2016 Annual Progress Report (Crop Year 2015) on the … Quality/Planning/NPU/Neuse/Final... ·...
14
NCDA&CS 2016 Annual Progress Report (Crop Year 2015) on the Neuse Agricultural Rule (15 A NCAC 2B.0238) A Report to the Environmental Management Commission from the Neuse Basin Oversight Committee: Crop Year 2015
Transcript of 2016 Annual Progress Report (Crop Year 2015) on the … Quality/Planning/NPU/Neuse/Final... ·...

NCDA&CS
2016 Annual Progress Report
(Crop Year 2015) on the Neuse
Agricultural Rule
(15 A NCAC 2B.0238) A Report to the Environmental Management Commission from the Neuse Basin
Oversight Committee: Crop Year 2015

2
3
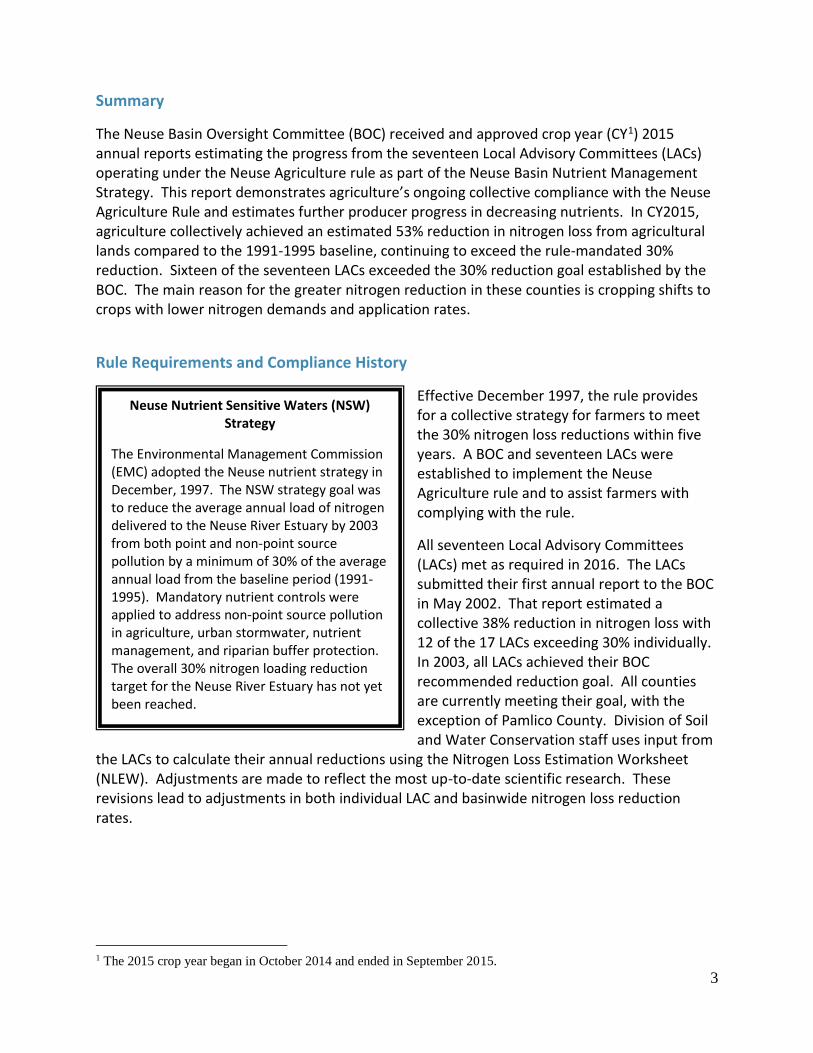
Summary
The Neuse Basin Oversight Committee (BOC) received and approved crop year (CY1) 2015 annual reports estimating the progress from the seventeen Local Advisory Committees (LACs) operating under the Neuse Agriculture rule as part of the Neuse Basin Nutrient Management Strategy. This report demonstrates agriculture’s ongoing collective compliance with the Neuse Agriculture Rule and estimates further producer progress in decreasing nutrients. In CY2015, agriculture collectively achieved an estimated 53% reduction in nitrogen loss from agricultural lands compared to the 1991-1995 baseline, continuing to exceed the rule-mandated 30% reduction. Sixteen of the seventeen LACs exceeded the 30% reduction goal established by the BOC. The main reason for the greater nitrogen reduction in these counties is cropping shifts to crops with lower nitrogen demands and application rates.
Rule Requirements and Compliance History
Effective December 1997, the rule provides for a collective strategy for farmers to meet the 30% nitrogen loss reductions within five years. A BOC and seventeen LACs were established to implement the Neuse Agriculture rule and to assist farmers with complying with the rule.
All seventeen Local Advisory Committees (LACs) met as required in 2016. The LACs submitted their first annual report to the BOC in May 2002. That report estimated a collective 38% reduction in nitrogen loss with 12 of the 17 LACs exceeding 30% individually. In 2003, all LACs achieved their BOC recommended reduction goal. All counties are currently meeting their goal, with the exception of Pamlico County. Division of Soil and Water Conservation staff uses input from
the LACs to calculate their annual reductions using the Nitrogen Loss Estimation Worksheet (NLEW). Adjustments are made to reflect the most up-to-date scientific research. These revisions lead to adjustments in both individual LAC and basinwide nitrogen loss reduction rates.
1 The 2015 crop year began in October 2014 and ended in September 2015.
Neuse Nutrient Sensitive Waters (NSW) Strategy
The Environmental Management Commission (EMC) adopted the Neuse nutrient strategy in December, 1997. The NSW strategy goal was to reduce the average annual load of nitrogen delivered to the Neuse River Estuary by 2003 from both point and non-point source pollution by a minimum of 30% of the average annual load from the baseline period (1991-1995). Mandatory nutrient controls were applied to address non-point source pollution in agriculture, urban stormwater, nutrient management, and riparian buffer protection. The overall 30% nitrogen loading reduction target for the Neuse River Estuary has not yet been reached.

4
Scope of Report and Methodology The estimates provided in this report represent whole-county scale calculations of nitrogen loss from cropland agriculture adjusted for acreage in the basin. These estimates were made by NC Division of Soil and Water Conservation (DSWC) staff using the ‘aggregate’ version of the Nitrogen Loss Estimation Worksheet, or NLEW, an accounting tool developed to meet the specifications of the Neuse Rule and approved by the EMC. The development team included interagency technical representatives of the NC Division of Water Resources (DWR), NC DSWC and USDA-Natural Resources Conservation Service (NRCS) and was led by NC State University Soil Science Department faculty. The NLEW captures application of both inorganic and animal waste sources of fertilizer to cropland. It does not capture the effects of nitrogen applied to pastureland and NLEW is an “edge-of-management unit” accounting tool; it estimates changes in nitrogen loss from croplands, but does not estimate changes in nitrogen loading to surface waters.
Annual Estimates of Nitrogen Loss and the Effect of NLEW Refinements
The NLEW software is periodically revised to incorporate new knowledge gained through research and improvements to data. These changes have incorporated the best available data, but changes to NLEW must be considered when comparing nitrogen loss reduction in different versions of NLEW. Further updates in soil management units are expected as NRCS produces updated electronic soils data. The small changes in soil management units are unlikely to produce significant effects on nitrogen loss reductions. In 2016 the Division of Soil and Water Conservation worked with NC State University, NCDA&CS Emergency Programs staff, and the NCSU Cooperative Extension Service to update NLEW software into a web-based platform that incorporates updated yield expectations and nitrogen use efficiencies for crops. The NLEW software has been updated from outdated programming language and is now being housed on NCDA&CS servers. As a result of this change, sweet potatoes, which were excluded from CY2014 reporting, have been added back into the crop reports for current and baseline years, while other specialty crops, like white potatoes, remain excluded due to a lack of research data to determine a North Carolina-specific nitrogen use efficiency. The crops not included are grown on a small number of acres in the basin and are therefore a minimal contributor to overall nitrogen loss from agriculture. Other beneficial updates include server storage of annual reports, streamlined data export, and ongoing end-user data maintenance capabilities, which should enable DSWC and the BOC to incorporate new realistic yield expectations and nitrogen use efficiencies quickly and efficiently as future research is released and refined. Figure 1 represents the annual percent nitrogen loss reduction from the baseline for 2001 to 2015.
5
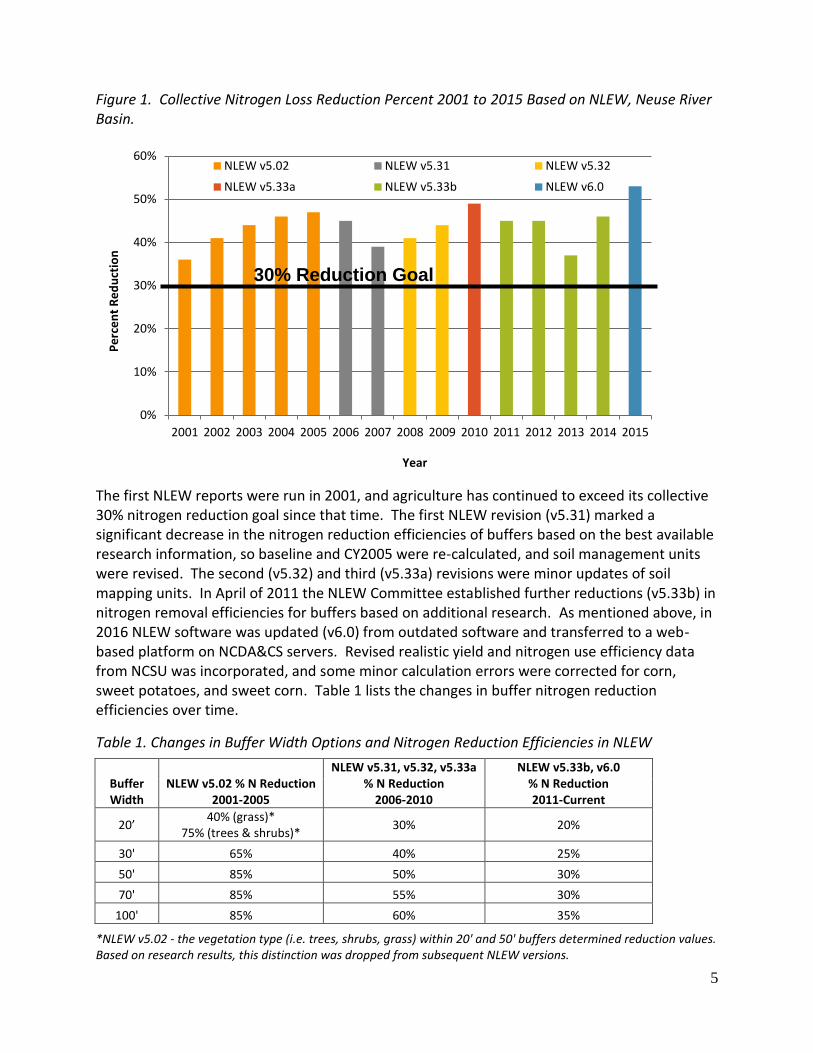
Figure 1. Collective Nitrogen Loss Reduction Percent 2001 to 2015 Based on NLEW, Neuse River Basin.
The first NLEW reports were run in 2001, and agriculture has continued to exceed its collective 30% nitrogen reduction goal since that time. The first NLEW revision (v5.31) marked a significant decrease in the nitrogen reduction efficiencies of buffers based on the best available research information, so baseline and CY2005 were re-calculated, and soil management units were revised. The second (v5.32) and third (v5.33a) revisions were minor updates of soil mapping units. In April of 2011 the NLEW Committee established further reductions (v5.33b) in nitrogen removal efficiencies for buffers based on additional research. As mentioned above, in 2016 NLEW software was updated (v6.0) from outdated software and transferred to a web-based platform on NCDA&CS servers. Revised realistic yield and nitrogen use efficiency data from NCSU was incorporated, and some minor calculation errors were corrected for corn, sweet potatoes, and sweet corn. Table 1 lists the changes in buffer nitrogen reduction efficiencies over time.
Table 1. Changes in Buffer Width Options and Nitrogen Reduction Efficiencies in NLEW
Buffer Width
NLEW v5.02 % N Reduction 2001-2005
NLEW v5.31, v5.32, v5.33a % N Reduction
2006-2010
NLEW v5.33b, v6.0 % N Reduction 2011-Current
20’ 40% (grass)*
75% (trees & shrubs)* 30% 20%
30' 65% 40% 25%
50' 85% 50% 30%
70' 85% 55% 30%
100' 85% 60% 35%
*NLEW v5.02 - the vegetation type (i.e. trees, shrubs, grass) within 20' and 50' buffers determined reduction values. Based on research results, this distinction was dropped from subsequent NLEW versions.
0%
10%
20%
30%
40%
50%
60%
2001 2002 2003 2004 2005 2006 2007 2008 2009 2010 2011 2012 2013 2014 2015
Pe
rce
nt
Re
du
ctio
n
Year
NLEW v5.02 NLEW v5.31 NLEW v5.32
NLEW v5.33a NLEW v5.33b NLEW v6.0
30% Reduction Goal

6
Current Status
Nitrogen Reduction from Baseline for CY2015
All seventeen LACs submitted their fifteenth annual reports to the BOC for approval in July 2016. For the entire basin, in CY2015 agriculture achieved a 53% reduction in nitrogen loss compared to the 1991-1995 baseline. This percentage is higher than the reduction reported for CY2014. Table 2 lists each county’s baseline, CY2014 and CY2015 nitrogen (lbs/yr) loss values, and nitrogen loss percent reductions from the baseline in CY2014 and CY2015. Table 2. Estimated Reductions in Agricultural Nitrogen Loss from Baseline (1991-1995) for 2014 and 2015, Neuse River Basin*
County Baseline N
Loss (lb) NLEW v6.0
CY2014 N Loss (lb) †
NLEW v5.33b
CY2014 N Reduction
(%) †
CY2015 N Loss (lb)
NLEW v6.0
CY2015 N Reduction
(%)
Carteret 1,292,586 780,771 40% 654,572 49%
Craven 4,153,187 1,673,786 58% 1,574,823 62%
Durham 220,309 115,682 47% 39,312 82%
Franklin 219,209 34,929 84% 35,176 84%
Granville 193,197 7,783 96% 26,701 86%
Greene 4,439,036 1,908,293 55% 2,030,728 54%
Johnston 6,728,638 2,577,846 60% 3,162,882 53%
Jones 3,283,906 2,216,470 29% 1,859,200 43%
Lenoir 4,455,752 3,105,762 25% 2,711,731 39%
Nash 1,042,072 350,511 62% 392,916 62%
Orange 787,040 168,891 79% 109,040 86%
Pamlico 2,023,294 1,733,030 9% 1,551,263 23%
Person 616,669 290,598 53% 139,231 77%
Pitt 3,399,455 1,816,934 43% 1,604,914 53%
Wake 1,434,602 405,896 72% 347,179 76%
Wayne 8,297,408 4,751,326 41% 3,772,582 55%
Wilson 3,273,647 1,536,995 50% 1,729,865 47%
Total 45,860,007 23,475,503† 46%† 21,742,116 53%
* Nitrogen loss values are for comparative purposes. They represent nitrogen that was applied to agricultural lands in the basin and neither used by crops nor intercepted by BMPs in a Soil Management Unit, based on NLEW calculations. This is not an in-stream loading value. † CY2014 values were calculated with sweet potato acres removed from current and baseline year figures. The numbers shown were copied from the 2015 report for the sake of consistency, but the CY2014 reductions shown cannot be compared to the baseline nitrogen loss shown in the table, which was calculated using NLEW v6.0 and includes sweet potatoes.

7
Nitrogen loss reductions were achieved through a combination of fertilization rate decreases, cropping shifts, and BMP implementation. In addition to wet weather, the most significant factor this year is cropping shifts to soybeans which require no nitrogen application other than the incidental nitrogen contributed by starter fertilizer applied by some farmers in the basin. This trend is most evident in Jones, Pamlico, and Lenoir counties, which showed substantial improvements from CY2014. Factors that influence agricultural nitrogen reductions are shown in Figure 3.
Pamlico County is working to improve their reduction, which increased this year compared to CY2014. From CY2014 to CY2015 Pamlico experienced a decrease of 1,642 acres of corn, 1,464 acres of cotton, and 4,520 acres of wheat. It experienced a concurrent increase of 1,695 acres of soybeans. The Pamlico Soil and Water Conservation District Board is working to meet their reduction by making nutrient reducing BMPs a higher priority in their annual NC Agriculture Cost Share Program (ACSP) strategy plan, and they installed water control structures which achieve nutrient reductions on 400 acres in CY2015. The DSWC, LACs and additional stakeholders are working with others in the agricultural community in this county and the surrounding area to communicate the need for more BMP installation at existing commodity outreach events. The BOC will continue to focus its efforts to monitor this county’s progress and encourage BMP implementation. The NLEW outputs and staff calculations estimate the factors that contributed to the nitrogen reduction by the percentages shown in Table 3.
Table 3. Factors That Influence Nitrogen Reduction on Agricultural Lands (by percentage), Neuse River Basin*
Practice CY2012 NLEW v5.33b
CY2013 NLEW v5.33b
CY2014 NLEW v5.33b
CY2015 NLEW v6.0
BMP implementation 8% 7% 8% 9%
Fertilization management
10% 6% 8% 10%
Cropping shift 14% 11% 18% 20%
Cropland converted to grass/trees
2% 2% 2% 2%
Cropland lost to idle land 4% 4% 3% 4%
Cropland lost to development
7% 7% 7% 8%
Total 45% 37% 46% 53%
*Percentages are based on a total of the reduction, not a year-to-year comparison.
8
BMP Implementation
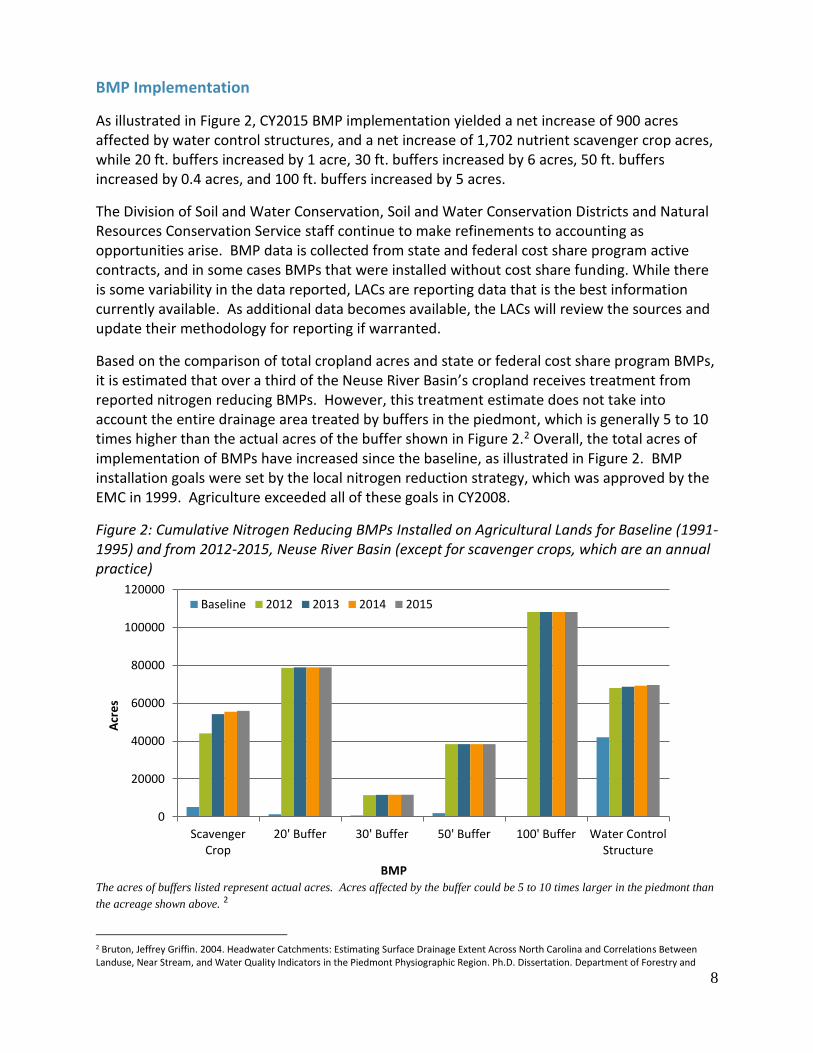
As illustrated in Figure 2, CY2015 BMP implementation yielded a net increase of 900 acres affected by water control structures, and a net increase of 1,702 nutrient scavenger crop acres, while 20 ft. buffers increased by 1 acre, 30 ft. buffers increased by 6 acres, 50 ft. buffers increased by 0.4 acres, and 100 ft. buffers increased by 5 acres.
The Division of Soil and Water Conservation, Soil and Water Conservation Districts and Natural Resources Conservation Service staff continue to make refinements to accounting as opportunities arise. BMP data is collected from state and federal cost share program active contracts, and in some cases BMPs that were installed without cost share funding. While there is some variability in the data reported, LACs are reporting data that is the best information currently available. As additional data becomes available, the LACs will review the sources and update their methodology for reporting if warranted.
Based on the comparison of total cropland acres and state or federal cost share program BMPs, it is estimated that over a third of the Neuse River Basin’s cropland receives treatment from reported nitrogen reducing BMPs. However, this treatment estimate does not take into account the entire drainage area treated by buffers in the piedmont, which is generally 5 to 10 times higher than the actual acres of the buffer shown in Figure 2.2 Overall, the total acres of implementation of BMPs have increased since the baseline, as illustrated in Figure 2. BMP installation goals were set by the local nitrogen reduction strategy, which was approved by the EMC in 1999. Agriculture exceeded all of these goals in CY2008.
Figure 2: Cumulative Nitrogen Reducing BMPs Installed on Agricultural Lands for Baseline (1991-1995) and from 2012-2015, Neuse River Basin (except for scavenger crops, which are an annual practice)
The acres of buffers listed represent actual acres. Acres affected by the buffer could be 5 to 10 times larger in the piedmont than
the acreage shown above. 2
2 Bruton, Jeffrey Griffin. 2004. Headwater Catchments: Estimating Surface Drainage Extent Across North Carolina and Correlations Between Landuse, Near Stream, and Water Quality Indicators in the Piedmont Physiographic Region. Ph.D. Dissertation. Department of Forestry and
0
20000
40000
60000
80000
100000
120000
ScavengerCrop
20' Buffer 30' Buffer 50' Buffer 100' Buffer Water ControlStructure
Acr
es
BMP
Baseline 2012 2013 2014 2015

9
Additional Nutrient BMPs
Not all types of nutrient-reducing BMPs are tracked by NLEW. These include livestock-related nitrogen and phosphorus reducing BMPs, BMPs that reduce soil and phosphorus loss, and BMPs that do not have enough scientific research to support a nitrogen reduction benefit. The BOC believes it is worthwhile to recognize these practices. Table 4 identifies BMPs not accounted for in NLEW and tracks their implementation in the basin since CY1996.
Increased implementation numbers are evident in CY2015 across most BMP types. Some of these BMPs will yield reductions in nitrogen loss that are not reflected in the NLEW accounting in this report but will benefit the estuary. Table 4: Nutrient-Reducing BMPs Not Accounted for in NLEW, 1996 to 2015, Neuse River Basin*
BMP Units 1996-2011 2012 2013 2014 2015
Diversion Feet 149,449 159,101 160,655 161,924 166,199
Cover Crops Acres 31,826 33,712 36,808 40,132 43,118
Fencing (USDA programs) Feet 154,885 164,202 170,501 204,869 214,748
Field Border Acres 3,337 5,190 5,211 5,217 5,219
Grassed Waterway Acres 2,261 2,289 2,300 2,351 2,358
Livestock Exclusion Feet 81,389 90,633 100,860 103,121 118,178
Precision Agriculture Acres 0 1,000 2,567 3,567 3,660
Sod Based Rotation Acres 60,115 76,857 92,404 92,404 101,429
Tillage Management Acres 34,072 44,011 48,649 53,634 59,057
Terraces Feet 49,970 49,970 50,670 50,670 76,175
Environmental Resources, North Carolina State University, Raleigh, NC 27606. http://www.lib.ncsu.edu/theses/available/etd-03282004-174056/
*Cumulative data provided using active contracts in State and Federal cost share programs.

10
Fertilization Management
Both increased fertilizer cost and better nutrient management have resulted in farmers in the Neuse River Basin reducing their fertilizer application from baseline levels. Despite annual fluctuations, fertilization rates for all major crops in the basin have been reduced from the baseline period. Between CY2014 and CY2015 nitrogen application rates increased by 13 lbs per acre on bermuda hay, 7 lbs per acre on corn, and 8 lbs per acre on wheat, while rates decreased by 2 lbs per acre on cotton, 18 lbs per acre on fescue hay, and 6 lbs per acre on tobacco. Figure 3 shows these corresponding application rates. With increasing fertilizer prices, there has been an economic incentive for producers to consider more efficient nitrogen rates, timing, and placement alternatives. Fertilizer rates and standard application practices are revisited annually by LACs using data from farmers, commercial applicators and state and federal agencies’ professional estimates. Figure 3. Average Annual Nitrogen Fertilization Rate (lbs/ac) for Agricultural Crops for the baseline (1991-1995) and 2012-2015, Neuse River Basin
0
50
100
150
200
250
300
Bermuda Corn Cotton Fescue Soybeans Tobacco Wheat
Nit
roge
n R
ate
lbs/
acr
e
Crops
Baseline 2012 2013 2014 2015
Factors Identified by LACs Contributing to Reduced Nitrogen Application Rates
Rising fertilizer costs and fluctuating farm incomes.
Increased education and outreach on nutrient management (NC Cooperative Extension held 21 nutrient management training sessions, approximately 2,000 farmers and applicators received training.)
Mandatory animal waste management plans
The federal government tobacco quota buy-out reducing tobacco acreage.
Neuse and Tar-Pamlico Nutrient Strategies

11
Cropping Shifts
The LACs recalculate the cropland acreage annually by utilizing crop data reported by farmers to the Farm Service Agency. Because each crop type requires different amounts of nitrogen and utilizes applied nitrogen with a different efficiency rate, changes in the mix of crops grown can have significant impact on the cumulative yearly nitrogen loss reduction. The BOC anticipates that the basin will see additional crop shifts in the upcoming year based on changing commodity prices and wet weather.
The price of corn remained low in CY2015, so corn acres remained fairly stable compared to CY2014. Cotton prices have fallen almost 56% from a 2011 peak, so cotton decreased by over 25,000 acres from CY2014 to CY2015. Soybean acres, which require no nitrogen input, saw a significant increase of over 16,000 acres between CY2014 and CY2015, and this transition helped reduce overall nitrogen loss. In addition, an extremely wet fall prevented many farmers from accessing their fields in time to plant a crop of winter wheat. In most cases wheat acres are “double cropped” with soybeans, which means that wheat acres are planted on the same acreage before a spring soybean crop. In CY2015, soybean acreages were accounted for in these double cropped systems, but some of those acres were not fertilized over the winter months where a wheat crop was not planted. This resulted in an overall decrease of over 46,000 wheat acres between CY2014 and CY2015. A host of factors from individual to global determine crop choices. Figure 4. Acreage of Major Crops for the Baseline (1991-1995) and 2012-2015, Neuse River Basin
0
50000
100000
150000
200000
250000
300000
350000
400000
Hay Corn Cotton Soybeans Tobacco Wheat
Acr
es
Crops
Baseline 2012 2013 2014 2015

12
Land Use Change to Development, Idle Land and Cropland Conversion
The number of cropland acres will fluctuate every year in the Neuse River Basin. Each year, some cropland is permanently lost to development or converted to grass or trees. However, idle land is agricultural land that is currently out of production but could be brought back into production at any time. Cropland conversion and cropland lost to development is land taken out of agricultural production and is unlikely to be returned to production. Currently it is estimated that more than 81,078 acres have been lost to development, and more than 21,756 acres have been converted to grass or trees since the baseline. For CY2015 there are approximately 45,004 idle acres and a total of 765,898 NLEW-accountable crop acres. These estimates come from the LAC members’ best professional judgment, USDA-Farm Service Agency (FSA) records and county planning departments. The total crop acres are obtained from USDA-FSA and NC Agricultural Statistics annual reports. Cropland acres have continued to decrease from the baseline period, and CY2015 experienced a reduction of over 74,903 crop acres from CY2014 (see Figure 5). A significant portion of this acreage reduction was due to the reduction in wheat, some of which would have been planted but for wet weather. Figure 5. Total NLEW Accounted Crop Acres in the Neuse River Basin, Baseline (1991-1995) and 2001-2015.
0
200000
400000
600000
800000
1000000
1200000
Baseline 2001 2002 2003 2004 2005 2006 2007 2008 2009 2010 2011 2012 2013 2014 2015
Acr
es
Year

13
Looking Forward
The Neuse BOC will continue to report on rule implementation, relying heavily on Soil and Water Conservation District staff to compile crop reports. The BOC continues to encourage counties to implement additional BMPs to further reduce nitrogen loss. Because cropping shifts are susceptible to various pressures, the BOC is working with LACs in all counties to continue BMP implementation that provides for a lasting reduction in nitrogen loss in the basin while monitoring cropping changes. Due to an extremely wet fall growing season in late 2015, the BOC expects reported wheat acre totals in CY2016 to remain low. Indications are that corn acreage will increase in CY2016 due to a price increase. Funding is an integral part in the success of reaching and maintaining the goal through technical assistance and BMP implementation. It is also important for data collection and reporting. In 2001, grants funded a total of ten basin technicians and two basin coordinators in the Neuse and Tar-Pamlico River Basins. The technicians’ primary responsibility was to assist farmers with BMP implementation. These technicians assisted existing county staff to expedite the installation of nutrient reducing BMPs in the basin. On June 30, 2015 the last technician funding was expended, and technician funding is no longer eligible for grant awards by funding entities in the state. Therefore, less technical assistance for BMP implementation is available. Ongoing responsibility for conservation practice planning and installation now depends on local staff that also have other duties. At the present time there is also no funding for a basin coordinator. Part of the responsibilities of the technicians and basin coordinators was to assist with the reporting requirements for the Neuse and Tar-Pamlico Agriculture Rules. In addition to his other duties, an employee within the NCSA&CS Division of Soil and Water Conservation has been assigned the data collection, compilation and reporting duties for the Agriculture Rules for all existing Nutrient Sensitive Waters Strategies. Farmers and agency staff personnel with other responsibilities serve on the LACs in a voluntary capacity. Without funding for technicians, the annual local progress reports fall on the LACs without local technical assistance to compile the data for the annual reports. Few currently serving LAC members were active during the stakeholder process for the Agriculture Rule, so some institutional knowledge about annual reporting requirements has been lost. As a result,
Basin Oversight Committee recognizes the dynamic nature of agricultural business.
Changes in world economies, energy or trade policies.
Changes in government programs (i.e., commodity support or environmental regulations)
Weather (i.e., long periods of drought or rain)
Scientific advances in agronomics (i.e., production of new types of crops or improvements in crop sustainability)
Plant disease or pest problems (i.e., viruses or foreign pests)
Urban encroachment (i.e., crop selection shifts as fields become smaller)
Age of farmer (i.e, as retirement approaches farmers may move from row crops to cattle)

14
training of new Soil and Water Conservation District staff and LAC members regarding rule requirements and reporting is ongoing. Now that watershed technician funding has been eliminated, a more centralized approach to data collection and verification is necessary. This evolving approach will involve GIS analysis and more streamlined FSA acreage documentation. The LACs will be trained to handle the new workload to the best of their ability. Because district staff has neither the time nor financial resources to synthesize county level data, this centralized approach will come at the expense of local knowledge. Annual agricultural reporting is required by the rules; therefore continued funding for the Division’s remaining position is essential for compliance. Previously, funding was available for research on conservation practice effectiveness, realistic yields, and nitrogen use efficiencies. Due to eligibility changes and other funding constraints, it is unlikely that new data will be developed. Prior funding sources for such research, which provided much of the scientific information on which NLEW was based, are no longer available. Should new funding be made available, additional North Carolina-specific research information could be incorporated into future NLEW updates. The Neuse BOC will continue to monitor and evaluate crop trends. The current shift to and from crops with higher nitrogen requirements may continue to influence the yearly reduction. Additionally, members of the BOC plan to participate in a land accounting work group, if reconvened, with the Division of Water Resources to assist in developing a more consistent land accounting framework.
Significant progress has been made in agricultural nitrogen loss reduction, and the agricultural community consistently reaches its 30% reduction goal. However, the measurable effects of these BMPs on overall in-stream nitrogen reduction may take years to develop due to the nature of non-point source pollution. Nitrogen reduction values presented in this annual summary of agricultural reductions reflect “edge-of-management unit” calculations that contribute to achieving the overall 30% nitrogen loss reduction goal. Significant quantities of agricultural BMPs have been installed since the adoption and implementation of the nutrient management strategy, and agriculture continues to do its part towards achieving the overall goal of a 30% reduction of nitrogen delivered to the Neuse estuary.