2016-2017 stCHDM IDP REVIEW 1 DRAFT
366
Chris Hani District Municipality 2016-2017 IDP Review 1 st Draft 1 2016-2017 CHDM IDP REVIEW 1 st DRAFT The Executive Mayor Chris Hani District Municipality 15 Bells Road Queenstown 5319 www.chrishanidm.gov.za Tel: 045 808 4600 Fax: 045 838 1556
Transcript of 2016-2017 stCHDM IDP REVIEW 1 DRAFT

Chris Hani District Municipality 2016-2017 IDP Review 1st Draft
1
2016-2017
CHDM IDP REVIEW 1st DRAFT
The Executive Mayor Chris Hani District Municipality 15 Bells Road Queenstown 5319 www.chrishanidm.gov.za Tel: 045 808 4600 Fax: 045 838 1556

Chris Hani District Municipality 2016-2017 IDP Review 1st Draft
2
TABLE OF CONTENT
Chris Hani District Municipality 2016-2017 IDP Review 1st Draft
3
THE EXECUTIVE SUMMARY
Background to this Document
The CHDM Council has adopted a 5 year IDP which is for 2012-2017, by the 30th May 2012. By law
IDP has to be reviewd annually to accommodate changes as the world changes, meaning by 2016-
2017 there should be a 5TH IDP Review which is the last IDP Review of 2012-2017 IDP. This last
review must not be in contrast with its original 5 year IDP hence this document which is the actual
5th IDP review of the 5 year Plan. It is submitted and prepared in fulfilment of the Municipality’s
legal obligation in terms of Section 32 of the Local Government: Municipal Systems Act 32 of 2000.
Previous Comments from the MEC of Local Government has been taken into consideration and
inputted.
In addition to the legal requirement for every Municipality to compile an Integrated
Development Plan, the Municipal Systems Act 32 of 2000 also requires that:
the IDP be implemented;
the Municipality monitors and evaluates its performance with regards to the
IDP’s implementation;
the IDP be reviewed annually to effect improvements.
Section 25 of the Municipal Systems Act deals with the adoption of the IDP and states that:
“Each municipal council must adopt a single, inclusive and strategic plan for the
development of the municipality which –
links, integrates and co-ordinates plans and takes into account proposals for the
development of the municipality;
aligns the resources and capacity of the municipality with the implementation
of the plan;
Forms the policy framework and general basis on which annual budget must be
based.”
Chris Hani District Municipality 2016-2017 IDP Review 1st Draft
4
CHDM’s Broad Strategic Objectives
In an effort to realise the institutional vision, CHDM has developed 5 Broad Strategic Objective
for a period of 5 years and are the ones that were adopted on 2012-2017 IDP and are to
continue as such even on the 2016-2017 IDP Review as aligned to the National KPA. These are a
way of responding to key issues confronting the municipality and as said are aligned to the 5
National KPA’s (5 year Local Government Strategic Agenda).
Report outline
The report is structured as follows:
Chapter 1: The Planning Process
This section of the IDP will outlines the planning process with specific reference to the IDP
process, and organisational arrangements. This chapter provides the reader with an
understanding of the process followed by the Chris Hani District Municipality in compiling
the Integrated Development Plan Review for 2016-2017 financial years.
Chapter 2: The Situational Analysis
This section will provide a detailed situational analysis of Chris Hani District Municipality as
informed and guided by the latest Census conducted in 2011 October by STATS SA which
in turn has been augmented to cater for projections of Demographics. Projections flowing
from Census 2011 were done by Global Insight and ECSEC.
Chapter 3: Objectives, Strategies and Projects
This section will provide a concise summary of the municipal Vision, Mission and Values,
and a detailed breakdown of objectives, strategies and project programmes flowing from
the Broad IDP Objectives as adopted on 2012-2017 IDP and reviewed for 2016-2017
financial with all stakeholders being involved. Inputs discussions and engagements of the
strategic session held at Cradock on the 02nd – 04th March 2016 were used as guide to this
chapter. All planning frameworks were considered NDP 2010, January 08th statement,
SONA AND SOPA up to the SODA.

Chris Hani District Municipality 2016-2017 IDP Review 1st Draft
5
Chapter 4: Spatial Development Framework Analysis
This section will provide a detailed analysis of the District Spatial Development Framework
as has just been reviewed for 2015-2020 financial year and further takes care of the
Enacted SPLUMA.
Chapter 5: Sector Plans
This section will provide a list of all CHDM Sector plans and their status together draft and
new ones.
Chapter 6: Financial Plan
This section will provide the district municipality’s financial strategies, the proposed
budget for the 2016-2017 and the following two outer years, as well as the 3 Year Financial
Plan.
Chapter 7: Performance Management System
This section wil provide the legal context of the municipality’s performance management
system, an overview of the monitoring and evaluation process, a background to the CHDM
Performance Management Framework as well as the Balanced Scorecard Model adopted
by the district municipality and a process of PMS Cascading to below Section 56/7.
Chris Hani District Municipality 2016-2017 IDP Review 1st Draft
6
CHAPTER 1: THE PLANNING PROCESS
The IDP Process
Prior to the commencement of this IDP Review, CHDM prepared and adopted a District
IDP Framework Plan that served as a guide to the overall process throughout the district,
as well as the CHDM IDP/Budget Process Plan. The Council resolutions for the adoption of
the District IDP Framework Plan and the IDP/Budget Process Plan as well as for 2016-2017
IDP are attached as Annexures respectively.
District IDP Framework Plan
A District Framework Plan was formulated and adopted by Council on 26th August 2015
to serve as a guide to all of the local municipalities within the CHDM area of jurisdiction,
in the preparation of their respective Process Plans. In brief, the District Framework Plan
outlines the time frames of scheduled events/activities, structures involved and their
respective roles and responsibilities.
CHDM IDP/Budget Process Plan
The IDP/Budget Process Plan was also formulated and adopted by CHDM Council on 26th
August 2015. The IDP/Budget Process Plan outlines in detail, the way in which the CHDM
embarked on its IDP and Budget processes from its commencement in August 2015 to
its completion in June 2016. In brief, the Process Plan outlines the time frames of
scheduled events, structures involved and their respective roles and responsibilities. On
26th August 2015, the Chris Hani District Municipality adopted a framework plan for the
IDP throughout its area of jurisdiction, followed by a Process Plan. These plans were
adopted in accordance with the relevant legal prescripts and have dictated the process
to be followed for developing the IDP.
Organisational arrangements were put in place as per the Process Plan and all legislative
prescripts were adhered to. Of particular note have been the effective and efficient
operations of structures such as the Technical IGR Mangers Forum, District Mayors
Forum (DIMAFO), IDP Representative Forum and the IDP Steering Committee. These
have executed their mandates in terms of the adopted Process Plan and ensured the
achievement of key milestones and deliverables.
During this 2016-2017 1st IDP Review development, particular attention was paid to
institutional issues, IDP-budget linkage, the maintainance of CHDMs Vision and Mission
as well as Values as endorsed on our Strategic Planning Session and given blessings by
our communities as these were presented on various platforms and communities given
platform to comment and advise on these.
Chris Hani District Municipality 2016-2017 IDP Review 1st Draft
7
The delivery of services to the community of Chris Hani pays particular attention on
Water and Sanitation. An analysis was conducted in respect of various sector plans
attached to the CHDM’s IDP and some were found to be still relevant and required
minor update, others required a reviewal, whilst new ones were developed.
Strict compliance with Regulation 3(5) has been ensured through an ongoing process of
consultation between the CHDM and all local municipalities through the operations of
the said structures.
Organizational Arrangements
CHDM IDP Structures:- Structures guided the IDP Process within the CHDM:
IDP/Budget/PMS Steering Committee
Development Coordinating Forum
Budget Steering Committee
IDP/PMS/Budget Representative Forum
Technical IGR Managers’ Forum
Chief Whips/Speakers Forum
District Mayors Forum (DIMAFO)
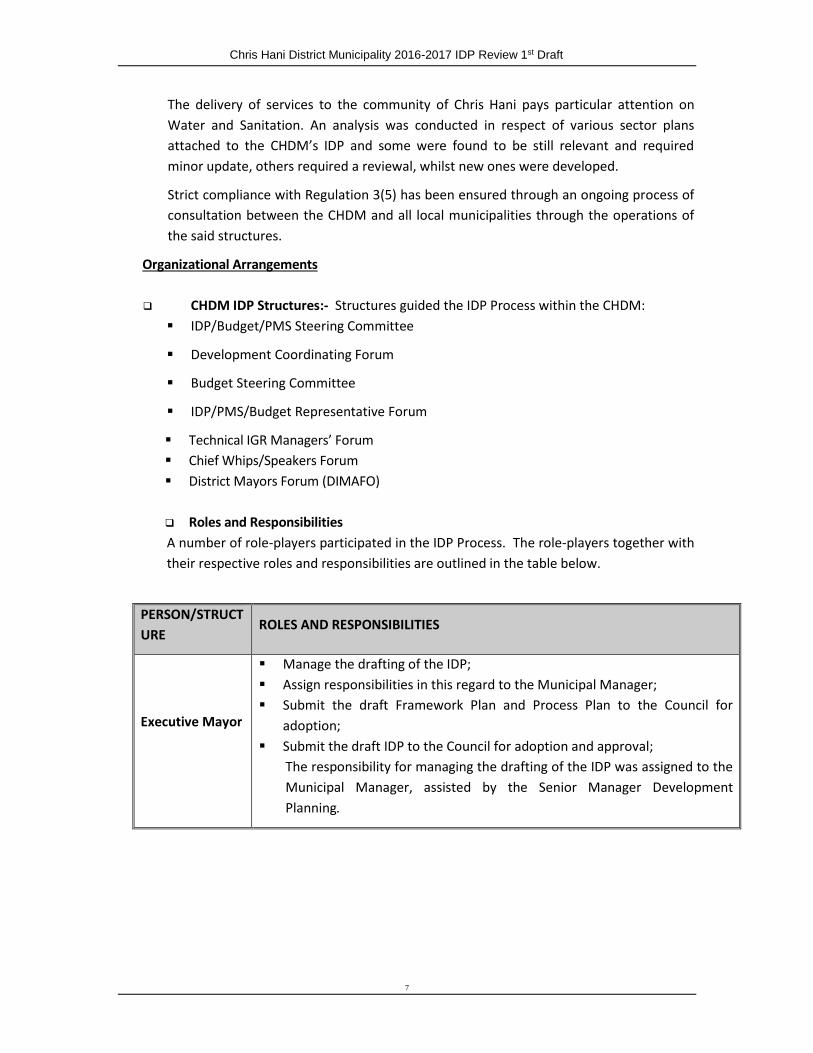
Roles and Responsibilities
A number of role-players participated in the IDP Process. The role-players together with
their respective roles and responsibilities are outlined in the table below.
PERSON/STRUCT
URE ROLES AND RESPONSIBILITIES
Executive Mayor
Manage the drafting of the IDP;
Assign responsibilities in this regard to the Municipal Manager;
Submit the draft Framework Plan and Process Plan to the Council for
adoption;
Submit the draft IDP to the Council for adoption and approval;
The responsibility for managing the drafting of the IDP was assigned to the
Municipal Manager, assisted by the Senior Manager Development
Planning.

Chris Hani District Municipality 2016-2017 IDP Review 1st Draft
8
Municipal
Manager /
Senior Manager
Development
Planning
The Municipal Manager had the following responsibilities, assigned to the
Senior Manager Development Planning:
Preparation of Framework Plan;
Preparation of the Process Plan;
Day-to-day management and coordination of the IDP process in terms of
time, resources and people, and ensuring:
The involvement of all relevant role-players, especially officials;
That the timeframes are being adhered to;
That the planning process is horizontally and vertically aligned and
complies with national and provincial requirements;
That conditions for participation are provided;
That the outcomes are documented; and
Organising the IDP Steering Committee Meetings
Ensuring that IDP Rep Forum Meetings are held;
District Mayors
Forum (DIMAFO)
The DIMAFO is the institutional structure to monitor alignment and integration
of the IDP process between CHDM, its local municipalities, sector departments
and parastatal bodies.
Chairperson:
The Executive Mayor of Chris Hani District Municipality
Secretariat:
The secretariat for this function is provided by the Mayors office
Members:
Chairpersons of the IDP Representative Forums from the:
Eight local Municipalities;
Chairpersons of the IDP Steering Committees, (Municipal Manager,
Strategic Manager/IDP Senior Manger CHDM and LM’s IDP Managers)
all eight Local Municipalities.
All CHDM Directors,Communications Manager
Representatives from sector departments and parastatals.
The DIMAFO is responsible for co-ordinating roles regarding district
municipality and local municipalities by:
Ensuring horizontal alignment of the IDPs of the local municipalities in
the district area of jurisdiction;
Ensuring vertical alignment between district and local planning;
Facilitation of vertical alignment of IDPs with other spheres of
government; and
Preparation of joint strategy workshops with local municipalities,
provincial and national role-players.
DIMAFO meetings are always preceded by IGR technical committee meetings
Chris Hani District Municipality 2016-2017 IDP Review 1st Draft
9
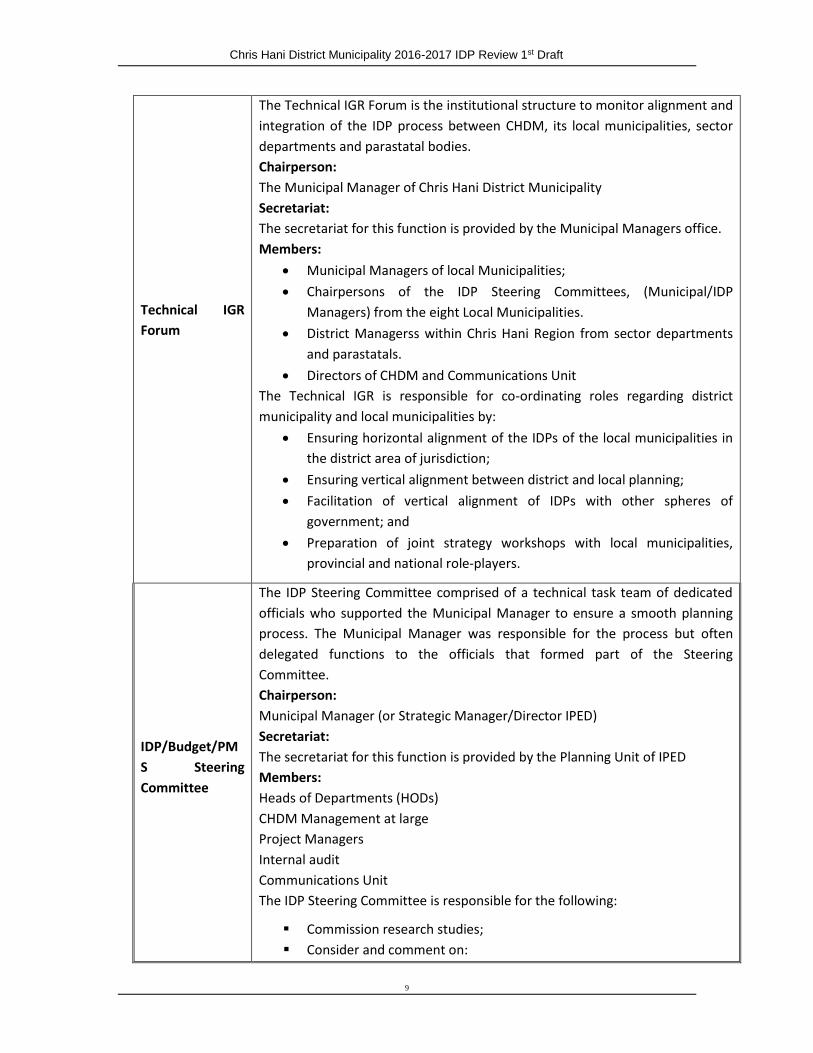
Technical IGR
Forum
The Technical IGR Forum is the institutional structure to monitor alignment and
integration of the IDP process between CHDM, its local municipalities, sector
departments and parastatal bodies.
Chairperson:
The Municipal Manager of Chris Hani District Municipality
Secretariat:
The secretariat for this function is provided by the Municipal Managers office.
Members:
Municipal Managers of local Municipalities;
Chairpersons of the IDP Steering Committees, (Municipal/IDP
Managers) from the eight Local Municipalities.
District Managerss within Chris Hani Region from sector departments
and parastatals.
Directors of CHDM and Communications Unit
The Technical IGR is responsible for co-ordinating roles regarding district
municipality and local municipalities by:
Ensuring horizontal alignment of the IDPs of the local municipalities in
the district area of jurisdiction;
Ensuring vertical alignment between district and local planning;
Facilitation of vertical alignment of IDPs with other spheres of
government; and
Preparation of joint strategy workshops with local municipalities,
provincial and national role-players.
IDP/Budget/PM
S Steering
Committee
The IDP Steering Committee comprised of a technical task team of dedicated
officials who supported the Municipal Manager to ensure a smooth planning
process. The Municipal Manager was responsible for the process but often
delegated functions to the officials that formed part of the Steering
Committee.
Chairperson:
Municipal Manager (or Strategic Manager/Director IPED)
Secretariat:
The secretariat for this function is provided by the Planning Unit of IPED
Members:
Heads of Departments (HODs)
CHDM Management at large
Project Managers
Internal audit
Communications Unit
The IDP Steering Committee is responsible for the following:
Commission research studies;
Consider and comment on:
Chris Hani District Municipality 2016-2017 IDP Review 1st Draft
10
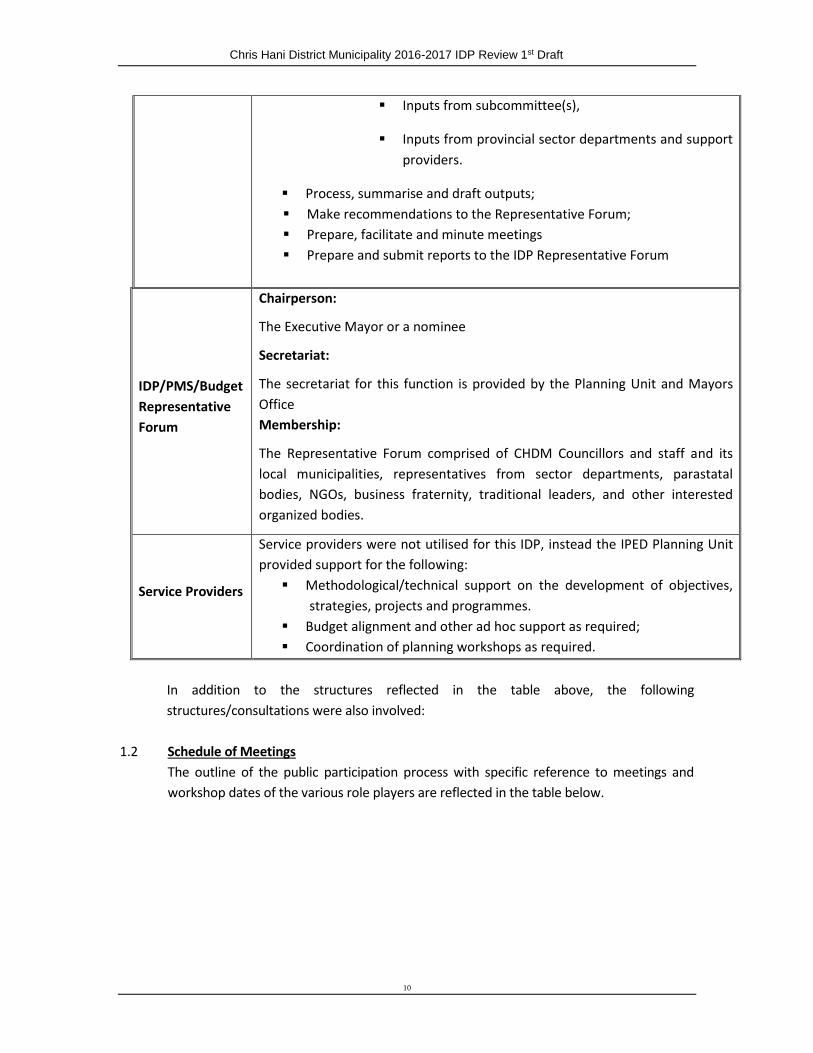
Inputs from subcommittee(s),
Inputs from provincial sector departments and support
providers.
Process, summarise and draft outputs;
Make recommendations to the Representative Forum;
Prepare, facilitate and minute meetings
Prepare and submit reports to the IDP Representative Forum
IDP/PMS/Budget
Representative
Forum
Chairperson:
The Executive Mayor or a nominee
Secretariat:
The secretariat for this function is provided by the Planning Unit and Mayors
Office
Membership:
The Representative Forum comprised of CHDM Councillors and staff and its
local municipalities, representatives from sector departments, parastatal
bodies, NGOs, business fraternity, traditional leaders, and other interested
organized bodies.
Service Providers
Service providers were not utilised for this IDP, instead the IPED Planning Unit
provided support for the following:
Methodological/technical support on the development of objectives,
strategies, projects and programmes.
Budget alignment and other ad hoc support as required;
Coordination of planning workshops as required.
In addition to the structures reflected in the table above, the following
structures/consultations were also involved:
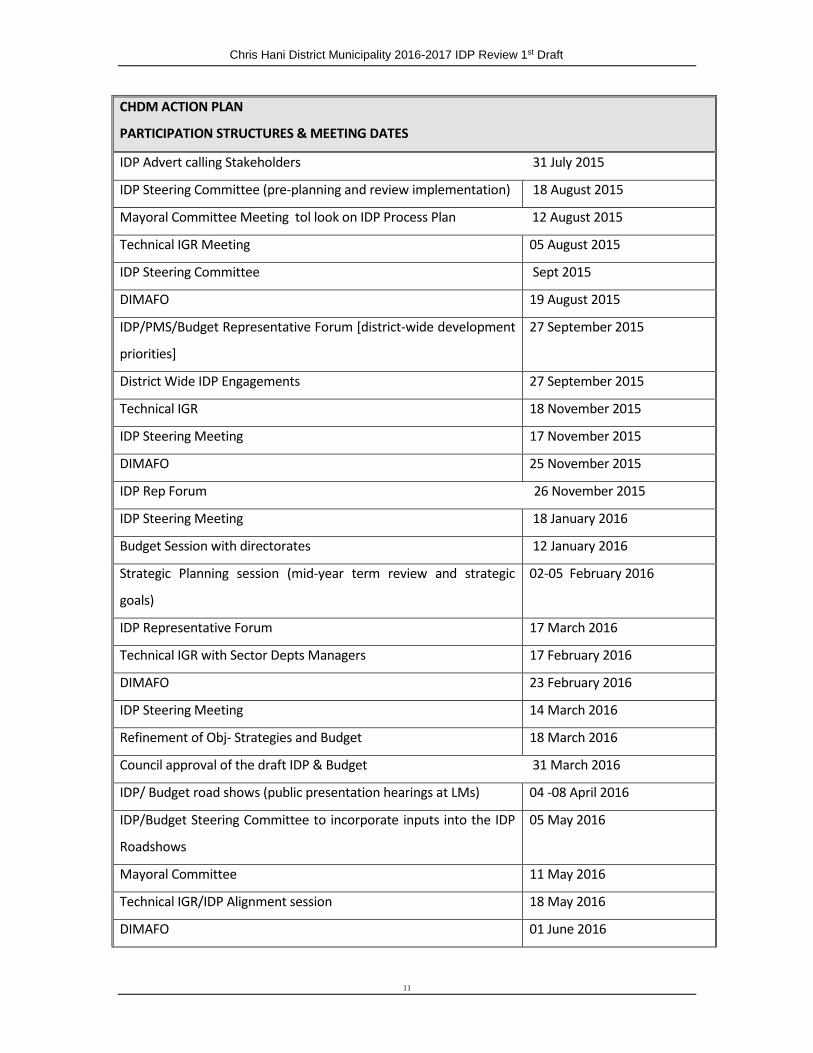
1.2 Schedule of Meetings
The outline of the public participation process with specific reference to meetings and
workshop dates of the various role players are reflected in the table below.
Chris Hani District Municipality 2016-2017 IDP Review 1st Draft
11
CHDM ACTION PLAN
PARTICIPATION STRUCTURES & MEETING DATES
IDP Advert calling Stakeholders 31 July 2015
IDP Steering Committee (pre-planning and review implementation) 18 August 2015
Mayoral Committee Meeting tol look on IDP Process Plan 12 August 2015
Technical IGR Meeting 05 August 2015
IDP Steering Committee Sept 2015
DIMAFO 19 August 2015
IDP/PMS/Budget Representative Forum [district-wide development
priorities]
27 September 2015
District Wide IDP Engagements 27 September 2015
Technical IGR 18 November 2015
IDP Steering Meeting 17 November 2015
DIMAFO 25 November 2015
IDP Rep Forum 26 November 2015
IDP Steering Meeting 18 January 2016
Budget Session with directorates 12 January 2016
Strategic Planning session (mid-year term review and strategic
goals)
02-05 February 2016
IDP Representative Forum 17 March 2016
Technical IGR with Sector Depts Managers 17 February 2016
DIMAFO 23 February 2016
IDP Steering Meeting 14 March 2016
Refinement of Obj- Strategies and Budget 18 March 2016
Council approval of the draft IDP & Budget 31 March 2016
IDP/ Budget road shows (public presentation hearings at LMs) 04 -08 April 2016
IDP/Budget Steering Committee to incorporate inputs into the IDP
Roadshows
05 May 2016
Mayoral Committee 11 May 2016
Technical IGR/IDP Alignment session 18 May 2016
DIMAFO 01 June 2016

Chris Hani District Municipality 2016-2017 IDP Review 1st Draft
12
IDP Rep Forum 12 May 2016
Council Meeting (Final Adoption of IDP & Budget) 25 May 2016
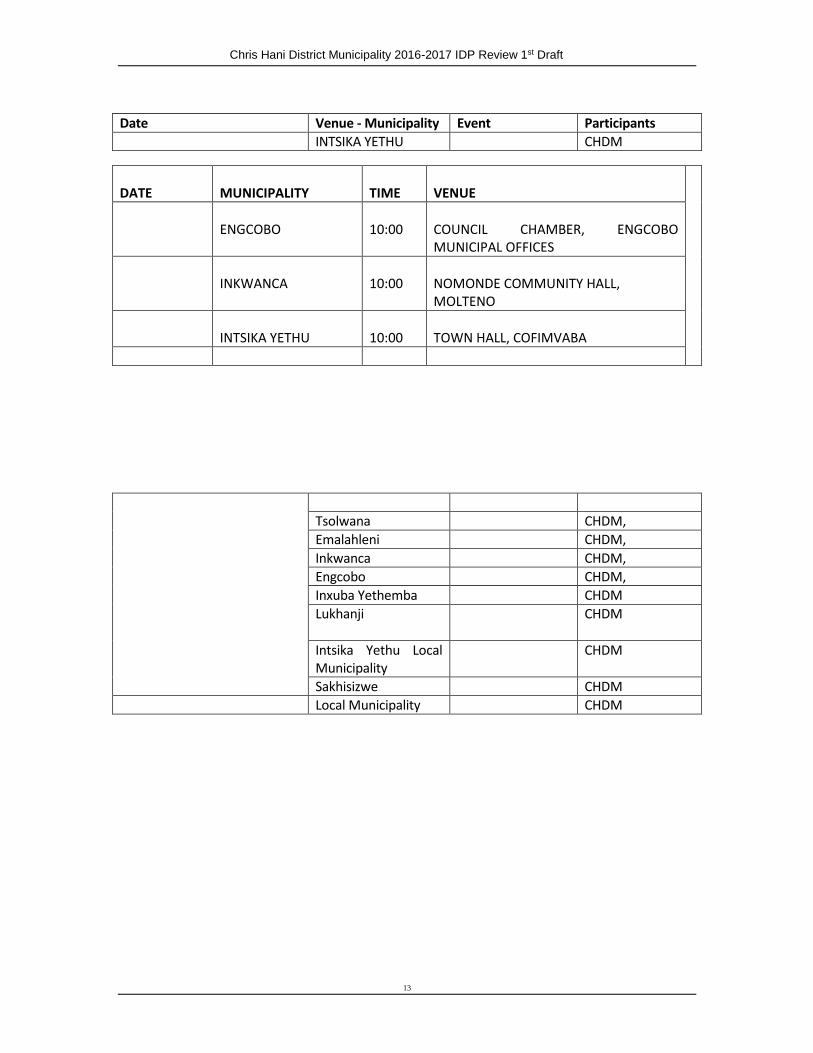
Planned Community Involvement for 2016-2017
The outline of the Public Participation Process with specific reference to transparency and community involvement during the 2016- 2017 IDP development process.
Chris Hani District Municipality 2016-2017 IDP Review 1st Draft
13
Date Venue - Municipality Event Participants
For the Month of April 2016
INTSIKA YETHU CHDM
For the Month of April 2016
Tsolwana CHDM,
Emalahleni CHDM,
Inkwanca CHDM,
Engcobo CHDM,
Inxuba Yethemba CHDM
Lukhanji
CHDM
Intsika Yethu Local Municipality
CHDM
Sakhisizwe CHDM
Local Municipality CHDM
DATE
MUNICIPALITY
TIME
VENUE
ENGCOBO
10:00
COUNCIL CHAMBER, ENGCOBO MUNICIPAL OFFICES
INKWANCA
10:00
NOMONDE COMMUNITY HALL, MOLTENO
INTSIKA YETHU
10:00
TOWN HALL, COFIMVABA

Chris Hani District Municipality 2016-2017 IDP Review 1st Draft
14
1.4 Relevant Documents
The following documentation should be read with the IDP:
Municipal Systems Act and relevant regulations
IDP Guide Pack, with specific reference to Guide 3 and Guide 6
District IDP Framework Plan
CHDM IDP/Budget Process Plan
CHDM IDP (2012 - 2017)
Various sector plans and programmes
Category B IDP’s (2012 - 2017)
Performance Management Framework (2014)
Provincial Growth and Development Plan (2004-2014)
National Development Plan 2030
1.5 Alignment with National and Provincial Programs
The following National programs informed the IDP Process:
State of the Nation Address (SONA)
Green Paper on National Planning Commission (revised).
National Development Planning 2030
State of Local Government in South Africa
Municipal Demarcation Board Reports 2015
COGTA : Local Government Turnaround Strategy (LGTAS)
COGTA : Operation Clean Audit 2014
• Powers & Functions :
Municipal Demarcation Board
Local Government MEC
ANC Manifesto (2009, 2011, 2014-2016)
ANC January 8th Statement (2013-2016)
King III Report & Code on Good Governance for South Africa-2009
EMALAHLENI 10:00 TOWN HALL, LADY FRERE
SAKHISIZWE
10:00
TOWN HALL, ELLIOT
TSOLWANA
10:00
WARD
LUKHANJI
10:00
SKWEYIYA, EZIBELENI & SADA

Chris Hani District Municipality 2016-2017 IDP Review 1st Draft
15
CHDM has adopted that 2016/17 as year of service delivery and year of the BACK TO BASICS.
CHDM acknowledged that though we work ‘Harder’, we don’t work ‘Smarter’. CHDM thus
concur with the Back to Basics as pronounced by the President of RSA.
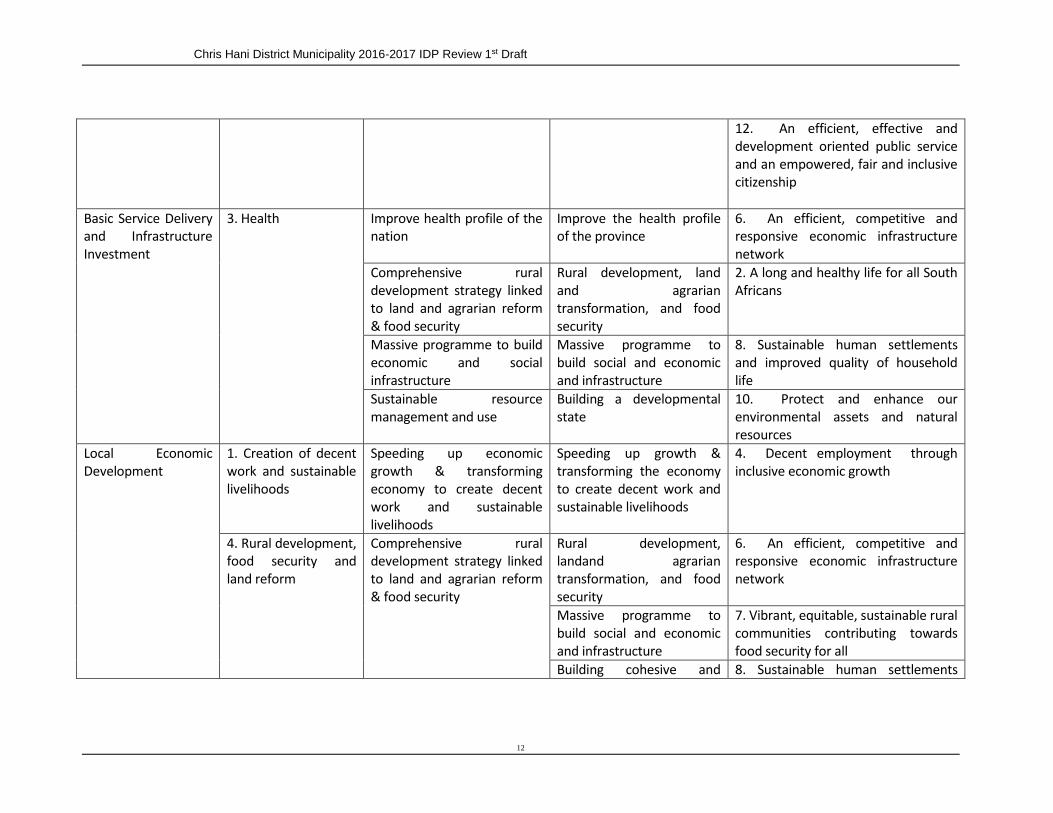
The National Development 2030 mentions that South Africa can eliminate poverty and reduce inequality by 2030 and this will require change, hard work, leadership and unity. Its goal is to improve the life chances of all South Africans, but particularly those young people who presently live in poverty. The plan asks for a major change in how we as government in general we go about our lives. In the past, we expected government to do things for us. What South Africa needs is for all of us to be active citizens and to work together – government, business, communities – so that people have what they need to live the lives they would like. On compiling this 2016-2017 IDP Review the NDP 2030 has been taken into consideration and aligned to a great extent. The following table below depicts how CHDMs 5 key performance areas are aligned with the national and provincial programs:

Chris Hani District Municipality 2016-2017 IDP Review 1st Draft
11
Key Performance Areas
Manifesto 2014
10 National Priorities
8 Provincial Priorities
12 Outcomes
Good Governance and Public Participation
5. Fight against crime and corruption
Intensifying the fight against crime and corruption
Intensify the fight against crime and corruption
7. Vibrant, equitable, sustainable rural communities contributing towards food security for all
Build cohesive, caring and sustainable communities
Building cohesive and sustainable communities
9. Responsive, accountable, effective and efficient Local Government system
Pursuing African advancement and enhanced international co-operation
12. An efficient, effective and development oriented public service and an empowered, fair and inclusive citizenship
Building a developmental state including improvement of public services and strengthening democratic institutions
11. Create a better South Africa, better Africa and a better world
Municipal Financial Viability and Management
5. Fight against crime and corruption
Intensifying the fight against crime and corruption
Intensify the fight against crime and corruption
9. Responsive, accountable, effective and efficient Local Government system
Municipal Transformation and Institutional Development
5. Fight against crime and corruption
Strengthen skills and human resource base
Strengthen education, skills and human resource base
1. Quality basic education
2. Education
Pursuing African advancement and enhanced international co-operation
5. Skilled and capable workforce to support an inclusive growth path
Building a developmental state including improvement of public services and strengthening democratic institutions
3. All people in SA are and feel safe
9. Responsive, accountable, effective and efficient Local Government system
Chris Hani District Municipality 2016-2017 IDP Review 1st Draft
12
12. An efficient, effective and development oriented public service and an empowered, fair and inclusive citizenship
Basic Service Delivery and Infrastructure Investment
3. Health
Improve health profile of the nation
Improve the health profile of the province
6. An efficient, competitive and responsive economic infrastructure network
Comprehensive rural development strategy linked to land and agrarian reform & food security
Rural development, land and agrarian transformation, and food security
2. A long and healthy life for all South Africans
Massive programme to build economic and social infrastructure
Massive programme to build social and economic and infrastructure
8. Sustainable human settlements and improved quality of household life
Sustainable resource management and use
Building a developmental state
10. Protect and enhance our environmental assets and natural resources
Local Economic Development
1. Creation of decent work and sustainable livelihoods
Speeding up economic growth & transforming economy to create decent work and sustainable livelihoods
Speeding up growth & transforming the economy to create decent work and sustainable livelihoods
4. Decent employment through inclusive economic growth
4. Rural development, food security and land reform
Comprehensive rural development strategy linked to land and agrarian reform & food security
Rural development, landand agrarian transformation, and food security
6. An efficient, competitive and responsive economic infrastructure network
Massive programme to build social and economic and infrastructure
7. Vibrant, equitable, sustainable rural communities contributing towards food security for all
Building cohesive and 8. Sustainable human settlements
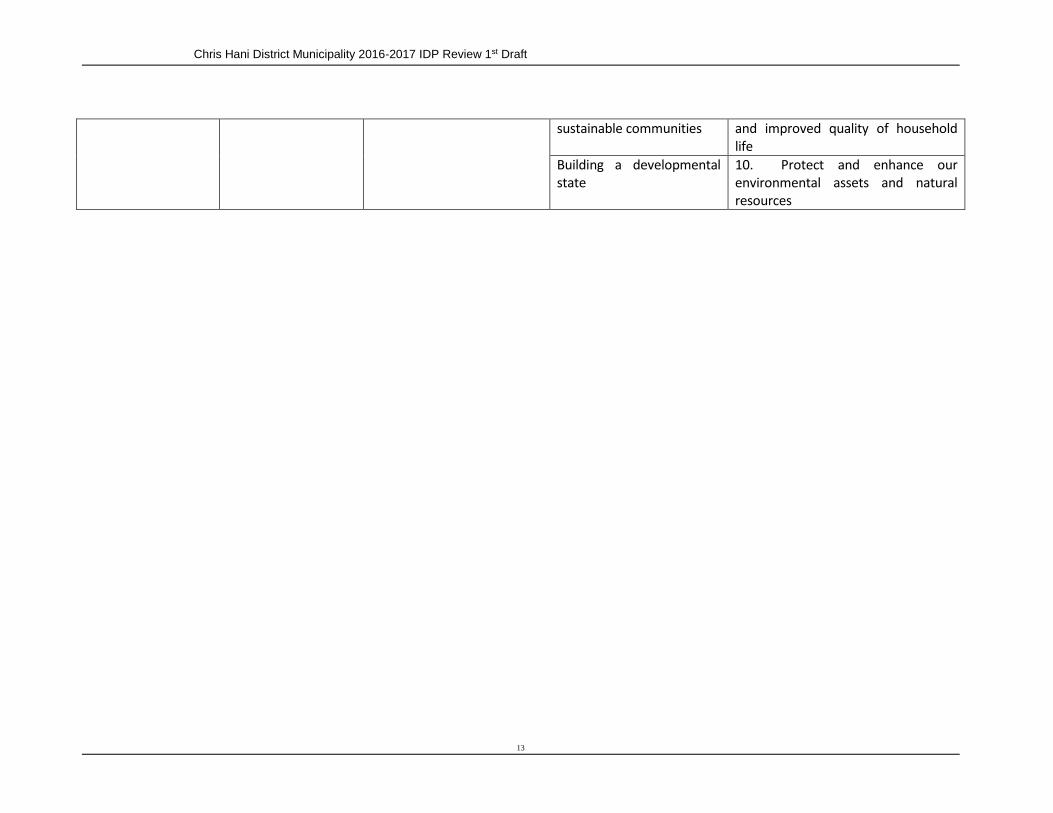
Chris Hani District Municipality 2016-2017 IDP Review 1st Draft
13
sustainable communities and improved quality of household life
Building a developmental state
10. Protect and enhance our environmental assets and natural resources
Chris Hani District Municpality –2016-2017 IDP Review 1st Draft
14
CHAPTER 2
This chapter provides a detailed summary of the Chris Hani District Municipality Situational
Analysis as guided by the official statistics as released by STATS SA informed by Census 2011
and Global Insight IHS Projections 2014-2015 as well as ECSECC 2014 Socio-Economic Profile.
2.1 ANALYSIS OVERVIEW
2.1.1 Introduction
Chris Hani District Municipality is located within the centre of the Province of the Eastern Cape
surrounded by the district municipalities of Amatole, Cacadu, Joe Gqabi and OR Tambo. It is
made up of the following eight local municipalities: Emalahleni, Engcobo, Inkwanca, Intsika
Yethu, Inxuba Yethemba, Lukhanji, Sakhisizwe and Tsolwana.
Lukhanji local municipality, comprising of Queenstown which is a main town and small
town of Whittlesea and numerous peri-urban and rural settlements. This is the home
to the District administrative centre.
Sakhisizwe local municipality, comprising of Cala and Elliot and numerous peri-urban
and rural settlements.
Emalahleni local municipality, comprising of Lady Frere, Dodrecht and Indwe and
numerious peri-urban and rural settlements.
Intsika Yethu local municipality, comprising of Cofimvaba, Tsomo and numerous peri-
urban and rural settlements.
Tsolwana local municipality, comprising of Tarkastad and Hofmeyer and surround rural
settlements.
Inkwanca local municipality, comprising of Molteno and Sterkstroom and surrounding
peri-urban and rural settlements.
Inxuba Yethemba local municipality, comprising of Cradock, Middleburg and
numerious peri-urban and rural settlements.
Engcobo local municipality, comprising of Ngcobo and numerious peri-urban and rural
settlements.
Chris Hani District Municipality covers an area of 36 558 KM2, a change from its previous size of
36, 561 square kilometres in extent due to the changes in dermacation.
Inxuba Yethemba is the largest single municipality (32%) in the district, followed by Tsolwana
(16%); Sakhisizwe and Engcobo are the smallest in terms of size (6% each).

Chris Hani District Municpality –2016-2017 IDP Review 1st Draft
15
2.2 DEMOGRAPHIC OVERVIEW
The Chris Hani District Municipality is one of the municipalities in the Eastern Cape Province. It is centrally
situated in the heart of the Eastern Cape, a linking node to all the regions in the province. It also includes
sections of the N6 and N10 routes that link the Eastern Cape ports with Gauteng. It comprises eight local
municipalities and Chris Hani District Municipality had an estimated total of 804 600 people living within
the boundaries of the municipality. The population is decreasing at an average of 0.08% per annum since
2002.
More than 93% of the population belongs to the African population group. In 2012 there were
approximately 214 200 households Chris Hani District Municipality, with an average household size of 3.7
people. The total population density for 2011 was 22 people per km². The total number of individuals with
an education level of less than a matric certificate - including those without schooling - was approximately
430 000 in 2012. The total number of individuals having obtained a matric certificate without any other
education was 68 950. In 2012, there were 167 400 people in Chris Hani District Municipality who were
considered to be functionally illiterate. Expressed as a literacy rate of all people aged 20 and up, this
amounts to 63.2% - up by 14.3 percentage points from 48.9% in 2002. Chris Hani District Municipality’s
literacy rate is still lower than that of the Eastern Cape Province and South Africa as whole. A decline in the
numbers of people living in extreme poverty is most certainly an indication that the community is
developing. In 2012, there was an estimated 365 400 people (or 45.4% of the total population
Chris Hani District Municipality) living in poverty. This number decreased with 22.1 percentage points since
2002.
The annual per capita income in Chris Hani District Municipality amounted to R23 500 in 2012, which is
lower than the province average. The total personal income in 2012 amounts to R18 9 billion which is
increasing over time. In 2012 the Chris Hani District Municipality had a Gini coefficient of 0.57. Between
2002 and 2012, income inequality decreased which means that an improvement is seen in the income
distribution.It is estimated that just over 83 400 people were employed by formal and informal sectors in
the district municipality. The unemployment rate was high at 34.5% in 2012 or 46 400 people. The total
economically active population was just over 134 600 people. The largest sector in terms of jobs is the
community service sector which includes all levels of government. In 2012, the region had a total Gross
Domestic product (GDP) of R13.9 billion which is a contribution of 5.9% to the total GDP of the Eastern
Cape Province and 0.4% to the GDP of South Africa as a whole. In 2012, the community services sector
contributed 53% towards Chris Hani District Municipality’s GVA (an indicator of business activity), with the
trade and finance sectors trailing at 18% and 11% respectively.
The Chris Hani Municipality is committed towards ensuring a brighter future for all inhabitants in the region
and its investment strategies aim to enhance competitiveness and encourage sustainable growth that is
inclusive. A stimulus should be created for the local economy to grow, compete and create more jobs. It is
all about competitiveness, about enterprises thriving in competitive markets and locations with the aim to
create sustainable employment at the local level. The main approach to do so is:
o To ensure that an environment and opportunities for more labour-absorbing economic activities is
established;
o To ensure that the fruits of growth are shared in such a way that poverty is largely eliminated; and
o To ensure that severe inequalities that still plague South Africa are considerably reduced.
Chris Hani District Municpality –2016-2017 IDP Review 1st Draft
16
Attracting private investors to Chris Hani District Municipality – and assisting them in establishing and
growing their businesses within the region – will ultimately result in the generation of income and wealth,
as well as increased profit margins which invariably lead to more investment. Once the cycle of investment
and positive returns on investment has been established within Chris Hani District Municipality, the
economic and socio-economic welfare of the entire community becomes a reality.
1 Introduction
Chris Hani is a District Municipality that has a vision of being a major economic growth stimulator and a
courageous destination for trade and investment, creating a better life for all. In order for this to be
achieved, the economy needs to grow at levels necessary to support the district’s targets in terms of
employment creation, socio-economic development and be sustained at levels necessary for poverty
alleviation. Analysing the current status of Chris Hani District Municipality’s economy in terms of GDP
growth, sectoral contributions and shares, as well as development indicators over time, will provide a
better understanding of the intricacies in its economy.
Economic growth in the country should be accelerated to an extent where poverty and unemployment is
alleviated - and here Chris Hani District Municipality’s has an important role to play by promoting the
District as a healthy growing destination for several business type initiatives.
The socio economic status quo of Chris Hani District Municipality is presented against the background of a
macro economic outlook for South Africa as a whole.
2 Statistical overview report for Chris Hani District Municipality
This report provides a topic-based framework of the historical, current and projected future economy of
Chris Hani District Municipality. The goal of this report is to provide the socio-economic context of Chris
Hani District Municipality, and to analyse various economic and socio-economic indicators relative to the
neighbouring regions, Eastern Cape Province and South Africa. The report also looks at the breakdown of
Chris Hani into its local municipalities for a selected number of variables.
1. Demographic
"Demographics", the term used for "population characteristics", includes population groups, age and
location of the residents of a specific region. Distributions of values within a demographic variable, and
across households, as well as trends over time are of interest.
In this section, an overview is provided of the demography of the Chris Hani District Municipality and all its
neighbouring regions, the Eastern Cape Province and South Africa as a whole.

Chris Hani District Municpality –2016-2017 IDP Review 1st Draft
17
1.1 Total Population
Population statistics is important when analysing an economy, as the growth in population directly impacts
employment and unemployment as well as other economic indicators like economic growth and per capita
income.
TABLE 1. TOTAL POPULATION - CHRIS HANI, EASTERN CAPE AND NATIONAL TOTAL, 2002-2012
[NUMBERS & PERCENTAGE]
Chris Hani Eastern Cape National Total Chris Hani as
% of province
Chris Hani as
% of national
2002 811,355 6,488,918 46,010,360 12.5% 1.8%
2003 806,340 6,487,798 46,556,367 12.4% 1.7%
2004 801,923 6,486,837 47,071,080 12.4% 1.7%
2005 798,256 6,487,856 47,606,384 12.3% 1.7%
2006 795,654 6,492,350 48,177,404 12.3% 1.7%
2007 794,994 6,500,641 48,764,219 12.2% 1.6%
2008 796,209 6,517,241 49,411,215 12.2% 1.6%
2009 798,089 6,539,796 50,028,134 12.2% 1.6%
2010 800,477 6,573,111 50,761,147 12.2% 1.6%
2011 802,441 6,608,741 51,513,755 12.1% 1.6%
2012 804,573 6,645,998 52,248,192 12.1% 1.5%
Average Annual growth
2002-2012 -0.08% 0.24% 1.28%
Source: IHS Global Insight Regional eXplorer version 700
With 805 000 people living in Chris Hani, the district municipality housed 1.5% of South Africa's total
population in 2012. When compared to Eastern Cape's average annual growth rate (0.24%), Chris Hani's
population has grown at a significant lower rate of -0.08% over the last decade.
There was a decline in the overall population for Chris Hani during the years 2002 to 2007 – resulting in
negative growth. From 2008 onwards, there has been a slight increase again with positive growth.
Chris Hani District Municpality –2016-2017 IDP Review 1st Draft
18
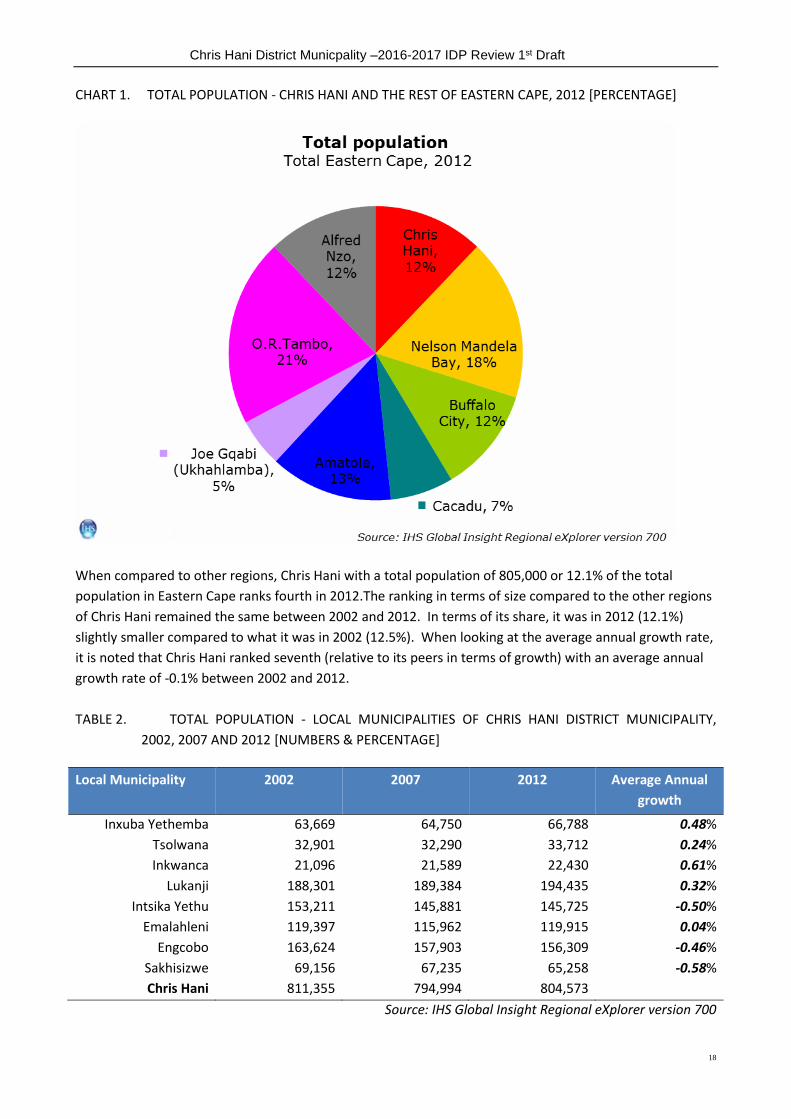
CHART 1. TOTAL POPULATION - CHRIS HANI AND THE REST OF EASTERN CAPE, 2012 [PERCENTAGE]
When compared to other regions, Chris Hani with a total population of 805,000 or 12.1% of the total
population in Eastern Cape ranks fourth in 2012.The ranking in terms of size compared to the other regions
of Chris Hani remained the same between 2002 and 2012. In terms of its share, it was in 2012 (12.1%)
slightly smaller compared to what it was in 2002 (12.5%). When looking at the average annual growth rate,
it is noted that Chris Hani ranked seventh (relative to its peers in terms of growth) with an average annual
growth rate of -0.1% between 2002 and 2012.
TABLE 2. TOTAL POPULATION - LOCAL MUNICIPALITIES OF CHRIS HANI DISTRICT MUNICIPALITY,
2002, 2007 AND 2012 [NUMBERS & PERCENTAGE]
Local Municipality 2002 2007 2012 Average Annual
growth
Inxuba Yethemba 63,669 64,750 66,788 0.48%
Tsolwana 32,901 32,290 33,712 0.24%
Inkwanca 21,096 21,589 22,430 0.61%
Lukanji 188,301 189,384 194,435 0.32%
Intsika Yethu 153,211 145,881 145,725 -0.50%
Emalahleni 119,397 115,962 119,915 0.04%
Engcobo 163,624 157,903 156,309 -0.46%
Sakhisizwe 69,156 67,235 65,258 -0.58%
Chris Hani 811,355 794,994 804,573
Source: IHS Global Insight Regional eXplorer version 700
Chris Hani District Municpality –2016-2017 IDP Review 1st Draft
19
The local municipality that had the lowest population growth (in fact negative, i.e. the population is
shrinking) is the Sakhisizwe Local Municipality, where the population decreased at an average annual rate
of 0.58%. The municipality with the highest population growth rate is the Inkwanca Local Municipality at
0.61% average annual growth. The Inxuba Yethemba Local Municipality too had a positive growth rate of
0.48%, which is still significantly lower than the average national growth of 1.28% over the same period.
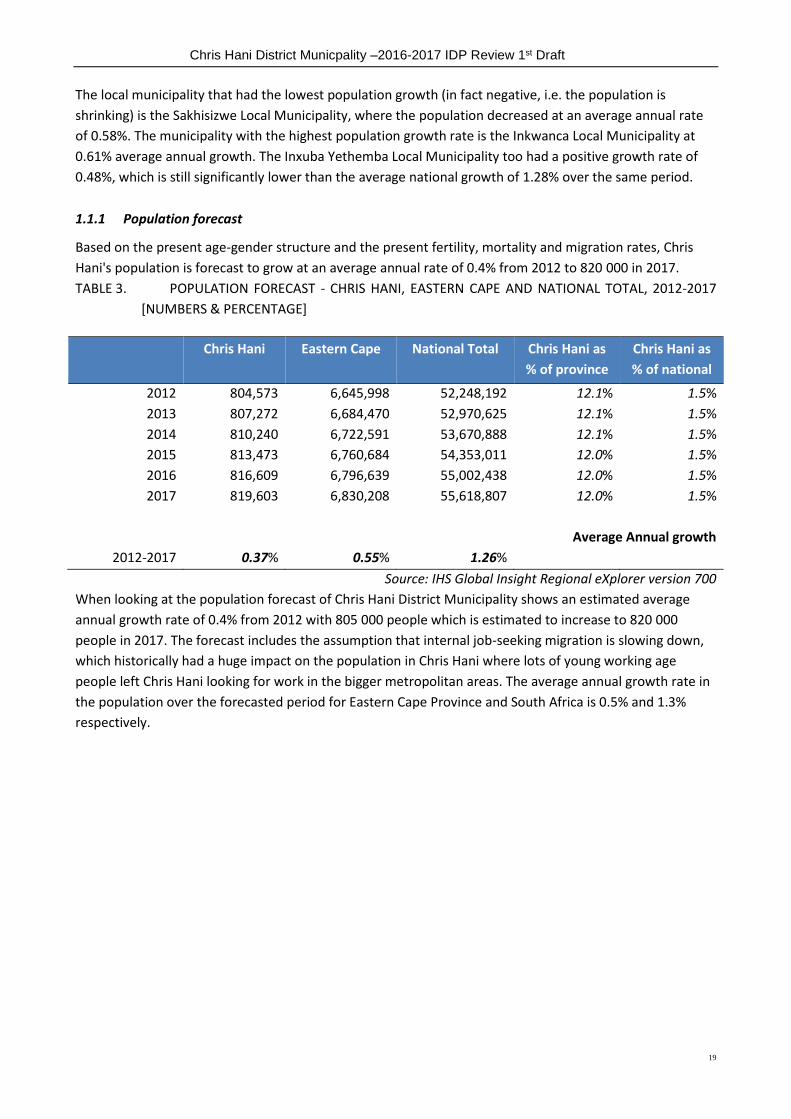
1.1.1 Population forecast
Based on the present age-gender structure and the present fertility, mortality and migration rates, Chris
Hani's population is forecast to grow at an average annual rate of 0.4% from 2012 to 820 000 in 2017.
TABLE 3. POPULATION FORECAST - CHRIS HANI, EASTERN CAPE AND NATIONAL TOTAL, 2012-2017
[NUMBERS & PERCENTAGE]
Chris Hani Eastern Cape National Total Chris Hani as
% of province
Chris Hani as
% of national
2012 804,573 6,645,998 52,248,192 12.1% 1.5%
2013 807,272 6,684,470 52,970,625 12.1% 1.5%
2014 810,240 6,722,591 53,670,888 12.1% 1.5%
2015 813,473 6,760,684 54,353,011 12.0% 1.5%
2016 816,609 6,796,639 55,002,438 12.0% 1.5%
2017 819,603 6,830,208 55,618,807 12.0% 1.5%
Average Annual growth
2012-2017 0.37% 0.55% 1.26%
Source: IHS Global Insight Regional eXplorer version 700
When looking at the population forecast of Chris Hani District Municipality shows an estimated average
annual growth rate of 0.4% from 2012 with 805 000 people which is estimated to increase to 820 000
people in 2017. The forecast includes the assumption that internal job-seeking migration is slowing down,
which historically had a huge impact on the population in Chris Hani where lots of young working age
people left Chris Hani looking for work in the bigger metropolitan areas. The average annual growth rate in
the population over the forecasted period for Eastern Cape Province and South Africa is 0.5% and 1.3%
respectively.
Chris Hani District Municpality –2016-2017 IDP Review 1st Draft
20
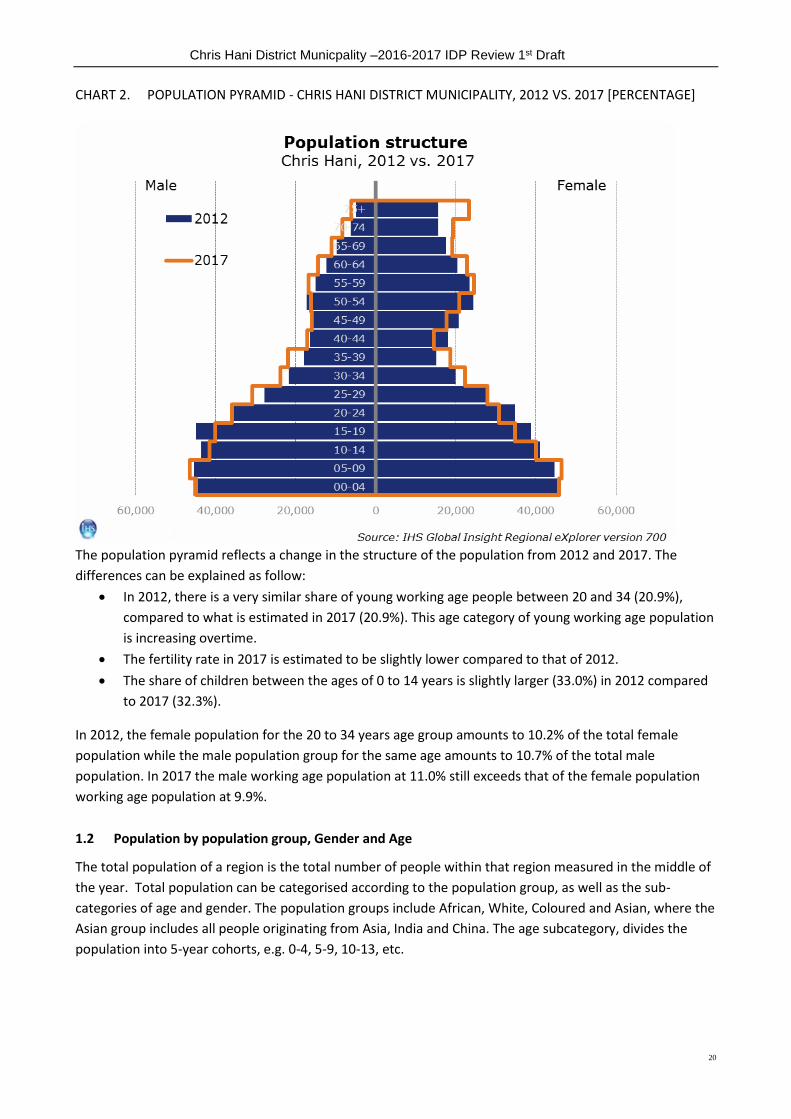
CHART 2. POPULATION PYRAMID - CHRIS HANI DISTRICT MUNICIPALITY, 2012 VS. 2017 [PERCENTAGE]
The population pyramid reflects a change in the structure of the population from 2012 and 2017. The
differences can be explained as follow:
In 2012, there is a very similar share of young working age people between 20 and 34 (20.9%),
compared to what is estimated in 2017 (20.9%). This age category of young working age population
is increasing overtime.
The fertility rate in 2017 is estimated to be slightly lower compared to that of 2012.
The share of children between the ages of 0 to 14 years is slightly larger (33.0%) in 2012 compared
to 2017 (32.3%).
In 2012, the female population for the 20 to 34 years age group amounts to 10.2% of the total female
population while the male population group for the same age amounts to 10.7% of the total male
population. In 2017 the male working age population at 11.0% still exceeds that of the female population
working age population at 9.9%.
1.2 Population by population group, Gender and Age
The total population of a region is the total number of people within that region measured in the middle of
the year. Total population can be categorised according to the population group, as well as the sub-
categories of age and gender. The population groups include African, White, Coloured and Asian, where the
Asian group includes all people originating from Asia, India and China. The age subcategory, divides the
population into 5-year cohorts, e.g. 0-4, 5-9, 10-13, etc.
Chris Hani District Municpality –2016-2017 IDP Review 1st Draft
21
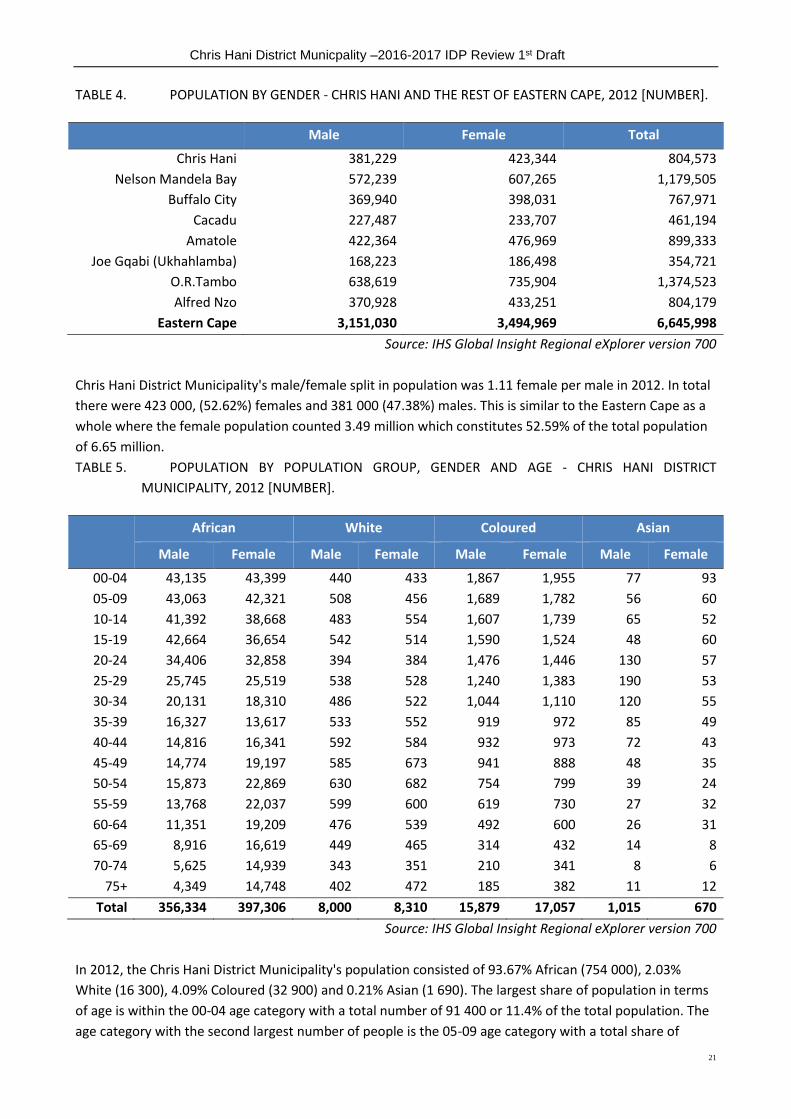
TABLE 4. POPULATION BY GENDER - CHRIS HANI AND THE REST OF EASTERN CAPE, 2012 [NUMBER].
Male Female Total
Chris Hani 381,229 423,344 804,573
Nelson Mandela Bay 572,239 607,265 1,179,505
Buffalo City 369,940 398,031 767,971
Cacadu 227,487 233,707 461,194
Amatole 422,364 476,969 899,333
Joe Gqabi (Ukhahlamba) 168,223 186,498 354,721
O.R.Tambo 638,619 735,904 1,374,523
Alfred Nzo 370,928 433,251 804,179
Eastern Cape 3,151,030 3,494,969 6,645,998
Source: IHS Global Insight Regional eXplorer version 700
Chris Hani District Municipality's male/female split in population was 1.11 female per male in 2012. In total
there were 423 000, (52.62%) females and 381 000 (47.38%) males. This is similar to the Eastern Cape as a
whole where the female population counted 3.49 million which constitutes 52.59% of the total population
of 6.65 million.
TABLE 5. POPULATION BY POPULATION GROUP, GENDER AND AGE - CHRIS HANI DISTRICT
MUNICIPALITY, 2012 [NUMBER].
African White Coloured Asian
Male Female Male Female Male Female Male Female
00-04 43,135 43,399 440 433 1,867 1,955 77 93
05-09 43,063 42,321 508 456 1,689 1,782 56 60
10-14 41,392 38,668 483 554 1,607 1,739 65 52
15-19 42,664 36,654 542 514 1,590 1,524 48 60
20-24 34,406 32,858 394 384 1,476 1,446 130 57
25-29 25,745 25,519 538 528 1,240 1,383 190 53
30-34 20,131 18,310 486 522 1,044 1,110 120 55
35-39 16,327 13,617 533 552 919 972 85 49
40-44 14,816 16,341 592 584 932 973 72 43
45-49 14,774 19,197 585 673 941 888 48 35
50-54 15,873 22,869 630 682 754 799 39 24
55-59 13,768 22,037 599 600 619 730 27 32
60-64 11,351 19,209 476 539 492 600 26 31
65-69 8,916 16,619 449 465 314 432 14 8
70-74 5,625 14,939 343 351 210 341 8 6
75+ 4,349 14,748 402 472 185 382 11 12
Total 356,334 397,306 8,000 8,310 15,879 17,057 1,015 670
Source: IHS Global Insight Regional eXplorer version 700
In 2012, the Chris Hani District Municipality's population consisted of 93.67% African (754 000), 2.03%
White (16 300), 4.09% Coloured (32 900) and 0.21% Asian (1 690). The largest share of population in terms
of age is within the 00-04 age category with a total number of 91 400 or 11.4% of the total population. The
age category with the second largest number of people is the 05-09 age category with a total share of

Chris Hani District Municpality –2016-2017 IDP Review 1st Draft
22
11.2%, followed by the 10-14 age category with 84 600 people. The age category with the least number of
people is the 75+ age category with only 20 600 people, as reflected in the population pyramids below
1.2.1 Population Pyramids
Definition: A population pyramid is a graphic representation of the population categorised by gender and
age, for a specific year and region. The horizontal axis depicts the share of people, where the
male population is charted on the left-hand side and the female population on the right-hand
side of the vertical axis. The vertical axis is divided in 5-year age categories.
With the African population group represents 93.7%of the Chris Hani District Municipality's total
population, the overall population pyramid for the region will mostly reflect that of the African population
group. The chart below compares Chris Hani's population structure of 2012 to that of South Africa.
CHART 3. POPULATION PYRAMID - CHRIS HANI DISTRICT MUNICIPALITY VS. SOUTH AFRICA, 2012
[PERCENTAGE]
By comparing the Chris Hani District Municipality's population pyramid with South Africa's several signs of
change can be noticed. The most significant differences between the Chris Hani and South Africa are:
There is a significant smaller share of young working age people - aged 20 to 34 (20.9%) in Chris
Hani, compared to the national picture (27.0%)
The area seems to be a migrant sending area, with many people leaving the area to find work in the
bigger cities.
Fertility in Chris Hani is significantly higher compared to South Africa as a whole.
Chris Hani District Municpality –2016-2017 IDP Review 1st Draft
23
The share of children between the ages of 0 to 14 years is significantly larger (33.0%) in Chris Hani
compared to South Africa (29.7%). Demand for expenditure on schooling as percentage of total
budget within Chris Hani will be higher than that of South Africa.
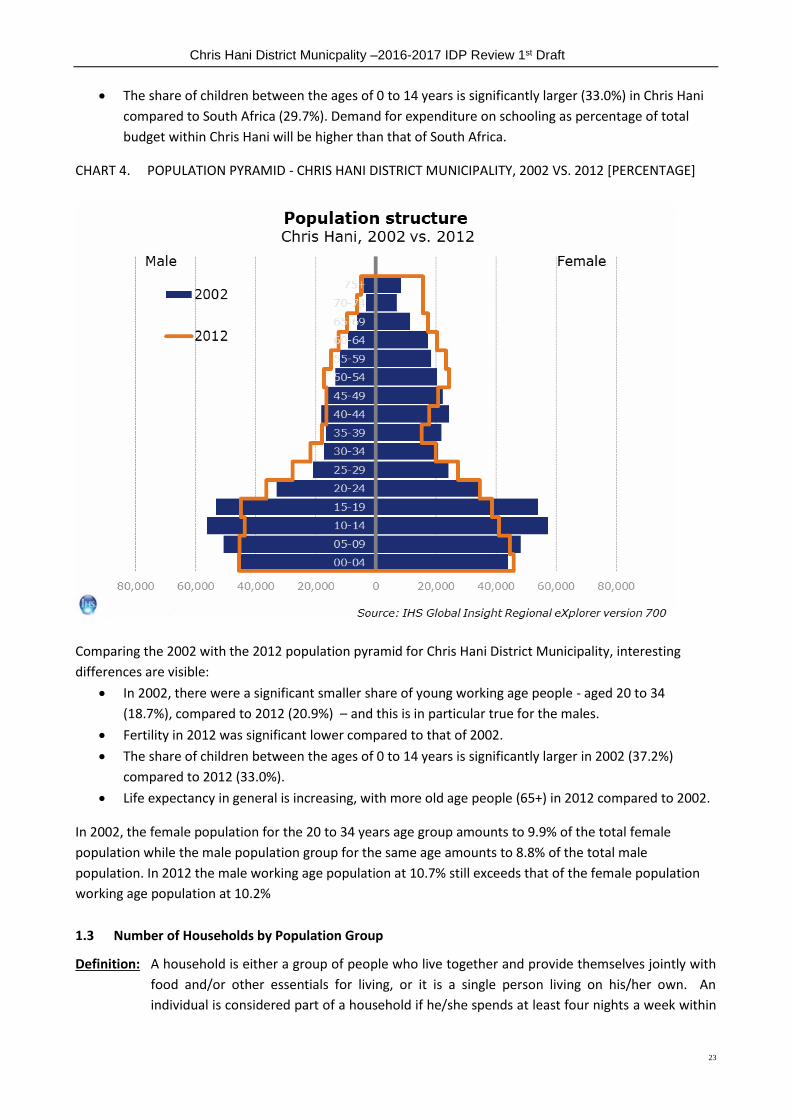
CHART 4. POPULATION PYRAMID - CHRIS HANI DISTRICT MUNICIPALITY, 2002 VS. 2012 [PERCENTAGE]
Comparing the 2002 with the 2012 population pyramid for Chris Hani District Municipality, interesting
differences are visible:
In 2002, there were a significant smaller share of young working age people - aged 20 to 34
(18.7%), compared to 2012 (20.9%) – and this is in particular true for the males.
Fertility in 2012 was significant lower compared to that of 2002.
The share of children between the ages of 0 to 14 years is significantly larger in 2002 (37.2%)
compared to 2012 (33.0%).
Life expectancy in general is increasing, with more old age people (65+) in 2012 compared to 2002.
In 2002, the female population for the 20 to 34 years age group amounts to 9.9% of the total female
population while the male population group for the same age amounts to 8.8% of the total male
population. In 2012 the male working age population at 10.7% still exceeds that of the female population
working age population at 10.2%
1.3 Number of Households by Population Group
Definition: A household is either a group of people who live together and provide themselves jointly with
food and/or other essentials for living, or it is a single person living on his/her own. An
individual is considered part of a household if he/she spends at least four nights a week within

Chris Hani District Municpality –2016-2017 IDP Review 1st Draft
24
the household. To categorise a household according to population group, the population group
to which the head of the household belongs, is used.
If the number of households is growing at a faster rate than that of the population it means that the
average household size is decreasing and vice versa. In 2012, the Chris Hani District Municipality comprised
of 214 000 households. This equates to an average annual growth rate of 1.22% in the number of
households between 2002 and 2012. With an average annual growth rate of -0.08% in the total population,
the household size in the Chris Hani District Municipality is by implication decreasing. This is confirmed by
the data where the average household size in 2002 decrease from approximately 4.3 individuals per
household to 3.8 persons per household in 2012.
TABLE 6. NUMBER OF HOUSEHOLDS - CHRIS HANI, EASTERN CAPE AND NATIONAL TOTAL, 2002-2012
[NUMBER & PERCENTAGE]
Chris Hani Eastern Cape National Total Chris Hani as
% of province
Chris Hani as
% of national
2002 189,792 1,537,800 12,014,757 12.3% 1.6%
2003 193,178 1,564,958 12,385,568 12.3% 1.6%
2004 195,787 1,585,275 12,725,259 12.4% 1.5%
2005 198,601 1,606,397 13,034,529 12.4% 1.5%
2006 202,302 1,632,861 13,317,242 12.4% 1.5%
2007 207,039 1,664,144 13,595,780 12.4% 1.5%
2008 211,355 1,690,361 13,876,167 12.5% 1.5%
2009 213,950 1,703,889 14,081,872 12.6% 1.5%
2010 215,246 1,710,168 14,270,892 12.6% 1.5%
2011 214,619 1,707,839 14,498,115 12.6% 1.5%
2012 214,221 1,704,690 14,748,242 12.6% 1.5%
Average Annual growth
2002-2012 1.22% 1.04% 2.07%
Source: IHS Global Insight Regional eXplorer version 700
Relative to the province, Chris Hani had a higher average annual growth rate of 1.22% from 2002 to 2012.
In contrast, South Africa had a total of 14.7 million households, with a growth rate of 2.07%, thus growing
at a higher rate than the Chris Hani. The composition of the households by population group consists of
92.5% which is ascribed to the African population group with the largest amount of households by
population group. The Coloured population group had a total composition of 4.7% (ranking second). The
White population group had a total composition of 2.5% of the total households. The smallest population
group by households is the Asian population group with only 0.3%.

Chris Hani District Municpality –2016-2017 IDP Review 1st Draft
25
Number of households by population group - Chris Hani District Municipality, 2012 [Percentage]
The growth in the number of households for the African population is on average 1.17% per annum for the
period 2002 to 2012, which translates to an increase of 21 800 in households over the period. The average
annual growth rate in the number of households for all the other population groups has increased with
1.77%.
Chris Hani District Municpality –2016-2017 IDP Review 1st Draft
26
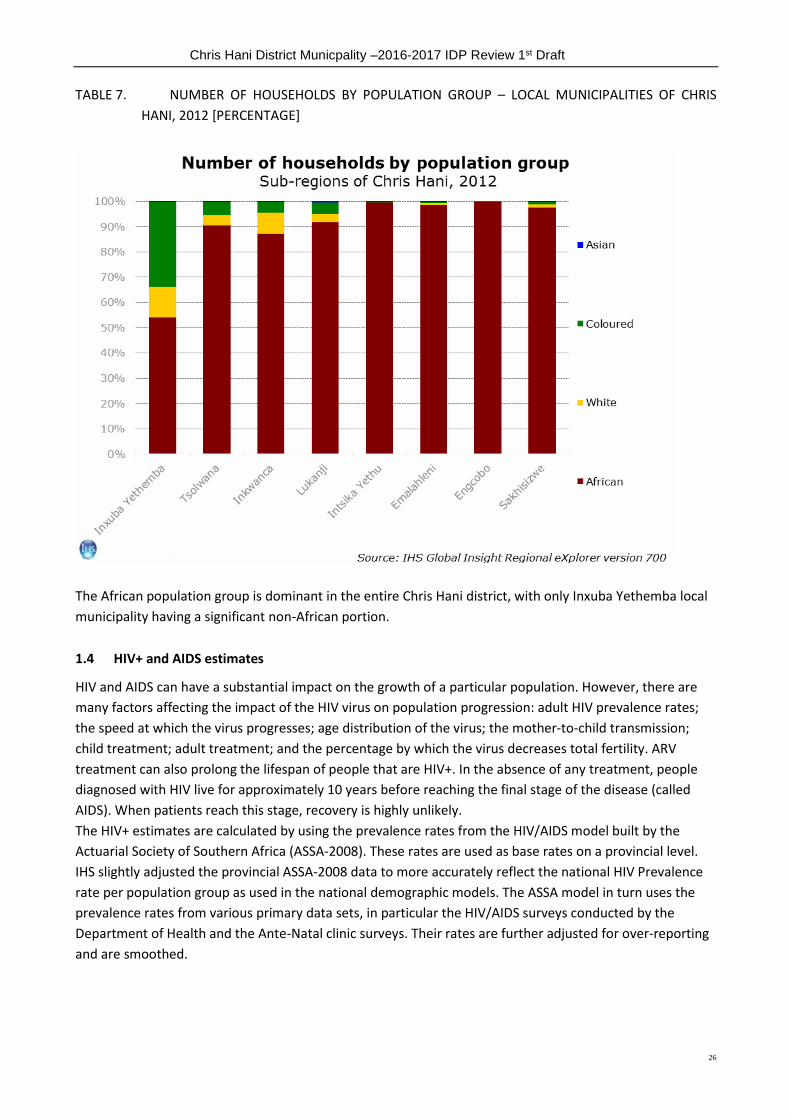
TABLE 7. NUMBER OF HOUSEHOLDS BY POPULATION GROUP – LOCAL MUNICIPALITIES OF CHRIS
HANI, 2012 [PERCENTAGE]
The African population group is dominant in the entire Chris Hani district, with only Inxuba Yethemba local
municipality having a significant non-African portion.
1.4 HIV+ and AIDS estimates
HIV and AIDS can have a substantial impact on the growth of a particular population. However, there are
many factors affecting the impact of the HIV virus on population progression: adult HIV prevalence rates;
the speed at which the virus progresses; age distribution of the virus; the mother-to-child transmission;
child treatment; adult treatment; and the percentage by which the virus decreases total fertility. ARV
treatment can also prolong the lifespan of people that are HIV+. In the absence of any treatment, people
diagnosed with HIV live for approximately 10 years before reaching the final stage of the disease (called
AIDS). When patients reach this stage, recovery is highly unlikely.
The HIV+ estimates are calculated by using the prevalence rates from the HIV/AIDS model built by the
Actuarial Society of Southern Africa (ASSA-2008). These rates are used as base rates on a provincial level.
IHS slightly adjusted the provincial ASSA-2008 data to more accurately reflect the national HIV Prevalence
rate per population group as used in the national demographic models. The ASSA model in turn uses the
prevalence rates from various primary data sets, in particular the HIV/AIDS surveys conducted by the
Department of Health and the Ante-Natal clinic surveys. Their rates are further adjusted for over-reporting
and are smoothed.
Chris Hani District Municpality –2016-2017 IDP Review 1st Draft
27
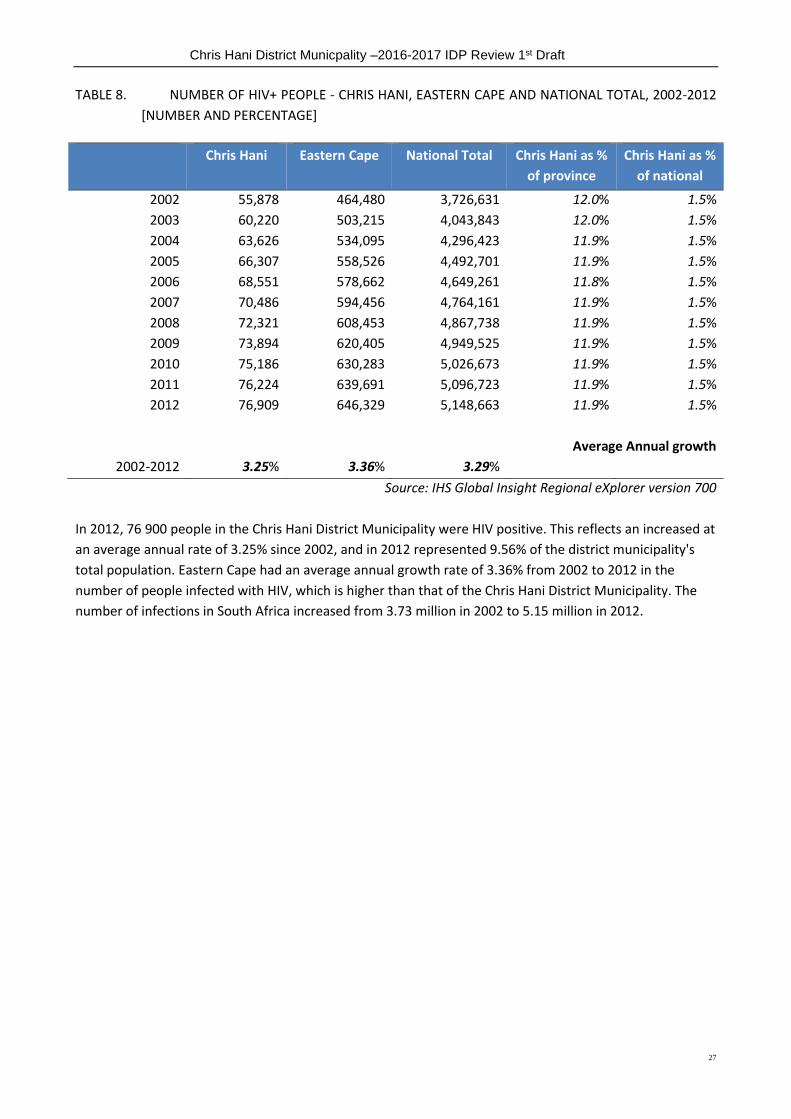
TABLE 8. NUMBER OF HIV+ PEOPLE - CHRIS HANI, EASTERN CAPE AND NATIONAL TOTAL, 2002-2012
[NUMBER AND PERCENTAGE]
Chris Hani Eastern Cape National Total Chris Hani as %
of province
Chris Hani as %
of national
2002 55,878 464,480 3,726,631 12.0% 1.5%
2003 60,220 503,215 4,043,843 12.0% 1.5%
2004 63,626 534,095 4,296,423 11.9% 1.5%
2005 66,307 558,526 4,492,701 11.9% 1.5%
2006 68,551 578,662 4,649,261 11.8% 1.5%
2007 70,486 594,456 4,764,161 11.9% 1.5%
2008 72,321 608,453 4,867,738 11.9% 1.5%
2009 73,894 620,405 4,949,525 11.9% 1.5%
2010 75,186 630,283 5,026,673 11.9% 1.5%
2011 76,224 639,691 5,096,723 11.9% 1.5%
2012 76,909 646,329 5,148,663 11.9% 1.5%
Average Annual growth
2002-2012 3.25% 3.36% 3.29%
Source: IHS Global Insight Regional eXplorer version 700
In 2012, 76 900 people in the Chris Hani District Municipality were HIV positive. This reflects an increased at
an average annual rate of 3.25% since 2002, and in 2012 represented 9.56% of the district municipality's
total population. Eastern Cape had an average annual growth rate of 3.36% from 2002 to 2012 in the
number of people infected with HIV, which is higher than that of the Chris Hani District Municipality. The
number of infections in South Africa increased from 3.73 million in 2002 to 5.15 million in 2012.
Chris Hani District Municpality –2016-2017 IDP Review 1st Draft
28
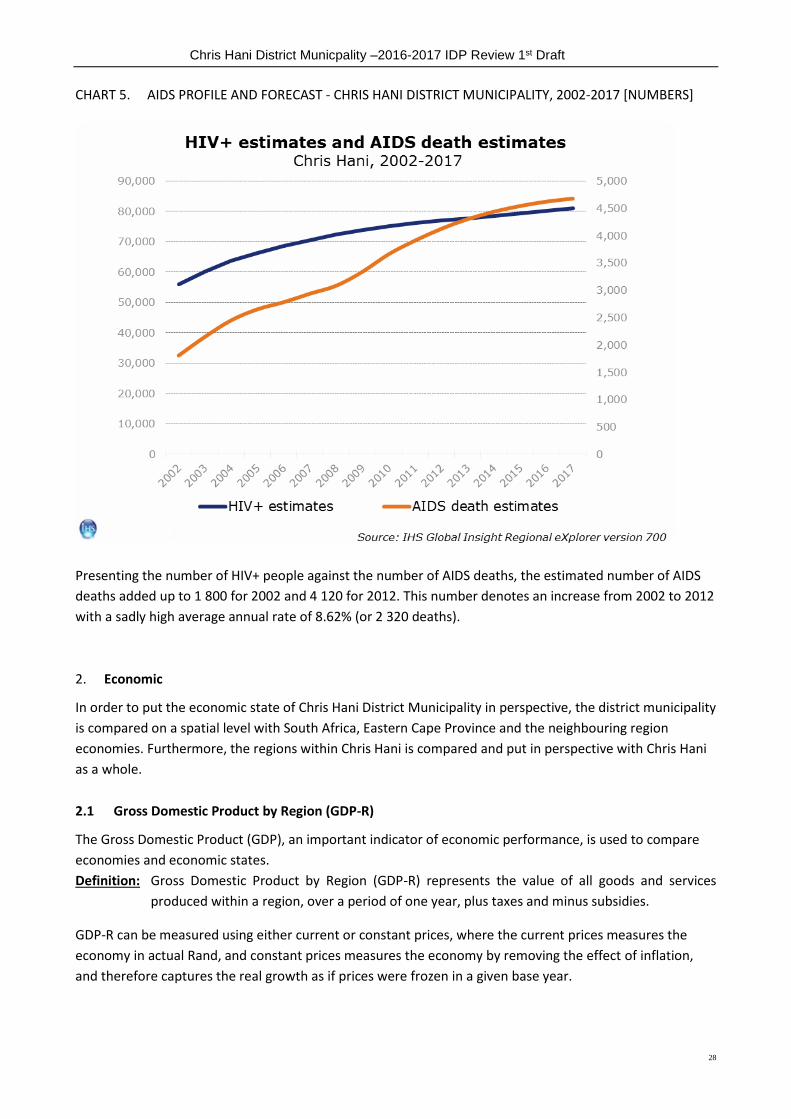
CHART 5. AIDS PROFILE AND FORECAST - CHRIS HANI DISTRICT MUNICIPALITY, 2002-2017 [NUMBERS]
Presenting the number of HIV+ people against the number of AIDS deaths, the estimated number of AIDS
deaths added up to 1 800 for 2002 and 4 120 for 2012. This number denotes an increase from 2002 to 2012
with a sadly high average annual rate of 8.62% (or 2 320 deaths).
2. Economic
In order to put the economic state of Chris Hani District Municipality in perspective, the district municipality
is compared on a spatial level with South Africa, Eastern Cape Province and the neighbouring region
economies. Furthermore, the regions within Chris Hani is compared and put in perspective with Chris Hani
as a whole.
2.1 Gross Domestic Product by Region (GDP-R)
The Gross Domestic Product (GDP), an important indicator of economic performance, is used to compare
economies and economic states.
Definition: Gross Domestic Product by Region (GDP-R) represents the value of all goods and services
produced within a region, over a period of one year, plus taxes and minus subsidies.
GDP-R can be measured using either current or constant prices, where the current prices measures the
economy in actual Rand, and constant prices measures the economy by removing the effect of inflation,
and therefore captures the real growth as if prices were frozen in a given base year.
Chris Hani District Municpality –2016-2017 IDP Review 1st Draft
29
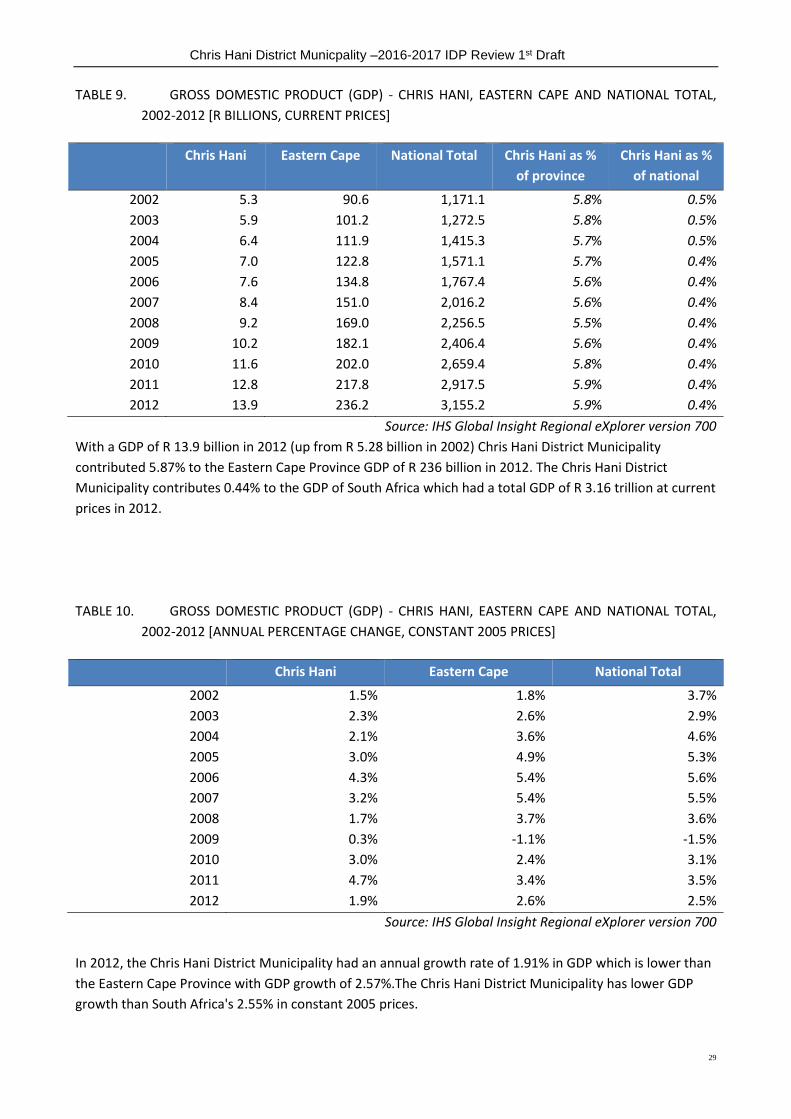
TABLE 9. GROSS DOMESTIC PRODUCT (GDP) - CHRIS HANI, EASTERN CAPE AND NATIONAL TOTAL,
2002-2012 [R BILLIONS, CURRENT PRICES]
Chris Hani Eastern Cape National Total Chris Hani as %
of province
Chris Hani as %
of national
2002 5.3 90.6 1,171.1 5.8% 0.5%
2003 5.9 101.2 1,272.5 5.8% 0.5%
2004 6.4 111.9 1,415.3 5.7% 0.5%
2005 7.0 122.8 1,571.1 5.7% 0.4%
2006 7.6 134.8 1,767.4 5.6% 0.4%
2007 8.4 151.0 2,016.2 5.6% 0.4%
2008 9.2 169.0 2,256.5 5.5% 0.4%
2009 10.2 182.1 2,406.4 5.6% 0.4%
2010 11.6 202.0 2,659.4 5.8% 0.4%
2011 12.8 217.8 2,917.5 5.9% 0.4%
2012 13.9 236.2 3,155.2 5.9% 0.4%
Source: IHS Global Insight Regional eXplorer version 700
With a GDP of R 13.9 billion in 2012 (up from R 5.28 billion in 2002) Chris Hani District Municipality
contributed 5.87% to the Eastern Cape Province GDP of R 236 billion in 2012. The Chris Hani District
Municipality contributes 0.44% to the GDP of South Africa which had a total GDP of R 3.16 trillion at current
prices in 2012.
TABLE 10. GROSS DOMESTIC PRODUCT (GDP) - CHRIS HANI, EASTERN CAPE AND NATIONAL TOTAL,
2002-2012 [ANNUAL PERCENTAGE CHANGE, CONSTANT 2005 PRICES]
Chris Hani Eastern Cape National Total
2002 1.5% 1.8% 3.7%
2003 2.3% 2.6% 2.9%
2004 2.1% 3.6% 4.6%
2005 3.0% 4.9% 5.3%
2006 4.3% 5.4% 5.6%
2007 3.2% 5.4% 5.5%
2008 1.7% 3.7% 3.6%
2009 0.3% -1.1% -1.5%
2010 3.0% 2.4% 3.1%
2011 4.7% 3.4% 3.5%
2012 1.9% 2.6% 2.5%
Source: IHS Global Insight Regional eXplorer version 700
In 2012, the Chris Hani District Municipality had an annual growth rate of 1.91% in GDP which is lower than
the Eastern Cape Province with GDP growth of 2.57%.The Chris Hani District Municipality has lower GDP
growth than South Africa's 2.55% in constant 2005 prices.

Chris Hani District Municpality –2016-2017 IDP Review 1st Draft
30
CHART 6. GROSS DOMESTIC PRODUCT (GDP) - CHRIS HANI DISTRICT MUNICIPALITY AND THE REST OF
EASTERN CAPE, 2012 [PERCENTAGE]
The Chris Hani District Municipality, with a total GDP of R 13.9 billion, contributes the sixth of all the
regional economies to total Eastern Cape GDP. This ranking in terms of size compared to other regions of
Chris Hani remained the same since 2002. In terms of its share, it was in 2012 (5.9%) very similar compared
to what it was in 2002 (5.8%). For the period 2002 to 2012, the average annual growth rate of 2.7% of Chris
Hani was the seventh relative to its peers in terms of growth in constant 2005 prices.
A municipality does not function in isolation and now, more than ever, it is crucial to have reliable
information on its economy for effective planning. Information is needed that will empower the
municipality to plan and implement policies that will encourage the social development and economic
growth of the people and industries in the municipality respectively.
TABLE 11. GROSS DOMESTIC PRODUCT (GDP) - LOCAL MUNICIPALITIES OF CHRIS HANI DISTRICT
MUNICIPALITY, 2002,2007 AND 2012 [R MILLIONS, CONSTANT 2005 PRICES]
Local Municipality 2002 2007 2012 Average Annual
growth
Inxuba Yethemba 983.6 1,156.8 1,330.8 3.07%
Tsolwana 158.6 178.7 210.2 2.86%
Inkwanca 266.7 298.5 320.1 1.84%
Lukanji 3,065.5 3,597.1 3,979.1 2.64%
Intsika Yethu 665.7 751.1 844.5 2.41%
Emalahleni 507.0 581.0 662.7 2.72%
Chris Hani District Municpality –2016-2017 IDP Review 1st Draft
31
Local Municipality 2002 2007 2012 Average Annual
growth
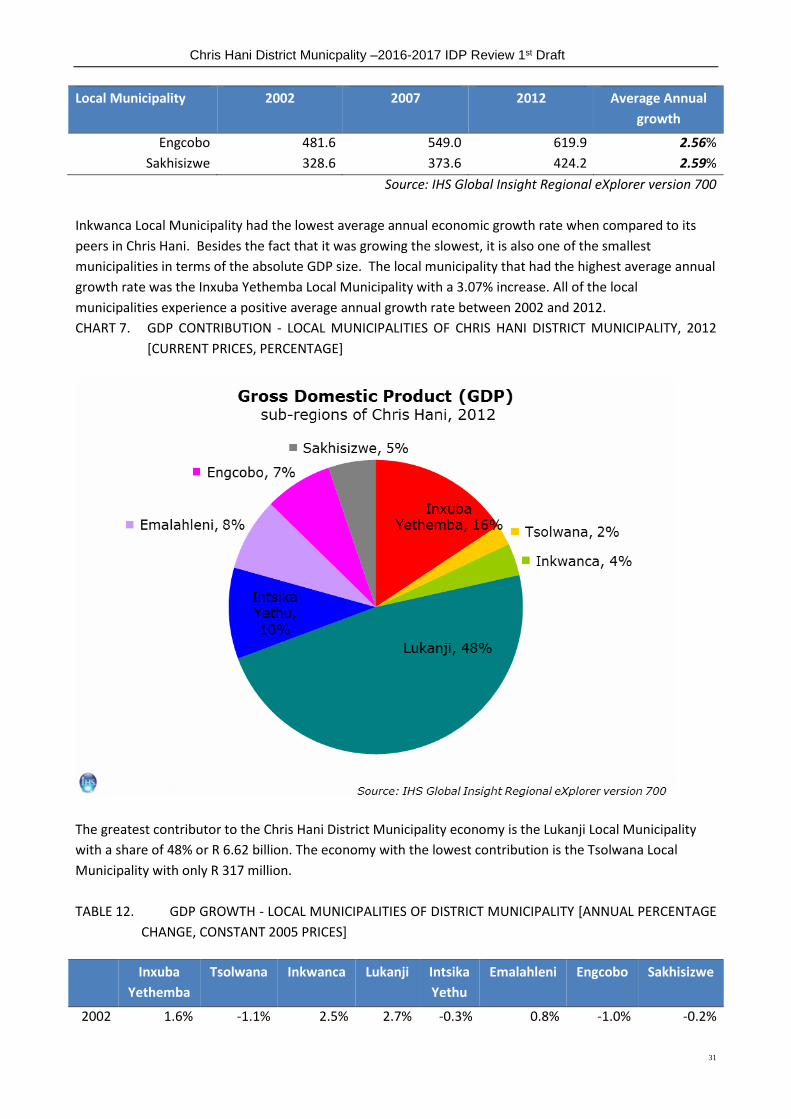
Engcobo 481.6 549.0 619.9 2.56%
Sakhisizwe 328.6 373.6 424.2 2.59%
Source: IHS Global Insight Regional eXplorer version 700
Inkwanca Local Municipality had the lowest average annual economic growth rate when compared to its
peers in Chris Hani. Besides the fact that it was growing the slowest, it is also one of the smallest
municipalities in terms of the absolute GDP size. The local municipality that had the highest average annual
growth rate was the Inxuba Yethemba Local Municipality with a 3.07% increase. All of the local
municipalities experience a positive average annual growth rate between 2002 and 2012.
CHART 7. GDP CONTRIBUTION - LOCAL MUNICIPALITIES OF CHRIS HANI DISTRICT MUNICIPALITY, 2012
[CURRENT PRICES, PERCENTAGE]
The greatest contributor to the Chris Hani District Municipality economy is the Lukanji Local Municipality
with a share of 48% or R 6.62 billion. The economy with the lowest contribution is the Tsolwana Local
Municipality with only R 317 million.
TABLE 12. GDP GROWTH - LOCAL MUNICIPALITIES OF DISTRICT MUNICIPALITY [ANNUAL PERCENTAGE
CHANGE, CONSTANT 2005 PRICES]
Inxuba
Yethemba
Tsolwana Inkwanca Lukanji Intsika
Yethu
Emalahleni Engcobo Sakhisizwe
2002 1.6% -1.1% 2.5% 2.7% -0.3% 0.8% -1.0% -0.2%
Chris Hani District Municpality –2016-2017 IDP Review 1st Draft
32
Inxuba
Yethemba
Tsolwana Inkwanca Lukanji Intsika
Yethu
Emalahleni Engcobo Sakhisizwe
2003 2.8% 0.1% -0.2% 3.1% 2.1% 0.5% 1.9% 0.9%
2004 1.5% 0.7% 1.6% 2.6% 2.3% 1.7% 2.2% 1.6%
2005 3.1% -0.6% 2.0% 3.7% 1.4% 3.6% 2.0% 2.9%
2006 4.5% 7.0% 5.1% 3.8% 4.6% 4.8% 4.6% 4.7%
2007 4.7% 5.2% 3.0% 3.1% 1.9% 3.3% 2.7% 2.9%
2008 4.0% 4.6% 2.1% 1.1% 1.5% 0.6% 1.5% 1.1%
2009 1.2% 0.6% -1.1% -0.7% 2.1% 1.6% 1.1% 1.3%
2010 2.7% 5.5% 1.9% 2.2% 3.6% 5.2% 4.1% 4.2%
2011 4.0% 6.4% 2.8% 5.0% 3.7% 5.7% 4.5% 5.3%
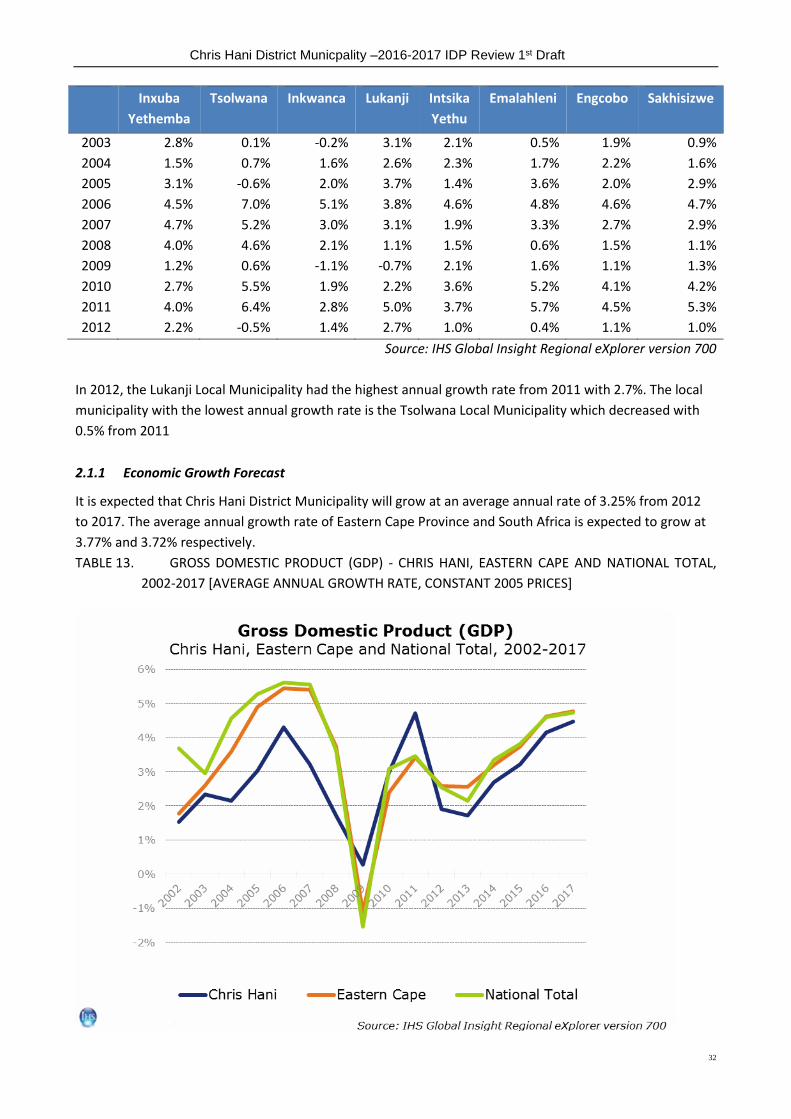
2012 2.2% -0.5% 1.4% 2.7% 1.0% 0.4% 1.1% 1.0%
Source: IHS Global Insight Regional eXplorer version 700
In 2012, the Lukanji Local Municipality had the highest annual growth rate from 2011 with 2.7%. The local
municipality with the lowest annual growth rate is the Tsolwana Local Municipality which decreased with
0.5% from 2011
2.1.1 Economic Growth Forecast
It is expected that Chris Hani District Municipality will grow at an average annual rate of 3.25% from 2012
to 2017. The average annual growth rate of Eastern Cape Province and South Africa is expected to grow at
3.77% and 3.72% respectively.
TABLE 13. GROSS DOMESTIC PRODUCT (GDP) - CHRIS HANI, EASTERN CAPE AND NATIONAL TOTAL,
2002-2017 [AVERAGE ANNUAL GROWTH RATE, CONSTANT 2005 PRICES]
Chris Hani District Municpality –2016-2017 IDP Review 1st Draft
33
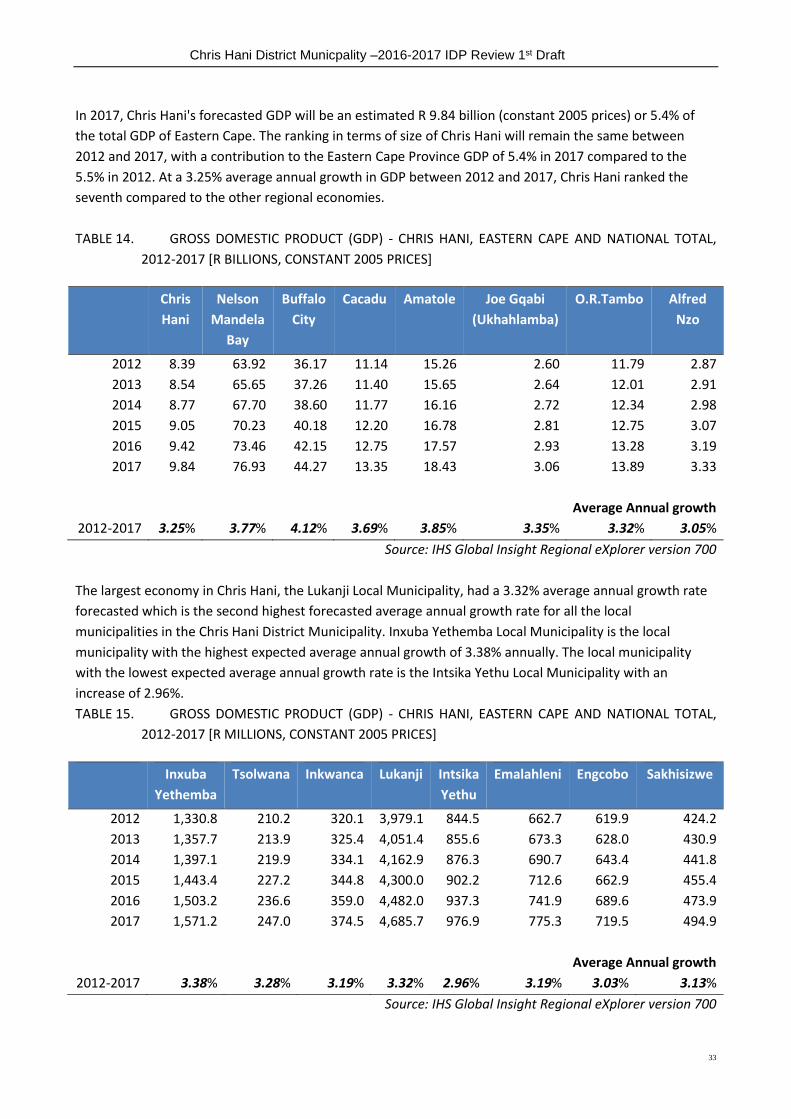
In 2017, Chris Hani's forecasted GDP will be an estimated R 9.84 billion (constant 2005 prices) or 5.4% of
the total GDP of Eastern Cape. The ranking in terms of size of Chris Hani will remain the same between
2012 and 2017, with a contribution to the Eastern Cape Province GDP of 5.4% in 2017 compared to the
5.5% in 2012. At a 3.25% average annual growth in GDP between 2012 and 2017, Chris Hani ranked the
seventh compared to the other regional economies.
TABLE 14. GROSS DOMESTIC PRODUCT (GDP) - CHRIS HANI, EASTERN CAPE AND NATIONAL TOTAL,
2012-2017 [R BILLIONS, CONSTANT 2005 PRICES]
Chris
Hani
Nelson
Mandela
Bay
Buffalo
City
Cacadu Amatole Joe Gqabi
(Ukhahlamba)
O.R.Tambo Alfred
Nzo
2012 8.39 63.92 36.17 11.14 15.26 2.60 11.79 2.87
2013 8.54 65.65 37.26 11.40 15.65 2.64 12.01 2.91
2014 8.77 67.70 38.60 11.77 16.16 2.72 12.34 2.98
2015 9.05 70.23 40.18 12.20 16.78 2.81 12.75 3.07
2016 9.42 73.46 42.15 12.75 17.57 2.93 13.28 3.19
2017 9.84 76.93 44.27 13.35 18.43 3.06 13.89 3.33
Average Annual growth
2012-2017 3.25% 3.77% 4.12% 3.69% 3.85% 3.35% 3.32% 3.05%
Source: IHS Global Insight Regional eXplorer version 700
The largest economy in Chris Hani, the Lukanji Local Municipality, had a 3.32% average annual growth rate
forecasted which is the second highest forecasted average annual growth rate for all the local
municipalities in the Chris Hani District Municipality. Inxuba Yethemba Local Municipality is the local
municipality with the highest expected average annual growth of 3.38% annually. The local municipality
with the lowest expected average annual growth rate is the Intsika Yethu Local Municipality with an
increase of 2.96%.
TABLE 15. GROSS DOMESTIC PRODUCT (GDP) - CHRIS HANI, EASTERN CAPE AND NATIONAL TOTAL,
2012-2017 [R MILLIONS, CONSTANT 2005 PRICES]
Inxuba
Yethemba
Tsolwana Inkwanca Lukanji Intsika
Yethu
Emalahleni Engcobo Sakhisizwe
2012 1,330.8 210.2 320.1 3,979.1 844.5 662.7 619.9 424.2
2013 1,357.7 213.9 325.4 4,051.4 855.6 673.3 628.0 430.9
2014 1,397.1 219.9 334.1 4,162.9 876.3 690.7 643.4 441.8
2015 1,443.4 227.2 344.8 4,300.0 902.2 712.6 662.9 455.4
2016 1,503.2 236.6 359.0 4,482.0 937.3 741.9 689.6 473.9
2017 1,571.2 247.0 374.5 4,685.7 976.9 775.3 719.5 494.9
Average Annual growth
2012-2017 3.38% 3.28% 3.19% 3.32% 2.96% 3.19% 3.03% 3.13%
Source: IHS Global Insight Regional eXplorer version 700

Chris Hani District Municpality –2016-2017 IDP Review 1st Draft
34
2.2 Gross Value Added by Region (GVA-R)
Chris Hani District Municipality's economy is made up of various industries. The GVA-R variable provides a
sector breakdown, where each sector is measured in terms of its "value added" produced in the local
economy.
Definition: Gross Value Added (GVA) is a measure of output (total production) of a region in terms of the
value that was created within that region. GVA can be broken down into various production
sectors.
The summary table below puts the Gross Value added (GVA) of all the regions in perspective to that of the
Chris Hani District Municipality.
TABLE 16. GROSS VALUE ADDED (GVA) BY BROAD ECONOMIC SECTOR - CHRIS HANI DISTRICT
MUNICIPALITY, 2012 [R BILLIONS, CURRENT PRICES]
Chris Hani Eastern Cape National Total Chris Hani as %
of province
Chris Hani as %
of national
Agriculture 0.4 3.5 72.7 12.2% 0.6%
Mining 0.0 0.2 262.7 3.4% 0.0%
Manufacturing 0.5 28.2 351.1 1.8% 0.1%
Electricity 0.2 3.1 79.1 6.5% 0.3%
Construction 0.3 4.9 112.6 6.7% 0.3%
Trade 2.3 36.1 452.7 6.3% 0.5%
Transport 0.8 18.4 257.7 4.3% 0.3%
Finance 1.4 43.8 608.5 3.2% 0.2%
Community services 6.8 74.0 637.9 9.1% 1.1%
Total Industries 12.7 212.2 2,835.1 6.0% 0.4%
Source: IHS Global Insight Regional eXplorer version 700
In 2012, the Community services sector is the largest within Chris Hani District Municipality accounting for
R 6.76 billion or 53.17% of the total GVA in Chris Hani. The sector that contributes the second most to the
GVA of the Chris Hani District Municipality is the Trade sector with 17.79%, followed by the Finance sector
with 11.14%. The sector that contributes the least to the economy of Chris Hani District Municipality is the
Mining sector with a contribution of R 7.09 million or 0.06% to the total GVA.

Chris Hani District Municpality –2016-2017 IDP Review 1st Draft
35
CHART 8. GROSS VALUE ADDED (GVA) BY BROAD ECONOMIC SECTOR - CHRIS HANI DISTRICT
MUNICIPALITY, 2012 [PERCENTAGE COMPOSITION]
The greatest contributor towards the GVA of the local municipalities is the community sector (ranging from
28% for the Inkwanca Local Municipality to 70% for Sakhisizwe Local Municipality), with the Lukanji Local
Municipality community services contributing 46% or R 2.8 billion to the total Gross value added of the its
own local municipality.
Chris Hani District Municpality –2016-2017 IDP Review 1st Draft
36
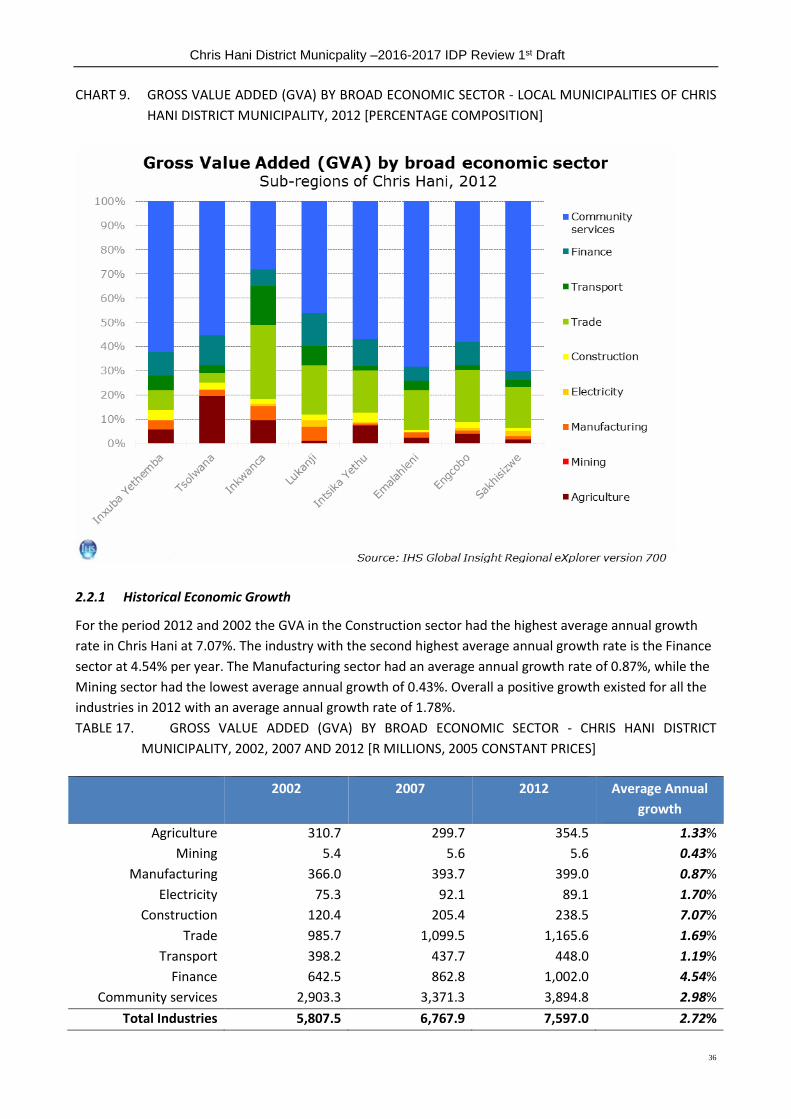
CHART 9. GROSS VALUE ADDED (GVA) BY BROAD ECONOMIC SECTOR - LOCAL MUNICIPALITIES OF CHRIS
HANI DISTRICT MUNICIPALITY, 2012 [PERCENTAGE COMPOSITION]
2.2.1 Historical Economic Growth
For the period 2012 and 2002 the GVA in the Construction sector had the highest average annual growth
rate in Chris Hani at 7.07%. The industry with the second highest average annual growth rate is the Finance
sector at 4.54% per year. The Manufacturing sector had an average annual growth rate of 0.87%, while the
Mining sector had the lowest average annual growth of 0.43%. Overall a positive growth existed for all the
industries in 2012 with an average annual growth rate of 1.78%.
TABLE 17. GROSS VALUE ADDED (GVA) BY BROAD ECONOMIC SECTOR - CHRIS HANI DISTRICT
MUNICIPALITY, 2002, 2007 AND 2012 [R MILLIONS, 2005 CONSTANT PRICES]
2002 2007 2012 Average Annual
growth
Agriculture 310.7 299.7 354.5 1.33%
Mining 5.4 5.6 5.6 0.43%
Manufacturing 366.0 393.7 399.0 0.87%
Electricity 75.3 92.1 89.1 1.70%
Construction 120.4 205.4 238.5 7.07%
Trade 985.7 1,099.5 1,165.6 1.69%
Transport 398.2 437.7 448.0 1.19%
Finance 642.5 862.8 1,002.0 4.54%
Community services 2,903.3 3,371.3 3,894.8 2.98%
Total Industries 5,807.5 6,767.9 7,597.0 2.72%

Chris Hani District Municpality –2016-2017 IDP Review 1st Draft
37
Source: IHS Global Insight Regional eXplorer version 700
The Tertiary sector contributes the most to the Gross Value Added within Chris Hani District Municipality at
88.3%. The Secondary sector contributed a total of 8.3% (ranking second), while the aggregate economic
sector that contributed the least to the total GVA is the Primary sector with a total of 3.4%.
CHART 10. GROSS VALUE ADDED (GVA) BY AGGREGATE ECONOMIC SECTOR - CHRIS HANI DISTRICT
MUNICIPALITY, 2012 [PERCENTAGE]
The following is a breakdown of the Gross Value Added (GVA) by aggregated sector
2.2.1.1 Primary Sector
The primary sector consists of two broad economic sectors namely the mining and the agricultural sector.
The following chart represents the average growth rate in the GVA for both of these sectors in Chris Hani
District Municipality from 2002 to 2012.
Chris Hani District Municpality –2016-2017 IDP Review 1st Draft
38
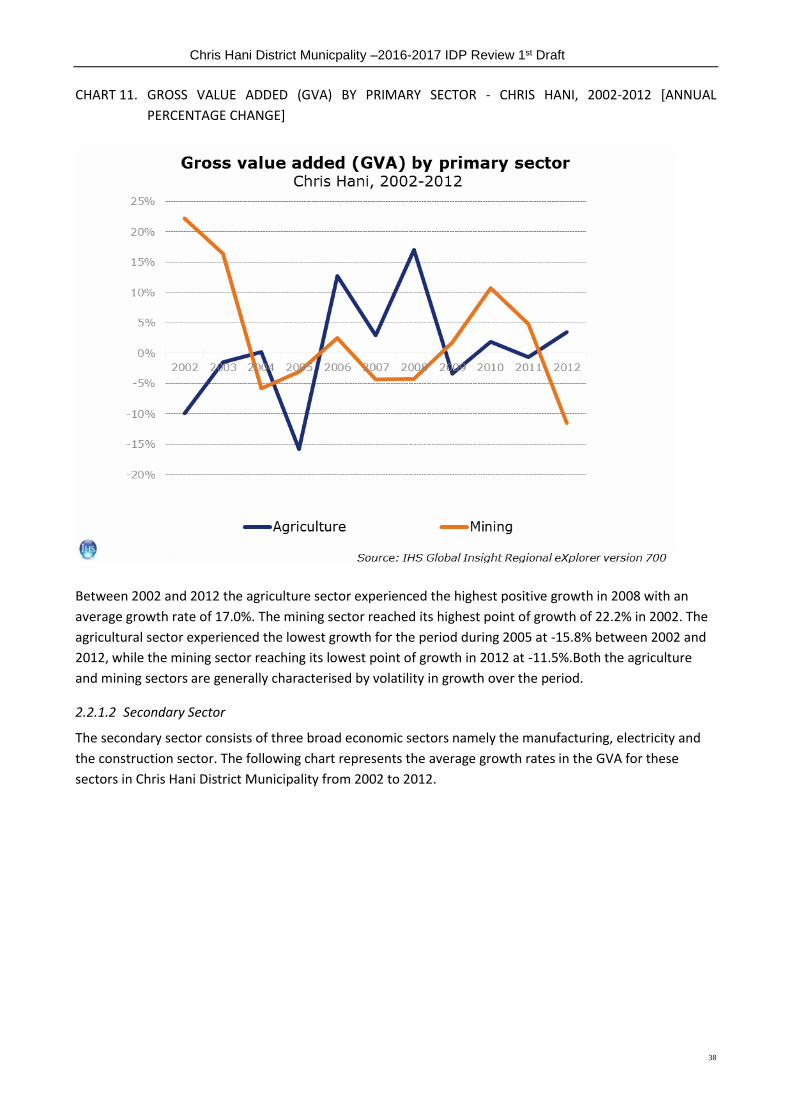
CHART 11. GROSS VALUE ADDED (GVA) BY PRIMARY SECTOR - CHRIS HANI, 2002-2012 [ANNUAL
PERCENTAGE CHANGE]
Between 2002 and 2012 the agriculture sector experienced the highest positive growth in 2008 with an
average growth rate of 17.0%. The mining sector reached its highest point of growth of 22.2% in 2002. The
agricultural sector experienced the lowest growth for the period during 2005 at -15.8% between 2002 and
2012, while the mining sector reaching its lowest point of growth in 2012 at -11.5%.Both the agriculture
and mining sectors are generally characterised by volatility in growth over the period.
2.2.1.2 Secondary Sector
The secondary sector consists of three broad economic sectors namely the manufacturing, electricity and
the construction sector. The following chart represents the average growth rates in the GVA for these
sectors in Chris Hani District Municipality from 2002 to 2012.
Chris Hani District Municpality –2016-2017 IDP Review 1st Draft
39
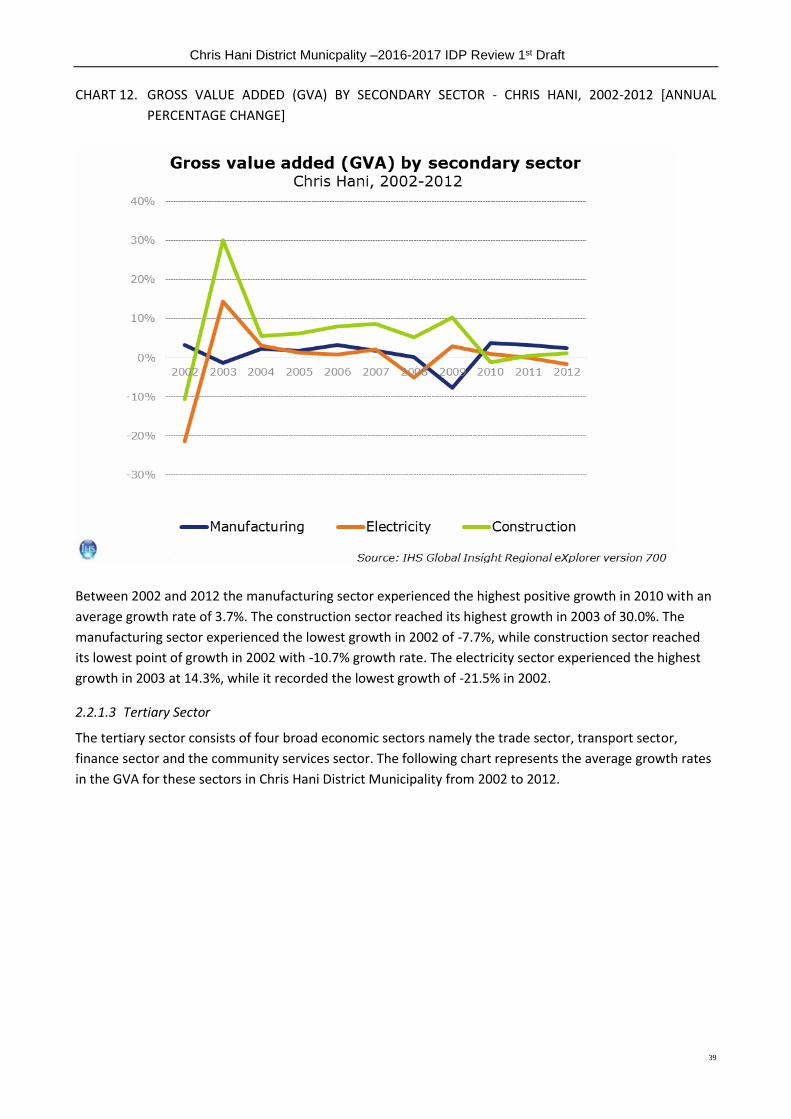
CHART 12. GROSS VALUE ADDED (GVA) BY SECONDARY SECTOR - CHRIS HANI, 2002-2012 [ANNUAL
PERCENTAGE CHANGE]
Between 2002 and 2012 the manufacturing sector experienced the highest positive growth in 2010 with an
average growth rate of 3.7%. The construction sector reached its highest growth in 2003 of 30.0%. The
manufacturing sector experienced the lowest growth in 2002 of -7.7%, while construction sector reached
its lowest point of growth in 2002 with -10.7% growth rate. The electricity sector experienced the highest
growth in 2003 at 14.3%, while it recorded the lowest growth of -21.5% in 2002.
2.2.1.3 Tertiary Sector
The tertiary sector consists of four broad economic sectors namely the trade sector, transport sector,
finance sector and the community services sector. The following chart represents the average growth rates
in the GVA for these sectors in Chris Hani District Municipality from 2002 to 2012.
Chris Hani District Municpality –2016-2017 IDP Review 1st Draft
40
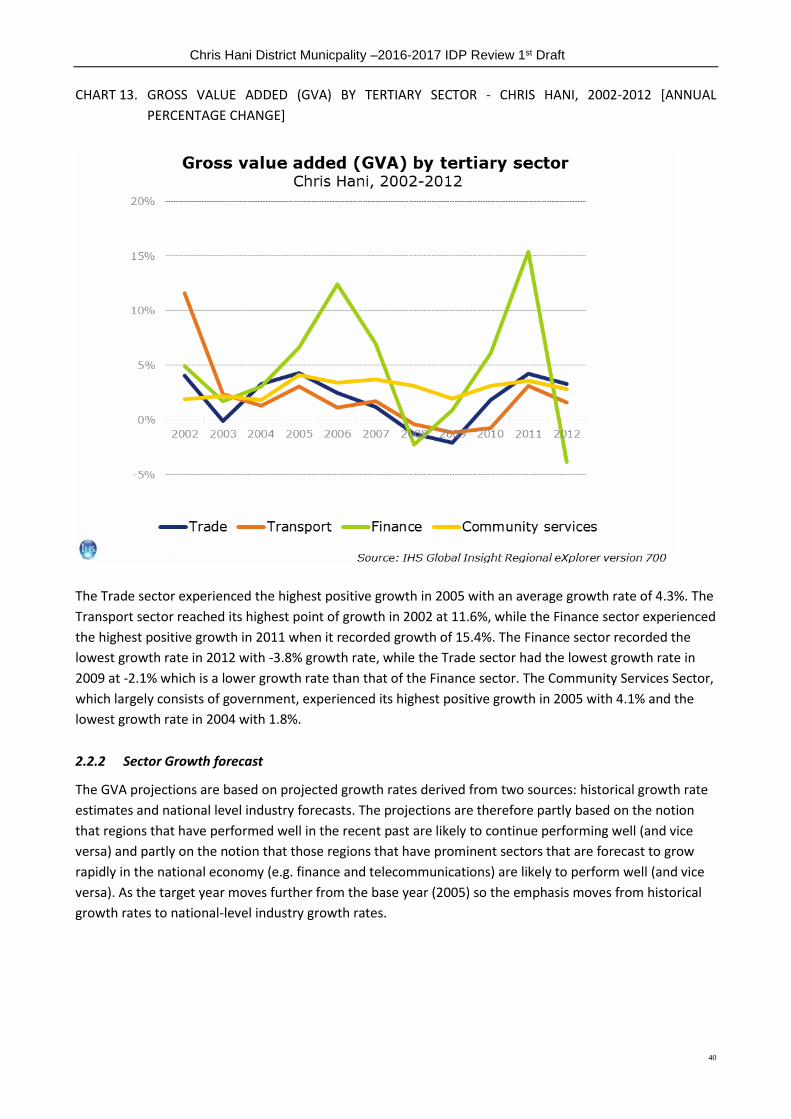
CHART 13. GROSS VALUE ADDED (GVA) BY TERTIARY SECTOR - CHRIS HANI, 2002-2012 [ANNUAL
PERCENTAGE CHANGE]
The Trade sector experienced the highest positive growth in 2005 with an average growth rate of 4.3%. The
Transport sector reached its highest point of growth in 2002 at 11.6%, while the Finance sector experienced
the highest positive growth in 2011 when it recorded growth of 15.4%. The Finance sector recorded the
lowest growth rate in 2012 with -3.8% growth rate, while the Trade sector had the lowest growth rate in
2009 at -2.1% which is a lower growth rate than that of the Finance sector. The Community Services Sector,
which largely consists of government, experienced its highest positive growth in 2005 with 4.1% and the
lowest growth rate in 2004 with 1.8%.
2.2.2 Sector Growth forecast
The GVA projections are based on projected growth rates derived from two sources: historical growth rate
estimates and national level industry forecasts. The projections are therefore partly based on the notion
that regions that have performed well in the recent past are likely to continue performing well (and vice
versa) and partly on the notion that those regions that have prominent sectors that are forecast to grow
rapidly in the national economy (e.g. finance and telecommunications) are likely to perform well (and vice
versa). As the target year moves further from the base year (2005) so the emphasis moves from historical
growth rates to national-level industry growth rates.

Chris Hani District Municpality –2016-2017 IDP Review 1st Draft
41
TABLE 18. GROSS VALUE ADDED (GVA) BY BROAD ECONOMIC SECTOR - CHRIS HANI DISTRICT
MUNICIPALITY, 2012-2017 [R MILLIONS, CONSTANT 2005 PRICES]
2012 2013 2014 2015 2016 2017 Average
Annual
growth
Agriculture 354.5 359.1 364.5 370.7 380.2 389.1 1.88%
Mining 5.6 5.9 6.1 6.3 6.6 6.8 3.90%
Manufacturing 399.0 401.1 410.6 423.5 440.7 458.9 2.84%
Electricity 89.1 89.9 92.4 95.7 100.1 104.8 3.29%
Construction 238.5 245.3 254.0 261.8 272.0 283.0 3.48%
Trade 1,165.6 1,185.2 1,216.8 1,254.5 1,307.1 1,361.4 3.16%
Transport 448.0 454.3 470.1 488.7 512.1 537.7 3.72%
Finance 1,002.0 1,022.8 1,061.0 1,108.4 1,165.6 1,228.0 4.15%
Community
services
3,894.8 3,971.2 4,069.0 4,190.7 4,356.7 4,556.0 3.19%
Total Industries 7,597.0 7,734.8 7,944.5 8,200.3 8,541.2 8,925.8 3.28%
Source: IHS Global Insight Regional eXplorer version 700
The Finance sector is expected to grow the most at an average of 4.2% annually from R 1 billion in 2012 to
R 1.23 billion in 2017. The Community services sector is estimated to be the largest sector within the Chris
Hani District Municipality in 2017 with a total share of 51.0% of the total GVA, growing at an average
annual rate of 3.2%. The sector that is estimated to grow the least is the Agriculture sector with an average
annual growth rate of 1.9% it is expected to only increase with R 34.7 million.
Chris Hani District Municpality –2016-2017 IDP Review 1st Draft
42
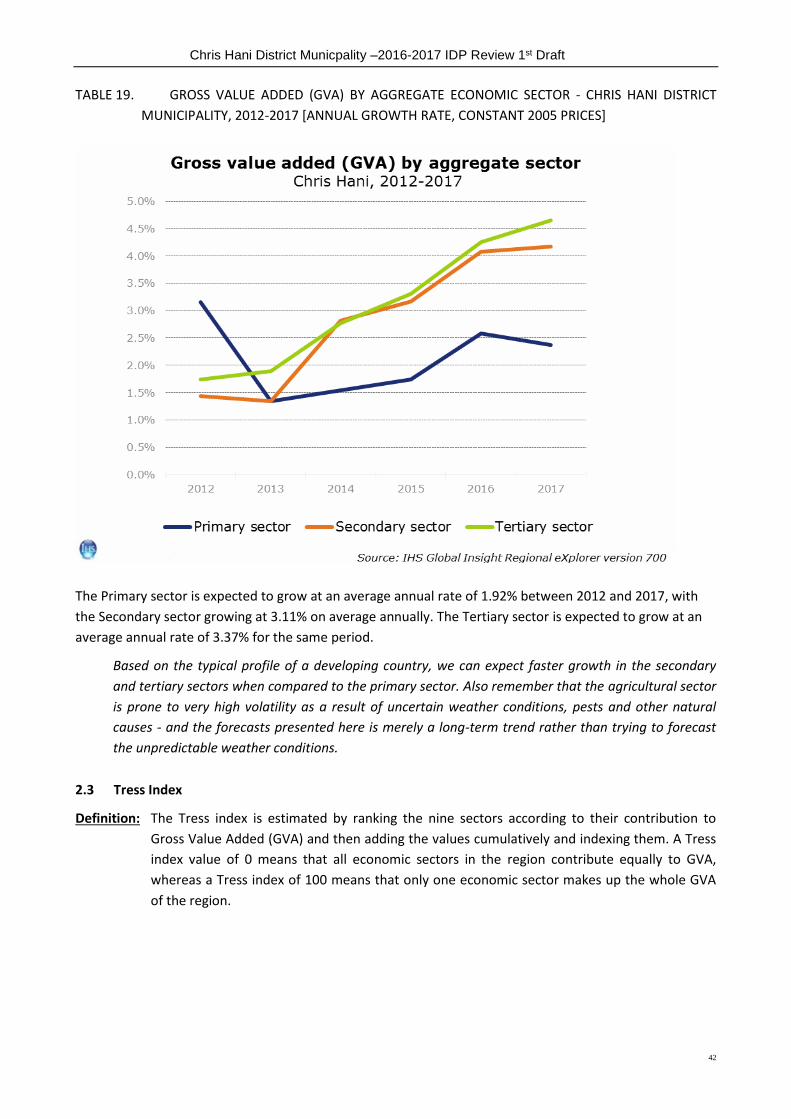
TABLE 19. GROSS VALUE ADDED (GVA) BY AGGREGATE ECONOMIC SECTOR - CHRIS HANI DISTRICT
MUNICIPALITY, 2012-2017 [ANNUAL GROWTH RATE, CONSTANT 2005 PRICES]
The Primary sector is expected to grow at an average annual rate of 1.92% between 2012 and 2017, with
the Secondary sector growing at 3.11% on average annually. The Tertiary sector is expected to grow at an
average annual rate of 3.37% for the same period.
Based on the typical profile of a developing country, we can expect faster growth in the secondary
and tertiary sectors when compared to the primary sector. Also remember that the agricultural sector
is prone to very high volatility as a result of uncertain weather conditions, pests and other natural
causes - and the forecasts presented here is merely a long-term trend rather than trying to forecast
the unpredictable weather conditions.
2.3 Tress Index
Definition: The Tress index is estimated by ranking the nine sectors according to their contribution to
Gross Value Added (GVA) and then adding the values cumulatively and indexing them. A Tress
index value of 0 means that all economic sectors in the region contribute equally to GVA,
whereas a Tress index of 100 means that only one economic sector makes up the whole GVA
of the region.
Chris Hani District Municpality –2016-2017 IDP Review 1st Draft
43
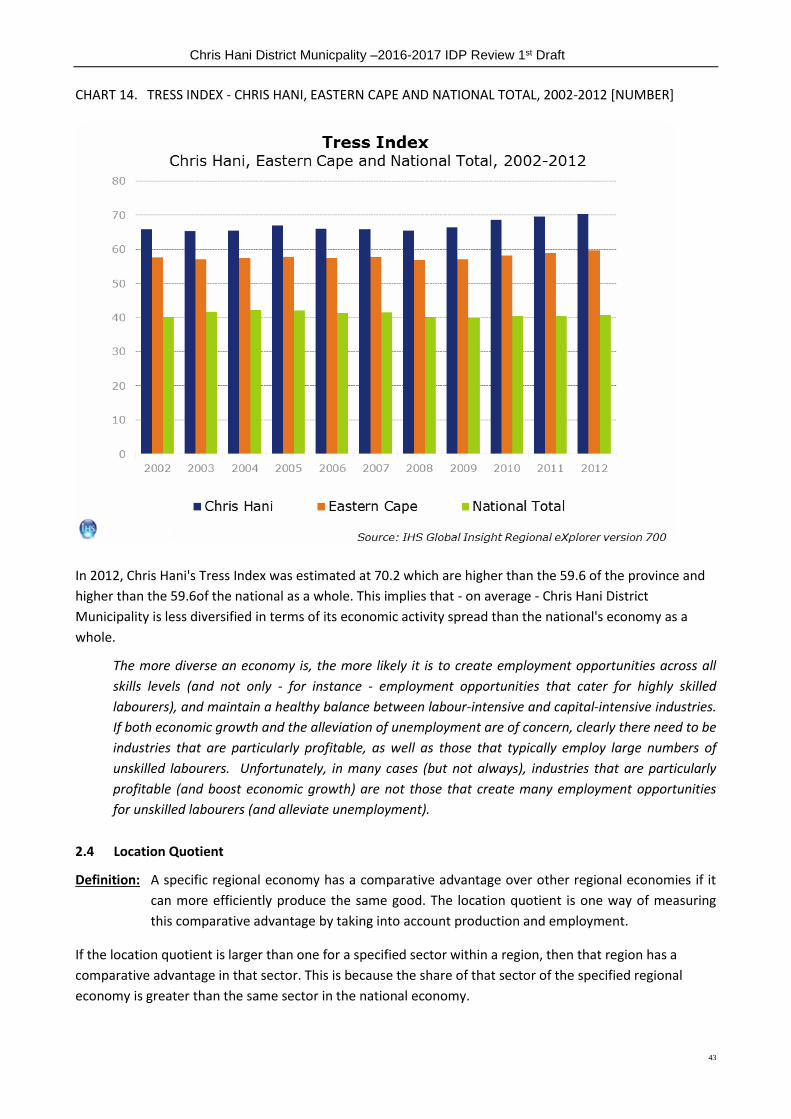
CHART 14. TRESS INDEX - CHRIS HANI, EASTERN CAPE AND NATIONAL TOTAL, 2002-2012 [NUMBER]
In 2012, Chris Hani's Tress Index was estimated at 70.2 which are higher than the 59.6 of the province and
higher than the 59.6of the national as a whole. This implies that - on average - Chris Hani District
Municipality is less diversified in terms of its economic activity spread than the national's economy as a
whole.
The more diverse an economy is, the more likely it is to create employment opportunities across all
skills levels (and not only - for instance - employment opportunities that cater for highly skilled
labourers), and maintain a healthy balance between labour-intensive and capital-intensive industries.
If both economic growth and the alleviation of unemployment are of concern, clearly there need to be
industries that are particularly profitable, as well as those that typically employ large numbers of
unskilled labourers. Unfortunately, in many cases (but not always), industries that are particularly
profitable (and boost economic growth) are not those that create many employment opportunities
for unskilled labourers (and alleviate unemployment).
2.4 Location Quotient
Definition: A specific regional economy has a comparative advantage over other regional economies if it
can more efficiently produce the same good. The location quotient is one way of measuring
this comparative advantage by taking into account production and employment.
If the location quotient is larger than one for a specified sector within a region, then that region has a
comparative advantage in that sector. This is because the share of that sector of the specified regional
economy is greater than the same sector in the national economy.

Chris Hani District Municpality –2016-2017 IDP Review 1st Draft
44
The location quotient is usually computed by taking the percentage share of the sector in the regional
economy divided by the percentage share of that same sector in the national economy.
CHART 15. LOCATION QUOTIENT BY BROAD ECONOMIC SECTORS - CHRIS HANI DISTRICT MUNICIPALITY
AND SOUTH AFRICA, 2012 [NUMBER]
For 2012 Chris Hani District Municipality has a very large comparative advantage in the Community services
sector. The Agriculture sector has a comparative advantage. The Trade also has a comparative advantage
when comparing it to the South Africa economy as a whole, although less prominent.
The Chris Hani District Municipality has a comparative disadvantage when it comes to the Mining sector
which has a very large comparative disadvantage. The Manufacturing sector has a large comparative
disadvantage compared to the economy of South Africa as a whole. The Finance also have a comparative
disadvantage compared the economy of South Africa as a whole.
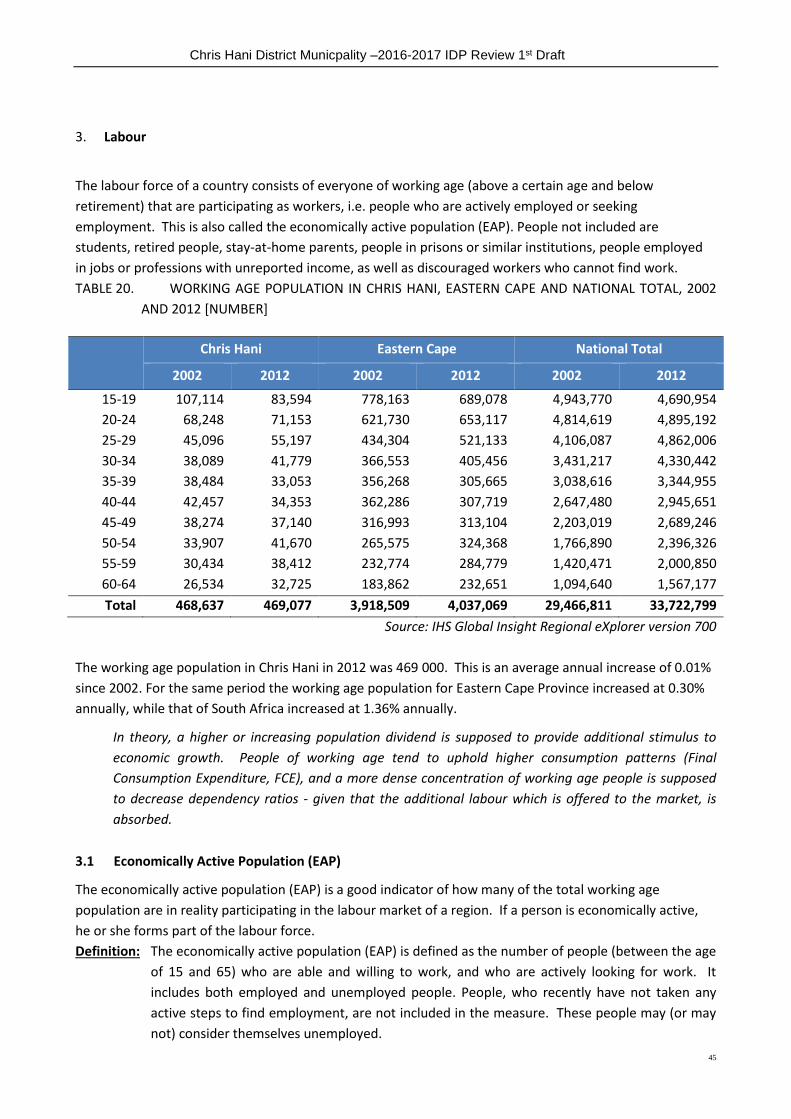
Chris Hani District Municpality –2016-2017 IDP Review 1st Draft
45
3. Labour
The labour force of a country consists of everyone of working age (above a certain age and below
retirement) that are participating as workers, i.e. people who are actively employed or seeking
employment. This is also called the economically active population (EAP). People not included are
students, retired people, stay-at-home parents, people in prisons or similar institutions, people employed
in jobs or professions with unreported income, as well as discouraged workers who cannot find work.
TABLE 20. WORKING AGE POPULATION IN CHRIS HANI, EASTERN CAPE AND NATIONAL TOTAL, 2002
AND 2012 [NUMBER]
Chris Hani Eastern Cape National Total
2002 2012 2002 2012 2002 2012
15-19 107,114 83,594 778,163 689,078 4,943,770 4,690,954
20-24 68,248 71,153 621,730 653,117 4,814,619 4,895,192
25-29 45,096 55,197 434,304 521,133 4,106,087 4,862,006
30-34 38,089 41,779 366,553 405,456 3,431,217 4,330,442
35-39 38,484 33,053 356,268 305,665 3,038,616 3,344,955
40-44 42,457 34,353 362,286 307,719 2,647,480 2,945,651
45-49 38,274 37,140 316,993 313,104 2,203,019 2,689,246
50-54 33,907 41,670 265,575 324,368 1,766,890 2,396,326
55-59 30,434 38,412 232,774 284,779 1,420,471 2,000,850
60-64 26,534 32,725 183,862 232,651 1,094,640 1,567,177
Total 468,637 469,077 3,918,509 4,037,069 29,466,811 33,722,799
Source: IHS Global Insight Regional eXplorer version 700
The working age population in Chris Hani in 2012 was 469 000. This is an average annual increase of 0.01%
since 2002. For the same period the working age population for Eastern Cape Province increased at 0.30%
annually, while that of South Africa increased at 1.36% annually.
In theory, a higher or increasing population dividend is supposed to provide additional stimulus to
economic growth. People of working age tend to uphold higher consumption patterns (Final
Consumption Expenditure, FCE), and a more dense concentration of working age people is supposed
to decrease dependency ratios - given that the additional labour which is offered to the market, is
absorbed.
3.1 Economically Active Population (EAP)
The economically active population (EAP) is a good indicator of how many of the total working age
population are in reality participating in the labour market of a region. If a person is economically active,
he or she forms part of the labour force.
Definition: The economically active population (EAP) is defined as the number of people (between the age
of 15 and 65) who are able and willing to work, and who are actively looking for work. It
includes both employed and unemployed people. People, who recently have not taken any
active steps to find employment, are not included in the measure. These people may (or may
not) consider themselves unemployed.
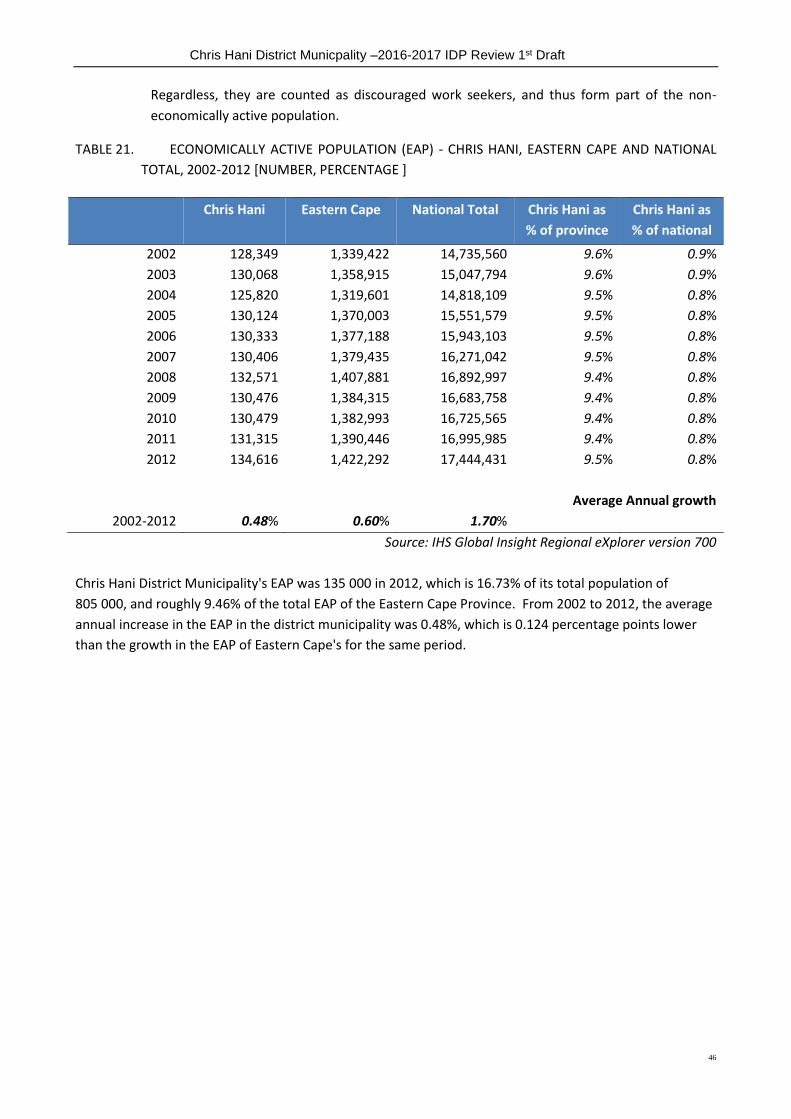
Chris Hani District Municpality –2016-2017 IDP Review 1st Draft
46
Regardless, they are counted as discouraged work seekers, and thus form part of the non-
economically active population.
TABLE 21. ECONOMICALLY ACTIVE POPULATION (EAP) - CHRIS HANI, EASTERN CAPE AND NATIONAL
TOTAL, 2002-2012 [NUMBER, PERCENTAGE ]
Chris Hani Eastern Cape National Total Chris Hani as
% of province
Chris Hani as
% of national
2002 128,349 1,339,422 14,735,560 9.6% 0.9%
2003 130,068 1,358,915 15,047,794 9.6% 0.9%
2004 125,820 1,319,601 14,818,109 9.5% 0.8%
2005 130,124 1,370,003 15,551,579 9.5% 0.8%
2006 130,333 1,377,188 15,943,103 9.5% 0.8%
2007 130,406 1,379,435 16,271,042 9.5% 0.8%
2008 132,571 1,407,881 16,892,997 9.4% 0.8%
2009 130,476 1,384,315 16,683,758 9.4% 0.8%
2010 130,479 1,382,993 16,725,565 9.4% 0.8%
2011 131,315 1,390,446 16,995,985 9.4% 0.8%
2012 134,616 1,422,292 17,444,431 9.5% 0.8%
Average Annual growth
2002-2012 0.48% 0.60% 1.70%
Source: IHS Global Insight Regional eXplorer version 700
Chris Hani District Municipality's EAP was 135 000 in 2012, which is 16.73% of its total population of
805 000, and roughly 9.46% of the total EAP of the Eastern Cape Province. From 2002 to 2012, the average
annual increase in the EAP in the district municipality was 0.48%, which is 0.124 percentage points lower
than the growth in the EAP of Eastern Cape's for the same period.

Chris Hani District Municpality –2016-2017 IDP Review 1st Draft
47
CHART 16. EAP AS % OF TOTAL POPULATION - CHRIS HANI AND THE REST OF EASTERN CAPE, 2002, 2007,
2012 [PERCENTAGE]
In 2012 15.8% of the total population in Chris Hani District Municipality were classified as economically
active. This increased to 16.7% in 2012. Compared to the other regions in Eastern Cape, Buffalo City had the
highest EAP as a percentage of the total population within its own region relative to the other regions.
3.1.1 Labour Force participation rate
Definition: The labour force participation rate (LFPR) is the Economically Active Population (EAP)
expressed as a percentage of the total working age population.

Chris Hani District Municpality –2016-2017 IDP Review 1st Draft
48
The following is the labour participation rate of the Chris Hani, Eastern Cape and National Total as a whole.
TABLE 22. THE LABOUR FORCE PARTICIPATION RATE - CHRIS HANI, EASTERN CAPE AND NATIONAL
TOTAL, 2002-2012 [PERCENTAGE]
Chris Hani Eastern Cape National Total
2002 27.4% 34.2% 50.0%
2003 27.8% 34.6% 50.2%
2004 27.0% 33.5% 48.7%
2005 27.9% 34.7% 50.4%
2006 27.9% 34.8% 50.9%
2007 27.9% 34.7% 51.2%
2008 28.3% 35.3% 52.5%
2009 27.8% 34.6% 51.2%
2010 27.7% 34.4% 50.7%
2011 27.9% 34.5% 50.9%
2012 28.7% 35.2% 51.7%
Source: IHS Global Insight Regional eXplorer version 700
From 2002 to 2012, Chris Hani's labour force participation rate increased from 27.39% to 28.70% which is
an increase of 1.31 percentage points. The Eastern Cape Province increased from 34.18% to 35.23%, South
Africa increased from 50.01% to 51.73%.
CHART 17. THE LABOUR FORCE PARTICIPATION RATE - CHRIS HANI DISTRICT MUNICIPALITY, 2002-2012
[PERCENTAGE]
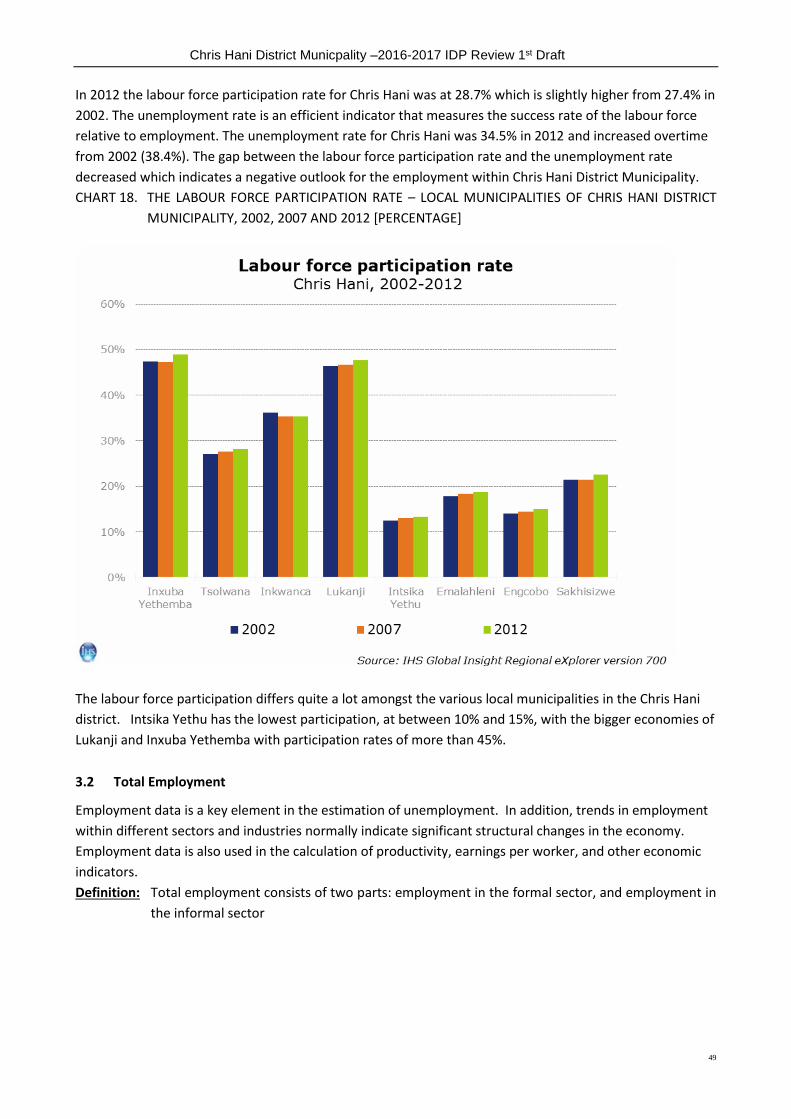
Chris Hani District Municpality –2016-2017 IDP Review 1st Draft
49
In 2012 the labour force participation rate for Chris Hani was at 28.7% which is slightly higher from 27.4% in
2002. The unemployment rate is an efficient indicator that measures the success rate of the labour force
relative to employment. The unemployment rate for Chris Hani was 34.5% in 2012 and increased overtime
from 2002 (38.4%). The gap between the labour force participation rate and the unemployment rate
decreased which indicates a negative outlook for the employment within Chris Hani District Municipality.
CHART 18. THE LABOUR FORCE PARTICIPATION RATE – LOCAL MUNICIPALITIES OF CHRIS HANI DISTRICT
MUNICIPALITY, 2002, 2007 AND 2012 [PERCENTAGE]
The labour force participation differs quite a lot amongst the various local municipalities in the Chris Hani
district. Intsika Yethu has the lowest participation, at between 10% and 15%, with the bigger economies of
Lukanji and Inxuba Yethemba with participation rates of more than 45%.
3.2 Total Employment
Employment data is a key element in the estimation of unemployment. In addition, trends in employment
within different sectors and industries normally indicate significant structural changes in the economy.
Employment data is also used in the calculation of productivity, earnings per worker, and other economic
indicators.
Definition: Total employment consists of two parts: employment in the formal sector, and employment in
the informal sector
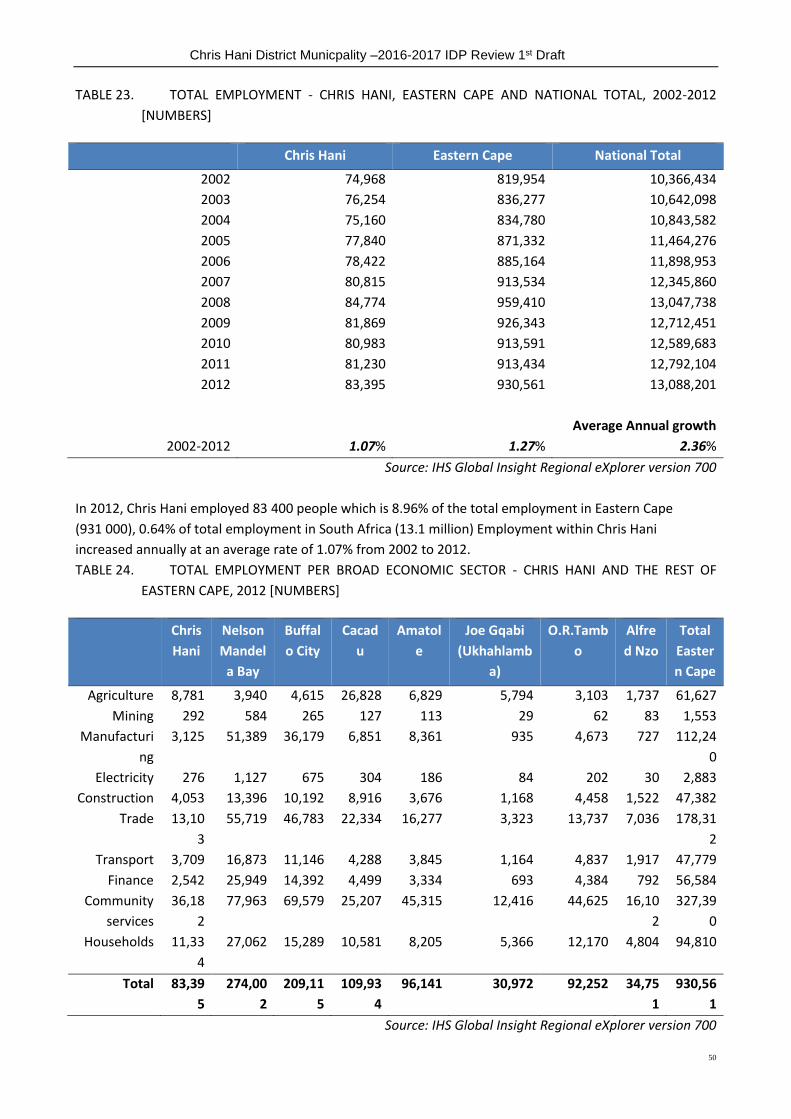
Chris Hani District Municpality –2016-2017 IDP Review 1st Draft
50
TABLE 23. TOTAL EMPLOYMENT - CHRIS HANI, EASTERN CAPE AND NATIONAL TOTAL, 2002-2012
[NUMBERS]
Chris Hani Eastern Cape National Total
2002 74,968 819,954 10,366,434
2003 76,254 836,277 10,642,098
2004 75,160 834,780 10,843,582
2005 77,840 871,332 11,464,276
2006 78,422 885,164 11,898,953
2007 80,815 913,534 12,345,860
2008 84,774 959,410 13,047,738
2009 81,869 926,343 12,712,451
2010 80,983 913,591 12,589,683
2011 81,230 913,434 12,792,104
2012 83,395 930,561 13,088,201
Average Annual growth
2002-2012 1.07% 1.27% 2.36%
Source: IHS Global Insight Regional eXplorer version 700
In 2012, Chris Hani employed 83 400 people which is 8.96% of the total employment in Eastern Cape
(931 000), 0.64% of total employment in South Africa (13.1 million) Employment within Chris Hani
increased annually at an average rate of 1.07% from 2002 to 2012.
TABLE 24. TOTAL EMPLOYMENT PER BROAD ECONOMIC SECTOR - CHRIS HANI AND THE REST OF
EASTERN CAPE, 2012 [NUMBERS]
Chris
Hani
Nelson
Mandel
a Bay
Buffal
o City
Cacad
u
Amatol
e
Joe Gqabi
(Ukhahlamb
a)
O.R.Tamb
o
Alfre
d Nzo
Total
Easter
n Cape
Agriculture 8,781 3,940 4,615 26,828 6,829 5,794 3,103 1,737 61,627
Mining 292 584 265 127 113 29 62 83 1,553
Manufacturi
ng
3,125 51,389 36,179 6,851 8,361 935 4,673 727 112,24
0
Electricity 276 1,127 675 304 186 84 202 30 2,883
Construction 4,053 13,396 10,192 8,916 3,676 1,168 4,458 1,522 47,382
Trade 13,10
3
55,719 46,783 22,334 16,277 3,323 13,737 7,036 178,31
2
Transport 3,709 16,873 11,146 4,288 3,845 1,164 4,837 1,917 47,779
Finance 2,542 25,949 14,392 4,499 3,334 693 4,384 792 56,584
Community
services
36,18
2
77,963 69,579 25,207 45,315 12,416 44,625 16,10
2
327,39
0
Households 11,33
4
27,062 15,289 10,581 8,205 5,366 12,170 4,804 94,810
Total 83,39
5
274,00
2
209,11
5
109,93
4
96,141 30,972 92,252 34,75
1
930,56
1
Source: IHS Global Insight Regional eXplorer version 700

Chris Hani District Municpality –2016-2017 IDP Review 1st Draft
51
Chris Hani District Municipality employs a total number of 83 400 people within its district municipality. The
district municipality that employs the highest number of people relative to the other regions within Eastern
Cape is Nelson Mandela Bay with a total number of 274 000. The district municipality that employs the
lowest number of people relative to the other regions within Eastern Cape is Joe Gqabi (Ukhahlamba) with
a total number of 31 000 employed within the district municipality.
CHART 19. TOTAL EMPLOYMENT PER BROAD ECONOMIC SECTOR - CHRIS HANI DISTRICT MUNICIPALITY,
2012 [PERCENTAGE]
In Chris Hani District Municipality the economic sectors that recorded the largest number of employment in
2012 were the Community services sector with a total of 36 600 or 43.4% of the total employment. The
Trade sector with a total of 13 200 (15.7%) employs the second highest relative to the rest of the sectors.
The Electricity sector with 280 (0.3%) is the sector that employs the least number of people in Chris Hani,
followed by the Mining sector with 292 (0.3%) people employed.
3.3 Formal and Informal employment
Total employment can be broken down into formal and informal sector employment. Formal sector
employment is measured from the formal business side, and the informal employment is measured from
the household side where formal businesses have not been established.
Formal employment is much more stable than informal employment. Informal employment is much harder
to measure and manage, simply because it cannot be tracked through the formal business side of the
economy. Informal employment is however a reality in South Africa and cannot be ignored.

Chris Hani District Municpality –2016-2017 IDP Review 1st Draft
52
The number of formally employed people in Chris Hani counted 67 600 in 2012, which is about 81.07% of
total employment, while the number of people employed in the informal sector counted 15 800 or 18.93%
of the total employment. Informal employment in Chris Hani was estimated at 15 800 in 2012 and increase
from 14 000 in 2002.
CHART 20. FORMAL AND INFORMAL EMPLOYMENT BY BROAD ECONOMIC SECTOR - CHRIS HANI DISTRICT
MUNICIPALITY, 2012 [NUMBERS]
Some of the economic sectors have little or no informal employment:
Mining industry, due to well-regulated mining safety policies, and the strict registration of a mine, has
little or no informal employment. The Electricity sector is also well regulated, making it difficult to get
information on informal employment. Domestic Workers and employment in the Agriculture sector is
typically counted under a separate heading.
In 2012 the Trade sector recorded the highest number of informally employed, with a total of 7 330 jobs or
46.41% of the total informal employment. This can be expected as the barriers to enter the Trade sector in
terms of capital and skills required is less than with most of the other sectors. The Finance sector has the
lowest informal employment with 382 and only contributes 2.42% to total informal employment.
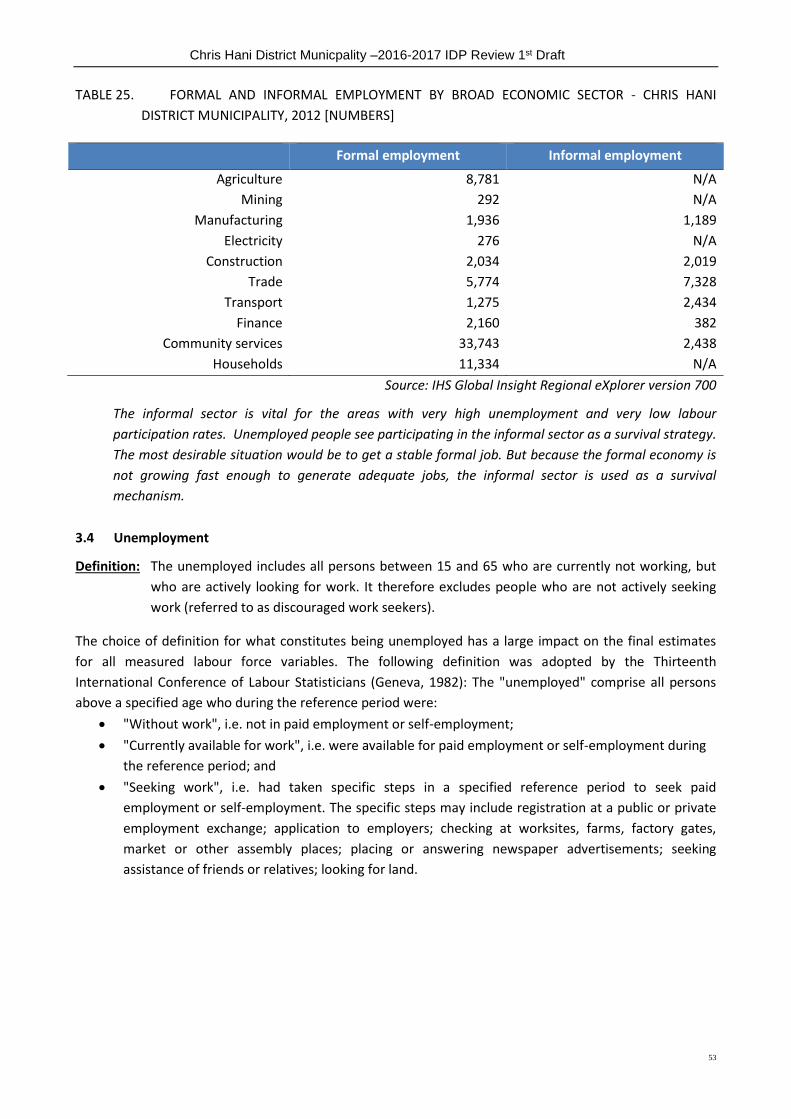
Chris Hani District Municpality –2016-2017 IDP Review 1st Draft
53
TABLE 25. FORMAL AND INFORMAL EMPLOYMENT BY BROAD ECONOMIC SECTOR - CHRIS HANI
DISTRICT MUNICIPALITY, 2012 [NUMBERS]
Formal employment Informal employment
Agriculture 8,781 N/A
Mining 292 N/A
Manufacturing 1,936 1,189
Electricity 276 N/A
Construction 2,034 2,019
Trade 5,774 7,328
Transport 1,275 2,434
Finance 2,160 382
Community services 33,743 2,438
Households 11,334 N/A
Source: IHS Global Insight Regional eXplorer version 700
The informal sector is vital for the areas with very high unemployment and very low labour
participation rates. Unemployed people see participating in the informal sector as a survival strategy.
The most desirable situation would be to get a stable formal job. But because the formal economy is
not growing fast enough to generate adequate jobs, the informal sector is used as a survival
mechanism.
3.4 Unemployment
Definition: The unemployed includes all persons between 15 and 65 who are currently not working, but
who are actively looking for work. It therefore excludes people who are not actively seeking
work (referred to as discouraged work seekers).
The choice of definition for what constitutes being unemployed has a large impact on the final estimates
for all measured labour force variables. The following definition was adopted by the Thirteenth
International Conference of Labour Statisticians (Geneva, 1982): The "unemployed" comprise all persons
above a specified age who during the reference period were:
"Without work", i.e. not in paid employment or self-employment;
"Currently available for work", i.e. were available for paid employment or self-employment during
the reference period; and
"Seeking work", i.e. had taken specific steps in a specified reference period to seek paid
employment or self-employment. The specific steps may include registration at a public or private
employment exchange; application to employers; checking at worksites, farms, factory gates,
market or other assembly places; placing or answering newspaper advertisements; seeking
assistance of friends or relatives; looking for land.

Chris Hani District Municpality –2016-2017 IDP Review 1st Draft
54
TABLE 26. UNEMPLOYMENT (OFFICIAL DEFINITION) - CHRIS HANI, EASTERN CAPE AND NATIONAL
TOTAL, 2002-2012 [NUMBER & PERCENTAGE]
Chris Hani Eastern Cape National Total Chris Hani as %
of province
Chris Hani as %
of national
2002 49,285 516,320 4,369,125 9.5% 1.1%
2003 49,763 521,480 4,405,696 9.5% 1.1%
2004 46,087 479,460 3,974,527 9.6% 1.2%
2005 47,625 493,669 4,087,303 9.6% 1.2%
2006 46,959 484,974 4,044,149 9.7% 1.2%
2007 44,467 458,514 3,925,183 9.7% 1.1%
2008 42,766 442,349 3,845,259 9.7% 1.1%
2009 43,736 452,645 3,971,308 9.7% 1.1%
2010 44,781 464,642 4,135,882 9.6% 1.1%
2011 45,175 469,899 4,203,880 9.6% 1.1%
2012 46,406 485,643 4,356,230 9.6% 1.1%
Average Annual growth
2002-2012 -0.60% -0.61% -0.03%
Source: IHS Global Insight Regional eXplorer version 700
In 2012, there were a total number of 46 400 people unemployed in Chris Hani, which is a decrease of from
49 300 in 2002. The total number of unemployed people within Chris Hani constitutes 9.56% of the total
number of unemployed people in Eastern Cape Province. The Chris Hani District Municipality had an
average annual decrease of -0.60% which is higher than that of the Eastern Cape Province which had an
average annual growth rate of -0.61%.
TABLE 27. UNEMPLOYMENT RATE (OFFICIAL DEFINITION) - CHRIS HANI, EASTERN CAPE AND
NATIONAL TOTAL, 2002-2012 [PERCENTAGE]
Chris Hani Eastern Cape National Total
2002 38.4% 38.5% 29.7%
2003 38.3% 38.4% 29.3%
2004 36.6% 36.3% 26.8%
2005 36.6% 36.0% 26.3%
2006 36.0% 35.2% 25.4%
2007 34.1% 33.2% 24.1%
2008 32.3% 31.4% 22.8%
2009 33.5% 32.7% 23.8%
2010 34.3% 33.6% 24.7%
2011 34.4% 33.8% 24.7%
2012 34.5% 34.1% 25.0%
Source: IHS Global Insight Regional eXplorer version 700
In 2012, the unemployment rate in Chris Hani District Municipality (based on the official definition of
unemployment) was 34.47%, which is a decrease of percentage points. The unemployment rate in Chris
Hani District Municipality is higher than that of Eastern Cape, the growth in the unemployment rate in Chris
Hani District Municipality is higher.
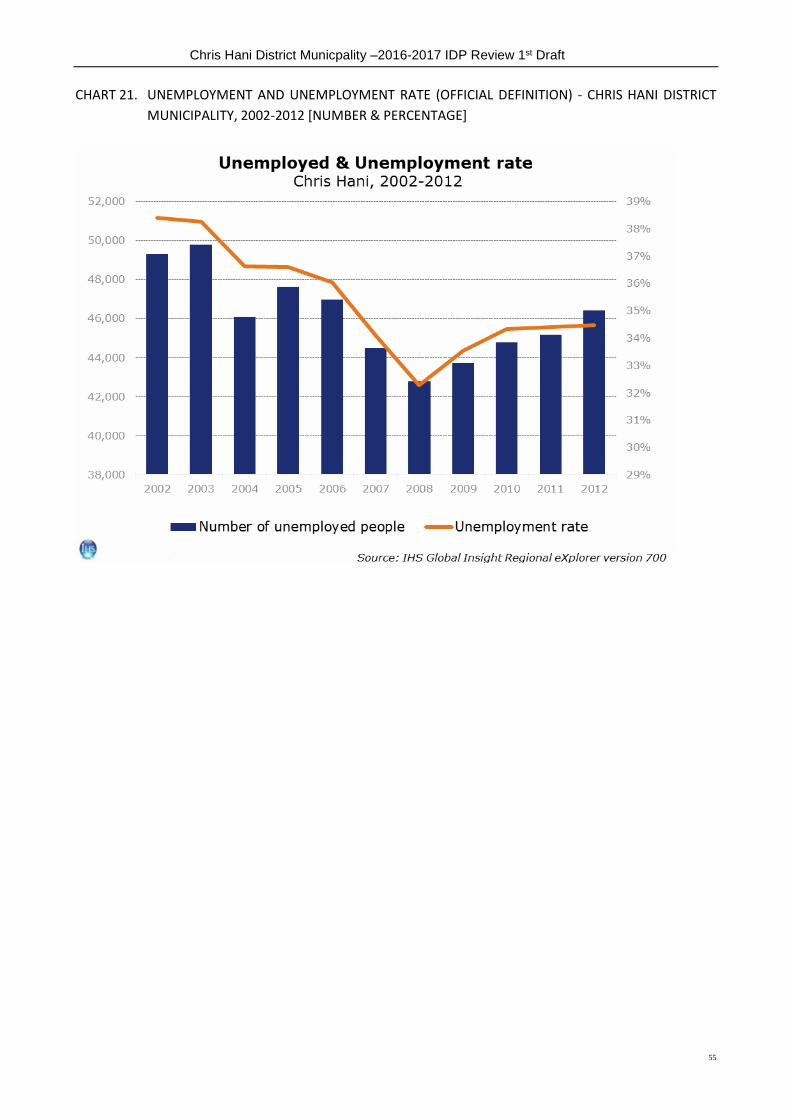
Chris Hani District Municpality –2016-2017 IDP Review 1st Draft
55
CHART 21. UNEMPLOYMENT AND UNEMPLOYMENT RATE (OFFICIAL DEFINITION) - CHRIS HANI DISTRICT
MUNICIPALITY, 2002-2012 [NUMBER & PERCENTAGE]
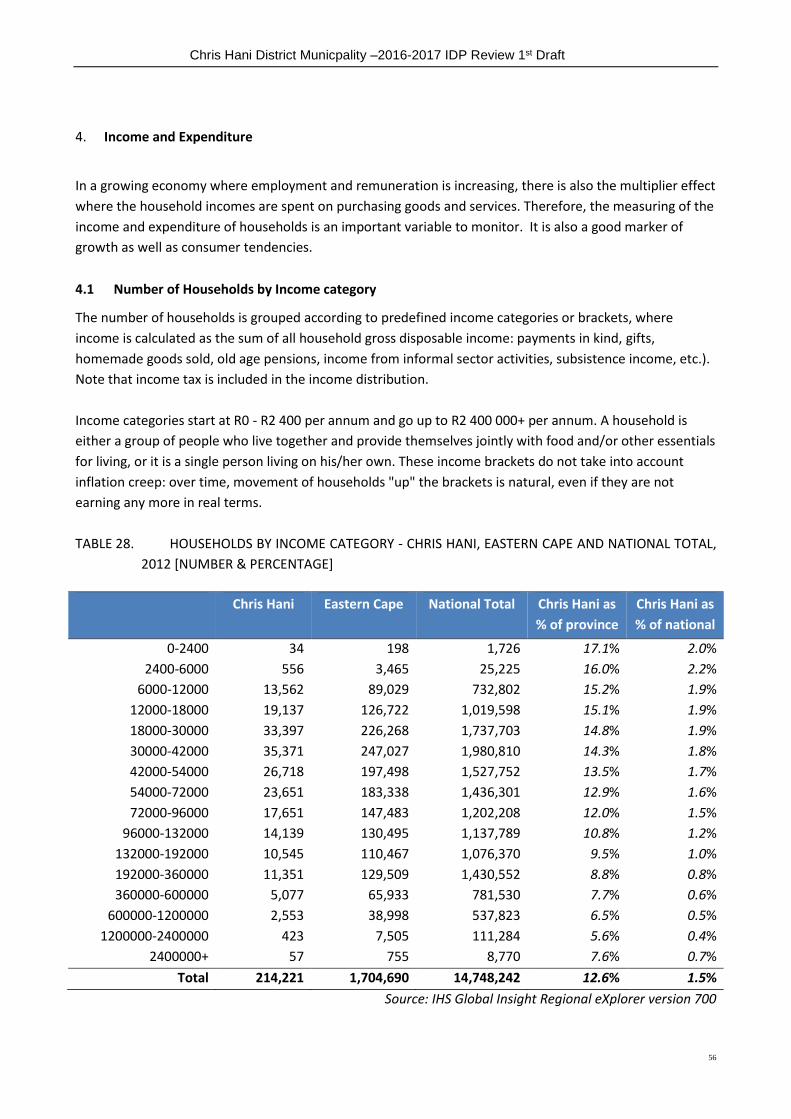
Chris Hani District Municpality –2016-2017 IDP Review 1st Draft
56
4. Income and Expenditure
In a growing economy where employment and remuneration is increasing, there is also the multiplier effect
where the household incomes are spent on purchasing goods and services. Therefore, the measuring of the
income and expenditure of households is an important variable to monitor. It is also a good marker of
growth as well as consumer tendencies.
4.1 Number of Households by Income category
The number of households is grouped according to predefined income categories or brackets, where
income is calculated as the sum of all household gross disposable income: payments in kind, gifts,
homemade goods sold, old age pensions, income from informal sector activities, subsistence income, etc.).
Note that income tax is included in the income distribution.
Income categories start at R0 - R2 400 per annum and go up to R2 400 000+ per annum. A household is
either a group of people who live together and provide themselves jointly with food and/or other essentials
for living, or it is a single person living on his/her own. These income brackets do not take into account
inflation creep: over time, movement of households "up" the brackets is natural, even if they are not
earning any more in real terms.
TABLE 28. HOUSEHOLDS BY INCOME CATEGORY - CHRIS HANI, EASTERN CAPE AND NATIONAL TOTAL,
2012 [NUMBER & PERCENTAGE]
Chris Hani Eastern Cape National Total Chris Hani as
% of province
Chris Hani as
% of national
0-2400 34 198 1,726 17.1% 2.0%
2400-6000 556 3,465 25,225 16.0% 2.2%
6000-12000 13,562 89,029 732,802 15.2% 1.9%
12000-18000 19,137 126,722 1,019,598 15.1% 1.9%
18000-30000 33,397 226,268 1,737,703 14.8% 1.9%
30000-42000 35,371 247,027 1,980,810 14.3% 1.8%
42000-54000 26,718 197,498 1,527,752 13.5% 1.7%
54000-72000 23,651 183,338 1,436,301 12.9% 1.6%
72000-96000 17,651 147,483 1,202,208 12.0% 1.5%
96000-132000 14,139 130,495 1,137,789 10.8% 1.2%
132000-192000 10,545 110,467 1,076,370 9.5% 1.0%
192000-360000 11,351 129,509 1,430,552 8.8% 0.8%
360000-600000 5,077 65,933 781,530 7.7% 0.6%
600000-1200000 2,553 38,998 537,823 6.5% 0.5%
1200000-2400000 423 7,505 111,284 5.6% 0.4%
2400000+ 57 755 8,770 7.6% 0.7%
Total 214,221 1,704,690 14,748,242 12.6% 1.5%
Source: IHS Global Insight Regional eXplorer version 700
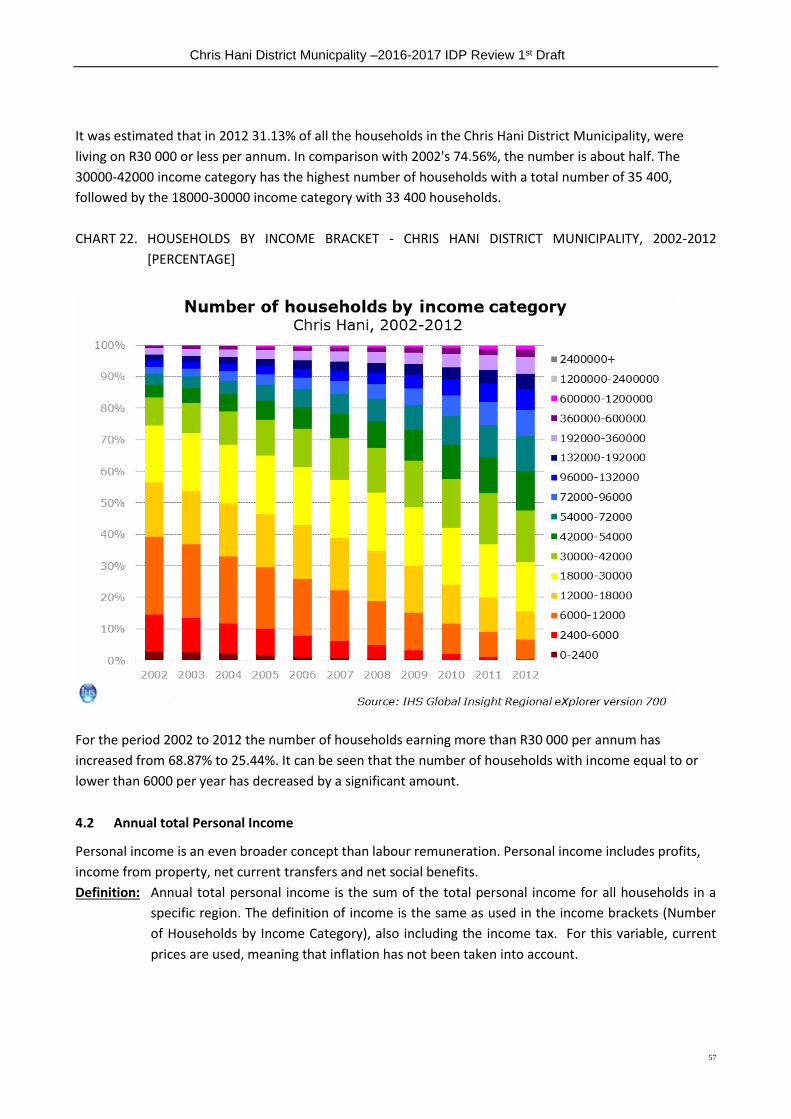
Chris Hani District Municpality –2016-2017 IDP Review 1st Draft
57
It was estimated that in 2012 31.13% of all the households in the Chris Hani District Municipality, were
living on R30 000 or less per annum. In comparison with 2002's 74.56%, the number is about half. The
30000-42000 income category has the highest number of households with a total number of 35 400,
followed by the 18000-30000 income category with 33 400 households.
CHART 22. HOUSEHOLDS BY INCOME BRACKET - CHRIS HANI DISTRICT MUNICIPALITY, 2002-2012
[PERCENTAGE]
For the period 2002 to 2012 the number of households earning more than R30 000 per annum has
increased from 68.87% to 25.44%. It can be seen that the number of households with income equal to or
lower than 6000 per year has decreased by a significant amount.
4.2 Annual total Personal Income
Personal income is an even broader concept than labour remuneration. Personal income includes profits,
income from property, net current transfers and net social benefits.
Definition: Annual total personal income is the sum of the total personal income for all households in a
specific region. The definition of income is the same as used in the income brackets (Number
of Households by Income Category), also including the income tax. For this variable, current
prices are used, meaning that inflation has not been taken into account.
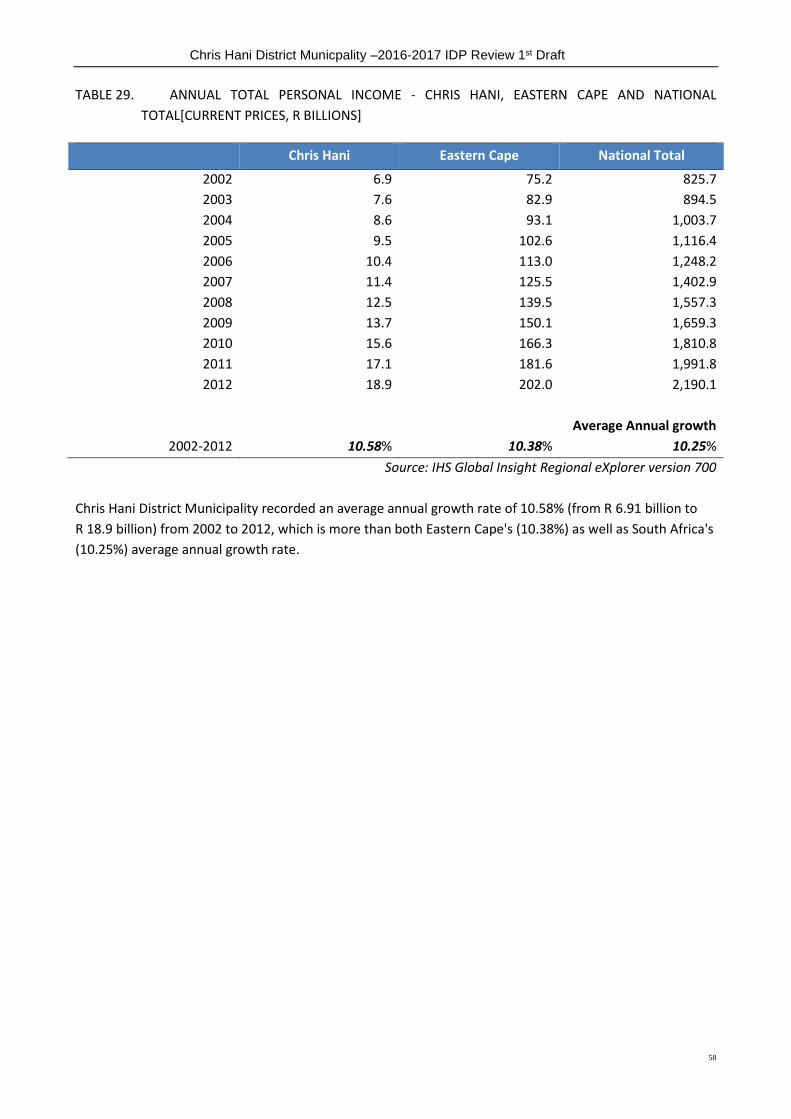
Chris Hani District Municpality –2016-2017 IDP Review 1st Draft
58
TABLE 29. ANNUAL TOTAL PERSONAL INCOME - CHRIS HANI, EASTERN CAPE AND NATIONAL
TOTAL[CURRENT PRICES, R BILLIONS]
Chris Hani Eastern Cape National Total
2002 6.9 75.2 825.7
2003 7.6 82.9 894.5
2004 8.6 93.1 1,003.7
2005 9.5 102.6 1,116.4
2006 10.4 113.0 1,248.2
2007 11.4 125.5 1,402.9
2008 12.5 139.5 1,557.3
2009 13.7 150.1 1,659.3
2010 15.6 166.3 1,810.8
2011 17.1 181.6 1,991.8
2012 18.9 202.0 2,190.1
Average Annual growth
2002-2012 10.58% 10.38% 10.25%
Source: IHS Global Insight Regional eXplorer version 700
Chris Hani District Municipality recorded an average annual growth rate of 10.58% (from R 6.91 billion to
R 18.9 billion) from 2002 to 2012, which is more than both Eastern Cape's (10.38%) as well as South Africa's
(10.25%) average annual growth rate.

Chris Hani District Municpality –2016-2017 IDP Review 1st Draft
59
TABLE 30. ANNUAL TOTAL PERSONAL INCOME BY POPULATION GROUP - CHRIS HANI AND THE REST
OF EASTERN CAPE [CURRENT PRICES, R BILLIONS]
The total personal income of Chris Hani District Municipality amounted to approximately R 18.9 billion in
2012. The African population group earned R 15.3 billion, or 80.73% of total personal income, while the
White population group earned R 2.48 billion, or 13.13% of the total personal income. The Coloured and
the Asian population groups only had a share of 5.45% and 0.69% of total personal income respectively.
TABLE 31. ANNUAL TOTAL PERSONAL INCOME – LOCAL MUNICIPALITIES OF CHRIS HANI DISTRICT
MUNICIPALITY[CURRENT PRICES, R BILLIONS]
Inxuba
Yethemba
Tsolwana Inkwanca Lukanji Intsika
Yethu
Emalahleni Engcobo Sakhisizwe
2002 0.85 0.33 0.20 2.13 1.04 0.87 1.06 0.44
2003 0.94 0.36 0.22 2.36 1.15 0.95 1.16 0.48
2004 1.03 0.40 0.24 2.64 1.31 1.08 1.33 0.54
2005 1.13 0.43 0.26 2.92 1.45 1.20 1.50 0.60
2006 1.25 0.47 0.29 3.17 1.58 1.32 1.65 0.66
2007 1.41 0.53 0.32 3.48 1.73 1.45 1.80 0.73
2008 1.58 0.58 0.35 3.82 1.88 1.58 1.96 0.80
2009 1.78 0.64 0.37 4.10 2.07 1.74 2.13 0.88
2010 1.94 0.73 0.41 4.58 2.39 2.03 2.47 1.03
2011 2.11 0.80 0.45 5.03 2.61 2.23 2.71 1.13
2012 2.35 0.88 0.50 5.58 2.88 2.46 2.98 1.25
Average Annual growth

Chris Hani District Municpality –2016-2017 IDP Review 1st Draft
60
Inxuba
Yethemba
Tsolwana Inkwanca Lukanji Intsika
Yethu
Emalahleni Engcobo Sakhisizwe
2002-2012 10.72% 10.29% 9.61% 10.13% 10.69% 11.01% 10.90% 11.16%
Source: IHS Global Insight Regional eXplorer version 700
Using the average annual growth rate of Total Personal Income, the local municipality that increased the
most was the Sakhisizwe Local Municipality with a growth rate of 11.16%. The local municipality with the
lowest average annual increase was the Inkwanca Local Municipality with 9.61%. In Rand values the local
municipality with the highest total personal income is the Lukanji Local Municipality with a total of
R 5.5 billion. Remember that this rand values is in current prices and therefore it does not take inflation
into account.
4.3 Annual per Capita Income
Definition: Per capita income refers to the income per person. Thus, it takes the total personal income
per annum and divides it equally among the population.
Per capita income is often used as a measure of wealth particularly when comparing economies or
population groups. Rising per capita income usually indicates a likely swell in demand for consumption.
CHART 23. PER CAPITA INCOME - CHRIS HANI, EASTERN CAPE AND NATIONAL TOTAL, 2012 [RAND,
CURRENT PRICES]
The per capita income in Chris Hani District Municipality was R 23,500 in 2012, and this is lower than both
the National Total (R 41,900) and of the Eastern Cape Province (R 30,400) per capita income.

Chris Hani District Municpality –2016-2017 IDP Review 1st Draft
61
CHART 24. PER CAPITA INCOME BY POPULATION GROUP - CHRIS HANI AND THE REST OF EASTERN CAPE
PROVINCE, 2012 [RAND, CURRENT PRICES]
Chris
Hani
Nelson
Mandela
Bay
Buffalo
City
Cacadu Amatole Joe Gqabi
(Ukhahlamb
a)
O.R.Tamb
o
Alfred
Nzo
African R 20,245 R 25,576 R 34,545 R 22,404 R 22,997 R 17,382 R 17,664 R 14,73
6
White R 152,15
5
R 172,05
3
R 202,89
2
R 152,83
5
R 165,33
7
R 161,192 R 130,390 R 95,27
7
Coloure
d
R 31,268 R 43,343 R 51,494 R 26,566 R 28,325 R 25,148 R 41,180 R 31,37
0
Asian R 77,248 R 115,93
3
R 143,47
9
R 47,445 R 76,171 N/A R 103,986 R 42,67
0
Total R 23,489 R 51,646 R 49,343 R 38,215 R 24,577 R 21,087 R 18,163 R 15,03
8
Source: IHS Global Insight Regional eXplorer version 700
Nelson Mandela Bay has the highest per capita income with a total of R 51,600. Buffalo City had the second
highest per capita income at R 49,300, whereas Alfred Nzo had the lowest per capita income at R 15,000. In
Chris Hani District Municipality, the White population group has the highest per capita income, with
R 152,000, relative to the other population groups. The population group with the second highest per
capita income within Chris Hani District Municipality is the Asian population group (R 77,200), where the
Coloured and the African population groups had a per capita income of R 31,300 and R 20,200 respectively.
4.4 Index of Buying Power
Definition: The Index of Buying Power (IBP) is a measure of a region's overall capacity to absorb products
and/or services. The index is useful when comparing two regions in terms of their capacity to
buy products. Values range from 0 to 1 (where the national index equals 1), and can be
interpreted as the percentage of national buying power attributable to the specific region.
Regions' buying power usually depends on three factors: the size of the population; the ability
of the population to spend (measured by total income); and the willingness of the population
to spend (measured by total retail sales).
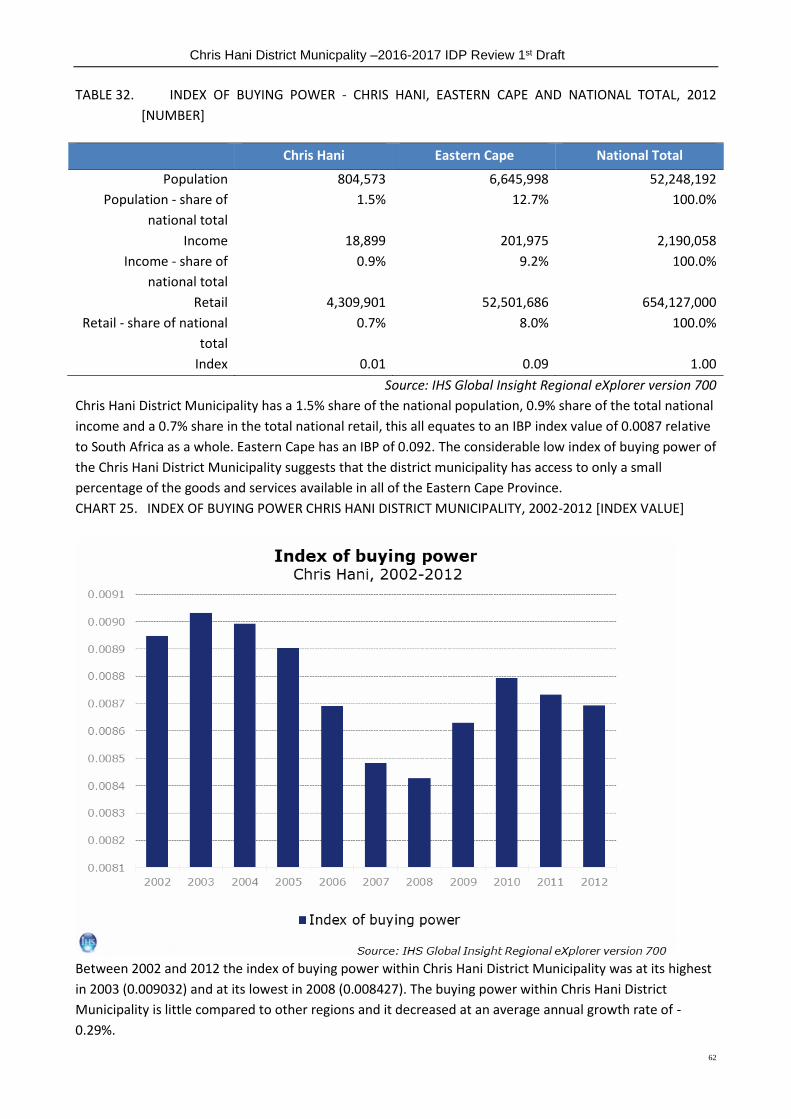
Chris Hani District Municpality –2016-2017 IDP Review 1st Draft
62
TABLE 32. INDEX OF BUYING POWER - CHRIS HANI, EASTERN CAPE AND NATIONAL TOTAL, 2012
[NUMBER]
Chris Hani Eastern Cape National Total
Population 804,573 6,645,998 52,248,192
Population - share of
national total
1.5% 12.7% 100.0%
Income 18,899 201,975 2,190,058
Income - share of
national total
0.9% 9.2% 100.0%
Retail 4,309,901 52,501,686 654,127,000
Retail - share of national
total
0.7% 8.0% 100.0%
Index 0.01 0.09 1.00
Source: IHS Global Insight Regional eXplorer version 700
Chris Hani District Municipality has a 1.5% share of the national population, 0.9% share of the total national
income and a 0.7% share in the total national retail, this all equates to an IBP index value of 0.0087 relative
to South Africa as a whole. Eastern Cape has an IBP of 0.092. The considerable low index of buying power of
the Chris Hani District Municipality suggests that the district municipality has access to only a small
percentage of the goods and services available in all of the Eastern Cape Province.
CHART 25. INDEX OF BUYING POWER CHRIS HANI DISTRICT MUNICIPALITY, 2002-2012 [INDEX VALUE]
Between 2002 and 2012 the index of buying power within Chris Hani District Municipality was at its highest
in 2003 (0.009032) and at its lowest in 2008 (0.008427). The buying power within Chris Hani District
Municipality is little compared to other regions and it decreased at an average annual growth rate of -
0.29%.
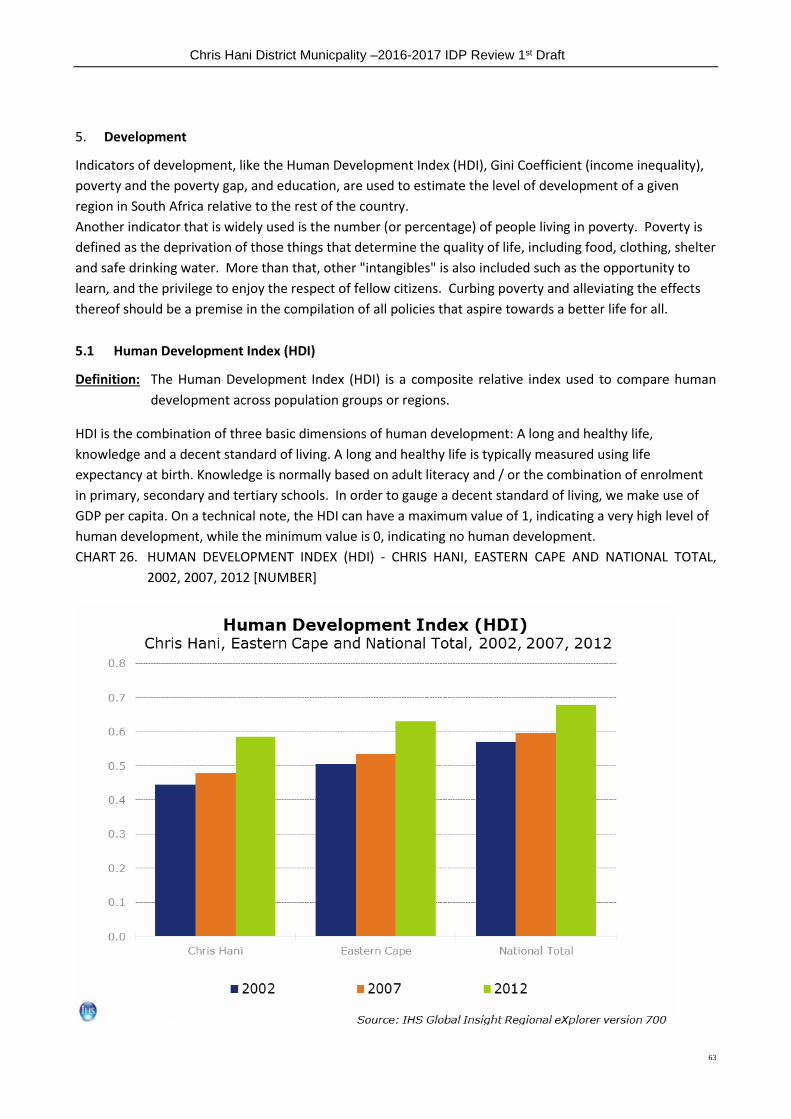
Chris Hani District Municpality –2016-2017 IDP Review 1st Draft
63
5. Development
Indicators of development, like the Human Development Index (HDI), Gini Coefficient (income inequality),
poverty and the poverty gap, and education, are used to estimate the level of development of a given
region in South Africa relative to the rest of the country.
Another indicator that is widely used is the number (or percentage) of people living in poverty. Poverty is
defined as the deprivation of those things that determine the quality of life, including food, clothing, shelter
and safe drinking water. More than that, other "intangibles" is also included such as the opportunity to
learn, and the privilege to enjoy the respect of fellow citizens. Curbing poverty and alleviating the effects
thereof should be a premise in the compilation of all policies that aspire towards a better life for all.
5.1 Human Development Index (HDI)
Definition: The Human Development Index (HDI) is a composite relative index used to compare human
development across population groups or regions.
HDI is the combination of three basic dimensions of human development: A long and healthy life,
knowledge and a decent standard of living. A long and healthy life is typically measured using life
expectancy at birth. Knowledge is normally based on adult literacy and / or the combination of enrolment
in primary, secondary and tertiary schools. In order to gauge a decent standard of living, we make use of
GDP per capita. On a technical note, the HDI can have a maximum value of 1, indicating a very high level of
human development, while the minimum value is 0, indicating no human development.
CHART 26. HUMAN DEVELOPMENT INDEX (HDI) - CHRIS HANI, EASTERN CAPE AND NATIONAL TOTAL,
2002, 2007, 2012 [NUMBER]
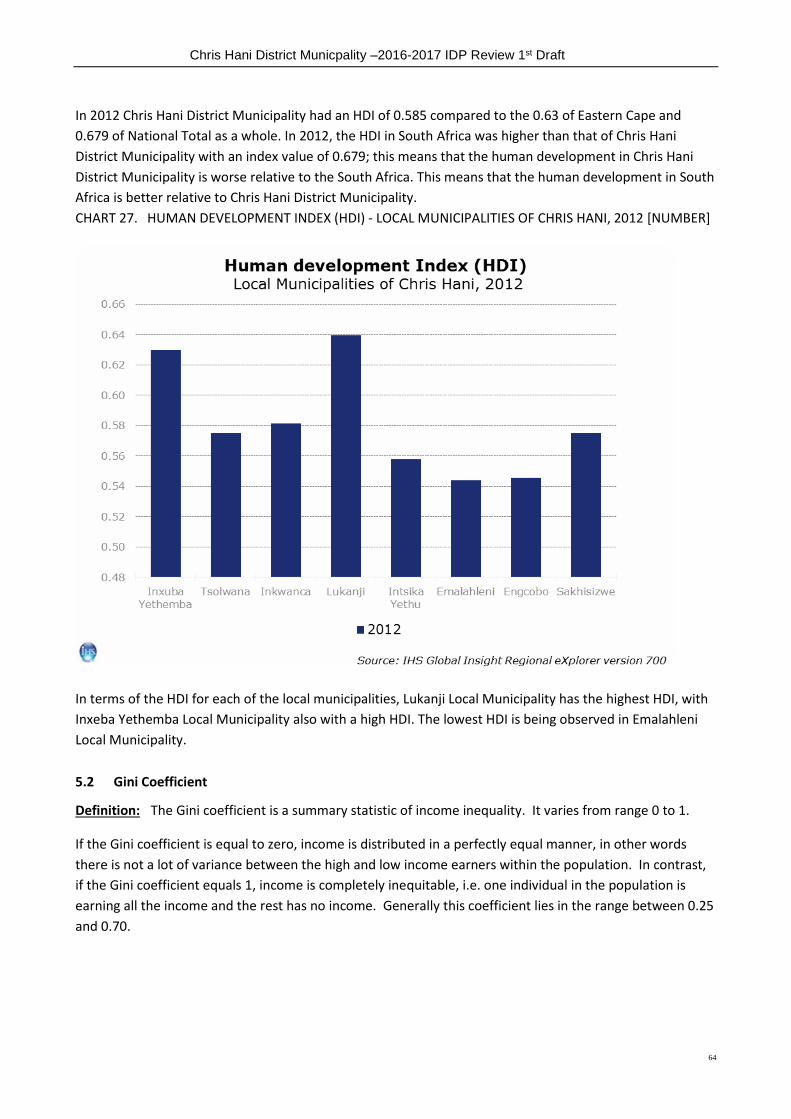
Chris Hani District Municpality –2016-2017 IDP Review 1st Draft
64
In 2012 Chris Hani District Municipality had an HDI of 0.585 compared to the 0.63 of Eastern Cape and
0.679 of National Total as a whole. In 2012, the HDI in South Africa was higher than that of Chris Hani
District Municipality with an index value of 0.679; this means that the human development in Chris Hani
District Municipality is worse relative to the South Africa. This means that the human development in South
Africa is better relative to Chris Hani District Municipality.
CHART 27. HUMAN DEVELOPMENT INDEX (HDI) - LOCAL MUNICIPALITIES OF CHRIS HANI, 2012 [NUMBER]
In terms of the HDI for each of the local municipalities, Lukanji Local Municipality has the highest HDI, with
Inxeba Yethemba Local Municipality also with a high HDI. The lowest HDI is being observed in Emalahleni
Local Municipality.
5.2 Gini Coefficient
Definition: The Gini coefficient is a summary statistic of income inequality. It varies from range 0 to 1.
If the Gini coefficient is equal to zero, income is distributed in a perfectly equal manner, in other words
there is not a lot of variance between the high and low income earners within the population. In contrast,
if the Gini coefficient equals 1, income is completely inequitable, i.e. one individual in the population is
earning all the income and the rest has no income. Generally this coefficient lies in the range between 0.25
and 0.70.

Chris Hani District Municpality –2016-2017 IDP Review 1st Draft
65
CHART 28. GINI COEFFICIENT - CHRIS HANI, EASTERN CAPE AND NATIONAL TOTAL, 2002-2012 [NUMBER]
In 2012, income inequality in the Chris Hani District Municipality was at 0.58. Comparing that to the past
decade's numbers, it has decreased since 2002. The Eastern Cape Province and the South Africa, both had
a better spread of income amongst their residents (at 0.61 and 0.63 respectively) than that of Chris Hani
District Municipality.
TABLE 33. GINI COEFFICIENT BY POPULATION GROUP - CHRIS HANI, 2002-2012 [NUMBER]
African White
2002 0.60 0.48
2003 0.61 0.48
2004 0.61 0.47
2005 0.61 0.46
2006 0.61 0.45
2007 0.60 0.44
2008 0.59 0.44
2009 0.57 0.43
2010 0.57 0.43
2011 0.56 0.43
2012 0.54 0.41
Average Annual growth
2002-2012 -1.04% -1.55%
Source: IHS Global Insight Regional eXplorer version 700
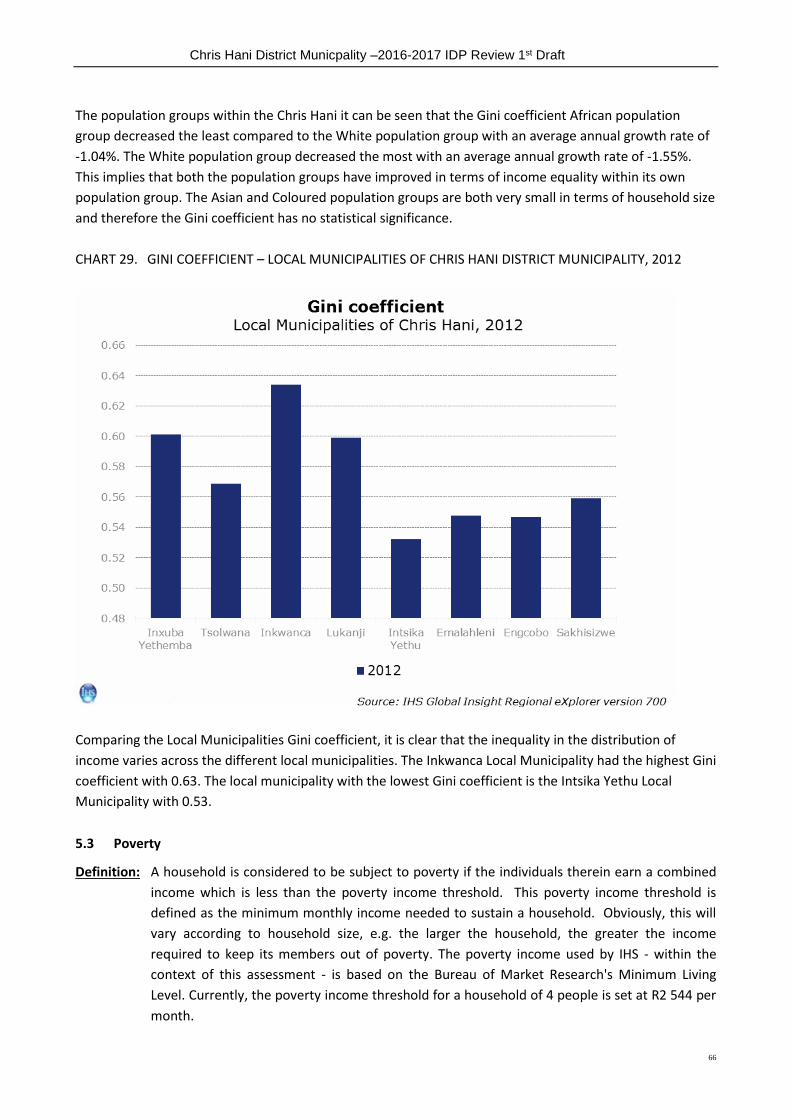
Chris Hani District Municpality –2016-2017 IDP Review 1st Draft
66
The population groups within the Chris Hani it can be seen that the Gini coefficient African population
group decreased the least compared to the White population group with an average annual growth rate of
-1.04%. The White population group decreased the most with an average annual growth rate of -1.55%.
This implies that both the population groups have improved in terms of income equality within its own
population group. The Asian and Coloured population groups are both very small in terms of household size
and therefore the Gini coefficient has no statistical significance.
CHART 29. GINI COEFFICIENT – LOCAL MUNICIPALITIES OF CHRIS HANI DISTRICT MUNICIPALITY, 2012
Comparing the Local Municipalities Gini coefficient, it is clear that the inequality in the distribution of
income varies across the different local municipalities. The Inkwanca Local Municipality had the highest Gini
coefficient with 0.63. The local municipality with the lowest Gini coefficient is the Intsika Yethu Local
Municipality with 0.53.
5.3 Poverty
Definition: A household is considered to be subject to poverty if the individuals therein earn a combined
income which is less than the poverty income threshold. This poverty income threshold is
defined as the minimum monthly income needed to sustain a household. Obviously, this will
vary according to household size, e.g. the larger the household, the greater the income
required to keep its members out of poverty. The poverty income used by IHS - within the
context of this assessment - is based on the Bureau of Market Research's Minimum Living
Level. Currently, the poverty income threshold for a household of 4 people is set at R2 544 per
month.

Chris Hani District Municpality –2016-2017 IDP Review 1st Draft
67
CHART 30. NUMBER AND PERCENTAGE OF PEOPLE LIVING IN POVERTY - CHRIS HANI DISTRICT
MUNICIPALITY, 2002-2012 [NUMBER & PERCENTAGE]
In 2012, there were 365 000 people living in poverty across Chris Hani - this is 33.29% lower than the
548 000 in 2002. The percentage of people living in poverty decreased from 67.51% in 2002 to 45.41% in
2012 which is a decrease of 22.1 percentage points.
TABLE 34. PERCENTAGE OF PEOPLE LIVING IN POVERTY BY POPULATION GROUP - CHRIS HANI, 2002-
2012 [PERCENTAGE]
African White Coloured Asian Total
2002 69.8% 3.5% 48.5% 16.4% 67.5%
2003 67.2% 3.2% 46.7% 17.9% 65.0%
2004 66.0% 2.8% 48.6% 18.9% 63.9%
2005 62.9% 1.8% 47.8% 18.6% 61.0%
2006 60.4% 1.7% 47.1% 19.2% 58.6%
2007 59.3% 1.5% 45.5% 19.8% 57.5%
2008 60.3% 1.6% 46.0% 20.5% 58.5%
2009 57.1% 1.6% 41.2% 16.7% 55.3%
2010 53.1% 1.5% 37.3% 11.3% 51.3%
2011 49.8% 1.4% 35.1% 12.5% 48.2%
2012 47.0% 1.2% 32.5% 12.8% 45.4%
Source: IHS Global Insight Regional eXplorer version 700
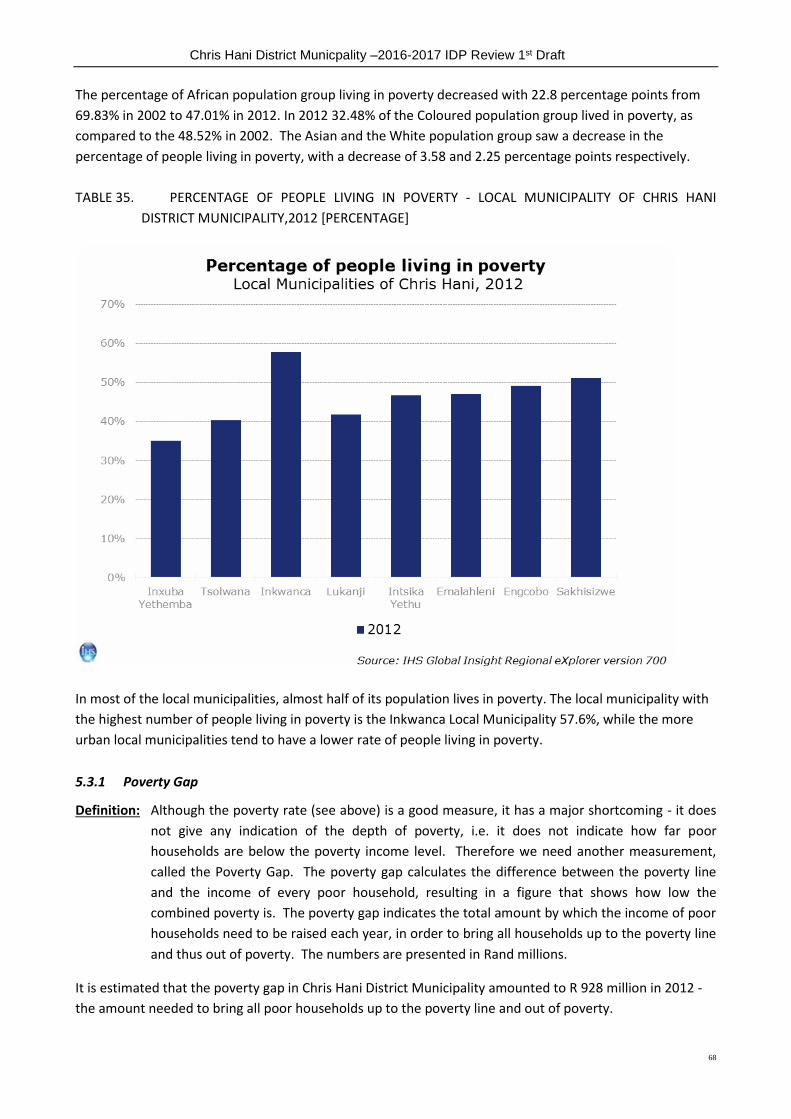
Chris Hani District Municpality –2016-2017 IDP Review 1st Draft
68
The percentage of African population group living in poverty decreased with 22.8 percentage points from
69.83% in 2002 to 47.01% in 2012. In 2012 32.48% of the Coloured population group lived in poverty, as
compared to the 48.52% in 2002. The Asian and the White population group saw a decrease in the
percentage of people living in poverty, with a decrease of 3.58 and 2.25 percentage points respectively.
TABLE 35. PERCENTAGE OF PEOPLE LIVING IN POVERTY - LOCAL MUNICIPALITY OF CHRIS HANI
DISTRICT MUNICIPALITY,2012 [PERCENTAGE]
In most of the local municipalities, almost half of its population lives in poverty. The local municipality with
the highest number of people living in poverty is the Inkwanca Local Municipality 57.6%, while the more
urban local municipalities tend to have a lower rate of people living in poverty.
5.3.1 Poverty Gap
Definition: Although the poverty rate (see above) is a good measure, it has a major shortcoming - it does
not give any indication of the depth of poverty, i.e. it does not indicate how far poor
households are below the poverty income level. Therefore we need another measurement,
called the Poverty Gap. The poverty gap calculates the difference between the poverty line
and the income of every poor household, resulting in a figure that shows how low the
combined poverty is. The poverty gap indicates the total amount by which the income of poor
households need to be raised each year, in order to bring all households up to the poverty line
and thus out of poverty. The numbers are presented in Rand millions.
It is estimated that the poverty gap in Chris Hani District Municipality amounted to R 928 million in 2012 -
the amount needed to bring all poor households up to the poverty line and out of poverty.

Chris Hani District Municpality –2016-2017 IDP Review 1st Draft
69
TABLE 36. TOTAL POVERTY GAP BY POPULATION GROUP - CHRIS HANI DISTRICT MUNICIPALITY, 2002-
2012 [R MILLIONS, CURRENT PRICES]
African White Coloured Asian Total
2002 793.3 0.7 20.3 0.1 814.4
2003 808.1 0.6 20.7 0.1 829.5
2004 817.2 0.6 22.0 0.2 840.0
2005 826.4 0.4 23.0 0.2 849.9
2006 815.1 0.4 23.5 0.2 839.2
2007 858.3 0.4 24.8 0.3 883.7
2008 1,019.3 0.5 29.5 0.6 1,050.0
2009 1,000.2 0.5 27.4 0.9 1,029.0
2010 930.4 0.4 25.5 0.7 957.0
2011 922.2 0.4 26.0 0.9 949.5
2012 900.7 0.3 26.1 1.2 928.3
Average Annual growth
2002-2012 1.28% -8.13% 2.52% 26.78% 1.32%
Source: IHS Global Insight Regional eXplorer version 700
The African population group has the largest poverty gap in absolute terms of R 901 million (which
increased from R 793 million in 2002). The Coloured population group showed the second largest poverty
gap with a total of R 26.1 million (which increased from R 20.3 million in 2002). The Asian and the White
population groups have a poverty gap of R 114,000 and R 675,000 respectively.
5.4 Education
Educating is important to the economic growth in a country and the development of its industries,
providing a trained workforce and skilled professionals required. The education measure represents the
highest level of education of an individual, using the 15 years and older age category. (According to the
United Nations definition of education, one is an adult when 15 years or older. IHS uses this cut-off point to
allow for cross-country comparisons. Furthermore, the age of 15 is also the legal age at which children may
leave school in South Africa).
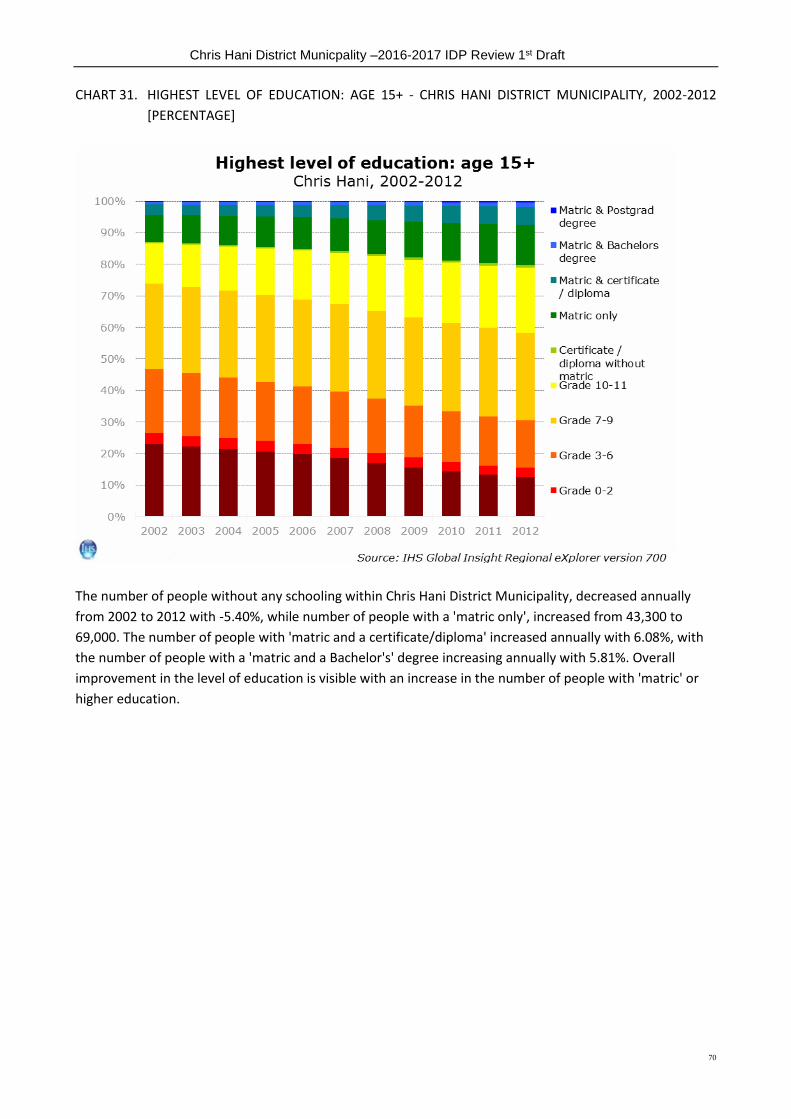
Chris Hani District Municpality –2016-2017 IDP Review 1st Draft
70
CHART 31. HIGHEST LEVEL OF EDUCATION: AGE 15+ - CHRIS HANI DISTRICT MUNICIPALITY, 2002-2012
[PERCENTAGE]
The number of people without any schooling within Chris Hani District Municipality, decreased annually
from 2002 to 2012 with -5.40%, while number of people with a 'matric only', increased from 43,300 to
69,000. The number of people with 'matric and a certificate/diploma' increased annually with 6.08%, with
the number of people with a 'matric and a Bachelor's' degree increasing annually with 5.81%. Overall
improvement in the level of education is visible with an increase in the number of people with 'matric' or
higher education.

Chris Hani District Municpality –2016-2017 IDP Review 1st Draft
71
TABLE 37. HIGHEST LEVEL OF EDUCATION: AGE 15+ - CHRIS HANI, EASTERN CAPE AND NATIONAL
TOTAL, 2012 [NUMBERS]
Chris Hani Eastern Cape National Total Chris Hani as %
of province
Chris Hani as
% of national
No schooling 67,227 437,695 2,621,077 15.4% 2.6%
Grade 0-2 16,909 107,464 599,961 15.7% 2.8%
Grade 3-6 80,487 544,950 3,216,343 14.8% 2.5%
Grade 7-9 148,825 1,173,214 8,082,816 12.7% 1.8%
Grade 10-11 111,813 1,043,859 9,105,784 10.7% 1.2%
Certificate /
diploma without
matric
4,393 36,160 333,274 12.1% 1.3%
Matric only 68,956 819,275 9,175,011 8.4% 0.8%
Matric &
certificate /
diploma
30,728 252,909 2,359,720 12.1% 1.3%
Matric &
Bachelors
degree
7,342 79,692 883,822 9.2% 0.8%
Matric &
Postgrad degree
1,970 25,707 374,910 7.7% 0.5%
Source: IHS Global Insight Regional eXplorer version 700
The number of people without any schooling in Chris Hani District Municipality constitutes 2.56% of the
number of people without schooling in the province and a total share of 2.56% of the national. In 2012, the
number of people in Chris Hani District Municipality with a matric only was 69,000 which is a share of
0.75% of the province. The number of people with a matric and a Postgrad degree constitutes 0.83% of the
province and 0.83% of the national.
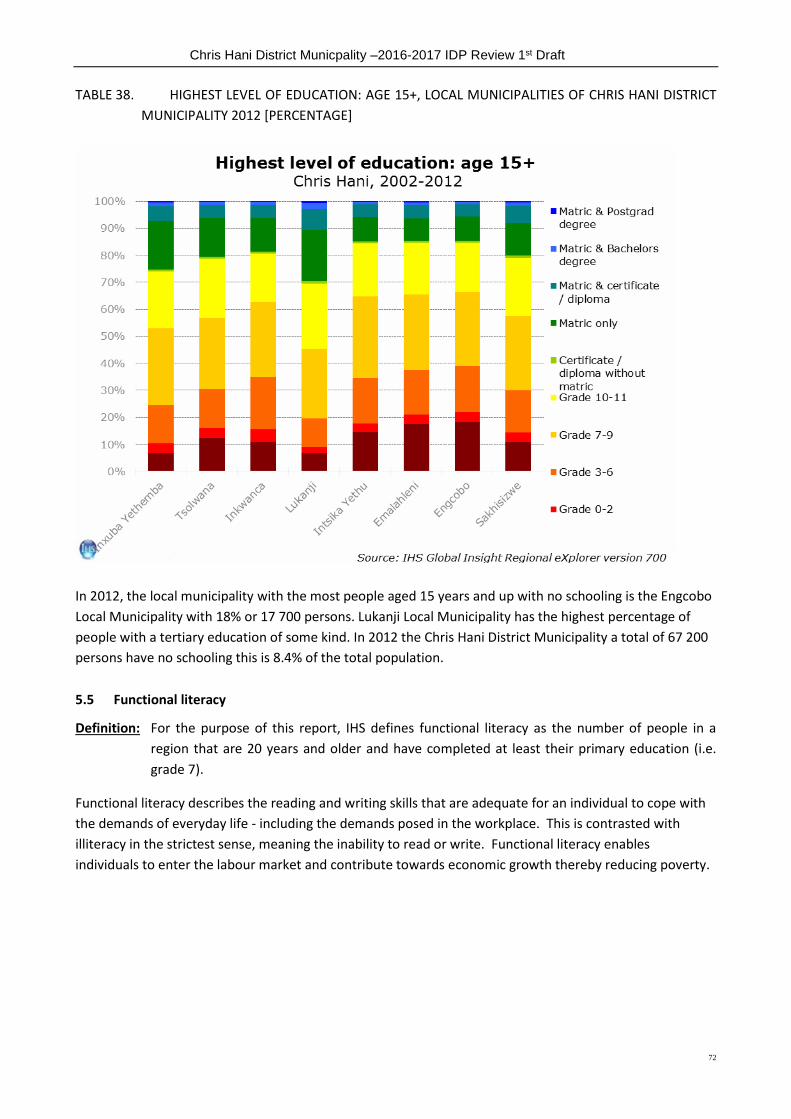
Chris Hani District Municpality –2016-2017 IDP Review 1st Draft
72
TABLE 38. HIGHEST LEVEL OF EDUCATION: AGE 15+, LOCAL MUNICIPALITIES OF CHRIS HANI DISTRICT
MUNICIPALITY 2012 [PERCENTAGE]
In 2012, the local municipality with the most people aged 15 years and up with no schooling is the Engcobo
Local Municipality with 18% or 17 700 persons. Lukanji Local Municipality has the highest percentage of
people with a tertiary education of some kind. In 2012 the Chris Hani District Municipality a total of 67 200
persons have no schooling this is 8.4% of the total population.
5.5 Functional literacy
Definition: For the purpose of this report, IHS defines functional literacy as the number of people in a
region that are 20 years and older and have completed at least their primary education (i.e.
grade 7).
Functional literacy describes the reading and writing skills that are adequate for an individual to cope with
the demands of everyday life - including the demands posed in the workplace. This is contrasted with
illiteracy in the strictest sense, meaning the inability to read or write. Functional literacy enables
individuals to enter the labour market and contribute towards economic growth thereby reducing poverty.

Chris Hani District Municpality –2016-2017 IDP Review 1st Draft
73
TABLE 39. FUNCTIONAL LITERACY: AGE 20+, COMPLETED GRADE 7 OR HIGHER - CHRIS HANI, 2002-
2012 [NUMBER & PERCENTAGE]
Illiterate Literate %
2002 205,490 196,622 48.9%
2003 201,363 204,017 50.3%
2004 197,176 211,567 51.8%
2005 193,045 219,404 53.2%
2006 189,184 227,786 54.6%
2007 185,478 236,645 56.1%
2008 182,070 246,231 57.5%
2009 178,687 256,293 58.9%
2010 175,188 266,686 60.4%
2011 171,386 277,136 61.8%
2012 167,368 287,717 63.2%
Average Annual growth
2002-2012 -2.03% 3.88% 2.60%
Source: IHS Global Insight Regional eXplorer version 700
A total of 288 000 individuals in Chris Hani District Municipality were considered functionally literate in
2012, while 167 000 people were considered to be illiterate. Expressed as a rate, this amounts to 63.22%,
which is an increase of 14.33% percentage points since 2002 (48.90%). The number of illiterate individuals
decreased - by -2.03% annually from 2002 to 2012, with the number of functional literate people increasing
at 3.88% annually.
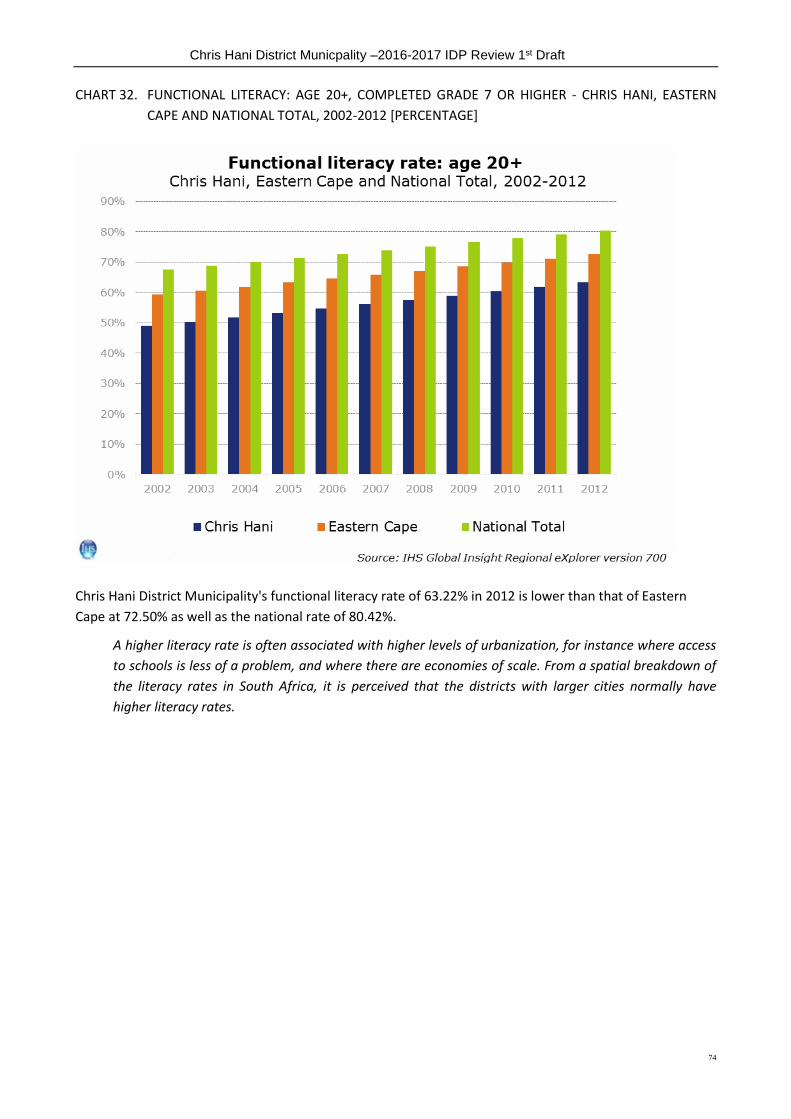
Chris Hani District Municpality –2016-2017 IDP Review 1st Draft
74
CHART 32. FUNCTIONAL LITERACY: AGE 20+, COMPLETED GRADE 7 OR HIGHER - CHRIS HANI, EASTERN
CAPE AND NATIONAL TOTAL, 2002-2012 [PERCENTAGE]
Chris Hani District Municipality's functional literacy rate of 63.22% in 2012 is lower than that of Eastern
Cape at 72.50% as well as the national rate of 80.42%.
A higher literacy rate is often associated with higher levels of urbanization, for instance where access
to schools is less of a problem, and where there are economies of scale. From a spatial breakdown of
the literacy rates in South Africa, it is perceived that the districts with larger cities normally have
higher literacy rates.

Chris Hani District Municpality –2016-2017 IDP Review 1st Draft
75
CHART 33. LITERACY RATE - LOCAL MUNICIPALITY OF CHRIS HANI DISTRICT MUNICIPALITY,2012
[PERCENTAGE]
Lukanji Local Municipality, at 80.3%, does have the highest literacy rates within the Chris Hani District
Municipality. The lowest literacy rate of 60.9% is in the Engcobo Local Municipality.
5.6 Population Density
Definition: Population density measures the concentration of people in a region. To calculate this, the
population of a region is divided by the area size of that region. The output is presented as the
number of people per square kilometre.
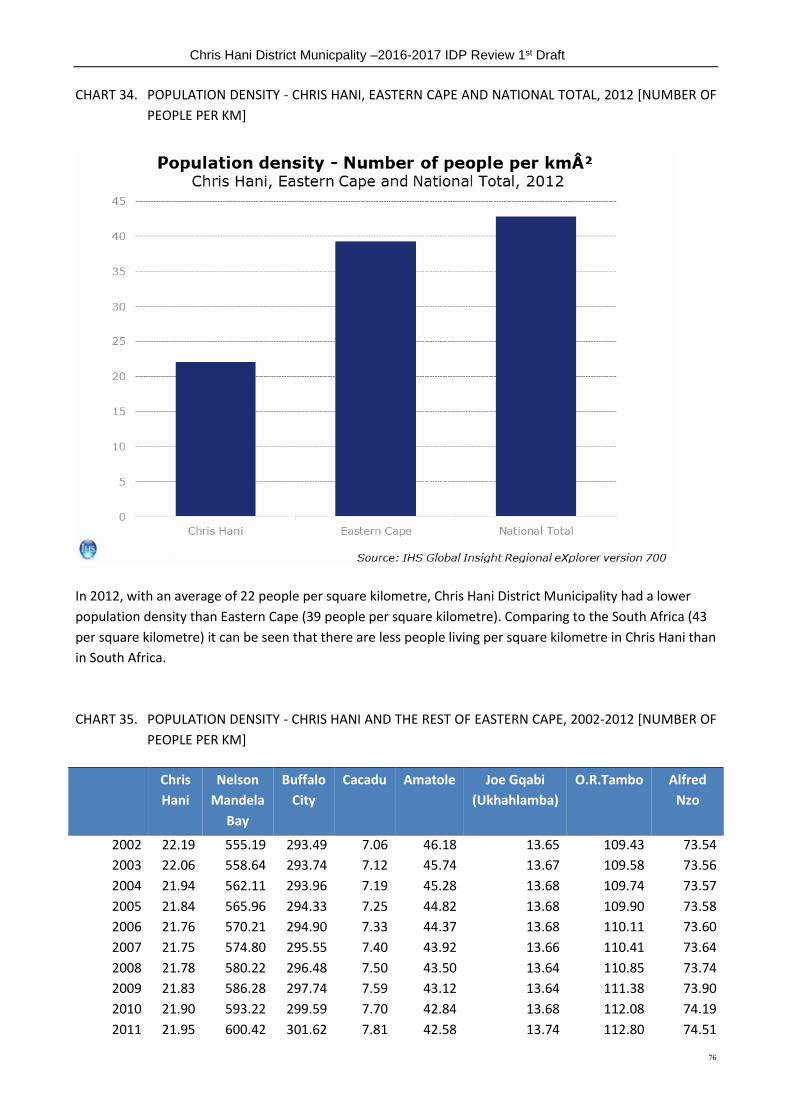
Chris Hani District Municpality –2016-2017 IDP Review 1st Draft
76
CHART 34. POPULATION DENSITY - CHRIS HANI, EASTERN CAPE AND NATIONAL TOTAL, 2012 [NUMBER OF
PEOPLE PER KM]
In 2012, with an average of 22 people per square kilometre, Chris Hani District Municipality had a lower
population density than Eastern Cape (39 people per square kilometre). Comparing to the South Africa (43
per square kilometre) it can be seen that there are less people living per square kilometre in Chris Hani than
in South Africa.
CHART 35. POPULATION DENSITY - CHRIS HANI AND THE REST OF EASTERN CAPE, 2002-2012 [NUMBER OF
PEOPLE PER KM]
Chris
Hani
Nelson
Mandela
Bay
Buffalo
City
Cacadu Amatole Joe Gqabi
(Ukhahlamba)
O.R.Tambo Alfred
Nzo
2002 22.19 555.19 293.49 7.06 46.18 13.65 109.43 73.54
2003 22.06 558.64 293.74 7.12 45.74 13.67 109.58 73.56
2004 21.94 562.11 293.96 7.19 45.28 13.68 109.74 73.57
2005 21.84 565.96 294.33 7.25 44.82 13.68 109.90 73.58
2006 21.76 570.21 294.90 7.33 44.37 13.68 110.11 73.60
2007 21.75 574.80 295.55 7.40 43.92 13.66 110.41 73.64
2008 21.78 580.22 296.48 7.50 43.50 13.64 110.85 73.74
2009 21.83 586.28 297.74 7.59 43.12 13.64 111.38 73.90
2010 21.90 593.22 299.59 7.70 42.84 13.68 112.08 74.19
2011 21.95 600.42 301.62 7.81 42.58 13.74 112.80 74.51
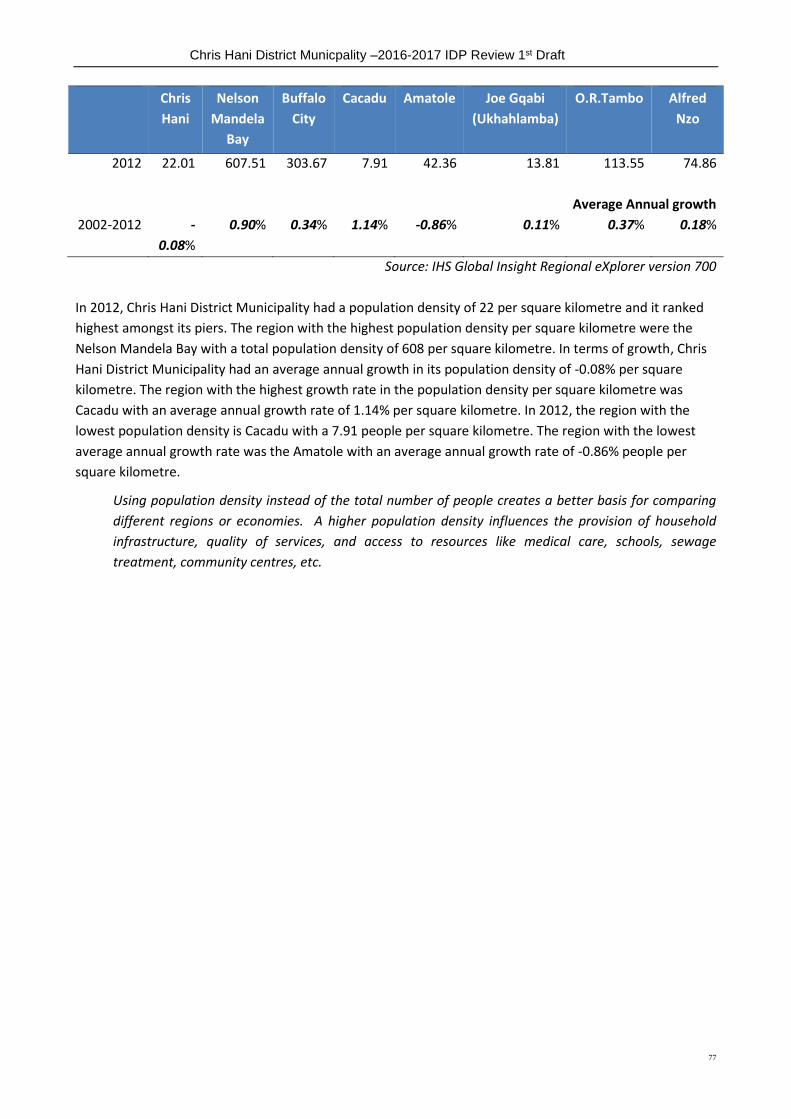
Chris Hani District Municpality –2016-2017 IDP Review 1st Draft
77
Chris
Hani
Nelson
Mandela
Bay
Buffalo
City
Cacadu Amatole Joe Gqabi
(Ukhahlamba)
O.R.Tambo Alfred
Nzo
2012 22.01 607.51 303.67 7.91 42.36 13.81 113.55 74.86
Average Annual growth
2002-2012 -
0.08%
0.90% 0.34% 1.14% -0.86% 0.11% 0.37% 0.18%
Source: IHS Global Insight Regional eXplorer version 700
In 2012, Chris Hani District Municipality had a population density of 22 per square kilometre and it ranked
highest amongst its piers. The region with the highest population density per square kilometre were the
Nelson Mandela Bay with a total population density of 608 per square kilometre. In terms of growth, Chris
Hani District Municipality had an average annual growth in its population density of -0.08% per square
kilometre. The region with the highest growth rate in the population density per square kilometre was
Cacadu with an average annual growth rate of 1.14% per square kilometre. In 2012, the region with the
lowest population density is Cacadu with a 7.91 people per square kilometre. The region with the lowest
average annual growth rate was the Amatole with an average annual growth rate of -0.86% people per
square kilometre.
Using population density instead of the total number of people creates a better basis for comparing
different regions or economies. A higher population density influences the provision of household
infrastructure, quality of services, and access to resources like medical care, schools, sewage
treatment, community centres, etc.
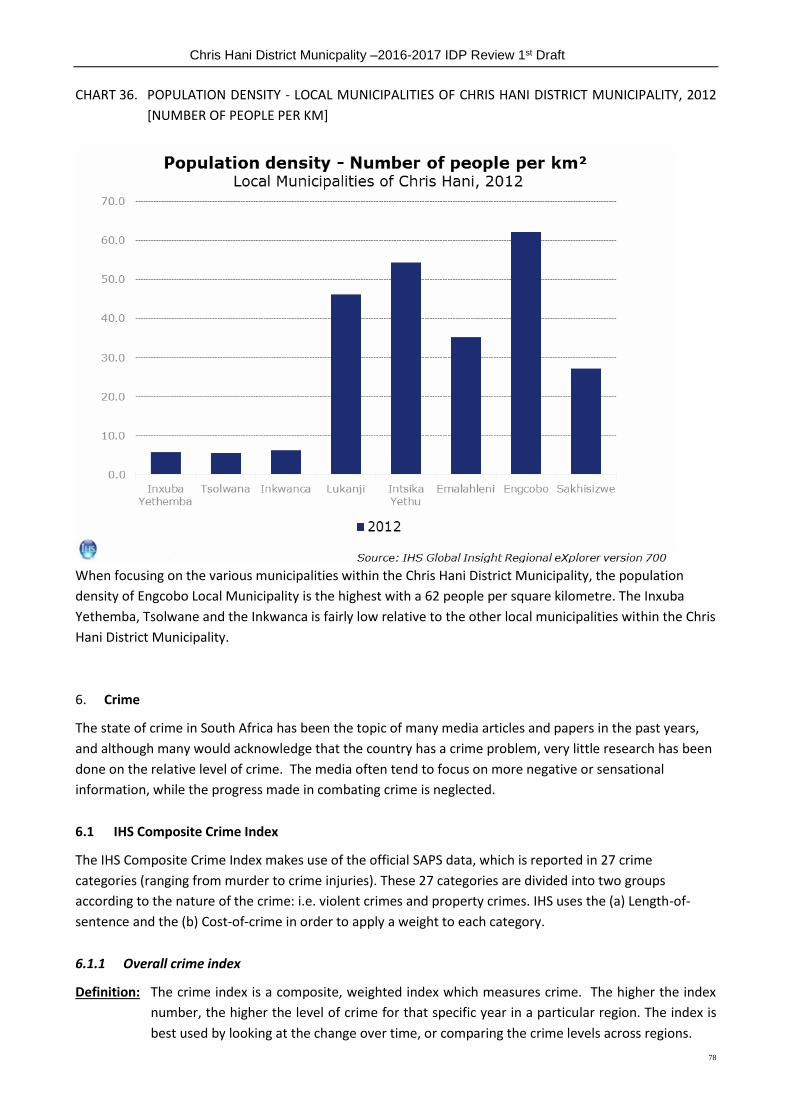
Chris Hani District Municpality –2016-2017 IDP Review 1st Draft
78
CHART 36. POPULATION DENSITY - LOCAL MUNICIPALITIES OF CHRIS HANI DISTRICT MUNICIPALITY, 2012
[NUMBER OF PEOPLE PER KM]
When focusing on the various municipalities within the Chris Hani District Municipality, the population
density of Engcobo Local Municipality is the highest with a 62 people per square kilometre. The Inxuba
Yethemba, Tsolwane and the Inkwanca is fairly low relative to the other local municipalities within the Chris
Hani District Municipality.
6. Crime
The state of crime in South Africa has been the topic of many media articles and papers in the past years,
and although many would acknowledge that the country has a crime problem, very little research has been
done on the relative level of crime. The media often tend to focus on more negative or sensational
information, while the progress made in combating crime is neglected.
6.1 IHS Composite Crime Index
The IHS Composite Crime Index makes use of the official SAPS data, which is reported in 27 crime
categories (ranging from murder to crime injuries). These 27 categories are divided into two groups
according to the nature of the crime: i.e. violent crimes and property crimes. IHS uses the (a) Length-of-
sentence and the (b) Cost-of-crime in order to apply a weight to each category.
6.1.1 Overall crime index
Definition: The crime index is a composite, weighted index which measures crime. The higher the index
number, the higher the level of crime for that specific year in a particular region. The index is
best used by looking at the change over time, or comparing the crime levels across regions.
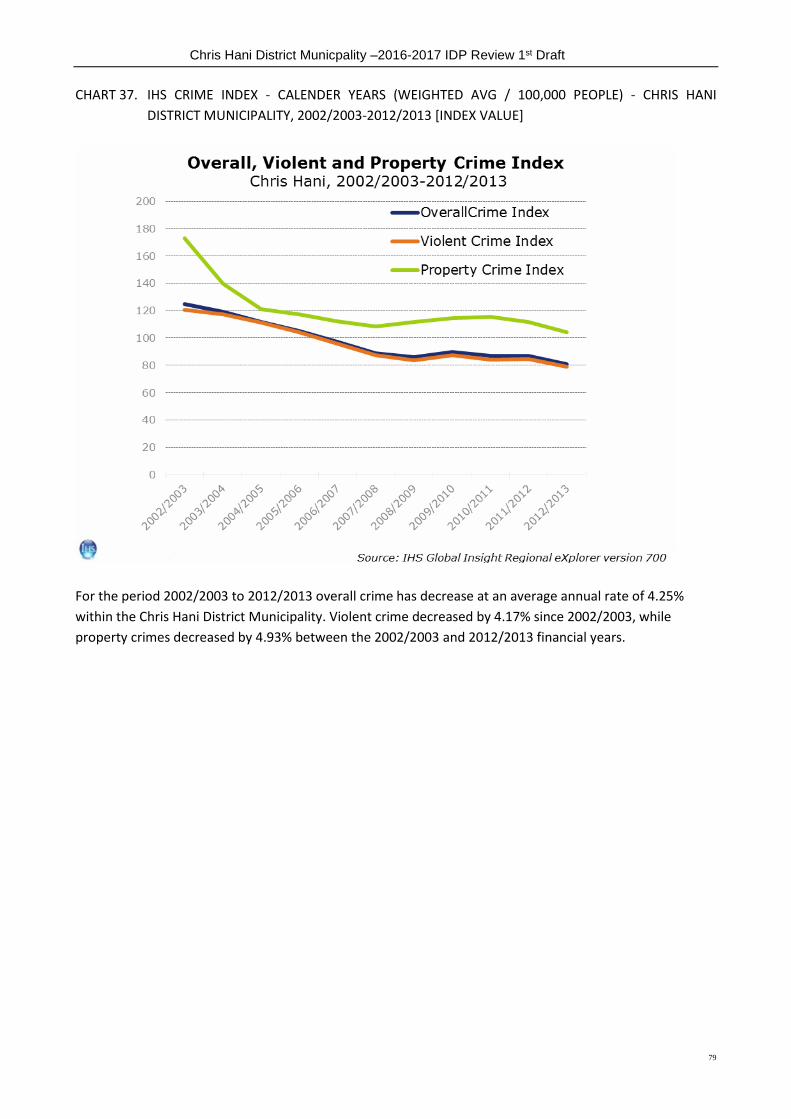
Chris Hani District Municpality –2016-2017 IDP Review 1st Draft
79
CHART 37. IHS CRIME INDEX - CALENDER YEARS (WEIGHTED AVG / 100,000 PEOPLE) - CHRIS HANI
DISTRICT MUNICIPALITY, 2002/2003-2012/2013 [INDEX VALUE]
For the period 2002/2003 to 2012/2013 overall crime has decrease at an average annual rate of 4.25%
within the Chris Hani District Municipality. Violent crime decreased by 4.17% since 2002/2003, while
property crimes decreased by 4.93% between the 2002/2003 and 2012/2013 financial years.
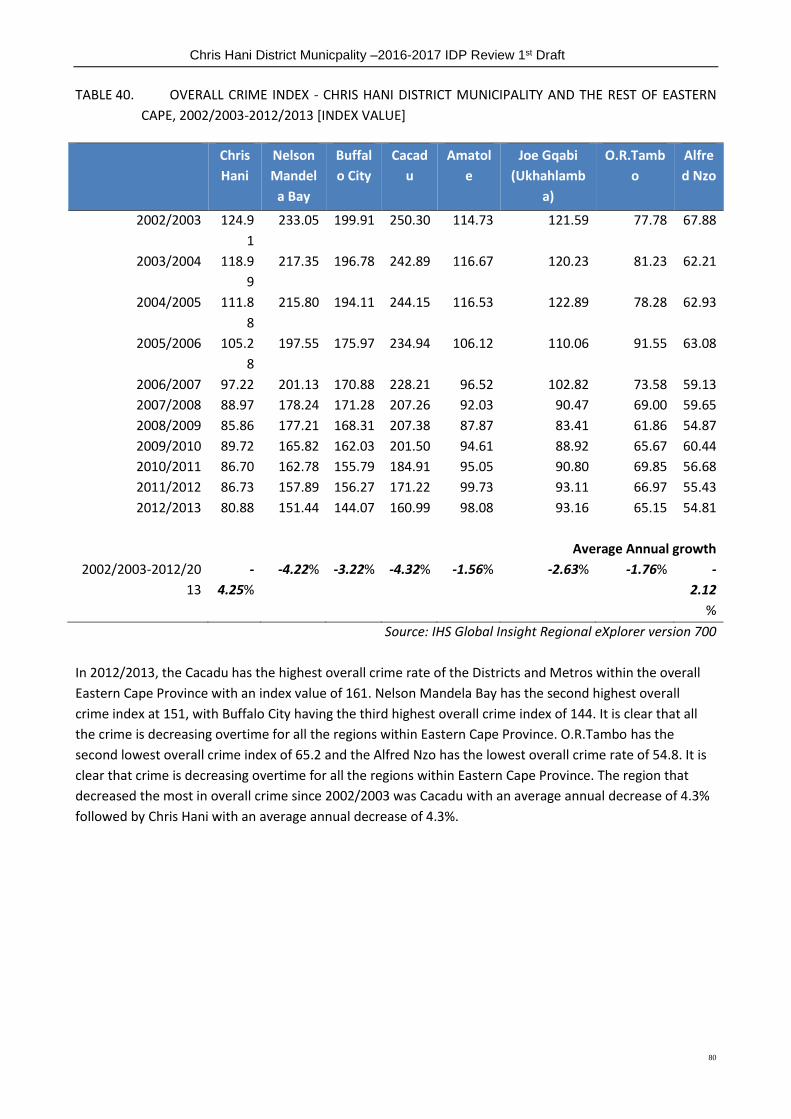
Chris Hani District Municpality –2016-2017 IDP Review 1st Draft
80
TABLE 40. OVERALL CRIME INDEX - CHRIS HANI DISTRICT MUNICIPALITY AND THE REST OF EASTERN
CAPE, 2002/2003-2012/2013 [INDEX VALUE]
Chris
Hani
Nelson
Mandel
a Bay
Buffal
o City
Cacad
u
Amatol
e
Joe Gqabi
(Ukhahlamb
a)
O.R.Tamb
o
Alfre
d Nzo
2002/2003 124.9
1
233.05 199.91 250.30 114.73 121.59 77.78 67.88
2003/2004 118.9
9
217.35 196.78 242.89 116.67 120.23 81.23 62.21
2004/2005 111.8
8
215.80 194.11 244.15 116.53 122.89 78.28 62.93
2005/2006 105.2
8
197.55 175.97 234.94 106.12 110.06 91.55 63.08
2006/2007 97.22 201.13 170.88 228.21 96.52 102.82 73.58 59.13
2007/2008 88.97 178.24 171.28 207.26 92.03 90.47 69.00 59.65
2008/2009 85.86 177.21 168.31 207.38 87.87 83.41 61.86 54.87
2009/2010 89.72 165.82 162.03 201.50 94.61 88.92 65.67 60.44
2010/2011 86.70 162.78 155.79 184.91 95.05 90.80 69.85 56.68
2011/2012 86.73 157.89 156.27 171.22 99.73 93.11 66.97 55.43
2012/2013 80.88 151.44 144.07 160.99 98.08 93.16 65.15 54.81
Average Annual growth
2002/2003-2012/20
13
-
4.25%
-4.22% -3.22% -4.32% -1.56% -2.63% -1.76% -
2.12
%
Source: IHS Global Insight Regional eXplorer version 700
In 2012/2013, the Cacadu has the highest overall crime rate of the Districts and Metros within the overall
Eastern Cape Province with an index value of 161. Nelson Mandela Bay has the second highest overall
crime index at 151, with Buffalo City having the third highest overall crime index of 144. It is clear that all
the crime is decreasing overtime for all the regions within Eastern Cape Province. O.R.Tambo has the
second lowest overall crime index of 65.2 and the Alfred Nzo has the lowest overall crime rate of 54.8. It is
clear that crime is decreasing overtime for all the regions within Eastern Cape Province. The region that
decreased the most in overall crime since 2002/2003 was Cacadu with an average annual decrease of 4.3%
followed by Chris Hani with an average annual decrease of 4.3%.
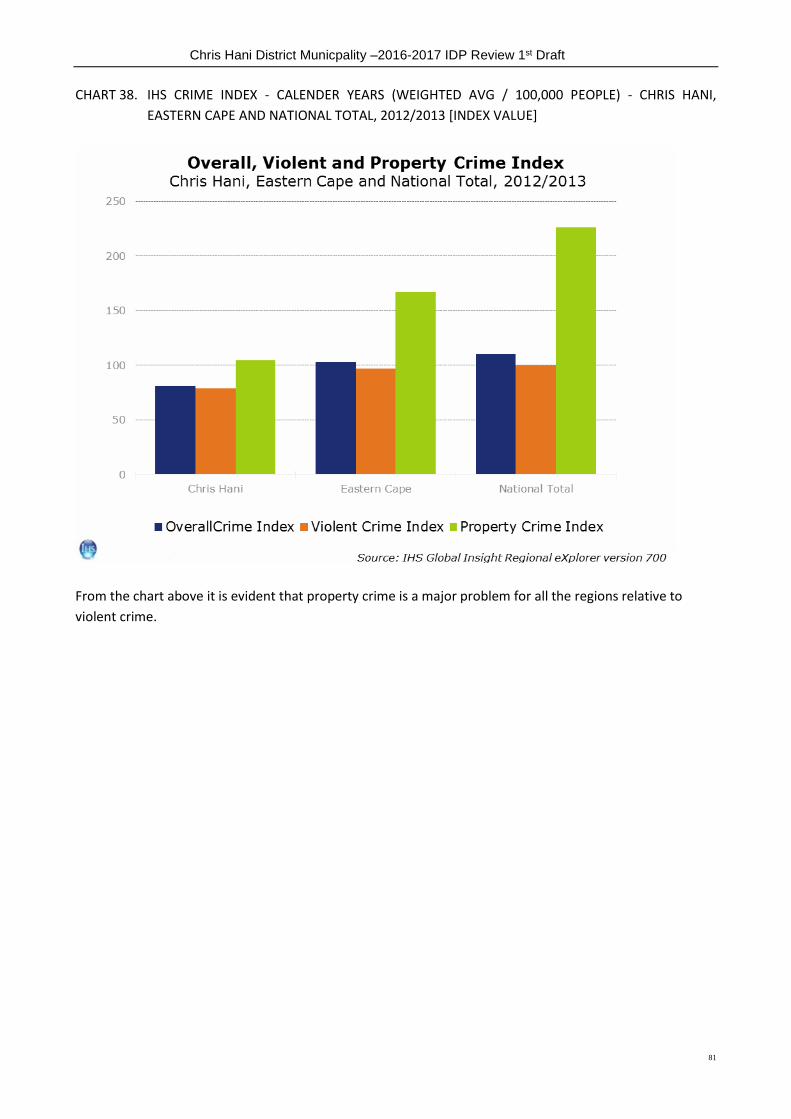
Chris Hani District Municpality –2016-2017 IDP Review 1st Draft
81
CHART 38. IHS CRIME INDEX - CALENDER YEARS (WEIGHTED AVG / 100,000 PEOPLE) - CHRIS HANI,
EASTERN CAPE AND NATIONAL TOTAL, 2012/2013 [INDEX VALUE]
From the chart above it is evident that property crime is a major problem for all the regions relative to
violent crime.
Chris Hani District Municpality –2016-2017 IDP Review 1st Draft
82
7. Household Infrastructure
Drawing on the household infrastructure data of a region is of essential value in economic planning and
social development. Assessing household infrastructure involves the measurement of four indicators:
Access to dwelling units
Access to proper sanitation
Access to running water
Access to refuse removal
Access to electricity
A household is considered "serviced" if it has access to all four of these basic services. If not, the household
is considered to be part of the backlog. The way access to a given service is defined (and how to accurately
measure that specific Definition over time) gives rise to some distinct problems. IHS has therefore
developed a unique model to capture the number of households and their level of access to the four basic
services.
A household is defined as a group of persons who live together and provide themselves jointly with food
and/or other essentials for living, or a single person who lives alone.
The next few sections offer an overview of the household infrastructure of the Chris Hani District
Municipality between 2012 and 2002.
7.1 Household by Dwelling Type
Using the StatsSA definition of a household and a dwelling unit, households can be categorised according to
type of dwelling. The categories are:
Very formal dwellings - structures built according to approved plans, e.g. houses on a separate
stand, flats or apartments, townhouses, rooms in backyards that also have running water and flush
toilets within the dwelling. .
Formal dwellings - structures built according to approved plans, i.e. house on a separate stand, flat
or apartment, townhouse, room in backyard, rooms or flatlet elsewhere etc, but without running
water or without a flush toilet within the dwelling.
Informal dwellings - shacks or shanties in informal settlements, serviced stands, or proclaimed
townships, as well as shacks in the backyards of other dwelling types.
Traditional dwellings - structures made of clay, mud, reeds, or other locally available material.
Other dwelling units - tents, ships, caravans, etc.

Chris Hani District Municpality –2016-2017 IDP Review 1st Draft
83
CHART 39. HOUSEHOLDS BY DWELLING UNIT TYPE - CHRIS HANI, EASTERN CAPE AND NATIONAL TOTAL,
2012 [PERCENTAGE]
Chris Hani District Municipality had a total number of 35 700 (16.67% of total households) very formal
dwelling units, a total of 80 400 (37.51% of total households) formal dwelling units and a total number of
3 650 (1.70% of total households) informal dwelling units.
TABLE 41. HOUSEHOLDS BY DWELLING UNIT TYPE - LOCAL MUNICIPALITIES OF CHRIS HANI, 2012
[NUMBER]
Inxuba
Yethemb
a
Tsolwan
a
Inkwanc
a
Lukan
ji
Intsik
a
Yethu
Emalahle
ni
Engcob
o
Sakhisizw
e
Total
Easter
n Cape
Very
Formal
11,082 730 1,296 19,89
6
126 956 255 1,369 35,711
Formal 7,529 6,865 4,617 23,50
6
8,713 13,129 8,438 7,565 80,362
Informal 394 77 76 1,727 233 119 435 585 3,647
Tradition
al
126 1,697 70 7,399 30,68
9
18,178 28,294 7,313 93,767
Other
dwelling
type
89 29 27 175 98 53 192 75 738
Total 19,220 9,398 6,087 52,70
3
39,85
8
32,436 37,614 16,908 214,22
4

Chris Hani District Municpality –2016-2017 IDP Review 1st Draft
84
Source: IHS Global Insight Regional eXplorer version 700
The local municipality with the highest number of very formal dwelling units is Lukhanji Local Municipality
with 19 900 or a share of 55.7% of the total very formal dwelling units within Chris Hani DM. The local
municipality with the lowest number of very formal dwelling units is Intsika Yethu Local Municipality with a
total of 126 or a share of 0.35% of the total very formal dwelling units within Chris Hani.
CHART 40. FORMAL DWELLING BACKLOG - NUMBER OF HOUSEHOLDS NOT LIVING IN A FORMAL
DWELLING - CHRIS HANI DISTRICT MUNICIPALITY, 2002-2012 [NUMBER OF HOUSEHOLDS]
When looking at the formal dwelling unit backlog (number of households not living in a formal dwelling)
over time, it can be seen that in 2002 the number of households not living in a formal dwelling were 90 200
within Chris Hani District Municipality. From 2002 this number increased annually at 0.85% to 98 200 in
2012.
The total number of households within Chris Hani District Municipality increased at an average annual rate
of 1.22% from 2002 to 2012, which is higher than the annual increase of 2.07% in the number of
households in South Africa.

Chris Hani District Municpality –2016-2017 IDP Review 1st Draft
85
7.2 Household by Type of Sanitation
Sanitation can be divided into specific types of sanitation to which a household has access. We use the
following categories:
No toilet-No access to any of the toilet systems explained below.
Bucket system - A top structure with a seat over a bucket. The bucket is periodically removed and
the contents disposed of. (Note: this system is widely used but poses health risks to the collectors.
Most authorities are actively attempting to discontinue the use of these buckets in their local
regions).
Pit toilet - A top structure over a pit.
Ventilation improved pit - A pit toilet but with a fly screen and vented by a pipe. Depending on soil
conditions, the pit may be lined.
Flush toilet - Waste is flushed into an enclosed tank, thus preventing the waste to flow into the
surrounding environment. The tanks need to be emptied or the contents pumped elsewhere.
CHART 41. HOUSEHOLDS BY TYPE OF SANITATION - CHRIS HANI, EASTERN CAPE AND NATIONAL TOTAL,
2012 [PERCENTAGE]
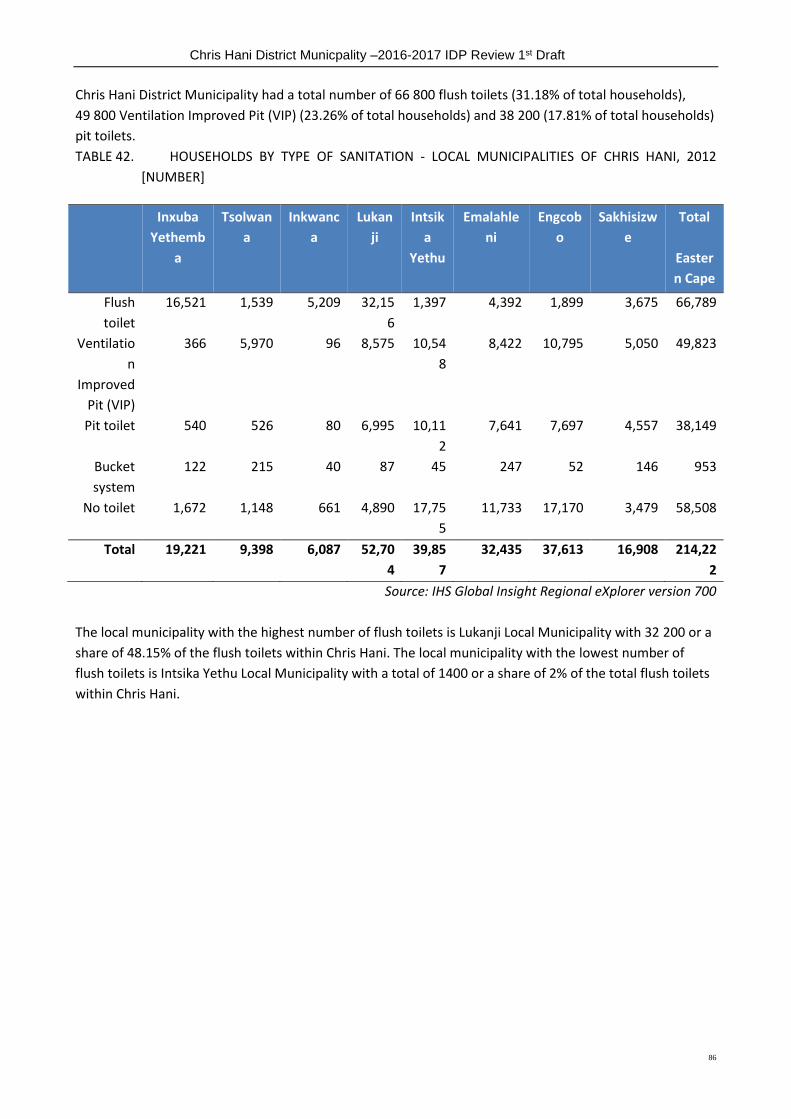
Chris Hani District Municpality –2016-2017 IDP Review 1st Draft
86
Chris Hani District Municipality had a total number of 66 800 flush toilets (31.18% of total households),
49 800 Ventilation Improved Pit (VIP) (23.26% of total households) and 38 200 (17.81% of total households)
pit toilets.
TABLE 42. HOUSEHOLDS BY TYPE OF SANITATION - LOCAL MUNICIPALITIES OF CHRIS HANI, 2012
[NUMBER]
Inxuba
Yethemb
a
Tsolwan
a
Inkwanc
a
Lukan
ji
Intsik
a
Yethu
Emalahle
ni
Engcob
o
Sakhisizw
e
Total
Easter
n Cape
Flush
toilet
16,521 1,539 5,209 32,15
6
1,397 4,392 1,899 3,675 66,789
Ventilatio
n
Improved
Pit (VIP)
366 5,970 96 8,575 10,54
8
8,422 10,795 5,050 49,823
Pit toilet 540 526 80 6,995 10,11
2
7,641 7,697 4,557 38,149
Bucket
system
122 215 40 87 45 247 52 146 953
No toilet 1,672 1,148 661 4,890 17,75
5
11,733 17,170 3,479 58,508
Total 19,221 9,398 6,087 52,70
4
39,85
7
32,435 37,613 16,908 214,22
2
Source: IHS Global Insight Regional eXplorer version 700
The local municipality with the highest number of flush toilets is Lukanji Local Municipality with 32 200 or a
share of 48.15% of the flush toilets within Chris Hani. The local municipality with the lowest number of
flush toilets is Intsika Yethu Local Municipality with a total of 1400 or a share of 2% of the total flush toilets
within Chris Hani.
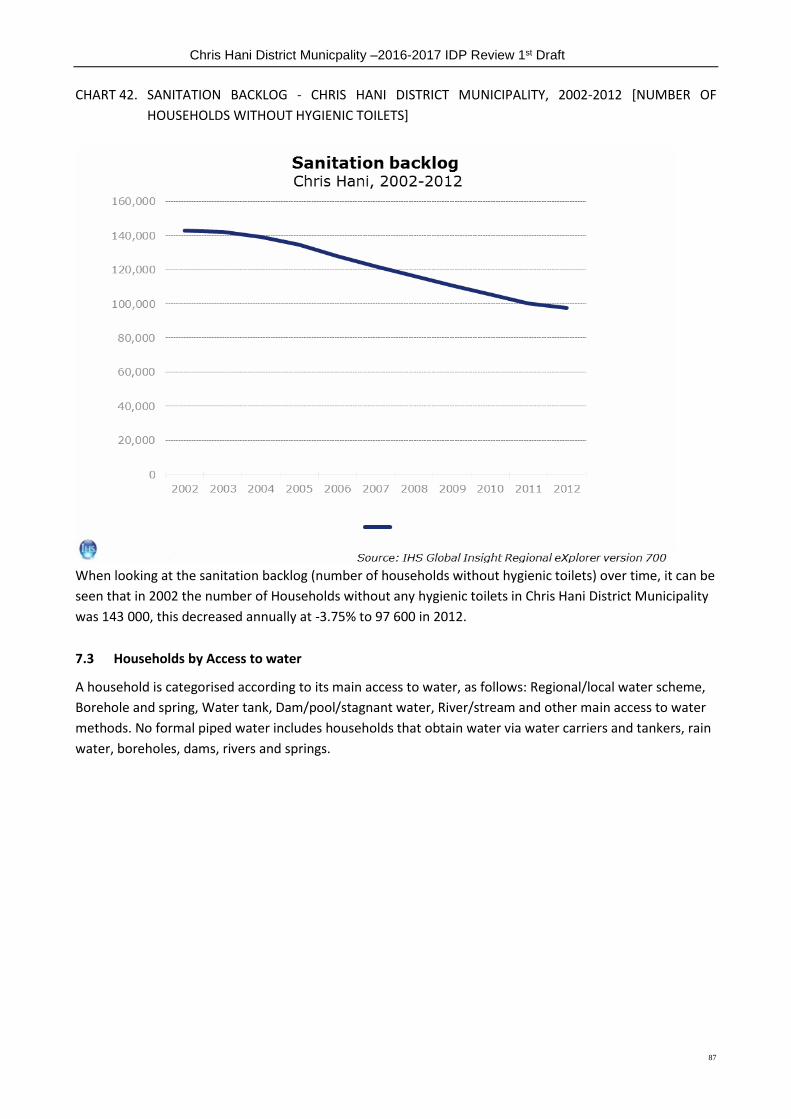
Chris Hani District Municpality –2016-2017 IDP Review 1st Draft
87
CHART 42. SANITATION BACKLOG - CHRIS HANI DISTRICT MUNICIPALITY, 2002-2012 [NUMBER OF
HOUSEHOLDS WITHOUT HYGIENIC TOILETS]
When looking at the sanitation backlog (number of households without hygienic toilets) over time, it can be
seen that in 2002 the number of Households without any hygienic toilets in Chris Hani District Municipality
was 143 000, this decreased annually at -3.75% to 97 600 in 2012.
7.3 Households by Access to water
A household is categorised according to its main access to water, as follows: Regional/local water scheme,
Borehole and spring, Water tank, Dam/pool/stagnant water, River/stream and other main access to water
methods. No formal piped water includes households that obtain water via water carriers and tankers, rain
water, boreholes, dams, rivers and springs.
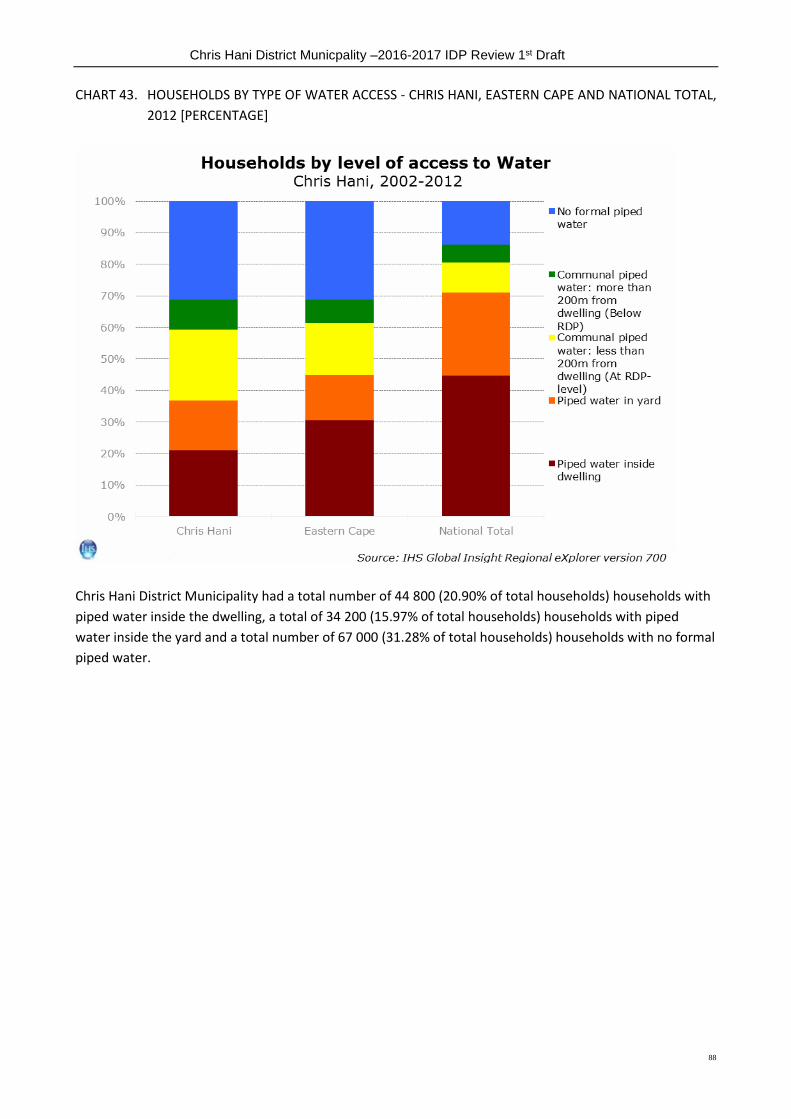
Chris Hani District Municpality –2016-2017 IDP Review 1st Draft
88
CHART 43. HOUSEHOLDS BY TYPE OF WATER ACCESS - CHRIS HANI, EASTERN CAPE AND NATIONAL TOTAL,
2012 [PERCENTAGE]
Chris Hani District Municipality had a total number of 44 800 (20.90% of total households) households with
piped water inside the dwelling, a total of 34 200 (15.97% of total households) households with piped
water inside the yard and a total number of 67 000 (31.28% of total households) households with no formal
piped water.
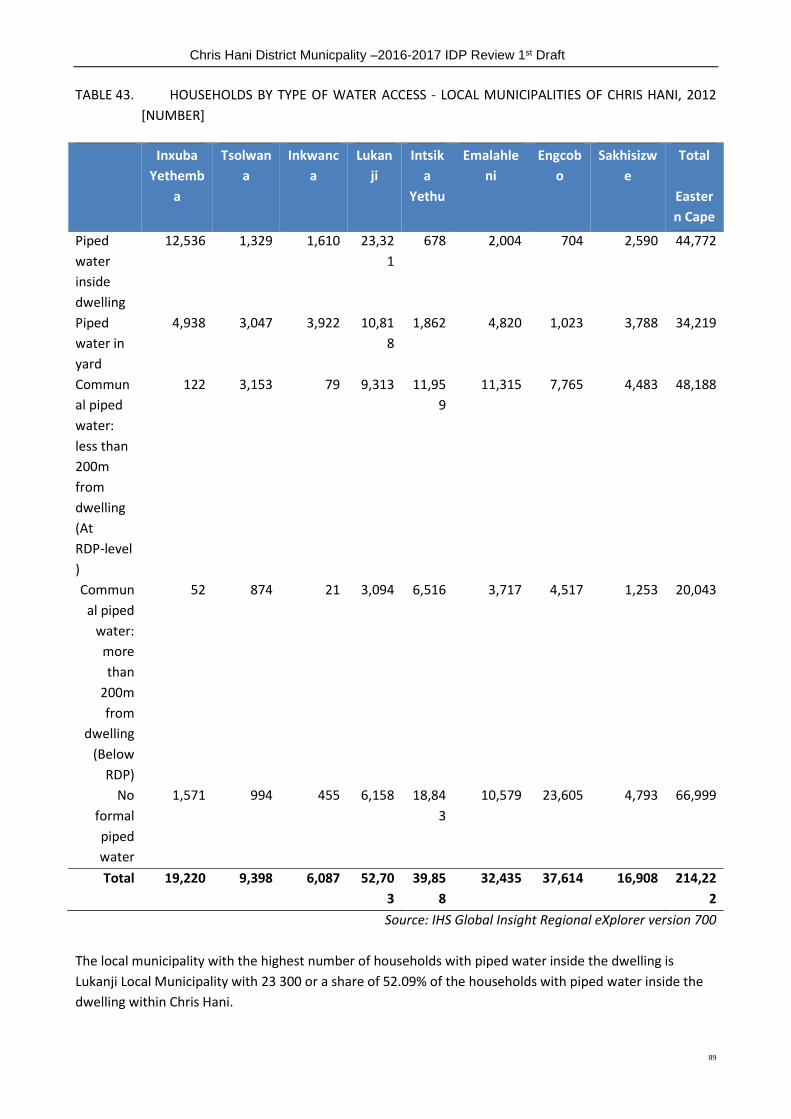
Chris Hani District Municpality –2016-2017 IDP Review 1st Draft
89
TABLE 43. HOUSEHOLDS BY TYPE OF WATER ACCESS - LOCAL MUNICIPALITIES OF CHRIS HANI, 2012
[NUMBER]
Inxuba
Yethemb
a
Tsolwan
a
Inkwanc
a
Lukan
ji
Intsik
a
Yethu
Emalahle
ni
Engcob
o
Sakhisizw
e
Total
Easter
n Cape
Piped
water
inside
dwelling
12,536 1,329 1,610 23,32
1
678 2,004 704 2,590 44,772
Piped
water in
yard
4,938 3,047 3,922 10,81
8
1,862 4,820 1,023 3,788 34,219
Commun
al piped
water:
less than
200m
from
dwelling
(At
RDP-level
)
122 3,153 79 9,313 11,95
9
11,315 7,765 4,483 48,188
Commun
al piped
water:
more
than
200m
from
dwelling
(Below
RDP)
52 874 21 3,094 6,516 3,717 4,517 1,253 20,043
No
formal
piped
water
1,571 994 455 6,158 18,84
3
10,579 23,605 4,793 66,999
Total 19,220 9,398 6,087 52,70
3
39,85
8
32,435 37,614 16,908 214,22
2
Source: IHS Global Insight Regional eXplorer version 700
The local municipality with the highest number of households with piped water inside the dwelling is
Lukanji Local Municipality with 23 300 or a share of 52.09% of the households with piped water inside the
dwelling within Chris Hani.
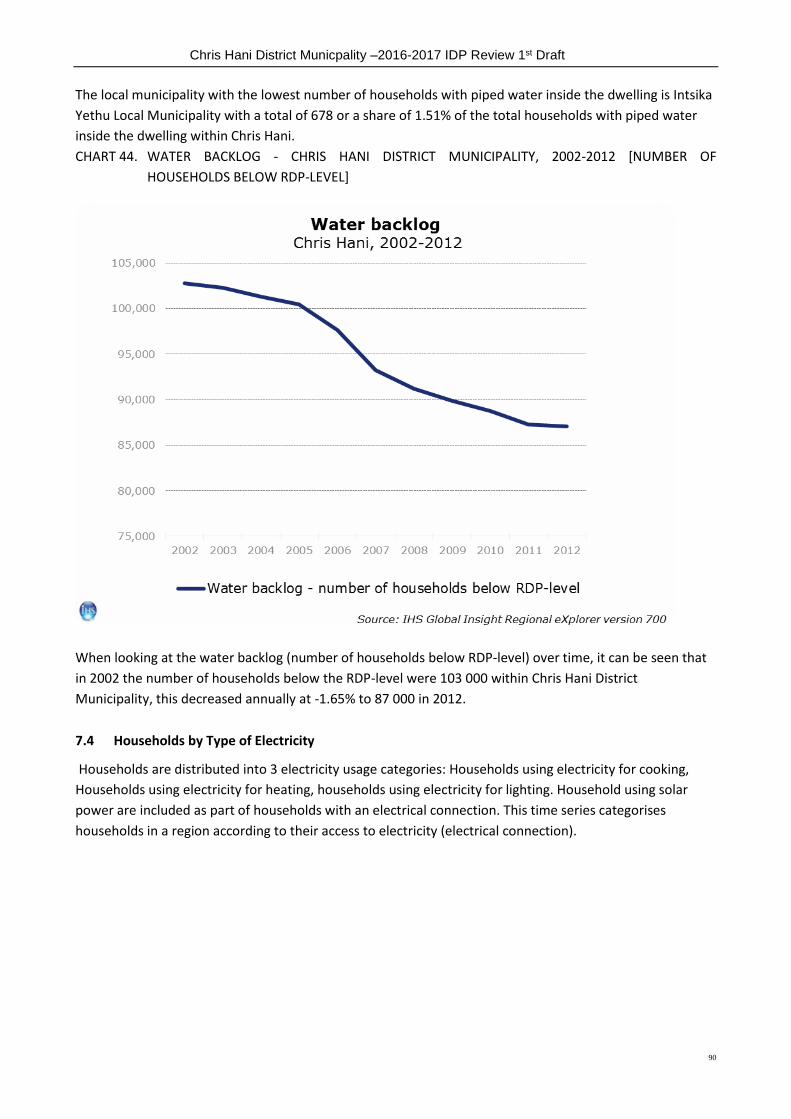
Chris Hani District Municpality –2016-2017 IDP Review 1st Draft
90
The local municipality with the lowest number of households with piped water inside the dwelling is Intsika
Yethu Local Municipality with a total of 678 or a share of 1.51% of the total households with piped water
inside the dwelling within Chris Hani.
CHART 44. WATER BACKLOG - CHRIS HANI DISTRICT MUNICIPALITY, 2002-2012 [NUMBER OF
HOUSEHOLDS BELOW RDP-LEVEL]
When looking at the water backlog (number of households below RDP-level) over time, it can be seen that
in 2002 the number of households below the RDP-level were 103 000 within Chris Hani District
Municipality, this decreased annually at -1.65% to 87 000 in 2012.
7.4 Households by Type of Electricity
Households are distributed into 3 electricity usage categories: Households using electricity for cooking,
Households using electricity for heating, households using electricity for lighting. Household using solar
power are included as part of households with an electrical connection. This time series categorises
households in a region according to their access to electricity (electrical connection).
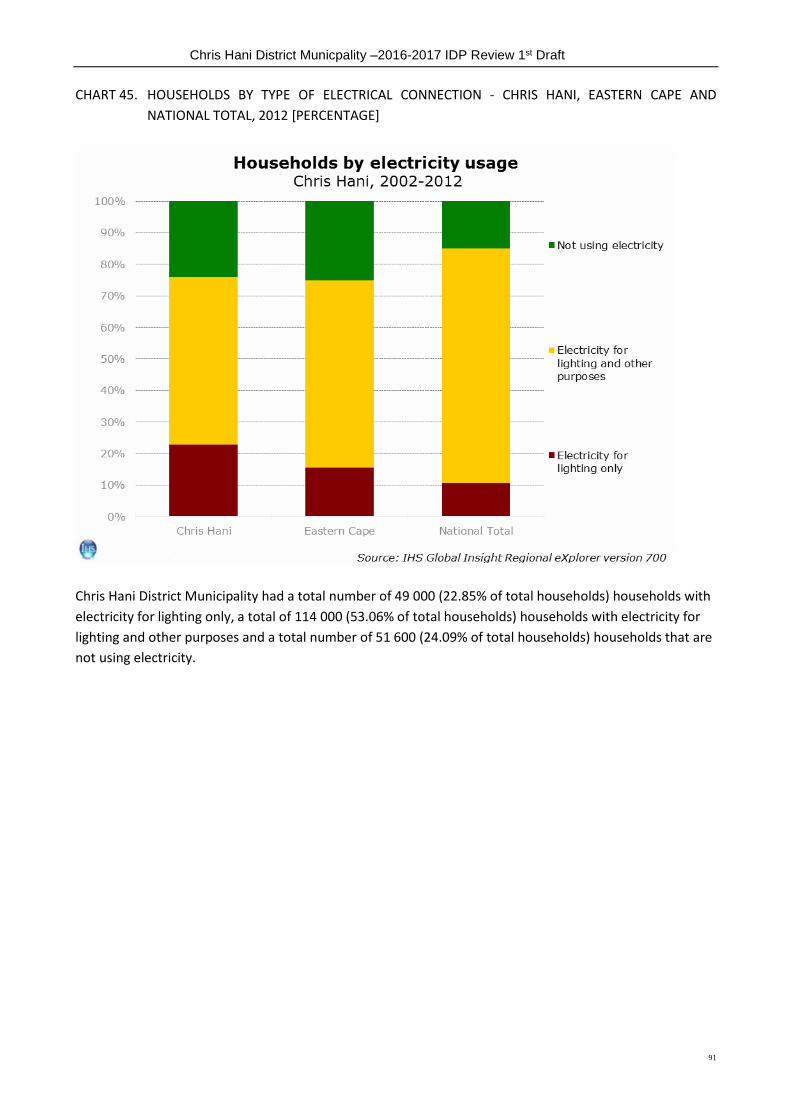
Chris Hani District Municpality –2016-2017 IDP Review 1st Draft
91
CHART 45. HOUSEHOLDS BY TYPE OF ELECTRICAL CONNECTION - CHRIS HANI, EASTERN CAPE AND
NATIONAL TOTAL, 2012 [PERCENTAGE]
Chris Hani District Municipality had a total number of 49 000 (22.85% of total households) households with
electricity for lighting only, a total of 114 000 (53.06% of total households) households with electricity for
lighting and other purposes and a total number of 51 600 (24.09% of total households) households that are
not using electricity.
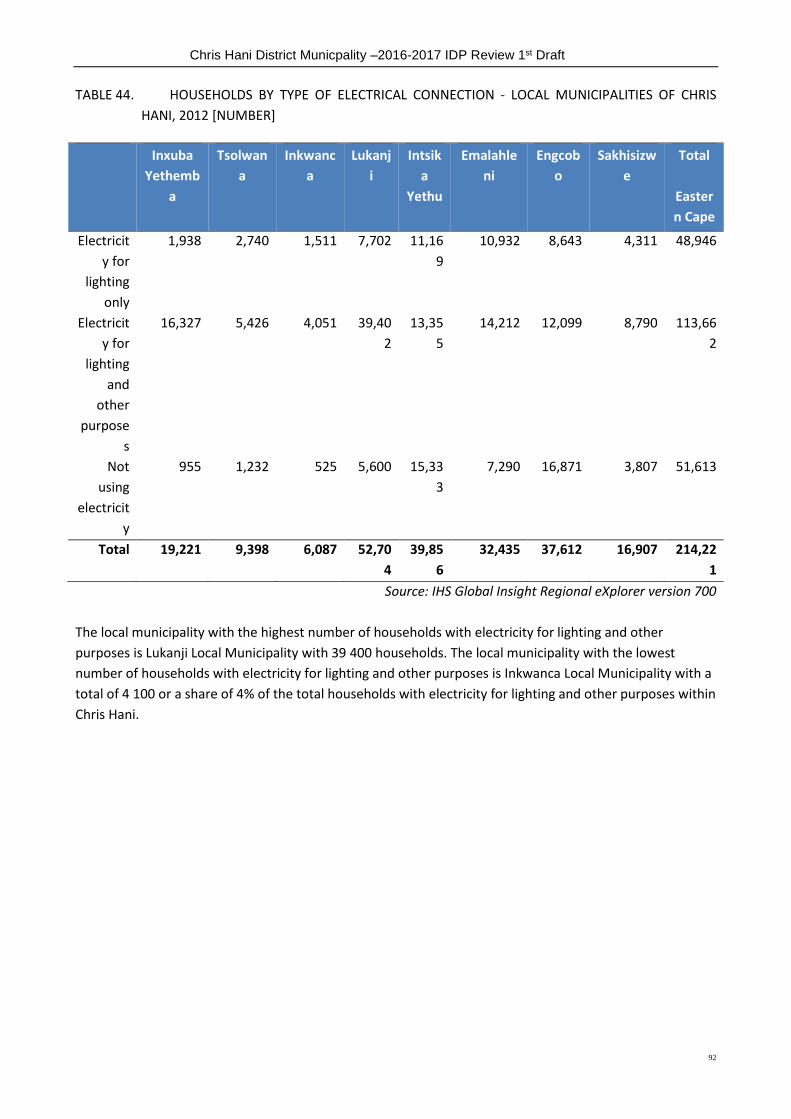
Chris Hani District Municpality –2016-2017 IDP Review 1st Draft
92
TABLE 44. HOUSEHOLDS BY TYPE OF ELECTRICAL CONNECTION - LOCAL MUNICIPALITIES OF CHRIS
HANI, 2012 [NUMBER]
Inxuba
Yethemb
a
Tsolwan
a
Inkwanc
a
Lukanj
i
Intsik
a
Yethu
Emalahle
ni
Engcob
o
Sakhisizw
e
Total
Easter
n Cape
Electricit
y for
lighting
only
1,938 2,740 1,511 7,702 11,16
9
10,932 8,643 4,311 48,946
Electricit
y for
lighting
and
other
purpose
s
16,327 5,426 4,051 39,40
2
13,35
5
14,212 12,099 8,790 113,66
2
Not
using
electricit
y
955 1,232 525 5,600 15,33
3
7,290 16,871 3,807 51,613
Total 19,221 9,398 6,087 52,70
4
39,85
6
32,435 37,612 16,907 214,22
1
Source: IHS Global Insight Regional eXplorer version 700
The local municipality with the highest number of households with electricity for lighting and other
purposes is Lukanji Local Municipality with 39 400 households. The local municipality with the lowest
number of households with electricity for lighting and other purposes is Inkwanca Local Municipality with a
total of 4 100 or a share of 4% of the total households with electricity for lighting and other purposes within
Chris Hani.
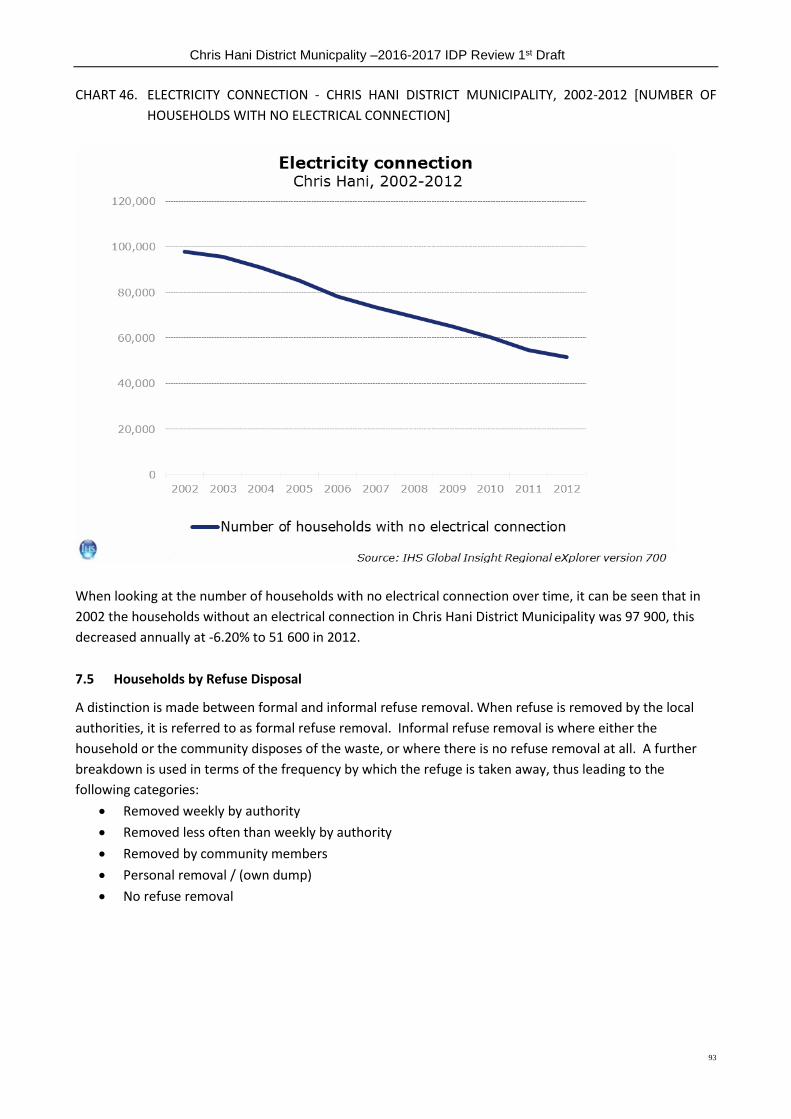
Chris Hani District Municpality –2016-2017 IDP Review 1st Draft
93
CHART 46. ELECTRICITY CONNECTION - CHRIS HANI DISTRICT MUNICIPALITY, 2002-2012 [NUMBER OF
HOUSEHOLDS WITH NO ELECTRICAL CONNECTION]
When looking at the number of households with no electrical connection over time, it can be seen that in
2002 the households without an electrical connection in Chris Hani District Municipality was 97 900, this
decreased annually at -6.20% to 51 600 in 2012.
7.5 Households by Refuse Disposal
A distinction is made between formal and informal refuse removal. When refuse is removed by the local
authorities, it is referred to as formal refuse removal. Informal refuse removal is where either the
household or the community disposes of the waste, or where there is no refuse removal at all. A further
breakdown is used in terms of the frequency by which the refuge is taken away, thus leading to the
following categories:
Removed weekly by authority
Removed less often than weekly by authority
Removed by community members
Personal removal / (own dump)
No refuse removal
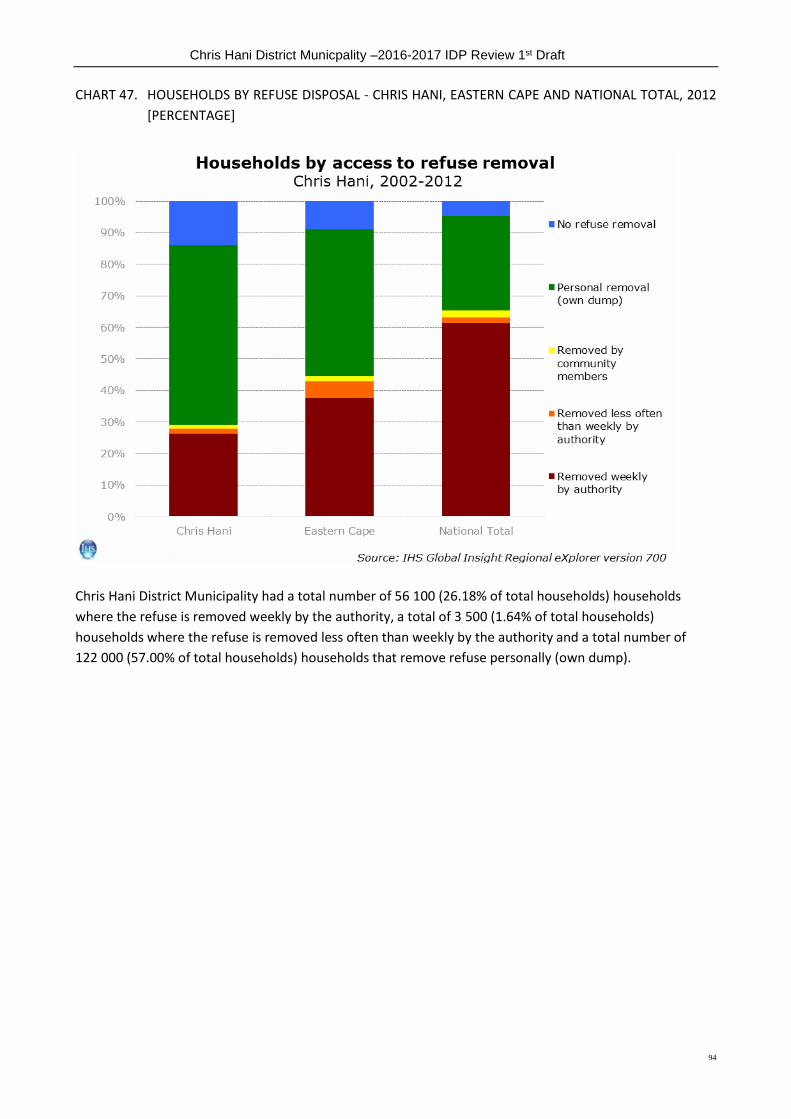
Chris Hani District Municpality –2016-2017 IDP Review 1st Draft
94
CHART 47. HOUSEHOLDS BY REFUSE DISPOSAL - CHRIS HANI, EASTERN CAPE AND NATIONAL TOTAL, 2012
[PERCENTAGE]
Chris Hani District Municipality had a total number of 56 100 (26.18% of total households) households
where the refuse is removed weekly by the authority, a total of 3 500 (1.64% of total households)
households where the refuse is removed less often than weekly by the authority and a total number of
122 000 (57.00% of total households) households that remove refuse personally (own dump).
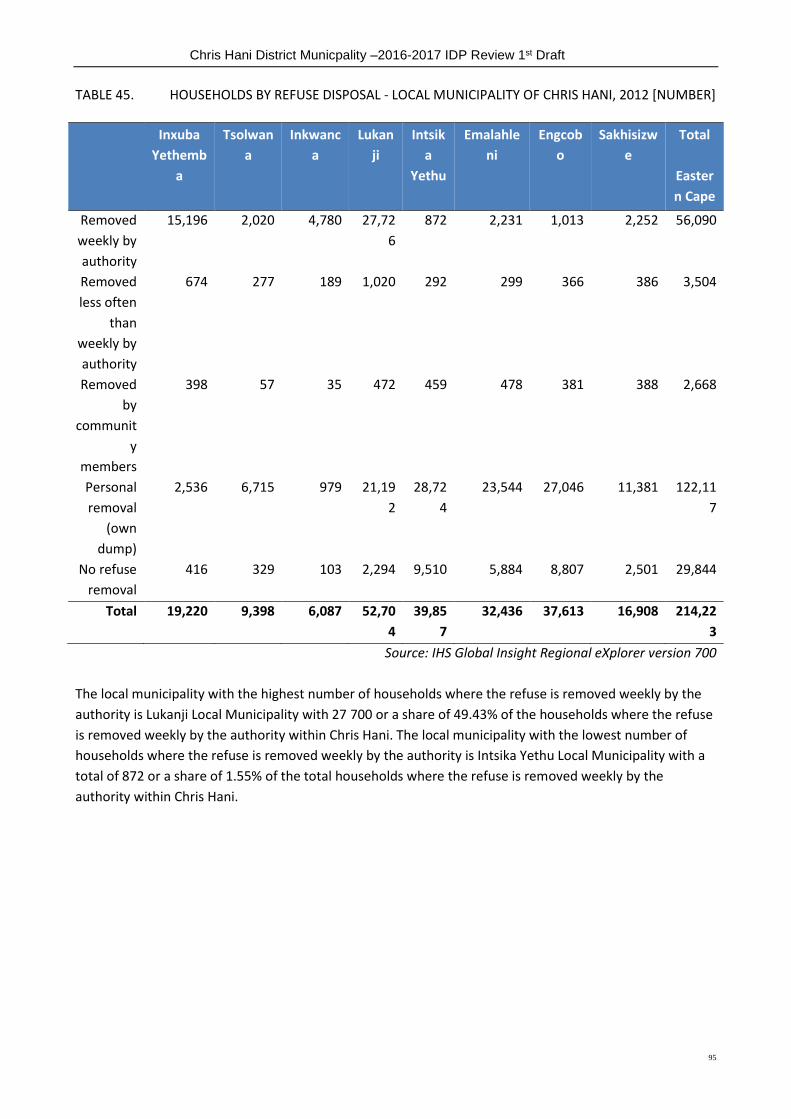
Chris Hani District Municpality –2016-2017 IDP Review 1st Draft
95
TABLE 45. HOUSEHOLDS BY REFUSE DISPOSAL - LOCAL MUNICIPALITY OF CHRIS HANI, 2012 [NUMBER]
Inxuba
Yethemb
a
Tsolwan
a
Inkwanc
a
Lukan
ji
Intsik
a
Yethu
Emalahle
ni
Engcob
o
Sakhisizw
e
Total
Easter
n Cape
Removed
weekly by
authority
15,196 2,020 4,780 27,72
6
872 2,231 1,013 2,252 56,090
Removed
less often
than
weekly by
authority
674 277 189 1,020 292 299 366 386 3,504
Removed
by
communit
y
members
398 57 35 472 459 478 381 388 2,668
Personal
removal
(own
dump)
2,536 6,715 979 21,19
2
28,72
4
23,544 27,046 11,381 122,11
7
No refuse
removal
416 329 103 2,294 9,510 5,884 8,807 2,501 29,844
Total 19,220 9,398 6,087 52,70
4
39,85
7
32,436 37,613 16,908 214,22
3
Source: IHS Global Insight Regional eXplorer version 700
The local municipality with the highest number of households where the refuse is removed weekly by the
authority is Lukanji Local Municipality with 27 700 or a share of 49.43% of the households where the refuse
is removed weekly by the authority within Chris Hani. The local municipality with the lowest number of
households where the refuse is removed weekly by the authority is Intsika Yethu Local Municipality with a
total of 872 or a share of 1.55% of the total households where the refuse is removed weekly by the
authority within Chris Hani.
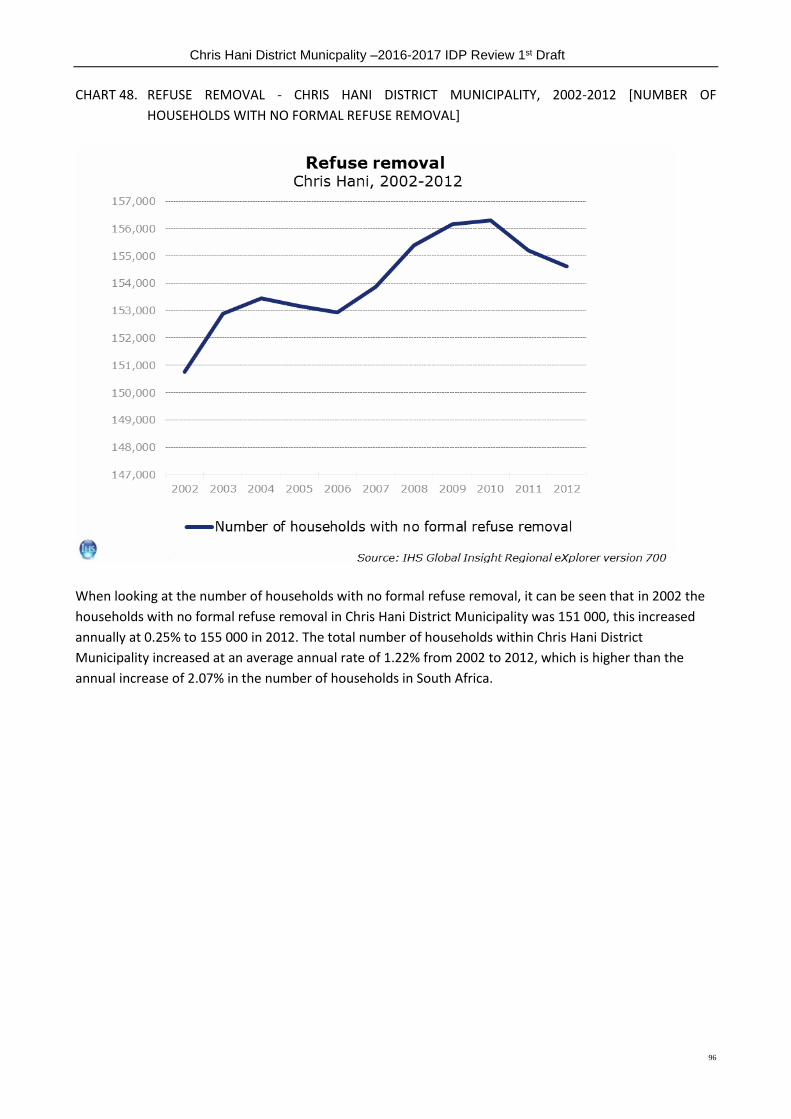
Chris Hani District Municpality –2016-2017 IDP Review 1st Draft
96
CHART 48. REFUSE REMOVAL - CHRIS HANI DISTRICT MUNICIPALITY, 2002-2012 [NUMBER OF
HOUSEHOLDS WITH NO FORMAL REFUSE REMOVAL]
When looking at the number of households with no formal refuse removal, it can be seen that in 2002 the
households with no formal refuse removal in Chris Hani District Municipality was 151 000, this increased
annually at 0.25% to 155 000 in 2012. The total number of households within Chris Hani District
Municipality increased at an average annual rate of 1.22% from 2002 to 2012, which is higher than the
annual increase of 2.07% in the number of households in South Africa.
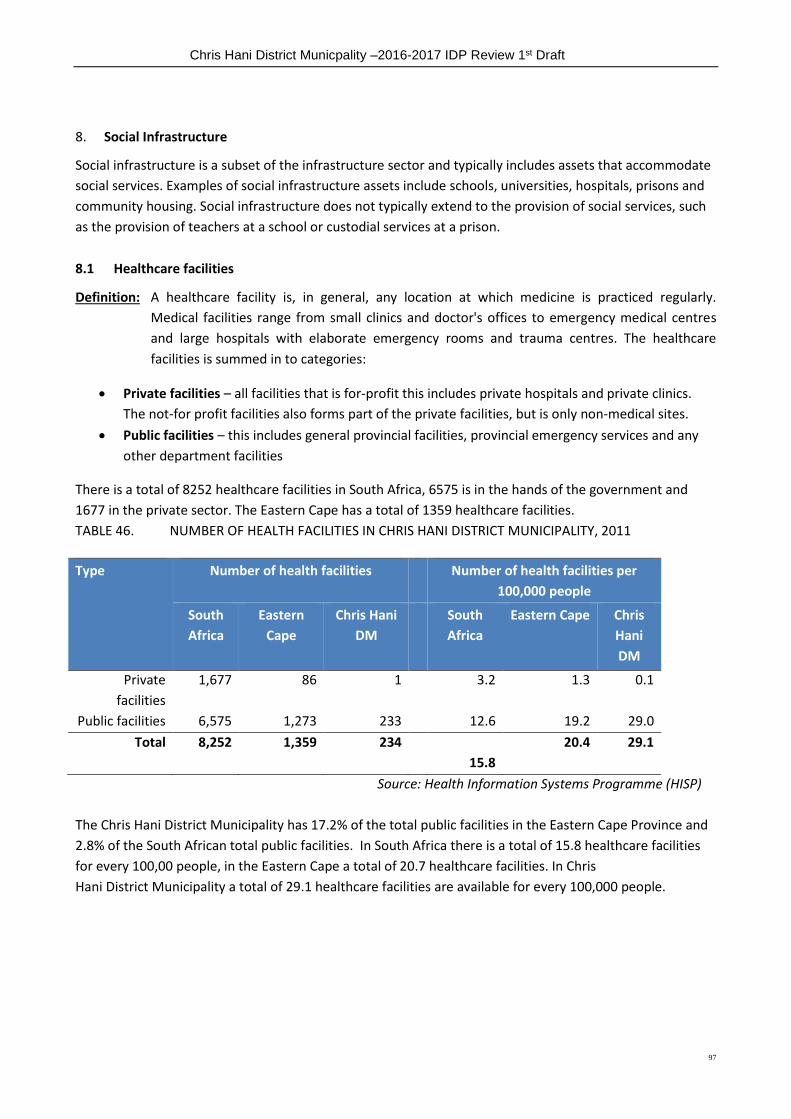
Chris Hani District Municpality –2016-2017 IDP Review 1st Draft
97
8. Social Infrastructure
Social infrastructure is a subset of the infrastructure sector and typically includes assets that accommodate
social services. Examples of social infrastructure assets include schools, universities, hospitals, prisons and
community housing. Social infrastructure does not typically extend to the provision of social services, such
as the provision of teachers at a school or custodial services at a prison.
8.1 Healthcare facilities
Definition: A healthcare facility is, in general, any location at which medicine is practiced regularly.
Medical facilities range from small clinics and doctor's offices to emergency medical centres
and large hospitals with elaborate emergency rooms and trauma centres. The healthcare
facilities is summed in to categories:
Private facilities – all facilities that is for-profit this includes private hospitals and private clinics.
The not-for profit facilities also forms part of the private facilities, but is only non-medical sites.
Public facilities – this includes general provincial facilities, provincial emergency services and any
other department facilities
There is a total of 8252 healthcare facilities in South Africa, 6575 is in the hands of the government and
1677 in the private sector. The Eastern Cape has a total of 1359 healthcare facilities.
TABLE 46. NUMBER OF HEALTH FACILITIES IN CHRIS HANI DISTRICT MUNICIPALITY, 2011
Type Number of health facilities Number of health facilities per
100,000 people
South
Africa
Eastern
Cape
Chris Hani
DM
South
Africa
Eastern Cape Chris
Hani
DM
Private
facilities
1,677 86 1 3.2 1.3 0.1
Public facilities 6,575 1,273 233 12.6 19.2 29.0
Total 8,252 1,359 234
15.8
20.4 29.1
Source: Health Information Systems Programme (HISP)
The Chris Hani District Municipality has 17.2% of the total public facilities in the Eastern Cape Province and
2.8% of the South African total public facilities. In South Africa there is a total of 15.8 healthcare facilities
for every 100,00 people, in the Eastern Cape a total of 20.7 healthcare facilities. In Chris
Hani District Municipality a total of 29.1 healthcare facilities are available for every 100,000 people.
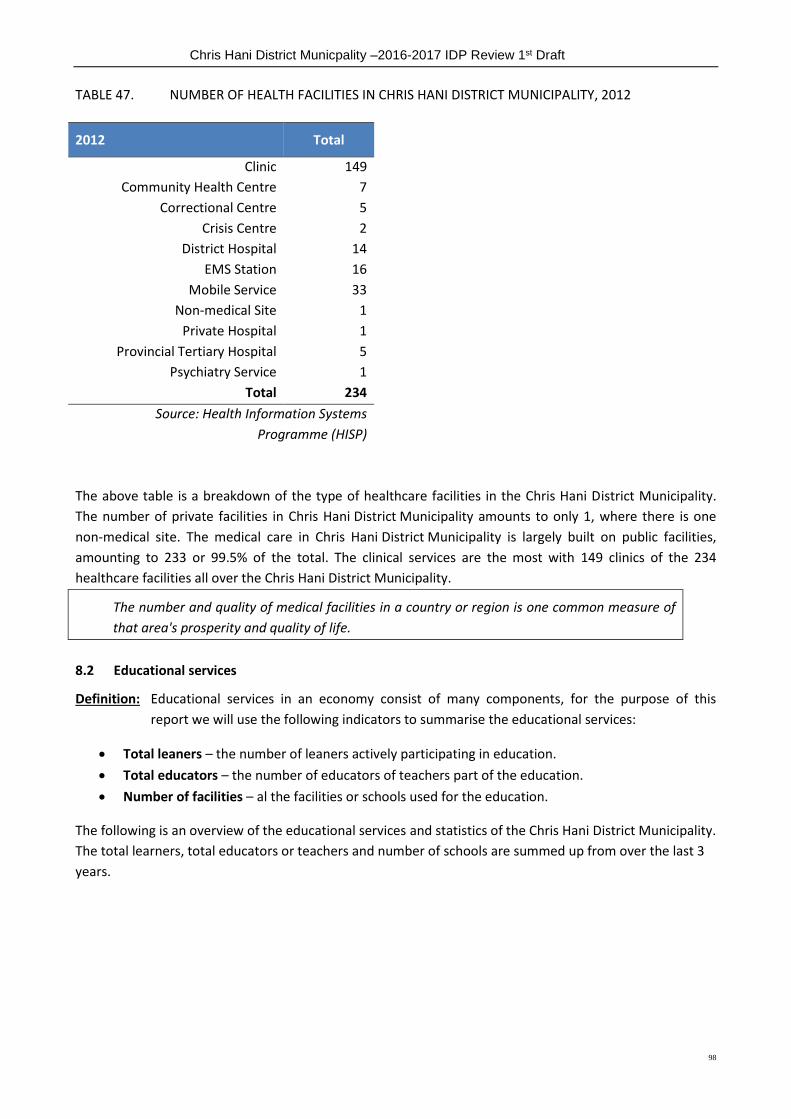
Chris Hani District Municpality –2016-2017 IDP Review 1st Draft
98
TABLE 47. NUMBER OF HEALTH FACILITIES IN CHRIS HANI DISTRICT MUNICIPALITY, 2012
2012 Total
Clinic 149
Community Health Centre 7
Correctional Centre 5
Crisis Centre 2
District Hospital 14
EMS Station 16
Mobile Service 33
Non-medical Site 1
Private Hospital 1
Provincial Tertiary Hospital 5
Psychiatry Service 1
Total 234
Source: Health Information Systems
Programme (HISP)
The above table is a breakdown of the type of healthcare facilities in the Chris Hani District Municipality.
The number of private facilities in Chris Hani District Municipality amounts to only 1, where there is one
non-medical site. The medical care in Chris Hani District Municipality is largely built on public facilities,
amounting to 233 or 99.5% of the total. The clinical services are the most with 149 clinics of the 234
healthcare facilities all over the Chris Hani District Municipality.
The number and quality of medical facilities in a country or region is one common measure of
that area's prosperity and quality of life.
8.2 Educational services
Definition: Educational services in an economy consist of many components, for the purpose of this
report we will use the following indicators to summarise the educational services:
Total leaners – the number of leaners actively participating in education.
Total educators – the number of educators of teachers part of the education.
Number of facilities – al the facilities or schools used for the education.
The following is an overview of the educational services and statistics of the Chris Hani District Municipality.
The total learners, total educators or teachers and number of schools are summed up from over the last 3
years.

Chris Hani District Municpality –2016-2017 IDP Review 1st Draft
99
TABLE 48. EDUCATION INFRASTRUCTURE - LOCAL MUNICIPALITIES OF CHRIS HANI DISTRICT
MUNICIPALITY, 2012
Total Learners Total Educators Number
of
Schools
2010 2011 2012 2010 2011 2012 2012
Emalahleni Local Municipality 43,626 40,814 40,761 1,658 1,642 1,600 180
Engcobo Local Municipality 58,558 55,764 53,969 1,846 1,835 1,796 169
Inkwanca Local Municipality 5,893 5,917 5,980 185 166 177 11
Intsika Yethu Local Municipality 63,996 57,645 54,652 2,443 2,402 2,353 250
Inxuba Yethemba Local
Municipality
15,301 15,479 15,608 523 523 517 46
Lukanji Local Municipality 55,478 53,171 53,544 2,042 2,008 1,980 171
Sakhisizwe Local Municipality 19,906 18,738 18,284 745 724 686 71
Tsolwana Local Municipality 10,696 10,208 10,425 413 386 394 42
Total 273,454 257,736 253,223 9,855 9,686 9,503 940
Source: EMIS - Department of Basic Education
The number of learners in Chris Hani District Municipality amounts to 253 223 in 2012 this decreased with
an average annual rate of 3.77% since 2010. Intsika Yethu Local Municipality decreased the most with an
average annual growth rate of -7.59% since 2010 while Inxuba Yethemba Local Municipality increased the
most with an average annual growth rate of 1.0%

Chris Hani District Municpality –2016-2017 IDP Review 1st Draft
100
9. Tourism
Tourism can be defined as the non-commercial organisation plus operation of vacations and visits to a place
of interest. Whether you visit a relative or friend, travel for business purposes, go on holiday or on medical
and religious trips - these are all included in tourism.
9.1 Trips by purpose of trips
Definition: As defined by the United Nations World Tourism Organisation (UN WTO), a trip refers to
travel, by a person, from the time they leave their usual residence until they return to that
residence. This is usually referred to as a round trip. IHS likes to narrow this definition down to
overnight trips only, and only those made by adult visitors (over 18 years). Also note that the
number of "person" trips are measured, not household or "party trips".
The main purpose for an overnight trip is grouped into these categories:
Leisure / Holiday
Business
Visits to friends and relatives
Other (Medical, Religious, etc.)
TABLE 49. NUMBER OF TRIPS BY PURPOSE OF TRIPS - CHRIS HANI DISTRICT MUNICIPALITY, 2002-2012
[NUMBER & PERCENTAGE]
Leisure /
Holiday
Business Visits to
friends and
relatives
Other (Medical,
Religious, etc)
Total
2002 38,765 27,185 283,803 42,643 392,395
2003 38,347 30,333 325,035 44,891 438,605
2004 33,968 28,277 316,654 42,699 421,598
2005 33,136 25,226 302,285 39,262 399,909
2006 36,327 26,087 311,051 38,197 411,662
2007 43,193 29,062 333,201 40,180 445,636
2008 47,315 29,896 347,744 40,167 465,121
2009 50,775 29,062 370,061 39,528 489,425
2010 46,772 26,764 331,281 37,538 442,356
2011 36,947 23,413 257,171 32,161 349,693
2012 25,024 21,560 197,366 26,667 270,617
Average Annual growth
2002-2012 -4.28% -2.29% -3.57% -4.59% -3.65%
Source: IHS Global Insight Regional eXplorer version 700
In Chris Hani District Municipality, the Business, relative to the other tourism, recorded the highest average
annual growth rate from 2002 (27 200) to 2012 (21 600) at -2.29%. Visits to friends and relatives recorded
the highest number of visits in 2012 at 197 000, with an average annual growth rate of -3.57%. The tourism

Chris Hani District Municpality –2016-2017 IDP Review 1st Draft
101
type that recorded the lowest growth was Other (Medical, Religious, etc) tourism with an average annual
growth rate of -4.59% from 2002 (42 600) to 2012 (26 700).
CHART 49. TRIPS BY PURPOSE OF TRIP - CHRIS HANI DISTRICT MUNICIPALITY, 2012 [PERCENTAGE]
The Visits to friends and relatives at 72.93% has largest share the total tourism within Chris Hani District
Municipality. Other (Medical, Religious, etc) tourism had the second highest share at 9.85%, followed by
Leisure / Holiday tourism at 9.25% and the Business tourism with the smallest share of 7.97% of the total
tourism within Chris Hani District Municipality.
9.2 Origin of Tourists
In the following table, the number of tourists that visited Chris Hani District Municipality from both
domestic origins, as well as those coming from international places, are listed.
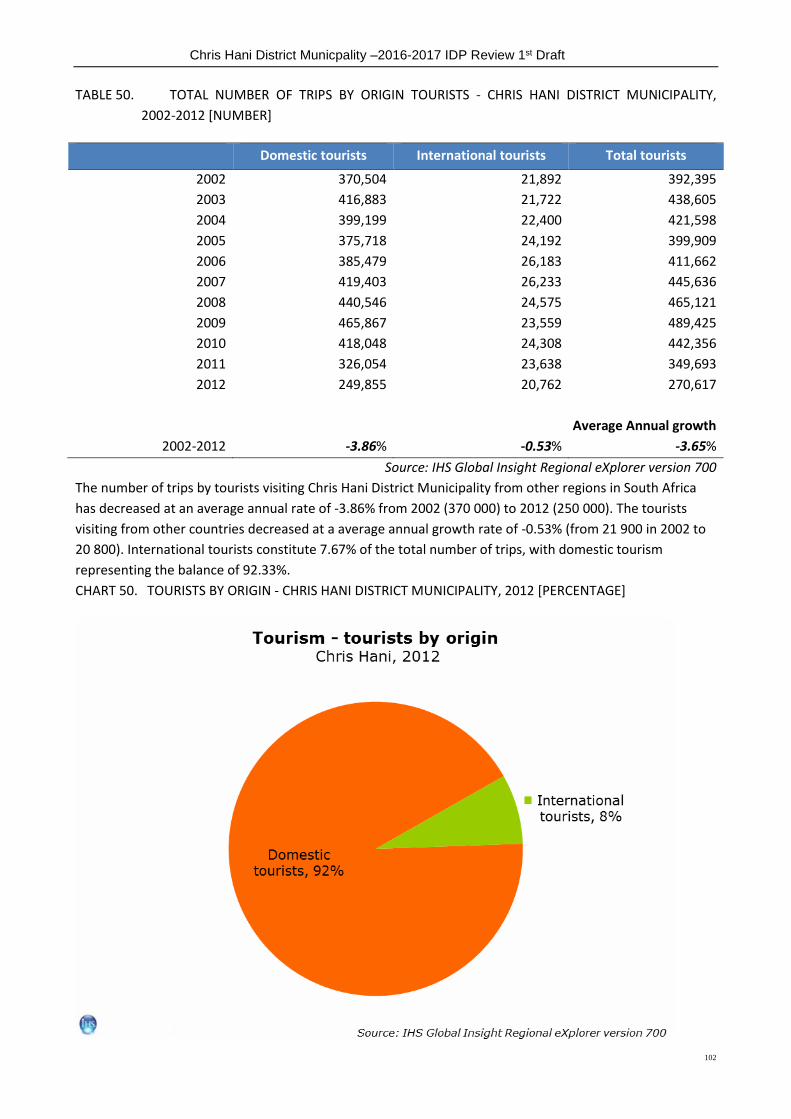
Chris Hani District Municpality –2016-2017 IDP Review 1st Draft
102
TABLE 50. TOTAL NUMBER OF TRIPS BY ORIGIN TOURISTS - CHRIS HANI DISTRICT MUNICIPALITY,
2002-2012 [NUMBER]
Domestic tourists International tourists Total tourists
2002 370,504 21,892 392,395
2003 416,883 21,722 438,605
2004 399,199 22,400 421,598
2005 375,718 24,192 399,909
2006 385,479 26,183 411,662
2007 419,403 26,233 445,636
2008 440,546 24,575 465,121
2009 465,867 23,559 489,425
2010 418,048 24,308 442,356
2011 326,054 23,638 349,693
2012 249,855 20,762 270,617
Average Annual growth
2002-2012 -3.86% -0.53% -3.65%
Source: IHS Global Insight Regional eXplorer version 700
The number of trips by tourists visiting Chris Hani District Municipality from other regions in South Africa
has decreased at an average annual rate of -3.86% from 2002 (370 000) to 2012 (250 000). The tourists
visiting from other countries decreased at a average annual growth rate of -0.53% (from 21 900 in 2002 to
20 800). International tourists constitute 7.67% of the total number of trips, with domestic tourism
representing the balance of 92.33%.
CHART 50. TOURISTS BY ORIGIN - CHRIS HANI DISTRICT MUNICIPALITY, 2012 [PERCENTAGE]

Chris Hani District Municpality –2016-2017 IDP Review 1st Draft
103
9.2.1 Bednights by origin of tourist
Definition: A bed night is the tourism industry measurement of one night away from home on a single
person trip.
The following is a summary of the number of bed nights spent by domestic and international tourist within
Chris Hani District Municipality between 2002 and 2012.
TABLE 51. BEDNIGHTS BY ORIGIN OF TOURIST - CHRIS HANI DISTRICT MUNICIPALITY, 2002-2012
[NUMBER]
Domestic tourists International tourists Total tourists
2002 2,802,162 230,720 3,032,882
2003 3,245,165 228,998 3,474,163
2004 3,059,618 228,871 3,288,489
2005 2,523,968 243,249 2,767,217
2006 2,415,593 269,723 2,685,317
2007 2,593,855 280,615 2,874,470
2008 2,672,914 282,357 2,955,271
2009 2,778,637 282,339 3,060,976
2010 2,648,084 305,054 2,953,138
2011 2,184,138 297,915 2,482,053
2012 1,921,093 242,584 2,163,677
Average Annual growth
2002-2012 -3.70% 0.50% -3.32%
Source: IHS Global Insight Regional eXplorer version 700
From 2012 to 2002, the number of bed nights spent by domestic tourists has decreased at an average
annual rate of -3.70%, while in the same period the international tourists had an average annual increase of
0.50%. The total number of bed nights spent by tourists decreased at an average annual growth rate of -
3.32% from 3.03 million in 2002 to 2.16 million in 2012.

Chris Hani District Municpality –2016-2017 IDP Review 1st Draft
104
CHART 51. GROWTH IN TOURISM (USING BEDNIGHTS) BY ORIGIN - CHRIS HANI DISTRICT MUNICIPALITY,
2002-2012 [NUMBER]
9.3 Tourism spending
Definition: In their Tourism Satellite Account, StatsSA defines tourism spending as all expenditure by
visitors for their trip to the particular region. This excludes capital expenditure as well as the
shopping expenditure of traders (called shuttle trade). The amounts are presented in current
prices, meaning that inflation has not been taken into account.
It is important to note that this type of spending differs from the concept of contribution to GDP. Tourism
spending merely represents a nominal spend of trips made to each region.

Chris Hani District Municpality –2016-2017 IDP Review 1st Draft
105
TABLE 52. TOTAL TOURISM SPENDING - CHRIS HANI, EASTERN CAPE AND NATIONAL TOTAL, 2002-
2012 [R BILLIONS, CURRENT PRICES]
Chris Hani Eastern Cape National Total
2002 0.6 7.5 83.3
2003 0.7 9.2 95.5
2004 0.7 8.9 95.8
2005 0.7 8.9 103.9
2006 0.8 10.6 119.2
2007 1.0 12.6 134.3
2008 1.1 14.5 146.9
2009 1.1 14.6 146.1
2010 1.3 17.0 168.5
2011 1.1 15.2 173.8
2012 1.0 13.6 165.4
Average Annual growth
2002-2012 5.39% 6.11% 7.10%
Source: IHS Global Insight Regional eXplorer version 700
Chris Hani District Municipality had a total tourism spending of R 974 million in 2012 with an average
annual growth rate of 5.4% since 2002 (R 576 million). Eastern Cape Province had a total tourism spending
of R 13.6 billion in 2012 and an average annual growth rate of 6.1%. In terms of growth the Eastern Cape
Province ranks second compared to the other regions. Total spending in South Africa increased from
R 83.3 billion in 2002 to R 165 billion in 2012 at an average annual rate of 7.1%.
9.3.1 Tourism Spend per Resident Capita
Another interesting topic to look at is tourism spending per resident capita. To calculate this, the total
amount of tourism spending in the region is divided by the number of residents living within that region.
This gives a relative indication of how important tourism is for a particular area.
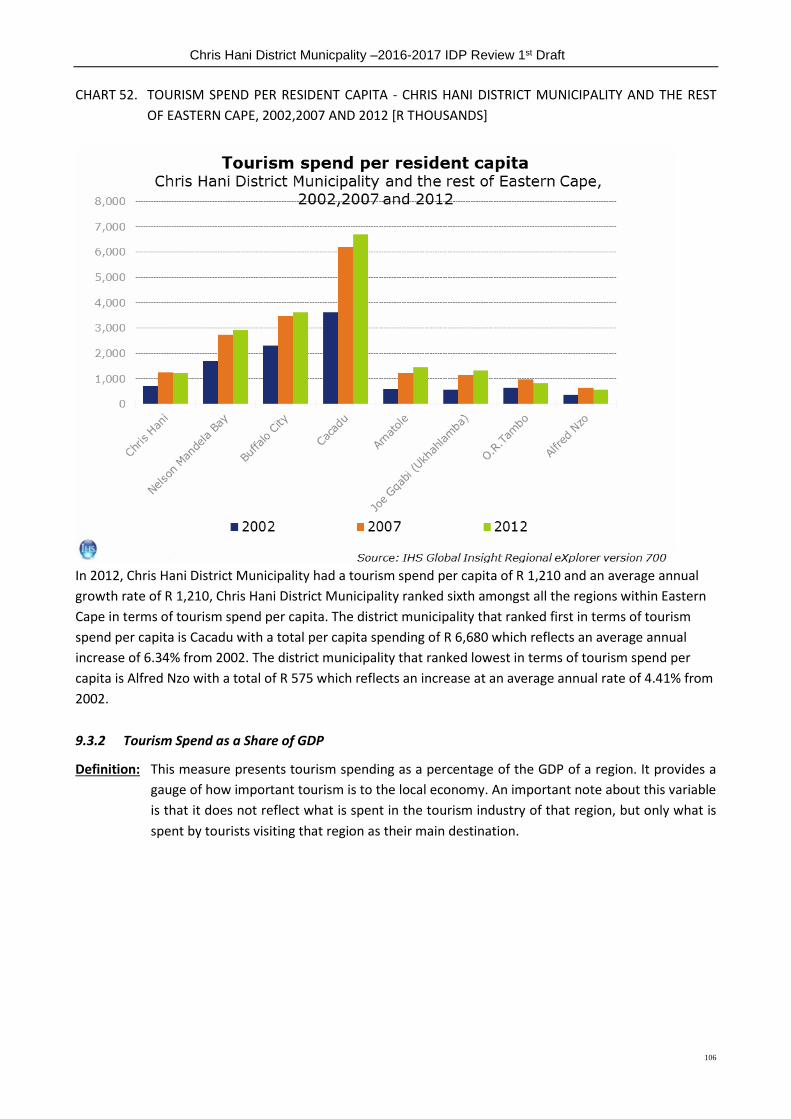
Chris Hani District Municpality –2016-2017 IDP Review 1st Draft
106
CHART 52. TOURISM SPEND PER RESIDENT CAPITA - CHRIS HANI DISTRICT MUNICIPALITY AND THE REST
OF EASTERN CAPE, 2002,2007 AND 2012 [R THOUSANDS]
In 2012, Chris Hani District Municipality had a tourism spend per capita of R 1,210 and an average annual
growth rate of R 1,210, Chris Hani District Municipality ranked sixth amongst all the regions within Eastern
Cape in terms of tourism spend per capita. The district municipality that ranked first in terms of tourism
spend per capita is Cacadu with a total per capita spending of R 6,680 which reflects an average annual
increase of 6.34% from 2002. The district municipality that ranked lowest in terms of tourism spend per
capita is Alfred Nzo with a total of R 575 which reflects an increase at an average annual rate of 4.41% from
2002.
9.3.2 Tourism Spend as a Share of GDP
Definition: This measure presents tourism spending as a percentage of the GDP of a region. It provides a
gauge of how important tourism is to the local economy. An important note about this variable
is that it does not reflect what is spent in the tourism industry of that region, but only what is
spent by tourists visiting that region as their main destination.
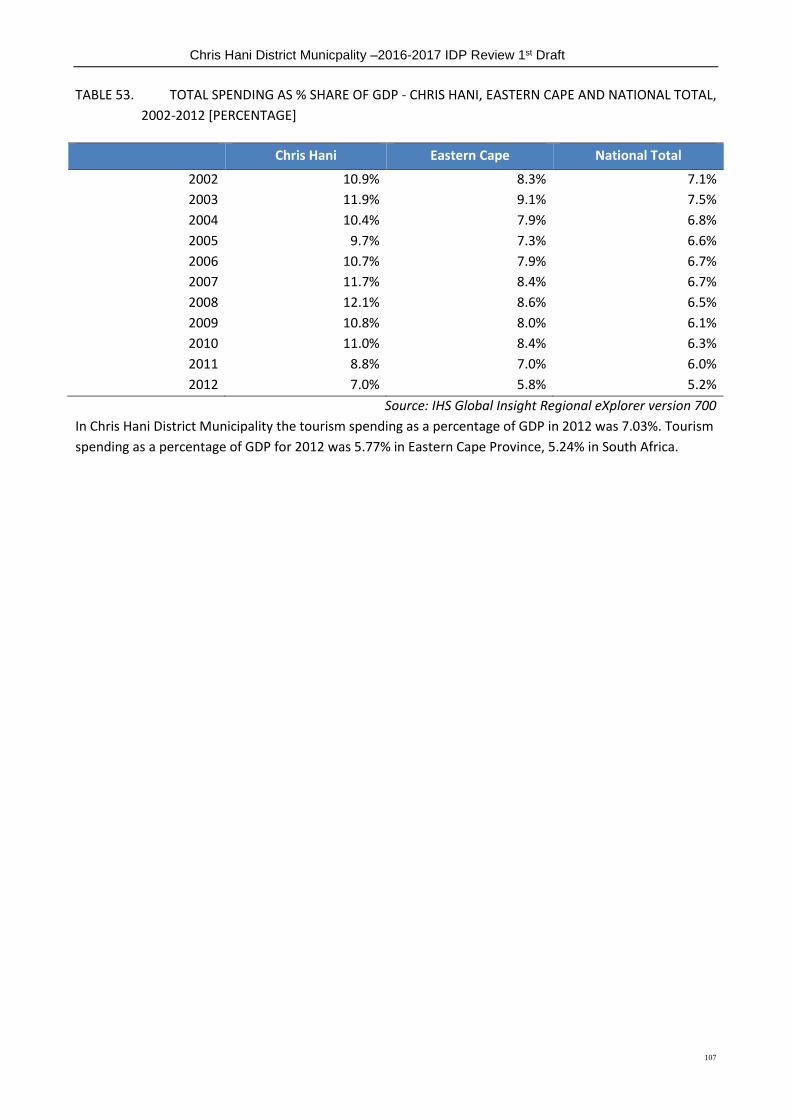
Chris Hani District Municpality –2016-2017 IDP Review 1st Draft
107
TABLE 53. TOTAL SPENDING AS % SHARE OF GDP - CHRIS HANI, EASTERN CAPE AND NATIONAL TOTAL,
2002-2012 [PERCENTAGE]
Chris Hani Eastern Cape National Total
2002 10.9% 8.3% 7.1%
2003 11.9% 9.1% 7.5%
2004 10.4% 7.9% 6.8%
2005 9.7% 7.3% 6.6%
2006 10.7% 7.9% 6.7%
2007 11.7% 8.4% 6.7%
2008 12.1% 8.6% 6.5%
2009 10.8% 8.0% 6.1%
2010 11.0% 8.4% 6.3%
2011 8.8% 7.0% 6.0%
2012 7.0% 5.8% 5.2%
Source: IHS Global Insight Regional eXplorer version 700
In Chris Hani District Municipality the tourism spending as a percentage of GDP in 2012 was 7.03%. Tourism
spending as a percentage of GDP for 2012 was 5.77% in Eastern Cape Province, 5.24% in South Africa.
Chris Hani District Municpality –2016-2017 IDP Review 1st Draft
108
2.4 OVERVIEW OF KEY PERFORMANCE AREAS (KPA)
2.4.1 LOCAL ECONOMIC DEVELOPMENT
2.4.1.1 Introduction
Local economic development (LED) as a concept evolving around economic discipline draws from a range of
academic fields and theories. LED has primarily established itself in the field of economics and regional or
spatial sciences. The field has also been influenced by sociology, political science, business science and to
some extent agricultural sciences. While LED is constantly evolving through trial and error it does revolve
around a number of central ideas or themes that are based on the historic model of Meier (2001). Such
themes include governance, development, economic growth, location, policy and LED strategies and
programmes. Each of the theme's theoretical basis is found in either economics, spatial sciences, sociology,
political science, business science or a combination there-of.
The White Paper on Local Government1 (1998) introduces the concept of “developmental local
government” which is defined as: “Local government committed to working with citizens and groups within
the community to find sustainable ways to meet their social, economic and material needs, and improve
the quality of their lives.” However the same document makes it clear that:
“Local Government is not directly responsible for creating jobs.
Rather, it is responsible for taking active steps to ensure that
the overall economic and social conditions of the locality are
conducive to the creation of employment opportunities.”
Thus, local economic development is about creating a platform and environment to engage stakeholders in
implementing strategies and programmes. The White Paper goes on to state that:
“The powers and functions of local government should be exercised in a way that has a maximum impact on
the social development of communities – in particular meeting the basic needs of the poor – and on the
growth of the local economy.
Development goals therefore primarily focus on ensuring that the community members live a long and healthy life, have access to education and maintain a decent standard of living. While not primarily tasked with employment creation, local government is responsible for ensuring that economic conditions are favourable for economic growth which will lead to employment creation. The robust economic growth experienced in developing counties during the 1990s coincided with strong employment growth.
The National Framework for LED then sets out a clear framework and specific objectives to guide Local
Economic Development.
“LED is the process by which public,
business and NGO sector partners work
collectely to create better conditions for
economic growth and employment
generation. The aim is to improve the
quality of life for all.”
World Bank Definition
Chris Hani District Municpality –2016-2017 IDP Review 1st Draft
109
a. Economic Development Principles
There are various different approaches to local economic development
b. Drivers of economic growth in our province
Our economic development planning is informed partly by the NSDP (National Spatial Development
Perspective) which advocates the following expenditure principles:
Focus economic growth and employment creation in areas where this is most effective and
sustainable as economic growth is a prerequisite for the achievement of other policy
objectives, key among which would be poverty alleviation.
Foster development on the basis of local potential by ensuring that government spending on
fixed investment, beyond the constitutional obligation to provide basic services to all citizens
(such as water, electricity as well as health and educational facilities) is focused on localities
of economic growth and/or economic potential in order to attract private-sector investment,
stimulate sustainable economic activities and/or create long-term employment opportunities.
Address past and current social inequalities by focusing on people not places so that in
localities where there are high levels of poverty and development potential capital
investment expands beyond basic service provision to exploit the potential. In localities with
low development potential, government spending, beyond basic services, should focus on
providing social transfers, human resource development and labour market intelligence to
enable people to become more mobile and migrate, if they choose to, to localities that are
more likely to provide sustainable employment or other economic opportunities.
Overcome the spatial distortions of apartheid by channeling future settlement and economic
development opportunities into activity corridors and nodes that are adjacent to or link the
main growth centres to create regional gateways to the global economy.
The NSDP categorization gives Chris Hani District Municipality low to medium resource potential, low
human need and low economic activity thereby implying that the District should focus on the provision of
basic infrastructure but increase expenditure on social infrastructure and particularly on human resource
development.
The position taken by the Chris Hani Regional Economic Development Strategy is that the government, unless it
expands the public service, does not create jobs and that government’s primary responsibility is to:-
Improve the socio-economic support to prepare people to take up economic opportunities;
continuously improve the enabling environment by minimising red tape and the transaction cost of doing
business, and
Create an enabling environment for new investment as well as the retention and expansion of existing
business.

Chris Hani District Municpality –2016-2017 IDP Review 1st Draft
110
The Provincial Growth and Development Plan (PGDP) advocates the “Systematic eradication of poverty
through a holistic, integrated and multi-dimensional approach to
Pro-poor programming.
Agrarian transformation and strengthening of household food security.
Consolidation, development and diversification of the manufacturing base and tourism
potential”.
These objectives are realised through the support of the three foundation objectives of
infrastructure development, human resource development and public sector and institutional
transformation.
The PGDP goes further to highlight areas of potential developmental activity in the Eastern Cape Provincial
Spatial Development Plan (PSDP) which in the Chris Hani District Municipality are the:
Friendly N6 and Maluti routes
Conservation of Forests in Engcobo Local Municipality
Potential for Coal Mining at Indwe, Emalahleni Local Municipality
Industrial potential of Queenstown
Karoo heartland i.e. Cradock and Middelburg
Potential for Agriculture
The Province has since identified the following High Impact Priority Projects (HIPPs).
Economic growth and Infrastructure cluster.
Infrastructure development
Umzimvubu Catchment Basin
Agricultural beneficiation & forestry
Social Needs Cluster.
Scaling-up Prevention and Treatment of HIV/AIDS
Community Mobilisation Against Crime
Governance and administration Cluster
Strategic skills Project (NSF)
Financial Viability for local government
Planning , monitoring and evaluation
c. Regional Economic Development Strategy in the Chris Hani District Municipality
The CHDM Local and Regional Economic Development Strategy was developed in 2009, the Strategy was
reviewed and adopted by Council in the 2013/14 financial year , through an intensive consultative process
with the participation of key stakeholders from the public and private sectors and civil society informed by
current agreements, District, Provincial and National policy positions and plans, and relevant legislation.The
strategy is supposed to be reviewed bi-annually so as to conform to changing circumstances. Particular
emphasis has been placed in the 2006 Growth and Development Summit (GDS) agreement in the
formulation of this strategy. The strategy acknowledges our rural situation and therefore advocates for
promotion of rural urban equity in infrastructure development, services expansion and stimulation of
economic opportunities. In an attempt to follow up and give the way forward on the resolutions of both the
Chris Hani District Municipality’s Growth and Development Summit, as well as Water and Rural
Development Summit , the Agricultural Indaba was held on the 24th and 25th of February 2011.

Chris Hani District Municpality –2016-2017 IDP Review 1st Draft
111
Amongst other things, the Indaba sought to facilitate a set of solutions to improve planning and
coordination that would result in a vibrant agricultural sector in the district. CHREDS has to further
incorporate the SEZ Concept which the district has followed.
The Chris Hani District Municipality developed and adopted a District Development Agenda that focuses on
the development of all its 8 local municipalities through the identification of competitive advantages of its
local municipalities. This was later translated into an Agro Industrial Plan that has been used as a spring
board to the proposed Special Economic Zone. As part of that process the Coega Development Corporation
was commissioned to conduct a feasibility study to ensure that the future plans, productive capacity and
economies of scale of each LM are properly captured and articulated to inform the establishment of the
clusters. Further to the above attempts towards the advancement of the Agrarian and Rural Development
in the region, Chris Hani District Municipality has adopted a “Developmental Agenda” that seeks to guide
development in its area of jurisdiction. This explained by a slide below and covers the eight local
municipalities within the district.
To further emphase the importance economic development the institution held an Investment summit by
May 2013 which was focussintg on ensuring measurable economic growth and creation of a substantial
number of jobs in the CHDM area.
Chris Hani Special Economic Zone
Local Beneficiation is the cornerstone of the Agenda
Water Infrastructure backlogs must be eradicated
Energy Security needs to be addressed
Transport Linkages needs to be maximised
Engcobo
Crop Production
Forestry Emalahleni
Coal Mining
Tourism
Sakhisizwe
Crop Production
Livestock Improvement
Intsika Yethu
Crop Production
Irrigation Schemes
Tsolwana
Tourism
Game Reserves
Inxuba-Yethemba
Bio-Fuels
Heritage Tourism
Lukhanji
Industrialisation
Regional Economic Hub
Inkwanca
Tourism
Industrial expansion
Developmental agenda/5 priority areas
Resource mobilisation is a key determinant
Practical IGR must be made non-negotiable
Institutional Capacity needs to be enhanced
Research and Planning must be the base
Communicating the Agenda must be prioritised
5 Priority areas of Govt
I. Creation of decent work and
sustainable livelihoods
II. Education
III. Health
IV. Rural development, food
security and land reform
V. Fight against crime and
corruption
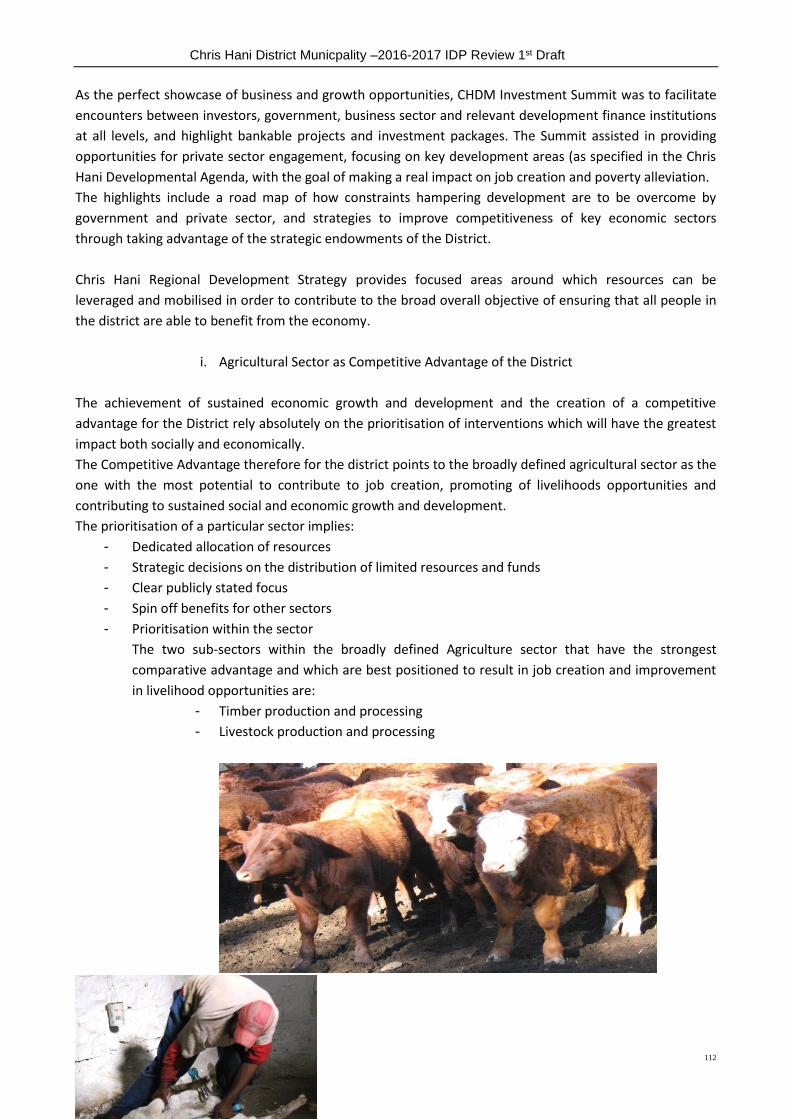
Chris Hani District Municpality –2016-2017 IDP Review 1st Draft
112
As the perfect showcase of business and growth opportunities, CHDM Investment Summit was to facilitate
encounters between investors, government, business sector and relevant development finance institutions
at all levels, and highlight bankable projects and investment packages. The Summit assisted in providing
opportunities for private sector engagement, focusing on key development areas (as specified in the Chris
Hani Developmental Agenda, with the goal of making a real impact on job creation and poverty alleviation.
The highlights include a road map of how constraints hampering development are to be overcome by
government and private sector, and strategies to improve competitiveness of key economic sectors
through taking advantage of the strategic endowments of the District.
Chris Hani Regional Development Strategy provides focused areas around which resources can be
leveraged and mobilised in order to contribute to the broad overall objective of ensuring that all people in
the district are able to benefit from the economy.
i. Agricultural Sector as Competitive Advantage of the District
The achievement of sustained economic growth and development and the creation of a competitive
advantage for the District rely absolutely on the prioritisation of interventions which will have the greatest
impact both socially and economically.
The Competitive Advantage therefore for the district points to the broadly defined agricultural sector as the
one with the most potential to contribute to job creation, promoting of livelihoods opportunities and
contributing to sustained social and economic growth and development.
The prioritisation of a particular sector implies:
- Dedicated allocation of resources
- Strategic decisions on the distribution of limited resources and funds
- Clear publicly stated focus
- Spin off benefits for other sectors
- Prioritisation within the sector
The two sub-sectors within the broadly defined Agriculture sector that have the strongest
comparative advantage and which are best positioned to result in job creation and improvement
in livelihood opportunities are:
- Timber production and processing
- Livestock production and processing
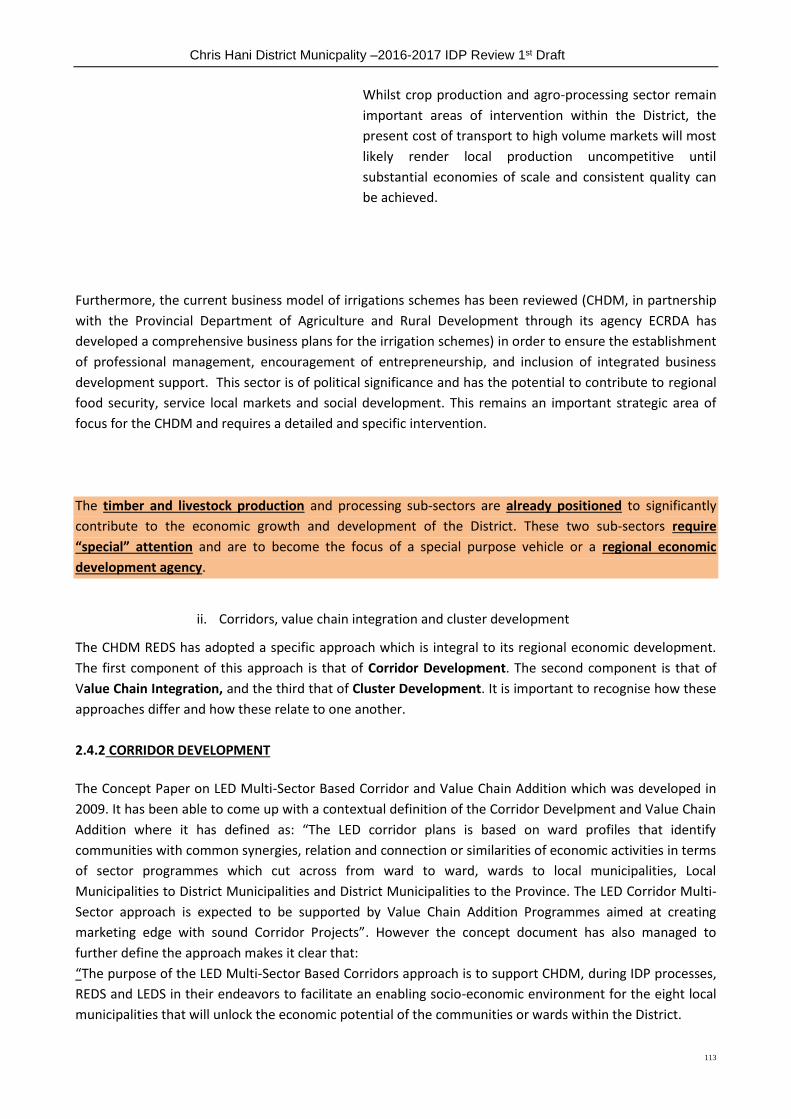
Chris Hani District Municpality –2016-2017 IDP Review 1st Draft
113
Whilst crop production and agro-processing sector remain
important areas of intervention within the District, the
present cost of transport to high volume markets will most
likely render local production uncompetitive until
substantial economies of scale and consistent quality can
be achieved.
Furthermore, the current business model of irrigations schemes has been reviewed (CHDM, in partnership
with the Provincial Department of Agriculture and Rural Development through its agency ECRDA has
developed a comprehensive business plans for the irrigation schemes) in order to ensure the establishment
of professional management, encouragement of entrepreneurship, and inclusion of integrated business
development support. This sector is of political significance and has the potential to contribute to regional
food security, service local markets and social development. This remains an important strategic area of
focus for the CHDM and requires a detailed and specific intervention.
The timber and livestock production and processing sub-sectors are already positioned to significantly
contribute to the economic growth and development of the District. These two sub-sectors require
“special” attention and are to become the focus of a special purpose vehicle or a regional economic
development agency.
ii. Corridors, value chain integration and cluster development
The CHDM REDS has adopted a specific approach which is integral to its regional economic development.
The first component of this approach is that of Corridor Development. The second component is that of
Value Chain Integration, and the third that of Cluster Development. It is important to recognise how these
approaches differ and how these relate to one another.
2.4.2 CORRIDOR DEVELOPMENT
The Concept Paper on LED Multi-Sector Based Corridor and Value Chain Addition which was developed in
2009. It has been able to come up with a contextual definition of the Corridor Develpment and Value Chain
Addition where it has defined as: “The LED corridor plans is based on ward profiles that identify
communities with common synergies, relation and connection or similarities of economic activities in terms
of sector programmes which cut across from ward to ward, wards to local municipalities, Local
Municipalities to District Municipalities and District Municipalities to the Province. The LED Corridor Multi-
Sector approach is expected to be supported by Value Chain Addition Programmes aimed at creating
marketing edge with sound Corridor Projects”. However the concept document has also managed to
further define the approach makes it clear that:
“The purpose of the LED Multi-Sector Based Corridors approach is to support CHDM, during IDP processes,
REDS and LEDS in their endeavors to facilitate an enabling socio-economic environment for the eight local
municipalities that will unlock the economic potential of the communities or wards within the District.

Chris Hani District Municpality –2016-2017 IDP Review 1st Draft
114
This will go a long way in income generation and job creation, premised on changing the lives of the citizens
for better.”
CHDM is committed to a corridor development approach. Integral to this approach is a focus on geographic
and spatial initiatives and interventions which link the node towns and small towns surrounding these
nodes in an integrated economic development process. Small town regeneration initiatives are central to
this approach.
The Walter Sisulu (East) Corridor outlined in brown on the map below runs along the R 61 and links
Ngcobo, Cofimvaba and Tsomo to Queenstown. The Bathandwa Ndondo (North-East) Corridor links Elliot,
Cala and Lady Frere to Queenstown. The Calata (West) Corridor links Middelburg to Cradock along the N10
and then links Cradock, Tarkastad to Queenstown along the R61. The Friendly N6 (North –South) corridor
links Whittelsea to Queenstown and Molteno.
One of the main objectives of the corridor development approach is to ensure integration and alignment of
economic development plans with spatial development plans, land use plans, infrastructure development
plans and other relevant sector plans. It allows CHDM to implement a wide range of generic and routine
LED initiatives, whilst simultaneously focusing on the defined area of strategic differentiation and the
concept of value chain integration.
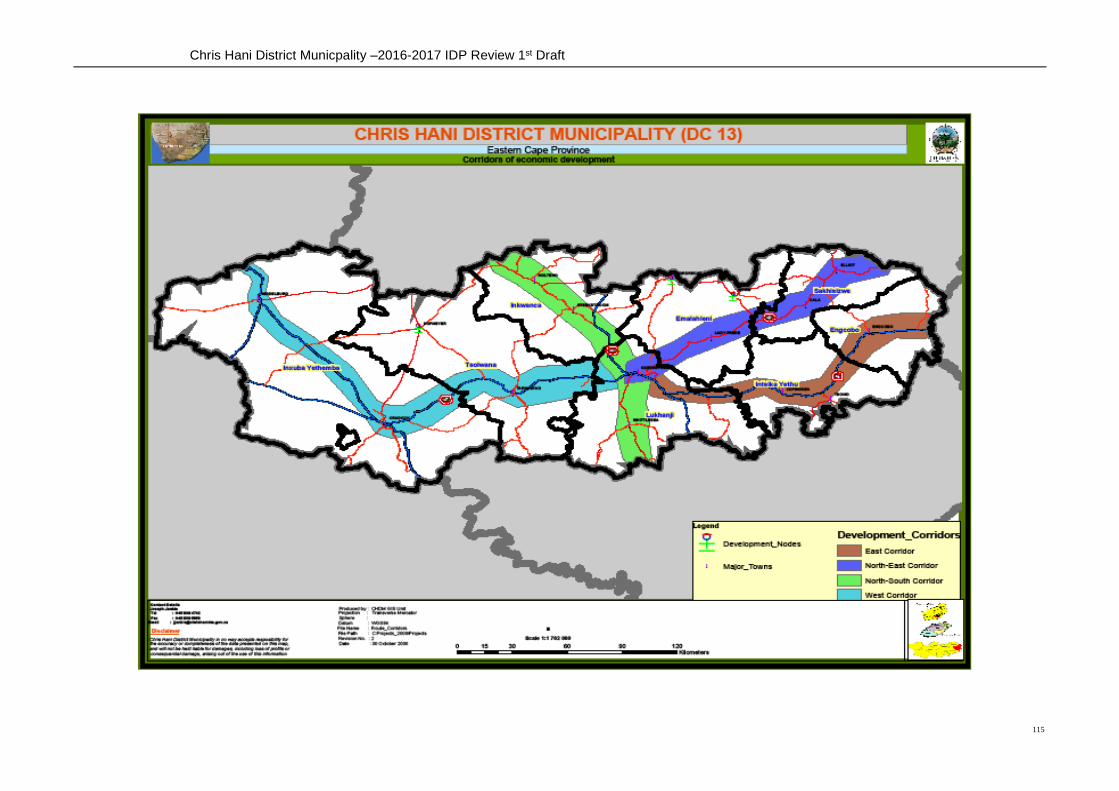
Chris Hani District Municpality –2016-2017 IDP Review 1st Draft
115

Chris Hani District Municpality –2016-2017 IDP Review 1st Draft
116
2.4.2.1 Value Chain Integration
Value chain integration implies looking at all the components of a particular sector and
subsector and identifying what can be done or put in place to add value to what already exists,
and in doing so, promote job creation and provide more livelihood opportunities.
The timber production value chain is predominantly located within the North Eastern Corridor
and the North West Corridor. Timber value adding activities are predominantly located in
Queenstown, with potential for early gaps in the value chain (e.g. sawmills, treatment,
processing of waste, etc) to be strengthened and/or established within towns along the two
defined corridors.
The livestock value chain extends across all corridors in the District, with particular points of
focus around the strengthening / establishment of strategically located public goods
investments (e.g. abattoirs, tanneries and other value adding facilities.
Value chain analysis can be used to identify “gaps” in a locality or along a corridor in order to
make strategic decisions about what interventions to implement (or what not to implement).
The value chain integration approach is particularly important in the development of a
competitive advantage for the district and in the understanding of the need to make strategic
decisions to allow the district to competitively position itself nationally and globally. Choices
then arise as to whether to focus on trying to develop all the components of all the value
chains or to focus on part of those value chains where one has a comparative advantage with
the most potential to be converted into a competitive advantage.
2.4.2.2 Cluster Development
In order to build a regionally or globally competitive position it is necessary to determine in
which part of each value chain one can compete and then relentlessly cluster in all the
resources, competencies and technology that will be demanded from everyone who can add
value or influence moving forward to achieving the strategic intent.The cluster approach to
develop focused and strategically located value chains may well provide the momentum
needed to begin the rebuilding and rejuvenating of small towns within these municipalities.
2.4.3 Facilitation of Economic Development
The overall responsibility for the facilitation of economic development lies with the District
Municipality. The key issues as identified by the REDS were identified through a consultative
process include:
i. Building on sector specific comparative advantages
ii. Creation of an enabling environment
iii. Corridor development
iv. Regular, mandatory and opportune economic development functions

Chris Hani District Municpality –2016-2017 IDP Review 1st Draft
117
2.4.4 SMALL MEDIUM AND MICRO ENTERPRISES
A Stats-SA Survey (March 2001) found that about 9% (209 000) of all businesses in SA, mostly
black or PDI are in the Eastern Cape. The survey further uncovered that women entrepreneurs
in the EC outnumbered men by almost three to one in the province – a figure well above the
national average. The survey’s findings also confirmed that of the 209 000 small businesses,
126 000 were based in rural areas of the Eastern Cape (Programme of Support for LED in the
Eastern Cape, 2004).
Small and medium enterprises have a significant contribution (collectively 29%) to the
provincial economy as opposed to informal and micro businesses (collectively 6%) in the
Eastern Cape. The same scenario prevails in terms of employment contribution by both the
small and medium-sized enterprises (collectively 37%).
Estimates suggest that there could well be more than 30 000 small business operators. The
majority of businesses are owner-managed or sole proprietors with few business partnerships
particularly in the rural areas (ECMAC Database 2005). However, there has been an increase in
the number of cooperatives being established as part of government’s drive to promote the
cooperatives movement. More than 50% of the small businesses have been in existence for
more than 5 years which demonstrates resilience by local enterprises.
More than half of the enterprises are in the trade sector, followed by community, social and
personal services sector businesses. Catering and accommodation represents a third sector
with a relatively high level of commercial activity in terms of district entrepreneurship.
Few enterprises are involved in commercial agriculture despite the numerous agriculturally
based poverty alleviation projects being supported by the ISRDP programme. The majority of
businesses fall within the micro and small business categories in terms of turnover levels and
employ an average of 7.5% employees (Local Business Enabling Environment Study 2007).37%
of business owners are between the age group of 30 – 39 years with those under 30-years only
making 13% of local businesses (Local Business Enabling Environment Study 2007).
2.4.4.1 The SMME business environment within Chris Hani
As depicted on the situationa analysis of the district, In general the area lacks business support
services as business people have to either travel to Queenstown or outside the municipal area
to access business support services. Lukhanji has the most developed business environment as
the area is the main urban centre of the district and its primary economic node.

Chris Hani District Municpality –2016-2017 IDP Review 1st Draft
118
SMMEs face a swathe of constraints related to the legal and regulatory environment; market
access; access to finance and suitable business premises; the acquisition of skills and
managerial expertise; access to appropriate resources and technology; the quality of
infrastructure, especially in poverty and rural areas; bureaucratic hurdles; and in some cases,
the tax regime (Annual Small Business Review, 2001). The District developed its own SMME
Development Strategy in 2007 in an attempt to address the mentioned constraints which was
last reviewed in 2010. The SMME Strategy is being developed from stratch as we feel it does
not addreass the current issues of the area and will be adopted by council within 2014-2015
financial years.
The District’s Growth and Development Summit (GDS) held in 2006 was a historic milestone to
strengthen private-public dialogue and commitment to a shared pro-poor economic and
investment growth path for the district. One of the key and relevant resolutions taken at the
GDS relate to the establishment of a fully representative district-wide business forum, with
various local business forums in each local municipality set up to allow dialogue between the
public and private sectors that would act as a single interface to lobby advice and partner
government to further common course. To further strengthen the GDS the municipality is
planning to conduct the follow up session on GDS resolution taken so as to track commitments
make. The Chris Hani District Business Forum has been established as that structure with seven
local business forums out of the eight local municipalities in the District.
The government identified the development of cooperatives as one of its flagship programmes
to develop the second economy that supports the majority of the population in as far as
creating jobs, increasing household income, reducing poverty, and improving the overall
standard of living is concerned. It was for this reason that the District actively supported and
facilitated the establishment of the Chris Hani District Cooperative Forum in November 2008
and by extension the eight local cooperative forums that exist in the district. The District also
assisted with strong financial support in the coordination of a three day cooperative indaba
that was held in June 2009. The indaba was characterized by interactive seminars and
commissions on a variety of subjects affecting the development of cooperatives. The
cooperatives were also exposed to a variety of funding, procurement, marketing, networking
and other opportunitiesiety.
The SMME and Cooperatives Business Development programmes were created to, among
other things, promote the development of sustainable SMMEs and Cooperatives, thereby
increasing the number and variety of economic enterprises operating in the formal economy
and to create jobs. To this end, R2 425 494.00 was granted to SMMEs and cooperatives and
376 jobs were created during the period 2011/12 and 2012/13 financial years (2 years).
The Chris Hani District Municipality (CHDM) has partnered with the Metropolitan SMME Portal
which is involved in the development of SMMEs. This organization has hosted annual SMME
business imbizos in the district since 2009. The District sees these Business Imbizos as an
opportunity to showcase the existing opportunities, while further capitalising on network
vehicles to unleash the economic potential of the District. Through information dissemination
at various fora, the District is ably positioned to promote strategic support to the business
fraternity under its jurisdiction. These SMME Portal Business Imbizos have been portrayed as
a vehicle that promotes dialogue between business and government, the private sector,
parastatals and linking SMMEs to opportunities and development agencies.

Chris Hani District Municpality –2016-2017 IDP Review 1st Draft
119
The CHDM has always viewed itself as an important node to synergising, coordinating, and
aligning with various actors who invest and contribute in other ways to business development
efforts. This is the main reason for CHDM’s participation in these Imbizos. It is hoped that the
Imbizos, amongst other things, will address the poor economic activity within the District. They
will also assist in strengthening the skills and business structures of the SMMEs, allowing them
to become sustainable and in a better position to tender on private sector and public sector
contracts.
CHDM together with the Border Kei Chamber of Business got into a joint initiative in late 2009
to establish the Chris Hani Enterprise Propeller (CHEP) with financial support from Thina
Sinako. This came after the realization that in the District more than R2.5 billion is spent
annually on goods and services but 80% of this amount is estimated to be leaving the District.
This is due to the fact that local suppliers, possibly, do not have the relevant skills or are
inadequately capacitated to successfully aply for tenders. CHEP is there to support emerging
and eastablished enterprises in the District to compete more effectively for tenders by
providing them with quality business advice, information and mentoring services, and
facilitating more effective linkages between them.
2.4.5 AGRICULTURAL DEVELOPMENT
Agriculture forms one of the key potential growth sectors in the CHDM. The Integrated
Agricultural Strategy was developed in 2008 and due to some development was further
reviewed and to be adopted by council before end of the current financial year 2016/2017. It
prioritised the following sectors for investment:
Agro – processing e.g. cheese production
Livestock farming particularly Goats and Cattle
High Value crop producton e.g. hydroponics and bio-fuels
Advantage of Irrigation schemes
Livestock farming is an important source of income for both commercial and communal
farming. The western part of the region is increasingly turning to game farming especially in
the areas around Queenstown, Cradock, Tarkastad and Molteno. The District Municipality has
engaged in partnerships with National Wool Growers Association (NWGA) to improve the
quality of wool sheep, develop wool growers associations, train farmers on livestock and veld
management and build appropriate infrastructure such as shearing sheds and fences. In the
past financial year a number of Shearing sheds were built and completed at Intsika Yethu LM,
Lukhanji and Engcobo municipalities.
Further partnerships with the Agricultural Research Council and Department of Agriculture and
Rural Development have resulted in the construction of livestock handling facilities. ASGISA-EC
(ECRDA) and TEBA Development are assisting with development of the livestock improvement
programme by introducing the concept of Village Link Persons (VLPs) where community
members received training in livestock handling and treatment, in certain areas where
infrastructure is in good condition animals are introduced with the main aim of improving
livestock quality (goats , sheep and cattle ) , quality rams and provision of veterinary services.
Chris Hani District Municpality –2016-2017 IDP Review 1st Draft
120
The District Municipality has in the past financial year formed partnership with Zulukama
Investment Trust , a community owned organisation with the main aim of improving livestock
quality in 5 Villages in Hewu area.The programme was planned to run for a long period as the
affected Institutions are expected to provide after care support.
The greatest challenge to livestock production remains lowskills level, access to land, poor veld
and livestock management, limited access to market, limited access to financial and credit
access by emerging farmers due in part to insecure land tenure, limited mentoring and
information from DoA and dilapidated and insufficient infrastructure such as roads, fencing,
stock dams and dipping tanks.
Dryland cropping is only feasible in small parts of CHDM within the Intsika Yethu, Sakhisizwe
and Engcobo municipalities. The District Municipality in collaboration with both the DARD and
Emalahleni Local Municipality is involved in the Sorghum production programme in Emalahleni
LM the main aim of this undertaking is to provide adequate raw material to the Mill Plant so as
to maintain the project sustainability, DoA have prioritised these areas under the Massive
Food Programme. The Siyazondla homestead food production programme assists with
improving household food security. Under High Value Crop Production, the DM supported the
pilot project for Hazel Nuts production at Glenbrook irrigation, partnering with ECDC and an
Italian Company. The project was initiated by Agrisudafrica and Eastern Cape Development
Corporation (ECDC) as a Community Development Project with contributions by various other
role players including the Department of Agriculture and Rural Development (DARD).
The project is a pilot project for the evaluation of hazelnut production viability in the area with
added value in the form of a successful vegetable business and training programme.
There is presently 8000 ha under irrigation with CHDM containing two of the largest irrigation
schemes in the Eastern Cape i.e. Ncora and Qamata. A further 7600 ha could be placed under
irrigation if the large Gariep Transfer Project were to be implemented. However there are vast
areas of underutilised land within the existing schemes such as Shiloh where only 40% of the
scheme is currently utilised. In addition to these schemes there are several large scale
commercial farming enterprises.
Any future irrigation development must consider the recommendations from the District’s
WSDP (Water Services Development Plan) that CHDM should not consider developing any
more irrigation schemes apart from the already established schemes and must look at other
methods of irrigation such as drip irrigation which ensure that water evaporation is minimised.
CHDM and Department of Rural Development and Agrarian Reforms have prioritised irrigation
schemes under their respective revitalisation and resuscitation programmes. Their
collaborative efforts are focussed towards attracting investors to run the schemes under
private, public partnerships.
Chris Hani District Municpality –2016-2017 IDP Review 1st Draft
121
Funding has been provided for setting up the correct institutions to run the schemes, building
of lay dams, centre pivots and irrigation systems, upgrading of office facilities, seed, planting
and harvesting operations as well as equipment such as tractors, ploughs and trailers.
However due to the complex community structures residing within the schemes, the effort of
the District and its partners has not yet resulted in independent and financially sustainable
irrigation schemes although considerable progress has occurred.
There is a clear development approach being followed by CHDM and DARD in developing the
irrigation schemes. The developments have started at Shiloh Irrigation Scheme (where a Dairy
Enterprise has been established). The CHDM and DARD have co-funded the project in the
2009/10 financial year. The focus for 2010/11 & 2012-2013 financial year was on developing
Ncora Irrigation Scheme. The focus for the 2013-2014 was on Qamata and Bilatye Irrigation
Schemes. CHDM and DARD are also facilitating the development of comprehensive business
plans (commissioned by ASGISA-EC now called ECRDA) for Ncora, Qamata and Bilatye Irrigation
Scheme. The plans will assist in directing future developments in the schemes.
2.4.6 FORESTRY, TIMBER AND WOOD PRODUCTION
The Chris Hani District Municipality is richly endowed with a number of forest plantation
resources. Most of these forest plantations are found in Intsika Yethu and Engcobo Local
Municipalities and are owned by DAFF. There are also some woodlots and few hectors of
category A plantations (Pine stands) in Sakhisizwe Municipality. The Forestry development in
the district is informed by the Regional Development Strategy which highlights matters around
forestry. Forestry Strategy has been developed for the first time as the area has potential and
rich in forestry,Timber and Wood production, a service provider has been commissioned to
develop the strategy and this was finalized by financial year 2014-2015 financial year and has
yet to be adopted by June 2015.
Despite the existence of raw material, land for aforestation and market opportunities, the forestry sector in Chris Hani District Municipality remained uninspiring, with very little significance to and impact on the economy of the region. In order to address this and to take advantage of a number of opportunities that the sector presents, specifically in relation to SMME promotion and community empowerment , Chris Hani Municipality and the Local Municipalities have prioritized forestry as one of the sectors that are key to economic development of the region. The Wood Cluster programme was then proposed in the 2003-2004 financial year.
The situational analysis of the forest plantations and woodlots in Chris Hani District Municipality revealed that their management is poor. The operational costs of the forest plantations and woodlots far outweigh the income generated by these plantations. This, in other words, means that these forests are operated at a loss. The quality that is produced is not good. In order to address these issues, the strategy with the following components was proposed:
o Proper management of forest plantations
o Value adding processes.
o Investment promotion
o Meaningful empowerment of communities
Chris Hani District Municpality –2016-2017 IDP Review 1st Draft
122
o Continued monitoring and evaluation of the process to address the problem areas.
o Capacitation of the existing small sawmillers
The DTI co-funded the Sawmill project for the implementation plan development. A challenge
of inadequate supply of raw material for this project is being investigated. The DTI conducted a
special study on the sawmillers around Chris Hani on aspects of productivity, yields, issues of
safety, technology and skills. Through the study it has been discovered that there is a need for
skills development and technology upgrading to improve the productivity and
competitiveness.
Since the DTI is starting a National Training Programme on small-scale sawmilling, the district
municipality has been chosen as a pilot. The dti approached SEDA to conduct training for the
Sawmillers on Co-operatives core principles and Business plan development. Training started
in May 2010. SEDA is assisting on the registration of the sawmillers as primary Co-operatives.
A skills development programme was conducted by Forestry SETA at Engcobo charcoal project.
The training started on 01 March 2010. The SETA introduced a New Venture Creation project
(Business skills development programme). The CHDM has also piloted the project at Lukhanji
Local Municipality since March 2010.
A number of projects were identified as the key pillars of the Forestry Strategy. Interventions in the form of feasibility studies, business plan development, skills development, workshops and establishment of Project steering committee have all been the build up to the implementation of the Chris Hani Forestry strategy, which together with the business plan were endorsed by the Council.
The local Municipalities have been consulted and brought on board in terms of the projects identified for their areas and programme to unfold in respect of the implementation of the projects. Project beneficiaries and other relevant stakeholders have been brought on board and roles and responsibilities are outlined on individual projects. Suppliers of services and products for the implementation of the projects have also been identified and some already approached to commence delivery. The projects that were identified are as follows:
o Sawmill project o Aforestation programme o Pole treatment plant o Engcobo Charcoal Manufacturing project o Sakhisizwe Charcoal manufacturing project o Tree Nursery Project
Current progress on Charcoal Projects:
(a) Engcobo Charcoal Manufacturing project : Project has been registered as Spring Forest Trading cc.Two charcoal kilns have been installed,
fencing of the site is still in progress, offices, stores and ablution structures have been ordered.

Chris Hani District Municpality –2016-2017 IDP Review 1st Draft
123
Project is operational as from 09 February 2009. 32 people are employed (Beneficiaries) and 1
project coordinator employed on 6 months contract for infrastructural development and skills
transfer. Sasol has been brought on board to assist on market identification, skills
development and value-chain establishment. Charcoal tests were done by SASOL and the
results were 82% complient. Training for the beneficiaries was conducted by the Forestry SETA
on Charcoal production.
( b) Sakhisizwe Charcoal Manufacturing Project The project has been started in August 2010. The purpose of the project is to fight alien
vegetation. This in turn creates job opportunities through the Charcoal project. The Sakhisizwe
project is still on the initial stages. It is not as fully functional as in the case of Engcobo project.
However, the project will take the same form of Engcobo project in terms of operation and
institutional arrangements.
2.4.7 CONSTRUCTION AND COAL MINING
The District has a high development profile in terms of the ISRDP nodal status. Its high
infrastructure budget allocation presents opportunities for the establishment of a local
construction industry and may enhance competitiveness by addressing critical shortcomings in
economic infrastructure. The strong growth and development in public housing and
construction comes with a huge demand for construction material such as clay and cement
bricks. At present illegal brick making activities are prevalent throughout the district mainly to
fulfill the demand of private construction needs. Due to low quality and illegal operations,
these bricks cannot be used for public sector construction.
The PGDP has identified coal mining at Indwe and Molteno as a HIPPS project which is at
Emalahleni Local Municipality. The exploitation of the Molteno/Indwe coalfields is currently
being investigated to access their viability. A public private partnership company has been
established with Elitheni. Prospective rights for the Indwe Coal Mines have begun and the
results look promising. By 2008 the site was set up for the first blast and currently the coal is
shipped to countries like Brazil. Coal Mining is doing very as currently it has employed 149
people.
2.4.8 MANUFACTURING
Manufacturing represents a significant proportion of the CHDM economy at 8 % GGP and 5 %
employment. Lukhanji municipality especially Queenstown has a small furniture, dairy
processing and wood products industry and operates as the prime manufacturing centre of the
District. Middelburg and Cradock have food processing activities. Manufacturing mainly takes
place in Queenstown and the major activities are furniture making, food processing and
pressed metal. The three biggest employers in Queenstown are manufacturers’ viz. Seating,
Twizza, Crickley Dairy and Stateline Pressed Metal. Other manufacturing industries are biltong
processing, cheese making, Ouma rusks, leather processing and bone meal production.

Chris Hani District Municpality –2016-2017 IDP Review 1st Draft
124
2.4.9 AGRO-PROCESSING
While the districts’ agricultural potential is obvious, primary agricultural projects have had a
minimal impact on unemployment. This situation necessitates strategies to increase value-
added production by exploiting opportunities that exist along the various crop and livestock
value chains.
Particular advantages lie in food-processing based on resource and crop availability, existing
factory infrastructure, as well as relatively well developed road infrastructure when compared
to other rural districts.
The bulk of the districts’ farm output goes for processing outside the district e.g. milk, beef,
wool, fruit etc which regulates the district to the bottom of the value chain. Opportunities exist
in food-processing especially in the areas on convenience food, specialty foods and organic
foods. Beside food –processing the District can promote high value crops such as cotton as
well as bio-diesel.
Bio Fuel Development at Cradock
Bio-diesel iniatives present huge opportunities especially around the existing sugar-beet
project near Cradock where Sugarbeet SA, Central energy Funds and the IDC have entered into
a partnership that will see 6000ha of sugarbeet planted, construction of Ethanol production
plant and buying of the ethanol by PetroSA to blend into their stock. It is estimated that this
project will create up to 2000 temporary jobs and 500 permanent jobs only in the Ethanol
plant construction phase.
The economy of the Eastern Cape Province is poised for re-engineering, revival and vibrancy
now that the R2 Billion Cradock bio fuel plant construction has been put into process by the
government departments responsible for this national pilot project. This bio fuel project is
developed under the auspices of the Industrial Development Corporation (IDC), Department of
Trade and Industry (DTI) and Department of Rural Development and Land Reform (DRDLR).
The last is playing a leading role and is providing the needed land where the required sorghum
and sugar beet will be growth. The agriculture leg of this project is that it will have as its
spinoff the development of livestock in the CHDM region and adjacent farming towns because
the bio fuel farms will also produce animal feed that will be used to develop quality beef
cattle- a process that will bolster the red meat industry of the province. The sleepy town of
Cradock is set for a re-awakening. There will be jobs and opportunities to establish businesses
for the local people. The Cradock bio fuel project is set to revive the economy of the Eastern
Cape in that it will re-activate all sectors of the economy of this motor province.The multi-
million rand Cradock bio fuel plant is a catalyst for industrial revolution in the Eastern Cape and
hence lifted by the President of RSA and Premier of Eastern Cape as one of projects to be
funded and looked into.
Trade and Services
Trade and services contributes in total between 16 % to the District GGP in 2000 and 22 %
employment in 2004. The majorities of SMME’s are found in the retail and service sector
(73%). It is the predominant form of economic activity in CHDM.

Chris Hani District Municpality –2016-2017 IDP Review 1st Draft
125
2.4.10 TOURISM & LIBERATION HERITAGE DEVELOPMENT
The CHDM has a rich history and natural resources that can promote tourism development in
the region. These resources are untapped and are not adequately budgeted for within the
District and local municipalities. The District has access to a number of major routes, the
friendly N6 and the N10 which link the District with East London, Bloemfontein and Port
Elizabeth and the R61 linking Queenstown with Mthatha and the Wild Coast.The region’s
emergence as a malaria free game farming and nature reserve location has contributed to
tourism revenue, a trend that looks set to continue. The growth of this sector may crowd in
private sector investment and support the emergence of supporting industry and services.
The District offers a variety of tourism experiences ranging from wildlife (MT. Zebra National
Park game, game or nature reserves, game farm etc); Adventure activities e.g. Fish River Canoe
Marathon, Hiking trails, abseiling, Fishing etc.: Historical buildings, battle s sites, Rock Art,
Anglo- Boer War Memorials to Liberation Struggle Icons i.e. Chris Hani, Vuyisile Mini, Cradock
Four, Walter Sisulu, DR AB. XuMa, Rev. James Calata etc.
The CHDM Tourism Integrated Master Plan as adopted by council in 2012/13 and cites that
Chris Hani District Municipality has a total of 204 tourist accommodation establishments,
providing 3,409 tourist beds.
Using the total number of beds and the average occupancy of the accommodation aggregated
from the individual Tourism Sector Plans, the total number of tourist bednights sold per
annum (calculated for the over 2008/9 year) is calculated to be 339,810 (see table below), at
an overall average bed occupancy of 27.31%.

Chris Hani District Municpality –2016-2017 IDP Review 1st Draft
126
Accommodation Type Number of
Beds in Chris
Hani
Average bed
occupancy in
Chris Hani
Bednights Sold
per annum
2007/8
Backpacker & Hostelling 0 0.00% 0
Bed & Breakfast 819 37.79% 112,973
Guest houses & Guest farms 1187 30.60% 132,595
Country House 47 25.32% 4,344
Hotels 298 18.06% 19,640
Lodge 294 17.83% 19,133
Self-Catering 332 23.12% 28,021
Caravan parks and camping sites 432 14.65% 23,105
TOTAL 3,409 27.31% 339,810
(Compiled by Kyle Business Projects)
CHRIS HANI DISTRICT MUNICIPALITY TOURIST
ACCOMMODATION OCCUPANCIES & BEDNIGHTS SOLD
The average bed occupancies of the different types of accommodation in the Chris Hani
District Municipality, and the derived total number of bednights sold per annum for 2009/10.
The average bed occupancies are calculated as a weighted average of the bed occupancies in
each Local Municipality. Adetailed analysis of tourism has been presented above.
Economic Impact of Tourism The economic value of tourism to the Chris Hani area is derived from the direct spend of
tourists in the area, and from the jobs supported by tourism.The direct contribution to GDP is
calculated from the total tourist bed nights sold in the area, and the average daily spend of
tourist. From this data, the projected economic impact of tourism is calculated using the
international simulated Tourism Satellite Accounting (TSA) system developed by the World
Travel & Tourism Council / Accenture, in conformance with the conceptual structure of the
WTO/UN TSA. This model calculates the economic impact of tourism on a geographic economy
using the basic direct spend of tourists into the tourism industry, and a system of economic
multipliers which define how that direct spend recirculates in the economy.
In the model used in the current study, current TSA multipliers are calculated from the WTTC /
Accenture 2007 Report on South Africa. From this base, the economic impact of tourism in the
Chris Hani District Municipality has been calculated over the forecast period 2008 to 2016, and
is shown in Figure 1, Figure 2, Figure 3, Figure 4, and Figure 5. The potential growth of these
economic contributions is also calculated, in four scenarios: Expected natural growth in
demand – this growth is driven by the anticipated growth in tourism demand in the Eastern
Cape (i.e. the baseline); Impact of additional 1% growth in demand; Impact of additional 3%
growth in demand; Impact of additional 5% growth in demand.
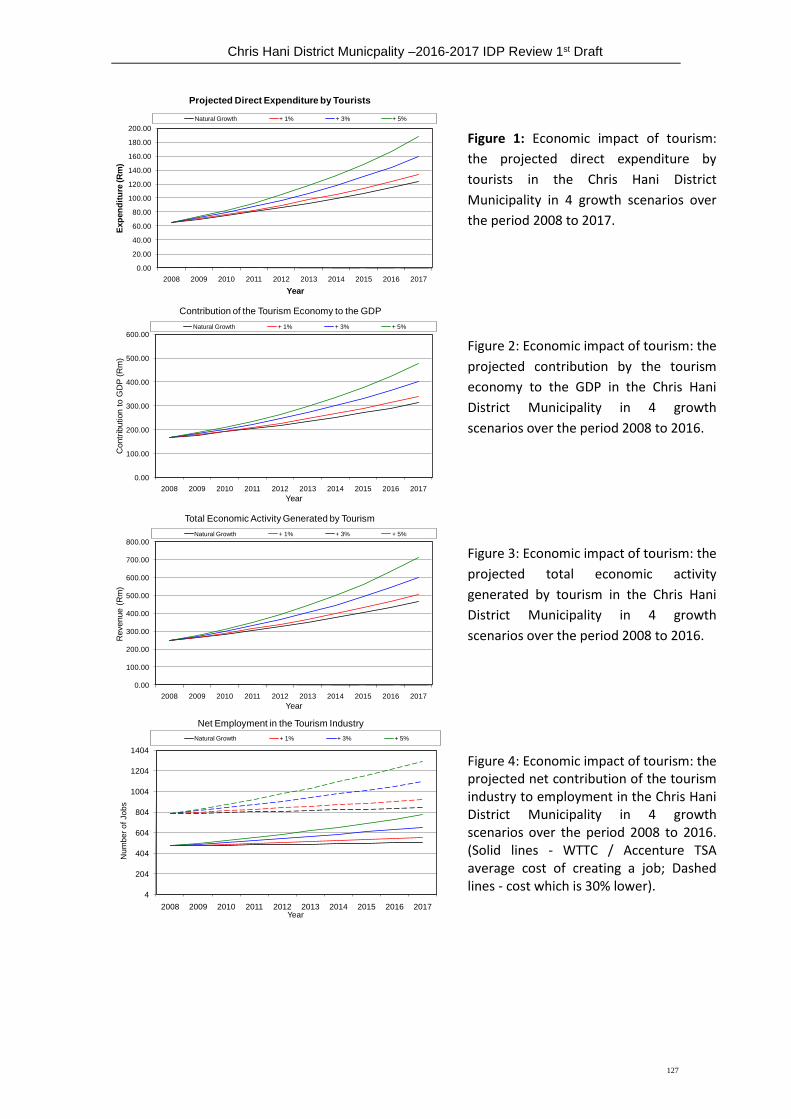
Chris Hani District Municpality –2016-2017 IDP Review 1st Draft
127
0.00
20.00
40.00
60.00
80.00
100.00
120.00
140.00
160.00
180.00
200.00
2008 2009 2010 2011 2012 2013 2014 2015 2016 2017
Exp
en
dit
ure
(R
m)
Year
Projected Direct Expenditure by Tourists
Natural Growth + 1% + 3% + 5%
Figure 1: Economic impact of tourism:
the projected direct expenditure by
tourists in the Chris Hani District
Municipality in 4 growth scenarios over
the period 2008 to 2017.
0.00
100.00
200.00
300.00
400.00
500.00
600.00
2008 2009 2010 2011 2012 2013 2014 2015 2016 2017
Contr
ibution t
o G
DP
(R
m)
Year
Contribution of the Tourism Economy to the GDP
Natural Growth + 1% + 3% + 5%
Figure 2: Economic impact of tourism: the
projected contribution by the tourism
economy to the GDP in the Chris Hani
District Municipality in 4 growth
scenarios over the period 2008 to 2016.
0.00
100.00
200.00
300.00
400.00
500.00
600.00
700.00
800.00
2008 2009 2010 2011 2012 2013 2014 2015 2016 2017
Revenue (
Rm
)
Year
Total Economic Activity Generated by Tourism
Natural Growth + 1% + 3% + 5%
Figure 3: Economic impact of tourism: the
projected total economic activity
generated by tourism in the Chris Hani
District Municipality in 4 growth
scenarios over the period 2008 to 2016.
4
204
404
604
804
1004
1204
1404
2008 2009 2010 2011 2012 2013 2014 2015 2016 2017
Nu
mb
er
of
Jo
bs
Year
Net Employment in the Tourism Industry
Natural Growth + 1% + 3% + 5%
Figure 4: Economic impact of tourism: the projected net contribution of the tourism industry to employment in the Chris Hani District Municipality in 4 growth scenarios over the period 2008 to 2016. (Solid lines - WTTC / Accenture TSA average cost of creating a job; Dashed lines - cost which is 30% lower).
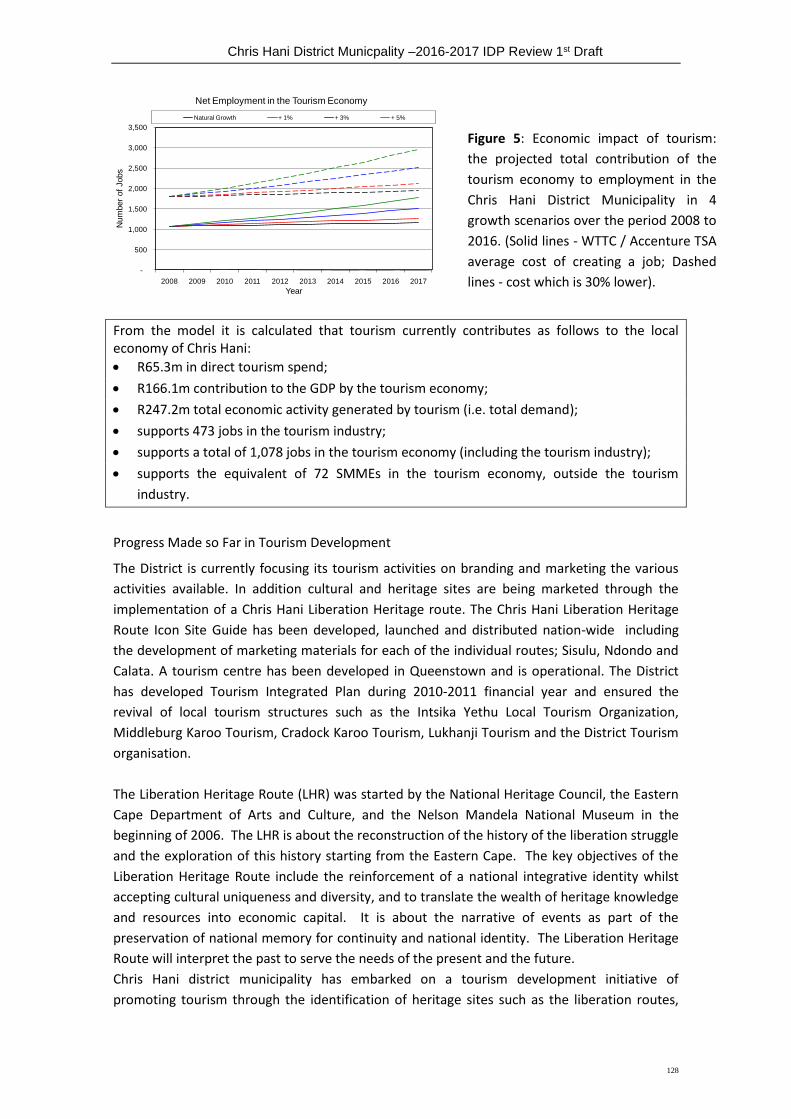
Chris Hani District Municpality –2016-2017 IDP Review 1st Draft
128
-
500
1,000
1,500
2,000
2,500
3,000
3,500
2008 2009 2010 2011 2012 2013 2014 2015 2016 2017
Num
ber
of
Jobs
Year
Net Employment in the Tourism Economy
Natural Growth + 1% + 3% + 5%
Figure 5: Economic impact of tourism:
the projected total contribution of the
tourism economy to employment in the
Chris Hani District Municipality in 4
growth scenarios over the period 2008 to
2016. (Solid lines - WTTC / Accenture TSA
average cost of creating a job; Dashed
lines - cost which is 30% lower).
From the model it is calculated that tourism currently contributes as follows to the local economy of Chris Hani:
R65.3m in direct tourism spend;
R166.1m contribution to the GDP by the tourism economy;
R247.2m total economic activity generated by tourism (i.e. total demand);
supports 473 jobs in the tourism industry;
supports a total of 1,078 jobs in the tourism economy (including the tourism industry);
supports the equivalent of 72 SMMEs in the tourism economy, outside the tourism
industry.
Progress Made so Far in Tourism Development
The District is currently focusing its tourism activities on branding and marketing the various
activities available. In addition cultural and heritage sites are being marketed through the
implementation of a Chris Hani Liberation Heritage route. The Chris Hani Liberation Heritage
Route Icon Site Guide has been developed, launched and distributed nation-wide including
the development of marketing materials for each of the individual routes; Sisulu, Ndondo and
Calata. A tourism centre has been developed in Queenstown and is operational. The District
has developed Tourism Integrated Plan during 2010-2011 financial year and ensured the
revival of local tourism structures such as the Intsika Yethu Local Tourism Organization,
Middleburg Karoo Tourism, Cradock Karoo Tourism, Lukhanji Tourism and the District Tourism
organisation.
The Liberation Heritage Route (LHR) was started by the National Heritage Council, the Eastern
Cape Department of Arts and Culture, and the Nelson Mandela National Museum in the
beginning of 2006. The LHR is about the reconstruction of the history of the liberation struggle
and the exploration of this history starting from the Eastern Cape. The key objectives of the
Liberation Heritage Route include the reinforcement of a national integrative identity whilst
accepting cultural uniqueness and diversity, and to translate the wealth of heritage knowledge
and resources into economic capital. It is about the narrative of events as part of the
preservation of national memory for continuity and national identity. The Liberation Heritage
Route will interpret the past to serve the needs of the present and the future.
Chris Hani district municipality has embarked on a tourism development initiative of
promoting tourism through the identification of heritage sites such as the liberation routes,
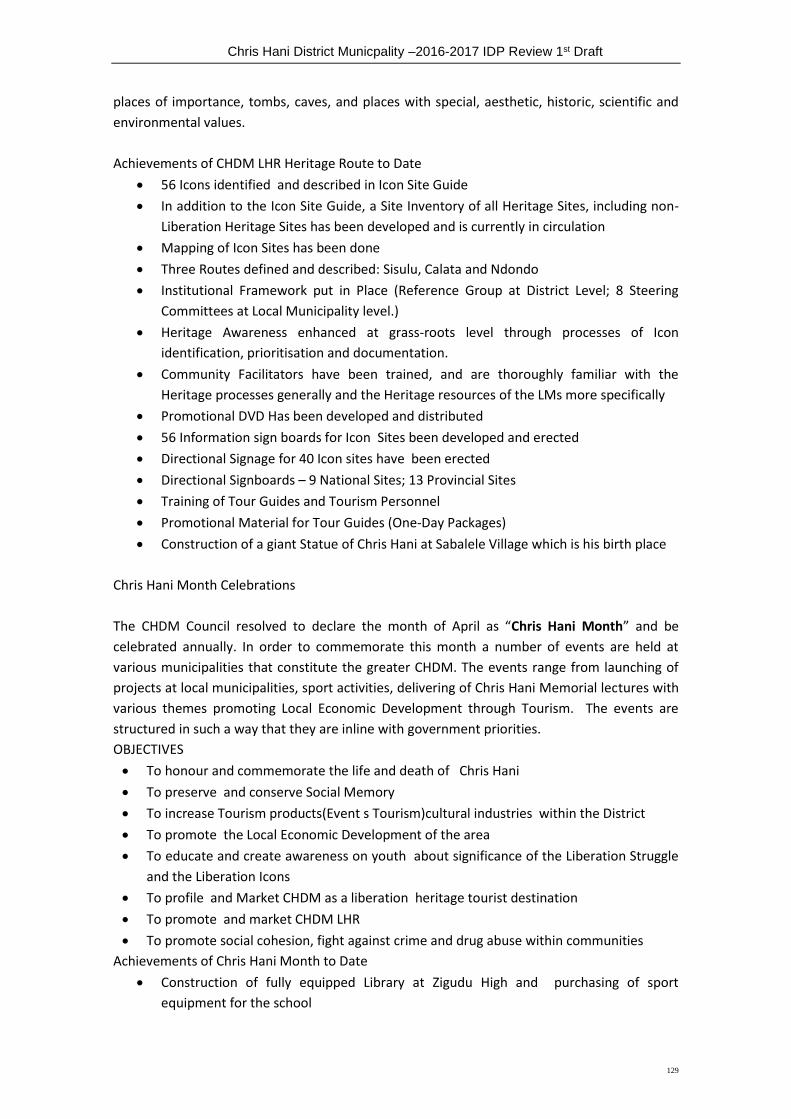
Chris Hani District Municpality –2016-2017 IDP Review 1st Draft
129
places of importance, tombs, caves, and places with special, aesthetic, historic, scientific and
environmental values.
Achievements of CHDM LHR Heritage Route to Date
56 Icons identified and described in Icon Site Guide
In addition to the Icon Site Guide, a Site Inventory of all Heritage Sites, including non-
Liberation Heritage Sites has been developed and is currently in circulation
Mapping of Icon Sites has been done
Three Routes defined and described: Sisulu, Calata and Ndondo
Institutional Framework put in Place (Reference Group at District Level; 8 Steering
Committees at Local Municipality level.)
Heritage Awareness enhanced at grass-roots level through processes of Icon
identification, prioritisation and documentation.
Community Facilitators have been trained, and are thoroughly familiar with the
Heritage processes generally and the Heritage resources of the LMs more specifically
Promotional DVD Has been developed and distributed
56 Information sign boards for Icon Sites been developed and erected
Directional Signage for 40 Icon sites have been erected
Directional Signboards – 9 National Sites; 13 Provincial Sites
Training of Tour Guides and Tourism Personnel
Promotional Material for Tour Guides (One-Day Packages)
Construction of a giant Statue of Chris Hani at Sabalele Village which is his birth place
Chris Hani Month Celebrations
The CHDM Council resolved to declare the month of April as “Chris Hani Month” and be
celebrated annually. In order to commemorate this month a number of events are held at
various municipalities that constitute the greater CHDM. The events range from launching of
projects at local municipalities, sport activities, delivering of Chris Hani Memorial lectures with
various themes promoting Local Economic Development through Tourism. The events are
structured in such a way that they are inline with government priorities.
OBJECTIVES
To honour and commemorate the life and death of Chris Hani
To preserve and conserve Social Memory
To increase Tourism products(Event s Tourism)cultural industries within the District
To promote the Local Economic Development of the area
To educate and create awareness on youth about significance of the Liberation Struggle
and the Liberation Icons
To profile and Market CHDM as a liberation heritage tourist destination
To promote and market CHDM LHR
To promote social cohesion, fight against crime and drug abuse within communities
Achievements of Chris Hani Month to Date
Construction of fully equipped Library at Zigudu High and purchasing of sport
equipment for the school
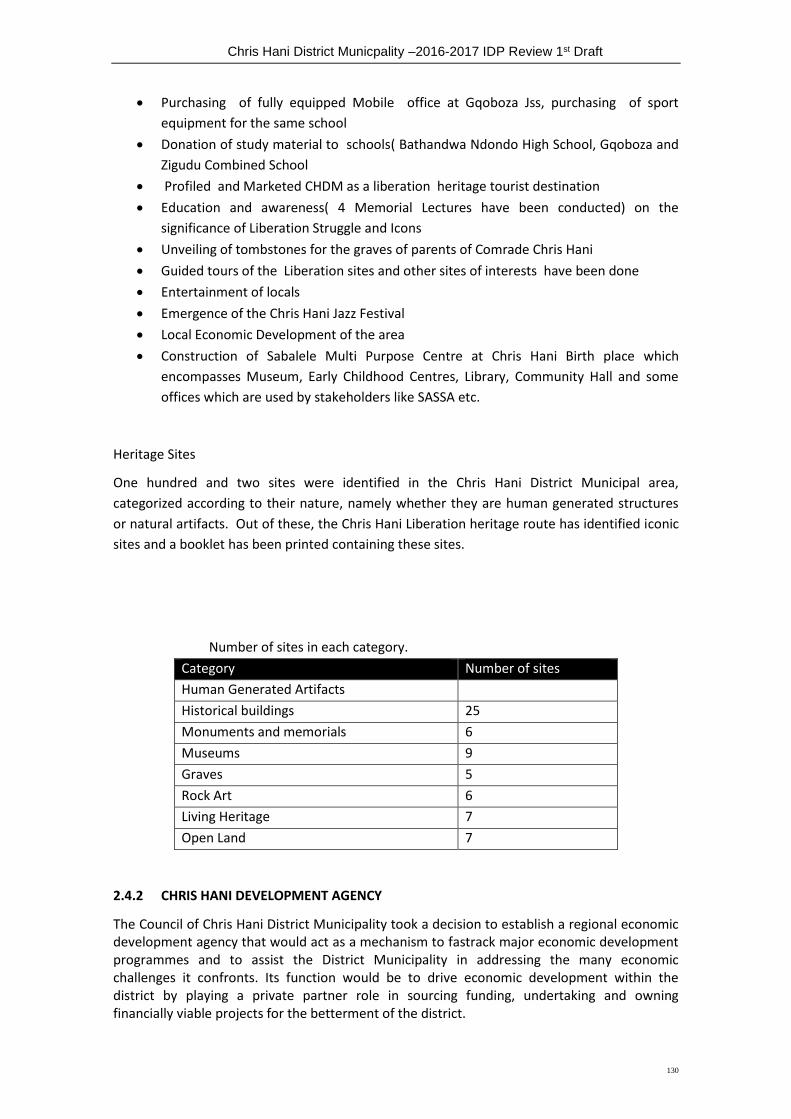
Chris Hani District Municpality –2016-2017 IDP Review 1st Draft
130
Purchasing of fully equipped Mobile office at Gqoboza Jss, purchasing of sport
equipment for the same school
Donation of study material to schools( Bathandwa Ndondo High School, Gqoboza and
Zigudu Combined School
Profiled and Marketed CHDM as a liberation heritage tourist destination
Education and awareness( 4 Memorial Lectures have been conducted) on the
significance of Liberation Struggle and Icons
Unveiling of tombstones for the graves of parents of Comrade Chris Hani
Guided tours of the Liberation sites and other sites of interests have been done
Entertainment of locals
Emergence of the Chris Hani Jazz Festival
Local Economic Development of the area
Construction of Sabalele Multi Purpose Centre at Chris Hani Birth place which
encompasses Museum, Early Childhood Centres, Library, Community Hall and some
offices which are used by stakeholders like SASSA etc.
Heritage Sites
One hundred and two sites were identified in the Chris Hani District Municipal area,
categorized according to their nature, namely whether they are human generated structures
or natural artifacts. Out of these, the Chris Hani Liberation heritage route has identified iconic
sites and a booklet has been printed containing these sites.
Number of sites in each category.
Category Number of sites
Human Generated Artifacts
Historical buildings 25
Monuments and memorials 6
Museums 9
Graves 5
Rock Art 6
Living Heritage 7
Open Land 7
2.4.2 CHRIS HANI DEVELOPMENT AGENCY
The Council of Chris Hani District Municipality took a decision to establish a regional economic development agency that would act as a mechanism to fastrack major economic development programmes and to assist the District Municipality in addressing the many economic challenges it confronts. Its function would be to drive economic development within the district by playing a private partner role in sourcing funding, undertaking and owning financially viable projects for the betterment of the district.

Chris Hani District Municpality –2016-2017 IDP Review 1st Draft
131
The strategic focus of the agency will lead the following:
• Functional irrigation schemes and efficient use of irrigation scheme infrastructure
• Participation and tangible economic benefit to rural communities
• Emerging farmers producing the minimum sorghum production for bio-ethanol pilot plant
• Quality meat production as business case for local abattoirs and meat processing from the region
• Efficient use of state resources and infrastructure
• Value chain benefication from the agro-industrial value chain
• Sustainable Enterprise Development establishment and job creation
The council’s decision to establish a development agency was based on an investigation of the
feasibility and/or viability of establishing the CHDM Development Agency. This was done by
looking at the lessons learnt from the development agencies that are doing well in the
Province to those that are not performing well. The investigation was completed and lead to
the recommendation to the Council for the establishment of a Development Agency as an
option to assist in fast tracking economic development in the area. Strides had been
undertaken by the Council as the Agency within its first years of existence managed to appoint
a fulltime CEO after the has a Permanent Board for 5 years consisting of 6 members as it is on
establishment phase. For the past year 2015 -2016 one of their main focuses was to manage
skills development fund which is to support well perfoming students within the district on
financial aid during their tertiary education mostly on scarce skills field.
Mandate of the Chris Hani Development Agency The new mandate of the Chris Hani Development Agency is outlined as follows in the Memorandum of Agreement between the Chris Hani District Municipality and the Chris Hani Development Agency:
Focus on the realization of the agro-industrial value chain linked to the SEZ model – Leverage investment into irrigation schemes and maximize infrastructure
potential thereof – focus on the agro-value process
Build research and economic modelling capacity to provide advisory support to economic project implementation.
Focus on investment facilitation and support/ empower communities to engage with private capital to ensure balanced socio-economic beneficiation
To be charged with the administration and management of the Community Skills
Development Fund on behalf of the District Municipality;
Name of the Development Agency The Development Agency is registered officially at CIPC as the Chris Hani Development Agency Pty (Ltd). It has about 9 members of the Board is currently runned by a fulltime CEO and a COO on senior management.

Chris Hani District Municpality –2016-2017 IDP Review 1st Draft
132
Organisational Arrangements The macro structure of the CHDA is appended hereunder:
2.5 ENVIRONMENT & TOPOGRAPHY
Climate
The climate varies from Arid to very cold high veld and falls mainly into 2 climatic zones
according to the “Agricultural Development Programme for the Eastern Cape’ – 1986, namely:-
Arid and Semi-Arid Moderate Midlands, and Arid and Semi-Arid Cold high lying land.
Rainfall
The rainfall varies dramatically over the area depending mostly on altitude and distance from
the coast. In the western arid areas, the average annual precipitation is between 200mm and
300mm whereas in the astern high lying areas of Cofimvaba it is 700-800 mm. The greater part
of the area is, however, arid to semi-arid and receives less than 400mm per annum.
Rainfall distribution is poor
and dry spells are a frequent
occurrence. In his study, J.H
van Wyk comes to the
conclusion that the rainfall of
the former Transkei shows
little variation and can
therefore be classified as
reliable.
Chris Hani District Municpality –2016-2017 IDP Review 1st Draft
133
He points out, however, that the variation of rainfall during the early summer months makes
early planting of agronomic crops risky. (Wood & van Schoor, 1976).
It is a summer rainfall area with 70% - 80% of the precipitation occurring during the summer
months in the form of thunderstorms. These storms are often of high intensity and are
sometimes accompanied by hail. Only 20 - 30% of the rainfall occurs during the winter month,
which usually results in snowfalls on the Chris Hani District Municipality plateau and the high
lying mountainous areas of the Compassberg and Winterberg.The further west, the poorer the
rainfall distribution, with severe droughts occurring fairly frequently. The rainfall in the eastern
area (Cofimvaba and Ngcobo) is more evenly spread, except for the early summer months
when “dry” spells can be expected, which makes the early planting of agronomic crops risky
(Wood & van Schoor, 1976).
Evaporation
Evaporation in the District is much higher than the average annual rainfall. The area thus
experiences a negative water balance. The evaporation in the arid western area is 2 146 mm
per annum, whereas it is approximately 1 700 mm per annum in the Lady Frere and Cofimvaba
Districts. This phenomenon complicates crop production as it requires moisture conservation
for dry land cropping and sophisticated irrigation management.
Temperatures
The temperature is characterised by extremes during the summer months, the maximum
temperature often exceeds 40ºC in the lower lying areas in the western (arid) section of the
study area. Minimum temperatures in the winter months in the high lying areas are often well
below zero and frost and snow is a common occurrence throughout the area.The average
commencing date for frost in most of the area is the Mid April and the average last date for
frost is the Mid October. Frost can, however, occur at any time of the year in the Molteno
District. This area experiences the largest inter-diurnal variation (change from one day to the
next) in temperature. (A.J. Roets & Associates, 1999).
The temperature in the eastern part of the District is a bit more moderate with frost occurring
from Mid May to Mid September.
Prevailing winds
During the summer months, the prevalent wind direction in the study area is north-westerly
(berg winds) whereas south-easterly to south-westerly winds prevail during the winter
months. Wind, however, is not regarded as a limiting factor in the study area.
Geology & Soils
The District consists mainly of Beaufort sediments intruded by Dolerite. These comprise Shale,
Mudstone and Sandstone.The soils in the District area are mainly from the Beaufort and
Molteno series of the Karoo sequence. As a result, the soils are poorly developed, shallow or
duplex (rocky), which are mostly not suitable for crop production. In the valleys, however,
Chris Hani District Municpality –2016-2017 IDP Review 1st Draft
134
deeper soils do occur. In the Fish River Valley as an example, there are 15 soil forms of which
the Hutton, Clovelly and Oakleaf forms (Binomial Classification) are dominant.
Soil salinity is, however, a major problem in the irrigation areas in the Cradock, Hofmeyr and
Tarkastad Districts.
The soils of the more arid areas of the study area are generally shallow and consist mainly of
the Mispah, Glenrosa and Swartland forms. In the flood plains, watercourses and plains,
deeper soils of the Oakleaf, Dundee and Valsrivier form are more common.
Topography, drainage and vegetation
The District is part of what is described as gradual “step” topography. The “steps” are formed
by the Winterberg mountain range in the south and the Stormberg range north of
Sterkstroom.
The Stormberg Mountain range runs from east to west dividing the area into the high lying
Stormberg plateau in the north and the generally lower altitude area in the south.
The Winterberg range with an altitude of 2 370 m above sea level extends into the
southernmost section of the area. The altitude of the Compassberg to the west of the
Stormberg range is 2 502 m, whereas the Stormberg plateau is ± 1 800 m above sea level. The
altitude of the lower lying area in the Cofimvaba District is ±600 m above sea level. The greater
part of the area, however, lies between 500 m and 1000 m above sea level.
The main drainage systems are the tributaries of the Great Fish, Great Kei Rivers and Mbashe
river systems, which drain into the Indian Ocean. The western section of Chris Hani District
Municipality consists mostly of mixed Nama Karoo veld whilst the eastern section consists
mostly of moist upland grassland. What is important from a conservation aspect is the valley
thicket occurring along the Kei and Mbashe River systems and the pockets of afromantane
forest occurring north of Ngcobo.
Conservation Areas within CHDM
The known conservation areas in the Chris Hani District Municipality are listed in the table
below. Only two of these conservation areas are under the direct control of the municipality,
namely Lawrence de Lange and Longhill (Lukhanji). In addition, a National Park (Mountain
Zebra National Park), a number of private nature reserves (i.e. Blanco) and three natural
heritage areas (i.e. Benghoil & Bushy Park, Carnarvon and Mhoge) are located, at least in part,
within the Municipality.
The formal protected area network is relatively extensive with the Mountain Zebra National
Park (SANP) and the Commando Drift and Tsolwana provincial reserves. The early selection of
protected reserves in the CHDM was based on ad hoc decisions to protect specific mammals
rather than objective criteria based on biodiversity mapping. Control of all indigenous forests
in the Eastern Cape including the CHDM, was handed over to the Directorate of Nature
Conservation of the Eastern Cape Province authorities in 1996, and management plans for all
forests are still in preparation.
Chris Hani District Municpality –2016-2017 IDP Review 1st Draft
135
Formally protected water sources include a number of large water catchments, including the
dams: Grassridge, Lake Arthur, Commando Drift, Xonxa, Lubisi and Ncora.
Water Resources
The CHDM falls within four river systems:
• The Great Fish River draining the central / western area southwards;
• The Kei River draining the central / eastern area southwards;
• The Mbashe River draining the eastern area southwards;
• The Orange River draining to the North.
Of these the Fish and Kei Rivers are the most significant rivers in terms of the catchment areas
in the CHDM. The total surface water available in the district has been estimated from the
Eastern Cape Water Resources Assessment as follows:
• Potential maximum yield (including dams and transfers) = 1013.5 Mm 3 / annum
• Probable total consumption and losses = 775.8 Mm 3 / annum
• Available surface water resource = 237.7 Mm 3 / annum
It is clear that across the whole district, there is a positive surface water balance and that
approximately 23,4% of the potential yield is still available for use, providing drought
conditions do not exist.. It is however worth noting that the resource is concentrated at the
major dams and rivers and as would be expected is not readily or cheaply accessible to all
potential users located a distance from these resources.
DAMS, WETLANDS AND SPRINGS
Chris Hani is characterized by a number of major dams, which serve the towns and the various
irrigation schemes.
The major dams in Chris Hani are:
• The Grassridge Dam between Cradock and Middelburg used as a balancing dam
• The Lake Arthur and Commandodrift Dams near Cradock used for irrigation
• The Xonxa, Lubisi and Ncora Dams between Lady Frere and Ngcobo used for irrigation.
• Xonxa Dam is currently used to support Lukhanji, Emalahleni with water as it has been
founded that it has a potential to do that, so water is sourced from there to Queenstown
as Lukhanji area has been discovered to be challenged.
Most of the wetlands occur in the Inxuba Yethemba municipality followed by the Emalahleni
and Tsolwana municipalities (4 each). The Engcobo, Inkwanca and Lukhanji municipalities only
have one listed wetland. Wetlands occur in the catchments above the Commando Drift,
Elands drift, Grassridge, Lake Arthur and Xonxa Dams.
A number of wetlands are located upstream of the dam immediately west of Dordrecht and
above what appears to be the Thrift Dam on the Black Kei, although not marked as such on the
topographical map (3226BC).

Chris Hani District Municpality –2016-2017 IDP Review 1st Draft
136
All the riparian wetlands are located within Eastern Mixed Nama Karoo vegetation, with the
exception of three found within Moist Upland Grassland (Lemoenfontein, Qumanco and
Snowdale-Success) and four within South-eastern Mountain Grassland (Clarke’s Siding,
Dordrecht Town, Driefontein 188 and Geluksvlei).
Springs are an important source of water in the district. They are also used for recreational
purposes such as at the Cradock Spa. A number of endorhic pan wetlands occur in the district,
two each in the Inkwanca (Coldstream pan, Die Pan wetland complex) and Inxuba Yethemba
(Helderwater pan, Rooikop) municipalities and one in the Tsolwana municipality (Rotterdam
wetland complex). The Helderwater pan, Rooikop wetland and Rotterdam wetland complex
are located within Eastern Mixed Nama Karoo, whereas the Coldstream pan and Die Pan
wetland complex are found within South-eastern Mountain Grassland.
Artificial Wetlands in the form of dams, excavations, solar salt extraction works and
wastewater treatment works occur to varying extents throughout the district. Solar salt
extraction works have the most restricted distribution, being limited to an area west of
Hofmeyr. They are all therefore located within the Tsolwana municipality. All these salt works
are located within Eastern Mixed Nama Karoo. Although they have been classified here as
artificial wetlands they are largely based on existing features, namely Landpan, Middelpan and
Soutpan.
Environmental Challenges
Government and the District Municipality have long neglected environmental protection. This
has led to many environmental disasters in the past, which could have been avoided if
environmental policies had been in place and enforced.
Lack of clean and unpolluted water is a major environmental problem in Tsolwana in particular
Thornhill area. Limited access to clean water affects mainly Emalahleni, Intsika Yethu,
Sakhisizwe, Engcobo and Lukhanji. Inkwanca and Inxuba Yethemba suffer from lack of a
guaranteed water supply, which should be rectified in the near future. Limited access to water
impacts upon the ability of people to practice good personal and food hygiene. The old and
people with disabilities are particularly affected as they have difficulty in gaining access to
water. The growing of crops is limited as there is no water to spare for the crops, which creates
many nutritional problems. Stock farming may also be limited due to insufficient water being
available that has a notable impact upon people’s livelihoods.
Limited and poor sanitation creates numerous environmental problems, such as water
pollution due to the waste being washed into the rivers by rain. Such water pollution is often
directly attributable to a variety of diseases which children playing in these contaminated
areas pick up. The smell from improper sanitation also affects quality of life for residents.The
greatest challenge facing government and local government in particular is how to minimise
harmful environmental practises that contribute to global warming and ultimately climate
change. A summit was recently held on this topic in the District to promote awareness of the
problems created by global warning.
Chris Hani District Municpality –2016-2017 IDP Review 1st Draft
137
Chris Hani District Municipality has produced an Environmental Management Plan (EMP)
which was adopted by Council in 2013-2014 in order to point out areas of concern, the plan is
reviewed for compliane and alignment annually so as to address current situation. The plan
highlights areas of the environment which should be conserved and protected.
Animal and vegetation species and cover are mapped and identified. In addition present and
future environmental problems are identified per local municipality as well as all renewable
resources. It highlights that:
The DM appoint dedicated environmental staff which has since been done
The DM develop an integrated environmental management system
The DM implement pollution control measures such as air pollution monitoring
stations
The DM assist to develop the capacity of its LM’s to deal with environmental issues
The DM undertake environmental impact assessments (EIA’s) for all of its current and
future project which is done currently by the municipality on all its projects that
require EIA
However the District Municipality has been struggling to finance the implementation of this
plan especially regarding pollution control mechanisms.
2.4.3 SERVICE DELIVERY & INFRASTRUCTURE DEVELOPMENT
2.1 Water Services & Sanitation
The Chris Hani District Municipality is a Water Services Authority in all local Municipalities
within the district in terms of powers and functions as developed by Municipal Structures Act,
117 of 1998. It therefore tasked with addressing a water services backlog. Water supply in
larger towns is treated and subject to operational and compliance monitoring while there are
small and remote rural communities whose supplies are seldom monitored.
The DM is a legislated WSA for its entire area of jurisdiction hence it has completed an
assessment of alternative water service provision mechanism, as required by Section 78 of
Municipal Systems Act. CHDM shares its borders with Ukhahlamba, O.R.Tambo, Amathole and
Cacadu of which some villages that are under jurisdiction of of CHDM gets some water from
those District Municipalities. An example of villages using water resources from other distrcicts
are villages at Tsomo as some are under Amathole and others under Chris Hani and
importance of inter municipal planning has worked as the area is serviced by Chris Hani
although its under Amathole DM And vice versa.
All its 8 local municipalities were Water Service Providers but CHDM Council has resolved to
take back the function of Water Provision due to various challenged experienced and this has
infact been agreed upon and a Council resolution is in place in that regard. Prior this Council
decision strong and healthy relationships with the LMs had resulted in the appointment of
critical and technical staff that were deployed to different LMs.
Chris Hani District Municpality –2016-2017 IDP Review 1st Draft
138
These people have assisted in strengthening LM’s water service provider staff and also ensured
that staff inherited from Department of Water Affairs is managed at the LM level. This has also
resulted in the improvement of the operational budget expenditure and vehicles and trucks
amounting to R27 million were purchased. As a result an improved customer care relation and
limited downtime has been observed. By due to the taking back of the function these staff
deployed will be further absorbed through a clear HR system and be amalgamated to the staff
of the district. This is infact aprocess and will be managed by all parties involved.
2.2 Water Services Development Plan With the publication of the Water Services Act (Act 108 of 1997), all South African water
services authorities were required to prepare a Water Services Development Plan (WSDP). The
WSDP is a business plan setting out the way in which a specific Water Services Authority
delivers water services to individuals and businesses in its area of jurisdiction. It also describes
the current and future consumer profile, the types of services that are provided, the
infrastructure requirements, a water balance, organisational and financial arrangements to be
used, an assessment of the viability of the approach, and an overview of environmental issues.
Following these analyses, important issues that may impact on the provision of effective and
sustainable water and sanitation services need to be identified and strategies must be
formulated to improve service provision.
As a WSA the Water Services Development Plan has to be reviewed annually, The 2015/2016
Final WSDP development was developed submitted to Council and as it has to be reviewe
annualy a final WSDP for 2016-2017 is to be adopted by May 2016-2017 financial year with
final IDP Review of 2016-2017. WSDP in general addresses the following matters
Service Level Objectives
Water Resources
Water Conservation and Demand Management
Bulk Infrastructure
Institutional Arrangements
Organisational Support,
Financial Management & Tariff Policy
The above Pie Chart shows the percentage of water infrastructure backlog within the district
as information and research conducted by Global Insight Rex 2011. It depicts that Engcobo has
more backlog followed by Intsika Yethu Municipality with Inkwanca being the least with water
backlog.The overall figure of the backlog has not changed significantly year-on-year , what has
changed it the distribution of the backlog between municipalities due to the demarcation
boundary changes.

Chris Hani District Municpality –2016-2017 IDP Review 1st Draft
139
This means that most of the CHDM water infrastructure backlog has shifted to Engcobo Local
Municipality area. This means that there is a newly developed WSDP has to reflect these
changes and to speak to how best to address the backlog going forward. Below are the water
backlog figures per municipality sourced from STATS SA Census 2011
The Water Services Development Plan (WSDP) which has been adopted currently utilises
Statssa figures from the 2011 Census estimate that currently 76% of the total population of
Chris Hani District Municipality (CHDM) is served with water services, whilst 55% are served
with sanitation services.
According to the WSDP of 2013-2014 which has relied on household figures of the 2011
Statssa figures delivers the following figures contained in the table below.
Source: Chris Hani Water Services Development Plan 2014
WATER
Households Percentage
Served Unserved Served Unserved
Emalahleni 13,746 20,569 40% 60%
Inkwanca 3,912 - 100% 0%
Intsika Yethu 24,516 26,245 48% 52%
Inxuba Yethemba 13,256 - 100% 0%
Lukhanji 42,434 14,555 74% 26%
Ngcobo 10,353 26,889 28% 72%
Sakhisizwe 7,564 7,081 52% 48%
Tsolwana 3,357 4,219 44% 56%
ECDMA13 24 - 100% 0%
TOTAL (2013) 119,162 99,558 54% 46%

Chris Hani District Municpality –2016-2017 IDP Review 1st Draft
140
The major challenge is meeting the backlog targets as set out by the national government due
to the insufficient capital funds (i.e. MIG allocations).The collapsing infrastructure in towns is
not included in the backlog.
Looking at the Sanitation Backlog as informed by official STATS SA Census 2011 the below Pie
Chart shows Intsika Yethu and Engcobo as municipalities within the district with more/high
backlog and the least being Inkwanca Municipality.
Actual figures are depicted by a graph below:
The CHDM has identified and quantified all villages with water and sanitation backlogs within
their area of jurisdiction and put them into clusters. The District Municipality could not meet
the targets it set of eradicating buckets due to financial and capacity constraints and as a result
has committed itself in ensuring that it provides free basic services to its communities. Due to
the allocated powers and functions the provision of basic level of services is limited to water
and sanitation.Backlogs have made it difficult to provide these services in areas which do not
have infrastructure especially in the former Ciskei and Transkei areas. The funding with respect
to MIG falls short in eradicating the backlog. The WSDP presents a number of possible
developmental scenarios. Given the available and potential resources and capacity, the most
viable scenario envisages increasing resources so that the backlogs are addressed by 2014 but
due to latest info it is envisaged that the backlog would be addresses by 2025 due to its huge
volume.
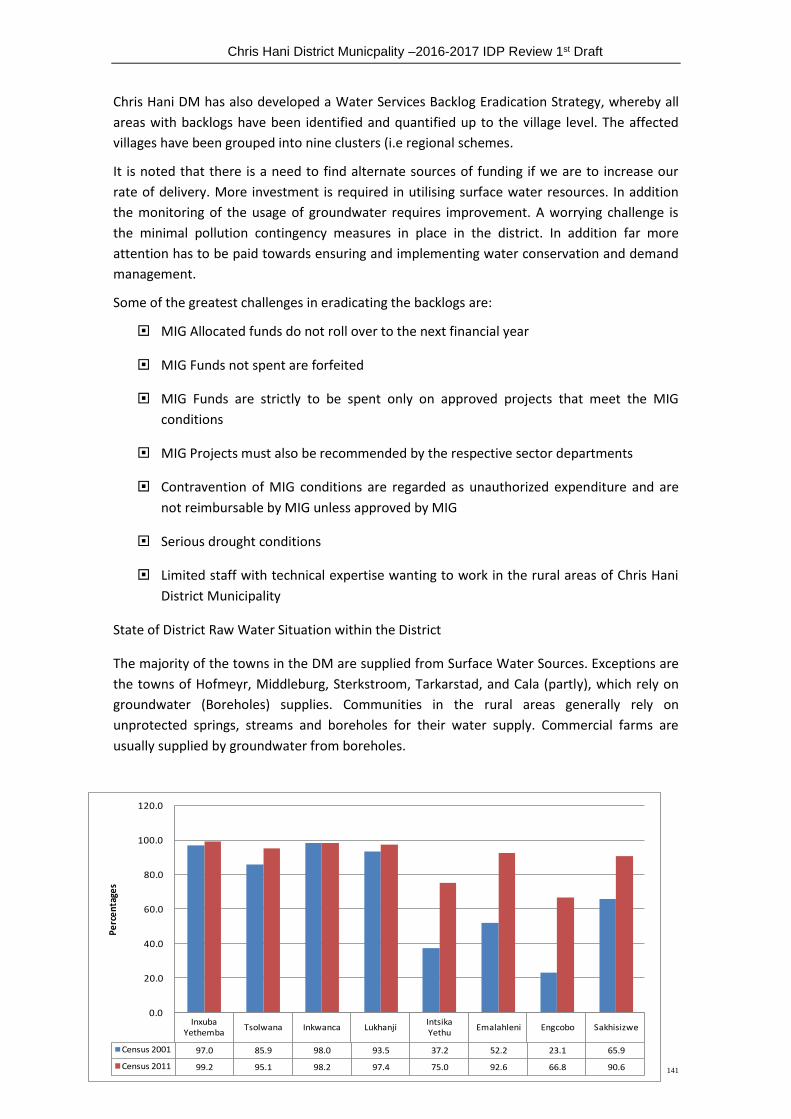
Chris Hani District Municpality –2016-2017 IDP Review 1st Draft
141
Chris Hani DM has also developed a Water Services Backlog Eradication Strategy, whereby all
areas with backlogs have been identified and quantified up to the village level. The affected
villages have been grouped into nine clusters (i.e regional schemes.
It is noted that there is a need to find alternate sources of funding if we are to increase our
rate of delivery. More investment is required in utilising surface water resources. In addition
the monitoring of the usage of groundwater requires improvement. A worrying challenge is
the minimal pollution contingency measures in place in the district. In addition far more
attention has to be paid towards ensuring and implementing water conservation and demand
management.
Some of the greatest challenges in eradicating the backlogs are:
MIG Allocated funds do not roll over to the next financial year
MIG Funds not spent are forfeited
MIG Funds are strictly to be spent only on approved projects that meet the MIG
conditions
MIG Projects must also be recommended by the respective sector departments
Contravention of MIG conditions are regarded as unauthorized expenditure and are
not reimbursable by MIG unless approved by MIG
Serious drought conditions
Limited staff with technical expertise wanting to work in the rural areas of Chris Hani
District Municipality
State of District Raw Water Situation within the District
The majority of the towns in the DM are supplied from Surface Water Sources. Exceptions are
the towns of Hofmeyr, Middleburg, Sterkstroom, Tarkarstad, and Cala (partly), which rely on
groundwater (Boreholes) supplies. Communities in the rural areas generally rely on
unprotected springs, streams and boreholes for their water supply. Commercial farms are
usually supplied by groundwater from boreholes.
Inxuba Yethemba
Tsolwana Inkwanca LukhanjiIntsika Yethu
Emalahleni Engcobo Sakhisizwe
Census 2001 97.0 85.9 98.0 93.5 37.2 52.2 23.1 65.9
Census 2011 99.2 95.1 98.2 97.4 75.0 92.6 66.8 90.6
0.0
20.0
40.0
60.0
80.0
100.0
120.0
Pe
rce
nta
ges
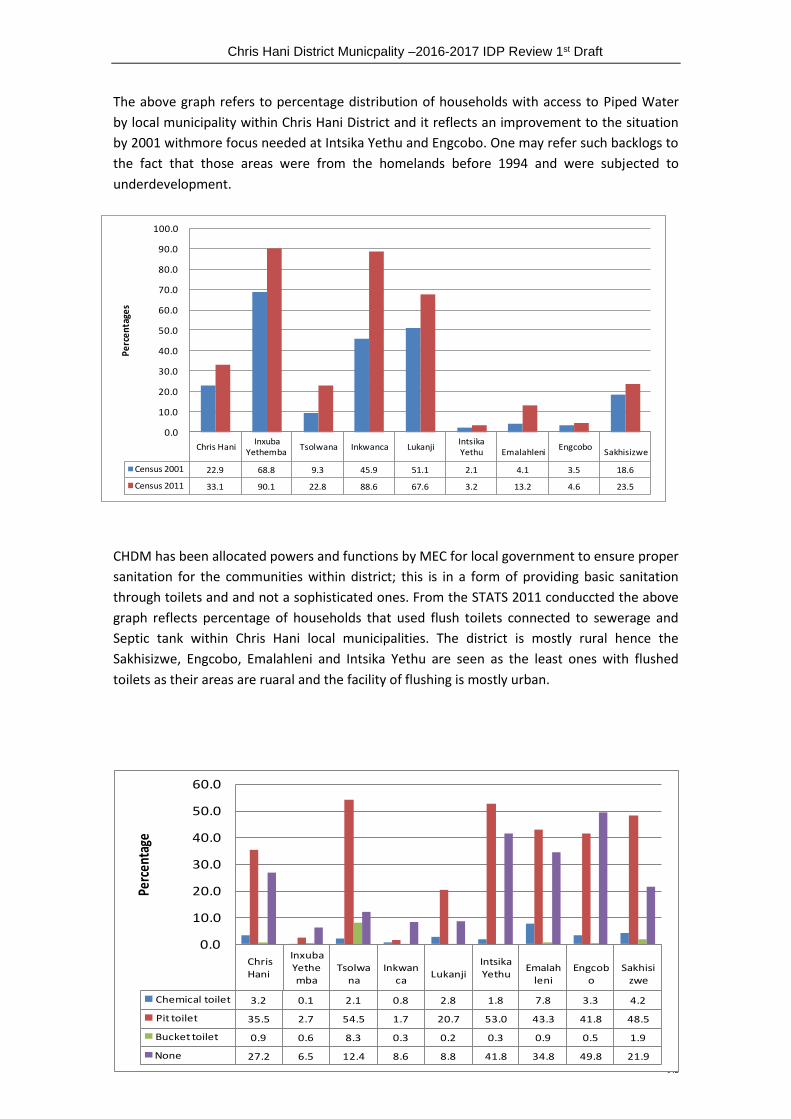
Chris Hani District Municpality –2016-2017 IDP Review 1st Draft
142
The above graph refers to percentage distribution of households with access to Piped Water
by local municipality within Chris Hani District and it reflects an improvement to the situation
by 2001 withmore focus needed at Intsika Yethu and Engcobo. One may refer such backlogs to
the fact that those areas were from the homelands before 1994 and were subjected to
underdevelopment.
CHDM has been allocated powers and functions by MEC for local government to ensure proper
sanitation for the communities within district; this is in a form of providing basic sanitation
through toilets and and not a sophisticated ones. From the STATS 2011 conduccted the above
graph reflects percentage of households that used flush toilets connected to sewerage and
Septic tank within Chris Hani local municipalities. The district is mostly rural hence the
Sakhisizwe, Engcobo, Emalahleni and Intsika Yethu are seen as the least ones with flushed
toilets as their areas are ruaral and the facility of flushing is mostly urban.
Chris HaniInxuba
YethembaTsolwana Inkwanca Lukanji
Intsika Yethu Emalahleni
EngcoboSakhisizwe
Census 2001 22.9 68.8 9.3 45.9 51.1 2.1 4.1 3.5 18.6
Census 2011 33.1 90.1 22.8 88.6 67.6 3.2 13.2 4.6 23.5
0.0
10.0
20.0
30.0
40.0
50.0
60.0
70.0
80.0
90.0
100.0
Pe
rce
nta
ges
Chris Hani
Inxuba Yethemba
Tsolwana
Inkwanca
LukanjiIntsika Yethu
Emalahleni
Engcobo
Sakhisizwe
Chemical toilet 3.2 0.1 2.1 0.8 2.8 1.8 7.8 3.3 4.2
Pit toilet 35.5 2.7 54.5 1.7 20.7 53.0 43.3 41.8 48.5
Bucket toilet 0.9 0.6 8.3 0.3 0.2 0.3 0.9 0.5 1.9
None 27.2 6.5 12.4 8.6 8.8 41.8 34.8 49.8 21.9
0.0
10.0
20.0
30.0
40.0
50.0
60.0
Perc
enta
ge

Chris Hani District Municpality –2016-2017 IDP Review 1st Draft
143
The above graph from STATS SA Census 2011 reflects the percentage within district of
households by type of toilet facilities and can be interpreted as Pit Toilets being the ones
mostly found within the district with areas that still have some bucket systems at Tsolwana
and Sakhisizwe.
Blue Drop Drinking Water and Green Drop Wastewater Quality Assessment and Compliance
Regular water quality testing at each of the water treatment works in the District is completed
by operators as part of their daily routine. The results are recorded at each plant and are
forwarded to the District for processing, interpretation and remedial action taken (if required).
Monitoring of water quality at the point of consumption is undertaken by Environmental
Health Practioners (EHPs) employed by each municipality in the District.
These EMPs sample water at a number of sampling points thoughout each municipality and
measure a number of water quality parameters.
EColi
pH
Turbidity
Total Dissolved Solids (TDS)
Conductivity
Free Chlorine
Nitrates
Sulphate
Flouride
In the event that a sample fails to comply with the required standards, it is retested before
remedial action is taken. For the eColi test, water is taken from an unsterilized tap and after it
has been burned to sterilise the tap. This will give an indication if any pollution enters the
water at the tap or prior to the tap.
Comments by 2012 Green Drop Inspectors:
“The Green Drop assessment revealed that wastewater management within this municipality ranges from acceptable to entirely unacceptable.
Management of the Queenstown wastewater system proved to be promising; within this system relatively good scores were achieved across the board accept for incident management, treatment capacity and asset management. A far less convincing performance was recorded at each of the remaining systems. This poor performance necessitates the Department to require the Water Services Authority to provide an explanation together with a turn-around plan within 30 days subsequent to the release of this report. (This to inform the appropriate intervention)
Special attention is required at Tsomo, Indweb, Cradock, Lady Frere, Middelburg and Comfimvaba since all of these systems reached the undesirable maximum risk rating.
Chris Hani District Municpality –2016-2017 IDP Review 1st Draft
144
This means that it is squarely within the critical risk category; the situation will not turn around without a concerted planning and implementation effort from municipal decision makers and management.
Green Drop Findings:
A lack of operational information indicates ineffective management of the wastewater systems in general; this severely compromised the Green Drop performance of Chris Hani District Municipality and Water Service Providers (Local Municipalities):
Officials indicated a budget for operations and maintenance but could not produce any evidence of expenditure. This prevented the assessors of having complete confidence in the efficacy levels of asset management.
The general lack of information bar one of the systems Chris Hani is responsible for, it is recommended that the compilation of asset registers and investment in operational monitoring will be prioritised, together with process optimisation in a serious endeavoured required for effluent quality compliance with authorization limits”
Conclusion: “The Regulator is not satisfied with the overall performance of wastewater services management in Chris Hani DM. The WSA has to submit a Corrective Action Plan to DWA within 30 days of release of the Green Drop Report.”
Comments by 2012 Blue Drop Inspectors:
“Chris Hani DM is another Eastern Cape Water Services Authority that impresses with its drive to improve drinking water quality management. An overall score improvement from 53.1% to 73.5% speaks volumes of the officials’ commitment in this regard. This is sincerely a commendable performance under challenging circumstances.
Nevertheless there would remain areas with dreadful microbiological compliances i.e. in systems such as Cala and Eliott. Compliance percentages in these two systems are well below 50% and it can be expected that these communities are at risk. The municipality is required to inform the Department’s regional office within 30 days as from the release of this report on an action plan for urgent improvement of treatment efficiency levels in these areas.
The Blue Drop inspectors noted: “The Water Services Providers responded very well to the deficiencies identified during the Blue Drop Assessment and come well prepared for the Confirmation Interviews. The WSPs were strongly supported by the ChrisHaniDistrictMunicipality. The District Director personally led the interviews and made sure that each of his WSPs was represented in large numbers. This illustrates the commitment of the District towards the Blue Drop Certification Programme.”
Findings:
The worst performing systems would be the Rural Systems within the jurisdiction of Intsika Yethu Local Municipality.
Chris Hani District Municpality –2016-2017 IDP Review 1st Draft
145
Interventions required to address identified ‘Blue Drop’ compliance gaps
It is clear from the Blue Drop Assessment that, while the Municipality has made great progress in improving its water quality monitoring system; specific areas that require additional interventions include:
Drinking Water Quality testing and compliance in rural areas (especially Intsika Yethu)
Water Safety Plans in some areas (i.e. rural areas)
Implementation of the comprehensive testing programme that will fully comply with SANS 241
Build Capacity and reduce reliance on service providers for support and testing
Roads and Stormwater
The road network in the Chris Hani District consists of a hierarchy of national, provincial and
municipal roads. Two national routes pass through the Chris Hani District in a north-south
direction i.e. the N10 and N6. The local Trunk and Main roads link the larger towns and villages
and mostly run in an east-west direction. The best example is the R61, which runs from
Cradock in the west through Queenstown to Mthatha in the east. The total length of the
provincial road network amounts to approximately 43 465km. This is made up of
approximately 5 102 km (12%) of surfaced roads and 38 363km (88%) of gravel roads. Only 707
km of the total network of nearly 8 900 km in Chris Hani is surfaced.
The overall condition of the road network in the Province and in the Chris Hani District has not
improved, mainly due to insufficient funds for maintenance and inherited backlogs. Gravel
roads require regular maintenance especially with heavy rains and high traffic volumes as can
be seen in the photograph above. From an economic point of view, gravel roads suppress
economic development since they lead to high vehicle operating costs and often lead to the
damage of crops transported.
The District is responsible for maintaining identified roads in the Inxuba Yethemba area on an
agency basis if the Department of Roads and Transport. As the custodian of the secondary
roads in the North Westen side of the district. It has met this responsibility in a stalwart
manner with the Department of Roads & Public Works and is firmly recognized in the Office of
the Premier as one of the trendsetters in Road Construction and Maintenance.
The District Municipality (DM) in particular the Roads Section team managed to successfully
secure again a new 3 year Service Level Agreement (Road Maintenance Contract) with the
Department of Roads & Public Works starting from the beginning of April 2013. The Contract is
limited to Provincial Proclaimed Roads within the Inxuba Yethemba Area. The project started
with a budget of 67.5 Million by 2009 and currently believed to increase. An allocation of R22,5
Million was committed for the 2011/12 financial year, continuing with R25 Million for the
2012/13, 2013/14 and 2015/16 fiscal years respectively.
Chris Hani District Municpality –2016-2017 IDP Review 1st Draft
146
The Roads Staff has been commended by DRPW, the Agricultural Union and the Roads Forum
for their professional implementation of the programme as their roads are of a high quality
and are maintained on par with the private sector. The program is aimed at all road users
particularly the local communities, tourists/visitors, Agriculture and National and provincial
funded projects to cater for an Ethanol factory in Cradock. Municipalities that are not part of
the Service Level Agreement are serviced by the Department of Roads & Public Works.
OPERATION & MAINTENANCE WITHIN CHDM The O&M unit is tasked with maintaining the infrastructure within the dsitrict of which some
of the functions of the unit includes:
-Routine Operation and Maintenance Procedures
-Start and Daily Operations
-Emergency flags
-Equipment Inventory
-Spare parts Inventory
-Equipment repair and Supply information
-Emergency Response and Action Plans
-Water Quality Monitoring
-Water Quality and Regulations Violation response Procedures
-Employee Training
-Monthly Inspection Reports and Observation Report
-System Description which includes
(a) Source
(b) Treatment
(c) Distribution
(d) Storage
The technical guidelines assisting in the development of Operation and Maintenance Plans (O
& M) for Water and Sanitation are developed so that they are in conjunction with conservation
and demand management as they are in the course of development. The O & M Plan has been
developed to satisfy the Licensing of Water Supply and Waste water Treatment system
operator Regulations including the development of reporting all daily procedures of
maintenance done on each and every Municipal asset and also a description of water supply
source, treatment, storage and distribution. This plan is intended to ensure that the system
operates in a manner that satisfies all laws, rules and regulations and that all employees are
acquainted with their individual responsibilities. The Unit has its own budget to run the
programmes of maintaining its operations.
Climate Change and Drought Mitigation
After CHDM was declared as a drought affected District, the Department of Water Affairs
allocated a Drought Relief Funding and the District Council adopted an action plan to address
the crisis in 2010/11. Subsequent to that the Municipality has developed a Climate Change
Adaptation Strategy which was adopted by Council by 2012-2013. Some of actions taken by
council include the following decisions:

Chris Hani District Municpality –2016-2017 IDP Review 1st Draft
147
- That to allocate the funds per Local Municipality.
- Funds have been utilised to test, drill and equip boreholes and also to protect the springs.
- Ground water protocol has to be conducted in all 8 local municipalities.
- WSPs were required to use the existing CHDM tender for ground water protocol to fast-track
the drought action plan implementation process.
- CHDM to purchase 12 water carts for water supply which where needed
- Springs are to be protected as alternative water supply.
- The Drought Relief Programme is to continue throughout.
The drought situation was further elevated on the 2010 Water and Rural Development
Summit. By the month of March 2012 the institution conducted a Climate Change Summit so
as to discuss climate change issues.
2.1 Education Snapshot within the region
Educating is important to the economic growth in a country and the development of its industries, providing a trained workforce and skilled professionals required. The education measure represents the highest level of education of an individual, using the 15 years and older age category. (According to the United Nations definition of education, one is an adult when 15 years or older. IHS uses this cut-off point to allow for cross-country comparisons. Furthermore, the age of 15 is also the legal age at which children may leave school in South Africa). CHART 53. HIGHEST LEVEL OF EDUCATION: AGE 15+ - CHRIS HANI DISTRICT MUNICIPALITY,
2002-2012 [PERCENTAGE]

Chris Hani District Municpality –2016-2017 IDP Review 1st Draft
148
The number of people without any schooling within Chris Hani District Municipality, decreased
annually from 2002 to 2012 with -5.40%, while number of people with a 'matric only',
increased from 43,300 to 69,000. The number of people with 'matric and a certificate/diploma'
increased annually with 6.08%, with the number of people with a 'matric and a Bachelor's'
degree increasing annually with 5.81%. Overall improvement in the level of education is visible
with an increase in the number of people with 'matric' or higher education.
TABLE 54. HIGHEST LEVEL OF EDUCATION: AGE 15+ - CHRIS HANI, EASTERN CAPE AND
NATIONAL TOTAL, 2012 [NUMBERS]
Chris Hani Eastern Cape National Total
Chris Hani as % of
province
Chris Hani as % of
national
No schooling 67,227 437,695 2,621,077 15.4% 2.6% Grade 0-2 16,909 107,464 599,961 15.7% 2.8% Grade 3-6 80,487 544,950 3,216,343 14.8% 2.5% Grade 7-9 148,825 1,173,214 8,082,816 12.7% 1.8% Grade 10-11 111,813 1,043,859 9,105,784 10.7% 1.2% Certificate / diploma without matric
4,393 36,160 333,274 12.1% 1.3%
Matric only 68,956 819,275 9,175,011 8.4% 0.8% Matric & certificate / diploma
30,728 252,909 2,359,720 12.1% 1.3%
Matric & Bachelors degree
7,342 79,692 883,822 9.2% 0.8%
Matric & Postgrad degree
1,970 25,707 374,910 7.7% 0.5%
Source: IHS Global Insight Regional eXplorer version 700 The number of people without any schooling in Chris Hani District Municipality constitutes 2.56% of the number of people without schooling in the province and a total share of 2.56% of the national. In 2012, the number of people in Chris Hani District Municipality with a matric only was 69,000 which is a share of 0.75% of the province. The number of people with a matric and a Postgrad degree constitutes 0.83% of the province and 0.83% of the national.

Chris Hani District Municpality –2016-2017 IDP Review 1st Draft
149
TABLE 55. HIGHEST LEVEL OF EDUCATION: AGE 15+, LOCAL MUNICIPALITIES OF CHRIS
HANI DISTRICT MUNICIPALITY 2012 [PERCENTAGE]
In 2012, the local municipality with the most people aged 15 years and up with no schooling is
the Engcobo Local Municipality with 18% or 17 700 persons. Lukanji Local Municipality has the
highest percentage of people with a tertiary education of some kind. In 2012 the Chris Hani
District Municipality a total of 67 200 persons have no schooling this is 8.4% of the total
population.
2.2 Functional literacy
Definition: For the purpose of this report, IHS defines functional literacy as the number of
people in a region that are 20 years and older and have completed at least their
primary education (i.e. grade 7).
Functional literacy describes the reading and writing skills that are adequate for an individual
to cope with the demands of everyday life - including the demands posed in the workplace.
This is contrasted with illiteracy in the strictest sense, meaning the inability to read or write.
Functional literacy enables individuals to enter the labour market and contribute towards
economic growth thereby reducing poverty.

Chris Hani District Municpality –2016-2017 IDP Review 1st Draft
150
TABLE 56. FUNCTIONAL LITERACY: AGE 20+, COMPLETED GRADE 7 OR HIGHER - CHRIS
HANI, 2002-2012 [NUMBER & PERCENTAGE]
Illiterate Literate %
2002 205,490 196,622 48.9% 2003 201,363 204,017 50.3% 2004 197,176 211,567 51.8% 2005 193,045 219,404 53.2% 2006 189,184 227,786 54.6% 2007 185,478 236,645 56.1% 2008 182,070 246,231 57.5% 2009 178,687 256,293 58.9% 2010 175,188 266,686 60.4% 2011 171,386 277,136 61.8% 2012 167,368 287,717 63.2% Average Annual growth 2002-2012 -2.03% 3.88% 2.60%
Source: IHS Global Insight Regional eXplorer version 700 A total of 288 000 individuals in Chris Hani District Municipality were considered functionally
literate in 2012, while 167 000 people were considered to be illiterate. Expressed as a rate,
this amounts to 63.22%, which is an increase of 14.33% percentage points since 2002
(48.90%). The number of illiterate individuals decreased - by -2.03% annually from 2002 to
2012, with the number of functional literate people increasing at 3.88% annually.

Chris Hani District Municpality –2016-2017 IDP Review 1st Draft
151
CHART 54. FUNCTIONAL LITERACY: AGE 20+, COMPLETED GRADE 7 OR HIGHER - CHRIS HANI,
EASTERN CAPE AND NATIONAL TOTAL, 2002-2012 [PERCENTAGE]
Chris Hani District Municipality's functional literacy rate of 63.22% in 2012 is lower than that of Eastern Cape at 72.50% as well as the national rate of 80.42%.
A higher literacy rate is often associated with higher levels of urbanization, for instance where access to schools is less of a problem, and where there are economies of scale. From a spatial breakdown of the literacy rates in South Africa, it is perceived that the districts with larger cities normally have higher literacy rates.
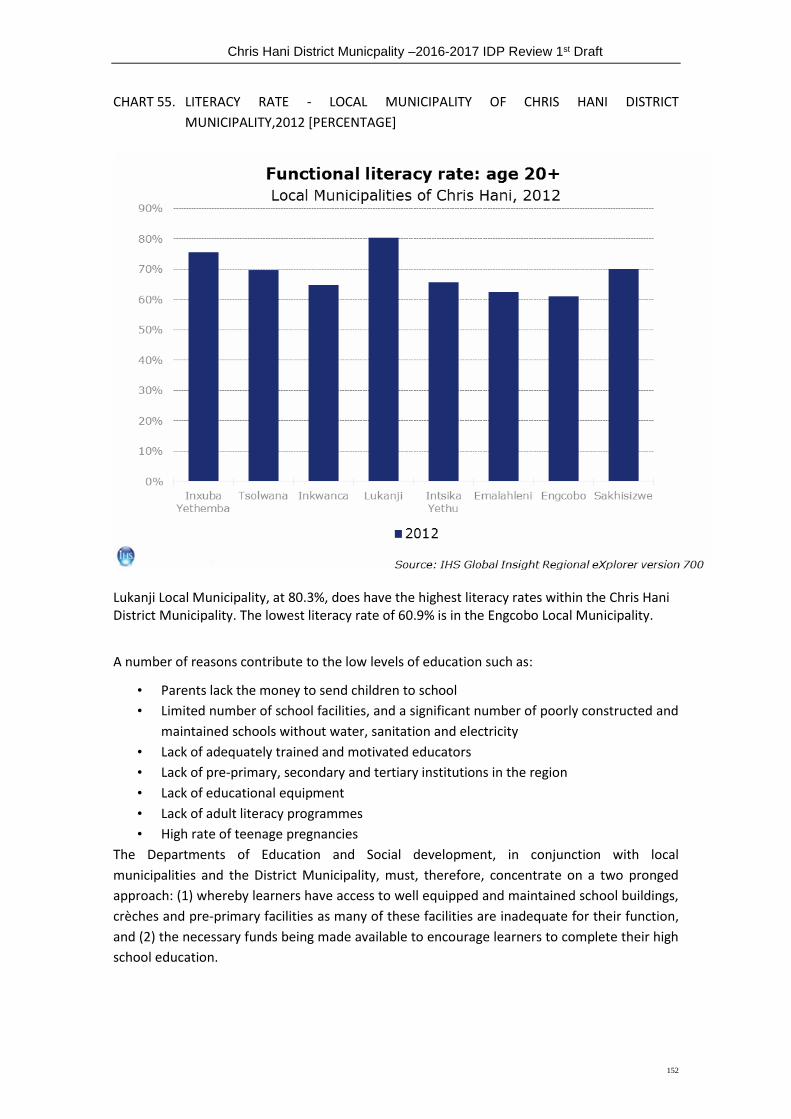
Chris Hani District Municpality –2016-2017 IDP Review 1st Draft
152
CHART 55. LITERACY RATE - LOCAL MUNICIPALITY OF CHRIS HANI DISTRICT
MUNICIPALITY,2012 [PERCENTAGE]
Lukanji Local Municipality, at 80.3%, does have the highest literacy rates within the Chris Hani District Municipality. The lowest literacy rate of 60.9% is in the Engcobo Local Municipality.
A number of reasons contribute to the low levels of education such as:
• Parents lack the money to send children to school
• Limited number of school facilities, and a significant number of poorly constructed and
maintained schools without water, sanitation and electricity
• Lack of adequately trained and motivated educators
• Lack of pre-primary, secondary and tertiary institutions in the region
• Lack of educational equipment
• Lack of adult literacy programmes
• High rate of teenage pregnancies
The Departments of Education and Social development, in conjunction with local
municipalities and the District Municipality, must, therefore, concentrate on a two pronged
approach: (1) whereby learners have access to well equipped and maintained school buildings,
crèches and pre-primary facilities as many of these facilities are inadequate for their function,
and (2) the necessary funds being made available to encourage learners to complete their high
school education.

Chris Hani District Municpality –2016-2017 IDP Review 1st Draft
153
Libraries
There is a significant lack of libraries within the District, resulting in school children and other
learners being unable to access information they require for their studies. It is noted, however,
that some progress is being made in this regard.Intsika Yethu Municipality with DSRAC has also
built the library in Cofimvaba Town for the p[urposes of assisting learners with information.
Secondly Through the liberation Heritage programme another library has been built at
Sabalele Village with the collaboration of Chris Hani District Municipality and DSRAC, the
library is packed with books to assit the learnesrs around the area of Sabalele.
Sports & Recreation Facilities
The District offers a wide display of sports
from the more adventurous such as white
water rafting, horse endurance trails to the
more sedate such as bowls. Indigenous
sporting activities such as horse races and
stick fighting are promoted and competitions
held throughout the rural areas.
Many sport clubs and codes have a proud tradition and have been going for many years.
However, there is a significant lack of sports and recreational facilities within the District,
especially in the former homeland areas. This may be directly attributed to the policies of the
former government, which did not take into cognisance the health and welfare of people living
in the then homelands. As a result many schools do not have their own playgrounds or
sporting facilities.
Community Halls
Community halls provide multiple opportunities, including a place for people to gather for
meetings, a place from which information may be disseminated, and a place from which
services (such as pension payouts) may be provided. The lack of community halls means that
local communities have no place to gather, partake in recreational and educational activities,
and receive pensions or pertinent community information. As informed by powers and
functions allocated to municipalities the distric municipality is not allocated those powers to
provide and build community halls as the function resides with LM’s, but flowing from the
discussions between DM and LM’s it has been advised that community halls be built at each
ward within the LM’s and be used by ward councillors as their offices because they are closer
to the people and therefore reachable. The building of these community halls is a function of
Local Municipality as the district is focusing on mostly water and sanitation.
Chris Hani District Municpality –2016-2017 IDP Review 1st Draft
154
Housing Development
In terms of the Municipal Structures Act 1998 no 117 a district municipality is expected “to
build the capacity of local municipality in its area to perform their functions and exercises their
powers where such capacity is lacking.” Chris Hani District Municipality serves to Coordinate;
Support; Guide and to facilitate the process of housing development within its jurisdiction.
Global Insight as well as an official Stats as conducted by 2011 shows that Intsika Yethu and
Engcobo municipalities are the most locals within the district with more housing backlogs.
Household by Dwelling Type
Using the StatsSA definition of a household and a dwelling unit, households can be categorised according to type of dwelling. The categories are:
Very formal dwellings - structures built according to approved plans, e.g. houses on a
separate stand, flats or apartments, townhouses, rooms in backyards that also have
running water and flush toilets within the dwelling. .
Formal dwellings - structures built according to approved plans, i.e. house on a
separate stand, flat or apartment, townhouse, room in backyard, rooms or flatlet
elsewhere etc, but without running water or without a flush toilet within the dwelling.
Informal dwellings - shacks or shanties in informal settlements, serviced stands, or
proclaimed townships, as well as shacks in the backyards of other dwelling types.
Traditional dwellings - structures made of clay, mud, reeds, or other locally available
material.
Other dwelling units - tents, ships, caravans, etc.
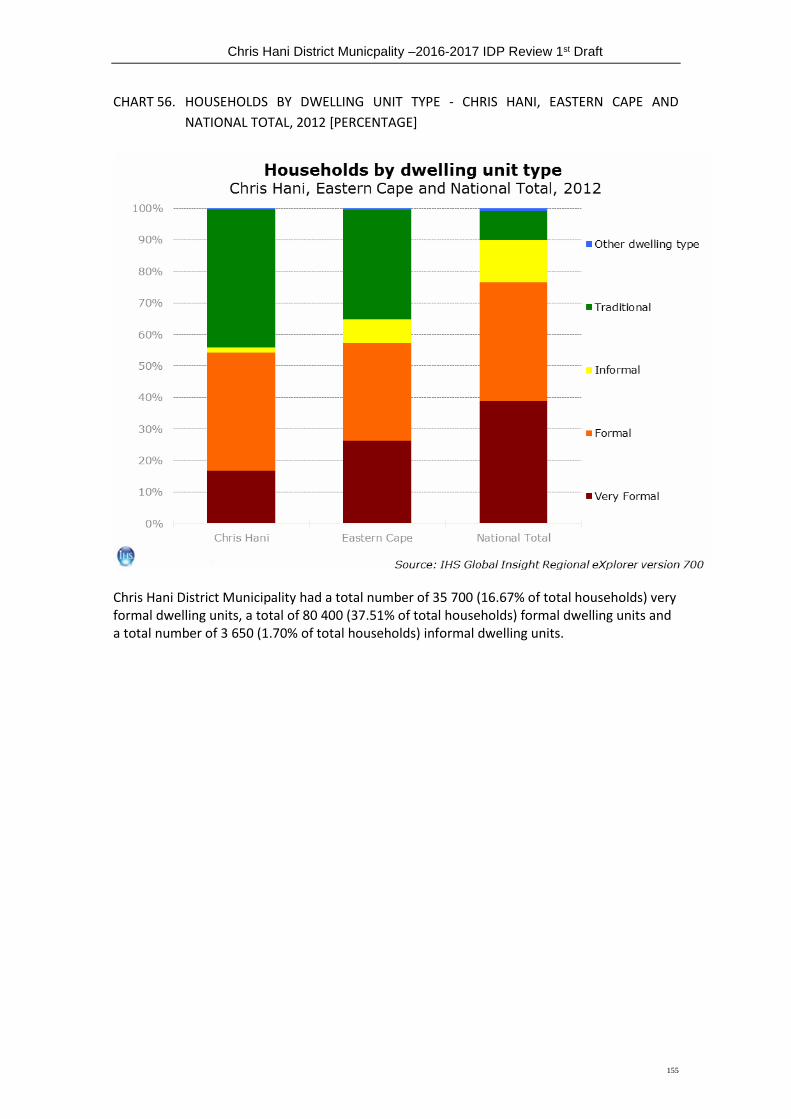
Chris Hani District Municpality –2016-2017 IDP Review 1st Draft
155
CHART 56. HOUSEHOLDS BY DWELLING UNIT TYPE - CHRIS HANI, EASTERN CAPE AND
NATIONAL TOTAL, 2012 [PERCENTAGE]
Chris Hani District Municipality had a total number of 35 700 (16.67% of total households) very formal dwelling units, a total of 80 400 (37.51% of total households) formal dwelling units and a total number of 3 650 (1.70% of total households) informal dwelling units.
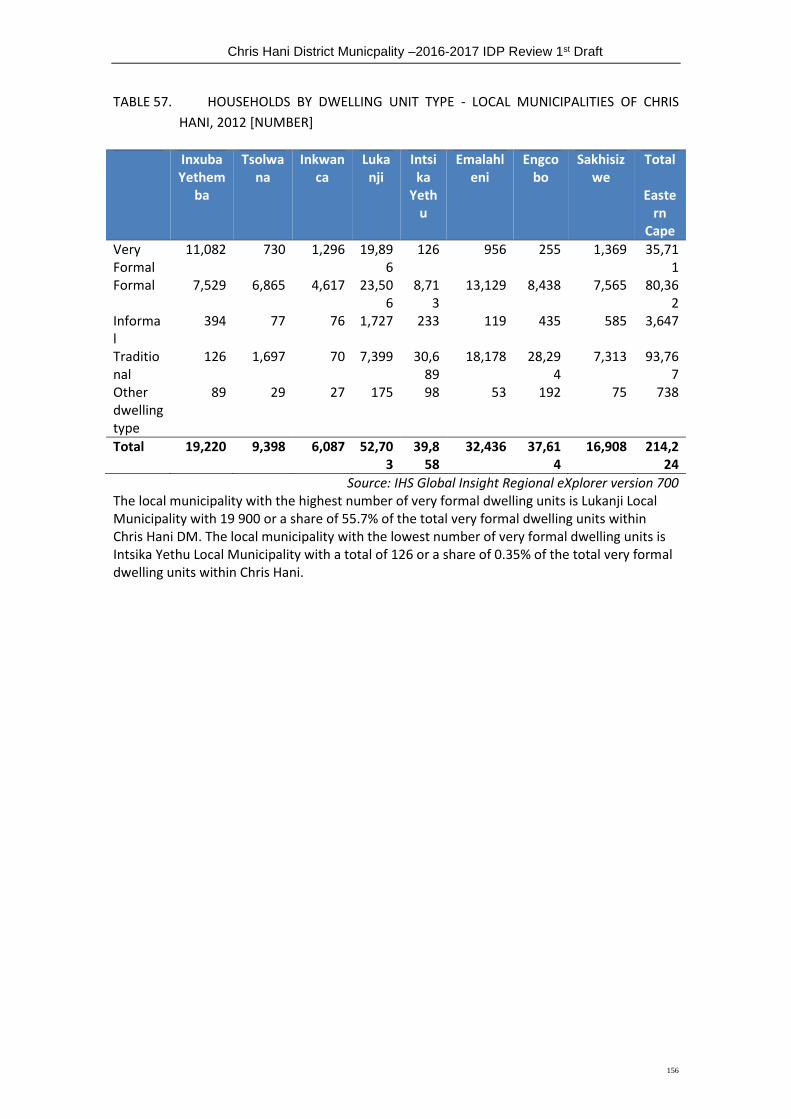
Chris Hani District Municpality –2016-2017 IDP Review 1st Draft
156
TABLE 57. HOUSEHOLDS BY DWELLING UNIT TYPE - LOCAL MUNICIPALITIES OF CHRIS
HANI, 2012 [NUMBER]
Inxuba Yethem
ba
Tsolwana
Inkwanca
Lukanji
Intsika
Yethu
Emalahleni
Engcobo
Sakhisizwe
Total
Eastern
Cape
Very Formal
11,082 730 1,296 19,896
126 956 255 1,369 35,711
Formal 7,529 6,865 4,617 23,506
8,713
13,129 8,438 7,565 80,362
Informal
394 77 76 1,727 233 119 435 585 3,647
Traditional
126 1,697 70 7,399 30,689
18,178 28,294
7,313 93,767
Other dwelling type
89 29 27 175 98 53 192 75 738
Total 19,220 9,398 6,087 52,703
39,858
32,436 37,614
16,908 214,224
Source: IHS Global Insight Regional eXplorer version 700 The local municipality with the highest number of very formal dwelling units is Lukanji Local Municipality with 19 900 or a share of 55.7% of the total very formal dwelling units within Chris Hani DM. The local municipality with the lowest number of very formal dwelling units is Intsika Yethu Local Municipality with a total of 126 or a share of 0.35% of the total very formal dwelling units within Chris Hani.
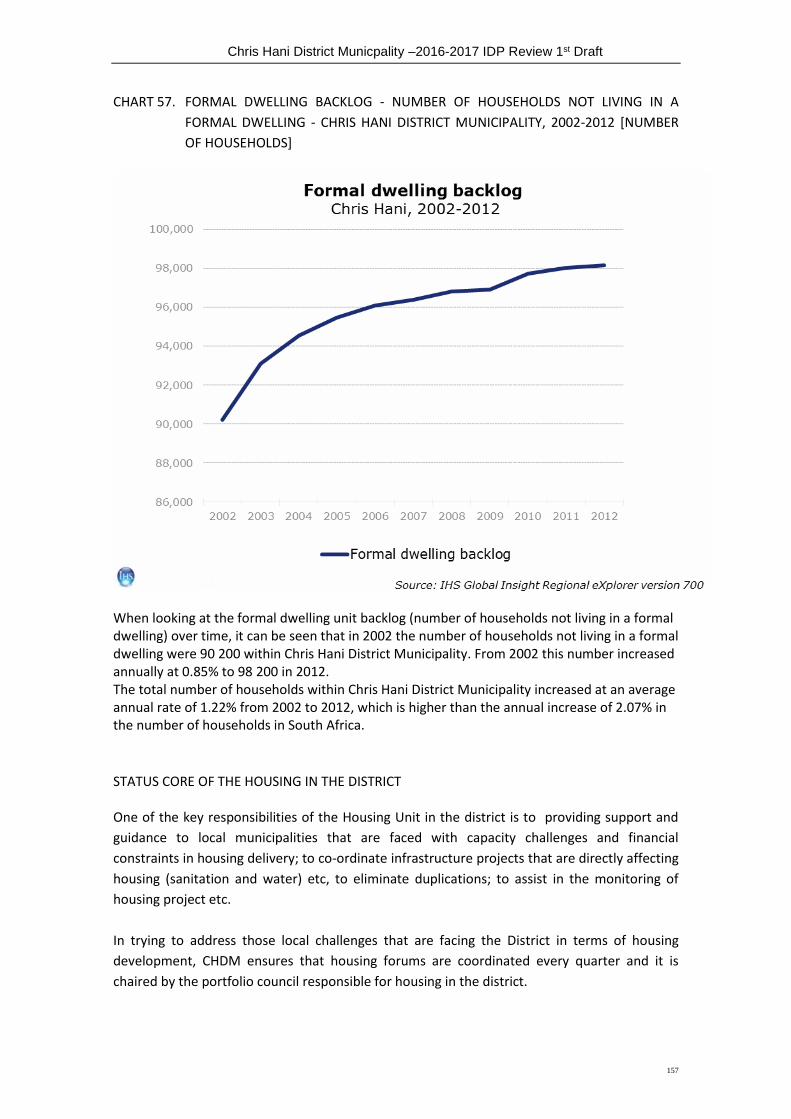
Chris Hani District Municpality –2016-2017 IDP Review 1st Draft
157
CHART 57. FORMAL DWELLING BACKLOG - NUMBER OF HOUSEHOLDS NOT LIVING IN A
FORMAL DWELLING - CHRIS HANI DISTRICT MUNICIPALITY, 2002-2012 [NUMBER
OF HOUSEHOLDS]
When looking at the formal dwelling unit backlog (number of households not living in a formal dwelling) over time, it can be seen that in 2002 the number of households not living in a formal dwelling were 90 200 within Chris Hani District Municipality. From 2002 this number increased annually at 0.85% to 98 200 in 2012. The total number of households within Chris Hani District Municipality increased at an average annual rate of 1.22% from 2002 to 2012, which is higher than the annual increase of 2.07% in the number of households in South Africa.
STATUS CORE OF THE HOUSING IN THE DISTRICT One of the key responsibilities of the Housing Unit in the district is to providing support and
guidance to local municipalities that are faced with capacity challenges and financial
constraints in housing delivery; to co-ordinate infrastructure projects that are directly affecting
housing (sanitation and water) etc, to eliminate duplications; to assist in the monitoring of
housing project etc.
In trying to address those local challenges that are facing the District in terms of housing
development, CHDM ensures that housing forums are coordinated every quarter and it is
chaired by the portfolio council responsible for housing in the district.

Chris Hani District Municpality –2016-2017 IDP Review 1st Draft
158
The forum is comprised of portfolio heads and officials that deals with housing; infrastructure
and town planning in the district and all its 8 local Municipalities; the Department of Human
Settlement in the Province and the Region; Sector departments are also invited to form part
of the forum.
Chris Hani District Municipality has been granted a Developer Status for the construction of permanent emergency houses in the entire district by the Department of Human Settlement. There is currently a backlog of 1300 disaster houses to be developed in the district, of that 427 have been approved for this financial year as follows:-
Intsika Yethu LM = 67
Lukhanji LM = 75
Emalahleni LM = 49
Sakhisizwe LM = 65
Engcobo LM = 73
Tsolwana LM = 44
Inkwanca LM = 24
Inxuba Yethemba LM = 30
CDHM Council took a resolution that CHDM be one of the municipalities that gets the accreditation status. The assignment for accreditation relates to transfer of a function which includes the transfer of the authority role and the right to receive directly the funds and the assets necessary to perform the Human Settlement function. CHDM is busy with the preparatory work that needs to be done for assessment of compliance and capacity for Municipal Accreditation. It appears that CHDM is in a state to apply for Level Two, the level that deals with full programme management and administration of all housing instruments/ programmes;
KEY ISSUES OF THE HOUSING DEVELOPMENT PLAN:
Skills Development
CHDM has signed a Service Level Agreement with Coega Development Corporation on
Advanced Socio Economic Development and Transformation through Infrastructure
Development which includes Skills Development to local labour including internship
programmes, emerging enterprise development including Cooperatives. The scope of work
includes, but no limiting construction of emergency house. Majority of contractors in the
district are in lower grades between 1 and 3 which need support in order for them to deliver
on time, at quality and cost. During the construction of emergency houses Coega will play a big
role on monitoring those local emerging contractors.
Capacitating of LMs
To provide capacity and support to LMs and other stakeholders with regard to housing delivery
in line with Housing Act. Guide LMs on how to develop their Housing Sector Plans, assist in the
monitoring of housing projects, give support on planning and implementation of subsidy
projects towards integrated settlements, Coordinating the formulation and review of housing
policy and legislation.
Chris Hani District Municpality –2016-2017 IDP Review 1st Draft
159
CHDM plan will address the following issues; ensure that housing project benefit the local
economy through all the housing programmes in the district. It will ensure that local people
are the first preference in terms of employment in the housing project and that building
material for the projects is purchased on the local suppliers of the district.
These housing programmes are all driven by an existing Housing Steering Forum which
involves all Local municipalities in the district: -Housing Portfolio Heads; Municipal Housing
Managers/officials; Department of Housing in the district and other stakeholders are invited
when it’s necessary.
Main functions of the HSCF
To discuss housing challenges and housing demands as to get solutions
To discuss progress reports submitted by the LMs on their housing projects.
Identify ways of providing capacity to those LMs that are lacking and also discuss other
related housing issues.
Subsequent to the role that the district will play on housing development the CHDM in
partnership with Coega Development Corporation intends signing an Agreements on Advanced
Socio Economic Development and Transformation through Infrastructure Development which
includes Skills Development to local labour including internship programmes, emerging
enterprise development including Cooperatives. As well as growing local Manufacturing
especially Concrete and Timber Products, Cooperative Forum is mostly targeted in the CHDM
area.
Telecommunication
Telkom is currently expanding its public phone infrastructure in the rural homeland areas with
the result that the majority of Chris Hani residents do have access to some sort of telephones.
Cellular phones cannot be used in all areas of the District due to the mountainous terrain,
which disrupts television, radio and cell phone reception. The investment into
telecommunications infrastructure is further hindered by vandalism and theft. Cellular and
television providers should be lobbied to increase their network coverage in these areas so
that consumers can experience a more satisfactory service.
There is still very limited access to fax and computer / internet facilities. GCIS has recently
completed a survey whereby they wish to install a multi-purpose facility that will give
community members access to all tele-communication facilities in each municipality.
The only existing facilities of this nature are currently located at the Qamata Great Place in the
Intsika Yethu Local Municipal area, Thusong Centres and at Ngcobo town.
OVERVIEW OF CHDM TRANSPORT MASTER PLAN When considered from a transport perspective, the Chris Hani District is of importance not
only to the local socio-economic climate, but also to the country as a whole. There are two
national roads passing through the district in a north-south direction i.e. the N10 and N6 as
well as two rail lines. The two rail routes links Port Elizabeth and East London to the interior.

Chris Hani District Municpality –2016-2017 IDP Review 1st Draft
160
The main east-west road corridors are along the R61 from Cradock, through Queenstown and
beyond, the R359 from Queenstown through Lady Frere and Cala to Elliot and the R56 from
Queenstown through Sterkstroom, Molteno and Steynsburg to Middelburg.
The CHDM Transport Master plan has been carried out to prepare the District meet the
demand for safe transport services and facilities. The Master plan positions the District to offer
maximum accessibility to the amenities offered in cities and towns throughout the District and
the many tourist facilities in the neighborhood. The Master plan intends to provide guidance
on the infrastructure requirements to improve major roads and key facilities in towns, signage
to guide visitors and public transport services and facilities.
The district is currently committed to the implementation of the Transport Master plan.
Therefore the intention will be a joint effort with local Municipalities contributing to
implementation in their areas.
The structure of the CHDM Transport Master plan includes the following chapters:
Travel Demand and Situational Analysis
Data Collection and Assessment
Transport Operational Plan:
- Infrastructure Plan
- Public Transport Plan
- Aviation Plan
- Rail Plan
- Local Mobility Plan
- Information and Signage Plan
- Safety and Security Plan
- Transport Management Plan
Branding and Marketing
Contingency Plans
Implementation and Evaluation Plan
The CHDM Transport Master plan also contains a clear set of recommendations to prepare the
District to compliment the transportation services. By preparing this Master plan, the District
shows its commitment and pursues the implementation of the Plan as a matter of priority.
Taxi services
There are 21 registered taxi associations operating in the 16 towns situated within the Chris
Hani District. According to the Registrar there are approximately 1 600 active members in the
different associations.
This figure excludes operators who are using sedans and bakkies/LDV. It is evident that there
are some differences between the Registrar and Taxi Associations due to the frequency of the
update of the Registrar’s database.

Chris Hani District Municpality –2016-2017 IDP Review 1st Draft
161
From the records of the Registrar, there are currently 304 registered taxi routes in the Chris
Hani District. Bakkie taxis comprise a significant percentage on the routes i.e. +/- 60 % and are
dominant in Engcobo, Cofimvaba, Cala and Tsomo. The sedan operation is largest within the
Lukhanji Municipality and particularly Queenstown.
Due to the large number of passengers using taxis in the District, as well as the flexibility of the
taxi industry, taxis are the most prominent form of local public transport. The type of vehicles
operating in the field varies from the typical minibus, to light delivery vehicles (LDVs) and
sedan or passenger cars. There are also many more routes between settlements than there
are within settlements. This can be explained by the fact that most of the settlements in Chris
Hani are small and thus there is not a great demand for motorised travel within the settlement
boundaries. Most daily activities can be accomplished on foot since the distance to be
travelled is relatively small in comparison to the greater distances between settlements.
Bus Services
There are currently 31 bus operators in CHDM according to the local ECDRT office but only 11
of these have operating permits and the buses only operate in four of the eight district
municipalities. The buses operate on 49 routes of which nine are subsidised. Operations on the
subsidised routes were suspended due to feasibility and/or un-roadworthy vehicles. Africa’s
Best 350 scheme has brought16 new buses to the CHDM routes.
Long distance travel
There are marked increases in the number of long distance journeys undertaken during holiday
periods such as Christmas (December-January) and Easter (April school holidays), whereas
during out-of season times there may be no services on those routes, depending on the mode.
Long distance routes include a number of important destinations and include both road and
rail based services. There is a close relationship between local and long distance public
transport services – passengers from outlying areas would be transported on a local service to
reach a main settlement and from there transfer onto a long distance service.
Even though long distance travel in Chris Hani resembles a corridor and feeder system, there is
little coordination between and within the schedules and frequencies of modes and equally
little consolidated information available on long distance travel.
Freight Transport
In Chris Hani, the main freight movement corridors are mainly along the national routes. Cargo
is transported nationally through the district from/to the coastal towns of East London and
Port Elizabeth primarily to/from Gauteng. The freight is moved by either road or rail. There are
no major freight generators within the Chris Hani District other than the typical economic
activities in the larger urban area, such as Queenstown.
The movement of freight has become more and more road based in the past few decades. The
busiest route being the N10 carries more than 100 long/large heavy vehicles per day. This
amount to approximately 10 interlinks per hour along the route.
Chris Hani District Municpality –2016-2017 IDP Review 1st Draft
162
Rail freight
There are two primary railway lines passing through the Chris Hani District in a north-south
direction. They are the East London – Bethulie route (passing through Queenstown,
Sterkstroom and Molteno) and the Port Elizabeth – Cradock – Carlton route. There were also a
number of other lines in the district but these are not in use or the lines have been lifted.
Rail Services
The Shosholoza Meyi operated by Transnet Freight Rail operates along two north-south routes
through the municipality. The two routes are the following:
• Johannesburg – Bloemfontein – Cradock – Port Elizabeth
• Johannesburg – Bloemfontein – Cradock – Port Elizabeth
• Johannesburg – Bloemfontein – Molteno – Sterkstroom – Queenstown –
• Cape Town – Colesberg – Molteno - Sterkstroom – Queenstown – East London
The area is served well with rail service. These services are mostly passenger services but carry
limited freight.
Air Services
There are not scheduled air services to and from any airports/airfields in the Chris Hani
District. There are several airstrips near the larger towns. All the airstrips are unsurfaced,
except the Queenstown airfield, which has one surfaced runway. There are a total of 10
airfields/airstrips located in Chris Hani. The airfields are mostly used for recreational and
tourism activities.
Non-motorised Transport
Planning for non-motorised transport (NMT) has historically been neglected even though it is
an important method of transport. The main issues witnessed during the assessment process
were the unavailability of safe pedestrian facilities, such as walkways and shelters, and
accommodation for people with disabilities.
Walking is a major mode of transport in the CBD areas. The surveys indicated that the highest
numbers of pedestrians are found in the CBD’s of Queenstown, Cofimvaba, Engcobo, Lady
Frere and in Cradock and Middelburg. Pedestrians face many problems due to the limited
availability of pedestrian facilities.
Scholar Transport
The importance of intervention in a scholar transport system has its roots in the fact that
education levels are low throughout the District, with a literacy rate of 47.1%. It has been
found that one of the reasons that contribute to the low levels of education is the lack of
convenient access to schools resulting in long travel times, mostly by walking to school.
The issues that the Chris Hani District faces with respect to public transport are the following:
Multiple small taxi operators that are tied to geographical locations are inflexible and
are difficult to coordinate and integrate in a larger system
Buying power of individual taxi operators is very low.
Vehicle capacities are not necessarily suited to the demand
Rail and subsidised buses operated at regional level and are not integrated into local
planning
Chris Hani District Municpality –2016-2017 IDP Review 1st Draft
163
Operator and regulatory fixation with vehicle type and layout discriminates against
passenger volumes / needs and does not provide operational flexibility
The overloading of heavy vehicles is a major contributor to the premature failure of
road pavements .
Gravel roads often become impassable in wet weather, isolating settlements that can
only be reached by such means. .
The large number of stray livestock on roads.
Poor management and supply of transfer facilities.
Derelict passenger rail lines and stations
Insufficient vehicle testing and licensing facilities
Unavailability of public transport facilities (including for the disabled)
Lack of cooperation between Public Transport Operators and the Municipal Authorities
Lack of Institutional capacity at Local and District level to manage transport planning
and implementation.
Insufficient supply of taxi related information, especially bakkie and sedan operations.
Outdated information at the Taxi Registrar
Lack of pedestrian and non-motorised transport facilities
Lack of accident database for the Chris Hani District
Lack of District Road Maintenance Programme
Inadequate pedestrian signs and markings and off loading areas especially within CBD
areas
Limited traffic calming measures within areas of high accidents
Low visibility of traffic officials and law enforcement
Insufficient supply of taxi related infrastructure
Public transport in the rural areas is reliant on bakkies
By-laws limiting the operation of hawkers on side-walks are not implemented or
proclaimed.
Recommendations
Public transport should provide connectivity where private transport is unfeasible
Each settlement condition requires a particular development and transport approach
Strong land use management should be accompanied by integrated transport
provision to achieve more compact, efficient settlements and transport services
Tourism potential should not be ruined by uncontrolled settlement growth or
insensitive transport connections

Chris Hani District Municpality –2016-2017 IDP Review 1st Draft
164
2.6.6 MUNICIPAL HEATH SERVICES
Municipal Health encompass the following services as detailed in the Constitution of the RSA, part B of schedule 4, and National Health Act, 61 of 2003:
(1) Water (a) Monitoring water quality and availability, including mapping of water sources.
Enforcement of laws and regulations related to water quality management.
(b) Ensuring water safety and acceptability in respect of quality (microbiological,
physical and chemical), and access to an adequate quantity for domestic
use as well as in respect of the quality of water for recreational, industrial,
food production and any other human and animal use.
(c) Ensuring that water supplies are readily accessible to communities and to the
planning, design, management and health surveillance.
(d) Ensuring monitoring of and effective waste water treatment and water pollution
control, including the collection treatment and safe disposal of sewage and other
water borne waste and surveillance of the quality of surface water (including the
sea) and ground water.
(e) Advocacy on proper and safe water usage and waste water disposal.
(f) Water sampling and testing in the field and examination and analysis in a
laboratory.
(2) Food Control
(a) Food safety in respect of acceptable microbiological and chemical standards and
quality of all food for human consumption and optimal hygiene control throughout
the food supply chain from the point of origin, all primary ground, or raw products
production up to the point of consumption.
(b) Food inspection at production, distribution and consumption area.
(c) Informal Street trading monitoring.
(d) Food premises inspection and control of statutory nuisances.
(e) Enforcement of food legislation and Codex Alimentarius.
(f) Food quality monitoring programmes and principles through various techniques e.g
HACCP audits.
(g) Promote the safe transportation, handling, storage and preparation of foodstuffs
used in the Primary School Nutrition programme (NSNP), Prisons and Health
establishments, Airports etc.
(h) Promote safe handling of meat and meat products including meat inspection and
examination at abattoirs.
(i) Promote the safe handling of milk and milk products
.
3) Waste Management
(a) Waste management and general hygiene monitoring including:
(b) Ensuring proper refuse storage, collection, transportation and transfer, processing
and materials recovery and final disposal.

Chris Hani District Municpality –2016-2017 IDP Review 1st Draft
165
(c) Liquid waste management including sewage and industrial effluents.
(d) Ensuring the proper storage, treatment collection, transportation, handling and
disposal of health care waste and hazardous waste.
(e) Sampling and analysis of any waste or product (sewage) refuse or other wastes.
(e) Investigations and inspections of any activity relating to the waste stream or any
product resulting there from.
(f) Advocacy on appropriate sanitation.
(g) Control of the handling and disposal of diseased animal tissue.
(h) Ensuring safe usage of treated sewage sludge and the health and safety of
reclaimed waste.
(i) Ensuring waste management including auditing of waste management systems
and ensuring the “cradle to grave” approach is adhered to.
(4) Health Surveillance of Premises and these includes -
(a) Environmental Health Impact Assessment including housing projects and indoor
air quality monitoring.
(b) Assessment of factors including ventilation, lighting, moisture-proofing, thermal
quality, structural safety and floor space.
(c) Assessment of an overcrowded, dirty or unsatisfactory condition in any residential,
commercial, industrial or other occupied premises.
(d) Monitoring all buildings and all other temporary or permanent physical structure
for residential, public or institutional use (including health care and other care,
detainment, work and recreation including travel, tourism, holiday resorts and
camping sites) as well as the facilities in connection therewith and the immediate
precincts thereof.
(e) Ensuring the urban and rural land-use planning and practices that are conducive to
sustainable development through sound environmental health impact and other
assessments.
(f) Ensuring prevention and abatement of any condition on any premises which is
likely to constitute a danger to health.
(g) Ensuring the health safety of the public passenger transportation facilities such as
busses, trains, taxis, boats and aeroplanes as well as all other facilities in
connection therewith.
(h) Ensuring compliance with the principles of agenda 21, Healthy Cities approach to
integrated service rendering and the practical minimizing of any detrimental
environmental health risk.
(5) Surveillance and prevention of Communicable diseases which excludes Immunizations.
(a) Health and hygiene promotion aimed at prevention of environmentally induced
diseases related communicable diseases
(b) Collection, analysis and dissemination of epidemiological data and information.
(c) Use of Participatory Hygiene and Sanitation Training (PHAST) approaches
for effective control measures at community level.
(d) Epidemiological surveillance of diseases.

Chris Hani District Municpality –2016-2017 IDP Review 1st Draft
166
(e) Establishment of effective Environmental Health Surveillance and Information
System at different spheres of governance.
(f) Develop environmental health measures with protocols with reference to
epidemics, emergencies, diseases and migrations of populations.
(6) Vector control monitoring which includes: -
(a) Identification of vectors, their habitats and breeding places.
(b) Vector control of public health interest including the control of arthropods, molluscs,
rodents and other alternative hosts of diseases.
(c) Removal or remedying of conditions resulting in or favouring the prevalence or
increase of rodents, insects, disease carriers or pest.
(d) Residual spraying of premises and surrounds.
(e) Investigate zoonotic diseases and other vector borne diseases in the working and living
environment.
(f) Surveillance of imported cargo and livestock for the prevalence of disease vectors.
(g) Serological tests of rodents, dogs and other pets.
(7) Environmental Pollution Control
Including: -
(a) Ensuring hygienic working, living and recreational environments.
(b) Identification of polluting agents and their sources,like air, land and water.
(c) Conducting environmental health impact assessment of development projects and
policies, including Major Hazardous Installations.
(d) Identifying environmental health hazards and conduct risk assessment and
mapping.
(e) Accident prevention e.g. paraffin usage.
(f) Approval of environmental health impact reports and commenting on
Environmental Impact Assessment applications.
(g) Ensuring clean and safe air externally (ambient and point sources), including
emission inventories monitoring, modeling and toxicological reports reviews and
complaint investigations.
(h) Control and prevention of vibration and noise pollution.
(i) Prevention and control of land pollution detrimental to human, animal or plant life.
(j) Ensuring compliance with the provisions of Occupational Health and Safety Act
and its regulations including anticipation, identifying, evaluating and
controlling of occupational hazards.

Chris Hani District Municpality –2016-2017 IDP Review 1st Draft
167
(k) Preventative measures required to ensure that the general environment
is free from risk health.
(l) Ensuring the registration, permitting, monitoring and auditing of all industries,
activities, trade, etc, which involves the control of internal impacts on the worker
and external impacts on the community and the environment.
(m) Infrastructure integrity management including pipelines and tankage.
(n) Ensuring emergency preparedness under abnormal operating conditions and
disasters jointly with other role players.
(o) Develop sustainable indicators appropriate for monitoring the effectiveness of
environmental management systems of industry.
(8) Disposal of the Dead
(a) Control, restriction or prohibition of the business of an undertaker or embalmer,
mortuaries and other places or facilities for the storage of dead bodies.
(c) Regulating, control and prohibition of graves, cemeteries/ crematoria
and other facilities for the disposal of dead bodies.
(d) Manage, control and monitor exhumations and reburial or disposal of human remains.
(9) Chemical Safety
Including: -
(a) Listing of all operators, fumigation firms, formal and informal retail
premises, which deal with the manufacturing, application, transport and storage of
chemicals.
(b) Permitting and auditing of premises e.g. Scheduled Trade permit.
(c) Facilitating pesticides and/or chemical safety advice, education and
training.
(10) Noise Control
(a) Assessment of the extent of noise pollution and its effect on
human health.
(b) Facilitate noise control measures.
(c) Measuring of ambient sound and noise levels.
(11) Radiation (Ioning and Non Ionosing) Monitoring and Control
Including: -
(a) Ensuring that ionising and non-ionising radiation sources are registered with
Department of Health.
Chris Hani District Municpality –2016-2017 IDP Review 1st Draft
168
(b) Ensuring that the registered ionising and non-ionising radiation sources meet
the license conditions.
(c) Monitoring the safe transportation of radioactive material to ensure
compliance.
(d) Ensuring that radioactive sources are licensed with the Nuclear Energy Council
of South Africa.
(e) Ensuring that all radiation material wastes from hospitals and other licensed
establishments are properly disposed of.
(f) Ensuring safety against any form or sources of electro-magnetic radiation.
(12) Control of Haradious Substances
In terms of control/monitoring the following is undertaken by the district:-
(a) Ensure that substances are correctly labeled.
(b) Ensure that all active ingredients are indicated.
(c) Ensure that warning signs are indicated.
(d) Ensuring that precautions are taken during storage/transportation and appropriate
protective gear is utilized during handling.
(e) Ensure that all substances are registered with the Departments of Agriculture and
Environmental Affairs.
(f) To ensure control of substances to prevent injury, ill-health or death by reason of
their toxic, corrosive, irritant or flammable nature.
(g) To control the importation, manufacture, sale, operation, application, modification
or dumping of such substance.
(h) To undertake licensing and registration of premises.
(i) Inspection of premises to ensure safety, storage, compliance, precaution measures,
etc.
(j) Ensure sampling is done according to approved procedure.
(k) Ensure that all labeling regulations are complied with.
(l) Check on all stock records and ensure hazardous substance register is up-dated.
(m) Ensure that empty containers are disposed of according to statutory requirements.
Background and Status of Municipal Health Services in the District Municipal area
The significant role that Environmental Health Services play in the economy and health
systems of South Africa has been overlooked for many years and we hope that this process will
open more doors for dialogue to promote and develop the service and the profession to serve
its purpose to ensure that our communities live, work and recreate in accordance with their
constitutional right, in a healthy and safe environment.
Chris Hani District Municpality –2016-2017 IDP Review 1st Draft
169
Environmental Health Services were in the past and in some cases still are fragmented with the
different service providers such as local, district and metropolitan municipalities as well as the
provincial department of health that rendered the services in the same areas, everybody
mainly focusing in another angle of environmental health. Governments aim was to rationalise
the health services and therefore they introduced a local government based District Health
System as the vehicle to render Primary Health Care services to the communities. Therefore
the Constitution made mention of the term municipal health services as a local government
function.The latest developments in the delivery of environmental health service by local
authorities are influenced and directed therefore, by the Constitution of the Republic of South
Africa, 1996 (Act 108 of 1996), that first promulgates three categories of municipalities,
namely A – metropolitan municipalities, B – local municipalities and C –district municipalities.
It also makes mention of municipal health services under Part B of Schedule 4 of the
Constitution, which is a responsibility of the Metropolitan and District Municipalities in
accordance with section 84(1) of the Municipal Structures Act, 1998 (Act 117 of 1998) and
section 32(1) of the National Health Act, 2003 (Act 61 of 2003). Municipal health services are
also included in the term health services in the last mentioned act.
Nevertheless, the term municipal health services that are allocated to metropolitan and
district municipalities, includes a list of selected environmental health services (EHS) activities
and aspects. Therefore, the metropolitan and district municipalities are the authorities to
implement and render municipal health services. In view of the latter, our Council had in 2006
conducted section 78 assessment in order to fully inform the process of transferring municipal
health services from category B municipalities and the Province back to where they belong in
terms of the afore mentioned pieces of legislation. Since that time, to date, this process
presented a number of financial and human capital challenges. As a result, the transfer of staff
although done it had some challenges which are to be ironed for good.
The matrix above will take cognisance of the population ratio as dictated by the national
norms and standards, which categorically states that one (1) EHP per 15 000 population.
Internal stakeholder relations
The diagram below shows the relationship this unit has with other departments within CHDM
that continuously support this unit in an endeavour to achieve its fundamental objectives and
goals. This relationship is existing despite challenges that are however manageable.

Chris Hani District Municpality –2016-2017 IDP Review 1st Draft
170
Sanitation Resource Centre
The main purpose of the centre is to promote safe sanitation within the district and also
educate communities on health and hygiene practices.
2.6.7 ENVIRONMENTAL MANAGEMENT This Environmental Management unit is legislatively informed by the National Environmental
Management Act 107 of 1998 wherein its function is to address environmental management
and climate change related issues. Critical to this unit is the development of a district wide
Climate Change response Strategy. This will be done in collaboration with all other interested
and affected stakeholders. The strategy will address adaptation and mitigation measures in an
attempt to conserve the natural resources that exist within the district. This unit strides to
ensure realization of Section 24 of the Constitution wherein it is stated that everyone has the
right to an environment that is not harmful to their health or well-being; and to have the
environment protected, for the benefit of present and future generations, through reasonable
legislative and other measures that prevent pollution and ecological degradation, ensuring
conservation and ecologically sustainable development and use of natural resources.
1. Waste Management
Chris Hani District Municipality is not performing the task of refuse removal. The refuse
removal services are performed by the local municipalities and in this case the 8 local
municipalities performing this task of refuse removal are Lukhanji, Sakhisizwe, Inxuba
Yethemba, Ngcobo, Emalahleni, Tsolwana, Intsika Yethu and Inkwanca local municipalities.
The local municipalities provide high quality standards of waste management services
considering their rural nature and economic stress. Waste is collected on a daily basis in town
and in urban residential areas and townships the waste is collected twice a week.
Departmental Links - MHS
10
MHS / EMInter Departmental Link with
- Community Services
• Communicable diseases
• TB – Contact tracing
• Medical Waste
•Air Quality Monitoring
• BSFEP
Engineering•Sanitation Co – ordination
•Health and Hygiene
•Environmental Management
(EIA’s)/ EHIA)
•Building Control
•Occupational Health and
Safety
•Pollution Control – Water
•Cemeteries
IPEDLand use planning
Spatial Development
Finance:
Disaster Management
Outbreak response
Awareness campaigns –
Cholera etc

Chris Hani District Municpality –2016-2017 IDP Review 1st Draft
171
There are refuse receptacles in a form of skips and rubbish bins in towns and the refuse
removal vehicles, tractors and trucks are in good conditions. The waste is disposed in the
landfill sites which are managed at local municipal level.
Waste Management Planning and Projects
CHDM assisted all the 8 local municipalities by developing the Integrated Waste Management
Plans. This means that all local municipalities within CHDM have integrated Waste
Management Plans which are currently under review. Through CHDM’s partnership with the
national Department of Environmental Affairs (DEA), Youth Jobs in Waste Programmes are
being implemented in all 8 municipalities in the region. These programmes mainly focus on
waste collection, recycling & sorting of waste, awareness campaigns as well as landfill sites
management. The DEA provided funding and support towards licensing of Cradock landfill site
and rehabilitation of the Whittlesea, Hofmeyer and Dordrecht waste sites. Several EPWP
programmes are implemented in municipalities towards cleansing, establishment of buy back
centres and recycling.
1. Greening and Land Care Programmes
In relation to greening, CHDM has resolved to ‘green’ its events by planting trees as means of
striving to counteract the carbon footprint. Trees are planted for the purpose of greening
especially in towns, villages and schools. As part of greening and land care, CHDM is
implementing job creation projects for correcting environmental degradation by means of
eradicating invasive alien plants and encroaching species like Euryops (Lapesi), Black and Silver
Wattle. The Wattle Eradication Programme and or Land Care Management Programme are
implemented in certain areas of Ngcobo, Lukhanji, Sakhisizwe, Emalahleni and Intsika Yethu
municipalities. The greening and environmental rehabilitation programs have also been
expanded to include research and a management program for Satansbos at Inxuba Yethemba
municipalit. The main objectives for land care and greening programmes are as follows:
Alleviate poverty through responsible environmental management
Create employment for the communities
Promote behavioral change with respect to environmental management
Protect the environment and ensure the safe use of land
2. Environmental Education and Awareness Programmes
Awareness programs are conducted on environmental quality management, land care and
sustainable development in relation to climate change. Observation of environmental days like
Arbor Day, World Environment Day and Water Week helps in raising the awareness in terms of
identified themes for those programs on an annual basis. Environmental education
programmes are also conducted in schools. The impact of these capacity building sessions
cannot be overemphasized as we can see that CHDM is now ready to address the scourge of
climate change and make it beneficial to the citizens of this region through greening, recycling,
and renewable energy initiatives. Environmental education programmes are also conducted in
schools.
Chris Hani District Municpality –2016-2017 IDP Review 1st Draft
172
3. Environmental Planning and Management
Chris Hani DM is in the process of developing Climate Change Adaptation and Mitigation
Strategy as well as the Air Quality Management Plan. The Integrated Waste Management Plans
are under review. The environmental planning tools currently used are the Environmental
Management Plan and the Spatial Development Framework. Several capital projects which
require Environmental Impact Assessment are included in the list of CHDM’s capital projects in
this document.
4. District Wide Environment and Climate Change Forum
In February 2012, CHDM hosted a District Wide Institutional Strategic planning session in
preparation for a 5 year IDP (2012 – 2017), wherein climate change was prioritised by all
Departments in the name of mainstreaming. Subsequently, a climate change summit was
convened on 27th – 29th February 2012 with a resolution to funcitionalize a district climate
change forum. It is against this background that the Environment and Climate Change Forum
has since been operational. The forum focuses on a wide scope of environment and climate
change aspects affecting the district including local municipalities pertaining to:
Education, awareness and capacity building
Compliance, Legislation and policy (requirement and formulation)
Biodiversity
Waste Management and Air Quality
CLIMATE CHANGE
Climate change is defined as the statistical significant and lasting change in the characteristics
of the climate system. Besides natural processes, climate change may result from human
activities, as is the case with the current climate change concerns. The major concern as a
significant of climate change is the increased emission of greenhouse gases, e.g. Carbon
Dioxide, Methane, Nitrous oxide and Halocarbon gases that contain fluorine, chlorine and
bromine – mainly used in aerosols.
The Impact of Climate Change and International Efforts to deal with the Challenge:
A key characteristic of the current climate change is global warming which refers to the
general increase in surface temperatures across the world. The main concern and urgency
about dealing with climate change is that the process is irreversible. Scientific evidence
gathered from different research activities around the world strongly indicate that the climate
is changing and the main contributor to these changes are human activities.
The use of fossil fuel, e.g. coal, in energy generation is one of the major producers of
greenhouse gases which are destroying the atmosphere resulting in the increase in surface
temperature due to ozone depletion. Other factors that contribute to the climate change
include the use of aerosols, cement manufacture, animal agriculture and deforestation.
The international community is alarmed by the current rapid change in climate, which is
leading to global warming, and this has led to international consultation and attempts to reach
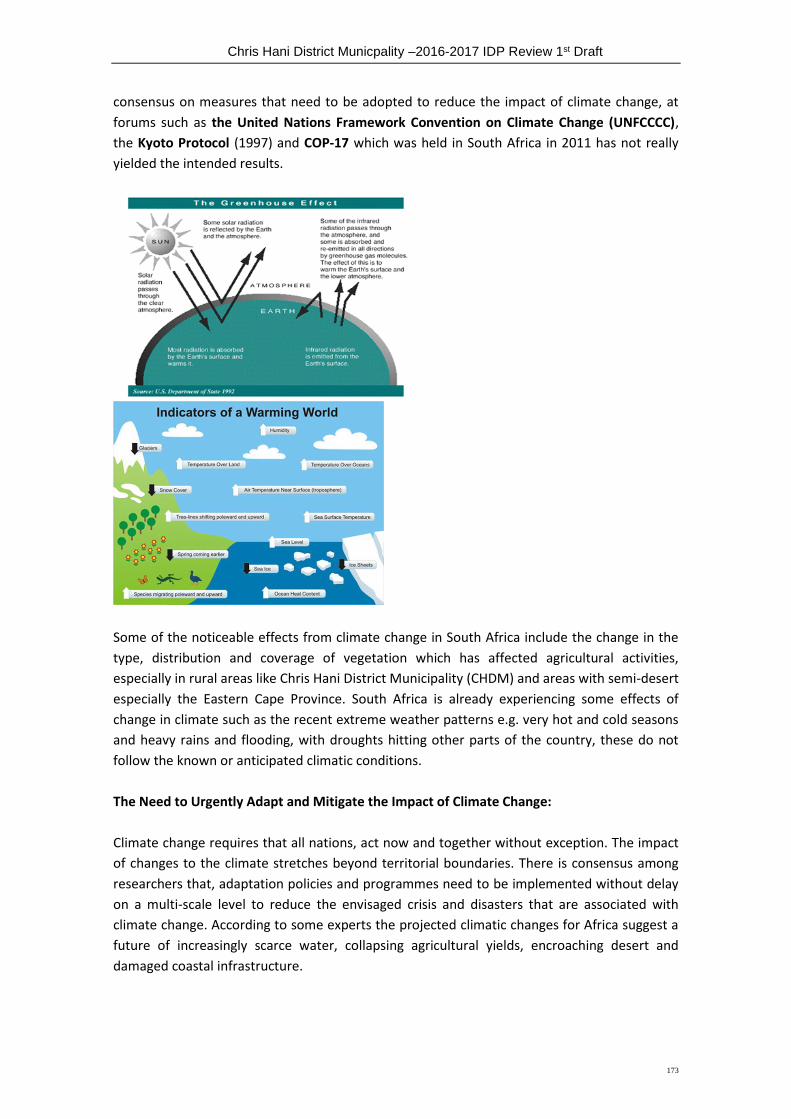
Chris Hani District Municpality –2016-2017 IDP Review 1st Draft
173
consensus on measures that need to be adopted to reduce the impact of climate change, at
forums such as the United Nations Framework Convention on Climate Change (UNFCCCC),
the Kyoto Protocol (1997) and COP-17 which was held in South Africa in 2011 has not really
yielded the intended results.
Some of the noticeable effects from climate change in South Africa include the change in the
type, distribution and coverage of vegetation which has affected agricultural activities,
especially in rural areas like Chris Hani District Municipality (CHDM) and areas with semi-desert
especially the Eastern Cape Province. South Africa is already experiencing some effects of
change in climate such as the recent extreme weather patterns e.g. very hot and cold seasons
and heavy rains and flooding, with droughts hitting other parts of the country, these do not
follow the known or anticipated climatic conditions.
The Need to Urgently Adapt and Mitigate the Impact of Climate Change:
Climate change requires that all nations, act now and together without exception. The impact
of changes to the climate stretches beyond territorial boundaries. There is consensus among
researchers that, adaptation policies and programmes need to be implemented without delay
on a multi-scale level to reduce the envisaged crisis and disasters that are associated with
climate change. According to some experts the projected climatic changes for Africa suggest a
future of increasingly scarce water, collapsing agricultural yields, encroaching desert and
damaged coastal infrastructure.

Chris Hani District Municpality –2016-2017 IDP Review 1st Draft
174
South Africa is a water scarce country, and this natural resource is seriously threatened by the
current global warming that characterizes climate change. At provincial and local government
levels including District like CHDM, this will require more collaboration in seeking solutions and
adapting so that the contributing factors to this phenomenon are reduced.
It is envisaged that the impacts of climate change ‘will be magnified or moderated by
underlying conditions of governance, poverty and resource management, as well as the nature
of climate change impacts at local and regional levels’. In 2008, the Secretary General of the
Organisation for Economic Cooperation and Development (OECD), Angela Guirra, made the
following statement, during a Conference on “Competitive Cities and Climate Change”,
“In our cities, citizens, industries and institutions must respond to the challenges of
technological change and globalisation. In our cities, as elsewhere, we must deal with the
social implications of change (…) Urban areas could (also) play a central role in successfully
addressing global environmental challenges (…) Cities generate almost 70% of total gas
emission. There is no doubt that improvements in urban design, housing stock, traffic
congestion and accessibility, disaster prevention and waste management, are crucial
component of a strategy to combat global warming. If cities fail to deal effectively with
environmental challenges, our planet is in serious trouble”. - Competitive Cities and Climate
Change. OECD Conference Proceedings, 9-10 October 2008, Milan, Italy.
The relevance of this statement can never be under estimated as we see the urgency of the
need for all of us to act decisively in dealing with what has been described as one of the man-
made security threats of this century. Experts gathered at the OECD 2008 Conference
proposed that:
“Strong and effective urban policies that enable cities to benefit from globalising processes
require flexible, multi-level forms of inter-governmental joint action. The need for a multi-level
governance framework for urban development policies is particularly critical for addressing
climate change. City and regional leaders are generally best suited to design strategies for
addressing their own local climate change risks. Likewise, local governments are needed as
partners to implement nation-wide climate change response policies, while at the same time
designing their own policy responses that are tailored to local contexts.”
It is within this background and within the context of South Africa’s experiences and unique
conditions that it has been deemed fit to develop and spearhead the programme on Climate
Change within our CHDM, as part of a District wide adaptation strategy.
2.6.7 Safety and Security
Whilst crime remains a serious issue within the District, the SAPS are undertaking numerous
strategies through which to combat crime. SAPS records the incidence of crime on a daily
basis, and utilises this information to manage the crime situation in the region. The most
significant rises in crime as indicated by the chart below are in indecent assault, residential
burglary and theft not covered in other categories.

Chris Hani District Municpality –2016-2017 IDP Review 1st Draft
175
A study done by the department of Social development have indicated that there is a rise in
the gender based violence index from 0.16 in 2006 to 0.29 which is worrying and can be linked
to the rise in assaults on women.
Some of the key challenges faced by SAPS in addressing crime relate to the poor quality of
some roads which lead to police stations. This is most notable in rural areas. The result is such
that it is difficult for the residents of the area to access police stations. In addition,
infrastructure capacity – particularly with regards to the holding cells is an issue. There is
currently insufficient jail accommodation in the area. As a result, many convicted prisoners are
kept in holding cells.
It is noteworthy that the SAPS boundaries and those of the Local and District Municipalities do
not coincide. As a result, the coordination of activities is often a challenge.
The state of crime in South Africa has been the topic of many media articles and papers in the past years, and although many would acknowledge that the country has a crime problem, very little research has been done on the relative level of crime. The media often tend to focus on more negative or sensational information, while the progress made in combating crime is neglected.
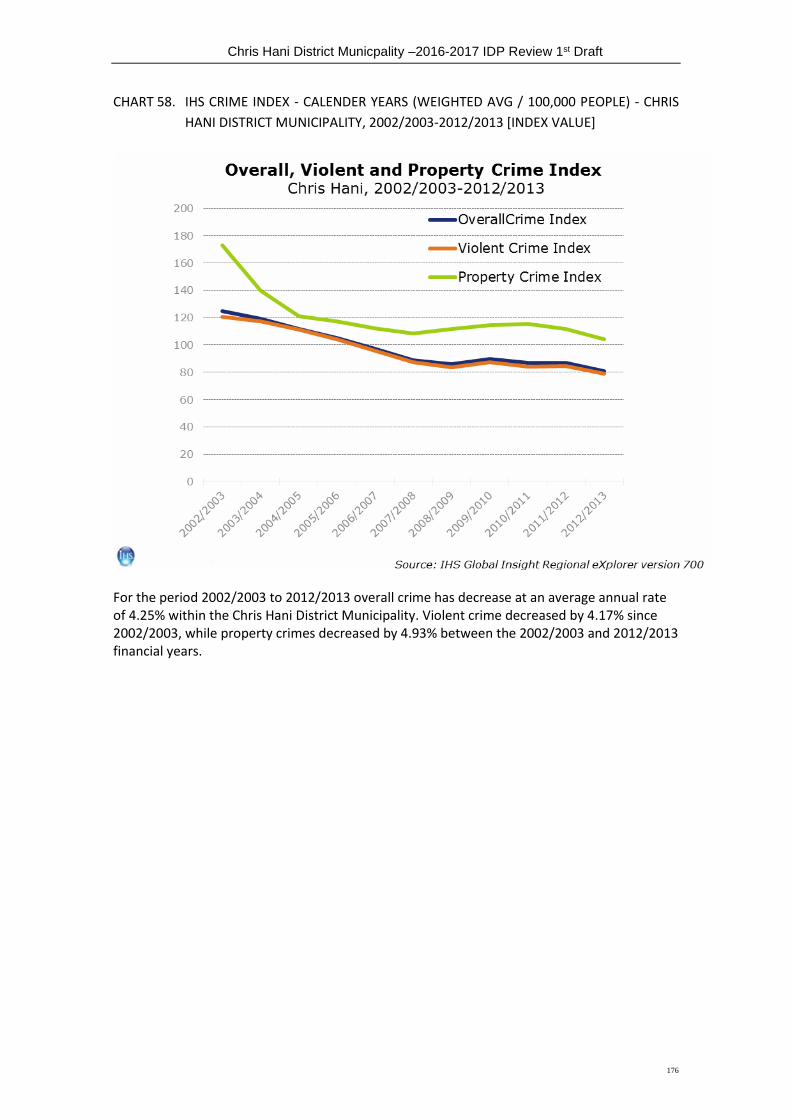
Chris Hani District Municpality –2016-2017 IDP Review 1st Draft
176
CHART 58. IHS CRIME INDEX - CALENDER YEARS (WEIGHTED AVG / 100,000 PEOPLE) - CHRIS
HANI DISTRICT MUNICIPALITY, 2002/2003-2012/2013 [INDEX VALUE]
For the period 2002/2003 to 2012/2013 overall crime has decrease at an average annual rate of 4.25% within the Chris Hani District Municipality. Violent crime decreased by 4.17% since 2002/2003, while property crimes decreased by 4.93% between the 2002/2003 and 2012/2013 financial years.

Chris Hani District Municpality –2016-2017 IDP Review 1st Draft
177
TABLE 58. OVERALL CRIME INDEX - CHRIS HANI DISTRICT MUNICIPALITY AND THE REST
OF EASTERN CAPE, 2002/2003-2012/2013 [INDEX VALUE]
Chris Hani
Nelson Mandela Bay
Buffalo
City
Cacadu
Amatole
Joe Gqabi (Ukhahlam
ba)
O.R.Tambo
Alfred
Nzo
2002/2003 124.91
233.05 199.91
250.30
114.73 121.59 77.78 67.88
2003/2004 118.99
217.35 196.78
242.89
116.67 120.23 81.23 62.21
2004/2005 111.88
215.80 194.11
244.15
116.53 122.89 78.28 62.93
2005/2006 105.28
197.55 175.97
234.94
106.12 110.06 91.55 63.08
2006/2007 97.22
201.13 170.88
228.21
96.52 102.82 73.58 59.13
2007/2008 88.97
178.24 171.28
207.26
92.03 90.47 69.00 59.65
2008/2009 85.86
177.21 168.31
207.38
87.87 83.41 61.86 54.87
2009/2010 89.72
165.82 162.03
201.50
94.61 88.92 65.67 60.44
2010/2011 86.70
162.78 155.79
184.91
95.05 90.80 69.85 56.68
2011/2012 86.73
157.89 156.27
171.22
99.73 93.11 66.97 55.43
2012/2013 80.88
151.44 144.07
160.99
98.08 93.16 65.15 54.81
Average Annual growth 2002/2003-2012/2013
-4.25
%
-4.22% -3.22
%
-4.32
%
-1.56% -2.63% -1.76% -2.12
%
Source: IHS Global Insight Regional eXplorer version 700 In 2012/2013, the Cacadu has the highest overall crime rate of the Districts and Metros within the overall Eastern Cape Province with an index value of 161. Nelson Mandela Bay has the second highest overall crime index at 151, with Buffalo City having the third highest overall crime index of 144. It is clear that all the crime is decreasing overtime for all the regions within Eastern Cape Province. O.R.Tambo has the second lowest overall crime index of 65.2 and the Alfred Nzo has the lowest overall crime rate of 54.8. It is clear that crime is decreasing overtime for all the regions within Eastern Cape Province. The region that decreased the most in overall crime since 2002/2003 was Cacadu with an average annual decrease of 4.3% followed by Chris Hani with an average annual decrease of 4.3%.

Chris Hani District Municpality –2016-2017 IDP Review 1st Draft
178
CHART 59. IHS CRIME INDEX - CALENDER YEARS (WEIGHTED AVG / 100,000 PEOPLE) - CHRIS
HANI, EASTERN CAPE AND NATIONAL TOTAL, 2012/2013 [INDEX VALUE]
From the chart above it is evident that property crime is a major problem for all the regions relative to violent crime.
2.6.8 Disaster Management & Fire Fighting Services CHDM has a well established Disaster Management Centre which was officially opened in
2005. It operates with some avarage staff and with limited resources, on the communication
side this has since been addressed as a world class communication system has been installed
and deals with disasters in terms of issuing of early warnings, receiving calls and dispatching
response vehicles and making Incidents Reports. Within the district there are six Satellite
Centres in that are located in strategic municipalities which are operating with three officials
each which are equipped with information communication systems and linked to all
emergency responses agencies and it it the responsibility of these centres to conduct
vulnerability and risk assessment as they are closer to communities.
These satellite centres are not fully equipped with all proper infrastructures and district is
making in-roads in terms of addressing the bottlenecks. The officials in those satellite centres
are responsible for educating the communities on disaster management risk reduction
practices as embodied in the Disaster Management Act 57 of 2002 and Disaster Management
Framework of 2005 respectively.
Chris Hani District Municpality –2016-2017 IDP Review 1st Draft
179
So as part of thereir daily operations they are to undertake these programmes of conducting
community vulnerability and risk identification. In response to the climate change challenges,
the district will conduct a scientific risk assessment in the next financial year that will inform
the development of a Disaster Management Plan. The municipality adopted its Disaster
Management Plan in 2012-13 and is annually reviewed and adopted by council together with
all other sector plans and is the one that guides and inform how disasters must be managed
and addressesd looking into the Spatial sphere of the district as chapter 4 of the IDP document
broadly explains the Spatial Development Framework of the district.
Within Disaster Management Centre Fire fighting services are located at there, though the
district is responsible for hazardous and veld fires it has also extended its services to the local
municipal areas where resources are not available or insufficient to perform the services
effectively. The district is on a mission of determining the roles and responsibilities of this
function between category B municipalities and Chris Hani DM as this will give effect to
formalization of working relations between these spheres of government as some functions
tend to overlap between CHDM and its LM’s, but this does not mean the function wont be
undertaken as there is a co-operative agreement in between municipalities. Chapter 3 of this
IDP indicates how this process will unfold.
For the year 2015-2020 CHDM has developed CHDM District Fire Srvices Plan with the
understanding that Chris Hani District Municipality is prone to many human- induced and
natural veld, forest and mountain fires which occasionally leads to loss of live-stock, lives or
injuries, property, economical loss and environmental degradation (damage the natural
resources base or adversely alter natural processes or ecosystem. In the past decade, these
fire occurrences have become more frequently and severe. Adetailed analysis is on the plan
itself which can be assessed on municipal website.
HIV & AIDS EPIDEMIC
The issue of HIV&AIDS Coordination needs to be clearly articulated as contained in the
National Strategic Plan on HIV and AIDS, STIs and T.B., DPLG framework and SALGA country
plan of HIV&AIDS within the local government environment. This has been explicitly explained
under the section of demographics above.
HIV AND AIDS PREVALENCE WITHIN CHRIS HANI DISTRICT MUNICIPALITY
Antenatal Sentinel HIV and Syphilis Prevalence Survey for Chris Hani District Municipality show
that HIV and AIDS prevalence was 27.1% in 2006, then increased to 30.2% in 2007, then
decreased to 27.0% in 2008 and remained at 27.0% in 2009 but increased to 30.1% in 2010.
HIV and AIDS prevalence among CHDM employees and councilors was found to be 16% in the
baseline survey conducted by Epicentre in February 2009. CHDM continues to invest in its
communities and its workplaces through implementation of community and workplace
HIV&AIDS programs. In the workplace programmes within CHDM education and awareness
programmes are conducted internally at departmental and at institutional leveI.

Chris Hani District Municpality –2016-2017 IDP Review 1st Draft
180
HIV and AIDS workplace committees within CHDM and in the local municipalities have been
established and they assist in planning and implementing HIV and AIDS workplace
programmes. Peer educators as part of internal programs also assist in identifying
departmental needs and implementation of departmental HIV and AIDS programmes. Peer
educators also capacitated to provide counseling and support to their peer within the
departments. They also assist in condom distribution and monitoring of consumption of
condoms. The prevention programmes are aimed at preventing new HIV, STI and T.B.
infections and re-infections to those already infected HIV Testing and Counseling Services are
continually offered to the employees and councilors in line with programmes and events
conducted to encourage employees and councilors to know their health status which includes
HIV, STI’s and T.B. These programmes are implemented as informed by HIV/AIDS, STI & TB
Workplace Policy which has been adopted by Council towards end of 2013-2014 financial year.
The education programmes also focus on the human rights and as well as responsibilities of
employees. Employees are informed about policies and other legislations to empower them to
know their rights and responsibilities and to be able to exercise these in the context of HIV and
AIDS. Other programmes which are conducted are care and support programmes which are
aimed at providing support to the employees and councilors infected and affected by HIV and
AIDS. These programmes are implemented in partnership with internal and external
stakeholders such as Wellness programme, Special Programmes Unit and other stakeholders.
Individual employees are able to access individual counseling from HIV and AIDS section or
Wellness Programme. Referrals are also made to external services. National and International
calendar events are also commemorated however the focus is more on implementing
programmes for maximum impact.
Chris Hani District Municipality HIV and AIDS unit also provides technical guidance and support
to the Local Municipalities and other stakeholders within the district for the implementation of
internal and external HIV and AIDS programmes. Partnerships have been made with all the
local municipalities within Chris Hani District Municipality for both internal and external HIV
and AIDS programmes in implementing programmes such as Sexually Transmitted Infections
and Condom use promotion, Candlelight memorial and World AIDS day. A policy for
Mainstreaming of HIV and AIDS by all departments within Chris Hani District Municipality, its
local municipalities and district wide has since been developed and it involved all stakeholders
in the process and they will be capacitated for its implementation. All these programmes are
aimed at reducing the impact of HIV and AIDS within the district.
CHDM also coordinates implementation of integrated HIV and AIDS programmes within the
communities through forums such as District AIDS Council, Local AIDS Councils and Ward AIDS
Councils. LACs have been established and inducted in all local municipalities. Ward AIDS
Councils have been established and inducted in six local municipalities. These forums ensure
integrated planning and implementation of HIV and AIDS programmes within the communities.
Some of the programmes of DAC are research conducted during door to door campaigns which
is aimed at identifying service delivery needs of communities as well as educating household
on a numbers of issues such as health and social issues, HIV and AIDS, social grants and other
issues. The District AIDS Council (DAC) has conducted door to door campaigns in the seven
local municipalities.

Chris Hani District Municpality –2016-2017 IDP Review 1st Draft
181
DAC also provides capacity building for its stakeholders on identified capacity needs. As part of
DAC programmes, partnerships have been held with various stakeholders such as Chris Hani
Choral Music Society, Chris Hani Council of Churches, Department of Sport, Recreation, Arts
and Culture and Walter Sisulu University.
Policies and Strategies developed to address and mitigate impact of HIV/AIDS within the
district and these were adopted by council.
HIV and AIDS Workplace Policy adopted in 2007 and later reviewed in 2013-2014 and
adopted by Council.
HIV and AIDS Strategic Plan Document for Workplace Programme developed in 2010,
adopted by council.
District HIV and AIDS Strategy Document 2008 – 2011 has been reviewed in 2012 and
its in the process of finalisation and to be adopted by council.
Mainstreaming of HIV/AIDS, STI & TB Mainstreaming Policy which has been adopted
by Council towards end of 2013-2014 financial year.
Key issues within HIV/AIDS Workplace Strategic Plan developed in 2010 are:
Levels of HIV infection among the participants, according to five-year age bands, are tabulated
on the starategy. HIV infection levels were highest among employees below age 50 years.
Due to the fact that the Chris Hani District Municipality has a relatively older workforce (with
about 60% of the employees tested being over age 40 years) it can be expected that many
employees with HIV infection may be moving into the later stages of infection and that
increasing numbers will be getting sick.
Stigma levels are high, with 99% of the employees surveyed believing that they will lose their
job if they disclose their HIV status. This means that the municipality’s HIV and AIDS policy
needs to be better communicated, and that there is a need for HIV and AIDS-related training
among management personnel in order to enable communication and implementation of the
policy.
The employees appear to face high levels of exposure to HIV; 2 out 3 of those surveyed
reported that they had nursed a person with HIV. Thus, there is a need for more HIV and AIDS-
related training for municipal employees.
Among the municipality’s employees, the peer educators are not effectively training their
peers, and meanwhile they require tool kits to training their peers. This is a serious gap in the
current peer education programme.
The employees generally believe that the municipality’s HIV and AIDS workplace programme is
of value, but they would like it to focus more on HIV and AIDS-related treatment and life skills.
About 50% of the employees surveyed knew their HIV status.
Chris Hani District Municpality –2016-2017 IDP Review 1st Draft
182
Overall, the employees would like VCT offered annually through the workplace.Several other
health problems were reported by the employees: 88 reported having high blood pressure, 17
had asthma, 20 had diabetes, and 54 said they had symptoms of TB. Mental illness is perhaps
the fastest-growing disability problem. The survey found significant levels of mental illness
among the municipal staff who participated. A large number of employees reported symptoms
of stress and depression. About 70 employees said they suffered from stress, did not sleep well
at night, have headaches, or are tired all the time. About 30 employees said they were
depressed. More than 50% of the employees reported money problems and consequently
needed financial training. The results also indicate that gambling is a problem as a large
percentage of the employees reported that they gamble.
CHRIS HANI DISTRICT HIV AND AIDS MAINSTREAMING STRATEGY
The strategic plan document guides Multisectoral coordination of HIV and AIDS programmes
within the district through the District AIDS Council (DAC). The DAC is a multisectoral, multi-
stakeholder structure that is coordinated within the CHDM. It is located in the office of the
Executive Mayor, Chaired by the Portfolio Councilor for SPU, Public Participation and HIV and
AIDS and administratively coordinated within the office of the Director, Health and Community
Services by the HIV and AIDS unit. The DAC has subcommittees that are formulated according
to the priority areas mentioned above. The sub-committees ensure the implementation of the
council programmes and projects that are related to HIV and AIDS within the entire district.
The Strategic Plan focused on 8 Priority areas in response to HIV & AIDS within the Chris Hani
District Municipality area of jurisdiction.
Priority 1: Prevention, Education, Awareness and Condom distribution
Priority area 2: Care and support for people living with HIV and AIDS (PLWHA)
Priority area 3: Care and Support for orphans and vulnerable children (OVC)
Priority Area 4: Circumcision
Priority area 5: Access to Human Rights and Justice
Priority area 6: Research, Monitoring and Evaluation
For the year 2015-2016 financial year CHDM did a major review of the HIV, AIDS, STIs and TB
Mainstreaming Strategy. This workplace strategy is one of the Chris Hani District municipality’s
contribution in the broader national and provincial integrated response to the challenges
posed by the HIV and AIDS pandemic and its purpose is to bring into life the CHDM HIV and
AIDS workplace policy framework through development, co-ordination and implementation of
appropriate HIV and AIDS workplace programmes that include:
a) To help CHDM staff and partners understand the principles and stages in mainstreaming
HIV and AIDS.
b) To develop a clearer understanding amongst staff and partners about integration activities
and holistic mainstreaming.
c) To give practical advice about implementation, through user-friendly, adaptable steps
towards mainstreaming

Chris Hani District Municpality –2016-2017 IDP Review 1st Draft
183
3 CHDM Anti Poverty strategy
The institution developed its own Anti Poverty Strategy taking a tune from the Eastern Cape
Anti Poverty startategy. The main purpose of the strategy is to work on identifying the
challenges that are poverty related and put forward the fundamentals of what the district will
consider as an appropriate responses to address those challenges in an comprehensive, multi
– dimensional, sustainable and well being manner.
The mandate to formulate the strategy derived from various platforms; the Chris Hani District
Municipal Council took a resolution that the strategy be developed.
The overall objective of this strategy is to eradicate poverty. In fighting poverty the strategy
will focus on the creation of economic opportunities and enabling or empowering
communities and individuals to access available opportunities in the district.
The aim is ensure social assistance and provision of basic services and ensure sustainability of
the program by equipping communities to support themselves. Most importantly we aim at
resolving poverty through improving the economic situation of households, by ensuring and
facilitating a coherent approach towards the implementation integrated programmes and
strategies.
The strategy focuses on the following key elements:
Comprehensive understanding of Poverty (definitions, determinants, indexes and
measurements)
Strategic targeting of areas, packaging of programmes that will have the strongest
Poverty Reduction impact
An acknowledgement of each department’s responsibility, and other stakeholders’
responsibilities in ensuring poverty eradication.
Encouraging inclusive and participatory setting of targets and monitoring of outcomes
or success indicators
The facilitation of intergovernmental collaboration, resources mobilisation, allocation
and interrogation
Expanded Public Works Programme & Community Works Programme
The institution is a beneficiary to the national programme of Expanded Public Works
Programme and has developed a policy around EPWP which was adopted by Council in 2010
and reviewed annually. The policy identified Learnership and Job Creation as two key
initiatives that CHDM can implement EPWP.
Learnership
From the programme 23 learner contractors had been appointed for the next intake of
learnersip on EPWP. These contractors are appointed for the period of three years working in
different project i.e. water and sanitation. The project Intsika Yethu Sanitation has been
identified as one of the labour intensive project that will be done by these learner contractors.
Learner contractors were awarded the project Intsika Yethu Sanitation in May 2011.

Chris Hani District Municpality –2016-2017 IDP Review 1st Draft
184
There were challenges with suppliers who do not trust contractors but 16 of them manage to
finish the project in time. The other 7 are still busy on site. The contract duration for the
project is 6 months which ended in February 2012. Due to the delays the contract duration
was extended to end March 2012. Since learnership involve labour intensive and training,
contractors will resume with classroom training from the 2nd of April 2012 for them to qualify
for NQF Level 4. The training will take 8 weeks and after that they will be working on another
Sanitation project under Cemforce construction.
Job creation
Under the EPWP the municipality has also been allocated R16.4million incentive grant for
2013/14 financial year. To earn this allocation, three directorates/ departments within the
institution, IPED, Techical Services and Municipal Health Srevices, are participating on EPWP.
CHDM has a target of creating 3750 work opportunities and 709 Full Time Equivalent (FTE’s)
for 13/14 FY. A total number of 6127 work opportunities have been achieved and 612 FTE’s
achieved in all EPWP projects as was reported to the Department of Public Works. Further
than that the municicpality has earned an amount of R5, 413 million from July 2013 to
December 2014 for the job creation programme.
Since there are Municipalities that are failing to achieve their target due to limited funding, the
Department of Public Works has diverted from the Schedule 8 (performance based) to
Schedule 5/6 (conditional) grant, starting from 1 July 2013. Municipalities will be given 40% of
their allocation upfront and for them to claim the rest they are expected to spend the 40%
first. The Planning Unit unit also does a programme of Paving, Beautification and Greening
through ythe concept of Small Town Revilisation where labour is sourced from the affected
areas and a paid through EPWP incentive. For 2013-14 an amount of R10,5 Million was utilized
on Paving and out of that jobs were created throughout the district in municipalities like
Inkwanca, Tsolwana, Lukhanji, Inxuba Yethemba etc. Following year 2014-15 same amount of
R10,5 Million was also utilized for the same concept. For 16/17 FY our allocation is R9,6 million
with a target of 1200 FTE’s.
Community Works Programme
Community works programme was launched as a pilot project under the auspices of the
Presidency and Social Developmeny in 2007 and was further included as EPWP new element in
2008. Its main aim was to provide a safety net by providind minimum level of regular work
opportunities and to supplement the existing livelihood strategies and reduce poverty and
deprivation amongst unemployed. Within the Chis Hani District Municipality there is only one
municipality not having site by 2013-14 and that is Emalahleni LM. For 2013-14 the
participation rates were as follows
Intsika Yethu= 1000 Target Participants Rates with 300 Original Participation Rate
Sakhisizwe = 1000 Target Participants Rates with 1000 Original Participation Rate
Tsolwana = 1000 Target Participants
Inkwanca = 1000 Target Participants
Lukhanji = 1000 Target Participants
Engcobo = 1000 Target Participants
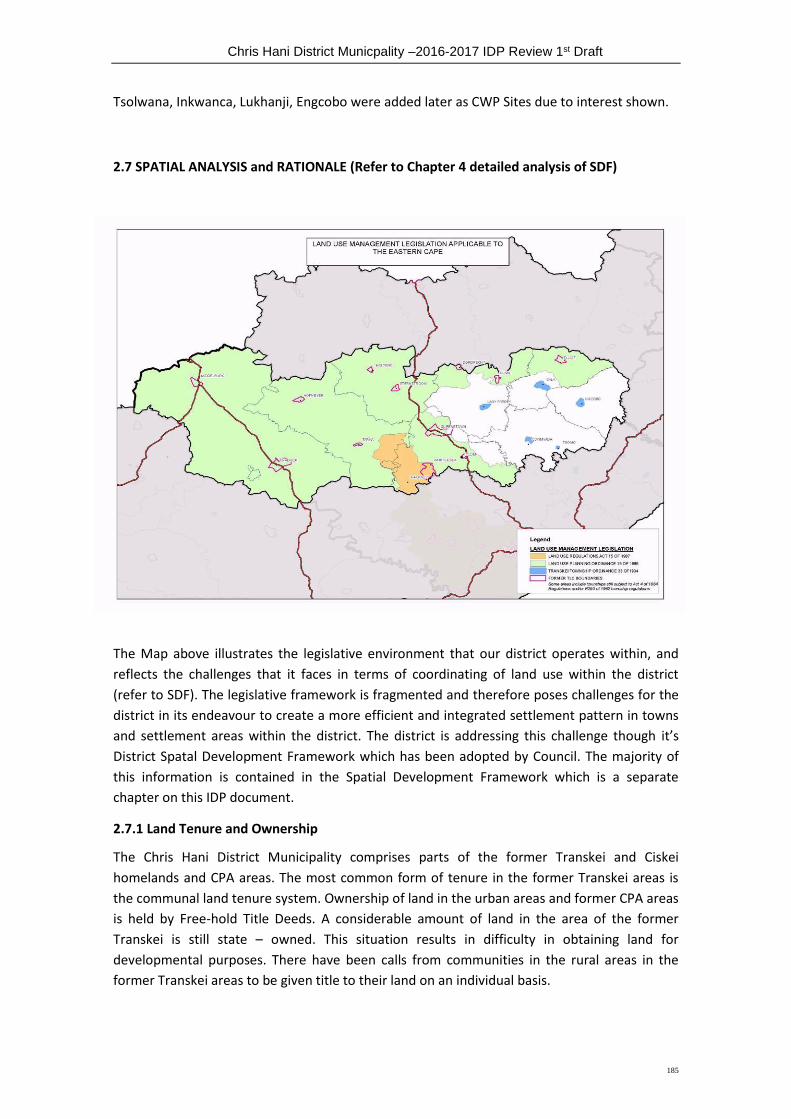
Chris Hani District Municpality –2016-2017 IDP Review 1st Draft
185
Tsolwana, Inkwanca, Lukhanji, Engcobo were added later as CWP Sites due to interest shown.
2.7 SPATIAL ANALYSIS and RATIONALE (Refer to Chapter 4 detailed analysis of SDF)
The Map above illustrates the legislative environment that our district operates within, and
reflects the challenges that it faces in terms of coordinating of land use within the district
(refer to SDF). The legislative framework is fragmented and therefore poses challenges for the
district in its endeavour to create a more efficient and integrated settlement pattern in towns
and settlement areas within the district. The district is addressing this challenge though it’s
District Spatal Development Framework which has been adopted by Council. The majority of
this information is contained in the Spatial Development Framework which is a separate
chapter on this IDP document.
2.7.1 Land Tenure and Ownership
The Chris Hani District Municipality comprises parts of the former Transkei and Ciskei
homelands and CPA areas. The most common form of tenure in the former Transkei areas is
the communal land tenure system. Ownership of land in the urban areas and former CPA areas
is held by Free-hold Title Deeds. A considerable amount of land in the area of the former
Transkei is still state – owned. This situation results in difficulty in obtaining land for
developmental purposes. There have been calls from communities in the rural areas in the
former Transkei areas to be given title to their land on an individual basis.
Chris Hani District Municpality –2016-2017 IDP Review 1st Draft
186
This will ensure tenure security and also safeguard them against future claims from others or
loss through potential reorganization of village land at a later stage. It is envisaged that the
Communal Land Rights Act (Act No. 11 of 2004) also known as ClaRA will inform proposals for
short term actions even though the Municipality will not be able to rely on its provisions until
the Act comes into effect (Emalahleni Housing sector plan).
Spatial planning professionals working within the district are faced with developmental
challenges due to the dynamic legislative character of the district caused by different planning
legislations that are applicable to the different towns in the district. This has led the district to
focus on the creating of development plans that outline the development direction of the key
nodes within our area, namely SDFs, Small town development plans, Land Use Management
systems. These initiative have are new to our district but are evidence of the district and its
LMs’ commitment to the spatial coherent development within the district, ensuring that the
developmental nature of the urban environment thrives to ensure economic growth that
benefits the residents, the business environment and the Local municipalities.
2.7.2 Small Town Development In its endeavour to define the district’s spatial rationale, the CHDM Spatial Development
Framework focuses on the strengthening of linkages between the deferent centres within the
CHDM area and their relationship with centres outside the boundaries of CHDM. This led the
CHDM adopting the Small Town Development approach that is aimed at accelerating
development through alignment of economic activities to ensure value chain addition. The
Small Towns Development approach looks at the redesigning of the town layout with the aim
of ensuring the potential of the space in and around the town are fully realised.
The Chris Hani Regional Economic Development Strategy highlighted the need to identify and
prioritise small towns along the economic corridors that have the potential to participate
actively in the value chain of the differentiated sector and implement small town development
initiatives.
Intsika Yethu which has Cofimvaba was identified as one of the towns that had the potential to
grow as it is one of the main service centres on the R61 east corridor, this culminated in CHDM
and Intsika Yethu local municipality with the assistance of Local Government and traditional
affairs embarking on the Small town Development plan for Cofimvaba and Tsomo town. On
2012-2013 budget the council set aside about R10 Million to address the decaying towns
within the district hence focusing on Paving, Beatification and Greening. The amount was
spread as follows R3 Million for Inxuba Yethemba focusing at Middleburg Lusaka Village, at
Lukhanji the focus was on Mlungisi cementries through Fencing, Beautification and Greening,
at Inkwanca focus on both towns Molteno and Sterkstroom for Paving, Tsolwana for Paving at
Hofmeyer. By thye year 2013-2014 the CHDM assisted Engcobo and Tsolwana to develop their
Small Town Revilisation Strategies and from those strategies projects will be identified and
implemented. For the Engcobo town key is to deal with Town Congestion as well as
beautification and Paving.
Chris Hani District Municpality –2016-2017 IDP Review 1st Draft
187
A total budget of R25 Million was needed to develop the town of Engcobo and for 2014-2015
the council has set aside R7 Million for Paving, Beautification, Street Furniture, Parking and
Hawker Stalls within the CBD, for Tarkastad key is to Pave sidewalks and beautify the town. On
2014-2015 financial year the Council further budgeted R10,5 Million for the Small Town
Revitilisation programe which would focus on Paving and Beautification of Hofmeyer, Lady
Frere, Hofmeyer, Mlungisi, Molteno and Middleburg etc.
The Small Town Regeneration concept is aimed at creatingf a development plan with a 30 year
future outlook of it growth potential and creating a plan that seeks to realise that potential.
The plan does not place the district and IYLM as the sole role players in the realising the
developmental objectives of the Cofimvaba and Tsomo towns, Tarkastad and Hofmeyer as well
as Engcobo but instead looks at creating plans to be used as a spatial guiding foundation that
assists stakeholders/ investors to define their role in the overall growth/development of these
towns.
The following reflect the aim behind Small Town Development:
Strengthen the retail, business, industrial and employment role of the Town Centres.
To develop the community, civic and educational roles of the two Centres as key attributes
of vibrant Town Centres.
Build on the unique function of each of the sub-centres serviced by these major Centres as
a defining characteristic of these areas and a contribution to the Corridor Development
initiative in the District.
Improve connections between the sub-centres and encourage activities adjoining access
routes between the major Centres and the sub-centres to create a more physically
contiguous and integrated Town Centre service area.
Consolidate the individual roles of the Centres so that they can better serve the sub-
centres, and act as destinations for sub-centre communities by providing an extensive and
unique range of retail, community and leisure opportunities.
Encourage new housing in and around the Town Centres that increases the range of
housing choices.
Create an attractive and distinctive built environment that supports the range of activities
of the Town Centres.
Create a positive urban image for each part of the Town Centres through the design of
buildings and spaces.
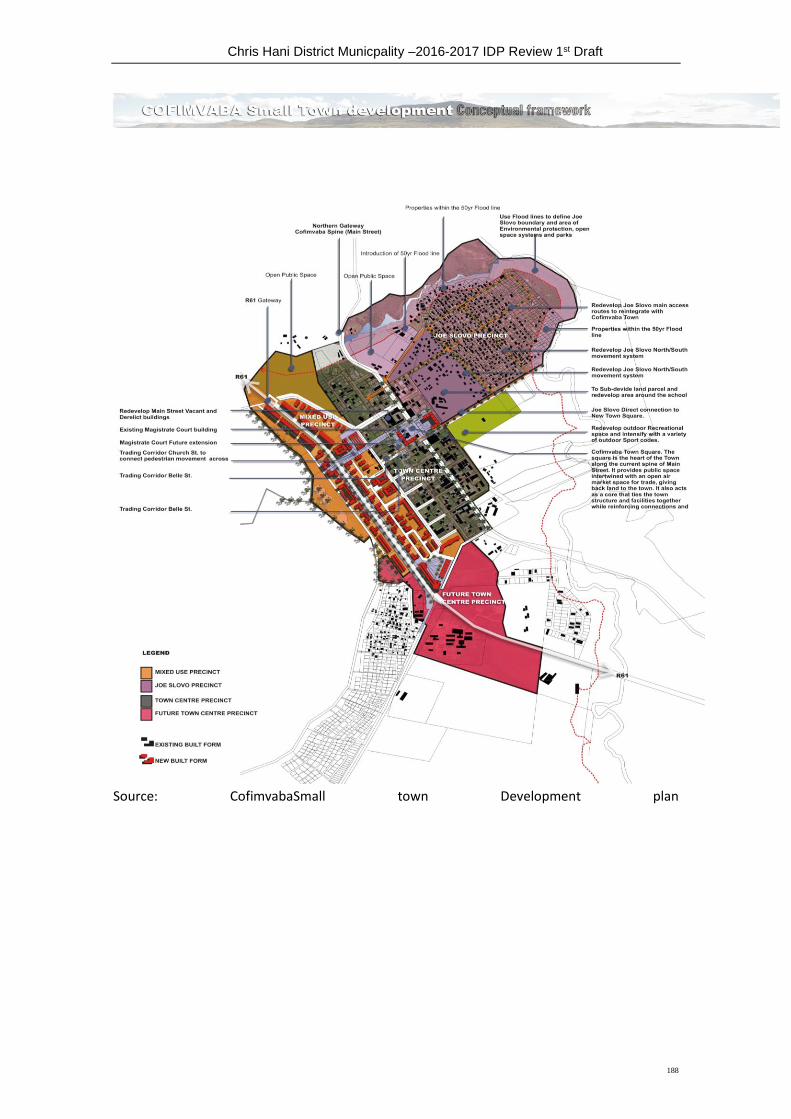
Chris Hani District Municpality –2016-2017 IDP Review 1st Draft
188
Source: CofimvabaSmall town Development plan
Chris Hani District Municpality –2016-2017 IDP Review 1st Draft
189
2.7.3 Land restitution and redistribution
The Land Reform Area Based Plan is a sector plan of the Municipality, to be implemented in
partnership with the Department of Rural Development and Land Reform, the Department of
Agriculture, and Chris Hani District Municipality. The Area Based Plan is a plan aimed at
ensuring the achievement of local land reform objectives and targets in a coordinated and
integrated manner with other development initiatives.
The Land Reform ABP Vision is:
A transformed farming community that is:
Reflective of a racially diverse rural population living in harmony, with tenure, social
and economic security;
Agriculturally productive in all municipal areas, producing food for the population in an
economic and environmentally sustainable manner.
Transformed communal settlement and land areas that are:
Reflective of households with secure and defined tenure rights, which are protected by
law;
Reflective of an efficient and effective system of administration of the land and the
management of the use of the land;
Agriculturally productive, with allotments and commonages producing food for the
household and, and where appropriate, on a commercial basis, in an economic and
environmentally sustainable manner.
Objectives and Targets for the Municipal ABP are:
REDISTRIBUTION
a. In terms of the national policy objective of achieving a 30% redistribution of white
owned farmland:
b. In terms of the national policy objective of productivity on redistributed farms: Farms
redistributed achieve at least 80% of envisaged production output estimated in the
Project Business Plan, and generate at least 75% of envisaged beneficiary income
estimated in the Project Business Plan within 5 years from land occupation by the
beneficiaries, with output and income steadily increasing from its baseline in year one.
COMMUNAL LAND MANAGEMENT
The key Focus Areas for land reform in the communal land areas have been identified as:
1. Land Administration (by which is meant, in this ABP, dealing with the key issues of
land allocations, and recording and managing land rights in communal land areas);
2. Tenure reform or, more specifically, land rights clarification, upgrading or
formalization (achieving recognized security of tenure); and

Chris Hani District Municpality –2016-2017 IDP Review 1st Draft
190
3. Dealing with issues of settlement planning and land use management (for example, to
better permit natural resource utilisation for economic development and/or manage
such natural resources to ensure appropriate land use and prevent resource
degradation).
Strategies applied to deal with these focus areas are:
1. To implement a targeted programme of Local Planning Processes in areas prioritized
by local municipalities.
2. To secure management support from the District Municipality and the Department of
Rural Development and Land Reform for Local Planning Processes projects.
3. To establish a capacity building programme in support of local planning projects being
implemented.
The Institutional Framework for Implementing the ABP is:
a. Establish local land reform offices with a Land Reform Administrator
b. Establish and convene the local Land Reform Committee
c. Participate in the District Land Reform Forum
d. Implement and manage the Small-Scale Farmer Support Programme

Chris Hani District Municpality –2016-2017 IDP Review 1st Draft
191
All programme institutional and projects are subject to implementation funding from the
Department of Rural Development and Land Reform, and (for relevant aspects) from the
Department of Agriculture or other Departments.

Chris Hani District Municpality –2016-2017 IDP Review 1st Draft
192
Programme Institutional Costs:
The cost of the project is enormous (table below) in light of budget constraints. It is however obvious that the District will not meet the target under present
conditions and that the timeframes for the plan need to be extended if the target of 30% is to be met.
Annual Programme
Targets/Ha Enterprises
Year 0 Year 1 Year 2 Year 3 Year 4 Year 5 Total
Municipality Cost Item 2008/9 2009/10 201/11 2011/12 2012/13 2013/14
Chris Hani Land price 63,869,550 184,038,580 285,374,152 356,786,936 419,411,652 474,303,060 1,783,930
Enterprise
cost
17,246,767 53,748,383 80,800,565 101,036,662 118,207,573 132,376,979 503,416,949
Planning
Costs
3,715,000 11,340,000 17,089,400 21,315,600 25,053,600 28,126,000 106,648,600
Support
costs
13,920,000 41,990,430 63,475,200 79,161,600 93,139,200 104,832,000 396,518,400
Total 98,751,317 291,117,363 446,748,337 558,300,798 655,812,025 739,638,039 2,790,367,879

Chris Hani District Municpality –2016-2017 IDP Review 1st Draft
193
The high costs are due to the amount of land which needs to be redistributed contained in the table below.
Annual Programme Targets
(ha/enterprise)
Year 0
(pre-ABP
iniation)
Year 1 Year 2 Year 3 Year 4 Year 5 Total
Municipality Ha/enterprise 2008/9 2009/10 2010/11 2011/12 2012/13 2013/14
Emalahleni Hectares 748 2,444 3,936 4,581 4,577 4,577 20,861
Projects 2 7 11 12 13 13 58
Inkwanca Hectares 3,166 11,298 16,156 17,630 20,059 21,642 89,951
Projects 4 14 20 22 25 27 112
Inxuba Yethemba Hectares 15,550 37,400 52,900 62,250 71,500 79,250 318,850
Projects 11 28 38 45 50 55 250
Lukhanji Hectares 3,415 8,430 10,460 12,490 12,980 14,270 62,045
Projects 5 12 15 18 19 21 90
Sakhisizwe Hectares 0 460 460 460 460 460 2,300
Projects 0 1 1 1 1 1 5
Tsolwana Hectares 7,481 19,095 27,949 33,538 36,877 36,653 161,953
Projects 7 17 25 30 33 33 145
Total Hectares 30,718 79,127 111,861 130,949 146,453 156,852 655,960

Chris Hani District Municpality –2016-2017 IDP Review 1st Draft
194
Total Projects 29 79 110 128 141 150 660

Chris Hani District Municpality –2016-2017 IDP Review 1st Draft
195
2.7.4 Land Administration Concerns
There is much concern about land administration in terms of land allocation, the recording of issued
land rights, the management of land use processes in rural settlement areas, in the former Ciskei and
Transkei area. This result from the breakdown of formal system in the communal land areas which has
resulted in ínformalisation of practices whereby various role-players like, traditional Authorities,
Department of Agriculture, ward Councillors, allocate land and record such allocations. The problem of
land administration has repercussion on land management because it results in conflict between land
uses in the rural areas. The issues are further clarified in the attached SDF.
Development issues
All the land for development in the urban areas is owned by the Municipality and private individuals
whilst the State owns the rural land in the former Transkei and Ciskei. Whilst land is available for
development, it is not quantified, ownership issues are unclear and zoning schemes and spatial
development frameworks are outdated and inadequate in providing direction for future and current
development needs.
Land tenure issues whereby ownership of land in the urban areas and former CPA areas is held by free-
hold Title Deeds but in the rural areas is generally communal is creating tension and delays in
development projects. This current fragmented land tenure system and the different planning
legislation aligned to it creates difficulty in:
accessing of land for development, primarily for housing, grazing or farming
more effective utilization of existing land, addressing land rights, provision of title deeds and
management and rights on the municipal commonage.
Developing an effective land administration system

Chris Hani District Municpality –2016-2017 IDP Review 1st Draft
196
MUNICIPAL TRANSFORMATION & ORGANISATIONAL DEVELOPMENT
Institutional Transformation and Organisational Development deals with the institutional arrangements that have been put in place to ensure that the municipality responds to the development needs of the communities on the one hand, and that it is able to effectively and efficiently deliver on its legislated powers and functions on the other hand. MUNICIPAL POWERS AND FUNCTIONS The Chris Hani District Municipality is a category C2 municipality mandated to perform those powers and functions vested in District Municipalities as contemplated in schedules 4 and 5 of the Constitution of the Republic of South Africa, Act 108 of 1996. In addition to these powers and functions as contemplated in the Act, the CHDM is mandated to perform such functions and powers as determined by the MEC responsible for Local Government and as gazzetted by the province. In relation to this, therefore, the core mandate of the CHDM is the supply of bulk water and sanitation infrastructure, disaster management, municipal planning, municipal health services, tourism, local economic development and maintenance of provincial roads as per the agreement intered into between the CHDM and the Department of Roads and Publi Works. The table bellow depicts those powers and functions vested in the district and those allocated to the various local municipalities within the district jurisdiction.
FUNCTION CHRIS HANI DM
LUKHANJI LM
INTSIKA YETHU LM
ENGCOBO LM
SAKHISIZWE LM
ELM TSOLWANA LM
INKWANCA LM
INXUBA YETHEMBA LM
Air pollution Yes Yes Yes Yes Yes Yes Yes Yes Yes
Building regulations
N/A Yes Yes Yes Yes Yes Yes Yes Yes
Child Care facilities
N/A Yes Yes Yes Yes Yes Yes Yes Yes
Electricity reticulation
N/A
Fire Fighting Yes Yes Yes Yes Yes Yes Yes Yes Yes
Local Tourism
Yes Yes Yes Yes Yes Yes Yes Yes Yes
Municipal Planning
Yes Yes Yes Yes Yes Yes Yes Yes Yes
Municipal Health Services
Yes No No No No No No No No
Municipal Public Transport
Regulation
Yes Yes Yes Yes Yes Yes Yes Yes
Storm water N/A Yes Yes Yes Yes Yes Yes Yes Yes
Trading regulations
N/A Yes Yes Yes Yes Yes Yes Yes Yes
Water (potable)
Bulk supply
Yes Yes Yes Yes Yes Yes Yes Yes
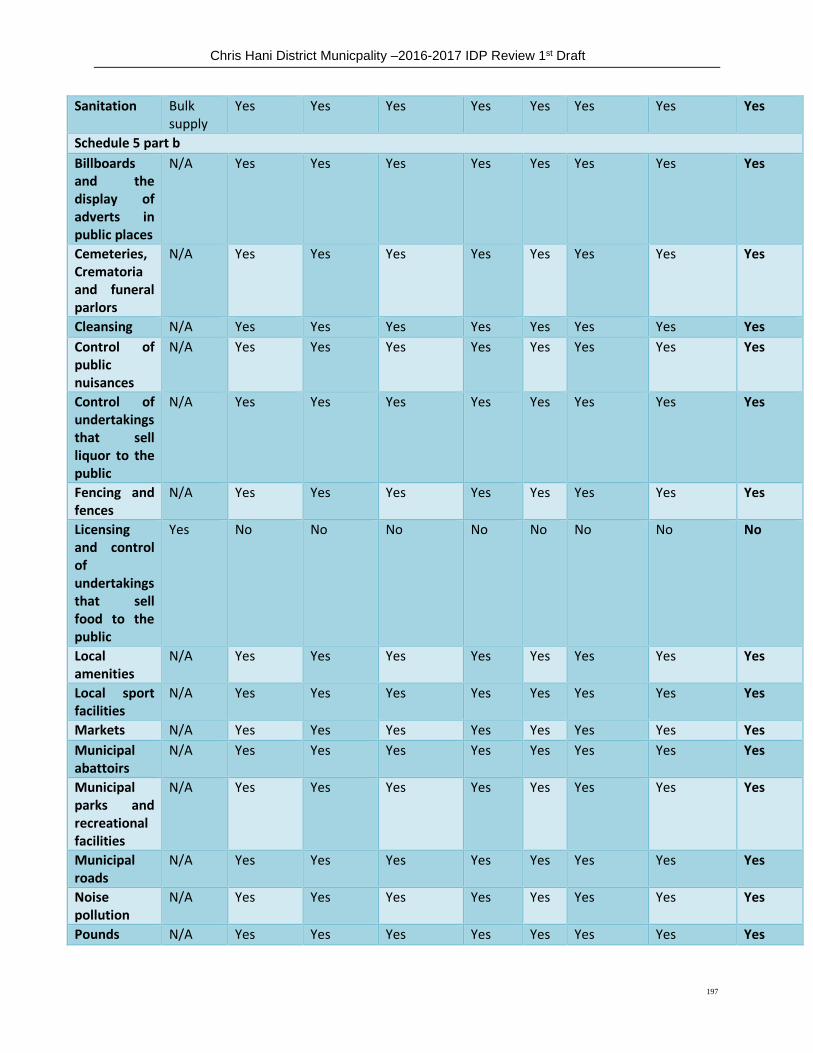
Chris Hani District Municpality –2016-2017 IDP Review 1st Draft
197
Sanitation Bulk supply
Yes Yes Yes Yes Yes Yes Yes Yes
Schedule 5 part b
Billboards and the display of adverts in public places
N/A Yes Yes Yes Yes Yes Yes Yes Yes
Cemeteries, Crematoria and funeral parlors
N/A Yes Yes Yes Yes Yes Yes Yes Yes
Cleansing N/A Yes Yes Yes Yes Yes Yes Yes Yes
Control of public nuisances
N/A Yes Yes Yes Yes Yes Yes Yes Yes
Control of undertakings that sell liquor to the public
N/A Yes Yes Yes Yes Yes Yes Yes Yes
Fencing and fences
N/A Yes Yes Yes Yes Yes Yes Yes Yes
Licensing and control of undertakings that sell food to the public
Yes No No No No No No No No
Local amenities
N/A Yes Yes Yes Yes Yes Yes Yes Yes
Local sport facilities
N/A Yes Yes Yes Yes Yes Yes Yes Yes
Markets N/A Yes Yes Yes Yes Yes Yes Yes Yes
Municipal abattoirs
N/A Yes Yes Yes Yes Yes Yes Yes Yes
Municipal parks and recreational facilities
N/A Yes Yes Yes Yes Yes Yes Yes Yes
Municipal roads
N/A Yes Yes Yes Yes Yes Yes Yes Yes
Noise pollution
N/A Yes Yes Yes Yes Yes Yes Yes Yes
Pounds N/A Yes Yes Yes Yes Yes Yes Yes Yes
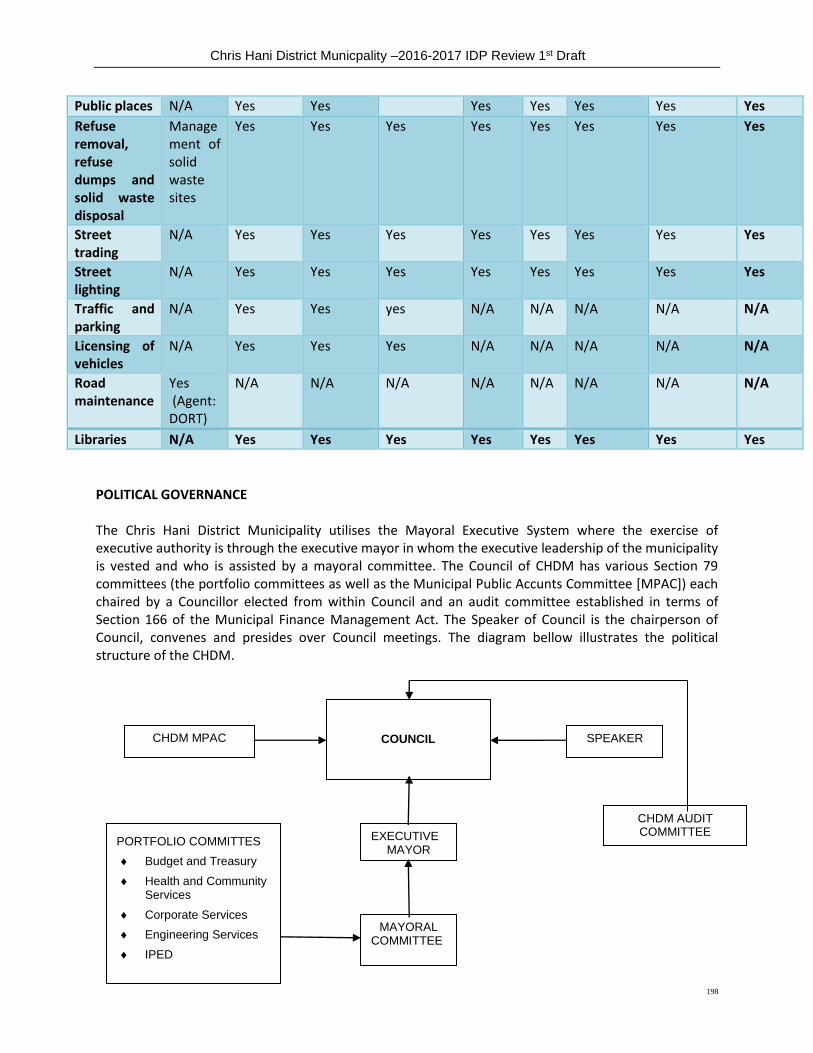
Chris Hani District Municpality –2016-2017 IDP Review 1st Draft
198
Public places N/A Yes Yes Yes Yes Yes Yes Yes
Refuse removal, refuse dumps and solid waste disposal
Management of solid waste sites
Yes Yes Yes Yes Yes Yes Yes Yes
Street trading
N/A Yes Yes Yes Yes Yes Yes Yes Yes
Street lighting
N/A Yes Yes Yes Yes Yes Yes Yes Yes
Traffic and parking
N/A Yes Yes yes N/A N/A N/A N/A N/A
Licensing of vehicles
N/A Yes Yes Yes N/A N/A N/A N/A N/A
Road maintenance
Yes (Agent: DORT)
N/A N/A N/A N/A N/A N/A N/A N/A
Libraries N/A Yes Yes Yes Yes Yes Yes Yes Yes
POLITICAL GOVERNANCE The Chris Hani District Municipality utilises the Mayoral Executive System where the exercise of executive authority is through the executive mayor in whom the executive leadership of the municipality is vested and who is assisted by a mayoral committee. The Council of CHDM has various Section 79 committees (the portfolio committees as well as the Municipal Public Accunts Committee [MPAC]) each chaired by a Councillor elected from within Council and an audit committee established in terms of Section 166 of the Municipal Finance Management Act. The Speaker of Council is the chairperson of Council, convenes and presides over Council meetings. The diagram bellow illustrates the political structure of the CHDM.
COUNCIL
SPEAKER
MAYORAL COMMITTEE
EXECUTIVE MAYOR
PORTFOLIO COMMITTES
Budget and Treasury
Health and Community Services
Corporate Services
Engineering Services
IPED
CHDM MPAC
CHDM AUDIT COMMITTEE

Chris Hani District Municpality –2016-2017 IDP Review 1st Draft
199
The CHDM Council has a total of 42 Councilors of which 17 are on Proportional Representation (PR) and 25 Councilors that are Direct Representatives from Local Municipalities within the District. Seven of the PR Councillors are members of the Mayoral Committee. There are also 08 Traditional Leaders that sits on a council which represent their areas. The table bellow depicts the composition of Council in terms of party representation of the PR Councillors: The table below depicts the composition of Council in terms of party representation of the PR Councilors:
POLITICAL PARTY NUMBER
ANC 14
UDM 1
DA 1
COPE 1
Party-political and demographic representation of Councillors & Traditional leadres in council.
POLITICAL PARTY NO OF COUNCILLORS GENDER DISTRIBUTION
MALE FEMALE
ANC 35 19 16
DA 3 3 -
UDM 3 2 1
COPE 1 1 -
Traditional Leaders in Council
06 5 1
ADMINISTRATION The Municipal Manager is the Head of the administration and Accounting Officer as defined in the Municipal Structures Act 117 of 1998. The responsibilities of the Municipal Manager include managing the financial affairs and service delivery in the municipality and is assisted and supported by the Chief Financial Officer and the Directors of respective departments as well as the Strategic Manager. The CFO, the Directors of the respective departments as well as the Strategic Manager are appointed in terms of Section 56 of the Municipal Systems Act. Currently one of these positions is not filled which Director IPED but institution is on a process of filling that vacancy. Positions are gender balanced as out of six Section 56/57 three are Males which include Municipal Manager and the other three are females. The political leadership and the administration complement each other to achieve the objectives of the IDP. The diagrams below reflect the administrative structure of the institution.

Chris Hani District Municpality –2016-2017 IDP Review 1st Draft
200
HUMAN RESOURCE The Municipality is committed to an efficient human resources system and has reviewed a number of policies to ensure the effective development, compliance and welfare of employees. Currently, the municipality has in its employment 972 workforce all with clear Job Description of whom majority are employed in the core departments which are Engineering Services, Health and Community Services and Integrated Planning and Economic Development. All these positions are funded by the institution. Out of a total 972 employees 122 are contract employee. All CHDM workforce including Councillors are guided by the Code of Conduct of the institution which was developed and adopted by council. The municipal organogram is reviewed annually as informed by objectives of the municipality within that financial year. The institution is also implementing an internship programme and has 149 Interns which are allocated within the district in all eight local municipalities. All these interns are funded by LGSETA.
Municipal Manager
Strategic Management
Budget & Treasury
Office
Corporate Services
Risk Manager
Internal Audit
Manager
Engineering Services
Health & Community
Services
Integrated Planning & Economic
Development
Communicati SPU
Municipal Supp
Financial Management
S AFS & Admin
Legal & Admin Human
Resources EAP & ICT Fleet Mngt
Water Services (WSA &WSP)
PMU Roads (SLA)
Financial Mngt
Fire Services Disaster Mngt Mun Health
Environmental Services
LED Dev Planning
Business Development
Housing

Chris Hani District Municpality –2016-2017 IDP Review 1st Draft
201
The current approved organizational structure together with the proposed positions that will ensure attainment of the objective entailed in the IDP is attached at the back of the document for ease of reference. The process of prioritization, engagement, alignment and integration will be embarked on with all the relevant stakeholders. Employment Equity The Municipality strives to meet the Employment Equity targets to comply with the Employment Equity Act and redress past imbalances. 100 % of Section 57 employees are black (inclusive of African and Coloured) and 50 % of Section 57 employees are female. The Council of the Municipality has developed and adopted an Employment Equity Plan for implementation in the financial year 2014 - 2015 with clear numeric targets to be achieved in each year of the plan. The reviewed plan is reviewed annually and adopted by council together with all other policies for implementation in the next financial year. Current demographics of the workforce in terms of gender representation are as follows: Males 483 and Females 143. The institution makes submissions to Dept of Labour around Equity targets. Human Resources Policy Review Human resources policies were approved by Council and are being implemented and some of them are to be developed and redone due to some gaps identified due to operational requirements and legislative imperatives. The need for development of new human resources policies has also been identified. Policies that are had just been adopted by council during the third quarter of 2014-2015 financial year include the following, Subsistence & Travelling Policy, Study Assistance Policy, Skills Development Policy and Health and Risk Asssessment, OHS, Declaration of Interests, Staff Attraction and Retention Policy etc. All these are reviewed annually and are presented to all relevant stakeholders for inputs and comments. Amongst those still to be developed include Succession Plan Policy. Work Place Skills Development Plan was adopted by Council for the financial year and is currently being implemented. A new WSP has been developed and submitted to Local Government Seta. The Municipality also implemented a number of skills development-related programmes, which include:
• Implementation of the Workplace Skills Plan; • Internships Programme • Study Assistance Programme; • National Treasury Minimum Competency Requirement
The Internships programme provided Graduates with practical learning experience from communities within Chris Hani area of jurisdiction. The Internship programme was made possible by the Engineering Department through the Expanded Public Works Programme which is funded by Public Works. The municipality has implemented its approved Workplace Skills Plan in the previous financial year. One Hundred and Twenty Three [123] employees have received training within this financial year at a cost of R 784 947.710 during the mid-year. A total of nine [9] training interventions were implemented.

Chris Hani District Municpality –2016-2017 IDP Review 1st Draft
202
In line with the Government Gazzette No 29967 on Minimum Competency Level, the municipality has commenced with the implementation of the regulations in that:
• 1 Senior Manager, 1 Councillor and 1 Official have been capacitated through Wits Business School
• 10 managers and 1 Councillor have been capacitated through the University of Fort Hare.
Internships, Learnership and Experiential Training Out of one hundred and eighty [180] interns, one hundred and four [104] unemployed graduates concluded their two year intership programme and 76 participants left the programme before conclusion of the contract for various reasons. Currently there are 149 active interns within the institution and are receiving exposure in the working environment and provide assistance in service delivery. Five [5] Financial Interns were appointed in collaboration with the Provincial Treasury for a duration of two years. Study Assistance for Employees As part of building capacity of the workforce the District is providing study assistance to those employees who wish to further their studies. The above is of assistance to both the employee and the organization in that when the skills of employees are enhanced also the level of performance or productivity is also improved. Within this current financial year ten [10] employees have received assistance to further their studies in the following fields:
Financial Field
Engineering
Human Resources
Administration
LABOUR RELATIONS
The Labour Relations division is to foster degree of cooperation through various structures which are formed by its own internal stake holders and to minimize the causes of unnecessary conflict or restrictive practices and to maintain sound Labour relations between unions and management .i.e to create micro and macro institutional structures which seeks to address the institutional challenges. To enhance productivity of the organization through advising and having workforce which is informed about all work related issues.
Labour relations division has the authority to manage grievances, handling disciplinary hearings, facilitating Labour disputes and to facilitate local Labour forum
Disciplinary Hearings
The Labour Relations officer handles and provide services of prosecution on various cases within the district and also support LM’s.
Chris Hani District Municpality –2016-2017 IDP Review 1st Draft
203
Local Labour Forum
There abovementioned structure serves as a consultative structure between labour and management and is functional. The structure is made up of Councilors, Managers and both two recognized union in the sector as prescribed in the Collective Agreement on Organizational rights which are SAMWU & IMATU.
EMPLOYEE ASSISTANCE PROGRAMME The employee assistance programme is defined as a workplace programme designed to offer short term assistance to CHDM employees, managers, union and councillors in identification, prevention and treatment of personal, social and work-related challenges that may have a negative effect on the well-being and performance of the employees and councillors. The wellness programmes has provided short term assessment, counselling and referral to 270 employees and councillors. Most of these interventions have yielded positive outcome in terms of improving employee wellbeing, performance and interpersonal relations. Trauma group sessions were also provided for employees in high risks occupations such as disaster and fire. These sessions equipped the workers with skills on how to deal with trauma experienced in their duties. Supervisor mentorship, coaching on how to identify and provide assistance to employees with personal challenges was conducted. These sessions has yielded positive outcomes in terms of improving relations between supervisors and employees. In line with the National Health calendar, the institutional wellness calendar and strategy, the following educational and awareness programmes were implemented for employees and councillors:
Financial wellness: budgeting, saving and debt management
Healthy lifestyle: weight management and medical screening
Marriages, relationships and interpersonal relations
Substance abuse Through these programmes 10% of the employees and councillors have managed to change their lifestyle habits for the better. Team building programmes and healthy retirement programmes were provided to certain identified employees and Departments. Technical support to 8 LMs was provided through the educational programmes and the wellness forum meetings. The wellness strategy and policy has been reviewed in line with the identified needs of the employees and councillors. Substance abuse policy and strategy has been developed.
Chris Hani District Municpality –2016-2017 IDP Review 1st Draft
204
OCCUPATIONAL HEALTH AND SAFETY The OHS Policy as adopted by council has been developed with key focus on Personal Protective Equipment and clothing, provision of safety measures and conditions for the employees and councillors. In line with compliance with the OHSA the following strides were achieved:
Establishment and capacity building of the OHS workplace committee
Training of She reps
Installation of first aid kits in cars
She awareness and educational programmes for high risks offices such as water and roads.
Site inspections
Provision of advise on compliance with OHSA to managers and the institution
Provision of medical and administrative assistance to employees and councillors with injuries of duty.
CHALLENGES
Delays in the Compensation fund in registering the claims for Occupational injuries
Insufficient personnel to implement the programme
Health risks assessments of high risks occupations
Lack of medical aids for employees
Management of incapacity and chronic illnesses
INFORMATION COMMUNICATION TECHNOLOGY The mandate of the unit is to provide ICT services and support to the District Municipality and to provide secure, reliable and consistent platform for information accessibility. The vision of the unit is to be a strategic support unit with highly capacitated human and computer based resource (s) for enhancing municipal service delivery. The Mission to identity, provide, support and maintain, business system and solutions, IT Infrastructure and to provide sound governance on management of ICT. Legal framework of the function derives from the following,
• Constitutions of the Republic • Municipal Systems Act • MFMA • SITA amendment (Act 38 of 2002) • Promotion of Access to Information • Electronic communications and Transaction Act (27 of 2002)
Key functions of the unit are :
Ensure effective ICT governance
Enable effective operation of the municipality’s support functions by ensuring development, implementation and maintenance of appropriate systems.
Provide the necessary, secure and sustainable infrastructure based on the most appropriate technology
The Municipality needs access to accurate and timely information at all times for executive and management decision support
Chris Hani District Municpality –2016-2017 IDP Review 1st Draft
205
To improve the management of 3rd party vendors (suppliers) by the efficient application of SLA’s
Increasing efficiency and effectiveness through continuing assessment, quality improvement and accountability to stakeholders
To Support Local Municipalities in ICT related matters
ICT GOVERNANCE
CHDM Council towards end of 2013-2014 financial year has adopted an ICT Governance Charter
(Framework) in order to have effective governance. The CHDM adopted Prince2 as an ICT project
management methodology embedded in the ICT Governance Framework. Prince2 provides a structured
framework for managing organizational projects and is not limited to ICT projects. The DM established
an Information Communication Technology Steering Committee (ICTSC) with terms of reference. The
ICTSC was established as a governance mechanism in line with generally adopted IT governance
frameworks such as COBIT, COSO & King reports. The steering committee meets quarterly. Other ICT
governance structures as outlined in the ICT Governance Framework, namely the Business Architucture
Forum and Information Security forums are to be established.
The following ICT policies were approved by Council and are implemented.
ICT Network Policy and Plan
Disaster Recovery Policy and Plan
Internet, Email and Intranet usage policy
Computer Equipment Acquisition policy The latter two are due for review. Policies were developed in 2014/15:
- ICT Risk Management Policy - Mobile Device Management Policy
The Information and Communication Technology Strategic Plan has been developed and awaiting Council approval. The strategic plan is underpinned by the ICT governance Framework that Council approved together with industry best practices. The strategic plan, which will be implemented in 2016/17 financial year will ensure alignment of technology initiatives with the business of the municipality and create an enabling technology environment. The main focus in implementation of the plan in 2016/17 will be integration of the ICT organization and integration of ICT systems within the District Municipality. NETWORK INFRASTRUCTURE AND SECURITY MANAGEMENT The District Municipality has 5 remote sites that are connected by a wireless network. The unit maintains the network infrastructure to ensure a robust network with minimum downtimes. An ICT network audit is conducted every two years and a report is produced with recommendations to ensure that the network infrastructure meets at least minimum industry standards and security measures are in place. The CHDM revamped its main server room to ensure compliance with required server room industry standards. The server room at Bells road has since been moved to the 1st floor and revamped to meet sever room industry standards.

Chris Hani District Municpality –2016-2017 IDP Review 1st Draft
206
The District Municipality has a Service Level Agreement with a Service Provider to provide second line support to the unit and a contract with a wireless infrastructure service provider to ensure minimum system downtimes. A contract has been signed with Telkom to provide VPN supreme service which is a WAN solution managed and maintained by Telkom with improved scalability, flexibility and reliability attached to a Service Level Agreement. INFORMATION SECURITY, ACCESSABILITY AND MANAGEMENT The District Municipality has a website with address www.chrishanidm.gov.za managed by the communication section. The CHDM also has an intranet for internal access to information and systems. The Disaster Recovery Plan (DRP) is in place and implemented in phases. A disaster recovery site was established at the disaster management center. The CHDM will be acquiring the services of a Cloud services provider as the next implementation phase of the DRP to further ensure Business Continuity in case of a disaster. The CHDM is in the process maximizing the use of SharePoint portal to use its Document Management capabilities to ensure that the DM has an Electronic Document Management System (EDMS) to ensure compliance. The District Municipality ensures that it keeps up with the latest in terms of Microsoft application. The District upgraded its Microsoft Office from Office 2007 to the latest Microsoft Office 2013. An upgrade training was undertaken to avoid frustration on the users and the ICT unit in terms of support.
Legal and Admin Function
The mandate of this unit is to provide is to manage administration and legal services. The unit also provide legal support service to senior management, departments and Council on the exercise of powers and functions and decision making through analysis and evaluation of attitudes of the municipality. It’s governed by the following legal framework, Municipal Systems Act, Municipal Finance Management Act, Constitution of the Republic of South Africa, High Court Rules, and Magistrate’s Court Rules. To ensure security within the institution Biometrics were installed in buildings to ensure safety of employees and councillors and safety plan is in place in implemented. On legal matters, Legal claims register is monitored and updated continuously as a well as some matters of litigation between CHDM and some other parties do take place, key being SAMWU who represent its members challenging the institution.
Workshop on litigations for managers was conducted by a registered firm who are our attorneys of record for purposes of equipping them. Matters of council are fairly attended as Council resolution register is continuously updated and the IT Software will be installed by Business Connexion. Developed council calendar, council diary and council resolution register.
Fleet Management
The unit of Management Fleet of the institution as a result Reviewed Fleet management policy is implemented and monitoring is continuously done, 95% pass rate of employees who were taken to Lukhanji driving licence testing centre, for evaluation of their driving skills before using council vehicles.
RECORDS MANAGEMENT
Facilitation of disposal of old records in line with legislation was done. 50% of unsuccessful applications for employment from 2008 to 2011 was disposed. Electronic Document Management System will be installed by Business Connexion.
Chris Hani District Municpality –2016-2017 IDP Review 1st Draft
207
2.4.4 MUNICIPAL FINANCIAL VIABILITY and MANAGEMENT
The Municipal Finance Management Act 56 of 2003 (MFMA) prescribes that the Council of a
municipality must for each financial year approve an Annual Budget for the municipality before the start
of that financial year. Section 16 (2) of the same Act stipulates that in order for the municipality to
perform what is prescribed, the Mayor of the municipality must table the Annual Budget at a Council
meeting at least 90 days before the start of the financial year. The processes involved during the 90 day
period enable transparent engagements amongst the Communities, Councilors, the Executive and
Administration to finalize the budget. The consultative and Public Participation processes also promote
oversight over the adoption and implementation of the budget. The departmental budget statements
provide Council with information on how different departments within Chris Hani District Municipality
(CHDM) intend to spend the funds that will be appropriated by Council, to enable Council and
communities keep departments accountable for their delivery commitments contained in the Service
Delivery Budget Implementation Plans (SDBIP) and to ensure that Council Committees effectively
perform their oversight functions.
1. REVENUE MANAGEMENT Chris Hani District Municipality is 100% Grant dependent. Our major source of revenue is on water as a
Water Services Authority and Water Services Provider. This function was in the past been done by LM
through contract signed as LMs were given WSP function, this has since been overturned due to end of
contract or agreement. Collection rate is very minimal as most of our communities are indegent and
therefore not paying for services. We have received a support from COGTA through their Municipal
Infrastructure Support Agency (MISA) which is assisting us in reviewing our Revenue Enhancement
Strategy. The Revenue Enhancement Strategy is therefore implemented but due to above mentioned
challenge of indegency we still face some difficulties on Revenue enhancement. Revenue Enhancement
Strategy is to ensure that we assist the Municipaality to improve revenue collection. By 2015/16
Collection rate at was very minimal due to some challenges experienced as e had just taken back the
WSP function. This will inform the municipality on ways of addressing recovery and enhancing revenue
through
Billing
Enforcement of By –laws
Data Cleansing
Reviewal and implementation of revenue related policies
Management of indigent consumers
Installation of Meters

Chris Hani District Municpality –2016-2017 IDP Review 1st Draft
208
The major sources of revenue consist of:
Operational Grants
Equitable Share
Finance Management Grant (FMG)
Municipal Systems Improvement Grant ( MSIG)
Expanded Public Works Programme ( EPWP)
Rural Roads Asset Management Grant
Other Operational Programs
Roads Subsidy
Working for Water
Lapesi Program
Capital Grants
Municipal Infrastructure Grant ( MIG)
Regional Bulk Infrastructure Grant ( RBIG)
Municipal Water Infrastructure Grant ( MWIG)
Rural Household Infrastructure Grant ( RHIG)
Water Services Operating Grant ( WSOG)
Other Capital Programs
Accelerated Community Infrastructure Program ( ACIP)
Department of Housing Unblocking Program
There are other incomes sources which are not significant are listed below
Interest from investment
Rental Income
1.1 WATER AND SANITATION TARIFFS
CHDM is in a process of developing New Tarriffs for the year 2016-2017 financial year, such Tarriffs will undergo all required stages before being adopted by Council. Thus far the 2015-2016 are applied up until the new 2016-2017 ones are adopted by Council. It is expected that by end May 2016 when the final IDP and Budget is adoptec by Council such process wil be complete and as such will be incorporated and influence the final 2016-2017 Budget. For this Draft IDP Review 2015-2016 Tarrifs will still still apply as they were adopted last financial year. 2015-2016 Water tariffs derived from the amount provided per household for free basic services on the basis of consumption of 6 kl per month. The amount is R91.00 per month and the tariff per kl is R8.66 A stepped-up tariff is proposed according to the categories and consumption levels reflected in the table below.
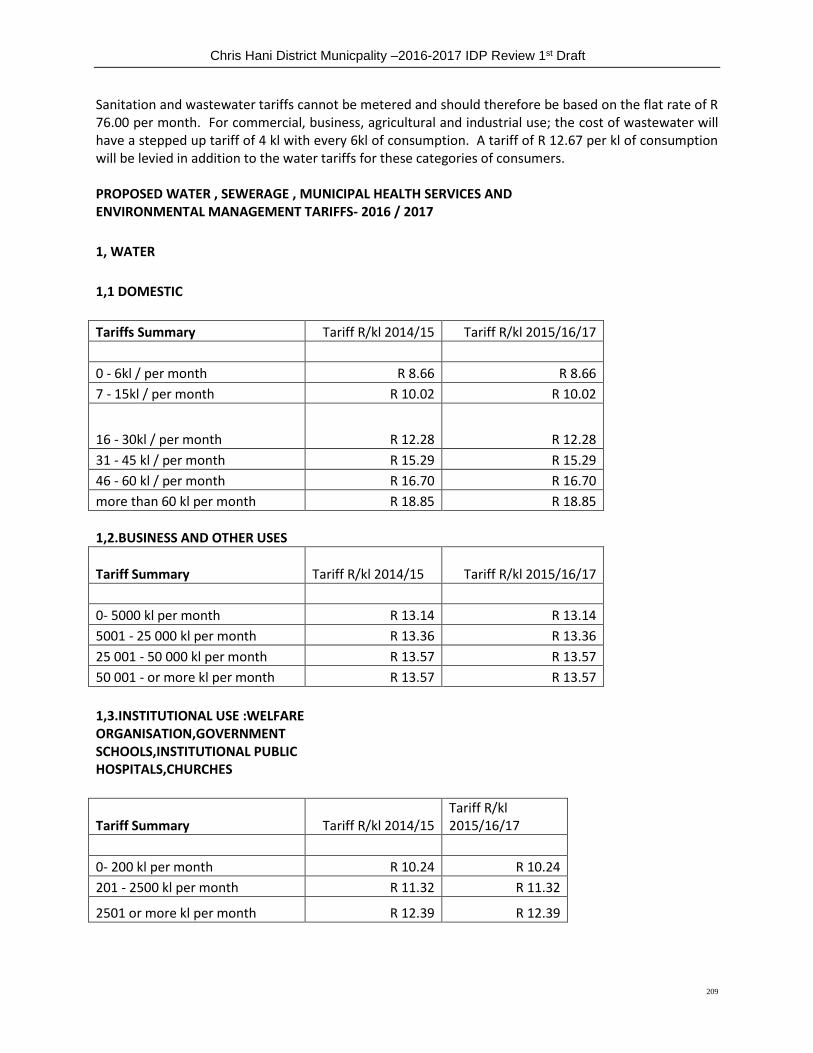
Chris Hani District Municpality –2016-2017 IDP Review 1st Draft
209
Sanitation and wastewater tariffs cannot be metered and should therefore be based on the flat rate of R 76.00 per month. For commercial, business, agricultural and industrial use; the cost of wastewater will have a stepped up tariff of 4 kl with every 6kl of consumption. A tariff of R 12.67 per kl of consumption will be levied in addition to the water tariffs for these categories of consumers. PROPOSED WATER , SEWERAGE , MUNICIPAL HEALTH SERVICES AND ENVIRONMENTAL MANAGEMENT TARIFFS- 2016 / 2017
1, WATER
1,1 DOMESTIC
Tariffs Summary Tariff R/kl 2014/15 Tariff R/kl 2015/16/17
0 - 6kl / per month R 8.66 R 8.66
7 - 15kl / per month R 10.02 R 10.02
16 - 30kl / per month R 12.28 R 12.28
31 - 45 kl / per month R 15.29 R 15.29
46 - 60 kl / per month R 16.70 R 16.70
more than 60 kl per month R 18.85 R 18.85
1,2.BUSINESS AND OTHER USES
Tariff Summary Tariff R/kl 2014/15
Tariff R/kl 2015/16/17
0- 5000 kl per month R 13.14 R 13.14
5001 - 25 000 kl per month R 13.36 R 13.36
25 001 - 50 000 kl per month R 13.57 R 13.57
50 001 - or more kl per month R 13.57 R 13.57
1,3.INSTITUTIONAL USE :WELFARE ORGANISATION,GOVERNMENT SCHOOLS,INSTITUTIONAL PUBLIC HOSPITALS,CHURCHES
Tariff Summary Tariff R/kl 2014/15 Tariff R/kl 2015/16/17
0- 200 kl per month R 10.24 R 10.24
201 - 2500 kl per month R 11.32 R 11.32
2501 or more kl per month R 12.39 R 12.39
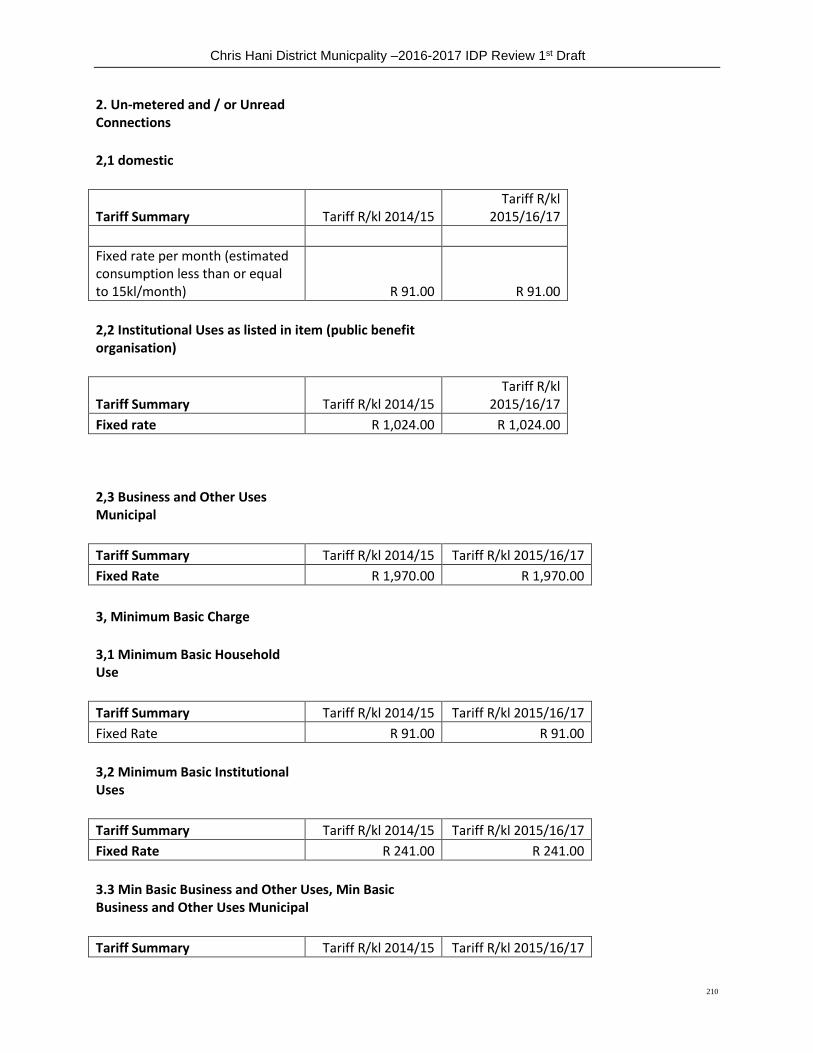
Chris Hani District Municpality –2016-2017 IDP Review 1st Draft
210
2. Un-metered and / or Unread Connections
2,1 domestic
Tariff Summary Tariff R/kl 2014/15 Tariff R/kl
2015/16/17
Fixed rate per month (estimated consumption less than or equal to 15kl/month) R 91.00 R 91.00
2,2 Institutional Uses as listed in item (public benefit organisation)
Tariff Summary Tariff R/kl 2014/15 Tariff R/kl
2015/16/17
Fixed rate R 1,024.00 R 1,024.00
2,3 Business and Other Uses Municipal
Tariff Summary Tariff R/kl 2014/15 Tariff R/kl 2015/16/17
Fixed Rate R 1,970.00 R 1,970.00
3, Minimum Basic Charge
3,1 Minimum Basic Household Use
Tariff Summary Tariff R/kl 2014/15 Tariff R/kl 2015/16/17
Fixed Rate R 91.00 R 91.00
3,2 Minimum Basic Institutional Uses
Tariff Summary Tariff R/kl 2014/15 Tariff R/kl 2015/16/17
Fixed Rate R 241.00 R 241.00
3.3 Min Basic Business and Other Uses, Min Basic Business and Other Uses Municipal
Tariff Summary Tariff R/kl 2014/15 Tariff R/kl 2015/16/17

Chris Hani District Municpality –2016-2017 IDP Review 1st Draft
211
Fixed Rate R 473.00 R 473.00
4, Deposit (water services)
Tariff Summary Tariff R/kl 2014/15
Tariff R/kl 2015/16/17
Consumers-Domestic 400.00
400.00
Consumers-Business or Commercial
1,067.55
1,067.55
Builders 4,163.33
4,163.33
5,Water Carting
Tariff Summary Tariff R/kl 2014/15 Tariff R/kl 2015/16/17
7-15 kl/load 476.41 476.41
Rate for km travelled to deliver R 8.00 R 8.00
6, CONNECTION PIPES,WATER CONNECTION INCLUDING FIRE CONNECTIONS OR UPGRADING
6,1 Where a water or fire hydrant connection is supplied :
6,1,1 Combination meters
Tariff Summary Tariff R/kl 2014/15 Tariff R/kl 2015/16/17
Main meter Size
50mm R 32,991.00 R 32,991.00
80mm R 35,978.00 R 35,978.00
100mm R 44,222.00 R 44,222.00
150mm R 70,188.00 R 70,188.00
6,1,2 Normal meters and Water Consumption Management meters
Main Meter Connection

Chris Hani District Municpality –2016-2017 IDP Review 1st Draft
212
Tariff Summary Tariff R/kl 2014/15 Tariff R/kl 2015/16/17
15mm R 2,271.00 R 2,271.00
15mm WCM R 3,269.00 R 3,269.00
25mm R 4,238.00 R 4,238.00
Main Meter connection Tariff R/kl 2015/16 Tariff R/kl 2015/16/17
15mm R 1,729.00 R 1,729.00
15mm WCM R 2,767.00 R 2,767.00
7, SEWERAGE
7,1 RESIDENTIAL
Tariff Summary Tariff R/kl 2014/15 Tariff R/kl 2015/16/17
Basic Charge : Consumers per year 719.55 719.55
Basic Charge : Business per year 1185.99 1185.99
Basic Charge : Government per year 1197.28 1197.28
Basic Charge :Churches,Hotels,School,Hospitals 1129.51 1129.51
7,2 Basic Charge per month Tariff Summary Tariff R/kl 2014/15 Tariff R/kl 2015/16/17
Night-soil removals (Buckets) per month 65.66 65.66
7,3 Charge per removal Tariff Summary Tariff R/kl 2014/15 Tariff R/kl 2015/16/17
Removal per bucket 45.00 45.00
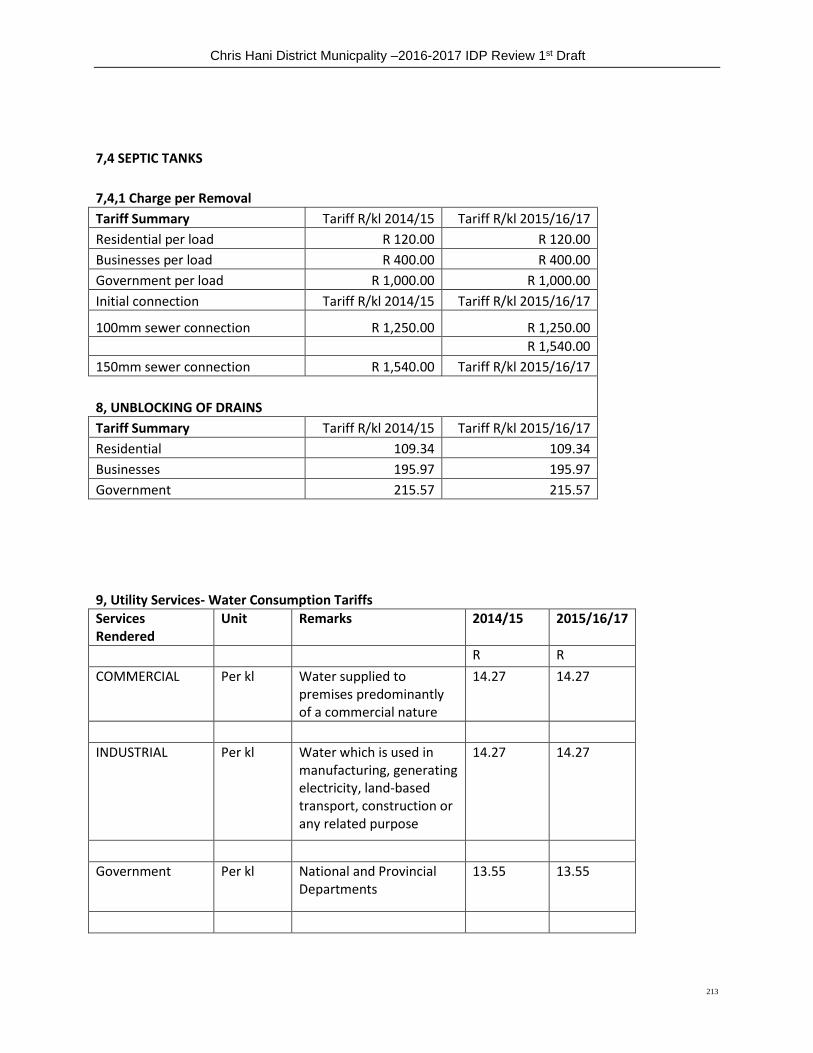
Chris Hani District Municpality –2016-2017 IDP Review 1st Draft
213
7,4 SEPTIC TANKS
7,4,1 Charge per Removal Tariff Summary Tariff R/kl 2014/15 Tariff R/kl 2015/16/17
Residential per load R 120.00 R 120.00
Businesses per load R 400.00 R 400.00
Government per load R 1,000.00 R 1,000.00
Initial connection Tariff R/kl 2014/15 Tariff R/kl 2015/16/17
100mm sewer connection R 1,250.00 R 1,250.00
R 1,540.00
150mm sewer connection R 1,540.00 Tariff R/kl 2015/16/17
8, UNBLOCKING OF DRAINS
Tariff Summary Tariff R/kl 2014/15 Tariff R/kl 2015/16/17
Residential 109.34 109.34
Businesses 195.97 195.97
Government 215.57 215.57
9, Utility Services- Water Consumption Tariffs
Services Rendered
Unit Remarks 2014/15 2015/16/17
R R
COMMERCIAL Per kl Water supplied to premises predominantly of a commercial nature
14.27 14.27
INDUSTRIAL Per kl Water which is used in manufacturing, generating electricity, land-based transport, construction or any related purpose
14.27 14.27
Government Per kl National and Provincial Departments
13.55 13.55

Chris Hani District Municpality –2016-2017 IDP Review 1st Draft
214
Schools/Sport Bodies/ Churches/ Charities
Per kl Any educational activity and / or sporting body
12.61 12.61
Miscellaneous Per kl All consumers who do not fall within the above categories
13.55 13.55
Homeless people shelters/ homes catering of physically or mentally challenged individuals
Homeless people shelters/ homes catering for the health of physically or mentally challenged individuals, including HOMAC accredited children's homes, registered with council on an annual basis. A sworn affidavit must accompany the application indicating the number of people normally accommodated at the facility
Step 1 (0 to 1.5kls) Per kl per person
0 0
Step 2 (above 1.6kls)
Per kl per person
12.61 12.61
Vulnerable Groups (Subsistence farming)
As defined in the CHDM's Agriculture Policy for approved and registered groups, considered on an annual basis.
Step 1 (0 to 10 kl) Per kl Free allocation. Corresponding Sanitation consumption not free
0 0
Step 2 (above 10kl)
Per kl Normal tariff for which the facility is situated
0 0
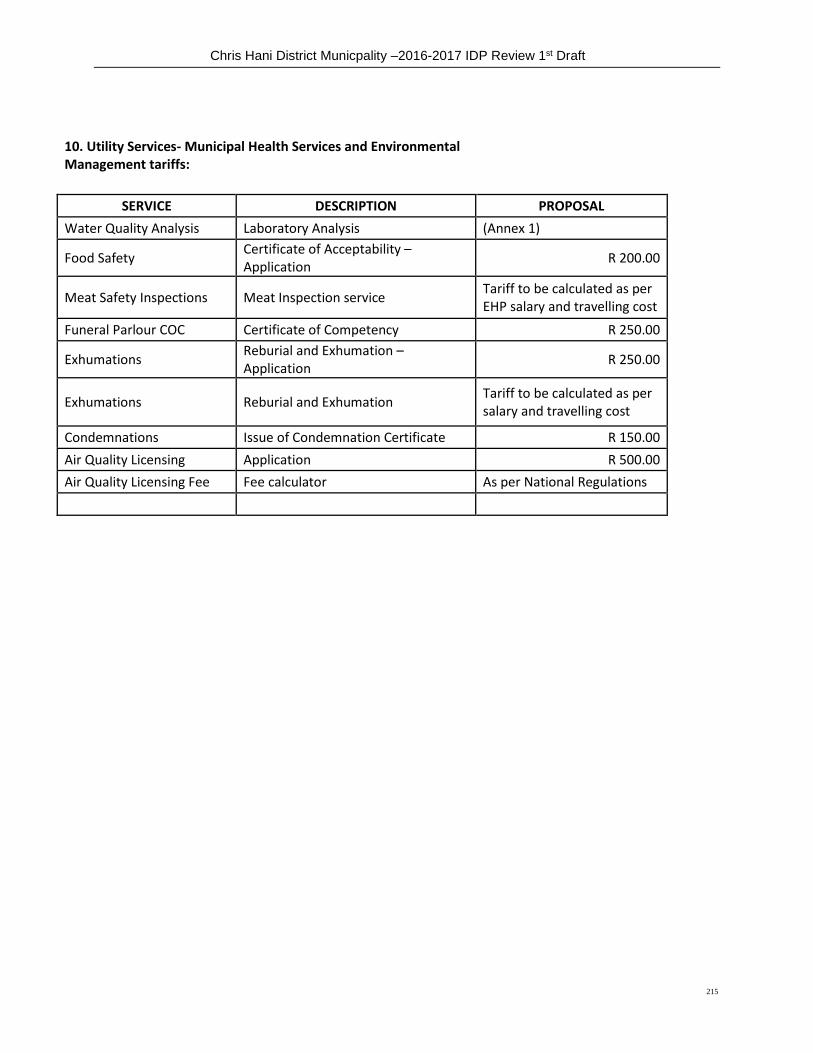
Chris Hani District Municpality –2016-2017 IDP Review 1st Draft
215
10. Utility Services- Municipal Health Services and Environmental
Management tariffs:
SERVICE DESCRIPTION PROPOSAL
Water Quality Analysis Laboratory Analysis (Annex 1)
Food Safety Certificate of Acceptability – Application
R 200.00
Meat Safety Inspections Meat Inspection service Tariff to be calculated as per EHP salary and travelling cost
Funeral Parlour COC Certificate of Competency R 250.00
Exhumations Reburial and Exhumation – Application
R 250.00
Exhumations Reburial and Exhumation Tariff to be calculated as per salary and travelling cost
Condemnations Issue of Condemnation Certificate R 150.00
Air Quality Licensing Application R 500.00
Air Quality Licensing Fee Fee calculator As per National Regulations
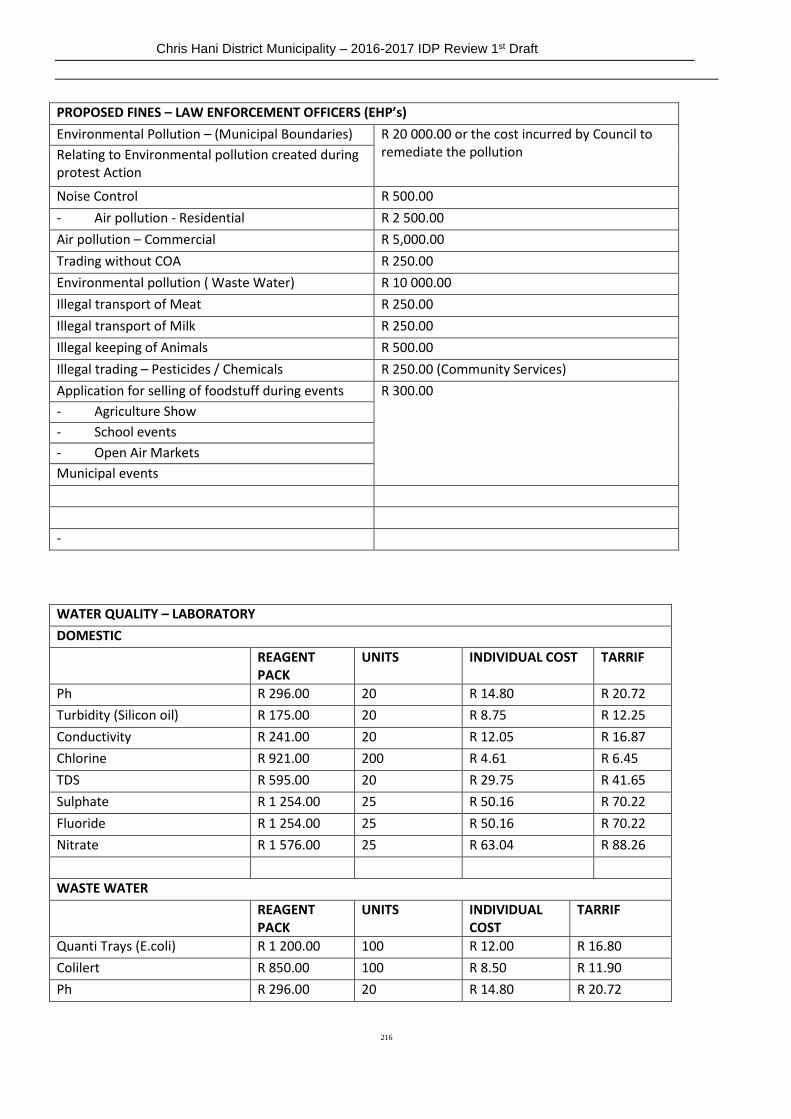
Chris Hani District Municipality – 2016-2017 IDP Review 1st Draft
216
PROPOSED FINES – LAW ENFORCEMENT OFFICERS (EHP’s)
Environmental Pollution – (Municipal Boundaries) R 20 000.00 or the cost incurred by Council to remediate the pollution Relating to Environmental pollution created during
protest Action
Noise Control R 500.00
- Air pollution - Residential R 2 500.00
Air pollution – Commercial R 5,000.00
Trading without COA R 250.00
Environmental pollution ( Waste Water) R 10 000.00
Illegal transport of Meat R 250.00
Illegal transport of Milk R 250.00
Illegal keeping of Animals R 500.00
Illegal trading – Pesticides / Chemicals R 250.00 (Community Services)
Application for selling of foodstuff during events R 300.00
- Agriculture Show
- School events
- Open Air Markets
Municipal events
-
WATER QUALITY – LABORATORY
DOMESTIC
REAGENT PACK
UNITS INDIVIDUAL COST TARRIF
Ph R 296.00 20 R 14.80 R 20.72
Turbidity (Silicon oil) R 175.00 20 R 8.75 R 12.25
Conductivity R 241.00 20 R 12.05 R 16.87
Chlorine R 921.00 200 R 4.61 R 6.45
TDS R 595.00 20 R 29.75 R 41.65
Sulphate R 1 254.00 25 R 50.16 R 70.22
Fluoride R 1 254.00 25 R 50.16 R 70.22
Nitrate R 1 576.00 25 R 63.04 R 88.26
WASTE WATER
REAGENT PACK
UNITS INDIVIDUAL COST
TARRIF
Quanti Trays (E.coli) R 1 200.00 100 R 12.00 R 16.80
Colilert R 850.00 100 R 8.50 R 11.90
Ph R 296.00 20 R 14.80 R 20.72
Chris Hani District Municipality – 2016-2017 IDP Review 1st Draft
217
Electrical Conductivity R 241.00 20 R 12.05 R 16.87
Suspended Solids R 560.00 25 R 22.40 R 31.36
Ammonia R 1 200.00 25 R 48.00 R 67.20
COD R 2 500.00 25 R 100.00 R 140.00
Nitrate R 1 576.00 25 R 63.04 R 88.26
Phosphate R 1 338.00 25 R 53.52 R 74.93
FREE BASIC SERVICES The working definition of beneficiaries for free basic services is poor households with a total household income below R 2 680 per month. These households are the beneficiaries of the basic services component of the equitable share allocation and as such will receive water subsidies of R 930.03 and sanitation services to an amount of R 76.00 per month. All the other households are excluded from this definition of free basic services beneficiaries. This working definition is provided in the Division of Revenue Bill, 2016 and explained in the formula for the equitable share allocations for municipalities. There seems to be coincidence in this regard between the indigent subsidies and free basic services subsidies. Council will need to decide on the level of services provided to the free basic services beneficiaries that are not inferior and are sustainable. The unintended consequences of these service levels include disparities between the different population groups, between urban and rural as well as the tendency to provide the services free to all households irrespective of income levels. A sustainable solution is to provide access to 750 litres per household per day inside the dwelling or yard. When all households receive a reliable water service, then they will fund the provision of sanitation at the level of sceptic tanks until the municipality is ready to roll out the sanitation network. This solution requires Council to decide on the designs of bulk water schemes, the reticulation schemes, the wastewater treatment plants, the types of water meters used and the toilet facilities permitted to be installed by the households. Different options are available as described in the Free Basic Services Regulations published by the Water Research Commission. INFLATIONARY TRENDS The cost of providing services is influenced by trends in the infrastructure industry, inclusive of inflation. The projected consumer price indices for the 2015 financial year are stipulated in the National Treasury Circular 70. The CPI projections for 2015, 2016 and 2017 financial years are 5.6, 5.4 and 5.4 respectively. The minimum wage for 2016 will be R 4 927. The maximum medical aid increase will be 50% of the percentage increase of CPI + 1.25. A provision of 12% increase for medical aid will be reasonable. The wage and salary cost of living adjustments are proposed at 6.8 % for 2015 (5.8 +1). Because of the negotiation processes as part of bargaining processes, it is proposed that the municipality provides for a 7.5% increase after the improvement of service conditions associated with closing the gap between top management and staff. A maximum of 6% increase on other expenses will suffice as the CPI of 5.4 is within this limit. Performance bonuses for the municipal manager and managers reporting to the municipal manager range from 5 to 14 percent of total remuneration. A provision of 10% will suffice since there have been no bonus payment trends recently in excess of 10%. The Eskom electricity increases have been approved at 7.39% by NERSA. This has the effect of limiting the costs influenced by the electricity inputs to the water and sanitation plants.

Chris Hani District Municipality – 2016-2017 IDP Review 1st Draft
218
The Engineering and Finance departments are encouraged to grow through the infusion of internships in their organisational structures. Phasing out of the clerk occupational category will provide more and better opportunities for internship contracts. For the effectiveness of internships, at least two year contracts are proposed inclusive of the EPWP element. It is a common practice amongst the educational institutions such as universities of technology and FET Colleges to require experiential training for their students. It is advised that the municipality provides opportunities for such training in areas of excellence relevant for the business of the municipality.
Collection rate at each municipality is not conducive for financial viability and sustainable services.
Municipality has conducted an internal study to address the Viability of institution where a strategy on
Revenue Enhancement has been developed. This will inform the municipality on ways of addressing recovery
and enhancing revenue through collection, billing etc.
2. FINANCIAL REPORTING AND BUGETING
Financial Reporting is done on a monthly basis internally to the Finance, Audit, Mayoral and Council Committees, externally the finance reporting is made to National Treasury and the various transferring departments like COGTA, DWA, Department of Roads and Transport and any other departments that we are performing agency functions for. In the previous years we have encountered a lot of challenges when it comes to financial reporting but that has since been resolved with the assistance from National Treasury through their CFO support program which has assisted in eradicating the backlog we had on financial reporting and constant training on reporting performed by Provincial Treasury office in the district.
Municipal budget is the annual financial plan of revenue and expenditure of local government units, revenues
and expenditures of budgetary establishments, auxiliary units, etc. It is passed in the form of a budget
resolution. Construction of the contents of the budget is determined by a team of budgetary principles, among
which the most important are the principles: unity, transparency, anteriority, balance, detail.
There are 5 Directorates (Budget & Treasury, Technical Services, Primary Health, and Environmental Health &
Disaster Management) within the District Municipality. Each Directorate is allocated funds in the budget, the
Directors are responsible to manage their allocated funds and accuracy is maintained.
In terms of budgeting all the budget related policies have been reviewed and approved by council. In terms of the Budget Framework Plan we are implementing according to the plan but what still need to be strengthened is the consultation of stakeholders so that we can get more although there is a budget steering committee which is in place and functional. We are also preparing budget as per the National Treasury guidelines and templates.
a. LINKAGE OF BUDGET TO IDP (LINKAGE AND ALIGNMENT)
Operations budget: the linkage between Budget & IDP are aligned and compliant as the committees are in
place as the Steering committee it’s called IDP/PMS/Budget Steering cause the three go together. All
operations are incurred in terms of IDP. The capital allocation is mainly for the Water & Sanitation services as
informed by Powers and Functions.
Chris Hani District Municipality – 2016-2017 IDP Review 1st Draft
219
Capital expenditure consists of MIG, RBIG, MWIG, RHIG, ACIP and WSOG which are 100% aligned to IDP as
they are spent on water & sanitation services. CHDM Municipal IDP gives attention to building its own delivery
capacities and IDP’s have improved over the last few years and are generally aligned to PGDP in terms of
agrarian transformation, human resource development, economic diversification and tourism, infrastructure
provision, and fighting poverty. However, there are some important gaps in the context of provincial
alignment (e.g. housing, EPWP etc).
The Chris Hani IDP devotes considerable attention to building its own capacity and that of the local municipalities. Perhaps more attention could be given to how to improve co-operation with other arms of Government
3. ASSET MANAGEMENT AND SUPPLY CHAIN MANAGEMENT We currently operate with a less staffed Asset Management unit. Asset management is incorporated under Budget and Reporting which was making the scope of work to be performed by the section to be huge and complex. Beginning of 2014/15 financial year this section has been splitted from supply chain management unit and new organogram has been developed and approved by the council and we are in a process of filling all the vacant positions as per new organogram. Currently we are using the external source with the few staff we had to assist in all the areas of assets (movable and infrastructure assets). We do have an Asset Register which is updated on a monthly basis for the movable assets and we have also procured an Asset Software which is also assisting in the proper management of asset. The area that still to be strengthened is the management of Infrastructure Assets. Infrastructure asset register is only updated at the end of the financial year which sometimes posses challenge during the end of the financial year. An Asset Management Strategy has been developed in 2015/16 financial year and we do have an Asset Management Policy. In the event of loss and stolen assets is reported to the asset manager and the asset register is updated. This is a plan to unify the asset management function and financial management system.
On Supply Chain Management the unit is the custodian of the institution’s Supply Chain Management Policy
which has been adopted by Council this policy is reviewed annually and ensures its implementation in its
procurement processes at all times. The policy itself is in line with Treasury Guidelines and is renewable
annually.
The unit has the following key priority areas:
• To ensure that the municipality has and implements a supply chain management policy, this gives
effect to the provisions of the act.
• To ensure procurement of goods and services in a fair, equitable, transparent, competitive and cost
effective and comply with the prescribed regulatory framework
• That all reasonable steps are taken to ensure that proper mechanisms are in place and separation of
duties in the supply chain management system is implemented to minimise likelihood of fraud,
corruption, favouritism and unfair and irregular practises.
• To ensure that all contracts/agreement are in writing and are procured in line with the Supply Chain
Management
• To ensure that the supply chain management delegations are properly enforced and managed
• That the municipal bid structures are in place and effective, to ensure competitive bidding process.
• Ensure submission of proper, accurate and applicable reports as per MFMA
• To ensure the disposal of municipal assets in accordance with the applicable legislation.
• Ensure that municipal inventory levels are kept at an acceptable levels as per the Municipal SCM
policy
Chris Hani District Municipality – 2016-2017 IDP Review 1st Draft
220
The institution is implementing a Database Rotation system for the procurement for goods and services for the
operational budget depending on delegation as per legislation, and is using an electronic order system for
purchases. Also the bidding system is followed as per legislation in terms of capital appointments and
according to the delegations. There are three bid committee structures that are active and have own set of
dates that they normally follow to attend to matters.
The Bid Committees are: the Adjudication Committee that is comprised of HoDs, SCM Manager and is chaired
by the CFO of the institution. Spefication and Evaluation Committees are appointed by Municipal Manager in
line with MFMA and as well SCM officials assist in sitting of these committees.
CHDM has the following elements of SCM that are fully functional:-
Demand management: This is the beginning of the supply chain, and must begin with a needs assessment, to
ensure that goods or services are required in order to deliver the agreed service, that specifications are
precisely determined, that requirements are linked to the budget and that the supplying industry has been
analyzed.
Acquisition management: It is the management of procurement by the municipality to decide on the manner
in which the market will be approached; to establish the total cost of ownership of a particular type of asset;
to ensure that bid documentation is complete, including evaluation criteria.
Logistics management: This aspect addresses the setting of inventory levels, placing of orders, receiving and
distribution of material and goods, stores, warehouse and transport management, expediting orders, the
review of vendor performance, maintenance and contract administration.
Disposal management: A supply chain management policy must provide for an effective system of disposal or
letting of assets no longer needed, including unserviceable, redundant or obsolete assets, subject to sections
14 and 90 of the MFMA.
Contract Management: this section addresses the validity of our contracts in terms of compliance and
applicable deliverables. It also monitors any variations that may be incurred.
Risk management: risk management is maintained in all elements of SCM by putting in place proper controls.
Risk management includes identification of risks on a case-by-case basis;
Performance management: This is a monitoring process, undertaking a retrospective analysis to determine
whether the desired objectives were achieved. Some of the issues that may be reviewed are: compliance to
norms and standards; cost efficiency of procurement process (i e the cost of the process itself).
Chris Hani District Municipality – 2016-2017 IDP Review 1st Draft
221
4. ACCOUNTING SYSTEMS ADMINISTRATION The unit is under Budget and Traeasury department and its main Objective is to maintain the financial
management systems for the District Municipality and it’s Local Municipalities as well as Integration of data
and or information between the systems that the district municipality use.
Unit uses various systems on a day to day basis. Systems that are in use are a sfollows
eVenus
The institution uses this financial Management System for:-
Processing of payments
General Ledger
Bank control
Assets and Fleet management
Cashdrawer
For receipting all income received and general enquiries.
Pay Day Software
The system helps us with Payroll, Human resources, Posts, Equity, Skills.
Bankit
We use the system for uploading payments for creditors and salaries to our FNB account.
Collection of money from our debtors and down loading the bank statements.
Supplier Database (Saratoga)
This system does supplier database management including rotation of suppliers.
CaseWare
This tool assists us in the preparation of GRAP compliant Financial Statements and it also
generates financial reports as per National Treasury Guidelines i.e. S71 reports and Budget
forms.
Asset Ware
It is a financial tool for Asset tracking and Management
Time Zone
Financial security system
This Unit nof Accounting Systems Administration gives support to some of our local municipalities which are using the same accounting packages as the district. They get shared support, skills transfer and systems administration on the systems above with district municipality.
Lukhanji Local Municipality
Intsika Yethu Local Municipality
Inkwanca Local Municipality
Chris Hani District Municipality – 2016-2017 IDP Review 1st Draft
222
5. ANNUAL FINANCIAL STATEMENT AND AUDIT
Budget and Treasury office have a section responsible for preparation of Annual Financial Statement and Audit Coordination. The key areas of this section are
Preparation and submission of Annual Financial Statements
Ensuring that audit is performed well by Auditor General and required information is submitted to
them timeously
Ensure that Audit Action plan is developed and implemented
5.1 AG’S OPINION AND AUDIT ACTION PLAN
Municipality has shown improvement on the Audit in the past two years as our audit opinion has changed
from Disclaimer to Qualification. Qualification has been achieved in the past two years and the institution is
striving for Unqualified Opinion as we believe we can achieve that. To ensure that matters raised by AG are
addressed promptly, CHDM has established Audit Task Team which sits weekly to make tasks easy for the
Steering Committee. Key areas of focus that the institution needs to focus on are issues of Compliance,
Performance Management, and Reconciliations of Grants which were not disclosed properly in the previous
financial years. An action plan has been developed which details the process to be followed in rectifying the
findings raised in the audit report. The AFS and Audit Coordination section is responsible for ensuring that the
institution work on improving the audit opinion by ensuring that action plan is being implemented and report
is prepared and submitted to council on progress.

Chris Hani District Municipality – 2016-2017 IDP Review 1st Draft
223
2.4.5 GOOD GOVERNANCE and PUBLIC PARTICIPATION
Good Corporate Governance underpins all the programmes and projects presented in this 2016-2017 IDP
Review. Good governance dictates that the Municipality should conduct its business in an Open, Transparent
and Accountable manner. For this to be realised, community participation is essential hence the municipality
developed policies and strategies to liase and interact with communities, amongst those are Stakeholder
Mobilisation Strategy, Public Participation Strategy, and Communication Strategy etc. The establishment of a
caring environment requires emphasis not only on community participation, but also on customer care and
responsiveness. With regard to Customer Care, the Municipality has embarked on a programme to engage
customers with regard to their level of satisfaction with municipal services and the development of a new
Customer Care Framework. In the current IDP review period, foundational work has been done in terms of the
completion of a comprehensive survey of all types of customers. Soon thereafter, the focus will shift to
embedding a robust system of customer relations management, anchored in clear service standards, customer
responsiveness, and the monitoring and evaluation of ongoing customer perceptions and feedback. The revival
of the Batho Pele Campaign will complement this effort and galvanise the institution to embrace a culture of
putting people first.
1. COMMUNICATIONS
The Communications unit was established in order to provide a link between the municipality and the
community, providing communication service for all CHDM Directorates. The communication function is
politically accountable to the Executive Mayor and the unit of communication is at the Strategic Directorate.
This function of communication is a legislative requirement as guided by The Constitution of the Republic of
South Africa, Act 108 of 1996, Section 32 that gives a right to every citizen to Right to Access any information
held by the state. The Municipal Systems Act 32 of 2000 Chapter 4, which requires Public Participation of
communities and stakeholders in decisions of councils. The Promotion of Access to Information Act No. 14 of
2000 which indicates how communities can access information at any given time. The Municipal Finance
Management Act 56 of 2003 which encourages publication of information and consultation with communities.
The District IDP which seeks to achieve the prescripts of the mission and vision and further the National
Government Communications Plan which provides framework for government communication and the SALGA
National Communications Conference Resolutions of May 2006.
The Unit is guided by the following Strategic Objectives
To strategize for municipal communication per communication challenges of the District
To regulate municipal communication
To maintain uniform corporate identity and image that promotes the municipal vision, mission and
values
To facilitate a coordinated two way flow of communication between municipality and its internal and
external publics
To provide communication support to all Directorates

Chris Hani District Municipality – 2016-2017 IDP Review 1st Draft
224
Communication Strategy
Communication Strategy has been developed and approved by Council in 2014/15 financial year, so that the
unit would develop and implement a responsive communication strategy with a programme of action that is
aligned to the municipal IDP, to guide communication activities of the municipality and should be linked to the
term of Council. The strategy is reviewed annually and adopted by Council after a consultative process with
relevant stakeholders. As one of key mandates of the develoomental local government is to ensure
participation and communication to all stakeholders each and every year its imperative that this is reviewed
annually and adopted by council. For 2016-2017 Financial Communications Unit intends to develop a New 5
Year Communcation Strategy linked to the term of Councillors.
The objectives of the strategy are to encourage meaningful public participation through promotion of
government programmes; To promote and articulate CHDM plans, policies and achievements. To facilitate
proactive communication on matters of disaster risk management, health and environmental issues; To
strengthen and improve internal communication systems; To reinforce intergovernmental relations through
coordination of communication programmes and activities amongst the three spheres of government and to
create and maintain sound relations with the media. Communication Policy was further developed and this has
to be developed and implementation of a communication policy haad to set out clear regulations and
procedures for communication in the municipality. The policy is currently incorporated in the Communication
Strategy and is reviewed annually.
Communication Structures are in place to ensure establishment of vibrant communication structures within
the district to ensure smooth flow of information and alignment of programmes. A District Communication
Forum chaired by the Manager Communications has been established, Local Communication Fora are
established and the Manager of Communications participate in the Municipal Managers’ Forum, an IGR
structure that includes government departments and parastatals. A Communication Task Team (CommTask) is
also established as an internal communication structure.
Marketing and Branding
The unit develops and implements a marketing plan that seeks to ensure promotion of the municipality and its
activities and programmes for the benefit of its publics, tourists and investors. This function requires
maximum utilisation of various platforms in the print, electronic media arenas and exploitation of unmediated
opportunities. The unit further develops marketing material such as banners, posters, leaflets, booklets and
any promotional material. The unit also develops and oversee implementation of Branding Guidelines which
regulate use of the municipal symbol, playing a leading role in the production of all branded material such as
name tags, business cards, stationery, corporate wear, corporate gifts, vision and mission statements, also
maintaining brand visibility through office and boundary signage.
Website content authoring The District Web site is a marketing, public participation and information dispensing tool. The unit is therefore responsible to constantly update the website with relevant content while the ICT section is responsible for the technical side. All important documents which are for public are uploaded on te website, documents loke IDP, SDBIP, Perfomance Agreements of Sec 56/57 Managers, Budget, IDP/Budget/PMS Process Plan, IDP Framework, Tenders awarded etc
Chris Hani District Municipality – 2016-2017 IDP Review 1st Draft
225
Advertising The unit is responsible for all advertising pertaining to: Council meetings, council announcements / messages,
events, project launches, annual reports, budget processes, IDP programmes etc.
Media Liaison and Monitoring
The unitt liaise with various media houses (radio, television and newspapers) for the purposes of disseminating
information to the public and responding to media queries, record and keep track of what is publicized about
the municipality and any news relating to local government and report to council.
News letters
The communication unit publishes a quarterly newsletter called “Uphuhliso” currently in two languages
(isiXhosa and English). The main objective of the publication is to disseminate information, encouraging public
participation in the process. The content is sourced from various directorates. An internal news letter
“InnerView”, is also published to keep internal stakeholders informed of Council business also affording them
a platform to air their views. The publication is done in house and produced monthly.
Presidential Hotline Queries
The unit is also charged with monitoring and coordination of hotline queries on line, facilitate responses and report. Events
The unit plays a prominent role in the coordination of ALL Council events by providing communication support,
such as media liaison, branding, photography etc. The events range from Outreach, IDP Road shows, Chris
Hani Month, Tourism / Heritage month, Institutionalized days such as Womens’ Day, ISDR etc.Production of
Annual Repor, the unit is responsible to produce a compliant annual report: this involves sourcing of
information from Directorates, collating and editing and ensure commissioning of printing services.
2. SPECIAL PROGRAMMES UNIT
The Special Programmes Unit (SPU) is a developmental office coordinating the upliftment of designated groups
(i.e. Gender, Youth, and People with Disabilities, Children and The Elderly) and ensures that all CHDM
Directorates mainstream their programmes. The Special Programmes Unit is located in the Strategic
Directorate.
This function is a legislative requirement guided by The Constitution of the Republic of South Africa, Act 108 of
1996, Section 9 that declares everyone is equal before the law and has the right to equal protection and
benefit of the law. The Local Government Municipal Systems Act 32 of 2000 Chapter 4 which requires public
participation of communities and Municipalities to take into account the special needs of designated groups.
The Promotion of Equality and Prevention of Unfair Discrimination Act 4 of 2000 and South Africa’s National
Policy Framework for Women’s Empowerment and Gender Equality of 2000 that promote and protect
women’s rights towards achieving gender equality.
Chris Hani District Municipality – 2016-2017 IDP Review 1st Draft
226
The Integrated National Disability Strategy of 1997 requires us to drive the government’s equity, equality and
empowerment agenda in terms of those living with disabilities. The National Youth Policy of 2008 is a
framework for youth development across the country which endeavours to ensure that all young women and
men are given meaningful opportunities to reach their full potential, both as individuals and as active
participants in society.
The Constitution of the Republic of SA, The South African Children’s Charter, and Children’s Act 38 of 2005
encourages government to develop a non-sexist, discrimination-free, equitable and inclusive society that
protects and develops the human potential of its children. The Older Persons Act 13 of 2006 seeks to promote
the rights, prevent and combat the abuse of older persons. The District IDP which seeks to obtain the vision,
mission and promote the values of a caring society.
STRATEGIC OBJECTIVES OF THE SPU
To assist CHDM in monitoring and evaluation of the integration and mainstreaming of Special Programmes
in the IDP and sector plans.
To facilitate and coordinate the development of District Gender Policy, District Integrated Disability
Strategy, District Youth Strategy and Coordinate and Monitor the implementation of Children’s and Older
Persons Rights Strategies.
To coordinate the participation of vulnerable groups in development through their designated forums.
To capacitate designated groups forums in order to manage their programmes and projects effectively.
To promote civic education on legislation, policies and programmes affecting designated groups to
strengthen social cohesion.
To coordinate the commemoration of institutionalised days.
The unit develops a holistic policy that responds to the changing conditions of vulnerable groups in partnership
with other stakeholders t ensure that they grow, develop and prosper as fully engaged responsive and
productive citizens.
It shall articulate the values of respect, participation, access, equity, diversity, redress, responsiveness,
transparency, gender sensitive, team work and ubuntu.
The unit shall develop and implement a responsive special programmes strategy with a clear programme of
action that is aligned to the district IDP linked to the term of council. The strategy must be reviewed by all
relevant stakeholders annually and be adopted by council.
The strategy highlights priority targets and interventions to be actioned for the betterment of the vulnerable
groups in areas such as education and skills development, employment and economic development, health
and wellbeing, social cohesion and public participation, information and communication, violence and abuse
against women and children, access and integration of people with disabilities, arts, sports and culture.
The unit has a functional District Special Programmes Unit Forum to support, coordinate and mainstream the
programmes in the departments and the IDP. This forum is made up by representatives from all local
municipalities and the district. The district technical task team is established to support the local municipalities
to plan and integrate their programmes adequately. The Special Programmes shall the requisite personnel to
attend to the challenges of the designated as recommended by SALGA and COGTA.
Chris Hani District Municipality – 2016-2017 IDP Review 1st Draft
227
The unit shall support and advise the local municipalities, monitor the implementation of the strategy, liaise
with Chapter 9 institutions, advice and brief the political and administrative heads respectively on all matters
affecting designated groups.
The SPU Section has identified areas which need to be resolved to ensure that youth, people with disabilities,
the elderly, children and gender issues are addressed within the institution:
Strategic focus responds to a need for skills development through education and training.
Demographic analysis does not provide accurate picture about youth. It provides no information about
the levels and types of disability. It provides no information about children. This unclear picture
compromises targeted programming, impact benchmarking and evaluations.
IDP does not provide a district skills profile. It only assumes the need for education and training on the
basis of high number of youth in the district, without even quantifying that number. Information is
neither disaggregated according to gender nor disability. In the absence of such skills profile training
interventions are compromised in terms of impact benchmarking and evaluation.
It is not clear how the 26% youth ownership of SMMEs is distributed across economic sectors in the
district. The same is not said about women ownership, except that their dress-making enterprises
make up 44% of the manufacturing sector. Nothing is said about disability. The determination of any
support for promotion of enterprise development would be compromised if based on such inadequate
planning information.
IDP emphasizes the lack of recreational facilities for youth especially in former homeland areas. It is
silent on recreational needs of women and people with disabilities, children and the elderly.
Need to focus on land tenure is limited only to youth and women, to the exclusion of people with
disabilities. This may lead to this group being excluded from housing beneficiation as well as land for
commercial purposes.
IDP silent on HIV/Aids and disability, children and the elderly. This may lead to inappropriate strategies
and resource misallocation.
IDP acknowledges need for appropriate baseline information for proper planning. It acknowledges
need for policies, mechanisms, processes and procedures for mainstreaming. It acknowledges need for
improving coordination.
3. Inter-Governmental Relations (IGR)
The function of the structure is to align the planning cycles of the different spheres of government to
ensure that IDP is a reflection of national plans at a local level. CHDM has developed an IGR Strategy
and for the financial year key is implementation of IGR Strategy as driven by IGR Core Team and
adopted by council.
The Executive Mayor of the CHDM is convening the DIMAFO of the District. It is composed of : -
– All Mayors in 8 municipalities
– The Departmental officials in the District
The Technical IGR Forum also is operational as chaired by Municipal Manager of CHDM, this forum seats
quarterly and is attended by all senior management of the institution as well as all sector departments’ senior
management. This forum discusses service delivery issues and issues discussed are alleviated to the District
Chris Hani District Municipality – 2016-2017 IDP Review 1st Draft
228
Mayors Forum for endorsement and for political buy-inn, meaning it further informs the agenda of the
DIMAFO.
Technical advise on policy / program debate
Develop an agenda
Report on progress
The Executive Mayor attends the Premier’s Co-ordinating Forum to raise issues that talk to Strategic
positioning of the CHDM in the fight against poverty. The MM attends the Technical Forum with the Director
General of the Province. SALGA is an integral part of all these processes as the organized body of the local
government
Challenges
o Failure by government structures to utilise Intergovernmental Relations as a planning tool;
o Lack of joint implementation of projects by government structures;
Risk Management
The District has developed and adopted Risk Management Policy which is adopted by Council and the unit
manages the process and the Municipal Manager assesses the implementation of risk management plans. The
progress on the implementation of risk management plans is monitored by the Performance Audit Committee.
Institution is in aprocess of appointing Risk Management Commeettee and this will be blessed by council.
Internal Audit Function
The Internal Audit Unit of the Chris Hani District Municipality was established in terms of the Municipal
Finance Management Act, Act 56 of 2003 (‘MFMA’) which states that Accounting Officer is responsible for
managing the financial administration of the municipality and that the municipality has and maintains,
effective and transparent systems of internal audit, operating in accordance with any prescribed norms and
standards.The internal audit activity evaluates risk exposures relating to the organization's governance,
operations and information systems, in relation to:
Effectiveness and efficiency of operations.
Reliability and integrity of financial and operational information.
Safeguarding of assets.
Compliance with laws, regulations, and contracts.
Based on the results of the risk assessment, the internal auditors evaluate the adequacy and effectiveness of
how risks are identified and managed in the above areas. They also assess other aspects such as ethics and
values within the organization, performance management, communication of risk and control information
within the organization in order to facilitate a good governance process.
The internal auditors provide recommendations for improvement in those areas where opportunities or
deficiencies are identified. While management is responsible for internal controls, the internal audit activity
provides assurance to management and the audit committee that internal controls are effective and working
as intended.
Chris Hani District Municipality – 2016-2017 IDP Review 1st Draft
229
The internal audit activity is led by the Internal Audit manager and the Manager delineates the scope of
activities, authority, and independence for internal auditing in a written charter that is approved by the audit
committee and adopted by Council
The Internal Audit Activity is manned by six capable Internal Audit practitioners who are members of the
Institute of Internal Auditors. The IIA is the primary body for the internal audit profession; it maintains the
International Standards for the Professional Practice of Internal Auditing and the profession s Code of Ethics.
IIA members are required to adhere to the Standards and Code of Ethics.
The Audit Committee
The Audit Committee is established in terms of Section 166 of the Municipal Finance Management Act, Act 56
of 2003 (‘MFMA’) which states that ‘’Each Municipality and each municipal entity must have an audit
committee.”The purpose of the Committee is to assist and advise the Council in fulfilling its oversight
responsibilities for the financial reporting process, the system of internal control over financial reporting, the
audit process, performance management and evaluation, Council’s process for monitoring compliance with
laws and regulations and Council’s code of conduct.
The Chris Hani District Municipality’s audit committee is shared amongst the three Municipalities i.e. CHDM,
Intsika Yethu Local Municipality and Engcobo Local Municipality; the committee is constituted by three highly
qualified professionals who are neither members of management nor members of Council
An audit committee typically serves as the liaison among the Council, external auditors, internal auditors, and
financial management. Generally, the audit committee's purpose is to assist the Council in overseeing the:
Reliability of the entity s financial statements and disclosures.
Effectiveness of the entity s internal control and risk management systems
Compliance with the entity s code of business conduct, and legal and regulatory requirements
Independence, qualifications, and performance of the external auditors and the performance of the
internal audit activity.
The Performance Audit Committee
Section 195 of the Constitution established the promotion of the efficient, economic and effective use of
resources as one of the democratic values and principles of public administration and for this reason the Chris
Hani District Municipality established a Performance Audit Committee. A performance audit is an independent
auditing process aimed at ensuring that satisfactory management measures have been instituted to confirm
that resources are both acquired economically as well as used efficiently and effectively. Essentially, it entails
“optimal (best) use of available resources”, “to achieve the stated goals”, in the “least expensive way” The
Performance Audit Committee is constituted by three independent individuals who are not employees of the
Chris Hani District Municipality, with appropriate business, financial, academic credentials and with suitable
leadership skills. These three independent individuals are deemed voting members. The Performance Audit
Committee meets at least four times during a financial year (one meeting per quarter). The Chairperson
convenes any additional meetings, as deemed necessary, at his/her own volition or upon the request of the
internal and/or external auditors, the Accounting officer and/or any Performance Audit Committee member.
Chris Hani District Municipality – 2016-2017 IDP Review 1st Draft
230
Functions of the Performance Audit Committee
More and above the provision of credible view of the efficiency and effectiveness of the performance
management of the municipality this Committee facilitates consideration of the annual report in its entirety
and also performs the following functions: Review quarterly reports, the Annual Financial Statements (AFS)
and any other reports deemed necessary, regarding the performance of management of the CHDM; Review
quarterly reports of Internal Audit regarding auditing of performance measurements; Reviewing significant
differences of opinion between management and the internal audit function; Review the Municipality’s
performance management system and make recommendations in this regard to Council; and, In reviewing the
performance management system, the committee focuses on economy, efficiency, effectiveness and impact in
so far as the key performance indicators and performance targets set by the municipality are concerned; In
this regard it is provided with the relevant Integrated Development Plan (IDP) and Service Delivery and Budget
Implementation Plans (SDBIP).
Accountability
(i) The Chairperson of the Performance Audit Committee accounts to Council and the Executive Mayor,
via the Municipal Manager.
(ii) The Chairperson of the Performance Audit Committee submits an annual report to the Council after
the Management Letter has been received from the Auditor-General.
(iii) The Chairperson of the Performance Audit Committee prepares a statement, for inclusion in the
annual report, commenting on performance management and performance evaluation.
(iv) The Chairperson reports and makes recommendations of any material findings to the Executive Mayor
via the Municipal Manager.
(v) The Chairperson of the Performance Audit Committee serves on the Assessment Panel for Section 57
Employees according to the performance regulations.
4. Public Participation
A recent study by the Department of Social Development has indicated that residents in ISRDP nodes rate their
local authorities higher than other spheres of government but cynicism is beginning to increase. There is a
growing perception that all spheres are not doing anything to improve the lives of residents. In addition there
is a growing sense of alienation i.e. that a person has no influence on their surrounds or community and a
growing lack of apathy towards attending community participation programmes like the IDP. It is therefore
even more important that CHDM increases its public participation and feedback mechanisms. Reviewed Public
Participation Strategy as adopted in 2014 Council meeting guides and inform all these innitiatives.
CHDM currently runs IDP and Budget roadshows on a yearly basis in all municipalities. In addition it hosts
several public knowledge sharing days on health issues, hygiene, water and sanitation usage, supply chain
management, disaster and fire prevention strategies and fire, occupational health and safety, LED, GIS and
Planning. To strengthen the relations with Traditional Leadership the House of Traditional Leadership of the
region is a stakeholder that sits on our Representatives Forum. In accordance with the Local Government
Municipal Systems Act, the CHDM holds regular Integrated Development Plan (IDP) Representative Forum
meetings in drafting its IDP. At the beginning of the planning cycle, advertisements are placed in the local
newspapers calling for interested parties to contact the CHDM.

Chris Hani District Municipality – 2016-2017 IDP Review 1st Draft
231
Once the IDP and budget have been drafted and tabled at Council, the CHDM places another advertisement
calling for public comments. Copies of the document are lodged at all the Libraries within the district and at
Local Municipalities. After this process, the CHDM further embarks upon IDP and Budget Roadshows to the
communities’ at all local municipalities. This is done in conjunction with the support and assistance of the
local municipalities who assist the CHDM’s officers, through their Ward Councillors, to mobilize the ward
community members to attend the roadshow events. The Draft IDP is summarized and presented to
communities in English and isiXhosa for comment and discussion. Records of these meetings are kept and a
document is drafted to keep track of the responses and to disseminate to other government departments for
follow up and actioning, where necessary, through intergovernmental forum meetings and Rep Forum. Once
all the comments and discussions have been taken into consideration towards an amended IDP and Budget,
the above process is followed up by a Council Open Day, where Committees and members of the community
are invited to a Council meeting. The amended/Draft IDP and Budget is again presented for the last time
before they are submitted to Council for adoption. Council procedures are relaxed for the Council Open Day
to allow the communities to speak and voice their comments after the presentations have been made. These
comments are again collated into a document.
The IDP/Budget Road-shows are conducted annually and all Local Municipalities with the district are visited,
the mayoral committee champions the initiative. Below is a proposed time schedule to be followed per LM in
April 2016.
MUNICIPALITY/AREA VENUE DATE TIME
1.Engcobo Local
Municipality
Engcobo Town Hall
By the Month of April
2016
10h00
2. Nkwanca Local
Municipality
Molteno Community Hall 10h00
3.Tsolwana Local
Municipality
Tarkastad Community
Hall
10h00
4. Sakhisizwe Local
Municipality
Elliot Town Hall 10h00
5.Inxuba Yethemba
Local Municipality
Cradock Town Hall 10h00
6. Emalahleni Local
Municipality
Dordrecht Town Hall 10h00
7. Intsika Yethu Local
Municipality
Cofimvaba Town Hall 10h00
8. Lukhanji Local
Municipality
Indoor Sports Centre 10h00
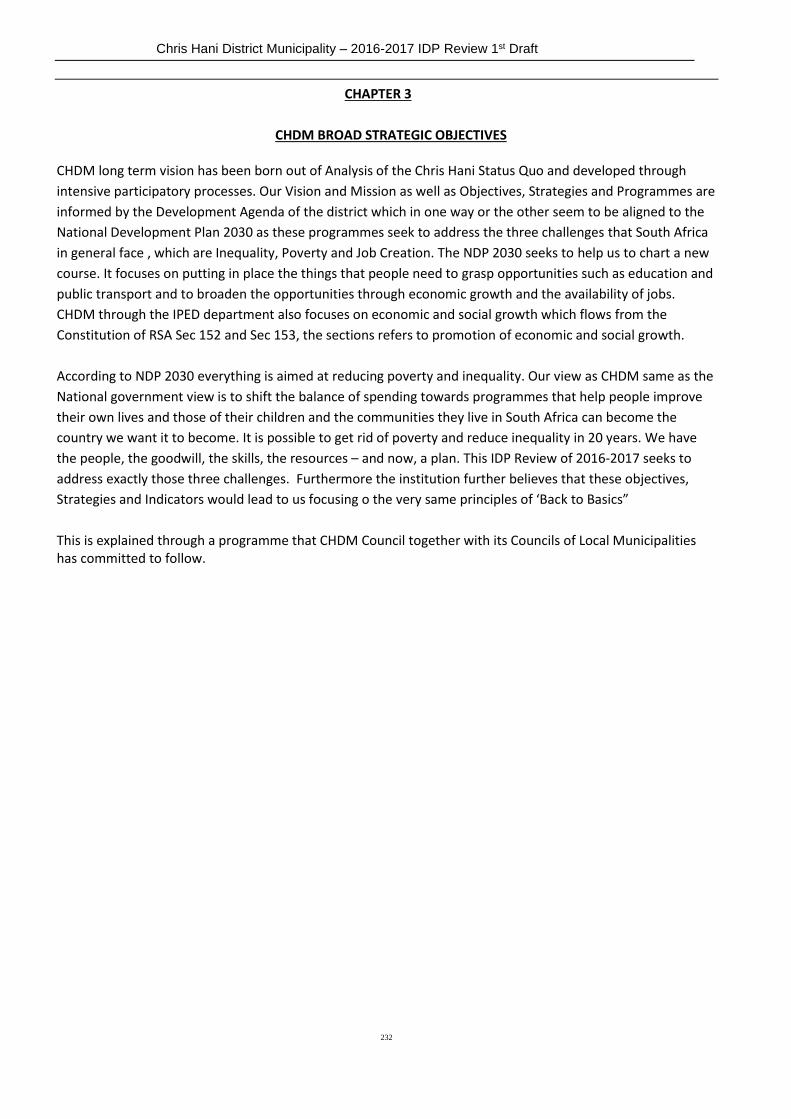
Chris Hani District Municipality – 2016-2017 IDP Review 1st Draft
232
CHAPTER 3
CHDM BROAD STRATEGIC OBJECTIVES CHDM long term vision has been born out of Analysis of the Chris Hani Status Quo and developed through
intensive participatory processes. Our Vision and Mission as well as Objectives, Strategies and Programmes are
informed by the Development Agenda of the district which in one way or the other seem to be aligned to the
National Development Plan 2030 as these programmes seek to address the three challenges that South Africa
in general face , which are Inequality, Poverty and Job Creation. The NDP 2030 seeks to help us to chart a new
course. It focuses on putting in place the things that people need to grasp opportunities such as education and
public transport and to broaden the opportunities through economic growth and the availability of jobs.
CHDM through the IPED department also focuses on economic and social growth which flows from the
Constitution of RSA Sec 152 and Sec 153, the sections refers to promotion of economic and social growth.
According to NDP 2030 everything is aimed at reducing poverty and inequality. Our view as CHDM same as the
National government view is to shift the balance of spending towards programmes that help people improve
their own lives and those of their children and the communities they live in South Africa can become the
country we want it to become. It is possible to get rid of poverty and reduce inequality in 20 years. We have
the people, the goodwill, the skills, the resources – and now, a plan. This IDP Review of 2016-2017 seeks to
address exactly those three challenges. Furthermore the institution further believes that these objectives,
Strategies and Indicators would lead to us focusing o the very same principles of ‘Back to Basics”
This is explained through a programme that CHDM Council together with its Councils of Local Municipalities has committed to follow.
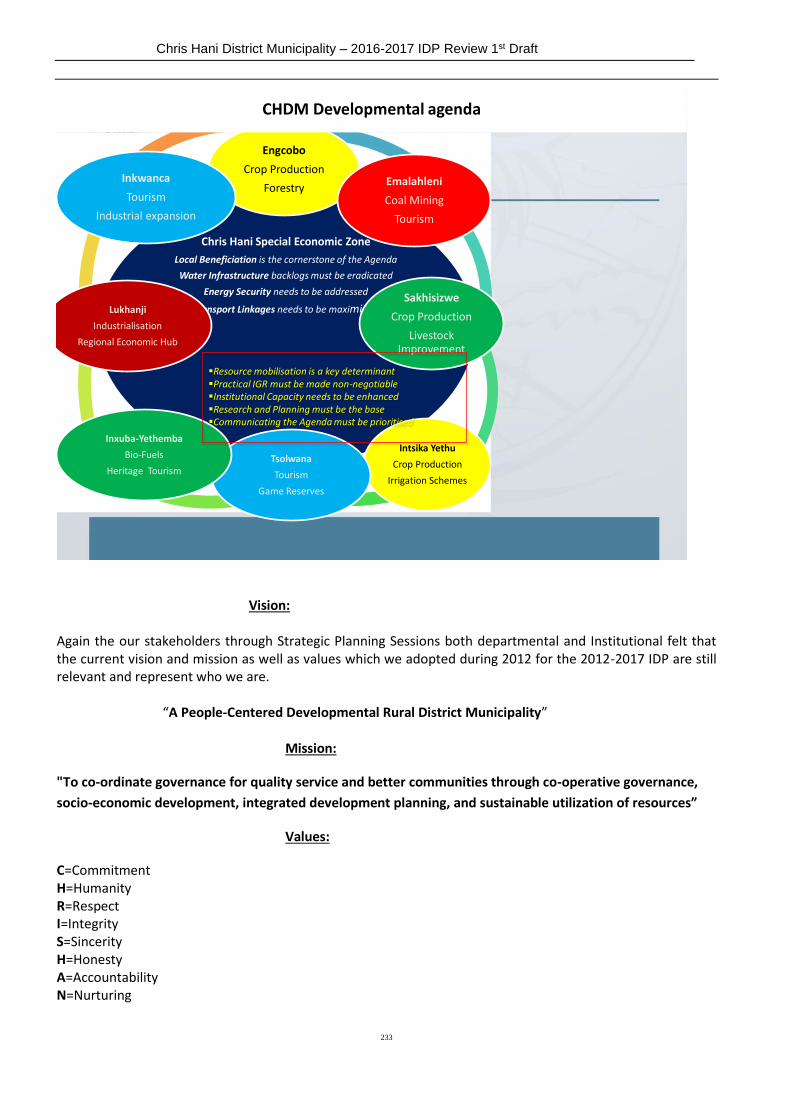
Chris Hani District Municipality – 2016-2017 IDP Review 1st Draft
233
Chris Hani Special Economic Zone
Local Beneficiation is the cornerstone of the Agenda
Water Infrastructure backlogs must be eradicated
Energy Security needs to be addressed
Transport Linkages needs to be maximised
Engcobo
Crop Production
ForestryEmalahleni
Coal Mining
Tourism
Sakhisizwe
Crop Production
Livestock Improvement
Intsika Yethu
Crop Production
Irrigation Schemes
Tsolwana
Tourism
Game Reserves
Inxuba-Yethemba
Bio-Fuels
Heritage Tourism
Lukhanji
Industrialisation
Regional Economic Hub
Inkwanca
Tourism
Industrial expansion
CHDM Developmental agenda
Resource mobilisation is a key determinantPractical IGR must be made non-negotiableInstitutional Capacity needs to be enhancedResearch and Planning must be the base Communicating the Agenda must be prioritised
Vision: Again the our stakeholders through Strategic Planning Sessions both departmental and Institutional felt that the current vision and mission as well as values which we adopted during 2012 for the 2012-2017 IDP are still relevant and represent who we are. “A People-Centered Developmental Rural District Municipality” Mission:
"To co-ordinate governance for quality service and better communities through co-operative governance,
socio-economic development, integrated development planning, and sustainable utilization of resources”
Values:
C=Commitment H=Humanity R=Respect I=Integrity S=Sincerity H=Honesty A=Accountability N=Nurturing

Chris Hani District Municipality – 2016-2017 IDP Review 1st Draft
234
I=Innovative
In an effort to realize the institutional vision, CHDM has developed 5 Broad Strategic Objective as aligned to
the National KPA. These are a way of responding to key issues confronting the municipality and as said are
aligned to the 5 National KPA’s (5 year Local Government Strategic Agenda). These Broad Strategic Objective
also remain unchanged for this period of IDP Review 2016-2017 and this is further informed by the fact that
this IDP Review is aproduct of this same Council and 2016-2017 is the last IDP Review of the 2012-2017 IDP.
CHDM 5 KEY BROAD STRATEGIC OBJECTIVES 1. Ensuring an Effective, Efficient and Co-ordinated Financial Management that enables CHDM to deliver its mandate. 2. To consistently create an enabling environment for Economic Growth, Rural Development and Employment opportunities. 3. Ensuring provision of Basic Services in a well structured, efficient and integrated manner. 4. To encourage the involvement and collaboration of Communities and Stakeholders through working together to achieve good governance in an integrated manner. 5. To establish and mantain a skilled labour force guided by policies to function optimally towards the delivery of services to communities.
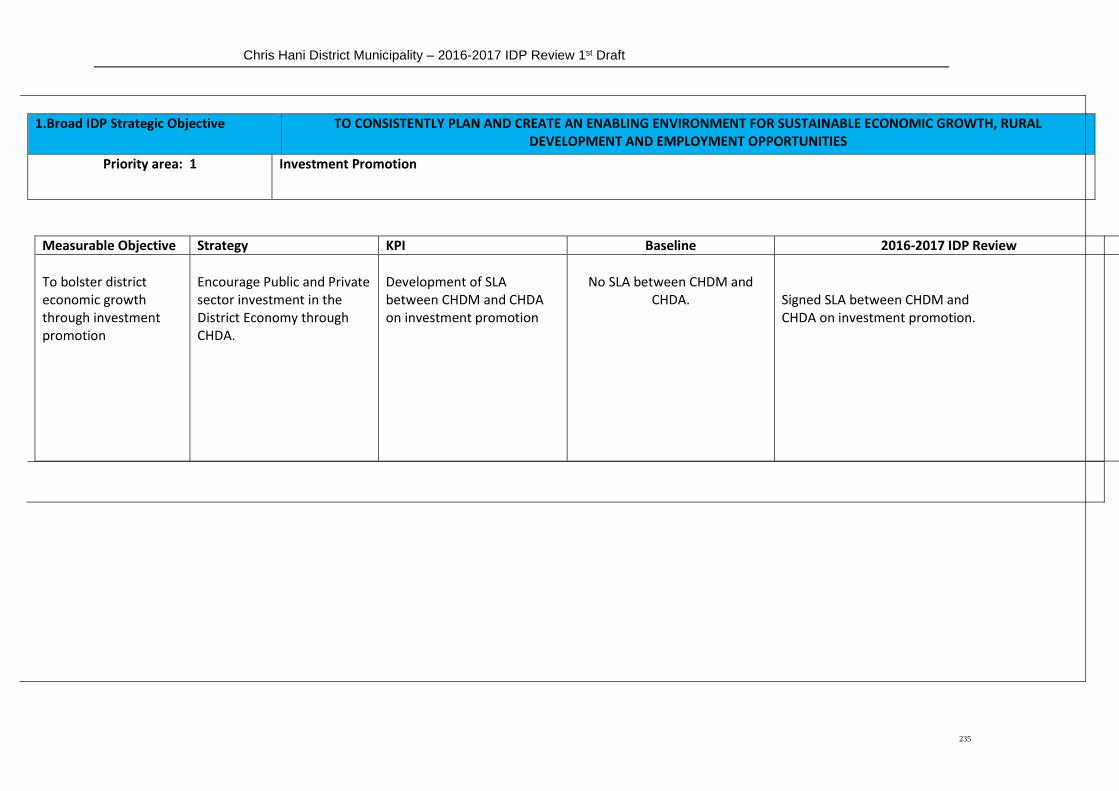
Chris Hani District Municipality – 2016-2017 IDP Review 1st Draft
235
1.Broad IDP Strategic Objective TO CONSISTENTLY PLAN AND CREATE AN ENABLING ENVIRONMENT FOR SUSTAINABLE ECONOMIC GROWTH, RURAL DEVELOPMENT AND EMPLOYMENT OPPORTUNITIES
Priority area: 1 Investment Promotion
Measurable Objective Strategy KPI Baseline 2016-2017 IDP Review
To bolster district economic growth through investment promotion
Encourage Public and Private sector investment in the District Economy through CHDA.
Development of SLA between CHDM and CHDA on investment promotion
No SLA between CHDM and
CHDA.
Signed SLA between CHDM and CHDA on investment promotion.
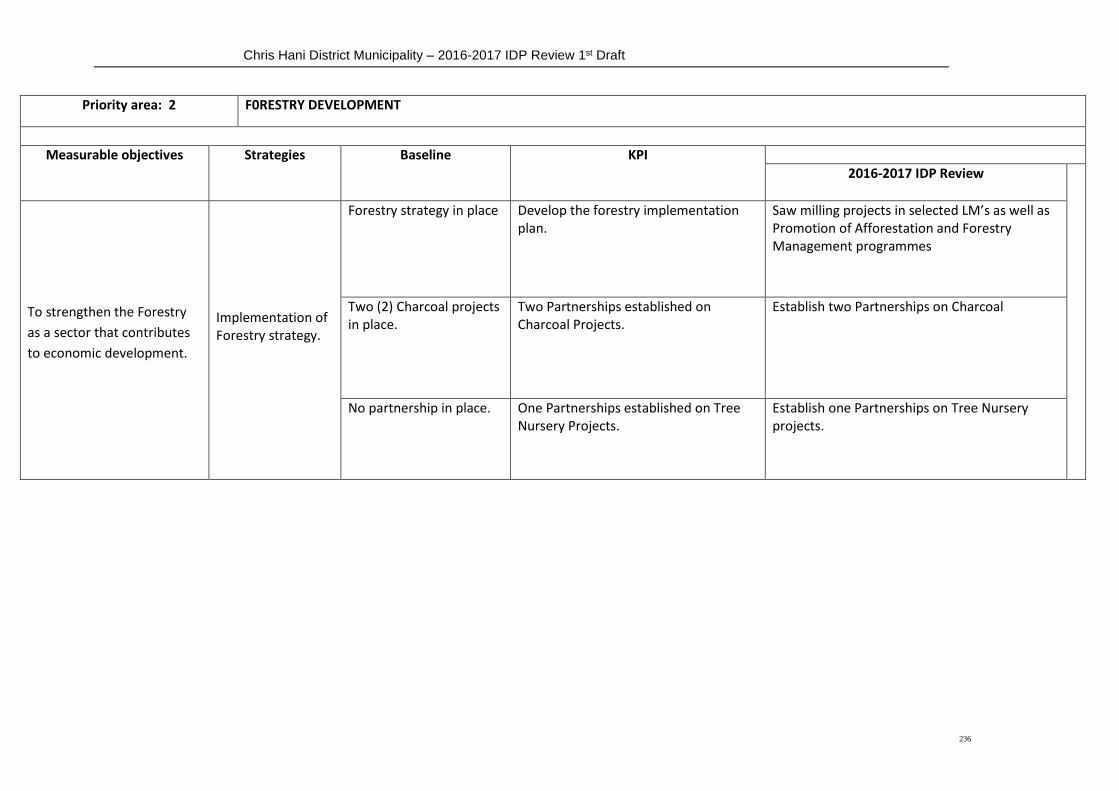
Chris Hani District Municipality – 2016-2017 IDP Review 1st Draft
236
Priority area: 2 F0RESTRY DEVELOPMENT
Measurable objectives Strategies Baseline KPI
2016-2017 IDP Review
To strengthen the Forestry
as a sector that contributes
to economic development.
Implementation of Forestry strategy.
Forestry strategy in place
Develop the forestry implementation plan.
Saw milling projects in selected LM’s as well as Promotion of Afforestation and Forestry Management programmes
Two (2) Charcoal projects in place.
Two Partnerships established on Charcoal Projects.
Establish two Partnerships on Charcoal
No partnership in place. One Partnerships established on Tree Nursery Projects.
Establish one Partnerships on Tree Nursery projects.
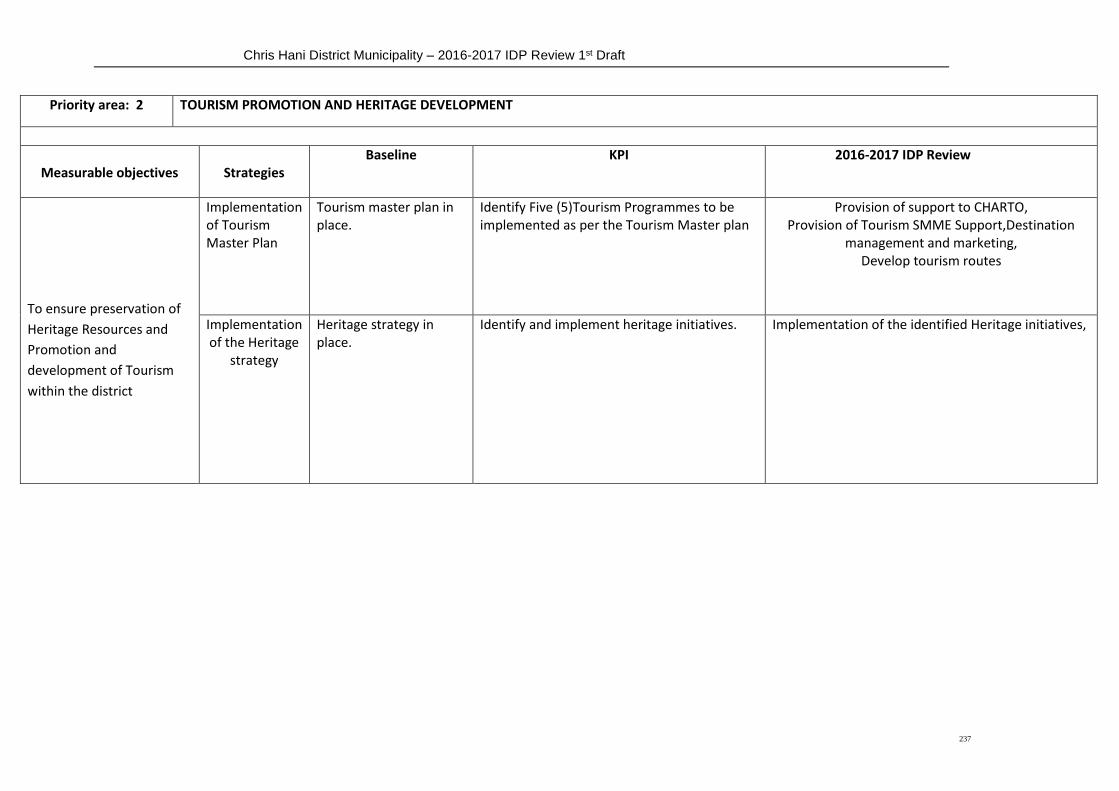
Chris Hani District Municipality – 2016-2017 IDP Review 1st Draft
237
Priority area: 2 TOURISM PROMOTION AND HERITAGE DEVELOPMENT
Measurable objectives
Strategies
Baseline KPI 2016-2017 IDP Review
To ensure preservation of
Heritage Resources and
Promotion and
development of Tourism
within the district
Implementation of Tourism Master Plan
Tourism master plan in place.
Identify Five (5)Tourism Programmes to be implemented as per the Tourism Master plan
Provision of support to CHARTO, Provision of Tourism SMME Support,Destination
management and marketing, Develop tourism routes
Implementation of the Heritage
strategy
Heritage strategy in place.
Identify and implement heritage initiatives. Implementation of the identified Heritage initiatives,
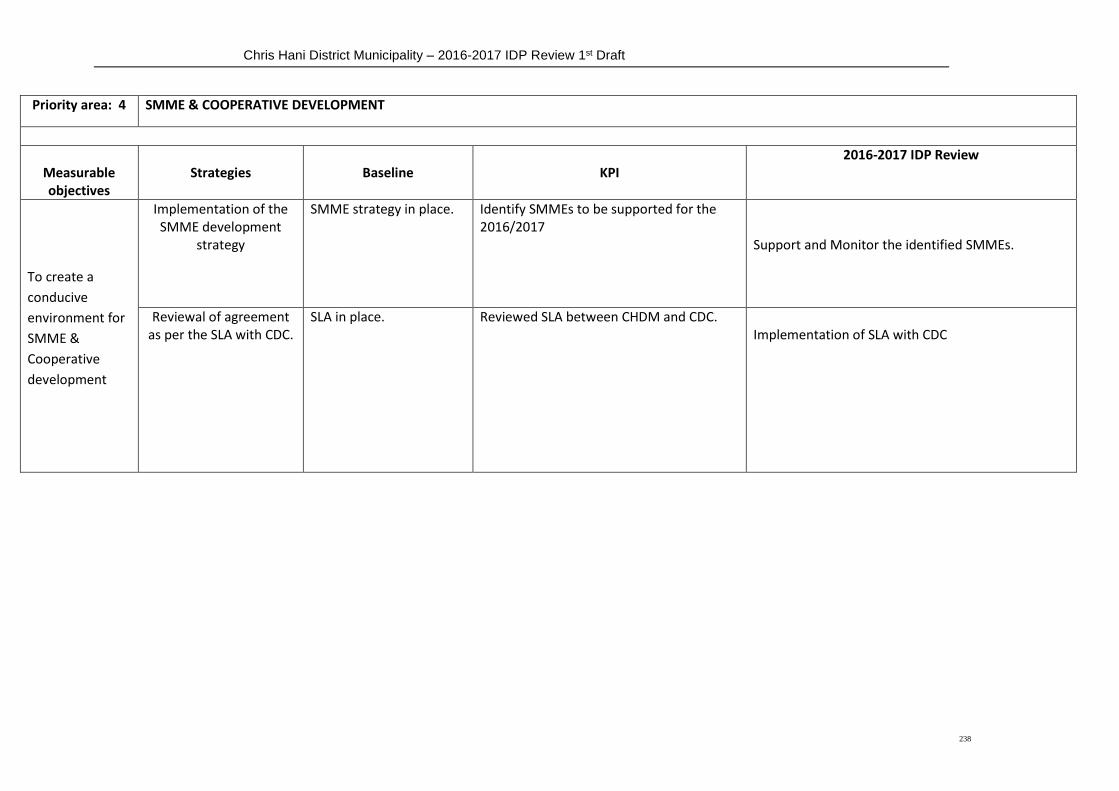
Chris Hani District Municipality – 2016-2017 IDP Review 1st Draft
238
Priority area: 4 SMME & COOPERATIVE DEVELOPMENT
Measurable objectives
Strategies
Baseline
KPI
2016-2017 IDP Review
To create a
conducive
environment for
SMME &
Cooperative
development
Implementation of the SMME development
strategy
SMME strategy in place.
Identify SMMEs to be supported for the 2016/2017
Support and Monitor the identified SMMEs.
Reviewal of agreement as per the SLA with CDC.
SLA in place. Reviewed SLA between CHDM and CDC. Implementation of SLA with CDC

Chris Hani District Municipality – 2016-2017 IDP Review 1st Draft
239
Priority area: 5 LIVESTOCK DEVELOPMENT
Measurable objectives
Strategies
Baseline KPI 2016-2017 IDP Review
To strengthen the
Agriculture as a sector
that contributes to
economic development
Implementation of the Agricultural
Strategy
Agricultural strategy in place.
Identification of Livestock programmes to be supported in 2016/2017.
Implementation of the identified Livestock programmes

Chris Hani District Municipality – 2016-2017 IDP Review 1st Draft
240
Priority area: 6 CROP PRODUCTION, AGRO PROCESSING & IRRIGATION SCHEMES
Measurable objectives
Strategies
Baseline
KPI
2016-2017 IDP Review
To strengthen the Agriculture as a sector that contributes to economic development
Strengthen the mechanization centre to support the farming community.
Existing Mechanisation centre-Ncora
Identify areas that need strengthening in the mechanization centre.
Implementation of the identified support areas working together with CHDA.
Improving crop production through introduction of new cultivars and supply of production inputs.
Crop production programme implemented in 14/15.
Identify dryland programmes to be supported.
Implementation of the identified Crop production programmes.
Revitilising Infrastructure of Irrigation Schemes.
Five irrigation schemes in place.
Identify infrastructure needs for support. Implementation of the prioritized inftrastructure needs.

Chris Hani District Municipality – 2016-2017 IDP Review 1st Draft
241
Priority area: 8 SMALL TOWN REVITILISATION
Measurable objectives
Strategies
Baseline
KPI
2016-2017 IDP Review
To promote revitilisation of urban areas and townships for economic development
Implementation of Small Town
Revitilisation Strategy
03 Strategies
developed
Four (4) small towns to be assisted
Development of the support plan which includes Paving and Beautification of Small Towns.
Priority area: 9 PLANNING
Measurable objectives
Strategies
Baseline
KPI
2016-2017 IDP Review
To ensure forward planning for the district in compliance with
legislation
Review and Implement Spatial Development Framework & LSDFs.
SDF in place Identify priority areas in the SDF for implementation.
Implementation of the reviewed SDF
Development & Review of 5 yr Integrated Development
Plan
5 year IDP in place
Adopted IDP Development of 2017-2022 five year IDP for the
Next Council
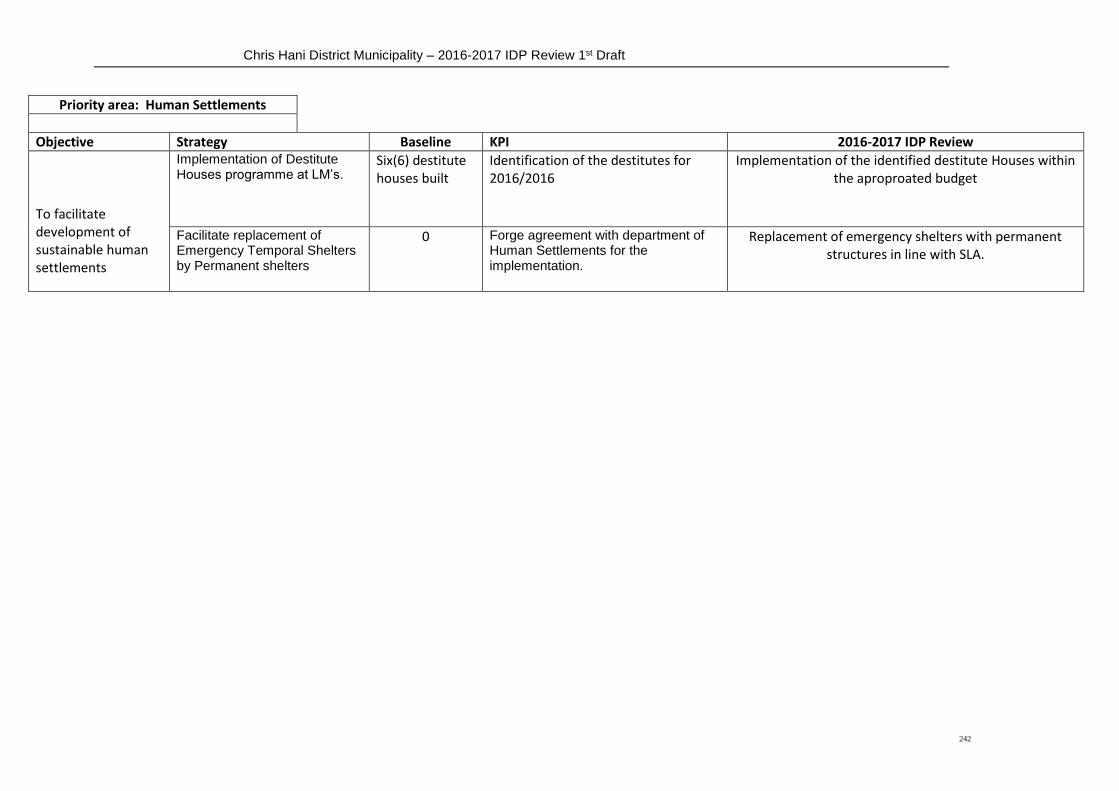
Chris Hani District Municipality – 2016-2017 IDP Review 1st Draft
242
Priority area: Human Settlements
Objective Strategy Baseline KPI 2016-2017 IDP Review
To facilitate development of sustainable human settlements
Implementation of Destitute Houses programme at LM’s.
Six(6) destitute houses built
Identification of the destitutes for 2016/2016
Implementation of the identified destitute Houses within the aproproated budget
Facilitate replacement of Emergency Temporal Shelters by Permanent shelters
0 Forge agreement with department of Human Settlements for the implementation.
Replacement of emergency shelters with permanent structures in line with SLA.

Chris Hani District Municipality – 2016-2017 IDP Review 1st Draft
243
1.BROAD IDP STRATEGIC OBJECTIVE To encourage the involvement and collaboration of communities and stakeholders through working together to achieve good governance in an integrated manner.
PRIORITY AREA MEASURABLE OBJECTIVE STRATEGY BASELINE KPI 2016/2017 IDP TARGET
FLEET
MANAGEMENT
To ensure that the fleet is
managed in accordance with
the Fleet Management
Policy.
Reviewal and
Implementation
of Fleet
Management
Policy.
Reviewed and
implemented Fleet
management Policy.
Fleet Management Policy reviewed
and implemented.
Acquisition of
fleet
No of vehicles to be
procured on RT57
Acquisition/Procurement of Fleet
Management and
maintenance of
fleet asset
Number of reports
submitted on management
and maintenance of fleet
8 Reports submitted on
Management and Maintenance of
Fleet
Building
Maintenance To safeguard the municipal assets in compliance with the safety standards
Construction and
Maintenance of
buildings
Number of buildings
constructed and
maintained
Three buildings maintained and one
constructed
PRIORITY AREA MEASURABLE OBJECTIVE
STRATEGY BASELINE KEY PERFORMANCE
INDICATOR
2016/2017 IDP TARGET
Security Services To safeguard the municipal assets in compliance with the safety standards
Development and Implementation of security
Approved security
management plan and %
implementation of the plan
Approved security management plan
and 30% implementation (phases)
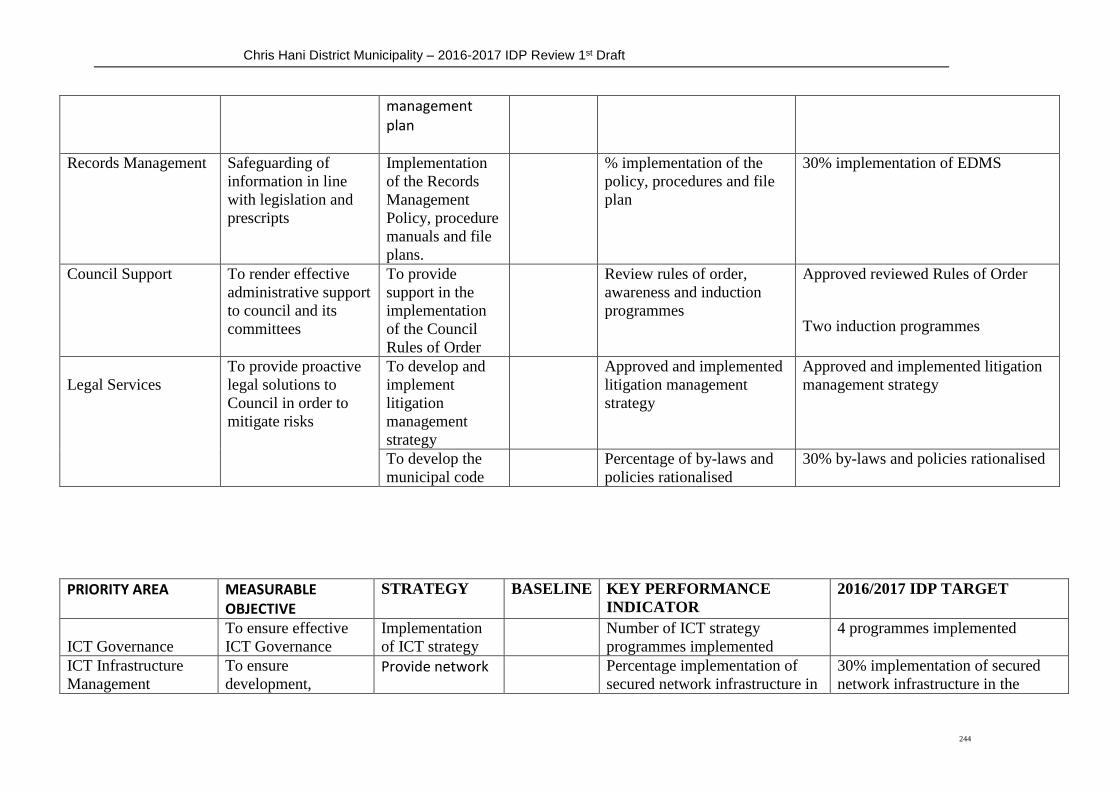
Chris Hani District Municipality – 2016-2017 IDP Review 1st Draft
244
management plan
Records Management
Safeguarding of
information in line
with legislation and
prescripts
Implementation
of the Records
Management
Policy, procedure
manuals and file
plans.
% implementation of the
policy, procedures and file
plan
30% implementation of EDMS
Council Support To render effective
administrative support
to council and its
committees
To provide
support in the
implementation
of the Council
Rules of Order
Review rules of order,
awareness and induction
programmes
Approved reviewed Rules of Order
Two induction programmes
Legal Services
To provide proactive
legal solutions to
Council in order to
mitigate risks
To develop and
implement
litigation
management
strategy
Approved and implemented
litigation management
strategy
Approved and implemented litigation
management strategy
To develop the
municipal code
Percentage of by-laws and
policies rationalised
30% by-laws and policies rationalised
PRIORITY AREA MEASURABLE OBJECTIVE
STRATEGY BASELINE KEY PERFORMANCE
INDICATOR
2016/2017 IDP TARGET
ICT Governance
To ensure effective
ICT Governance Implementation
of ICT strategy
Number of ICT strategy
programmes implemented
4 programmes implemented
ICT Infrastructure
Management
To ensure
development, Provide network Percentage implementation of
secured network infrastructure in
30% implementation of secured
network infrastructure in the

Chris Hani District Municipality – 2016-2017 IDP Review 1st Draft
245
management and
security of ICT
infrastructure
connectivity and security that responds to the needs of the municipality
the district district
Employee Wellness To promote employee wellness within the organisation
Implementation
of the Employee
Wellness Strategy
Number of wellness interventions
implemented
9 wellness interventions
implemented
Occupational Health
& Safety
To provide safety measures for the Councillors and Employees of the CHDM
Implementation of the OHS Strategy
Number of OHS programmes
implemented
5 OHS programmes implemented
PRIORITY AREA MEASURABLE OBJECTIVE
STRATEGY KEY PERFORMANCE
INDICATOR
2016/2017 IDP TARGET
Human Resources
To develop and
empower workforce
to enhance their skills
and competencies
Implementation
of HRD strategy
Number of HRD programmes
implemented
4 HRD programmes implemented
Human Resources
Transformation
To ensure compliance
with the employment
equity act.
Implementation
of employment
equity plan
Number of people from
employment equity target groups
employed in three highest levels
of management
50 % employment on three highest
levels of employment equity target
groups.
Organisational
To ensure sufficient
Implementation
% vacant funded positions filled 50% vacant funded positions filled
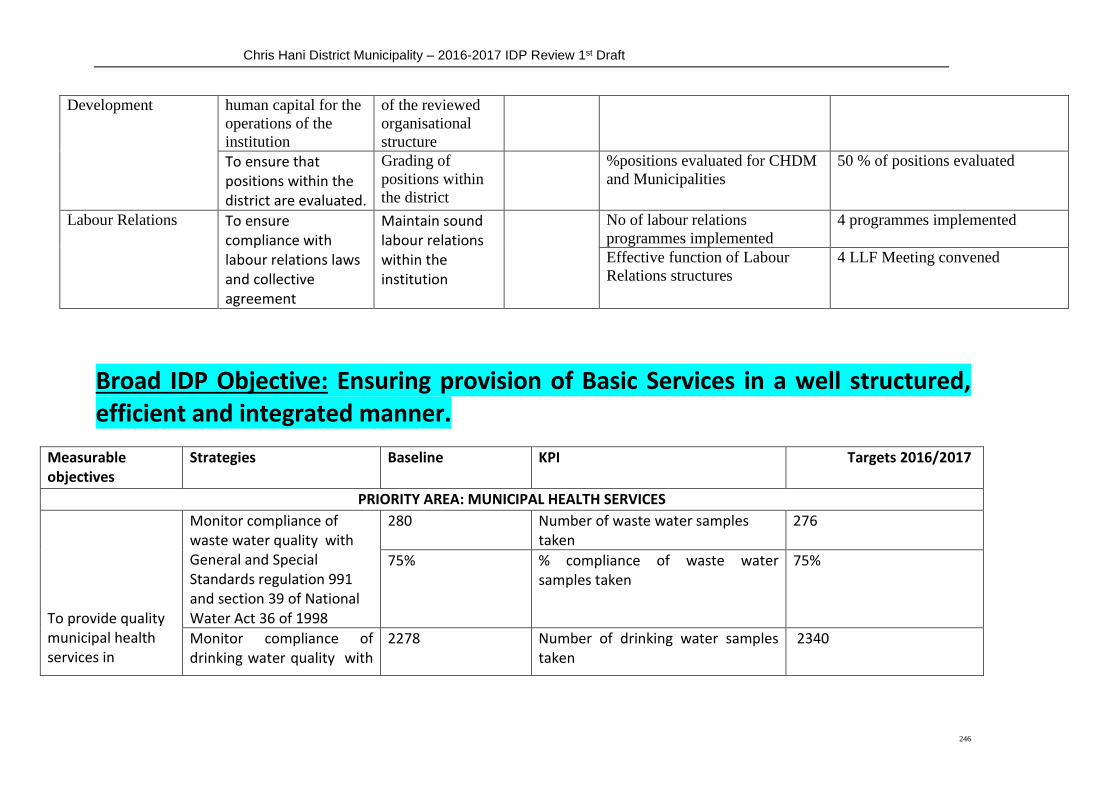
Chris Hani District Municipality – 2016-2017 IDP Review 1st Draft
246
Development human capital for the
operations of the
institution
of the reviewed
organisational
structure
To ensure that positions within the district are evaluated.
Grading of
positions within
the district
%positions evaluated for CHDM
and Municipalities
50 % of positions evaluated
Labour Relations To ensure compliance with labour relations laws and collective agreement
Maintain sound labour relations within the institution
No of labour relations
programmes implemented
4 programmes implemented
Effective function of Labour
Relations structures
4 LLF Meeting convened
Broad IDP Objective: Ensuring provision of Basic Services in a well structured, efficient and integrated manner.
Measurable objectives
Strategies Baseline KPI Targets 2016/2017
PRIORITY AREA: MUNICIPAL HEALTH SERVICES
To provide quality municipal health services in
Monitor compliance of waste water quality with General and Special Standards regulation 991 and section 39 of National Water Act 36 of 1998
280 Number of waste water samples taken
276
75% % compliance of waste water samples taken
75%
Monitor compliance of drinking water quality with
2278 Number of drinking water samples taken
2340

Chris Hani District Municipality – 2016-2017 IDP Review 1st Draft
247
Measurable objectives
Strategies Baseline KPI Targets 2016/2017
accordance with relevant legislations
SANS 241
97% % compliance of drinking water samples taken
97%
Monitor compliance with Foodstuffs, Cosmetics and Disinfectant Act (Regulation 692 of 2012) and (Regulation 962 of 2012
100% % of food premises issued with or renewed their Certificate of Acceptability
100%
624 Number of food samples taken 624
2200 Number of inspections conducted in food premises
2240
To provide quality municipal health services in accordance with relevant legislations
Monitor compliance with Management of Human Remains Regulation 363 of 2013
100% % of funeral parlous issued with or renewed their certificate of competence
100%
60 Number of funeral parlors inspected
68
Monitor compliance with the NEM Waste Act of 2008 and National Health Act of 2003
14 Number of waste sites inspected
14
8 Number of waste awareness campaigns conducted
8
Develop and implement Paupers Burial Policy
100% % of requests for pauper burials attended to
100%
Monitor compliance with White Paper on Basic Household Sanitation of 2001
100 Number of sampled sanitation structures inspected
120
40 Number of health and hygiene awareness campaigns conducted
40
Observe Environmental Health Days
6 Number of environmental health awareness days observed
4

Chris Hani District Municipality – 2016-2017 IDP Review 1st Draft
248
Measurable objectives
Strategies Baseline KPI Targets 2016/2017
To provide quality environmental management and climate change services in accordance with environmental management legislative framework
Facilitate natural resource management through eradication of alien plants and encroaching species e.g. Wattle; Euryops floribundus (Lapesi)
300 hectares
Number of hectares of alien vegetation eradicated
150 hectares
Facilitate climate change and greening programmes
None Number of Waste-to-Energy Feasibility Studies conducted
1
7840 Number of trees planted 7000 trees
4 Number of Environment and climate change Forum meetings conducted
4
Develop, implement and review environmental management sector plans
None Number of Climate Change Response Strategies reviewed
1
8 Number of Integrated Waste Management Plans developed
1
None Number of Invasive Alien Plant Management Strategy programmes implemented
1
To provide quality environmental management and climate change services in accordance with environmental management
Conduct Climate Change and Environmental Awareness Campaigns
8 Number of Climate Change and Environmental awareness campaigns conducted
8
Observe Environmental Days
3 Number of Environmental Days observed
3
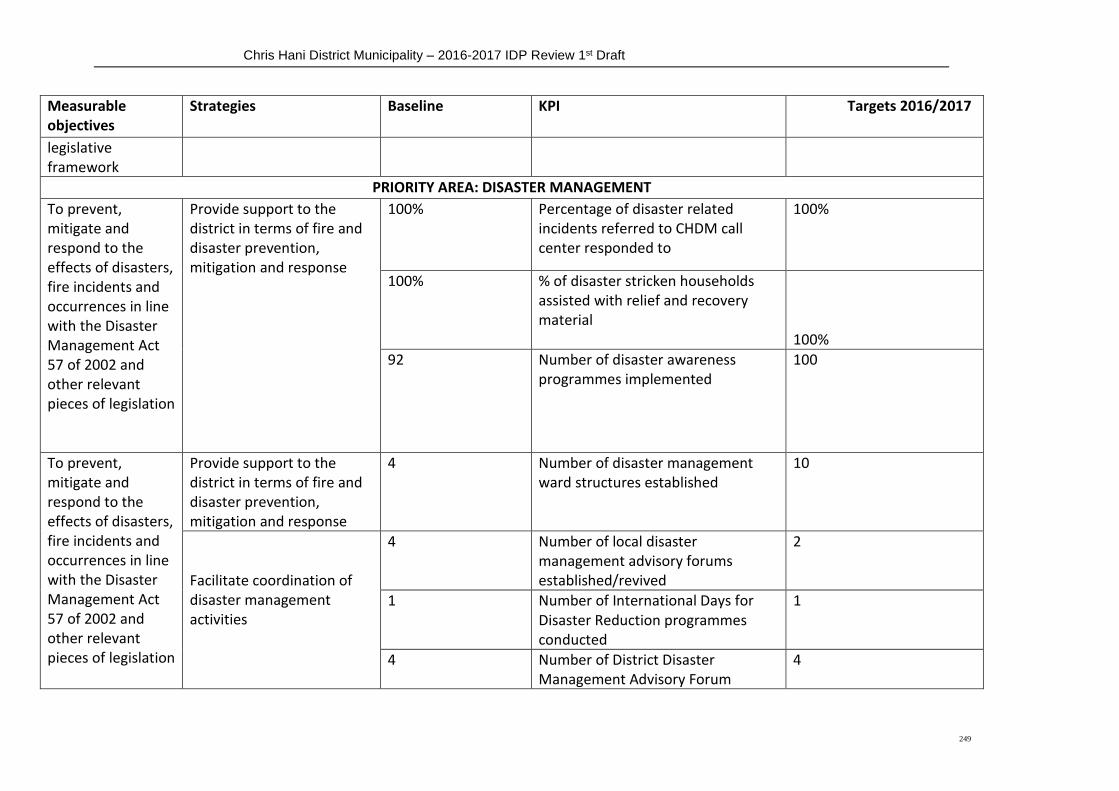
Chris Hani District Municipality – 2016-2017 IDP Review 1st Draft
249
Measurable objectives
Strategies Baseline KPI Targets 2016/2017
legislative framework
PRIORITY AREA: DISASTER MANAGEMENT
To prevent, mitigate and respond to the effects of disasters, fire incidents and occurrences in line with the Disaster Management Act 57 of 2002 and other relevant pieces of legislation
Provide support to the district in terms of fire and disaster prevention, mitigation and response
100% Percentage of disaster related incidents referred to CHDM call center responded to
100%
100% % of disaster stricken households assisted with relief and recovery material
100%
92 Number of disaster awareness programmes implemented
100
To prevent, mitigate and respond to the effects of disasters, fire incidents and occurrences in line with the Disaster Management Act 57 of 2002 and other relevant pieces of legislation
Provide support to the district in terms of fire and disaster prevention, mitigation and response
4 Number of disaster management ward structures established
10
Facilitate coordination of disaster management activities
4 Number of local disaster management advisory forums established/revived
2
1 Number of International Days for Disaster Reduction programmes conducted
1
4 Number of District Disaster Management Advisory Forum
4

Chris Hani District Municipality – 2016-2017 IDP Review 1st Draft
250
Measurable objectives
Strategies Baseline KPI Targets 2016/2017
meetings conducted
PRIORITY AREA: FIRE SERVICES PRIORITY AREA: FIRE SERVICES
Ensure compliance with the Fire Brigade Act 99 of 1987, SANS 10090 and other relevant legislations
Construct Fire Stations in all local Municipalities.
0 Number of fire stations constructed
1
Respond to 100% of all disasters, veld fires and hazmat incidents reported.
100% Percentage of disasters, veld fires and hazmat incidents responded to.
100%
Ensure compliance with the Fire Brigade Act 99 of 1987, SANS 10090 and other relevant legislations
Facilitate support programmes to Local Municipalities
24 Number of fire awareness programmes conducted
24
38 Number of fire inspections conducted
20
100% Percentage of structural Fires responded to
100%
Capacitate district/ local and volunteer firefighters.
5 Number of trainings conducted
3
PRIORITY AREA: HIV AND AIDS INTERNAL
To facilitate reduction of the spread and mitigate the impact of HIV, STI and TB
Provide technical support to Local Municipalities HIV and AIDS workplace committees
4 Number of Local Municipalities workplace committees provided with technical support
4
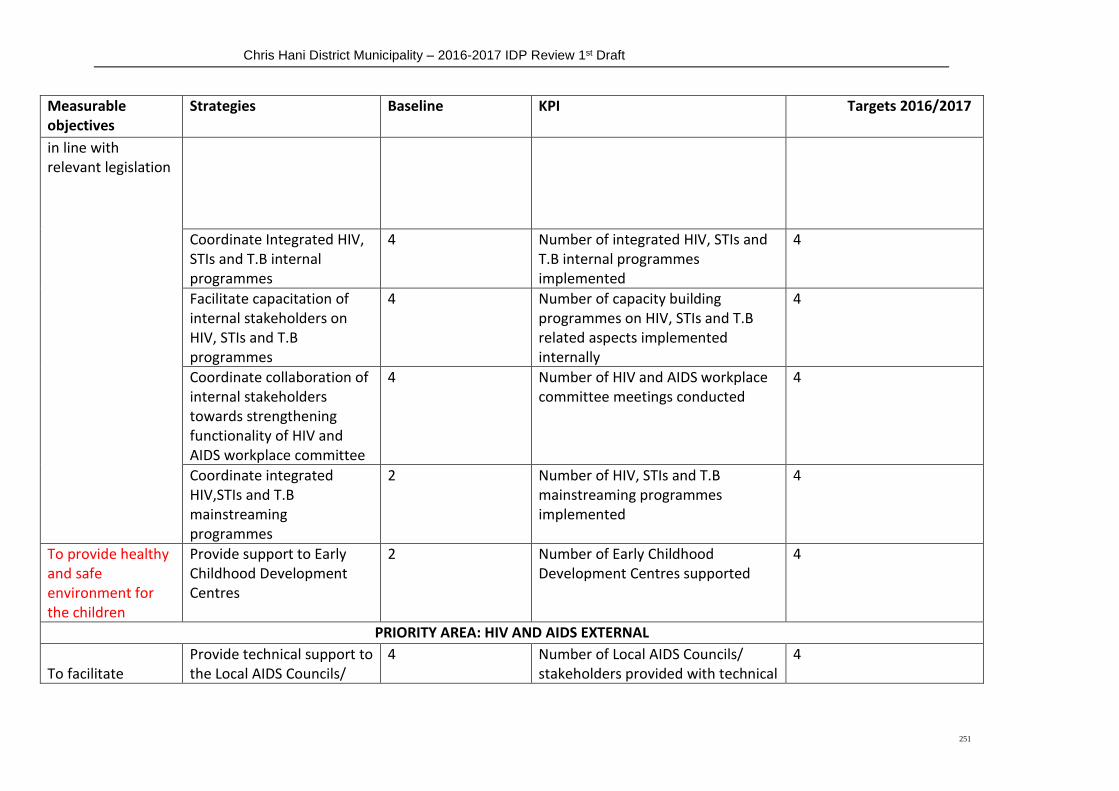
Chris Hani District Municipality – 2016-2017 IDP Review 1st Draft
251
Measurable objectives
Strategies Baseline KPI Targets 2016/2017
in line with relevant legislation
Coordinate Integrated HIV, STIs and T.B internal programmes
4 Number of integrated HIV, STIs and T.B internal programmes implemented
4
Facilitate capacitation of internal stakeholders on HIV, STIs and T.B programmes
4 Number of capacity building programmes on HIV, STIs and T.B related aspects implemented internally
4
Coordinate collaboration of internal stakeholders towards strengthening functionality of HIV and AIDS workplace committee
4 Number of HIV and AIDS workplace committee meetings conducted
4
Coordinate integrated HIV,STIs and T.B mainstreaming programmes
2 Number of HIV, STIs and T.B mainstreaming programmes implemented
4
To provide healthy and safe environment for the children
Provide support to Early Childhood Development Centres
2 Number of Early Childhood Development Centres supported
4
PRIORITY AREA: HIV AND AIDS EXTERNAL
To facilitate
Provide technical support to the Local AIDS Councils/
4 Number of Local AIDS Councils/ stakeholders provided with technical
4

Chris Hani District Municipality – 2016-2017 IDP Review 1st Draft
252
Measurable objectives
Strategies Baseline KPI Targets 2016/2017
reduction of the spread and mitigate the impact of HIV, STI and TB in line with relevant legislation
stakeholders support
Coordinate integrated HIV, STI and TB programmes
4 Number of integrated HIV, STIs and TB programmes implemented
4
Facilitate capacitation of stakeholders on HIV, STI and TB programmes
4 Number of capacity building programmes on HIV, STIs and TB related aspects conducted
4
Coordinate collaboration of external stakeholders towards strengthening functionality of District AIDS Council (DAC)
4 Number of DAC meetings conducted 4
PRIORITY AREA: ANTIPOVERTY PROGRAMMES (WAR ROOMS)
To facilitate and co-ordinate integrated poverty reduction programmes in line with relevant legislation
Facilitate creation of job opportunities through EPWP
100 Number of job opportunities created and sustained through EPWP
150
Coordinate poverty reduction programmes in line with the District Antipoverty Strategy
20 Number of households assisted with poverty reduction interventions
20
48 Number of antipoverty war rooms capacitated
24
4 Number of integrated Antipoverty Strategy programmes implemented
4
Coordinate collaboration of stakeholders towards strengthening functionality of District Antipoverty
4 Number of District anti - poverty forum meetings conducted
4
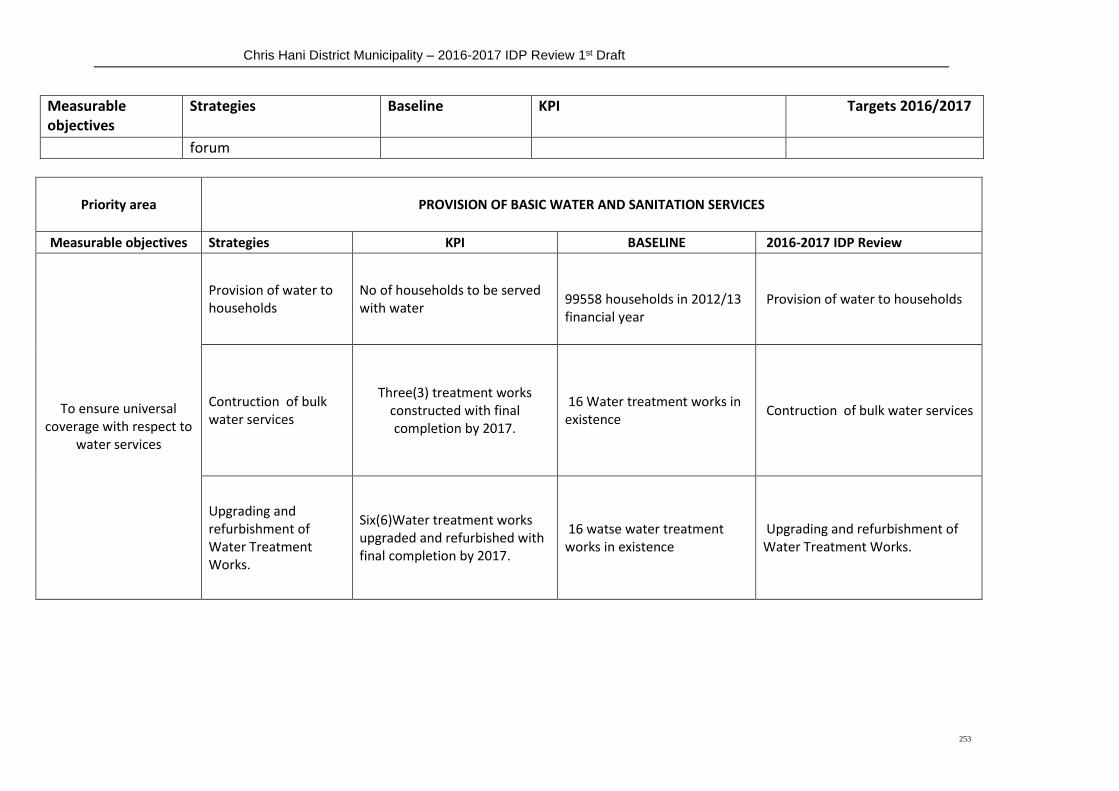
Chris Hani District Municipality – 2016-2017 IDP Review 1st Draft
253
Measurable objectives
Strategies Baseline KPI Targets 2016/2017
forum
Priority area
PROVISION OF BASIC WATER AND SANITATION SERVICES
Measurable objectives Strategies KPI BASELINE 2016-2017 IDP Review
To ensure universal coverage with respect to
water services
Provision of water to households
No of households to be served with water
99558 households in 2012/13 financial year
Provision of water to households
Contruction of bulk water services
Three(3) treatment works constructed with final completion by 2017.
16 Water treatment works in existence
Contruction of bulk water services
Upgrading and refurbishment of Water Treatment Works.
Six(6)Water treatment works upgraded and refurbished with final completion by 2017.
16 watse water treatment works in existence
Upgrading and refurbishment of Water Treatment Works.
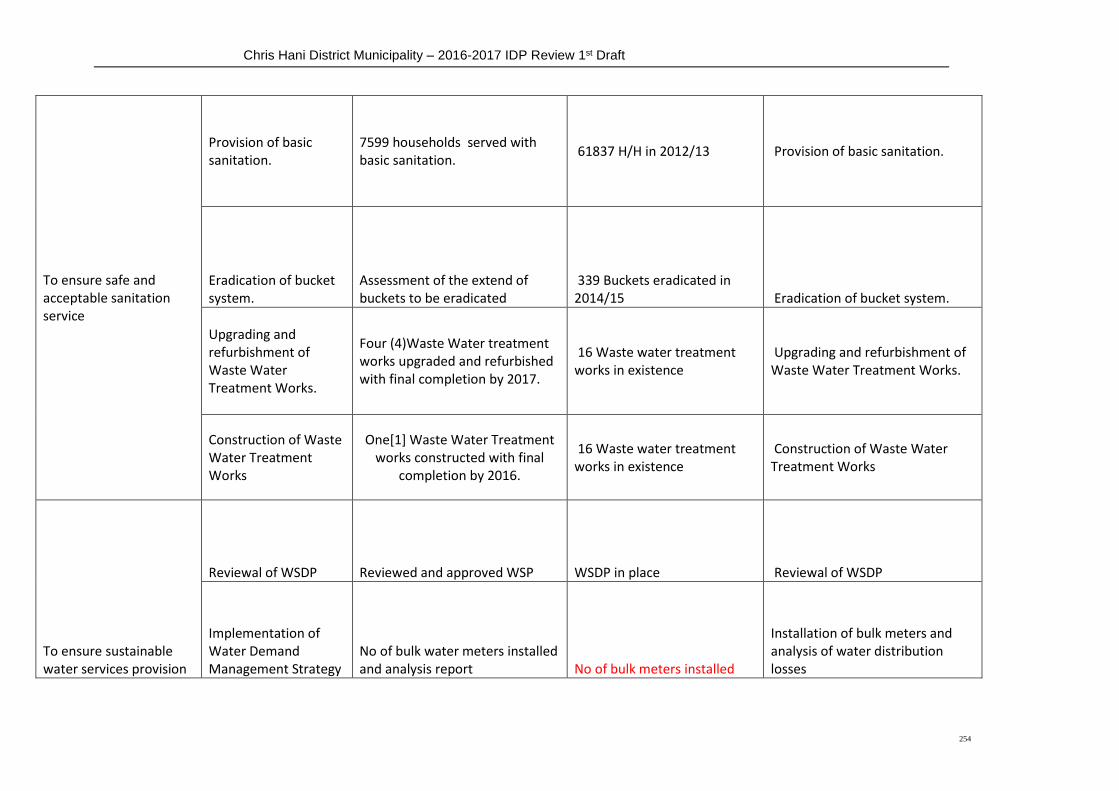
Chris Hani District Municipality – 2016-2017 IDP Review 1st Draft
254
To ensure safe and acceptable sanitation service
Provision of basic sanitation.
7599 households served with basic sanitation.
61837 H/H in 2012/13 Provision of basic sanitation.
Eradication of bucket system.
Assessment of the extend of buckets to be eradicated
339 Buckets eradicated in 2014/15 Eradication of bucket system.
Upgrading and refurbishment of Waste Water Treatment Works.
Four (4)Waste Water treatment works upgraded and refurbished with final completion by 2017.
16 Waste water treatment works in existence
Upgrading and refurbishment of Waste Water Treatment Works.
Construction of Waste Water Treatment Works
One[1] Waste Water Treatment works constructed with final
completion by 2016.
16 Waste water treatment works in existence
Construction of Waste Water Treatment Works
To ensure sustainable water services provision
Reviewal of WSDP Reviewed and approved WSP WSDP in place Reviewal of WSDP
Implementation of Water Demand Management Strategy
No of bulk water meters installed and analysis report No of bulk meters installed
Installation of bulk meters and analysis of water distribution losses
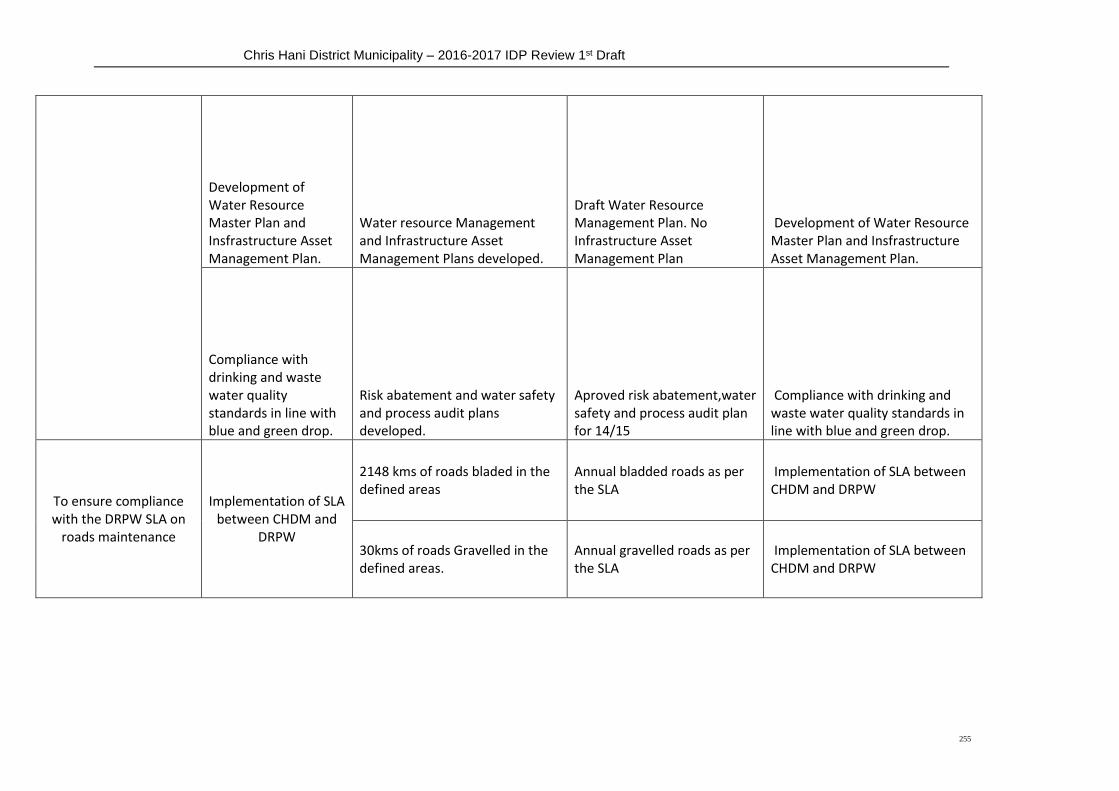
Chris Hani District Municipality – 2016-2017 IDP Review 1st Draft
255
Development of Water Resource Master Plan and Insfrastructure Asset Management Plan.
Water resource Management and Infrastructure Asset Management Plans developed.
Draft Water Resource Management Plan. No Infrastructure Asset Management Plan
Development of Water Resource Master Plan and Insfrastructure Asset Management Plan.
Compliance with drinking and waste water quality standards in line with blue and green drop.
Risk abatement and water safety and process audit plans developed.
Aproved risk abatement,water safety and process audit plan for 14/15
Compliance with drinking and waste water quality standards in line with blue and green drop.
To ensure compliance with the DRPW SLA on
roads maintenance
Implementation of SLA between CHDM and
DRPW
2148 kms of roads bladed in the defined areas
Annual bladded roads as per the SLA
Implementation of SLA between CHDM and DRPW
30kms of roads Gravelled in the defined areas.
Annual gravelled roads as per the SLA
Implementation of SLA between CHDM and DRPW
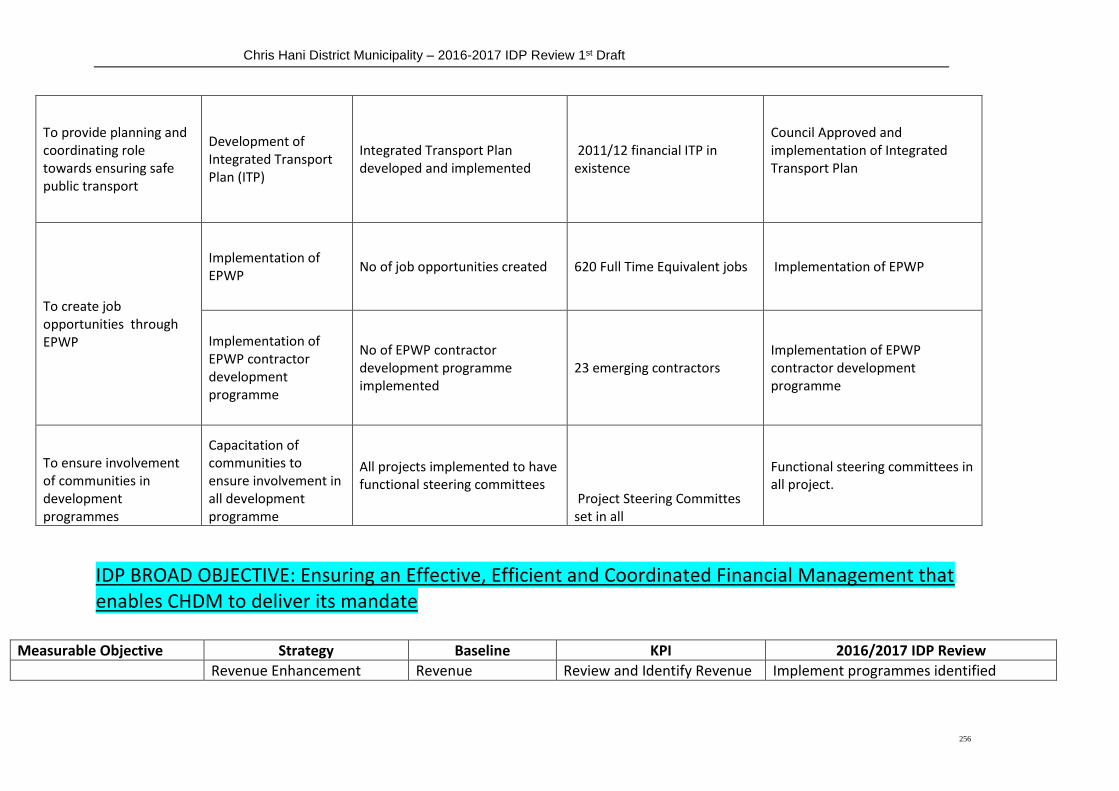
Chris Hani District Municipality – 2016-2017 IDP Review 1st Draft
256
To provide planning and coordinating role towards ensuring safe public transport
Development of Integrated Transport Plan (ITP)
Integrated Transport Plan developed and implemented
2011/12 financial ITP in existence
Council Approved and implementation of Integrated Transport Plan
To create job opportunities through EPWP
Implementation of EPWP
No of job opportunities created 620 Full Time Equivalent jobs Implementation of EPWP
Implementation of EPWP contractor development programme
No of EPWP contractor development programme implemented
23 emerging contractors Implementation of EPWP contractor development programme
To ensure involvement of communities in development programmes
Capacitation of communities to ensure involvement in all development programme
All projects implemented to have functional steering committees
Project Steering Committes set in all
Functional steering committees in all project.
IDP BROAD OBJECTIVE: Ensuring an Effective, Efficient and Coordinated Financial Management that enables CHDM to deliver its mandate
Measurable Objective Strategy Baseline KPI 2016/2017 IDP Review
Revenue Enhancement Revenue Review and Identify Revenue Implement programmes identified

Chris Hani District Municipality – 2016-2017 IDP Review 1st Draft
257
Ensuring sound and sustainable management of finances of district in line with National and Provincial norms and standards
Strategy Enhancement Strategy
Enhancement programmmes
Ensuring Expenditure management in line with the approved budget
Non adherence to MFMA Sec 65 (2) (e)
Adherence to Sec 65 (2) (e) of MFMA and Chapter 11 of MFMA
Quarterrly reports of MFMA Sec 65 (2) (e ) and chapter 11 of MFMA
Integration and improvement of Financial Management Systems
Financial Management Systems not integrated
Identification of Financial Management Systems to be integrated for compatability
Develop and implement a plan for integration of financial management systems
Maintainance of Compliant and accurate Fixed Asset Register in line with GRAP Standards
Asset Register in place Asset Management Policy
Identify gaps in Asset Register and Asset Management Policy in line with GRAP Standards
Implement Identified programmes
To ensure timeous submission of accurate AFS
Compilation of Credible AFS
AFS 2014-2015
Compiled Credible AFS for 2014/2015
Submission of Credible AFS for 2015-2016

Chris Hani District Municipality – 2016-2017 IDP Review 1st Draft
258
3.Broad IDP strategic Objective To encourage the involvement and collaboration of Communities and Stakeholders through working together to achieve good governance in an integrated manner.
Priority area Intergovernmental Relations
Measurable objectives Strategies Baseline KPI 2016/2017 IDP Review
Enhance Intergovernmental
relations within the district
Implementation of IGR Strategy
IGR Strategy Identification pf IGR Initiatives to be undertaken
Implementation of the IGR Strategy
Priority area Customer Care
Measurable objectives Strategies Baseline KPI 2016/2017 IDP Review
To ensure effective and efficient customer care service
Development and implementation of a customer care strategy
None Developed and Implemented Customer Care Strategy.
Implementation of the customer care strategy
To prepare and adopt a Credible Budget
Preparation and tabling of Credible Budget
2015-2016 Approved Budget
Credible and approved Budget
Implementation of credible and approved budget
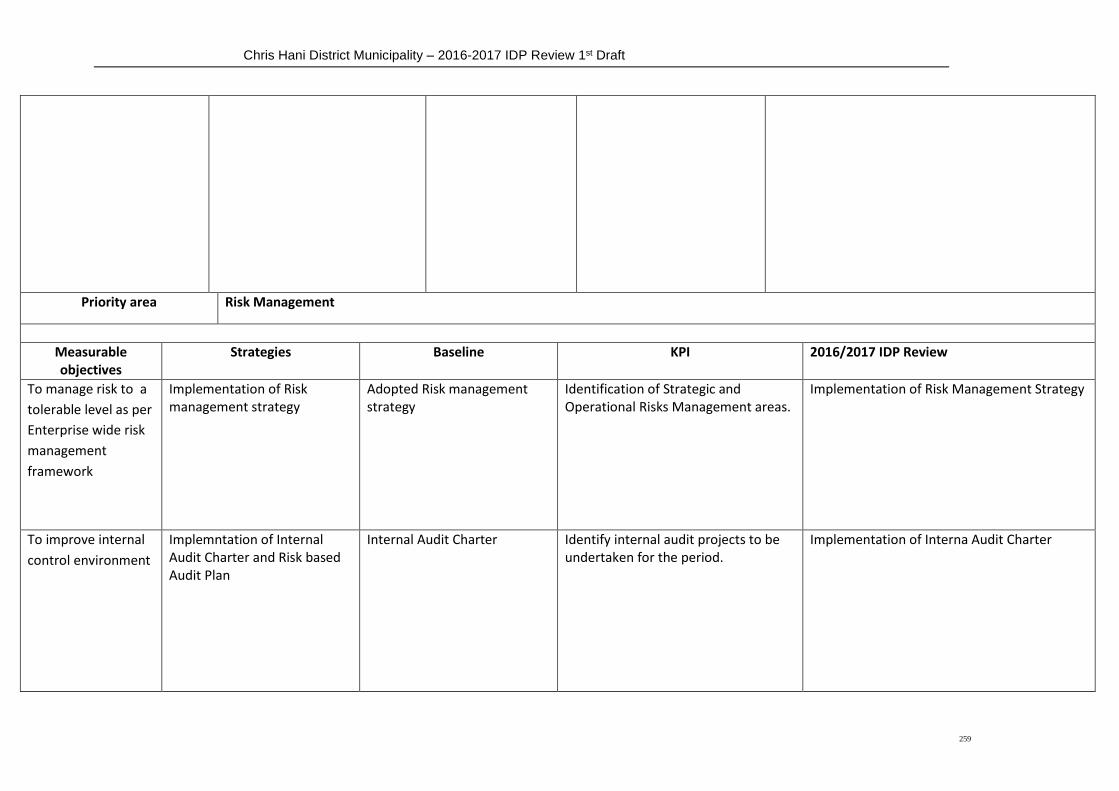
Chris Hani District Municipality – 2016-2017 IDP Review 1st Draft
259
Priority area Risk Management
Measurable objectives
Strategies Baseline KPI 2016/2017 IDP Review
To manage risk to a
tolerable level as per
Enterprise wide risk
management
framework
Implementation of Risk management strategy
Adopted Risk management strategy
Identification of Strategic and Operational Risks Management areas.
Implementation of Risk Management Strategy
To improve internal
control environment
Implemntation of Internal Audit Charter and Risk based Audit Plan
Internal Audit Charter Identify internal audit projects to be undertaken for the period.
Implementation of Interna Audit Charter

Chris Hani District Municipality – 2016-2017 IDP Review 1st Draft
260
Priority area Fraud and Corruption
Measurable objectives
Strategies Baseline KPI 2016/2017 IDP Review
To prevent Fraud
and corruption
Implementation of Anti-Fraud Corruption plan .
Reviewed Anti-Fraud and Corruption prevention plan
Identify programmes to implemented on Anti-Fraud and Corruption
Implementation of Anti Fraud Plan
Priority area International Relations.
Measurable objectives
Strategies
Baseline
KPI
2016/2017 IDP Review
To foster developmental relations with other
municipalities through twinning and
partnership arrangements
Development and implementation of an International Relations Framework
Draft International Relations Framework
Identify programmes to be pursued.
Imlementation of IR Framework

Chris Hani District Municipality – 2016-2017 IDP Review 1st Draft
261
Priority area Public participation
Measurable objectives
Strategies
Baseline
KPI
2016/2017 IDP Review
To strengthen Public
Participation on
developmental
issues within the
district
Reviewal and Implementation of a public participation strategy
Public Participation Strategy
Identify Programmes to be implemented as per public participation strategy
Implementation of the of district wide public participation strategy
Development and implementation of a social cohesion strategy
None
Develop and Identify programmes to be implemented as per Social Cohesion Strategy.
Develop and Implement Identified Social Cohesion
programmes
.
Priority area Performance Management System
Measurable objectives
Strategies
Baseline
KPI
2016/2017 IDP Review
Strengthen Institutional
Performance planning,
Asserting a system of Accountability and
Performance Management Framework
Identify programmes to be implemented as per the PMF
Full Implementation of Perfomance Management
Framework which includes Cascading to levels below

Chris Hani District Municipality – 2016-2017 IDP Review 1st Draft
262
Monitoring and
Evaluation
Reporting.
Section 56/7
Priority area Forum
Measurable objectives Strategies Baseline KPI 2016/2017 IDP Review
Enhance Integovernmental
relations within the district though
effective IGR Foras
Coordination of Forums 4 Forums per Sector Identify Forums to sit Sitting of Identified Forums per quarter
Priority area Communication and marketing
Measurable objectives Strategies Baseline KPI 2016/2017 IDP Review
To enhance communication with
stakeholders and uphold municipal
identity and image internally and
externally.
Communication, Branding and Markerting of the district
Communication Strategy and Marketing and Branding Manual
Identify programmes for implementation as per Communication, Markerting and Branding Manual
Review and implementation of the communication Branding and marketing strategy
Priority area Municipal Support

Chris Hani District Municipality – 2016-2017 IDP Review 1st Draft
263
Measurable objectives
Strategies
Baseline
KPI
2016/2017 IDP Review
Provide coordinated support to Local Municipalities
Coordination of municipal support
Uncoordinated Municipal support
Identify programmes of support to LMs
Implementation of identified municipal support
programmes

Chris Hani District Municipality – 2016-2017 IDP Review 1st Draft
264

Chris Hani District Municipality – 2016-2017 IDP Review 1st Draft
265
Chris Hani District Municipality – 2016-2017 IDP Review 1st Draft
266

Chris Hani District Municipality – 2016-2017 IDP Review 1st Draft
267
2016-2017 CHDM EQUITABLE SHARE TO FUND IDP PROJECTS
Department 2nd Adjustment Budget Draft Budget 2016/17 Increase/ Decrease
COMMUNITY SERVICES 19,900,000 15,790,000 -21%
CORPORATE SERVICES 18,021,548 18,000,000 0%
IPED 50,957,734 48,400,000 -5%
MUNICIPAL MANAGER 7,421,000 5,750,000 -23%
BUDGET & TREASURY - 2,000,000 100%
TECHNICAL SERVICES 2,354,533 2,000,000 -15%
Grand Total 120,759,321.00 91,940,000.00 -24%
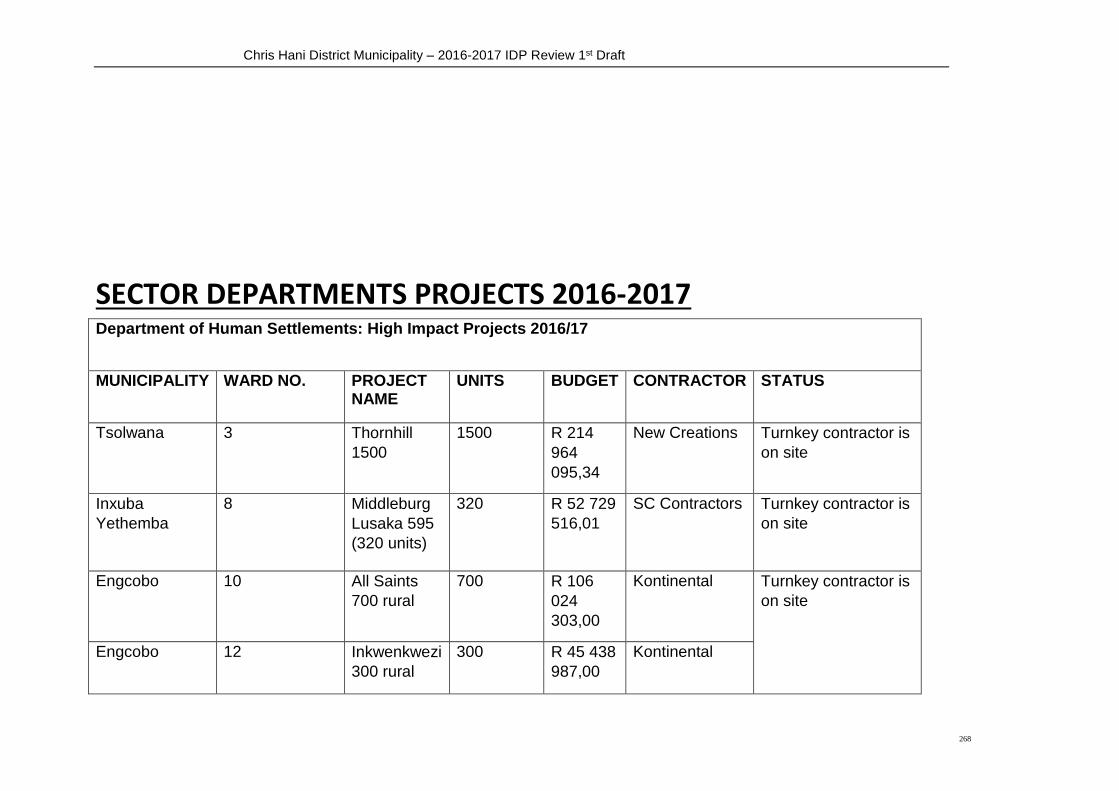
Chris Hani District Municipality – 2016-2017 IDP Review 1st Draft
268
SECTOR DEPARTMENTS PROJECTS 2016-2017 Department of Human Settlements: High Impact Projects 2016/17
MUNICIPALITY WARD NO. PROJECT NAME
UNITS BUDGET CONTRACTOR STATUS
Tsolwana 3 Thornhill
1500
1500 R 214
964
095,34
New Creations Turnkey contractor is
on site
Inxuba
Yethemba
8 Middleburg
Lusaka 595
(320 units)
320 R 52 729
516,01
SC Contractors Turnkey contractor is
on site
Engcobo 10 All Saints
700 rural
700 R 106
024
303,00
Kontinental Turnkey contractor is
on site
Engcobo 12 Inkwenkwezi
300 rural
300 R 45 438
987,00
Kontinental
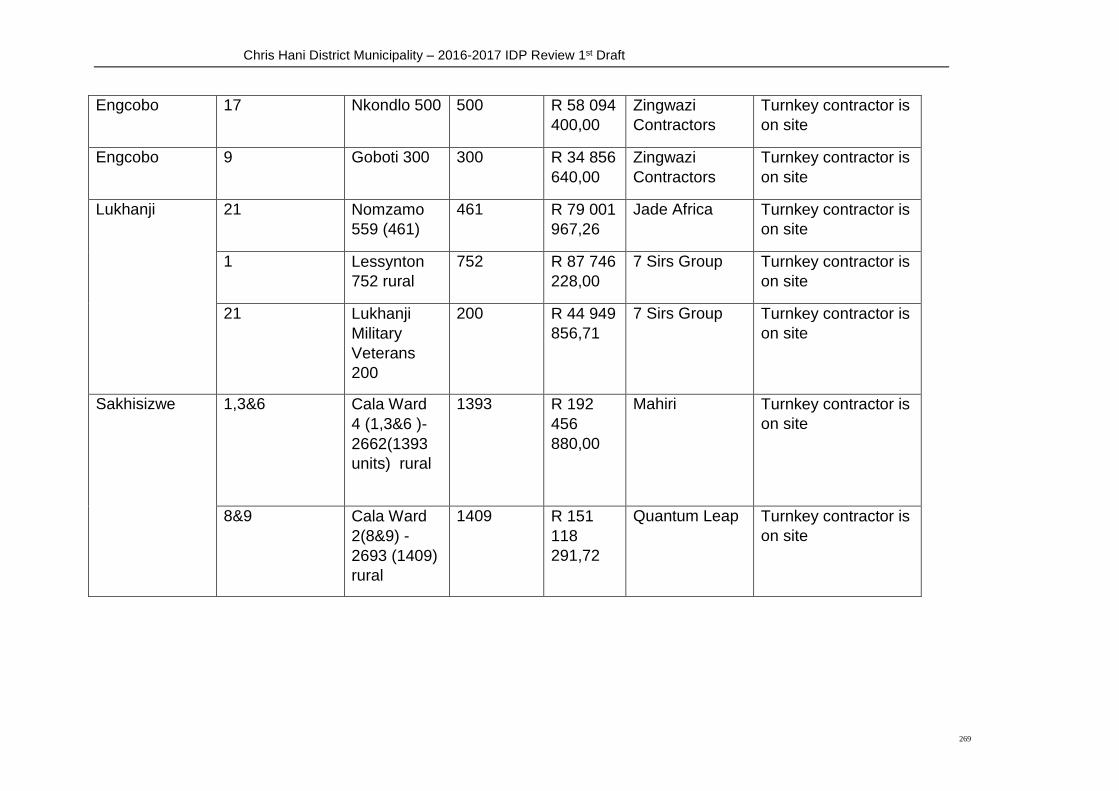
Chris Hani District Municipality – 2016-2017 IDP Review 1st Draft
269
Engcobo 17 Nkondlo 500 500 R 58 094
400,00
Zingwazi
Contractors
Turnkey contractor is
on site
Engcobo 9 Goboti 300 300 R 34 856
640,00
Zingwazi
Contractors
Turnkey contractor is
on site
Lukhanji 21 Nomzamo
559 (461)
461 R 79 001
967,26
Jade Africa Turnkey contractor is
on site
1 Lessynton
752 rural
752 R 87 746
228,00
7 Sirs Group Turnkey contractor is
on site
21 Lukhanji
Military
Veterans
200
200 R 44 949
856,71
7 Sirs Group Turnkey contractor is
on site
Sakhisizwe 1,3&6 Cala Ward
4 (1,3&6 )-
2662(1393
units) rural
1393 R 192
456
880,00
Mahiri Turnkey contractor is
on site
8&9 Cala Ward
2(8&9) -
2693 (1409)
rural
1409 R 151
118
291,72
Quantum Leap Turnkey contractor is
on site

Chris Hani District Municipality – 2016-2017 IDP Review 1st Draft
270
1,3&6 Cala Ward
4(1,3&6) -
2662(1269
units) rural
phase 2-
CRO's
1269 R 194
756
754,28
Mosegedi &
Associates
CRO is recently
contracted and to
establish site
8&9 Cala Ward
2(8&9) -
2693 (1284)
rural phase
2-CRO's
1284 R 216
764
446,00
Vukani
Construction
CRO is busy with
beneficiary Admin
&site establishment
Intsika Yethu 1 Chris Hani
Heritage
1000 (511
units) rural
511 R 66 712
865,46
Kentha Turnkey contractor is
on site
10 Vuyisile Mini
1000(500)
rural
500 R 65 311
369,35
Kentha Turnkey contractor is
on site
20 Lubisi 1000
rural_CRO
1000 R 151
289
000,89
Lima CRO is busy with
beneficiary Admin
and to commence in
Jan 2016
1 Chris Hani
Heritage
1000 (489
units) rural
489 R 82 552
814,67
Vukani
Construction
CRO has established
& recently started on
site
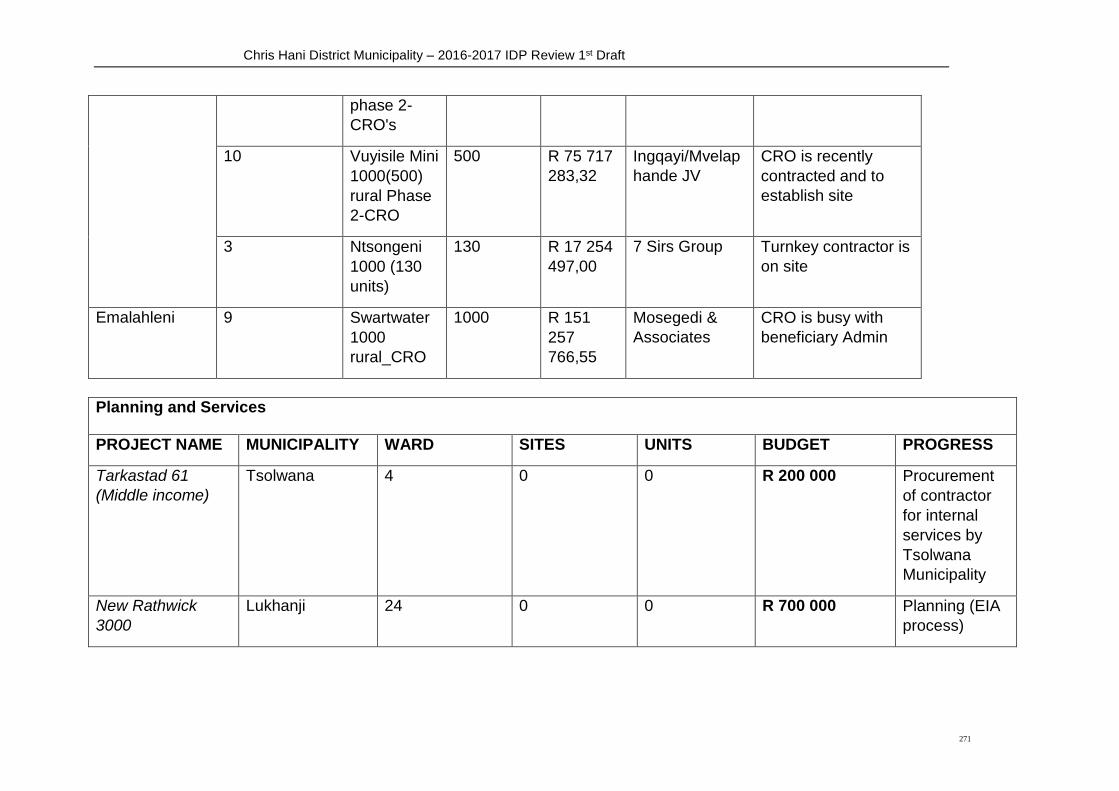
Chris Hani District Municipality – 2016-2017 IDP Review 1st Draft
271
phase 2-
CRO's
10 Vuyisile Mini
1000(500)
rural Phase
2-CRO
500 R 75 717
283,32
Ingqayi/Mvelap
hande JV
CRO is recently
contracted and to
establish site
3 Ntsongeni
1000 (130
units)
130 R 17 254
497,00
7 Sirs Group Turnkey contractor is
on site
Emalahleni 9 Swartwater
1000
rural_CRO
1000 R 151
257
766,55
Mosegedi &
Associates
CRO is busy with
beneficiary Admin
Planning and Services
PROJECT NAME MUNICIPALITY WARD SITES UNITS BUDGET PROGRESS
Tarkastad 61
(Middle income)
Tsolwana 4 0 0 R 200 000 Procurement
of contractor
for internal
services by
Tsolwana
Municipality
New Rathwick
3000
Lukhanji 24 0 0 R 700 000 Planning (EIA
process)
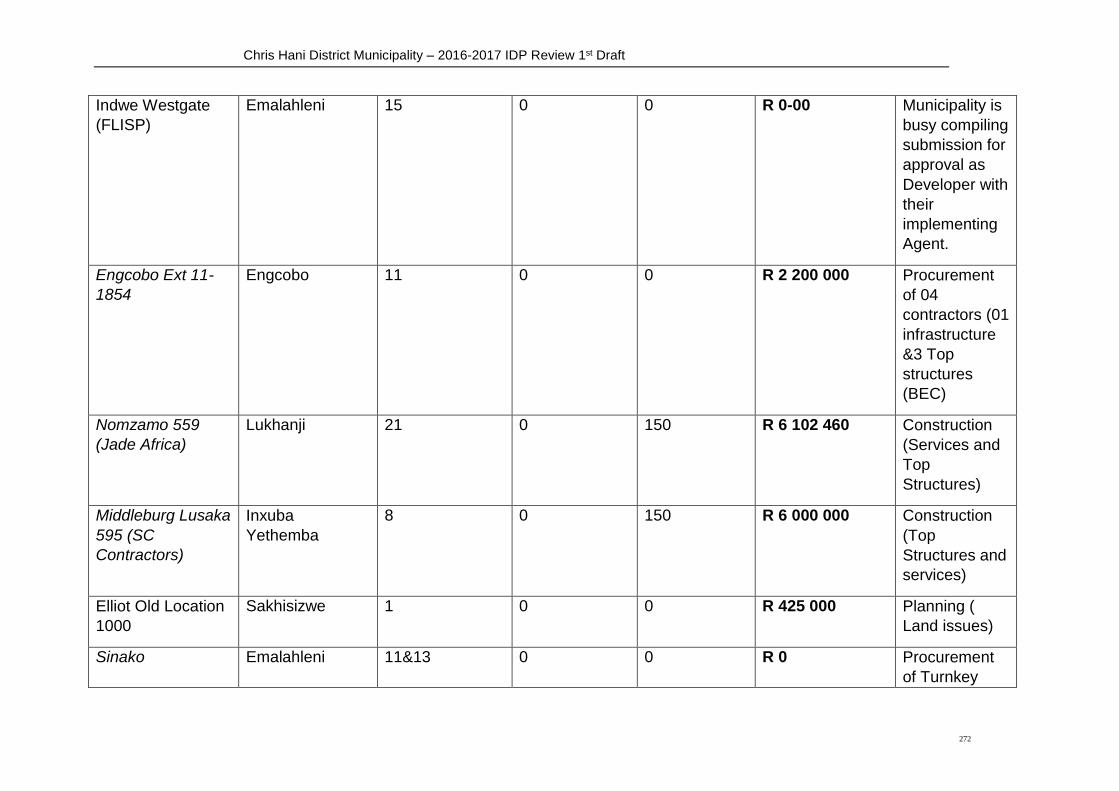
Chris Hani District Municipality – 2016-2017 IDP Review 1st Draft
272
Indwe Westgate
(FLISP)
Emalahleni 15 0 0 R 0-00 Municipality is
busy compiling
submission for
approval as
Developer with
their
implementing
Agent.
Engcobo Ext 11-
1854
Engcobo 11 0 0 R 2 200 000 Procurement
of 04
contractors (01
infrastructure
&3 Top
structures
(BEC)
Nomzamo 559
(Jade Africa)
Lukhanji 21 0 150 R 6 102 460 Construction
(Services and
Top
Structures)
Middleburg Lusaka
595 (SC
Contractors)
Inxuba
Yethemba
8 0 150 R 6 000 000 Construction
(Top
Structures and
services)
Elliot Old Location
1000
Sakhisizwe 1 0 0 R 425 000 Planning (
Land issues)
Sinako Emalahleni 11&13 0 0 R 0 Procurement
of Turnkey

Chris Hani District Municipality – 2016-2017 IDP Review 1st Draft
273
Zwelethemba 289 Contractor
(BEC)
Enyanisweni 431
(157 units)
Intsika Yethu 14 0 0 R 0 Municipality to
implement
Roads&Storm
Water and
busy with
submission
Joe Slovo 608 (
169 units)
Intsika Yethu 14 0 0 R 0
Sada/Wooden/Zink
1000
Lukhanji 5 0 0 R 750 000 Planning (
Subsidy
Administration)
Meadrose 493 Inxuba
Yethemba
7 0 0 R 100 000 Pre-planning-
bulk limitations
Polar Park 143 Lukhanji 1 R 525 000 Planning (
Subsidy
Administration)

Chris Hani District Municipality – 2016-2017 IDP Review 1st Draft
274
Top Structure Construction
PROJECT NAME MUNICIPALITY SITES UNITS BUDGET PROGRESS
Molteno Airstrip
1127 (500)
Inkwanca 4 0 50 R 2 000 000 Construction
(Top Structures)
by 16 Emerging
contractors.
Molteno Airstrip
1127 (627)
Inkwanca 4 0 0 R 500 000 Procurement
(SCM)
Molteno Nomonde
136 ( 70 units)
Inkwanca 4 0 0 R 750 000 Procurement
(SCM)
Mavuya phase1&2
462
Emalahleni 15 0 0 R 0 On Hold and
affected by
demands to use
local clay brick
manufacture by
local CO-OP.
Cala Elliot - Ext
13&14 (1289)
Sakhisiszwe 4&1 0 0 R 900 000 Construction
(Emerging
Contractor) 26
Emerging
Contractors JV’s

Chris Hani District Municipality – 2016-2017 IDP Review 1st Draft
275
Cala Elliot - Ext 15
(1289)
Sakhisizwe 4&1 0 0 R 750 000 Construction
(Emerging
Contractor) 26
Emerging
Contractors JV’s
Cala Elliot 514 -
372
Sakhisizwe 4&1 0 0 R 120 000 Contracting of
I.Agent. 15
Emerging
contractors
appointed
&Contracted.
Engcobo Ext 11-
1854
Engcobo 11 0 0 R 2 200 000 Procurement of
04 contractors
(01
infrastructure &3
Top structures
(BEC)
Middleburg
Lusaka 595 ( SC
Contractors)
Inxuba
Yethemba
8 0 150 R 6 000 000 Construction
(Top Structures
and services)
Sinako
Zwelethemba 289
Emalahleni 11&13 0 0 R 0 Procurement of
Turnkey
Contractor
(BEC)
Enyanisweni 431
(157 units)
Intsika Yethu 14 0 0 R 0 Procurement of
contractor

Chris Hani District Municipality – 2016-2017 IDP Review 1st Draft
276
(BEC)
Joe Slovo 608 (
169 units)
Intsika Yethu 14 0 0 R 0 Procurement of
contractor
(BEC)
Nomzamo 559
(Jade Africa)
Lukhanji 21 0 150 R 6 102 460 Construction
(Services and
Top Structures)
Zola 225 Lukhanji 27 0 0 R 200 000 Contractor
terminated and
on
reinstatement
process
Xuma 126 Lukhanji 27 0 0 R 220 000
Toisekraal 364 Lukhanji 27 0 0 R 350 000
Lesseyton 752
rural ( 7 Sirs
Group)
Lukhanji 27 5 20 R 3 300 000 Contractor
recently
contracted and
on site
Vuyisile Mini 1000
( Kentha-500 and
Ingqayi 500)
Intsika Yethu 10 16 59 R 4 280 000 Turnkey
contractor is on
site
Chris Hani
Heritage 1000 (
Kentha -511 &
Vukani-489 )
Intsika Yethu 1 25 75 R 7 800 000 Turnkey
contractor is on
site
Ntsongeni 130 Intsika Yethu 8 0 5 R 1 250 000 Contractor

Chris Hani District Municipality – 2016-2017 IDP Review 1st Draft
277
rural ( 7 Sirs
Group)
recently
contracted and
on site
Cofimvaba 170
(Rural Voucher)
Ntsika Yethu 3,5,8,10,11,13 0 0 R 400 000 Procurement of
contractors by
NURCHA
Lubisi 1000 (Lima
Developments)
Intsika Yethu 20 0 0 R 2 140 000 CRO is on site
busy with
beneficiary
Administration
before
commencement.
Project is being
implemented
through ePHP
process
Rosemead 220
Rural
Inxuba
Yethemba
29 0 0 R 0 Feasibility-land
issues
Mortimer and Fish
river 60
Inxuba
Yethemba
6&3 0 0 R 250 000 Feasibility-Land
challenges
Mntuntloni 1500
rural
Engcobo 12 0 0 R 0 Procurement of
Turnkey
contractor
(BEC)
Inkwenkwezi 300
rural ( Kontinental)
Engcobo 12 24 46 R 3 600 000 Construction
(Top Structures)

Chris Hani District Municipality – 2016-2017 IDP Review 1st Draft
278
Nkondlo500 rural (
Zingwazi)
Engcobo 17 15 50 R 3 300 000 Construction
(Top Structures)
Deberha 706 Engcobo 6 0 0 R 1 500 000 Procurement of
Contractor.
Goboti 300 rural (
Zingwazi)
Engcobo 9 20 40 R 2 700 000 Turn Key
contractor on
site
All Saints 700 rural
(Kontinental)
Engcobo 10 75 125 R 5 800 000 Turn Key
contractors on
site
Cefane Hook 350
rural
Engcobo 11 0 0 R 0 Procurement
(BEC)
Zwartwater 1000 Emalahleni 9 0 0 R 0 CRO is on site
and project is
implemented
through ePHP
Cala Ward 2- 2693
( Quantum Leap-
1409 & Vukani -
1284)
Sakhisizwe 2 0 20 R 4 400 000 2 Turnkey
contractor’s 2
CRO’s are on
site
Cala Ward 4- 2662
( Mahiri 1393 &
Mosegedi-1269)
Sakhisizwe 4 0 20 R 4 250 000
Zola Village700 Tsolwana 1 0 0 R 350 000 Procurement of
Turnkey
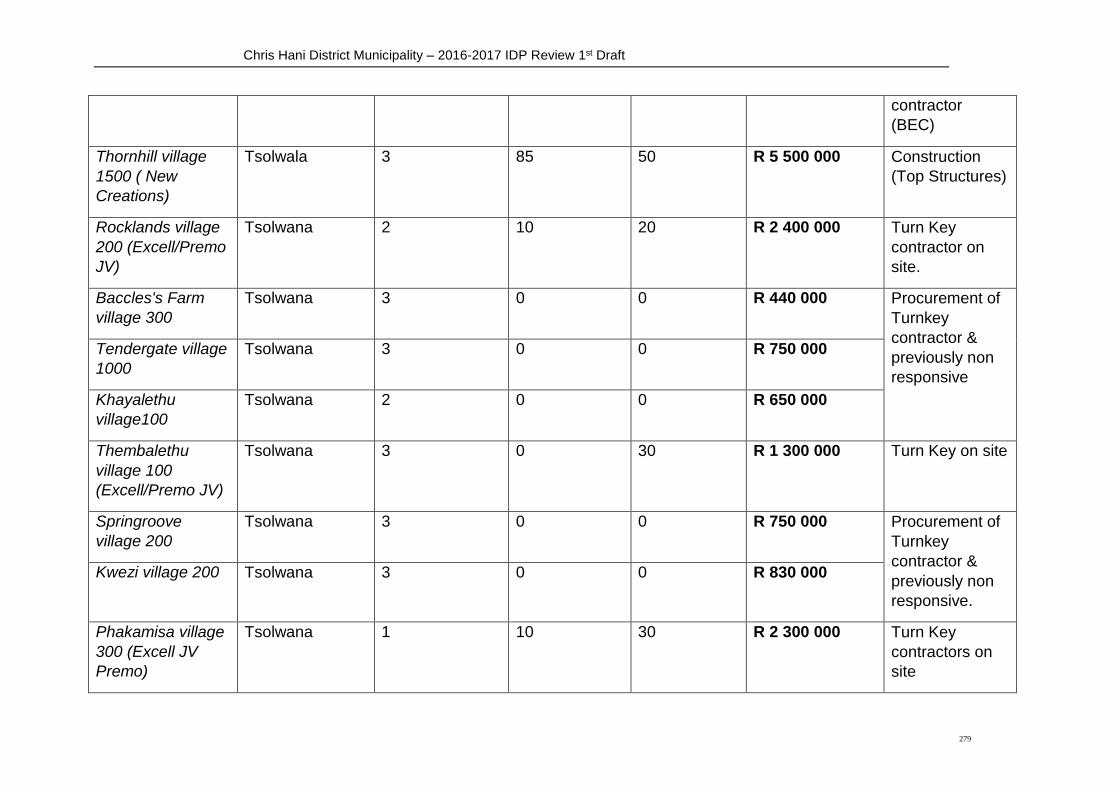
Chris Hani District Municipality – 2016-2017 IDP Review 1st Draft
279
contractor
(BEC)
Thornhill village
1500 ( New
Creations)
Tsolwala 3 85 50 R 5 500 000 Construction
(Top Structures)
Rocklands village
200 (Excell/Premo
JV)
Tsolwana 2 10 20 R 2 400 000 Turn Key
contractor on
site.
Baccles's Farm
village 300
Tsolwana 3 0 0 R 440 000 Procurement of
Turnkey
contractor &
previously non
responsive
Tendergate village
1000
Tsolwana 3 0 0 R 750 000
Khayalethu
village100
Tsolwana 2 0 0 R 650 000
Thembalethu
village 100
(Excell/Premo JV)
Tsolwana 3 0 30 R 1 300 000 Turn Key on site
Springroove
village 200
Tsolwana 3 0 0 R 750 000 Procurement of
Turnkey
contractor &
previously non
responsive.
Kwezi village 200 Tsolwana 3 0 0 R 830 000
Phakamisa village
300 (Excell JV
Premo)
Tsolwana 1 10 30 R 2 300 000 Turn Key
contractors on
site
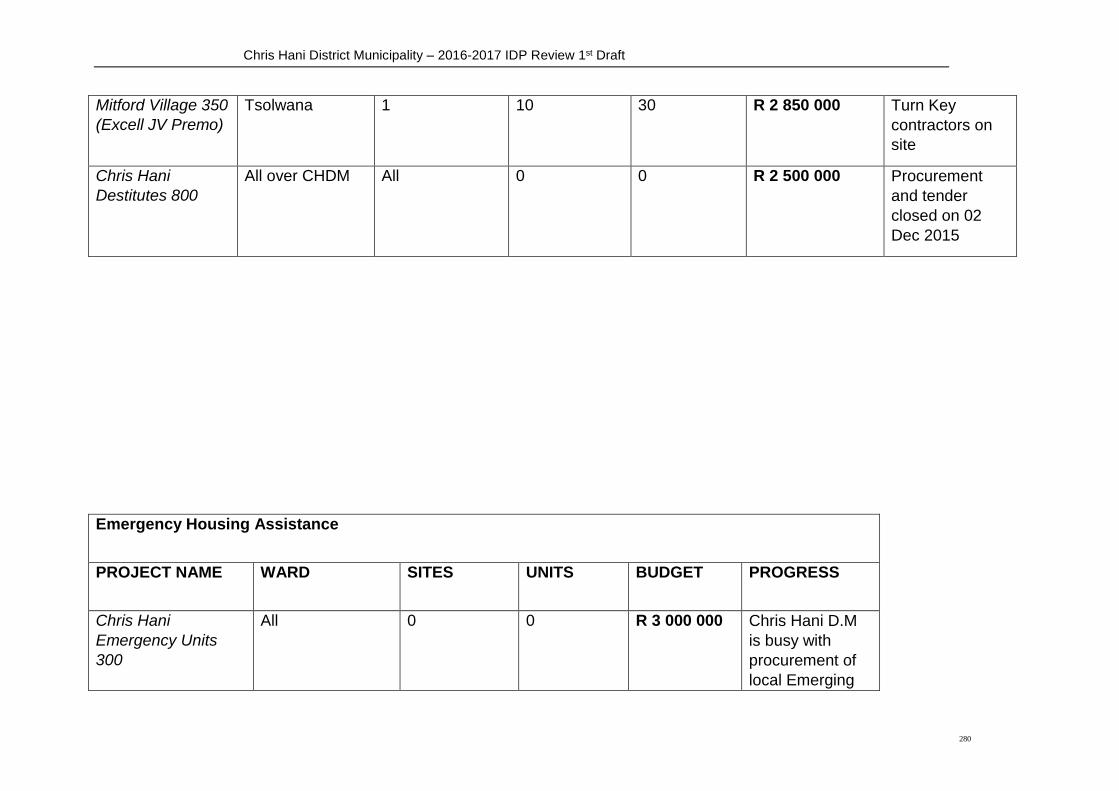
Chris Hani District Municipality – 2016-2017 IDP Review 1st Draft
280
Mitford Village 350
(Excell JV Premo)
Tsolwana 1 10 30 R 2 850 000 Turn Key
contractors on
site
Chris Hani
Destitutes 800
All over CHDM All 0 0 R 2 500 000 Procurement
and tender
closed on 02
Dec 2015
Emergency Housing Assistance
PROJECT NAME WARD SITES UNITS BUDGET PROGRESS
Chris Hani
Emergency Units
300
All 0 0 R 3 000 000 Chris Hani D.M
is busy with
procurement of
local Emerging

Chris Hani District Municipality – 2016-2017 IDP Review 1st Draft
281
Contractors
Proposed New Projects under Application for Development
PROJECT MUNICIPALITY WARD 17/18 18/19 19/20 STATUS
Whittle Sea 1000 Lukhanji 17 √ √ √ Projects will be
on hold for a
period of a year
due to current
commitment of
R 3.2 Billion
worth projects
over than
allocation
expected and
National in next
Ekuphumleni 250
ISU
Lukhanji 16 √
Tylden 300 rural Lukhanji 1 √ √ √
Ezibeleni 500 Lukhanji 8 √ √
Ezibeleni ISUP 200 Lukhanji 8 √
Unifound 750 Lukhanji 21 √ √ √
Ilinge ISUP 300 Lukhanji 1 √ √
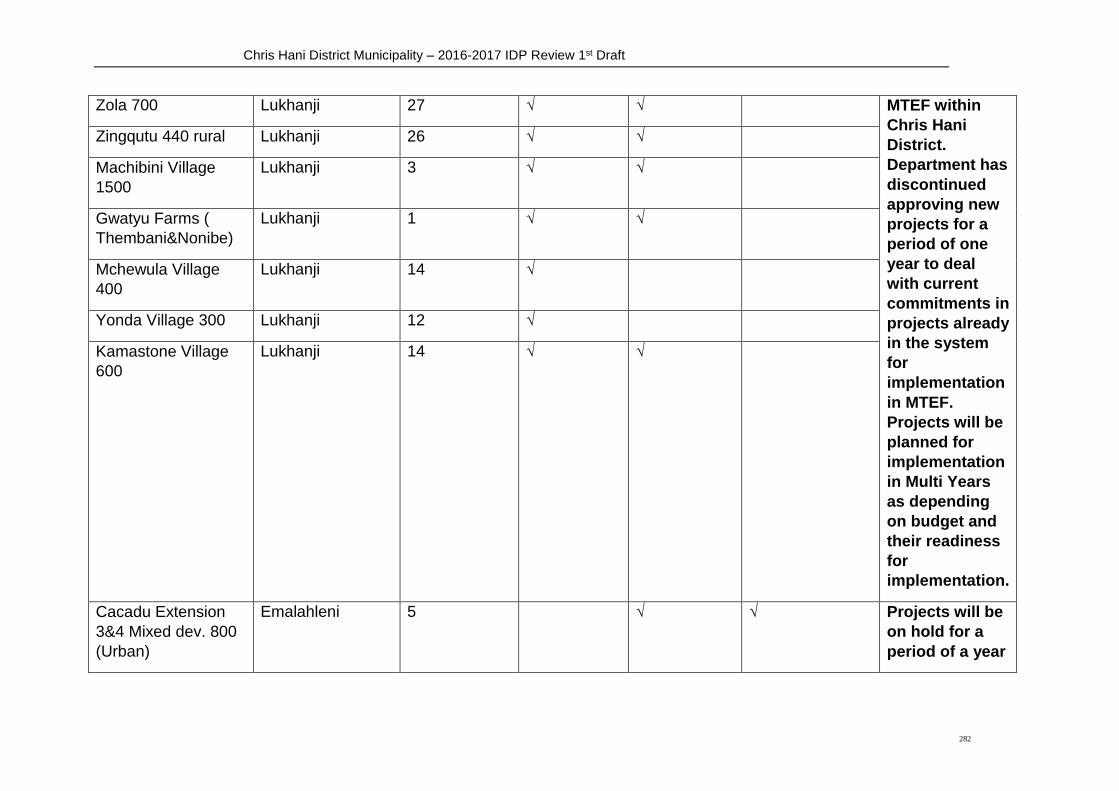
Chris Hani District Municipality – 2016-2017 IDP Review 1st Draft
282
Zola 700 Lukhanji 27 √ √ MTEF within
Chris Hani
District.
Department has
discontinued
approving new
projects for a
period of one
year to deal
with current
commitments in
projects already
in the system
for
implementation
in MTEF.
Projects will be
planned for
implementation
in Multi Years
as depending
on budget and
their readiness
for
implementation.
Zingqutu 440 rural Lukhanji 26 √ √
Machibini Village
1500
Lukhanji 3 √ √
Gwatyu Farms (
Thembani&Nonibe)
Lukhanji 1 √ √
Mchewula Village
400
Lukhanji 14 √
Yonda Village 300 Lukhanji 12 √
Kamastone Village
600
Lukhanji 14 √ √
Cacadu Extension
3&4 Mixed dev. 800
(Urban)
Emalahleni 5 √ √ Projects will be
on hold for a
period of a year

Chris Hani District Municipality – 2016-2017 IDP Review 1st Draft
283
Dodrecht (Mixed
Development) 800
(Urban)
Emalahleni 11 √ √ due to current
commitment of
R 3.2 Billion
worth projects
over than
allocation
expected and
National in next
MTEF within
Chris Hani
District.
Department has
discontinued
approving new
projects for a
period of one
year to deal
with current
commitments in
projects already
in the system
for
implementation
in MTEF.
Projects will be
planned for
implementation
in Multi Years
as depending
on budget and
Indwe 800 (Urban) Emalahleni 16 √ √
Phola Park and
Ekuphuleni 854
Rural
Sakhisizwe 1 √ √
Ekuphumleni 500
(Urban)
Intsika Yethu 14 √ √
Mandela View 130
(Urban)
Intsika Yethu 14 √ √
Ntsongeni Ext 1000-
870 units(Rural)
Intsika Yethu 14 √ √
Enyanisweni Ext
500(Urban)
Intsika Yethu 14 √ √
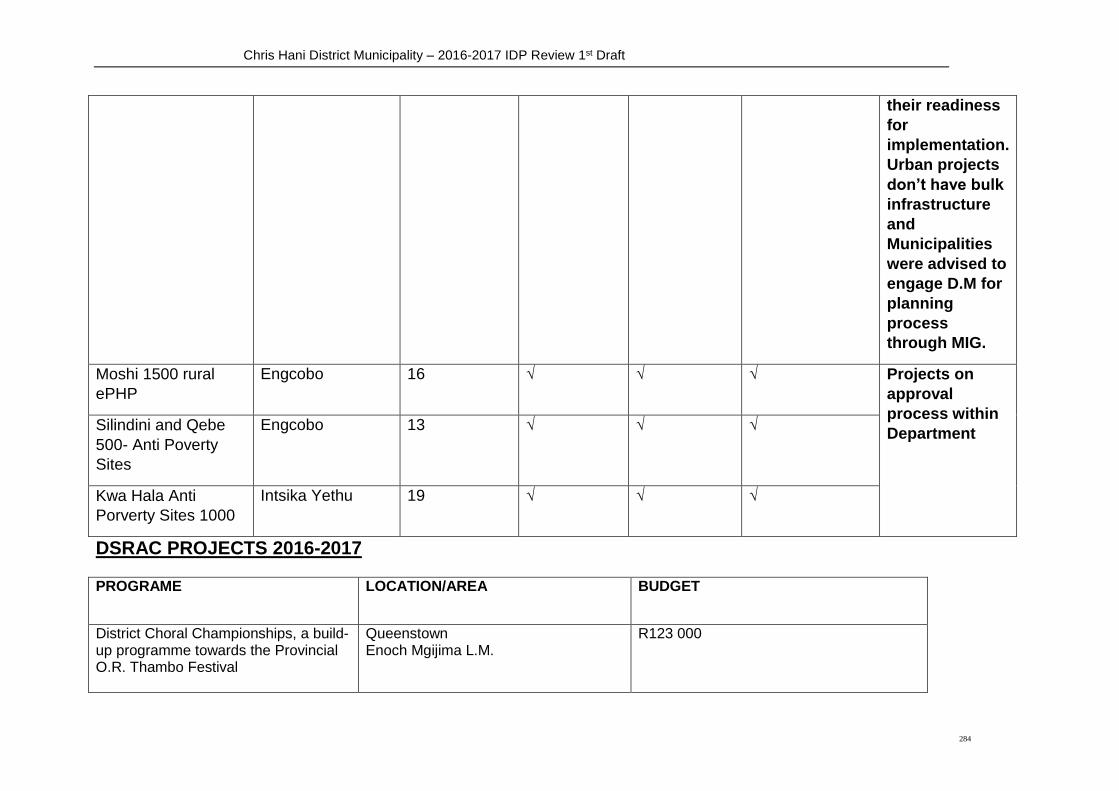
Chris Hani District Municipality – 2016-2017 IDP Review 1st Draft
284
their readiness
for
implementation.
Urban projects
don’t have bulk
infrastructure
and
Municipalities
were advised to
engage D.M for
planning
process
through MIG.
Moshi 1500 rural
ePHP
Engcobo 16 √ √ √ Projects on
approval
process within
Department Silindini and Qebe
500- Anti Poverty
Sites
Engcobo 13 √ √ √
Kwa Hala Anti
Porverty Sites 1000
Intsika Yethu 19 √ √ √
DSRAC PROJECTS 2016-2017 PROGRAME
LOCATION/AREA
BUDGET
District Choral Championships, a build-up programme towards the Provincial O.R. Thambo Festival
Queenstown
Enoch Mgijima L.M.
R123 000
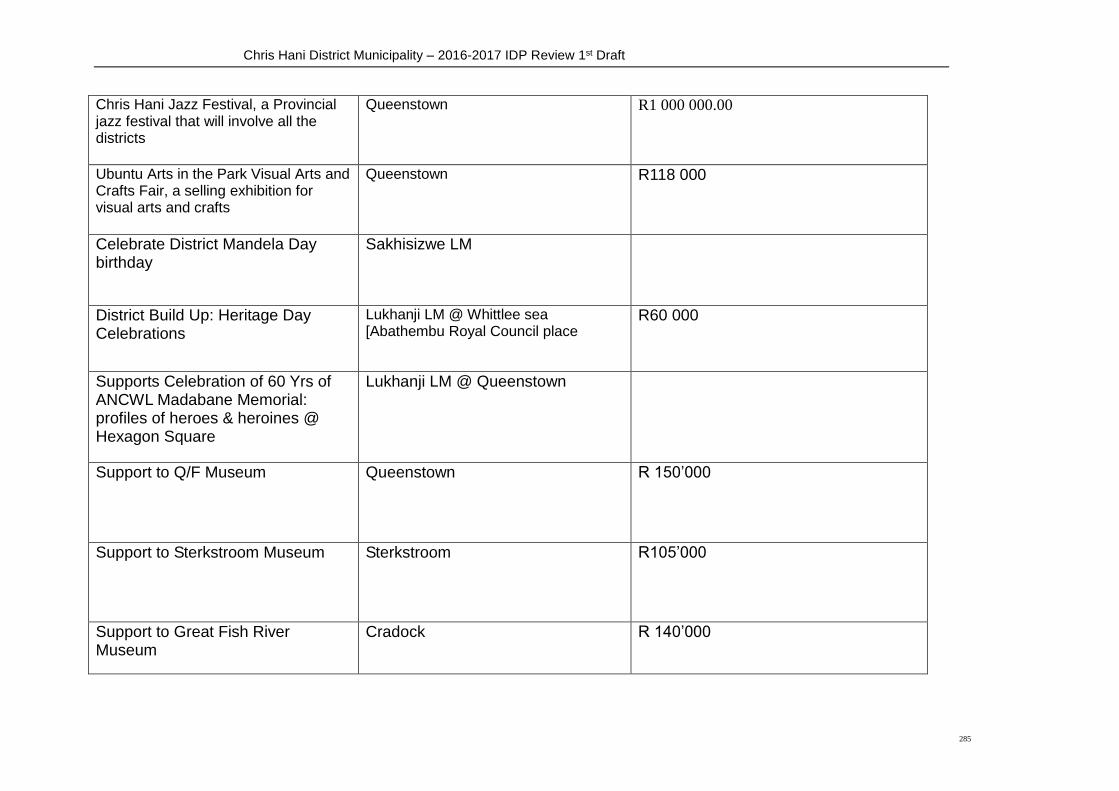
Chris Hani District Municipality – 2016-2017 IDP Review 1st Draft
285
Chris Hani Jazz Festival, a Provincial jazz festival that will involve all the districts
Queenstown
R1 000 000.00
Ubuntu Arts in the Park Visual Arts and Crafts Fair, a selling exhibition for visual arts and crafts
Queenstown
R118 000
Celebrate District Mandela Day birthday
Sakhisizwe LM
District Build Up: Heritage Day Celebrations
Lukhanji LM @ Whittlee sea [Abathembu Royal Council place
R60 000
Supports Celebration of 60 Yrs of ANCWL Madabane Memorial: profiles of heroes & heroines @ Hexagon Square
Lukhanji LM @ Queenstown
Support to Q/F Museum Queenstown R 150’000
Support to Sterkstroom Museum Sterkstroom R105’000
Support to Great Fish River Museum
Cradock R 140’000
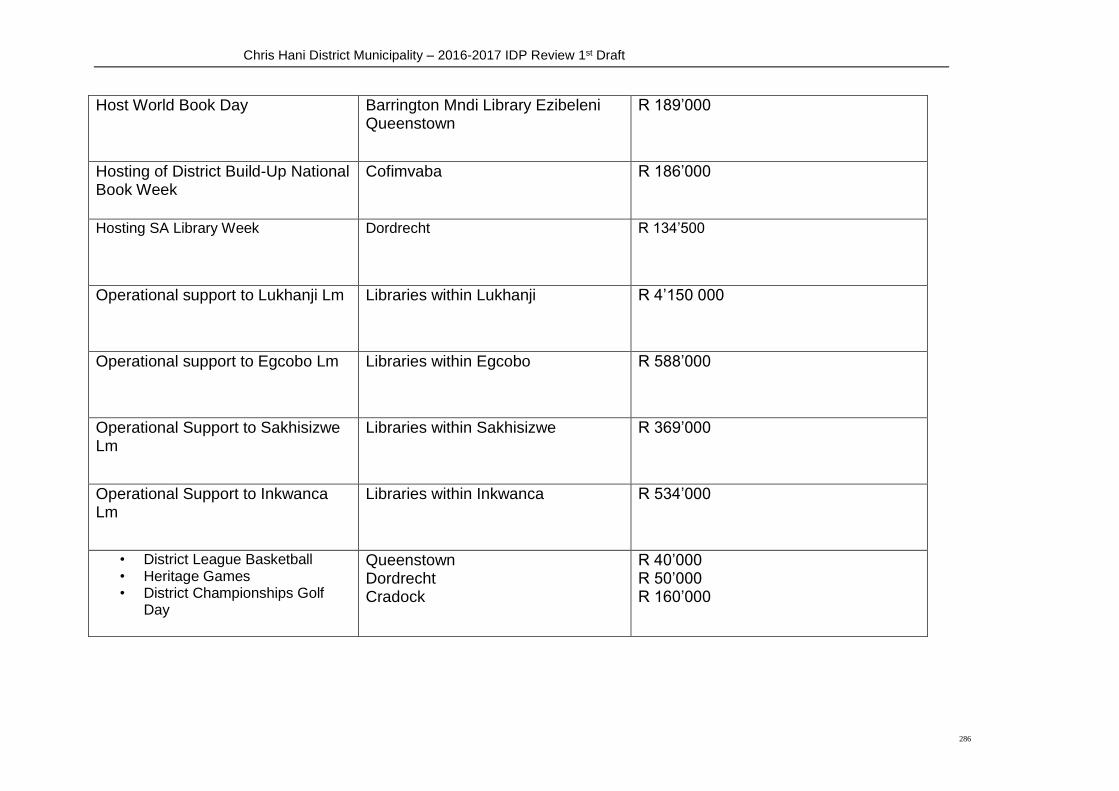
Chris Hani District Municipality – 2016-2017 IDP Review 1st Draft
286
Host World Book Day Barrington Mndi Library Ezibeleni Queenstown
R 189’000
Hosting of District Build-Up National Book Week
Cofimvaba
R 186’000
Hosting SA Library Week
Dordrecht
R 134’500
Operational support to Lukhanji Lm
Libraries within Lukhanji
R 4’150 000
Operational support to Egcobo Lm
Libraries within Egcobo
R 588’000
Operational Support to Sakhisizwe Lm
Libraries within Sakhisizwe
R 369’000
Operational Support to Inkwanca Lm
Libraries within Inkwanca
R 534’000
• District League Basketball • Heritage Games • District Championships Golf
Day
Queenstown
Dordrecht Cradock
R 40’000
R 50’000
R 160’000

Chris Hani District Municipality – 2016-2017 IDP Review 1st Draft
287
• District League Cricket • Eyase Kasi Road Running
Queenstown
R 70’000
• Women in Recreation Festival
Middelburg
R 80’000
• Children’s Day Festival • Recreation Explosion Festival
Hofmeyer Cofimvaba
R20’000
R123’274
• Community Pre-Schools Athletic’s
Queenstown
R 40’000
• Hosting Mandela Marathon • Hosting Geneva Scholtz
Memorial Women in Sport •
Tsomo Middleburg
R60’ 000 R90’000
• Co-ordinate Netball and Football Leagues
• Clarence Mlokohti Top 8 Football Tournament
• Hosting Bonkolo Marathon • Co-ordinate Chris Hani Teams in
the Border Cricket League
All LM’S Tsomo Queenstown All LM’S
R80’000 R100’000 R200’000 R45’000
• Support participants to attend Provincial Indigenous Games
• Co-ordinate Indigenous Games Cluster Festival between Chris Hani and Amathole
Cradock
R 145’000 R120’000
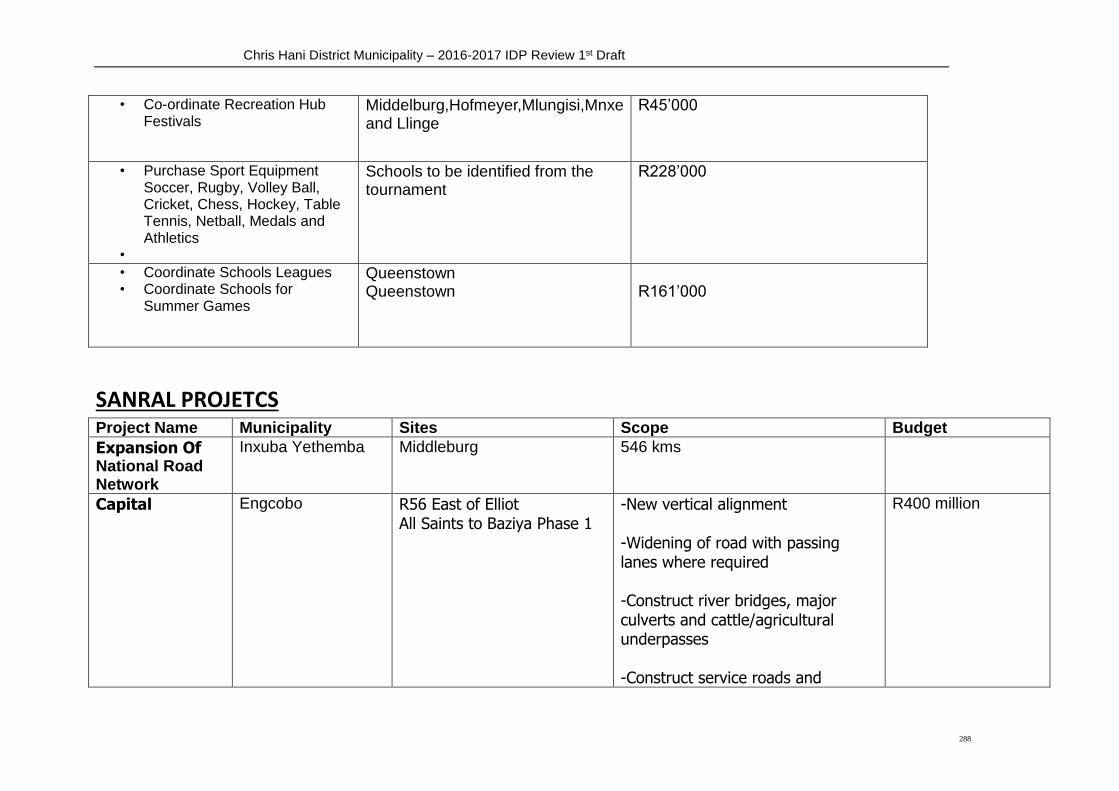
Chris Hani District Municipality – 2016-2017 IDP Review 1st Draft
288
• Co-ordinate Recreation Hub Festivals
Middelburg,Hofmeyer,Mlungisi,Mnxe and Llinge
R45’000
• Purchase Sport Equipment Soccer, Rugby, Volley Ball, Cricket, Chess, Hockey, Table Tennis, Netball, Medals and Athletics
•
Schools to be identified from the tournament
R228’000
• Coordinate Schools Leagues • Coordinate Schools for
Summer Games
Queenstown Queenstown
R161’000
SANRAL PROJETCS Project Name Municipality Sites Scope Budget
Expansion Of National Road Network
Inxuba Yethemba Middleburg 546 kms
Capital Engcobo R56 East of Elliot All Saints to Baziya Phase 1
-New vertical alignment -Widening of road with passing lanes where required -Construct river bridges, major culverts and cattle/agricultural underpasses -Construct service roads and
R400 million

Chris Hani District Municipality – 2016-2017 IDP Review 1st Draft
289
Phase 2
walkways -Formalize accesses and intersections New vertical alignment -Widening of road with passing lanes where required -Construct river bridges, major culverts and cattle/agricultural underpasses -Construct service roads and walkways -Formalize accesses and intersections
R350 million
Intsika Yethu/ Engcobo
Upgrade between Qumanco River and All Saints Phase 1
–Upgrading of vertical alignment and widening of road –Construct 2x bridges and major culverts –Improve intersections where necessary –Construct service road inside township to facilitate closure of
R209 million
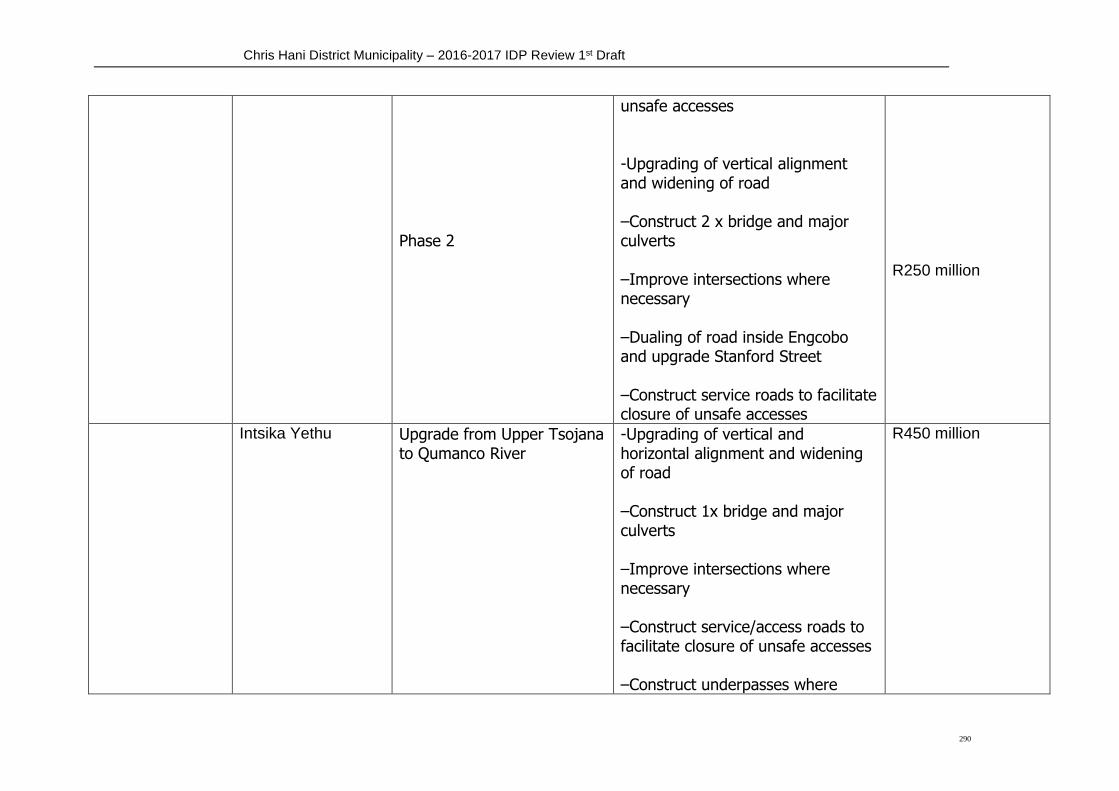
Chris Hani District Municipality – 2016-2017 IDP Review 1st Draft
290
Phase 2
unsafe accesses -Upgrading of vertical alignment and widening of road –Construct 2 x bridge and major culverts –Improve intersections where necessary –Dualing of road inside Engcobo and upgrade Stanford Street –Construct service roads to facilitate closure of unsafe accesses
R250 million
Intsika Yethu Upgrade from Upper Tsojana to Qumanco River
-Upgrading of vertical and horizontal alignment and widening of road –Construct 1x bridge and major culverts –Improve intersections where necessary –Construct service/access roads to facilitate closure of unsafe accesses –Construct underpasses where
R450 million
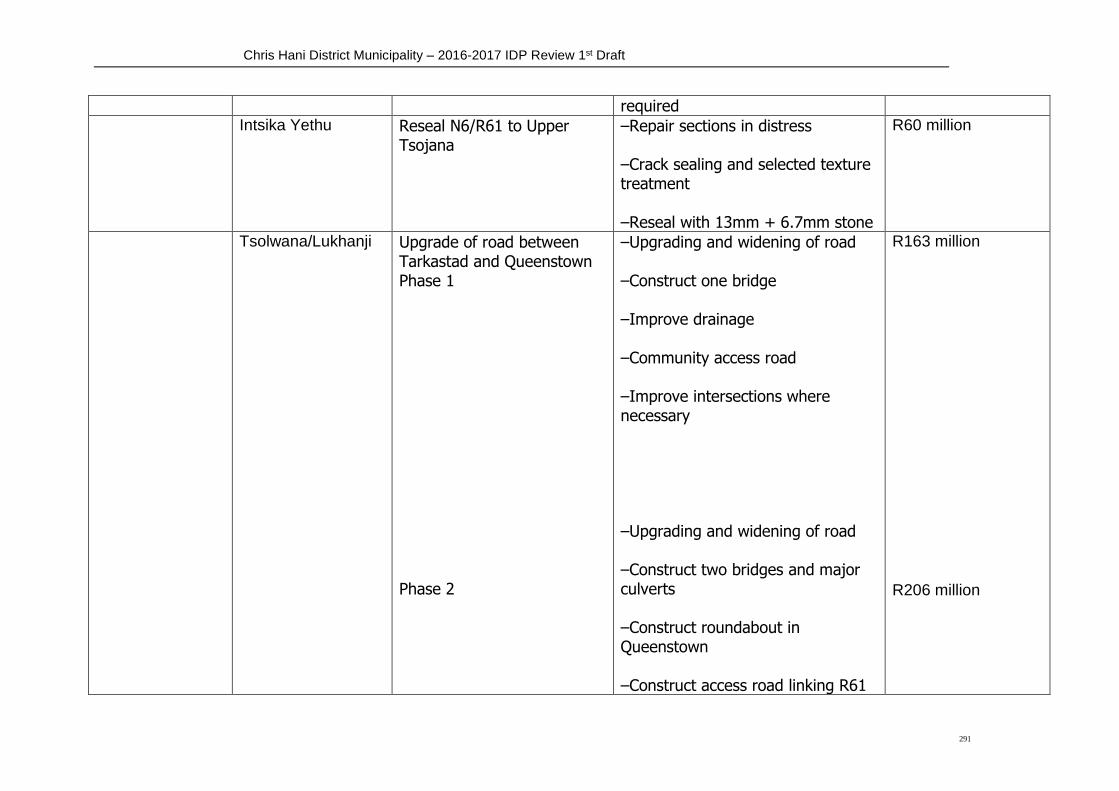
Chris Hani District Municipality – 2016-2017 IDP Review 1st Draft
291
required
Intsika Yethu Reseal N6/R61 to Upper Tsojana
–Repair sections in distress –Crack sealing and selected texture treatment –Reseal with 13mm + 6.7mm stone
R60 million
Tsolwana/Lukhanji Upgrade of road between Tarkastad and Queenstown Phase 1 Phase 2
–Upgrading and widening of road –Construct one bridge –Improve drainage –Community access road –Improve intersections where necessary –Upgrading and widening of road –Construct two bridges and major culverts –Construct roundabout in Queenstown –Construct access road linking R61
R163 million R206 million
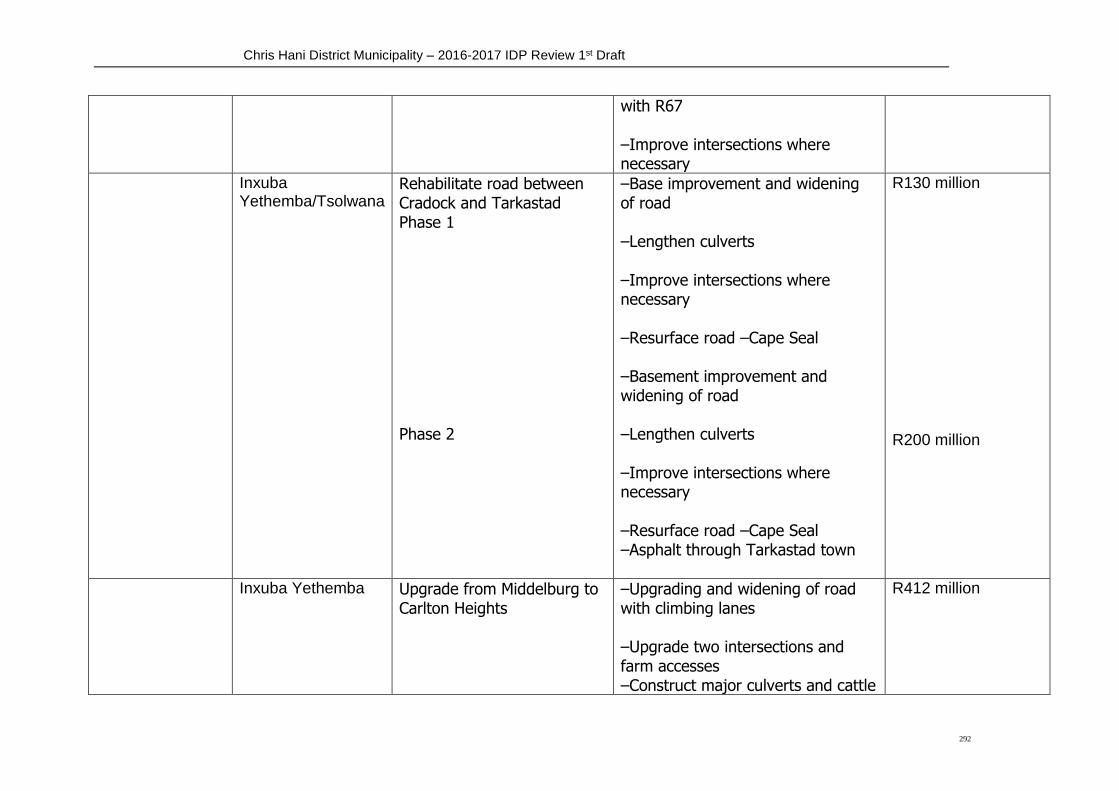
Chris Hani District Municipality – 2016-2017 IDP Review 1st Draft
292
with R67 –Improve intersections where necessary
Inxuba Yethemba/Tsolwana
Rehabilitate road between Cradock and Tarkastad Phase 1 Phase 2
–Base improvement and widening of road –Lengthen culverts –Improve intersections where necessary –Resurface road –Cape Seal –Basement improvement and widening of road –Lengthen culverts –Improve intersections where necessary –Resurface road –Cape Seal –Asphalt through Tarkastad town
R130 million R200 million
Inxuba Yethemba Upgrade from Middelburg to Carlton Heights
–Upgrading and widening of road with climbing lanes –Upgrade two intersections and farm accesses –Construct major culverts and cattle
R412 million

Chris Hani District Municipality – 2016-2017 IDP Review 1st Draft
293
underpasses –Construct river bridges –Rehabilitate Meintjies Street after the construction of major bridge near town
Inxuba Yethemba Upgrading of road from Cradock and Knutsford
–Upgrading and widening of road with climbing lanes –Upgrade two intersections and farm accesses –Construct underpass at 24.36km –Special maintenance to Church Street and surfacing of intersection of Albert and Adderley Streets –Upgrading of street lighting from the rail over road bridge to 100m past Caltex service station.
R180 million
Tsolwana Upgrading of road from Riet River to Tarka Bridge
–Improve vertical and horizontal alignment –Widening of road with climbing lanes –Drainage structures and installation of prefabricated culverts, in-situ culverts and in-situ irrigation canal
R401 million
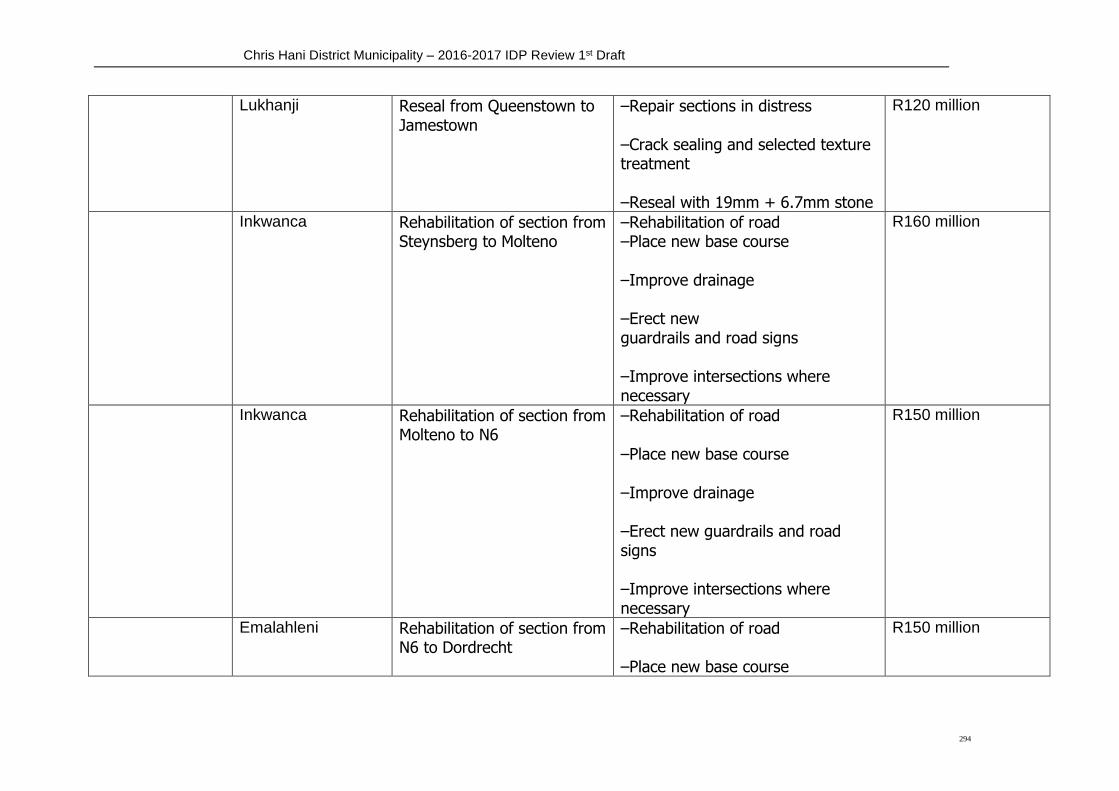
Chris Hani District Municipality – 2016-2017 IDP Review 1st Draft
294
Lukhanji Reseal from Queenstown to Jamestown
–Repair sections in distress –Crack sealing and selected texture treatment –Reseal with 19mm + 6.7mm stone
R120 million
Inkwanca Rehabilitation of section from Steynsberg to Molteno
–Rehabilitation of road –Place new base course –Improve drainage –Erect new guardrails and road signs –Improve intersections where necessary
R160 million
Inkwanca Rehabilitation of section from Molteno to N6
–Rehabilitation of road –Place new base course –Improve drainage –Erect new guardrails and road signs –Improve intersections where necessary
R150 million
Emalahleni Rehabilitation of section from N6 to Dordrecht
–Rehabilitation of road –Place new base course
R150 million
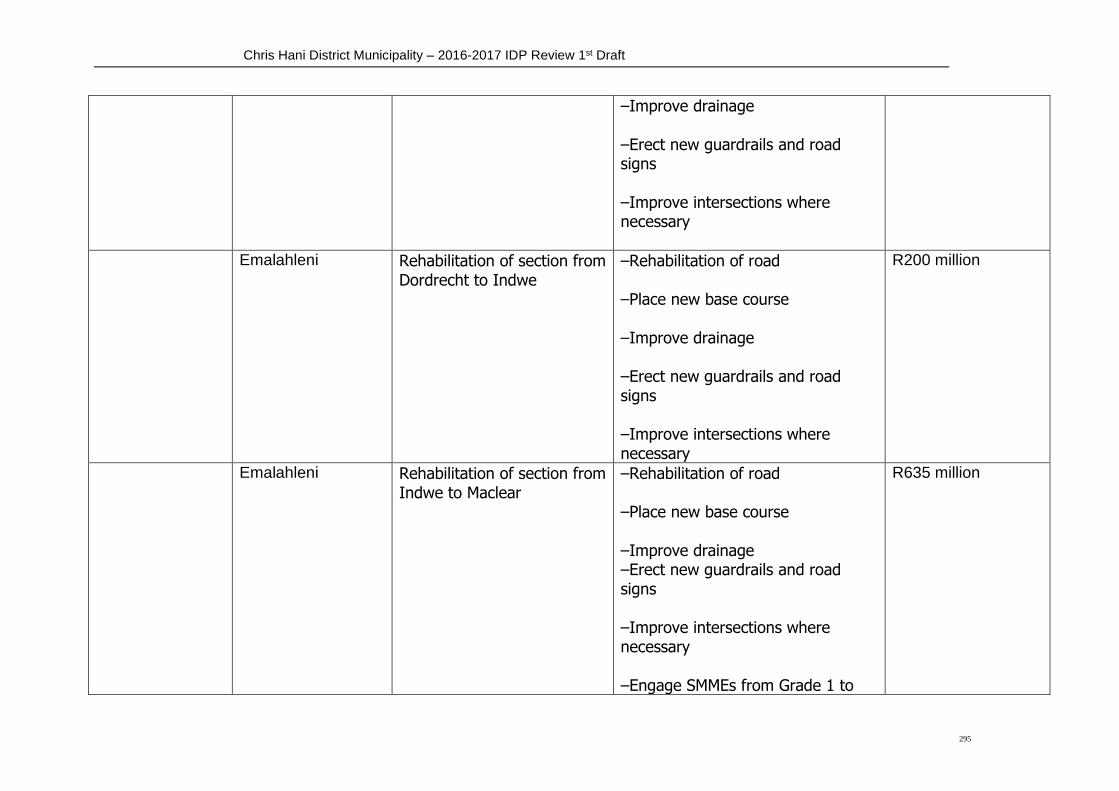
Chris Hani District Municipality – 2016-2017 IDP Review 1st Draft
295
–Improve drainage –Erect new guardrails and road signs –Improve intersections where necessary
Emalahleni Rehabilitation of section from Dordrecht to Indwe
–Rehabilitation of road –Place new base course –Improve drainage –Erect new guardrails and road signs –Improve intersections where necessary
R200 million
Emalahleni Rehabilitation of section from Indwe to Maclear
–Rehabilitation of road –Place new base course –Improve drainage –Erect new guardrails and road signs –Improve intersections where necessary –Engage SMMEs from Grade 1 to
R635 million
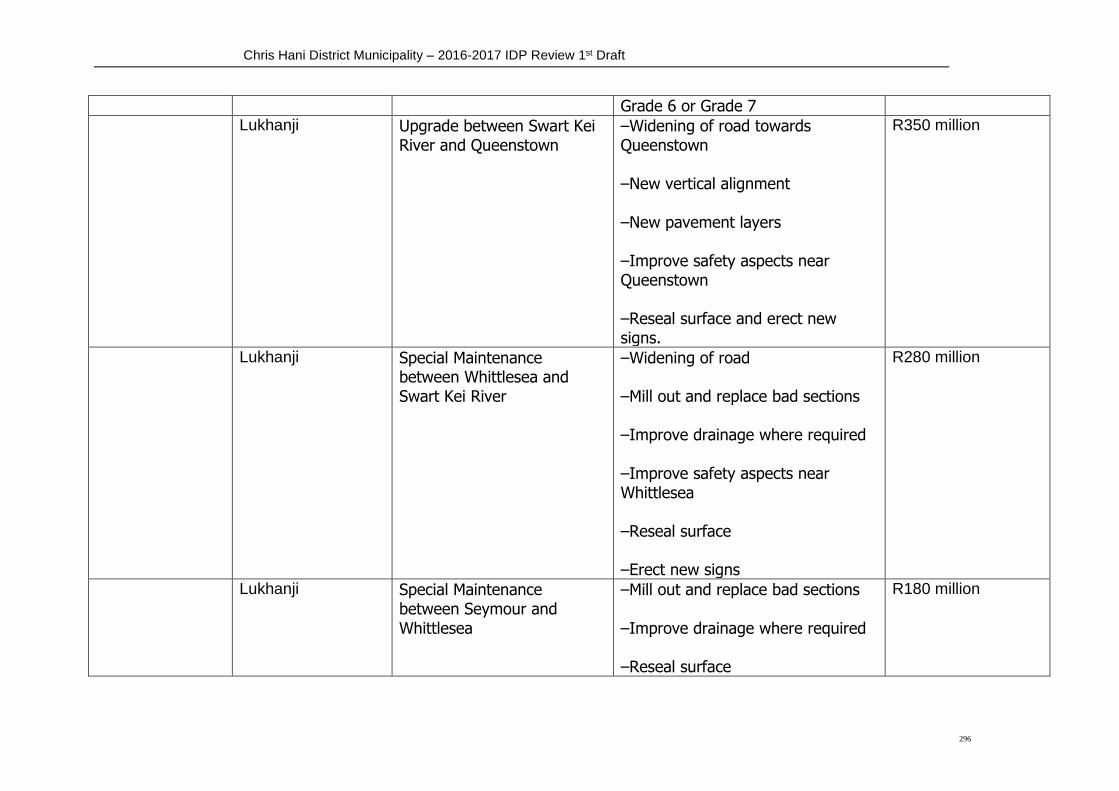
Chris Hani District Municipality – 2016-2017 IDP Review 1st Draft
296
Grade 6 or Grade 7
Lukhanji Upgrade between Swart Kei River and Queenstown
–Widening of road towards Queenstown –New vertical alignment –New pavement layers –Improve safety aspects near Queenstown –Reseal surface and erect new signs.
R350 million
Lukhanji Special Maintenance between Whittlesea and Swart Kei River
–Widening of road –Mill out and replace bad sections –Improve drainage where required –Improve safety aspects near Whittlesea –Reseal surface –Erect new signs
R280 million
Lukhanji Special Maintenance between Seymour and Whittlesea
–Mill out and replace bad sections –Improve drainage where required –Reseal surface
R180 million

Chris Hani District Municipality – 2016-2017 IDP Review 1st Draft
297
–Erect new signs
Assistance To Province
Intsika Yethu Sabalele Upgrade –Improve vertical and horizontal alignment –Construct a 6.8 m single carriageway –Provide calming measures at identified spots –Turning lanes at intersection with R61 at St Marks –Apply 19 mm Cape Seal
R170 million
ESKOM PROJECTS 2016-17
Municipality Project Name Category Y-E Plan CAPEX Y-E Plan
Connections
Emalahleni Emalahleni Small Holdings 16/17 Household R3,000,000.00 50
Emalahleni Small Holdings 16/17 Link
Line
Infrastructure R6,250,000.00
Emalahleni 16/17 Extensions Household R2,695,348.00 117

Chris Hani District Municipality – 2016-2017 IDP Review 1st Draft
298
Emalahleni Infills Infills R1,350,000.00 100
Emalahleni 17/18 Exts Pre-Engineering R396,005.00
Farm Dweller FWHs R73,684.00 7
Total Emalahleni R13,765,037.00 274
Engcobo Engcobo Rural Exts 16/17 Household R9,750,000.00 500
Engcobo Rural Exts 16/17 Link Line Infrastructure R3,750,000.00
Xonya Electrification 16/17 Household R3,363,000.00 177
Engcobo Infills Infills R1,200,000.00 100
Engcobo Ward Exts Pre-Engineering R250,000.00
Total Engcobo R18,313,000.00 682
Municipality Project Name Category Y-E Plan CAPEX Y-E Plan
Connections
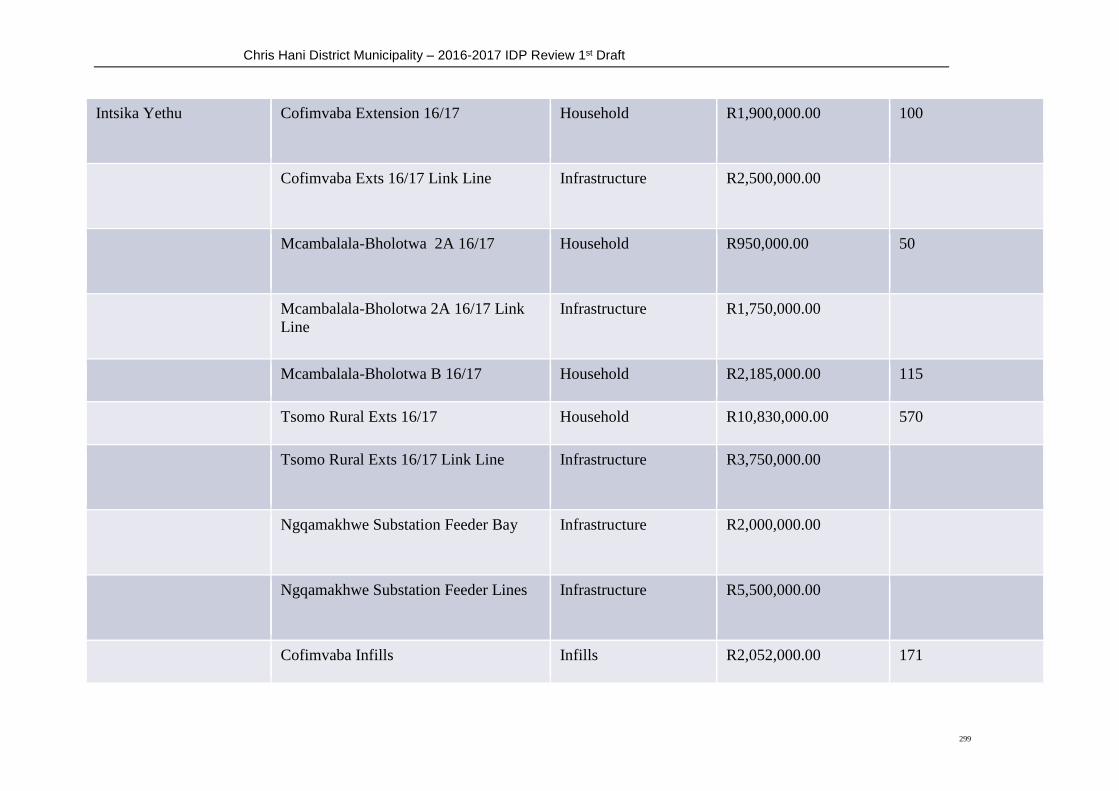
Chris Hani District Municipality – 2016-2017 IDP Review 1st Draft
299
Intsika Yethu Cofimvaba Extension 16/17 Household R1,900,000.00 100
Cofimvaba Exts 16/17 Link Line Infrastructure R2,500,000.00
Mcambalala-Bholotwa 2A 16/17 Household R950,000.00 50
Mcambalala-Bholotwa 2A 16/17 Link
Line
Infrastructure R1,750,000.00
Mcambalala-Bholotwa B 16/17 Household R2,185,000.00 115
Tsomo Rural Exts 16/17 Household R10,830,000.00 570
Tsomo Rural Exts 16/17 Link Line Infrastructure R3,750,000.00
Ngqamakhwe Substation Feeder Bay Infrastructure R2,000,000.00
Ngqamakhwe Substation Feeder Lines Infrastructure R5,500,000.00
Cofimvaba Infills Infills R2,052,000.00 171
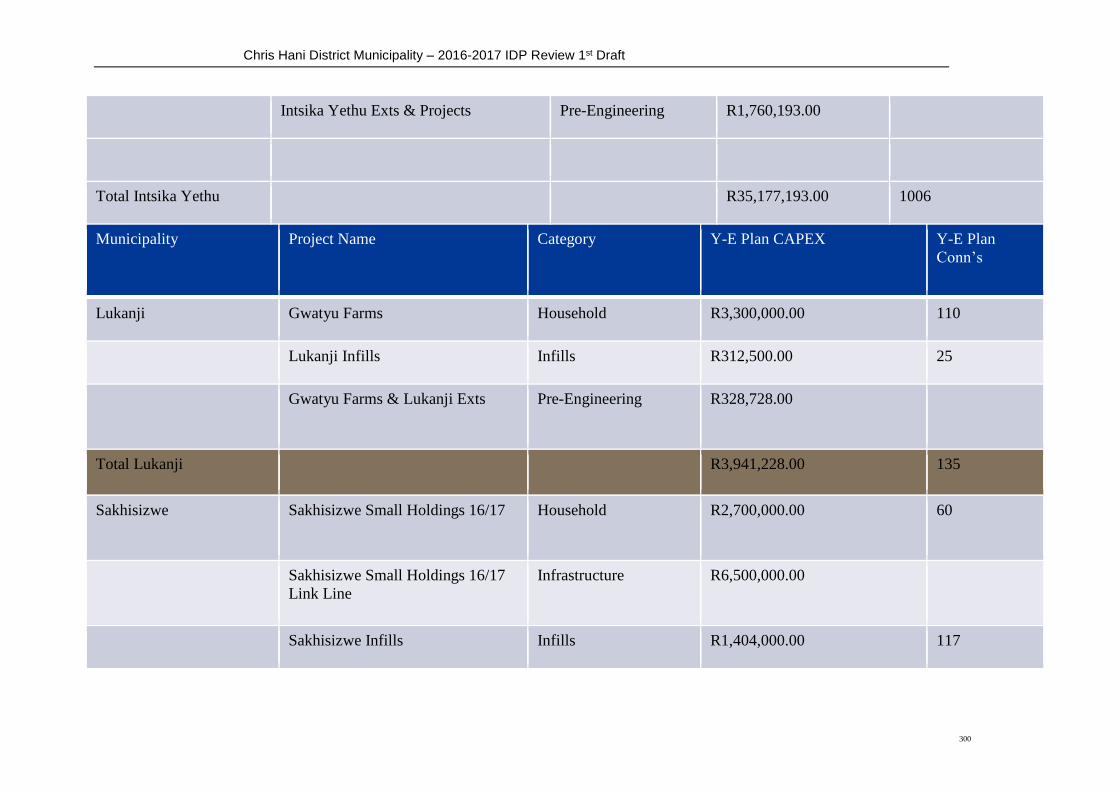
Chris Hani District Municipality – 2016-2017 IDP Review 1st Draft
300
Intsika Yethu Exts & Projects Pre-Engineering R1,760,193.00
Total Intsika Yethu R35,177,193.00 1006
Municipality Project Name Category Y-E Plan CAPEX Y-E Plan
Conn’s
Lukanji Gwatyu Farms Household R3,300,000.00 110
Lukanji Infills Infills R312,500.00 25
Gwatyu Farms & Lukanji Exts Pre-Engineering R328,728.00
Total Lukanji R3,941,228.00 135
Sakhisizwe Sakhisizwe Small Holdings 16/17 Household R2,700,000.00 60
Sakhisizwe Small Holdings 16/17
Link Line
Infrastructure R6,500,000.00
Sakhisizwe Infills Infills R1,404,000.00 117

Chris Hani District Municipality – 2016-2017 IDP Review 1st Draft
301
Sakhisizwe Extensions Pre-Engineering R1,186,351.00
Total Sakhisizwe R11,790,351.00 177
Tsolwana Zola Housing Development Household R2,625,000.00 210
Tsolwana Infills Infrastructure R397,105.00 31
Tsolwana Ward Exts Pre-Engineering R394,123.00
Total Tsolwana R3,416,228.00 241
Total Chris Hani R86,403,038.00 1833
CHDA 2016-2017 PROJECTS Project Name Municipality Sites Scope Budget Duration
Agriculture and Agro processing: Livestock Value Chain ( Beef)
Jobs Fund Livestock Linkage Project in Implementation in partnership with Jobs Fund, Berlin Beef and Masisizane Fund, 1500 weaners will be placed in communities from
R 60 million

Chris Hani District Municipality – 2016-2017 IDP Review 1st Draft
302
the beginning of April
Agriculture and Agro processing: Dairy
Lukhanji Queenstown Business plan for cheese factory to be based in Queenidustria is at the final stages of development.
Agriculture and Agro processing: Vegetables
Intsika Yethu Qamata In partnership with Potato SA 15 ha of Potatoes planted in Qamata and will be ready for harvest by end of March
Agriculture and Agro processing: Fruit value chain
About 30 Ha of pomegranate has been planted at Mitrock, in partnership with POMEC Vineyard site expansion is in progress, an irrigation system has been installed in the expanded area. 1st Grapes harvested and sent to a Cellar in Cape
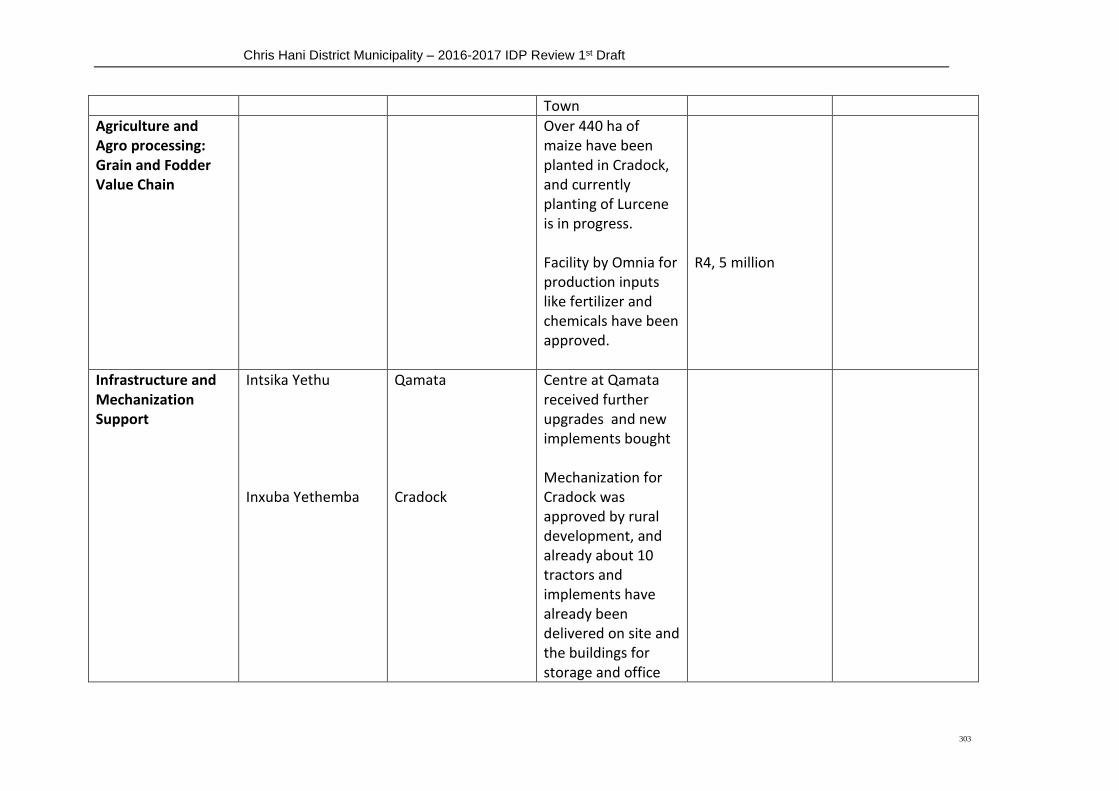
Chris Hani District Municipality – 2016-2017 IDP Review 1st Draft
303
Town
Agriculture and Agro processing: Grain and Fodder Value Chain
Over 440 ha of maize have been planted in Cradock, and currently planting of Lurcene is in progress. Facility by Omnia for production inputs like fertilizer and chemicals have been approved.
R4, 5 million
Infrastructure and Mechanization Support
Intsika Yethu Inxuba Yethemba
Qamata Cradock
Centre at Qamata received further upgrades and new implements bought Mechanization for Cradock was approved by rural development, and already about 10 tractors and implements have already been delivered on site and the buildings for storage and office
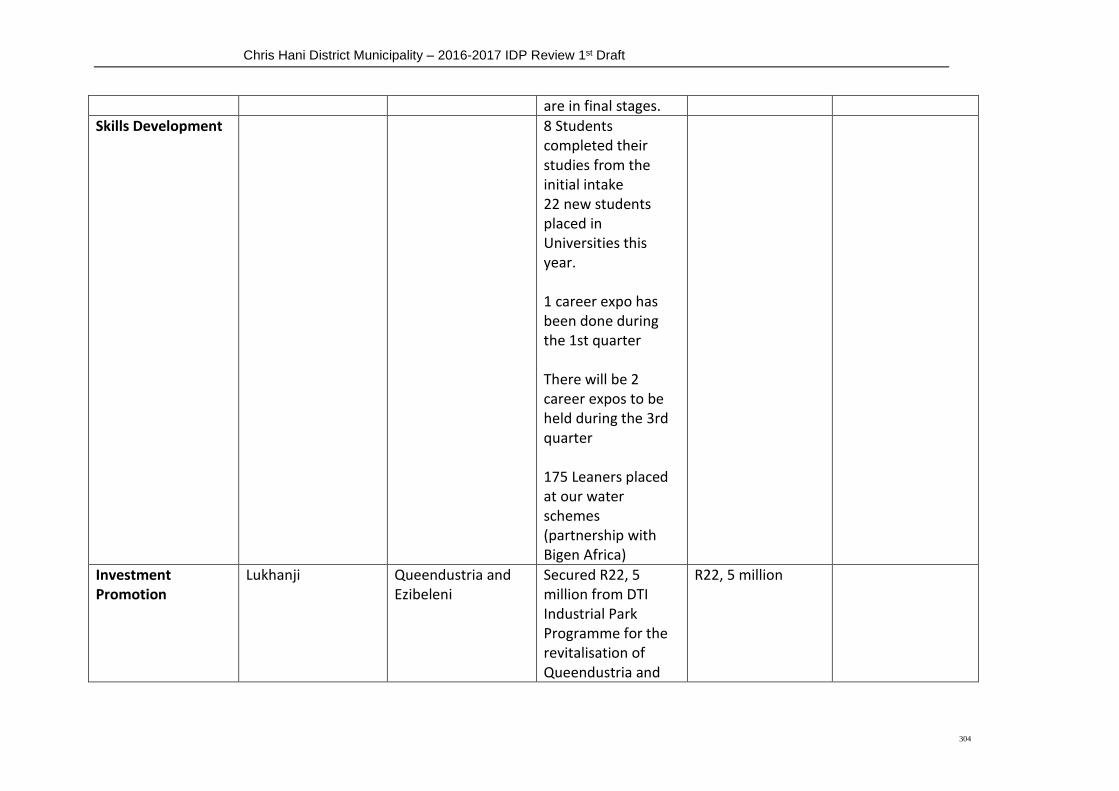
Chris Hani District Municipality – 2016-2017 IDP Review 1st Draft
304
are in final stages.
Skills Development 8 Students completed their studies from the initial intake 22 new students placed in Universities this year. 1 career expo has been done during the 1st quarter There will be 2 career expos to be held during the 3rd quarter 175 Leaners placed at our water schemes (partnership with Bigen Africa)
Investment Promotion
Lukhanji Queendustria and Ezibeleni
Secured R22, 5 million from DTI Industrial Park Programme for the revitalisation of Queendustria and
R22, 5 million
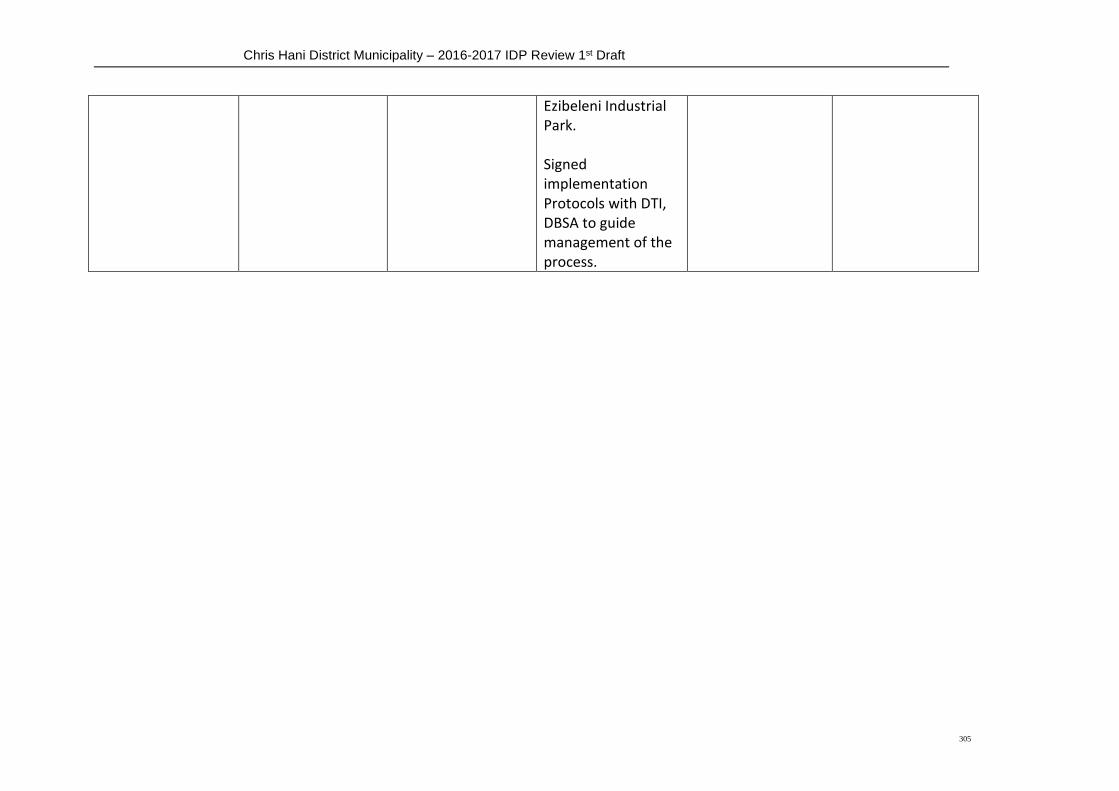
Chris Hani District Municipality – 2016-2017 IDP Review 1st Draft
305
Ezibeleni Industrial Park. Signed implementation Protocols with DTI, DBSA to guide management of the process.
Chris Hani District Municipality – 2016-2017 IDP Review 1st Draft
306
Chris Hani District Municipality – 2016-2017 IDP Review 1st Draft
307
CHAPTER 4 CHDM SPATIAL DEVELOPMENT FRAMEWORK In accordance with the requirements of legislation governing municipal planning, the Chris Hani District Municipality (CHDM) reviewed its District Spatial Development Framework (SDF). In line with the function of the District Municipality to co-ordinate development activities in the district, the District SDF should be taken as a guide to where planning and development initiatives could best be directed by public and private sector agencies seeking to invest in development initiatives in the district. Therefore, the SDF: - Identifies the key spatial development features (trends and dynamics) currently applicable in the
Chris Hani District Municipality;
Establishes clearly the objectives of the Chris Hani District Municipality in relation to spatial
development in its area of jurisdiction, with particular emphasis on clarifying the principles to be
followed in the management of such spatial development in the area;
Identifies the Municipality’s strategies and policies that are adopted to achieve its spatial
development objectives. These focus on establishing a hierarchy of settlement and delineating
Special Development Areas, which are: -
o Areas where strategic development intervention is required (areas of particular
development potential and/or areas where current development activities represent a
development opportunity); and
o Areas where priority spending is required (areas of special need).
Sets out basic guidelines for a land use management system in Chris Hani District Municipality.
The main changes to the district SDF of 2010 are as follows: -
Boundary changes as per the demarcation board are reflected;
Revised Priority Spatial Issues identified on the basis of a new Analysis as well as the revision of
the related Spatial Development Objectives and Strategies, in line with the current CHDM IDP
A revision of the Development Nodes and Corridors as well as the identified Special
Development Areas to align with the inputs of the review of the Regional Economic
Development Strategy (REDS);
The inclusion of information emanating from the Special Economic Zone report
A consideration of the likely requirements related to the implementation of the Spatial Planning
& Land Use Management, Act 16 of 2013 (SPLUMA)
3 A Development Perspective of Chris Hani District
The points below set out some of the most distinctive features of the Chris Hani District taken into consideration in the review of the SDF: -

Chris Hani District Municipality – 2016-2017 IDP Review 1st Draft
308
It is estimated that the total population of the district in 2015 will reach about 813,473 people
(approximately 216,600 households), with the highest population densities located in the
former Ciskei and Transkei areas. This reflects a reduction from previous estimates (2001 and
2004) and suggests that the district is experiencing a process of outward migration.
In essence, the Chris Hani District may be defined as a largely land or primary production-
based area, where the most important elements of the district economy are derived from state
investment and from the consumption and production patterns of the resident population itself.
From a spatial development perspective, it is clear that the dominant area for economic activity
in the district is the Lukhanji municipal area, where some 48% of the total Gross Domestic
Product (GDP) of the district is produced. Within Lukhanji, Queenstown remains the main
concentration of activity in the commercial, manufacturing, and services sectors.
It is clear, too, that the small towns in the district remain important as service centres where
the local populace can access retail goods and other services.
Looking at economic development potential, the Chris Hani Regional Economic Development
Strategy (REDS) has endorsed 4 specific clusters (or sectors) for prioritisation in the district,
these being: (i) The Agricultural, Agro-Processing and Forestry Sector; (ii) The Manufacturing,
Construction and Mining Sector; (iii) Tourism & Hospitality Sector; and (iv) The Services, Retail
and Logistics Sector.
The REDS process has emphasised, however, that the sector that is perceived to present the
greatest opportunity to build value, create job opportunities and improve economic
development in the district is the broadly defined agricultural and forestry sector with its
related value-adding activities.
The REDS has provided the strategic basis for an Agro-Industrial approach to development in
the district, which has also taken form in the conceptualisation of a district Special Economic
Zone (SEZ).
The Chris Hani SEZ is proposed to have its Hub at the Queendustria industrial complex in
Queenstown.
4 Spatial Development Framework Proposals
In recognition of the need to plan for the maximization of available human and natural resources within a context of achieving sustainability, the CHDM acknowledges that there is a need to focus limited public resources in areas of opportunity in order to achieve maximum impact. From a spatial planning perspective, this means certain structuring elements have been identified to guide future planning and expenditure. These structuring elements are clustered into four main components: -
The district-scale Settlement Hierarchy;
Development Corridors aligned with the REDS and the SEZ;
Special Development Areas defined on the basis of specific development potential and/or
development need; and
Environmental Management Areas

Chris Hani District Municipality – 2016-2017 IDP Review 1st Draft
309
4.1 District-Scale Settlement Hierarchy
The SDF Review has identified an amended hierarchy of settlements in order to guide the DM and LMs in the allocation of appropriate levels of investment in infrastructure and services and to be better able to implement appropriate land use management strategies. It must be noted that the Hierarchy is defined from a district perspective and relates primarily to a consideration of both current status and function of a centre as well as its prospective future status. This takes into account the priority of Small-Town Regeneration, which forms part of the overall strategic approach of the REDS.
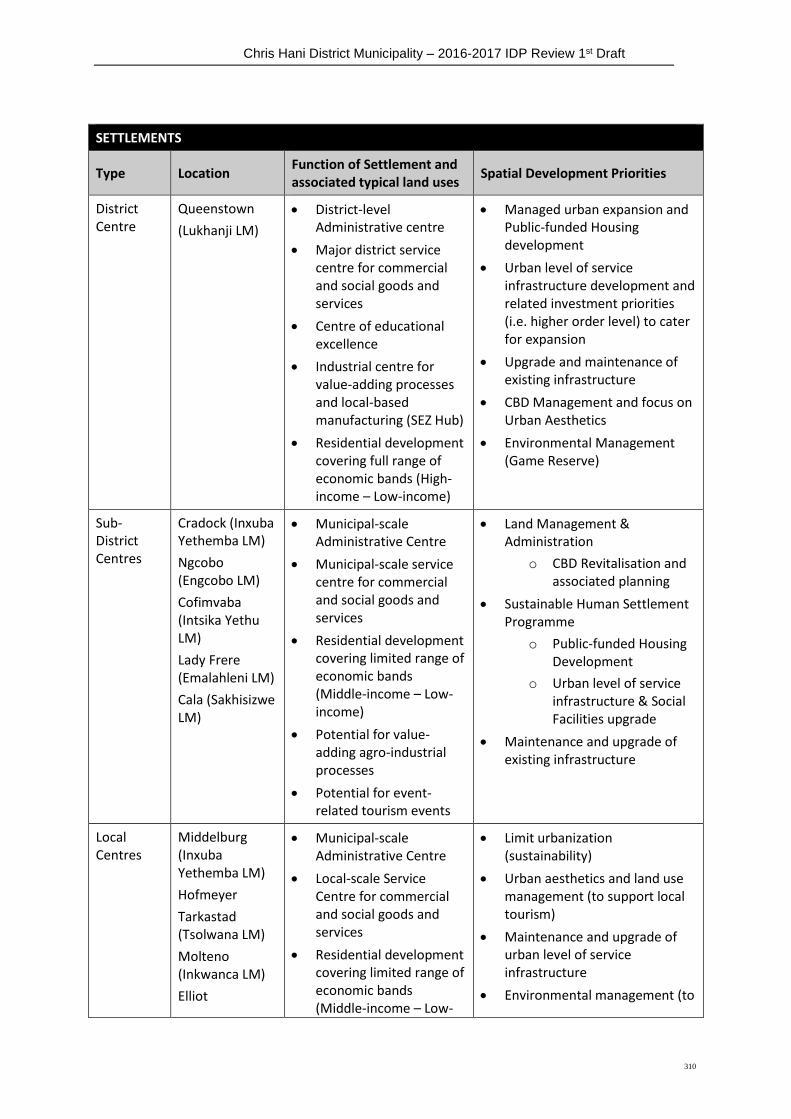
Chris Hani District Municipality – 2016-2017 IDP Review 1st Draft
310
SETTLEMENTS
Type Location Function of Settlement and associated typical land uses
Spatial Development Priorities
District Centre
Queenstown
(Lukhanji LM)
District-level Administrative centre
Major district service centre for commercial and social goods and services
Centre of educational excellence
Industrial centre for value-adding processes and local-based manufacturing (SEZ Hub)
Residential development covering full range of economic bands (High-income – Low-income)
Managed urban expansion and Public-funded Housing development
Urban level of service infrastructure development and related investment priorities (i.e. higher order level) to cater for expansion
Upgrade and maintenance of existing infrastructure
CBD Management and focus on Urban Aesthetics
Environmental Management (Game Reserve)
Sub-District Centres
Cradock (Inxuba Yethemba LM)
Ngcobo (Engcobo LM)
Cofimvaba (Intsika Yethu LM)
Lady Frere (Emalahleni LM)
Cala (Sakhisizwe LM)
Municipal-scale Administrative Centre
Municipal-scale service centre for commercial and social goods and services
Residential development covering limited range of economic bands (Middle-income – Low-income)
Potential for value-adding agro-industrial processes
Potential for event-related tourism events
Land Management & Administration
o CBD Revitalisation and associated planning
Sustainable Human Settlement Programme
o Public-funded Housing Development
o Urban level of service infrastructure & Social Facilities upgrade
Maintenance and upgrade of existing infrastructure
Local Centres
Middelburg (Inxuba Yethemba LM)
Hofmeyer
Tarkastad (Tsolwana LM)
Molteno (Inkwanca LM)
Elliot
Municipal-scale Administrative Centre
Local-scale Service Centre for commercial and social goods and services
Residential development covering limited range of economic bands (Middle-income – Low-
Limit urbanization (sustainability)
Urban aesthetics and land use management (to support local tourism)
Maintenance and upgrade of urban level of service infrastructure
Environmental management (to

Chris Hani District Municipality – 2016-2017 IDP Review 1st Draft
311
SETTLEMENTS
Type Location Function of Settlement and associated typical land uses
Spatial Development Priorities
(Sakhisizwe LM)
Dordrecht (Emalahleni LM)
income)
Potential for value-adding agro-industrial processes
support local tourism)
Sub-Local Centres
Sterkstroom (Inkwanca LM)
Sada/Whittlesea (Lukhanji LM)
Indwe
Vaal Banks (Emalahleni LM)
Tsomo (Intsika Yethu LM)
Ilinge (Lukhanji LM)
Thornhill (Tsolwana LM)
Lower Lufuta (Sakhisizwe LM)
Mnyolo
Clarkebury (Engcobo LM)
Ncora
Qamata
St Marks (Intsika Yethu LM)
Minor Administrative Functions
Minor service centre for social goods and services
Focused support of local economic initiatives – agriculture-based
Areas where higher order facilities should be focused in first instance
Maintenance and upgrade of existing infrastructure
Basic level of service extension with provision for higher levels of service where feasible and sustainable
Local planning to maximize use of resources and to formalize spatial elements of land rights and rights allocations
Local land use schemes to be negotiated
Rural Setlements
Rural settlements across the district
Primarily residential and livelihood subsistence function
Some provision of limited social goods and services
Basic level of service extension
Local planning to maximize use of resources
Local land use schemes to be negotiated
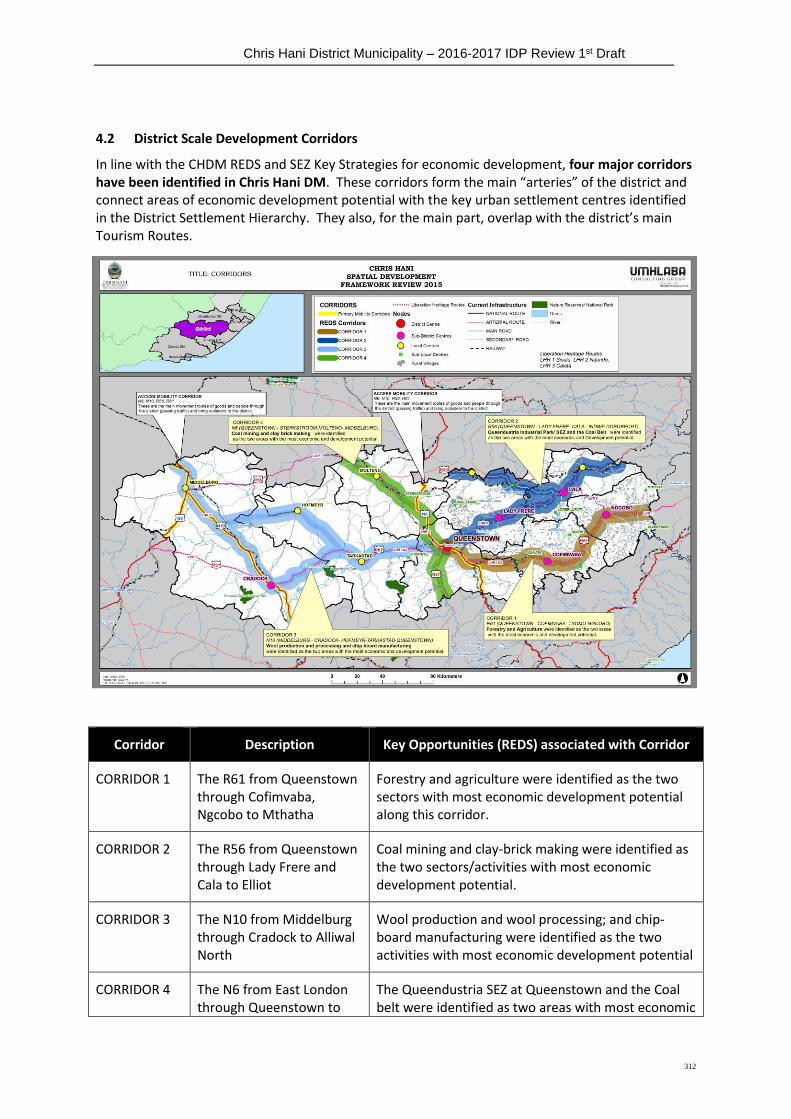
Chris Hani District Municipality – 2016-2017 IDP Review 1st Draft
312
4.2 District Scale Development Corridors
In line with the CHDM REDS and SEZ Key Strategies for economic development, four major corridors have been identified in Chris Hani DM. These corridors form the main “arteries” of the district and connect areas of economic development potential with the key urban settlement centres identified in the District Settlement Hierarchy. They also, for the main part, overlap with the district’s main Tourism Routes.
Corridor Description Key Opportunities (REDS) associated with Corridor
CORRIDOR 1 The R61 from Queenstown through Cofimvaba, Ngcobo to Mthatha
Forestry and agriculture were identified as the two sectors with most economic development potential along this corridor.
CORRIDOR 2 The R56 from Queenstown through Lady Frere and Cala to Elliot
Coal mining and clay-brick making were identified as the two sectors/activities with most economic development potential.
CORRIDOR 3 The N10 from Middelburg through Cradock to Alliwal North
Wool production and wool processing; and chip-board manufacturing were identified as the two activities with most economic development potential
CORRIDOR 4 The N6 from East London through Queenstown to
The Queendustria SEZ at Queenstown and the Coal belt were identified as two areas with most economic
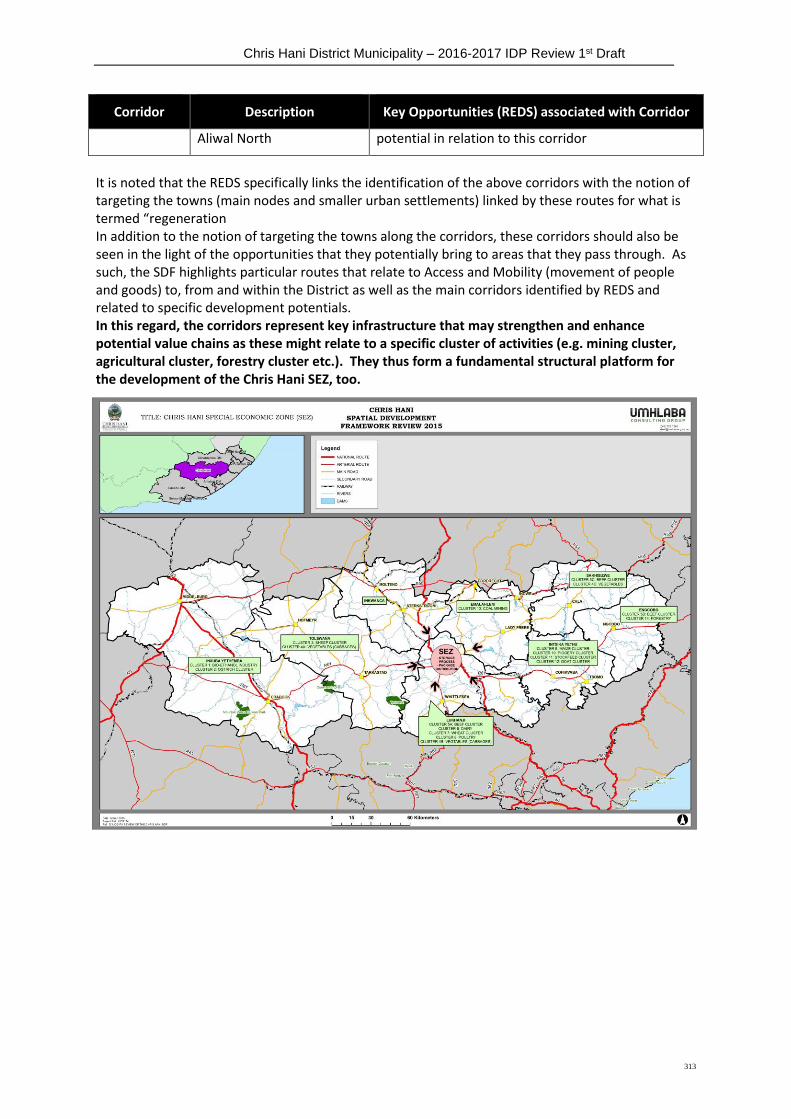
Chris Hani District Municipality – 2016-2017 IDP Review 1st Draft
313
Corridor Description Key Opportunities (REDS) associated with Corridor
Aliwal North potential in relation to this corridor
It is noted that the REDS specifically links the identification of the above corridors with the notion of targeting the towns (main nodes and smaller urban settlements) linked by these routes for what is termed “regeneration In addition to the notion of targeting the towns along the corridors, these corridors should also be seen in the light of the opportunities that they potentially bring to areas that they pass through. As such, the SDF highlights particular routes that relate to Access and Mobility (movement of people and goods) to, from and within the District as well as the main corridors identified by REDS and related to specific development potentials. In this regard, the corridors represent key infrastructure that may strengthen and enhance potential value chains as these might relate to a specific cluster of activities (e.g. mining cluster, agricultural cluster, forestry cluster etc.). They thus form a fundamental structural platform for the development of the Chris Hani SEZ, too.

Chris Hani District Municipality – 2016-2017 IDP Review 1st Draft
314
4.3 District-Scale Special Development Areas
In line with the approach of attempting to direct development according to the Guidelines of the National Spatial Development Perspective, the SDF Review has extended the identification of Special Development Areas in Chris Hani Municipality and has focused on the following categories of SDA:
1. Areas of Local Economic Development Potential
2. Areas of Priority Basic Needs
3. Land Reform & Settlement Zones
Special Development Areas Description
1. Areas of Local Economic Development Potential
Agricultural and Forestry Sectors
Tourism Sector
Manufacturing, Industry Mining and Renewable Energy Sectors
SDAs that focus more specifically on defining spatial areas where certain forms of development potential have been identified, either through previous planning exercises, or through the REDS adopted by the CHDM
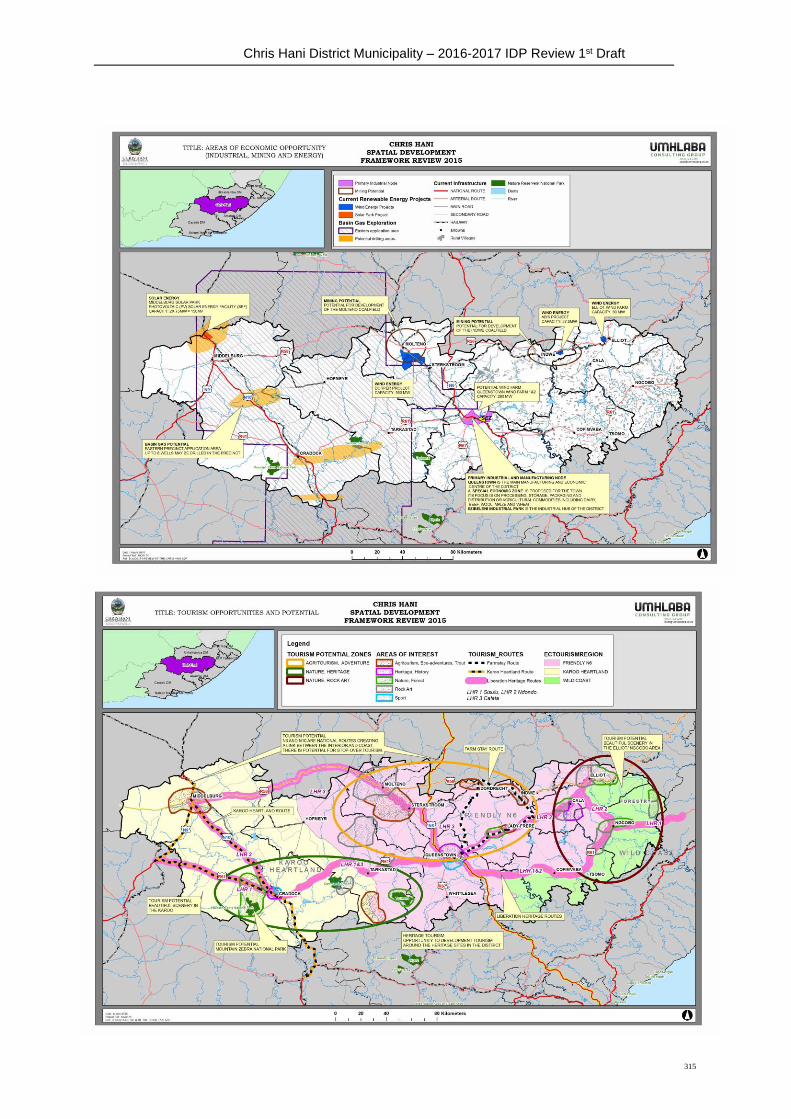
Chris Hani District Municipality – 2016-2017 IDP Review 1st Draft
315
Special Development Areas Description
2. Areas of Priority Basic Needs Areas of greatest need are defined as those areas with the lowest income per capita income levels and worst-off settlement areas (which are, effectively, the rural settlements in the former Ciskei and Transkei).
These SDAs require priority basic needs intervention and strategic proposals to improve the level of well-being of communities in these areas (poverty alleviation programs and basic infrastructure investment).
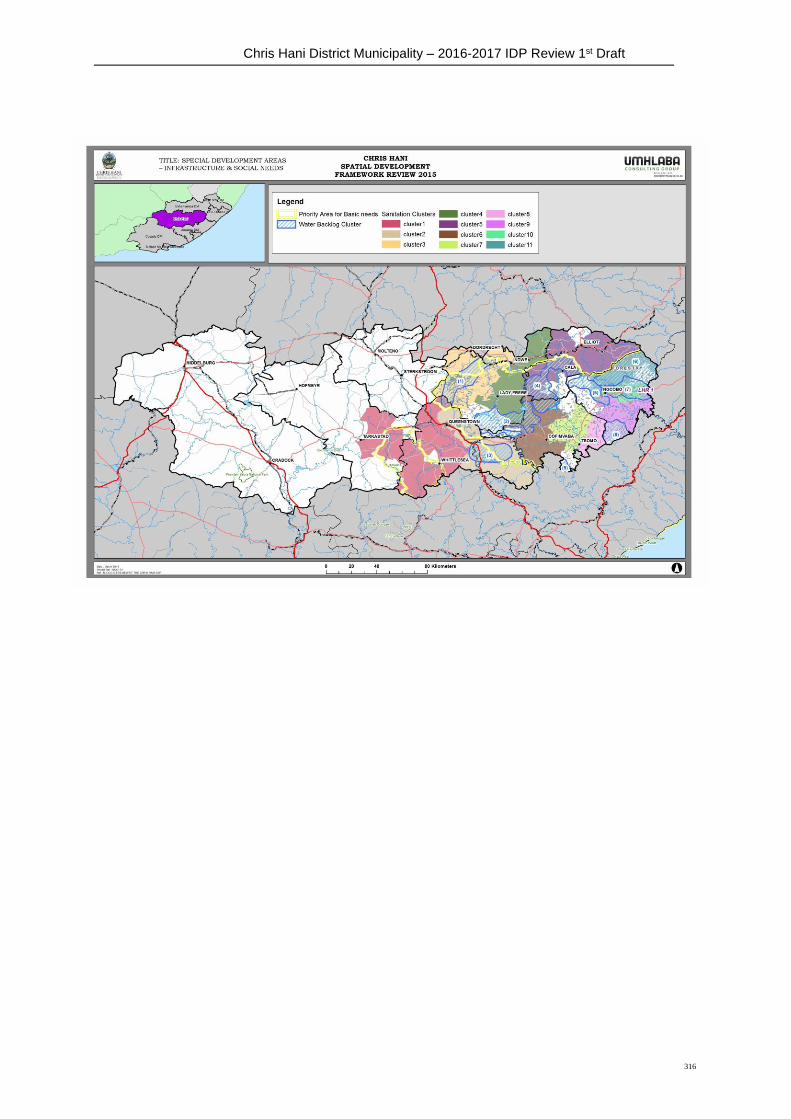
Chris Hani District Municipality – 2016-2017 IDP Review 1st Draft
316
Chris Hani District Municipality – 2016-2017 IDP Review 1st Draft
317
Special Development Areas Description
3. Land Reform and Settlement Zones
Land Reform & Settlement Zones are areas identified in the course of a participatory process with LMs. These Zones reflected areas that are identified as requiring specific forms of planning and development interventions in the interests of furthering land and agrarian reform and managed settlement development processes.
In addition, the Area Based Plan for Land Reform in Chris Hani District also endorsed these Zones and added a conceptual spatial proposal relating to land located close to identified urban centres and along roads leading to/from such centres, which was to the effect that the area so defined is to be seen as an area of greater potential for the development of small-scale farming enterprises and schemes to train up emerging farmers for future participation in the land redistribution programme.
4.4 Managing the Environment & Climate Change
The final structural component of the overall district SDF relates to the priority of managing the environmental assets and resources of the district to promote sustainability and spatial resilience in the face of land development pressures and the changes being wrought by climate change. Key elements of the district Environmental Framework are identified as follows: -: -
The area along the Great Kei River and its tributaries from the Xonxa and Lubisi Dams southwards consists of important valley thicket vegetation. The area north of Ngcobo contains pockets of aframontaine forests. Both these areas are important natural areas, which should be protected.
The formal protected area network is relatively extensive with the Mountain Zebra National Park (SANP) and the Commando Drift and Tsolwana provincial reserves
Formally protected water sources include a number of large water catchments, including the dams: Grassridge, Lake Arthur, Commando Drift, Xonxa, Lubisi and Ncora.
From a natural resource perspective, the eastern part of Chris Hani District Municipality, the most deprived area within the municipality, has the most potential for agriculture and forestry because of good soils and a relatively high rainfall specifically with regards to:
o Dryland agriculture for maize production
o Irrigation and agriculture from the Xonxa Dam, Lubisi Dam and Ncora Dam
o Forestry in the mountainous areas north of Engcobo
The western part of the Chris Hani District Municipality is the best endowed with tourism resources such as:
o Cradock and Middelburg form part of the Karoo Heartland Tourism route whilst Queenstown forms part of the Friendly N6 Tourism Route.
o Abundant heritage resources in Queenstown, Cradock, Sterkstroom, Molteno, Middelburg and Hofmeyr along the east-west routes from Queenstown namely R61 and R56.
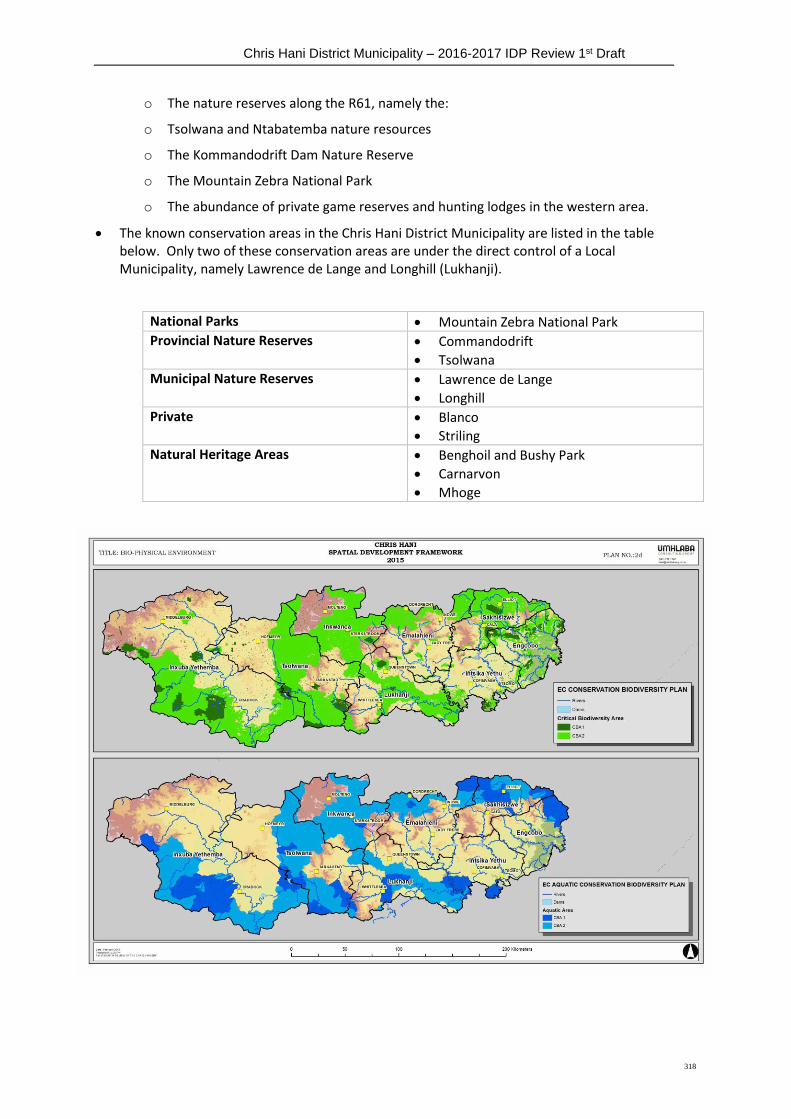
Chris Hani District Municipality – 2016-2017 IDP Review 1st Draft
318
o The nature reserves along the R61, namely the:
o Tsolwana and Ntabatemba nature resources
o The Kommandodrift Dam Nature Reserve
o The Mountain Zebra National Park
o The abundance of private game reserves and hunting lodges in the western area.
The known conservation areas in the Chris Hani District Municipality are listed in the table below. Only two of these conservation areas are under the direct control of a Local Municipality, namely Lawrence de Lange and Longhill (Lukhanji).
National Parks Mountain Zebra National Park
Provincial Nature Reserves Commandodrift
Tsolwana
Municipal Nature Reserves Lawrence de Lange
Longhill
Private Blanco
Striling
Natural Heritage Areas Benghoil and Bushy Park
Carnarvon
Mhoge
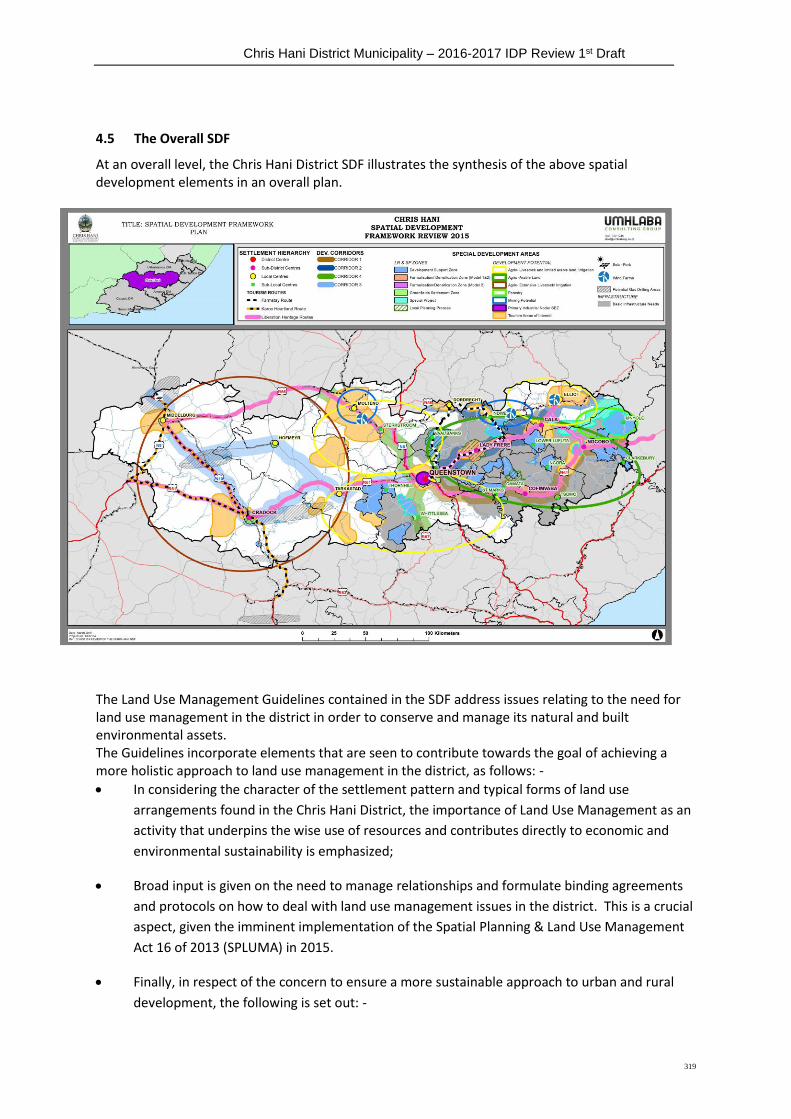
Chris Hani District Municipality – 2016-2017 IDP Review 1st Draft
319
4.5 The Overall SDF
At an overall level, the Chris Hani District SDF illustrates the synthesis of the above spatial development elements in an overall plan.
5 Land Use Management Guidelines
The Land Use Management Guidelines contained in the SDF address issues relating to the need for land use management in the district in order to conserve and manage its natural and built environmental assets. The Guidelines incorporate elements that are seen to contribute towards the goal of achieving a more holistic approach to land use management in the district, as follows: -
In considering the character of the settlement pattern and typical forms of land use
arrangements found in the Chris Hani District, the importance of Land Use Management as an
activity that underpins the wise use of resources and contributes directly to economic and
environmental sustainability is emphasized;
Broad input is given on the need to manage relationships and formulate binding agreements
and protocols on how to deal with land use management issues in the district. This is a crucial
aspect, given the imminent implementation of the Spatial Planning & Land Use Management
Act 16 of 2013 (SPLUMA) in 2015.
Finally, in respect of the concern to ensure a more sustainable approach to urban and rural
development, the following is set out: -
Chris Hani District Municipality – 2016-2017 IDP Review 1st Draft
320
o A proposed framework for categorizing different types of settlement and
associating these with typical Levels of Service (LOS) provision is provided, based
on previous work done for Land Reform & Settlement Plans compiled for the
Amathole and Chris Hani District Municipalities, 2005;
o Based on the guidelines suggested by the Eastern Cape Biodiversity Conservation
Plan, generic land use objectives are incorporated in relation to the different land
management classes identified in the Plan; and
o In relation to the hierarchy of settlement set out above, a broad set of guidelines is
proposed.
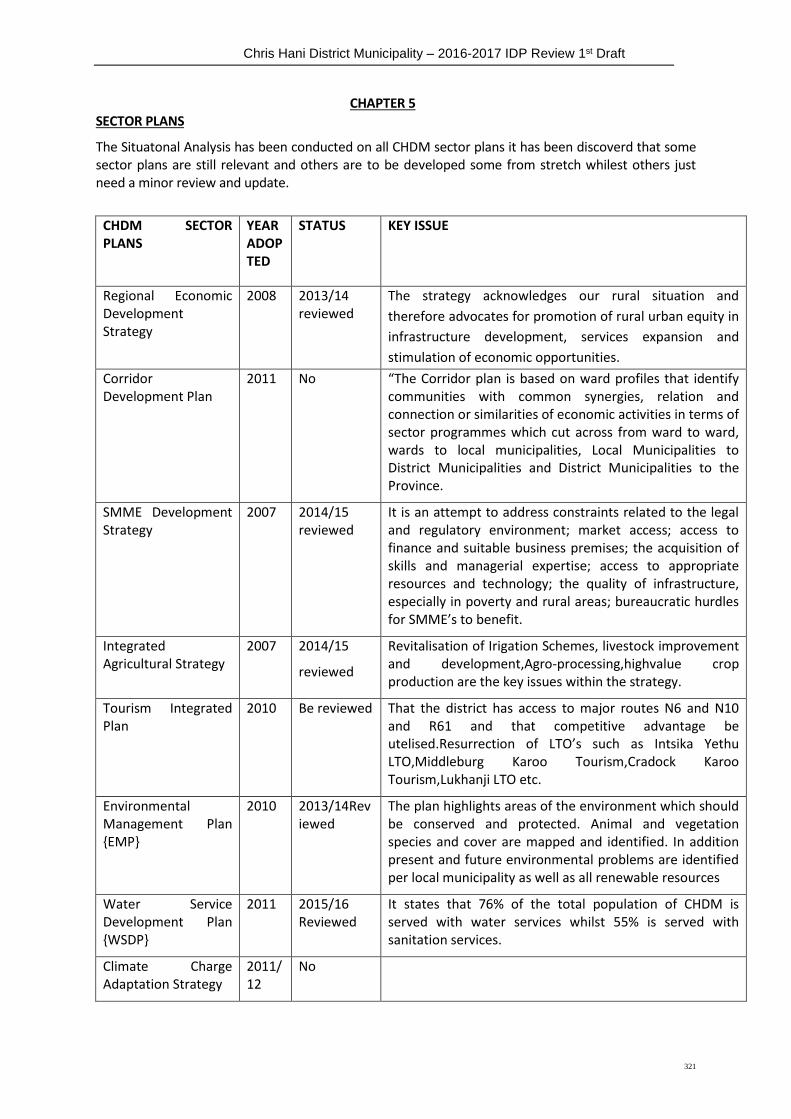
Chris Hani District Municipality – 2016-2017 IDP Review 1st Draft
321
CHAPTER 5 SECTOR PLANS
The Situatonal Analysis has been conducted on all CHDM sector plans it has been discoverd that some sector plans are still relevant and others are to be developed some from stretch whilest others just need a minor review and update.
CHDM SECTOR PLANS
YEAR ADOPTED
STATUS KEY ISSUE
Regional Economic Development Strategy
2008
2013/14 reviewed
The strategy acknowledges our rural situation and
therefore advocates for promotion of rural urban equity in
infrastructure development, services expansion and
stimulation of economic opportunities.
Corridor Development Plan
2011 No “The Corridor plan is based on ward profiles that identify communities with common synergies, relation and connection or similarities of economic activities in terms of sector programmes which cut across from ward to ward, wards to local municipalities, Local Municipalities to District Municipalities and District Municipalities to the Province.
SMME Development Strategy
2007 2014/15 reviewed
It is an attempt to address constraints related to the legal and regulatory environment; market access; access to finance and suitable business premises; the acquisition of skills and managerial expertise; access to appropriate resources and technology; the quality of infrastructure, especially in poverty and rural areas; bureaucratic hurdles for SMME’s to benefit.
Integrated Agricultural Strategy
2007 2014/15
reviewed
Revitalisation of Irigation Schemes, livestock improvement and development,Agro-processing,highvalue crop production are the key issues within the strategy.
Tourism Integrated Plan
2010 Be reviewed That the district has access to major routes N6 and N10 and R61 and that competitive advantage be utelised.Resurrection of LTO’s such as Intsika Yethu LTO,Middleburg Karoo Tourism,Cradock Karoo Tourism,Lukhanji LTO etc.
Environmental Management Plan {EMP}
2010 2013/14Reviewed
The plan highlights areas of the environment which should be conserved and protected. Animal and vegetation species and cover are mapped and identified. In addition present and future environmental problems are identified per local municipality as well as all renewable resources
Water Service Development Plan {WSDP}
2011 2015/16 Reviewed
It states that 76% of the total population of CHDM is served with water services whilst 55% is served with sanitation services.
Climate Charge Adaptation Strategy
2011/12
No
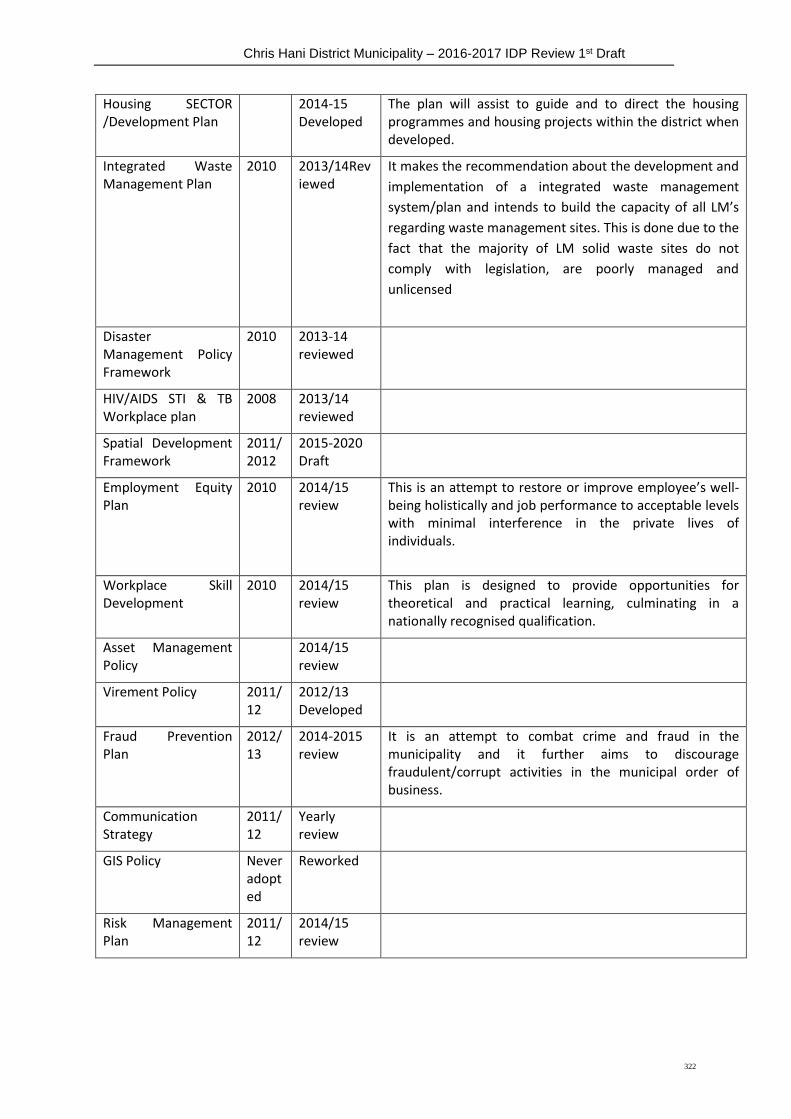
Chris Hani District Municipality – 2016-2017 IDP Review 1st Draft
322
Housing SECTOR /Development Plan
2014-15 Developed
The plan will assist to guide and to direct the housing programmes and housing projects within the district when developed.
Integrated Waste Management Plan
2010 2013/14Reviewed
It makes the recommendation about the development and
implementation of a integrated waste management
system/plan and intends to build the capacity of all LM’s
regarding waste management sites. This is done due to the
fact that the majority of LM solid waste sites do not
comply with legislation, are poorly managed and
unlicensed
Disaster Management Policy Framework
2010 2013-14 reviewed
HIV/AIDS STI & TB Workplace plan
2008 2013/14 reviewed
Spatial Development Framework
2011/2012
2015-2020 Draft
Employment Equity Plan
2010 2014/15 review
This is an attempt to restore or improve employee’s well-being holistically and job performance to acceptable levels with minimal interference in the private lives of individuals.
Workplace Skill Development
2010 2014/15 review
This plan is designed to provide opportunities for theoretical and practical learning, culminating in a nationally recognised qualification.
Asset Management Policy
2014/15 review
Virement Policy 2011/12
2012/13 Developed
Fraud Prevention Plan
2012/13
2014-2015 review
It is an attempt to combat crime and fraud in the municipality and it further aims to discourage fraudulent/corrupt activities in the municipal order of business.
Communication Strategy
2011/12
Yearly review
GIS Policy Never adopted
Reworked
Risk Management Plan
2011/12
2014/15 review
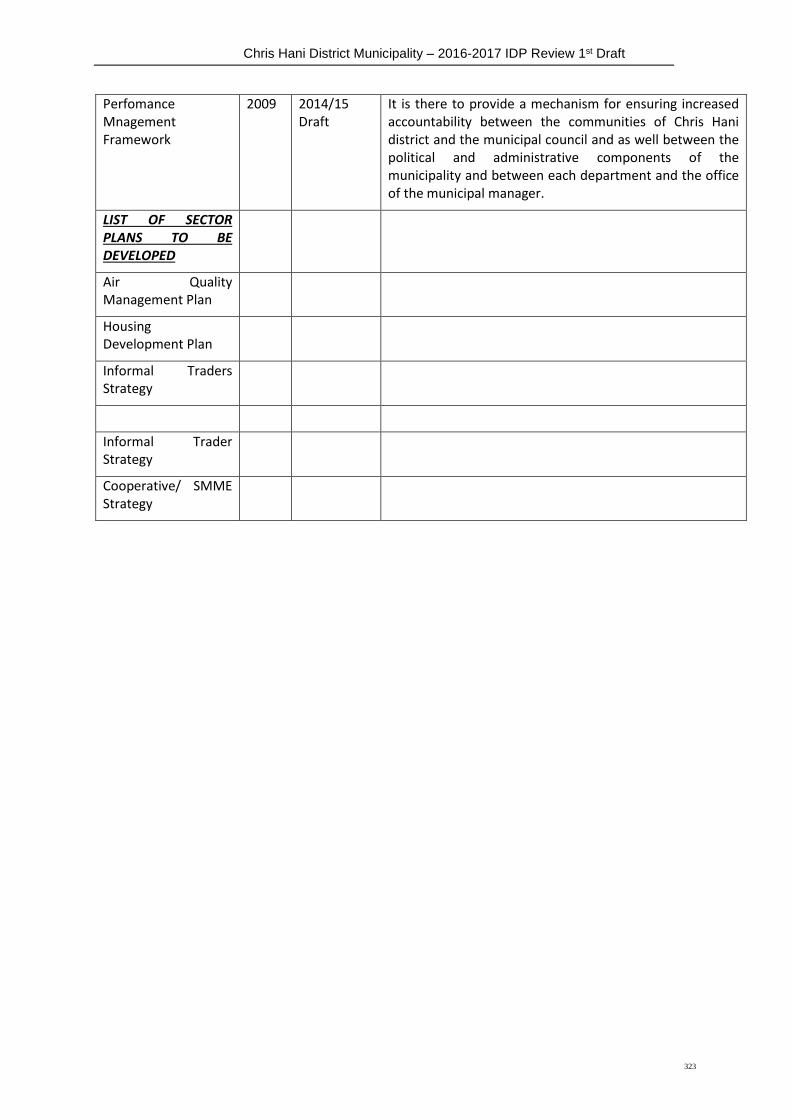
Chris Hani District Municipality – 2016-2017 IDP Review 1st Draft
323
Perfomance Mnagement Framework
2009 2014/15 Draft
It is there to provide a mechanism for ensuring increased accountability between the communities of Chris Hani district and the municipal council and as well between the political and administrative components of the municipality and between each department and the office of the municipal manager.
LIST OF SECTOR PLANS TO BE DEVELOPED
Air Quality Management Plan
Housing Development Plan
Informal Traders Strategy
Informal Trader Strategy
Cooperative/ SMME Strategy
Chris Hani District Municipality – 2016-2017 IDP Review 1st Draft
324
CHAPTER 6
CHDM FINANCIAL PLAN
Chris Hani District Municipality prepared an IDP/Budget/PMS process plan action programs for the
2016-2019 Medium Term Revenue and Expenditure Framework (MTREF) which started on 25 July
2016. The Minister of Finance tabled the Division of Revenue Bill and subsequent to this, the budget
allocations were published for all spheres of government.
The purpose of this document is to outline the key financial considerations considered in the budget
allocations for the 2016 to 2019 MTREF. Key assumptions in the municipality’s budget prioritization
process are identified as well as the key areas of applicability. They are as follows:
1. Population statistics and household services as per Census 2011.
2. Own revenue projections according to the tariff structure.
3. Free Basic Services
4. Inflationary trends
5. Budget allocations in terms of the Division of Revenue Bill, 2016
The financial plan is to create the medium-term strategic financial framework for allocating
resources through the municipal budgeting process and to ensure the financial viability and
sustainability of the Chris Hani district municipality’s investments and operations. Other important
reasons for developing the financial plan are as follows:
• to ensure a close planning and budgeting link;
• to inform municipal budgeting over tier;
• to facilitate inter-governmental alignment with regard to capital requirements and sources of
funding;
• assess financial management arrangement and financial strategy; and
• To outline revenue and expenditure forecast.
The needs and demands of the various communities far exceed the resources available to the
municipality. Consequently it is necessary to weigh the competing demands and to prioritize
expenditure. In such a process there are always trade-offs that lead both political and senior
management to focus on the poorer areas where the greatest need exists. Without proper financial
planning, sustainability and sound financial management will not be achieved. Given the nature of
Integrated Development Planning, it will be necessary to revise and update financial strategies on a
continuous basis. This will ensure realistic monitoring and the implementation of pro-active
adjustments to the status quo.
The draft budget recognises the funding streams of Council that have remained the same as
in the previous budget year being mainly service charges for water and sanitation services
and grant funding from both national and provincial departments. Other revenue in addition
Chris Hani District Municipality – 2016-2017 IDP Review 1st Draft
325
to the above is investment revenue and sundry revenue that is inclusive of input VAT from
conditional grants expenditure. The input VAT from conditional grants is recognised as
municipalities were advised to do so by MFMA Circular 48 of 2009 and the subsequent
National Treasury budget related circulars. The expenditure of the municipality is mainly as
a result of employee related costs and allowances, expenditure on operating and capital
grants, transfers and grants to the municipal entity and adopted schools, repairs &
maintenance and other operating expenditure that includes general expenses, debt
impairment and depreciation on property plant and equipment and all these expenditure
items are reflected in Table A4 of Schedule A.
The draft budget for 2016/2017 MTREF budget year, started with a process of looking at the
audited outcomes for 2014/15, mid-year performance and the budget adjustment that was
tabled in Council on 24 February 2016. The issues raised in the departmental and
institutional strategic sessions were also taken into account during the preparation of this
budget as they had a direct influence or bearing to the 2016/17 IDP. The allowable increases
(parameters) of 6,6%, 6,2% and 5.9% for the current budget year and the two outer years as
determined by National Treasury were taken into account when crafting this budget.
The salaries budget recognises current salary levels and potential increases for cost of
leaving adjustment and general annual increase that will be effected as from July 2016 and
the filling of prioritised vacant funded posts in the organisational structure. The collective
agreement has allowed for a 7% increase in 2015/16 and in 2016/17 and 2017/18
respectively the department has allowed for an average increase on the CPI plus 1. Though
SALGA and National Treasury had made the later determination on salary increases, the
municipality has allowed for a 10% increase in salaries to cater for prioritised positions on
the organisational structure that was approved by Council in December and the integration
of personnel that came from municipalities during water take over. All Directorates were
requested to provide further inputs to the operating budget based on their needs and also
taking into account the constraints presented by the limited revenue sources of the
municipality. Engagements were made with departments, technical budget steering
committee and the Budget Steering Committee that is formed in line with Regulation 4 of
the MBRR. Provincial allocations (including agency functions) made / expected to the district
were bot confirmed by the respective departments for current and the outer budget years.
The outcome of the draft budget process was a non-cash deficit of R91,8 m after the
contribution to Asset Finance Reserve amounting to R129,5m, which will be funded from
the accumulated surplus. The municipality has however managed to raise an amount of
R80m from its reserves to fund the expenditure that relates to CHDM Village/Office Park.
The reserve has been accumulated through the input VAT that was received from SARS as a
refund from Conditional Grants Revenue. The non- cash deficit is however reflecting a
reducing trend when compared to the second adjustment budget.
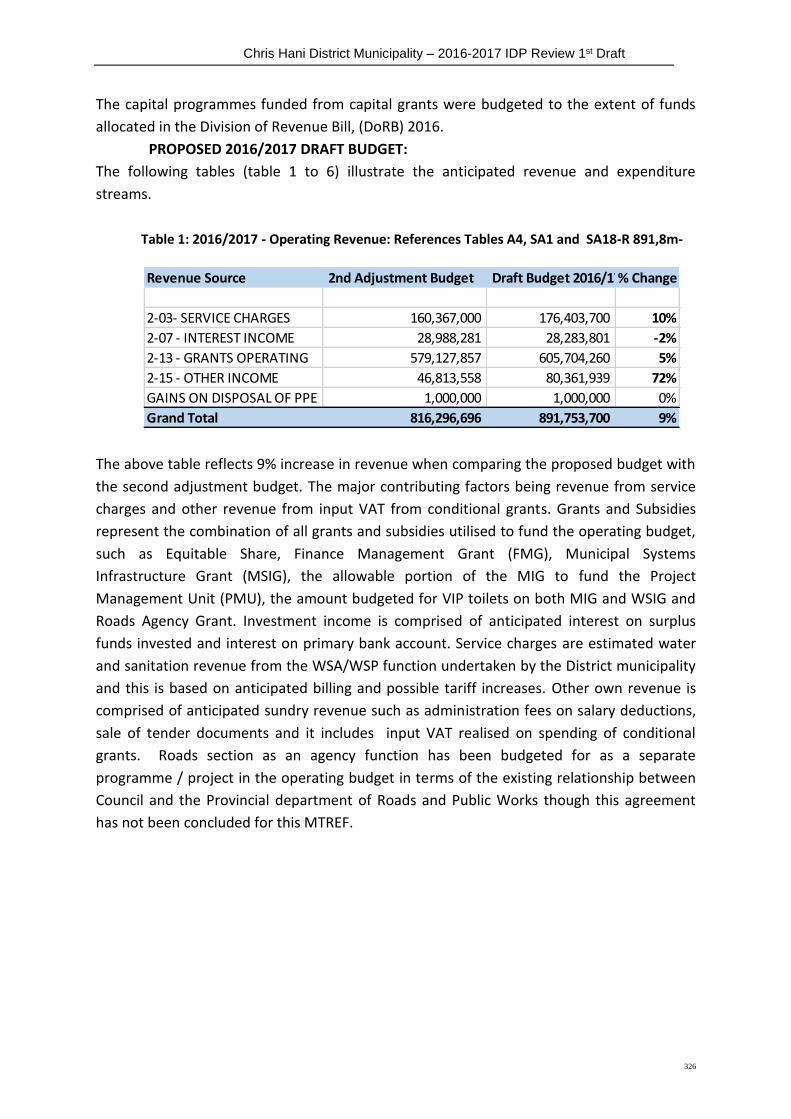
Chris Hani District Municipality – 2016-2017 IDP Review 1st Draft
326
The capital programmes funded from capital grants were budgeted to the extent of funds
allocated in the Division of Revenue Bill, (DoRB) 2016.
PROPOSED 2016/2017 DRAFT BUDGET:
The following tables (table 1 to 6) illustrate the anticipated revenue and expenditure
streams.
Table 1: 2016/2017 - Operating Revenue: References Tables A4, SA1 and SA18-R 891,8m-
Revenue Source 2nd Adjustment Budget Draft Budget 2016/17% Change
2-03- SERVICE CHARGES 160,367,000 176,403,700 10%
2-07 - INTEREST INCOME 28,988,281 28,283,801 -2%
2-13 - GRANTS OPERATING 579,127,857 605,704,260 5%
2-15 - OTHER INCOME 46,813,558 80,361,939 72%
GAINS ON DISPOSAL OF PPE 1,000,000 1,000,000 0%
Grand Total 816,296,696 891,753,700 9%
The above table reflects 9% increase in revenue when comparing the proposed budget with
the second adjustment budget. The major contributing factors being revenue from service
charges and other revenue from input VAT from conditional grants. Grants and Subsidies
represent the combination of all grants and subsidies utilised to fund the operating budget,
such as Equitable Share, Finance Management Grant (FMG), Municipal Systems
Infrastructure Grant (MSIG), the allowable portion of the MIG to fund the Project
Management Unit (PMU), the amount budgeted for VIP toilets on both MIG and WSIG and
Roads Agency Grant. Investment income is comprised of anticipated interest on surplus
funds invested and interest on primary bank account. Service charges are estimated water
and sanitation revenue from the WSA/WSP function undertaken by the District municipality
and this is based on anticipated billing and possible tariff increases. Other own revenue is
comprised of anticipated sundry revenue such as administration fees on salary deductions,
sale of tender documents and it includes input VAT realised on spending of conditional
grants. Roads section as an agency function has been budgeted for as a separate
programme / project in the operating budget in terms of the existing relationship between
Council and the Provincial department of Roads and Public Works though this agreement
has not been concluded for this MTREF.
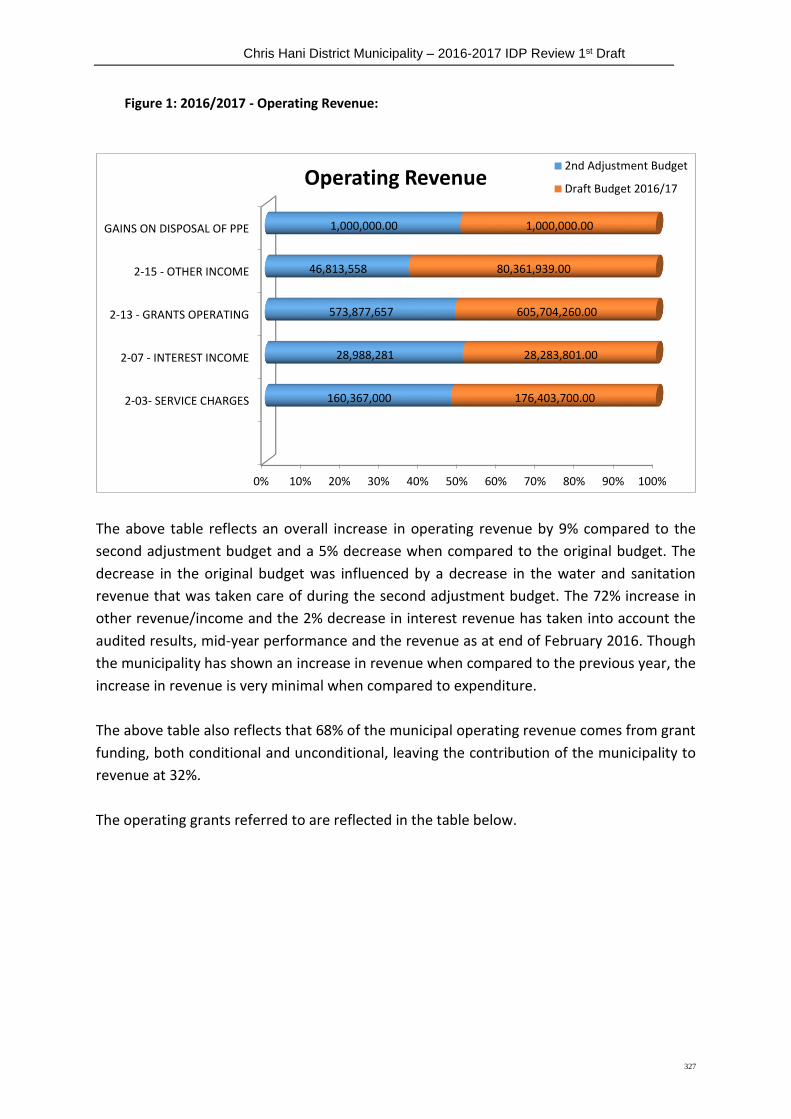
Chris Hani District Municipality – 2016-2017 IDP Review 1st Draft
327
Figure 1: 2016/2017 - Operating Revenue:
0% 10% 20% 30% 40% 50% 60% 70% 80% 90% 100%
2-03- SERVICE CHARGES
2-07 - INTEREST INCOME
2-13 - GRANTS OPERATING
2-15 - OTHER INCOME
GAINS ON DISPOSAL OF PPE
160,367,000
28,988,281
573,877,657
46,813,558
1,000,000.00
176,403,700.00
28,283,801.00
605,704,260.00
80,361,939.00
1,000,000.00
Operating Revenue2nd Adjustment Budget
Draft Budget 2016/17
The above table reflects an overall increase in operating revenue by 9% compared to the
second adjustment budget and a 5% decrease when compared to the original budget. The
decrease in the original budget was influenced by a decrease in the water and sanitation
revenue that was taken care of during the second adjustment budget. The 72% increase in
other revenue/income and the 2% decrease in interest revenue has taken into account the
audited results, mid-year performance and the revenue as at end of February 2016. Though
the municipality has shown an increase in revenue when compared to the previous year, the
increase in revenue is very minimal when compared to expenditure.
The above table also reflects that 68% of the municipal operating revenue comes from grant
funding, both conditional and unconditional, leaving the contribution of the municipality to
revenue at 32%.
The operating grants referred to are reflected in the table below.

Chris Hani District Municipality – 2016-2017 IDP Review 1st Draft
328
OPERATING GRANTS 2016/17 MTREF
Details of Grant Revenue 2nd Adjustment BudgetDraft Budget 2016/17% Change
EQUITABLE SHARE 446,759,000 485,308,000 9%
FINANCIAL MANAGEMENT GRANT 1,500,000 1,500,000 0%
MUNICIPAL SYSTEM IMPROVEMENT GRANT (MSIG) 940,000 1,040,000 11%
EXPANDED PUBLIC WORKS PROGRAMME (EPWP) 5,961,000 7,797,000 31%
RURAL ROAD ASSET MANAGEMENT (RAMS) 3,016,000 3,097,000 3%
MIIG OPERATIONAL 84,401,657 71,162,260 -16%
ROADS AND PUBLIC WORKS 27,800,000 27,800,000 0%
PROV: DEDEAT 4,000,000 4,000,000 0%
RHIG/WSIG 4,000,000 4,000,000 0%
TOTAL OPERATING GRANTS 542,577,657 605,704,260 12%
Table 2: 2016/2017 Draft – Operating expenditure: Table A4 AND
SA1
Expenditure Classification 2nd Adjustment Budget Draft Budget 2016/17 % Change
1-31 - EMPLOYEE RELATED COSTS - REMUNERATION 234,205,275 270,195,110 15%
1-32 - EMPLOYEE RELATED COSTS - SOCIAL CONTRIBU 36,650,142 41,815,496 14%
1-33 - REMUNERATION OF COUNCILLORS 10,866,939 11,953,633 10%
1-36 - DEPRECIATION 115,434,000 130,000,000 13%
1-37 - REPAIRS AND MAINTENANCE 58,354,204 60,687,000 4%
1-39 - BULK PURCHASES 16,500,000 17,049,855 3%
1-40 - CONTRACTED SERVICES 12,271,011 16,000,000 30%
1-41 - GRANTS AND SUBSIDIES PAID: OPERATIONAL 18,040,000 18,540,000 3%
1-43 - GENERAL EXPENSES 443,586,938 417,822,236 -6%
1-44 - DEBT IMPAIRMENT 347,065,000 196,237,000 -43%
1-45 - INTEREST ON OVERDUE ACCOUNTS 397,958 - -100%
1-46 - INDIGENT SUBSIDY 21,915,360 32,142,528 47%
Grand Total 1,315,286,826 1,212,442,858 -8%
The table above reflects 8% decrease in operating expenditure when compared with the
second adjustment budget and a 37% increase when compared to the original budget.
The following expenditure items increased:
Employee related costs;
Depreciation and Asset Impairment;
Repairs and Maintenance;
Bulk Purchases;
Contracted Services; and
Indigent Subsidy.
The following expenditure items have however decreased:
General Expenses; and
Debt Impairment.
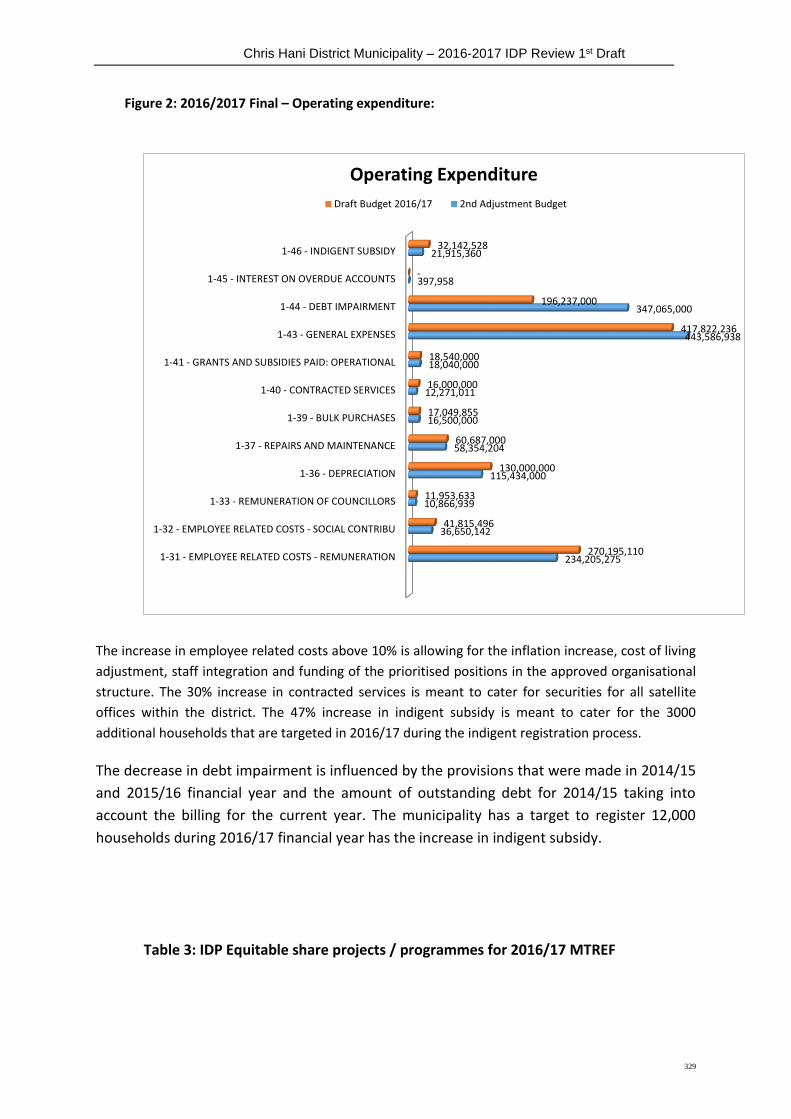
Chris Hani District Municipality – 2016-2017 IDP Review 1st Draft
329
Figure 2: 2016/2017 Final – Operating expenditure:
1-31 - EMPLOYEE RELATED COSTS - REMUNERATION
1-32 - EMPLOYEE RELATED COSTS - SOCIAL CONTRIBU
1-33 - REMUNERATION OF COUNCILLORS
1-36 - DEPRECIATION
1-37 - REPAIRS AND MAINTENANCE
1-39 - BULK PURCHASES
1-40 - CONTRACTED SERVICES
1-41 - GRANTS AND SUBSIDIES PAID: OPERATIONAL
1-43 - GENERAL EXPENSES
1-44 - DEBT IMPAIRMENT
1-45 - INTEREST ON OVERDUE ACCOUNTS
1-46 - INDIGENT SUBSIDY
234,205,275
36,650,142
10,866,939
115,434,000
58,354,204
16,500,000
12,271,011
18,040,000
443,586,938
347,065,000
397,958
21,915,360
270,195,110
41,815,496
11,953,633
130,000,000
60,687,000
17,049,855
16,000,000
18,540,000
417,822,236
196,237,000
-
32,142,528
Operating Expenditure
Draft Budget 2016/17 2nd Adjustment Budget
The increase in employee related costs above 10% is allowing for the inflation increase, cost of living
adjustment, staff integration and funding of the prioritised positions in the approved organisational
structure. The 30% increase in contracted services is meant to cater for securities for all satellite
offices within the district. The 47% increase in indigent subsidy is meant to cater for the 3000
additional households that are targeted in 2016/17 during the indigent registration process.
The decrease in debt impairment is influenced by the provisions that were made in 2014/15
and 2015/16 financial year and the amount of outstanding debt for 2014/15 taking into
account the billing for the current year. The municipality has a target to register 12,000
households during 2016/17 financial year has the increase in indigent subsidy.
Table 3: IDP Equitable share projects / programmes for 2016/17 MTREF

Chris Hani District Municipality – 2016-2017 IDP Review 1st Draft
330
Department 2nd Adjustment Budget Draft Budget 2016/17 Increase/ Decrease
COMMUNITY SERVICES 19,900,000 15,790,000 -21%
CORPORATE SERVICES 18,021,548 18,000,000 0%
IPED 50,957,734 48,400,000 -5%
MUNICIPAL MANAGER 7,421,000 5,750,000 -23%
BUDGET & TREASURY - 2,000,000 100%
TECHNICAL SERVICES 2,354,533 2,000,000 -15%
Grand Total 120,759,321.00 91,940,000.00 -24%
Table 3 above reflects a 24% decrease in equitable share programmes when comparing the
second adjustment with the proposed draft budget and 1% increase when compared to the
original budget. There is no significant increase in these programmes due to municipal
revenue that is currently not permitting. The municipality has to survive within its means
hence this expenditure item was not increased by a higher amount when compared to the
original budget.
Figure 3: 2016/2017 IDP/Equitable Share Programmes:
COMMUNITY SERVICES
CORPORATE SERVICES
IPED
MUNICIPAL MANAGER
BUDGET & TREASURY
TECHNICAL SERVICES
19,900,000
18,021,548
50,957,734
7,421,000
-
2,354,533
15,790,000
18,000,000
48,400,000
5,750,000
2,000,000
2,000,000
IDP Projects
Draft Budget 2016/17 2nd Adjustment Budget
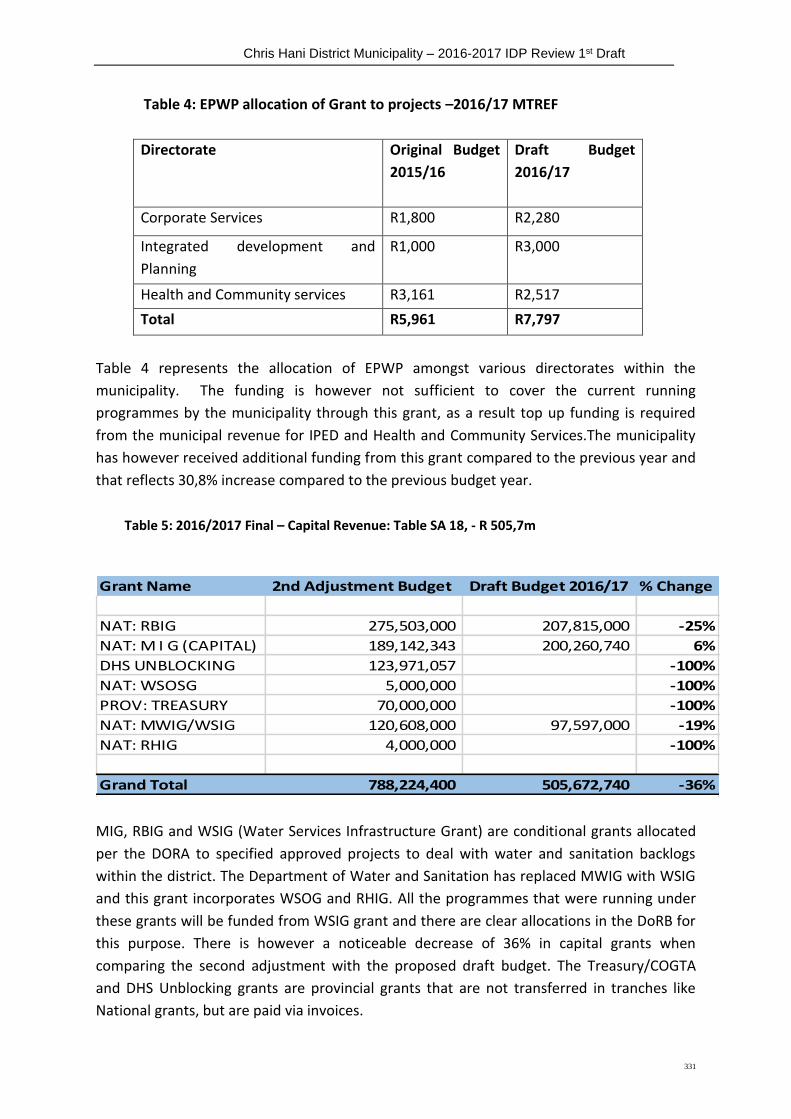
Chris Hani District Municipality – 2016-2017 IDP Review 1st Draft
331
Table 4: EPWP allocation of Grant to projects –2016/17 MTREF
Directorate Original Budget
2015/16
Draft Budget
2016/17
Corporate Services R1,800 R2,280
Integrated development and
Planning
R1,000 R3,000
Health and Community services R3,161 R2,517
Total R5,961 R7,797
Table 4 represents the allocation of EPWP amongst various directorates within the
municipality. The funding is however not sufficient to cover the current running
programmes by the municipality through this grant, as a result top up funding is required
from the municipal revenue for IPED and Health and Community Services.The municipality
has however received additional funding from this grant compared to the previous year and
that reflects 30,8% increase compared to the previous budget year.
Table 5: 2016/2017 Final – Capital Revenue: Table SA 18, - R 505,7m
Grant Name 2nd Adjustment Budget Draft Budget 2016/17 % Change
NAT: RBIG 275,503,000 207,815,000 -25%
NAT: M I G (CAPITAL) 189,142,343 200,260,740 6%
DHS UNBLOCKING 123,971,057 -100%
NAT: WSOSG 5,000,000 -100%
PROV: TREASURY 70,000,000 -100%
NAT: MWIG/WSIG 120,608,000 97,597,000 -19%
NAT: RHIG 4,000,000 -100%
Grand Total 788,224,400 505,672,740 -36%
MIG, RBIG and WSIG (Water Services Infrastructure Grant) are conditional grants allocated
per the DORA to specified approved projects to deal with water and sanitation backlogs
within the district. The Department of Water and Sanitation has replaced MWIG with WSIG
and this grant incorporates WSOG and RHIG. All the programmes that were running under
these grants will be funded from WSIG grant and there are clear allocations in the DoRB for
this purpose. There is however a noticeable decrease of 36% in capital grants when
comparing the second adjustment with the proposed draft budget. The Treasury/COGTA
and DHS Unblocking grants are provincial grants that are not transferred in tranches like
National grants, but are paid via invoices.

Chris Hani District Municipality – 2016-2017 IDP Review 1st Draft
332
They are not reflected on the budget as the these are not continuing grants, the balance
that is left at year end would be rolled over in August 2017. Though the municipality is
overcommitted on all its capital grants the allocations have decreased instead of increasing
and that negatively affects the planning and smooth running of the projects by the
municipality.
Figure 4: 2016 / 2017 Draft Budget 2106/17 – Capital Revenue
NAT: RBIG
NAT: M I G (CAPITAL)
DHS UNBLOCKING
NAT: WSOSG
PROV: TREASURY
NAT: MWIG/WSIG
NAT: RHIG
275,503,000
189,142,343
123,971,057
5,000,000
70,000,000
120,608,000
4,000,000
207,815,000.00
200,260,740.00
97,597,000.00
Capital Funding
Draft Budget 2016/17 2nd Adjustment Budget
CAPITAL EXPENDITURE / PROJECTS: Table A5 and SA 18 in R 635m.
Capital Revenue 2nd Adjustment Budget Draft Budget 2016/17 % Change
ASSET FINANCING RESERVE 43,067,000 129,527,050 201%
MUNICIPAL INFRUSTRUCTURE GRANT (MIG) 189,142,343 200,260,740 6%
REGIONAL INFRUSTUCTURE GRANT (RBIG) 275,503,000 207,815,000 -25%
RHIG 4,000,000 - -100%
MWIG 120,608,000 97,597,000 -19%
DHS UNBLOCKING 123,971,057 - -100%
PROVINCIAL TREASURY 70,000,000 - -100%
WATER SERVICES OPER GRANT - REFUBLISHMNT 5,000,000 - -100%
Grand Total 831,291,400 635,199,790 -24%

Chris Hani District Municipality – 2016-2017 IDP Review 1st Draft
333
The capital programmes funded from capital grants were budgeted to the extent of funds
allocated. The high increase in internal funded assets is as a result of CHDM Village/Office
Park that has been provided for at R80m. The above table reflects a decrease in capital
expenditure by 24% when compared to the second adjusted budget.
This is as a result of Treasury/COGTA and DHS Unblocking grants that were provided for
during 2015/16 financial year.

Chris Hani District Municipality – 2016-2017 IDP Review 1st Draft
334

Chris Hani District Municipality – 2016-2017 IDP Review 1st Draft
335
CHDM CAPITAL PROGRAMMES
MIG FUNDED PROJECTS FOR 2016/17 TO 2018/19 FINANCIAL YEARS
Municipalities Projects 2016/17 2017/18 2018/19
Emalahleni Mhlanga Water Supply 9 000 000,00 15 000 000,00 -
Mhlanga & Mgwalana Bulk Water Supply 520 740,50 6 031 846,00 10 000 000,00
Nkolonga, Sikhwanqeni Water Supply 15 000 000,00 4 000 000,00 -
Cluster 4 Sanitation 500 000,00 6 000 000,00 6 288 685,00
Cluster 3 Sanitation 500 000,00 6 000 000,00 6 000 000,00
Dodrecht Water Supply Upgrade 8 000 000,00 - -
Dodrecht Upgrade of Water Treatment Works - - 13 000 000,00
TOTAL 33 520 740,50 37 031 846,00 35 288 685,00
Inkwanca Molteno Sewer Bulk 10 892 592,50 12 243 017,00 15 111 032,00
Upgrade of Molteno Oxidation Ponds 2 000 000,00 2 000 000,00 -
TOTAL 12 892 592,50 14 243 017,00 15 111 032,00
Intsika Yethu Ward 8 Sanitation - 1 669 227,00 15 000 000,00
Cofimvaba Ward 3 Sanitation VIP Toilets 12 000 000,00
Intsika Yethu Sanitation - 1 000 000,00 15 000 000,00
Cofimvaba Bulk Water & Sewer Services 1 000 000,00 15 000 000,00
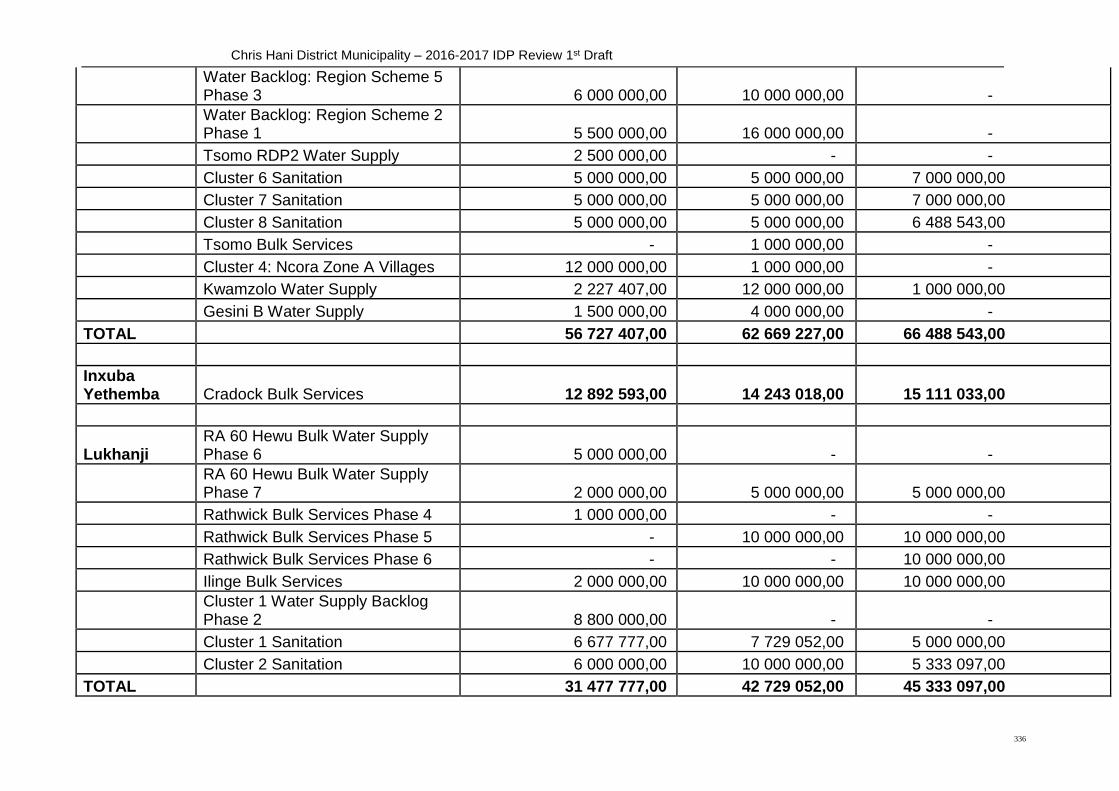
Chris Hani District Municipality – 2016-2017 IDP Review 1st Draft
336
Water Backlog: Region Scheme 5 Phase 3 6 000 000,00 10 000 000,00 -
Water Backlog: Region Scheme 2 Phase 1 5 500 000,00 16 000 000,00 -
Tsomo RDP2 Water Supply 2 500 000,00 - -
Cluster 6 Sanitation 5 000 000,00 5 000 000,00 7 000 000,00
Cluster 7 Sanitation 5 000 000,00 5 000 000,00 7 000 000,00
Cluster 8 Sanitation 5 000 000,00 5 000 000,00 6 488 543,00
Tsomo Bulk Services - 1 000 000,00 -
Cluster 4: Ncora Zone A Villages 12 000 000,00 1 000 000,00 -
Kwamzolo Water Supply 2 227 407,00 12 000 000,00 1 000 000,00
Gesini B Water Supply 1 500 000,00 4 000 000,00 -
TOTAL 56 727 407,00 62 669 227,00 66 488 543,00
Inxuba Yethemba Cradock Bulk Services 12 892 593,00 14 243 018,00 15 111 033,00
Lukhanji RA 60 Hewu Bulk Water Supply Phase 6 5 000 000,00 - -
RA 60 Hewu Bulk Water Supply Phase 7 2 000 000,00 5 000 000,00 5 000 000,00
Rathwick Bulk Services Phase 4 1 000 000,00 - -
Rathwick Bulk Services Phase 5 - 10 000 000,00 10 000 000,00
Rathwick Bulk Services Phase 6 - - 10 000 000,00
Ilinge Bulk Services 2 000 000,00 10 000 000,00 10 000 000,00
Cluster 1 Water Supply Backlog Phase 2 8 800 000,00 - -
Cluster 1 Sanitation 6 677 777,00 7 729 052,00 5 000 000,00
Cluster 2 Sanitation 6 000 000,00 10 000 000,00 5 333 097,00
TOTAL 31 477 777,00 42 729 052,00 45 333 097,00
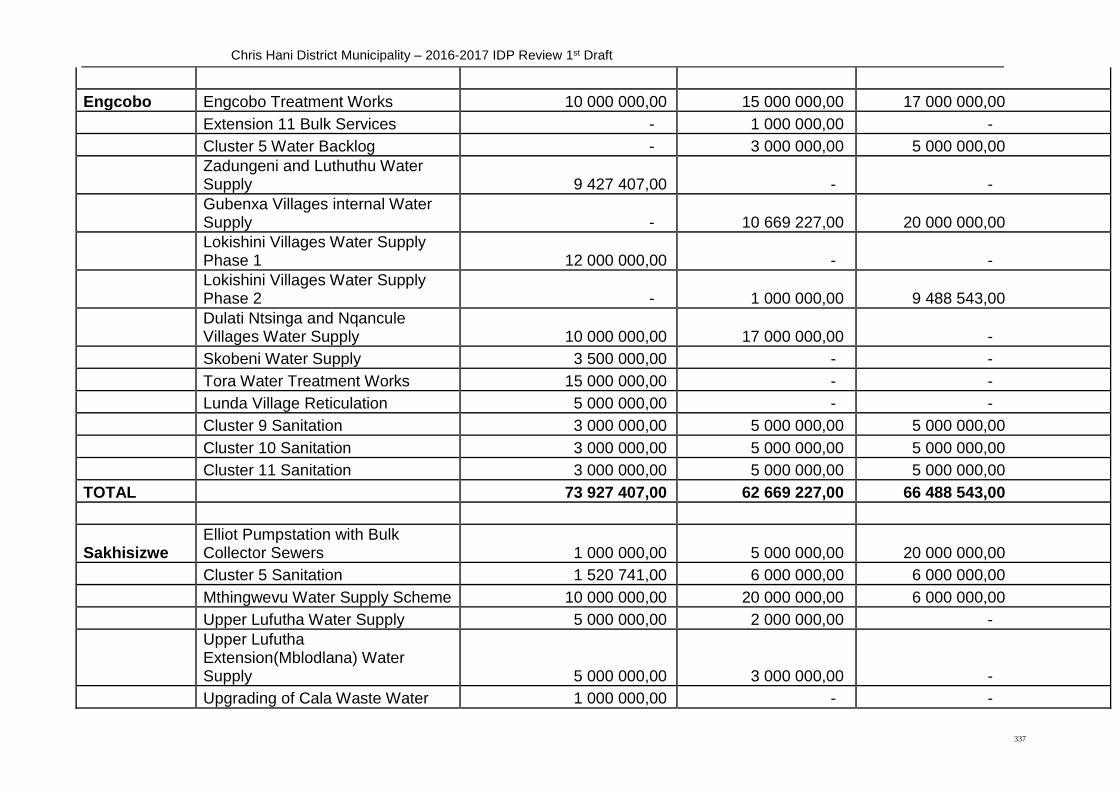
Chris Hani District Municipality – 2016-2017 IDP Review 1st Draft
337
Engcobo Engcobo Treatment Works 10 000 000,00 15 000 000,00 17 000 000,00
Extension 11 Bulk Services - 1 000 000,00 -
Cluster 5 Water Backlog - 3 000 000,00 5 000 000,00
Zadungeni and Luthuthu Water Supply 9 427 407,00 - -
Gubenxa Villages internal Water Supply - 10 669 227,00 20 000 000,00
Lokishini Villages Water Supply Phase 1 12 000 000,00 - -
Lokishini Villages Water Supply Phase 2 - 1 000 000,00 9 488 543,00
Dulati Ntsinga and Nqancule Villages Water Supply 10 000 000,00 17 000 000,00 -
Skobeni Water Supply 3 500 000,00 - -
Tora Water Treatment Works 15 000 000,00 - -
Lunda Village Reticulation 5 000 000,00 - -
Cluster 9 Sanitation 3 000 000,00 5 000 000,00 5 000 000,00
Cluster 10 Sanitation 3 000 000,00 5 000 000,00 5 000 000,00
Cluster 11 Sanitation 3 000 000,00 5 000 000,00 5 000 000,00
TOTAL 73 927 407,00 62 669 227,00 66 488 543,00
Sakhisizwe Elliot Pumpstation with Bulk Collector Sewers 1 000 000,00 5 000 000,00 20 000 000,00
Cluster 5 Sanitation 1 520 741,00 6 000 000,00 6 000 000,00
Mthingwevu Water Supply Scheme 10 000 000,00 20 000 000,00 6 000 000,00
Upper Lufutha Water Supply 5 000 000,00 2 000 000,00 -
Upper Lufutha Extension(Mblodlana) Water Supply 5 000 000,00 3 000 000,00 -
Upgrading of Cala Waste Water 1 000 000,00 - -
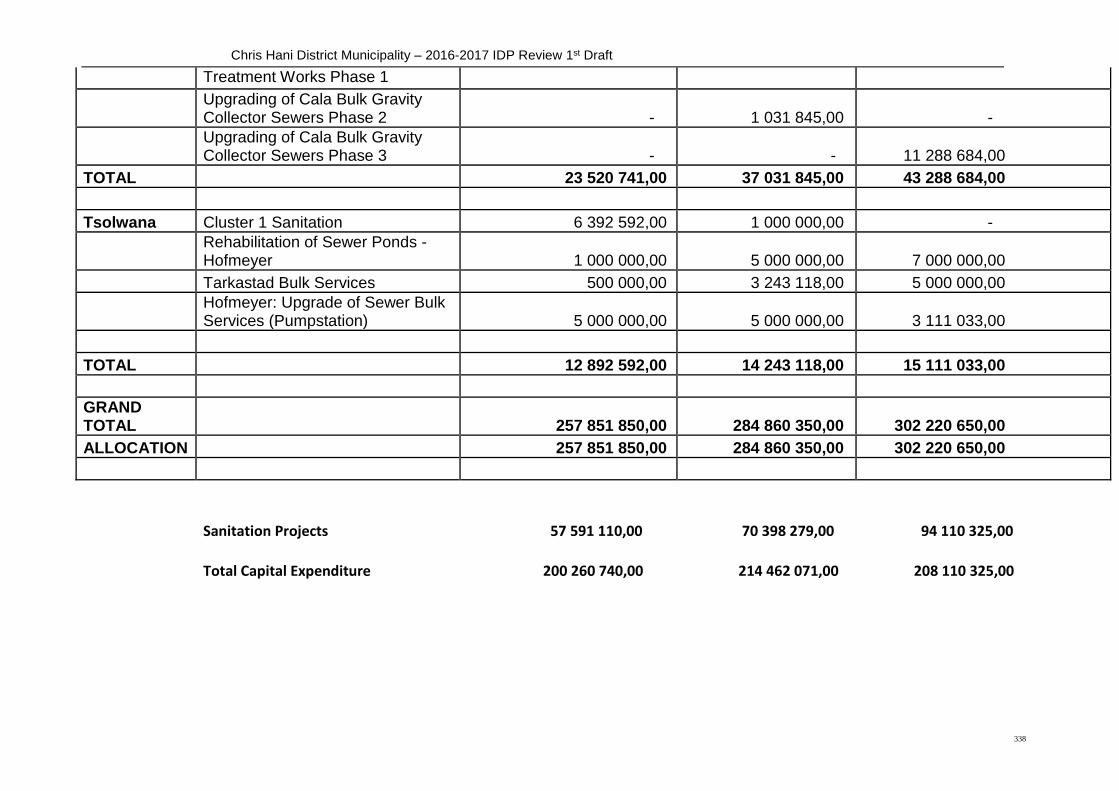
Chris Hani District Municipality – 2016-2017 IDP Review 1st Draft
338
Treatment Works Phase 1
Upgrading of Cala Bulk Gravity Collector Sewers Phase 2 - 1 031 845,00 -
Upgrading of Cala Bulk Gravity Collector Sewers Phase 3 - - 11 288 684,00
TOTAL 23 520 741,00 37 031 845,00 43 288 684,00
Tsolwana Cluster 1 Sanitation 6 392 592,00 1 000 000,00 -
Rehabilitation of Sewer Ponds - Hofmeyer 1 000 000,00 5 000 000,00 7 000 000,00
Tarkastad Bulk Services 500 000,00 3 243 118,00 5 000 000,00
Hofmeyer: Upgrade of Sewer Bulk Services (Pumpstation) 5 000 000,00 5 000 000,00 3 111 033,00
TOTAL 12 892 592,00 14 243 118,00 15 111 033,00
GRAND TOTAL 257 851 850,00 284 860 350,00 302 220 650,00
ALLOCATION 257 851 850,00 284 860 350,00 302 220 650,00
Sanitation Projects 57 591 110,00 70 398 279,00 94 110 325,00
Total Capital Expenditure 200 260 740,00 214 462 071,00 208 110 325,00

Chris Hani District Municipality – 2016-2017 IDP Review 1st Draft
339
WSIG FUNDED PROJECTS FOR 2016/17 TO 2018/19 FINANCIAL
YEARS
Municipalities Projects 2016/17 2017/18 2018/19
Emalahleni Cluster 2 Water Backlog - 20 000 000,00
Cluster 2 (Jiputa Makhikhi; Emazimeni; Emaqwathini; Lukhavana) Phase 2 7 500 000,00 3 000 000,00 -
Cluster 2 RS 1-1B (Gcina; Qumbu; Hala; Mbetheni; Kuliweni) Phase 1 2 000 000,00 17 000 000,00 1 000 000,00
Cluster 2 RS 1-1B (Gcina; Qumbu; Hala; Mbetheni; Kuliweni) Phase 2 - 10 000 000,00 10 000 000,00
Gqebenya Small Farms Interim Water Supply - 10 000 000,00 10 000 000,00
Mdeni Interim Water Supply 1 000 000,00 4 000 000,00 -
Cluster 2 Water backlog Project-Regional Scheme 3:Phase 1G - 10 000 000,00 15 000 000,00
Cluster 2 Water backlog Project-Regional Scheme 3:Phase 1D 15 000 000,00 10 000 000,00
Refurbishment of machubeni Regional Scheme 2 000 000,00 2 000 000,00 2 000 000,00
Water Conservation and Demand Management-Dordrecht 2 500 000,00
TOTAL 12 500 000,00 71 000 000,00 70 500 000,00
Intsika Yethu Cluster 4 Water Backlog - - 13 764 000,00
Cluster 4 (Gesini; Kwamzola; Melika Matole-anyile A & B) Phase 1 12 697 000,00
Cluster 4 (Gesini; Kwamzola; Melika Matole-anyile A & B) Phase 2 - 11 000 000,00 -
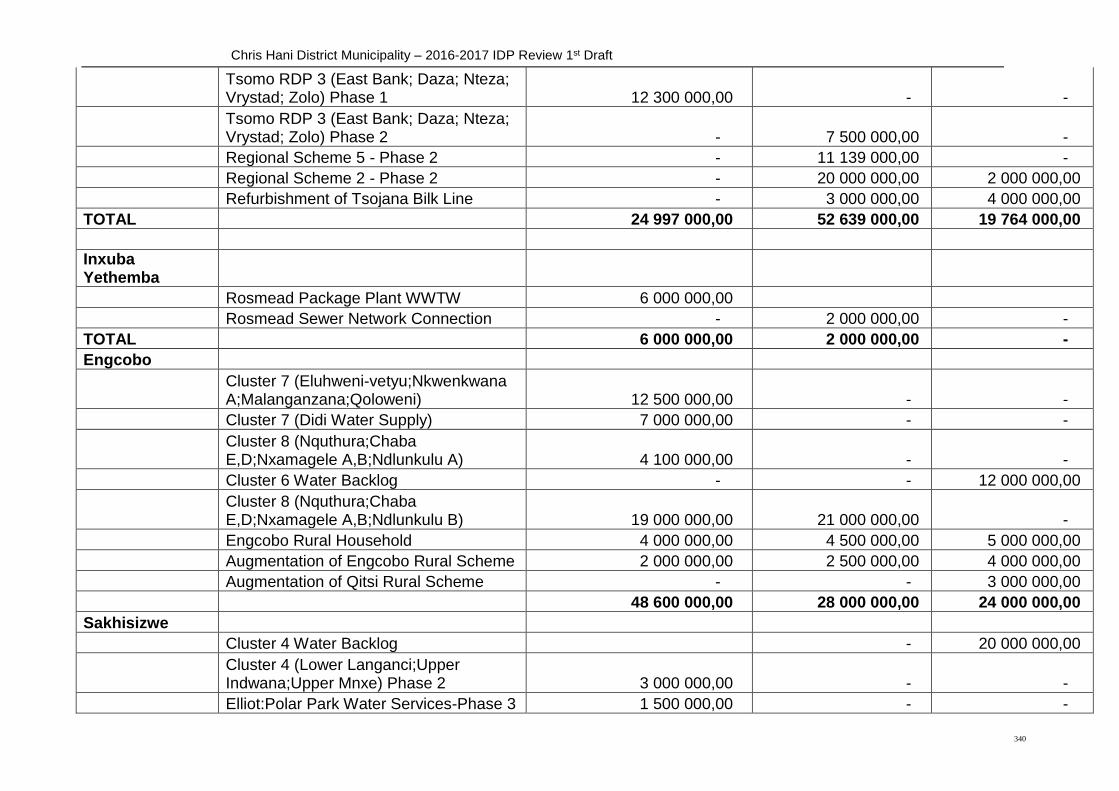
Chris Hani District Municipality – 2016-2017 IDP Review 1st Draft
340
Tsomo RDP 3 (East Bank; Daza; Nteza; Vrystad; Zolo) Phase 1 12 300 000,00 - -
Tsomo RDP 3 (East Bank; Daza; Nteza; Vrystad; Zolo) Phase 2 - 7 500 000,00 -
Regional Scheme 5 - Phase 2 - 11 139 000,00 -
Regional Scheme 2 - Phase 2 - 20 000 000,00 2 000 000,00
Refurbishment of Tsojana Bilk Line - 3 000 000,00 4 000 000,00
TOTAL 24 997 000,00 52 639 000,00 19 764 000,00
Inxuba Yethemba
Rosmead Package Plant WWTW 6 000 000,00
Rosmead Sewer Network Connection - 2 000 000,00 -
TOTAL 6 000 000,00 2 000 000,00 -
Engcobo
Cluster 7 (Eluhweni-vetyu;Nkwenkwana A;Malanganzana;Qoloweni) 12 500 000,00 - -
Cluster 7 (Didi Water Supply) 7 000 000,00 - -
Cluster 8 (Nquthura;Chaba E,D;Nxamagele A,B;Ndlunkulu A) 4 100 000,00 - -
Cluster 6 Water Backlog - - 12 000 000,00
Cluster 8 (Nquthura;Chaba E,D;Nxamagele A,B;Ndlunkulu B) 19 000 000,00 21 000 000,00 -
Engcobo Rural Household 4 000 000,00 4 500 000,00 5 000 000,00
Augmentation of Engcobo Rural Scheme 2 000 000,00 2 500 000,00 4 000 000,00
Augmentation of Qitsi Rural Scheme - - 3 000 000,00
48 600 000,00 28 000 000,00 24 000 000,00
Sakhisizwe
Cluster 4 Water Backlog - 20 000 000,00
Cluster 4 (Lower Langanci;Upper Indwana;Upper Mnxe) Phase 2 3 000 000,00 - -
Elliot:Polar Park Water Services-Phase 3 1 500 000,00 - -
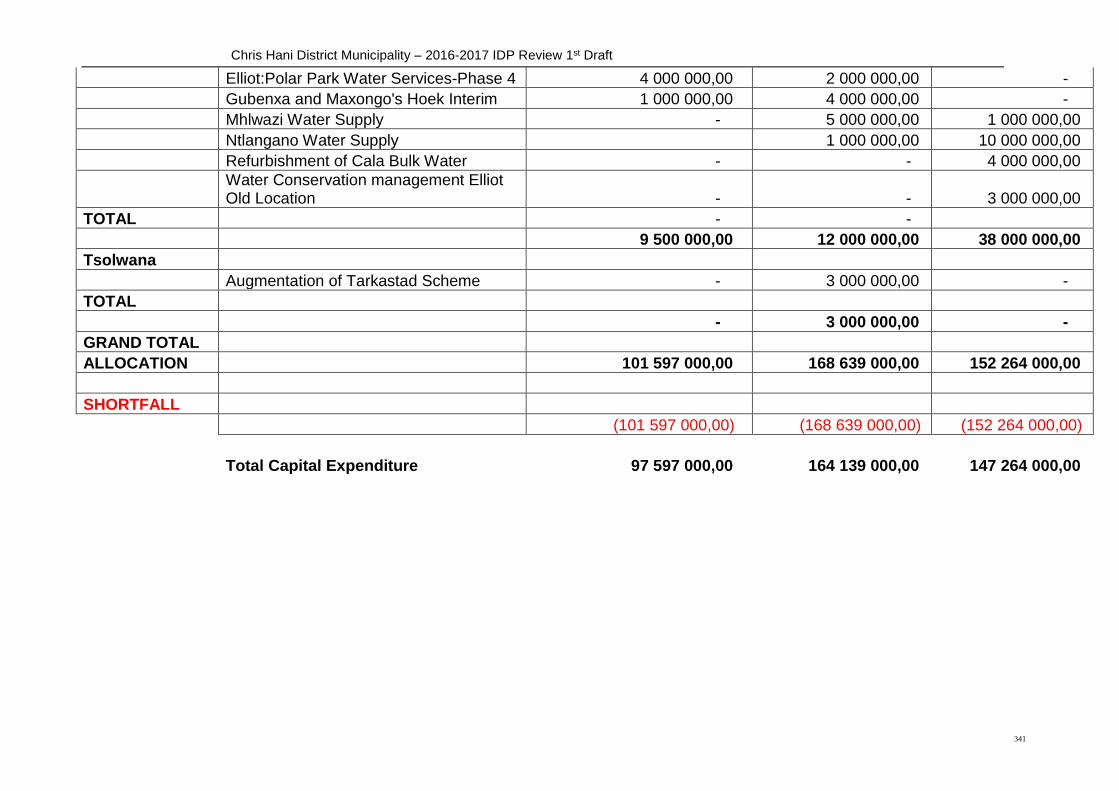
Chris Hani District Municipality – 2016-2017 IDP Review 1st Draft
341
Elliot:Polar Park Water Services-Phase 4 4 000 000,00 2 000 000,00 -
Gubenxa and Maxongo's Hoek Interim 1 000 000,00 4 000 000,00 -
Mhlwazi Water Supply - 5 000 000,00 1 000 000,00
Ntlangano Water Supply 1 000 000,00 10 000 000,00
Refurbishment of Cala Bulk Water - - 4 000 000,00
Water Conservation management Elliot Old Location - - 3 000 000,00
TOTAL - -
9 500 000,00 12 000 000,00 38 000 000,00
Tsolwana
Augmentation of Tarkastad Scheme - 3 000 000,00 -
TOTAL
- 3 000 000,00 -
GRAND TOTAL
ALLOCATION 101 597 000,00 168 639 000,00 152 264 000,00
SHORTFALL
(101 597 000,00) (168 639 000,00) (152 264 000,00)
Total Capital Expenditure 97 597 000,00 164 139 000,00 147 264 000,00
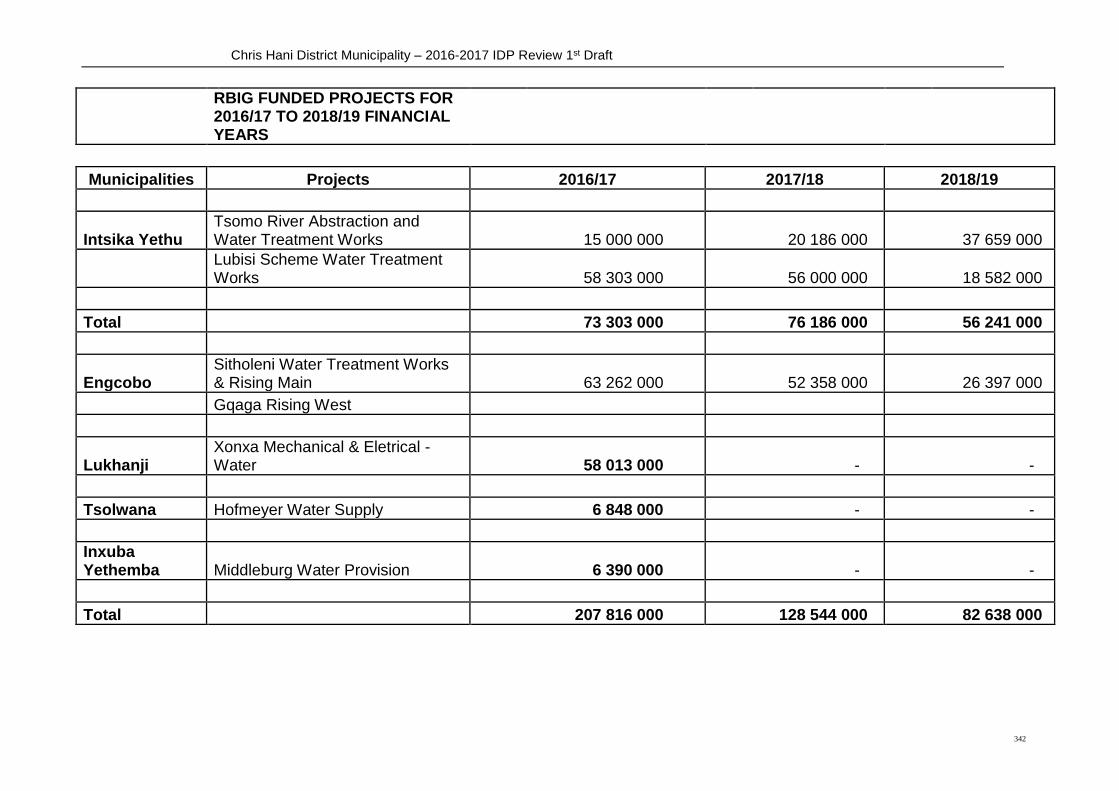
Chris Hani District Municipality – 2016-2017 IDP Review 1st Draft
342
RBIG FUNDED PROJECTS FOR 2016/17 TO 2018/19 FINANCIAL YEARS
Municipalities Projects 2016/17 2017/18 2018/19
Intsika Yethu Tsomo River Abstraction and Water Treatment Works 15 000 000 20 186 000 37 659 000
Lubisi Scheme Water Treatment Works 58 303 000 56 000 000 18 582 000
Total 73 303 000 76 186 000 56 241 000
Engcobo Sitholeni Water Treatment Works & Rising Main 63 262 000 52 358 000 26 397 000
Gqaga Rising West
Lukhanji Xonxa Mechanical & Eletrical - Water 58 013 000 - -
Tsolwana Hofmeyer Water Supply 6 848 000 - -
Inxuba Yethemba Middleburg Water Provision 6 390 000 - -
Total 207 816 000 128 544 000 82 638 000

Chris Hani District Municipality – 2016-2017 IDP Review 1st Draft
343
Chris Hani District Municipality – 2016-2017 IDP Review 1st Draft
344
CHAPTER 7
PERFOMANCE MANAGEMENT SYSTEM
Introduction
Section 152 of the Constitution of the Republic of South Africa, Act 108 of 1996 (the Constitution) defines the
objects of local government and further, in terms of Section 153, imposes upon municipalities specific
developmental duties that each municipality should strive to realise. With respect to the former, the
Constitution suggests that a municipality must:
a) Provide democratic and accountable government for communities;
b) Ensure the provision of services to communities in a sustainable manner;
c) Promote social and economic development;
d) Promote a safe and healthy environment; and
e) Encourage the involvement of communities and community organisations in the matters of local
government.
The Constitution prescribes that municipalities must strive within their financial and administrative capacity
to achieve such objects. In relation to the duties of municipalities, the Constitution prescribes that a
municipality must:
a) Structure and manage its administration and budgeting and planning processes to give priority to the
basic needs of the community, and to promote the social and economic development of the
community; and
b) Participate in National and Provincial development programmes.
To ensure that the Chris Hani District Municipality (CHDM) complies with these pieces of legislation and that
it delivers on the needs of its communities in an effective, efficient and economical manner, the CHDM has
formulated strategic plans, allocated resources for the implementation of those plans and through this
policy, seeks to develop a mechanism to monitor and measure the performance of the institution, inclusive
of all its administrative units, against the set plans.
As the key to the success of the municipality in all its endeavors, performance management equips leaders,
managers, workers and stakeholders with a set of tools and techniques for regularly planning, continuously
monitoring and periodically measuring and reviewing the performance of CHDM in terms of the indicators
and targets for effectiveness.
Chris Hani District Municipality – 2016-2017 IDP Review 1st Draft
345
1.2 Purpose and Objectives
The primary purpose of this policy is to give effect to the performance management system as prescribed in
various pieces of legislation. Through the translation of the municipality’s vision, mission and objectives into
measurable performance outcomes, the policy aims to provide a guide in terms which the performance of
the institution and its administrative units can be measured, improved and/or maintained in order to
improve service delivery.
To this end, the policy seeks to:
a) Create a frame of reference which clearly guides political office bearers and municipal officials in the
interpretation and application of performance management mechanisms in the CHDM;
b) Clarify the roles and responsibilities of all stakeholders during the various performance management
processes;
c) Establish a universal performance management language thus promoting consistency and
commonality in the application of concepts;
d) Promote a culture of accountability, responsibility and performance excellence;
e) Enhance the development of human capital; and
f) Ensure recognition and reward for performance excellence.
Apart from the legislative adherence that this policy seeks to ensure, it further seeks to create a frame within
which the municipality can plan, monitor, review and improve the implementation of Council’s Integrated
Development Plan. In doing so, it will fulfil the following functions:
1. Facilitate increased accountability
The performance management system will provide a mechanism for ensuring increased
accountability between:
The residents of the CHDM and Council,
The political and administrative components of Council,
Each department and the executive office
2. Facilitate learning and improvement
While ensuring that accountability is maximized, the performance management system must also
provide a mechanism for learning and improvement. It should allow for the municipality to know
which approaches are having the desired impact, and enable the municipality to improve delivery. It
should form the basis for monitoring, evaluating and improving the Integrated Development Plan.

Chris Hani District Municipality – 2016-2017 IDP Review 1st Draft
346
3. Provide early warning signals
The performance management system should provide Managers, the Municipal Manager,
Committees of Council and the Mayoral Committee with early warning of non-performance of the
full implementation of the Integrated Development Plan. It is important that the system ensures
decision-makers are timeously informed of possible non-performance, so that they can facilitate
intervention, if necessary.
4. Facilitate decision-making
The performance management system should provide appropriate management information that
will allow efficient, effective and informed decision-making, particularly on the allocation of
resources.
1.3 Policy Scope and Key Principles
The Policy applies to all Councillors, the Municipal Manager including those managers appointed in terms of
Section 56 of the Local Government: Municipal Systems Act, 32 of 2000, (CHDM Directors/Heads of
Department) as well as categories of CHDM officials as determined by Council. Furthermore, this policy
applies to the CHDM entity, the Chris Hani Regional Development Agency (CHDA) and its category of officials
as determined by the CHDA Board.
The application of the PMS Policy will be based on the following principles:
a) Simplicity: The system must be a simple user-friendly system that enables Council and its external
stakeholders to operate it within the existing resource capacity;
b) Politically Driven: Legislation clearly tasks Council as the owner of the performance management
system. The Municipal Manager will need to drive both the implementation and improvement of the
system and may delegate responsibilities in this regard;
c) Incremental Implementation: It is important that while a holistic performance management system
is the ultimate objective, Council could adopt a phased approach to implementation, dependent on
the capacity and resources of the municipality. The performance management system will need to
be constantly improved based on its workability;
d) Transparency and Accountability: The process of managing performance should be inclusive, open
and transparent. Citizens should know how departments are run, how resources are spent, and who
is in charge of particular services. Similarly, all information on the performance of departments
should be accessible to other managers, employees, the public and specific interest groups;
e) Integration: The performance management system should be integrated into other management
processes of Council, such that it becomes a tool for more efficient and effective management rather
than an additional reporting burden. It should be seen as a central tool for ongoing management
functions;

Chris Hani District Municipality – 2016-2017 IDP Review 1st Draft
347
f) Objectivity: Performance management must be founded on objectivity and should be democratic in
pursuance of its objectives. Both the processes of managing performance and the information on
which it relies need to be objective and credible. It should promote mutual respect, trust and ensure
high levels of co-operation and discipline in the dealings of municipal people among one another;
and
g) Clear and Accountable: The intentions of Council’s performance management system must be made
clear and acceptable especially to its officials, councillors and customers. Concerns and fears about
the system must be heard and addressed appropriately to minimise suspicions and maximise the
understanding and acceptance of change. International author of public sector management
literature Norman Flynn (113:1990) agrees that,” the first imperative is to ensure that the purposes
for measuring performance are clear and accepted by everyone. If measurements, especially of
costs, are to be used punitively, then they will create a different atmosphere than if they are to be
used creatively to help people improve their performance”.

Chris Hani District Municipality – 2016-2017 IDP Review 1st Draft
348
1.4 Legislative Context Performance management in local government is a legislated business process with various statutes
regulating the application thereof within municipalities. This Policy must thus be applied consistently with
the regulatory framework as summarized below:
The Constitution, Act 108 of 1996
The Constitution provides that municipalities in South Africa must:
Provide democratic and accountable government for local communities;
Ensure the provision of services to communities in sustainable manner;
Promote social and economic development;
Promote a safe and healthy environment;
Encourage the involvement of communities and community organisations in the matters
of local government.
The performance of municipalities must be monitored and managed to ensure the achievement of
these constitutional provisions.
White Paper on Service Delivery (Batho Pele) 1998
The performance management system must be based on and should give effect to the eight Batho
Pele principles of improved service delivery as outlined in and required by the White Paper on
Service Delivery. The principles are as follows:
Consultation;
Service Standards;
Access;
Courtesy;
Information;
Openness/ Transparency;
Redress; and
Value for Money.
The Local Government: Municipal Structures Act, 117 of 1998
Section 19 (1) of the Act specifies that a municipal council must strive within its capacity to
achieve the objectives set out in section 152 of the Constitution and annually review its overall
performance in achieving those objectives.
Section 44 (3) states the executive committee, in performing its duties, must :
(a) Identify and develop criteria in terms of which progress in the implementation of the
Chris Hani District Municipality – 2016-2017 IDP Review 1st Draft
349
strategies, programmes and services rendered to communities can be evaluated,
including key performance indicators which are specific to the municipality and common
to local government in general;
(b) Evaluate progress against the key performance indicators;
(c) Review the performance of the municipality in order to improve –
i. The economy, efficiency and effectiveness of the municipality;
ii. The efficiency of credit control and revenue and debt collection services;
and
iii. The implementation of the municipality’s by-laws
The Local Government: Municipal Systems Act, 32 of 2000 (MSA)
The MSA sets out the legal framework for performance management as a means to
measure, evaluate and report on the implementation of the Integrated Development Plan
(IDP):
Chapter 6 of the MSA provides for the establishment, monitoring and review of the
performance management system as well as reporting on the organisational performance
achievements against the IDP indicators and targets.
Section 57 of the MSA requires the Municipal Manager and the managers directly
accountable to the Municipal Manager (Section 57 employees) to sign annual
performance agreements and plans, with a set of performance measures to assess
individual achievement against the plans. The performance plans must be aligned to the
SDBIP that are based on the IDP.
According to section 67 of the MSA, a municipality must implement systems and
procedures to ensure fair, efficient, effective and transparent personnel administration,
including the monitoring, measuring and evaluating of staff performance
The MSA, in section 81(b), states that the municipality must monitor and assess the
performance of a service provider (or municipal entity) in implementing the service
delivery agreement (where applicable).
Section 26 of the Local Government: Municipal Systems Amendment Act, 44 0f 2003
provides that a parent municipality which has sole control of a municipal entity or
effective control in the case of a municipal entity which is a private company:
(a) Must ensure that annual performance objectives and indicators for the' municipal
entity are established by agreement with the municipal entity and included in the
municipal entity's multi-year business plan n accordance with section 87(5)(d) of

Chris Hani District Municipality – 2016-2017 IDP Review 1st Draft
350
the Municipal Finance Management Act; and
(b) Must monitor and annually review as part of the municipal entity’s annual budget
process as set out in section 87 of the Municipal Finance Management Act, the
performance of the municipal entity against the agreed performance objectives
and indicators.
The Local Government: Municipal Finance Management Act, 56 of 2003 (MFMA)
The MFMA contains various provisions relating to municipal performance management. It
requires municipalities, in annual budget approval, to adopt an SDBIP with service delivery targets
and performance indicators and compile an annual report, which must include a performance
report compiled in terms of the MSA.
Pertinent provisions include:
Section 16(2) requires that the municipality’s annual budget to be accompanied by
measurable performance objectives for revenue from each source and for each vote in
the budget, taking into account the IDP.
Section 53(1)(c) provides for the Mayor to ensure that performance agreements of
Section 57 employees comply with the requirements of the MSA to promote sound
financial management and are linked to the measurable performance objectives approved
with the budget and included in the SDBIP.
In terms of section 72 (1) (a) (iv), the accounting officer of a municipality must, by 25
January of each year, assess the performance of the municipality during the first half of
the financial year, taking into account the performance of every municipal entity under
the sole or shared control of the municipality, taking into account reports from any such
entities.
The MFMA, section 165 (2) (b), requires each municipality and municipal entity to have an
internal audit unit to advise the accounting officer and report to the audit committee on
the implementation of the internal audit plan and matters relating to, inter alia,
performance management.
In turn, section 166 requires each municipality and municipal entity to have an audit
committee to advise the municipal council, accounting officer and the management staff
of the municipality, or the board of directors, the accounting officer and the management
staff of the municipal entity, on matters relating to inter alia, performance management
and performance evaluation.

Chris Hani District Municipality – 2016-2017 IDP Review 1st Draft
351
The Local Government: Municipal Performance Management Regulations, 2001
In 2001 the Minister responsible for local government published the Local Government: Municipal
Planning and Performance Management Regulations, in terms of section 49 of the MSA. The
Regulations provide for municipalities to ensure that the PMS complies with the requirements of
the MSA, demonstrate the operation and management of the PMS, clarify roles and
responsibilities, as well as ensure alignment with employee performance management and the
IDP processes.
Local Government: Municipal Performance Regulations for Municipal Managers and Managers Directly Accountable to Municipal Managers, 2006
In 2006, a set of regulations was promulgated for Municipal Managers and Managers directly
accountable to the Municipal Manager, setting out how their performance is to be planned,
reviewed, improved and rewarded. The regulations provide for the conclusion of performance
agreements and plans for these managers.
Skills Development Act, 97 of 1998 (SDA)
The SDA supports occupational development which in turn acts as a catalyst for enhanced
performance within the workplace. It provides for the development of specific managerial and
occupational competencies which must be aligned to specific jobs, job profiles and consequently
Personal Development Plans which form an integral aspect of performance management.
Labour Relations Act, 66 of 1995 (as Amended) (LRA)
The LRA creates an enabling framework for the application of fair labour principles and practices
in dealing with capacity challenges in the workplace as outlined in chapter 8.

Chris Hani District Municipality – 2016-2017 IDP Review 1st Draft
352
1.5 Internal Capacity and Stakeholder Roles and Responsibilities
The MSA places responsibility on Council to adopt the performance management system, while holding the
Executive Mayor responsible for the development of the system. The Executive Mayor through the systems
of delegation assigns these responsibilities to the municipal manager, but remains accountable for the
development of the performance management system. The municipal manager may further delegate the
responsibility to another senior manager. Therefore it is important that the Council, within its policy
framework on delegation, assigns responsibilities accordingly. This must be done in writing. In the
assignment letter, the Council should stipulate quite clearly what needs to be done, by whom and when
5.1.1
5.2 MUNICIPAL MANAGER/MANAGER PMS
The Municipal Manager as the ultimate administrative accounting officer has the responsibility, as delegated
by the Executive Mayor, of introducing the performance management system and implementing it. The
Municipal Manager also has the responsibility of preparing the institution for change. This in effect means
ensuring that those to participate in the performance system, including the various internal and external
stakeholders, have a common understanding of why performance management is needed and what it will do
for the organisation.
This also involves an interpretation of the principles that will govern its development and use. Of importance
in this process is the ability of the institution to reach consensus on the manner in which the system will be
administered. However, given the intensive nature of the process of implementing the performance
management system, this against the many responsibilities attached to the Municipal Manager, it may
become necessary that this function is sub-delegated to a manager that is responsible for the introduction
and implementation of the performance management system. This manager will report to the Municipal
Manager.
5.2.1
5.3 PERFORMANCE MANAGEMENT STRUCTURES: INTERNAL AUDIT AND PERFORMANCE AUDIT
COMMITTEE
Section 45 of the MSA has a specific prescription that the results of the measurements of performance (this
includes quarterly assessments) must be audited as part of the municipality’s internal audit processes and,
on an annual basis, be audited by the auditor general. Furthermore, as part of the institutions audit plan,
performance measurements must be presented to the performance audit committee to evaluate both the
level of performance of the institution as well as the usefulness of the system

Chris Hani District Municipality – 2016-2017 IDP Review 1st Draft
353
5.3.1
5.4 PERFORMANCE MANAGEMENT STRUCTURES: COUNCIL, MAYORAL COMMITTEE AND
PORTFOLIO/STANDING COMMITTEES
Council has the ultimate responsibility of reviewing the performance of the Municipal Council, its
Committees and the Administration. Through the presentation of the quarterly organisational/strategic
scorecard/Institutional Service Delivery and Budget Implementation Plan (SDBIP), Mid-year Performance
assessment and Annual Report, the Municipal Council is able to make an assessment of the level of
performance of the municipality. Critically, even though the task of developing and approving the SDBIP
resides with the Executive Mayor, any amendments to the SDBIP can only be effected by a resolution of
Council. As legislative requirements, Council must approve the Annual and Mid-year performance reports of
the municipality.
The Mayoral Committee on the other hand should play the most significant role in reviewing the
performance of the administration, as the performance management system should be designed to allow
this committee to strategically drive and manage performance in the organisation. Reviews at this level
should remain strategic so that councillors are not restrained by operational discussions. In order for this
review to be strategic the committee must review performance quarterly, with the final quarterly review
taking the form of an annual review. The content of the review should be confined to agreed / confirmed
priority areas and objectives. The municipal manager should remain accountable for reporting on
performance at this level, even if he or she delegates this responsibility to other officials.
Portfolio/Standing Committees need to manage the performance of sectors and functions respective to their
portfolios. While it is important that they at least review performance of organisational priorities that lie
within their portfolio, it is desirable that they review additional sectoral priorities determined by them. In
order to build the role played by standing or portfolio committees, while ensuring that their role remains
strategic and not operational, these committees must review performance as often as monthly.
5.5 PERFORMANCE MANAGEMENT STRUCTURES: EXTERNAL STAKEHOLDERS
On a quarterly basis, municipalities must report on performance to communities and other relevant
stakeholders. This can be done in a number of ways:
1. Publication of quarterly reports on all accessible media;
2. Presentation of the performance information at IDP forum
3. Conducting public hearings on performance.

Chris Hani District Municipality – 2016-2017 IDP Review 1st Draft
354
Of importance in this regard is to invite all stakeholders to make representations on the information that is
published by the municipality. This is to allow these stakeholders to assess/review the performance of the
municipality so as to establish whether the public expectations are being met. Tabulated hereon below are
the various responsibilities attached to each stakeholder:
STAKEHOLDER ROLE IN PLANNING ROLE IN IMPLEMENTATION
Community Structures and IDP Forum
To be consulted and actively participate in the identification and prioritisation of area needs
Participate in the development of long-term vision for the area
Participate in the setting of indicators and targets
Must be given the opportunity to review the performance of the municipality and provide feedback in terms of the progress made in realising municipal targets
Council Must facilitate the development of a long-term vision for the area
identify priorities of Council for the period
Must facilitate the development of indicators and targets, and adopt agreed upon targets and indicators
Must facilitate the development of strategies for the realisation of the vision and targets set
Must approve the IDP and Budget as Municipal strategic and planning documents (approval of targets and indicators)
Must consider the municipality’s SDBIP and performance plans of S57 Managers including the Municipal Manager
Must review the performance of the municipality and approve recommendations and amendments where applicable and performance information submitted to other stakeholders
Standing (s79) Committees
Provide an objective view in terms of the content of the departmental scorecards
Ensure the inclusion of department specific community needs (indicators and targets) in the scorecard
Consider monthly and quarterly reports on departmental performance as submitted by the departmental director
Approve performance information submitted to other structures (internal and external)
Propose corrective actions to be taken where necessary
Make recommendations to Mayco/Council in terms of the performance of the department
Mayoral Committee (Mayco)
Oversees the development of the IDP, Budget and Service Delivery and Budget Implementation Plan
Provide strategic direction in terms of the implementation of municipal strategies
Engage relevant stakeholders on the strategies of the municipality
Conduct reviews of municipal performance (Monthly, quarterly and annually)
Approve performance information submitted to Council and other structures
Propose corrective actions and make recommendations to Council on municipal performance
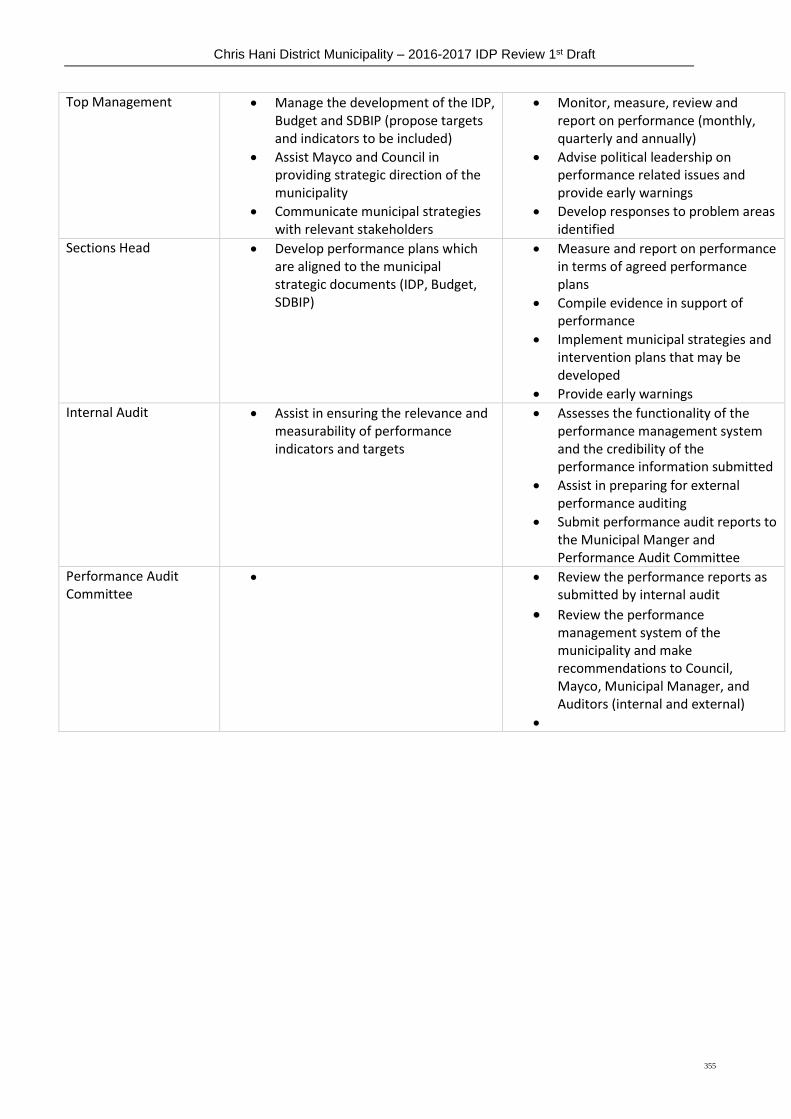
Chris Hani District Municipality – 2016-2017 IDP Review 1st Draft
355
Top Management Manage the development of the IDP, Budget and SDBIP (propose targets and indicators to be included)
Assist Mayco and Council in providing strategic direction of the municipality
Communicate municipal strategies with relevant stakeholders
Monitor, measure, review and report on performance (monthly, quarterly and annually)
Advise political leadership on performance related issues and provide early warnings
Develop responses to problem areas identified
Sections Head Develop performance plans which are aligned to the municipal strategic documents (IDP, Budget, SDBIP)
Measure and report on performance in terms of agreed performance plans
Compile evidence in support of performance
Implement municipal strategies and intervention plans that may be developed
Provide early warnings
Internal Audit Assist in ensuring the relevance and measurability of performance indicators and targets
Assesses the functionality of the performance management system and the credibility of the performance information submitted
Assist in preparing for external performance auditing
Submit performance audit reports to the Municipal Manger and Performance Audit Committee
Performance Audit Committee
Review the performance reports as submitted by internal audit
Review the performance management system of the municipality and make recommendations to Council, Mayco, Municipal Manager, and Auditors (internal and external)
Chris Hani District Municipality – 2016-2017 IDP Review 1st Draft
356
1.6 Conclusion
Highlighted hereon above are the key policy principles that underpin the application of the Chris Hani District
Municipal Performance Management processes. The Chris Hani District Municipality’s Performance
Management and Monitoring practices continue to evolve given the dynamic operating environment.
Monitoring Evaluation and Reporting Practices are driven from a premise that they are integrally connected
and should be pursued in a collaborative manner. Another key objective of this policy and system at large is
the extent to which it successfully allows for accurate implementation and tracking of service delivery
priorities as articulated in strategic and operational documents. The key measure of its success is the extent
to which these have enabled the municipality to progressively achieve its intended short, medium and long
term objectives
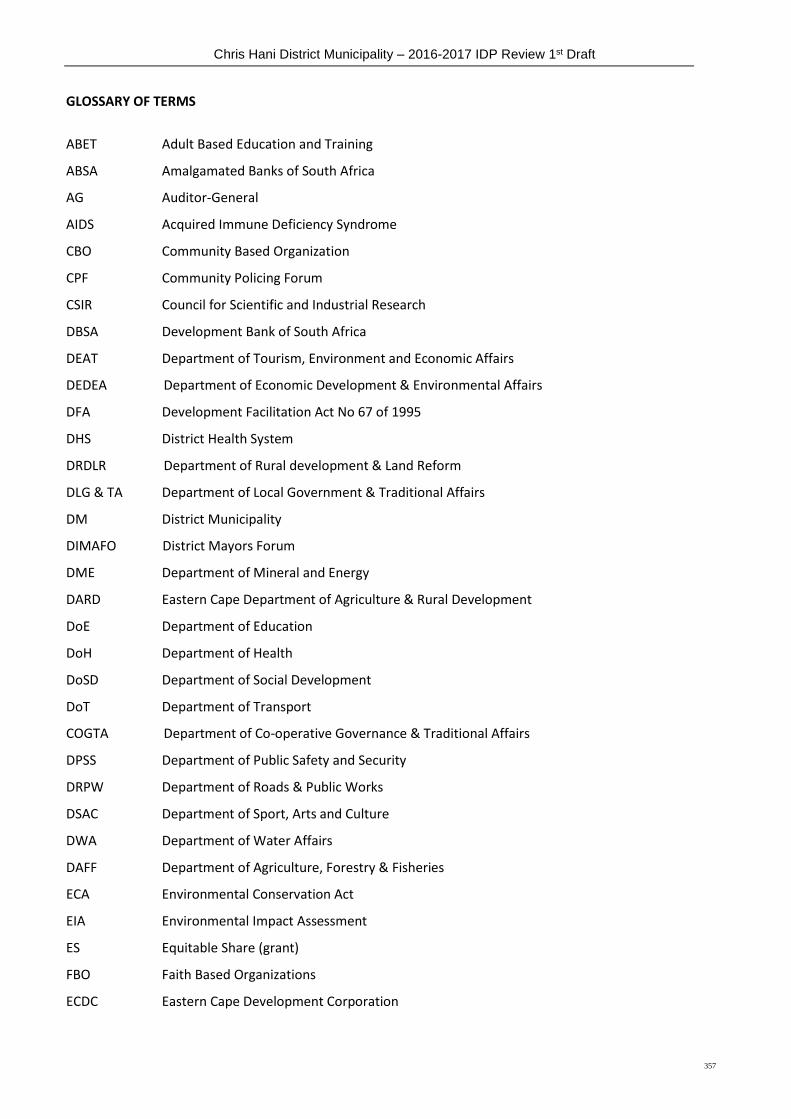
Chris Hani District Municipality – 2016-2017 IDP Review 1st Draft
357
GLOSSARY OF TERMS
ABET Adult Based Education and Training
ABSA Amalgamated Banks of South Africa
AG Auditor-General
AIDS Acquired Immune Deficiency Syndrome
CBO Community Based Organization
CPF Community Policing Forum
CSIR Council for Scientific and Industrial Research
DBSA Development Bank of South Africa
DEAT Department of Tourism, Environment and Economic Affairs
DEDEA Department of Economic Development & Environmental Affairs
DFA Development Facilitation Act No 67 of 1995
DHS District Health System
DRDLR Department of Rural development & Land Reform
DLG & TA Department of Local Government & Traditional Affairs
DM District Municipality
DIMAFO District Mayors Forum
DME Department of Mineral and Energy
DARD Eastern Cape Department of Agriculture & Rural Development
DoE Department of Education
DoH Department of Health
DoSD Department of Social Development
DoT Department of Transport
COGTA Department of Co-operative Governance & Traditional Affairs
DPSS Department of Public Safety and Security
DRPW Department of Roads & Public Works
DSAC Department of Sport, Arts and Culture
DWA Department of Water Affairs
DAFF Department of Agriculture, Forestry & Fisheries
ECA Environmental Conservation Act
EIA Environmental Impact Assessment
ES Equitable Share (grant)
FBO Faith Based Organizations
ECDC Eastern Cape Development Corporation

Chris Hani District Municipality – 2016-2017 IDP Review 1st Draft
358
PGDP Provincial Growth & Development Plan
GCIS Government Communication and Information Systems
GGP Gross Geographic Product
GIS Geographical Information System
GTZ German Technical Cooperation
GVA Gross Value Added
HDI Human Development Index
HIV Human Immune Deficiency Virus
HR Human Resource
IDC Independent Development Corporation
IDP Integrated Development Plan
IDT Independent Development Trust
ICT Information Communication Technology
ITP Integrated Transportation Plan
IWMP Integrated Waste Management Plan
JOC Joint Operational Centre
LDO Land Development Objectives
LED Local Economic Development
LSA Local Service Area (Primary Health)
MAYCO Mayoral Committee
MEC Member of the Executive Committee
MIG Municipal Infrastructure Grant
MFMA Municipal Finance Management Act
MSIG Municipal Support & Institutional Grant
MSyA Municipal Systems Act, 2000
MStA Municipal Structures Act, 1998
NDC National Development Corporation
NDP National Development Plan 2030
NEMA National Environmental Management Act
NER National Electrification Regulator
NGO Non Governmental Organizations
NSS National Sanitation Strategy
PATA Promotion of Administrative Justice Act
PMS Performance Management System
PPP Public Private Partnership
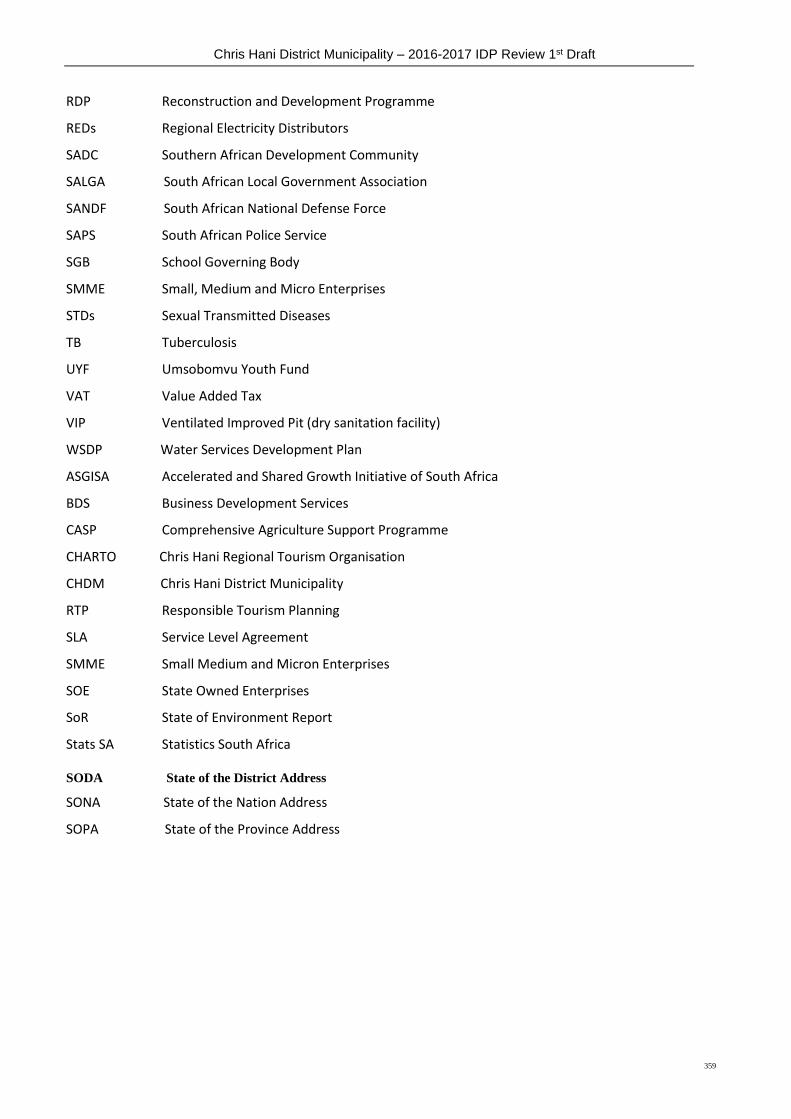
Chris Hani District Municipality – 2016-2017 IDP Review 1st Draft
359
RDP Reconstruction and Development Programme
REDs Regional Electricity Distributors
SADC Southern African Development Community
SALGA South African Local Government Association
SANDF South African National Defense Force
SAPS South African Police Service
SGB School Governing Body
SMME Small, Medium and Micro Enterprises
STDs Sexual Transmitted Diseases
TB Tuberculosis
UYF Umsobomvu Youth Fund
VAT Value Added Tax
VIP Ventilated Improved Pit (dry sanitation facility)
WSDP Water Services Development Plan
ASGISA Accelerated and Shared Growth Initiative of South Africa
BDS Business Development Services
CASP Comprehensive Agriculture Support Programme
CHARTO Chris Hani Regional Tourism Organisation
CHDM Chris Hani District Municipality
RTP Responsible Tourism Planning
SLA Service Level Agreement
SMME Small Medium and Micron Enterprises
SOE State Owned Enterprises
SoR State of Environment Report
Stats SA Statistics South Africa
SODA State of the District Address
SONA State of the Nation Address
SOPA State of the Province Address
Chris Hani District Municipality – 2016-2017 IDP Review 1st Draft
360
IDP REVIEW 1st Draft for Council Adoption
The process of approval for this 1st IDP Review for 2016/2017 IDP review involved some consultative
meetings with all stakeholders including: all municipalities planning unit within CHDM, representative forum
members, sector departments, internal departments and some comments from MEC for Local Governmen of
previous years. After Council approved this 1st Draft 2016-2017 IDP Review document copy will be submitted
to MEC for Local Government in the Eastern Cape Province, Provincial Treasury as well as National Treasury
for comments as well as to community members forcomments as their comments and consultation is critical
for them to be incorporated on the Final IDP Review by the month of May 2016. .
DECLARATION OF 2016- 2017 CHDM 1st DRAFT IDP REVIEW FOR ADOPTION BY COUNCIL BY MARCH 2016
SIGNATURES
……………………………………..
Mr. M. MENE DATE
MUNICIPAL MANAGER
Cllr M KOYO DATE
EXECETIVE MAYOR

Chris Hani District Municipality – 2016-2017 IDP Review 1st Draft
361
0RGANOGRAM
NB !!!!!!!! Be attached for printing