2016-2017 Laboratory Schools Annual Report
12
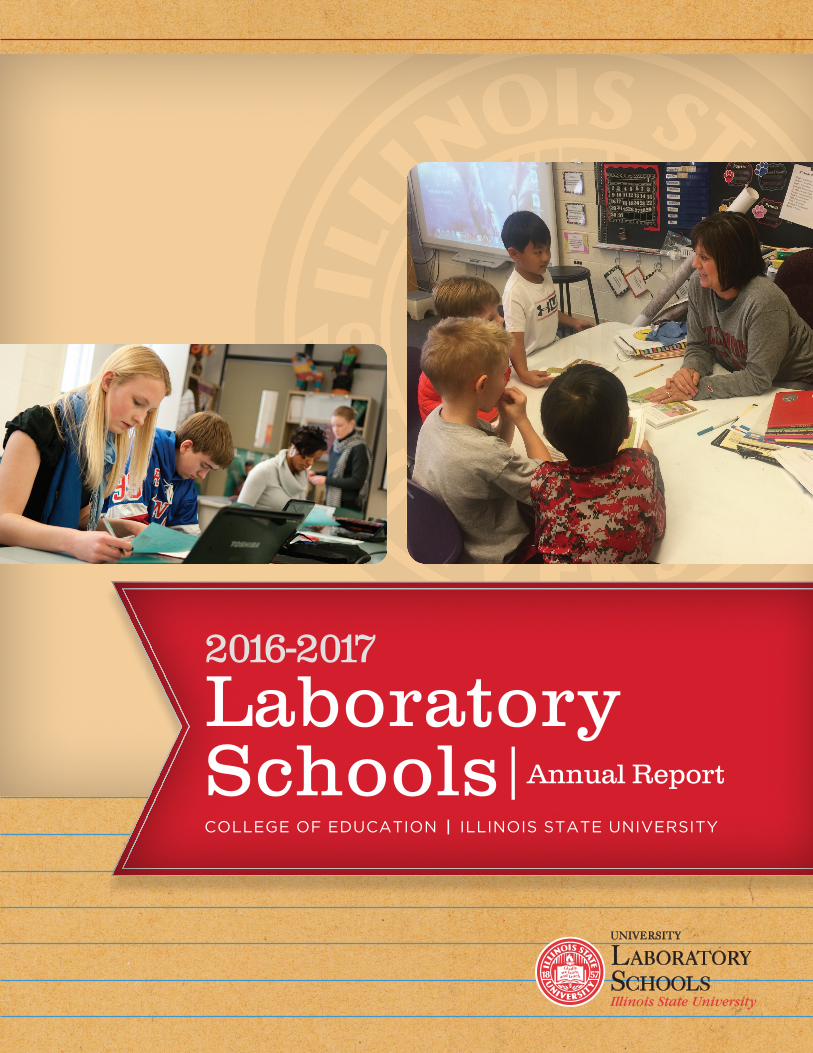
UNIVERSITY L ABORATORY S CHOOLS 2016-2017 Laboratory Schools | Annual Report COLLEGE OF EDUCATION | ILLINOIS STATE UNIVERSITY
Transcript of 2016-2017 Laboratory Schools Annual Report
UNIVERSITY
LABORATORYSCHOOLS
2016-2017
LaboratorySchools|Annual Report
COLLEGE OF EDUCATION | ILLINOIS STATE UNIVERSITY
2 Illinois State University Laboratory Schools Annual Report
Eight U-High students were named Commended Students in the 2017 National Merit Scholarship Program, among 34,000 throughout the nation recognized for their excep-tional academic promise.
Mark Adams, one of U-High’s speech and debate coaches and a recently retired English teacher, was honored, for the second time, as one of 12 people nationwide to receive a Diamond Coach Award by the National Speech and Debate Association Honor Society. Mr. Adams has coached at U-High for 10 years.
The U-High boys golf team won the Class 2A State Tour-nament held at ISU’s Weibring Golf Club. This win marks the 10th championship in school history and the first title since 2009. The U-High girls golf team finished in seventh place at this year’s Class 1A State Tournament held at Deca-tur’s Red Tail Run Golf Course.
The U-High girls tennis doubles team finished in third place at this year’s state tournament. Overall the girls Pioneers tennis team finished in ninth place with 13 points. The U-High boys tennis team finished in fourth place at this year’s state tournament in Arlington Heights.
The U-High boys soccer team defeated Waterloo Gilbault 1-0 and St. Joseph 3-1 to win the Class 1A state championship. The Pioneers ended with a 17-6-5 record and the first state title in school history. The Illinois High School Coaches Associa-tion released its all sectional soccer selections and Nathan Clay and Cayden Redd were selected for the all-sectional first team and JD Kelley was selected for an honorable mention.
The U-High girls soccer team finished in second place at this year’s state series at North Central College in Naperville. U-High graduate Sarah LaFayette was named this year’s Pan-
tagraph Soccer Player of the Year. Sarah led the Pioneers to a second place finish in the Class 1A state tournament this past season. She was also the third leading scorer in state history, scoring 178 career goals along with contributing 53 assists.
The U-High Marching Pioneers received first place in Music Performance and Second Place overall in Class 1A at the State of Illinois Invitational High School Marching Band Championship in October.
Eighteen U-High jazz musicians were chosen to participate in the 2016 ILMEA District Jazz Festival. Thirty U-High musicians were chosen to participate in the 2016 Illinois Music Educators Association District Festival.
The U-High cross country teams competed at the Class 2A state meet held at Peoria’s Detweiller Park. The boys teams finished in third place, and the girls team finished in eighth place.
The U-High boys tennis coach, Jon Friesen, was selected by the Illinois High School Tennis Coaches Association as the 2016 Regional Coach of the Year. Coach Friesen was honored at the Awards Luncheon of the IHSTCA Workshop in February at the Vaughan Center in Aurora.
Under the ranking of Niche’s Best Public High Schools, U-High came out as the 13th best in the state of Illinois.
Lake Williams was named the 2016 Mr. U-High. With everyone's help, the U-High Student Senate and U-Build Club raised over $5,800 that will be used to help construct a home in Haiti over spring break.
Coach Lester Hampton was inducted into the Illinois Track and Cross Country Coaches Association Hall of Fame.
Eleven U-High music students were selected to participate in the 2017 Illinois Music Educators Festival.
POINTS OF PRIDE
OUR MISSION
Thomas Metcalf School and University High School, laboratory schools administered by the College of Education
at Illinois State University, serve as clinical experience and practice sites for pre-service teachers and experimental
teaching activities. The schools provide a “living laboratory” for research and applied practices to improve
teaching and other educational practice. This tradition is reflected in the four-part mission of the Illinois State
University laboratory schools, which states:
• Provide a school in which excellence in education theory and practice can be observed, studied, and practiced by teacher candidates and other pre-service school professionals;
• Provide an environment in which research and development activities may be conducted;
• Provide a comprehensive, high-quality academic program for Thomas Metcalf School and University High School students; and
• Promote effective, high-quality education throughout the teaching profession, and aid other educators in the process of improving the quality of education in their schools.
The 2016-2017 school year was marked by some memorable achievements by students and faculty alike. Selected highlights are listed under the next section, “Points of Pride.”

Laboratory Schools Annual Report Illinois State University 3 2 Illinois State University Laboratory Schools Annual Report
For the second year in a row, U-High’s literary maga-zine Brome and Beyond has won the highest award from the National Council of English Teachers for its 2015 issue “Spiraling Out of Control.”
Stephanie Chow was honored at the ILMEA All-State Composition Contest with a first place award in the Com-mercial/Pop category and second place award in Jazz Im-provisation. She and Ryann Piker performed her first place composition “Closer” for all of the All-State students at the Student Composition Concert in January. Stephanie Chow won second place in the NAfME Electronic Music Composi-tion Contest (high school division) for her original composi-tion “Closer”.
Packard Otto and Dylan Carey competed in the Illinois State Wrestling meet. Packard finished in the top eight class A heavyweights and finished just one match away from med-aling. Dylan placed fifth at 126 in one of the toughest weight classes in the state.
At this year’s state swim meet, U-High’s Colton Stogner finished in fifth place in 20.9 seconds in the 50 free and in sixth place in 45.77 seconds in the 100 free at New Trier High School.
In basketball, the Associated Press selected U-High’s Keon-dre Schumacher as an all-state second team pick in class 3A. He averaged 17.3 points and 3.6 assists per game. Raven Hughes, with 1,279 career points, was named the Pantagraph Area Player of the Year. She averaged 15.5 points and carried the Pioneers to a 28-5 record and as high as No. 4 in the state poll.
The U-High WYSE team finished in second place at the state tournament at the University of Illinois at Urbana-Champaign.
Lauren Seaver finished in third place and Katie Reeves finished in fourth place in the track and field team pole vault event at this year’s state meet in Charleston. The U-High boys track and field team tied for first place at this year’s state meet held in Charleston. The team finished with 37 points, tying with Freeport for the Class 2A title.
James Han brought home a first place finish in extempora-neous commentary at this year’s National Speech and Debate Tournament in Alabama. Caroline Pickering and Natalie Thomison finished in second and fourth place, respectively, in expository speaking. U-High had an additional two students finish in the top 60 and four were semi-finalists. The Pioneers were represented by a record 16 students who attended the tournament that involved more than 1,100 schools.
The National Speech and Debate Association named seniors Colin Hardman, Justin Maaks, Alex Plumadore and Austin Spaulding Academic All-Americans. Less than 500 out of 141,000 students earn this award each year, placing them nation-ally among the top half of one-percent of all student members.
This month, students from U-High and the area competed in the Annual National NAACP ACT-SO Competition in Baltimore. They competed along with 700 talented youth from across the US. U-High junior Jordyn Blythe brought home a gold medal in oratory speaking.
Graduation was held for the class of 2017 in Braden Audi-torium for the seniors and their families. The class was offered over $12,000,000 in scholarships to continue their education at colleges and universities around the country.
Metcalf Learner Qualities were introduced. Metcalf students recognize and exhibit personal responsibility for their learning, as evident by the following learner qualities:
• Wonder: I imagine possibilities • Self Aware: I am mindful • Question: I find out • Think: I have my own ideas, beliefs, and opinions• Reflect: I look back on my learning to choose my next
steps • Grit: I don’t give up • Connect: I link knowledge together to develop new
understandingsThrough her famous children’s books, author Patricia Po-
lacco, read and discussed with students at Metcalf her journey as a struggling student to an inspirational author.
Professional basketball player, Corey Rich, visited Metcalf to share with students how important school is and how activities such as basketball can help build character.
The Metcalf Game Club was created for Metcalf students to have fun, create, and socialize, using games to enhance learning.
Six golfers at Metcalf competed at state. Jaiden Mapugay placed seventh. Olivia Graham and Ihnera Gerongay tied for 19th place.
Metcalf hosted visitors from China, Panama, and Japan.The Metcalf Math Counts team earned second place at
the regional competition. Eighth-grader Matt Culbertson earned first place, Alicia Han (eighth grade) earned sixth place, and Rene Mohammadi (eighth grade) earned eighth place. Our team participated at state in Lisle.
The Metcalf Allied Arts musical performance of The Lion King, resulted in record attendance.
The Metcalf Scholastic Bowl won state.The Metcalf Jr Gamma Phi Circus celebrated its 30th
anniversary.In collaboration with ISU Deaf and Hard of Hearing
Department, guest speaker Sheena McFeely spoke to Metcalf students about her journey through life living as a deaf indi-vidual and how she accomplished her goals and dreams.
The Metcalf Orffcats were invited to perform in Nash-ville. During this trip, they were given the opportunity to re-cord themselves in one of the city’s premier recording studios.
The Metcalf Eighth grade boys won state in the 4x100 relay–Mathew Davenport, Mason McClure, Daniel Mosele, and Camdyn Barclay. Colton Nafziger, McClure, Mosele, and Barclay placed sixth in the 4x400. Naffziger placed sixth in pole vault.
Nine Metcalf teachers completed their third and final year working toward National Board Certification.
Made in Hayden debuted as middle school students showcased their various talents on stage at Metcalf.
Metcalf Administrators and teachers visited the countries of Spain, New Zealand, Australia, and China to experience education across the world.

4 Illinois State University Laboratory Schools Annual Report
AttendanceA perfect attendance rate (100 percent) means that all students
attended school each day of the academic session.
Metcalf U-High District State
Attendance 95.98 94.98 95.2 94.0
Days Present Days Possible Percent
MLS 63,795 66,468 95.98
UHS 100,551 105,867 94.98
LS 164,346 172,335 95.36
Enrollment by grade level
K 1 2 3 4 5 6 7 8 Metcalf
36 35 42 42 41 47 46 49 49 387
9 10 11 12 U-High
157 145 155 150 607
District
994
Average class size Average class size is the total enrollment for a grade divided by
the number of classes for that grade reported for the first school
day in May. For high schools, the average class size is computed
for the whole school, based on the average class sizes for the
second and fifth periods. The average number of students in each
class in Illinois is 21.
Laboratory School Average
State
Kindergarten 18 19.1
Grade 1 17.5 19.8
Grade 3 21 20.8
Grade 6 23 21.3
Grade 8 24.5 20.6
High school 16.2 19.5
Actual Enrollment by Grade
Laboratory Schools Average by Grade
Kindergarten 36 18
Grade 1 35 17.5
Grade 3 42 21
Grade 6 46 23
Grade 8 49 24.5
High school 1214/75 16.2
Enrollment by race/ethnicity (%)
Metcalf U-High District State
White 74.9 74.1 74.5 48.5
Black 4.4 6.6 5.5 17
Hispanic 9.3 6.6 7.95 25.7
Asian 4.2 5.6 4.9 4.9
Native Hawaiian/Pacific Islander
0.0 0.33 0.165 0.1
American Indian/Alaskan 0.003 0.0 0.15 0.4
Two or More Races 7.5 6.9 7.2 3.4
Metcalf (387) U-High (607) Unit-wide (994)
White 289 74.9 449 74.1 738 74.4
Black 16 4.2 40 6.6 56 5.7
Hispanic 36 9.3 40 6.6 76 7.7
Asian 16 4.2 34 5.5 49 4.9
Native Hawaiian/Pacific Islander
0.0 0.0 2 0.33 2 0.2
American Indian/Alaskan
1 0.26 0.0 0.0 1 0.1
Two or More Races
29 7.5 42 6.9 71 7.2
STUDENT CHARACTERISTICS
Student characteristics are reported in this section of the annual report. This information can be used to compare the performance of students in the Laboratory Schools with the performance of other students throughout Illinois.

Laboratory Schools Annual Report Illinois State University 5 4 Illinois State University Laboratory Schools Annual Report
ACHIEVEMENT INDICATORS (TESTING)
SATThe Scholastic Aptitude Test (SAT) is a college entrance exam taken
by high school students that is often used by out-of-state universities
during the admission process. The SAT measures three areas: verbal,
mathematical, and writing ability. Scores range from 200 to 800.
Below are the averages for the graduating class of 2017.
U-High State Nation
Evidence-Based Reading and Writing
659 556 538
Mathematics 654 554 533
Overall 1313 1110 1071
PSATThe Pre-Scholastic Aptitude Test (PSAT) is typically taken by
juniors to determine if a student qualifies for National Merit Scholar
status. One student qualified for National Merit status. Sophomores
occasionally take this test for practice so only scores for juniors are
reported. This year 74 sophomores and 109 juniors took the PSAT.
The PSAT measures three areas: verbal, mathematical, and writing
ability. Total scores range from 320 to 1520.
U-High State Total Group
Sophomore 1124 933 938
Junior 1203 1002 1020
ACTThe American College Test (ACT) is the test taken by Illinois students
who intend to go to college. The test predicts how well students
will do in college. ACT scores range from 1 (lowest) to 36 (highest).
Below are the average scores for the graduating class of 2017.
U-High State Nation
English 24.8 20.7 20.3
Mathematics 25.2 21.0 20.7
Reading 25.6 21.3 21.4
Science Reasoning 24.6 21.1 21.0
Composition 25.2 21.2 21.0
Graduation rate (N=148)Graduation rate is the percent of ninth-grade students who
graduate four years later. The graduation rate does not include
the count of students who graduated in the summer after their
scheduled spring graduation or those who took more than four
years to graduate.
University High School State
100 85.2
Post-secondary options (N=148)
Two-year community
college
Four-year college or university
MilitaryTrade School
Other
12% 83% 3% 0% 1%
Partnership for Assessment of Readiness for College and Careers (PARCC)Each Performance Level is a broad, categorical level defined by a student’s overall scale score and used to report overall student performance
by describing how well students met the expectations for their grade level/course. Each Performance Level is defined by a range of overall scale
scores for the assessment. There are five Performance Levels for PARCC assessments:
Level 1: Did not yet meet expectations
Level 2: Partially met expectations
Level 3: Approached expectations
Level 4: Met expectations
Level 5: Exceeded expectations
Grade 3 Grade 4 Grade 5
Metcalf State Metcalf State Metcalf State
Reading 55 36.2 76 37.1 75 36.6
Mathematics 64 39.2 81 30.8 56 29.6
Grade 6 Grade 7 Grade 8
Metcalf State Metcalf State Metcalf State
Reading 76 34.9 74 40 80 37.4
Mathematics 70 28.1 65 26.9 78 31.5
Students performing at levels 4 and 5 met or exceeded expectations, have demonstrated
readiness for the next grade level/course and, ultimately, are on track for college and careers.
Performance Level Descriptors (PLDs) describe the knowledge, skills, and practices that students
should know and be able to demonstrate at each Performance Level in each content area (ELA/L
and mathematics), and at each grade level/course.
Student characteristics are reported in this section of the annual report. This information can be used to compare the performance of students in the Laboratory Schools with the performance of other students throughout Illinois.

6 Illinois State University Laboratory Schools Annual Report
ACHIEVEMENT INDICATORS (AP)
ASPIRE ACT Aspire maps learner progress from grades three through
high school (grades 9 and 10) on a vertical scale, anchored
to the scoring system of the ACT. This test offers a system of
annual vertically articulated, standards-based system summative
assessments linked to ACT College Readiness Benchmarks and
other sets of state standards. Subject areas include english, math,
reading, science, and writing.
U-High (9th Grade)
ACT College Readiness Benchmark (9th Grade)
English 436 429
Mathematics 433 425
Reading 429 423
Science Reasoning 432 425
Writing 426 425
U-High (10th Grade)
ACT College Readiness Benchmark
(10th Grade)
English 440 431
Mathematics 438 427
Reading 431 424
Science Reasoning 435 427
Writing 429 426
Honors and awards National Merit Scholars are selected on the basis of their scores on the
Preliminary Scholastic Aptitude Test/National Merit Qualifying Test.
This recognition is limited to high school seniors who score in the top
half of 1 percent of all seniors who take the exam. Eight students were
recognized as Commended Scholars during the school year and five
students were semifinalists in the competition.
Advanced Placement One hundred and seventy six University High School students
completed 320 Advanced Placement (AP) examinations during
the past school year. Advanced Placement is an international
program sponsored by the College Board. Successful completion
of AP courses (score of 3 and above) may result in college credit
and/or exemption from introductory courses at the college level.
AP exams are scored on a five-point scale: 5–extremely well
qualified; 4–well qualified; 3–qualified; 2–possibly qualified; and 1–no
recommendation. The courses, the number of students who took
each exam, and the percentage of students who earned scores that
qualify for college credit are listed in the following table.
Each year the College Board recognizes students who have scored
well on AP tests. Thirty-two U-High students were recognized as
AP Scholars because they received grades of 3 or higher on three
or more AP Exams. Twenty-two students were recognized as AP
Scholars with Honor as they received an average grade of at least
3.25 on all AP exams taken and grades of 3 or higher on four or
more of these exams. Seventeen students were recognized as AP
Scholars With Distinction as they received an average grade of at
least 3.5 on all AP exams taken and had grades of 3 or higher on
five or more of these exams. Five students were recognized as a
National AP Scholar as they received an average score of at least 4
on all AP Exams taken and scores of 4 or higher on eight or more
of these exams.
CourseNumber of
examsPercentage who qualify
Biology 16 100
Calculus AB 40 100
Calculus BC 17 94
Chemistry 15 93
Computer Science 32 81
English–Language 1 100
English–Literature 57 91
European History 17 88
Macroeconomics 4 75
Microeconomics 5 100
Physics C: Electricity
and Magnetism2 50
Physics C: Mechanics 6 100
Psychology 4 100
Spanish Language 9 78
Statistics 23 65
Studio Art Drawing 5 80
U.S. History 22 82
U.S. Government and Politics 45 91
Total AP Exams Taken 320

Laboratory Schools Annual Report Illinois State University 7 6 Illinois State University Laboratory Schools Annual Report
Demand for counseling services The demand for counseling services is defined as the number
of initial counseling requests made by students, parents,
faculty, or administrators. This number does not reflect any
continuing sessions as a result of an initial contact. Metcalf
counseling services consist of providing assistance to students
with concerns along with social and emotional classroom
programming including problem-solving and emotional control
along with offering academic and behavior testing. U-High
counseling services consist of providing assistance to students
with concerns along with advising students on class schedules
and transcripts, testing services, and career exploration.
Metcalf U-High
Demand for counseling services
144 requests 965 requests
Students receiving assistance Resource teachers, along with the help of peers, Illinois State
University, and volunteer mentors, provide one-to-one or small-
group assistance to students who need additional help. The
indicator shows the number of students and the proportion of
students in each school who receive this type of assistance.
Metcalf Tier 3
U-High U-Link Students
U-High U-Connect Students
Students receiving assistance from resource teachers
31 340 12
SUPPORT SERVICES
Additional services and interventions U-Link Mentors—A peer-helping program composed of a network
of caring students who are trained to help U-High students. A total
of 52 U-High and Illinois State students served as tutors during the
school year.
U-Connect Instructors—The ISU college students provide targeted
instruction in literacy and mathematics one-on-one to help students
make connections in the classroom. This experience offers more
authentic teaching practices one-on-one with students and offers ISU
students pre-teaching opportunities. Seven majors are represented
from ISU colleges by instructors in the U-Connect program: Special Ed.,
Spanish, Deaf Ed., Biology, Math, Chemistry, History and Social Science.
A total of 11 ISU students served as instructors during the 2016-2017
school year at U-High.
Percent of teachers (N=86) and administrators (N=9) by years of experience, grouped in five-year increments (%)
1-5 years
6-10 years
11-15 years
16-20 years
21-25 years
26+ years
Teachers 16.3 24.4 10.5 14.0 11.6 22.1
Administrators 22.2 22.2 22.2 22.2 11.1 0.0
Percent of teachers (N=86) by degrees attained (%)
Laboratory Schools State
Bachelor’s 27.9 38.5
Master’s and above 72.1 60.9
Percent of teachers (N=86) by race and gender (%)
Laboratory Schools State
Asian or Pacific Islander 1.1 1.5
Black non-Hispanic 2.1 5.8
Hispanic 2.1 5.6
Native American 0.0 0.2
White non-Hispanic 93.6 83.3
Two or more Races 0.0 0.8
Male 30.2 23.3
Female 69.8 76.7
Number of national board certified teachers – 22 (25.6 percent)
Average salariesThe average teacher and administrator salaries are based on
full-time equivalents. Salaries only represent base pay and do not
include coaching stipends and extra duty pay.
Laboratory Schools State
Teachers (86) $54,927 $64,516
Administrators (9) $88,225 $106,273
STAFF CHARACTERISTICS
National Board Certified Teachers
Laboratory schools*
State Nation
# National Board Certified
22 6,041 112,000
% Certified 25.6% 4.5% 3.1%
*There are currently seven Laboratory School teachers in the process
of obtaining certification. Upon receiving their certification, 33.8
percent of our faculty will then be National Board Certified teachers.
The National Board was created to “define what teachers should know and
be able to do” and to “support the creation of rigorous, valid assessments
to see that certified teachers do meet these standards.” The National
Board has worked with master teachers and education experts to
develop standards for accomplished teaching in prekindergarten
through grade 12 subject areas and offers 25 different certificates.
Teachers must pass 10 rigorous assessments, including four portfolio
entries featuring teacher practice and six exercises that assess
content knowledge. The certification process can take from one to
three years. The certificate, valid for 5-10 years, can be renewed. This
voluntary program does not replace state prekindergarten through
grade 12 teacher licensure or certification. Instead, it offers a much more
rigorous national teacher credential that is recognized and rewarded
nationwide. More than 112,000 teachers are National Board certified
nationwide—just over 3 percent of the nation’s teachers.
8 Illinois State University Laboratory Schools Annual Report
FINANCE DATA
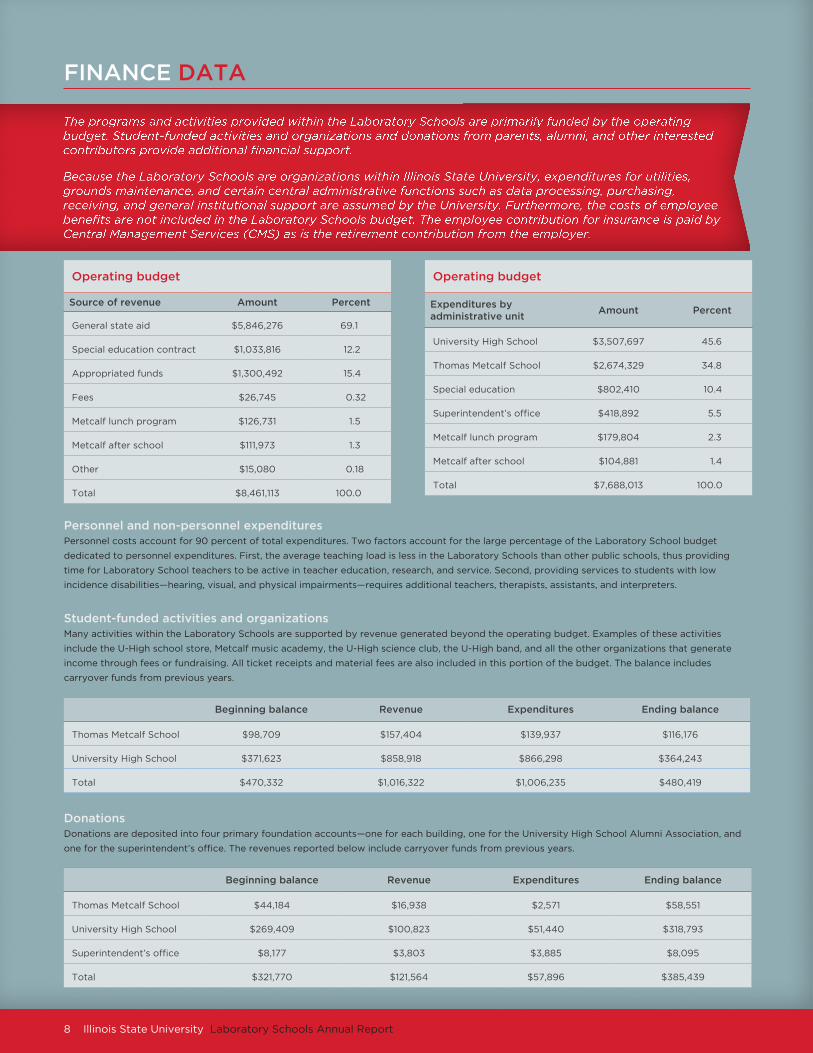
Personnel and non-personnel expenditures Personnel costs account for 90 percent of total expenditures. Two factors account for the large percentage of the Laboratory School budget
dedicated to personnel expenditures. First, the average teaching load is less in the Laboratory Schools than other public schools, thus providing
time for Laboratory School teachers to be active in teacher education, research, and service. Second, providing services to students with low
incidence disabilities—hearing, visual, and physical impairments—requires additional teachers, therapists, assistants, and interpreters.
Student-funded activities and organizations Many activities within the Laboratory Schools are supported by revenue generated beyond the operating budget. Examples of these activities
include the U-High school store, Metcalf music academy, the U-High science club, the U-High band, and all the other organizations that generate
income through fees or fundraising. All ticket receipts and material fees are also included in this portion of the budget. The balance includes
carryover funds from previous years.
Beginning balance Revenue Expenditures Ending balance
Thomas Metcalf School $98,709 $157,404 $139,937 $116,176
University High School $371,623 $858,918 $866,298 $364,243
Total $470,332 $1,016,322 $1,006,235 $480,419
DonationsDonations are deposited into four primary foundation accounts—one for each building, one for the University High School Alumni Association, and
one for the superintendent’s office. The revenues reported below include carryover funds from previous years.
Beginning balance Revenue Expenditures Ending balance
Thomas Metcalf School $44,184 $16,938 $2,571 $58,551
University High School $269,409 $100,823 $51,440 $318,793
Superintendent’s office $8,177 $3,803 $3,885 $8,095
Total $321,770 $121,564 $57,896 $385,439
Operating budget
Source of revenue Amount Percent
General state aid $5,846,276 69.1
Special education contract $1,033,816 12.2
Appropriated funds $1,300,492 15.4
Fees $26,745 0.32
Metcalf lunch program $126,731 1.5
Metcalf after school $111,973 1.3
Other $15,080 0.18
Total $8,461,113 100.0
Operating budget
Expenditures by administrative unit
Amount Percent
University High School $3,507,697 45.6
Thomas Metcalf School $2,674,329 34.8
Special education $802,410 10.4
Superintendent’s office $418,892 5.5
Metcalf lunch program $179,804 2.3
Metcalf after school $104,881 1.4
Total $7,688,013 100.0
The programs and activities provided within the Laboratory Schools are primarily funded by the operating budget. Student-funded activities and organizations and donations from parents, alumni, and other interested contributors provide additional financial support.
Because the Laboratory Schools are organizations within Illinois State University, expenditures for utilities, grounds maintenance, and certain central administrative functions such as data processing, purchasing, receiving, and general institutional support are assumed by the University. Furthermore, the costs of employee benefits are not included in the Laboratory Schools budget. The employee contribution for insurance is paid by Central Management Services (CMS) as is the retirement contribution from the employer.

Laboratory Schools Annual Report Illinois State University 9 8 Illinois State University Laboratory Schools Annual Report
CO-CURRICULAR PARTICIPATION
Students are encouraged to participate in the many aca-demic, athletic, and arts-related activities offered outside of the regular school day or schedule. Seventy-two activities are offered at University High School, and 21 activities are offered at Thomas Metcalf School. The total student counts exceed student enrollment at both schools because stu-dents participate in multiple activities.
Metcalf students
U-High students
Academic activities 41 1,279
Athletic activities 252 681
Arts-related activities 529 1,017
Club and school activities 45 430
Total 867 3,407
Average number of activities per student
2.2 5.6
TECHNOLOGY USE
Operating expense per pupilOperating expense per pupil (OEPP) is the gross operating cost
of the combined schools divided by the average daily attendance
(ADA) for the regular school term. Special education expenditures
associated with low-incidence programs provided in the Laboratory
Schools on a contractual basis are not included.
Laboratory Schools State average
$7,037* $12,973**
*Does not include expenditures for utilities, maintenance, and employee benefits
**Average for all Illinois Unit Districts for FY16
FINANCE DATA
SPECIAL EDUCATION SERVICES
Low-incidence programs
DisabilityNumber of students
Number of teachers
Number of assistants
and interpreters
Deaf/Hard-of-hearing 13 4 4
Visually impaired 6 3 1
Total 19 7 5
Related services
ServiceNumber of students
Speech and language therapy 13
Orientation and mobility training 4
Auditory listening therapy 13
The Heart of Illinois Low Incidence Association (HILIA) is a
regional special education cooperative formed to promote,
establish, and maintain a continuum of comprehensive
services for children ages 3 to 21. The Laboratory Schools
offer a site-based center for students with hearing and
vision disabilities. Several support services are offered to
the students enrolled in these programs. These services
include speech and language therapy, auditory listening
therapy, physical therapy, occupational therapy, orientation
and mobility training, auditory assessment services, and
psychological assessment services. The academic curriculum,
which promotes an inclusionary philosophy, and the length
of time and type of supplemental services are determined by
the child’s Individual Education Plan (IEP).
The Laboratory Schools recognize technology is an essential tool for engaging students in the instructional process. Understanding how technology can assist in the gathering, organizing and synthesizing of information is critical to success in the 21st century.
Technology is a tool used to increase student engagement, and it has allowed our faculty to enhance curriculum and facilitate a hands-on learning environment. The focus on increasing student engagement has led the Laboratory Schools to make sure each student has access to a computer during instruction. As a result, the Laboratory Schools have implemented a one-to-one laptop initiative in grades 3-12.
University High School is in the seventh year of a one-to-one initiative, while Thomas Metcalf School is in the fourth year of a Google school concept utilizing Chromebooks. Each family pays a technology fee to support this dynamic learning environment. In addition to each student’s laptop, classrooms are supported with iPads, smartboards, and other computing devices our faculty and our tech coordinators deem appropriate in our effort to engage students at the highest levels.

10 Illinois State University Laboratory Schools Annual Report
Laboratory Schools administrationTy Wolf, Ed.D.
Interim Superintendent, Laboratory Schools
(309) 438-8542
Amy Coffman, Ph.D.
Principal, Thomas Metcalf School
438-7621
Andrea Markert
Principal, University High School
438-8346
UHigh.IllinoisState.edu
Metcalf.IllinoisState.edu
VOLUNTEER HOURS
CONTACT WITH PARENTS“Personal contact” includes parent-teacher conferences, parental visits to school, school visits to home, telephone conversations, and written
correspondence. There was personal contact between 100 percent of students’ parents/guardians and the school staff during the school year.
The Laboratory Schools are very fortunate to have many parents who are involved in the schools’ programs and activities. We would like to extend
our sincere thanks to the members of the Citizens Advisory Council, the Thomas Metcalf School PTO, and the University High School Boosters,
along with all our Lab School families. For more information on ways to become involved with these groups, please contact any of our administrators.
Illinois State University students volunteered 927 hours at Thomas Metcalf School. Illinois State University students volunteered 1,934 hours at University High School.
TEACHER EDUCATION HOURSThe Laboratory Schools provided 40,129 hours of clinical experiences for teacher education students from 25 different University departments.
University Department Clinical Hours
Art 96.00
Biology 1,968.00
Communication Sciences and Disorder 315.00
Dance 80.00
Health Sciences 170.00
History 1,932.00
Kinesiology and Recreation 1,703.00
Mathematics 2,884.00
Music 2,091.00
Psychology 155.00
School of Teaching and Learning 26,892.50
Special Education 1,166.00
Technology 85.00
Theatre 592.00
Total hours 40,129.00

10 Illinois State University Laboratory Schools Annual Report
TEACHER EDUCATION HOURSThe Laboratory Schools provided 40,129 hours of clinical experiences for teacher education students from 25 different University departments.
University Department Clinical Hours
Art 96.00
Biology 1,968.00
Communication Sciences and Disorder 315.00
Dance 80.00
Health Sciences 170.00
History 1,932.00
Kinesiology and Recreation 1,703.00
Mathematics 2,884.00
Music 2,091.00
Psychology 155.00
School of Teaching and Learning 26,892.50
Special Education 1,166.00
Technology 85.00
Theatre 592.00
Total hours 40,129.00
Presentations by faculty at University High School
“Social Science Standards in a Business Class,” ISU Social Science
Conference, Normal, January 27, 2017—Andrew McDowell
"Doing Justice to History—The Push Toward Making the U.K. and
U.S. Curricula More Inclusive," Ireland International Conference on
Education, Dublin, Ireland, April 25, 2017—Robert Fitzgerald
"Using Technology to Critically Assess Common Core Speaking and
Listening Standards," Illinois Communication and Theatre Association
Annual Convention, Lisle, September 23, 2016—Brian Rohman
“Disney World Candlelight Procession,” Candlelight Procession,
Orlando, December 30, 2016—Chris Corpus
“Teaching with Technology,” Illinois Teachers of Bilingual Education
Conference, Naperville, February 24, 2017—Tisha Ortega
“iResearch: Authentic Research Projects in the 21st Century,” ISLMA
Annual Conference, Illinois School Library Media Association, Tinley
Park Convention Center, November 4, 2016—Gretchen Zaitzeff and
Cassie Graham
“Read, Think, SPEAK: Using YA Literature in Nontraditional High
School Disciplines,” ISLMA Annual Conference, Illinois School Library
Media Association, Tinley Park Convention Center, November 5, 2016—
Gretchen Zaitzeff and Jeff Wollenweber
Service and Leadership by faculty at University High School
ILMEA District 3 Senior Chorus Auditions–Chris Corpus, Adjudicator
American Choral Directors Association Summer Conference–Chris
Corpus, Participant
Admissions Committee–Chris Corpus, Member
Illinois School Library Media Association–Gretchen Zaitzeff, board
member at large
UHS Leadership Team–Gretchen Zaitzeff, member
EdTPA Rubric 10 Exploratory Committee for College of Education–
Gretchen Zaitzeff, member
Honors and Awards by faculty at University High School
Coach Jeremy Stanton received the 2016-2017 NFHS Boys Soccer
Coach of the Year Award (National Federation of State High School
Associations).
Robert Fitzgerald received the Fulbright Distinguished Teacher Award
(Fulbright/Institute for International Education).
Research Projects conducted by faculty at Thomas Metcalf School
“Collaborative Development of Clinical Practice in Literacy:
Strengthening Learning in Teacher Education with Laboratory School
Partners”–Crystal Patterson, Lisa Kendall, Laurel Schumacher, Brittney
Minton, Amy Schumacher, Susi Beard
Presentations by faculty at Thomas Metcalf School
“ISU Future Teacher Training,” Using CCSS with Thematic Units,
Thomas Metcalf School, April 7, 2017–Crystal Patterson and Michelle
Mueller
“Learner Qualities: Self Aware” for Metcalf Late Start, October 1, 2016–
Kim Walker-Smith and Margo Ehrlich
“Larry Ainsworth” for Thomas Metcalf Laboratory School for Late Start
at Illinois State University, Normal, November 20, 2016–Mandy Stalets
“Strategies and Hints for Teachers of the Visually Impaired” for SED
246–Field Work in Low Vision and Blindness Presentation, Illinois State
University, Normal, February 13, 2017–Jan Harrell
“Working with Students with Low Vision and Blindness” for TCH 294–
Middle School Education, Kingsley Middle School, Normal, February 21,
2017–Jan Harrell
“Stop, Collaborate, and Listen!” for Illinois Music Educators Association
Conference, Peoria, January 1, 2017–David Sulzberger
Publications by faculty at Thomas Metcalf School
“Brain Science for Principals: What School Leaders Need to Know,”
How can principals maintain mindfulness in challenging times?; How can
principals support environments that cultivate learning?; How can brain
science inform cultural processes?, July 1, 2016–Christine Paxson
Service and Leadership by faculty at Thomas Metcalf School
IESA Scholar Attitude Awards–Megan Bozarth
Jr. Gamma Phi Circus–Kim Walker-Smith, Director
NBCT Professional Development–Kim Walker-Smith, Facilitator
Faculty Associate Council–Kim Walker-Smith, member
KNR 222–Kim Walker-Smith, Instructor
KNR 242 and KNR 221–Kim Walker-Smith, School Clinical Supervisor
Faculty Advisory Committee–Nancy Harr
HONORS AND AWARDS

This document is available in alternative formats upon request by contacting the Laboratory Schools Superintendent’s Office at (309) 438-8542. An equal opportunity/affirmative action university encouraging diversity. • University Marketing and CoMMUniCations • 18-5084 printed on recycled paper
SERVICE TO PROFESSIONIllinois Vision Leadership Council–Jan Harrell, Membership Chair
Jazz Band–David Sulzberger, Director
Technology Committee–David Sulzberger, Member
TCH 209, Illinois State University College of Education–Michelle Mueller,
Co-teaching
Outreach Through Hosting Area Schools
Observe classroom/Q&A on Standards-Based Grading, Canton Schools,
January 13, 2017–Crystal Patterson
Hosted Visits at Thomas Metcalf School
10/02/16 - Scholars from Japan visited PE classes to learn about
physical education in the U.S.
10/17/16 - Educators from Thailand visited Metcalf
11/29/16 - Eric Parker from Eastern Kentucky University Model
Laboratory School visited Illinois State University Lab Schools to
become familiar with the Lab Schools and to discuss best practices
02/03/17 - Elementary teachers from Panama visited Metcalf
02/07/17 - Education majors from China visited Metcalf
03/01/17 - ISU exchange students from Japan; they come yearly for
classroom observations and technology discussions
03/30/17 - sixth-grade students from Asahikawa, Japan; they come
yearly and are paired with our eighth-grade students to be integrated
into American schools
04/26/17 and 05/04/17 - ISU English Scholars; this group of
scholarship recipients comes annually to spend time in our
classrooms and learn about technology in education