20152010 - GCC Stat
58
: 1 2018 2010 2015
Transcript of 20152010 - GCC Stat

:1
2018
20102015

1
20102015

2
3
4
5
6
8
12
20
33
45
3
.
20102015
.
20102015

4
110002010201513
2 NGL1000 2010201514
32010201515
410002010201516
510002010201517
62010201518
72010201519
8)1000 21
9/)100022
10–)100023
11) 24
122010201525
1310002010201526
1410002010201527
5110002010201528
1610002010201529
1710002010201530
1810002010201531
1910002010201532
202010201534
212010201535
222010201536
232010201537
242010201538
252010201539
2610002010201540
2710002010201541
2810002010201542
2910002010201543
3010002010201544

5
1:2010201513
2:2010201514
3:2010201515
42010201516
52010201517
62010201518
72010201519
8)1000 2010201521
9 /)10002010201522
10)10002010201523
11)2010201524
122010201525
1310002010201526
1410002010201527
5110002010201528
16 10002010201529
1710002010201530
1810002010201531
1910002010201532
202010201534
212010201535
222010201536
232010201537
242010201538
252010201539
2610002010201540
2710002010201541
2810002010201542
2910002010201543
3010002010201544

6
,OPEC , OAPEC AUE
1000
20102015

7
11- States and Organizations
AbbreviationMeaning No
GCC Gulf Cooperation Council1
OPECOrganization of Petroleum ExportingCountries
2
OAPEC Organization of Arab Petroleum Exporting Countries
3
AUEArab Union of Electricity 4
UAE United Arab Emirates5
BHKingdom of Bahrain 6
KSAKingdom of Saudi Arabia7
OMSultanate of Oman8
QAQatar State9
KUKuwait State10
2 2- Units
AbbreviationMeaning No
"000 Thousand 1
1000 B Thousand Barrel 2
m Million 3
b Billion 4
/ B/D Barrel per day 5
/ Cu. Ft. /Day Cubic feet per Day 6
cu. m Cubic meter 7
/ GW/H Giga watt per hour 8
33- Shortcut
AbbreviationMeaning No
.. Nil 1
... Not Available 2
0 The value is zero 3
44 - Note
Some totals may not be equal due to the rounding factor
Data sources are placed under tables in case the data source is not the national statistical centers

8
(IRES)
UNSD IEA Eurostat.
:
o
o .
o
o .
9
(
.
.
.
.
.
.
.
) (
(
"
"" "
.
.

10
o
o
o GasTo Liquid (GTL) (LNG)

11
" "

12
Section 1: Energy Supply
13
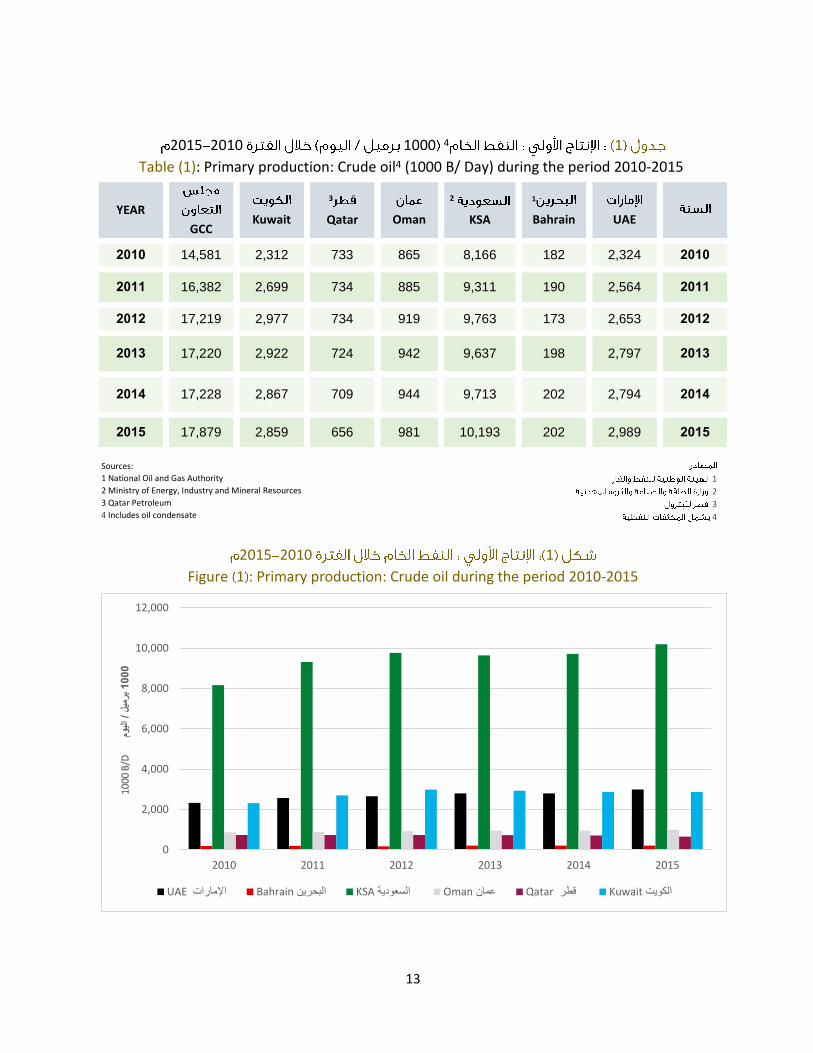
1 4100020102015
Table (1): Primary production: Crude oil4 (1000 B/ Day) during the period 2010-2015
1 20102015
Figure 1 : Primary production: Crude oil during the period 2010-2015
YEAR
GCCKuwait
3
Qatar Oman
2
KSA
1
Bahrain UAE
2010 14,581 2,312 733 865 8,166 182 2,324 2010
2011 16,382 2,699 734 885 9,311 190 2,564 2011
2012 17,219 2,977 734 919 9,763 173 2,653 2012
2013 17,220 2,922 724 942 9,637 198 2,797 2013
2014 17,228 2,867 709 944 9,713 202 2,794 2014
2015 17,879 2,859 656 981 10,193 202 2,989 2015
1
2
3
4
Sources:
1 National Oil and Gas Authority
2 Ministry of Energy, Industry and Mineral Resources
3 Qatar Petroleum
4 Includes oil condensate
0
2,000
4,000
6,000
8,000
10,000
12,000
2010 2011 2012 2013 2014 2015
1000
ل مي
بر /
وم
ليا
10
00
B/D
Bahrainالبحرين UAEالإمارات KSAالسعودية Omanعمان Qatarقطر Kuwaitالكويت

14
2 1000 20102015
Table (2): Primary production: Natural Gas Liquids (NGL) (1000 B/ Day) during the period 2010-2015
2 20102015
Figure 2 : Primary production: Natural Gas Liquids during the period 2010-2015
YEAR
GCC
5
Kuwait
4
Qatar
3
Oman
2
KSA
1
Bahrain UAE
2010 2,857 126 835 .. 1,219 10 666 2010
2011 3,172 137 1,001 .. 1,264 11 759 2011
2012 3,322 152 1,066 .. 1,321 10 773 2012
2013 3,293 147 1,071 4 1,249 10 814 2013
2014 3,192 144 1,039 3 1,291 10 705 2014
2015 3,350 141 1,069 3 1,300 10 828 2015
1
2
3
4
5OAPEC
-OAPEC
Sources:
1 National Oil and Gas Authority
2 Aramco company
3 Ministry of Oil & Gas
4 Qatar Petroleum
5 Organization of Arab Petroleum Exporting Countries –OAPEC
0
200
400
600
800
1,000
1,200
1,400
2010 2011 2012 2013 2014 2015
1000
ل مي
بر /
وم
ليا
10
00
B/D
Bahrainالبحرين UAEالإمارات KSAالسعودية Omanعمان Qatarقطر Kuwaitالكويت
15
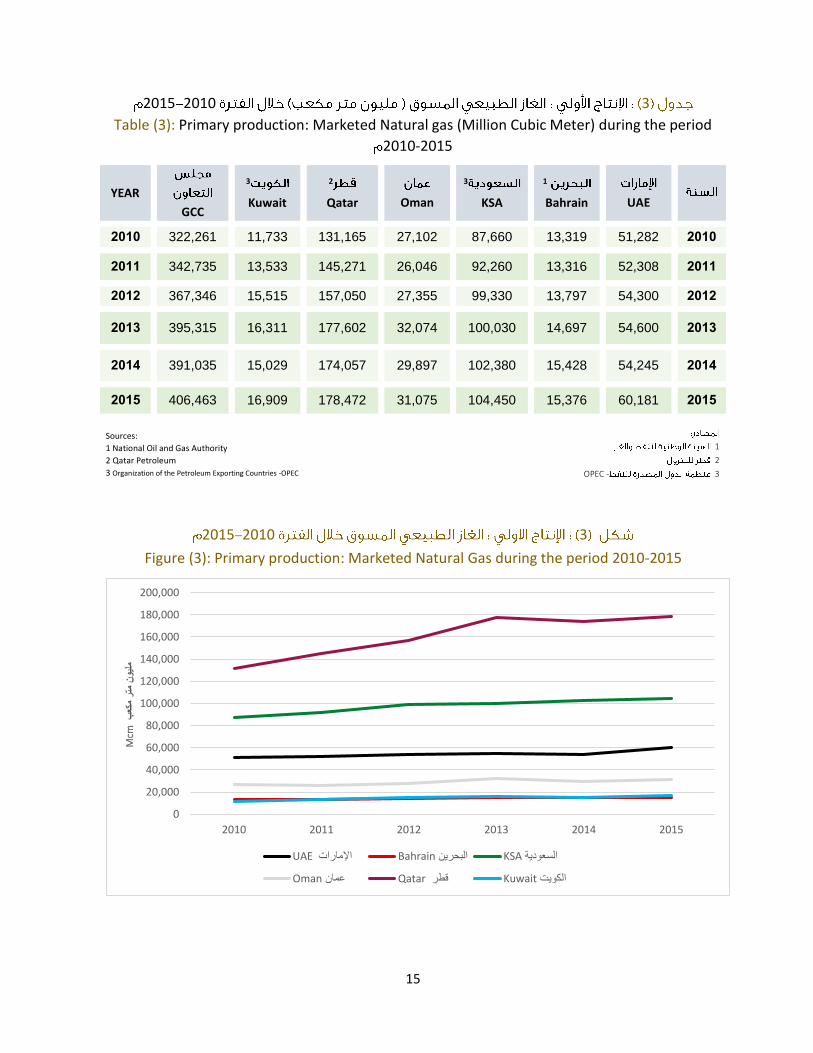
3 20102015
Table (3): Primary production: Marketed Natural gas (Million Cubic Meter) during the period
2010-2015
3 20102015
Figure (3): Primary production: Marketed Natural Gas during the period 2010-2015
YEAR
GCC
3
Kuwait
2
Qatar Oman
3
KSA
1
Bahrain UAE
2010 322,261 11,733 131,165 27,102 87,660 13,319 51,282 2010
2011 342,735 13,533 145,271 26,046 92,260 13,316 52,308 2011
2012 367,346 15,515 157,050 27,355 99,330 13,797 54,300 2012
2013 395,315 16,311 177,602 32,074 100,030 14,697 54,600 2013
2014 391,035 15,029 174,057 29,897 102,380 15,428 54,245 2014
2015 406,463 16,909 178,472 31,075 104,450 15,376 60,181 2015
1
2
3-OPEC
Sources:
1 National Oil and Gas Authority
2 Qatar Petroleum
3 Organization of the Petroleum Exporting Countries -OPEC
0
20,000
40,000
60,000
80,000
100,000
120,000
140,000
160,000
180,000
200,000
2010 2011 2012 2013 2014 2015
Mcm
ب
كع م
تر م
نيو
مل
Bahrainالبحرين UAEالإمارات KSAالسعودية
Omanعمان Qatarقطر Kuwaitالكويت

16
4100020102015
Table (4): Import Crude Oil (1000 B/Day) during the period 2010-2015
420102015
Figure (4): Import Crude Oil during the period 2010-2015
YEAR
GCCKuwait Qatar Oman KSA
1
Bahrain UAE
2010 235 ... ... ... ... 235 ... 2010
2011 217 ... ... ... ... 217 ... 2011
2012 220 ... ... ... ... 220 ... 2012
2013 215 ... ... ... ... 215 ... 2013
2014 208 ... ... ... ... 208 ... 2014
2015 216 ... ... ... ... 216 ... 2015
1
Sources:
1 National Oil and Gas Authority
195
200
205
210
215
220
225
230
235
240
2010 2011 2012 2013 2014 2015
1000
ل مي
بر /
وم
ليا
10
00
B/D
Bahrainالبحرين

17
5100020102015
Table (5): Export Crude Oil (1000 B/Day) during the period 2010-2015
520102015
Figure 5 : Export Crude Oil during the period 2010-2015
YEAR
GCCKuwait
3
Qatar Oman
2
KSA
1
Bahrain UAE
2010 11,595 1,322 587 745 6,644 151 2,146 2010
2011 12,969 1,818 588 738 7,218 150 2,457 2011
2012 13,652 2,070 588 765 7,557 133 2,540 2012
2013 13,771 2,047 599 833 7,571 143 2,579 2013
2014 13,255 1,995 595 800 7,153 154 2,557 2014
2015 13,114 1,965 491 844 7,163 150 2,501 2015
1
2-OPEC
3
Sources:
1 National Oil and Gas Authority
2 Organization of the Petroleum Exporting Countries -OPEC
3 Qatar Petroleum
0
1,000
2,000
3,000
4,000
5,000
6,000
7,000
8,000
2010 2011 2012 2013 2014 2015
1000
ل مي
بر /
وم
ليا
10
00
B/D
Bahrainالبحرين UAEالإمارات KSAالسعودية Omanعمان Qatarقطر Kuwaitالكويت

18
620102015
Table (6): Import Electricity (GW.H) during the period 2010-2015
620102015
Figure 6 Import Electricity during the period 2010-2015
YEAR
GCC
3
Kuwait
1
Qatar
2
Oman
1
KSA
1
Bahrain UAE السنة
2010 273 38 43 .. .. 192 .. 2010
2011 353 96 17 12 1 227 .. 2011
2012 384 106 8 7 13 35 215 2012
2013 437 124 8 3 6 70 226 2013
2014 639 136 7 4 4 240 248 2014
2015 1,130 133 79 25 461 198 234 2015
1AUE-
2
3
Sources:
1 Arab Union of Electricity – AUE
2 Authority for Electricity Regulation
3 Ministry of Electricity and Water
0
50
100
150
200
250
300
350
400
450
500
2010 2011 2012 2013 2014 2015
GW
.H
ت وا
جاجي
.
ه
عسا
Bahrainالبحرين UAEالإمارات KSAالسعودية
Omanعمان Qatarقطر Kuwaitالكويت

19
720102015
Table (7): Export Electricity (GW H) during the period 2010-2015
720102015
Figure ) 7 : Export Electricity during the period 2010-2015
YEAR
GCC
3
Kuwait
1
Qatar
2
Oman
1
KSA
1
Bahrain UAE
2010 219 83 59 .. .. 19 58 2010
2011 348 124 47 .. 8 107 62 2011
2012 634 136 27 18 14 190 249 2012
2013 490 164 25 2 5 53 242 2013
2014 732 178 26 9 6 237 276 2014
2015 1,268 175 98 15 512 219 249 2015
1AUE-
2
3
Sources:
1 Arab Union of Electricity – AUE
2 Authority for Electricity Regulation
3 Ministry of Electricity and Water
0
100
200
300
400
500
600
2010 2011 2012 2013 2014 2015
GW
.H
ت وا
جاجي
.
عه
سا
UAEالإمارات
Bahrainالبحرين
KSAالسعودية
Omanعمان
Qatarقطر
Kuwaitالكويت

20
Section II: Energy Transformations

21
820102015
)1000
Table (8): Fuel consumed in power plants during the period 2010-2015
Crude Oil ) 1000 B)
(8)20102015
Figure (8): Fuel consumed in power plants Crude oil during the period 2010-2015
YEAR
GCC
2
Kuwait Qatar Oman
1
KSA Bahrain UAE
2010 162,094 17,963 … … 144,131 … … 2010
2011 153,911 19,447 … … 134,464 … … 2011
2012 150,015 16,567 … … 133,448 … … 2012
2013 127,972 11,324 … … 116,648 … … 2013
2014 153,744 14,409 … … 139,335 … … 2014
م2015 … … .. … … 4,849 .. 2015
1
2
Sources:
1 Saudi Electricity Company
2 Ministry of Electricity and Water
0
20,000
40,000
60,000
80,000
100,000
120,000
140,000
160,000
KSAالسعودية Kuwaitالكويت
1000
ل مي
بر1000
B
2010 2011 2012 2013 2014 2015

22
920102015
)1000
Table (9): Fuel consumed in power plants during the period 2010-2015 Gas Oil Diesel ) 1000 B)
920102015
Figure (9): Fuel consumed in power plants Gas oil / Diesel during the period 2010-2015
YEAR
GCC
3
Kuwait Qatar
2
Oman
1
KSA
1
Bahrain
1
UAE
2010 86,370 9088 .. 951 76331 .. .. 2010
2011 87,205 10247 .. 986 75972 .. .. 2011
2012 92,010 11914 .. 1094 76263 .. 2739 2012
2013 91,262 9237 .. 1220 79718 20 1067 2013
2014 87,139 11154 .. 1335 74262 20 368 2014
2015 85,571 8570 .. 1511 75384 27 79 2015
1 - AUE
2
3
Sources:
1 Arab Union of Electricity - AUE
2 Authority for Electricity Regulation
3 Ministry of Electricity and Water
0
10000
20000
30000
40000
50000
60000
70000
80000
90000
2010 2011 2012 2013 2014 2015
1000
ل
ميبر
B
1000
Bahrainالبحرين UAEالإمارات KSAالسعودية Omanعمان Qatarقطر Kuwaitالكويت

23
1020102015
)1000
Table (10): Fuel consumed in power plants during the period 2010-2015
(1000 B)) Oil Fuel (Heavy oil
10)(
20102015
Figure (10): Fuel consumed in power plants Oil Fuel (Heavy Oil) during the period 2010-2015
YEAR
GCC
3
Kuwait Qatar Oman
2
KSA Bahrain
1
UAE
2010 60,438 43,903 .. .. 16,536 .. .. 2010
2011 59,202 38,935 .. .. 20,267 .. .. 2011
2012 64,876 38,558 .. .. 24,362 .. 1,956 2012
2013 72,673 46,967 .. .. 24,527 .. 1,179 2013
2014 74,653 37,955 .. .. 36,233 .. 465 2014
2015 46,895 46,722 .. .. .. .. 173 2015
:
1 - AUE
2
3
Sources:
1 Arab Union of Electricity - AUE
2 Saudi Electricity Company
3 Ministry of Electricity and Water
0
5,000
10,000
15,000
20,000
25,000
30,000
35,000
40,000
45,000
50,000
2010 2011 2012 2013 2014 2015
1000
ل
ميبر
B
1000
Bahrainالبحرين UAEالإمارات KSAالسعودية Omanعمان Qatarقطر Kuwaitالكويت

24
1120102015
)
Table (11) Fuel consumed in power plants during the period 2010-2015
(Million Cubic Meter) Natural Gas
1120102015
Figure (11): Fuel consumed in power plants -Natural Gas during the period 2010-2015
YEAR
GCC
4
Kuwait
3
Qatar
2
Oman
1
KSA Bahrain UAE
2010 32,145 5,936 .. 6,283 19,926 .. .. 2010
2011 35,431 6,829 .. 6,616 21,986 .. .. 2011
2012 40,203 7,473 .. 7,468 25,262 .. .. 2012
2013 50,942 7,173 11,262 7,324 25,183 .. .. 2013
2014 52,360 8,884 12,140 7,896 23,440 .. .. 2014
2015 30,744 9,933 12,585 8,226 .. .. .. 2015
Sources:
1 Saudi Electricity Company
2 Authority for Electricity Regulation
3 KAHRAMAA (Consumption of independent electricity and water producers for gas (
4 Ministry of Electricity and Water
0
5,000
10,000
15,000
20,000
25,000
30,000
2010 2011 2012 2013 2014 2015
MC
M ب
كع م
تر م
نيو
مل
Bahrainالبحرين UAEالإمارات KSAالسعودية Omanعمان Qatarقطر Kuwaitالكويت
1
2
3
4

25
1220102015
Table (12) Total Electricity production (GW.H) during the period 2010-2015
1220102015
Figure (12): Total Electricity Production during the period 2010-2015
YEAR
GCC
2
Kuwait Qatar Oman
1
KSA Bahrain UAE
2010 452,158 57,082 28,144 19,159 240,067 13,757 93,949 2010
2011 472,613 57,488 30,731 21,354 250,077 13,826 99,137 2011
2012 512,356 61,119 34,788 24,444 271,679 14,104 106,222 2012
2013 530,067 60,982 34,668 25,661 284,017 14,760 109,979 2013
2014 576,768 65,140 38,693 28,343 311,807 16,257 116,528 2014
2015 624,745 68,288 41,499 32,082 338,327 17,183 127,366 2015
1
2
Sources:
1 Ministry of Water and Electricity
2 Ministry of Electricity and Water
0
50,000
100,000
150,000
200,000
250,000
300,000
350,000
400,000
Bahrainالبحرين UAEالإمارات KSAالسعودية Omanعمان Qatarقطر Kuwaitالكويت
GW
.H
ت وا
جاجي
. عه
سا
2010 2011 2012 2013 2014 2015

26
13100020102015
Table (13): Refineries Input - Crude Oil ( 1000B) during the period 2010-2015
13–20102015
Figure (13): Refineries Input - Crude Oil during the period 2010-2015
YEAR
GCC
4
Kuwait
3
Qatar
Oman
2
KSA
1
Bahrain UAE
2010 1,048,957 .. 53,444 60,966 629,330 96,802 208,415 2010
2011 1,071,315 .. 53,168 74,194 617,647 94,531 231,775 2011
2012 1,105,351 .. 53,045 72,452 650,836 96,148 232,870 2012
2013 1,062,368 .. 45,706 69,258 613,855 96,298 237,250 2013
2014 1,166,439 .. 41,498 66,511 729,822 93,913 234,695 2014
2015 1,749,592 325,887 60,335 69,954 795,690 96,956 400,770 2015
1
2 JODI
3
4
Sources:
* Include condensate
1 National Oil and Gas Authority
2 Joint Organizations Data Initiative JODI
3 Qatar Petroleum
4 Ministry of Oil & Gas
0
100,000
200,000
300,000
400,000
500,000
600,000
700,000
800,000
900,000
Bahrainالبحرين UAEالإمارات KSAالسعودية Omanعمان Qatarقطر Kuwaitالكويت
1000
ل
ميبر
B
1000
2010 2011 2012 2013 2014 2015

27
14 –100020102015
Table (14): Refineries Output - Liquefied Petroleum Gases (LPG) (1000 B) during the period 2010-2015
14–20102015
Figure (14): Refineries Output - Liquefied Petroleum Gases (LPG) during the period 2010-2015
YEAR
GCCKuwait
2
Qatar Oman
1
KSA Bahrain
UAE
2010 74,874 46,099 4,015 3,243 12,228 564 8,726 2010
2011 78,903 50,035 2,920 4,352 11,970 574 9,052 2011
2012 81,762 55,478 3,650 3,888 11,249 612 6,885 2012
2013 85,671 53,638 3,614 3,349 13,862 654 10,555 2013
2014 87,519 52,652 3,614 3,796 16,171 685 10,602 2014
2015 104,166 67,726 3,541 3,745 16,758 735 11,662 2015
1
2
Sources:
1 Ministry of Energy, Industry and Mineral Resources
2 Qatar Petroleum
0
10,000
20,000
30,000
40,000
50,000
60,000
70,000
80,000
Bahrainالبحرين UAEالإمارات KSAالسعودية Omanعمان Qatarقطر Kuwaitالكويت
1000
ل
ميبر
B
1000
2010 2011 2012 2013 2014 2015

28
15–100020102015
Table (15): Refineries Output - Gasoline (1000 B) during the period 2010-2015
15–20102015
Figure (15): Refineries Output - Gasoline during the period 2010-2015
YEAR
GCCKuwait
2
Qatar Oman
1
KSA Bahrain UAE
2010 219,770 19,065 16,425 16,234 137,080 6,877 24,089 2010
2011 236,567 18,727 15,695 23,265 142,584 6,248 30,048 2011
2012 241,224 19,012 15,330 23,476 145,889 5,642 31,875 2012
2013 229,256 20,641 13,870 21,737 134,692 5,064 33,252 2013
2014 258,185 20,938 13,870 25,356 160,938 6,398 30,685 2014
2015 287,121 17,436 14,783 26,107 179,901 6,981 41,914 2015
1
2
Sources:
1 Ministry of Energy, Industry and Mineral Resources
2 Qatar Petroleum
0
20,000
40,000
60,000
80,000
100,000
120,000
140,000
160,000
180,000
200,000
2010 2011 2012 2013 2014 2015
1000
يل
رمب
B
1000
Bahrainالبحرين UAEالإمارات KSAالسعودية Omanعمان Qatarقطر Kuwaitالكويت

29
61–1000
20102015
Table ( 61 ): Refineries Output Kerosene Jet Fuel (1000 B) during the period 2010-2015
(16)–20102015
Figure ( 61 ): Refineries Output Kerosene Jet Fuel during the period2010 -2015
YEAR
GCCKuwait
2
Qatar Oman
1
KSA Bahrain UAE
2010 239,378 66,213 25,915 4,597 58,112 24,868 59,674 2010
2011 241,791 63,934 26,645 4,925 60,738 24,213 61,336 2011
2012 242,988 56,786 26,828 5,544 63,802 24,675 65,353 2012
2013 252,316 67,962 24,601 4,394 59,455 26,604 69,301 2013
2014 260,609 66,429 24,601 4,806 77,315 23,254 64,204 2014
2015 294,931 69,204 26,609 5,170 76,954 25,821 91,173 2015
1
2
Sources:
1 Ministry of Energy, Industry and Mineral Resources
2 Qatar Petroleum
0
10,000
20,000
30,000
40,000
50,000
60,000
70,000
80,000
90,000
100,000
Bahrainالبحرين UAEالإمارات KSAالسعودية Omanعمان Qatarقطر Kuwaitالكويت
1000
يلرم
ب1
00
0B
2010 2011 2012 2013 2014 2015

30
17–100020102015
Table (17): Refineries Output - Naphtha (1000 B) during the period 2010-2015
17 –20102015
Figure (17): Refineries Output - Naphtha during the period 2010-2015
YEAR
GCCKuwait Qatar Oman
1
KSA Bahrain UAE
2010 222,529 76,021 .. 3,568 71,690 15,626 55,624 2010
2011 211,666 70,988 .. 4,604 62,122 14,656 59,296 2011
2012 197,118 52,379 .. 4,975 64,180 15,871 59,713 2012
2013 210,670 69,877 .. 3,113 58,654 16,338 62,688 2013
2014 228,162 71,338 .. 4,066 70,272 16,721 65,765 2014
2015 247,826 71,938 .. 4,124 68,770 14,322 88,672 2015
1 Sources:
1 Ministry of Energy, Industry and Mineral
sources
0
10,000
20,000
30,000
40,000
50,000
60,000
70,000
80,000
90,000
100,000
2010 2011 2012 2013 2014 2015
1000
يلرم
ب1
00
0B
Bahrainالبحرين UAEالإمارات KSAالسعودية Omanعمان Qatarقطر Kuwaitالكويت

31
18–100020102015
Table (18) Refineries Output - Gas Oil & Diesel (1000 B) during the period 2010-2015
18 –20102015
Figure (18): Refineries Output - Gas Oil & Diesel during the period 2010-2015
YEAR
GCCKuwait
2
Qatar Oman
1
KSA Bahrain UAE
2010 410,801 78,145 18,615 11,115 231,212 31,891 39,823 2010
2011 414,029 78,576 16,790 16,014 229,397 28,390 44,862 2011
2012 420,177 84,205 16,243 15,472 234,122 30,529 39,606 2012
2013 400,833 78,585 16,279 14,108 219,768 28,504 43,590 2013
2014 466,051 80,612 16,279 19,642 274,842 29,517 45,159 2014
2015 567,739 82,548 14,710 22,102 351,471 30,436 66,473 2015
1
2
Sources:
1 Ministry of Energy, Industry and Mineral Resources
2 Qatar Petroleum
0
50,000
100,000
150,000
200,000
250,000
300,000
350,000
400,000
Bahrainالبحرين UAEالإمارات KSAالسعودية Omanعمان Qatarقطر Kuwaitالكويت
1000
يلرم
ب1
00
0B
2010 2011 2012 2013 2014 2015

32
19–100020102015
Table (19): Refineries Output - Fuel Oil (1000 B) during the period 2010-2015
19–20102015
Figure (19): Refineries Output - Fuel Oil during the period 2010-2015
YEAR
GCCKuwait
2
Qatar Oman
1
KSA Bahrain UAE
2010 274,159 71,881 1,825 2,268 162,575 15,399 20,211 2010
2011 251,375 64,669 1,460 3,314 152,172 16,275 13,485 2011
2012 275,660 73,125 1,825 3,342 168,383 16,175 12,810 2012
2013 273,691 67,945 2,300 2,084 166,197 16,676 18,490 2013
2014 282,007 67,959 2,300 2,667 175,676 14,287 19,119 2014
2015 274,434 74,559 2,482 2,563 163,156 14,436 17,238 2015
1
2
Sources:
1 Ministry of Energy, Industry and Mineral Resources
2 Qatar Petroleum
0 20,000 40,000 60,000 80,000 100,000 120,000 140,000 160,000 180,000 200,000
2010
2011
2012
2013
2014
2015
1000
يلرم
ب1
00
0B
Kuwaitالكويت Qatarقطر Omanعمان KSAالسعودية Bahrainالبحرين UAEالإمارات

33
Section III:
Final Energy Consumption

34
2020102015
Table (20): Electricity Consumption in the industrial sector (GW.H) during the period 2010-2015
20 2010 2015
Figure 20: Electricity consumption in the industrial sector during the period 2010-2015
YEAR
GCC
5
Kuwait
4
Qatar Oman
3
KSA
2
Bahrain
1
UAE
2010 59,803 1,242 7,773 1,541 38,569 1,408 9,270 2010
2011 68,199 1,324 9,089 2,583 42,129 1,821 11,254 2011
2012 70,952 1,340 9,798 3,436 41,711 1,739 12,928 2012
2013 81,702 1,410 9,944 3,686 51,080 2,017 13,564 2013
2014 98,626 17,541 11,568 4,189 51,499 2,632 11,196 2014
2015 93,358 15,913 11,887 4,723 45,134 2,728 12,973 2015
1
2
3
4
5
Sources:
1 Ministry of Energy
2 Electricity and Water Authority
3 Ministry of Water and Electricity
4 KAHRAMAA
5 Ministry of Electricity and Water
0
10,000
20,000
30,000
40,000
50,000
60,000
2010 2011 2012 2013 2014 2015
GW
.H
ت وا
جاجي
. عه
سا
Bahrainالبحرين UAEالإمارات KSAالسعودية
Omanعمان Qatarقطر Kuwaitالكويت

35
21
20102015
Table (21): Electricity Consumption in Commercial and Public Services Sector (GW.H) during the period 2010-2015
21 2010 2015
Figure 21 : Electricity consumption in Commercial and Public Services Sector during the period
2010-2015
YEAR
GCC
4
Kuwait Qatar Oman
3
KSA
2 *
Bahrain
1
UAE
2010 102,701 7,999 .. 5,727 53,824 4,720 30,431 2010
2011 107,861 8,613 .. 6,380 56,928 4,523 31,417 2011
2012 120,574 9,720 .. 6,929 65,898 4,551 33,476 2012
2013 124,800 10,108 .. 7,708 66,884 4,855 35,245 2013
2014 136,818 11,734 .. 8,291 72,866 5,521 39,319 2014
2015 166,450 14,175 .. 9,637 80,876 6,141 55,621 2015
0
10,000
20,000
30,000
40,000
50,000
60,000
70,000
80,000
90,000
Bahrainالبحرين UAEالإمارات KSAالسعودية Omanعمان Qatarقطر Kuwaitالكويت
GW
.H
ت وا
جاجي
. عه
سا
2010 2011 2012 2013 2014 2015
1
2*
3
4
Sources:
1 Ministry of Energy
2 Electricity and Water Authority - *Commercial only
3 Ministry of Water and Electricity
4 Ministry of Electricity and Water

36
2220102015
Table (22): Electricity Consumption in the Residential sector (GW.H) during the period 2010-2015
22 2010 2015
Figure 22 : Electricity consumption in the Residential sector during the period 2010-2015
YEAR
GCC
5
Kuwait
4
Qatar Oman
3
KSA
2
Bahrain
1
UAE
2010 211,094 38,203 16,844 8,397 108,627 5,966 33,058 2010
2011 214,179 37,815 18,670 9,060 109,261 5,871 33,502 2011
2012 229,034 39,452 20,387 10,039 120,246 6,309 32,601 2012
2013 235,398 39,094 20,121 10,787 125,678 6,426 33,292 2013
2014 234,863 24,678 22,216 11,959 133,904 6,985 35,121 2014
2015 253,921 25,998 24,491 13,757 144,041 7,626 38,008 2015
1
2
3
4
5
Sources:
1 Ministry of Energy
2 Electricity and Water Authority
3 Ministry of Water and Electricity
4 KAHRAMAA - Includes (residential, commercial and governmental)
5 Ministry of Electricity and Water
0
20,000
40,000
60,000
80,000
100,000
120,000
140,000
160,000
2010 2011 2012 2013 2014 2015
GW
.H
ت وا
جاجي
. عه
سا
Bahrainالبحرين UAEالإمارات KSAالسعودية Omanعمان Qatarقطر Kuwaitالكويت
37
2320102015
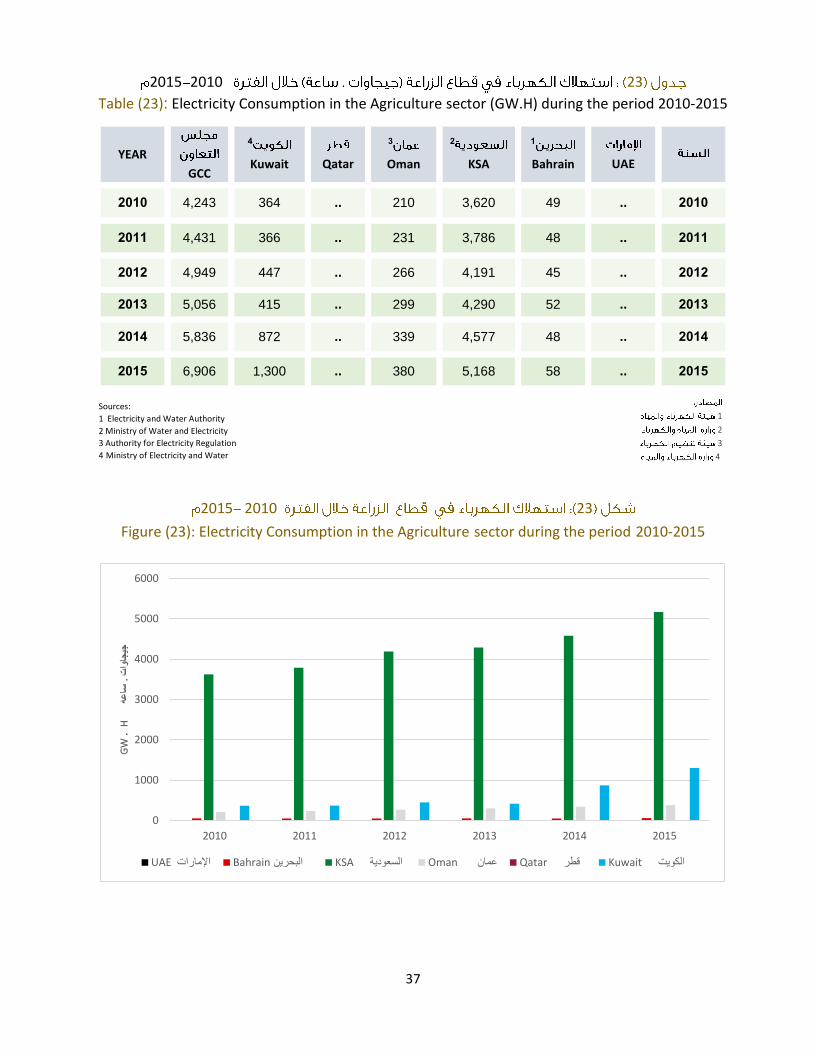
Table (23): Electricity Consumption in the Agriculture sector (GW.H) during the period 2010-2015
23 2010 2015
Figure (23): Electricity Consumption in the Agriculture sector during the period 2010-2015
YEAR
GCC
4
Kuwait Qatar
3
Oman
2
KSA
1
Bahrain UAE
2010 4,243 364 .. 210 3,620 49 .. 2010
2011 4,431 366 .. 231 3,786 48 .. 2011
2012 4,949 447 .. 266 4,191 45 .. 2012
2013 5,056 415 .. 299 4,290 52 .. 2013
2014 5,836 872 .. 339 4,577 48 .. 2014
2015 6,906 1,300 .. 380 5,168 58 .. 2015
1
2
3
4
Sources:
1 Electricity and Water Authority
2 Ministry of Water and Electricity
3 Authority for Electricity Regulation
4 Ministry of Electricity and Water
0
1000
2000
3000
4000
5000
6000
2010 2011 2012 2013 2014 2015
GW
.H
ت وا
جاجي
. عه
سا
Bahrainالبحرين UAEالإمارات KSAالسعودية Omanعمان Qatarقطر Kuwaitالكويت

38
2420102015
Table (24): Electricity Consumption in the other sectors (GW.H) during the period 2010-2015
24 2010 2015
Figure 24 : Electricity Consumption in the other sectors during the period 2010-2015
YEAR
GCC
4
Kuwait Qatar
3
Oman
2
KSA Bahrain
1
UAE
2010 25,424 713 .. 259 7,623 .. 16,829 2010
2011 27,898 748 .. 258 7,557 .. 19,335 2011
2012 31,972 992 .. 289 8,242 .. 22,448 2012
2013 33,137 809 .. 310 8,756 .. 23,262 2013
2014 36,640 544 .. 394 9,653 .. 26,049 2014
2015 31,873 659 .. 415 10,819 .. 19,980 2015
Sources:
1 Ministry of Energy (Include agricultural data)
2 Ministry of Water and Electricity
3 Authority for Electricity Regulation
4 Ministry of Electricity and Water
1
2
3
4
0
5,000
10,000
15,000
20,000
25,000
30,000
Bahrainالبحرين UAEالإمارات KSAالسعودية Omanعمان Qatarقطر Kuwaitالكويت
GW
.H
ت وا
جاجي
. عه
سا
2010 2011 2012 2013 2014 2015

39
2520102015
Table (25): Total Electricity Consumption (GW.H) during the period 2010-2015
252010 2015
Figure 25 : Total Electricity Consumption during the period 2010-2015
YEAR
GCC
6
Kuwait
5
Qatar
4
Oman
3
KSA
2
Bahrain
1
UAE
2010 403,263 48,520 24,617 16,133 212,263 12,142 89,588 2010
2011 422,568 48,865 27,759 18,512 219,661 12,263 95,508 2011
2012 457,480 51,951 30,185 20,959 240,288 12,644 101,453 2012
2013 480,092 51,835 30,065 22,791 256,688 13,350 105,363 2013
2014 515,699 55,369 33,784 25,172 274,503 15,186 111,685 2014
2015 552,506 58,045 36,377 28,912 286,038 16,552 126,582 2015
1
2
3
4
5
6
Sources:
1 Ministry of Energy
2 Electricity and Water Authority
3 Ministry of Water and Electricity
4 Authority for Electricity Regulation
5 KAHRAMAA
6 Ministry of Electricity and Water
0
50,000
100,000
150,000
200,000
250,000
300,000
350,000
Bahrainالبحرين UAEالإمارات KSAالسعودية Omanعمان Qatarقطر Kuwaitالكويت
GW
.H
ت وا
جاجي
. عه
سا
2010 2011 2012 2013 2014 2015

40
26100020102015
Table (26): Consumption of Liquefied petroleum gases - LPG (1000 B) during the period 2010-2015
2620102015
Figure 26 : Consumption of Liquefied petroleum gases - LPG during the period 2010-2015
YEAR
GCCKuwait
2
Qatar Oman
1
KSA Bahrain UAE
2010 22,035 1,523 730 966 13,428 557 4,832 2010
2011 27,420 1,603 1,095 1,133 18,292 569 4,728 2011
2012 26,379 2,186 986 1,332 16,356 605 4,914 2012
2013 25,275 1,493 1,022 1,569 15,259 643 5,289 2013
2014 25,878 1,635 1,168 1,761 15,188 678 5,448 2014
2015 27,521 1,664 1,095 1,915 16,127 717 6,002 2015
Sources:
1 Ministry of Energy, Industry and Mineral Resources
2 Qatar Petroleum
1
2
0
2,000
4,000
6,000
8,000
10,000
12,000
14,000
16,000
18,000
20,000
البحرين UAEالإمارات
BahrainKSAالسعودية Omaعمان Qatarقطر Kuwaitالكويت
1000
يلرم
ب1
00
0B
2010 2011 2012 2013 2014 2015

41
27100020102015
Table (27): Consumption of Gasoline (1000 B) during the period 2010-2015
2720102015
Figure 27 : Consumption of Gasoline during the period 2010-2015
YEAR
GCCKuwait
2
Qatar Oman
1
KSA Bahrain UAE
2010 250,791 26,223 9,125 15,937 151,353 5,314 42,839 2010
2011 258,814 21,555 9,855 16,479 162,462 5,103 43,360 2011
2012 279,889 22,276 10,804 18,402 175,919 5,687 46,801 2012
2013 303,503 23,983 11,826 19,661 184,137 5,981 57,914 2013
2014 316,626 24,491 12,666 21,224 190,706 6,360 61,181 2014
2015 330,015 25,941 13,505 22,649 203,978 6,611 57,331 2015
1
2
Sources:
1 Ministry of Energy, Industry and Mineral Resources
2 Qatar Petroleum
0
50,000
100,000
150,000
200,000
250,000
Bahrainالبحرين UAEالإمارات KSAالسعودية Omanعمان Qatarقطر Kuwaitالكويت
1000
يلرم
ب1
00
0B
2010 2011 2012 2013 2014 2015

42
28100020102015
Table (28): Consumption of Kerosene and Jet Fuel (1000 B) during the period 2010-2015
2820102015
Figure 28 : Consumption of Kerosene and Jet Fuel during the period 2010-2015
YEAR
GCCKuwait
2
Qatar Oman
1
KSA Bahrain UAE
2010 72,771 6,862 9,490 3,128 23,247 564 29,480 2010
2011 75,135 5,426 11,680 2,974 23,896 380 30,779 2011
2012 84,524 5,065 16,060 3,291 24,760 421 34,927 2012
2013 100,836 4,835 14,272 2,949 25,561 570 52,650 2013
2014 97,567 5,614 17,557 3,041 27,283 511 43,561 2014
2015 126,808 36,424 22,265 3,739 31,366 478 62,536 2015
1
2
3OAPEC
Sources:
1 Ministry of Energy, Industry and Mineral Resources
2 Qatar Petroleum
3 Organization of Arab Petroleum Exporting Countries –OAPEC
0
10,000
20,000
30,000
40,000
50,000
60,000
70,000
2010 2011 2012 2013 2014 2015
1000
يلرم
ب1
00
0B
Bahrainالبحرين UAEالإمارات KSAالسعودية Omanعمان Qatarقطر Kuwaitالكويت

43
29100020102015
Table (29): Consumption of Gas Oil & Diesel (1000 B) during the period 2010-2015
29 20102015
Figure 29 : Consumption of Gas Oil & Diesel during the period 2010-2015
YEAR
GCCKuwait
2
Qatar Oman
1
KSA Bahrain UAE
2010 303,551 20,249 12,410 12,643 224,653 2,655 30,941 2010
2011 313,637 18,532 12,775 11,775 237,630 2,405 30,520 2011
2012 336,117 19,368 11,206 13,467 260,163 2,606 29,307 2012
2013 341,323 19,984 9,271 14,608 266,323 2,278 28,859 2013
2014 349,834 19,984 8,687 16,051 274,939 2,214 27,959 2014
2015 358,645 20,816 14,965 16,219 284,116 2,405 20,124 2015
1
2
Sources:
1 Ministry of Energy, Industry and Mineral Resources
2 Qatar Petroleum
0
50,000
100,000
150,000
200,000
250,000
300,000
Bahrainالبحرين UAEالإمارات KSAالسعودية Omanعمان Qatarقطر Kuwaitالكويت
1000
يلرم
ب1
00
0B
2010 2011 2012 2013 2014 2015

44
30100020102015
Table (30): Consumption of Fuel Oil (1000 B) during the period 2010-2015
3020102015
Figure 30 : Consumption of Fuel Oil during the period 2010-2015
YEAR
GCCKuwait Qatar
2
Oman
1
KSA Bahrain UAE
2010 142,717 49,035 .. 10,293 83,005 .. 384 2010
2011 143,337 37,327 .. 11,169 94,360 .. 481 2011
2012 139,733 29,794 .. 13,140 96,401 .. 398 2012
2013 172,222 45,707 .. 13,943 112,309 .. 263 2013
2014 191,093 35,609 .. 16,024 138,524 .. 936 2014
2015 207,158 345,234 .. 16,024 145,625 .. 275 2015
1
2OAPEC
3
Sources:
1 Ministry of Energy, Industry and Mineral Resources
2 Organization of Arab Petroleum Exporting Countries –OAPEC
3 Ministry of Oil & Gas
0
20000
40000
60000
80000
100000
120000
140000
160000
2010 2011 2012 2013 2014 2015
1000
يلرم
ب1
00
0B
Bahrainالبحرين UAEالإمارات KSAالسعودية Omanعمان Qatarقطر Kuwaitالكويت

45

46
Transport sector: consumption of fuels and electricity by any economic entity to
transport of goods or persons between points of departure and destination
within the national territory. Divided into "class transport” The means of
transport following:
Domestic aviation
Roads
Rail
Internal navigation
Transport via pipelines
Transport not elsewhere specified
Other: This category includes consumption of other sectors such as:
Households (household sector)
Commercial and public services
Agriculture, forestry and fishing
What is not specified elsewhere
The energy sector, which is not specified.

47
Energy Transformations
Energy Transformation or Secondary production (middle block in the energy balance) is the
manufacture of energy products through the process of transformation of primary fuels or energy
(the processes that convert an energy product into another energy product, which, in general, is
more suitable for specific uses) For example:-
o Electricity: Transformation in the Electric Power Plant of petroleum
products) crude oil and natural gas ( to electricity.
o Refineries: Transformation in the Refinery Plant of crude oil to
petroleum products.
o Other: such as GasTo Liquid (GTL) plants for the transformation of,
natural gas to liquefied natural gas (LNG).
Final Energy consumption
Final energy consumption: represent the third block in the energy and its flows are reflecting
energy consumption by energy consumers, as well as non-energy use of energy products. The
final consumption is measured by the deliveries of energy products to all consumers. It excludes
deliveries of fuel and other energy products for use in transformation processes and the use of
energy products for energy needs of the energy industries.
The energy sector: refers to consumption of fuels and energy for the direct support of
the production, and preparation for use of fuels and energy. Quantities of fuels, which
are transformed into other fuels or energy, are not included here but within the
transformation use.
Industry: The final consumption recorded under this category covers the use of energy
products for energy purposes by economic units belonging to the industry groups
listed below:
Iron and steel
Chemicals and petrochemicals
Non-ferrous metals
Nonferrous metals
Transport equipment
Mechanisms
Mining and quarrying
Foodstuffs and tobacco
Pulp and paper and printing
Wood and wood products
Textiles and leather
Construction
Other industries not elsewhere specified
48
Exports of energy products: comprise all fuel and other energy products leaving the
national territory with the exception that exports exclude quantities of fuels delivered for use
by merchant (including passenger) ships and civil aircraft, of all nationalities, during
international transport of goods and passengers. Goods simply being transported through a
country (goods in transit) and goods temporarily withdrawn are excluded but re-exports,
foreign goods exported in the same state as previously imported, are included. Fuels
delivered to foreign merchant ships and civil aircraft engaged in international travel are
classified as “International Marine” or “Aviation Bunkers”, respectively. Note that “country
of destination” of energy products (that is country of the last known destination as it is known
at the time of exportation) should be recorded as a country to which these products are
exported to.
International Bunkers: These include:
International Marine Bunkers are quantities of fuels delivered to merchant (including
passenger) ships, of any nationality, for consumption during international voyages
transporting goods or passengers. International voyages take place when the ports of
departure and arrival are in different national territories. Fuels delivered for
consumption by ships during domestic transportation, fishing or military uses are not
included here. For the purposes of energy statistics International Marine Bunkers are
not included in exports
International Aviation Bunkers are quantities of fuels delivered to civil aircraft, of any
nationality, for consumption during international flights transporting goods or
passengers. International flights take place when the ports of departure and arrival are
in different national territories. Fuels delivered for consumption by aircraft undertaking
domestic or military flights are not included here. For the purposes of energy statistics
International Aviation Bunkers are not included in exports.
Stock changes: stocks are quantities of energy products that can be held and used to:
(a) maintain service under conditions where supply and demand are variable in their timing or
amount due to normal market fluctuations, or (b) supplement supply in the case of a supply
disruption.
Stocks used to manage a supply disruption may be called ”strategic” or “emergency” stocks
and are often held separately from stocks designed to meet normal market fluctuations. Stock
changes are defined as the increase (stock build) or decrease (stock draw) in the quantity of
stock over the reporting period. They are calculated as a difference between the closing and
opening stocks

49
Statistical concepts, definitions and terminology
All statistical concepts, definitions and terminology use in this publication refers to international
standards, which are the International Recommendations for Energy Statistics (IRES) devlopped
by UNSD and Energy Statistics Manual of the International Energy Agency and the Eurostat.
Energy supply
The energy supply represent the top block of an energy balance according to UNSD, IEA or Eurostat
balance structure. It is intended to show flows representing energy entering the national territory
for the first time, energy removed from national territory and stock changes.
The entering flows consist of:
Production of primary energy products represented in this publication by primary
production of crude oil and marketed natural gas,
Imports of both primary and secondary energy products; such as import of crude oil and
electricity.
The removing flows consist of:
Exports of primary and secondary energy products (crude oil and Electricity),
International bunkers.
Primary energy production: is the capture or extraction of fuels or energy from natural energy
flows, the biosphere and natural reserves of fossil fuels within the national territory in a form
suitable for use. Inert matter removed from the extracted fuels and quantities re-injected,
flared or vented are not included.
Imports of energy products: comprise all fuel and other energy products entering the national
territory. Goods simply being transported through a country (goods in transit) and goods
temporarily admitted are excluded but re-imports, which are domestic goods exported but
subsequently readmitted, are included. The bunkering of fuel outside the reference territory
by national merchant ships and civil aircraft engaged in international travel is excluded from
imports. Fuels delivered to national merchant ships and civil aircraft which are outside of the
national territory and are engaged in international travel should be classified as “International
Marine” or “Aviation Bunkers”, respectively, in the country where such bunkering is carried
out .Note that the “country of origin” of energy products should be recorded as a country from
which goods were imported.

50
Statistical Definitions and
Terminology

51
The methodology used in the preparation of the Energy Statistics
Bulletin and the User Notice
Data sources
The statistics in the bulletin are derived from the official sources in the GCC
countries, where the national statistical agencies in the GCC countries are the
official source of data for the GCC statistical center, which in turn represents the
link between the Gulf statistical center and data producers from other parties such
as Governmental bodies and others. Some of the missing data were based on data
from other international organizations such as OPEC, OAPEC AUE.
Energy data collection and processing mechanism
Energy data are collected from national statistical agencies in member countries
through annual publications published on the websites of member countries. Data
collected by national bodies and ministries as well as by international organizations
are also used to compare and correct data.
The data are then reviewed, audited and coordinated according to the publishing
schedules. Some units are converted from one formula to another (for example,
crude oil production from 1,000 metric tons to 1,000 barrels, natural gas
production from 1 million cubic feet to 1 million cubic meters) )
Time period
The data published in this publication represent a time series from 2010-2015.

52
Page Figure 13Figure 1: Primary production : crude oil production 2010-2015
14Figure 2: Primary production : Natural Gas Liquids production 2010-2015
15Figure 3: : Primary production :Marketed Natural gas (Million Cubic Meter) 2010-2015
16Figure (4): Import Crude Oil (1000 B/Day) 2010-2015
17Figure (5): Export Crude Oil (1000 B/Day) 2010-2015
18Figure (6): Import Electricity (GW.H) 2010-2015
19Figure (7): Export Electricity (GW.H) 2010-2015
21Figure (8): Fuel consumed in power plants Crude oil (1000 B)
22Figure (9): Fuel consumed in power plants Gas Oil / Diesel (1000 B)
23 Figure (10): Fuel consumed in power plants Heavy oil (1000 B)
24Figure (11): Fuel consumed in power plants Natural gas (million cubic meter )2010-2015
25Figure (12): Electricity production (GW.H) 2010-2015
26Figure (13): Input Refineries - crude oil (1000 barrels) 2010-2015
27Figure (14): Output of Refineries - Liquefied Petroleum Gases (LPG) (1000 B) 2010-2015
28Figure (15): Output of Refineries- Gasoline (1000 B) 2010-2015
29Figure (16): Output of Refineries Kerosene/ Jet Fuel (1000 B) 2010-2015
30Figure (17): Output of Refineries- Naphtha (1000 B) 2010-2015
31Figure (18): Output of Refineries- Gas Oil & Diesel (1000 B) 2010-2015
32Figure (19): Output of Refineries- Fuel Oil (1000 B) 2010-2015
34Figure (20): Electricity Consumption in the industrial sector (GW/H) 2010-2015
35Figure (21): Electricity Consumption in the Service and Public Administration sector (GW.H) 2010-2015
36Figure (22): Electricity Consumption in the Residential sector (GW.H) 2010-2015
37Figure (23): Electricity Consumption in the Agriculture sector (GW.H) 2010-2015
38Figure (24): Electricity Consumption in the other sector (GW.H) 2010-2015
39Figure (25): Total Electricity Consumption (GW.H) 2010-2015
40Figure (26): Consumption of Liquefied petroleum gases - LPG (1000 B) 2010-2015
41Figure (27): Consumption of Gasoline (1000 B) 2010-2015
42Figure (28): Consumption of Jet Fuel (1000 B) 2010-2015
43Figure (29): Consumption of Gas Oil & Diesel (1000 B) 2010-2015
44Figure (30): Consumption of Fuel Oil (1000 B) 2010-2015
Figures list
53
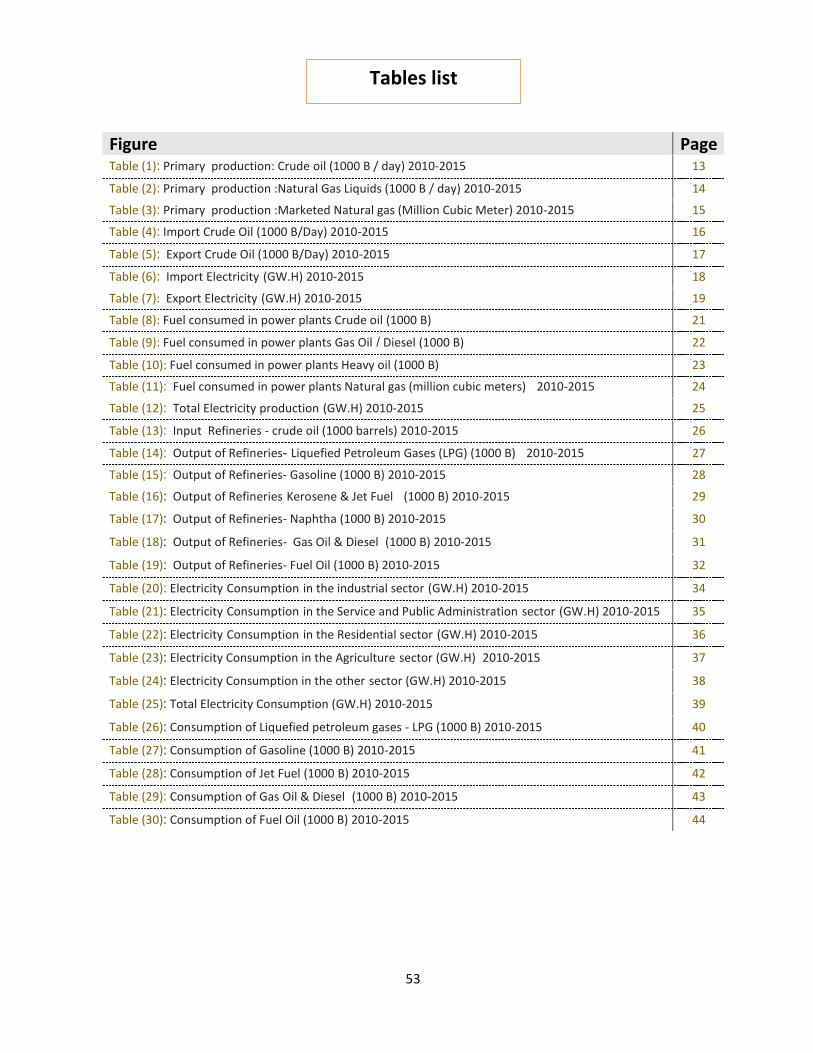
Page Figure 13Table (1): Primary production: Crude oil (1000 B / day) 2010-2015
14Table (2): Primary production :Natural Gas Liquids (1000 B / day) 2010-2015
15Table (3): Primary production :Marketed Natural gas (Million Cubic Meter) 2010-2015
16Table (4): Import Crude Oil (1000 B/Day) 2010-2015
17Table (5): Export Crude Oil (1000 B/Day) 2010-2015
18Table (6): Import Electricity (GW.H) 2010-2015
19Table (7): Export Electricity (GW.H) 2010-2015
21Table (8): Fuel consumed in power plants Crude oil (1000 B)
22Table (9): Fuel consumed in power plants Gas Oil / Diesel (1000 B)
23 Table (10): Fuel consumed in power plants Heavy oil (1000 B)
24Table (11): Fuel consumed in power plants Natural gas (million cubic meters) 2010-2015
25Table (12): Total Electricity production (GW.H) 2010-2015
26Table (13): Input Refineries - crude oil (1000 barrels) 2010-2015
27Table (14): Output of Refineries - Liquefied Petroleum Gases (LPG) (1000 B) 2010-2015
28Table (15): Output of Refineries- Gasoline (1000 B) 2010-2015
29Table (16): Output of Refineries Kerosene & Jet Fuel (1000 B) 2010-2015
30Table (17): Output of Refineries- Naphtha (1000 B) 2010-2015
31Table (18): Output of Refineries- Gas Oil & Diesel (1000 B) 2010-2015
32Table (19): Output of Refineries- Fuel Oil (1000 B) 2010-2015
34Table (20): Electricity Consumption in the industrial sector (GW.H) 2010-2015
35Table (21): Electricity Consumption in the Service and Public Administration sector (GW.H) 2010-2015
36Table (22): Electricity Consumption in the Residential sector (GW.H) 2010-2015
37Table (23): Electricity Consumption in the Agriculture sector (GW.H) 2010-2015
38Table (24): Electricity Consumption in the other sector (GW.H) 2010-2015
39Table (25): Total Electricity Consumption (GW.H) 2010-2015
40Table (26): Consumption of Liquefied petroleum gases - LPG (1000 B) 2010-2015
41Table (27): Consumption of Gasoline (1000 B) 2010-2015
42Table (28): Consumption of Jet Fuel (1000 B) 2010-2015
43Table (29): Consumption of Gas Oil & Diesel (1000 B) 2010-2015
44Table (30): Consumption of Fuel Oil (1000 B) 2010-2015
Tables list

54
Introduction
The energy sector in the Gulf region is witnessing rapid growth in various fields, including oil, gas, renewable energy and electricity, all contributing to the growth of the economy in the Gulf region. It was therefore necessary to provide high quality statistical data and credibility that enable the researcher and the economic and other data users to study the energy sector more broadly and a long-term view of the development of the energy sector rather than the possibility of drawing policies and decisions that in turn contribute to the growth and prosperity of the region..
In order to achieve the desired objectives among the GCC countries, the GCC Statistical Center was established as the official source of data, information and statistics and to enhance the statistical and informational work of national statistical centers and planning bodies in the GCC states, to be a reliable source and effective engine of the statistical system in the GCC countries, By providing decision makers, researchers and interested in the GCC countries with the approved statistical knowledge.
The Statistical Center of the GCC States is pleased to present the first edition of the "Energy Statistics in the GCC Countries Annual Bulletin 2010-2015", which reviews the most important data, indicators and terms related to energy statistics in the GCC countries. It is divided into three sections the first section concerns energy supply, which includes (primary production, import and export) And the second section on energy transfermaions, particularly in refineries and electricty stations. Finally, the third section, which includes the final consumption of energy, and the data tables are displayed with the graph classified by the Gulf Countries and the year. The time series of data published covers six years from 2010 to 2015. Data were collected through the websites of statistical centers of gulf cooperation council, as well as some other data provided by member states to the center.
As the Statistical Center is pleased to thank, and appreciation of all statistical centers in member states to provide the data required to complete the publication, and thanked all the staff of the Statistical Center, who contributed effectively output the publication . welcomed any proposals or ongoing reviews that will enrich the content of the newsletter, and working to develop best in upcoming releases God willing.

55
page Contents
54 Introduction
53 List of tables
52 List of graphs
51
The methodology used in the preparation of the Energy Statistics Bulletin and the users warning
50 Concepts and terminology
12 Section 1
Energy Supply
20 Section 2
Energy Transformations
33 Section 3
Energy Consumption
45
Data sources
56
Bulletin of Energy Statistics for the GCC Countries
2010-2015

57
Energy statistics
Bulletin for the GCC
Countries 2010-2015
Version: 1
April 2018


![Improving GCC Retargetability - CSE · GCC stands for GNU Compiler Collection. GCC is an integrated distribution of compilers for several programming languages[11]. GCC is one of](https://static.fdocuments.in/doc/165x107/5ed8c3576714ca7f4768857f/improving-gcc-retargetability-cse-gcc-stands-for-gnu-compiler-collection-gcc.jpg)