2015/16 season report Team X - The official website for ... Elite Club Injury Study 2015/16 season...
35
UEFA Elite Club Injury Study Report 2015/16 UEFA Elite Club Injury Study 2015/16 season report Team X
Transcript of 2015/16 season report Team X - The official website for ... Elite Club Injury Study 2015/16 season...

UEFA Elite Club Injury Study Report 2015/16
UEFA Elite Club Injury Study
2015/16 season report
Team X

UEFA Elite Club Injury Study Report 2015/16
1
The UEFA Elite Club Injury Study was initiated by and is funded and supported by UEFA.
This report has been produced on behalf of the UEFA Medical Committee by:
Professor Jan Ekstrand, MD, PhD, Linkoping University
Former first vice-chairman of the UEFA Medical Committee
Correspondence should be addressed to:
Injury Study Group
Professor Jan Ekstrand
Hertig Karlsgatan 13 B
582 21 Linkoping
Sweden
Håkan Bengtsson Anna Hallén
[email protected] [email protected]
+46 13 318990
UEFA
Marc Vouillamoz
Head of Medical and Anti-Doping Unit
Niki Papadimitriou
Medical Assistant
Route de Genève 46
1260 Nyon 2
Switzerland
+41 848 00 27 27
+41 22 707 27 34 (fax)

UEFA Elite Club Injury Study Report 2015/16
2
Table of Contents
1 Participating clubs ...................................................................................................................................... 3
2 Presentation ................................................................................................................................................. 3
3 Interpretation of results ............................................................................................................................. 4
4 Exposure ....................................................................................................................................................... 5
5 General injury patterns ............................................................................................................................... 7
5.1 Training injury patterns ................................................................................................................... 10
5.1.1 Training injury rate ................................................................................................................... 10
5.1.2 Days’ absence for training injuries ........................................................................................ 11
5.1.3 Burden of training injuries ...................................................................................................... 11
5.2 Match injury patterns....................................................................................................................... 12
5.2.1 Match injury rate ...................................................................................................................... 12
5.2.2 Days’ absence for match injuries ........................................................................................... 13
5.2.3 Burden of match injuries ........................................................................................................ 13
5.3 Severe injury patterns ...................................................................................................................... 14
5.3.1 Severe injury rate ..................................................................................................................... 14
5.4 Muscle injury patterns ..................................................................................................................... 19
5.4.1 Muscle injury rate .................................................................................................................... 21
5.4.2 Burden of muscle injuries ....................................................................................................... 21
5.4.3 Days’ absence for muscle injuries ......................................................................................... 22
5.5 Ligament injury patterns ................................................................................................................. 15
5.5.1 Ligament injury rate ................................................................................................................ 17
5.5.2 Burden of ligament injuries .................................................................................................... 17
5.5.3 Days’ absence for ligament injuries ...................................................................................... 18
5.6 Re-injury patterns ............................................................................................................................. 18
5.6.1 Re-injury rate (%) ...................................................................................................................... 23
6 Squad attendance/availability and absences ....................................................................................... 24
6.1 Squad attendance/availability ....................................................................................................... 24
6.2 Squad absences ................................................................................................................................ 25
6.3 Number of training sessions/matches missed because of injury ............................................. 28
7 Analyses over 15 seasons ......................................................................................................................... 29
7.1 Injury rates over 15 seasons ............................................................................................................ 29
7.2 Squad attendance/availability and absences over 15 seasons ................................................. 32

UEFA Elite Club Injury Study Report 2015/16
3
1 Participating clubs
This season report contains results from July to June of the 2015/16 season for the 29 clubs that
provided complete data for at least five months. Those clubs are: AFC Ajax, Arsenal FC, AS Roma,
Borussia Dortmund, Chelsea FC, Club Atlético de Madrid, FC Barcelona, FC Basel 1893, FC Porto, FC
Schalke 04, FC Shakhtar Donetsk, FC Zenit, Galatasaray AŞ, Juventus, LOSC Lille, Maccabi Tel-Aviv FC,
Malmö FF, Manchester City FC, Manchester United FC, NK Maribor, Olympique Lyonnais, Paris Saint-
Germain, PSV Eindhoven, Real Madrid CF, SL Benfica, Southampton FC, Sporting Clube de Portugal,
Tottenham Hotspur FC and Valencia CF.
2 Presentation
The report is divided into different sections on general injury patterns, such as data on exposure,
training injuries, match injuries, severe injuries, muscle injuries, ligament injuries, re-injuries, and player
attendance/availability and absence. Each injury section is split into four sub-sections:
Injury patterns: the number of injuries of this type over the season and their relative distribution
as a percentage of the total number of injuries, looking at injury location, type, mechanism,
overuse/trauma, contact/non-contact, severity, re-injury rate, monthly distribution and injury
occasion.
Injury rate: the number of injuries of this type relative to exposure time, allowing the individual
injury rate to be evaluated. Injury rate is expressed as the number of injuries for every 1,000 hours
of exposure.
Days’ absence: total number of days lost because of specific injuries and the minimum, maximum
and average period of absence for such injuries.
Injury burden: a combined measure of the frequency (injury rate) and severity (days´ absence) of
injuries giving the burden of injury for the player and the consequences for the team. Injury burden
is expressed as the number of days’ absence for every 1,000 hours of exposure. Example: Team A
with 10 injuries in 5,000 hours, each resulting in an absence of 10 days on average, has an injury
burden of 20 days for every 1,000 hours. Team B with 20 injuries in 5,000 hours, each resulting in an
absence of 5 days on average, also has an injury burden of 20 days for every 1,000 hours.

UEFA Elite Club Injury Study Report 2015/16
4
3 Interpretation of results
When comparing your club’s results with those of other participating clubs, please bear the following
in mind:
Because of the limited amounts of data collected over one season, the injury rates presented are
sometimes based on just a few actual injuries. This means that some results should be interpreted
with caution.
The overall number of injuries varies between clubs, mainly because of the number of minor
injuries. It is therefore important to look not only at the overall injury rate, but also at the data on
severe injuries and squad availability, as these variables may have a greater impact on the club.
Only months where full data has been provided are included in this analysis. The number of months
of data may therefore differ between teams, and this may influence the injury statistics in the
report.
In the case of players who were still injured at the end of the season, we have used either the club’s
estimated return date or an approximation of severity based on the mean absence for this
particular injury. Some data on the number of days’ absence and injury risk presented in the report
could therefore be based on approximate values/estimates.
We hope that you will find this report useful in your daily work treating and preventing injuries at your
club. Please do not hesitate to contact the Football Research Group (FRG), using the contact details at
the start of this report, if you have any questions about how to interpret the results.

UEFA Elite Club Injury Study Report 2015/16
5
4 Exposure
In total, 215,000 hours of exposure were recorded during the 2015/16 season, with approximately
183,000 training hours (85%) and 32,000 match hours (15%). Team x reported xx hours of total
exposure, with xx training hours (xx%) and xx match hours (xx%).
On average, teams reported 218 training sessions and 59 matches over the reporting period. Since the
reporting period differed between teams, we have also calculated a monthly training and match load.
On average, teams had 20 training sessions and 5.4 matches each month, giving an average training-
to-match exposure ratio of 5.6 hours of training for each hour of match play.
Figure 1. Number of training sessions per month
Figure 2. Number of matches per month
14
1517 17 17 17 18
18 19 19 19 19 20 20 20 20 20 21 21 21 22 22 22 23 2323 23 24
25 26
20
0
5
10
15
20
25
30
x x x x x x x x x x x x x x x x x x x x x x x x x x x x x x ALL
Trai
nin
g se
ssio
ns
per
mo
nth
4.5 4.6 4.74.9 5.0 5.0 5.1 5.1 5.1 5.2 5.2 5.3 5.3 5.4 5.4 5.5 5.5 5.5
5.7 5.7 5.7 5.8 5.8 5.8 5.9 5.9 5.9 6.0 6.1
6.6
5.4
0
1
2
3
4
5
6
7
x x x x x x x x x x x x x x x x x x x x x x x x x x x x x x ALL
Mat
ches
per
mo
nth

UEFA Elite Club Injury Study Report 2015/16
6
Figure 3. Ratio of training hours to match hours
Figure 4. Number of training sessions (blue bars) and matches (red bars) for Team X over the
season
3.1 3.23.5
4.2 4.2 4.3 4.5 4.64.9 5.0 5.0 5.1 5.1 5.1 5.2 5.5
5.8 5.9 5.9 5.9 6.1 6.3 6.4 6.5 6.8 6.97.5
7.98.2
11.8
5.6
0.0
2.0
4.0
6.0
8.0
10.0
12.0
14.0
x x x x x x x x x x x x x x x x x x x x x x x x x x x x x x ALL
Trai
nin
g/M
atch
Rat
io
22
19 19
21
17
6
20
27
21 21
14
98 8
67
2
67
6
8
6
0
5
10
15
20
25
30
Jul Aug Sep Oct Nov Dec Jan Feb Mar Apr May
Trai
nin
g se
ssio
ns/
mat
ches
Training sessions Matches

UEFA Elite Club Injury Study Report 2015/16
7
5 General injury patterns
The tables below show the number (N) and relative distribution (%) of different injuries. In total, 1,200
injuries were reported, with 530 training injuries (44%) and 670 match injuries (56%). There were 228
severe injuries (19%), 540 muscle injuries (45%) and 182 ligament injuries (15%).
Team x reported xx injuries (xx training injuries; xx match injuries) during the season, including xx
severe injuries, xx muscle injuries and xx ligament injuries.
Table 1. Injury location
Training Match play Total
Team X Other teams Team X Other teams Team X Other teams
N % N % N % N % N % N %
Head/face 0 0,0 5 1,0 0 0,0 21 3,2 0 0,0 26 2,2
Neck/cervical spine 0 0,0 5 1,0 0 0,0 2 ,3 0 0,0 7 ,6
Shoulder/clavicula 0 0,0 6 1,2 0 0,0 15 2,3 0 0,0 21 1,8
Upper arm 0 0,0 1 ,2 0 0,0 0 0,0 0 0,0 1 ,1
Elbow 0 0,0 2 ,4 0 0,0 0 0,0 0 0,0 2 ,2
Forearm 0 0,0 1 ,2 0 0,0 1 ,2 0 0,0 2 ,2
Wrist 0 0,0 2 ,4 0 0,0 2 ,3 0 0,0 4 ,3
Hand/finger/thumb 0 0,0 4 ,8 0 0,0 5 ,8 0 0,0 9 ,8
Sternum/ribs/upper back 1 7,7 4 ,8 0 0,0 6 ,9 1 3,2 10 ,9
Abdomen 0 0,0 4 ,8 0 0,0 6 ,9 0 0,0 10 ,9
Lower back/pelvis/sacrum 0 0,0 32 6,2 0 0,0 12 1,9 0 0,0 44 3,8
Hip/groin 4 30,8 85 16,4 3 16,7 84 13,0 7 22,6 169 14,5
Thigh 3 23,1 134 25,9 11 61,1 215 33,2 14 45,2 349 30,0
Knee 0 0,0 82 15,9 1 5,6 90 13,9 1 3,2 172 14,8
Lower leg/Achilles tendon 2 15,4 66 12,8 2 11,1 86 13,3 4 12,9 152 13,0
Ankle 3 23,1 56 10,8 1 5,6 80 12,3 4 12,9 136 11,7
Foot/toe 0 0,0 28 5,4 0 0,0 23 3,5 0 0,0 51 4,4
Total 13 100,0 517 100,0 18 100,0 648 100,0 31 100,0 1165 100,0
Table 2. Injury type
Training Match play Total
Team X Other
teams
Team X Other
teams
Team X Other teams
N % N % N % N % N % N %
Fracture 2 15,4 10 1,9 0 0,0 25 3,9 2 6,5 35 3,0
Other bone injury 1 7,7 2 ,4 0 0,0 2 ,3 1 3,2 4 ,3
Dislocation/subluxation 0 0,0 3 ,6 0 0,0 2 ,3 0 0,0 5 ,4
Sprain/ligament injury 2 15,4 62 12,0 2 11,1 116 17,9 4 12,9 178 15,3
Meniscus/cartilage 0 0,0 20 3,9 0 0,0 23 3,5 0 0,0 43 3,7
Muscle rupture/strain/cramps 8 61,5 218 42,2 14 77,8 300 46,3 22 71,0 518 44,5
Tendon
injury/rupture/tendinosis
0 0,0 52 10,1 1 5,6 29 4,5 1 3,2 81 7,0
Haematoma/contusion/bruise 0 0,0 63 12,2 1 5,6 88 13,6 1 3,2 151 13,0
Laceration 0 0,0 1 ,2 0 0,0 8 1,2 0 0,0 9 ,8
Concussion 0 0,0 2 ,4 0 0,0 8 1,2 0 0,0 10 ,9
Nerve injury 0 0,0 6 1,2 0 0,0 2 ,3 0 0,0 8 ,7
Synovitis/effusion 0 0,0 16 3,1 0 0,0 13 2,0 0 0,0 29 2,5
Overuse unspec 0 0,0 49 9,5 0 0,0 23 3,5 0 0,0 72 6,2
Other injury 0 0,0 13 2,5 0 0,0 9 1,4 0 0,0 22 1,9
Total 13 100,0 517 100,0 18 100,0 648 100,0 31 100,0 1165 100,0

UEFA Elite Club Injury Study Report 2015/16
8
Table 3. Injury mechanism
Training Match play Total
Team X Other teams Team X Other teams Team X Other teams
N % N % N % N % N % N %
Running/sprinting 3 25,0 75 17,7 9 52,9 153 25,7 12 41,4 228 22,4
Twisting/turning 0 0,0 40 9,5 1 5,9 44 7,4 1 3,4 84 8,2
Shooting 4 33,3 49 11,6 3 17,6 19 3,2 7 24,1 68 6,7
Passing/crossing 0 0,0 21 5,0 1 5,9 25 4,2 1 3,4 46 4,5
Dribbling 0 0,0 7 1,7 1 5,9 10 1,7 1 3,4 17 1,7
Jumping/landing 0 0,0 18 4,3 0 0,0 35 5,9 0 0,0 53 5,2
Falling/diving 0 0,0 12 2,8 0 0,0 12 2,0 0 0,0 24 2,4
Stretching 0 0,0 11 2,6 0 0,0 15 2,5 0 0,0 26 2,6
Sliding 0 0,0 13 3,1 0 0,0 5 ,8 0 0,0 18 1,8
Overuse 1 8,3 78 18,4 0 0,0 55 9,2 1 3,4 133 13,1
Hit by ball 0 0,0 9 2,1 0 0,0 4 ,7 0 0,0 13 1,3
Collision 0 0,0 5 1,2 0 0,0 31 5,2 0 0,0 36 3,5
Heading 0 0,0 2 ,5 0 0,0 6 1,0 0 0,0 8 ,8
Tackled 1 8,3 30 7,1 2 11,8 84 14,1 3 10,3 114 11,2
Tackling 3 25,0 10 2,4 0 0,0 20 3,4 3 10,3 30 2,9
Kicked 0 0,0 25 5,9 0 0,0 60 10,1 0 0,0 85 8,3
Blocked 0 0,0 4 ,9 0 0,0 4 ,7 0 0,0 8 ,8
Use of arm/elbow 0 0,0 0 0,0 0 0,0 4 ,7 0 0,0 4 ,4
Other acute mechanism 0 0,0 14 3,3 0 0,0 10 1,7 0 0,0 24 2,4
Total 12 100,0 423 100,0 17 100,0 596 100,0 29 100,0 1019 100,0
Table 4. Overuse/trauma distribution
Training Match play Total
Team X Other teams Team X Other teams Team X Other teams
N % N % N % N % N % N %
Overuse 10 76,9 243 47,0 15 83,3 191 29,4 25 80,6 434 37,2
Trauma 3 23,1 274 53,0 3 16,7 459 70,6 6 19,4 733 62,8
Total 13 100,0 517 100,0 18 100,0 650 100,0 31 100,0 1167 100,0
Table 5. Contact/non-contact distribution
Training Match play Total
Team X Other teams Team X Other teams Team X Other teams
N % N % N % N % N % N %
Non-contact 9 69,2 418 80,9 16 88,9 415 64,0 25 80,6 833 71,5
Contact player 4 30,8 91 17,6 2 11,1 224 34,6 6 19,4 315 27,0
Contact object 0 0,0 8 1,5 0 0,0 9 1,4 0 0,0 17 1,5
Total 13 100,0 517 100,0 18 100,0 648 100,0 31 100,0 1165 100,0
Table 6. Injury severity
Training Match play Total
Team X Other teams Team X Other teams Team X Other teams
N % N % N % N % N % N %
Slight [0 days] 0 0,0 5 1,0 0 0,0 3 ,5 0 0,0 8 ,7
Minimal [1-3 days] 0 0,0 116 22,4 0 0,0 68 10,4 0 0,0 184 15,7
Mild [4-7 days] 0 0,0 133 25,7 2 11,1 133 20,4 2 6,5 266 22,8
Moderate [8-28 days] 8 61,5 182 35,2 11 61,1 311 47,7 19 61,3 493 42,2
Severe [>28 days] 5 38,5 81 15,7 5 27,8 137 21,0 10 32,3 218 18,6
Total 13 100,0 517 100,0 18 100,0 652 100,0 31 100,0 1169 100,0

UEFA Elite Club Injury Study Report 2015/16
9
Table 7. Re-injury rate
Training Match play Total
Team X Other teams Team X Other teams Team X Other teams
N % N % N % N % N % N %
No re-injury 9 69,2 457 88,4 18 100,0 599 91,9 27 87,1 1056 90,3
Re-injury 4 30,8 60 11,6 0 0,0 49 7,5 4 12,9 109 9,3
Unknown 0 0,0 0 0,0 0 0,0 4 ,6 0 0,0 4 ,3
Total 13 100,0 517 100,0 18 100,0 652 100,0 31 100,0 1169 100,0
Table 8. Monthly distribution of injuries
Training Match play Total
Team X Other teams Team X Other teams Team X Other teams
N % N % N % N % N % N %
July 3 9,7 53 10,6 2 6,9 33 5,1 5 8,3 86 7,5
August 3 9,7 46 9,2 1 3,4 44 6,9 4 6,7 90 7,9
September 4 12,9 52 10,4 3 10,3 70 10,9 7 11,7 122 10,7
October 2 6,5 44 8,8 5 17,2 79 12,3 7 11,7 123 10,8
November 3 9,7 32 6,4 2 6,9 76 11,9 5 8,3 108 9,5
December 6 19,4 44 8,8 3 10,3 53 8,3 9 15,0 97 8,5
January 2 6,5 65 13,0 3 10,3 59 9,2 5 8,3 124 10,9
February 2 6,5 46 9,2 4 13,8 79 12,3 6 10,0 125 11,0
March 2 6,5 44 8,8 3 10,3 60 9,4 5 8,3 104 9,1
April 3 9,7 44 8,8 2 6,9 58 9,0 5 8,3 102 8,9
May 1 3,2 29 5,8 1 3,4 30 4,7 2 3,3 59 5,2
June 0 0,0 0 0,0 0 0,0 0 0,0 0 0,0 0 0,0
Total 31 100,0 499 100,0 29 100,0 641 100,0 60 100,0 1140 100,0
Table 9. Injury occasion
Training Match play Total
Team X Other teams Team X Other teams Team X Other teams
N % N % N % N % N % N %
First team 20 90,9 405 95,3 27 93,1 524 87,9 47 92,2 929 91,0
Reserve team 0 0,0 1 ,2 0 0,0 30 5,0 0 0,0 31 3,0
National team 2 9,1 19 4,5 2 6,9 42 7,0 4 7,8 61 6,0
Total 22 100,0 425 100,0 29 100,0 596 100,0 51 100,0 1021 100,0

UEFA Elite Club Injury Study Report 2015/16
10
5.1 Training injury patterns
5.1.1 Training injury rate
The mean training injury rate for all teams was 2.9 injuries for every 1,000 training hours, with
individual rates ranging from 0.4 to 8.6 at the various clubs.
Figure 5. Training injury rate
Figure 6. Monthly distribution of training injuries (blue bars) and training injury rates (red bars) for
Team X across the season
0.4 0.60.9
1.21.4
1.9 1.9 2.0 2.2 2.2 2.2 2.3 2.4 2.4 2.4 2.5 2.63.0 3.0 3.2 3.3
3.7 3.74.0
4.3
5.15.4
5.7
6.9
8.6
2.9
0
1
2
3
4
5
6
7
8
9
x x x x x x x x x x x x x x x x x x x x x x x x x x x x x x ALL
Inci
den
ce
3 3
4
2
3
6
2 2 2
3
1
5.5
4.5
6.2
3.2
5.4
11.8
3.23.8 3.7
6.0
3.2
0.0
2.0
4.0
6.0
8.0
10.0
12.0
14.0
Jul Aug Sep Oct Nov Dec Jan Feb Mar Apr May
Trai
nin
g in
juri
es/i
nci
den
ce
Training injuries Training injury incidence

UEFA Elite Club Injury Study Report 2015/16
11
5.1.2 Days’ absence for training injuries
The average absence for training injuries for all teams was 20 days, with individual amounts ranging
from 4 to 62 days at the various clubs.
Figure 7. Days’ absence for training injuries
5.1.3 Burden of training injuries
The mean injury burden in training was 57 days’ absence for every 1,000 hours, with individual
amounts ranging from 10 to 157 at the various clubs.
Figure 8. Training injury burden
4
9 9 1011 12 12 13 14
16 17 17 1719 20 21
23 2426 26 27 28 28
30
3639 40
45
55
62
20
0
10
20
30
40
50
60
70
x x x x x x x x x x x x x x x x x x x x x x x x x x x x x x ALL
Day
s' a
bse
nce
10 11
2129 30 32 33
39 41 43 45 45 46
56 57 57 5863 63
6974 76 76 78 79
90 9297
111
157
57
0
20
40
60
80
100
120
140
160
180
x x x x x x x x x x x x x x x x x x x x x x x x x x x x x x ALL
Day
s' a
bse
nce
per
1,0
00
tra
inin
g h
ou
rs

UEFA Elite Club Injury Study Report 2015/16
12
5.2 Match injury patterns
5.2.1 Match injury rate
The mean match injury rate for all teams was 20.6 injuries for every 1,000 match hours, with individual
rates ranging from 7.8 to 45.1 at the various clubs.
Figure 9. Match injury rate
Figure 10. Monthly distribution of match injuries (blue bars) and match injury rates (red bars) for
Team X across the season
8
1113 13 13 14 14 15
16 16 16 17 17 17 1719 19 20 20
2223 23
27 27 2728
31 3234
45
21
0
5
10
15
20
25
30
35
40
45
50
x x x x x x x x x x x x x x x x x x x x x x x x x x x x x x ALL
Inci
den
ce
13
01 1
3
02 2 2
0
9.7
25.3
0.0
7.3
10.2
36.4
0.0
17.3 17.5
15.2
0.00.0
5.0
10.0
15.0
20.0
25.0
30.0
35.0
40.0
Jul Aug Sep Oct Nov Dec Jan Feb Mar Apr May
Mat
ch in
juri
es/i
nci
den
ce
Match injuries Match injury incidence

UEFA Elite Club Injury Study Report 2015/16
13
5.2.2 Days’ absence for match injuries
The average absence for match injuries for all teams was 23 days, with individual amounts ranging
from 11 to 65 days at the various clubs.
Figure 11. Days’ absence for match injuries
5.2.3 Burden of match injuries
The mean injury burden in match play was 476 days’ absence for every 1,000 hours, with individual
amounts ranging from 164 to 896 at the various clubs.
Figure 12. Match injury burden
11 13 13 1315
17 18 19 20 21 21 21 21 22 22 22 22 2325 25 25 26
28 30 30 32 33
3942
65
23
0
10
20
30
40
50
60
70
x x x x x x x x x x x x x x x x x x x x x x x x x x x x x x ALL
Day
s' a
bse
nce
164 170197
232 245
296 313 314
363 368387
424 431 432471 475
503 510 510 511
565602
633655
687711 720 721
784
896
476
0
100
200
300
400
500
600
700
800
900
1000
x x x x x x x x x x x x x x x x x x x x x x x x x x x x x x ALL
Day
s' a
bse
nce
per
1,0
00
mat
ch h
ou
rs

UEFA Elite Club Injury Study Report 2015/16
14
5.3 Severe injury patterns
Injuries resulting in more than four weeks´ absence are classified as severe injuries.
Table 10. Severe injury diagnoses
Diagnosis description Team X Other teams
N % N %
[GTHS] Sportsman's hernia 1 25,0 0 0,0
[KJAX] Acute ACL injury 1 25,0 8 3,6
[KAXX] Knee Osteoarthritis 1 25,0 0 0,0
[QFTX] Fractured Midshaft Tibia +/- Fibula 1 25,0 0 0,0
5.3.1 Severe injury rate
The mean severe injury rate for all teams was 1.1 severe injuries for every 1,000 hours, with individual
rates ranging from 0.4 to 2.5 at the various clubs. Please note that since total absences are unknown
where players were still injured at the time of writing, the true figures may differ slightly from those
presented here.
Figure 13. Severe injury rate
0.4 0.4 0.4 0.4 0.40.6 0.6 0.6
0.7 0.7 0.8 0.80.9 0.9
1.0 1.0 1.11.2 1.2 1.3
1.4 1.4 1.41.5 1.5 1.6
2.12.2
2.3
2.5
1.1
0.0
0.5
1.0
1.5
2.0
2.5
3.0
x x x x x x x x x x x x x x x x x x x x x x x x x x x x x x ALL
Inci
den
ce

UEFA Elite Club Injury Study Report 2015/16
15
5.4 Ligament injury patterns
Table 11. Ligament injury diagnoses
Diagnosis description Team X Other teams
N % N %
[KJMB] Grade 2 MCL tear knee 1 16,7 7 4,0
[KJLL] LCL strain/rupture 1 16,7 8 4,6
[AJXX] Ankle Sprains 1 16,7 34 19,4
[AJLX] Ankle lateral ligament sprain 1 16,7 14 8,0
[KJMX] MCL injury knee 2 33,3 15 8,6
Total 6 100,0 175 100,0
Table 12. Mechanism of ligament injuries
Total
Team X Other teams
N % N %
Running/sprinting 0 0,0 1 ,6
Twisting/turning 1 16,7 31 17,8
Shooting 2 33,3 6 3,4
Passing/crossing 0 0,0 2 1,1
Dribbling 0 0,0 7 4,0
Jumping/landing 0 0,0 14 8,0
Falling/diving 0 0,0 3 1,7
Stretching 0 0,0 2 1,1
Sliding 0 0,0 6 3,4
Overuse 0 0,0 2 1,1
Hit by ball 1 16,7 4 2,3
Collision 1 16,7 4 2,3
Tackled 1 16,7 50 28,7
Tackling 0 0,0 18 10,3
Kicked 0 0,0 8 4,6
Blocked 0 0,0 5 2,9
Other acute mechanism 0 0,0 11 6,3
Total 6 100,0 174 100,0
Table 13. Contact/non-contact ligament injuries
Total
Team X Other teams
N % N %
Non-contact 1 16,7 73 41,5
Contact player 3 50,0 98 55,7
Contact object 2 33,3 5 2,8
N/A 0 0,0 0 0,0
Total 6 100,0 176 100,0

UEFA Elite Club Injury Study Report 2015/16
16
Table 14. Severity of ligament injuries
Total
Team X Other teams
N % N %
Slight [0 days] 0 0,0 0 0,0
Minimal [1-3 days] 0 0,0 19 10,8
Mild [4-7 days] 1 16,7 37 21,0
Moderate [8-28 days] 4 66,7 67 38,1
Severe [>28 days] 1 16,7 53 30,1
Total 6 100,0 176 100,0
Table 15. Re-injury rate for ligament injuries
Total
Team X Other teams
N % N %
No re-injury 6 100,0 163 92,6
Re-injury 0 0,0 13 7,4
Total 6 100,0 176 100,0
Table 16. Monthly distribution of ligament injuries
Total
Team X Other teams
N % N %
July 1 16,7 15 8,5
August 1 16,7 16 9,1
September 0 0,0 23 13,1
October 1 16,7 23 13,1
November 1 16,7 19 10,8
December 0 0,0 12 6,8
January 1 16,7 14 8,0
February 0 0,0 19 10,8
March 0 0,0 13 7,4
April 1 16,7 18 10,2
May 0 0,0 4 2,3
June 0 0,0 0 0,0
Total 6 100,0 176 100,0
UEFA Elite Club Injury Study Report 2015/16
17
5.4.1 Ligament injury rate
The mean ligament injury rate for all teams was 0.8 injuries for every 1,000 hours, with individual rates
ranging from 0.1 to 2.9 at the various clubs.
Figure 14. Ligament injury rate
5.4.2 Burden of ligament injuries
The mean ligament injury burden was 29 days’ absence for every 1,000 hours, with individual amounts
ranging from 2 to 83 at the various clubs.
Figure 15. Ligament injury burden
0.10.3 0.3
0.40.6 0.6 0.6 0.6 0.6 0.6 0.6 0.7 0.7 0.7 0.7 0.8 0.8
0.9 0.9 0.91.0 1.0 1.1
1.21.3 1.3 1.3
1.4 1.5
2.9
0.8
0.0
0.5
1.0
1.5
2.0
2.5
3.0
3.5
x x x x x x x x x x x x x x x x x x x x x x x x x x x x x x ALL
Inci
den
ce
2 3 3 49 9
11 13 13 14 1620 22
26 26
3335 36 36 37
43 4347 49 51
54 54 54
61
83
29
0
10
20
30
40
50
60
70
80
90
x x x x x x x x x x x x x x x x x x x x x x x x x x x x x x ALL
Day
s' a
bse
nce
per
1,0
00
exp
osu
re h
ou
rs

UEFA Elite Club Injury Study Report 2015/16
18
5.4.3 Days’ absence for ligament injuries
Table 17. Days’ absence for ligament injuries
Diagnosis description
Ligament injuries
Team X Other teams
N Sum Mean Med Min Max N Sum Mean Med Min Max
[KJMB] Grade 2 MCL tear knee 1 17 17,0 17,0 17 17 7 239 34,1 31,0 8 65
[KJLL] LCL strain/rupture 1 19 19,0 19,0 19 19 8 271 33,9 17,5 5 141
[AJXX] Ankle Sprains 1 33 33,0 33,0 33 33 34 532 15,6 9,0 1 145
[AJLX] Ankle lateral ligament sprain 1 27 27,0 27,0 27 27 14 261 18,6 15,0 1 51
[KJMX] MCL injury knee 2 21 10,5 10,5 4 17 15 220 14,7 10,0 2 63
Total 6 117 19,5 18,0 4 33 175 6095 34,8 15,0 1 227
UEFA Elite Club Injury Study Report 2015/16
19
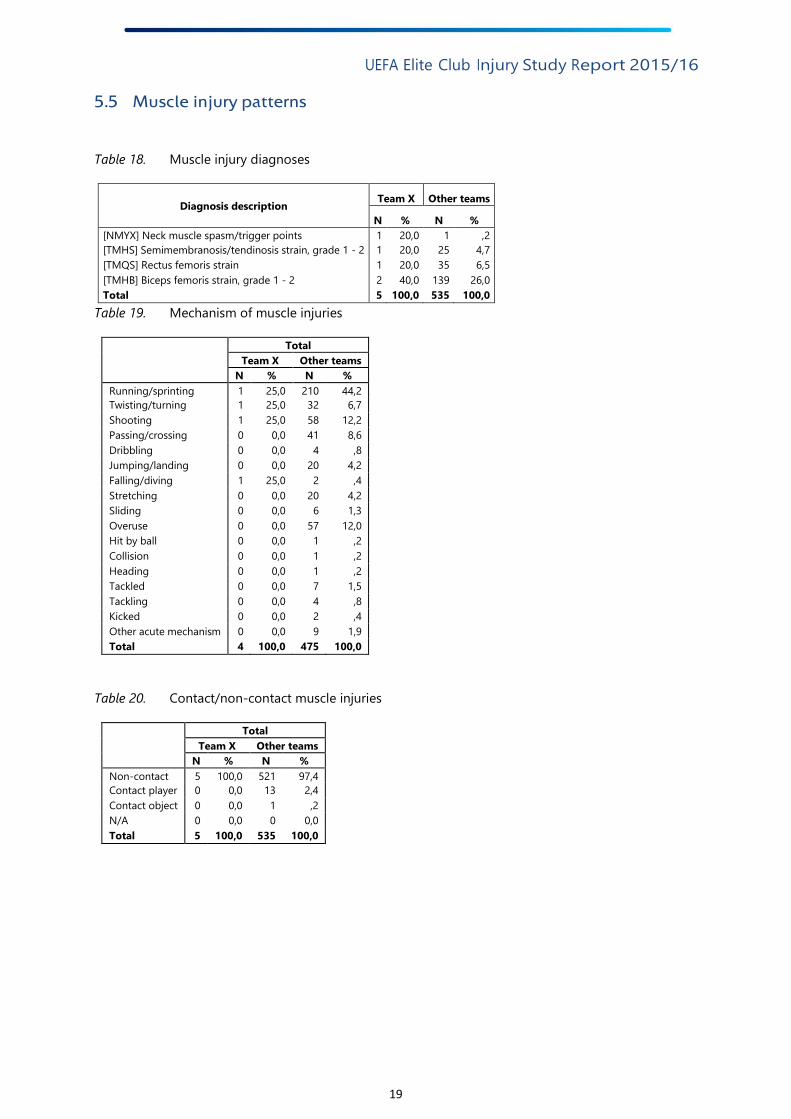
5.5 Muscle injury patterns
Table 18. Muscle injury diagnoses
Diagnosis description Team X Other teams
N % N %
[NMYX] Neck muscle spasm/trigger points 1 20,0 1 ,2
[TMHS] Semimembranosis/tendinosis strain, grade 1 - 2 1 20,0 25 4,7
[TMQS] Rectus femoris strain 1 20,0 35 6,5
[TMHB] Biceps femoris strain, grade 1 - 2 2 40,0 139 26,0
Total 5 100,0 535 100,0
Table 19. Mechanism of muscle injuries
Total
Team X Other teams
N % N %
Running/sprinting 1 25,0 210 44,2
Twisting/turning 1 25,0 32 6,7
Shooting 1 25,0 58 12,2
Passing/crossing 0 0,0 41 8,6
Dribbling 0 0,0 4 ,8
Jumping/landing 0 0,0 20 4,2
Falling/diving 1 25,0 2 ,4
Stretching 0 0,0 20 4,2
Sliding 0 0,0 6 1,3
Overuse 0 0,0 57 12,0
Hit by ball 0 0,0 1 ,2
Collision 0 0,0 1 ,2
Heading 0 0,0 1 ,2
Tackled 0 0,0 7 1,5
Tackling 0 0,0 4 ,8
Kicked 0 0,0 2 ,4
Other acute mechanism 0 0,0 9 1,9
Total 4 100,0 475 100,0
Table 20. Contact/non-contact muscle injuries
Total
Team X Other teams
N % N %
Non-contact 5 100,0 521 97,4
Contact player 0 0,0 13 2,4
Contact object 0 0,0 1 ,2
N/A 0 0,0 0 0,0
Total 5 100,0 535 100,0

UEFA Elite Club Injury Study Report 2015/16
20
Table 21. Severity of muscle injuries
Total
Team X Other teams
N % N %
Slight [0 days] 0 0,0 1 ,2
Minimal [1-3 days] 0 0,0 55 10,3
Mild [4-7 days] 2 40,0 98 18,3
Moderate [8-28 days] 3 60,0 297 55,5
Severe [>28 days] 0 0,0 84 15,7
Total 5 100,0 535 100,0
Table 22. Re-injury rate for muscle injuries
Total
Team X Other teams
N % N %
No re-injury 5 100,0 487 91,0
Re-injury 0 0,0 48 9,0
Total 5 100,0 535 100,0
Table 23. Monthly distribution of muscle injuries
Total
Team X Other teams
N % N %
July 1 6,7 26 5,0
August 2 13,3 33 6,3
September 1 6,7 60 11,4
October 0 0,0 54 10,3
November 1 6,7 53 10,1
December 2 13,3 46 8,8
January 2 13,3 56 10,7
February 1 6,7 63 12,0
March 0 0,0 54 10,3
April 4 26,7 48 9,1
May 1 6,7 32 6,1
June 0 0,0 0 0,0
Total 15 100,0 525 100,0
UEFA Elite Club Injury Study Report 2015/16
21
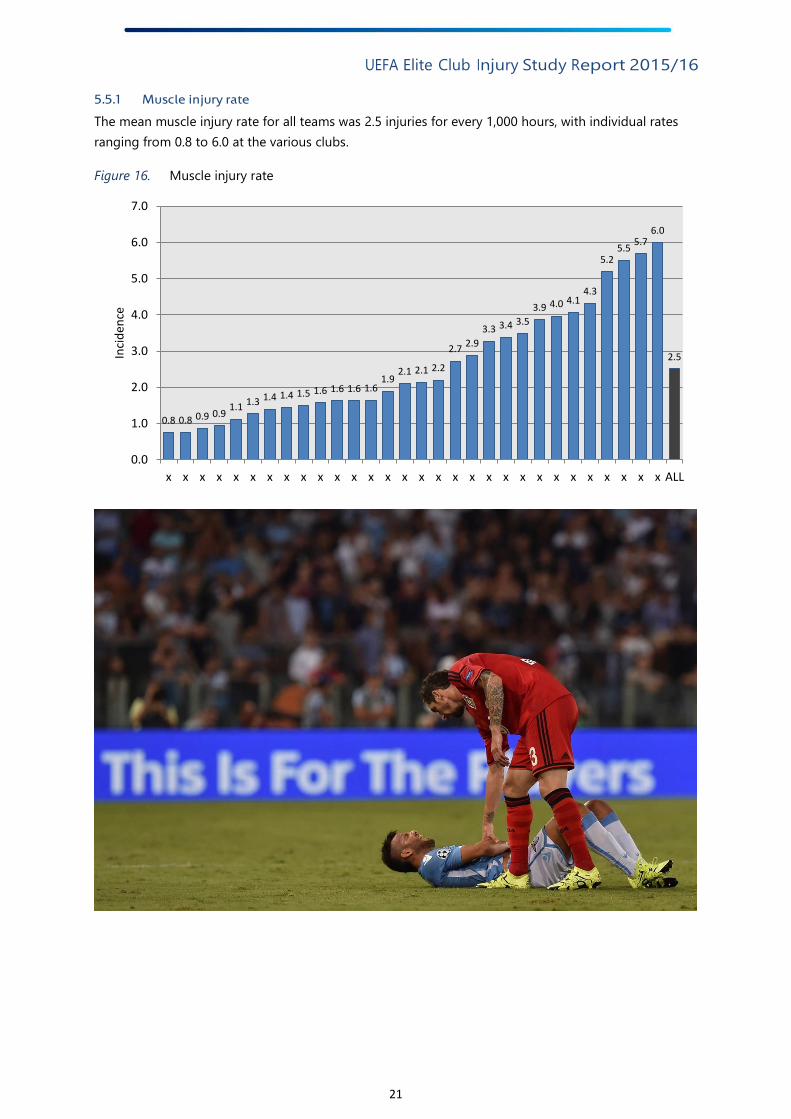
5.5.1 Muscle injury rate
The mean muscle injury rate for all teams was 2.5 injuries for every 1,000 hours, with individual rates
ranging from 0.8 to 6.0 at the various clubs.
Figure 16. Muscle injury rate
0.8 0.8 0.9 0.91.1 1.3 1.4 1.4 1.5 1.6 1.6 1.6 1.6
1.92.1 2.1 2.2
2.72.9
3.3 3.4 3.5
3.9 4.0 4.14.3
5.25.5
5.76.0
2.5
0.0
1.0
2.0
3.0
4.0
5.0
6.0
7.0
x x x x x x x x x x x x x x x x x x x x x x x x x x x x x x ALL
Inci
den
ce

UEFA Elite Club Injury Study Report 2015/16
22
5.5.2 Burden of muscle injuries
The mean muscle injury burden was 44 days’ absence for every 1,000 hours, with individual amounts
ranging from 6 to 102 at the various clubs.
Figure 17. Muscle injury burden
5.5.3 Days’ absence for muscle injuries
Table 24. Days’ absence for muscle injuries
Diagnosis description
Muscle injuries
Team X Other teams
N Sum Mean Med Min Max N Sum Mean Med Min Max
[NMYX] Neck muscle spasm/trigger points 1 4 4,0 4,0 4 4 1 3 3,0 3,0 3 3
[TMHS] Semimembranosis/tendinosis strain 1 17 17,0 17,0 17 17 25 455 18,2 17,0 1 87
[TMQS] Rectus femoris strain 1 15 15,0 15,0 15 15 35 766 21,9 17,0 2 69
[TMHB] Biceps femoris strain, grade 1 - 2 2 19 9,5 9,5 4 15 139 3045 21,9 17,0 2 103
Total 5 55 11,0 15,0 4 17 535 9450 17,7 13,0 0 189
N = number of injuries within each category
Sum = total number of days lost because of injury (consequences for the team)
Mean= average number of days’ absence per injury (expected recovery time)
Med = median days’ absence for all injuries within the category (expected recovery time)
Min = shortest absence for an injury
Max = longest absence for an injury
6 8 11 1117
20 22 23 24 25 26 27
3538 40 40
42
5257
6165 66 67 67 67
76
90
99 100102
44
0
20
40
60
80
100
120
x x x x x x x x x x x x x x x x x x x x x x x x x x x x x x ALL
Day
s' a
bse
nce
per
1,0
00
exp
osu
re h
ou
rs

UEFA Elite Club Injury Study Report 2015/16
23
5.6 Re-injury patterns
Table 25. Re-injury diagnoses
Diagnosis description Team X Other teams
N % N %
[RFUX] Fractured ulna midshaft 1 50,0 0 0,0
[TMXX] Thigh Muscle strain/Spasm/Trigger Points 1 50,0 1 ,9
Total 2 100,0 111 100,0
Table 26. Severity of re-injuries
Total
Team X Other teams
N % N %
Slight [0 days] 0 0,0 0 0,0
Minimal [1-3 days] 1 50,0 9 8,1
Mild [4-7 days] 0 0,0 11 9,9
Moderate [8-28 days] 0 0,0 44 39,6
Severe [>28 days] 1 50,0 47 42,3
Total 2 100,0 111 100,0
5.6.1 Re-injury rate (%)
On average, 9% of injuries sustained were re-injuries, with individual rates ranging from 0% to 28% at
the various clubs.
Figure 18. Re-injury rate
0% 0%
3% 3% 3% 3% 3%5% 6% 6% 6% 6%
7%8% 8% 9% 9% 9%
11%11%11%
13%13%13%13%14%15%
17%
20%
28%
9.4%
0
0
0
0
0
0
0
x x x x x x x x x x x x x x x x x x x x x x x x x x x x x x ALL

UEFA Elite Club Injury Study Report 2015/16
24
6 Squad attendance/availability and absences
All data in the charts in this section is in the form of percentages.
6.1 Squad attendance/availability
Squad attendance/availability refers to the average percentage of players who participated in training
sessions or were available for match selection over the reporting period. An attendance/availability
rate of 100% would mean that no player was absent because of injury, illness, national team duty or
any other reason.
Figure 19. Squad attendance rates for training
Figure 20. Squad availability rates for matches
0%
10%
20%
30%
40%
50%
60%
70%
80%
90%
100%
x x x x x x x x x x x x x x x x x x x x x x x x x x x x x x ALL
Training attendance (%) Training absence (%)
0%
10%
20%
30%
40%
50%
60%
70%
80%
90%
100%
x x x x x x x x x x x x x x x x x x x x x x x x x x x x x x ALL
Match availability (%) Match absence (%)
UEFA Elite Club Injury Study Report 2015/16
25
Figure 21. Team X’s overall squad attendance in training (blue bars) and availability for matches (red
bars) over the season
96%93%
84%
79% 80%
95% 95%
90%
77%
96% 100%96%93%
89%
83% 81%
93% 94%90%
75%
98% 100%
0%
10%
20%
30%
40%
50%
60%
70%
80%
90%
100%
Jul Aug Sep Oct Nov Dec Jan Feb Mar Apr May
Training attendance (%) Match availability (%)

UEFA Elite Club Injury Study Report 2015/16
26
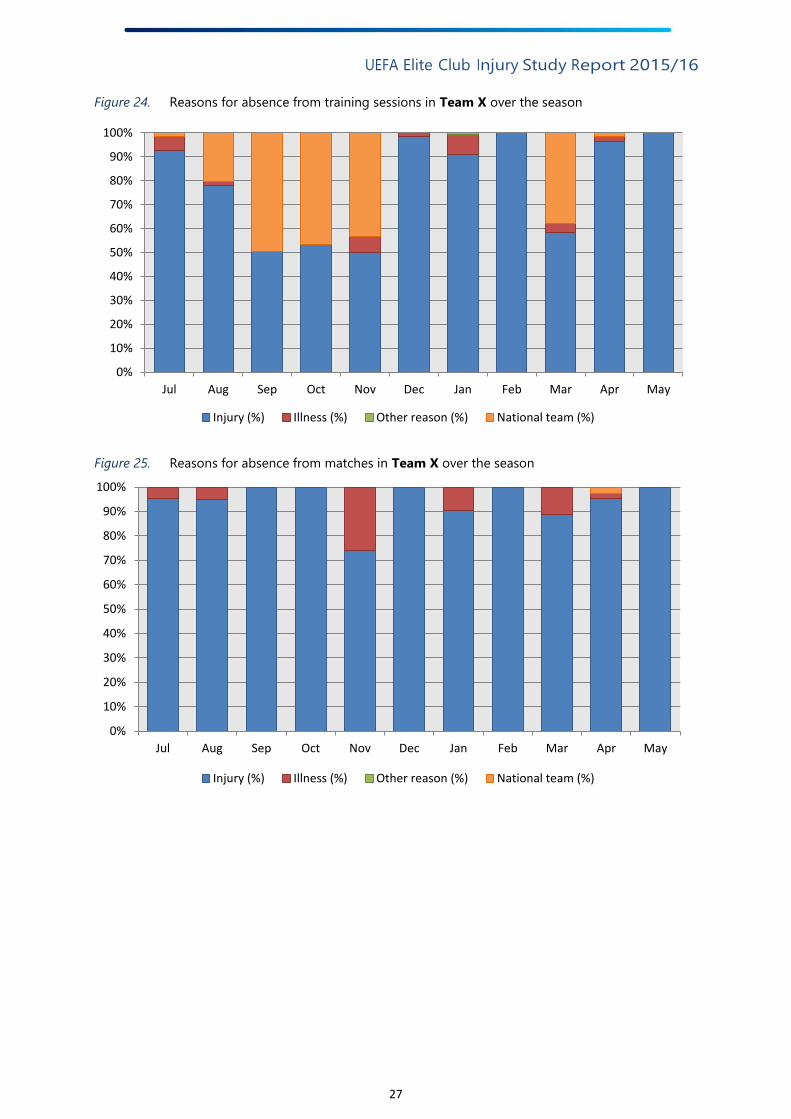
6.2 Squad absences
The charts below break players’ absences down by reason.
Figure 22. Reasons for absence from training sessions
Figure 23. Reasons for absence from matches
0%
10%
20%
30%
40%
50%
60%
70%
80%
90%
100%
x x x x x x x x x x x x x x x x x x x x x x x x x x x x x x ALL
Injury (%) Illness (%) Other reason (%) National team (%)
0%
10%
20%
30%
40%
50%
60%
70%
80%
90%
100%
x x x x x x x x x x x x x x x x x x x x x x x x x x x x x x ALL
Injury (%) Illness (%) Other reason (%) National team (%)
UEFA Elite Club Injury Study Report 2015/16
27
Figure 24. Reasons for absence from training sessions in Team X over the season
Figure 25. Reasons for absence from matches in Team X over the season
0%
10%
20%
30%
40%
50%
60%
70%
80%
90%
100%
Jul Aug Sep Oct Nov Dec Jan Feb Mar Apr May
Injury (%) Illness (%) Other reason (%) National team (%)
0%
10%
20%
30%
40%
50%
60%
70%
80%
90%
100%
Jul Aug Sep Oct Nov Dec Jan Feb Mar Apr May
Injury (%) Illness (%) Other reason (%) National team (%)

UEFA Elite Club Injury Study Report 2015/16
28
6.3 Number of training sessions/matches missed because of injury
The consequences of injuries have also been assessed in terms of the number of training sessions and
matches that players missed during the reporting period. On average, across all clubs, each player
missed 2.1 training sessions and 0.6 matches each month because of injury. Data specific to each club
is presented below.
Figure 26. Number of training sessions missed per player per month owing to injury
Figure 27. Number of matches missed per player per month owing to injury
1.1 1.1 1.11.3
1.4 1.4 1.4 1.41.5 1.6 1.6 1.7 1.7 1.8 1.8
1.9
2.1 2.2
2.4 2.4 2.52.6 2.7 2.7
2.8 2.8 2.8 2.8
3.2
3.7
2.1
0.0
0.5
1.0
1.5
2.0
2.5
3.0
3.5
4.0
x x x x x x x x x x x x x x x x x x x x x x x x x x x x x x ALL
Mis
sed
tra
inin
gs p
er p
laye
r p
er m
on
th
0.30.3 0.3
0.4 0.4 0.4 0.4 0.4 0.40.5 0.5 0.5 0.5 0.5
0.5 0.6 0.6 0.6 0.60.6 0.7 0.7 0.7
0.7 0.70.8
0.80.9 0.9
1.0
0.6
0.0
0.2
0.4
0.6
0.8
1.0
1.2
x x x x x x x x x x x x x x x x x x x x x x x x x x x x x x ALL
Mis
sed
mat
ches
per
pla
yer
per
mo
nth
UEFA Elite Club Injury Study Report 2015/16
29
7 Analyses over 15 seasons
UEFA’s injury study has now recorded approximately 13,000 injuries and 1,800,000 exposure hours
over 15 seasons. Close to 50 teams from 18 different countries have participated at some point during
these 15 seasons. This section contains results based on data from all seasons of the study.
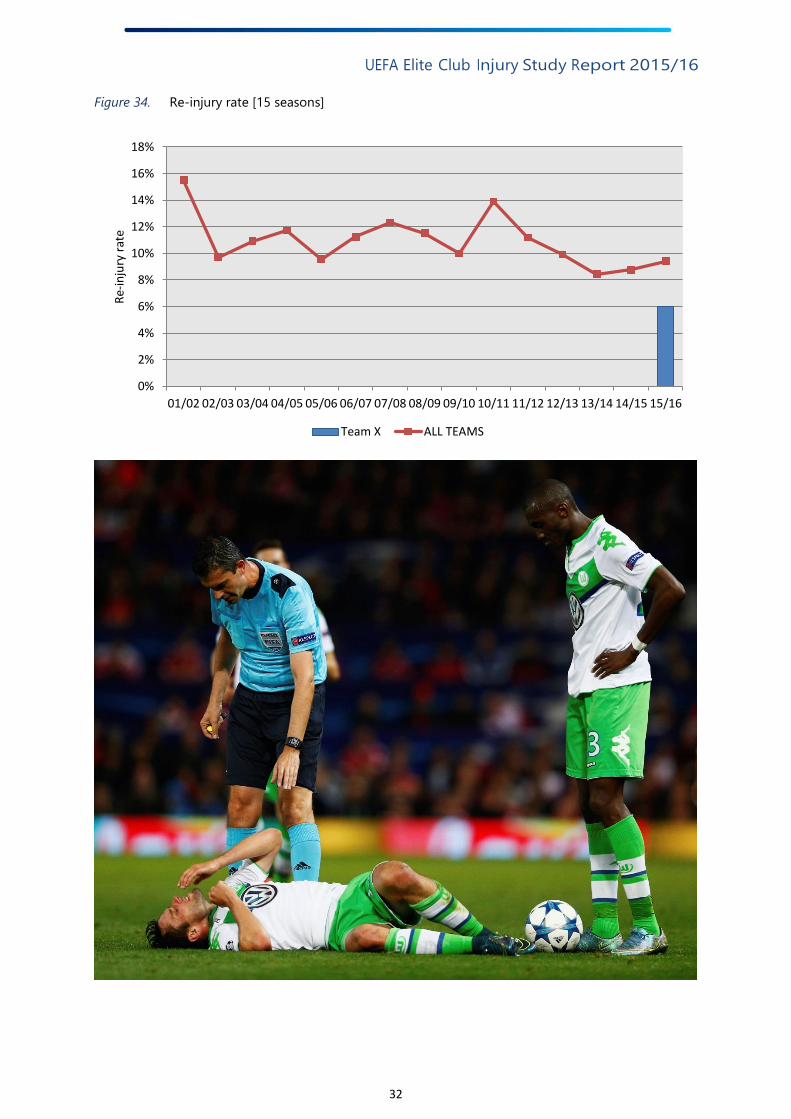
7.1 Injury rates over 15 seasons
The injury rate each season (blue bars) is shown for your own club, together with the mean injury rate
for all teams (red line), for the purposes of comparison.
Figure 28. Training injury rate [15 seasons]
Figure 29. Match injury rate [15 seasons]
0
1
2
3
4
5
6
01/02 02/03 03/04 04/05 05/06 06/07 07/08 08/09 09/10 10/11 11/12 12/13 13/14 14/15 15/16
Trai
nin
g in
jury
inci
den
ce
Team X ALL TEAMS
0
5
10
15
20
25
30
35
01/02 02/03 03/04 04/05 05/06 06/07 07/08 08/09 09/10 10/11 11/12 12/13 13/14 14/15 15/16
Mat
ch in
jury
inci
den
ce
Team X ALL TEAMS

UEFA Elite Club Injury Study Report 2015/16
30
Figure 30. Total injury rate [15 seasons]
Figure 31. Severe injury rate (>4 weeks’ absence) [15 seasons]
0
1
2
3
4
5
6
7
8
9
10
01/02 02/03 03/04 04/05 05/06 06/07 07/08 08/09 09/10 10/11 11/12 12/13 13/14 14/15 15/16
Tota
l in
jury
inci
den
ce
Team X ALL TEAMS
0
0.5
1
1.5
2
2.5
01/02 02/03 03/04 04/05 05/06 06/07 07/08 08/09 09/10 10/11 11/12 12/13 13/14 14/15 15/16
Seve
re in
jury
inci
den
ce
Team X ALL TEAMS

UEFA Elite Club Injury Study Report 2015/16
31
Figure 32. Muscle injury rate [15 seasons]
Figure 33. Ligament injury rate [15 seasons]
0
0.5
1
1.5
2
2.5
3
3.5
4
01/02 02/03 03/04 04/05 05/06 06/07 07/08 08/09 09/10 10/11 11/12 12/13 13/14 14/15 15/16
Mu
scle
inju
ry in
cid
ence
Team X ALL TEAMS
0.0
0.5
1.0
1.5
2.0
2.5
01/02 02/03 03/04 04/05 05/06 06/07 07/08 08/09 09/10 10/11 11/12 12/13 13/14 14/15 15/16
Liga
men
t in
jury
inci
den
ce
Team X ALL TEAMS
UEFA Elite Club Injury Study Report 2015/16
32
Figure 34. Re-injury rate [15 seasons]
0%
2%
4%
6%
8%
10%
12%
14%
16%
18%
01/02 02/03 03/04 04/05 05/06 06/07 07/08 08/09 09/10 10/11 11/12 12/13 13/14 14/15 15/16
Re-
inju
ry r
ate
Team X ALL TEAMS

UEFA Elite Club Injury Study Report 2015/16
33
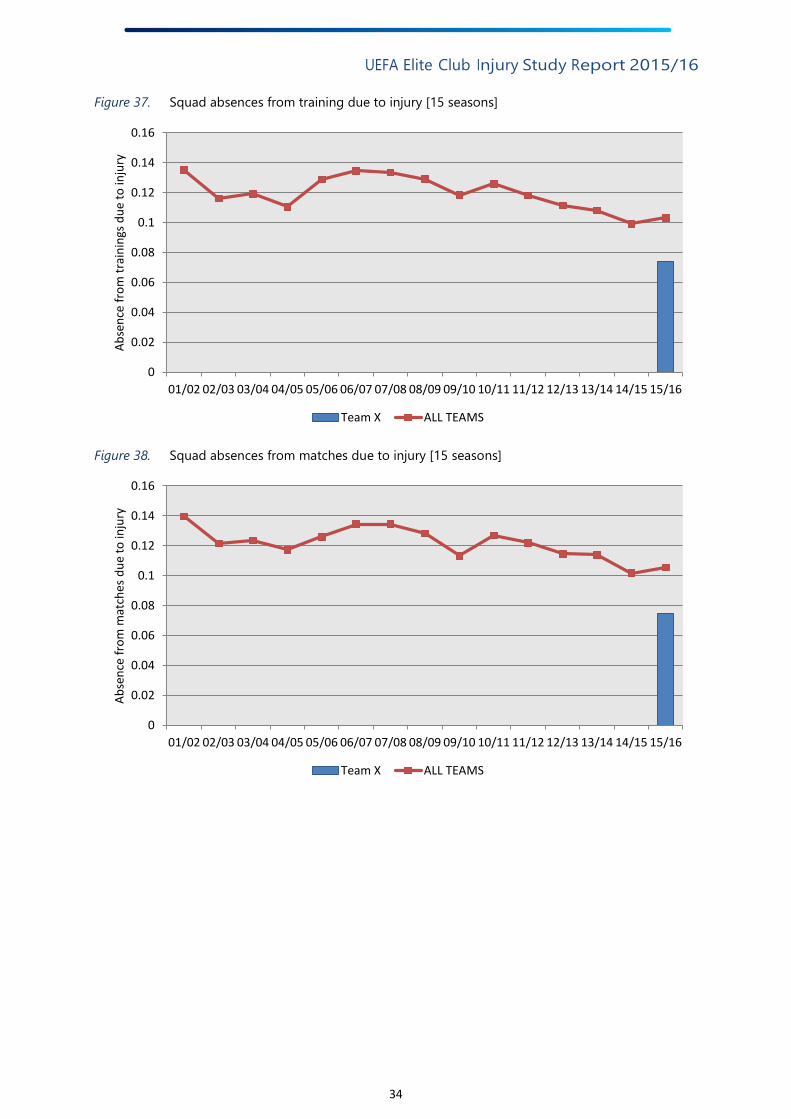
7.2 Squad attendance/availability and absences over 15 seasons
Squad attendance/availability and absences due to injury each season is shown for your own club
(blue bars), together with the mean attendance/availability for all teams (red line), for the purposes of
comparison.
Figure 35. Squad attendance rates for training [15 seasons]
Figure 36. Squad availability rates for matches [15 seasons]
0
0.1
0.2
0.3
0.4
0.5
0.6
0.7
0.8
0.9
1
01/02 02/03 03/04 04/05 05/06 06/07 07/08 08/09 09/10 10/11 11/12 12/13 13/14 14/15 15/16
Trai
nin
g at
ten
dan
ce
Team X ALL TEAMS
0
0.1
0.2
0.3
0.4
0.5
0.6
0.7
0.8
0.9
1
01/02 02/03 03/04 04/05 05/06 06/07 07/08 08/09 09/10 10/11 11/12 12/13 13/14 14/15 15/16
Mat
ch a
vaila
bili
ty
Team X ALL TEAMS
UEFA Elite Club Injury Study Report 2015/16
34
Figure 37. Squad absences from training due to injury [15 seasons]
Figure 38. Squad absences from matches due to injury [15 seasons]
0
0.02
0.04
0.06
0.08
0.1
0.12
0.14
0.16
01/02 02/03 03/04 04/05 05/06 06/07 07/08 08/09 09/10 10/11 11/12 12/13 13/14 14/15 15/16
Ab
sen
ce f
rom
tra
inin
gs d
ue
to in
jury
Team X ALL TEAMS
0
0.02
0.04
0.06
0.08
0.1
0.12
0.14
0.16
01/02 02/03 03/04 04/05 05/06 06/07 07/08 08/09 09/10 10/11 11/12 12/13 13/14 14/15 15/16
Ab
sen
ce f
rom
mat
ches
du
e to
inju
ry
Team X ALL TEAMS