2015/16 - Alps | The Student Centred Approach - alps-va.co.uk · 2015/16 Alps - Alkemygold Ltd,...
90
2015/16 Alps - Alkemygold Ltd, Kevin Conway House Longbow Close, Huddersfield HD2 1GQ 01484 887 600 [email protected] www.alps-va.co.uk Alps Example Sixth Form A level report 2015/16 Report number 1 - 19.08.16 A level - 2015/16
-
Upload
nguyenkien -
Category
Documents
-
view
217 -
download
1
Transcript of 2015/16 - Alps | The Student Centred Approach - alps-va.co.uk · 2015/16 Alps - Alkemygold Ltd,...

2015/16Alps - Alkemygold Ltd, Kevin Conway House
Longbow Close, Huddersfield HD2 1GQ01484 887 600
Alps Example Sixth Form
A level report 2015/16
Report number 1 - 19.08.16
A level - 2015/16


Index
Introduction p4
Section A - National benchmarks The calculation of the average GCSE score p8
Explanation - Alps grading system p9
National benchmark data - Performance per subject p10
National benchmark data - National minimum expected grades p11
National benchmark data - Performance - number of subjects p12
National benchmark data - Performance per student p12
What an Alps score of 1.0 means in this report p13
Explanation - Subject thermometer p14
Subject value added scores at different percentiles p16
Performance indicators - an overview p18
Section B - Your analysis Raw A level results p21
Strategic overview p23
– Analysis of students banded by ability – current year p25
– Analysis of students banded by ability – four year summary p27
Calculation of Alps A level - Quality Indicator p29
Subject value added overview p31
Quality of teaching and learning measurement p33
Alps T scores p35
Student progression scores p37
Students not included in key indicator calculations p38
Single subject pages (follows)
Student performance overview and Progression (follows)
Copyright © Alkemygold Ltd 2016All rights reserved. No part of this publication may be reproduced, stored in a retrieval system, or transmitted, in any form or by any means, electronic, mechanical,photocopying, recording or otherwise, without the prior written permission of the copyright owner, save that permission is granted to reproduce for internal educationaluse only by the institution that this publication is addressed to.
3A level Alps report 2016 ©Alkemygold Ltd www.alps-va.co.uk

Introduction
Alps (Advanced Level Performance System) is the result of over 30 years of careful research and development, initiallyat Greenhead College, Huddersfield, by Dr Kevin Conway CBE, the Principal, and over the last fifteen years at Alps. All ourdevelopment in this time has been geared to helping staff in schools and colleges and their advisory colleagues at local authorityand academy chain levels to enhance the recruitment, retention and achievements of students studying A level, AS level, BTECNational and KS4 qualifications. Each year our reports cover over 73% of all A levels nationally, and are taken by over 1,550 schoolsand colleges. Alps has been developed educationally by teachers for teachers and we believe this is one key factor for its popularity.
There are three sets of principles which underpin all our work –
• Firstly, the simple idea that each of us is an individual, an exception and needs to be valued
• Secondly, that aspiration, inspiration and motivation are key elements needed in work with young people
• Thirdly, powerful leadership and high quality teaching and learning, coupled with high quality target-setting, monitoring,guidance and support are the three elements that define good schools and colleges. (Constant organisational change does not!)
Powerful ‘Alps’ schools work to these principles consistently year on year and their students benefit.
Over time, we have risen from around 40 schools and the collective group of Sixth Form Colleges in 2001 to over 1,550 schools,academies, sixth form colleges and FE colleges, representing over 73% of students taking A levels. We have a presence in everyLA in the country.
The key feedback we have received and continuously work on is that the presentation of our reports is simple to understand whilecreating a powerful common language for students, staff, governors, parents and LA staff alike. The performance indicators wehave developed and continue to develop are each significant in their own right for each provider. Summative reports for LAs andgroups of providers, such as trusts, allow the identification of good practice down to subject/course level which can be spreadbetween providers in organised training sessions.
Alps reports and training are aids to culture change, within senior leadership teams, for staff and for students. They challengeparticipants to continuously improve incrementally to the levels of the 75th percentile providers. They identify strengthsand weaknesses on a nine point scale, first developed by Alps, so that good practice can be shared and weaknesses can bestrengthened. It is a positive process.
What defines us ahead of others is the timeliness of our reports, which can be available for the start of the Autumn term, the clearyet detailed presentation of analysis in the reports as well as the ease of sending in the data we require. However, the biggestdifference is that we do not just give information, but are available to deliver best practice training.
New for 2016
• New Quality Indicator and T Scores
In 2016 we have decided to replace the VA Quality and Breadth Indicator with our new Quality Indicator. One of the drivers of this is the developing linear landscape and optional nature of the standalone AS exams. This would have made an indicatordependent on breadth of provision unfair on schools not entering students for standalone AS exams in 2016.
However we see many other advantages to introducing this new indicator. Firstly, it will allow all A level results to be evaluated,whereas the VA Q&B Indicator only included results of students taking 2 or more A levels. Secondly, schools and colleges withstudents on mixed academic and vocational programmes will not be disadvantaged, for example, if they are taking 2 A levelsand a BTEC. Thirdly, the VA Q&B Indicator – like the UCAS points per student Performance Tables measure – could rewardschools or colleges for concentrating on the quantity of qualifications taken rather than the quality of individual grades.
This brings me to our main driver. Put simply, the quality of the individual grade matters more to each student than the quantityof qualifications taken. This does not mean we no longer think it important that each student should be on a full programmeof study, typically 3 A levels or the equivalent. We do!
Our Quality Indicator is based on adding up the total UCAS points achieved in subjects and measuring this against the totalexpected UCAS points (at the 75th percentile) in those subjects. In a nutshell, this new indicator is an accurate reflectionof the quality of your overall performance per subject.
The switch from the VA Quality & Breadth grade to the Quality Indicator will impact on your overall T score, as this is an averageof your Red and Blue Teaching grades and the Quality Indicator. In your 2016 report we are showing you how you would havescored against the new Quality Indicator in previous years so your T score for those years in the 2016 report may not matchthe T scores for those years in your 2015 report.
4A level Alps report 2016 ©Alkemygold Ltd www.alps-va.co.uk

Any new system is bound to generate winners and losers. Modelling the Quality Indicator against previous years’ results showsus that those whose Quality Indicator for 2015 is lower than their VA Q&B grade generally had a total UCAS points boostedby taking more subjects per student than the 75th percentile nationally.
• Updated BTEC Benchmarks and Minimum Expected Grades for 2016
We have updated our Alps BTEC benchmarks in our main BTEC report and our Certificate and 90-credit Diploma reports for2016. The updated benchmark tables and revised Alps minimum expected grades to be used with your students can be foundin your BTEC report.
The new Alps benchmarks are produced using the full national dataset from the Department for Education. Our analysis thisyear has shown that the year on year improvement in vocational results has continued across all eleven Alps bands, and weconcluded that the change was significant enough to require updated benchmarks for 2016.
We are aware that teaching starts on the new BTEC suite in September 2016. Once we have the results of these new courseswe will review the targets and benchmarks for 2017 in light of any changes across our BTEC reports.
The new benchmarks will be applied to the 2016 data only in your BTEC reports.
• A level and AS level – no change to benchmarks for 2016
Following our analysis of the full DfE data, we will not be changing our A level and AS level Alps benchmarks and minimumexpected grades for the coming year. The analysis of the DfE data showed that there is little change in value added termsin the outcomes of these qualifications. As with the BTEC reports, we will review this again for 2017.
• Pages recommended for use with governors In 2015-16, we delivered a significant amount of training for governors, usually through local
authority Governor Services. During this training we are often asked which pages are most usefulfor governors and indeed which pages should be shared with governors.
We have decided this year to identify the following pages with our governor mark. For ease of use, pages with this logo on themare suitable for use with governors:
1. Raw results 2. Strategic Overview 3. Banded by ability - 4 year summary 4. Subject Value Added Overview
Finally
Government policies in education over the past few years have radically changed the landscape with schools, new academiesand ‘free’ schools now co-existing. We also see new groupings of schools in trusts, federations and consortia emerging alongsidedifferent roles for local authorities. Post-16 funding will continue to be squeezed, and the role of local authorities is being developedwith increased demands on school improvement services.
Alps reports have been used in Ofsted and Estyn inspections by many schools to support judgements. It is official policy that whereAlps reports are made available, they must be given due consideration by inspectors. The timeliness of our reports has often comeinto play here, especially in showing up-to-date progress. The uniqueness of our 4 year profile of A, AS, BTEC National and KS4reports is especially helpful. Our helpdesk is always on hand at inspection time!
We remain happy to help any school, academy, college or LA to implement Alps systems using our highly qualified and experiencedtrainers, all of whom have been or are in senior positions in top performing schools and colleges.
We are at the end of the telephone Monday to Friday 9am-5pm – 01484 887600 or you can email us at [email protected].
Please visit our website for more information at www.alps-va.co.uk
Mary AhernChief Executive
Autumn 2016
5A level Alps report 2016 ©Alkemygold Ltd www.alps-va.co.uk
G3
Alps Alps - Alkemygold Ltd, Kevin Conway House
Longbow Close, Huddersfield HD2 1GQ01484 887600 | [email protected] | www.alps-va.co.uk
KS5

6A level Alps report 2016 ©Alkemygold Ltd www.alps-va.co.uk

Section A
National benchmarks & explanationof the Alps grading system
7A level Alps report 2016 ©Alkemygold Ltd www.alps-va.co.uk
Alps Alps - Alkemygold Ltd, Kevin Conway House
Longbow Close, Huddersfield HD2 1GQ01484 887600 | [email protected] | www.alps-va.co.uk
KS5
Alps A level - Calculation of the average GCSE score
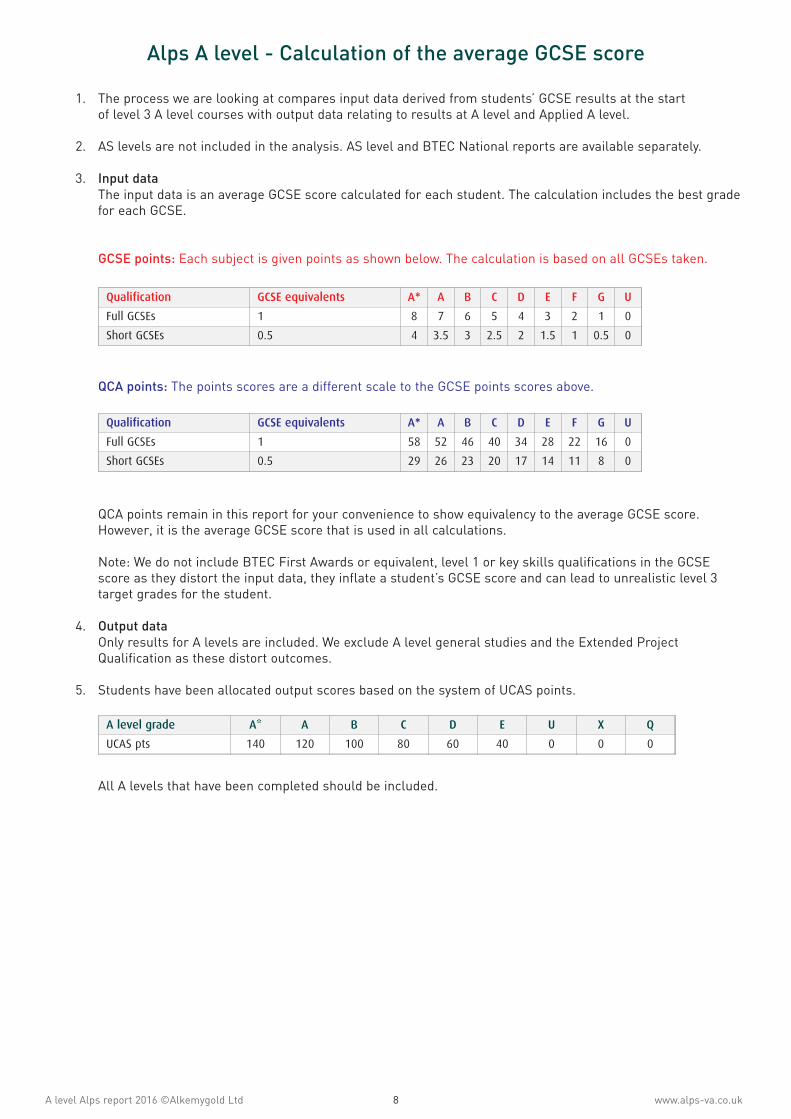
1. The process we are looking at compares input data derived from students’ GCSE results at the startof level 3 A level courses with output data relating to results at A level and Applied A level.
2. AS levels are not included in the analysis. AS level and BTEC National reports are available separately.
3. Input data The input data is an average GCSE score calculated for each student. The calculation includes the best grade
for each GCSE.
GCSE points: Each subject is given points as shown below. The calculation is based on all GCSEs taken.
QCA points: The points scores are a different scale to the GCSE points scores above.
QCA points remain in this report for your convenience to show equivalency to the average GCSE score.However, it is the average GCSE score that is used in all calculations.
Note: We do not include BTEC First Awards or equivalent, level 1 or key skills qualifications in the GCSE
score as they distort the input data, they inflate a student’s GCSE score and can lead to unrealistic level 3target grades for the student.
4. Output data Only results for A levels are included. We exclude A level general studies and the Extended Project
Qualification as these distort outcomes.
5. Students have been allocated output scores based on the system of UCAS points.
All A levels that have been completed should be included.
Qualification GCSE equivalents A* A B C D E F G U
Full GCSEs 1 8 7 6 5 4 3 2 1 0
Short GCSEs 0.5 4 3.5 3 2.5 2 1.5 1 0.5 0
Qualification GCSE equivalents A* A B C D E F G U
Full GCSEs 1 58 52 46 40 34 28 22 16 0
Short GCSEs 0.5 29 26 23 20 17 14 11 8 0
A level grade A* A B C D E U X Q
UCAS pts 140 120 100 80 60 40 0 0 0
8A level Alps report 2016 ©Alkemygold Ltd www.alps-va.co.uk

9A level Alps report 2016 ©Alkemygold Ltd www.alps-va.co.uk
Alps A level - Alps grading system
1. In Section B, your school/college data for A levels is compared to the Alps benchmarks created from thefull DfE national dataset.
2. There are 8 key indicators for you to consider, which should help you as a provider to create agendasfor development leading to higher levels of recruitment, retention and achievement.
• Analysis of students banded by ability • Quality Indicator • Subject value added overview • Quality of teaching and learning measurement • Alps T scores • Student progression score • Single subject reports • Student performance overview
3. Throughout this analytical section, there is a common grading system that works at three levels whichare interlinked and allow a reader to look at the analysis at different depths.
4. These are:
5. Colours
• RED means your performance is within or exceeds the top 25% of the A level benchmark for the indicator.
• BLUE means your performance is within or is worse than the bottom 25% of the A level benchmark for the indicator.
6. Alps grades - basis of the grading system
7. Alps value added scores - there are ranges of value added scores ranked by provider fromthe Alps national database in a variety of formats which are described on the following pages.
Matching top 25%+ RED Alps grades 1 - 3
Matching middle 50% BLACK Alps grades 4 - 6
Matching bottom 25%- BLUE Alps grades 7 - 9
100%
90%
75%
60%
40%
25%
10%
Bottom
1 2
3
7 8
9
4
5
6
---- Alps grade 1 - better or equal to the best score achieved in the indicator - Outstanding
---- Alps grade 2 - scoring between the 90th and 99th percentile - Outstanding
---- Alps grade 3 - scoring between the 75th and 89th percentile - Excellent
---- Alps grade 4 - scoring between the 60th and 74th percentile - Very good
---- Alps grade 5 - scoring between the 40th and 59th percentile - Satisfactory to Good
---- Alps grade 6 - scoring between the 25th and 39th percentile - Below average
---- Alps grade 7 - scoring between the 10th and 24th percentile - Less than satisfactory
---- Alps grade 8 - scoring between the 1st and 9th percentile - Relatively poor
---- Alps grade 9 - scoring below the lowest score achieved in the indicator - Poor
The challenge is to get out of the BLUE and move towards the RED. If you are already in the RED the challenge is to stay there. Continuous improvement is the underlying theme.
Using the national dataset supplied to Alps by the Department for Education(2,580 sets, 241,036 students, 685,377 A levels taken)
Alps A level - National benchmark
Performance per subject
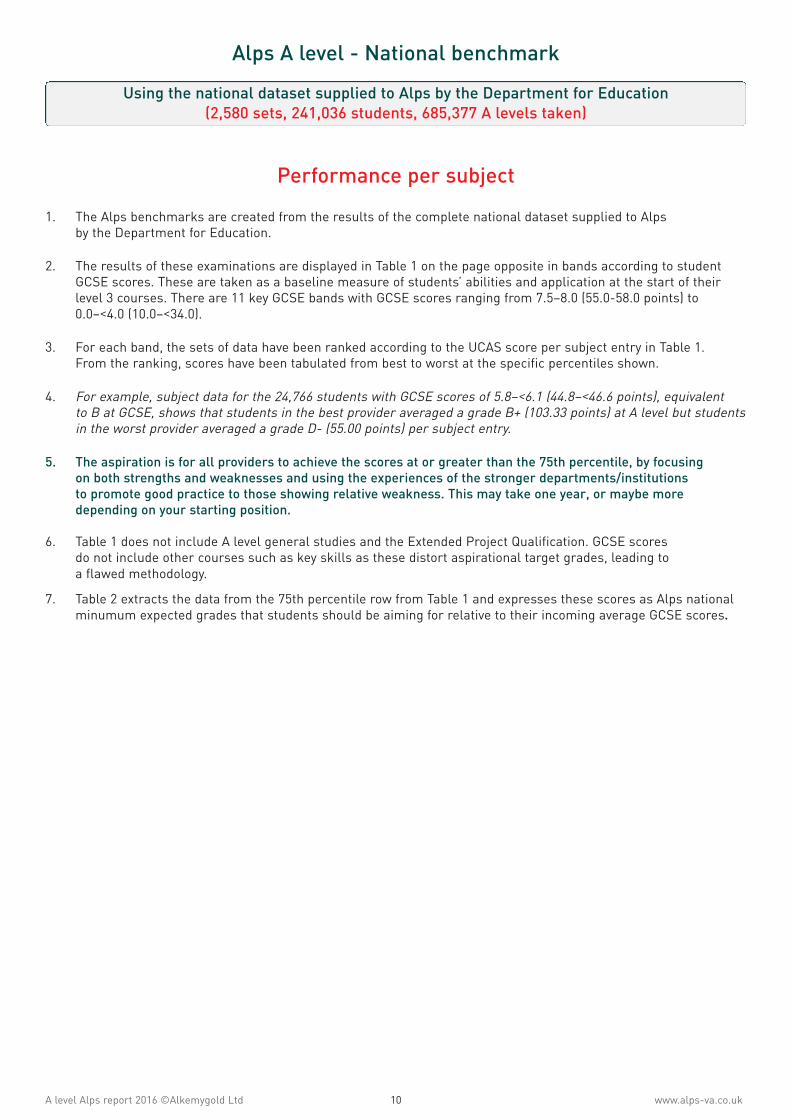
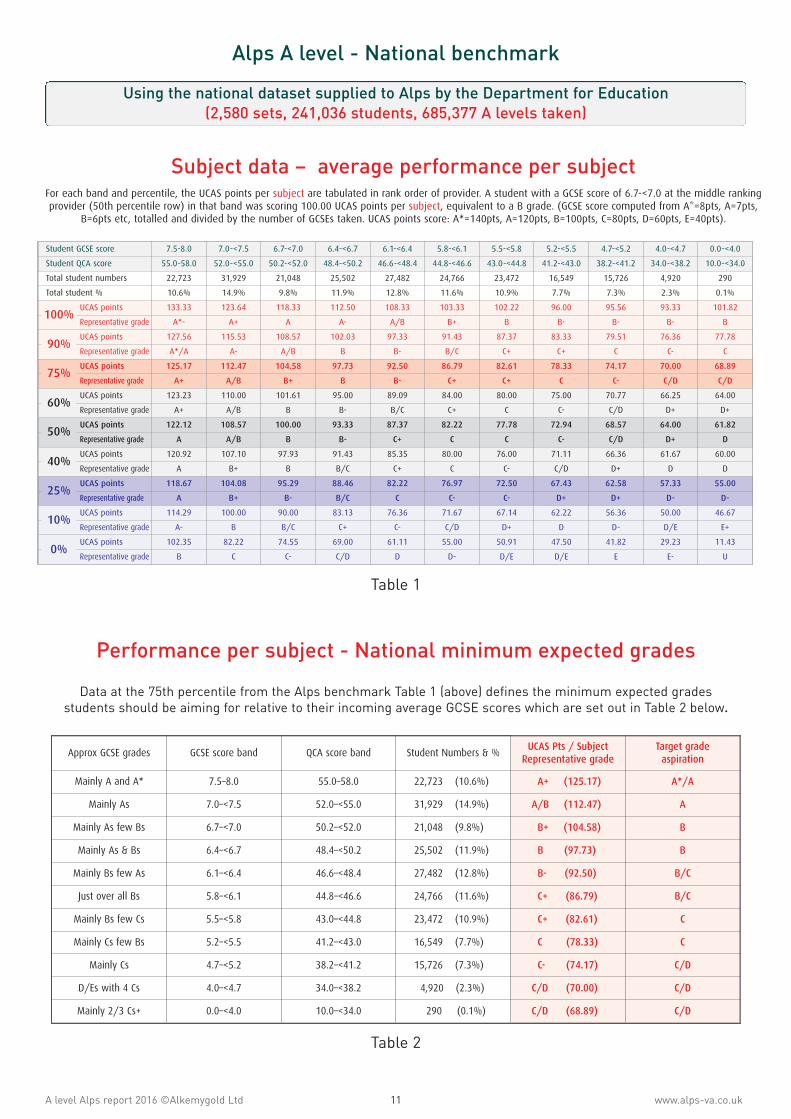
1. The Alps benchmarks are created from the results of the complete national dataset supplied to Alpsby the Department for Education.
2. The results of these examinations are displayed in Table 1 on the page opposite in bands according to studentGCSE scores. These are taken as a baseline measure of students’ abilities and application at the start of theirlevel 3 courses. There are 11 key GCSE bands with GCSE scores ranging from 7.5–8.0 (55.0-58.0 points) to0.0–<4.0 (10.0–<34.0).
3. For each band, the sets of data have been ranked according to the UCAS score per subject entry in Table 1.From the ranking, scores have been tabulated from best to worst at the specific percentiles shown.
4. For example, subject data for the 24,766 students with GCSE scores of 5.8–<6.1 (44.8–<46.6 points), equivalentto B at GCSE, shows that students in the best provider averaged a grade B+ (103.33 points) at A level but studentsin the worst provider averaged a grade D- (55.00 points) per subject entry.
5. The aspiration is for all providers to achieve the scores at or greater than the 75th percentile, by focusingon both strengths and weaknesses and using the experiences of the stronger departments/institutionsto promote good practice to those showing relative weakness. This may take one year, or maybe moredepending on your starting position.
6. Table 1 does not include A level general studies and the Extended Project Qualification. GCSE scoresdo not include other courses such as key skills as these distort aspirational target grades, leading toa flawed methodology.
7. Table 2 extracts the data from the 75th percentile row from Table 1 and expresses these scores as Alps nationalminumum expected grades that students should be aiming for relative to their incoming average GCSE scores.
10A level Alps report 2016 ©Alkemygold Ltd www.alps-va.co.uk
Using the national dataset supplied to Alps by the Department for Education(2,580 sets, 241,036 students, 685,377 A levels taken)
Alps A level - National benchmark
Performance per subject - National minimum expected grades
Data at the 75th percentile from the Alps benchmark Table 1 (above) defines the minimum expected gradesstudents should be aiming for relative to their incoming average GCSE scores which are set out in Table 2 below.
Subject data – average performance per subjectFor each band and percentile, the UCAS points per subject are tabulated in rank order of provider. A student with a GCSE score of 6.7-<7.0 at the middle rankingprovider (50th percentile row) in that band was scoring 100.00 UCAS points per subject , equivalent to a B grade. (GCSE score computed from A*=8pts, A=7pts,
B=6pts etc, totalled and divided by the number of GCSEs taken. UCAS points score: A*=140pts, A=120pts, B=100pts, C=80pts, D=60pts, E=40pts).
Student GCSE score 7.5-8.0 7.0-<7.5 6.7-<7.0 6.4-<6.7 6.1-<6.4 5.8-<6.1 5.5-<5.8 5.2-<5.5 4.7-<5.2 4.0-<4.7 0.0-<4.0
Student QCA score 55.0-58.0 52.0-<55.0 50.2-<52.0 48.4-<50.2 46.6-<48.4 44.8-<46.6 43.0-<44.8 41.2-<43.0 38.2-<41.2 34.0-<38.2 10.0-<34.0
Total student numbers 22,723 31,929 21,048 25,502 27,482 24,766 23,472 16,549 15,726 4,920 290
Total student % 10.6% 14.9% 9.8% 11.9% 12.8% 11.6% 10.9% 7.7% 7.3% 2.3% 0.1%
UCAS points 133.33 123.64 118.33 112.50 108.33 103.33 102.22 96.00 95.56 93.33 101.82
Representative grade A*- A+ A A- A/B B+ B B- B- B- B
UCAS points 127.56 115.53 108.57 102.03 97.33 91.43 87.37 83.33 79.51 76.36 77.78
Representative grade A*/A A- A/B B B- B/C C+ C+ C C- C
UCAS points 125.17 112.47 104.58 97.73 92.50 86.79 82.61 78.33 74.17 70.00 68.89
Representative grade A+ A/B B+ B B- C+ C+ C C- C/D C/D
UCAS points 123.23 110.00 101.61 95.00 89.09 84.00 80.00 75.00 70.77 66.25 64.00
Representative grade A+ A/B B B- B/C C+ C C- C/D D+ D+
UCAS points 122.12 108.57 100.00 93.33 87.37 82.22 77.78 72.94 68.57 64.00 61.82
Representative grade A A/B B B- C+ C C C- C/D D+ D
UCAS points 120.92 107.10 97.93 91.43 85.35 80.00 76.00 71.11 66.36 61.67 60.00
Representative grade A B+ B B/C C+ C C- C/D D+ D D
UCAS points 118.67 104.08 95.29 88.46 82.22 76.97 72.50 67.43 62.58 57.33 55.00
Representative grade A B+ B- B/C C C- C- D+ D+ D- D-
UCAS points 114.29 100.00 90.00 83.13 76.36 71.67 67.14 62.22 56.36 50.00 46.67
Representative grade A- B B/C C+ C- C/D D+ D D- D/E E+
UCAS points 102.35 82.22 74.55 69.00 61.11 55.00 50.91 47.50 41.82 29.23 11.43
Representative grade B C C- C/D D D- D/E D/E E E- U
100%
90%
75%
60%
50%
40%
25%
10%
0%
Approx GCSE grades GCSE score band QCA score band Student Numbers & %UCAS Pts / Subject
Representative gradeTarget grade
aspiration
Mainly A and A* 7.5 –8.0 55.0 –58.0 22,723 (10.6%) A+ (125.17) A*/A
Mainly As 7.0 –<7.5 52.0 –<55.0 31,929 (14.9%) A/B (112.47) A
Mainly As few Bs 6.7–<7.0 50.2 –<52.0 21,048 (9.8%) B+ (104.58) B
Mainly As & Bs 6.4 –<6.7 48.4–<50.2 25,502 (11.9%) B (97.73) B
Mainly Bs few As 6.1 –<6.4 46.6 –<48.4 27,482 (12.8%) B- (92.50) B/C
Just over all Bs 5.8 –<6.1 44.8–<46.6 24,766 (11.6%) C+ (86.79) B/C
Mainly Bs few Cs 5.5 –<5.8 43.0 –<44.8 23,472 (10.9%) C+ (82.61) C
Mainly Cs few Bs 5.2–<5.5 41.2 –<43.0 16,549 (7.7%) C (78.33) C
Mainly Cs 4.7 –<5.2 38.2 –<41.2 15,726 (7.3%) C- (74.17) C/D
D/Es with 4 Cs 4.0 –<4.7 34.0 –<38.2 4,920 (2.3%) C/D (70.00) C/D
Mainly 2/3 Cs+ 0.0 –<4.0 10.0 –<34.0 290 (0.1%) C/D (68.89) C/D
11A level Alps report 2016 ©Alkemygold Ltd www.alps-va.co.uk
Using the national dataset supplied to Alps by the Department for Education(2,580 sets, 241,036 students, 685,377 A levels taken)
Table 1
Table 2

12A level Alps report 2016 ©Alkemygold Ltd www.alps-va.co.uk
Alps A level - National benchmark
Performance - number of subjectsTable 3 below has been created from the DfE national dataset and shows the average number of subjects takenby students in each band of ability excluding general studies and the Extended Project Qualification. For examplein band 4.0–<4.7 (34.0–<38.2 points) at the 75th percentile students took on average 2.75 A levels excluding general
studies and EPQ, which equated to 75% of students completing 3 A levels and 25% completing 2 A levels.This is not included in your Quality Indicator calculation, but is relevant for the banded analysis.
Performance - total UCAS points per studentTable 4 below has been created from the DfE national dataset. It shows the average total number of UCAS
points per student achieved at the 75th percentile and therefore the corresponding indicative grade outcomesrelative to their incoming average GCSE scores across all their A level subjects.
This is not included in your Quality Indicator calculation, but is relevant for the banded analysis.
Using the national dataset supplied to Alps by the Department for Education(2,580 sets, 241,036 students, 685,377 A levels taken)
Approx GCSE grades GCSE score band QCA score band Student Numbers & %UCAS Pts / Student
Representative gradeIndicative Grade
Outcomes
Mainly A and A* 7.5 –8.0 55.0 –58.0 22,723 (10.6%) A*AAA/A*AA (421.25) A*AAA/A*AA
Mainly As 7.0 –<7.5 52.0 –<55.0 31,929 (14.9%) AAA- (350.77) AAA
Mainly As few Bs 6.7–<7.0 50.2 –<52.0 21,048 (9.8%) ABB (320.00) ABB
Mainly As & Bs 6.4 –<6.7 48.4–<50.2 25,502 (11.9%) BBB- (293.85) BBB
Mainly Bs few As 6.1 –<6.4 46.6 –<48.4 27,482 (12.8%) BBC- (274.76) BBC
Just over all Bs 5.8 –<6.1 44.8–<46.6 24,766 (11.6%) BCC- (255.56) BCC
Mainly Bs few Cs 5.5 –<5.8 43.0 –<44.8 23,472 (10.9%) CCC (240.00) CCC
Mainly Cs few Bs 5.2–<5.5 41.2 –<43.0 16,549 (7.7%) CCD+ (222.50) CCD
Mainly Cs 4.7 –<5.2 38.2 –<41.2 15,726 (7.3%) CDD+ (205.00) CDD
D/Es with 4 Cs 4.0 –<4.7 34.0 –<38.2 4,920 (2.3%) DDD+ (186.67) CDD/DDD
Mainly 2/3 Cs+ 0.0 –<4.0 10.0 –<34.0 290 (0.1%) DDD (180.00) CDD/DDD
Table 3
Table 4
AGCSE score band
BQCA score band
CStudent numbers
DAvg no. of A2s taken
EOn average
Subjects to betaken (exc Gen St)
7.5–8.0 55.0–58.0 22,72 (10.6%) 3.41 41% take 4 - 59% take 3 4/3
7.0–<7.5 52.0–<55.0 31,929 (14.9%) 3.18 82% take 3 - 18% take 4 3/4
6.7–<7.0 50.2–<52.0 21,048 (9.8%) 3.08 92% take 3 - 8% take 4 3
6.4–<6.7 48.4–<50.2 25,502 (11.9%) 3.00 100% take 3 3
6.1–<6.4 46.6–<48.4 27,482 (12.8%) 3.00 100% take 3 3
5.8–<6.1 44.8–<46.6 24,766 (11.6%) 3.00 100% take 3 3
5.5–<5.8 43.0–<44.8 23,472 (10.9%) 3.00 100% take 3 3
5.2–<5.5 41.2–<43.0 16,549 (7.7%) 3.00 100% take 3 3
4.7–<5.2 38.2–<41.2 15,726 (7.3%) 2.88 88% take 3 - 12% take 2 3
4.0–<4.7 34.0–<38.2 4,920 (2.3%) 2.75 75% take 3 - 25% take 2 3/2
0.0–<4.0 10.0–<34.0 290 (0.1%) 2.67 67% take 3 - 33% take 2 3/2

13A level Alps report 2016 ©Alkemygold Ltd www.alps-va.co.uk
What an Alps score of 1.0 means in this report
1. The Alps benchmarks are created from the results of the complete national dataset supplied to Alpsby the Department for Education.
2. The benchmark is used to create aspirational minimum expectations for all schools and colleges thatare involved in using Alps systems to raise student and staff esteem and achievement. This will be usedas a ‘fixed point’ against which schools and colleges can measure themselves and their annual progress.
3. The Alps methodology is based on groups of students. On any benchmark thermometer within the report,if the Actual UCAS points equals the Expected UCAS points then the score will be 1.0.
# In some circumstances the number of students is replaced with the number of entries, for example with double awards. ~ This part of the denominator varies to maintain the concept that 0.2 = 1 grade per entry.
4. The Expected UCAS points is based on the performance of the top 25% of schools and colleges in eachof the Alps average GCSE bands. The premise being that if the students in each ability band can achievethese outcomes then this should be the ambition for all students and staff.
5. A score of 1.0 for a year group in a school or college means that on average, across all subjects, studentshave achieved the expected UCAS points. This accurately reflects the quality of the provider’s student groupmeasured relative to their GCSE scores.
In table 5 as the difference between the Total Expected points and the Total Actual points tends to zero,
then when divided by the number of entries the Alps score will tend to 1.0.
6. At a subject level, an Alps score of 1.0 means that on average, students in this subject group achievedthe expected UCAS points. However, subject thermometers show that some students will need to exceedtheir minimum expected grades to match the top 25% of departments for that subject.
It is essential that all staff understand their own subject thermometer, as performance managementis based on the performance of the students in their subject compared to the subject’s performance nationally,and not just the target grades for students.
Table 5
Using the national dataset supplied to Alps by the Department for Education(2,580 sets, 241,036 students, 685,377 A levels taken)
Alps measure = +1 Actual UCAS points – Expected UCAS points
Number of students# x 100~( )
Subject Entries Expected pts Actual pts Alps score Alps grade
Subject A 41 3,752.68 3,720 0.99 4
Subject B 16 1,358.55 1,280 0.95 5
Subject C 48 4,725.28 4,840 1.02 3
Subject D 25 2,466.08 1,660 0.68 8
... ... ... ... ... ...
Totals 130 12,302.59 11,500
Alps A level - Explanation of a subject thermometer
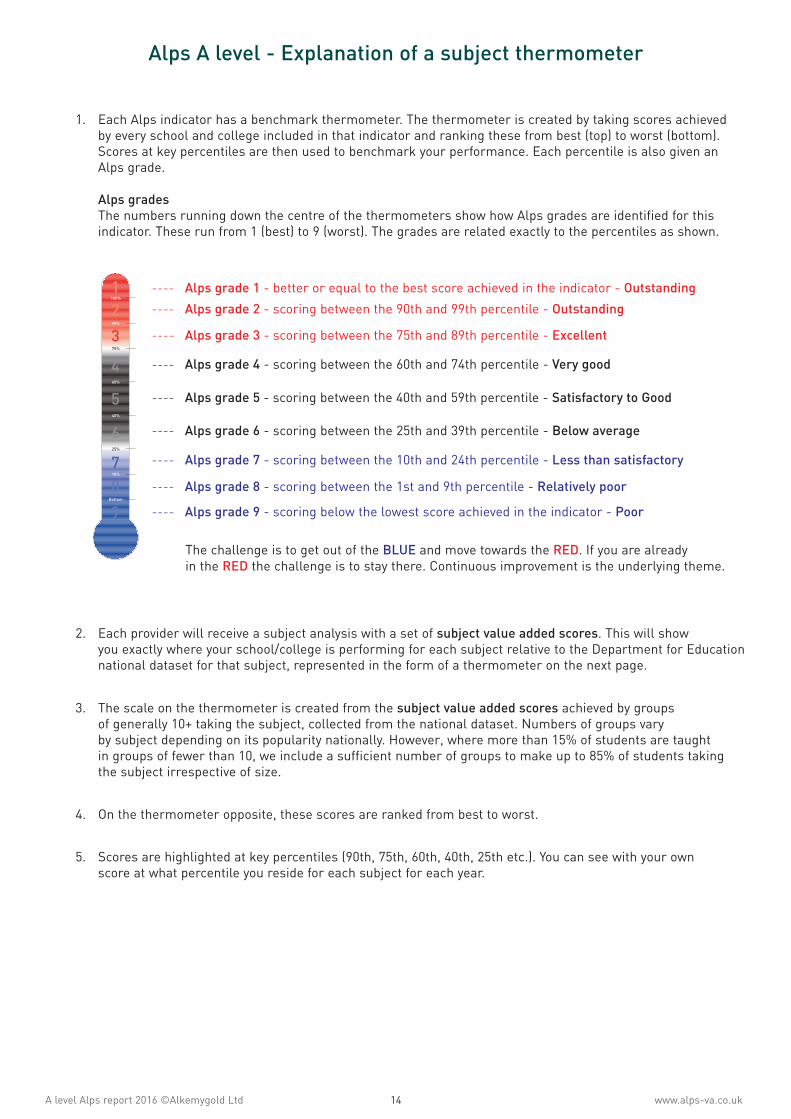
1. Each Alps indicator has a benchmark thermometer. The thermometer is created by taking scores achievedby every school and college included in that indicator and ranking these from best (top) to worst (bottom).Scores at key percentiles are then used to benchmark your performance. Each percentile is also given anAlps grade.
Alps grades The numbers running down the centre of the thermometers show how Alps grades are identified for this
indicator. These run from 1 (best) to 9 (worst). The grades are related exactly to the percentiles as shown.
2. Each provider will receive a subject analysis with a set of subject value added scores. This will showyou exactly where your school/college is performing for each subject relative to the Department for Educationnational dataset for that subject, represented in the form of a thermometer on the next page.
3. The scale on the thermometer is created from the subject value added scores achieved by groupsof generally 10+ taking the subject, collected from the national dataset. Numbers of groups varyby subject depending on its popularity nationally. However, where more than 15% of students are taughtin groups of fewer than 10, we include a sufficient number of groups to make up to 85% of students takingthe subject irrespective of size.
4. On the thermometer opposite, these scores are ranked from best to worst.
5. Scores are highlighted at key percentiles (90th, 75th, 60th, 40th, 25th etc.). You can see with your ownscore at what percentile you reside for each subject for each year.
100%
90%
75%
60%
40%
25%
10%
Bottom
1 2
3
7 8
9
4
5
6
---- Alps grade 1 - better or equal to the best score achieved in the indicator - Outstanding
---- Alps grade 2 - scoring between the 90th and 99th percentile - Outstanding
---- Alps grade 3 - scoring between the 75th and 89th percentile - Excellent
---- Alps grade 4 - scoring between the 60th and 74th percentile - Very good
---- Alps grade 5 - scoring between the 40th and 59th percentile - Satisfactory to Good
---- Alps grade 6 - scoring between the 25th and 39th percentile - Below average
---- Alps grade 7 - scoring between the 10th and 24th percentile - Less than satisfactory
---- Alps grade 8 - scoring between the 1st and 9th percentile - Relatively poor
---- Alps grade 9 - scoring below the lowest score achieved in the indicator - Poor
The challenge is to get out of the BLUE and move towards the RED. If you are already in the RED the challenge is to stay there. Continuous improvement is the underlying theme.
14A level Alps report 2016 ©Alkemygold Ltd www.alps-va.co.uk

Alps A level - Explanation of a subject thermometer0.20 represents one grade difference in one subject per student.
15A level Alps report 2016 ©Alkemygold Ltd www.alps-va.co.uk
1.18
1.08
1.03
1.00
0.95
0.92
0.86
0.71
100%
90%
75%
60%
40%
25%
10%
Bottom
1 2
3
7 8
9
4
5
6
1
153
382
611
916
1,145
1,374
1,527
100%
90%
75%
60%
40%
25%
10%
Bottom
1 2
3
7 8
9
4
5
6
Ranked providers A level English literature
16A level Alps report 2016 ©Alkemygold Ltd www.alps-va.co.uk
Alps A level - Subject value added scores at different percentiles
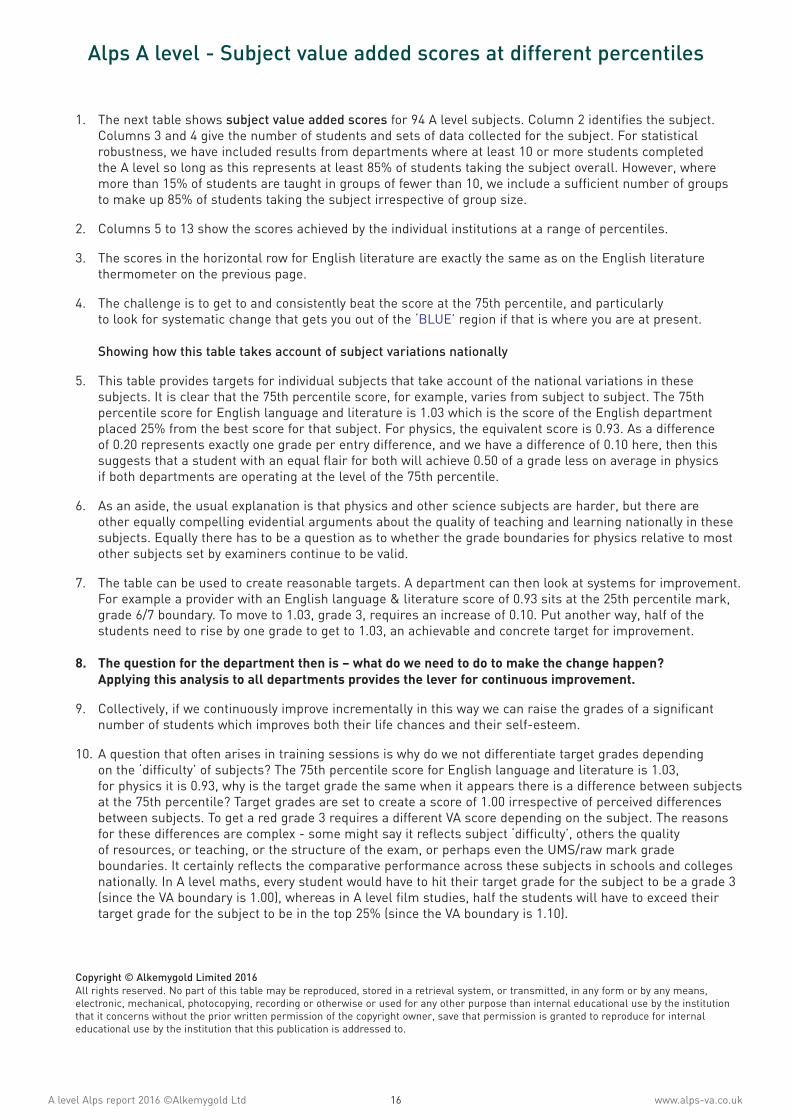
1. The next table shows subject value added scores for 94 A level subjects. Column 2 identifies the subject.Columns 3 and 4 give the number of students and sets of data collected for the subject. For statisticalrobustness, we have included results from departments where at least 10 or more students completedthe A level so long as this represents at least 85% of students taking the subject overall. However, wheremore than 15% of students are taught in groups of fewer than 10, we include a sufficient number of groupsto make up 85% of students taking the subject irrespective of group size.
2. Columns 5 to 13 show the scores achieved by the individual institutions at a range of percentiles.
3. The scores in the horizontal row for English literature are exactly the same as on the English literaturethermometer on the previous page.
4. The challenge is to get to and consistently beat the score at the 75th percentile, and particularlyto look for systematic change that gets you out of the ‘BLUE’ region if that is where you are at present. Showing how this table takes account of subject variations nationally
5. This table provides targets for individual subjects that take account of the national variations in thesesubjects. It is clear that the 75th percentile score, for example, varies from subject to subject. The 75thpercentile score for English language and literature is 1.03 which is the score of the English departmentplaced 25% from the best score for that subject. For physics, the equivalent score is 0.93. As a differenceof 0.20 represents exactly one grade per entry difference, and we have a difference of 0.10 here, then thissuggests that a student with an equal flair for both will achieve 0.50 of a grade less on average in physicsif both departments are operating at the level of the 75th percentile.
6. As an aside, the usual explanation is that physics and other science subjects are harder, but there areother equally compelling evidential arguments about the quality of teaching and learning nationally in thesesubjects. Equally there has to be a question as to whether the grade boundaries for physics relative to mostother subjects set by examiners continue to be valid.
7. The table can be used to create reasonable targets. A department can then look at systems for improvement.For example a provider with an English language & literature score of 0.93 sits at the 25th percentile mark,grade 6/7 boundary. To move to 1.03, grade 3, requires an increase of 0.10. Put another way, half of thestudents need to rise by one grade to get to 1.03, an achievable and concrete target for improvement.
8. The question for the department then is – what do we need to do to make the change happen?Applying this analysis to all departments provides the lever for continuous improvement.
9. Collectively, if we continuously improve incrementally in this way we can raise the grades of a significantnumber of students which improves both their life chances and their self-esteem.
10. A question that often arises in training sessions is why do we not differentiate target grades dependingon the ‘difficulty’ of subjects? The 75th percentile score for English language and literature is 1.03,for physics it is 0.93, why is the target grade the same when it appears there is a difference between subjectsat the 75th percentile? Target grades are set to create a score of 1.00 irrespective of perceived differencesbetween subjects. To get a red grade 3 requires a different VA score depending on the subject. The reasonsfor these differences are complex - some might say it reflects subject ‘difficulty’, others the qualityof resources, or teaching, or the structure of the exam, or perhaps even the UMS/raw mark gradeboundaries. It certainly reflects the comparative performance across these subjects in schools and collegesnationally. In A level maths, every student would have to hit their target grade for the subject to be a grade 3(since the VA boundary is 1.00), whereas in A level film studies, half the students will have to exceed theirtarget grade for the subject to be in the top 25% (since the VA boundary is 1.10).
Copyright © Alkemygold Limited 2016 All rights reserved. No part of this table may be reproduced, stored in a retrieval system, or transmitted, in any form or by any means,
electronic, mechanical, photocopying, recording or otherwise or used for any other purpose than internal educational use by the institutionthat it concerns without the prior written permission of the copyright owner, save that permission is granted to reproduce for internaleducational use by the institution that this publication is addressed to.

17A level Alps report 2016 ©Alkemygold Ltd www.alps-va.co.uk
Alps A level - Subject value added scores at different percentiles95 subjects are listed. Subjects not included are missing because the number of sets of data was too small to be reliable. 0.20 difference represents one grade difference per entry in comparing sets.
Subject Students Sets 100% 90% 75% 60% 40% 25% 10% 0% <0%
1 A - Accounting 2,424 146 1.19 1.04 0.98 0.94 0.88 0.83 0.75 0.53 <0.53
2 A - Ancient History 521 26 1.08 1.05 1.01 0.97 0.94 0.93 0.88 0.82 <0.82
3 A - Anthropology 123 13 1.15 1.06 1.02 1.01 0.97 0.82 0.79 0.64 <0.64
4 A - Applied Art & Design - Double Award 297 36 1.51 1.33 1.25 1.19 1.10 1.01 0.97 0.86 <0.86
5 A - Applied Art & Design - Single Award 320 48 1.49 1.24 1.17 1.13 1.01 0.94 0.84 0.67 <0.67
6 A - Applied Business - Double Award 978 94 1.43 1.22 1.15 1.12 1.07 1.00 0.93 0.75 <0.75
7 A - Applied Business - Single Award 4,701 311 1.38 1.18 1.10 1.06 1.01 0.96 0.87 0.54 <0.54
8 A - Applied ICT - Double Award 393 34 1.20 1.14 1.06 1.00 0.97 0.91 0.81 0.58 <0.58
9 A - Applied ICT - Single Award 5,588 359 1.31 1.09 1.02 0.96 0.89 0.84 0.75 0.33 <0.33
10 A - Applied Science - Double Award 271 23 0.99 0.96 0.94 0.86 0.83 0.79 0.70 0.27 <0.27
11 A - Applied Science - Single Award 2,178 184 1.16 1.01 0.96 0.92 0.87 0.82 0.74 0.53 <0.53
12 A - Arabic 139 26 1.40 1.31 1.21 1.17 1.07 1.01 0.91 0.84 <0.84
13 A - Archaeology 385 29 1.16 1.13 1.08 1.01 0.99 0.91 0.85 0.59 <0.59
14 A - Art & Design 5,618 542 1.38 1.19 1.12 1.07 1.01 0.96 0.87 0.72 <0.72
15 A - Art & Design (3D Design) 515 48 1.35 1.25 1.21 1.12 1.03 0.96 0.85 0.57 <0.57
16 A - Art & Design (Critical Studies) 218 19 1.35 1.30 1.18 1.16 1.09 1.04 0.93 0.86 <0.86
17 A - Art & Design (Fine Art) 11,246 927 1.38 1.21 1.14 1.09 1.03 0.98 0.91 0.74 <0.74
18 A - Art & Design (Graphic Design) 3,438 188 1.39 1.24 1.16 1.11 1.02 0.99 0.93 0.71 <0.71
19 A - Art & Design (Photography) 10,192 580 1.50 1.25 1.16 1.10 1.05 0.99 0.92 0.72 <0.72
20 A - Art & Design (Textiles) 2,733 286 1.53 1.26 1.19 1.12 1.06 1.02 0.94 0.73 <0.73
21 A - Biology 50,589 1,596 1.06 0.96 0.92 0.88 0.84 0.80 0.74 0.59 <0.59
22 A - Business Studies 20,443 914 1.22 1.10 1.04 1.01 0.96 0.92 0.86 0.73 <0.73
23 A - Chemistry 39,459 1,330 1.04 0.97 0.93 0.90 0.86 0.82 0.76 0.62 <0.62
24 A - Chinese 762 141 1.41 1.22 1.16 1.10 1.05 1.00 0.93 0.65 <0.65
25 A - Citizenship Studies 666 42 1.23 1.18 1.09 1.04 0.97 0.94 0.88 0.55 <0.55
26 A - Classical Civilisation 3,152 257 1.16 1.07 1.02 0.99 0.95 0.92 0.86 0.74 <0.74
27 A - Classical Greek 142 29 1.15 1.08 1.06 1.03 1.00 0.95 0.92 0.77 <0.77
28 A - Classics 268 24 1.24 1.08 1.02 0.97 0.93 0.89 0.83 0.57 <0.57
29 A - Communication & Culture 1,454 71 1.30 1.18 1.14 1.10 1.05 1.01 0.93 0.86 <0.86
30 A - Computing 2,946 282 1.14 1.01 0.95 0.90 0.84 0.79 0.70 0.43 <0.43
31 A - Creative Writing 742 86 1.20 1.11 1.06 1.00 0.96 0.93 0.86 0.76 <0.76
32 A - Critical Thinking 826 42 1.01 0.93 0.87 0.85 0.78 0.73 0.65 0.34 <0.34
33 A - Dance 1,706 251 1.38 1.21 1.12 1.08 1.02 0.96 0.89 0.72 <0.72
34 A - Design & Technology (Food Technology) 936 171 1.35 1.15 1.10 1.02 0.94 0.90 0.77 0.43 <0.43
35 A - Design & Technology (Product Design) 7,980 937 1.26 1.11 1.03 0.98 0.92 0.86 0.78 0.49 <0.49
36 A - Design & Technology (Systems & Control Technology) 191 32 1.21 1.10 1.04 0.98 0.94 0.88 0.84 0.76 <0.76
37 A - Design & Technology (Textiles) 1,583 272 1.24 1.10 1.04 0.99 0.93 0.87 0.78 0.62 <0.62
38 A - Drama & Theatre Studies 10,619 1,004 1.27 1.12 1.06 1.01 0.96 0.92 0.86 0.71 <0.71
39 A - Economics 18,036 725 1.15 1.06 1.02 0.98 0.95 0.91 0.86 0.72 <0.72
40 A - Economics & Business 1,664 96 1.24 1.10 1.04 1.00 0.96 0.93 0.86 0.66 <0.66
41 A - Electronics 875 67 1.31 1.16 1.12 1.06 1.01 0.96 0.89 0.78 <0.78
42 A - Engineering - Single Award 202 25 1.18 1.16 1.10 1.06 0.95 0.84 0.83 0.66 <0.66
43 A - English Language 21,475 709 1.15 1.06 1.02 0.99 0.96 0.93 0.89 0.76 <0.76
44 A - English Language & Literature 13136 512 1.17 1.07 1.03 1.00 0.96 0.93 0.88 0.76 <0.76
45 A - English Literature 38,438 1,527 1.18 1.08 1.03 1.00 0.95 0.92 0.86 0.71 <0.71
46 A - Environmental Studies 952 75 1.26 1.01 0.92 0.89 0.85 0.79 0.70 0.44 <0.44
47 A - Film Studies 5,137 351 1.30 1.16 1.10 1.07 1.03 1.00 0.95 0.76 <0.76
48 A - French 8,381 1,099 1.18 1.05 0.99 0.95 0.89 0.85 0.77 0.55 <0.55
49 A - General Studies 30,023 407 1.02 0.90 0.85 0.80 0.74 0.70 0.64 0.43 <0.43
50 A - Geography 24,719 1,259 1.15 1.07 1.02 0.99 0.96 0.92 0.86 0.72 <0.72
51 A - Geology 1,687 102 1.17 1.07 1.04 1.00 0.96 0.92 0.86 0.77 <0.77
52 A - German 2,562 492 1.32 1.06 0.99 0.93 0.88 0.81 0.73 0.53 <0.53
53 A - Government & Politics 11,402 698 1.19 1.08 1.04 1.01 0.97 0.92 0.87 0.70 <0.70
54 A - Health & Social Care - Double Award 1,801 152 1.33 1.15 1.09 1.04 0.98 0.94 0.88 0.69 <0.69
55 A - Health & Social Care - Single Award 4,282 311 1.24 1.10 1.03 0.99 0.94 0.90 0.83 0.62 <0.62
56 A - History 40,333 1,505 1.16 1.05 1.01 0.98 0.94 0.91 0.86 0.71 <0.71
57 A - History of Art 681 71 1.21 1.15 1.11 1.05 0.97 0.94 0.87 0.71 <0.71
58 A - Home Economics 264 50 1.28 1.09 1.05 0.99 0.91 0.85 0.77 0.45 <0.45
59 A - Information & Communication Technology 6,248 438 1.19 1.05 0.99 0.94 0.90 0.85 0.77 0.64 <0.64
60 A - Italian 331 61 1.38 1.13 1.08 1.05 0.99 0.95 0.90 0.56 <0.56
61 A - Japanese 62 11 1.15 1.07 1.06 0.97 0.89 0.86 0.80 0.69 <0.69
62 A - Latin 1,034 187 1.15 1.08 1.05 1.01 0.96 0.91 0.84 0.63 <0.63
63 A - Law 9,853 364 1.20 1.08 1.02 0.98 0.93 0.88 0.81 0.65 <0.65
64 A - Leisure Studies - Single Award 421 47 1.23 1.18 1.09 1.06 1.00 0.97 0.91 0.80 <0.80
65 A - Mathematics 69,225 1,778 1.13 1.04 1.00 0.97 0.92 0.89 0.83 0.65 <0.65
66 A - Mathematics (Further) 9,851 988 1.24 1.11 1.05 1.02 0.97 0.92 0.84 0.52 <0.52
67 A - Media Studies 17,461 820 1.29 1.15 1.09 1.06 1.01 0.98 0.91 0.75 <0.75
68 A - Media: Communication & Production - Single Award 339 18 1.32 1.24 1.15 1.07 0.94 0.93 0.86 0.81 <0.81
69 A - Music 3,816 685 1.15 1.04 0.97 0.92 0.86 0.81 0.73 0.54 <0.54
70 A - Music Technology 2,324 329 1.26 1.07 0.98 0.92 0.85 0.79 0.67 0.39 <0.39
71 A - Performance Studies 697 64 1.17 1.06 1.03 0.99 0.92 0.87 0.83 0.69 <0.69
72 A - Performing Arts - Single Award 966 112 1.53 1.24 1.17 1.10 1.03 0.98 0.90 0.72 <0.72
73 A - Philosophy 2,310 156 1.14 1.02 0.97 0.92 0.88 0.84 0.78 0.47 <0.47
74 A - Physical Education 11,133 998 1.20 1.06 0.97 0.93 0.87 0.83 0.76 0.48 <0.48
75 A - Physics 25,806 1,246 1.08 0.98 0.93 0.89 0.84 0.80 0.73 0.55 <0.55
76 A - Polish 253 55 1.49 1.40 1.33 1.25 1.16 1.10 0.93 0.75 <0.75
77 A - Portuguese 116 22 1.24 1.21 1.13 1.08 1.01 0.98 0.90 0.68 <0.68
78 A - Psychology 47,545 1,485 1.14 1.03 0.98 0.94 0.90 0.86 0.79 0.63 <0.63
79 A - Religious Studies 16,202 1,009 1.20 1.09 1.04 1.01 0.96 0.92 0.85 0.73 <0.73
80 A - Russian 269 50 1.46 1.44 1.37 1.30 1.19 1.13 1.02 0.64 <0.64
81 A - Science In Society 88 16 1.11 1.03 0.98 0.86 0.80 0.65 0.51 0.34 <0.34
82 A - Sociology 23,176 872 1.25 1.13 1.08 1.04 1.00 0.96 0.90 0.76 <0.76
83 A - Spanish 5,427 774 1.25 1.07 1.00 0.96 0.91 0.86 0.79 0.51 <0.51
84 A - Statistics 536 33 1.10 1.05 0.97 0.95 0.88 0.85 0.80 0.65 <0.65
85 A - Travel & Tourism - Single Award 1,372 157 1.36 1.19 1.13 1.09 1.01 0.96 0.88 0.61 <0.61
86 A - Travel & Tourism - Double Award 71 12 1.34 1.23 1.13 1.11 1.07 1.03 1.01 0.82 <0.82
87 A - Turkish 259 37 1.35 1.23 1.16 1.11 1.06 1.00 0.84 0.49 <0.49
88 A - Urdu 215 40 1.55 1.40 1.29 1.21 1.13 1.08 0.98 0.58 <0.58
89 A - Use of Mathematics 794 24 1.10 1.00 0.98 0.95 0.93 0.88 0.79 0.75 <0.75
90 A - Welsh 191 22 1.19 1.05 1.01 1.00 0.92 0.86 0.80 0.59 <0.59
91 A - World Development 495 26 1.27 1.22 1.13 1.10 1.03 1.02 0.95 0.86 <0.86
92 CACHE Diploma - Child Care & Education 2,907 117 1.46 1.27 1.19 1.13 1.09 1.03 0.98 0.81 <0.81
93 IFS Diploma - Financial Studies 1,600 80 1.31 1.25 1.21 1.17 1.09 1.05 0.98 0.84 <0.84
94 EPQ - Extended Project 25,431 708 1.35 1.17 1.10 1.05 0.98 0.91 0.78 0.49 <0.49
95 WBQ - Welsh Baccalaureate 2,172 43 1.32 1.27 1.21 1.17 1.10 1.09 1.02 0.78 <0.78
1 2 3 4 5 6 7 8 9

18A level Alps report 2016 ©Alkemygold Ltd www.alps-va.co.uk
Alps A level - Performance indicators - an overview
1. The Alps (Advanced Level Performance System) uses the complete national dataset from the Departmentfor Education for all schools and colleges.
2. Remember that there is no one Alps ‘score’ that stands above the others – they are all there to be used to help you analyse and improve performance in A level outcomes. In each of the measures below, resultsin general studies and EPQ are not included.
3. The ‘RED’ teaching and learning score is a measure of what proportion of your teaching across all subjects isexcellent or outstanding. It works by adding together the number of all the exam entries in subjects which scored1, 2 or 3 and comparing it with the number of entries overall.
4. The ‘BLUE’ teaching and learning score helps you gauge what proportion of your teaching across all subjects isless than satisfactory, or poor. It works by adding together the number of all the exam entries in subjects whichscored 7, 8 or 9.
5. The Quality Indicator is a measure that looks at the performance across all your subjects. This is calculatedby comparing the Alps expected UCAS points against the actual UCAS points achieved in each subject you offer.
6. The T score is simply an average of the scores for three measures – Quality Indicator, RED teaching and learningand BLUE teaching and learning. You can use it to measure changes in overall quality year on year.
7. The Three year T score summarises the total trend over the last 3 years. It averages your single yearT score for the last three years.
8. The Student progression score is a measure of what proportion of students who completed 2 or moreAS levels went on to complete 2 or more A levels.
9. An Alps score of 1.0 means that the UCAS scores for a year group were in line with their minimum expectations.
10. Subject national expected outcomes vary. If all students nationally achieved as expected the score would be 1.0.If they achieved lower than expected the score would be below 1.0. This helps you to know what departmentsneed to do in order to improve. 0.2 is a grade.
11. The Student Performance Overview shows how each student performed in each course they took againstthe Alps minimum expected grades.
12. Throughout this analytical section, there is a common grading system that works at three levels whichare interlinked and allow a reader to look at the analysis at different depths. These are:
Matching top 25%+ RED Alps grades 1 - 3
Matching middle 50% BLACK Alps grades 4 - 6
Matching bottom 25%- BLUE Alps grades 7 - 9

Section B
Analysis of your A level data
19A level Alps report 2016 ©Alkemygold Ltd www.alps-va.co.uk
Alps Alps - Alkemygold Ltd, Kevin Conway House
Longbow Close, Huddersfield HD2 1GQ01484 887600 | [email protected] | www.alps-va.co.uk
KS5

Alps A level - Raw results
1. The raw A level results for your school or college on which the Alps analysis is based are opposite.Please check to ensure these are correct.
2. A copy of your report will go to your LA or MAT if you are part of an LA or MAT funded project, so it isimportant that your data is correct. Equally, an accurate Alps report can be a powerful tool to use in yourOfsted inspection.
3. If you need to correct your data, please amend the data in your provider’s Alps Data Collection Software(ADCS) file which you can access via myAlps Data Exchange at www.alps-va.co.uk.
4. If you re-submit your corrected data file to us we will re-process and send to you the amended report.Please see the ADCS user guide for more information. This is available via the help menu in the ADCSor via our website www.alps-va.co.uk/data.
20A level Alps report 2016 ©Alkemygold Ltd www.alps-va.co.uk
G3

Alps A level - Raw resultsAlps Example Sixth Form
2015/16 | A level | Report no: 1 | 19.08.16
A level Alps report 2016 ©Alkemygold Ltd 21 www.alps-va.co.uk
Subject Exams A* A B C D E U X Q A*-E% A*-C% A*-B% AvgGCSE
AvgQCA
A - Applied ICT - S 2 0 0 2 0 0 0 0 0 0 100.0% 100.0% 100.0% 6.02 46.09
A - Art & Design 36 4 9 10 7 5 1 0 0 0 100.0% 83.3% 63.9% 5.95 45.70
A - Biology 26 0 4 5 5 6 1 4 1 0 80.8% 53.8% 34.6% 6.50 49.02
A - Business Studies 22 0 2 4 6 7 2 1 0 0 95.5% 54.5% 27.3% 5.96 45.74
A - Chemistry 17 2 8 4 1 1 1 0 0 0 100.0% 88.2% 82.4% 6.81 50.85
A - Classical Civilisation 6 0 2 2 0 1 1 0 0 0 100.0% 66.7% 66.7% 6.06 46.34
A - Computing 5 1 1 2 1 0 0 0 0 0 100.0% 100.0% 80.0% 6.48 48.88
A - D&T (Product Design) 35 0 14 11 9 1 0 0 0 0 100.0% 97.1% 71.4% 6.16 46.96
A - Drama & Theatre Studies 26 0 1 15 5 4 1 0 0 0 100.0% 80.8% 61.5% 5.56 43.35
A - Economics 6 1 2 1 1 1 0 0 0 0 100.0% 83.3% 66.7% 6.27 47.64
A - English Language 29 0 11 11 4 3 0 0 0 0 100.0% 89.7% 75.9% 6.14 46.83
A - English Literature 43 1 10 15 10 5 2 0 0 0 100.0% 83.7% 60.5% 6.12 46.71
A - Film Studies 13 0 3 4 3 3 0 0 0 0 100.0% 76.9% 53.8% 5.31 41.83
A - French 9 0 2 3 2 2 0 0 0 0 100.0% 77.8% 55.6% 6.62 49.74
A - Geography 19 2 4 8 3 2 0 0 0 0 100.0% 89.5% 73.7% 6.23 47.36
A - Government & Politics 3 0 1 0 1 1 0 0 0 0 100.0% 66.7% 33.3% 6.15 46.88
A - History 42 2 9 11 11 7 2 0 0 0 100.0% 78.6% 52.4% 6.07 46.42
A - Home Economics 1 0 0 0 0 1 0 0 0 0 100.0% 0.0% 0.0% 6.44 48.64
A - ICT 16 0 0 7 4 3 2 0 0 0 100.0% 68.8% 43.8% 5.69 44.16
A - Law 6 0 2 1 2 1 0 0 0 0 100.0% 83.3% 50.0% 5.93 45.56
A - Mathematics 49 6 13 13 13 3 1 0 0 0 100.0% 91.8% 65.3% 6.47 48.80
A - Maths (Further) 7 2 3 2 0 0 0 0 0 0 100.0% 100.0% 100.0% 6.79 50.75
A - Media Studies 12 0 1 5 4 1 1 0 0 0 100.0% 83.3% 50.0% 5.57 43.42
A - Physical Education 11 2 3 4 1 1 0 0 0 0 100.0% 90.9% 81.8% 6.07 46.42
A - Physics 16 2 5 4 1 2 1 1 0 0 93.8% 75.0% 68.8% 6.47 48.79
A - Psychology 50 2 7 11 16 8 4 2 0 0 96.0% 72.0% 40.0% 6.00 45.97
A - Religious Studies 14 0 3 2 2 3 2 2 0 0 85.7% 50.0% 35.7% 5.90 45.38
A - Sociology 34 0 11 10 6 5 2 0 0 0 100.0% 79.4% 61.8% 5.55 43.30
A - Spanish 3 0 1 1 1 0 0 0 0 0 100.0% 100.0% 66.7% 7.60 55.60
A - Travel & Tourism - D 2 0 0 2 0 2 0 0 0 0 100.0% 50.0% 50.0% 5.17 40.99
A - World Development 8 2 3 1 2 0 0 0 0 0 100.0% 100.0% 75.0% 6.78 50.67
Totals 568 29 135 171 121 79 24 10 1 0 98.1% 80.0% 58.8% 6.09 46.56
Subject Exams A* A B C D E U X Q A*-E% A*-C% A*-B% AvgGCSE
AvgQCA
A - General Studies 67 1 7 20 18 13 6 2 0 0 97.0% 68.7% 41.8% 6.18 47.09
EPQ - Extended Project 16 0 5 3 4 3 0 1 0 0 93.8% 75.0% 50.0% 6.44 48.66
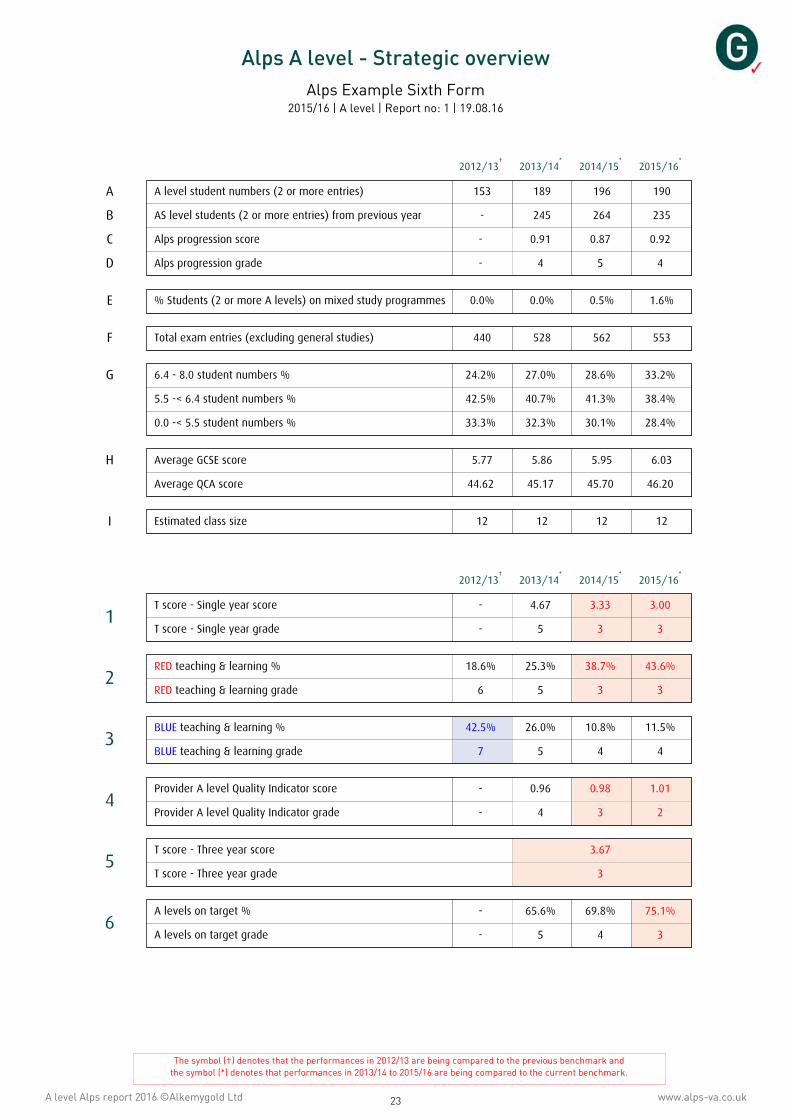
Alps A level - Strategic overview
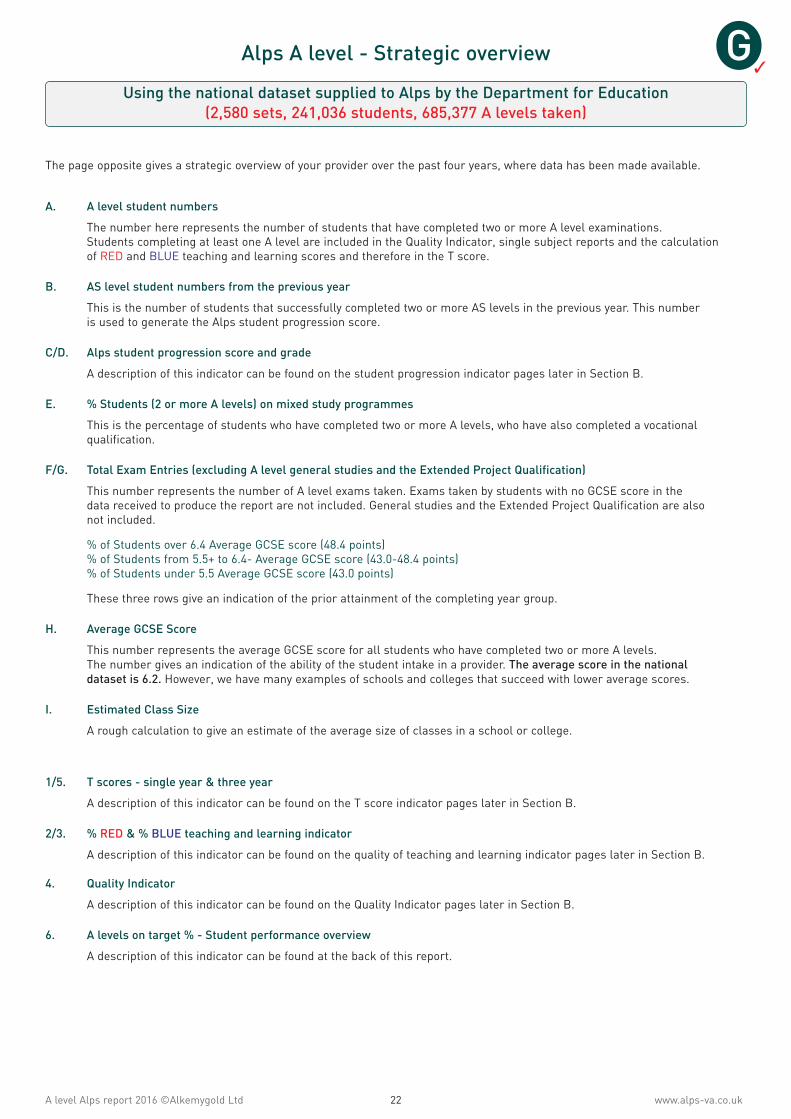
The page opposite gives a strategic overview of your provider over the past four years, where data has been made available.
A. A level student numbers
The number here represents the number of students that have completed two or more A level examinations.Students completing at least one A level are included in the Quality Indicator, single subject reports and the calculationof RED and BLUE teaching and learning scores and therefore in the T score.
B. AS level student numbers from the previous year
This is the number of students that successfully completed two or more AS levels in the previous year. This numberis used to generate the Alps student progression score.
C/D. Alps student progression score and grade
A description of this indicator can be found on the student progression indicator pages later in Section B.
E. % Students (2 or more A levels) on mixed study programmes
This is the percentage of students who have completed two or more A levels, who have also completed a vocationalqualification.
F/G. Total Exam Entries (excluding A level general studies and the Extended Project Qualification)
This number represents the number of A level exams taken. Exams taken by students with no GCSE score in thedata received to produce the report are not included. General studies and the Extended Project Qualification are alsonot included.
% of Students over 6.4 Average GCSE score (48.4 points) % of Students from 5.5+ to 6.4- Average GCSE score (43.0-48.4 points) % of Students under 5.5 Average GCSE score (43.0 points)
These three rows give an indication of the prior attainment of the completing year group.
H. Average GCSE Score
This number represents the average GCSE score for all students who have completed two or more A levels.The number gives an indication of the ability of the student intake in a provider. The average score in the nationaldataset is 6.2. However, we have many examples of schools and colleges that succeed with lower average scores.
I. Estimated Class Size
A rough calculation to give an estimate of the average size of classes in a school or college.
1/5. T scores - single year & three year
A description of this indicator can be found on the T score indicator pages later in Section B.
2/3. % RED & % BLUE teaching and learning indicator
A description of this indicator can be found on the quality of teaching and learning indicator pages later in Section B.
4. Quality Indicator
A description of this indicator can be found on the Quality Indicator pages later in Section B.
6. A levels on target % - Student performance overview
A description of this indicator can be found at the back of this report.
22A level Alps report 2016 ©Alkemygold Ltd www.alps-va.co.uk
Using the national dataset supplied to Alps by the Department for Education(2,580 sets, 241,036 students, 685,377 A levels taken)
G3
A level Alps report 2016 ©Alkemygold Ltd 23 www.alps-va.co.uk
Alps A level - Strategic overviewAlps Example Sixth Form
2015/16 | A level | Report no: 1 | 19.08.16
The symbol (†) denotes that the performances in 2012/13 are being compared to the previous benchmark andthe symbol (*) denotes that performances in 2013/14 to 2015/16 are being compared to the current benchmark.
2012/13†
2013/14*
2014/15*
2015/16*
A
B
C
D
A level student numbers (2 or more entries) 153 189 196 190
AS level students (2 or more entries) from previous year - 245 264 235
Alps progression score - 0.91 0.87 0.92
Alps progression grade - 4 5 4
E % Students (2 or more A levels) on mixed study programmes 0.0% 0.0% 0.5% 1.6%
F Total exam entries (excluding general studies) 440 528 562 553
G 6.4 - 8.0 student numbers % 24.2% 27.0% 28.6% 33.2%
5.5 -< 6.4 student numbers % 42.5% 40.7% 41.3% 38.4%
0.0 -< 5.5 student numbers % 33.3% 32.3% 30.1% 28.4%
H Average GCSE score 5.77 5.86 5.95 6.03
Average QCA score 44.62 45.17 45.70 46.20
I Estimated class size 12 12 12 12
2012/13†
2013/14*
2014/15*
2015/16*
1T score - Single year score - 4.67 3.33 3.00
T score - Single year grade - 5 3 3
2RED teaching & learning % 18.6% 25.3% 38.7% 43.6%
RED teaching & learning grade 6 5 3 3
3BLUE teaching & learning % 42.5% 26.0% 10.8% 11.5%
BLUE teaching & learning grade 7 5 4 4
4Provider A level Quality Indicator score - 0.96 0.98 1.01
Provider A level Quality Indicator grade - 4 3 2
5T score - Three year score 3.67
T score - Three year grade 3
6A levels on target % - 65.6% 69.8% 75.1%
A levels on target grade - 5 4 3

Alps A level - Analysis of students banded by ability – current year
GCSE Banded v A level Data
The analysis by GCSE bands is represented in Tables 6 & 7.
The page opposite shows the A level results of your students banded into groups of students according to theirachievement at level 2. This is a key set of data as it allows comparison of students grouped by ability against nationalbenchmarks and clearly highlights the areas of strength and weakness at strategic overview level.
The table lists the number of students, the number of A level entries and the grades achieved. Each grade is givena UCAS score where A*=140, A=120, B=100, C=80, D=60, E=40 points.
Average UCAS points per student
Column 16 gives the average UCAS points scored per student for each GCSE band. Column 18 shows the national75th percentile target and column 17 the Alps grade for the indicator where 1 = outstanding, 5 = satisfactory to good,9 = poor.
UCAS points per subject
Column 19 gives the average UCAS points per subject entry for each GCSE band. Column 21 is the national 75thpercentile target and column 20 gives the Alps grade for this indicator, again with a scale of 1 to 9 where1 is outstanding and 9 is poor achievement.
Average number of subjects taken
Column 22 shows you the average number of A levels taken compared with the national scene at the 75th percentileof the database in column 24, with your graded position by Alps grade in column 23 in the range 1 to 9.
Average GCSE score band Average QCA score band Description of GCSE results
7.5–8.0 55.0–58.0 Mainly A and A*
7.0–<7.5 52.0–<55.0 Mainly As
6.7–<7.0 50.2–<52.0 Mainly As few Bs
6.4–<6.7 48.4–<50.2 Mainly As & Bs
6.1–<6.4 46.6–<48.4 Mainly Bs few As
5.8–<6.1 44.8–<46.6 Just over all Bs
5.5–<5.8 43.0–<44.8 Mainly Bs few Cs
5.2–<5.5 41.2–<43.0 Mainly Cs few Bs
4.7–<5.2 38.2–<41.2 Mainly Cs
4.0–<4.7 34.0–<38.2 D/Es with 4 Cs
less than 4.0 less than 34.0 Mainly 2/3 Cs+
24A level Alps report 2016 ©Alkemygold Ltd www.alps-va.co.uk
Using the national dataset supplied to Alps by the Department for Education(2,580 sets, 241,036 students, 685,377 A levels taken)

A level A
lps report 2016 ©A
lkemygold Ltd
25w
ww
.alps-va.co.uk
Alps A level - Analysis of students banded by ability - current yearAlps Example Sixth Form | 2015/16 | A level | Report no: 1 | 19.08.16
Table 6
GCSE Banded v A level data
The band 7.0-<7.5 represents a group of students whose average GCSE score on entry was equal to or greater than 7.0 (52 points) and less than 7.5 (55 points) with pointsawarded for GCSE grades as follows: A*=8, A=7, B=6, C=5, D=4, E=3, F=2, G=1. A level single grades are given UCAS points as follows: A*=140, A=120, B=100, C=80, D=60,E=40. Double A level grades: A*A*=280, A,A*=260, AA=240, AB=220, BB=200, BC=180, CC=160, CD=140, DD=120, DE=100, EE=80. The table does not include AS levelsand students who have attempted fewer than 2 A levels. General studies and the Extended Project Qualification are not included.
Students / entriesby GCSE band
A level grades achieved Achievement rates UCAS pts / student UCAS pts / subject No. of subjects per student
0 1 2 3 4 5 6 7 8 9 10 11 12 13 14 15 16 17 18 19 20 21 22 23 24
GCSEband
QCAband
No. ofstudents
No.entries A* A B C D E U X Q A*-E% A*-C% A*-B%
UCAS Pts /Student
AlpsGrade
TargetUCAS pts /
studentbenchmark
75%UCAS Pts /
SubjectAlps
Grade
TargetUCAS pts /
subjectbenchmark
75%Subjects /Student
AlpsGrade
Target no.of subjectsper studentbenchmark
75%
7.5 - 8.0 55.0 - 58.0 7 24 10 11 0 2 1 0 0 0 0 100.0% 95.8% 87.5% 420.00 4 421.25 122.50 5 125.17 3.43 3 3.41
7.0 -< 7.5 52.0 -< 55.0 18 60 7 26 14 11 2 0 0 0 0 100.0% 96.7% 78.3% 361.11 3 350.77 108.33 5 112.47 3.33 2 3.18
6.7 -< 7.0 50.2 -< 52.0 21 67 5 23 27 9 2 0 1 0 0 98.5% 95.5% 82.1% 333.33 3 320.00 104.48 4 104.58 3.19 3 3.08
6.4 -< 6.7 48.4 -< 50.2 17 50 0 11 23 10 6 0 0 0 0 100.0% 88.0% 68.0% 281.18 5 293.85 95.60 4 97.73 2.94 6 3.00
6.1 -< 6.4 46.6 -< 48.4 21 62 1 12 21 15 11 1 1 0 0 98.4% 79.0% 54.8% 265.71 4 274.76 90.00 4 92.50 2.95 5 3.00
5.8 -< 6.1 44.8 -< 46.6 25 72 3 11 26 20 8 2 1 1 0 97.2% 83.3% 55.6% 260.00 3 255.56 90.28 3 86.79 2.88 5 3.00
5.5 -< 5.8 43.0 -< 44.8 27 76 0 18 27 15 7 4 5 0 0 93.4% 78.9% 59.2% 245.93 3 240.00 87.37 2 82.61 2.81 5 3.00
5.2 -< 5.5 41.2 -< 43.0 29 80 2 11 16 22 20 8 1 0 0 98.8% 63.8% 36.3% 223.45 3 222.50 81.00 3 78.33 2.76 5 3.00
4.7 -< 5.2 38.2 -< 41.2 19 45 0 6 10 10 13 5 1 0 0 97.8% 57.8% 35.6% 184.21 5 205.00 77.78 3 74.17 2.37 7 2.88
4.0 -< 4.7 34.0 -< 38.2 5 14 0 0 4 2 7 1 0 0 0 100.0% 42.9% 28.6% 204.00 3 186.67 72.86 3 70.00 2.80 3 2.75
0.0 -< 4.0 10.0 -< 34.0 1 3 0 0 1 1 0 1 0 0 0 100.0% 66.7% 33.3% 220.00 2 180.00 73.33 3 68.89 3.00 2 2.67
6.4 - 8.0 48.4 - 58.0 63 201 22 71 64 32 11 0 1 0 0 99.5% 94.0% 78.1% 336.83 105.57
5.5 -< 6.4 43.0 -< 48.4 73 210 4 41 74 50 26 7 7 1 0 96.2% 80.5% 56.7% 256.44 89.14
0.0 -< 5.5 10.0 -< 43.0 54 142 2 17 31 35 40 15 2 0 0 98.6% 59.9% 35.2% 207.78 79.01
Total 190 553 28 129 169 117 77 22 10 1 0 98.0% 80.1% 59.0% 269.26 92.51

Analysis of students banded by ability – 4 year summary
Table 7a - UCAS points per student
The purpose of Table 7a is to show how your students performed in terms of total A level UCAS points per studentagainst our benchmarks based on national data. The data in this table does not have any impact on the indicatorgrades in your Strategic Overview.
To understand your performance fully you should compare the figures in this table with the data in your StudentPerformance Overview which shows all the qualifications taken by each student. This will enable you to see whetherthe students in an underperforming band have taken fewer than 3 A levels but have also taken additional AS orvocational qualifications. This and the data in Table 7b below will clarify whether the underperformance in termsof UCAS points per student is caused by the quality of grades per entry or mixed programmes of study.
Table 7b - UCAS points per subject
This table shows how your students performed in terms of total A level UCAS points per subject against ourbenchmarks based on national data.
Although the data in this table does not directly influence your Quality Indicator score and grade it gives you a veryclear picture about how the different prior attainment bands of students performed in terms of points per entry.
To understand your performance fully you should compare the figures in this table with the data in your StudentPerformance Overview which shows all the qualifications taken by each student. This will enable you to see whetherstudents in each band have either consistently met aspirational Alps minimum expected grades in subjects orconsistently underperformed in subjects. If the latter, investigate the causes which might link to insufficiently robustIAG or inaccurate assessment and progress tracking or a lack of differentiation in the classroom or ineffective support.
Table 7c - Subjects taken per student
This table shows how your students performed in terms of total A levels taken in comparison to national figures.The data in this table does not have any impact on the indicator grades in your Strategic Overview.
To understand your performance fully you should compare the figures in this table with the data in your StudentPerformance Overview which shows all the qualifications taken by each student. This will enable you to see whetherstudents who have taken fewer than 3 A levels have taken additional AS or vocational qualifications.
We are aware that subjects taken per student may well fluctuate significantly, especially at AS, as we move into thelinear landscape in England.
26A level Alps report 2016 ©Alkemygold Ltd www.alps-va.co.uk
Using the national dataset supplied to Alps by the Department for Education(2,580 sets, 241,036 students, 685,377 A levels taken)
G3

A level Alps report 2016 ©Alkemygold Ltd 27 www.alps-va.co.uk
Analysis of students banded by ability - 4 year summaryAlps Example Sixth Form
2015/16 | A level | Report no: 1 | 19.08.16
The symbol (†) denotes that the performances in 2012/13 are being compared to the previous benchmark andthe symbol (*) denotes that performances in 2013/14 to 2015/16 are being compared to the current benchmark.
Using the national dataset supplied to Alps by the Department for Education(2,580 sets, 241,036 students, 685,377 A levels taken)
Table 7a - UCAS points per student
2012/13†
2013/14*
2014/15*
2015/16*
GCSE score QCA score UCAS pts target Studentnumbers
UCAS ptsscored Alps grade Student
numbersUCAS ptsscored Alps grade Student
numbersUCAS ptsscored Alps grade Student
numbersUCAS ptsscored Alps grade
7.5 - 8.0 55.0 - 58.0 421.25 4 285.00 8 3 340.00 8 8 422.50 3 7 420.00 4
7.0 -< 7.5 52.0 -< 55.0 350.77 6 303.33 8 16 333.75 5 15 376.00 2 18 361.11 3
6.7 -< 7.0 50.2 -< 52.0 320.00 12 281.67 7 13 293.85 6 11 387.27 2 21 333.33 3
6.4 -< 6.7 48.4 -< 50.2 293.85 15 245.33 7 19 283.16 5 22 311.82 2 17 281.18 5
6.1 -< 6.4 46.6 -< 48.4 274.76 25 185.60 8 20 296.00 2 32 279.38 3 21 265.71 4
5.8 -< 6.1 44.8 -< 46.6 255.56 16 226.25 6 24 211.67 7 23 229.57 6 25 260.00 3
5.5 -< 5.8 43.0 -< 44.8 240.00 24 216.67 5 33 229.09 4 26 204.62 6 27 245.93 3
5.2 -< 5.5 41.2 -< 43.0 222.50 15 182.67 6 23 206.96 5 24 201.67 5 29 223.45 3
4.7 -< 5.2 38.2 -< 41.2 205.00 15 205.33 3 24 151.67 7 28 152.14 7 19 184.21 5
4.0 -< 4.7 34.0 -< 38.2 186.67 17 201.18 2 12 178.33 4 6 143.33 6 5 204.00 3
0.0 -< 4.0 10.0 -< 34.0 180.00 4 215.00 2 2 170.00 4 1 200.00 3 1 220.00 2
Table 7b - UCAS points per subject
2012/13†
2013/14*
2014/15*
2015/16*
GCSE score QCA score UCAS pts target Studentnumbers
UCAS ptsscored Alps grade Student
numbersUCAS ptsscored Alps grade Student
numbersUCAS ptsscored Alps grade Student
numbersUCAS ptsscored Alps grade
7.5 - 8.0 55.0 - 58.0 125.17 4 81.43 9 3 113.33 8 8 125.19 3 7 122.50 5
7.0 -< 7.5 52.0 -< 55.0 112.47 6 91.00 8 16 106.80 6 15 115.10 3 18 108.33 5
6.7 -< 7.0 50.2 -< 52.0 104.58 12 91.35 8 13 97.95 5 11 115.14 2 21 104.48 4
6.4 -< 6.7 48.4 -< 50.2 97.73 15 81.78 8 19 94.39 5 22 100.88 3 17 95.60 4
6.1 -< 6.4 46.6 -< 48.4 92.50 25 66.29 8 20 98.67 2 32 95.11 3 21 90.00 4
5.8 -< 6.1 44.8 -< 46.6 86.79 16 75.42 7 24 74.71 7 23 82.50 5 25 90.28 3
5.5 -< 5.8 43.0 -< 44.8 82.61 24 78.79 4 33 84.00 3 26 73.89 6 27 87.37 2
5.2 -< 5.5 41.2 -< 43.0 78.33 15 68.50 6 23 76.77 4 24 75.63 4 29 81.00 3
4.7 -< 5.2 38.2 -< 41.2 74.17 15 75.12 3 24 61.69 7 28 60.00 7 19 77.78 3
4.0 -< 4.7 34.0 -< 38.2 70.00 17 71.25 3 12 73.79 3 6 66.15 5 5 72.86 3
0.0 -< 4.0 10.0 -< 34.0 68.89 4 78.18 2 2 68.00 4 1 66.67 4 1 73.33 3
Table 7c - Subjects taken per student
2012/13†
2013/14*
2014/15*
2015/16*
GCSE score QCA score No. subjectstarget
Studentnumbers
Avg subjectstaken Alps grade Student
numbersAvg subjects
taken Alps grade Studentnumbers
Avg subjectstaken Alps grade Student
numbersAvg subjects
taken Alps grade
7.5 - 8.0 55.0 - 58.0 3.41 4 3.50 4 3 3.00 7 8 3.38 4 7 3.43 3
7.0 -< 7.5 52.0 -< 55.0 3.18 6 3.33 3 16 3.13 4 15 3.27 3 18 3.33 2
6.7 -< 7.0 50.2 -< 52.0 3.08 12 3.08 4 13 3.00 4 11 3.36 2 21 3.19 3
6.4 -< 6.7 48.4 -< 50.2 3.00 15 3.00 4 19 3.00 3 22 3.09 3 17 2.94 6
6.1 -< 6.4 46.6 -< 48.4 3.00 25 2.80 7 20 3.00 3 32 2.94 5 21 2.95 5
5.8 -< 6.1 44.8 -< 46.6 3.00 16 3.00 3 24 2.83 6 23 2.78 7 25 2.88 5
5.5 -< 5.8 43.0 -< 44.8 3.00 24 2.75 6 33 2.73 7 26 2.77 6 27 2.81 5
5.2 -< 5.5 41.2 -< 43.0 3.00 15 2.67 5 23 2.70 6 24 2.67 6 29 2.76 5
4.7 -< 5.2 38.2 -< 41.2 2.88 15 2.73 4 24 2.46 7 28 2.54 7 19 2.37 7
4.0 -< 4.7 34.0 -< 38.2 2.75 17 2.82 2 12 2.42 6 6 2.17 8 5 2.80 3
0.0 -< 4.0 10.0 -< 34.0 2.67 4 2.75 2 2 2.50 5 1 3.00 2 1 3.00 2
28A level Alps report 2016 ©Alkemygold Ltd www.alps-va.co.uk
Using the national dataset supplied to Alps by the Department for Education(2,580 sets, 241,036 students, 685,377 A levels taken)
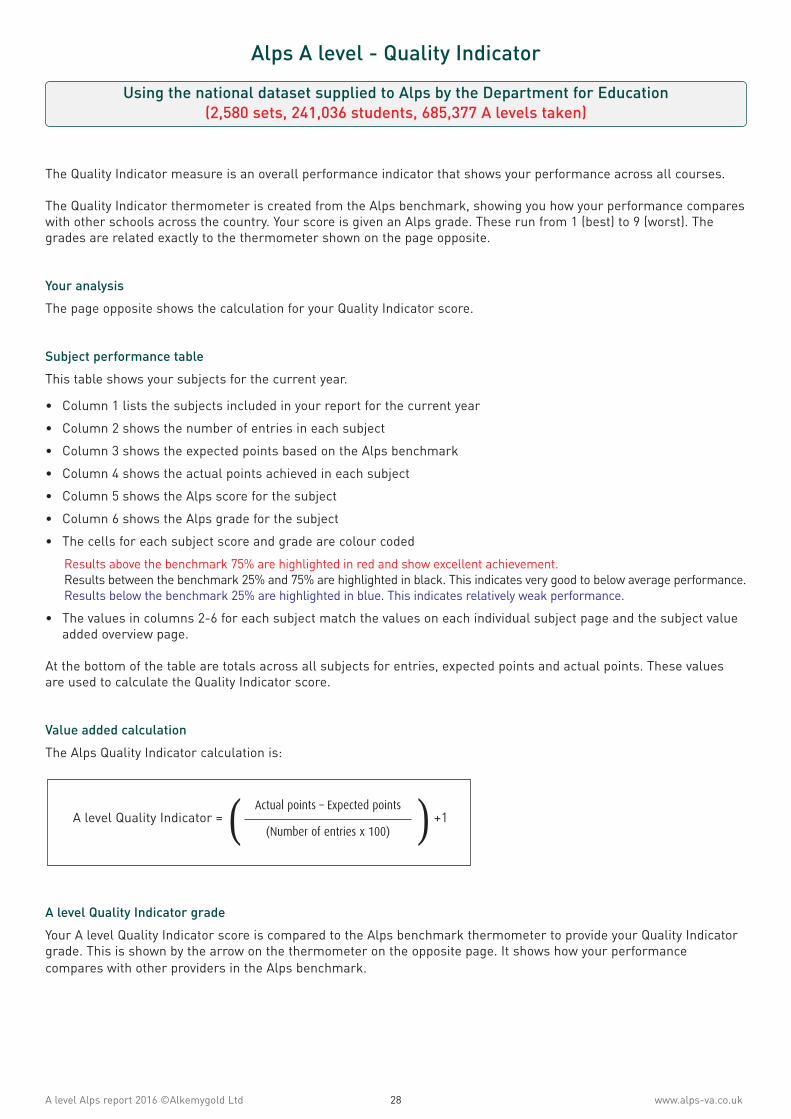
Alps A level - Quality Indicator
The Quality Indicator measure is an overall performance indicator that shows your performance across all courses.
The Quality Indicator thermometer is created from the Alps benchmark, showing you how your performance compareswith other schools across the country. Your score is given an Alps grade. These run from 1 (best) to 9 (worst). Thegrades are related exactly to the thermometer shown on the page opposite.
Your analysis
The page opposite shows the calculation for your Quality Indicator score.
Subject performance table
This table shows your subjects for the current year.
• Column 1 lists the subjects included in your report for the current year
• Column 2 shows the number of entries in each subject
• Column 3 shows the expected points based on the Alps benchmark
• Column 4 shows the actual points achieved in each subject
• Column 5 shows the Alps score for the subject
• Column 6 shows the Alps grade for the subject
• The cells for each subject score and grade are colour coded
Results above the benchmark 75% are highlighted in red and show excellent achievement. Results between the benchmark 25% and 75% are highlighted in black. This indicates very good to below average performance. Results below the benchmark 25% are highlighted in blue. This indicates relatively weak performance.
• The values in columns 2-6 for each subject match the values on each individual subject page and the subject valueadded overview page.
At the bottom of the table are totals across all subjects for entries, expected points and actual points. These valuesare used to calculate the Quality Indicator score.
Value added calculation
The Alps Quality Indicator calculation is:
A level Quality Indicator grade
Your A level Quality Indicator score is compared to the Alps benchmark thermometer to provide your Quality Indicatorgrade. This is shown by the arrow on the thermometer on the opposite page. It shows how your performancecompares with other providers in the Alps benchmark.
A level Quality Indicator = +1Actual points – Expected points
(Number of entries x 100)( )

A level A
lps report 2016 ©A
lkemygold Ltd
29w
ww
.alps-va.co.uk
Alps A level - Quality IndicatorAlps Example Sixth Form | 2015/16 | A level | Report no: 1 | 19.08.16
Value Added Score
1 + ( )Actual UCAS pts - Expected UCAS pts
Entries × 100
1 + ( )52,260 - 51,866.53
566 × 100= 1.01
A level QI score = 1.01 QI grade = 2
1100% 1.07
290% 1.01
375% 0.98
460% 0.96
540% 0.93
625% 0.91
710% 0.87
8bottom 0.77
9
ð
Subject Entries ExpectedPoints
ActualPoints Score Grade
A - Applied ICT - S 2 180.34 200 1.10 2
A - Art & Design 36 3,198.66 3,540 1.09 4
A - Biology 25 2,466.08 1,660 0.68 8
A - Business Studies 22 1,940.58 1,620 0.85 8
A - Chemistry 16 1,674.85 1,700 1.02 2
A - Classical Civilisation 6 559.54 540 0.97 5
A - Computing 5 499.54 540 1.08 2
A - D&T (Product Design) 35 3,227.01 3,560 1.10 3
A - Drama & Theatre Studies 26 2,186.49 2,300 1.04 4
A - Economics 6 569.98 620 1.08 2
A - English Language 29 2,681.55 2,920 1.08 2
A - English Literature 43 3,939.61 4,020 1.02 4
A - Film Studies 13 1,017.50 1,180 1.13 3
A - French 9 896.83 820 0.91 5
A - Geography 19 1,772.16 1,920 1.08 2
A - Government & Politics 3 266.08 260 0.98 5
A - History 41 3,752.68 3,720 0.99 4
A - Home Economics 1 97.73 60 0.62 8
A - ICT 16 1,358.55 1,280 0.95 4
A - Law 6 529.92 560 1.05 3
A - Mathematics 48 4,725.28 4,840 1.02 3
A - Maths (Further) 7 733.00 840 1.15 2
A - Media Studies 12 985.34 1,040 1.05 5
A - Physical Education 11 991.23 1,180 1.17 2
A - Physics 16 1,561.53 1,520 0.97 3
Subject Entries ExpectedPoints
ActualPoints Score Grade
A - Psychology 50 4,487.97 4,140 0.93 5
A - Religious Studies 14 1,243.12 980 0.81 8
A - Sociology 34 2,819.20 3,180 1.11 3
A - Spanish 3 362.81 300 0.79 7
A - Travel & Tourism - D 4 305.00 320 1.04 6
A - World Development 8 836.37 900 1.08 5
Totals 566 51,866.53 52,260
30A level Alps report 2016 ©Alkemygold Ltd www.alps-va.co.uk
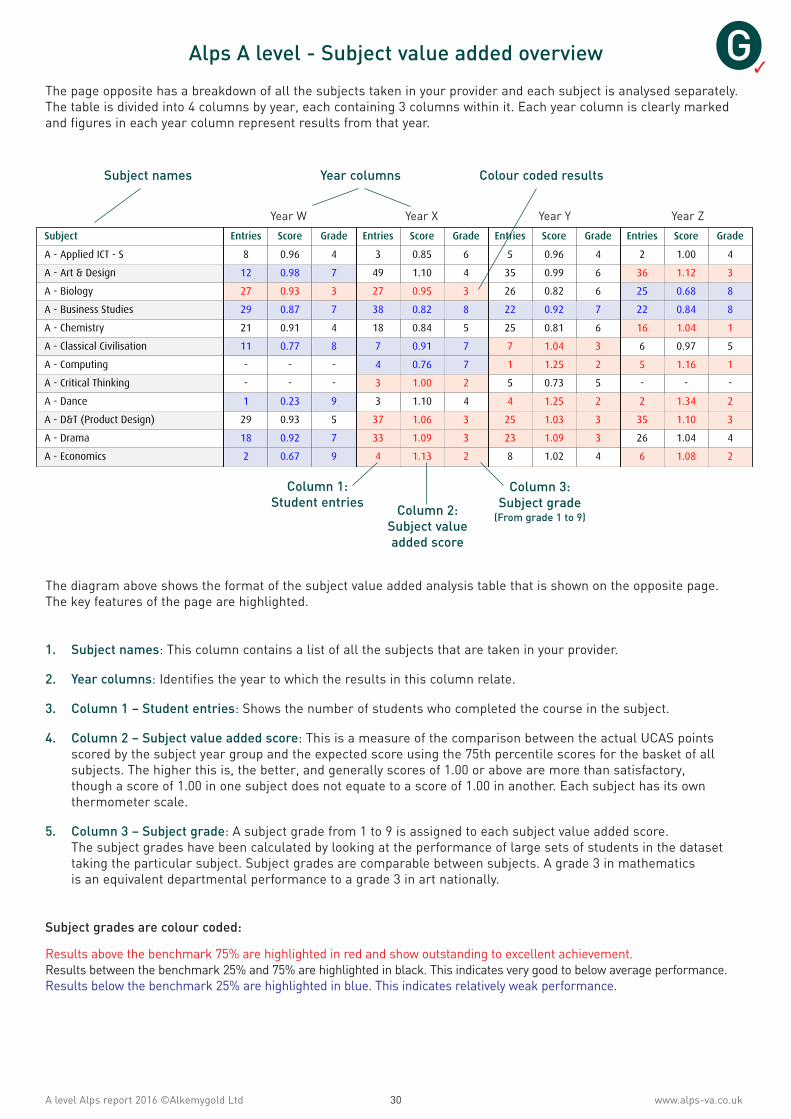
Alps A level - Subject value added overview
The page opposite has a breakdown of all the subjects taken in your provider and each subject is analysed separately.The table is divided into 4 columns by year, each containing 3 columns within it. Each year column is clearly markedand figures in each year column represent results from that year.
The diagram above shows the format of the subject value added analysis table that is shown on the opposite page.The key features of the page are highlighted.
1. Subject names: This column contains a list of all the subjects that are taken in your provider.
2. Year columns: Identifies the year to which the results in this column relate.
3. Column 1 – Student entries: Shows the number of students who completed the course in the subject.
4. Column 2 – Subject value added score: This is a measure of the comparison between the actual UCAS pointsscored by the subject year group and the expected score using the 75th percentile scores for the basket of allsubjects. The higher this is, the better, and generally scores of 1.00 or above are more than satisfactory,though a score of 1.00 in one subject does not equate to a score of 1.00 in another. Each subject has its ownthermometer scale.
5. Column 3 – Subject grade: A subject grade from 1 to 9 is assigned to each subject value added score.The subject grades have been calculated by looking at the performance of large sets of students in the datasettaking the particular subject. Subject grades are comparable between subjects. A grade 3 in mathematicsis an equivalent departmental performance to a grade 3 in art nationally.
Subject grades are colour coded:
Results above the benchmark 75% are highlighted in red and show outstanding to excellent achievement.Results between the benchmark 25% and 75% are highlighted in black. This indicates very good to below average performance.Results below the benchmark 25% are highlighted in blue. This indicates relatively weak performance.
Subject names Year columns Colour coded results
Subject Entries Score Grade Entries Score Grade Entries Score Grade Entries Score Grade
A - Applied ICT - S 8 0.96 4 3 0.85 6 5 0.96 4 2 1.00 4
A - Art & Design 12 0.98 7 49 1.10 4 35 0.99 6 36 1.12 3
A - Biology 27 0.93 3 27 0.95 3 26 0.82 6 25 0.68 8
A - Business Studies 29 0.87 7 38 0.82 8 22 0.92 7 22 0.84 8
A - Chemistry 21 0.91 4 18 0.84 5 25 0.81 6 16 1.04 1
A - Classical Civilisation 11 0.77 8 7 0.91 7 7 1.04 3 6 0.97 5
A - Computing - - - 4 0.76 7 1 1.25 2 5 1.16 1
A - Critical Thinking - - - 3 1.00 2 5 0.73 5 - - -
A - Dance 1 0.23 9 3 1.10 4 4 1.25 2 2 1.34 2
A - D&T (Product Design) 29 0.93 5 37 1.06 3 25 1.03 3 35 1.10 3
A - Drama 18 0.92 7 33 1.09 3 23 1.09 3 26 1.04 4
A - Economics 2 0.67 9 4 1.13 2 8 1.02 4 6 1.08 2
Column 1:Student entries
Column 3:Subject grade(From grade 1 to 9)Column 2:
Subject valueadded score
Year W Year X Year Y Year Z
G3

A level Alps report 2016 ©Alkemygold Ltd 31 www.alps-va.co.uk
Alps A level - Subject value added overviewAlps Example Sixth Form
2015/16 | A level | Report no: 1 | 19.08.16
The symbol (†) denotes that the performances in 2012/13 are being compared to the previous benchmark andthe symbol (*) denotes that performances in 2013/14 to 2015/16 are being compared to the current benchmark.
The symbol (**) denotes that a subject is excluded from the overall report indicators.
2012/13†
2013/14*
2014/15*
2015/16*
Subject Entries Score Grade Entries Score Grade Entries Score Grade Entries Score Grade
A - Applied ICT - S 8 0.96 4 3 0.83 7 5 0.95 5 2 1.10 2
A - Art & Design 12 0.98 7 51 1.10 4 35 0.98 6 36 1.09 4
A - Biology 27 0.93 3 27 0.97 2 26 0.82 6 25 0.68 8
A - Business Studies 29 0.87 7 39 0.82 8 30 0.87 7 22 0.85 8
A - Chemistry 21 0.91 4 18 0.85 6 25 0.82 6 16 1.02 2
A - Classical Civilisation 11 0.77 8 7 0.91 7 7 1.03 3 6 0.97 5
A - Computing - - - 4 0.77 7 2 0.91 4 5 1.08 2
A - D&T (Product Design) 29 0.93 5 37 1.05 3 25 1.02 4 35 1.10 3
A - Drama & Theatre Studies 18 0.92 7 33 1.08 3 23 1.08 3 26 1.04 4
A - Economics 2 0.67 9 7 1.09 2 13 0.91 6 6 1.08 2
A - English Language 15 0.66 9 25 0.98 5 23 1.08 2 29 1.08 2
A - English Literature 31 1.02 4 50 0.98 5 58 1.03 3 43 1.02 4
A - Film Studies - - - 7 1.20 2 11 1.15 3 13 1.13 3
A - French 12 0.77 7 6 0.67 8 9 0.95 4 9 0.91 5
**A - General Studies 73 0.85 4 94 0.79 5 90 0.80 4 66 0.87 3
A - Geography 24 0.92 6 21 1.00 4 17 0.97 5 19 1.08 2
A - Government & Politics 11 1.02 4 8 0.96 6 3 0.69 9 3 0.98 5
A - History 32 1.04 3 17 0.94 5 27 0.93 6 41 0.99 4
A - Home Economics 2 0.63 8 5 0.88 6 2 0.82 7 1 0.62 8
A - ICT 16 0.62 8 7 0.84 7 10 0.86 6 16 0.95 4
A - Law - - - 8 1.08 2 8 0.93 5 6 1.05 3
A - Mathematics 33 0.80 8 44 0.86 7 52 0.96 5 48 1.02 3
A - Maths (Further) 3 0.33 9 1 0.95 6 9 1.15 2 7 1.15 2
A - Media Studies 18 0.95 7 16 1.03 5 20 0.96 7 12 1.05 5
A - Physical Education 25 1.02 3 17 0.94 4 17 1.01 3 11 1.17 2
A - Physics 14 0.71 7 15 0.78 7 25 0.95 3 16 0.97 3
A - Psychology 42 0.90 6 37 0.92 5 50 1.02 3 50 0.93 5
A - Religious Studies 4 0.81 8 11 0.86 7 12 0.94 6 14 0.81 8
A - Sociology 10 1.03 5 20 1.10 3 30 1.07 4 34 1.11 3
A - Spanish 1 0.73 8 3 0.49 9 5 0.85 7 3 0.79 7
A - Travel & Tourism - D 2 0.73 8 4 1.00 8 4 1.25 2 4 1.04 6
A - World Development - - - 1 1.02 6 3 1.01 7 8 1.08 5
**EPQ - Extended Project - - - - - - 19 0.89 7 16 1.02 5

Alps A level - Quality of teaching and learning measurement
In terms of Alps analysis, the definition of top class ‘RED’ teaching and learning is when a group of students takinga subject achieves an Alps subject grade of 1, 2 or 3, matching performance in the top 25% of the Alps nationalbenchmark for that subject. Each provider receives a figure for ‘RED’ teaching and learning for each year.
The definition of ‘BLUE’ teaching and learning is when a group of students taking a subject achieves an Alps subjectgrade of 7, 8 or 9, matching performance in the bottom 25% of the Alps national benchmark for that subject. Eachprovider receives a figure for ‘BLUE’ teaching and learning for each year.
The calculation for each is computed the same way, below is an example of a ‘RED’ calculation:
Let us take a provider where there were 300 entries leading to A level grades. These will be spread across the rangeof subjects taken in the institution. Say we had 15 students completing art with an Alps grade 1 outcome, 25 takingchemistry with an Alps grade 2 outcome, 30 taking English literature with an Alps grade 3 outcome, 30 takingmathematics with a grade 3 outcome and 20 taking psychology with an Alps grade 2 outcome. In total we have 120entries in groups where students achieved at grades 1, 2 and 3 – ‘RED’ teaching. So 120 out of the 300 entries or 40%overall fall in the ‘RED’ category. In this case, 40% is the ‘RED’ teaching and learning score for the provider.
Your analysis
On the opposite page there are three tables that relate the quality of teaching and learning in your providerto those in the Alps national benchmark. This page will briefly summarise the content of these tables.
Table 8a – Subject grades using numbers of students in each grade band
The figures from Table 8a are computed straight from your subject analysis page. Each subject on the subject analysispage is given a subject grade from 1 to 9 (1 is the best, 9 is the worst). All learners who were taught in subjects thatachieved a grade 2, can be said to have experienced grade 2 teaching and learning in those subjects.
Table 8a shows how many students experienced teaching and learning at each learning quality grade for each year.For example, if there were 6 chemistry learners and 12 mathematics learners taught to grade 2, and if these werethe only departments to gain a grade 2, there would be 18 in the grade 2 column of Table 8a for that year.
This information gives a picture of the range and the quality of the teaching and learning.
• A high number in bands 1, 2 and 3 shows a large number of students being taught and learning with high quality. • A high number in bands 4, 5 and 6 shows a large number of students being taught and learning satisfactorily. • A high number in bands 7, 8 and 9 shows a large number of students being taught and learning relatively poorly.
Table 8b – Subject grades using percentage of students in each grade band
Table 8b shows the same information as Table 8a in percentage terms. This allows easier interpretation of the valuesshown in the table.
Table 8c – Subject grades using percentage of students in ‘RED’, ‘BLACK’ and ‘BLUE’ bands
Table 8c shows similar information to Table 8b but with the results of subject grades grouped together as follows:
Grades 1, 2 and 3 in Table 8b are grouped together into a RED teaching band in Table 8c. Grades 4, 5 and 6 in Table 8b are grouped together into a BLACK teaching band in Table 8c. Grades 7, 8 and 9 in Table 8b are grouped together into a BLUE teaching band in Table 8c.
Table 8c gives an overview of levels of performance in the provider
A high percentage of RED teaching and learning indicates that there is a large amount of high quality teachingand learning in the institution. A high percentage of BLUE teaching and learning indicates that there is a large amountof poor or very poor quality teaching and learning in the institution. Alps has analysed the amounts of RED and BLUEteaching and learning obtained by the providers in the benchmark. This gives useful targets for the amounts of REDand BLUE teaching and learning.
32A level Alps report 2016 ©Alkemygold Ltd www.alps-va.co.uk
Using the national dataset supplied to Alps by the Department for Education(2,580 sets, 241,036 students, 685,377 A levels taken)

A level Alps report 2016 ©Alkemygold Ltd 33 www.alps-va.co.uk
Alps A level - Quality of teaching and learning measurementAlps Example Sixth Form
2015/16 | A level | Report no: 1 | 19.08.16
The symbol (†) denotes that the performances in 2012/13 are being compared to the previous benchmark andthe symbol (*) denotes that performances in 2013/14 to 2015/16 are being compared to the current benchmark.
The figures in Table 8a are derived from your subject data sheet
Table 8a - Subject grades summary using total numbers of student entries contributing to each grade band
Learning Quality 1 2 3 4 5 6 7 8 9 Totals
2012/13†
- - 84 71 39 66 103 69 20 452
2013/14*
- 49 90 89 145 33 91 49 3 549
2014/15*
- 36 191 66 82 148 60 - 3 586
2015/16*
- 95 152 162 88 4 3 62 - 566
Table 8b - Subject grades summary using percentage of student entries contributing to each grade band
Learning Quality 1 2 3 4 5 6 7 8 9 Totals
2012/13†
0.0% 0.0% 18.6% 15.7% 8.6% 14.6% 22.8% 15.3% 4.4% 100.0%
2013/14*
0.0% 8.9% 16.4% 16.2% 26.4% 6.0% 16.6% 8.9% 0.5% 100.0%
2014/15*
0.0% 6.1% 32.6% 11.3% 14.0% 25.3% 10.2% 0.0% 0.5% 100.0%
2015/16*
0.0% 16.8% 26.9% 28.6% 15.5% 0.7% 0.5% 11.0% 0.0% 100.0%
Table 8c - Subject grades summary using percentage of student entries in RED, BLACK and BLUE bands
Learning quality 1+2+3 Grade 4+5+6 7+8+9 Grade Totals
2012/13†
18.6% 6 38.9% 42.5% 7 100.0%
2013/14*
25.3% 5 48.6% 26.0% 5 100.0%
2014/15*
38.7% 3 50.5% 10.8% 4 100.0%
2015/16*
43.6% 3 44.9% 11.5% 4 100.0%
RED teaching and learningthermometer
1100% 89.6%
290% 54.9%
375% 38.3%
460% 28.8%
540% 18.3%
625% 12.1%
710% 4.5%
8bottom 0.0%
9
ð2015/16
BLUE teaching and learningthermometer
1100% 0.0%
290% 3.6%
375% 10.7%
460% 18.8%
540% 31.6%
625% 43.5%
710% 61.3%
8bottom 96.3%
9
ð2015/16
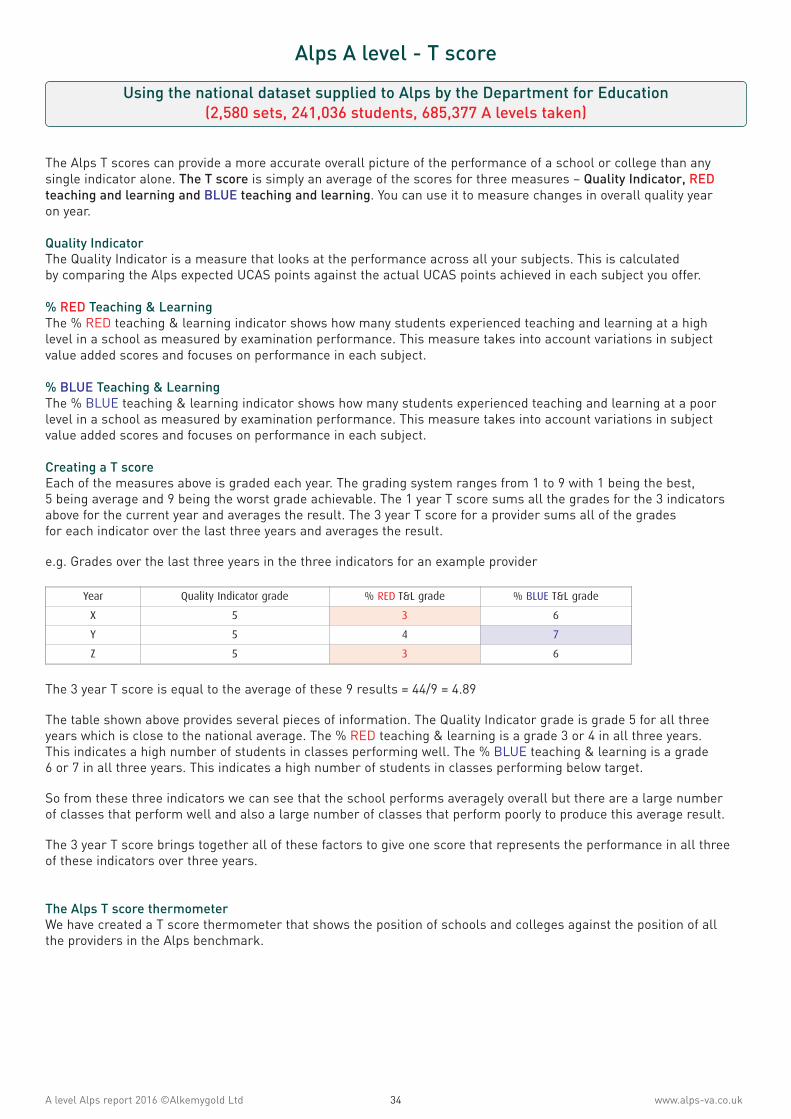
Alps A level - T score
The Alps T scores can provide a more accurate overall picture of the performance of a school or college than anysingle indicator alone. The T score is simply an average of the scores for three measures – Quality Indicator, REDteaching and learning and BLUE teaching and learning. You can use it to measure changes in overall quality yearon year.
Quality IndicatorThe Quality Indicator is a measure that looks at the performance across all your subjects. This is calculatedby comparing the Alps expected UCAS points against the actual UCAS points achieved in each subject you offer.
% RED Teaching & LearningThe % RED teaching & learning indicator shows how many students experienced teaching and learning at a highlevel in a school as measured by examination performance. This measure takes into account variations in subjectvalue added scores and focuses on performance in each subject.
% BLUE Teaching & LearningThe % BLUE teaching & learning indicator shows how many students experienced teaching and learning at a poorlevel in a school as measured by examination performance. This measure takes into account variations in subjectvalue added scores and focuses on performance in each subject.
Creating a T scoreEach of the measures above is graded each year. The grading system ranges from 1 to 9 with 1 being the best,5 being average and 9 being the worst grade achievable. The 1 year T score sums all the grades for the 3 indicatorsabove for the current year and averages the result. The 3 year T score for a provider sums all of the gradesfor each indicator over the last three years and averages the result.
e.g. Grades over the last three years in the three indicators for an example provider
The 3 year T score is equal to the average of these 9 results = 44/9 = 4.89
The table shown above provides several pieces of information. The Quality Indicator grade is grade 5 for all threeyears which is close to the national average. The % RED teaching & learning is a grade 3 or 4 in all three years.This indicates a high number of students in classes performing well. The % BLUE teaching & learning is a grade6 or 7 in all three years. This indicates a high number of students in classes performing below target.
So from these three indicators we can see that the school performs averagely overall but there are a large numberof classes that perform well and also a large number of classes that perform poorly to produce this average result.
The 3 year T score brings together all of these factors to give one score that represents the performance in all threeof these indicators over three years.
The Alps T score thermometerWe have created a T score thermometer that shows the position of schools and colleges against the position of allthe providers in the Alps benchmark.
Year Quality Indicator grade % RED T&L grade % BLUE T&L grade
X 5 3 6
Y 5 4 7
Z 5 3 6
34A level Alps report 2016 ©Alkemygold Ltd www.alps-va.co.uk
Using the national dataset supplied to Alps by the Department for Education(2,580 sets, 241,036 students, 685,377 A levels taken)

A level Alps report 2016 ©Alkemygold Ltd 35 www.alps-va.co.uk
Alps A level - T scoreAlps Example Sixth Form
2015/16 | A level | Report no: 1 | 19.08.16
The symbol (†) denotes that the performances in 2012/13 are being compared to the previous benchmark andthe symbol (*) denotes that performances in 2013/14 to 2015/16 are being compared to the current benchmark.
2013/14*
2014/15*
2015/16*
1. Provider A level Quality Indicator grades 4 3 2
2. % RED teaching & learning grades 5 3 3
3. % BLUE teaching & learning grades 5 4 4
4. T score - single year 4.67 3.33 3.00
T score - single year grade (1 to 9) 5 3 3
5. Three year T score 3.67
Three year T score grade (1 to 9) 3
Single year T score
1100% 1.67
290% 2.67
375% 3.67
460% 4.33
540% 5.33
625% 6.33
710% 7.33
8bottom 8.00
9
ï 2015/16
Three year T score
1100% 1.83
290% 2.83
375% 3.83
460% 4.67
540% 5.50
625% 6.33
710% 7.33
8bottom 8.33
9
ð2013/14-2015/16
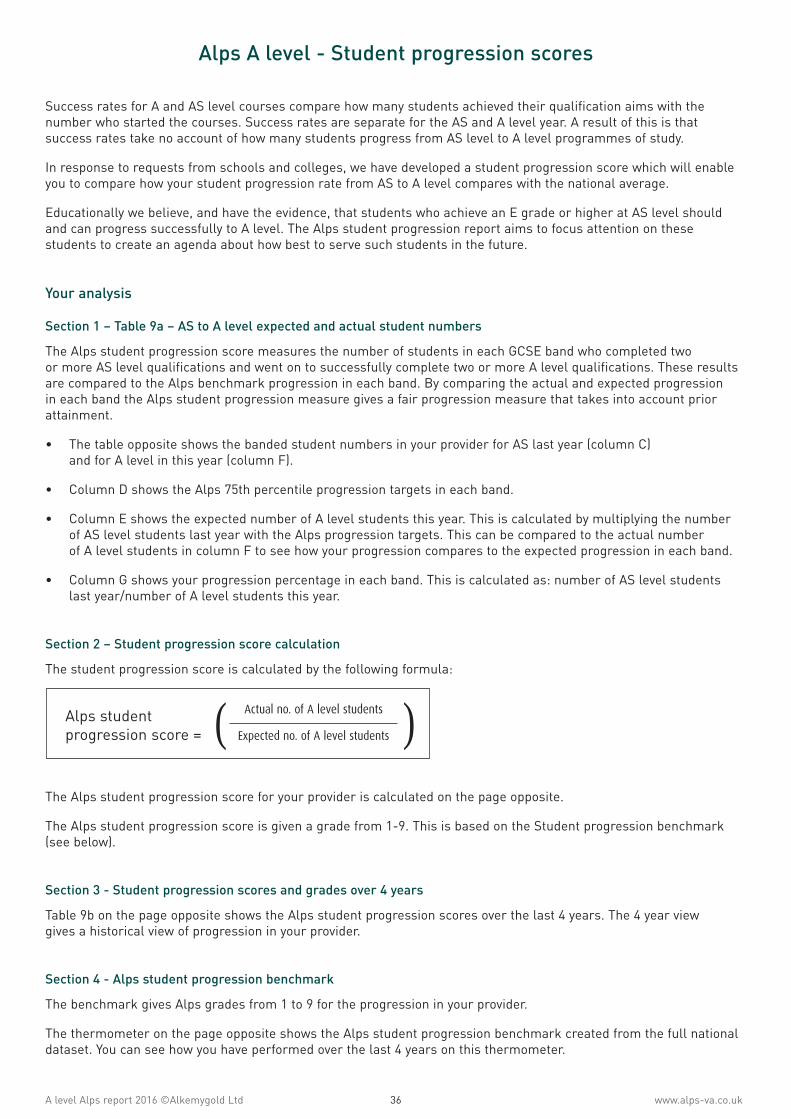
Alps A level - Student progression scores
Success rates for A and AS level courses compare how many students achieved their qualification aims with thenumber who started the courses. Success rates are separate for the AS and A level year. A result of this is thatsuccess rates take no account of how many students progress from AS level to A level programmes of study.
In response to requests from schools and colleges, we have developed a student progression score which will enableyou to compare how your student progression rate from AS to A level compares with the national average.
Educationally we believe, and have the evidence, that students who achieve an E grade or higher at AS level shouldand can progress successfully to A level. The Alps student progression report aims to focus attention on thesestudents to create an agenda about how best to serve such students in the future.
Your analysis
Section 1 – Table 9a – AS to A level expected and actual student numbers
The Alps student progression score measures the number of students in each GCSE band who completed twoor more AS level qualifications and went on to successfully complete two or more A level qualifications. These resultsare compared to the Alps benchmark progression in each band. By comparing the actual and expected progressionin each band the Alps student progression measure gives a fair progression measure that takes into account priorattainment.
• The table opposite shows the banded student numbers in your provider for AS last year (column C)and for A level in this year (column F).
• Column D shows the Alps 75th percentile progression targets in each band.
• Column E shows the expected number of A level students this year. This is calculated by multiplying the numberof AS level students last year with the Alps progression targets. This can be compared to the actual numberof A level students in column F to see how your progression compares to the expected progression in each band.
• Column G shows your progression percentage in each band. This is calculated as: number of AS level studentslast year/number of A level students this year.
Section 2 – Student progression score calculation
The student progression score is calculated by the following formula:
The Alps student progression score for your provider is calculated on the page opposite.
The Alps student progression score is given a grade from 1-9. This is based on the Student progression benchmark(see below).
Section 3 - Student progression scores and grades over 4 years
Table 9b on the page opposite shows the Alps student progression scores over the last 4 years. The 4 year viewgives a historical view of progression in your provider.
Section 4 - Alps student progression benchmark
The benchmark gives Alps grades from 1 to 9 for the progression in your provider.
The thermometer on the page opposite shows the Alps student progression benchmark created from the full nationaldataset. You can see how you have performed over the last 4 years on this thermometer.
Alps student progression score =
Actual no. of A level students
Expected no. of A level students( )
36A level Alps report 2016 ©Alkemygold Ltd www.alps-va.co.uk

A level Alps report 2016 ©Alkemygold Ltd 37 www.alps-va.co.uk
Alps A level - Student progression scoresAlps Example Sixth Form
2015/16 | A level | Report no: 1 | 19.08.16
The symbol (†) denotes that the performances in 2012/13 are being compared to the previous benchmark andthe symbol (*) denotes that performances in 2013/14 to 2015/16 are being compared to the current benchmark.
For students completing 2 or more AS levels in year 1 and students completing2 or more A levels in year 2, excluding general studies
Table 9a - AS to A level expected and actual student numbers in 2015/16
A B C D E F G
GCSE score GCSE gradesNumber of AS
students in2014/15
Alps 75%progression rate
Expected numberof A level students
Actual no. of A2students in2015/16
Your providerprogression rate
7.5 - 8.0 Mainly A* and A 8 100.0% 8.00 7 87.5%
7.0 -< 7.5 Mainly As 20 100.0% 20.00 18 90.0%
6.7 -< 7.0 Mainly As, few Bs 21 100.0% 21.00 21 100.0%
6.4 -< 6.7 Mainly As, few Bs 17 100.0% 17.00 17 100.0%
6.1 -< 6.4 Mainly Bs, few As 26 100.0% 26.00 21 80.8%
5.8 -< 6.1 Mainly Bs 27 93.0% 25.11 25 92.6%
5.5 -< 5.8 Mainly Bs, few Cs 34 86.0% 29.24 27 79.4%
5.2 -< 5.5 Mainly Cs, few Bs 36 80.0% 28.80 29 80.6%
4.7 -< 5.2 Mainly Cs 33 71.0% 23.43 19 57.6%
4.0 -< 4.7 Mainly 4 Cs, with D/Es 12 63.0% 7.56 5 41.7%
0.0 -< 4.0 Mainly 2/3 Cs, with D/Es 1 75.0% 0.75 1 100.0%
Totals: 235 206.89 190
Alps student progression scores - calculation
2015/16 AS to A progression score =Actual number of A level
Expected number of A level=
190
206.89
2015/16 AS to A progression score = 0.922015/16 AS to A progression grade = 4
Table 9b - AS to A level progression scores and grades over 4 years
Year of results 2012/13†
2013/14*
2014/15*
2015/16*
Actual A level student numbers 153 189 196 190
Expected A level student numbers - 207.47 225.51 206.89
AS to A2 progression score - 0.91 0.87 0.92
AS to A2 progression grade - 4 5 4
1100% 1.09
290% 0.99
375% 0.94
460% 0.90
540% 0.85
625% 0.81
710% 0.69
8bottom 0.39
9
ð

Alps A level - Students not included in key indicator calculationsAlps Example Sixth Form
2015/16 | A level | Report no: 1 | 19.08.16
A level Alps report 2016 ©Alkemygold Ltd 38 www.alps-va.co.uk
Students are filtered out of the Alps report calculations if they do not have a GCSE score.
Total number of students: 204
Number of students used in the Alps reports: 190
Number of students filtered out of the Alps reports: 14
Total number of entries: 570
Number of entries used in the Alps reports: 553
Number of entries filtered out of the Alps reports: 17
The following students did not have a GCSE score in the data file you submitted to Alps. If you have GCSE scores forthese students you can add the GCSE score to your data file using the Alps Data Collection Software (ADCS). Open yourdata file and you can add the GCSE scores by typing the values into the spreadsheet.
ID Name Subject 1 Subject 2 Subject 3 Subject 4
Student 1091 Student 1091, A - Biology A A - Chemistry A A - General Studies A A - History A
A - Mathematics A

Your single subject pages
39A level Alps report 2016 ©Alkemygold Ltd www.alps-va.co.uk
Alps Alps - Alkemygold Ltd, Kevin Conway House
Longbow Close, Huddersfield HD2 1GQ01484 887600 | [email protected] | www.alps-va.co.uk
KS5

Alps A level - How to read a subject page
This page is a quick reference tool for subject teachers.
How is my Alps score calculated?
Alps is designed to look at the performance of students.
1. On the top left is a table titled ‘Expected UCAS points’. This shows how many students are in each band and whattheir expected UCAS points outcome would be if they performed at the same level as the top 25% of providersacross the country. In this example we would expect 1,358.55 UCAS points in total.
2. To the right is the actual grades this group achieved, so the ‘Total actual UCAS points’ was 1,280.
3. The subject VA score is then calculated to give an Alps score, in this case 0.95.
4. The Subject A specific thermometer shows that when comparing this Subject A department with all otherSubject A departments nationally, a score of 0.95 puts it just above the 60th percentile.
5. The list of students is in descending GCSE score order and shows how each student performed. By looking at thislist it is possible to determine if there is a particular group of students who appear to have underachieved relativeto the minimum target grades. By identifying potential weaknesses in performance, staff can be sure to focuson students who may underachieve in their current classes.
What is an Alps subject thermometer?
Each subject has its own benchmark thermometer that compares that subject department to all other departmentsof the same subject in the DfE national dataset. An Alps score of 1.00 means that all students have achieved theirtarget grades. In the above, the top 25% of Subject A departments score 0.99 nationally. For Subject A, most studentsin the national dataset achieve their minimum target grades. If your subject has a score above 1.00 at the 75thpercentile then this means that in your subject a proportion of students nationally is exceeding their minimum targetgrades. The full list of all subject benchmarks can be found in any provider report.
Single Subject Report - A - Information & Communication Technology
Expected UCAS points
GCSE Band QCA Band Students × Target = Total exp
A level grades and Total actual UCAS points
1
2
3
4
5
6
7
8
9
ð
Student Avg QCAscore
AvgGCSEscore
Grade Targetgrade
Student 1623, F 50.68 6.78 B B
Student 1418, F 49.78 6.63 B B
Student 0832, F 49.36 6.56 C B
Student 0342, F 46.78 6.13 B B/C
Student 1561, M 46.66 6.11 B B/C
Student 0595, M 46.00 6.00 C B/C
Student 1240, F 45.64 5.94 B B/C
Student 0312, F 44.74 5.79 B C
Student 1625, M 44.50 5.75 B C
Student 0424, M 42.64 5.44 C C
Student 0506, F 42.64 5.44 C C
Student 1084, F 41.50 5.25 D C
Student 1429, M 41.32 5.22 E C
Student 0519, M 41.26 5.21 D C
Student 0570, F 40.00 5.00 D C/D
Student 1688, M 32.98 3.83 E C/D
1
5
2
4
40A level Alps report 2016 ©Alkemygold Ltd www.alps-va.co.uk
Single Subject Report - A - Subject A
3Year W Year X Year Y Year Z

A level A
lps report 2016 ©A
lkemygold Ltd
Subject page 1w
ww
.alps-va.co.uk
Single Subject Report - A - Applied Information & Communication Technology - Single AwardAlps Example Sixth Form | 2015/16 | A level | Report no: 1 | 19.08.16
The symbol (†) denotes that the performances in 2012/13 are being compared to the previous benchmark andthe symbol (*) denotes that performances in 2013/14 to 2015/16 are being compared to the current benchmark.
Expected UCAS points
GCSE Band QCA Band Students × Target = Total exp
7.5 - 8.0 55.0 - 58.0 0 × 125.17 = 0.00
7.0 -< 7.5 52.0 -< 55.0 0 × 112.47 = 0.00
6.7 -< 7.0 50.2 -< 52.0 0 × 104.58 = 0.00
6.4 -< 6.7 48.4 -< 50.2 1 × 97.73 = 97.73
6.1 -< 6.4 46.6 -< 48.4 0 × 92.50 = 0.00
5.8 -< 6.1 44.8 -< 46.6 0 × 86.79 = 0.00
5.5 -< 5.8 43.0 -< 44.8 1 × 82.61 = 82.61
5.2 -< 5.5 41.2 -< 43.0 0 × 78.33 = 0.00
4.7 -< 5.2 38.2 -< 41.2 0 × 74.17 = 0.00
4.0 -< 4.7 34.0 -< 38.2 0 × 70.00 = 0.00
0.0 -< 4.0 10.0 -< 34.0 0 × 68.89 = 0.00
Students = 2 Expected UCAS points total = 180.34
A level grades and Total actual UCAS points
Students A* A B C D E U X Q A*-E% A*-C% A*-B% Avg GCSE Avg QCA
2 0 0 2 0 0 0 0 0 0 100.0% 100.0% 100.0% 6.02 46.09
UCAS pts ×140 ×120 ×100 ×80 ×60 ×40 ×0 ×0 ×0
Act pts 0 0 200 0 0 0 0 0 0
Total actual = 200
Subject VA score = 1 +Actual - Expected
Students × 100=
200 - 180.34
2 × 100+ 1 = 1.10 grade 2
2012/13†
2013/14*
2014/15*
2015/16*
Students Score Grade Students Score Grade Students Score Grade Students Score Grade
8 0.96 4 3 0.83 7 5 0.95 5 2 1.10 2
1100% 1.31
290% 1.09
375% 1.02
460% 0.96
540% 0.89
625% 0.84
710% 0.75
8bottom 0.33
9
ð
Student Avg QCAscore
AvgGCSEscore
Grade Targetgrade
Student 0123, F 48.58 6.43 B B
Student 1557, F 43.60 5.60 B C
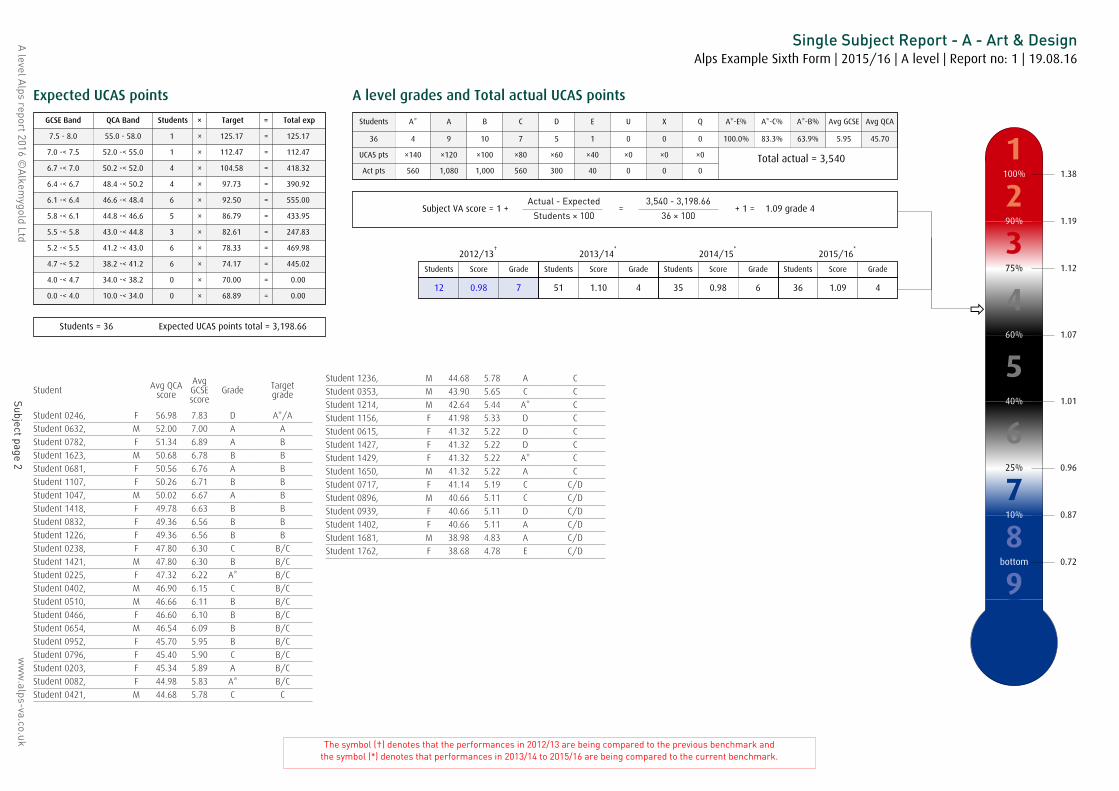
A level A
lps report 2016 ©A
lkemygold Ltd
Subject page 2w
ww
.alps-va.co.uk
Single Subject Report - A - Art & DesignAlps Example Sixth Form | 2015/16 | A level | Report no: 1 | 19.08.16
The symbol (†) denotes that the performances in 2012/13 are being compared to the previous benchmark andthe symbol (*) denotes that performances in 2013/14 to 2015/16 are being compared to the current benchmark.
Expected UCAS points
GCSE Band QCA Band Students × Target = Total exp
7.5 - 8.0 55.0 - 58.0 1 × 125.17 = 125.17
7.0 -< 7.5 52.0 -< 55.0 1 × 112.47 = 112.47
6.7 -< 7.0 50.2 -< 52.0 4 × 104.58 = 418.32
6.4 -< 6.7 48.4 -< 50.2 4 × 97.73 = 390.92
6.1 -< 6.4 46.6 -< 48.4 6 × 92.50 = 555.00
5.8 -< 6.1 44.8 -< 46.6 5 × 86.79 = 433.95
5.5 -< 5.8 43.0 -< 44.8 3 × 82.61 = 247.83
5.2 -< 5.5 41.2 -< 43.0 6 × 78.33 = 469.98
4.7 -< 5.2 38.2 -< 41.2 6 × 74.17 = 445.02
4.0 -< 4.7 34.0 -< 38.2 0 × 70.00 = 0.00
0.0 -< 4.0 10.0 -< 34.0 0 × 68.89 = 0.00
Students = 36 Expected UCAS points total = 3,198.66
A level grades and Total actual UCAS points
Students A* A B C D E U X Q A*-E% A*-C% A*-B% Avg GCSE Avg QCA
36 4 9 10 7 5 1 0 0 0 100.0% 83.3% 63.9% 5.95 45.70
UCAS pts ×140 ×120 ×100 ×80 ×60 ×40 ×0 ×0 ×0
Act pts 560 1,080 1,000 560 300 40 0 0 0
Total actual = 3,540
Subject VA score = 1 +Actual - Expected
Students × 100=
3,540 - 3,198.66
36 × 100+ 1 = 1.09 grade 4
2012/13†
2013/14*
2014/15*
2015/16*
Students Score Grade Students Score Grade Students Score Grade Students Score Grade
12 0.98 7 51 1.10 4 35 0.98 6 36 1.09 4
1100% 1.38
290% 1.19
375% 1.12
460% 1.07
540% 1.01
625% 0.96
710% 0.87
8bottom 0.72
9
ð
Student Avg QCAscore
AvgGCSEscore
Grade Targetgrade
Student 0246, F 56.98 7.83 D A*/A
Student 0632, M 52.00 7.00 A A
Student 0782, F 51.34 6.89 A B
Student 1623, M 50.68 6.78 B B
Student 0681, F 50.56 6.76 A B
Student 1107, F 50.26 6.71 B B
Student 1047, M 50.02 6.67 A B
Student 1418, F 49.78 6.63 B B
Student 0832, F 49.36 6.56 B B
Student 1226, F 49.36 6.56 B B
Student 0238, F 47.80 6.30 C B/C
Student 1421, M 47.80 6.30 B B/C
Student 0225, F 47.32 6.22 A* B/C
Student 0402, M 46.90 6.15 C B/C
Student 0510, M 46.66 6.11 B B/C
Student 0466, F 46.60 6.10 B B/C
Student 0654, M 46.54 6.09 B B/C
Student 0952, F 45.70 5.95 B B/C
Student 0796, F 45.40 5.90 C B/C
Student 0203, F 45.34 5.89 A B/C
Student 0082, F 44.98 5.83 A* B/C
Student 0421, M 44.68 5.78 C C
Student 1236, M 44.68 5.78 A C
Student 0353, M 43.90 5.65 C C
Student 1214, M 42.64 5.44 A* C
Student 1156, F 41.98 5.33 D C
Student 0615, F 41.32 5.22 D C
Student 1427, F 41.32 5.22 D C
Student 1429, F 41.32 5.22 A* C
Student 1650, M 41.32 5.22 A C
Student 0717, F 41.14 5.19 C C/D
Student 0896, M 40.66 5.11 C C/D
Student 0939, F 40.66 5.11 D C/D
Student 1402, F 40.66 5.11 A C/D
Student 1681, M 38.98 4.83 A C/D
Student 1762, F 38.68 4.78 E C/D

A level A
lps report 2016 ©A
lkemygold Ltd
Subject page 3w
ww
.alps-va.co.uk
Single Subject Report - A - BiologyAlps Example Sixth Form | 2015/16 | A level | Report no: 1 | 19.08.16
The symbol (†) denotes that the performances in 2012/13 are being compared to the previous benchmark andthe symbol (*) denotes that performances in 2013/14 to 2015/16 are being compared to the current benchmark.
Expected UCAS points
GCSE Band QCA Band Students × Target = Total exp
7.5 - 8.0 55.0 - 58.0 2 × 125.17 = 250.34
7.0 -< 7.5 52.0 -< 55.0 5 × 112.47 = 562.35
6.7 -< 7.0 50.2 -< 52.0 4 × 104.58 = 418.32
6.4 -< 6.7 48.4 -< 50.2 4 × 97.73 = 390.92
6.1 -< 6.4 46.6 -< 48.4 1 × 92.50 = 92.50
5.8 -< 6.1 44.8 -< 46.6 4 × 86.79 = 347.16
5.5 -< 5.8 43.0 -< 44.8 3 × 82.61 = 247.83
5.2 -< 5.5 41.2 -< 43.0 2 × 78.33 = 156.66
4.7 -< 5.2 38.2 -< 41.2 0 × 74.17 = 0.00
4.0 -< 4.7 34.0 -< 38.2 0 × 70.00 = 0.00
0.0 -< 4.0 10.0 -< 34.0 0 × 68.89 = 0.00
Students = 25 Expected UCAS points total = 2,466.08
A level grades and Total actual UCAS points
Students A* A B C D E U X Q A*-E% A*-C% A*-B% Avg GCSE Avg QCA
25 0 3 5 5 6 1 4 1 0 80.0% 52.0% 32.0% 6.50 49.02
UCAS pts ×140 ×120 ×100 ×80 ×60 ×40 ×0 ×0 ×0
Act pts 0 360 500 400 360 40 0 0 0
Total actual = 1,660
Subject VA score = 1 +Actual - Expected
Students × 100=
1,660 - 2,466.08
25 × 100+ 1 = 0.68 grade 8
2012/13†
2013/14*
2014/15*
2015/16*
Students Score Grade Students Score Grade Students Score Grade Students Score Grade
27 0.93 3 27 0.97 2 26 0.82 6 25 0.68 8
1100% 1.06
290% 0.96
375% 0.92
460% 0.88
540% 0.84
625% 0.80
710% 0.74
8bottom 0.59
9
ð
Student Avg QCAscore
AvgGCSEscore
Grade Targetgrade
Student 0172, M 56.86 7.81 C A*/A
Student 0102, F 55.00 7.50 A A*/A
Student 0253, M 54.64 7.44 C A
Student 1023, F 54.10 7.35 B A
Student 0634, F 53.80 7.30 A A
Student 0750, M 53.62 7.27 A A
Student 0413, F 52.60 7.10 C A
Student 1632, F 51.52 6.92 C B
Student 1533, M 50.80 6.80 B B
Student 1200, F 50.38 6.73 D B
Student 0453, M 50.20 6.70 U B
Student 0411, M 49.42 6.57 B B
Student 0063, F 49.12 6.52 C B
Student 0123, F 48.58 6.43 D B
Student 1397, F 48.40 6.40 D B
Student 0985, F 47.44 6.24 B B/C
Student 0595, M 46.00 6.00 X B/C
Student 0942, F 45.40 5.90 D B/C
Student 1510, F 45.40 5.90 U B/C
Student 1281, F 44.98 5.83 B B/C
Student 0591, F 44.74 5.79 U C
Student 0840, F 44.68 5.78 D C
Student 1395, F 44.68 5.78 D C
Student 1613, F 41.98 5.33 E C
Student 0519, M 41.26 5.21 U C
Student 1091, M - - A -
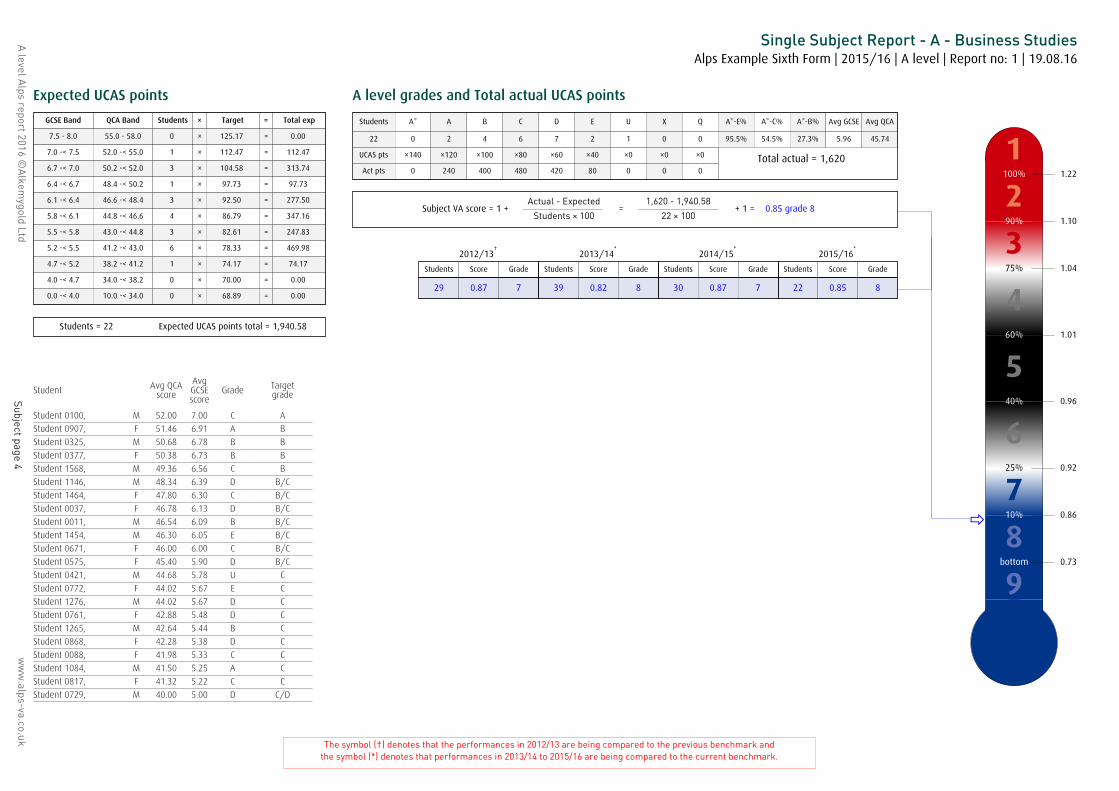
A level A
lps report 2016 ©A
lkemygold Ltd
Subject page 4w
ww
.alps-va.co.uk
Single Subject Report - A - Business StudiesAlps Example Sixth Form | 2015/16 | A level | Report no: 1 | 19.08.16
The symbol (†) denotes that the performances in 2012/13 are being compared to the previous benchmark andthe symbol (*) denotes that performances in 2013/14 to 2015/16 are being compared to the current benchmark.
Expected UCAS points
GCSE Band QCA Band Students × Target = Total exp
7.5 - 8.0 55.0 - 58.0 0 × 125.17 = 0.00
7.0 -< 7.5 52.0 -< 55.0 1 × 112.47 = 112.47
6.7 -< 7.0 50.2 -< 52.0 3 × 104.58 = 313.74
6.4 -< 6.7 48.4 -< 50.2 1 × 97.73 = 97.73
6.1 -< 6.4 46.6 -< 48.4 3 × 92.50 = 277.50
5.8 -< 6.1 44.8 -< 46.6 4 × 86.79 = 347.16
5.5 -< 5.8 43.0 -< 44.8 3 × 82.61 = 247.83
5.2 -< 5.5 41.2 -< 43.0 6 × 78.33 = 469.98
4.7 -< 5.2 38.2 -< 41.2 1 × 74.17 = 74.17
4.0 -< 4.7 34.0 -< 38.2 0 × 70.00 = 0.00
0.0 -< 4.0 10.0 -< 34.0 0 × 68.89 = 0.00
Students = 22 Expected UCAS points total = 1,940.58
A level grades and Total actual UCAS points
Students A* A B C D E U X Q A*-E% A*-C% A*-B% Avg GCSE Avg QCA
22 0 2 4 6 7 2 1 0 0 95.5% 54.5% 27.3% 5.96 45.74
UCAS pts ×140 ×120 ×100 ×80 ×60 ×40 ×0 ×0 ×0
Act pts 0 240 400 480 420 80 0 0 0
Total actual = 1,620
Subject VA score = 1 +Actual - Expected
Students × 100=
1,620 - 1,940.58
22 × 100+ 1 = 0.85 grade 8
2012/13†
2013/14*
2014/15*
2015/16*
Students Score Grade Students Score Grade Students Score Grade Students Score Grade
29 0.87 7 39 0.82 8 30 0.87 7 22 0.85 8
1100% 1.22
290% 1.10
375% 1.04
460% 1.01
540% 0.96
625% 0.92
710% 0.86
8bottom 0.73
9
ð
Student Avg QCAscore
AvgGCSEscore
Grade Targetgrade
Student 0100, M 52.00 7.00 C A
Student 0907, F 51.46 6.91 A B
Student 0325, M 50.68 6.78 B B
Student 0377, F 50.38 6.73 B B
Student 1568, M 49.36 6.56 C B
Student 1146, M 48.34 6.39 D B/C
Student 1464, F 47.80 6.30 C B/C
Student 0037, F 46.78 6.13 D B/C
Student 0011, M 46.54 6.09 B B/C
Student 1454, M 46.30 6.05 E B/C
Student 0671, F 46.00 6.00 C B/C
Student 0575, F 45.40 5.90 D B/C
Student 0421, M 44.68 5.78 U C
Student 0772, F 44.02 5.67 E C
Student 1276, M 44.02 5.67 D C
Student 0761, F 42.88 5.48 D C
Student 1265, M 42.64 5.44 B C
Student 0868, F 42.28 5.38 D C
Student 0088, F 41.98 5.33 C C
Student 1084, M 41.50 5.25 A C
Student 0817, F 41.32 5.22 C C
Student 0729, M 40.00 5.00 D C/D

A level A
lps report 2016 ©A
lkemygold Ltd
Subject page 5w
ww
.alps-va.co.uk
Single Subject Report - A - ChemistryAlps Example Sixth Form | 2015/16 | A level | Report no: 1 | 19.08.16
The symbol (†) denotes that the performances in 2012/13 are being compared to the previous benchmark andthe symbol (*) denotes that performances in 2013/14 to 2015/16 are being compared to the current benchmark.
Expected UCAS points
GCSE Band QCA Band Students × Target = Total exp
7.5 - 8.0 55.0 - 58.0 3 × 125.17 = 375.51
7.0 -< 7.5 52.0 -< 55.0 3 × 112.47 = 337.41
6.7 -< 7.0 50.2 -< 52.0 5 × 104.58 = 522.90
6.4 -< 6.7 48.4 -< 50.2 2 × 97.73 = 195.46
6.1 -< 6.4 46.6 -< 48.4 0 × 92.50 = 0.00
5.8 -< 6.1 44.8 -< 46.6 1 × 86.79 = 86.79
5.5 -< 5.8 43.0 -< 44.8 1 × 82.61 = 82.61
5.2 -< 5.5 41.2 -< 43.0 0 × 78.33 = 0.00
4.7 -< 5.2 38.2 -< 41.2 1 × 74.17 = 74.17
4.0 -< 4.7 34.0 -< 38.2 0 × 70.00 = 0.00
0.0 -< 4.0 10.0 -< 34.0 0 × 68.89 = 0.00
Students = 16 Expected UCAS points total = 1,674.85
A level grades and Total actual UCAS points
Students A* A B C D E U X Q A*-E% A*-C% A*-B% Avg GCSE Avg QCA
16 2 7 4 1 1 1 0 0 0 100.0% 87.5% 81.3% 6.81 50.85
UCAS pts ×140 ×120 ×100 ×80 ×60 ×40 ×0 ×0 ×0
Act pts 280 840 400 80 60 40 0 0 0
Total actual = 1,700
Subject VA score = 1 +Actual - Expected
Students × 100=
1,700 - 1,674.85
16 × 100+ 1 = 1.02 grade 2
2012/13†
2013/14*
2014/15*
2015/16*
Students Score Grade Students Score Grade Students Score Grade Students Score Grade
21 0.91 4 18 0.85 6 25 0.82 6 16 1.02 2
1100% 1.04
290% 0.97
375% 0.93
460% 0.90
540% 0.86
625% 0.82
710% 0.76
8bottom 0.62
9
ð
Student Avg QCAscore
AvgGCSEscore
Grade Targetgrade
Student 0246, F 56.98 7.83 A* A*/A
Student 0172, M 56.86 7.81 A A*/A
Student 0102, F 55.00 7.50 A A*/A
Student 0634, F 53.80 7.30 A A
Student 0683, M 53.74 7.29 A A
Student 0464, F 53.14 7.19 A A
Student 1632, F 51.52 6.92 B B
Student 0850, F 51.22 6.87 A B
Student 1533, M 50.80 6.80 B B
Student 1338, F 50.62 6.77 A* B
Student 1200, F 50.38 6.73 A B
Student 0411, M 49.42 6.57 B B
Student 0657, M 49.36 6.56 C B
Student 1281, F 44.98 5.83 D B/C
Student 0840, F 44.68 5.78 E C
Student 0963, M 41.02 5.17 B C/D
Student 1091, M - - A -

A level A
lps report 2016 ©A
lkemygold Ltd
Subject page 6w
ww
.alps-va.co.uk
Single Subject Report - A - Classical CivilisationAlps Example Sixth Form | 2015/16 | A level | Report no: 1 | 19.08.16
The symbol (†) denotes that the performances in 2012/13 are being compared to the previous benchmark andthe symbol (*) denotes that performances in 2013/14 to 2015/16 are being compared to the current benchmark.
Expected UCAS points
GCSE Band QCA Band Students × Target = Total exp
7.5 - 8.0 55.0 - 58.0 1 × 125.17 = 125.17
7.0 -< 7.5 52.0 -< 55.0 1 × 112.47 = 112.47
6.7 -< 7.0 50.2 -< 52.0 0 × 104.58 = 0.00
6.4 -< 6.7 48.4 -< 50.2 0 × 97.73 = 0.00
6.1 -< 6.4 46.6 -< 48.4 0 × 92.50 = 0.00
5.8 -< 6.1 44.8 -< 46.6 1 × 86.79 = 86.79
5.5 -< 5.8 43.0 -< 44.8 1 × 82.61 = 82.61
5.2 -< 5.5 41.2 -< 43.0 1 × 78.33 = 78.33
4.7 -< 5.2 38.2 -< 41.2 1 × 74.17 = 74.17
4.0 -< 4.7 34.0 -< 38.2 0 × 70.00 = 0.00
0.0 -< 4.0 10.0 -< 34.0 0 × 68.89 = 0.00
Students = 6 Expected UCAS points total = 559.54
A level grades and Total actual UCAS points
Students A* A B C D E U X Q A*-E% A*-C% A*-B% Avg GCSE Avg QCA
6 0 2 2 0 1 1 0 0 0 100.0% 66.7% 66.7% 6.06 46.34
UCAS pts ×140 ×120 ×100 ×80 ×60 ×40 ×0 ×0 ×0
Act pts 0 240 200 0 60 40 0 0 0
Total actual = 540
Subject VA score = 1 +Actual - Expected
Students × 100=
540 - 559.54
6 × 100+ 1 = 0.97 grade 5
2012/13†
2013/14*
2014/15*
2015/16*
Students Score Grade Students Score Grade Students Score Grade Students Score Grade
11 0.77 8 7 0.91 7 7 1.03 3 6 0.97 5
1100% 1.16
290% 1.07
375% 1.02
460% 0.99
540% 0.95
625% 0.92
710% 0.86
8bottom 0.74
9
ðStudent Avg QCA
score
AvgGCSEscore
Grade Targetgrade
Student 0102, F 55.00 7.50 A A*/A
Student 0344, F 54.40 7.40 A A
Student 0942, F 45.40 5.90 B B/C
Student 1008, M 43.36 5.56 B C
Student 0923, F 41.20 5.20 D C
Student 1384, F 38.68 4.78 E C/D

A level A
lps report 2016 ©A
lkemygold Ltd
Subject page 7w
ww
.alps-va.co.uk
Single Subject Report - A - ComputingAlps Example Sixth Form | 2015/16 | A level | Report no: 1 | 19.08.16
The symbol (†) denotes that the performances in 2012/13 are being compared to the previous benchmark andthe symbol (*) denotes that performances in 2013/14 to 2015/16 are being compared to the current benchmark.
Expected UCAS points
GCSE Band QCA Band Students × Target = Total exp
7.5 - 8.0 55.0 - 58.0 1 × 125.17 = 125.17
7.0 -< 7.5 52.0 -< 55.0 1 × 112.47 = 112.47
6.7 -< 7.0 50.2 -< 52.0 0 × 104.58 = 0.00
6.4 -< 6.7 48.4 -< 50.2 0 × 97.73 = 0.00
6.1 -< 6.4 46.6 -< 48.4 1 × 92.50 = 92.50
5.8 -< 6.1 44.8 -< 46.6 1 × 86.79 = 86.79
5.5 -< 5.8 43.0 -< 44.8 1 × 82.61 = 82.61
5.2 -< 5.5 41.2 -< 43.0 0 × 78.33 = 0.00
4.7 -< 5.2 38.2 -< 41.2 0 × 74.17 = 0.00
4.0 -< 4.7 34.0 -< 38.2 0 × 70.00 = 0.00
0.0 -< 4.0 10.0 -< 34.0 0 × 68.89 = 0.00
Students = 5 Expected UCAS points total = 499.54
A level grades and Total actual UCAS points
Students A* A B C D E U X Q A*-E% A*-C% A*-B% Avg GCSE Avg QCA
5 1 1 2 1 0 0 0 0 0 100.0% 100.0% 80.0% 6.48 48.88
UCAS pts ×140 ×120 ×100 ×80 ×60 ×40 ×0 ×0 ×0
Act pts 140 120 200 80 0 0 0 0 0
Total actual = 540
Subject VA score = 1 +Actual - Expected
Students × 100=
540 - 499.54
5 × 100+ 1 = 1.08 grade 2
2012/13†
2013/14*
2014/15*
2015/16*
Students Score Grade Students Score Grade Students Score Grade Students Score Grade
- - - 4 0.77 7 2 0.91 4 5 1.08 2
1100% 1.14
290% 1.01
375% 0.95
460% 0.90
540% 0.84
625% 0.79
710% 0.70
8bottom 0.43
9
ð
Student Avg QCAscore
AvgGCSEscore
Grade Targetgrade
Student 1055, F 55.72 7.62 A* A*/A
Student 0080, F 52.24 7.04 A A
Student 0985, F 47.44 6.24 B B/C
Student 0575, F 45.40 5.90 C B/C
Student 1557, F 43.60 5.60 B C

A level A
lps report 2016 ©A
lkemygold Ltd
Subject page 8w
ww
.alps-va.co.uk
Single Subject Report - A - Design & Technology (Product Design)Alps Example Sixth Form | 2015/16 | A level | Report no: 1 | 19.08.16
The symbol (†) denotes that the performances in 2012/13 are being compared to the previous benchmark andthe symbol (*) denotes that performances in 2013/14 to 2015/16 are being compared to the current benchmark.
Expected UCAS points
GCSE Band QCA Band Students × Target = Total exp
7.5 - 8.0 55.0 - 58.0 0 × 125.17 = 0.00
7.0 -< 7.5 52.0 -< 55.0 6 × 112.47 = 674.82
6.7 -< 7.0 50.2 -< 52.0 4 × 104.58 = 418.32
6.4 -< 6.7 48.4 -< 50.2 4 × 97.73 = 390.92
6.1 -< 6.4 46.6 -< 48.4 3 × 92.50 = 277.50
5.8 -< 6.1 44.8 -< 46.6 6 × 86.79 = 520.74
5.5 -< 5.8 43.0 -< 44.8 5 × 82.61 = 413.05
5.2 -< 5.5 41.2 -< 43.0 4 × 78.33 = 313.32
4.7 -< 5.2 38.2 -< 41.2 2 × 74.17 = 148.34
4.0 -< 4.7 34.0 -< 38.2 1 × 70.00 = 70.00
0.0 -< 4.0 10.0 -< 34.0 0 × 68.89 = 0.00
Students = 35 Expected UCAS points total = 3,227.01
A level grades and Total actual UCAS points
Students A* A B C D E U X Q A*-E% A*-C% A*-B% Avg GCSE Avg QCA
35 0 14 11 9 1 0 0 0 0 100.0% 97.1% 71.4% 6.16 46.96
UCAS pts ×140 ×120 ×100 ×80 ×60 ×40 ×0 ×0 ×0
Act pts 0 1,680 1,100 720 60 0 0 0 0
Total actual = 3,560
Subject VA score = 1 +Actual - Expected
Students × 100=
3,560 - 3,227.01
35 × 100+ 1 = 1.10 grade 3
2012/13†
2013/14*
2014/15*
2015/16*
Students Score Grade Students Score Grade Students Score Grade Students Score Grade
29 0.93 5 37 1.05 3 25 1.02 4 35 1.10 3
1100% 1.26
290% 1.11
375% 1.03
460% 0.98
540% 0.92
625% 0.86
710% 0.78
8bottom 0.49
9
ð
Student Avg QCAscore
AvgGCSEscore
Grade Targetgrade
Student 0608, F 54.40 7.40 A A
Student 1286, M 54.40 7.40 A A
Student 1705, F 54.40 7.40 A A
Student 1023, F 54.10 7.35 A A
Student 0498, M 53.20 7.20 B A
Student 0632, M 52.00 7.00 A A
Student 0782, F 51.34 6.89 A B
Student 1586, M 50.68 6.78 B B
Student 1623, M 50.68 6.78 A B
Student 0453, M 50.20 6.70 A B
Student 1456, M 50.02 6.67 A B
Student 1226, F 49.36 6.56 A B
Student 1468, M 48.64 6.44 B B
Student 1397, F 48.40 6.40 B B
Student 1146, M 48.34 6.39 A B/C
Student 0883, F 46.66 6.11 B B/C
Student 0887, F 46.66 6.11 A B/C
Student 0039, F 46.00 6.00 B B/C
Student 1240, F 45.64 5.94 B B/C
Student 0118, M 45.34 5.89 C B/C
Student 0203, F 45.34 5.89 B B/C
Student 1116, M 45.34 5.89 C B/C
Student 1131, M 44.80 5.80 C B/C
Student 0346, F 44.68 5.78 C C
Student 0421, M 44.68 5.78 B C
Student 1625, M 44.50 5.75 B C
Student 0471, M 43.36 5.56 C C
Student 0826, M 43.36 5.56 C C
Student 1541, M 42.64 5.44 C C
Student 0737, F 42.34 5.39 C C
Student 0918, F 41.98 5.33 A C
Student 1053, F 41.32 5.22 C C
Student 0939, F 40.66 5.11 D C/D
Student 0570, F 40.00 5.00 A C/D
Student 0593, F 38.02 4.67 B C/D

A level A
lps report 2016 ©A
lkemygold Ltd
Subject page 9w
ww
.alps-va.co.uk
Single Subject Report - A - Drama & Theatre StudiesAlps Example Sixth Form | 2015/16 | A level | Report no: 1 | 19.08.16
The symbol (†) denotes that the performances in 2012/13 are being compared to the previous benchmark andthe symbol (*) denotes that performances in 2013/14 to 2015/16 are being compared to the current benchmark.
Expected UCAS points
GCSE Band QCA Band Students × Target = Total exp
7.5 - 8.0 55.0 - 58.0 0 × 125.17 = 0.00
7.0 -< 7.5 52.0 -< 55.0 3 × 112.47 = 337.41
6.7 -< 7.0 50.2 -< 52.0 0 × 104.58 = 0.00
6.4 -< 6.7 48.4 -< 50.2 2 × 97.73 = 195.46
6.1 -< 6.4 46.6 -< 48.4 3 × 92.50 = 277.50
5.8 -< 6.1 44.8 -< 46.6 2 × 86.79 = 173.58
5.5 -< 5.8 43.0 -< 44.8 3 × 82.61 = 247.83
5.2 -< 5.5 41.2 -< 43.0 5 × 78.33 = 391.65
4.7 -< 5.2 38.2 -< 41.2 1 × 74.17 = 74.17
4.0 -< 4.7 34.0 -< 38.2 6 × 70.00 = 420.00
0.0 -< 4.0 10.0 -< 34.0 1 × 68.89 = 68.89
Students = 26 Expected UCAS points total = 2,186.49
A level grades and Total actual UCAS points
Students A* A B C D E U X Q A*-E% A*-C% A*-B% Avg GCSE Avg QCA
26 0 1 15 5 4 1 0 0 0 100.0% 80.8% 61.5% 5.56 43.35
UCAS pts ×140 ×120 ×100 ×80 ×60 ×40 ×0 ×0 ×0
Act pts 0 120 1,500 400 240 40 0 0 0
Total actual = 2,300
Subject VA score = 1 +Actual - Expected
Students × 100=
2,300 - 2,186.49
26 × 100+ 1 = 1.04 grade 4
2012/13†
2013/14*
2014/15*
2015/16*
Students Score Grade Students Score Grade Students Score Grade Students Score Grade
18 0.92 7 33 1.08 3 23 1.08 3 26 1.04 4
1100% 1.27
290% 1.12
375% 1.06
460% 1.01
540% 0.96
625% 0.92
710% 0.86
8bottom 0.71
9
ð
Student Avg QCAscore
AvgGCSEscore
Grade Targetgrade
Student 0344, F 54.40 7.40 B A
Student 0076, F 53.32 7.22 C A
Student 0498, M 53.20 7.20 B A
Student 0228, M 50.02 6.67 B B
Student 1659, M 48.64 6.44 B B
Student 0394, M 47.68 6.28 A B/C
Student 1561, M 46.66 6.11 C B/C
Student 0258, F 46.60 6.10 D B/C
Student 0270, F 46.00 6.00 B B/C
Student 0082, F 44.98 5.83 C B/C
Student 0905, M 44.68 5.78 B C
Student 1236, M 44.68 5.78 B C
Student 0808, F 43.84 5.64 B C
Student 0368, M 42.40 5.40 B C
Student 0918, F 41.98 5.33 B C
Student 1156, F 41.98 5.33 C C
Student 1301, M 41.98 5.33 B C
Student 1650, M 41.32 5.22 D C
Student 0221, M 40.72 5.12 B C/D
Student 0593, F 38.02 4.67 B C/D
Student 0822, F 37.42 4.57 B C/D
Student 0977, F 37.36 4.56 E C/D
Student 0679, F 35.98 4.33 D C/D
Student 0629, M 35.32 4.22 C C/D
Student 0790, F 34.84 4.14 D C/D
Student 1688, M 32.98 3.83 B C/D

A level A
lps report 2016 ©A
lkemygold Ltd
Subject page 10w
ww
.alps-va.co.uk
Single Subject Report - A - EconomicsAlps Example Sixth Form | 2015/16 | A level | Report no: 1 | 19.08.16
The symbol (†) denotes that the performances in 2012/13 are being compared to the previous benchmark andthe symbol (*) denotes that performances in 2013/14 to 2015/16 are being compared to the current benchmark.
Expected UCAS points
GCSE Band QCA Band Students × Target = Total exp
7.5 - 8.0 55.0 - 58.0 1 × 125.17 = 125.17
7.0 -< 7.5 52.0 -< 55.0 0 × 112.47 = 0.00
6.7 -< 7.0 50.2 -< 52.0 1 × 104.58 = 104.58
6.4 -< 6.7 48.4 -< 50.2 0 × 97.73 = 0.00
6.1 -< 6.4 46.6 -< 48.4 1 × 92.50 = 92.50
5.8 -< 6.1 44.8 -< 46.6 1 × 86.79 = 86.79
5.5 -< 5.8 43.0 -< 44.8 1 × 82.61 = 82.61
5.2 -< 5.5 41.2 -< 43.0 1 × 78.33 = 78.33
4.7 -< 5.2 38.2 -< 41.2 0 × 74.17 = 0.00
4.0 -< 4.7 34.0 -< 38.2 0 × 70.00 = 0.00
0.0 -< 4.0 10.0 -< 34.0 0 × 68.89 = 0.00
Students = 6 Expected UCAS points total = 569.98
A level grades and Total actual UCAS points
Students A* A B C D E U X Q A*-E% A*-C% A*-B% Avg GCSE Avg QCA
6 1 2 1 1 1 0 0 0 0 100.0% 83.3% 66.7% 6.27 47.64
UCAS pts ×140 ×120 ×100 ×80 ×60 ×40 ×0 ×0 ×0
Act pts 140 240 100 80 60 0 0 0 0
Total actual = 620
Subject VA score = 1 +Actual - Expected
Students × 100=
620 - 569.98
6 × 100+ 1 = 1.08 grade 2
2012/13†
2013/14*
2014/15*
2015/16*
Students Score Grade Students Score Grade Students Score Grade Students Score Grade
2 0.67 9 7 1.09 2 13 0.91 6 6 1.08 2
1100% 1.15
290% 1.06
375% 1.02
460% 0.98
540% 0.95
625% 0.91
710% 0.86
8bottom 0.72
9
ð
Student Avg QCAscore
AvgGCSEscore
Grade Targetgrade
Student 0993, M 55.36 7.56 A* A*/A
Student 0419, F 50.20 6.70 B B
Student 1464, F 47.80 6.30 A B/C
Student 0289, M 46.48 6.08 C B/C
Student 1488, M 43.36 5.56 A C
Student 0424, F 42.64 5.44 D C

A level A
lps report 2016 ©A
lkemygold Ltd
Subject page 11w
ww
.alps-va.co.uk
Single Subject Report - A - English LanguageAlps Example Sixth Form | 2015/16 | A level | Report no: 1 | 19.08.16
The symbol (†) denotes that the performances in 2012/13 are being compared to the previous benchmark andthe symbol (*) denotes that performances in 2013/14 to 2015/16 are being compared to the current benchmark.
Expected UCAS points
GCSE Band QCA Band Students × Target = Total exp
7.5 - 8.0 55.0 - 58.0 0 × 125.17 = 0.00
7.0 -< 7.5 52.0 -< 55.0 3 × 112.47 = 337.41
6.7 -< 7.0 50.2 -< 52.0 7 × 104.58 = 732.06
6.4 -< 6.7 48.4 -< 50.2 3 × 97.73 = 293.19
6.1 -< 6.4 46.6 -< 48.4 4 × 92.50 = 370.00
5.8 -< 6.1 44.8 -< 46.6 1 × 86.79 = 86.79
5.5 -< 5.8 43.0 -< 44.8 4 × 82.61 = 330.44
5.2 -< 5.5 41.2 -< 43.0 4 × 78.33 = 313.32
4.7 -< 5.2 38.2 -< 41.2 2 × 74.17 = 148.34
4.0 -< 4.7 34.0 -< 38.2 1 × 70.00 = 70.00
0.0 -< 4.0 10.0 -< 34.0 0 × 68.89 = 0.00
Students = 29 Expected UCAS points total = 2,681.55
A level grades and Total actual UCAS points
Students A* A B C D E U X Q A*-E% A*-C% A*-B% Avg GCSE Avg QCA
29 0 11 11 4 3 0 0 0 0 100.0% 89.7% 75.9% 6.14 46.83
UCAS pts ×140 ×120 ×100 ×80 ×60 ×40 ×0 ×0 ×0
Act pts 0 1,320 1,100 320 180 0 0 0 0
Total actual = 2,920
Subject VA score = 1 +Actual - Expected
Students × 100=
2,920 - 2,681.55
29 × 100+ 1 = 1.08 grade 2
2012/13†
2013/14*
2014/15*
2015/16*
Students Score Grade Students Score Grade Students Score Grade Students Score Grade
15 0.66 9 25 0.98 5 23 1.08 2 29 1.08 2
1100% 1.15
290% 1.06
375% 1.02
460% 0.99
540% 0.96
625% 0.93
710% 0.89
8bottom 0.76
9
ð
Student Avg QCAscore
AvgGCSEscore
Grade Targetgrade
Student 0344, F 54.40 7.40 A A
Student 0498, M 53.20 7.20 B A
Student 0125, M 53.14 7.19 A A
Student 0782, F 51.34 6.89 B B
Student 0850, F 51.22 6.87 A B
Student 0156, M 51.16 6.86 B B
Student 0325, M 50.68 6.78 A B
Student 1244, F 50.68 6.78 A B
Student 1338, F 50.62 6.77 A B
Student 0377, F 50.38 6.73 B B
Student 0228, M 50.02 6.67 B B
Student 1635, F 49.84 6.64 A B
Student 1659, M 48.64 6.44 C B
Student 0698, M 47.08 6.18 B B/C
Student 0784, M 47.02 6.17 D B/C
Student 0887, F 46.66 6.11 B B/C
Student 0466, F 46.60 6.10 B B/C
Student 1510, F 45.40 5.90 A B/C
Student 0255, F 43.54 5.59 B C
Student 0471, M 43.36 5.56 C C
Student 1639, M 43.36 5.56 A C
Student 0874, F 43.00 5.50 A C
Student 1416, M 42.64 5.44 C C
Student 1559, F 42.64 5.44 D C
Student 0088, F 41.98 5.33 A C
Student 1253, M 41.98 5.33 B C
Student 0221, M 40.72 5.12 C C/D
Student 0216, M 39.34 4.89 B C/D
Student 0977, F 37.36 4.56 D C/D

A level A
lps report 2016 ©A
lkemygold Ltd
Subject page 12w
ww
.alps-va.co.uk
Single Subject Report - A - English LiteratureAlps Example Sixth Form | 2015/16 | A level | Report no: 1 | 19.08.16
The symbol (†) denotes that the performances in 2012/13 are being compared to the previous benchmark andthe symbol (*) denotes that performances in 2013/14 to 2015/16 are being compared to the current benchmark.
Expected UCAS points
GCSE Band QCA Band Students × Target = Total exp
7.5 - 8.0 55.0 - 58.0 1 × 125.17 = 125.17
7.0 -< 7.5 52.0 -< 55.0 5 × 112.47 = 562.35
6.7 -< 7.0 50.2 -< 52.0 5 × 104.58 = 522.90
6.4 -< 6.7 48.4 -< 50.2 4 × 97.73 = 390.92
6.1 -< 6.4 46.6 -< 48.4 6 × 92.50 = 555.00
5.8 -< 6.1 44.8 -< 46.6 5 × 86.79 = 433.95
5.5 -< 5.8 43.0 -< 44.8 9 × 82.61 = 743.49
5.2 -< 5.5 41.2 -< 43.0 4 × 78.33 = 313.32
4.7 -< 5.2 38.2 -< 41.2 3 × 74.17 = 222.51
4.0 -< 4.7 34.0 -< 38.2 1 × 70.00 = 70.00
0.0 -< 4.0 10.0 -< 34.0 0 × 68.89 = 0.00
Students = 43 Expected UCAS points total = 3,939.61
A level grades and Total actual UCAS points
Students A* A B C D E U X Q A*-E% A*-C% A*-B% Avg GCSE Avg QCA
43 1 10 15 10 5 2 0 0 0 100.0% 83.7% 60.5% 6.12 46.71
UCAS pts ×140 ×120 ×100 ×80 ×60 ×40 ×0 ×0 ×0
Act pts 140 1,200 1,500 800 300 80 0 0 0
Total actual = 4,020
Subject VA score = 1 +Actual - Expected
Students × 100=
4,020 - 3,939.61
43 × 100+ 1 = 1.02 grade 4
2012/13†
2013/14*
2014/15*
2015/16*
Students Score Grade Students Score Grade Students Score Grade Students Score Grade
31 1.02 4 50 0.98 5 58 1.03 3 43 1.02 4
1100% 1.18
290% 1.08
375% 1.03
460% 1.00
540% 0.95
625% 0.92
710% 0.86
8bottom 0.71
9
ð
Student Avg QCAscore
AvgGCSEscore
Grade Targetgrade
Student 1124, F 56.26 7.71 A A*/A
Student 0253, M 54.64 7.44 A A
Student 0344, F 54.40 7.40 A* A
Student 0608, F 54.40 7.40 B A
Student 1705, F 54.40 7.40 B A
Student 0100, M 52.00 7.00 C A
Student 0244, F 51.40 6.90 A B
Student 1346, M 50.80 6.80 B B
Student 1244, F 50.68 6.78 C B
Student 1107, F 50.26 6.71 A B
Student 0310, M 50.20 6.70 B B
Student 0228, M 50.02 6.67 A B
Student 1047, M 50.02 6.67 B B
Student 1568, M 49.36 6.56 D B
Student 1659, M 48.64 6.44 B B
Student 0158, M 48.10 6.35 D B/C
Student 0394, M 47.68 6.28 A B/C
Student 0805, M 47.32 6.22 C B/C
Student 0883, F 46.66 6.11 A B/C
Student 0887, F 46.66 6.11 C B/C
Student 1561, M 46.66 6.11 B B/C
Student 0415, F 46.54 6.09 B B/C
Student 0270, F 46.00 6.00 C B/C
Student 0671, F 46.00 6.00 C B/C
Student 1679, M 46.00 6.00 A B/C
Student 1116, M 45.34 5.89 C B/C
Student 0905, M 44.68 5.78 B C
Student 0353, M 43.90 5.65 B C
Student 0808, F 43.84 5.64 C C
Student 0096, F 43.60 5.60 D C
Student 0440, F 43.36 5.56 C C
Student 0826, M 43.36 5.56 C C
Student 1008, M 43.36 5.56 B C
Student 0502, F 43.00 5.50 B C
Student 0874, F 43.00 5.50 A C
Student 0368, M 42.40 5.40 B C
Student 1365, F 41.98 5.33 A C
Student 1613, F 41.98 5.33 B C
Student 0923, F 41.20 5.20 E C
Student 0717, F 41.14 5.19 D C/D
Student 0814, F 40.66 5.11 E C/D
Student 0216, M 39.34 4.89 B C/D
Student 0822, F 37.42 4.57 D C/D

A level A
lps report 2016 ©A
lkemygold Ltd
Subject page 13w
ww
.alps-va.co.uk
Single Subject Report - A - Film StudiesAlps Example Sixth Form | 2015/16 | A level | Report no: 1 | 19.08.16
The symbol (†) denotes that the performances in 2012/13 are being compared to the previous benchmark andthe symbol (*) denotes that performances in 2013/14 to 2015/16 are being compared to the current benchmark.
Expected UCAS points
GCSE Band QCA Band Students × Target = Total exp
7.5 - 8.0 55.0 - 58.0 0 × 125.17 = 0.00
7.0 -< 7.5 52.0 -< 55.0 0 × 112.47 = 0.00
6.7 -< 7.0 50.2 -< 52.0 0 × 104.58 = 0.00
6.4 -< 6.7 48.4 -< 50.2 0 × 97.73 = 0.00
6.1 -< 6.4 46.6 -< 48.4 2 × 92.50 = 185.00
5.8 -< 6.1 44.8 -< 46.6 0 × 86.79 = 0.00
5.5 -< 5.8 43.0 -< 44.8 0 × 82.61 = 0.00
5.2 -< 5.5 41.2 -< 43.0 5 × 78.33 = 391.65
4.7 -< 5.2 38.2 -< 41.2 5 × 74.17 = 370.85
4.0 -< 4.7 34.0 -< 38.2 1 × 70.00 = 70.00
0.0 -< 4.0 10.0 -< 34.0 0 × 68.89 = 0.00
Students = 13 Expected UCAS points total = 1,017.50
A level grades and Total actual UCAS points
Students A* A B C D E U X Q A*-E% A*-C% A*-B% Avg GCSE Avg QCA
13 0 3 4 3 3 0 0 0 0 100.0% 76.9% 53.8% 5.31 41.83
UCAS pts ×140 ×120 ×100 ×80 ×60 ×40 ×0 ×0 ×0
Act pts 0 360 400 240 180 0 0 0 0
Total actual = 1,180
Subject VA score = 1 +Actual - Expected
Students × 100=
1,180 - 1,017.50
13 × 100+ 1 = 1.13 grade 3
2012/13†
2013/14*
2014/15*
2015/16*
Students Score Grade Students Score Grade Students Score Grade Students Score Grade
- - - 7 1.20 2 11 1.15 3 13 1.13 3
1100% 1.30
290% 1.16
375% 1.10
460% 1.07
540% 1.03
625% 1.00
710% 0.95
8bottom 0.76
9
ð
Student Avg QCAscore
AvgGCSEscore
Grade Targetgrade
Student 0698, M 47.08 6.18 A B/C
Student 0258, F 46.60 6.10 B B/C
Student 1541, M 42.64 5.44 B C
Student 0368, M 42.40 5.40 D C
Student 0918, F 41.98 5.33 B C
Student 0364, F 41.32 5.22 C C
Student 1650, M 41.32 5.22 D C
Student 0717, F 41.14 5.19 C C/D
Student 0814, F 40.66 5.11 A C/D
Student 0939, F 40.66 5.11 A C/D
Student 1402, F 40.66 5.11 B C/D
Student 0729, M 40.00 5.00 D C/D
Student 0977, F 37.36 4.56 C C/D

A level A
lps report 2016 ©A
lkemygold Ltd
Subject page 14w
ww
.alps-va.co.uk
Single Subject Report - A - FrenchAlps Example Sixth Form | 2015/16 | A level | Report no: 1 | 19.08.16
The symbol (†) denotes that the performances in 2012/13 are being compared to the previous benchmark andthe symbol (*) denotes that performances in 2013/14 to 2015/16 are being compared to the current benchmark.
Expected UCAS points
GCSE Band QCA Band Students × Target = Total exp
7.5 - 8.0 55.0 - 58.0 1 × 125.17 = 125.17
7.0 -< 7.5 52.0 -< 55.0 2 × 112.47 = 224.94
6.7 -< 7.0 50.2 -< 52.0 1 × 104.58 = 104.58
6.4 -< 6.7 48.4 -< 50.2 1 × 97.73 = 97.73
6.1 -< 6.4 46.6 -< 48.4 1 × 92.50 = 92.50
5.8 -< 6.1 44.8 -< 46.6 2 × 86.79 = 173.58
5.5 -< 5.8 43.0 -< 44.8 0 × 82.61 = 0.00
5.2 -< 5.5 41.2 -< 43.0 1 × 78.33 = 78.33
4.7 -< 5.2 38.2 -< 41.2 0 × 74.17 = 0.00
4.0 -< 4.7 34.0 -< 38.2 0 × 70.00 = 0.00
0.0 -< 4.0 10.0 -< 34.0 0 × 68.89 = 0.00
Students = 9 Expected UCAS points total = 896.83
A level grades and Total actual UCAS points
Students A* A B C D E U X Q A*-E% A*-C% A*-B% Avg GCSE Avg QCA
9 0 2 3 2 2 0 0 0 0 100.0% 77.8% 55.6% 6.62 49.74
UCAS pts ×140 ×120 ×100 ×80 ×60 ×40 ×0 ×0 ×0
Act pts 0 240 300 160 120 0 0 0 0
Total actual = 820
Subject VA score = 1 +Actual - Expected
Students × 100=
820 - 896.83
9 × 100+ 1 = 0.91 grade 5
2012/13†
2013/14*
2014/15*
2015/16*
Students Score Grade Students Score Grade Students Score Grade Students Score Grade
12 0.77 7 6 0.67 8 9 0.95 4 9 0.91 5
1100% 1.18
290% 1.05
375% 0.99
460% 0.95
540% 0.89
625% 0.85
710% 0.77
8bottom 0.55
9
ðStudent Avg QCA
score
AvgGCSEscore
Grade Targetgrade
Student 1444, M 57.40 7.90 A A*/A
Student 0076, F 53.32 7.22 C A
Student 0125, M 53.14 7.19 B A
Student 0156, M 51.16 6.86 A B
Student 1047, M 50.02 6.67 B B
Student 1146, M 48.34 6.39 D B/C
Student 1679, M 46.00 6.00 B B/C
Student 1510, F 45.40 5.90 C B/C
Student 0761, F 42.88 5.48 D C

A level A
lps report 2016 ©A
lkemygold Ltd
Subject page 15w
ww
.alps-va.co.uk
Single Subject Report - A - General StudiesAlps Example Sixth Form | 2015/16 | A level | Report no: 1 | 19.08.16
The symbol (†) denotes that the performances in 2012/13 are being compared to the previous benchmark andthe symbol (*) denotes that performances in 2013/14 to 2015/16 are being compared to the current benchmark.
Expected UCAS points
GCSE Band QCA Band Students × Target = Total exp
7.5 - 8.0 55.0 - 58.0 4 × 125.17 = 500.68
7.0 -< 7.5 52.0 -< 55.0 7 × 112.47 = 787.29
6.7 -< 7.0 50.2 -< 52.0 8 × 104.58 = 836.64
6.4 -< 6.7 48.4 -< 50.2 7 × 97.73 = 684.11
6.1 -< 6.4 46.6 -< 48.4 10 × 92.50 = 925.00
5.8 -< 6.1 44.8 -< 46.6 8 × 86.79 = 694.32
5.5 -< 5.8 43.0 -< 44.8 9 × 82.61 = 743.49
5.2 -< 5.5 41.2 -< 43.0 7 × 78.33 = 548.31
4.7 -< 5.2 38.2 -< 41.2 4 × 74.17 = 296.68
4.0 -< 4.7 34.0 -< 38.2 2 × 70.00 = 140.00
0.0 -< 4.0 10.0 -< 34.0 0 × 68.89 = 0.00
Students = 66 Expected UCAS points total = 6,156.52
A level grades and Total actual UCAS points
Students A* A B C D E U X Q A*-E% A*-C% A*-B% Avg GCSE Avg QCA
66 1 6 20 18 13 6 2 0 0 97.0% 68.2% 40.9% 6.18 47.09
UCAS pts ×140 ×120 ×100 ×80 ×60 ×40 ×0 ×0 ×0
Act pts 140 720 2,000 1,440 780 240 0 0 0
Total actual = 5,320
Subject VA score = 1 +Actual - Expected
Students × 100=
5,320 - 6,156.52
66 × 100+ 1 = 0.87 grade 3
2012/13†
2013/14*
2014/15*
2015/16*
Students Score Grade Students Score Grade Students Score Grade Students Score Grade
73 0.85 4 94 0.79 5 90 0.80 4 66 0.87 3
1100% 1.02
290% 0.90
375% 0.85
460% 0.80
540% 0.74
625% 0.70
710% 0.64
8bottom 0.43
9
ð
Student Avg QCAscore
AvgGCSEscore
Grade Targetgrade
Student 0266, F 56.62 7.77 B A*/A
Student 1051, M 56.62 7.77 A A*/A
Student 1055, F 55.72 7.62 B A*/A
Student 0102, F 55.00 7.50 B A*/A
Student 0344, F 54.40 7.40 B A
Student 0683, M 53.74 7.29 B A
Student 0076, F 53.32 7.22 D A
Student 0125, M 53.14 7.19 C A
Student 0413, F 52.60 7.10 D A
Student 0100, M 52.00 7.00 C A
Student 1702, M 52.00 7.00 C A
Student 0907, F 51.46 6.91 B B
Student 0782, F 51.34 6.89 C B
Student 0156, M 51.16 6.86 A B
Student 1200, F 50.38 6.73 C B
Student 1107, F 50.26 6.71 D B
Student 0310, M 50.20 6.70 B B
Student 0419, F 50.20 6.70 A B
Student 0453, M 50.20 6.70 C B
Student 1456, M 50.02 6.67 C B
Student 1635, F 49.84 6.64 A B
Student 0411, M 49.42 6.57 D B
Student 1568, M 49.36 6.56 C B
Student 0063, F 49.12 6.52 A B
Student 0123, F 48.58 6.43 C B
Student 1397, F 48.40 6.40 D B
Student 1146, M 48.34 6.39 D B/C
Student 0158, M 48.10 6.35 A B/C
Student 1421, M 47.80 6.30 C B/C
Student 0985, F 47.44 6.24 C B/C
Student 1723, F 47.44 6.24 B B/C
Student 0698, M 47.08 6.18 B B/C
Student 0402, M 46.90 6.15 C B/C
Student 0037, F 46.78 6.13 D B/C
Student 0510, M 46.66 6.11 B B/C
Student 0466, F 46.60 6.10 D B/C
Student 0011, M 46.54 6.09 A* B/C
Student 0415, F 46.54 6.09 C B/C
Student 1454, M 46.30 6.05 E B/C
Student 1683, F 45.70 5.95 B B/C
Student 0575, F 45.40 5.90 B B/C
Student 0796, F 45.40 5.90 C B/C
Student 1116, M 45.34 5.89 D B/C
Student 0231, F 44.98 5.83 C B/C
Student 0591, F 44.74 5.79 E C
Student 0772, F 44.02 5.67 B C
Student 1348, M 44.02 5.67 D C
Student 0353, M 43.90 5.65 E C
Student 1557, F 43.60 5.60 E C
Student 0255, F 43.54 5.59 B C
Student 0826, M 43.36 5.56 C C
Student 1008, M 43.36 5.56 B C
Student 0874, F 43.00 5.50 B C
Student 0761, F 42.88 5.48 U C
Student 0506, F 42.64 5.44 B C
Student 0928, F 42.64 5.44 D C
Student 0368, M 42.40 5.40 B C
Student 0164, F 41.98 5.33 B C
Student 0364, F 41.32 5.22 C C
Student 0866, M 41.26 5.21 B C
Student 0717, F 41.14 5.19 E C/D
Student 0221, M 40.72 5.12 D C/D
Student 0168, F 40.66 5.11 C C/D
Student 0729, M 40.00 5.00 D C/D
Student 0977, F 37.36 4.56 E C/D
Student 0790, F 34.84 4.14 U C/D
Student 1091, M - - A -

A level A
lps report 2016 ©A
lkemygold Ltd
Subject page 16w
ww
.alps-va.co.uk
Single Subject Report - A - GeographyAlps Example Sixth Form | 2015/16 | A level | Report no: 1 | 19.08.16
The symbol (†) denotes that the performances in 2012/13 are being compared to the previous benchmark andthe symbol (*) denotes that performances in 2013/14 to 2015/16 are being compared to the current benchmark.
Expected UCAS points
GCSE Band QCA Band Students × Target = Total exp
7.5 - 8.0 55.0 - 58.0 0 × 125.17 = 0.00
7.0 -< 7.5 52.0 -< 55.0 2 × 112.47 = 224.94
6.7 -< 7.0 50.2 -< 52.0 4 × 104.58 = 418.32
6.4 -< 6.7 48.4 -< 50.2 3 × 97.73 = 293.19
6.1 -< 6.4 46.6 -< 48.4 1 × 92.50 = 92.50
5.8 -< 6.1 44.8 -< 46.6 4 × 86.79 = 347.16
5.5 -< 5.8 43.0 -< 44.8 2 × 82.61 = 165.22
5.2 -< 5.5 41.2 -< 43.0 2 × 78.33 = 156.66
4.7 -< 5.2 38.2 -< 41.2 1 × 74.17 = 74.17
4.0 -< 4.7 34.0 -< 38.2 0 × 70.00 = 0.00
0.0 -< 4.0 10.0 -< 34.0 0 × 68.89 = 0.00
Students = 19 Expected UCAS points total = 1,772.16
A level grades and Total actual UCAS points
Students A* A B C D E U X Q A*-E% A*-C% A*-B% Avg GCSE Avg QCA
19 2 4 8 3 2 0 0 0 0 100.0% 89.5% 73.7% 6.23 47.36
UCAS pts ×140 ×120 ×100 ×80 ×60 ×40 ×0 ×0 ×0
Act pts 280 480 800 240 120 0 0 0 0
Total actual = 1,920
Subject VA score = 1 +Actual - Expected
Students × 100=
1,920 - 1,772.16
19 × 100+ 1 = 1.08 grade 2
2012/13†
2013/14*
2014/15*
2015/16*
Students Score Grade Students Score Grade Students Score Grade Students Score Grade
24 0.92 6 21 1.00 4 17 0.97 5 19 1.08 2
1100% 1.15
290% 1.07
375% 1.02
460% 0.99
540% 0.96
625% 0.92
710% 0.86
8bottom 0.72
9
ð
Student Avg QCAscore
AvgGCSEscore
Grade Targetgrade
Student 1286, M 54.40 7.40 B A
Student 0683, M 53.74 7.29 A A
Student 0156, M 51.16 6.86 A B
Student 0325, M 50.68 6.78 A* B
Student 1338, F 50.62 6.77 A* B
Student 0681, F 50.56 6.76 B B
Student 0657, M 49.36 6.56 B B
Student 1589, F 48.88 6.48 A B
Student 1468, M 48.64 6.44 C B
Student 0784, M 47.02 6.17 A B/C
Student 0011, M 46.54 6.09 B B/C
Student 0654, M 46.54 6.09 B B/C
Student 1111, F 45.76 5.96 C B/C
Student 0231, F 44.98 5.83 B B/C
Student 0772, F 44.02 5.67 B C
Student 0353, M 43.90 5.65 D C
Student 1253, M 41.98 5.33 B C
Student 0364, F 41.32 5.22 C C
Student 0701, F 39.70 4.95 D C/D

A level A
lps report 2016 ©A
lkemygold Ltd
Subject page 17w
ww
.alps-va.co.uk
Single Subject Report - A - Government & PoliticsAlps Example Sixth Form | 2015/16 | A level | Report no: 1 | 19.08.16
The symbol (†) denotes that the performances in 2012/13 are being compared to the previous benchmark andthe symbol (*) denotes that performances in 2013/14 to 2015/16 are being compared to the current benchmark.
Expected UCAS points
GCSE Band QCA Band Students × Target = Total exp
7.5 - 8.0 55.0 - 58.0 0 × 125.17 = 0.00
7.0 -< 7.5 52.0 -< 55.0 0 × 112.47 = 0.00
6.7 -< 7.0 50.2 -< 52.0 0 × 104.58 = 0.00
6.4 -< 6.7 48.4 -< 50.2 0 × 97.73 = 0.00
6.1 -< 6.4 46.6 -< 48.4 1 × 92.50 = 92.50
5.8 -< 6.1 44.8 -< 46.6 2 × 86.79 = 173.58
5.5 -< 5.8 43.0 -< 44.8 0 × 82.61 = 0.00
5.2 -< 5.5 41.2 -< 43.0 0 × 78.33 = 0.00
4.7 -< 5.2 38.2 -< 41.2 0 × 74.17 = 0.00
4.0 -< 4.7 34.0 -< 38.2 0 × 70.00 = 0.00
0.0 -< 4.0 10.0 -< 34.0 0 × 68.89 = 0.00
Students = 3 Expected UCAS points total = 266.08
A level grades and Total actual UCAS points
Students A* A B C D E U X Q A*-E% A*-C% A*-B% Avg GCSE Avg QCA
3 0 1 0 1 1 0 0 0 0 100.0% 66.7% 33.3% 6.15 46.88
UCAS pts ×140 ×120 ×100 ×80 ×60 ×40 ×0 ×0 ×0
Act pts 0 120 0 80 60 0 0 0 0
Total actual = 260
Subject VA score = 1 +Actual - Expected
Students × 100=
260 - 266.08
3 × 100+ 1 = 0.98 grade 5
2012/13†
2013/14*
2014/15*
2015/16*
Students Score Grade Students Score Grade Students Score Grade Students Score Grade
11 1.02 4 8 0.96 6 3 0.69 9 3 0.98 5
1100% 1.19
290% 1.08
375% 1.04
460% 1.01
540% 0.97
625% 0.92
710% 0.87
8bottom 0.70
9
ðStudent Avg QCAscore
AvgGCSEscore
Grade Targetgrade
Student 0158, M 48.10 6.35 A B/C
Student 0011, M 46.54 6.09 D B/C
Student 1679, M 46.00 6.00 C B/C
A level A
lps report 2016 ©A
lkemygold Ltd
Subject page 18w
ww
.alps-va.co.uk
Single Subject Report - A - HistoryAlps Example Sixth Form | 2015/16 | A level | Report no: 1 | 19.08.16
The symbol (†) denotes that the performances in 2012/13 are being compared to the previous benchmark andthe symbol (*) denotes that performances in 2013/14 to 2015/16 are being compared to the current benchmark.
Expected UCAS points
GCSE Band QCA Band Students × Target = Total exp
7.5 - 8.0 55.0 - 58.0 2 × 125.17 = 250.34
7.0 -< 7.5 52.0 -< 55.0 3 × 112.47 = 337.41
6.7 -< 7.0 50.2 -< 52.0 6 × 104.58 = 627.48
6.4 -< 6.7 48.4 -< 50.2 4 × 97.73 = 390.92
6.1 -< 6.4 46.6 -< 48.4 8 × 92.50 = 740.00
5.8 -< 6.1 44.8 -< 46.6 3 × 86.79 = 260.37
5.5 -< 5.8 43.0 -< 44.8 3 × 82.61 = 247.83
5.2 -< 5.5 41.2 -< 43.0 5 × 78.33 = 391.65
4.7 -< 5.2 38.2 -< 41.2 4 × 74.17 = 296.68
4.0 -< 4.7 34.0 -< 38.2 3 × 70.00 = 210.00
0.0 -< 4.0 10.0 -< 34.0 0 × 68.89 = 0.00
Students = 41 Expected UCAS points total = 3,752.68
A level grades and Total actual UCAS points
Students A* A B C D E U X Q A*-E% A*-C% A*-B% Avg GCSE Avg QCA
41 2 8 11 11 7 2 0 0 0 100.0% 78.0% 51.2% 6.07 46.42
UCAS pts ×140 ×120 ×100 ×80 ×60 ×40 ×0 ×0 ×0
Act pts 280 960 1,100 880 420 80 0 0 0
Total actual = 3,720
Subject VA score = 1 +Actual - Expected
Students × 100=
3,720 - 3,752.68
41 × 100+ 1 = 0.99 grade 4
2012/13†
2013/14*
2014/15*
2015/16*
Students Score Grade Students Score Grade Students Score Grade Students Score Grade
32 1.04 3 17 0.94 5 27 0.93 6 41 0.99 4
1100% 1.16
290% 1.05
375% 1.01
460% 0.98
540% 0.94
625% 0.91
710% 0.86
8bottom 0.71
9
ð
Student Avg QCAscore
AvgGCSEscore
Grade Targetgrade
Student 1124, F 56.26 7.71 A* A*/A
Student 0993, M 55.36 7.56 A A*/A
Student 0253, M 54.64 7.44 A A
Student 1705, F 54.40 7.40 B A
Student 0750, M 53.62 7.27 A* A
Student 1632, F 51.52 6.92 B B
Student 0244, F 51.40 6.90 B B
Student 0681, F 50.56 6.76 B B
Student 1107, F 50.26 6.71 A B
Student 0310, M 50.20 6.70 C B
Student 0419, F 50.20 6.70 B B
Student 1047, M 50.02 6.67 B B
Student 1635, F 49.84 6.64 A B
Student 0832, F 49.36 6.56 C B
Student 1589, F 48.88 6.48 C B
Student 0158, M 48.10 6.35 B B/C
Student 1464, F 47.80 6.30 A B/C
Student 0985, F 47.44 6.24 C B/C
Student 1723, F 47.44 6.24 C B/C
Student 0805, M 47.32 6.22 D B/C
Student 0784, M 47.02 6.17 A B/C
Student 0037, F 46.78 6.13 C B/C
Student 0466, F 46.60 6.10 D B/C
Student 0415, F 46.54 6.09 A B/C
Student 0289, M 46.48 6.08 B B/C
Student 0575, F 45.40 5.90 B B/C
Student 1395, F 44.68 5.78 A C
Student 0255, F 43.54 5.59 B C
Student 0874, F 43.00 5.50 C C
Student 1541, M 42.64 5.44 D C
Student 0737, F 42.34 5.39 D C
Student 0164, F 41.98 5.33 C C
Student 1365, F 41.98 5.33 E C
Student 0519, M 41.26 5.21 D C
Student 1381, M 40.00 5.00 C C/D
Student 1126, M 39.34 4.89 C C/D
Student 0240, M 38.98 4.83 D C/D
Student 1384, F 38.68 4.78 E C/D
Student 0593, F 38.02 4.67 D C/D
Student 0822, F 37.42 4.57 B C/D
Student 0679, F 35.98 4.33 C C/D
Student 1091, M - - A -

A level A
lps report 2016 ©A
lkemygold Ltd
Subject page 19w
ww
.alps-va.co.uk
Single Subject Report - A - Home EconomicsAlps Example Sixth Form | 2015/16 | A level | Report no: 1 | 19.08.16
The symbol (†) denotes that the performances in 2012/13 are being compared to the previous benchmark andthe symbol (*) denotes that performances in 2013/14 to 2015/16 are being compared to the current benchmark.
Expected UCAS points
GCSE Band QCA Band Students × Target = Total exp
7.5 - 8.0 55.0 - 58.0 0 × 125.17 = 0.00
7.0 -< 7.5 52.0 -< 55.0 0 × 112.47 = 0.00
6.7 -< 7.0 50.2 -< 52.0 0 × 104.58 = 0.00
6.4 -< 6.7 48.4 -< 50.2 1 × 97.73 = 97.73
6.1 -< 6.4 46.6 -< 48.4 0 × 92.50 = 0.00
5.8 -< 6.1 44.8 -< 46.6 0 × 86.79 = 0.00
5.5 -< 5.8 43.0 -< 44.8 0 × 82.61 = 0.00
5.2 -< 5.5 41.2 -< 43.0 0 × 78.33 = 0.00
4.7 -< 5.2 38.2 -< 41.2 0 × 74.17 = 0.00
4.0 -< 4.7 34.0 -< 38.2 0 × 70.00 = 0.00
0.0 -< 4.0 10.0 -< 34.0 0 × 68.89 = 0.00
Students = 1 Expected UCAS points total = 97.73
A level grades and Total actual UCAS points
Students A* A B C D E U X Q A*-E% A*-C% A*-B% Avg GCSE Avg QCA
1 0 0 0 0 1 0 0 0 0 100.0% 0.0% 0.0% 6.44 48.64
UCAS pts ×140 ×120 ×100 ×80 ×60 ×40 ×0 ×0 ×0
Act pts 0 0 0 0 60 0 0 0 0
Total actual = 60
Subject VA score = 1 +Actual - Expected
Students × 100=
60 - 97.73
1 × 100+ 1 = 0.62 grade 8
2012/13†
2013/14*
2014/15*
2015/16*
Students Score Grade Students Score Grade Students Score Grade Students Score Grade
2 0.63 8 5 0.88 6 2 0.82 7 1 0.62 8
1100% 1.28
290% 1.09
375% 1.05
460% 0.99
540% 0.91
625% 0.85
710% 0.77
8bottom 0.45
9
ð
Student Avg QCAscore
AvgGCSEscore
Grade Targetgrade
Student 0474, M 48.64 6.44 D B

A level A
lps report 2016 ©A
lkemygold Ltd
Subject page 20w
ww
.alps-va.co.uk
Single Subject Report - A - Information & Communication TechnologyAlps Example Sixth Form | 2015/16 | A level | Report no: 1 | 19.08.16
The symbol (†) denotes that the performances in 2012/13 are being compared to the previous benchmark andthe symbol (*) denotes that performances in 2013/14 to 2015/16 are being compared to the current benchmark.
Expected UCAS points
GCSE Band QCA Band Students × Target = Total exp
7.5 - 8.0 55.0 - 58.0 0 × 125.17 = 0.00
7.0 -< 7.5 52.0 -< 55.0 0 × 112.47 = 0.00
6.7 -< 7.0 50.2 -< 52.0 1 × 104.58 = 104.58
6.4 -< 6.7 48.4 -< 50.2 2 × 97.73 = 195.46
6.1 -< 6.4 46.6 -< 48.4 2 × 92.50 = 185.00
5.8 -< 6.1 44.8 -< 46.6 2 × 86.79 = 173.58
5.5 -< 5.8 43.0 -< 44.8 2 × 82.61 = 165.22
5.2 -< 5.5 41.2 -< 43.0 5 × 78.33 = 391.65
4.7 -< 5.2 38.2 -< 41.2 1 × 74.17 = 74.17
4.0 -< 4.7 34.0 -< 38.2 0 × 70.00 = 0.00
0.0 -< 4.0 10.0 -< 34.0 1 × 68.89 = 68.89
Students = 16 Expected UCAS points total = 1,358.55
A level grades and Total actual UCAS points
Students A* A B C D E U X Q A*-E% A*-C% A*-B% Avg GCSE Avg QCA
16 0 0 7 4 3 2 0 0 0 100.0% 68.8% 43.8% 5.69 44.16
UCAS pts ×140 ×120 ×100 ×80 ×60 ×40 ×0 ×0 ×0
Act pts 0 0 700 320 180 80 0 0 0
Total actual = 1,280
Subject VA score = 1 +Actual - Expected
Students × 100=
1,280 - 1,358.55
16 × 100+ 1 = 0.95 grade 4
2012/13†
2013/14*
2014/15*
2015/16*
Students Score Grade Students Score Grade Students Score Grade Students Score Grade
16 0.62 8 7 0.84 7 10 0.86 6 16 0.95 4
1100% 1.19
290% 1.05
375% 0.99
460% 0.94
540% 0.90
625% 0.85
710% 0.77
8bottom 0.64
9
ð
Student Avg QCAscore
AvgGCSEscore
Grade Targetgrade
Student 1623, M 50.68 6.78 B B
Student 1418, F 49.78 6.63 B B
Student 0832, F 49.36 6.56 C B
Student 0342, F 46.78 6.13 B B/C
Student 1561, M 46.66 6.11 B B/C
Student 0595, M 46.00 6.00 C B/C
Student 1240, F 45.64 5.94 B B/C
Student 0312, F 44.74 5.79 B C
Student 1625, M 44.50 5.75 B C
Student 0424, F 42.64 5.44 C C
Student 0506, F 42.64 5.44 C C
Student 1084, M 41.50 5.25 D C
Student 1429, F 41.32 5.22 E C
Student 0519, M 41.26 5.21 D C
Student 0570, F 40.00 5.00 D C/D
Student 1688, M 32.98 3.83 E C/D
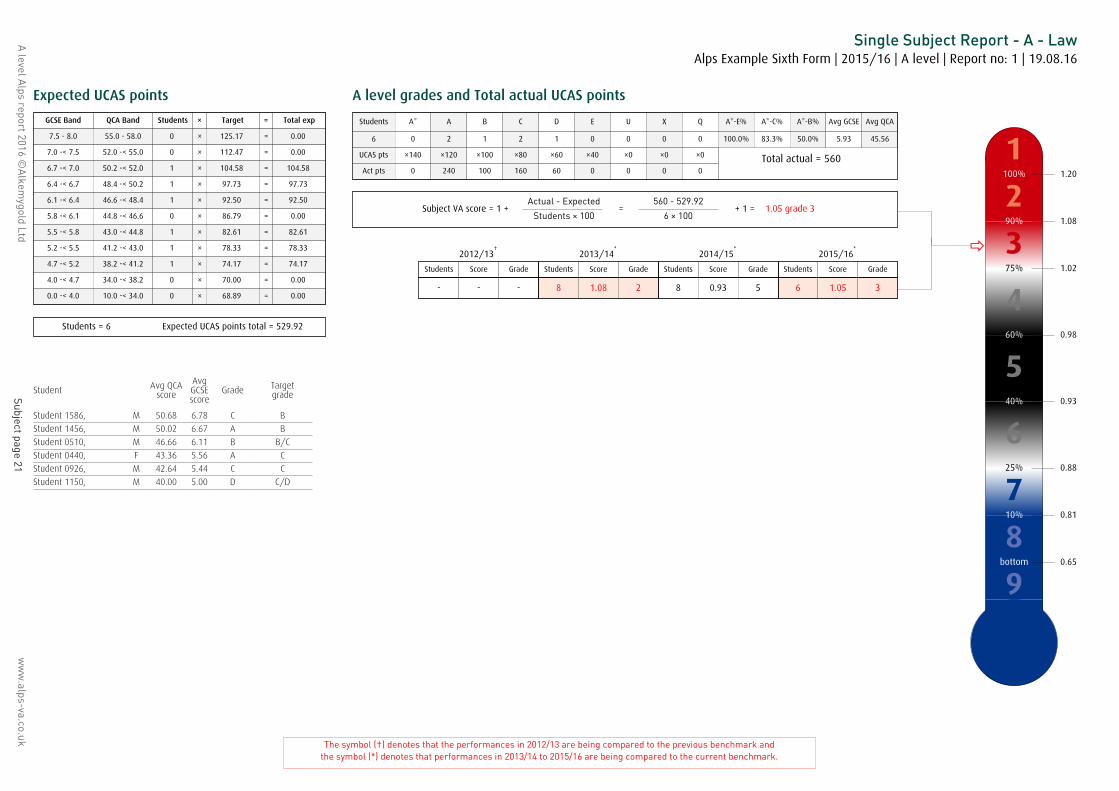
A level A
lps report 2016 ©A
lkemygold Ltd
Subject page 21w
ww
.alps-va.co.uk
Single Subject Report - A - LawAlps Example Sixth Form | 2015/16 | A level | Report no: 1 | 19.08.16
The symbol (†) denotes that the performances in 2012/13 are being compared to the previous benchmark andthe symbol (*) denotes that performances in 2013/14 to 2015/16 are being compared to the current benchmark.
Expected UCAS points
GCSE Band QCA Band Students × Target = Total exp
7.5 - 8.0 55.0 - 58.0 0 × 125.17 = 0.00
7.0 -< 7.5 52.0 -< 55.0 0 × 112.47 = 0.00
6.7 -< 7.0 50.2 -< 52.0 1 × 104.58 = 104.58
6.4 -< 6.7 48.4 -< 50.2 1 × 97.73 = 97.73
6.1 -< 6.4 46.6 -< 48.4 1 × 92.50 = 92.50
5.8 -< 6.1 44.8 -< 46.6 0 × 86.79 = 0.00
5.5 -< 5.8 43.0 -< 44.8 1 × 82.61 = 82.61
5.2 -< 5.5 41.2 -< 43.0 1 × 78.33 = 78.33
4.7 -< 5.2 38.2 -< 41.2 1 × 74.17 = 74.17
4.0 -< 4.7 34.0 -< 38.2 0 × 70.00 = 0.00
0.0 -< 4.0 10.0 -< 34.0 0 × 68.89 = 0.00
Students = 6 Expected UCAS points total = 529.92
A level grades and Total actual UCAS points
Students A* A B C D E U X Q A*-E% A*-C% A*-B% Avg GCSE Avg QCA
6 0 2 1 2 1 0 0 0 0 100.0% 83.3% 50.0% 5.93 45.56
UCAS pts ×140 ×120 ×100 ×80 ×60 ×40 ×0 ×0 ×0
Act pts 0 240 100 160 60 0 0 0 0
Total actual = 560
Subject VA score = 1 +Actual - Expected
Students × 100=
560 - 529.92
6 × 100+ 1 = 1.05 grade 3
2012/13†
2013/14*
2014/15*
2015/16*
Students Score Grade Students Score Grade Students Score Grade Students Score Grade
- - - 8 1.08 2 8 0.93 5 6 1.05 3
1100% 1.20
290% 1.08
375% 1.02
460% 0.98
540% 0.93
625% 0.88
710% 0.81
8bottom 0.65
9
ð
Student Avg QCAscore
AvgGCSEscore
Grade Targetgrade
Student 1586, M 50.68 6.78 C B
Student 1456, M 50.02 6.67 A B
Student 0510, M 46.66 6.11 B B/C
Student 0440, F 43.36 5.56 A C
Student 0926, M 42.64 5.44 C C
Student 1150, M 40.00 5.00 D C/D
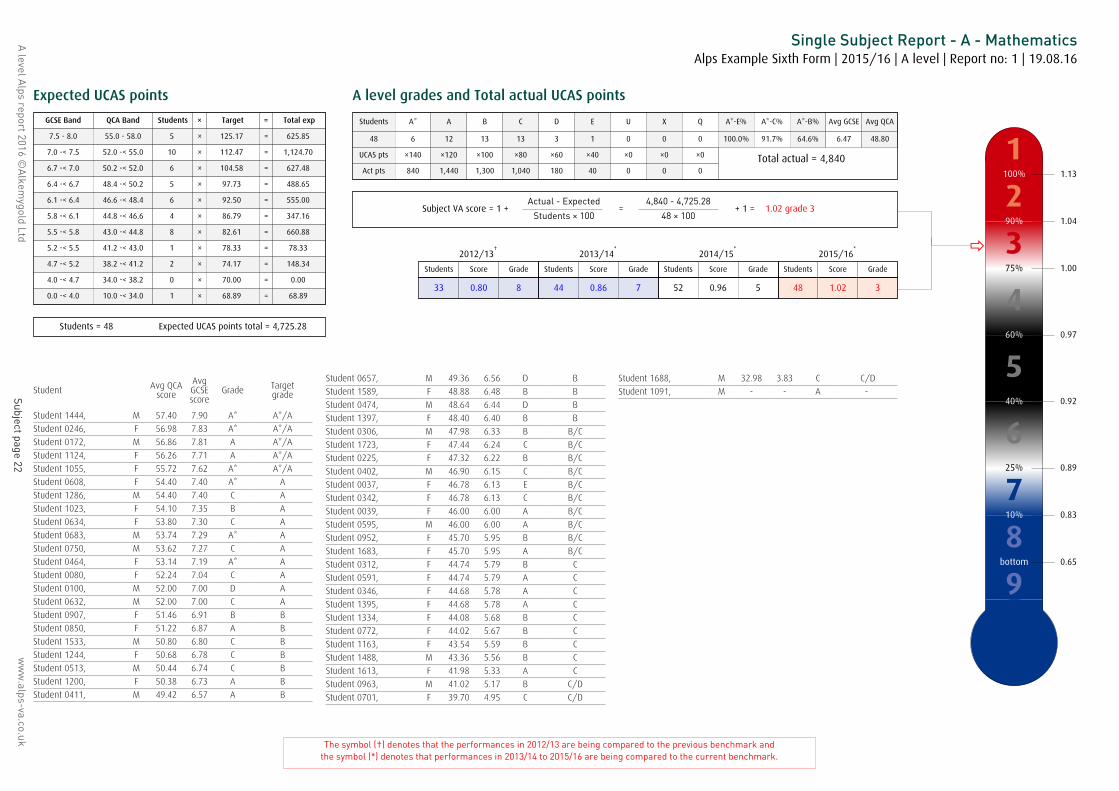
A level A
lps report 2016 ©A
lkemygold Ltd
Subject page 22w
ww
.alps-va.co.uk
Single Subject Report - A - MathematicsAlps Example Sixth Form | 2015/16 | A level | Report no: 1 | 19.08.16
The symbol (†) denotes that the performances in 2012/13 are being compared to the previous benchmark andthe symbol (*) denotes that performances in 2013/14 to 2015/16 are being compared to the current benchmark.
Expected UCAS points
GCSE Band QCA Band Students × Target = Total exp
7.5 - 8.0 55.0 - 58.0 5 × 125.17 = 625.85
7.0 -< 7.5 52.0 -< 55.0 10 × 112.47 = 1,124.70
6.7 -< 7.0 50.2 -< 52.0 6 × 104.58 = 627.48
6.4 -< 6.7 48.4 -< 50.2 5 × 97.73 = 488.65
6.1 -< 6.4 46.6 -< 48.4 6 × 92.50 = 555.00
5.8 -< 6.1 44.8 -< 46.6 4 × 86.79 = 347.16
5.5 -< 5.8 43.0 -< 44.8 8 × 82.61 = 660.88
5.2 -< 5.5 41.2 -< 43.0 1 × 78.33 = 78.33
4.7 -< 5.2 38.2 -< 41.2 2 × 74.17 = 148.34
4.0 -< 4.7 34.0 -< 38.2 0 × 70.00 = 0.00
0.0 -< 4.0 10.0 -< 34.0 1 × 68.89 = 68.89
Students = 48 Expected UCAS points total = 4,725.28
A level grades and Total actual UCAS points
Students A* A B C D E U X Q A*-E% A*-C% A*-B% Avg GCSE Avg QCA
48 6 12 13 13 3 1 0 0 0 100.0% 91.7% 64.6% 6.47 48.80
UCAS pts ×140 ×120 ×100 ×80 ×60 ×40 ×0 ×0 ×0
Act pts 840 1,440 1,300 1,040 180 40 0 0 0
Total actual = 4,840
Subject VA score = 1 +Actual - Expected
Students × 100=
4,840 - 4,725.28
48 × 100+ 1 = 1.02 grade 3
2012/13†
2013/14*
2014/15*
2015/16*
Students Score Grade Students Score Grade Students Score Grade Students Score Grade
33 0.80 8 44 0.86 7 52 0.96 5 48 1.02 3
1100% 1.13
290% 1.04
375% 1.00
460% 0.97
540% 0.92
625% 0.89
710% 0.83
8bottom 0.65
9
ð
Student Avg QCAscore
AvgGCSEscore
Grade Targetgrade
Student 1444, M 57.40 7.90 A* A*/A
Student 0246, F 56.98 7.83 A* A*/A
Student 0172, M 56.86 7.81 A A*/A
Student 1124, F 56.26 7.71 A A*/A
Student 1055, F 55.72 7.62 A* A*/A
Student 0608, F 54.40 7.40 A* A
Student 1286, M 54.40 7.40 C A
Student 1023, F 54.10 7.35 B A
Student 0634, F 53.80 7.30 C A
Student 0683, M 53.74 7.29 A* A
Student 0750, M 53.62 7.27 C A
Student 0464, F 53.14 7.19 A* A
Student 0080, F 52.24 7.04 C A
Student 0100, M 52.00 7.00 D A
Student 0632, M 52.00 7.00 C A
Student 0907, F 51.46 6.91 B B
Student 0850, F 51.22 6.87 A B
Student 1533, M 50.80 6.80 C B
Student 1244, F 50.68 6.78 C B
Student 0513, M 50.44 6.74 C B
Student 1200, F 50.38 6.73 A B
Student 0411, M 49.42 6.57 A B
Student 0657, M 49.36 6.56 D B
Student 1589, F 48.88 6.48 B B
Student 0474, M 48.64 6.44 D B
Student 1397, F 48.40 6.40 B B
Student 0306, M 47.98 6.33 B B/C
Student 1723, F 47.44 6.24 C B/C
Student 0225, F 47.32 6.22 B B/C
Student 0402, M 46.90 6.15 C B/C
Student 0037, F 46.78 6.13 E B/C
Student 0342, F 46.78 6.13 C B/C
Student 0039, F 46.00 6.00 A B/C
Student 0595, M 46.00 6.00 A B/C
Student 0952, F 45.70 5.95 B B/C
Student 1683, F 45.70 5.95 A B/C
Student 0312, F 44.74 5.79 B C
Student 0591, F 44.74 5.79 A C
Student 0346, F 44.68 5.78 A C
Student 1395, F 44.68 5.78 A C
Student 1334, F 44.08 5.68 B C
Student 0772, F 44.02 5.67 B C
Student 1163, F 43.54 5.59 B C
Student 1488, M 43.36 5.56 B C
Student 1613, F 41.98 5.33 A C
Student 0963, M 41.02 5.17 B C/D
Student 0701, F 39.70 4.95 C C/D
Student 1688, M 32.98 3.83 C C/D
Student 1091, M - - A -

A level A
lps report 2016 ©A
lkemygold Ltd
Subject page 23w
ww
.alps-va.co.uk
Single Subject Report - A - Mathematics (Further)Alps Example Sixth Form | 2015/16 | A level | Report no: 1 | 19.08.16
The symbol (†) denotes that the performances in 2012/13 are being compared to the previous benchmark andthe symbol (*) denotes that performances in 2013/14 to 2015/16 are being compared to the current benchmark.
Expected UCAS points
GCSE Band QCA Band Students × Target = Total exp
7.5 - 8.0 55.0 - 58.0 2 × 125.17 = 250.34
7.0 -< 7.5 52.0 -< 55.0 2 × 112.47 = 224.94
6.7 -< 7.0 50.2 -< 52.0 0 × 104.58 = 0.00
6.4 -< 6.7 48.4 -< 50.2 0 × 97.73 = 0.00
6.1 -< 6.4 46.6 -< 48.4 1 × 92.50 = 92.50
5.8 -< 6.1 44.8 -< 46.6 0 × 86.79 = 0.00
5.5 -< 5.8 43.0 -< 44.8 2 × 82.61 = 165.22
5.2 -< 5.5 41.2 -< 43.0 0 × 78.33 = 0.00
4.7 -< 5.2 38.2 -< 41.2 0 × 74.17 = 0.00
4.0 -< 4.7 34.0 -< 38.2 0 × 70.00 = 0.00
0.0 -< 4.0 10.0 -< 34.0 0 × 68.89 = 0.00
Students = 7 Expected UCAS points total = 733.00
A level grades and Total actual UCAS points
Students A* A B C D E U X Q A*-E% A*-C% A*-B% Avg GCSE Avg QCA
7 2 3 2 0 0 0 0 0 0 100.0% 100.0% 100.0% 6.79 50.75
UCAS pts ×140 ×120 ×100 ×80 ×60 ×40 ×0 ×0 ×0
Act pts 280 360 200 0 0 0 0 0 0
Total actual = 840
Subject VA score = 1 +Actual - Expected
Students × 100=
840 - 733.00
7 × 100+ 1 = 1.15 grade 2
2012/13†
2013/14*
2014/15*
2015/16*
Students Score Grade Students Score Grade Students Score Grade Students Score Grade
3 0.33 9 1 0.95 6 9 1.15 2 7 1.15 2
1100% 1.24
290% 1.11
375% 1.05
460% 1.02
540% 0.97
625% 0.92
710% 0.84
8bottom 0.52
9
ð
Student Avg QCAscore
AvgGCSEscore
Grade Targetgrade
Student 1444, M 57.40 7.90 A* A*/A
Student 1055, F 55.72 7.62 A A*/A
Student 0464, F 53.14 7.19 A A
Student 0080, F 52.24 7.04 A* A
Student 0306, M 47.98 6.33 B B/C
Student 0346, F 44.68 5.78 A C
Student 1334, F 44.08 5.68 B C
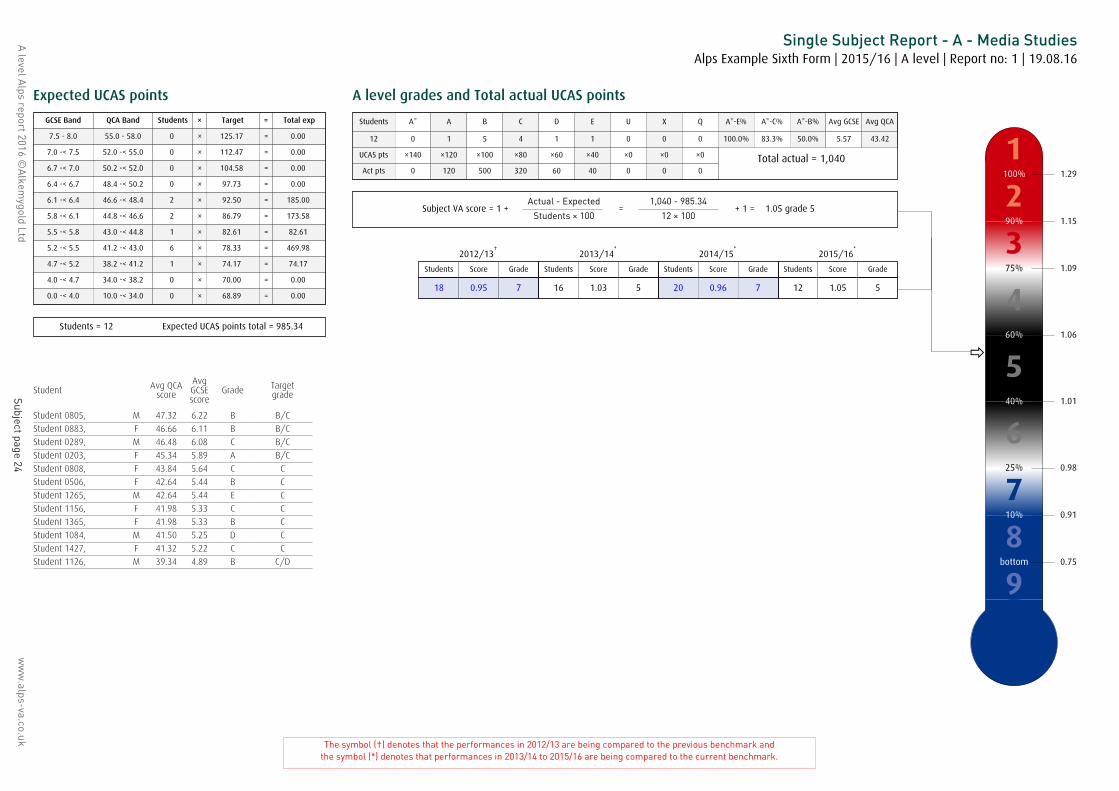
A level A
lps report 2016 ©A
lkemygold Ltd
Subject page 24w
ww
.alps-va.co.uk
Single Subject Report - A - Media StudiesAlps Example Sixth Form | 2015/16 | A level | Report no: 1 | 19.08.16
The symbol (†) denotes that the performances in 2012/13 are being compared to the previous benchmark andthe symbol (*) denotes that performances in 2013/14 to 2015/16 are being compared to the current benchmark.
Expected UCAS points
GCSE Band QCA Band Students × Target = Total exp
7.5 - 8.0 55.0 - 58.0 0 × 125.17 = 0.00
7.0 -< 7.5 52.0 -< 55.0 0 × 112.47 = 0.00
6.7 -< 7.0 50.2 -< 52.0 0 × 104.58 = 0.00
6.4 -< 6.7 48.4 -< 50.2 0 × 97.73 = 0.00
6.1 -< 6.4 46.6 -< 48.4 2 × 92.50 = 185.00
5.8 -< 6.1 44.8 -< 46.6 2 × 86.79 = 173.58
5.5 -< 5.8 43.0 -< 44.8 1 × 82.61 = 82.61
5.2 -< 5.5 41.2 -< 43.0 6 × 78.33 = 469.98
4.7 -< 5.2 38.2 -< 41.2 1 × 74.17 = 74.17
4.0 -< 4.7 34.0 -< 38.2 0 × 70.00 = 0.00
0.0 -< 4.0 10.0 -< 34.0 0 × 68.89 = 0.00
Students = 12 Expected UCAS points total = 985.34
A level grades and Total actual UCAS points
Students A* A B C D E U X Q A*-E% A*-C% A*-B% Avg GCSE Avg QCA
12 0 1 5 4 1 1 0 0 0 100.0% 83.3% 50.0% 5.57 43.42
UCAS pts ×140 ×120 ×100 ×80 ×60 ×40 ×0 ×0 ×0
Act pts 0 120 500 320 60 40 0 0 0
Total actual = 1,040
Subject VA score = 1 +Actual - Expected
Students × 100=
1,040 - 985.34
12 × 100+ 1 = 1.05 grade 5
2012/13†
2013/14*
2014/15*
2015/16*
Students Score Grade Students Score Grade Students Score Grade Students Score Grade
18 0.95 7 16 1.03 5 20 0.96 7 12 1.05 5
1100% 1.29
290% 1.15
375% 1.09
460% 1.06
540% 1.01
625% 0.98
710% 0.91
8bottom 0.75
9
ð
Student Avg QCAscore
AvgGCSEscore
Grade Targetgrade
Student 0805, M 47.32 6.22 B B/C
Student 0883, F 46.66 6.11 B B/C
Student 0289, M 46.48 6.08 C B/C
Student 0203, F 45.34 5.89 A B/C
Student 0808, F 43.84 5.64 C C
Student 0506, F 42.64 5.44 B C
Student 1265, M 42.64 5.44 E C
Student 1156, F 41.98 5.33 C C
Student 1365, F 41.98 5.33 B C
Student 1084, M 41.50 5.25 D C
Student 1427, F 41.32 5.22 C C
Student 1126, M 39.34 4.89 B C/D

A level A
lps report 2016 ©A
lkemygold Ltd
Subject page 25w
ww
.alps-va.co.uk
Single Subject Report - A - Physical EducationAlps Example Sixth Form | 2015/16 | A level | Report no: 1 | 19.08.16
The symbol (†) denotes that the performances in 2012/13 are being compared to the previous benchmark andthe symbol (*) denotes that performances in 2013/14 to 2015/16 are being compared to the current benchmark.
Expected UCAS points
GCSE Band QCA Band Students × Target = Total exp
7.5 - 8.0 55.0 - 58.0 0 × 125.17 = 0.00
7.0 -< 7.5 52.0 -< 55.0 1 × 112.47 = 112.47
6.7 -< 7.0 50.2 -< 52.0 1 × 104.58 = 104.58
6.4 -< 6.7 48.4 -< 50.2 0 × 97.73 = 0.00
6.1 -< 6.4 46.6 -< 48.4 1 × 92.50 = 92.50
5.8 -< 6.1 44.8 -< 46.6 6 × 86.79 = 520.74
5.5 -< 5.8 43.0 -< 44.8 1 × 82.61 = 82.61
5.2 -< 5.5 41.2 -< 43.0 1 × 78.33 = 78.33
4.7 -< 5.2 38.2 -< 41.2 0 × 74.17 = 0.00
4.0 -< 4.7 34.0 -< 38.2 0 × 70.00 = 0.00
0.0 -< 4.0 10.0 -< 34.0 0 × 68.89 = 0.00
Students = 11 Expected UCAS points total = 991.23
A level grades and Total actual UCAS points
Students A* A B C D E U X Q A*-E% A*-C% A*-B% Avg GCSE Avg QCA
11 2 3 4 1 1 0 0 0 0 100.0% 90.9% 81.8% 6.07 46.42
UCAS pts ×140 ×120 ×100 ×80 ×60 ×40 ×0 ×0 ×0
Act pts 280 360 400 80 60 0 0 0 0
Total actual = 1,180
Subject VA score = 1 +Actual - Expected
Students × 100=
1,180 - 991.23
11 × 100+ 1 = 1.17 grade 2
2012/13†
2013/14*
2014/15*
2015/16*
Students Score Grade Students Score Grade Students Score Grade Students Score Grade
25 1.02 3 17 0.94 4 17 1.01 3 11 1.17 2
1100% 1.20
290% 1.06
375% 0.97
460% 0.93
540% 0.87
625% 0.83
710% 0.76
8bottom 0.48
9
ð
Student Avg QCAscore
AvgGCSEscore
Grade Targetgrade
Student 0632, M 52.00 7.00 A A
Student 0907, F 51.46 6.91 A* B
Student 0958, F 47.20 6.20 C B/C
Student 1454, M 46.30 6.05 B B/C
Student 1076, M 46.00 6.00 A B/C
Student 1111, F 45.76 5.96 A B/C
Student 1683, F 45.70 5.95 B B/C
Student 0231, F 44.98 5.83 A* B/C
Student 1281, F 44.98 5.83 B B/C
Student 1488, M 43.36 5.56 B C
Student 0761, F 42.88 5.48 D C

A level A
lps report 2016 ©A
lkemygold Ltd
Subject page 26w
ww
.alps-va.co.uk
Single Subject Report - A - PhysicsAlps Example Sixth Form | 2015/16 | A level | Report no: 1 | 19.08.16
The symbol (†) denotes that the performances in 2012/13 are being compared to the previous benchmark andthe symbol (*) denotes that performances in 2013/14 to 2015/16 are being compared to the current benchmark.
Expected UCAS points
GCSE Band QCA Band Students × Target = Total exp
7.5 - 8.0 55.0 - 58.0 1 × 125.17 = 125.17
7.0 -< 7.5 52.0 -< 55.0 4 × 112.47 = 449.88
6.7 -< 7.0 50.2 -< 52.0 1 × 104.58 = 104.58
6.4 -< 6.7 48.4 -< 50.2 1 × 97.73 = 97.73
6.1 -< 6.4 46.6 -< 48.4 2 × 92.50 = 185.00
5.8 -< 6.1 44.8 -< 46.6 5 × 86.79 = 433.95
5.5 -< 5.8 43.0 -< 44.8 2 × 82.61 = 165.22
5.2 -< 5.5 41.2 -< 43.0 0 × 78.33 = 0.00
4.7 -< 5.2 38.2 -< 41.2 0 × 74.17 = 0.00
4.0 -< 4.7 34.0 -< 38.2 0 × 70.00 = 0.00
0.0 -< 4.0 10.0 -< 34.0 0 × 68.89 = 0.00
Students = 16 Expected UCAS points total = 1,561.53
A level grades and Total actual UCAS points
Students A* A B C D E U X Q A*-E% A*-C% A*-B% Avg GCSE Avg QCA
16 2 5 4 1 2 1 1 0 0 93.8% 75.0% 68.8% 6.47 48.79
UCAS pts ×140 ×120 ×100 ×80 ×60 ×40 ×0 ×0 ×0
Act pts 280 600 400 80 120 40 0 0 0
Total actual = 1,520
Subject VA score = 1 +Actual - Expected
Students × 100=
1,520 - 1,561.53
16 × 100+ 1 = 0.97 grade 3
2012/13†
2013/14*
2014/15*
2015/16*
Students Score Grade Students Score Grade Students Score Grade Students Score Grade
14 0.71 7 15 0.78 7 25 0.95 3 16 0.97 3
1100% 1.08
290% 0.98
375% 0.93
460% 0.89
540% 0.84
625% 0.80
710% 0.73
8bottom 0.55
9
ð
Student Avg QCAscore
AvgGCSEscore
Grade Targetgrade
Student 1055, F 55.72 7.62 A* A*/A
Student 1023, F 54.10 7.35 A A
Student 0634, F 53.80 7.30 A A
Student 0464, F 53.14 7.19 A* A
Student 0080, F 52.24 7.04 A A
Student 1533, M 50.80 6.80 B B
Student 0657, M 49.36 6.56 A B
Student 0306, M 47.98 6.33 B B/C
Student 0402, M 46.90 6.15 U B/C
Student 0039, F 46.00 6.00 D B/C
Student 1076, M 46.00 6.00 B B/C
Student 0952, F 45.70 5.95 B B/C
Student 1683, F 45.70 5.95 A B/C
Student 1240, F 45.64 5.94 D B/C
Student 1334, F 44.08 5.68 C C
Student 1163, F 43.54 5.59 E C

A level A
lps report 2016 ©A
lkemygold Ltd
Subject page 27w
ww
.alps-va.co.uk
Single Subject Report - A - PsychologyAlps Example Sixth Form | 2015/16 | A level | Report no: 1 | 19.08.16
The symbol (†) denotes that the performances in 2012/13 are being compared to the previous benchmark andthe symbol (*) denotes that performances in 2013/14 to 2015/16 are being compared to the current benchmark.
Expected UCAS points
GCSE Band QCA Band Students × Target = Total exp
7.5 - 8.0 55.0 - 58.0 1 × 125.17 = 125.17
7.0 -< 7.5 52.0 -< 55.0 2 × 112.47 = 224.94
6.7 -< 7.0 50.2 -< 52.0 8 × 104.58 = 836.64
6.4 -< 6.7 48.4 -< 50.2 5 × 97.73 = 488.65
6.1 -< 6.4 46.6 -< 48.4 6 × 92.50 = 555.00
5.8 -< 6.1 44.8 -< 46.6 7 × 86.79 = 607.53
5.5 -< 5.8 43.0 -< 44.8 8 × 82.61 = 660.88
5.2 -< 5.5 41.2 -< 43.0 7 × 78.33 = 548.31
4.7 -< 5.2 38.2 -< 41.2 5 × 74.17 = 370.85
4.0 -< 4.7 34.0 -< 38.2 1 × 70.00 = 70.00
0.0 -< 4.0 10.0 -< 34.0 0 × 68.89 = 0.00
Students = 50 Expected UCAS points total = 4,487.97
A level grades and Total actual UCAS points
Students A* A B C D E U X Q A*-E% A*-C% A*-B% Avg GCSE Avg QCA
50 2 7 11 16 8 4 2 0 0 96.0% 72.0% 40.0% 6.00 45.97
UCAS pts ×140 ×120 ×100 ×80 ×60 ×40 ×0 ×0 ×0
Act pts 280 840 1,100 1,280 480 160 0 0 0
Total actual = 4,140
Subject VA score = 1 +Actual - Expected
Students × 100=
4,140 - 4,487.97
50 × 100+ 1 = 0.93 grade 5
2012/13†
2013/14*
2014/15*
2015/16*
Students Score Grade Students Score Grade Students Score Grade Students Score Grade
42 0.90 6 37 0.92 5 50 1.02 3 50 0.93 5
1100% 1.14
290% 1.03
375% 0.98
460% 0.94
540% 0.90
625% 0.86
710% 0.79
8bottom 0.63
9
ð
Student Avg QCAscore
AvgGCSEscore
Grade Targetgrade
Student 0993, M 55.36 7.56 A* A*/A
Student 0076, F 53.32 7.22 A A
Student 1702, M 52.00 7.00 B A
Student 0244, F 51.40 6.90 D B
Student 1346, M 50.80 6.80 B B
Student 0325, M 50.68 6.78 B B
Student 1586, M 50.68 6.78 C B
Student 0513, M 50.44 6.74 B B
Student 0377, F 50.38 6.73 B B
Student 0310, M 50.20 6.70 B B
Student 0419, F 50.20 6.70 A B
Student 1456, M 50.02 6.67 B B
Student 1635, F 49.84 6.64 B B
Student 1418, F 49.78 6.63 B B
Student 1226, F 49.36 6.56 C B
Student 0063, F 49.12 6.52 C B
Student 0394, M 47.68 6.28 A B/C
Student 0225, F 47.32 6.22 D B/C
Student 0958, F 47.20 6.20 B B/C
Student 0510, M 46.66 6.11 D B/C
Student 0883, F 46.66 6.11 C B/C
Student 0258, F 46.60 6.10 C B/C
Student 0415, F 46.54 6.09 A* B/C
Student 0654, M 46.54 6.09 B B/C
Student 0671, F 46.00 6.00 E B/C
Student 0942, F 45.40 5.90 C B/C
Student 0118, M 45.34 5.89 C B/C
Student 0082, F 44.98 5.83 C B/C
Student 0231, F 44.98 5.83 C B/C
Student 0591, F 44.74 5.79 U C
Student 1276, M 44.02 5.67 D C
Student 1348, M 44.02 5.67 D C
Student 0096, F 43.60 5.60 C C
Student 1163, F 43.54 5.59 C C
Student 1008, M 43.36 5.56 C C
Student 1639, M 43.36 5.56 U C
Student 0502, F 43.00 5.50 A C
Student 0424, F 42.64 5.44 E C
Student 0506, F 42.64 5.44 C C
Student 0928, F 42.64 5.44 A C
Student 1416, M 42.64 5.44 C C
Student 1559, F 42.64 5.44 E C
Student 0164, F 41.98 5.33 C C
Student 0817, F 41.32 5.22 A C
Student 0896, M 40.66 5.11 D C/D
Student 1150, M 40.00 5.00 D C/D
Student 1381, M 40.00 5.00 E C/D
Student 1126, M 39.34 4.89 A C/D
Student 0240, M 38.98 4.83 C C/D
Student 0223, M 38.02 4.67 D C/D

A level A
lps report 2016 ©A
lkemygold Ltd
Subject page 28w
ww
.alps-va.co.uk
Single Subject Report - A - Religious StudiesAlps Example Sixth Form | 2015/16 | A level | Report no: 1 | 19.08.16
The symbol (†) denotes that the performances in 2012/13 are being compared to the previous benchmark andthe symbol (*) denotes that performances in 2013/14 to 2015/16 are being compared to the current benchmark.
Expected UCAS points
GCSE Band QCA Band Students × Target = Total exp
7.5 - 8.0 55.0 - 58.0 0 × 125.17 = 0.00
7.0 -< 7.5 52.0 -< 55.0 2 × 112.47 = 224.94
6.7 -< 7.0 50.2 -< 52.0 2 × 104.58 = 209.16
6.4 -< 6.7 48.4 -< 50.2 0 × 97.73 = 0.00
6.1 -< 6.4 46.6 -< 48.4 0 × 92.50 = 0.00
5.8 -< 6.1 44.8 -< 46.6 2 × 86.79 = 173.58
5.5 -< 5.8 43.0 -< 44.8 4 × 82.61 = 330.44
5.2 -< 5.5 41.2 -< 43.0 2 × 78.33 = 156.66
4.7 -< 5.2 38.2 -< 41.2 2 × 74.17 = 148.34
4.0 -< 4.7 34.0 -< 38.2 0 × 70.00 = 0.00
0.0 -< 4.0 10.0 -< 34.0 0 × 68.89 = 0.00
Students = 14 Expected UCAS points total = 1,243.12
A level grades and Total actual UCAS points
Students A* A B C D E U X Q A*-E% A*-C% A*-B% Avg GCSE Avg QCA
14 0 3 2 2 3 2 2 0 0 85.7% 50.0% 35.7% 5.90 45.38
UCAS pts ×140 ×120 ×100 ×80 ×60 ×40 ×0 ×0 ×0
Act pts 0 360 200 160 180 80 0 0 0
Total actual = 980
Subject VA score = 1 +Actual - Expected
Students × 100=
980 - 1,243.12
14 × 100+ 1 = 0.81 grade 8
2012/13†
2013/14*
2014/15*
2015/16*
Students Score Grade Students Score Grade Students Score Grade Students Score Grade
4 0.81 8 11 0.86 7 12 0.94 6 14 0.81 8
1100% 1.20
290% 1.09
375% 1.04
460% 1.01
540% 0.96
625% 0.92
710% 0.85
8bottom 0.73
9
ð
Student Avg QCAscore
AvgGCSEscore
Grade Targetgrade
Student 0413, F 52.60 7.10 D A
Student 1702, M 52.00 7.00 B A
Student 0244, F 51.40 6.90 A B
Student 0156, M 51.16 6.86 A B
Student 0796, F 45.40 5.90 D B/C
Student 1116, M 45.34 5.89 C B/C
Student 1348, M 44.02 5.67 A C
Student 0471, M 43.36 5.56 U C
Student 0826, M 43.36 5.56 E C
Student 1639, M 43.36 5.56 B C
Student 0926, M 42.64 5.44 D C
Student 0088, F 41.98 5.33 C C
Student 1519, F 40.00 5.00 E C/D
Student 0714, F 38.68 4.78 U C/D
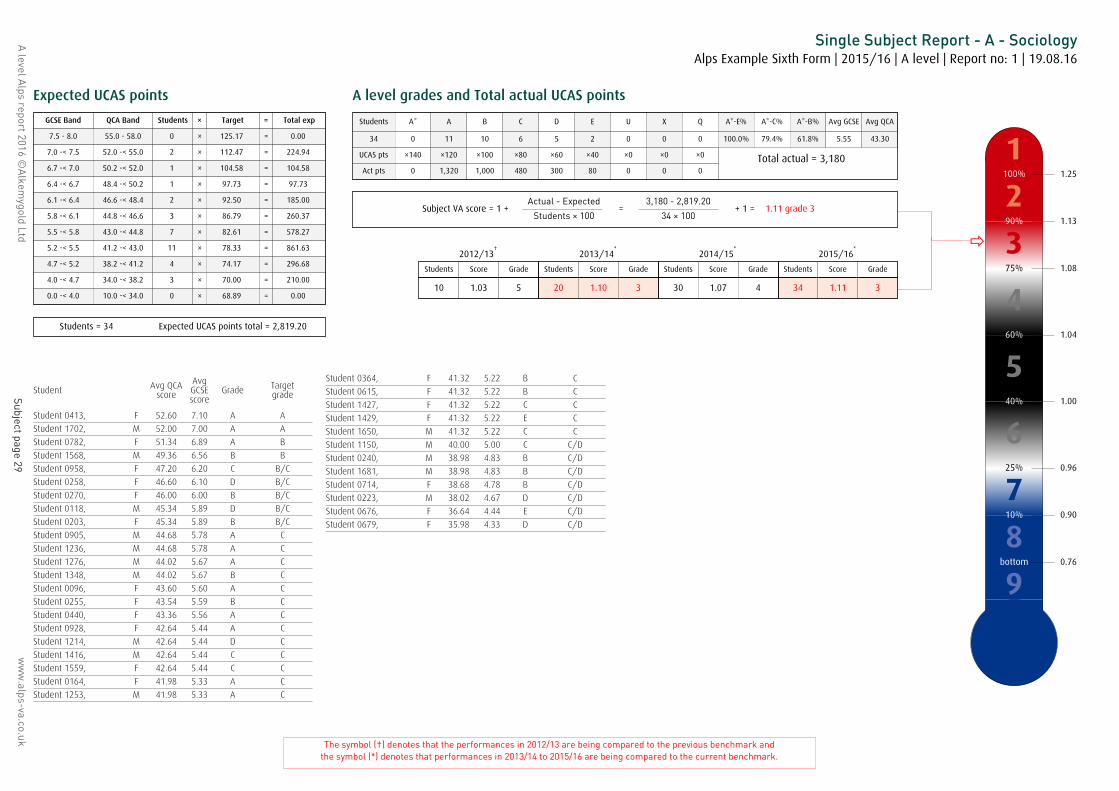
A level A
lps report 2016 ©A
lkemygold Ltd
Subject page 29w
ww
.alps-va.co.uk
Single Subject Report - A - SociologyAlps Example Sixth Form | 2015/16 | A level | Report no: 1 | 19.08.16
The symbol (†) denotes that the performances in 2012/13 are being compared to the previous benchmark andthe symbol (*) denotes that performances in 2013/14 to 2015/16 are being compared to the current benchmark.
Expected UCAS points
GCSE Band QCA Band Students × Target = Total exp
7.5 - 8.0 55.0 - 58.0 0 × 125.17 = 0.00
7.0 -< 7.5 52.0 -< 55.0 2 × 112.47 = 224.94
6.7 -< 7.0 50.2 -< 52.0 1 × 104.58 = 104.58
6.4 -< 6.7 48.4 -< 50.2 1 × 97.73 = 97.73
6.1 -< 6.4 46.6 -< 48.4 2 × 92.50 = 185.00
5.8 -< 6.1 44.8 -< 46.6 3 × 86.79 = 260.37
5.5 -< 5.8 43.0 -< 44.8 7 × 82.61 = 578.27
5.2 -< 5.5 41.2 -< 43.0 11 × 78.33 = 861.63
4.7 -< 5.2 38.2 -< 41.2 4 × 74.17 = 296.68
4.0 -< 4.7 34.0 -< 38.2 3 × 70.00 = 210.00
0.0 -< 4.0 10.0 -< 34.0 0 × 68.89 = 0.00
Students = 34 Expected UCAS points total = 2,819.20
A level grades and Total actual UCAS points
Students A* A B C D E U X Q A*-E% A*-C% A*-B% Avg GCSE Avg QCA
34 0 11 10 6 5 2 0 0 0 100.0% 79.4% 61.8% 5.55 43.30
UCAS pts ×140 ×120 ×100 ×80 ×60 ×40 ×0 ×0 ×0
Act pts 0 1,320 1,000 480 300 80 0 0 0
Total actual = 3,180
Subject VA score = 1 +Actual - Expected
Students × 100=
3,180 - 2,819.20
34 × 100+ 1 = 1.11 grade 3
2012/13†
2013/14*
2014/15*
2015/16*
Students Score Grade Students Score Grade Students Score Grade Students Score Grade
10 1.03 5 20 1.10 3 30 1.07 4 34 1.11 3
1100% 1.25
290% 1.13
375% 1.08
460% 1.04
540% 1.00
625% 0.96
710% 0.90
8bottom 0.76
9
ð
Student Avg QCAscore
AvgGCSEscore
Grade Targetgrade
Student 0413, F 52.60 7.10 A A
Student 1702, M 52.00 7.00 A A
Student 0782, F 51.34 6.89 A B
Student 1568, M 49.36 6.56 B B
Student 0958, F 47.20 6.20 C B/C
Student 0258, F 46.60 6.10 D B/C
Student 0270, F 46.00 6.00 B B/C
Student 0118, M 45.34 5.89 D B/C
Student 0203, F 45.34 5.89 B B/C
Student 0905, M 44.68 5.78 A C
Student 1236, M 44.68 5.78 A C
Student 1276, M 44.02 5.67 A C
Student 1348, M 44.02 5.67 B C
Student 0096, F 43.60 5.60 A C
Student 0255, F 43.54 5.59 B C
Student 0440, F 43.36 5.56 A C
Student 0928, F 42.64 5.44 A C
Student 1214, M 42.64 5.44 D C
Student 1416, M 42.64 5.44 C C
Student 1559, F 42.64 5.44 C C
Student 0164, F 41.98 5.33 A C
Student 1253, M 41.98 5.33 A C
Student 0364, F 41.32 5.22 B C
Student 0615, F 41.32 5.22 B C
Student 1427, F 41.32 5.22 C C
Student 1429, F 41.32 5.22 E C
Student 1650, M 41.32 5.22 C C
Student 1150, M 40.00 5.00 C C/D
Student 0240, M 38.98 4.83 B C/D
Student 1681, M 38.98 4.83 B C/D
Student 0714, F 38.68 4.78 B C/D
Student 0223, M 38.02 4.67 D C/D
Student 0676, F 36.64 4.44 E C/D
Student 0679, F 35.98 4.33 D C/D
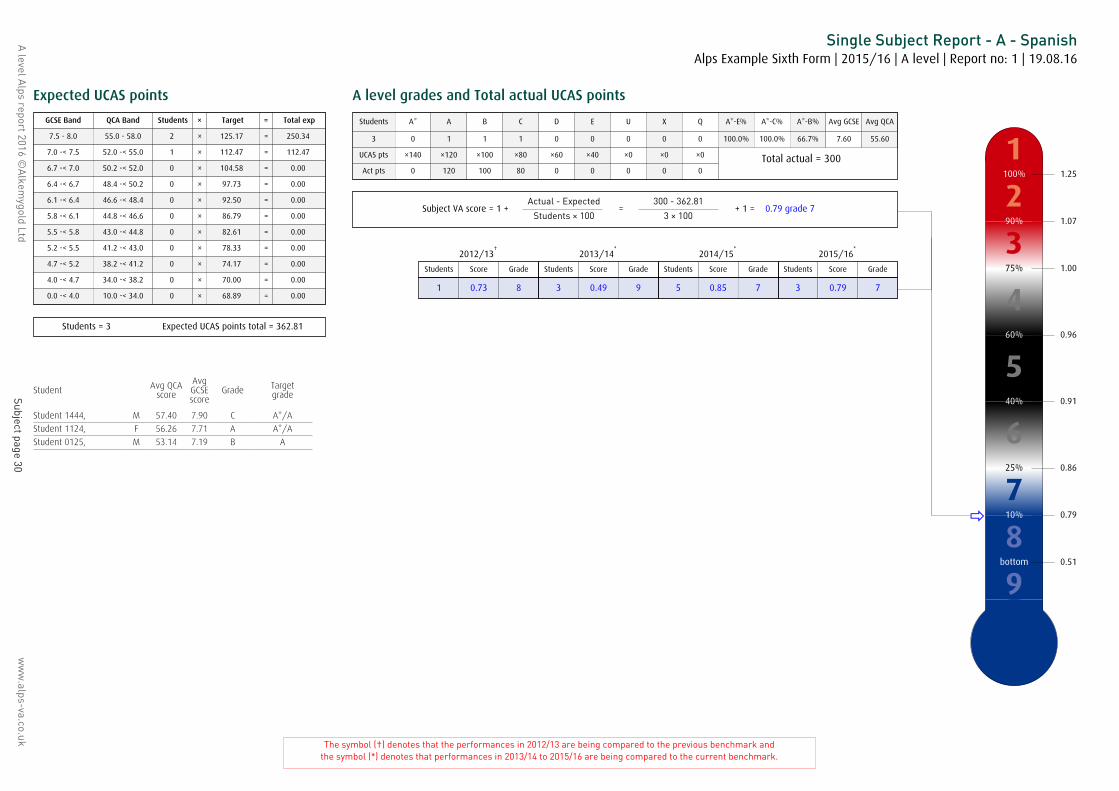
A level A
lps report 2016 ©A
lkemygold Ltd
Subject page 30w
ww
.alps-va.co.uk
Single Subject Report - A - SpanishAlps Example Sixth Form | 2015/16 | A level | Report no: 1 | 19.08.16
The symbol (†) denotes that the performances in 2012/13 are being compared to the previous benchmark andthe symbol (*) denotes that performances in 2013/14 to 2015/16 are being compared to the current benchmark.
Expected UCAS points
GCSE Band QCA Band Students × Target = Total exp
7.5 - 8.0 55.0 - 58.0 2 × 125.17 = 250.34
7.0 -< 7.5 52.0 -< 55.0 1 × 112.47 = 112.47
6.7 -< 7.0 50.2 -< 52.0 0 × 104.58 = 0.00
6.4 -< 6.7 48.4 -< 50.2 0 × 97.73 = 0.00
6.1 -< 6.4 46.6 -< 48.4 0 × 92.50 = 0.00
5.8 -< 6.1 44.8 -< 46.6 0 × 86.79 = 0.00
5.5 -< 5.8 43.0 -< 44.8 0 × 82.61 = 0.00
5.2 -< 5.5 41.2 -< 43.0 0 × 78.33 = 0.00
4.7 -< 5.2 38.2 -< 41.2 0 × 74.17 = 0.00
4.0 -< 4.7 34.0 -< 38.2 0 × 70.00 = 0.00
0.0 -< 4.0 10.0 -< 34.0 0 × 68.89 = 0.00
Students = 3 Expected UCAS points total = 362.81
A level grades and Total actual UCAS points
Students A* A B C D E U X Q A*-E% A*-C% A*-B% Avg GCSE Avg QCA
3 0 1 1 1 0 0 0 0 0 100.0% 100.0% 66.7% 7.60 55.60
UCAS pts ×140 ×120 ×100 ×80 ×60 ×40 ×0 ×0 ×0
Act pts 0 120 100 80 0 0 0 0 0
Total actual = 300
Subject VA score = 1 +Actual - Expected
Students × 100=
300 - 362.81
3 × 100+ 1 = 0.79 grade 7
2012/13†
2013/14*
2014/15*
2015/16*
Students Score Grade Students Score Grade Students Score Grade Students Score Grade
1 0.73 8 3 0.49 9 5 0.85 7 3 0.79 7
1100% 1.25
290% 1.07
375% 1.00
460% 0.96
540% 0.91
625% 0.86
710% 0.79
8bottom 0.51
9
ð
Student Avg QCAscore
AvgGCSEscore
Grade Targetgrade
Student 1444, M 57.40 7.90 C A*/A
Student 1124, F 56.26 7.71 A A*/A
Student 0125, M 53.14 7.19 B A

A level A
lps report 2016 ©A
lkemygold Ltd
Subject page 31w
ww
.alps-va.co.uk
Single Subject Report - A - Travel & Tourism - Double AwardAlps Example Sixth Form | 2015/16 | A level | Report no: 1 | 19.08.16
The symbol (†) denotes that the performances in 2012/13 are being compared to the previous benchmark andthe symbol (*) denotes that performances in 2013/14 to 2015/16 are being compared to the current benchmark.
Expected UCAS points
GCSE Band QCA Band Students × Target = Total exp
7.5 - 8.0 55.0 - 58.0 0 × 250.34 = 0.00
7.0 -< 7.5 52.0 -< 55.0 0 × 224.94 = 0.00
6.7 -< 7.0 50.2 -< 52.0 0 × 209.16 = 0.00
6.4 -< 6.7 48.4 -< 50.2 0 × 195.46 = 0.00
6.1 -< 6.4 46.6 -< 48.4 0 × 185.00 = 0.00
5.8 -< 6.1 44.8 -< 46.6 0 × 173.58 = 0.00
5.5 -< 5.8 43.0 -< 44.8 0 × 165.22 = 0.00
5.2 -< 5.5 41.2 -< 43.0 1 × 156.66 = 156.66
4.7 -< 5.2 38.2 -< 41.2 1 × 148.34 = 148.34
4.0 -< 4.7 34.0 -< 38.2 0 × 140.00 = 0.00
0.0 -< 4.0 10.0 -< 34.0 0 × 137.78 = 0.00
Students = 2 Expected UCAS points total = 305.00
A level grades and Total actual UCAS points
Students A*A* A*A AA AB BB BC CC CD DD DE EE U X Q A*A*-EE% A*A*-CC% A*A*-BB% Avg GCSE Avg QCA
2 0 0 0 0 1 0 0 0 1 0 0 0 0 0 100.0% 50.0% 50.0% 5.17 40.99
UCAS pts ×280 ×260 ×240 ×220 ×200 ×180 ×160 ×140 ×120 ×100 ×80 ×0 ×0 ×0
Act pts 0 0 0 0 200 0 0 0 120 0 0 0 0 0
Total actual = 320
Subject VA score = 1 +Actual - Expected
Students × 200=
320 - 305.00
2 × 200+ 1 = 1.04 grade 6
2012/13†
2013/14*
2014/15*
2015/16*
Students Score Grade Students Score Grade Students Score Grade Students Score Grade
1 0.73 8 2 1.00 8 2 1.25 2 2 1.04 6
1100% 1.34
290% 1.23
375% 1.13
460% 1.11
540% 1.07
625% 1.03
710% 1.01
8bottom 0.82
9
ð
Student Avg QCAscore
AvgGCSEscore
Grade Targetgrade
Student 1301, M 41.98 5.33 BB CC
Student 1519, F 40.00 5.00 DD CD
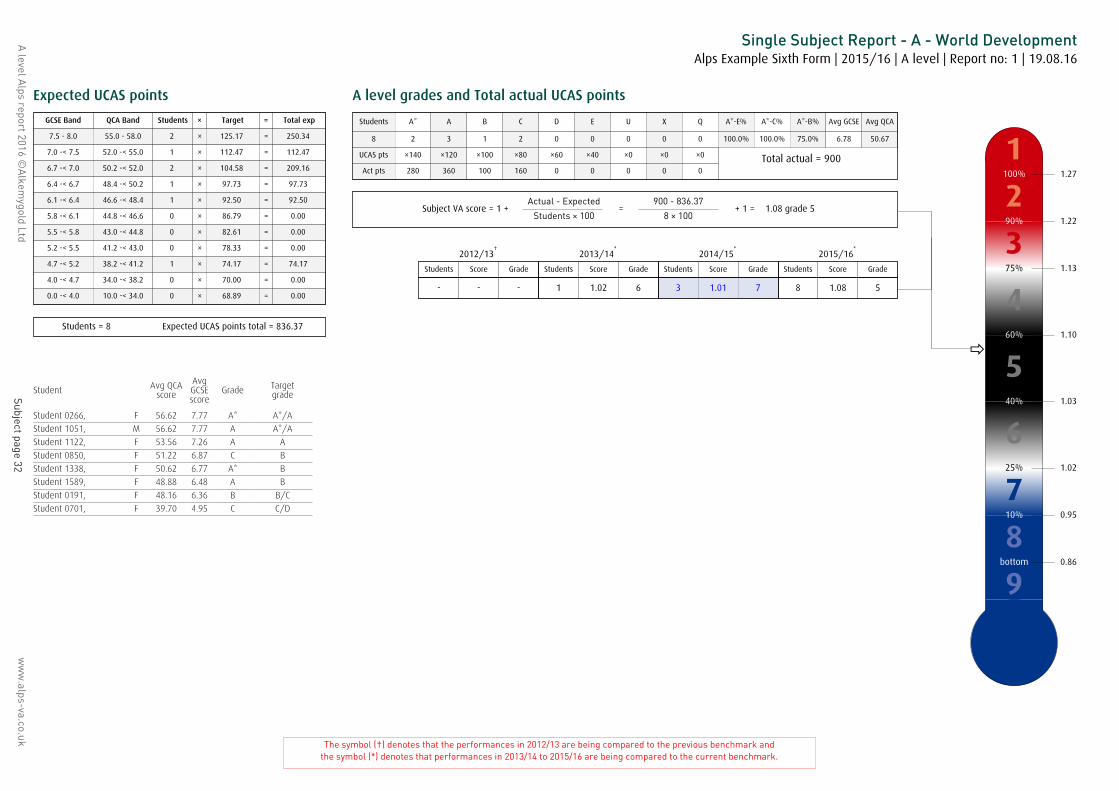
A level A
lps report 2016 ©A
lkemygold Ltd
Subject page 32w
ww
.alps-va.co.uk
Single Subject Report - A - World DevelopmentAlps Example Sixth Form | 2015/16 | A level | Report no: 1 | 19.08.16
The symbol (†) denotes that the performances in 2012/13 are being compared to the previous benchmark andthe symbol (*) denotes that performances in 2013/14 to 2015/16 are being compared to the current benchmark.
Expected UCAS points
GCSE Band QCA Band Students × Target = Total exp
7.5 - 8.0 55.0 - 58.0 2 × 125.17 = 250.34
7.0 -< 7.5 52.0 -< 55.0 1 × 112.47 = 112.47
6.7 -< 7.0 50.2 -< 52.0 2 × 104.58 = 209.16
6.4 -< 6.7 48.4 -< 50.2 1 × 97.73 = 97.73
6.1 -< 6.4 46.6 -< 48.4 1 × 92.50 = 92.50
5.8 -< 6.1 44.8 -< 46.6 0 × 86.79 = 0.00
5.5 -< 5.8 43.0 -< 44.8 0 × 82.61 = 0.00
5.2 -< 5.5 41.2 -< 43.0 0 × 78.33 = 0.00
4.7 -< 5.2 38.2 -< 41.2 1 × 74.17 = 74.17
4.0 -< 4.7 34.0 -< 38.2 0 × 70.00 = 0.00
0.0 -< 4.0 10.0 -< 34.0 0 × 68.89 = 0.00
Students = 8 Expected UCAS points total = 836.37
A level grades and Total actual UCAS points
Students A* A B C D E U X Q A*-E% A*-C% A*-B% Avg GCSE Avg QCA
8 2 3 1 2 0 0 0 0 0 100.0% 100.0% 75.0% 6.78 50.67
UCAS pts ×140 ×120 ×100 ×80 ×60 ×40 ×0 ×0 ×0
Act pts 280 360 100 160 0 0 0 0 0
Total actual = 900
Subject VA score = 1 +Actual - Expected
Students × 100=
900 - 836.37
8 × 100+ 1 = 1.08 grade 5
2012/13†
2013/14*
2014/15*
2015/16*
Students Score Grade Students Score Grade Students Score Grade Students Score Grade
- - - 1 1.02 6 3 1.01 7 8 1.08 5
1100% 1.27
290% 1.22
375% 1.13
460% 1.10
540% 1.03
625% 1.02
710% 0.95
8bottom 0.86
9
ð
Student Avg QCAscore
AvgGCSEscore
Grade Targetgrade
Student 0266, F 56.62 7.77 A* A*/A
Student 1051, M 56.62 7.77 A A*/A
Student 1122, F 53.56 7.26 A A
Student 0850, F 51.22 6.87 C B
Student 1338, F 50.62 6.77 A* B
Student 1589, F 48.88 6.48 A B
Student 0191, F 48.16 6.36 B B/C
Student 0701, F 39.70 4.95 C C/D

A level A
lps report 2016 ©A
lkemygold Ltd
Subject page 33w
ww
.alps-va.co.uk
Single Subject Report - EPQ - Extended ProjectAlps Example Sixth Form | 2015/16 | A level | Report no: 1 | 19.08.16
The symbol (†) denotes that the performances in 2012/13 are being compared to the previous benchmark andthe symbol (*) denotes that performances in 2013/14 to 2015/16 are being compared to the current benchmark.
Expected UCAS points
GCSE Band QCA Band Students × Target = Total exp
7.5 - 8.0 55.0 - 58.0 4 × 57.14 = 228.56
7.0 -< 7.5 52.0 -< 55.0 0 × 52.00 = 0.00
6.7 -< 7.0 50.2 -< 52.0 4 × 47.50 = 190.00
6.4 -< 6.7 48.4 -< 50.2 1 × 44.00 = 44.00
6.1 -< 6.4 46.6 -< 48.4 0 × 40.00 = 0.00
5.8 -< 6.1 44.8 -< 46.6 0 × 36.28 = 0.00
5.5 -< 5.8 43.0 -< 44.8 4 × 33.19 = 132.76
5.2 -< 5.5 41.2 -< 43.0 3 × 30.00 = 90.00
4.7 -< 5.2 38.2 -< 41.2 0 × 26.83 = 0.00
4.0 -< 4.7 34.0 -< 38.2 0 × 23.92 = 0.00
0.0 -< 4.0 10.0 -< 34.0 0 × 25.79 = 0.00
Students = 16 Expected UCAS points total = 685.32
A level grades and Total actual UCAS points
Students A* A B C D E U X Q A*-E% A*-C% A*-B% Avg GCSE Avg QCA
16 0 5 3 4 3 0 1 0 0 93.8% 75.0% 50.0% 6.44 48.66
UCAS pts ×60 ×60 ×50 ×40 ×30 ×20 ×0 ×0 ×0
Act pts 0 300 150 160 90 0 0 0 0
Total actual = 700
Subject VA score = 1 +Actual - Expected
Students × 50=
700 - 685.32
16 × 50+ 1 = 1.02 grade 5
2012/13†
2013/14*
2014/15*
2015/16*
Students Score Grade Students Score Grade Students Score Grade Students Score Grade
- - - - - - 19 0.89 7 16 1.02 5
1100% 1.35
290% 1.17
375% 1.10
460% 1.05
540% 0.98
625% 0.91
710% 0.78
8bottom 0.49
9
ðStudent Avg QCA
score
AvgGCSEscore
Grade Targetgrade
Student 1444, M 57.40 7.90 A A
Student 0246, F 56.98 7.83 A A
Student 0172, M 56.86 7.81 A A
Student 1124, F 56.26 7.71 A A
Student 1533, M 50.80 6.80 A B
Student 0325, M 50.68 6.78 B B
Student 1623, M 50.68 6.78 D B
Student 0453, M 50.20 6.70 U B
Student 1468, M 48.64 6.44 C B/C
Student 1348, M 44.02 5.67 B D
Student 0471, M 43.36 5.56 D D
Student 0826, M 43.36 5.56 D D
Student 1008, M 43.36 5.56 C D
Student 1416, M 42.64 5.44 B D
Student 0088, F 41.98 5.33 C D
Student 0364, F 41.32 5.22 C D

A level Alps report 2016 ©Alkemygold Ltd www.alps-va.co.uk
Student performanceoverview & progression
Part 1: Student performance overview -
The Student Performance Overview shows how each studentperformed in each course they took against the Alps minimum
expected grades
Part 2: Progression
A list of students who completed 2 or more AS levels last yearwho did not go on to complete 2 or more A levels in this year
Student performance page 1
Alps Alps - Alkemygold Ltd, Kevin Conway House
Longbow Close, Huddersfield HD2 1GQ01484 887600 | [email protected] | www.alps-va.co.uk
KS5
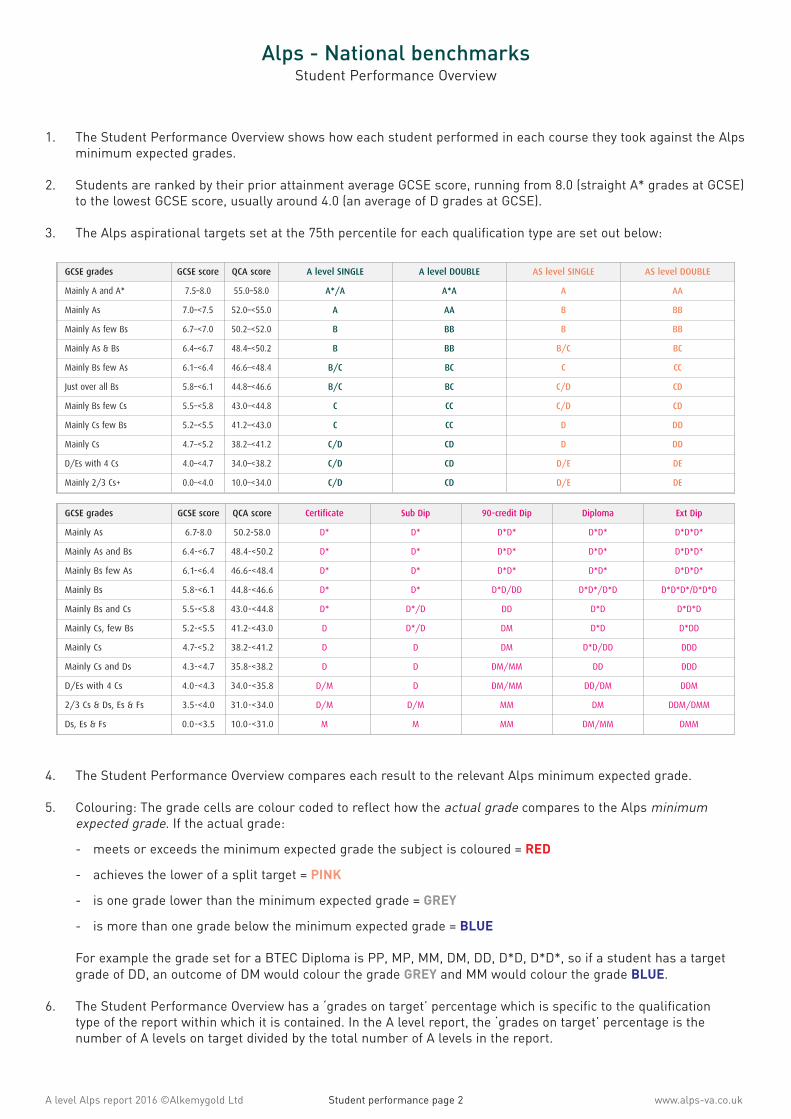
A level Alps report 2016 ©Alkemygold Ltd www.alps-va.co.ukStudent performance page 2
Alps - National benchmarksStudent Performance Overview
1. The Student Performance Overview shows how each student performed in each course they took against the Alpsminimum expected grades.
2. Students are ranked by their prior attainment average GCSE score, running from 8.0 (straight A* grades at GCSE)to the lowest GCSE score, usually around 4.0 (an average of D grades at GCSE).
3. The Alps aspirational targets set at the 75th percentile for each qualification type are set out below:
4. The Student Performance Overview compares each result to the relevant Alps minimum expected grade.
5. Colouring: The grade cells are colour coded to reflect how the actual grade compares to the Alps minimumexpected grade. If the actual grade:
- meets or exceeds the minimum expected grade the subject is coloured = RED
- achieves the lower of a split target = PINK
- is one grade lower than the minimum expected grade = GREY
- is more than one grade below the minimum expected grade = BLUE
For example the grade set for a BTEC Diploma is PP, MP, MM, DM, DD, D*D, D*D*, so if a student has a targetgrade of DD, an outcome of DM would colour the grade GREY and MM would colour the grade BLUE.
6. The Student Performance Overview has a ‘grades on target’ percentage which is specific to the qualification type of the report within which it is contained. In the A level report, the ‘grades on target’ percentage is the
number of A levels on target divided by the total number of A levels in the report.
GCSE grades GCSE score QCA score A level SINGLE A level DOUBLE AS level SINGLE AS level DOUBLE
Mainly A and A* 7.5 –8.0 55.0 –58.0 A*/A A*A A AA
Mainly As 7.0 –<7.5 52.0 –<55.0 A AA B BB
Mainly As few Bs 6.7–<7.0 50.2 –<52.0 B BB B BB
Mainly As & Bs 6.4 –<6.7 48.4–<50.2 B BB B/C BC
Mainly Bs few As 6.1 –<6.4 46.6 –<48.4 B/C BC C CC
Just over all Bs 5.8 –<6.1 44.8–<46.6 B/C BC C/D CD
Mainly Bs few Cs 5.5 –<5.8 43.0 –<44.8 C CC C/D CD
Mainly Cs few Bs 5.2–<5.5 41.2 –<43.0 C CC D DD
Mainly Cs 4.7 –<5.2 38.2 –<41.2 C/D CD D DD
D/Es with 4 Cs 4.0 –<4.7 34.0 –<38.2 C/D CD D/E DE
Mainly 2/3 Cs+ 0.0 –<4.0 10.0 –<34.0 C/D CD D/E DE
GCSE grades GCSE score QCA score Certificate Sub Dip 90-credit Dip Diploma Ext Dip
Mainly As 6.7-8.0 50.2-58.0 D* D* D*D* D*D* D*D*D*
Mainly As and Bs 6.4-<6.7 48.4-<50.2 D* D* D*D* D*D* D*D*D*
Mainly Bs few As 6.1-<6.4 46.6-<48.4 D* D* D*D* D*D* D*D*D*
Mainly Bs 5.8-<6.1 44.8-<46.6 D* D* D*D/DD D*D*/D*D D*D*D*/D*D*D
Mainly Bs and Cs 5.5-<5.8 43.0-<44.8 D* D*/D DD D*D D*D*D
Mainly Cs, few Bs 5.2-<5.5 41.2-<43.0 D D*/D DM D*D D*DD
Mainly Cs 4.7-<5.2 38.2-<41.2 D D DM D*D/DD DDD
Mainly Cs and Ds 4.3-<4.7 35.8-<38.2 D D DM/MM DD DDD
D/Es with 4 Cs 4.0-<4.3 34.0-<35.8 D/M D DM/MM DD/DM DDM
2/3 Cs & Ds, Es & Fs 3.5-<4.0 31.0-<34.0 D/M D/M MM DM DDM/DMM
Ds, Es & Fs 0.0-<3.5 10.0-<31.0 M M MM DM/MM DMM

A level Alps report 2016 ©Alkemygold Ltd www.alps-va.co.ukStudent performance page 3
7. Calculation of the ‘grades on target’ percentages: Each subject is given a weighting for this percentage.In practice, the weighting approximates to a block of timetable time. We have represented this visually,so an A level, AS and BTEC Subsidiary Diploma and BTEC Certificate will occupy one column while a doubleA, AS, BTEC Diploma and 90-credit Diploma will occupy two columns in an A level report. In addition:
• The IFS and CACHE (certificate and diploma) will be treated as one subject
• EPQ and general studies will be coloured but not included in the ‘grades on target’ calculation
8. There is no measurement of breadth of programme in the Student Performance Overview.
9. We have benchmarked the ‘grades on target’ percentage for A level, AS level and BTEC, using the full nationaldataset. The benchmark grade relates to the report’s qualification type, for example an AS report will benchmarkthe number of AS subjects that are on or above target in the national dataset for AS levels. The threebenchmarks are shown below:
91.1%
77.8%
72.8%
69.4%
64.7%
60.2%
52.8%
27.9%
100%
90%
75%
60%
40%
25%
10%
Bottom
1 2
3
7 8
9
4
5
6
AS level gradeson target
92.4%
77.1%
72.3%
69.0%
65.0%
61.3%
54.2%
32.0%
100%
90%
75%
60%
40%
25%
10%
Bottom
1 2
3
7 8
9
4
5
6
A level gradeson target
100.0%
88.3%
77.3%
68.6%
56.5%
44.7%
31.4%
0.0%
100%
90%
75%
60%
40%
25%
10%
Bottom
1 2
3
7 8
9
4
5
6
BTEC gradeson target

A level Alps report 2016 ©Alkemygold Ltd www.alps-va.co.ukStudent performance page 4
Student performanceoverview & progression
Part 1: Student performance overview -
The Student Performance Overview shows how each studentperformed in each course they took against the Alps minimum
expected grades
A level Alps report 2016 ©Alkemygold Ltd www.alps-va.co.ukStudent performance page 5
Alps Alps - Alkemygold Ltd, Kevin Conway House
Longbow Close, Huddersfield HD2 1GQ01484 887600 | [email protected] | www.alps-va.co.uk
KS5

A level Alps report 2016 ©Alkemygold Ltd Student performance page 6 www.alps-va.co.uk
Alps A level - Student Performance OverviewAlps Example Sixth Form
2015/16 | A level | Report no: 1 | 19.08.16
A levels on target % 75.1%
A levels on target grade 3
On or abovetarget
Lower of splitgrade targets
Below targetby 1 grade
Below targetby 1+ grades
Percentage of A levels 63.1% 12.0% 16.1% 8.8%
A level Target Grade A*/A (see description pages for targets of other qualifications)
Name M/F GCSE QCA Subject 1 Subject 2 Subject 3 Subject 4
1 Student 1444, M 7.90 57.40 A - French A A - Mathematics A* A - Maths (Further) A* A - Spanish C
EPQ - Extended Project A
2 Student 0246, F 7.83 56.98 A - Art & Design D A - Chemistry A* A - Mathematics A* EPQ - Extended Project A
3 Student 0172, M 7.81 56.86 A - Biology C A - Chemistry A A - Mathematics A EPQ - Extended Project A
4 Student 0266, F 7.77 56.62 A - General Studies B A - World Development A* AS - Biology A AS - Chemistry B
AS - Mathematics A AS - Physics A
5 Student 1051, M 7.77 56.62 A - General Studies A A - World Development A AS - Chemistry B AS - Mathematics A
AS - Maths (Further) A AS - Physics A
6 Student 1124, F 7.71 56.26 A - English Literature A A - History A* A - Mathematics A A - Spanish A
EPQ - Extended Project A
7 Student 1055, F 7.62 55.72 A - Computing A* A - General Studies B A - Mathematics A* A - Maths (Further) A
A - Physics A*
8 Student 0993, M 7.56 55.36 A - Economics A* A - History A A - Psychology A*
9 Student 0102, F 7.50 55.00 A - Biology A A - Chemistry A A - Classical Civilisation A A - General Studies B
A level Target Grade A (see description pages for targets of other qualifications)
Name M/F GCSE QCA Subject 1 Subject 2 Subject 3 Subject 4
10 Student 0253, M 7.44 54.64 A - Biology C A - English Literature A A - History A
11 Student 0344, F 7.40 54.40 A - Classical Civilisation A A - Drama & Theatre Studies B A - English Language A A - English Literature A*
A - General Studies B
12 Student 0608, F 7.40 54.40 A - D&T (Product Design) A A - English Literature B A - Mathematics A* AS - Art & Design A
13 Student 1286, M 7.40 54.40 A - D&T (Product Design) A A - Geography B A - Mathematics C
14 Student 1705, F 7.40 54.40 A - D&T (Product Design) A A - English Literature B A - History B
15 Student 1023, F 7.35 54.10 A - Biology B A - D&T (Product Design) A A - Mathematics B A - Physics A
AS - Chemistry A
16 Student 0634, F 7.30 53.80 A - Biology A A - Chemistry A A - Mathematics C A - Physics A
17 Student 0683, M 7.29 53.74 A - Chemistry A A - General Studies B A - Geography A A - Mathematics A*
18 Student 0750, M 7.27 53.62 A - Biology A A - History A* A - Mathematics C
19 Student 1122, F 7.26 53.56 A - World Development A AS - Chemistry C AS - Geography B AS - Mathematics B
AS - Physics B
20 Student 0076, F 7.22 53.32 A - Drama & Theatre Studies C A - French C A - General Studies D A - Psychology A
21 Student 0498, M 7.20 53.20 A - D&T (Product Design) B A - Drama & Theatre Studies B A - English Language B
22 Student 0125, M 7.19 53.14 A - English Language A A - French B A - General Studies C A - Spanish B
23 Student 0464, F 7.19 53.14 A - Chemistry A A - Mathematics A* A - Maths (Further) A A - Physics A*
24 Student 0413, F 7.10 52.60 A - Biology C A - General Studies D A - Religious Studies D A - Sociology A
25 Student 0080, F 7.04 52.24 A - Computing A A - Mathematics C A - Maths (Further) A* A - Physics A
26 Student 0100, M 7.00 52.00 A - Business Studies C A - English Literature C A - General Studies C A - Mathematics D
27 Student 0632, M 7.00 52.00 A - Art & Design A A - D&T (Product Design) A A - Mathematics C A - Physical Education A
28 Student 1702, M 7.00 52.00 A - General Studies C A - Psychology B A - Religious Studies B A - Sociology A
A level Target Grade B (see description pages for targets of other qualifications)
Name M/F GCSE QCA Subject 1 Subject 2 Subject 3 Subject 4
29 Student 1632, F 6.92 51.52 A - Biology C A - Chemistry B A - History B
30 Student 0907, F 6.91 51.46 A - Business Studies A A - General Studies B A - Mathematics B A - Physical Education A*
31 Student 0244, F 6.90 51.40 A - English Literature A A - History B A - Psychology D A - Religious Studies A
32 Student 0782, F 6.89 51.34 A - Art & Design A A - D&T (Product Design) A A - English Language B A - General Studies C
A - Sociology A
33 Student 0850, F 6.87 51.22 A - Chemistry A A - English Language A A - Mathematics A A - World Development C
34 Student 0156, M 6.86 51.16 A - English Language B A - French A A - General Studies A A - Geography A
A - Religious Studies A
35 Student 1346, M 6.80 50.80 A - English Literature B A - Psychology B AS - History A AS - Sociology A
36 Student 1533, M 6.80 50.80 A - Biology B A - Chemistry B A - Mathematics C A - Physics B

A level Alps report 2016 ©Alkemygold Ltd Student performance page 7 www.alps-va.co.uk
Alps A level - Student Performance OverviewAlps Example Sixth Form
2015/16 | A level | Report no: 1 | 19.08.16
A levels on target % 75.1%
A levels on target grade 3
On or abovetarget
Lower of splitgrade targets
Below targetby 1 grade
Below targetby 1+ grades
Percentage of A levels 63.1% 12.0% 16.1% 8.8%
A level Target Grade B (see description pages for targets of other qualifications)
EPQ - Extended Project A
37 Student 0325, M 6.78 50.68 A - Business Studies B A - English Language A A - Geography A* A - Psychology B
EPQ - Extended Project B
38 Student 1244, F 6.78 50.68 A - English Language A A - English Literature C A - Mathematics C AS - Business Studies A
39 Student 1586, M 6.78 50.68 A - D&T (Product Design) B A - Law C A - Psychology C
40 Student 1623, M 6.78 50.68 A - Art & Design B A - D&T (Product Design) A A - ICT B EPQ - Extended Project D
41 Student 1338, F 6.77 50.62 A - Chemistry A* A - English Language A A - Geography A* A - World Development A*
42 Student 0681, F 6.76 50.56 A - Art & Design A A - Geography B A - History B
43 Student 0513, M 6.74 50.44 A - Mathematics C A - Psychology B
44 Student 0377, F 6.73 50.38 A - Business Studies B A - English Language B A - Psychology B
45 Student 1200, F 6.73 50.38 A - Biology D A - Chemistry A A - General Studies C A - Mathematics A
46 Student 1107, F 6.71 50.26 A - Art & Design B A - English Literature A A - General Studies D A - History A
47 Student 0310, M 6.70 50.20 A - English Literature B A - General Studies B A - History C A - Psychology B
48 Student 0419, F 6.70 50.20 A - Economics B A - General Studies A A - History B A - Psychology A
49 Student 0453, M 6.70 50.20 A - Biology U A - D&T (Product Design) A A - General Studies C EPQ - Extended Project U
50 Student 0228, M 6.67 50.02 A - Drama & Theatre Studies B A - English Language B A - English Literature A AS - General Studies C
51 Student 1047, M 6.67 50.02 A - Art & Design A A - English Literature B A - French B A - History B
52 Student 1456, M 6.67 50.02 A - D&T (Product Design) A A - General Studies C A - Law A A - Psychology B
53 Student 1635, F 6.64 49.84 A - English Language A A - General Studies A A - History A A - Psychology B
54 Student 1418, F 6.63 49.78 A - Art & Design B A - ICT B A - Psychology B
55 Student 0411, M 6.57 49.42 A - Biology B A - Chemistry B A - General Studies D A - Mathematics A
56 Student 0657, M 6.56 49.36 A - Chemistry C A - Geography B A - Mathematics D A - Physics A
57 Student 0832, F 6.56 49.36 A - Art & Design B A - History C A - ICT C
58 Student 1226, F 6.56 49.36 A - Art & Design B A - D&T (Product Design) A A - Psychology C
59 Student 1568, M 6.56 49.36 A - Business Studies C A - English Literature D A - General Studies C A - Sociology B
60 Student 0063, F 6.52 49.12 A - Biology C A - General Studies A A - Psychology C
61 Student 1589, F 6.48 48.88 A - Geography A A - History C A - Mathematics B A - World Development A
62 Student 0474, M 6.44 48.64 A - Home Economics D A - Mathematics D AS - Biology D AS - Chemistry E
63 Student 1468, M 6.44 48.64 A - D&T (Product Design) B A - Geography C AS - Mathematics D AS - Sociology D
EPQ - Extended Project C
64 Student 1659, M 6.44 48.64 A - Drama & Theatre Studies B A - English Language C A - English Literature B
65 Student 0123, F 6.43 48.58 A - Applied ICT - S B A - Biology D A - General Studies C
66 Student 1397, F 6.40 48.40 A - Biology D A - D&T (Product Design) B A - General Studies D A - Mathematics B
A level Target Grade B/C (see description pages for targets of other qualifications)
Name M/F GCSE QCA Subject 1 Subject 2 Subject 3 Subject 4
67 Student 1146, M 6.39 48.34 A - Business Studies D A - D&T (Product Design) A A - French D A - General Studies D
68 Student 0191, F 6.36 48.16 A - World Development B AS - Biology C AS - Geography B AS - Mathematics C
AS - Physical Education A
69 Student 0158, M 6.35 48.10 A - English Literature D A - General Studies A A - Government & Politics A A - History B
70 Student 0306, M 6.33 47.98 A - Mathematics B A - Maths (Further) B A - Physics B
71 Student 0238, F 6.30 47.80 A - Art & Design C AS - Mathematics A
72 Student 1421, M 6.30 47.80 A - Art & Design B A - General Studies C
73 Student 1464, F 6.30 47.80 A - Business Studies C A - Economics A A - History A
74 Student 0394, M 6.28 47.68 A - Drama & Theatre Studies A A - English Literature A A - Psychology A
75 Student 0985, F 6.24 47.44 A - Biology B A - Computing B A - General Studies C A - History C
76 Student 1723, F 6.24 47.44 A - General Studies B A - History C A - Mathematics C AS - English Language D
77 Student 0225, F 6.22 47.32 A - Art & Design A* A - Mathematics B A - Psychology D
78 Student 0805, M 6.22 47.32 A - English Literature C A - History D A - Media Studies B AS - Art & Design B
79 Student 0958, F 6.20 47.20 A - Physical Education C A - Psychology B A - Sociology C
80 Student 0698, M 6.18 47.08 A - English Language B A - Film Studies A A - General Studies B
81 Student 0784, M 6.17 47.02 A - English Language D A - Geography A A - History A
82 Student 0402, M 6.15 46.90 A - Art & Design C A - General Studies C A - Mathematics C A - Physics U
83 Student 0037, F 6.13 46.78 A - Business Studies D A - General Studies D A - History C A - Mathematics E
84 Student 0342, F 6.13 46.78 A - ICT B A - Mathematics C AS - History A AS - Sociology C
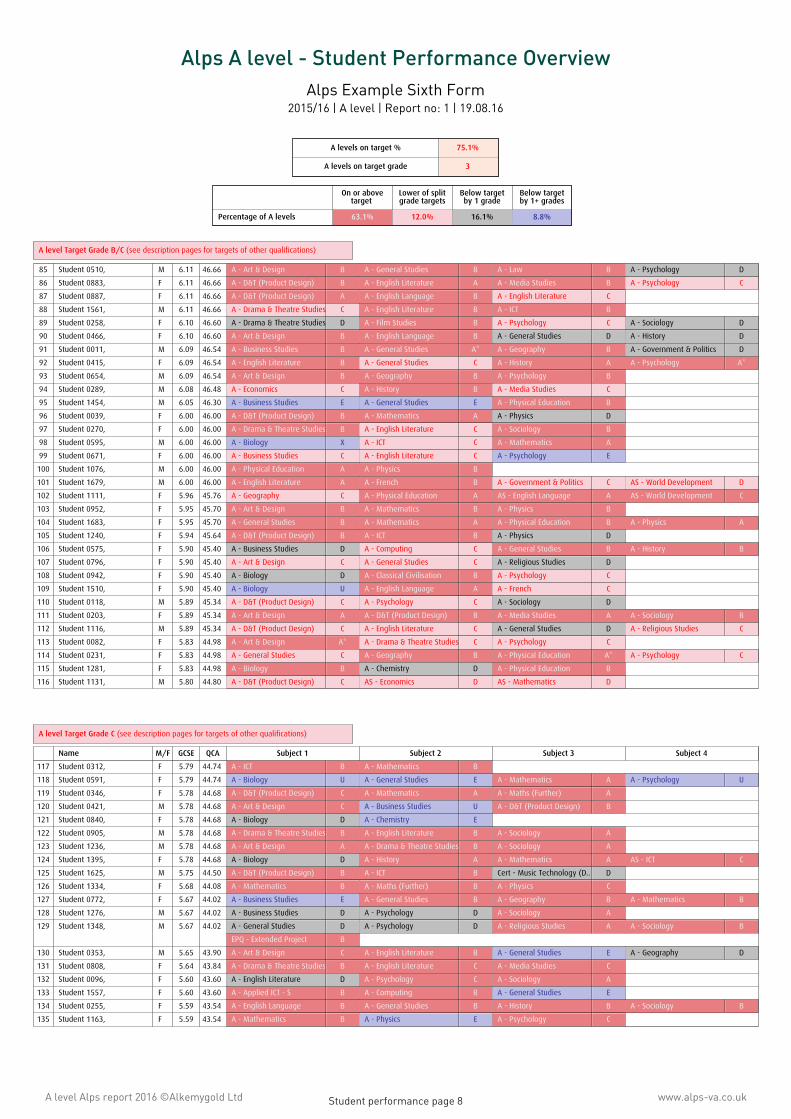
A level Alps report 2016 ©Alkemygold Ltd Student performance page 8 www.alps-va.co.uk
Alps A level - Student Performance OverviewAlps Example Sixth Form
2015/16 | A level | Report no: 1 | 19.08.16
A levels on target % 75.1%
A levels on target grade 3
On or abovetarget
Lower of splitgrade targets
Below targetby 1 grade
Below targetby 1+ grades
Percentage of A levels 63.1% 12.0% 16.1% 8.8%
A level Target Grade B/C (see description pages for targets of other qualifications)
85 Student 0510, M 6.11 46.66 A - Art & Design B A - General Studies B A - Law B A - Psychology D
86 Student 0883, F 6.11 46.66 A - D&T (Product Design) B A - English Literature A A - Media Studies B A - Psychology C
87 Student 0887, F 6.11 46.66 A - D&T (Product Design) A A - English Language B A - English Literature C
88 Student 1561, M 6.11 46.66 A - Drama & Theatre Studies C A - English Literature B A - ICT B
89 Student 0258, F 6.10 46.60 A - Drama & Theatre Studies D A - Film Studies B A - Psychology C A - Sociology D
90 Student 0466, F 6.10 46.60 A - Art & Design B A - English Language B A - General Studies D A - History D
91 Student 0011, M 6.09 46.54 A - Business Studies B A - General Studies A* A - Geography B A - Government & Politics D
92 Student 0415, F 6.09 46.54 A - English Literature B A - General Studies C A - History A A - Psychology A*
93 Student 0654, M 6.09 46.54 A - Art & Design B A - Geography B A - Psychology B
94 Student 0289, M 6.08 46.48 A - Economics C A - History B A - Media Studies C
95 Student 1454, M 6.05 46.30 A - Business Studies E A - General Studies E A - Physical Education B
96 Student 0039, F 6.00 46.00 A - D&T (Product Design) B A - Mathematics A A - Physics D
97 Student 0270, F 6.00 46.00 A - Drama & Theatre Studies B A - English Literature C A - Sociology B
98 Student 0595, M 6.00 46.00 A - Biology X A - ICT C A - Mathematics A
99 Student 0671, F 6.00 46.00 A - Business Studies C A - English Literature C A - Psychology E
100 Student 1076, M 6.00 46.00 A - Physical Education A A - Physics B
101 Student 1679, M 6.00 46.00 A - English Literature A A - French B A - Government & Politics C AS - World Development D
102 Student 1111, F 5.96 45.76 A - Geography C A - Physical Education A AS - English Language A AS - World Development C
103 Student 0952, F 5.95 45.70 A - Art & Design B A - Mathematics B A - Physics B
104 Student 1683, F 5.95 45.70 A - General Studies B A - Mathematics A A - Physical Education B A - Physics A
105 Student 1240, F 5.94 45.64 A - D&T (Product Design) B A - ICT B A - Physics D
106 Student 0575, F 5.90 45.40 A - Business Studies D A - Computing C A - General Studies B A - History B
107 Student 0796, F 5.90 45.40 A - Art & Design C A - General Studies C A - Religious Studies D
108 Student 0942, F 5.90 45.40 A - Biology D A - Classical Civilisation B A - Psychology C
109 Student 1510, F 5.90 45.40 A - Biology U A - English Language A A - French C
110 Student 0118, M 5.89 45.34 A - D&T (Product Design) C A - Psychology C A - Sociology D
111 Student 0203, F 5.89 45.34 A - Art & Design A A - D&T (Product Design) B A - Media Studies A A - Sociology B
112 Student 1116, M 5.89 45.34 A - D&T (Product Design) C A - English Literature C A - General Studies D A - Religious Studies C
113 Student 0082, F 5.83 44.98 A - Art & Design A* A - Drama & Theatre Studies C A - Psychology C
114 Student 0231, F 5.83 44.98 A - General Studies C A - Geography B A - Physical Education A* A - Psychology C
115 Student 1281, F 5.83 44.98 A - Biology B A - Chemistry D A - Physical Education B
116 Student 1131, M 5.80 44.80 A - D&T (Product Design) C AS - Economics D AS - Mathematics D
A level Target Grade C (see description pages for targets of other qualifications)
Name M/F GCSE QCA Subject 1 Subject 2 Subject 3 Subject 4
117 Student 0312, F 5.79 44.74 A - ICT B A - Mathematics B
118 Student 0591, F 5.79 44.74 A - Biology U A - General Studies E A - Mathematics A A - Psychology U
119 Student 0346, F 5.78 44.68 A - D&T (Product Design) C A - Mathematics A A - Maths (Further) A
120 Student 0421, M 5.78 44.68 A - Art & Design C A - Business Studies U A - D&T (Product Design) B
121 Student 0840, F 5.78 44.68 A - Biology D A - Chemistry E
122 Student 0905, M 5.78 44.68 A - Drama & Theatre Studies B A - English Literature B A - Sociology A
123 Student 1236, M 5.78 44.68 A - Art & Design A A - Drama & Theatre Studies B A - Sociology A
124 Student 1395, F 5.78 44.68 A - Biology D A - History A A - Mathematics A AS - ICT C
125 Student 1625, M 5.75 44.50 A - D&T (Product Design) B A - ICT B Cert - Music Technology (D.. D
126 Student 1334, F 5.68 44.08 A - Mathematics B A - Maths (Further) B A - Physics C
127 Student 0772, F 5.67 44.02 A - Business Studies E A - General Studies B A - Geography B A - Mathematics B
128 Student 1276, M 5.67 44.02 A - Business Studies D A - Psychology D A - Sociology A
129 Student 1348, M 5.67 44.02 A - General Studies D A - Psychology D A - Religious Studies A A - Sociology B
EPQ - Extended Project B
130 Student 0353, M 5.65 43.90 A - Art & Design C A - English Literature B A - General Studies E A - Geography D
131 Student 0808, F 5.64 43.84 A - Drama & Theatre Studies B A - English Literature C A - Media Studies C
132 Student 0096, F 5.60 43.60 A - English Literature D A - Psychology C A - Sociology A
133 Student 1557, F 5.60 43.60 A - Applied ICT - S B A - Computing B A - General Studies E
134 Student 0255, F 5.59 43.54 A - English Language B A - General Studies B A - History B A - Sociology B
135 Student 1163, F 5.59 43.54 A - Mathematics B A - Physics E A - Psychology C

A level Alps report 2016 ©Alkemygold Ltd Student performance page 9 www.alps-va.co.uk
Alps A level - Student Performance OverviewAlps Example Sixth Form
2015/16 | A level | Report no: 1 | 19.08.16
A levels on target % 75.1%
A levels on target grade 3
On or abovetarget
Lower of splitgrade targets
Below targetby 1 grade
Below targetby 1+ grades
Percentage of A levels 63.1% 12.0% 16.1% 8.8%
A level Target Grade C (see description pages for targets of other qualifications)
136 Student 0440, F 5.56 43.36 A - English Literature C A - Law A A - Sociology A AS - English Language B
137 Student 0471, M 5.56 43.36 A - D&T (Product Design) C A - English Language C A - Religious Studies U EPQ - Extended Project D
138 Student 0826, M 5.56 43.36 A - D&T (Product Design) C A - English Literature C A - General Studies C A - Religious Studies E
EPQ - Extended Project D
139 Student 1008, M 5.56 43.36 A - Classical Civilisation B A - English Literature B A - General Studies B A - Psychology C
EPQ - Extended Project C
140 Student 1488, M 5.56 43.36 A - Economics A A - Mathematics B A - Physical Education B
141 Student 1639, M 5.56 43.36 A - English Language A A - Psychology U A - Religious Studies B
142 Student 0502, F 5.50 43.00 A - English Literature B A - Psychology A
143 Student 0874, F 5.50 43.00 A - English Language A A - English Literature A A - General Studies B A - History C
144 Student 0761, F 5.48 42.88 A - Business Studies D A - French D A - General Studies U A - Physical Education D
145 Student 0424, F 5.44 42.64 A - Economics D A - ICT C A - Psychology E
146 Student 0506, F 5.44 42.64 A - General Studies B A - ICT C A - Media Studies B A - Psychology C
147 Student 0926, M 5.44 42.64 A - Law C A - Religious Studies D AS - Sociology D
148 Student 0928, F 5.44 42.64 A - General Studies D A - Psychology A A - Sociology A AS - D&T (Product Design) A
AS - Film Studies B
149 Student 1214, M 5.44 42.64 A - Art & Design A* A - Sociology D
150 Student 1265, M 5.44 42.64 A - Business Studies B A - Media Studies E
151 Student 1416, M 5.44 42.64 A - English Language C A - Psychology C A - Sociology C EPQ - Extended Project B
152 Student 1541, M 5.44 42.64 A - D&T (Product Design) C A - Film Studies B A - History D
153 Student 1559, F 5.44 42.64 A - English Language D A - Psychology E A - Sociology C
154 Student 0368, M 5.40 42.40 A - Drama & Theatre Studies B A - English Literature B A - Film Studies D A - General Studies B
155 Student 0737, F 5.39 42.34 A - D&T (Product Design) C A - History D
156 Student 0868, F 5.38 42.28 A - Business Studies D AS - Film Studies C AS - General Studies C
157 Student 0088, F 5.33 41.98 A - Business Studies C A - English Language A A - Religious Studies C EPQ - Extended Project C
158 Student 0164, F 5.33 41.98 A - General Studies B A - History C A - Psychology C A - Sociology A
159 Student 0918, F 5.33 41.98 A - D&T (Product Design) A A - Drama & Theatre Studies B A - Film Studies B
160 Student 1156, F 5.33 41.98 A - Art & Design D A - Drama & Theatre Studies C A - Media Studies C
161 Student 1253, M 5.33 41.98 A - English Language B A - Geography B A - Sociology A AS - Spanish E
162 Student 1301, M 5.33 41.98 A - Drama & Theatre Studies B A - Travel & Tourism - D A - Travel & Tourism - D BB
163 Student 1365, F 5.33 41.98 A - English Literature A A - History E A - Media Studies B
164 Student 1613, F 5.33 41.98 A - Biology E A - English Literature B A - Mathematics A
165 Student 1084, M 5.25 41.50 A - Business Studies A A - ICT D A - Media Studies D
166 Student 0364, F 5.22 41.32 A - Film Studies C A - General Studies C A - Geography C A - Sociology B
EPQ - Extended Project C
167 Student 0615, F 5.22 41.32 A - Art & Design D A - Sociology B Sub Dip - Business D
168 Student 0817, F 5.22 41.32 A - Business Studies C A - Psychology A
169 Student 1053, F 5.22 41.32 A - D&T (Product Design) C AS - Art & Design C AS - Film Studies C AS - Geography D
170 Student 1427, F 5.22 41.32 A - Art & Design D A - Media Studies C A - Sociology C AS - Law E
171 Student 1429, F 5.22 41.32 A - Art & Design A* A - ICT E A - Sociology E
172 Student 1650, M 5.22 41.32 A - Art & Design A A - Drama & Theatre Studies D A - Film Studies D A - Sociology C
173 Student 0519, M 5.21 41.26 A - Biology U A - History D A - ICT D
174 Student 0866, M 5.21 41.26 90-cred Dip - Creative 90-cred Dip - Creative DD A - General Studies B
175 Student 0923, F 5.20 41.20 A - Classical Civilisation D A - English Literature E
A level Target Grade C/D (see description pages for targets of other qualifications)
Name M/F GCSE QCA Subject 1 Subject 2 Subject 3 Subject 4
176 Student 0717, F 5.19 41.14 A - Art & Design C A - English Literature D A - Film Studies C A - General Studies E
177 Student 0963, M 5.17 41.02 A - Chemistry B A - Mathematics B AS - Psychology E AS - Sociology B
178 Student 0221, M 5.12 40.72 A - Drama & Theatre Studies B A - English Language C A - General Studies D
179 Student 0168, F 5.11 40.66 A - General Studies C AS - D&T (Product Design) C AS - Film Studies B
180 Student 0814, F 5.11 40.66 A - English Literature E A - Film Studies A
181 Student 0896, M 5.11 40.66 A - Art & Design C A - Psychology D
182 Student 0939, F 5.11 40.66 A - Art & Design D A - D&T (Product Design) D A - Film Studies A
183 Student 1402, F 5.11 40.66 A - Art & Design A A - Film Studies B
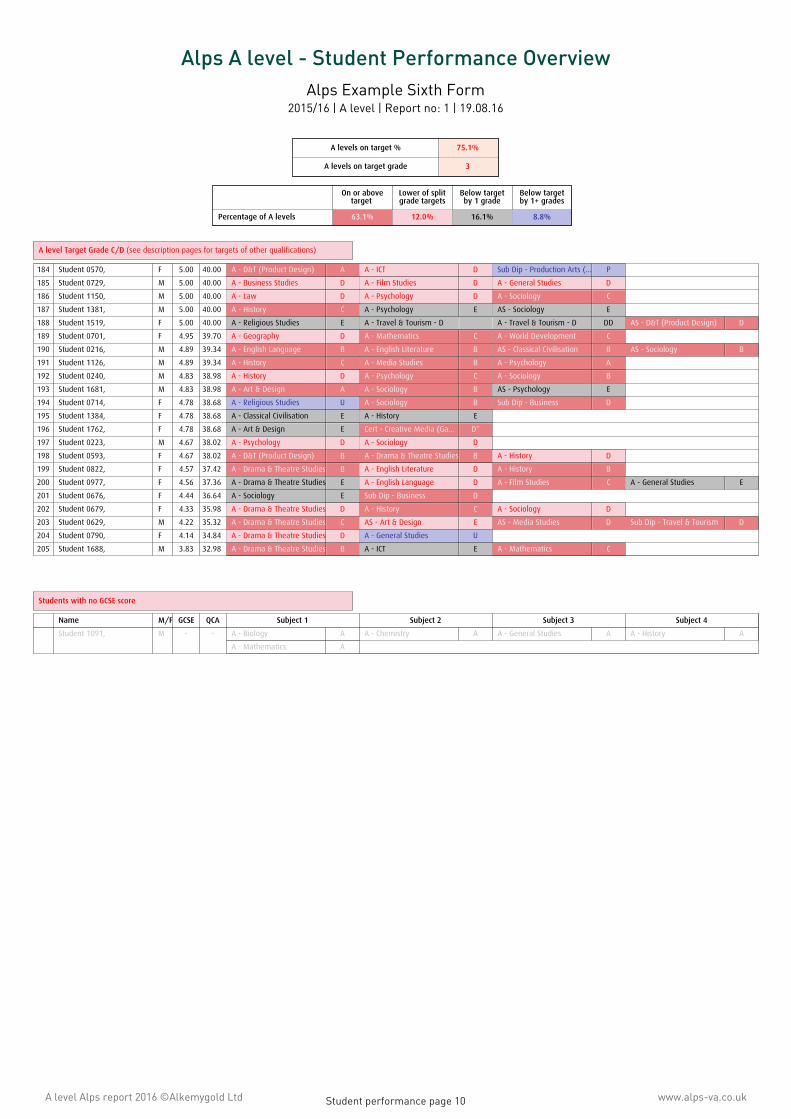
A level Alps report 2016 ©Alkemygold Ltd Student performance page 10 www.alps-va.co.uk
Alps A level - Student Performance OverviewAlps Example Sixth Form
2015/16 | A level | Report no: 1 | 19.08.16
A levels on target % 75.1%
A levels on target grade 3
On or abovetarget
Lower of splitgrade targets
Below targetby 1 grade
Below targetby 1+ grades
Percentage of A levels 63.1% 12.0% 16.1% 8.8%
A level Target Grade C/D (see description pages for targets of other qualifications)
184 Student 0570, F 5.00 40.00 A - D&T (Product Design) A A - ICT D Sub Dip - Production Arts (... P
185 Student 0729, M 5.00 40.00 A - Business Studies D A - Film Studies D A - General Studies D
186 Student 1150, M 5.00 40.00 A - Law D A - Psychology D A - Sociology C
187 Student 1381, M 5.00 40.00 A - History C A - Psychology E AS - Sociology E
188 Student 1519, F 5.00 40.00 A - Religious Studies E A - Travel & Tourism - D A - Travel & Tourism - D DD AS - D&T (Product Design) D
189 Student 0701, F 4.95 39.70 A - Geography D A - Mathematics C A - World Development C
190 Student 0216, M 4.89 39.34 A - English Language B A - English Literature B AS - Classical Civilisation B AS - Sociology B
191 Student 1126, M 4.89 39.34 A - History C A - Media Studies B A - Psychology A
192 Student 0240, M 4.83 38.98 A - History D A - Psychology C A - Sociology B
193 Student 1681, M 4.83 38.98 A - Art & Design A A - Sociology B AS - Psychology E
194 Student 0714, F 4.78 38.68 A - Religious Studies U A - Sociology B Sub Dip - Business D
195 Student 1384, F 4.78 38.68 A - Classical Civilisation E A - History E
196 Student 1762, F 4.78 38.68 A - Art & Design E Cert - Creative Media (Ga... D*
197 Student 0223, M 4.67 38.02 A - Psychology D A - Sociology D
198 Student 0593, F 4.67 38.02 A - D&T (Product Design) B A - Drama & Theatre Studies B A - History D
199 Student 0822, F 4.57 37.42 A - Drama & Theatre Studies B A - English Literature D A - History B
200 Student 0977, F 4.56 37.36 A - Drama & Theatre Studies E A - English Language D A - Film Studies C A - General Studies E
201 Student 0676, F 4.44 36.64 A - Sociology E Sub Dip - Business D
202 Student 0679, F 4.33 35.98 A - Drama & Theatre Studies D A - History C A - Sociology D
203 Student 0629, M 4.22 35.32 A - Drama & Theatre Studies C AS - Art & Design E AS - Media Studies D Sub Dip - Travel & Tourism D
204 Student 0790, F 4.14 34.84 A - Drama & Theatre Studies D A - General Studies U
205 Student 1688, M 3.83 32.98 A - Drama & Theatre Studies B A - ICT E A - Mathematics C
Students with no GCSE score
Name M/F GCSE QCA Subject 1 Subject 2 Subject 3 Subject 4
Student 1091, M - - A - Biology A A - Chemistry A A - General Studies A A - History A
A - Mathematics A

Student performanceoverview & progression
Part 2: Progression
A list of students who completed 2 or more AS levels last yearwho did not go on to complete 2 or more A levels in this year
Missing AS level data
If this report contains no data we do not have validated AS level data for last yearin the Alps database so we do not have the data to put into this report.
To receive a complete version of this report, send through last year’s and this year’s AS level dataand request an AS level report. We will send through an AS level report covering last year and this year.
You will then need to request an updated A level report to include your progression analysis.
A level Alps report 2016 ©Alkemygold Ltd www.alps-va.co.ukStudent progression page 1
Alps Alps - Alkemygold Ltd, Kevin Conway House
Longbow Close, Huddersfield HD2 1GQ01484 887600 | [email protected] | www.alps-va.co.uk
KS5
Alps - Student progression
Progression measure
The Alps student progression report measures the number of students that gain 2 A level courses after completing2 AS level courses the previous year (see the progression indicator in Section B).
Progression is an important dimension to the Alps report. Educationally we believe, and have the evidence,that students who achieve an E grade or higher at AS level should and can progress successfully to A level.
The Alps student progression report allows schools and colleges to measure if the number of students progressingfrom AS level to A level is good, average or below average by national standards. As with all Alps value added reportsthe student prior attainment is taken into account in the measurement of progression performance.
Student Performance - Progression
In 2010 we added the Student Performance - Progression report. This new report takes progression downto the level of the individual student.
The following pages list students who completed 2 or more AS levels in the previous year and then did not progressto sit 2 or more A levels this year along with the subjects they sat and the grades they achieved at AS level in theprevious year. This report allows the senior management to look at each individual student and ask the question:
‘Why did this student not complete 2 or more A levels after completing at least 2 or more AS levels?’
For many students there can be valid reasons for inclusion in this report:
• The student re-sat their AS level subjects
• The student completed only 1 A level alongside a BTEC or another A level equivalent examination
• The student moved away and sat the A level year in another school or college
For each student the story will vary. Reflection on these reasons for non-progression on a student by student basiswill inform the senior staff if each student was best served by not progressing to A level after completing their courseof AS study.
Progression Performance
At the top of the first page of the Student Performance - Progression report is a sentence explaining your Alpsprogression performance this year. Your progression performance adds context to this report.
A good progression rate (Alps grades 1, 2 or 3) suggests that the number of students in this report is low and is lessthan we would expect to see taking into account the student prior attainment in your school or college.
A progression rate that is relatively poor by national standards (Alps grades 7, 8 or 9) suggests that too many studentsappear on the page opposite and that other schools and colleges with a similar student profile would have a lowernumber of students who do not progress from AS level to A level.
Health warning
The students in this report are matched across 2 years by using the student identifier sent through to Alps when yousubmitted data. If the student identifiers do not match between one year and the next then the students in this reportwill not represent students who failed to progress.
You will know if this happens as the number of students that appear in this report will be far higher than the numberof students that appear not to have progressed in your student progression indicator in Section B.
If there seems to be a much higher number of students in this report than you would expect, and on investigationmany of them did progress to do 2 or more A levels, then it is likely that the student IDs do not match over 2 years.To correct this you can resubmit your data for the previous year using the same student IDs as your current year’sdata and we will re-run your report to give you accurate information.
A level Alps report 2016 ©Alkemygold Ltd www.alps-va.co.ukStudent progression page 2

A level Alps report 2016 ©Alkemygold Ltd Student progression page 3 www.alps-va.co.uk
Alps A level - Student ProgressionAlps Example Sixth Form
2015/16 | A level | Report no: 1 | 19.08.16
Your Alps Progression Score is: 0.92 (Alps grade 4 ). This indicates solid progression rates from AS level to A level.For a full description of the Alps Student Progression indicator see earlier in the report.
AS level Target Grade A (see description pages for targets of other qualifications)
Name M/F GCSE QCA Subject 1 Subject 2 Subject 3 Subject 4
1 Student 1357, M 7.62 55.72 AS - Critical Thinking B AS - Mathematics A
AS level Target Grade B (see description pages for targets of other qualifications)
Name M/F GCSE QCA Subject 1 Subject 2 Subject 3 Subject 4
2 Student 0486, F 7.28 53.68 AS - Biology A AS - Chemistry C AS - Mathematics A AS - Physics C
3 Student 1360, M 7.17 53.02 AS - Critical Thinking C AS - World Development A
AS level Target Grade C (see description pages for targets of other qualifications)
Name M/F GCSE QCA Subject 1 Subject 2 Subject 3 Subject 4
4 Student 1341, F 6.39 48.34 AS - Biology D AS - Chemistry D AS - Mathematics D AS - Physics U
5 Student 0794, M 6.33 47.98 AS - Biology U AS - Chemistry E AS - Economics E AS - Mathematics E
6 Student 0238, F 6.30 47.80 AS - Art & Design C AS - Mathematics U
7 Student 1421, M 6.30 47.80 AS - Art & Design C AS - General Studies B AS - Travel & Tourism - S B
8 Student 0994, F 6.28 47.68 AS - Art & Design C AS - Psychology C
9 Student 1438, F 6.19 47.14 AS - English Literature E AS - History E AS - ICT D AS - Mathematics E
10 Student 0943, F 6.18 47.08 AS - Business Studies U AS - English Literature D AS - Psychology U
AS level Target Grade C/D (see description pages for targets of other qualifications)
Name M/F GCSE QCA Subject 1 Subject 2 Subject 3 Subject 4
11 Student 0395, F 6.06 46.36 AS - Art & Design A AS - Biology U AS - Psychology E
12 Student 0893, F 6.06 46.36 AS - Economics D AS - Mathematics C AS - Media Studies D AS - Physics U
13 Student 0979, M 6.04 46.24 AS - Business Studies C AS - Computing D AS - General Studies E AS - Mathematics D
AS - Physical Education B
14 Student 0196, F 5.93 45.58 AS - Business Studies D AS - Economics U AS - Psychology D
15 Student 0455, F 5.89 45.34 AS - Biology E AS - History D AS - ICT C AS - Media Studies C
16 Student 1287, F 5.78 44.68 AS - Physical Education E AS - Psychology U
17 Student 1256, M 5.69 44.14 AS - Business Studies D AS - ICT E AS - Sociology C
18 Student 0371, M 5.68 44.08 AS - Business Studies U AS - Psychology U AS - Sociology D
19 Student 1177, M 5.67 44.02 AS - Chemistry E AS - Economics U AS - General Studies U AS - Mathematics C
AS - Physics E
20 Student 1741, F 5.67 44.02 AS - English Literature D AS - General Studies U AS - Law E AS - Religious Studies C
AS - Sociology A
21 Student 1208, F 5.65 43.90 AS - Mathematics C AS - Physics C
22 Student 1339, F 5.61 43.66 AS - History A AS - Media Studies E AS - Sociology D
23 Student 0200, M 5.56 43.36 AS - D&T (Product Design) C AS - Economics U AS - Mathematics U AS - Physics U
24 Student 0359, F 5.56 43.36 AS - Art & Design C AS - ICT D
25 Student 0623, M 5.52 43.12 AS - Business Studies C AS - Film Studies B AS - General Studies D AS - Music Technology E
AS - Psychology D
AS level Target Grade D (see description pages for targets of other qualifications)
Name M/F GCSE QCA Subject 1 Subject 2 Subject 3 Subject 4
26 Student 0903, F 5.44 42.64 AS - Art & Design D AS - D&T (Product Design) C AS - General Studies E AS - Sociology D
27 Student 0173, M 5.43 42.58 AS - Economics U AS - History D AS - Psychology E
28 Student 1724, F 5.40 42.40 AS - D&T (Product Design) C AS - History E
29 Student 1196, F 5.39 42.34 A - Drama & Theatre Studies C AS - D&T (Product Design) C AS - Sociology U
30 Student 1654, M 5.31 41.86 AS - Geography C AS - Physics E
31 Student 0422, M 5.30 41.80 AS - Business Studies A AS - English Language B AS - General Studies E AS - Law A
AS - Mathematics B
32 Student 0435, F 5.23 41.38 AS - Art & Design B AS - General Studies E AS - Travel & Tourism - S D

A level Alps report 2016 ©Alkemygold Ltd Student progression page 4 www.alps-va.co.uk
Alps A level - Student ProgressionAlps Example Sixth Form
2015/16 | A level | Report no: 1 | 19.08.16
Your Alps Progression Score is: 0.92 (Alps grade 4 ). This indicates solid progression rates from AS level to A level.For a full description of the Alps Student Progression indicator see earlier in the report.
AS level Target Grade D (see description pages for targets of other qualifications)
33 Student 1053, F 5.22 41.32 AS - Art & Design E AS - D&T (Product Design) C AS - Geography E
34 Student 1386, F 5.22 41.32 AS - English Literature B AS - Media Studies E AS - Psychology U
35 Student 0047, F 5.13 40.78 A - Law C AS - Business Studies D AS - Economics E AS - Religious Studies C
36 Student 0168, F 5.11 40.66 AS - Biology E AS - Business Studies C AS - General Studies C AS - Law E
37 Student 0438, F 5.11 40.66 AS - Chemistry U AS - Psychology E AS - Sociology C
38 Student 0476, F 5.11 40.66 AS - Art & Design D AS - D&T (Product Design) D AS - Economics U AS - General Studies E
AS - Mathematics U
39 Student 1564, F 5.11 40.66 AS - Art & Design D AS - ICT C
40 Student 1714, F 5.11 40.66 AS - Business Studies D AS - Chemistry U AS - Economics E AS - Mathematics U
41 Student 0565, F 5.00 40.00 AS - English Language E AS - English Literature E AS - General Studies U AS - Geography E
42 Student 1647, F 5.00 40.00 AS - Classical Civilisation D AS - Film Studies B AS - Sociology C
43 Student 0956, F 4.93 39.58 AS - Biology U AS - Chemistry U AS - ICT D
44 Student 1094, M 4.90 39.40 AS - D&T (Product Design) D AS - French D AS - ICT E AS - Psychology U
45 Student 0687, F 4.89 39.34 AS - English Literature E AS - Sociology C
46 Student 0723, M 4.89 39.34 AS - Drama & Theatre Stu... C AS - Sociology U
47 Student 1178, F 4.80 38.80 AS - Business Studies X AS - General Studies E AS - Geography E AS - Mathematics U
AS - Physics U
48 Student 1061, M 4.79 38.74 AS - Biology U AS - Business Studies E AS - Media Studies U AS - Psychology D
AS level Target Grade D/E (see description pages for targets of other qualifications)
Name M/F GCSE QCA Subject 1 Subject 2 Subject 3 Subject 4
49 Student 0128, F 4.67 38.02 AS - D&T (Product Design) D AS - English Language D AS - General Studies U AS - Sociology D
50 Student 1735, F 4.61 37.66 AS - Media Studies E AS - Psychology U AS - Sociology E
51 Student 0676, F 4.44 36.64 AS - Business Studies U AS - Psychology U AS - Sociology E
52 Student 0499, F 4.22 35.32 AS - Drama & Theatre Stu... D AS - Film Studies B AS - Psychology U AS - Sociology E
53 Student 0629, M 4.22 35.32 AS - Art & Design U AS - Drama & Theatre Stu... E
54 Student 0790, F 4.14 34.84 AS - Drama & Theatre Stu... C AS - General Studies U AS - Travel & Tourism - S U
55 Student 1718, F 4.00 34.00 A - Classical Civilisation D AS - Religious Studies D AS - Sociology C


A
Alps Alps - Alkemygold Ltd, Kevin Conway House
Longbow Close, Huddersfield HD2 1GQ01484 887600 | [email protected] | www.alps-va.co.uk
KS5