20150701 cielo august
35
Copyright © Cielo | Todos os direitos reservados CORPORATE PRESENTATION August, 2015
-
Upload
cielositeri -
Category
Investor Relations
-
view
789 -
download
0
Transcript of 20150701 cielo august

Copyright © Cielo | Todos os direitos reservados
CORPORATE PRESENTATION
August, 2015
THE COMPANY MAKES FORWARD LOOKINGSTATEMENTS THAT ARE SUBJECT TO RISKS AND UNCERTAINTIES
DISCLAIMER
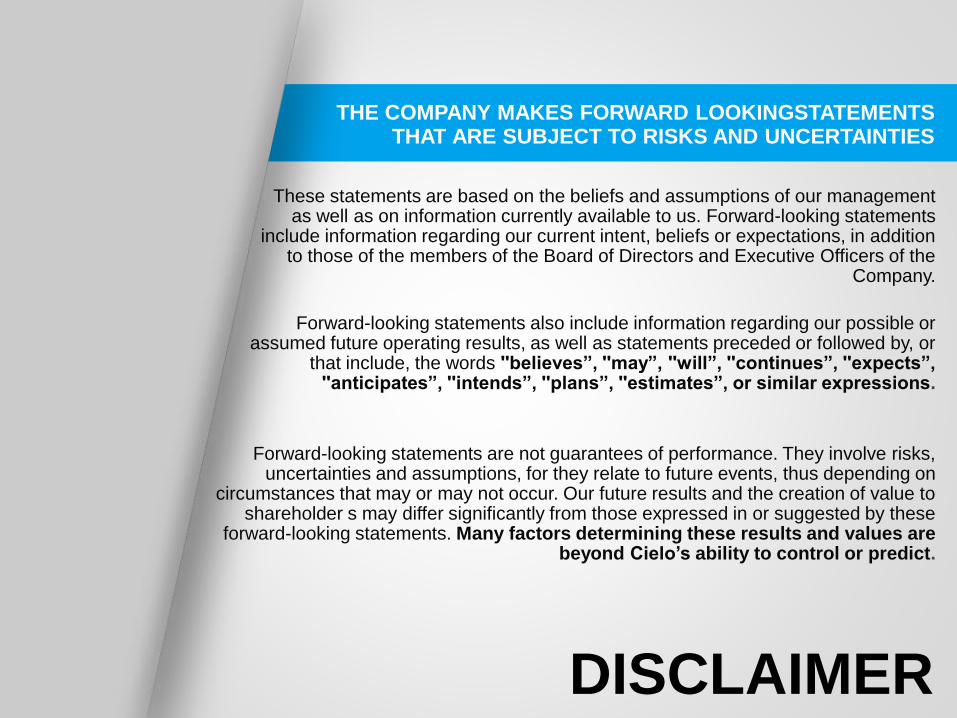
These statements are based on the beliefs and assumptions of our management as well as on information currently available to us. Forward-looking statements
include information regarding our current intent, beliefs or expectations, in addition to those of the members of the Board of Directors and Executive Officers of the
Company.
Forward-looking statements also include information regarding our possible or assumed future operating results, as well as statements preceded or followed by, or
that include, the words ''believes”, ''may”, ''will”, ''continues”, ''expects”, ''anticipates”, ''intends”, ''plans”, ''estimates”, or similar expressions.
Forward-looking statements are not guarantees of performance. They involve risks, uncertainties and assumptions, for they relate to future events, thus depending on
circumstances that may or may not occur. Our future results and the creation of value to shareholder s may differ significantly from those expressed in or suggested by these
forward-looking statements. Many factors determining these results and values are beyond Cielo’s ability to control or predict.
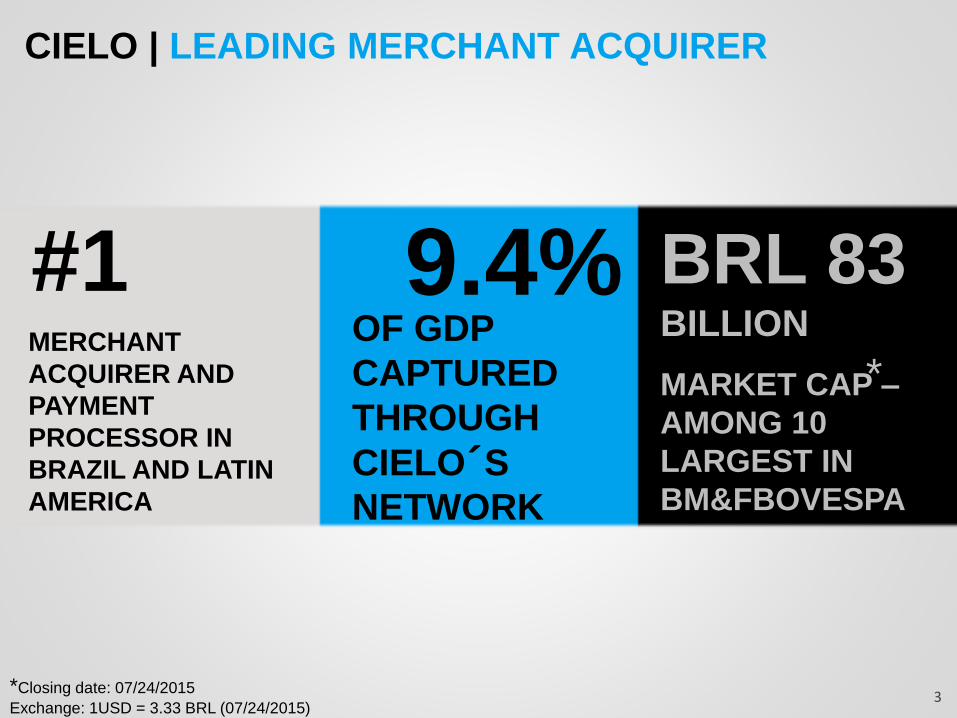
#1MERCHANT
ACQUIRER AND
PAYMENT
PROCESSOR IN
BRAZIL AND LATIN
AMERICA
OF GDP
CAPTURED
THROUGH
CIELO´S
NETWORK
MARKET CAP –
AMONG 10
LARGEST IN
BM&FBOVESPA
BRL 83 BILLION
9.4%
CIELO | LEADING MERCHANT ACQUIRER
*
*Closing date: 07/24/2015
Exchange: 1USD = 3.33 BRL (07/24/2015) 3
Copyright © Cielo | Todos os direitos reservados
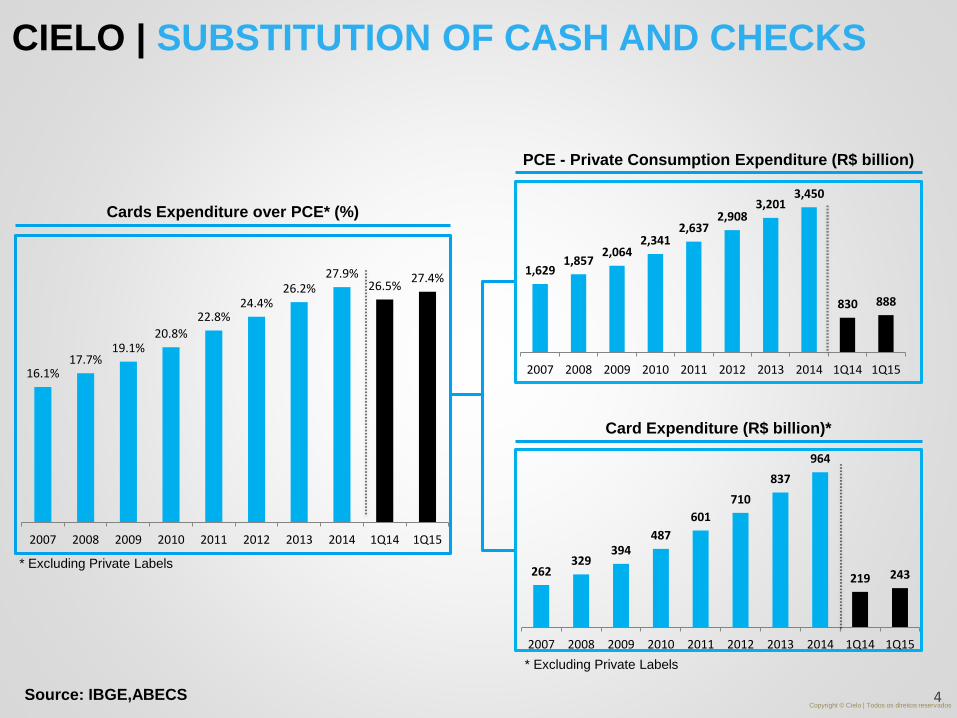
CIELO | SUBSTITUTION OF CASH AND CHECKS
* Excluding Private Labels
Cards Expenditure over PCE* (%)
PCE - Private Consumption Expenditure (R$ billion)
Card Expenditure (R$ billion)*
Source: IBGE,ABECS 4
* Excluding Private Labels
16.1%17.7%
19.1%20.8%
22.8%24.4%
26.2%27.9%
26.5%27.4%
2007 2008 2009 2010 2011 2012 2013 2014 1Q14 1Q15
1,6291,857
2,0642,341
2,6372,908
3,2013,450
830 888
2007 2008 2009 2010 2011 2012 2013 2014 1Q14 1Q15
262329
394487
601
710
837
964
219 243
2007 2008 2009 2010 2011 2012 2013 2014 1Q14 1Q15
CIELOPROMO
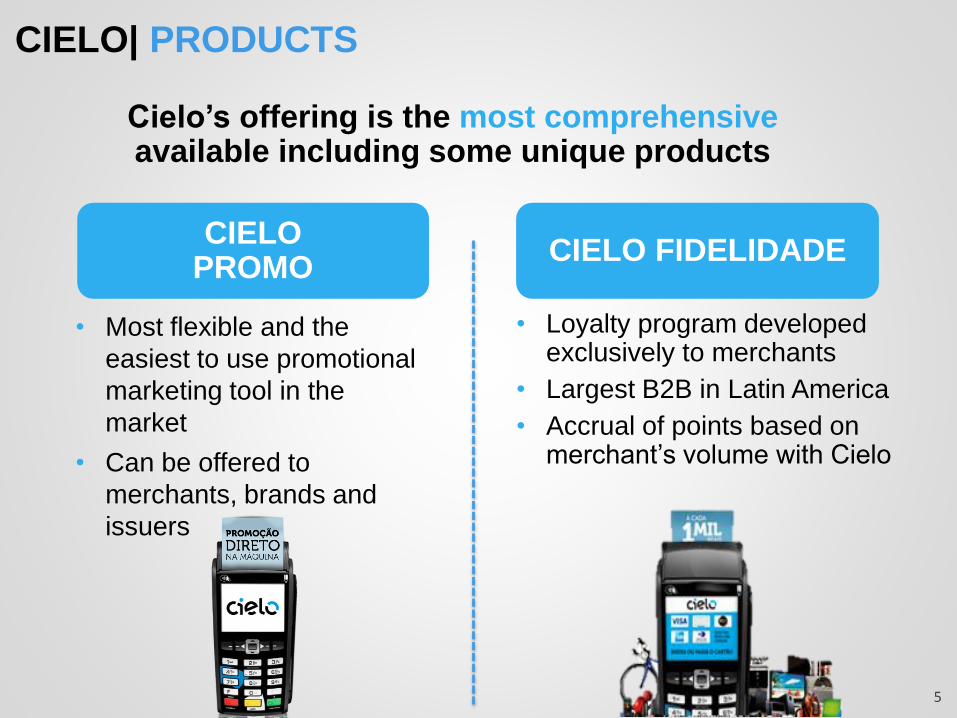
Cielo’s offering is the most comprehensive available including some unique products
• Loyalty program developed exclusively to merchants
• Largest B2B in Latin America
• Accrual of points based on merchant’s volume with Cielo
• Most flexible and the
easiest to use promotional
marketing tool in the
market
• Can be offered to
merchants, brands and
issuers
CIELO| PRODUCTS
CIELO FIDELIDADE
5
Copyright © Cielo | Todos os direitos reservados
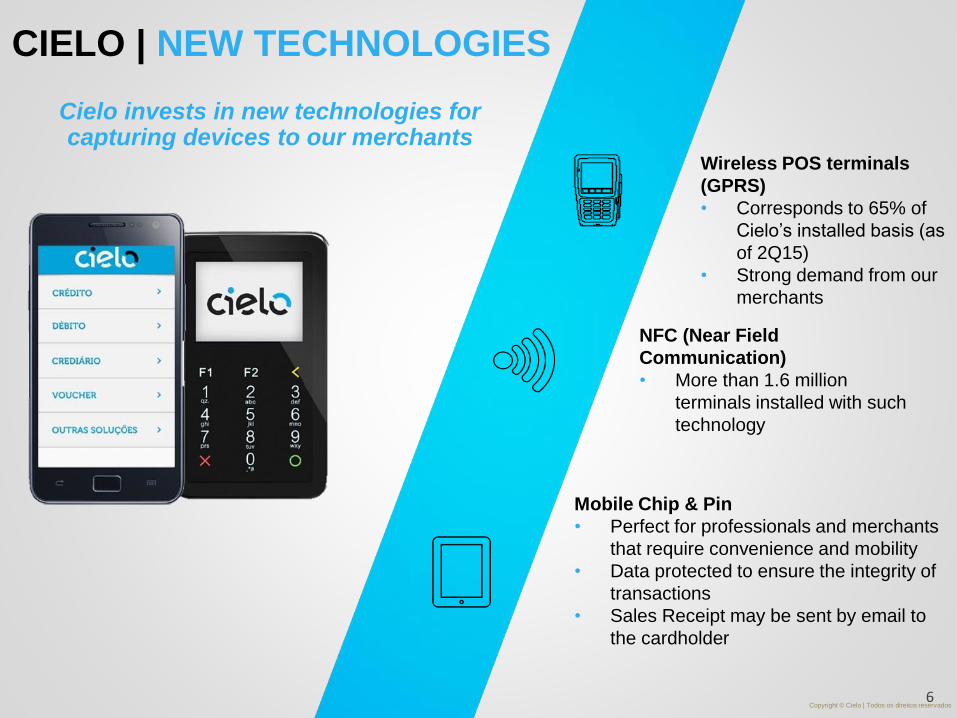
CIELO | NEW TECHNOLOGIES
Wireless POS terminals
(GPRS)
• Corresponds to 65% of
Cielo’s installed basis (as
of 2Q15)
• Strong demand from our
merchants
NFC (Near Field
Communication)
• More than 1.6 million
terminals installed with such
technology
Mobile Chip & Pin
• Perfect for professionals and merchants
that require convenience and mobility
• Data protected to ensure the integrity of
transactions
• Sales Receipt may be sent by email to
the cardholder
Cielo invests in new technologies for capturing devices to our merchants
6
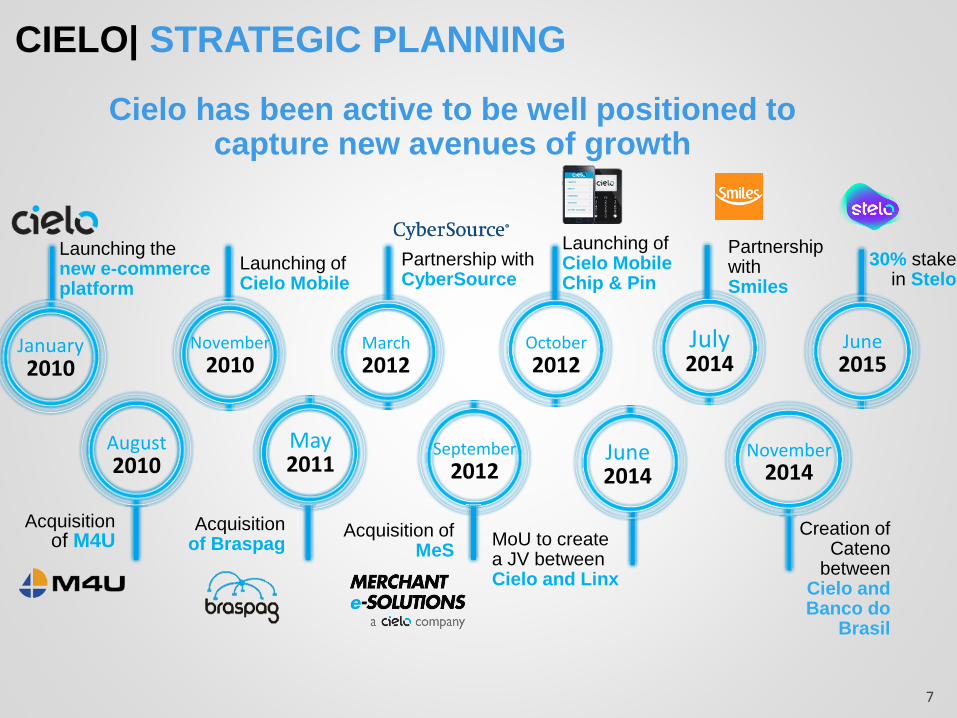
30% stake in Stelo
Creation of Cateno
between Cielo and Banco do
Brasil
Launching ofCielo MobileChip & Pin
November2014
November
2010March
2012
August2010
May2011
September
2012
October
2012January2010
June2014
June2015
CIELO| STRATEGIC PLANNING
Cielo has been active to be well positioned to capture new avenues of growth
Launching the new e-commerce platform
Acquisitionof M4U
Acquisitionof Braspag
Launching ofCielo Mobile
Partnership withCyberSource
Acquisition of MeS
7
MoU to createa JV betweenCielo and Linx
July2014
Partnership with Smiles
Business
Expansion
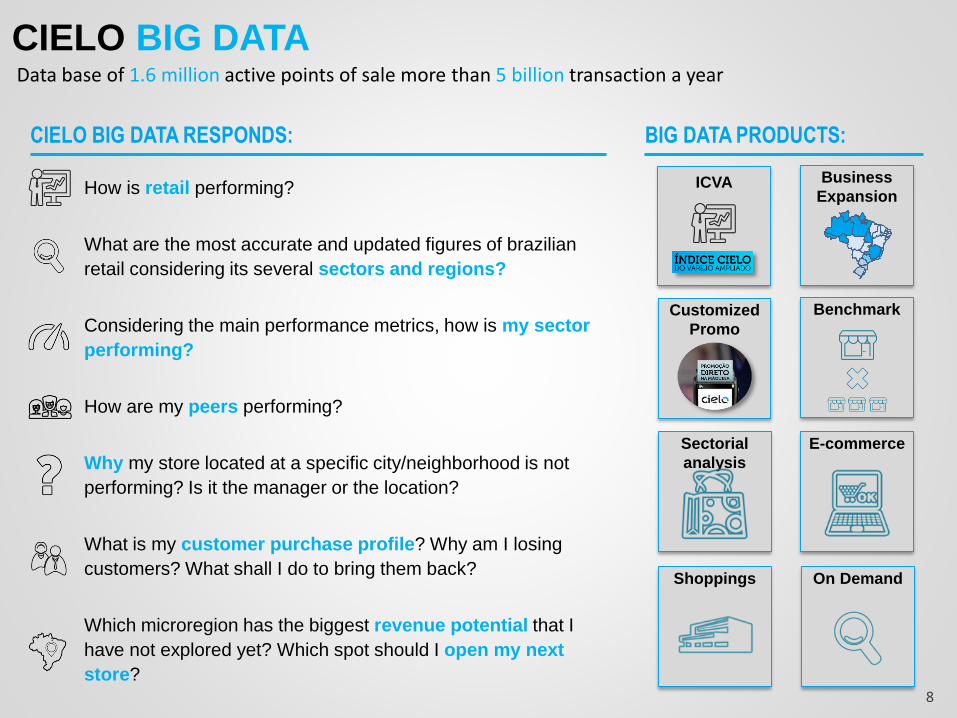
Data base of 1.6 million active points of sale more than 5 billion transaction a year
CIELO BIG DATA
CIELO BIG DATA RESPONDS:
How is retail performing?
What are the most accurate and updated figures of brazilian
retail considering its several sectors and regions?
Considering the main performance metrics, how is my sector
performing?
How are my peers performing?
Why my store located at a specific city/neighborhood is not
performing? Is it the manager or the location?
What is my customer purchase profile? Why am I losing
customers? What shall I do to bring them back?
Which microregion has the biggest revenue potential that I
have not explored yet? Which spot should I open my next
store?
BIG DATA PRODUCTS:
ICVA
BenchmarkCustomized
Promo
E-commerceSectorial
analysis
Shoppings On Demand
8
Source: CIELO
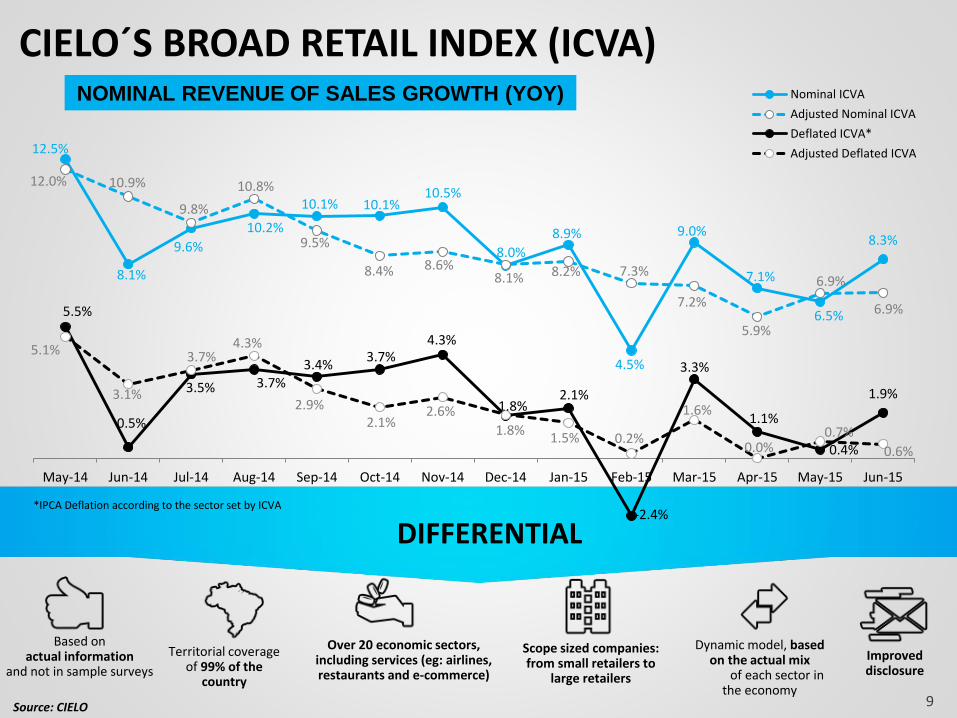
CIELO´S BROAD RETAIL INDEX (ICVA)NOMINAL REVENUE OF SALES GROWTH (YOY)
DIFFERENTIAL
Territorial coverageof 99% of the
country
Scope sized companies: from small retailers to
large retailers
Based onactual information
and not in sample surveys
Dynamic model, basedon the actual mix
of each sector in the economy
Over 20 economic sectors, including services (eg: airlines, restaurants and e-commerce)
Improveddisclosure
9
12.5%
8.1%
9.6%
10.2%
10.1% 10.1%10.5%
8.0%
8.9%
4.5%
9.0%
7.1%
6.5%
8.3%
12.0% 10.9%
9.8%
10.8%
9.5%
8.4% 8.6%8.1% 8.2% 7.3%
7.2%
5.9%
6.9%
6.9%5.5%
0.5%
3.5% 3.7%3.4%
3.7%4.3%
1.8%2.1%
-2.4%
3.3%
1.1%
0.4%
1.9%
5.1%
3.1%
3.7%4.3%
2.9%2.1%
2.6%
1.8%1.5% 0.2%
1.6%
0.0%0.7%
0.6%
May-14 Jun-14 Jul-14 Aug-14 Sep-14 Oct-14 Nov-14 Dec-14 Jan-15 Feb-15 Mar-15 Apr-15 May-15 Jun-15
Nominal ICVA
Adjusted Nominal ICVA
Deflated ICVA*
Adjusted Deflated ICVA
*IPCA Deflation according to the sector set by ICVA
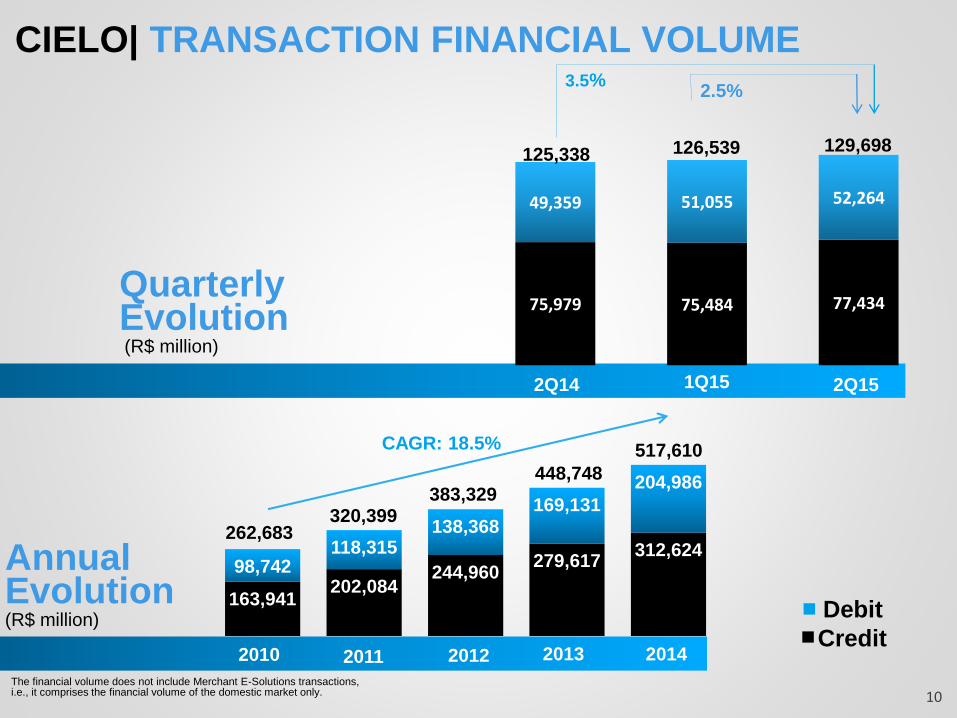
163,941202,084
244,960279,617
312,62498,742
118,315138,368
169,131
204,986
517,610CAGR: 18.5%
AnnualEvolution(R$ million)
2012 2013
448,748
320,399
Credit
Debit
The financial volume does not include Merchant E-Solutions transactions, i.e., it comprises the financial volume of the domestic market only.
CIELO| TRANSACTION FINANCIAL VOLUME
20112010
383,329
262,683
2014
10
75,979 75,484 77,434
49,359 51,055 52,264
Quarterly Evolution(R$ million)
125,338129,698126,539
1Q15
2.5%
2Q14 2Q15
3.5%
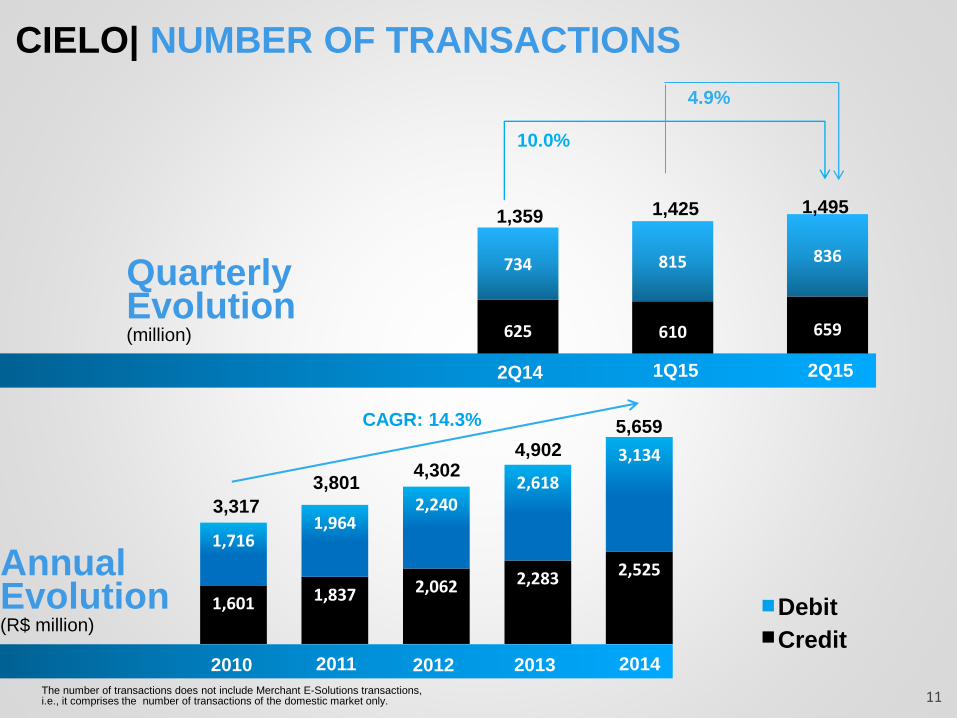
CIELO| NUMBER OF TRANSACTIONS
AnnualEvolution(R$ million)
2012 2013
Credit
Debit
The number of transactions does not include Merchant E-Solutions transactions, i.e., it comprises the number of transactions of the domestic market only.
2010 2011
1,601 1,837 2,062 2,283 2,525
1,7161,964
2,2402,618
3,134
3,317
3,8014,302
4,902
5,659
2014
CAGR: 14.3%
11
625 610 659
734 815 836
1,4951,359
10.0%
1Q15
1,425
4.9%
QuarterlyEvolution(million)
2Q152Q14

CIELO| OPERATIONAL INDICATORS
2Q14 1Q15 2Q15
Quarterly Evolution(Thousand)
* Points of Sales Merchants are those that have made at least a single transaction in the last 30 days .The year is measured based on the closing
POS Terminals Points of Sales Merchants (30 days)*
2010
1,2771,484
1,7271,831
2,023
1,069 1,1561,282
1,4261,619
Annual Evolution(Thousand)
2010 2011 2012
CAGR: 10.9%
CAGR 12.2%
20142013
12
1,8922,020 2,071
1,4731,637 1,674
2.5%13.6%
2.3%
9.5%
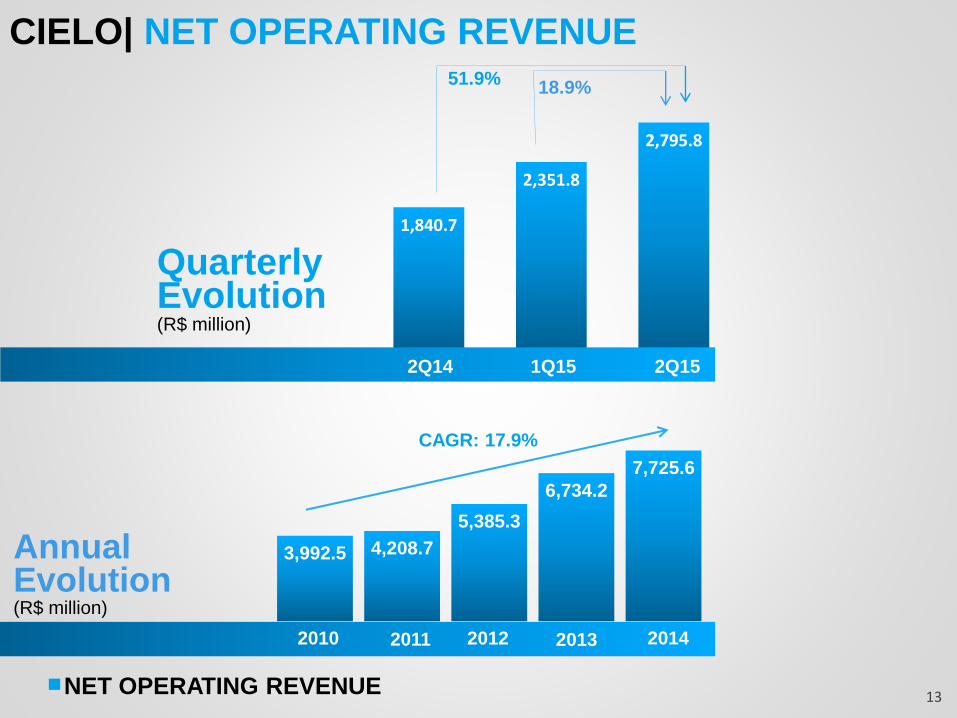
1,840.7
2,351.8
2,795.8
2Q14 1Q15 2Q15
AnnualEvolution(R$ million)
CIELO| NET OPERATING REVENUE
NET OPERATING REVENUE
QuarterlyEvolution(R$ million)
51.9%
20112010
18.9%
3,992.5 4,208.7
5,385.3
6,734.2
7,725.6
CAGR: 17.9%
2012 201320112010 2014
13
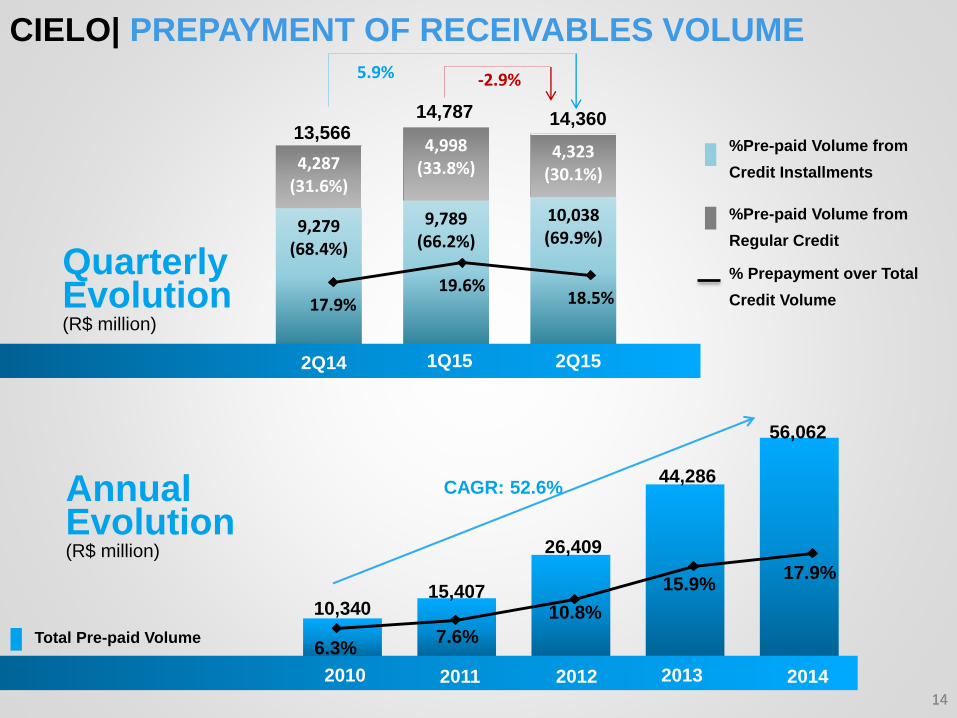
9,279(68.4%)
9,789(66.2%)
10,038(69.9%)
4,287(31.6%)
4,998(33.8%)
4,323(30.1%)
17.9%19.6%
18.5%
2Q14 1Q15 2Q15
CIELO| PREPAYMENT OF RECEIVABLES VOLUME5.9% -2.9%
14
QuarterlyEvolution(R$ million)
13,56614,787 14,360
%Pre-paid Volume from
Credit Installments
% Prepayment over Total
Credit Volume
%Pre-paid Volume from
Regular Credit
10,34015,407
26,409
44,286
56,062
6.3%7.6%
10.8%
15.9%17.9%
2012 201414
20112010
AnnualEvolution(R$ million)
2013
CAGR: 52.6%
Total Pre-paid Volume
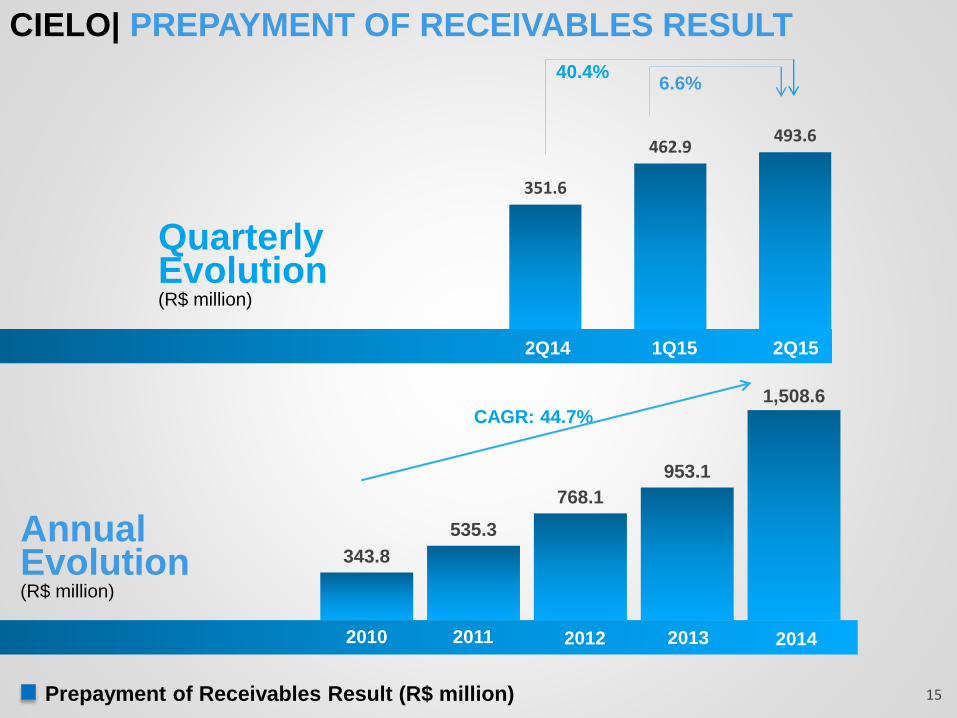
CIELO| PREPAYMENT OF RECEIVABLES RESULT
15
343.8
535.3
768.1
953.1
1,508.6
351.6
462.9493.6
2Q14 1Q15 2Q15
QuarterlyEvolution(R$ million)
AnnualEvolution(R$ million)
Prepayment of Receivables Result (R$ million)
2012 2014201320112010
40.4%6.6%
CAGR: 44.7%
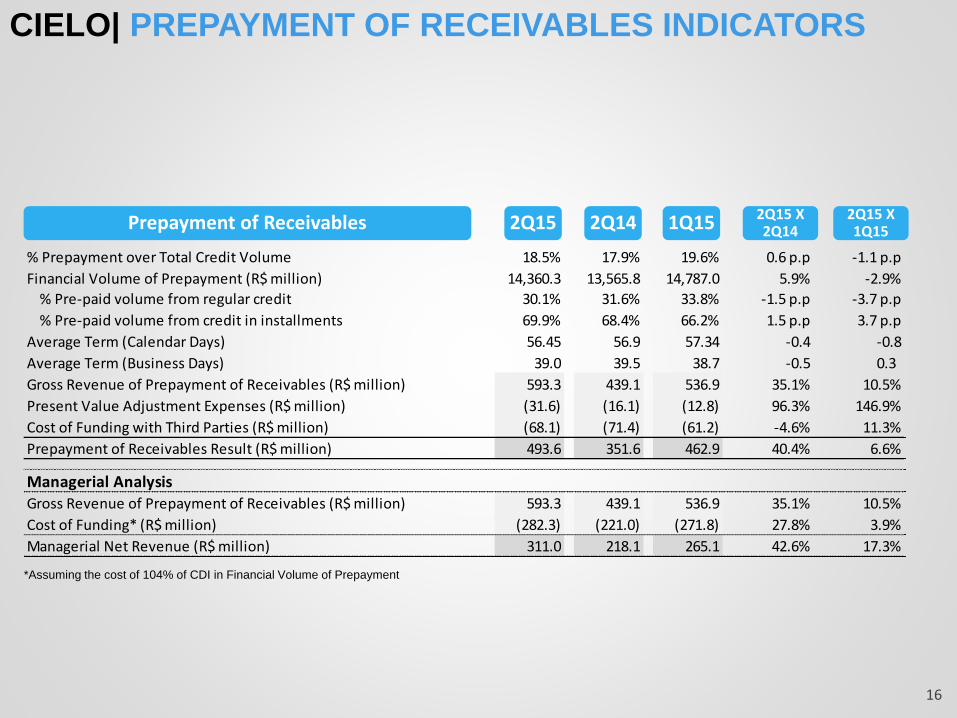
CIELO| PREPAYMENT OF RECEIVABLES INDICATORS
16
Prepayment of Receivables 2Q15 2Q14 1Q15 2Q15 X 2Q14
2Q15 X 1Q15
*Assuming the cost of 104% of CDI in Financial Volume of Prepayment
% Prepayment over Total Credit Volume 18.5% 17.9% 19.6% 0.6 p.p -1.1 p.p
Financial Volume of Prepayment (R$ million) 14,360.3 13,565.8 14,787.0 5.9% -2.9%
% Pre-paid volume from regular credit 30.1% 31.6% 33.8% -1.5 p.p -3.7 p.p
% Pre-paid volume from credit in installments 69.9% 68.4% 66.2% 1.5 p.p 3.7 p.p
Average Term (Calendar Days) 56.45 56.9 57.34 -0.4 -0.8
Average Term (Business Days) 39.0 39.5 38.7 -0.5 0.3
Gross Revenue of Prepayment of Receivables (R$ million) 593.3 439.1 536.9 35.1% 10.5%
Present Value Adjustment Expenses (R$ million) (31.6) (16.1) (12.8) 96.3% 146.9%
Cost of Funding with Third Parties (R$ million) (68.1) (71.4) (61.2) -4.6% 11.3%
Prepayment of Receivables Result (R$ million) 493.6 351.6 462.9 40.4% 6.6%
Managerial AnalysisGross Revenue of Prepayment of Receivables (R$ million) 593.3 439.1 536.9 35.1% 10.5%
Cost of Funding* (R$ million) (282.3) (221.0) (271.8) 27.8% 3.9%
Managerial Net Revenue (R$ million) 311.0 218.1 265.1 42.6% 17.3%
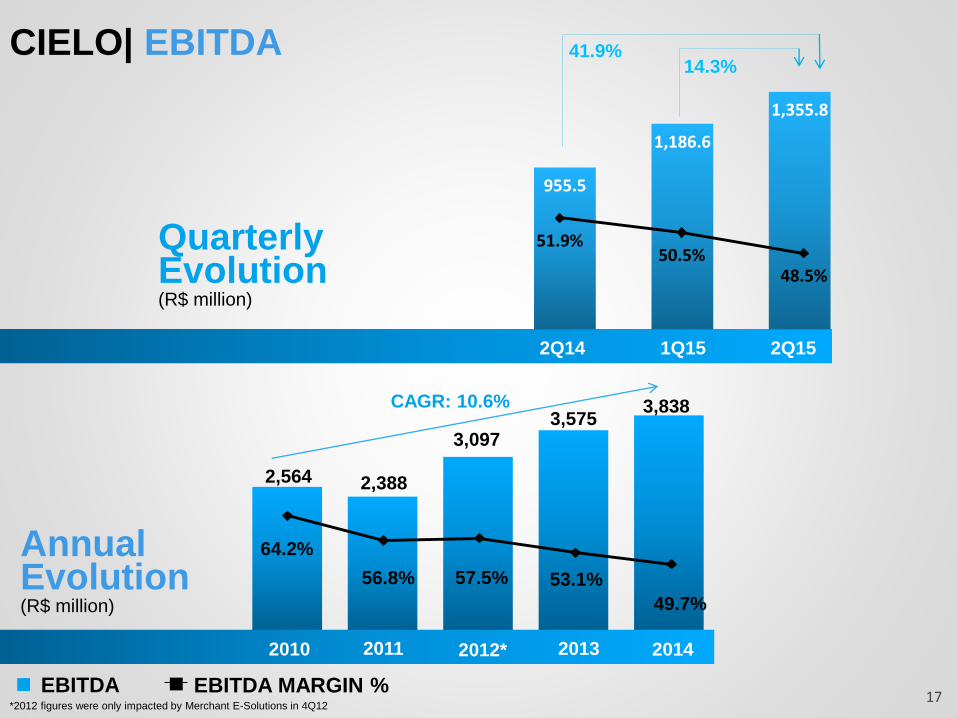
2,564 2,388
3,0973,575
3,838
64.2%
56.8% 57.5% 53.1%
49.7%
CIELO| EBITDA
QuarterlyEvolution(R$ million)
2Q14 1Q15 2Q15
2012* 2013
AnnualEvolution(R$ million)
EBITDA MARGIN %EBITDA
CAGR: 10.6%
*2012 figures were only impacted by Merchant E-Solutions in 4Q12
20112010 2014
17
955.5
1,186.6
1,355.8
51.9%50.5%
48.5%
14.3%41.9%
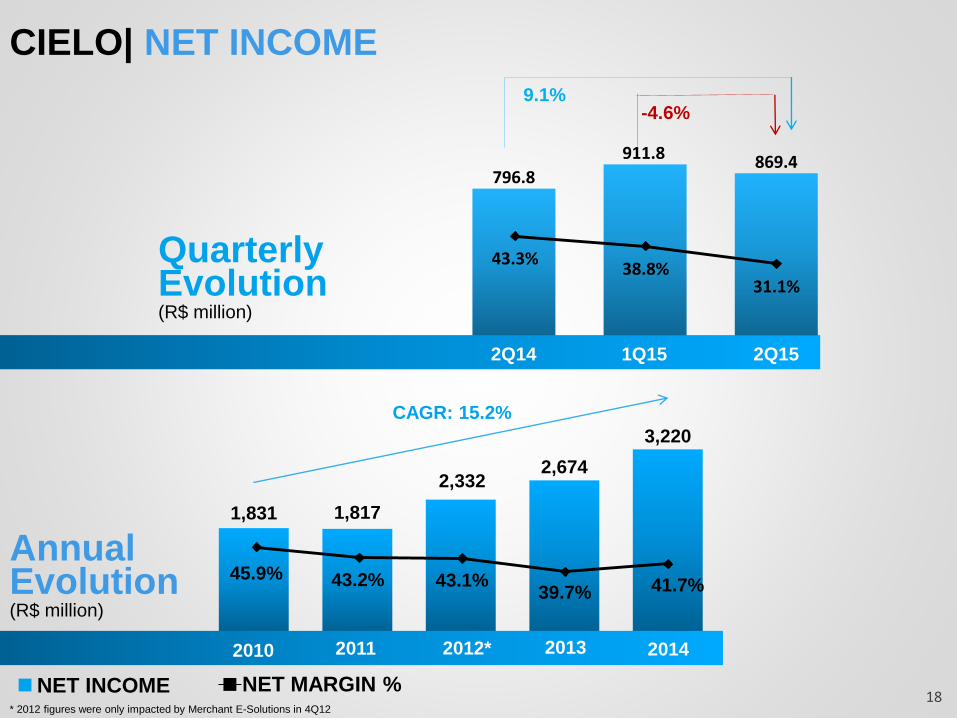
2Q14 1Q15 2Q15
QuarterlyEvolution(R$ million)
1,831 1,817
2,3322,674
3,220
2012* 2013
45.9% 43.2% 43.1%39.7% 41.7%
AnnualEvolution(R$ million)
NET MARGIN %NET INCOME* 2012 figures were only impacted by Merchant E-Solutions in 4Q12
CAGR: 15.2%
20112010 2014
18
CIELO| NET INCOME
796.8
911.8 869.4
9.1%
43.3%38.8%
31.1%
-4.6%
CIELO | INVESTMENT HIGHLIGHTS
Leader in a growing market
Strong balance sheet, high cash generation and low capex requirements
Minimum dividend payout of 30% of net profit*distributed twice a year
Focus on innovation, diversificationand continuous growth
* After constitution of legal reserve of 20% of the Company´s capital stock
19
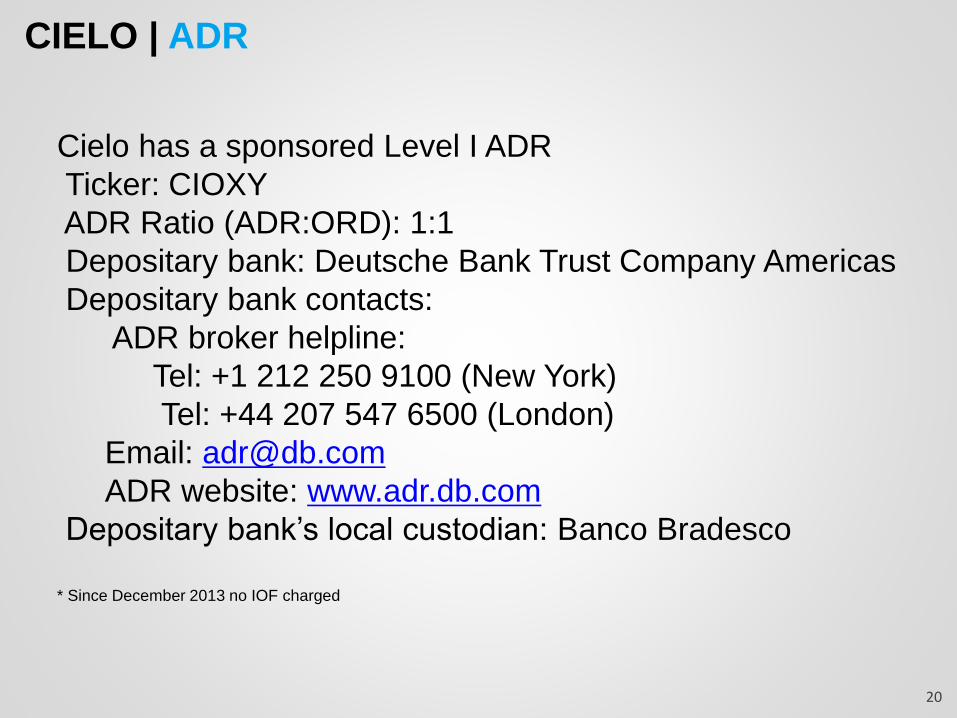
CIELO | ADR
Cielo has a sponsored Level I ADR
Ticker: CIOXY
ADR Ratio (ADR:ORD): 1:1
Depositary bank: Deutsche Bank Trust Company Americas
Depositary bank contacts:
ADR broker helpline:
Tel: +1 212 250 9100 (New York)
Tel: +44 207 547 6500 (London)
Email: [email protected]
ADR website: www.adr.db.com
Depositary bank’s local custodian: Banco Bradesco
* Since December 2013 no IOF charged
20

Copyright © Cielo | Todos os direitos reservados
APPENDIX
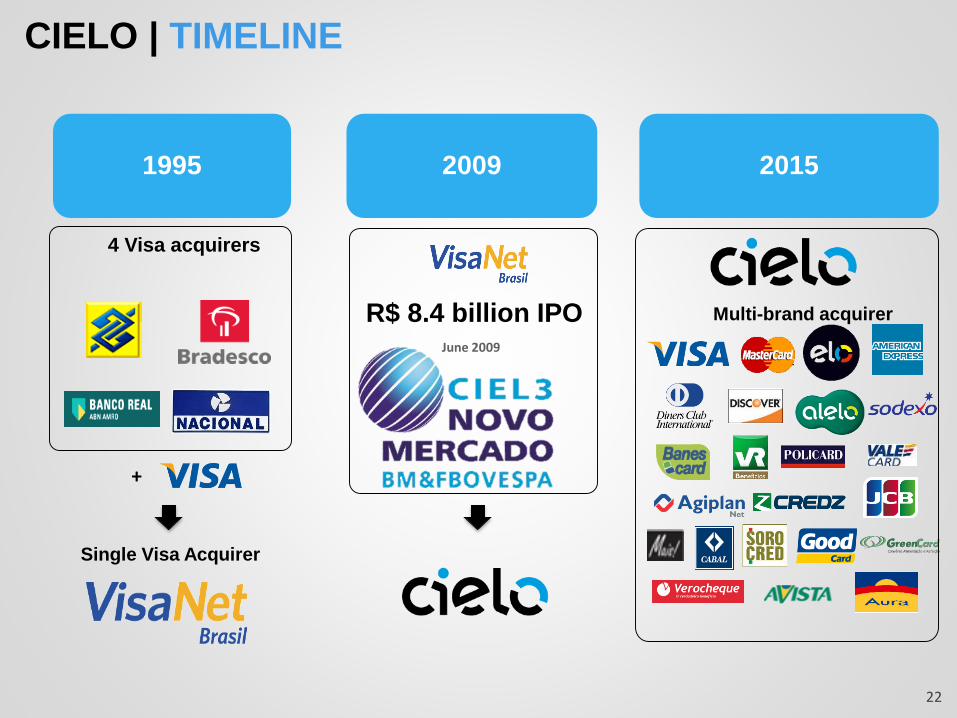
1995 2009 2015
June 2009
Single Visa Acquirer
R$ 8.4 billion IPO
+
Multi-brand acquirer
CIELO | TIMELINE
4 Visa acquirers
22
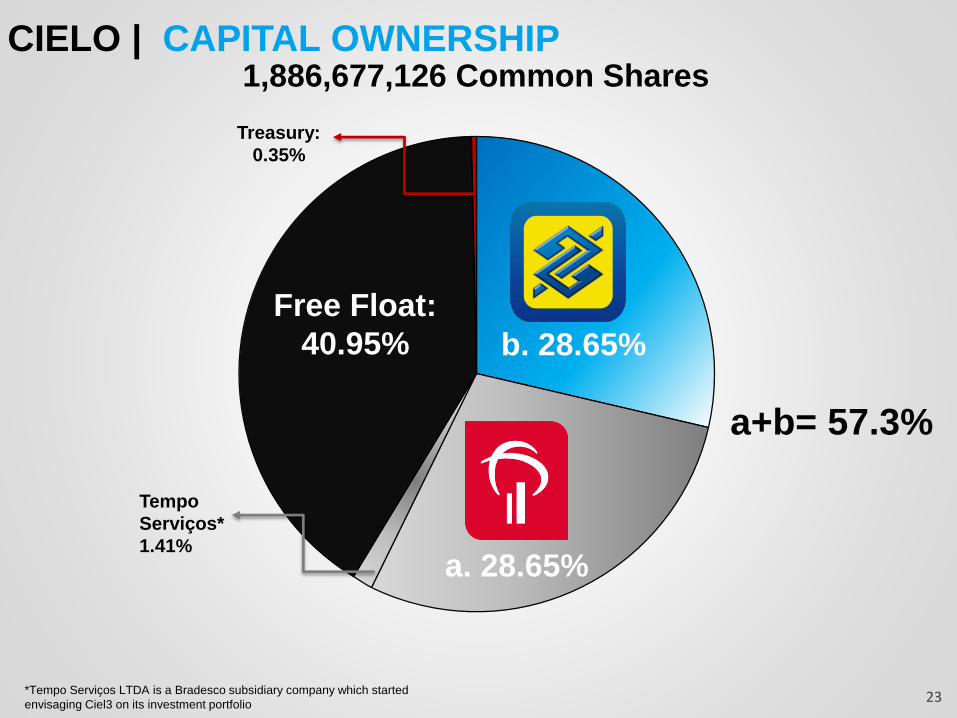
1,886,677,126 Common SharesCIELO | CAPITAL OWNERSHIP
23*Tempo Serviços LTDA is a Bradesco subsidiary company which started
envisaging Ciel3 on its investment portfolio
b. 28.65%
a. 28.65%
a+b= 57.3%
Tempo
Serviços*
1.41%
Free Float:
40.95%
Treasury:
0.35%
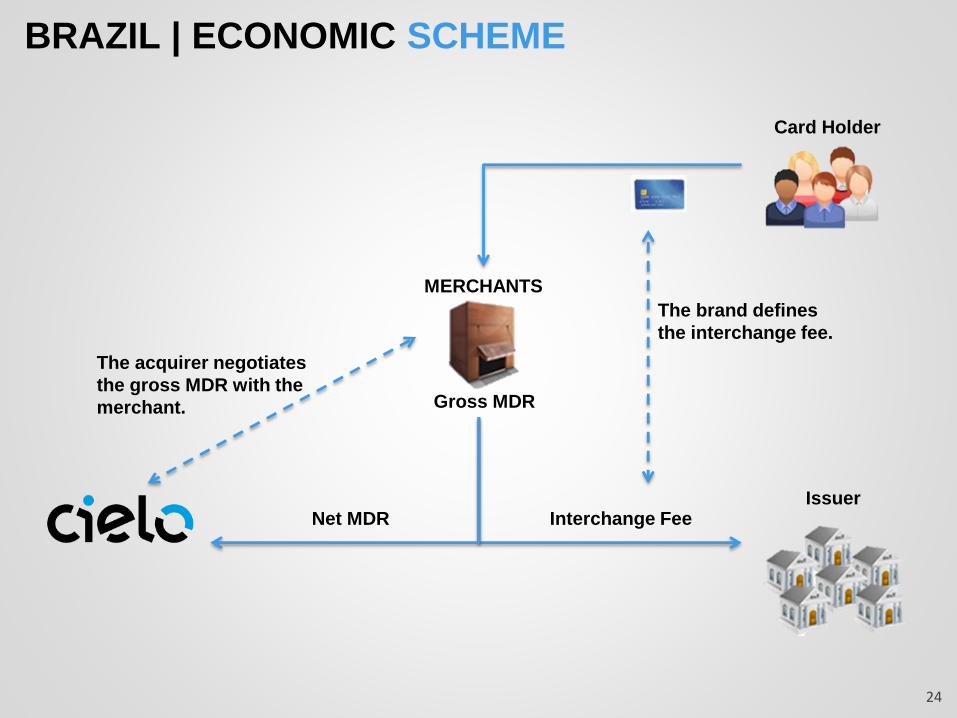
BRAZIL | ECONOMIC SCHEME
Gross MDR
Net MDR Interchange Fee
The brand defines
the interchange fee.
The acquirer negotiates
the gross MDR with the
merchant.
MERCHANTS
Issuer
Card Holder
24
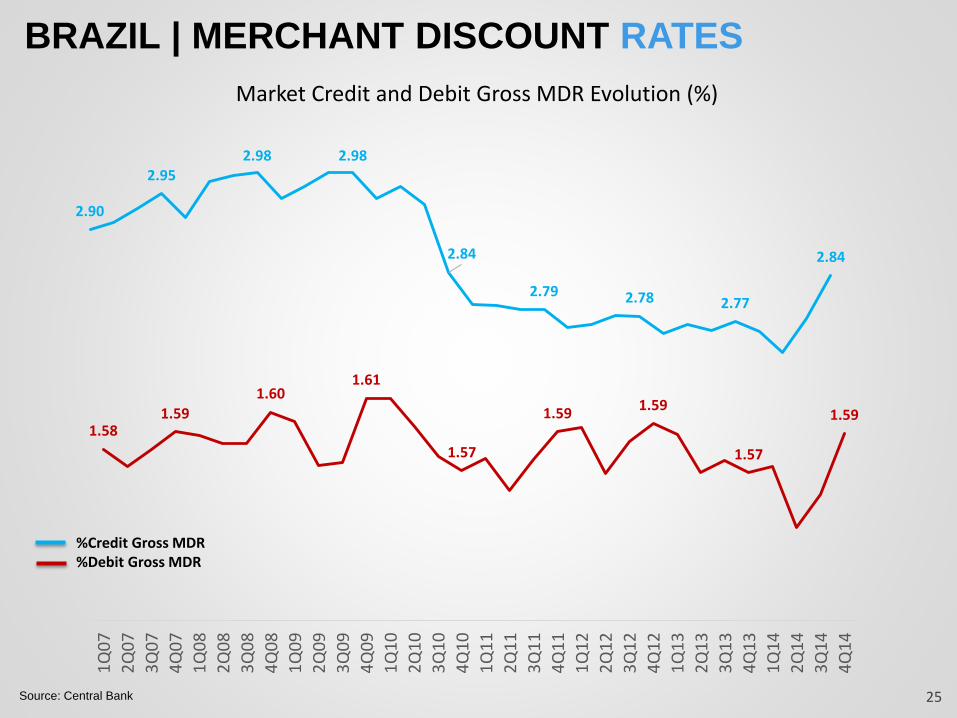
2.90
2.952.98 2.98
2.84
2.79 2.78 2.77
2.84
BRAZIL | MERCHANT DISCOUNT RATES
Source: Central Bank 25
1.581.59
1.601.61
1.57
1.591.59
1.57
1.59
1Q
07
2Q
07
3Q
07
4Q
07
1Q
08
2Q
08
3Q
08
4Q
08
1Q
09
2Q
09
3Q
09
4Q
09
1Q
10
2Q
10
3Q
10
4Q
10
1Q
11
2Q
11
3Q
11
4Q
11
1Q
12
2Q
12
3Q
12
4Q
12
1Q
13
2Q
13
3Q
13
4Q
13
1Q
14
2Q
14
3Q
14
4Q
14
%Credit Gross MDR%Debit Gross MDR
Market Credit and Debit Gross MDR Evolution (%)
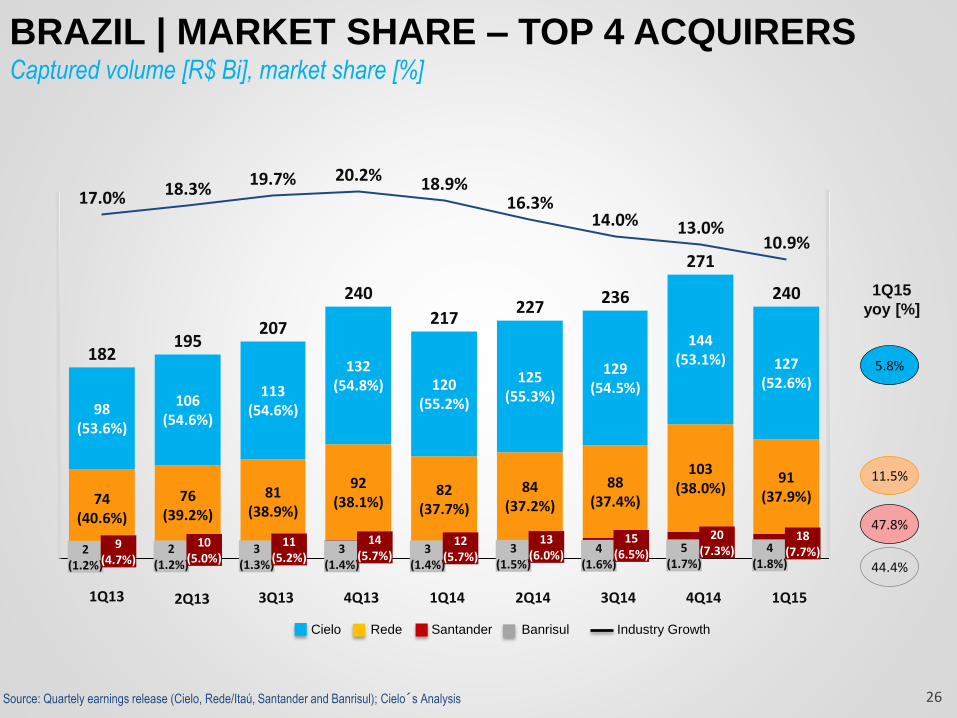
BRAZIL | MARKET SHARE – TOP 4 ACQUIRERSCaptured volume [R$ Bi], market share [%]
26Source: Quartely earnings release (Cielo, Rede/Itaú, Santander and Banrisul); Cielo´s Analysis
1Q15
240
10.9%
4(1.8%)
18(7.7%)
91(37.9%)
127(52.6%)
4Q14
271
13.0%
5(1.7%)
20(7.3%)
103(38.0%)
144(53.1%)
3Q14
236
14.0%
4(1.6%)
15(6.5%)
88(37.4%)
129(54.5%)
2Q14
227
16.3%
3(1.5%)
13(6.0%)
84(37.2%)
125(55.3%)
1Q14
217
18.9%
3(1.4%)
12(5.7%)
82(37.7%)
120(55.2%)
4Q13
240
20.2%
3(1.4%)
14(5.7%)
92(38.1%)
132(54.8%)
3Q13
207
19.7%
3(1.3%)
11(5.2%)
81(38.9%)
113(54.6%)
2Q13
195
18.3%
2(1.2%)
10(5.0%)
76(39.2%)
106(54.6%)
1Q13
182
17.0%
2(1.2%)
9(4.7%)
74(40.6%)
98(53.6%)
5.8%
11.5%
47.8%
44.4%
1Q15
yoy [%]
Cielo Rede Santander Banrisul Industry Growth
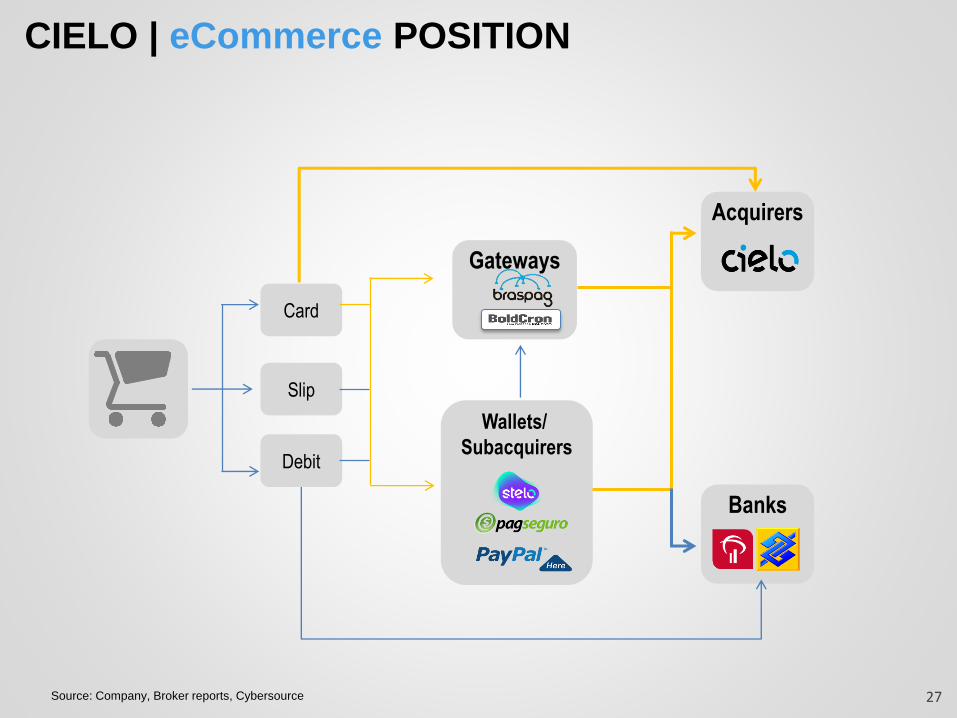
CIELO | eCommerce POSITION
Source: Company, Broker reports, Cybersource 27
Card
Slip
Acquirers
Gateways
Banks
Debit
Wallets/
Subacquirers
Copyright © Cielo | Todos os direitos reservados
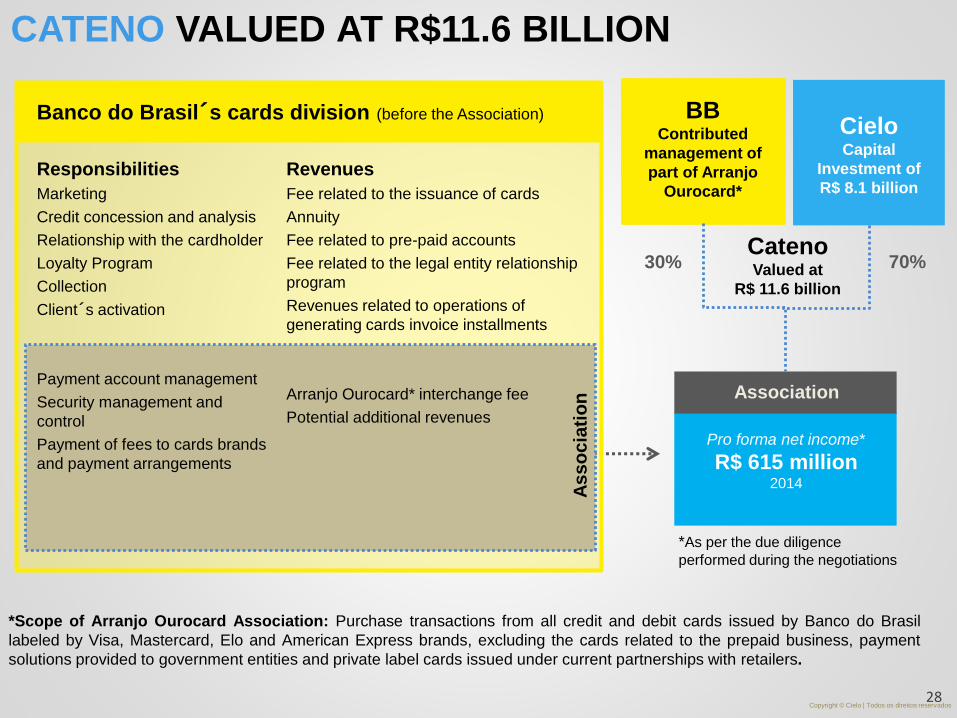
CieloCapital
Investment of
R$ 8.1 billion
30% 70%
Pro forma net income*
R$ 615 million 2014
Association
BBContributed
management of
part of Arranjo
Ourocard*
*As per the due diligence
performed during the negotiations
CatenoValued at
R$ 11.6 billion
*Scope of Arranjo Ourocard Association: Purchase transactions from all credit and debit cards issued by Banco do Brasil
labeled by Visa, Mastercard, Elo and American Express brands, excluding the cards related to the prepaid business, payment
solutions provided to government entities and private label cards issued under current partnerships with retailers.
Banco do Brasil´s cards division (before the Association)
Responsibilities
Marketing
Credit concession and analysis
Relationship with the cardholder
Loyalty Program
Collection
Client´s activation
Payment account management
Security management and
control
Payment of fees to cards brands
and payment arrangements
Revenues
Fee related to the issuance of cards
Annuity
Fee related to pre-paid accounts
Fee related to the legal entity relationship
program
Revenues related to operations of
generating cards invoice installments
Arranjo Ourocard* interchange fee
Potential additional revenues
As
so
cia
tio
n
CATENO VALUED AT R$11.6 BILLION
28
Copyright © Cielo | Todos os direitos reservados
29
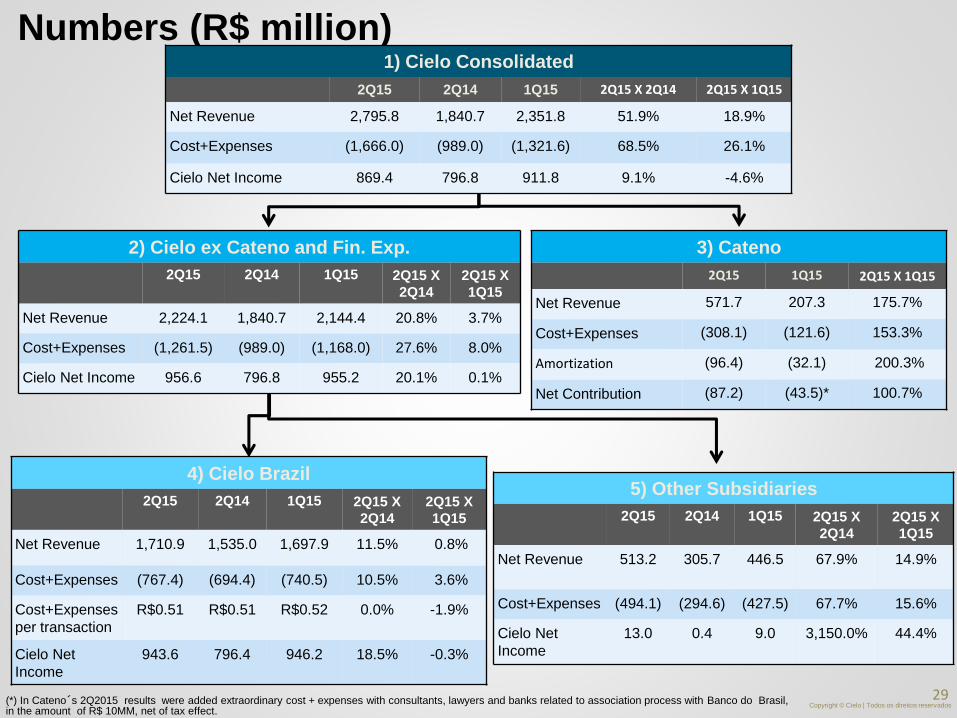
Numbers (R$ million)
4) Cielo Brazil
2Q15 2Q14 1Q15 2Q15 X
2Q14
2Q15 X
1Q15
Net Revenue 1,710.9 1,535.0 1,697.9 11.5% 0.8%
Cost+Expenses (767.4) (694.4) (740.5) 10.5% 3.6%
Cost+Expenses
per transaction
R$0.51 R$0.51 R$0.52 0.0% -1.9%
Cielo Net
Income
943.6 796.4 946.2 18.5% -0.3%
5) Other Subsidiaries
2Q15 2Q14 1Q15 2Q15 X
2Q14
2Q15 X
1Q15
Net Revenue 513.2 305.7 446.5 67.9% 14.9%
Cost+Expenses (494.1) (294.6) (427.5) 67.7% 15.6%
Cielo Net
Income
13.0 0.4 9.0 3,150.0% 44.4%
3) Cateno
2Q15 1Q15 2Q15 X 1Q15
Net Revenue 571.7 207.3 175.7%
Cost+Expenses (308.1) (121.6) 153.3%
Amortization (96.4) (32.1) 200.3%
Net Contribution (87.2) (43.5)* 100.7%
1) Cielo Consolidated
2Q15 2Q14 1Q15 2Q15 X 2Q14 2Q15 X 1Q15
Net Revenue 2,795.8 1,840.7 2,351.8 51.9% 18.9%
Cost+Expenses (1,666.0) (989.0) (1,321.6) 68.5% 26.1%
Cielo Net Income 869.4 796.8 911.8 9.1% -4.6%
2) Cielo ex Cateno and Fin. Exp.
2Q15 2Q14 1Q15 2Q15 X
2Q14
2Q15 X
1Q15
Net Revenue 2,224.1 1,840.7 2,144.4 20.8% 3.7%
Cost+Expenses (1,261.5) (989.0) (1,168.0) 27.6% 8.0%
Cielo Net Income 956.6 796.8 955.2 20.1% 0.1%
(*) In Cateno´s 2Q2015 results were added extraordinary cost + expenses with consultants, lawyers and banks related to association process with Banco do Brasil, in the amount of R$ 10MM, net of tax effect.
Copyright © Cielo | Todos os direitos reservados
30
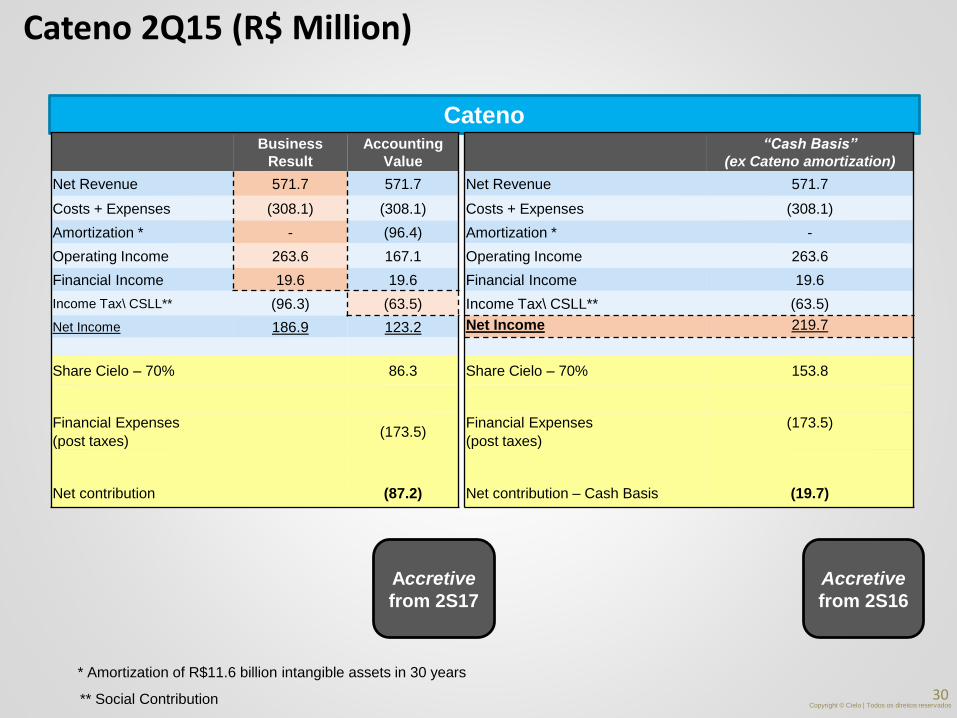
Cateno 2Q15 (R$ Million)
Cateno
* Amortization of R$11.6 billion intangible assets in 30 years
** Social Contribution
Business
Result
Accounting
Value
“Cash Basis”
(ex Cateno amortization)
Net Revenue 571.7 571.7 Net Revenue 571.7
Costs + Expenses (308.1) (308.1) Costs + Expenses (308.1)
Amortization * - (96.4) Amortization * -
Operating Income 263.6 167.1 Operating Income 263.6
Financial Income 19.6 19.6 Financial Income 19.6
Income Tax\ CSLL** (96.3) (63.5) Income Tax\ CSLL** (63.5)
Net Income 186.9 123.2 Net Income 219.7
Share Cielo – 70% 86.3 Share Cielo – 70% 153.8
Financial Expenses(173.5)
Financial Expenses (173.5)
(post taxes) (post taxes)
Net contribution (87.2) Net contribution – Cash Basis (19.7)
Accretive
from 2S16
Accretive
from 2S17
Copyright © Cielo | Todos os direitos reservados
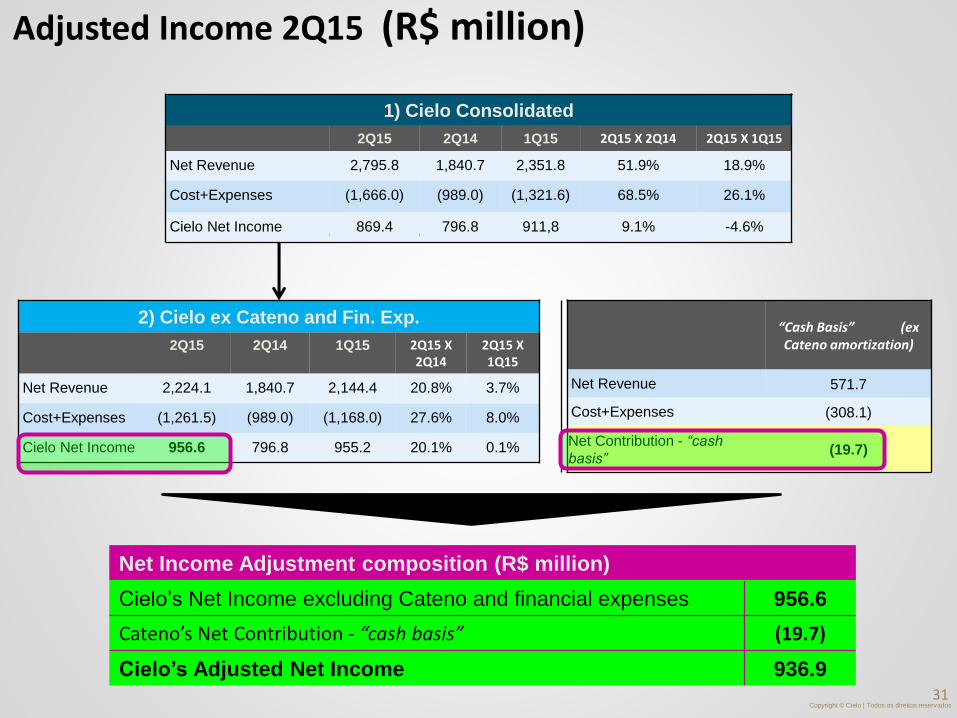
31
Adjusted Income 2Q15 (R$ million)
“Cash Basis” (ex Cateno amortization)
Net Revenue 571.7
Cost+Expenses (308.1)
Net Contribution - “cash
basis” (19.7)
1) Cielo Consolidated
2Q15 2Q14 1Q15 2Q15 X 2Q14 2Q15 X 1Q15
Net Revenue 2,795.8 1,840.7 2,351.8 51.9% 18.9%
Cost+Expenses (1,666.0) (989.0) (1,321.6) 68.5% 26.1%
Cielo Net Income 869.4 796.8 911,8 9.1% -4.6%
2) Cielo ex Cateno and Fin. Exp.
2Q15 2Q14 1Q15 2Q15 X 2Q14
2Q15 X 1Q15
Net Revenue 2,224.1 1,840.7 2,144.4 20.8% 3.7%
Cost+Expenses (1,261.5) (989.0) (1,168.0) 27.6% 8.0%
Cielo Net Income 956.6 796.8 955.2 20.1% 0.1%
Net Income Adjustment composition (R$ million)
Cielo’s Net Income excluding Cateno and financial expenses 956.6
Cateno’s Net Contribution - “cash basis” (19.7)
Cielo’s Adjusted Net Income 936.9
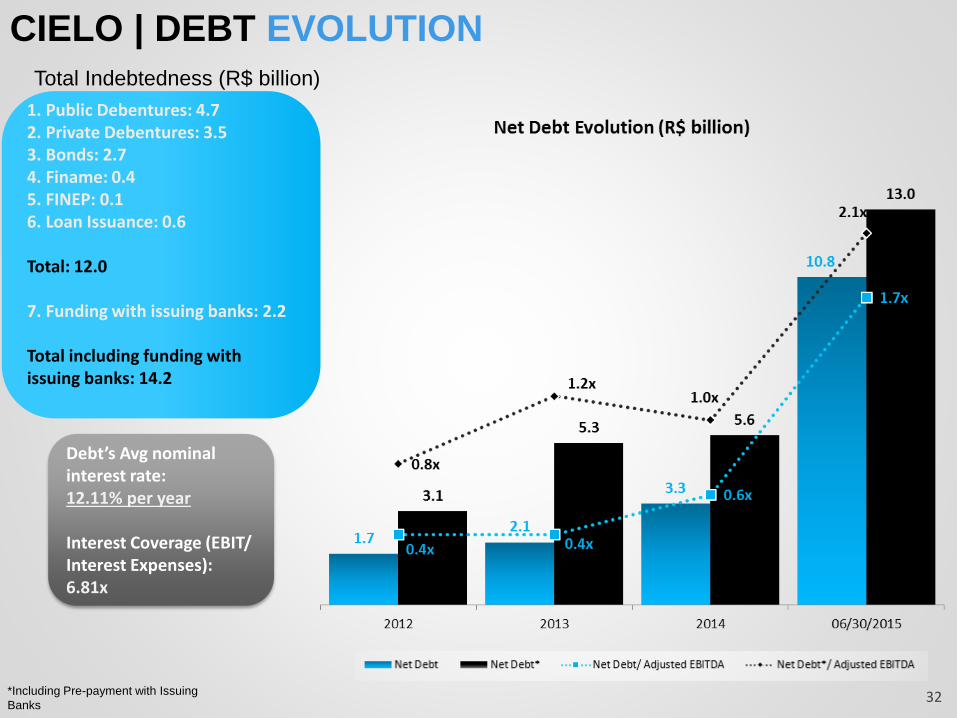
CIELO | DEBT EVOLUTION
32
Total Indebtedness (R$ billion)
*Including Pre-payment with Issuing
Banks
1. Public Debentures: 4.72. Private Debentures: 3.53. Bonds: 2.74. Finame: 0.45. FINEP: 0.16. Loan Issuance: 0.6
Total: 12.0
7. Funding with issuing banks: 2.2
Total including funding with issuing banks: 14.2
Debt’s Avg nominal interest rate: 12.11% per year
Interest Coverage (EBIT/ Interest Expenses): 6.81x
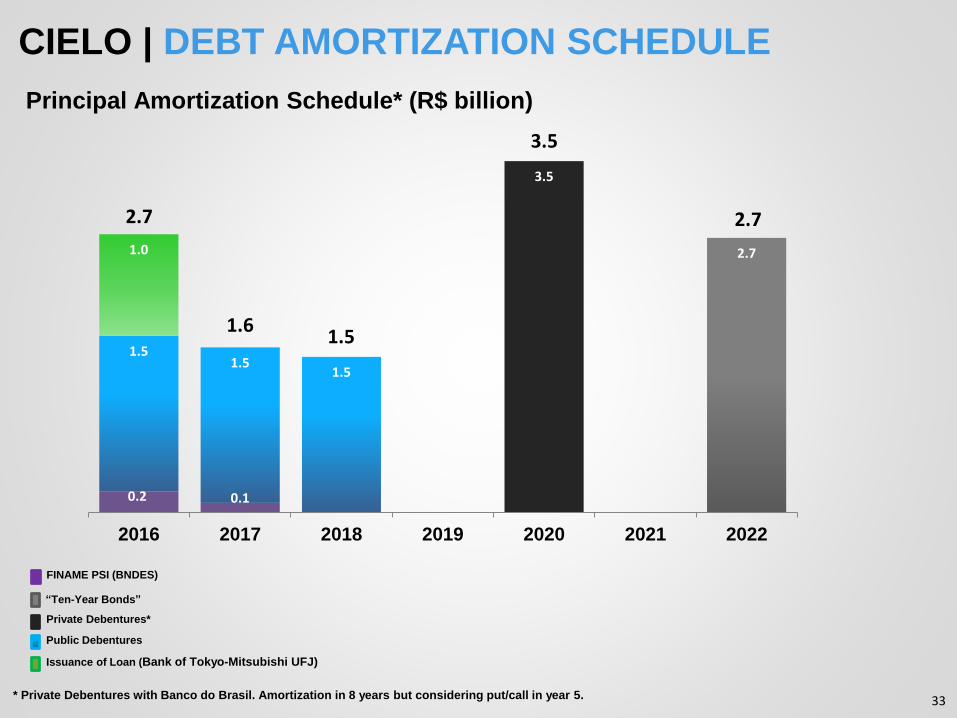
0.2 0.1
2.7
3.5
1.51.5
1.5
0.0
1.0
2016 2017 2018 2019 2020 2021 2022
CIELO | DEBT AMORTIZATION SCHEDULE
33
“Ten-Year Bonds”
Private Debentures*
FINAME PSI (BNDES)
Principal Amortization Schedule* (R$ billion)
Public Debentures
* Private Debentures with Banco do Brasil. Amortization in 8 years but considering put/call in year 5.
Issuance of Loan (Bank of Tokyo-Mitsubishi UFJ)
3.5
2.7
1.51.6
2.7
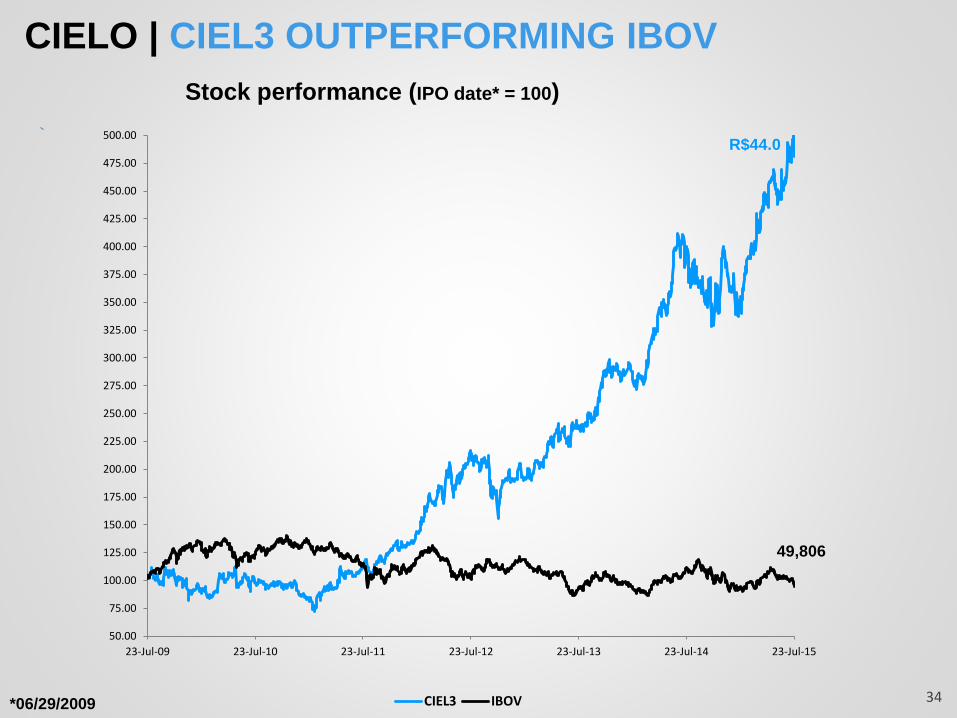
CIELO | CIEL3 OUTPERFORMING IBOV
Stock performance (IPO date* = 100)
*06/29/2009 34
50.00
75.00
100.00
125.00
150.00
175.00
200.00
225.00
250.00
275.00
300.00
325.00
350.00
375.00
400.00
425.00
450.00
475.00
500.00
23-Jul-09 23-Jul-10 23-Jul-11 23-Jul-12 23-Jul-13 23-Jul-14 23-Jul-15
CIEL3 IBOV
R$44.0
49,806

Copyright © Cielo | Todos os direitos reservados
RELATIONSwww.cielo.com.br/ri
E-mail: [email protected]
Phone: + 55 11 2596-8458
INVESTOR