20150515 gavin long
29
Data based approaches to urban energy modelling Gavin Long
-
Upload
lucasproject -
Category
Education
-
view
18 -
download
1
Transcript of 20150515 gavin long
Data based approaches to urban energy modelling
Gavin Long
Presentation plan
• The InSMART project
• Geospatial data for urban modelling
• Constructing a residential building stock model for Nottingham
• Data challenges for city scale micro-simulation
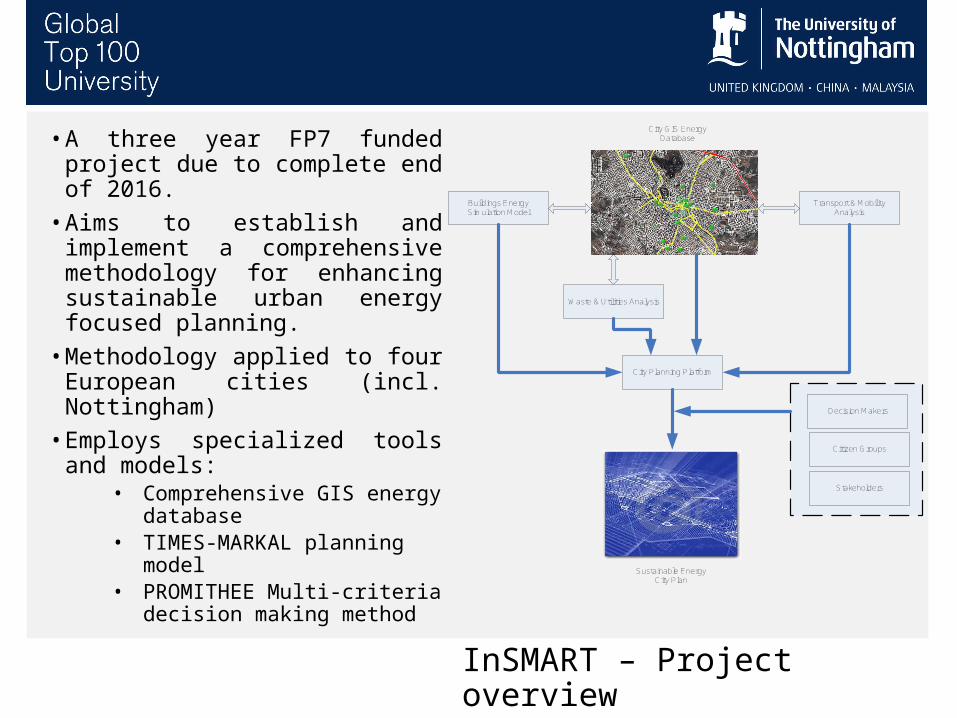
InSMART – Project overview
• A three year FP7 funded project due to complete end of 2016.
• Aims to establish and implement a comprehensive methodology for enhancing sustainable urban energy focused planning.
• Methodology applied to four European cities (incl. Nottingham)
• Employs specialized tools and models:
• Comprehensive GIS energy database
• TIMES-MARKAL planning model
• PROMITHEE Multi-criteria decision making method
Waste & Utilities Analysis
Buildings EnergySimulation Model
Transport & Mobility Analysis
City Planning Platform
City GIS Energy Database
Sustainable Energy City Plan
Decision Makers
Stakeholders
Citizen Groups
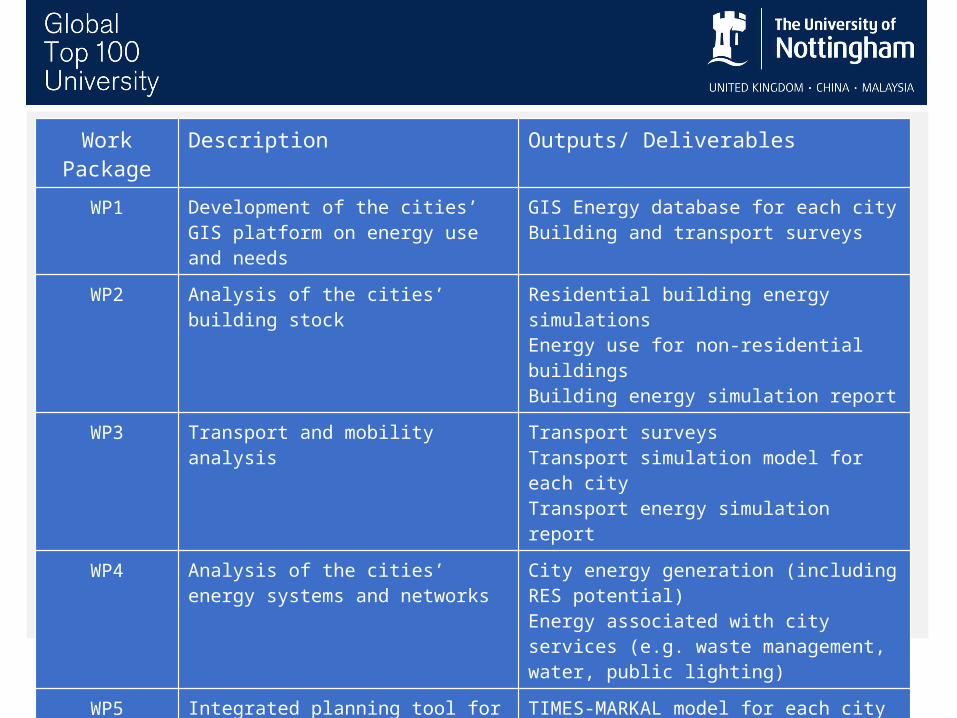
InSMART – Project structure
Work Package Description Outputs/ Deliverables
WP1 Development of the cities’ GIS platform on energy use and needs
GIS Energy database for each cityBuilding and transport surveys
WP2 Analysis of the cities’ building stock Residential building energy simulationsEnergy use for non-residential buildingsBuilding energy simulation report
WP3 Transport and mobility analysis Transport surveysTransport simulation model for each cityTransport energy simulation report
WP4 Analysis of the cities’ energy systems and networks
City energy generation (including RES potential)Energy associated with city services (e.g. waste management, water, public lighting)
WP5 Integrated planning tool for the development of strategic sustainable energy plans
TIMES-MARKAL model for each cityOptimal energy scenarios
WP6 Development of mid-term implementation action plans
Sustainable energy action plans to 2030 for each city
WP7/8 Dissemination and project management Project web site
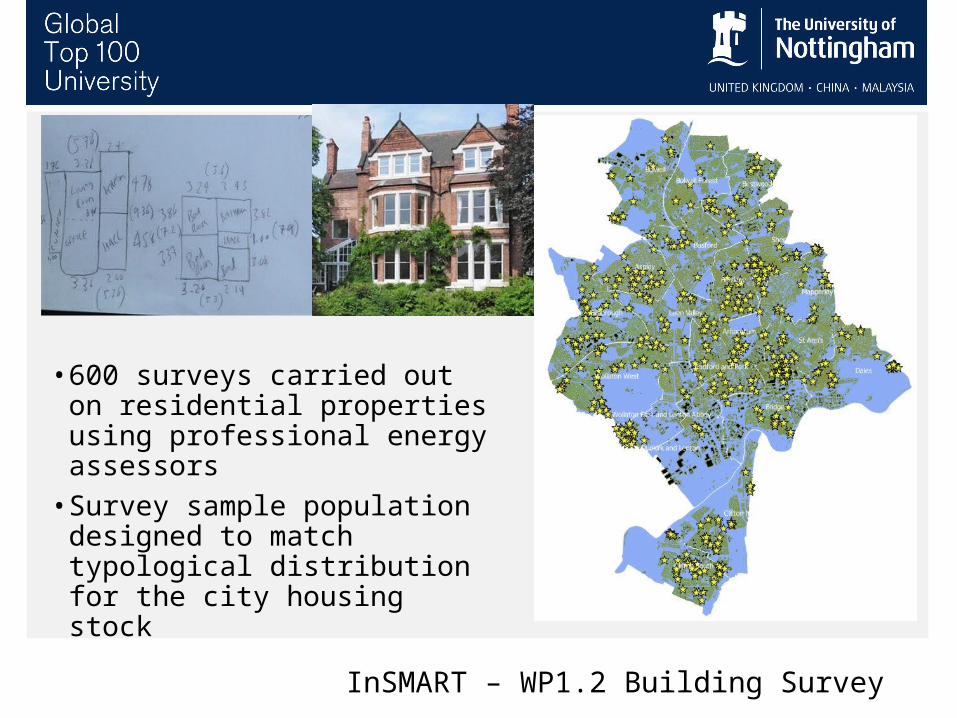
InSMART – WP1.2 Building Survey
• 600 surveys carried out on residential properties using professional energy assessors
• Survey sample population designed to match typological distribution for the city housing stock
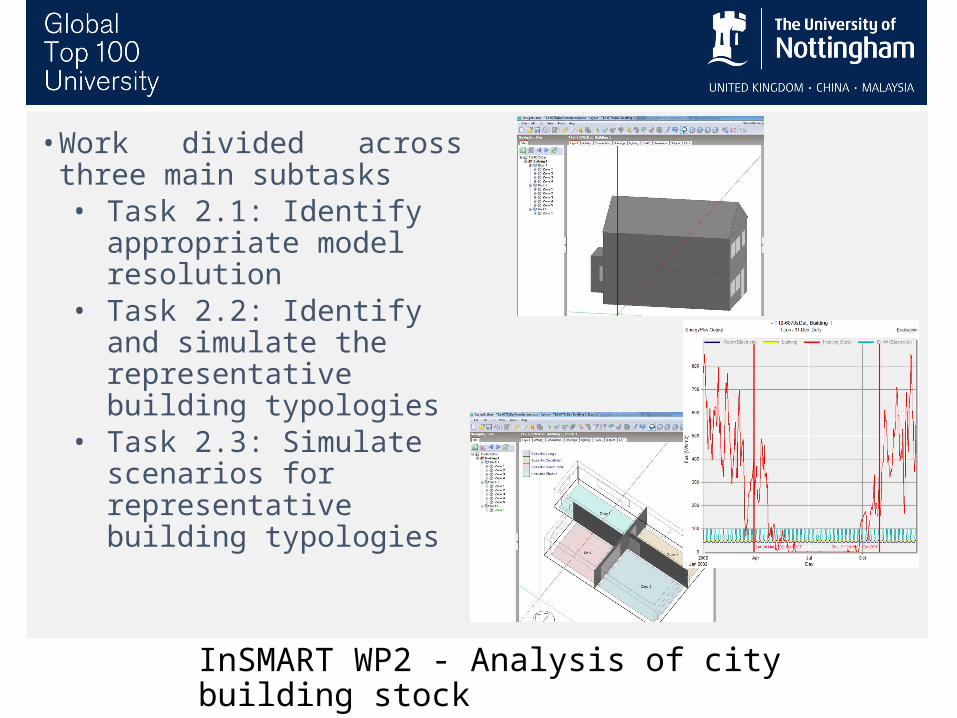
InSMART WP2 - Analysis of city building stock
• Work divided across three main subtasks• Task 2.1: Identify appropriate
model resolution • Task 2.2: Identify and
simulate the representative building typologies
• Task 2.3: Simulate scenarios for representative building typologies
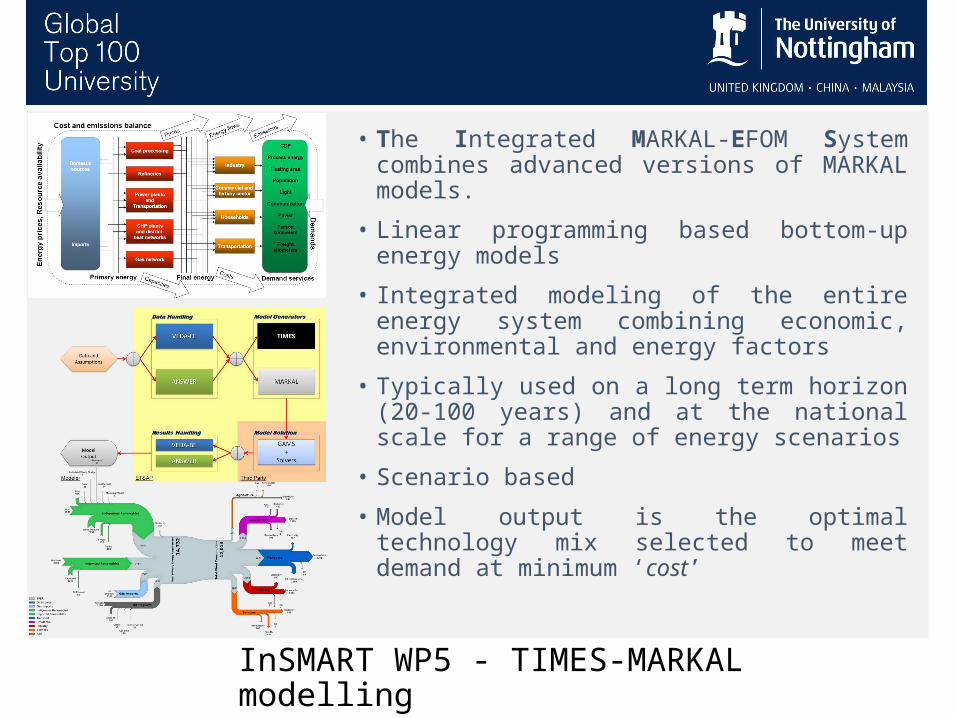
InSMART WP5 - TIMES-MARKAL modelling
• The Integrated MARKAL-EFOM System combines advanced versions of MARKAL models.
• Linear programming based bottom-up energy models
• Integrated modeling of the entire energy system combining economic, environmental and energy factors
• Typically used on a long term horizon (20-100 years) and at the national scale for a range of energy scenarios
• Scenario based
• Model output is the optimal technology mix selected to meet demand at minimum ‘cost’
GEOSPATIAL DATA FOR URBAN MODELLING
Approaches to urban modelling Data types, aggregation units and sources
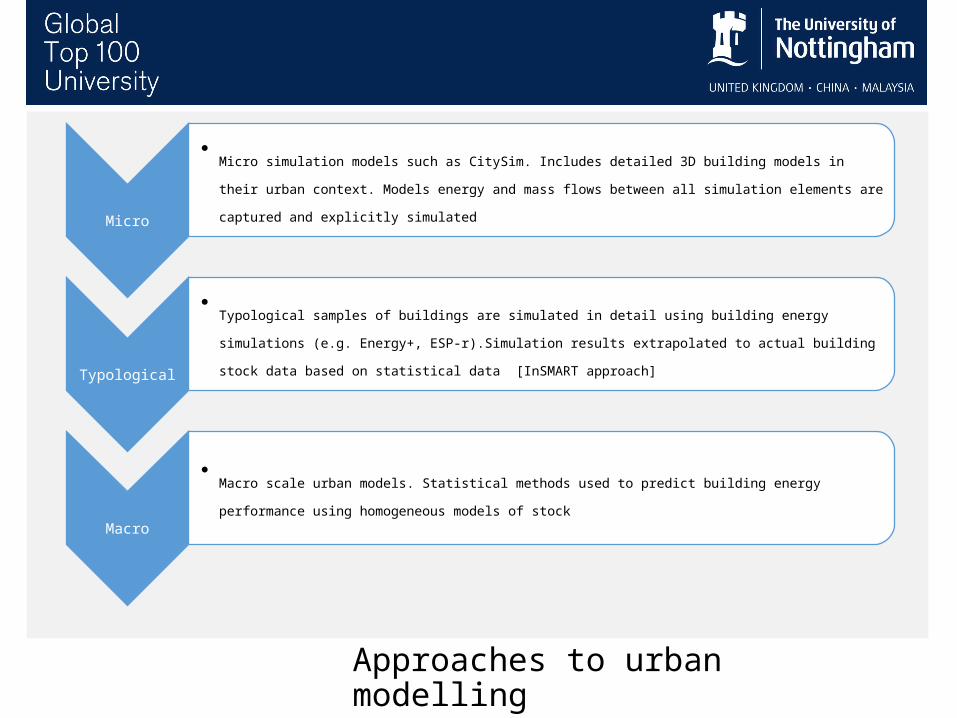
Approaches to urban modelling
Micro
•Micro simulation models such as CitySim. Includes detailed 3D building models in their urban context. Models energy and
mass flows between all simulation elements are captured and explicitly simulated
Typolog
ical
•Typological samples of buildings are simulated in detail using building energy simulations (e.g. Energy+, ESP-r).Simulation
results extrapolated to actual building stock data based on statistical data [InSMART approach]
Macro
•Macro scale urban models. Statistical methods used to predict building energy performance using homogeneous models of
stock
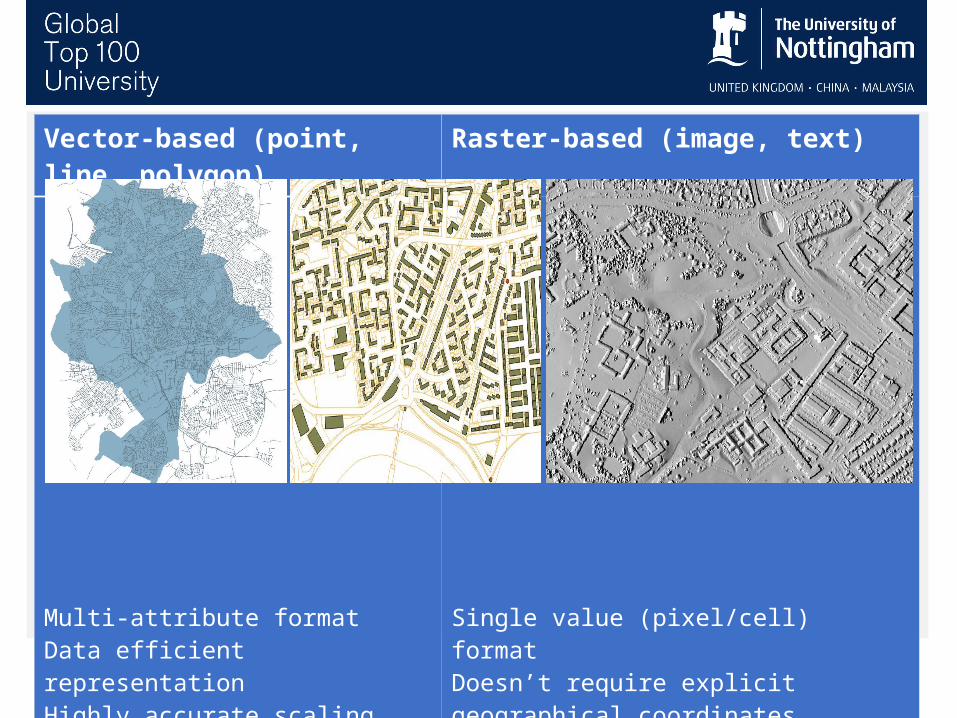
Spatial datatypes
Vector-based (point, line, polygon) Raster-based (image, text)
H
Multi-attribute formatData efficient representationHighly accurate scaling
Single value (pixel/cell) formatDoesn’t require explicit geographical coordinatesComputationally simple to analyse and process
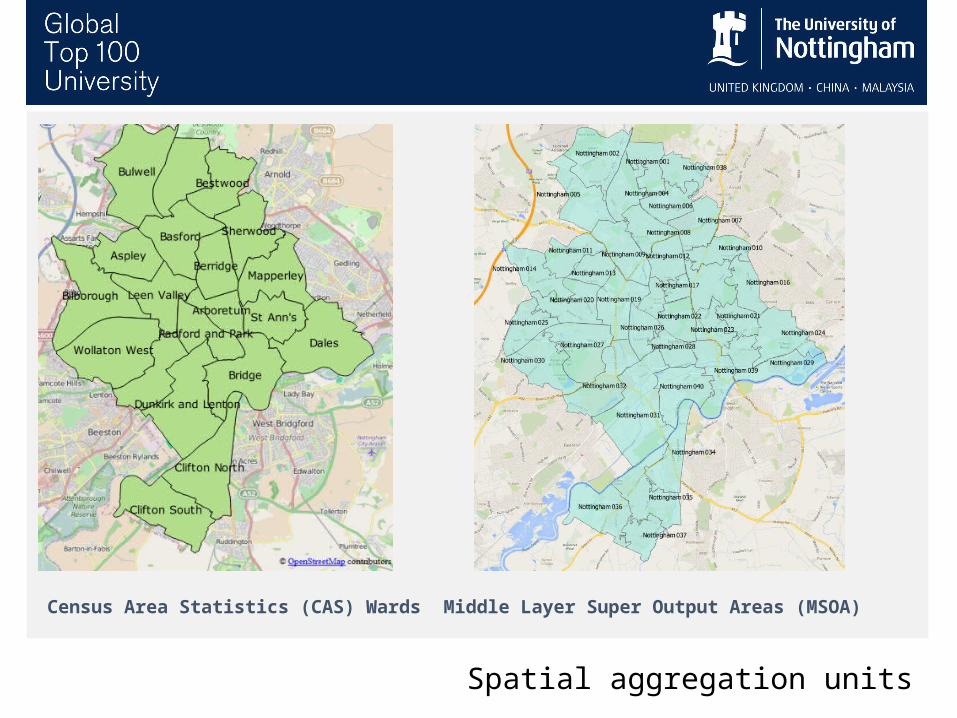
Spatial aggregation units
Census Area Statistics (CAS) Wards Middle Layer Super Output Areas (MSOA)
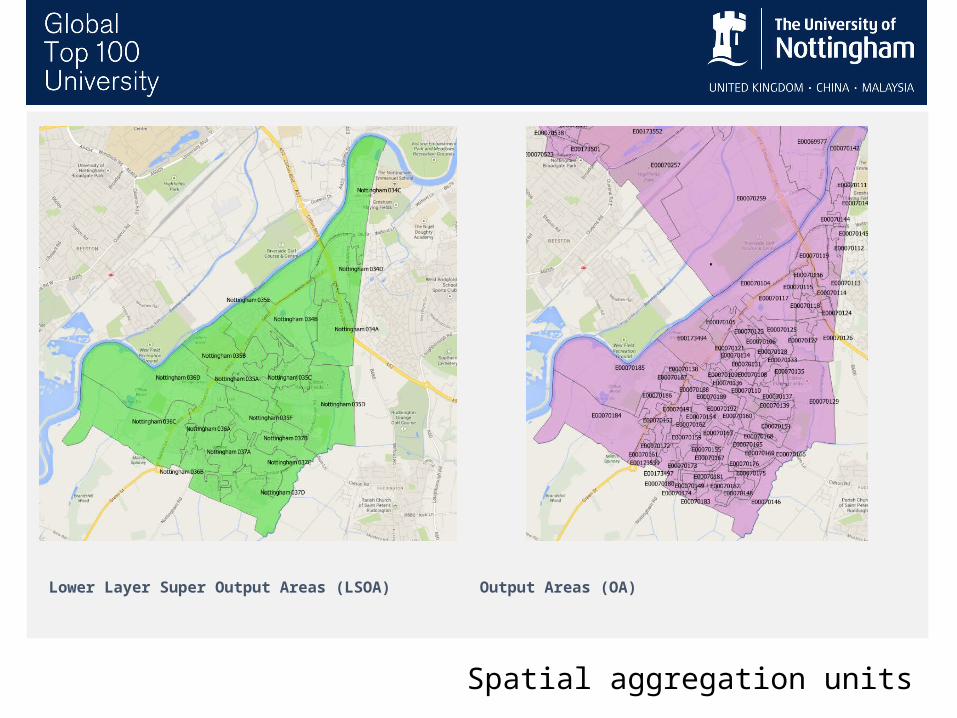
Spatial aggregation units
Lower Layer Super Output Areas (LSOA) Output Areas (OA)
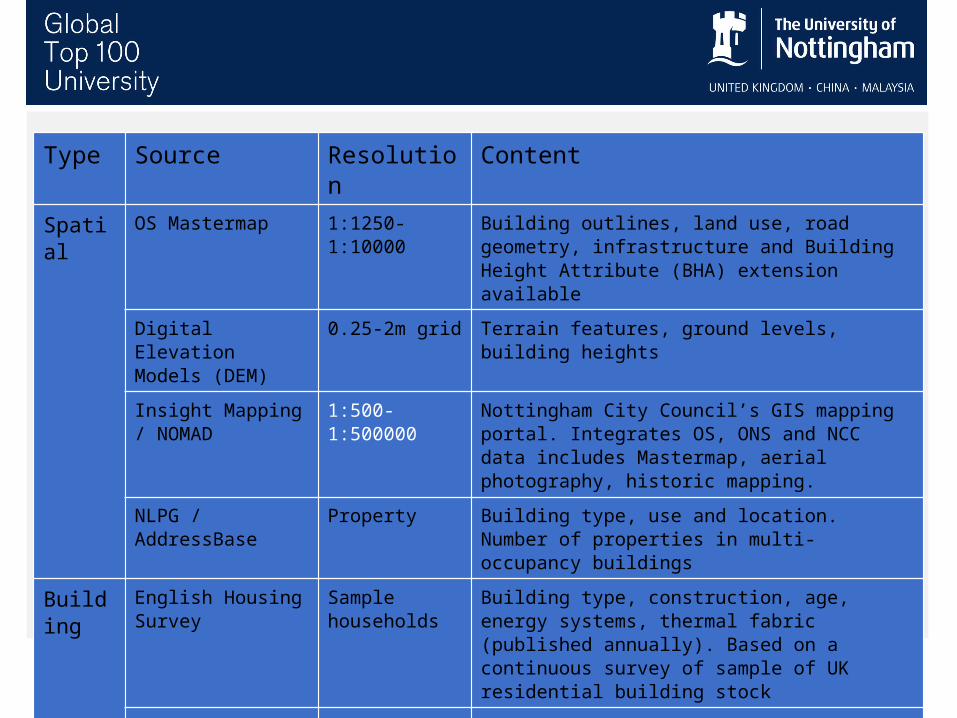
Potential data sources for urban modelling
Type Source Resolution Content
Spatial OS Mastermap 1:1250-1:10000 Building outlines, land use, road geometry, infrastructure and Building Height Attribute (BHA) extension available
Digital Elevation Models (DEM)
0.25-2m grid Terrain features, ground levels, building heights
Insight Mapping / NOMAD
1:500-1:500000 Nottingham City Council’s GIS mapping portal. Integrates OS, ONS and NCC data includes Mastermap, aerial photography, historic mapping.
NLPG / AddressBase Property Building type, use and location. Number of properties in multi-occupancy buildings
Building English Housing Survey Sample households
Building type, construction, age, energy systems, thermal fabric (published annually). Based on a continuous survey of sample of UK residential building stock
UK Census LSOA/OA Building type, heating systems, tenure
Nottingham City Homes Stock database
Property (NCH owned only)
Building type, construction material, date of construction
InSMART Building survey
Sample Households
Building fabric and modifications, floorplans, energy systems and use, occupancy profile, electrical appliances
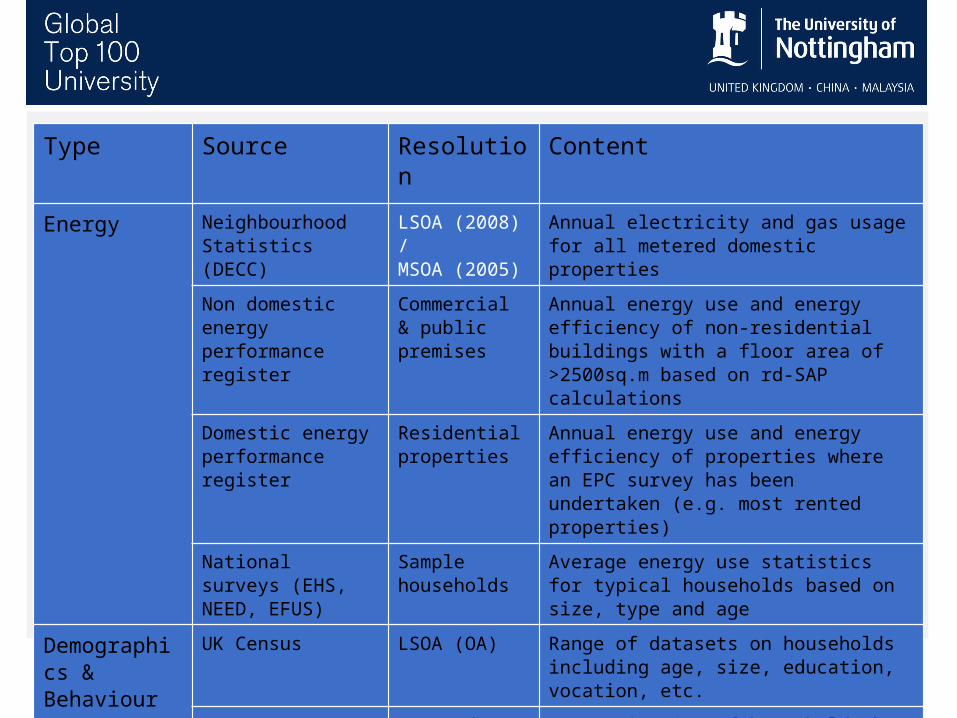
Potential data sources for urban modelling
Type Source Resolution Content
Energy Neighbourhood Statistics (DECC)
LSOA (2008) /MSOA (2005)
Annual electricity and gas usage for all metered domestic properties
Non domestic energy performance register
Commercial & public premises
Annual energy use and energy efficiency of non-residential buildings with a floor area of >2500sq.m based on rd-SAP calculations
Domestic energy performance register
Residential properties
Annual energy use and energy efficiency of properties where an EPC survey has been undertaken (e.g. most rented properties)
National surveys (EHS, NEED, EFUS)
Sample households
Average energy use statistics for typical households based on size, type and age
Demographics & Behaviour
UK Census LSOA (OA) Range of datasets on households including age, size, education, vocation, etc.
MOSAIC Postcode Categorisation of households by a range of factors (e.g. financial, educational, lifestyle and vocational) (updated regularly)
Misc. studies Households / Individuals
Range of surveys relating to energy related behaviour (e.g. Time Use, Powering the Nation)
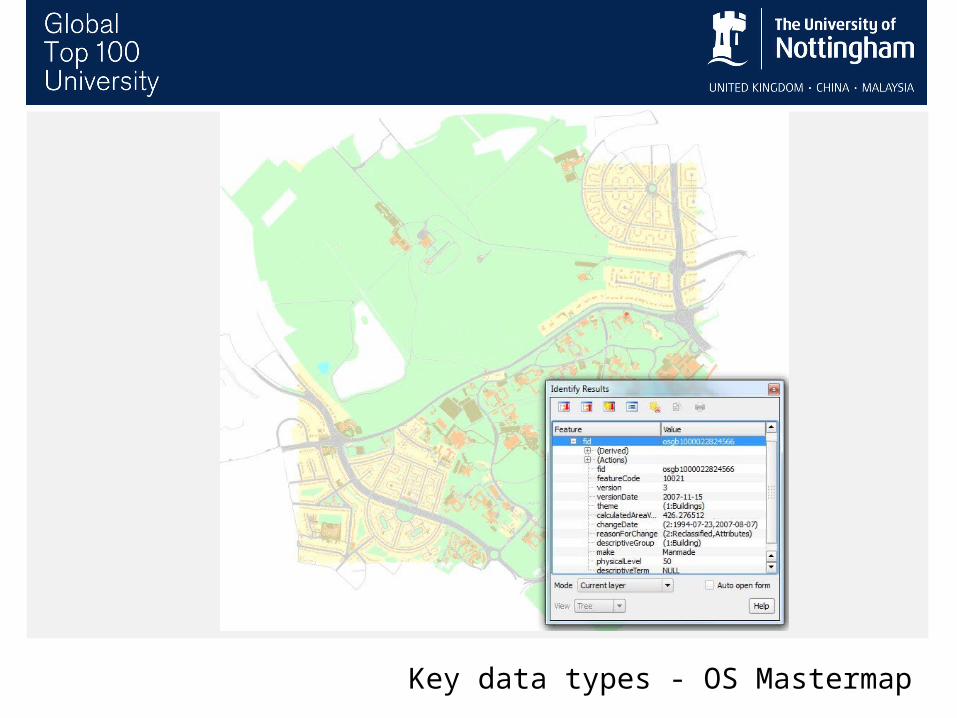
Key data types - OS Mastermap
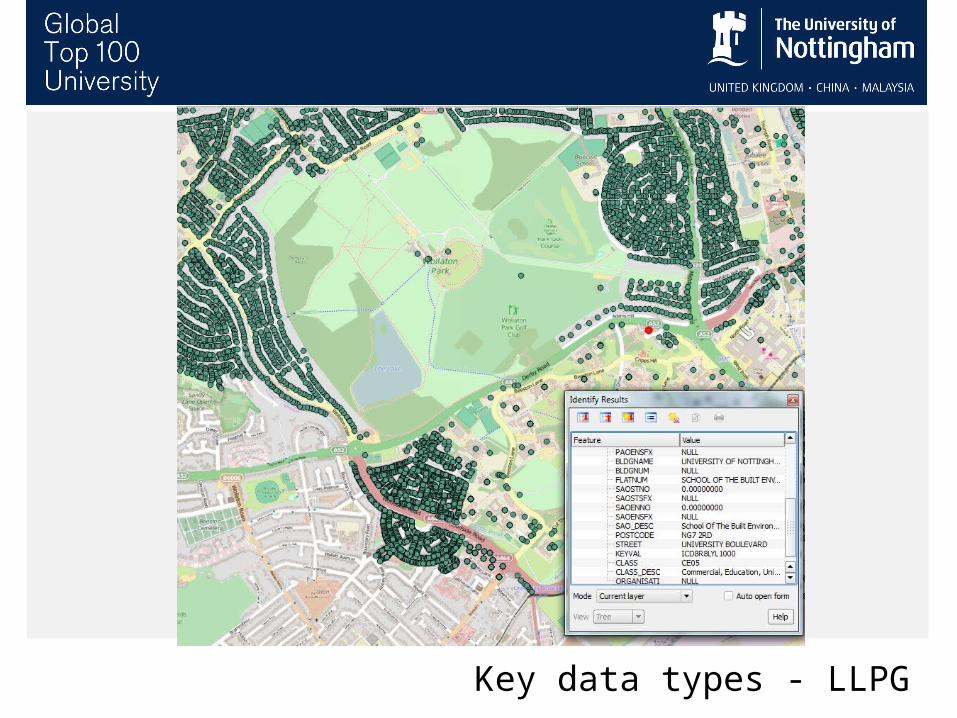
Key data types - LLPG

CASE STUDY
Constructing a residential building stock model for Nottingham
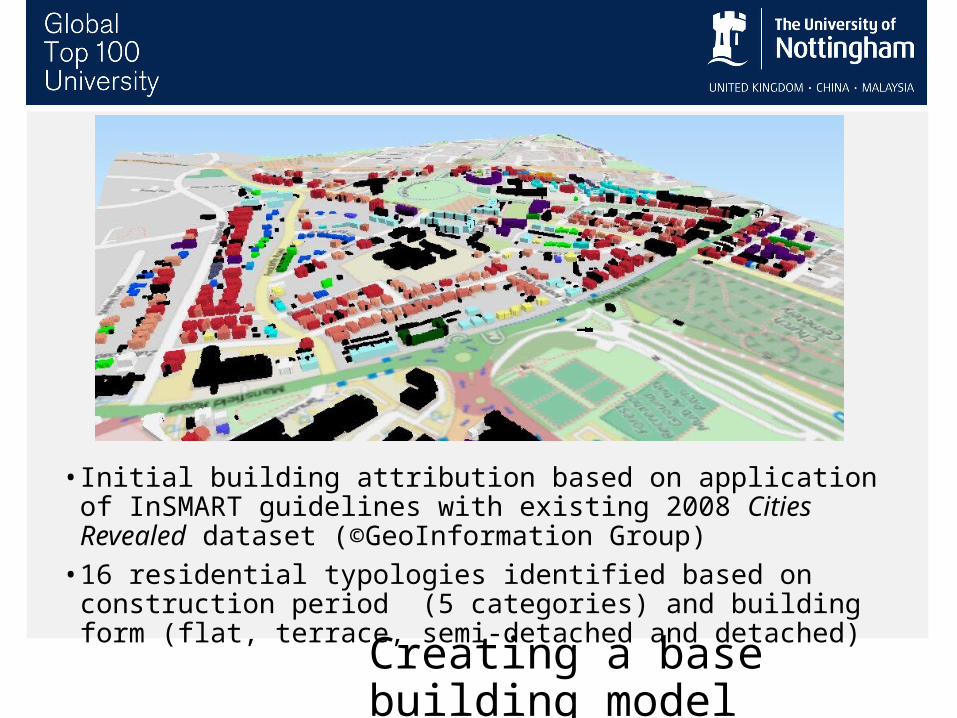
Creating a base building model
• Initial building attribution based on application of InSMART guidelines with existing 2008 Cities Revealed dataset (©GeoInformation Group)
• 16 residential typologies identified based on construction period (5 categories) and building form (flat, terrace, semi-detached and detached)
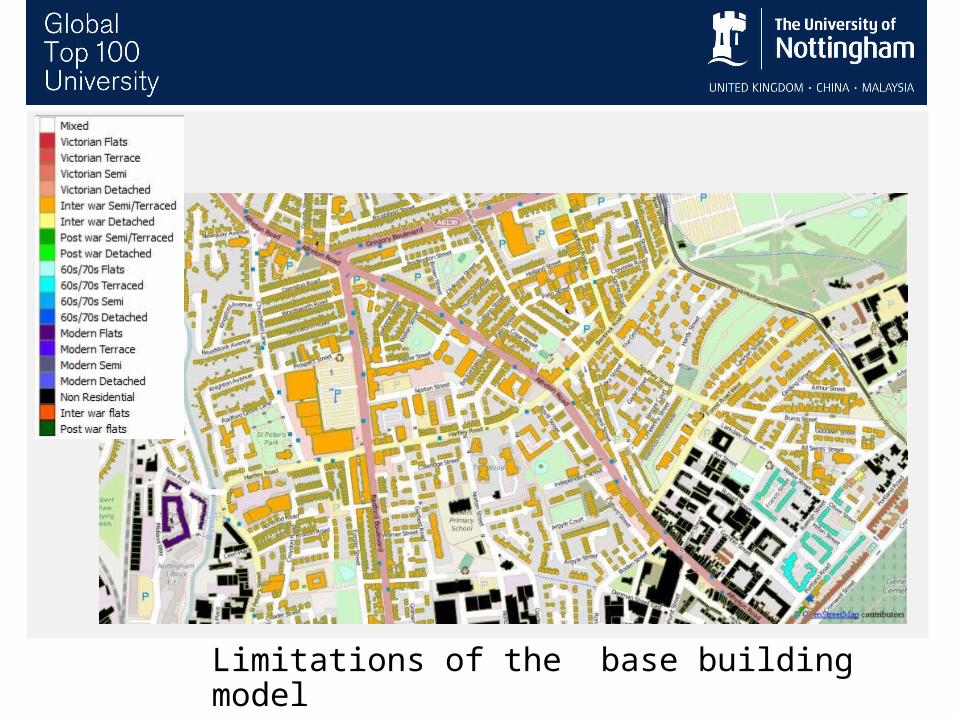
Limitations of the base building model
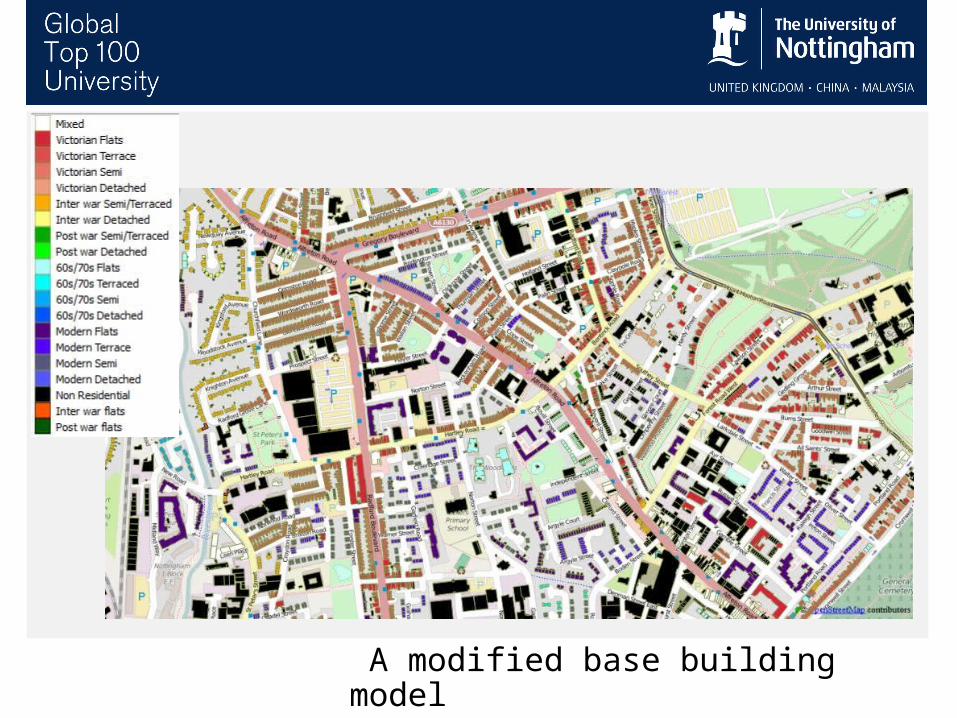
A modified base building model
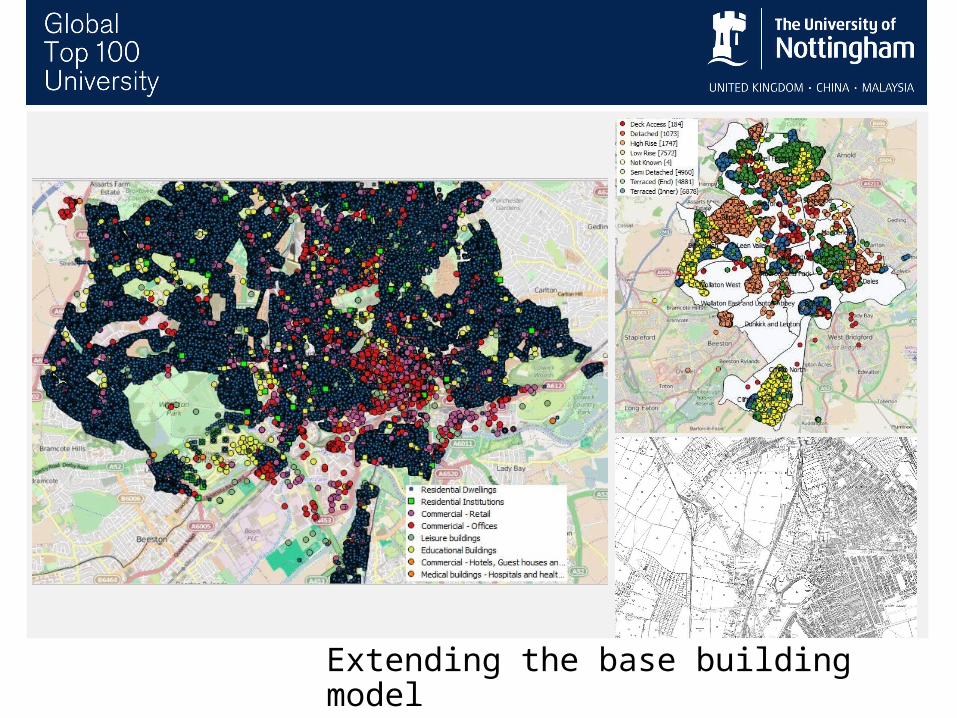
Extending the base building model
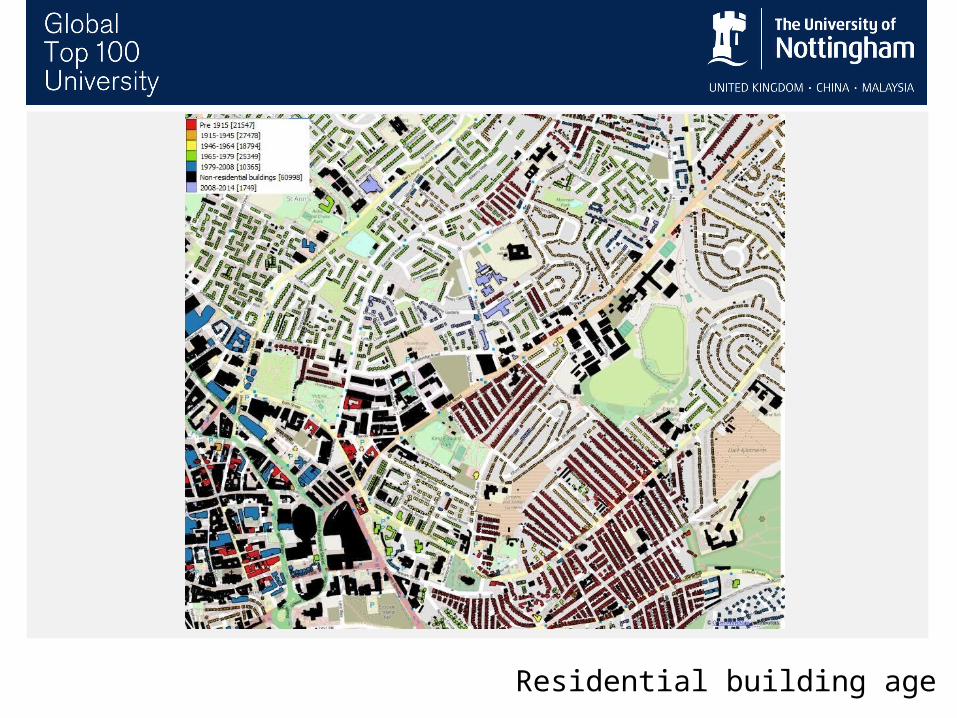
Residential building age
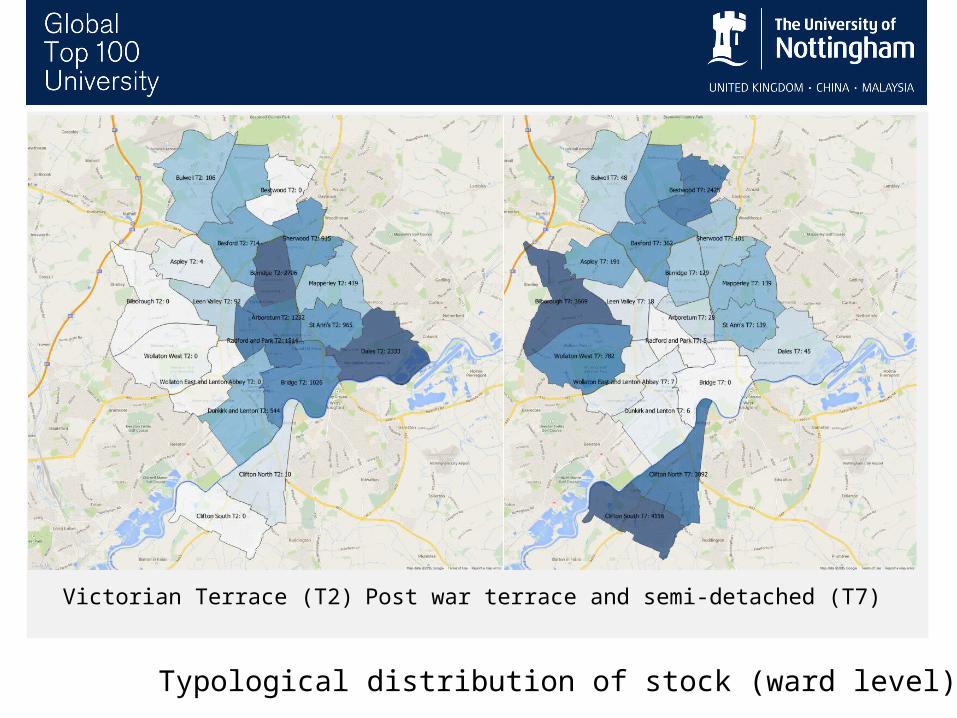
Typological distribution of stock (ward level)
Victorian Terrace (T2) Post war terrace and semi-detached (T7)
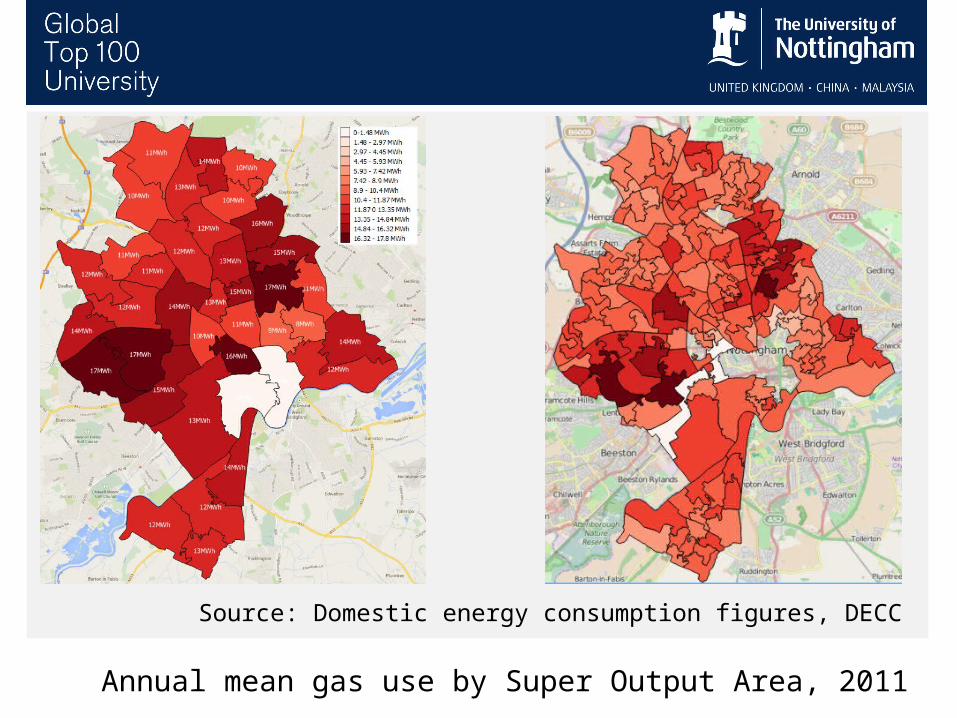
Annual mean gas use by Super Output Area, 2011
Source: Domestic energy consumption figures, DECC
Data Challenges for city scale micro-simulation
Data gaps, quality and consistency
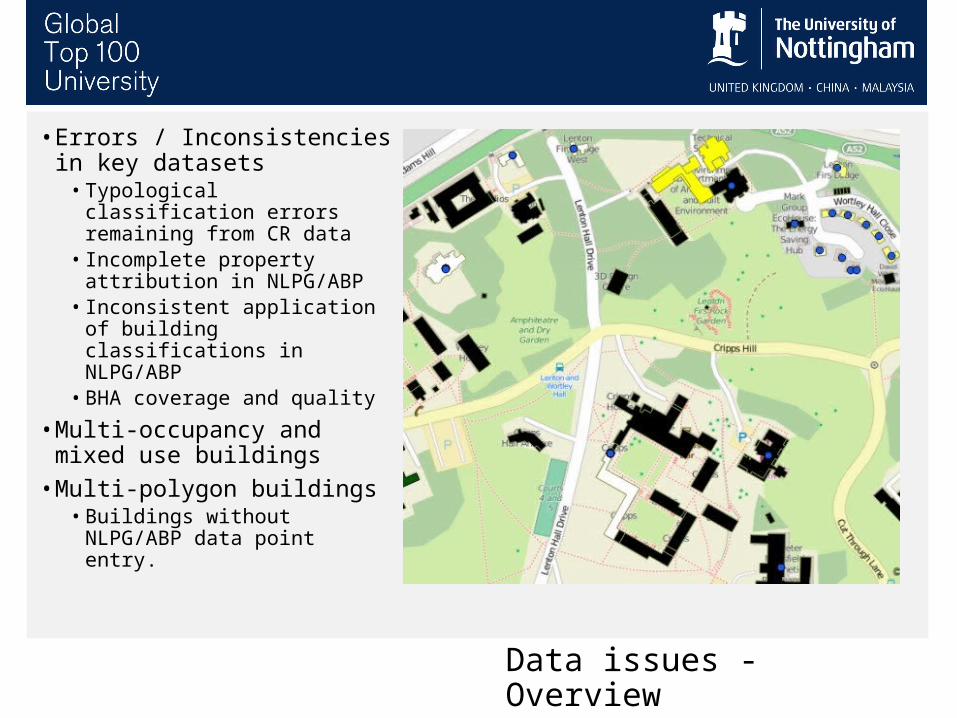
Data issues - Overview
• Errors / Inconsistencies in key datasets
• Typological classification errors remaining from CR data
• Incomplete property attribution in NLPG/ABP
• Inconsistent application of building classifications in NLPG/ABP
• BHA coverage and quality
• Multi-occupancy and mixed use buildings
• Multi-polygon buildings • Buildings without NLPG/ABP
data point entry.
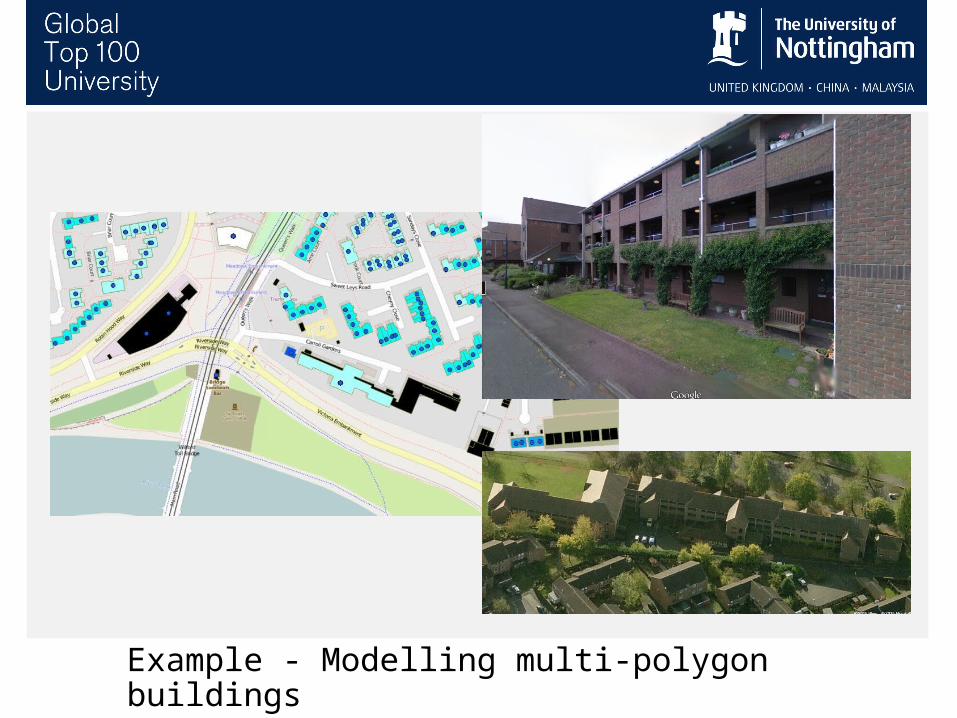
Example - Modelling multi-polygon buildings
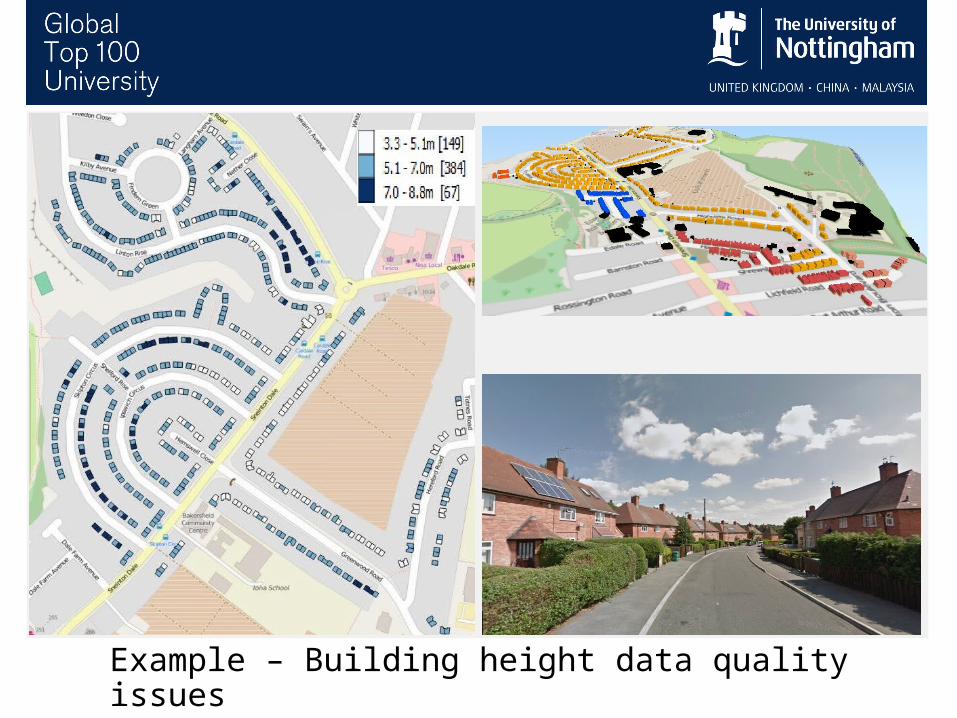
Example – Building height data quality issues

Thank you for your time (and patience)
Questions?


![Final Aisan Complaint Harvard Document 20150515[1]](https://static.fdocuments.in/doc/165x107/577cb5631a28aba7118d1c4c/final-aisan-complaint-harvard-document-201505151.jpg)