2015 VIRGINIA ON-FARM WHEAT TEST PLOTS · treatment for the control of aphids and barley yellow...
25
2015 Virginia Polytechnic Institute and State University ANR-159NP Virginia Cooperative Extension programs and employment are open to all, regardless of age, color, disability, gender, gender identity, gender expression, national origin, political affiliation, race, religion, sexual orientation, genetic information, veteran status, or any other basis protected by law. An equal opportunity/affirmative action employer. Issued in furtherance of Cooperative Extension work, Virginia Polytechnic Institute and State University, Virginia State University, and the U.S. Department of Agriculture cooperating. Edwin J. Jones, Director, Virginia Cooperative Extension, Virginia Tech, Blacksburg; Jewel E. Hairston, Administrator, 1890 Extension Program, Virginia State, Petersburg. 2015 VIRGINIA ON-FARM WHEAT TEST PLOTS A Summary of Replicated Research and Demonstration Plots Conducted by Virginia Cooperative Extension in Cooperation with Local Producers and Agribusinesses CONDUCTED AND SUMMARIZED BY: Keith Balderson, Extension Agent, Essex County Roy Flanagan, Extension Agent, Virginia Beach Trent Jones, Extension Agent, Northumberland and Lancaster Counties Watson Lawrence, Extension Agent, City of Chesapeake David Moore, Extension Agent, Middlesex County Scott Reiter, Extension Agent, Prince George County Stephanie Romelczyk, Extension Agent, Westmoreland County Glenn Chappell, II, Virginia State University Wade Thomason, Extension Grains Specialist, Virginia Tech FINANCIAL ASSISTANCE PROVIDED BY: VIRGINIA SMALL GRAINS BOARD
Transcript of 2015 VIRGINIA ON-FARM WHEAT TEST PLOTS · treatment for the control of aphids and barley yellow...

2015 Virginia Polytechnic Institute and State University ANR-159NP
Virginia Cooperative Extension programs and employment are open to all, regardless of age, color, disability, gender, gender identity, gender expression, national origin, political affiliation, race, religion, sexual orientation, genetic information, veteran status, or any other basis protected by law. An equal opportunity/affirmative action employer. Issued in furtherance of Cooperative Extension work, Virginia Polytechnic Institute
and State University, Virginia State University, and the U.S. Department of Agriculture cooperating. Edwin J. Jones, Director, Virginia Cooperative Extension, Virginia Tech, Blacksburg; Jewel E. Hairston, Administrator, 1890 Extension Program, Virginia State, Petersburg.
2015 VIRGINIA ON-FARM WHEAT TEST PLOTS
A Summary of Replicated Research and Demonstration Plots Conducted by Virginia Cooperative Extension in Cooperation with Local Producers and Agribusinesses
CONDUCTED AND SUMMARIZED BY:
Keith Balderson, Extension Agent, Essex County Roy Flanagan, Extension Agent, Virginia Beach Trent Jones, Extension Agent, Northumberland and Lancaster Counties Watson Lawrence, Extension Agent, City of Chesapeake David Moore, Extension Agent, Middlesex County Scott Reiter, Extension Agent, Prince George County Stephanie Romelczyk, Extension Agent, Westmoreland County Glenn Chappell, II, Virginia State University Wade Thomason, Extension Grains Specialist, Virginia Tech
FINANCIAL ASSISTANCE PROVIDED BY: VIRGINIA SMALL GRAINS BOARD

2
INTRODUCTION
The demonstration and research plot results discussed in this publication are a cooperative effort by seven Virginia Cooperative Extension agents, extension specialists from Virginia Tech, and an associate professor at the Virginia State University School of Agriculture. We are proud to present this year’s on-farm small grain plot work to you. We hope the information in this publication will help farmers produce a profitable crop in 2016. The field work and printing of this publication are supported by the Virginia Small Grains Check-Off Funds. The cooperators gratefully acknowledge this support. Any small grain producer or agribusiness personnel who would like to receive a copy of this report should contact his/her local extension agent, who can request a copy from Keith Balderson in Essex County at 804 443-3551 or [email protected]. This is the twenty-second year of this multi-year project. Further work is planned for the upcoming growing season. The authors wish to thank the many producers who participated in this project. Appreciation is extended to the seed, chemical, and fertilizer representatives who donated products and/or assisted with the field work and to Taylor Sabo, 2015 Essex and Middlesex County VCE intern for his assistance with data compilation. DISCLAIMER: Trade and brand names are used for educational purposes only, and Virginia Cooperative Extension does not guarantee or warrant the standards of the products, nor does Virginia Cooperative Extension imply approval of the product to the exclusion of others which may be suitable.

3
TABLE OF CONTENTS Page General Summary. . . . . . . . . . . . . . . . . . . . . . . . . . . . . . . . . . . . . . . . . . . . . . . . . . 4 Wheat Variety Plots. . . . . . . . . . . . . . . . . . . . . . . . . . . . . . . . . . . . . . . . . . . . . . . . 5-16 Seed Treatment Plot. . . . . . . . . . . . . . . . . . . . . . . . . . . . . . . . . . . . . . . . . . . . . . . . 17 Fusarium Head Blight Fungicide Plots. . . . . . . . . . . . . . . . . . . . . . . . . . . . . . . . . . 18-21 Growth Regulator Plot . . . . . . . . . . . . . . . . . . . . . . . . . . . . . . . . . . . . . . . . . . . . . . 22 Tissue Testing Results. . . . . . . . . . . . . . . . . . . . . . . . . . . . . . . . . . . . . . . . . . . . . . . 23-25

4
GENERAL SUMMARY
A. VARIETY SELECTION: Variety selection remains one of the most important components of wheat
production. Five wheat variety plots were planted in eastern Virginia. Three plots were located in the central and upper coastal plain at Virginia State University and Westmoreland and Middlesex Counties. Fifteen wheat varieties were replicated across those three locations, and the average yield per variety across locations ranged from 80.5 to 70.3 bushels per acre. Wheat variety plots were also planted in Chesapeake and Virginia Beach with seventeen varieties replicated across the two locations. Averaged across both locations, yields ranged 83.5 to 67.5 bushels per acre. In addition to yield, producers should also consider test weight, disease resistance, standability, and the presence of “beards” if deer pressure is a concern. The best resource for wheat variety selection is the Virginia Cooperative Extension publication, Small Grains for 2015, which is posted on the Virginia Cooperative Extension website at www.ext.vt.edu.
B. SEED TREATMENT PLOT: There was one seed treatment plot that was conducted in Westmoreland
County this year looking at Gaucho 600 and BIOSTART RhizoBoost. Gaucho 600 is an insecticide seed treatment for the control of aphids and barley yellow dwarf. BIOSTART RhizoBoost belongs to a category of bacteria called spore formers which have the ability to create endospores. Endospores are bacterial seeds; they are in a dormant state and generated when the bacteria is stressed or placed in harsh conditions such as extreme heat, desiccation or drastic pH change. The endospores contain all of the necessary genetic information required to produce a new active bacterial cell once conditions are favorable. Spores have recoverable activity after environmental or chemical shifts. In the one plot evaluated the Gaucho 600/BIOSTART RhizoBoost plot yielded 2 bushels better than the check plots.
C. FUSARIUM HEAD BLIGHT FUNGICIDE & GROWTH REGULATOR PLOTS: Fusarium Head
Blight (head scab) pressure under favorable weather conditions can dramatically reduce yield and test weight. As concerns over head scab and vomitoxin continue to increase, more farmers are treating small grains with fungicides to prevent scab infection. Both ground and aerial application are being used. In one plot evaluating Prosaro Fungicide applied at flowering, the Prosaro treated plot yielded almost 6 bushels per acre better than the untreated check plots, but the yield difference was not statistically significant. In two plots evaluating aerial versus ground applications of Prosaro, the aerial application yielded 2 bushels per acre better than the ground application in one plot, while yields were the same for each treatment in the other plot. Aerial applications can be very beneficial in fields without tramlines and in situations where no tracks are already in the field. One plot evaluated the use of the growth regulator Palisade. Increased rates of nitrogen applications to increase yield may lead to decreased straw strength and lodging later in the growing season which is unfavorable. In this plot, there was little difference in yield and test weight between the treated and untreated plots, making the application unprofitable.
D. TISSUE TESTING: Tissue testing may be conducted to solve fertility issues or inquire about the fertility
levels in the crop including macro and micronutrients. During the 2014-2015 small grains growing season, 13 small grain tissue samples were submitted for analysis. Boron was low in nine samples and deficient in 1 sample. Complete results of the tissue analysis results year by year can be found under the section in this publication labeled 2007-2015 Small Grain Tissue Sample Summary.

5
2014/15 Virginia State University Small Grain Variety Comparison
Cooperators: Producer: Glenn F. Chappell, III Glenn F. Chappell, II – Virginia State University Scott Reiter – Virginia Cooperative Extension – Prince George Previous Crop: Corn Soil Type: Slagle sandy loam Tillage: No-Till Test/Plot Size: 650 ft. x 15 ft. per variety Planting Equipment: John Deere 1590 NT Drill Planting Date: October 19, 2014 Row Spacing: 7.5 inches Variety: Various Seeding Rate: 20 seed/row ft. Crop Protection: Herbicides: 2pt./A Gramoxone 2.0 SL - October 6, 2014;
0.5 oz./A of Harmony Extra SG – February 15, 2015 Fungicides: 6.0 oz./A of Headline SC – May 6, 2015 Insecticides: 1.0 oz./A of Karate Z – May 6, 2015 Fertilizer: 30 lbs./A of N – October 6, 2014; 30 lbs./A of N February 15, 2015; 60 lbs./A of N March 25, 2015
Harvest Date: June 25, 2015 Harvest Equipment: John Deere 6620 Brand Variety H2O (%) Test wt. Yield Bu/A % of Check** USG 3404* 13.2 54.1 55.7 ------ AgriMaxx 446 12.9 54.4 58.1 106.8 Featherstone 73 12.9 53.4 51.0 93.7 Southern S. 8416 13.0 53.5 57.7 106.0 AgriMaxx 434 13.0 54.6 56.5 103.9 Great Heart 933 12.9 52.1 58.9 108.2 Pioneer 26R10 12.8 55.1 61.9 113.8 USG 3251 12.8 54.5 55.2 101.4 Dyna-Gro 9223 12.9 53.8 63.4 116.4 Southern S. 8360 12.9 54.0 58.8 108.2 Dyna-Gro 9552 12.8 55.3 61.6 113.1 Southern H. 4300 12.4 53.3 63.0 115.7 Pioneer 26R20 12.4 54.8 52.8 97.0 Southern H. 3200 12.4 52.7 50.5 92.8 Great Heart 940 12.5 56.6 66.7 122.5 USG 3404* 12.8 54.3 55.2 ----- *Check Variety

6
**% of Check is calculated by dividing the individual variety yield by the mean of the two checks located on either side of the variety plot. Discussion: Compare these results with regional data to choose varieties that match your production conditions. Test weights were low probably due to the moderate late season scab pressure and ryegrass contamination. The GS 25 nitrogen application was based on tiller counts and the GS 30 nitrogen application was based on tissue testing.

7
2015 Westmoreland County Wheat Variety Plot
Cooperators: Producer: F.F. Chandler, Jr. Extension: Stephanie Romelczyk, VCE – Westmoreland Keith Balderson, VCE – Essex Trent Jones, VCE – Northumberland/Lancaster
Agribusiness: Participating Companies; Curtis Packett and Rusty Green, CPS
Previous Crop: Corn Soil Type: Kempsville loam Tillage: No-till Planting Date: October 28, 2014 Fertilizer: 40-50-80 + 5 lbs/A S in fall 50 lbs N + 20 lbs S + ½ gal. Black Label Zn in February 50 lbs N + 20 lbs S + ½ gal. Black Label Zn in March Crop Protection: Burndown: 2 pts/A Gramoxone & 0.4 oz/A Finesse Cereal and Fallow 3 oz/A Quadris in March w/N application 7 oz/A Prosaro & 2 oz/A Tombstone in May Harvest Date: July 15, 2015
Discussion: Good yields overall. Harvest was extremely delayed due to rain in June and early July – as a result, low test weights were recorded.
Variety Test Weight (Lbs./Bu.)
Moisture (%)
Yield Bu./A
@13.5% Agri-Maxx 446 53 13.2 85.67 Pioneer 26R10 53 13.0 82.04 Southern States 8360 54 13.5 81.40 USG 3251 53 13.3 80.31 Southern Harvest 4300 55 13.7 77.41 Agri-Maxx 434 52 13.2 76.95 Dyna-Gro 9552 50 13.0 76.75 Southern States 8415 53 12.6 76.60 Dyna-Gro 9223 53 13.5 76.47 Featherstone 73 53 12.6 75.66 Southern Harvest 3200 54 14.1 75.01 Pioneer 26R20 53 13.5 74.70 Great Heart 933 53 13.4 74.27 USG 3404 53 14.5 74.24 Great Heart 940 53 12.9 68.84

8
2015 Middlesex County Wheat Variety Plot Cooperators: Producer: Jason Benton Extension: David Moore, VCE-Middlesex Taylor Sabo, VCE-Summer Intern Previous Crop: Corn Soil Type: Suffolk Fine Sandy Loam Tillage No Till into shredded stalks Planting Date: 10/24/14 Fertilization: 10-60-120 Broadcast 20-0-0 December 50-0-0 March 70-0-0 April Crop Protection: Glyphosate Burndown Finesse + Lambda-Cy-December Palisade-April; Prosaro-May Harvest Date: June 19, 2015
Variety Test Weight (lbs./bu.)
Moisture (%)
Yield (bu/A @13.5)
GHT 940 62 14.3 104.3* Check (Shirley) 61 15.2 101.1 GHT 933 61 14.8 92.5 Check 61 15.0 104.6* Dyna-Gro 9552 62 15.0 92.8 Check 60 14.9 105.6 Dyna-Gro 9223 59 14.9 97.4 Check 60 15.0 102.3 USG 3251 61 14.5 96.5** Check 61 14.8 102.7 USG 3404 61 14.2 96.7 Check 60 14.0 101.3 Pioneer P26R10 60 13.9 97.5** Check 60 13.7 100.9 Pioneer P26R20 61 14.1 90.6 Check 60 14.1 101.8 Agri-Maxx 434 61 14.4 92.7* Check 60 14.3 97.7 Agri-Maxx 446 61 13.9 91.5 Check 60 14.1 103.2 Southern States 8360 61 14.2 100.7* Check 62 13.7 87.2 Southern States 8415 62 13.2 85.0 Check 60 13.1 103.4 Southern Harvest 3200 62 13.2 91.5* Check 60 13.2 103.1*

9
Southern Harvest 4300 60 12.7 98.4 Check 60 13.0 103.6 Featherstone 73 60 13.7 91.4* *75 lbs. added to the yield weight to compensate for one tire track in the plot. **150 lbs. added to the yield weight to compensate for two tire tracks in the plot Estimated total yield damage from tire tracks in 6.8 acre plot is 58 bushels. Testing done by Mennel Milling: Protein=Higher the better for baking/milling SDS=Baking /milling quality; Higher the number the better. Vomitoxin= Level of toxins (DON levels) found in wheat; for human consumption should not be over 1.5 ppm. (Vomitoxin is directly associated with Head Scab levels)
Variety Protein Levels SDS Vomitoxin (ppm) GHT 940 10.8 61.2 .21 Check 1-Shirley 9.7 46.5 .37 GHT 933 9.5 45.5 .29 Dyna-Gro 9552 10.3 47.6 .59 Dyna-Gro 9223 9.6 43.7 .25 USG 3251 10.2 45.8 .24 USG 3404 9.9 42.9 .20 Pioneer 26R10 10.3 49.2 .30 Pioneer 26R20 9.8 38.9 .23 Agri-Maxx 434 9.8 44.9 .03 Agri-Maxx 446 10.4 45.0 .25 Southern States 8360 10.2 43.4 .21 Southern States 8415 10.4 52.4 .84 Southern Harvest 3200 10.1 53.5 .46 Southern Harvest 4300 9.2 35.1 .00 Check 2-Shirley 9.9 45.2 .20 Featherstone 73 9.6 46.5 .00 Discussion: This has been a trying year for wheat. Many thanks to Jason and to Mennel for their association with this plot and the results. The plot was treated with Prosaro fungicide with hopes of reducing scab/toxin levels. As you see, the levels were very acceptable. Protein and SDS levels were also decent for the most part. Use this and other Virginia Tech on-farm research results when making planting decisions for 2016 crop.

10
2015 Chesapeake Wheat Variety Plot
Cooperators: Producer: Marvel Nicholas Extension: Watson Lawrence-Chesapeake Previous Crop: Corn Soil Type: Chesapeake Fine Sandy Loam Tillage: Disk followed by disk with culti-packer Planting Date: October 29, 2014 Fertilizer: October 27: 1 ½ tons Lime/A October 27: 342 lbs. 14-10-26 + 5.7 lbs. Sulfur/A April 2: 100 lbs.N/A (32% Liquid Nitrogen) Crop Protection: April 2: Herbicides (Finesse .2 oz./A + Harmony SG ½ oz./A) Harvest Date: June 22, 2015
Discussion: Wheat heads showed evidence of Fusarium Head Blight. The incidence of fusarium head blight is strongly associated with moisture at the time of flowering, and the timing of rainfall, rather than the amount, is the most critical factor. Some varieties were impacted more than others, reflecting variation of flowering dates and variety resistance. Varieties with low test weights often evidence of Fusarium Head Blight. Specific recommended fungicides for head diseases are most effective after head emergence and can provide some late-season foliar disease protection.
Variety Test Weight (Lbs./Bu.)
Moisture (%)
Yield Bu./A @13.5%)
Southern States 8340 57.0 11.9 80.59 Dyna Gro 9223 53.3 12.0 80.13 Pioneer 26R10 55.3 12.0 79.73 Great Heart 955 53.2 11.3 79.07 Great Heart 940 56.9 11.4 76.83 Oakes 57.9 12.8 74.94 Shirley 53.2 11.1 74.81 Dyna Gro 9552 55.8 11.8 73.78 Southern States 8870 56.4 12.1 73.58 Harrison 53.1 12.0 72.49 Pioneer 26R41 55.3 12.1 72.45 USG 3251 56.6 12.4 72.30 Great Heart 933 54.4 11.1 70.80 Southern States 8404 55.4 10.9 68.55 Pioneer 26R20 54.8 11.3 67.81 USG 3555 54.7 11.8 65.99 USG 3120 54.7 11.5 63.66 Average 55.2 11.7 73.38

11
2015 Virginia Beach Wheat Variety Plot
Cooperators: Producer: Russell H. Malbone Extension: Roy D. Flanagan III Previous Crop: No till Field Corn Soil Type: Predominantly Nimmo Loam and Dragston Fine Sandy Loam Tillage: Conventional Tillage, Disked 2X, Field Cultivator 2X Planting Date: November 21, 2013 Fertilizer: Topdressed with 250lbs of 46-0-0 Crop Protection: Harmony Extra SG @ .5oz. per acre Tilt @ 4 oz. per acre No insecticide used Harvest Date: June 30, 2015
Variety Test Weight (Lbs./Bu.)
Moisture (%)
Yield Bu./A @13.5%)
—Check 58 13.2 74.85 SS 8870 60 12.9 89.51 Oakes 62 13.7 87.97 Pioneer 26R20 61 14.2 86.42 SS 8340 62 13.0 86.42 Dyna Gro 9223 61 13.5 81.79 Pioneer 26R10 60 13.7 80.25 Harrison 62 13.6 80.25 Great Heart 940 62 13.2 77.16 Great Heart 955 60 13.3 77.16 USG 3120 61 13.3 77.16 USG 3251 60 13.1 74.08 Shirley 62 13.5 74.08 Progeny P870 61 12.8 72.53 USG 3555 61 13.3 70.99 Great Heart 933 61 13.4 69.45 SS 8404 62 12.7 66.36 Dyna Gro 9552 62 12.9 64.82 Pioneer 26R41 Data withheld water hurt Average 61 13.29 77.29

12
2015 “Bearded” Wheat Variety Trial
Cooperators: Producer: Robert Bland IV Extension: David Moore, VCE-Middlesex Taylor Sabo, VCE Intern Previous Crop: Bermudagrass Hay Soil Type: Emporia Sandy Loam Tillage: Ripped, Disked and Field Cultivator Planting Date: November 14, 2014 Fertilizer: 1.5 Ton Chicken Litter (Broadcast) 80-0-0-15s April Crop Protection: Burndown prior to Chicken Litter-Glyphosate + 2,4-D Harmony Extra applied in March Palisade and Smart Trio (April) Warrior and Prosaro (May) Harvest Date: June 24, 2015 Variety Test Weight % Moisture Yield A @13.5% Check-(USG 3120) 59 14.7 77.5 Pioneer 26R10 56 14.8 94.5 Check 58 16.0 76.8 Agri-Maxx 434 57 15.9 82.7 Check 59 15.6 77.2 Southern Harvest 4300 58 15.4 90.3 Discussion: This was a plot to compare several “bearded” wheat varieties to the check that the producer was using. (A good way for all to learn is to do some small plots on your farm) This has been a very trying wheat crop to get harvested. We even got “stuck” trying to get this one harvested. A lot of variation in this plot, but overall, a very good plot and some good yields. Please use other Virginia Tech variety information when making planting decisions for the 2016 wheat crop.

13
2015 Virginia Cooperative Extension On-Farm Wheat Variety Plot Yield Summary for Central and Upper Coastal Plain (bushels/acre)
Variety Virginia State Westmoreland Middlesex Average Rank
Great Heart 933 58.9 74.3 92.5 75.2 11
Great Heart 940 66.7 68.8 104.3 79.9 3
Dyna-Gro 9223 63.4 76.5 97.4 79.1 5
Dyna-Gro 9552 61.6 76.8 92.8 77.1 8
USG 3251 55.2 80.3 96.5 77.3 7
USG 3404 55.7 74.2 96.7 75.5 9
Pioneer P26R10 61.9 82.0 97.5 80.5 1
Pioneer P26R20 52.8 74.7 90.6 72.7 T13
Agri-Maxx 434 56.5 77.0 92.7 75.4 10
Agri-Maxx 446 58.1 85.7 91.5 78.4 6
Southern States 8360 58.8 81.4 100.7 80.3 2
Southern States 8415 57.7 76.6 85.0 73.1 12
Southern Harvest 3200 50.5 75.0 91.5 72.3 14
Southern Harvest 4300 63.0 77.4 98.4 79.6 4
Featherstone 73 51.0 75.7 91.4 72.7 T13
Average 58.1 77.1 94.6

14
2015 Virginia Cooperative Extension On-Farm Wheat Variety Plot Yield Summary for Central and Upper Coastal Plain (lbs./bu)
Variety Virginia State Westmoreland Middlesex Average Rank
Great Heart 933 52.1 53 61 55.37 12
Great Heart 940 56.6 53 62 57.20 1
Dyna-Gro 9223 53.8 53 59 55.27 13
Dyna-Gro 9552 55.3 50 62 55.77 10
USG 3251 54.5 53 61 56.17 T5
USG 3404 54.1 53 61 56.03 T8
Pioneer P26R10 55.1 53 60 56.03 T8
Pioneer P26R20 54.8 53 61 56.27 3
Agri-Maxx 434 54.6 52 61 55.87 9
Agri-Maxx 446 54.4 53 61 56.13 6
Southern States 8360 54 54 61 56.33 2
Southern States 8416 53.5 53 62 56.17 T5
Southern Harvest 3200 52.7 54 62 56.23 4
Southern Harvest 4300 53.3 55 60 56.10 7
Featherstone 73 53.4 53 60 55.47 11
Average 54.1 53 60.9

15
2015 Virginia Cooperative Extension On-Farm Wheat Variety Plot Yield Summary for Chesapeake and Virginia Beach (bushels/acre)
Variety Chesapeake Virginia Beach Average Rank
Great Heart 933 70.8 69.5 70.13 13
Great Heart 940 76.8 77.2 76.98 8
Great Heart 955 79.0 77.2 78.08 6
Dyna-Gro 9223 80.1 81.8 80.95 4
Dyna-Gro 9552 73.8 64.8 69.31 14
USG 3120 63.7 77.2 70.43 12
USG 3251 72.3 74.1 73.19 11
USG 3555 66.0 71.0 68.50 15
Pioneer P26R10 79.7 80.3 79.98 5
Pioneer P26R20 67.8 86.4 77.11 7
Pioneer P26R41 72.5 Data withheld water hurt -
Southern States 8340 80.6 86.4 83.51 1
Southern States 8404 68.6 66.4 67.48 16
Southern States 8870 73.6 89.5 81.56 2
Harrison 72.5 80.3 76.38 9
Oakes 74.9 88.0 81.44 3
Shirley 74.8 74.1 74.44 10 Average 73.38 77.74

16
2015 Virginia Cooperative Extension On-Farm Wheat Variety Plot Yield Summary for Chesapeake and Virginia Beach (lbs./bu)
Variety Chesapeake Virginia Beach Average Rank
Great Heart 933 54.4 61.0 57.70 10
Great Heart 940 56.9 62.0 59.45 3
Great Heart 955 53.2 60.0 56.60 15
Dyna-Gro 9223 53.3 61.0 57.15 14
Dyna-Gro 9552 55.8 62.0 58.90 4
USG 3120 54.7 61.0 57.85 T9
USG 3251 56.6 60.0 58.30 6
USG 3555 54.7 61.0 57.85 T9
Pioneer P26R10 55.3 60.0 57.65 11
Pioneer P26R20 54.8 61.0 57.90 8
Pioneer P26R41 55.3 Data withheld Water hurt -
Southern States 8340 57 62.0 59.50 2
Southern States 8404 55.4 62.0 58.70 5
Southern States 8870 56.4 60.0 58.20 7
Harrison 53.1 62.0 57.55 13
Oakes 57.9 62.0 59.95 1
Shirley 53.2 62.0 57.60 12
Average 55.18 61.2

17
2015 Evaluation of Gaucho 600/BioStart Rhizoboost
Cooperators: Producer: Keith Balderson Extension: Keith Balderson, VCE-Essex and Stephanie Romelczyk, VCE-Westmoreland and Taylor Sabo, VCE Intern Agribusiness: Jim Riddell, Agronomist, Southern States Cooperative Previous Crop: Corn Variety: SS 5205 treated with EverGol Energy vs. EverGol Energy/Gaucho 600/ BioStart Rhizoboost Soil Type: Kempsville Sandy Loam Tillage: No-Till, stalks bush hogged Planting Date: October 18, 2014 Fertilizer: Fall: 30-90-90 per acre Spring Topdress: 110-0-0-18 split applied in early February and early April Crop Protection: Burndown Herbicide: Gramoxone Pre-emergence Herbicide: Finesse Harvest Date: June 20, 2015 Treatment Test
Weight % Moisture Yield A @13.5%
Check-Rep 1 56.6 12.8 76.8 Gaucho 600/BioStart Rhizoboost-Rep 1 56.5 12.5 78.5 Check-Rep 2 56.6 12.8 76.5 Gaucho 600/BioStart Rhizoboost-Rep 2 56.5 12.5 78.6 Check-Ave. 56.6 12.8 76.65 Gaucho 600/BioStart Rhizoboost-Ave 56.5 12.5 78.55 LSD (0.10) ns ns 1.3 Discussion: This plot compared EverGol Energy Seed Treatment to EverGol Energy/Gaucho 600/BioStart Rhizoboost on SS 5205 wheat. Gaucho 600 is an insecticide seed treatment for the control of aphids and barley yellow dwarf. BIOSTART RhizoBoost belongs to a category of bacteria called spore formers which have the ability to create endospores. Endospores are bacterial seeds; they are in a dormant state and generated when the bacteria is stressed or placed in harsh conditions such as extreme heat, desiccation or drastic pH change. The endospores contain all of the necessary genetic information required to produce a new active bacterial cell once conditions are favorable. Spores have recoverable activity after environmental or chemical shifts. In this plot, the Gaucho 600/BioStart Rhizoboost treatment tended to yield more than the check plots. Visibly there did not appear to be significant barley yellow dwarf present in the check plots, and we don’t know if the yield increase is due to the Gaucho 600 or BioStart Rhizoboost.
18
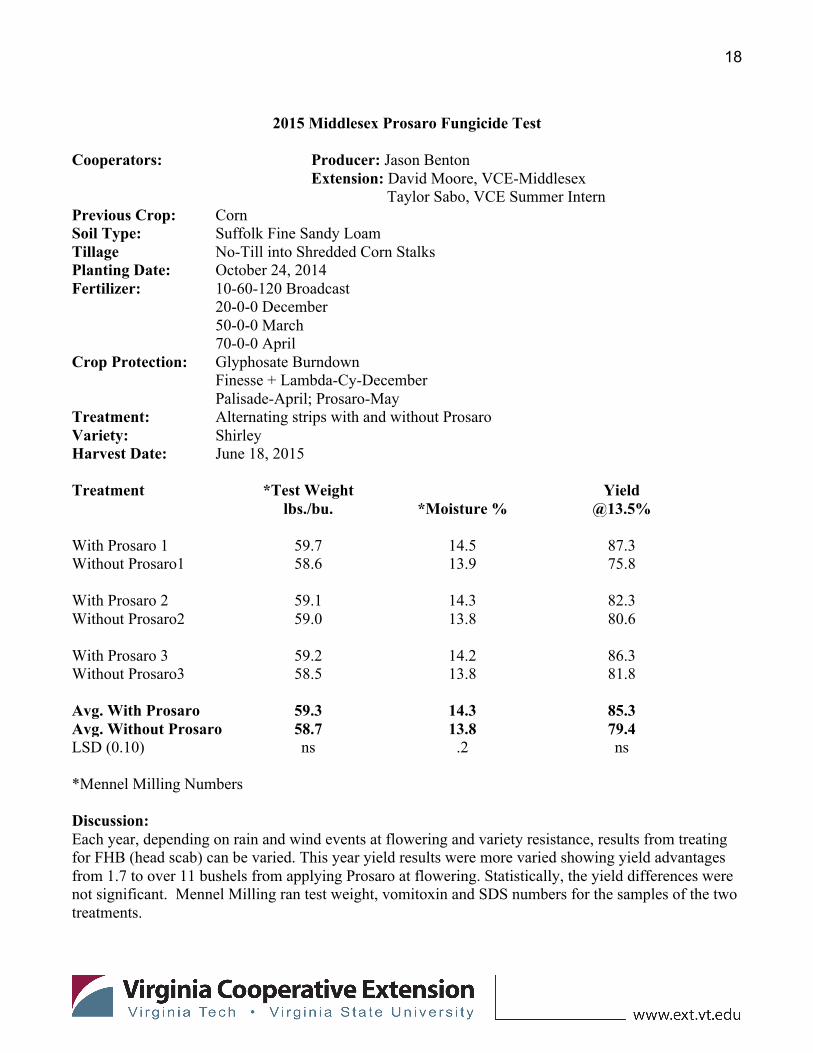
2015 Middlesex Prosaro Fungicide Test
Cooperators: Producer: Jason Benton Extension: David Moore, VCE-Middlesex Taylor Sabo, VCE Summer Intern Previous Crop: Corn Soil Type: Suffolk Fine Sandy Loam Tillage No-Till into Shredded Corn Stalks Planting Date: October 24, 2014 Fertilizer: 10-60-120 Broadcast 20-0-0 December 50-0-0 March 70-0-0 April Crop Protection: Glyphosate Burndown Finesse + Lambda-Cy-December Palisade-April; Prosaro-May Treatment: Alternating strips with and without Prosaro Variety: Shirley Harvest Date: June 18, 2015 Treatment *Test Weight
lbs./bu.
*Moisture % Yield
@13.5% With Prosaro 1 59.7 14.5 87.3 Without Prosaro1 58.6 13.9 75.8 With Prosaro 2 59.1 14.3 82.3 Without Prosaro2 59.0 13.8 80.6 With Prosaro 3 59.2 14.2 86.3 Without Prosaro3 58.5 13.8 81.8 Avg. With Prosaro 59.3 14.3 85.3 Avg. Without Prosaro 58.7 13.8 79.4 LSD (0.10) ns .2 ns *Mennel Milling Numbers Discussion: Each year, depending on rain and wind events at flowering and variety resistance, results from treating for FHB (head scab) can be varied. This year yield results were more varied showing yield advantages from 1.7 to over 11 bushels from applying Prosaro at flowering. Statistically, the yield differences were not significant. Mennel Milling ran test weight, vomitoxin and SDS numbers for the samples of the two treatments.

19
Other Samples run by Mennel Milling: Protein: The higher the number the better SDS = Milling/Baking quality (the higher the better). Indicates protein and gluten strength. Vomitoxin – Levels of toxins in the sample. It is directly related to the amount of Head Scab present in sample. (For human consumption, levels should be below 1.5 ppm)
Treatment Protein SDS Vomitoxin With Prosaro 1 10.4 52.5 0.00 Without Prosaro 1 10.8 53.8 0.00 With Prosaro 2 10.5 50.0 0.00 Without Prosaro 2 10.8 51.9 0.09 With Prosaro 3 10.4 49.4 0.00 Without Prosaro 3 10.7 51.2 0.00 Discussion: There is a pretty significant yield bump from using Prosaro in this test, but there is nothing significant about the amount of Vomitoxin present in the samples whether using Prosaro or not. The easiest way to explain that and not get too technical is to say, some DON toxins are more harmful than others. We do see differences in moisture and test weight when using a Scab fungicide. Generally, there is an increase in moisture and test weight when the fungicide is used and this was again the case in this plot. Use this and other Virginia Tech on-farm research results when making production decisions for 2016 wheat crop.

20
2015 Comparison of Aerial vs. Ground Application of Prosaro Fungicide
Cooperators: Producer: Cloverfield Enterprise Extension: Keith Balderson, VCE-Essex Taylor Sabo, VCE Intern Agribusiness: Matt Crabbe, Crabbe Aviations Previous Crop: Corn Variety: Yorktown Soil Type: Tetotum loam and Munden fine sandy loam Planting Date: October 26, 2014 Fertilizer: Pre-Plant—193 lbs. per acre MAP; 129 lbs. per acre Potash (60% Product) Burndown—30-0-0-4 per acre Topdress—100-0-0-12.5 per acre in mid March Harvest Date: June 26, 2015 Treatment Replication % Moisture Yield A @13.5% Aerial Application 1 12.9 80 Ground Application 1 13.1 79 Ground Application 2 12.6 74 Aerial Application 2 12.7 76 Aerial Application 3 12.8 85 Ground Application 3 12.5 82 Ground Application-Average 12.7 78.3 Aerial Application-Average 12.9 80.3 LSD (0.10) ns 1.7 Discussion: As concerns over Fusarium Head Blight and vomitoxin continue to increase, more farmers are treating small grains with fungicides to prevent scab infection. Both ground and aerial application are being used. Aerial applications can be very beneficial in fields without tramlines and in situations where no tracks are already in the field. Ground and aerial applications of fungicide and insecticide were made at the same time in this plot. This field had tramlines and yields were taken out of the tramlines so the tracks from the ground application would have had little to no effect on yields. Scab pressure in the field was relatively low, and the aerial application tended to be better than the ground application. With wheat at $5.50 per bushel, the aerial application would need to yield about 1 bushel per acre more than the ground application to cover the difference between the costs of the two types of application.

21
2015 Comparison of Aerial vs. Ground Application of Prosaro Fungicide
Cooperators: Producer: Cloverfield Enterprise Extension: Keith Balderson, VCE-Essex Taylor Sabo, VCE Intern Agribusiness: Matt Crabbe, Crabbe Aviation Previous Crop: Corn Variety : Dyna-Gro 9343 Soil Type: Wickham fine sandy loam and Altavista fine sandy loam Planting Date: October 28, 2014 Fertilizer: Pre-Plant—190 lbs. per acre Potash (60% product); 190 lbs per acre MAP Burndown—3-0-0-4 per acre Topdress—100-0-0-12.5 per acre Harvest Date: June 29, 2015 Treatment Replication % Moisture Yield A @13.5% Aerial Application 1 13.0 84 Ground Application 1 13.4 83 Aerial Application 2 13.0 87 Ground Application 2 13.1 86 Aerial Application 3 12.9 86 Ground Application 3 13.1 87 Aerial Application-Average 13.0 85.7 Ground Application-Average 13.2 85.3 LSD (0.10) ns ns Discussion: As concerns over Fusarium Head Blight and vomitoxin continue to increase, more farmers are treating small grains with fungicides to prevent scab infection. Both ground and aerial application are being used. Aerial applications can be very beneficial in fields without tramlines and in situations where no tracks are already in the field. Ground and aerial applications of fungicide and insecticide were made at the same time in this plot. This field had tramlines and yields were taken out of the tramlines so the tracks from the ground application would have had little to no effect on yields. Scab pressure in the field was relatively low, and there was virtually no difference in yield between the aerial and ground application. With wheat at $5.50 per bushel, the aerial application would need to yield about 1 bushel per acre more than the ground application to cover the difference between the costs of the two types of application.

22
2015 Middlesex Palisade Growth Regulator Test Cooperators: Producer: Jason Benton Extension: David Moore, VCE-Middlesex Taylor Sabo, VCE Summer Intern Previous Crop: Corn Soil Type: Suffolk Fine Sandy Loam Tillage: No-Till into Shredded Corn Stalks Planting Date: October 26, 2014 Fertilizer: 10-60-120 Broadcast 20-0-0 December 50-0-0 March 70-0-0 April Crop Protection: Glyphosate Burndown Finesse + Lambda-Cy-December Palisade-April; Prosaro-May Treatment: Alternating strips with and without Palisade Variety: Pioneer 26R10 Harvest Date: June 22, 2015 Treatment Test Weight
lbs./bu.
Moisture % Yield
@13.5% With Palisade 1 60 11.4 81.8 Without Palisade 1 59 11.4 86.0 With Palisade 2 60 11.5 77.5 Without Palisade 2 59.5 11.4 77.9 With Palisade 3 60 11.4 77.5 Without Palisade3 60 11.7 77.3 Avg. With Palisade 60 11.4 78.9 Avg. Without Palisade 59.5 11.5 80.4 LSD (0.10) ns ns ns Discussion: Palisade is a growth regulator and is suggested to be used if you suspect that wheat will lodge due to weather or increased nitrogen use. It is not meant to increase yields without the increased use of nitrogen. In previous years, it may have increased yields, but did not do more than cover the cost of application. It was a trade of dollars. In this particular test, it did not do that. Application of Palisade can be made between GS 30 (begin jointing) and GS 37 (just prior to flag leaf). Use this and other Virginia Tech replicated on-farm plot results when making production decisions for 2016 wheat crop.

23
2007 – 2015 Small Grain Tissue Sample Summary
Totals-‐2007 N S P K Mg Ca Na B Zn Mn Fe Cu Al
Very High 0 0 0 2 0 0 0 0 0 1 5 0 0 High 0 0 3 2 0 0 0 0 0 1 5 0 2 Sufficient 0 10 7 6 1 7 10 8 4 7 0 6 8 Low 8 0 0 0 9 2 0 2 2 1 0 4 0 Deficient 2 0 0 0 0 1 0 0 4 0 0 0 0 Total 10 10 10 10 10 10 10 10 10 10 10 10 10
Totals-‐2008 N S P K Mg Ca Na B Zn Mn Fe Cu Al
Very High 4 12 3 36 0 2 0 0 0 23 59 32 0 High 4 32 20 29 0 20 1 1 8 50 41 28 3 Sufficient 24 46 77 35 22 53 100 38 64 15 1 34 98 Low 71 4 1 1 71 26 0 56 26 5 0 7 0 Deficient 8 7 0 0 8 0 0 6 3 8 0 0 0 Total 111 101 101 101 101 101 101 101 101 101 101 101 101
Totals-‐2009 N S P K Mg Ca Na B Zn Mn Fe Cu Al
Very High 0 0 0 7 0 0 0 0 0 1 13 0 0 High 4 7 3 7 0 3 0 0 5 9 6 7 0 Sufficient 8 11 15 5 14 15 19 10 12 7 0 6 19 Low 7 1 1 0 5 1 0 9 2 0 0 6 0 Deficient 0 0 0 0 0 0 0 0 0 2 0 0 0 Total 19 19 19 19 19 19 19 19 19 19 19 19 19
Totals-‐2010 N S P K Mg Ca Na B Zn Mn Fe Cu Al
Very High 20 0 13 19 1 1 0 0 0 2 23 4 0 High 2 9 6 3 0 1 0 1 7 4 7 9 0 Sufficient 5 11 11 8 22 21 22 8 13 13 0 14 29 Low 3 2 0 0 6 7 8 13 8 3 0 3 1 Deficient 0 8 0 0 1 0 0 8 2 8 0 0 0 Total 30 30 30 30 30 30 30 30 30 30 30 30 30

24
Totals-‐2011 N S P K Mg Ca Na B Zn Mn Fe Cu Al
Barley Very High 0 0 0 4 0 0 0 0 0 0 3 0 0 High 2 2 3 0 0 4 0 0 1 2 0 0 0 Sufficient 2 3 2 1 5 1 5 1 3 2 2 3 5 Low 2 0 0 0 0 0 0 2 1 0 0 1 0 Deficient 0 0 0 0 0 0 0 2 0 1 0 1 0 Total 6 5 5 5 5 5 5 5 5 5 5 5 5 Wheat Very High 0 0 0 0 0 0 0 0 0 0 3 0 0 High 12 0 10 1 0 0 0 0 0 0 0 0 2 Sufficient 22 13 9 18 17 18 19 4 18 17 16 14 17 Low 0 6 0 0 2 1 0 13 1 1 0 5 0 Deficient 0 0 0 0 0 0 0 2 0 1 0 0 0 Total 34 19 19 19 19 19 19 19 19 19 19 19 19
Totals-‐2012 N S P K Mg Ca Na B Zn Mn Fe Cu Al
Barley Very High 0 0 0 0 0 0 0 0 0 0 0 0 0 High 2 0 0 0 0 3 0 0 0 1 0 0 0 Sufficient 1 3 5 5 4 1 4 5 5 4 5 5 4 Low 0 1 0 0 1 1 1 0 0 0 0 0 0 Deficient 2 1 0 0 0 0 0 0 0 0 0 0 1 Total 5 5 5 5 5 5 5 5 5 5 5 5 5 Wheat Very High 1 0 0 0 0 0 1 1 0 0 1 0 0 High 5 0 6 3 0 6 0 0 0 0 0 1 0 Sufficient 14 17 15 21 21 18 23 9 23 22 23 23 18 Low 2 6 3 0 3 0 0 14 1 1 0 0 6 Deficient 2 1 0 0 0 0 0 0 0 1 0 0 0 Total 24 24 24 24 24 24 24 24 24 24 24 24 24

25
Totals-‐2013 N S P K Mg Ca Na B Zn Mn Fe Cu Al
Barley and Wheat
Very High 2 0 0 0 0 0 0 0 0 2 0 0 0 High 3 1 3 0 0 3 0 0 0 0 5 0 0 Sufficient 51 46 60 65 53 58 67 28 55 60 62 65 67 Low 1 4 1 1 8 4 0 38 3 0 0 1 0 Deficient 10 16 3 1 6 2 0 1 9 5 0 1 0 Total 67 67 67 67 67 67 67 67 67 67 67 67 67
Totals-‐2014 N S P K Mg Ca Na B Zn Mn Fe Cu Al
Barley and Wheat Very High 4 0 0 0 0 0 0 0 0 0 6 0 1 High 18 1 8 6 0 9 0 2 0 0 5 0 3 Sufficient 13 29 27 29 32 26 35 26 35 33 24 35 31 Low 0 1 0 0 0 0 0 5 0 0 0 0 0 Deficient 0 4 0 0 3 0 0 2 0 2 0 0 0 Total 35 35 35 35 35 35 35 35 35 35 35 35 35
Totals-‐2015 N S P K Mg Ca Na B Zn Mn Fe Cu Al
Barley and Wheat Very High 1 0 0 4 0 0 0 0 0 0 3 0 0 High 7 12 11 7 0 11 0 1 10 8 10 1 1 Sufficient 5 1 2 2 12 2 13 2 3 5 0 12 12 Low 0 0 0 0 1 0 0 9 0 0 0 0 0 Deficient 0 0 0 0 0 0 0 1 0 0 0 0 0 Total 13 13 13 13 13 13 13 13 13 13 13 13 13
Total Tissue Samples N S P K Mg Ca Na B Zn Mn Fe Cu Al
(2007-‐2015) Very High 33 12 16 68 1 3 1 1 0 29 113 36 1 High 60 62 76 61 0 59 1 5 30 72 79 47 11 Sufficient 158 201 238 210 215 239 331 142 250 202 149 232 317 Low 95 33 14 7 112 42 12 178 49 16 5 31 17 Deficient 24 38 3 1 19 4 1 20 18 28 0 1 0 Total 370 346 347 347 347 347 346 346 347 347 346 347 346