2015 Trends in Global Employee Engagement - Health | Aon · Risk. Reinsurance. Human Resources. Aon...
48
Risk. Reinsurance. Human Resources. Aon Hewitt Performance, Reward & Talent 2015 Trends in Global Employee Engagement Making engagement happen
Transcript of 2015 Trends in Global Employee Engagement - Health | Aon · Risk. Reinsurance. Human Resources. Aon...
Risk. Reinsurance. Human Resources.
Aon HewittPerformance, Reward & Talent
2015 Trends in Global Employee EngagementMaking engagement happen
Executive Summary . . . . . . . . . . . . . . . . . . . . . . . . . . . . . . . . . . . .1
Key Findings . . . . . . . . . . . . . . . . . . . . . . . . . . . . . . . . . . . . . . . . . .5
Trends in Global Employee Engagement . . . . . . . . . . . . . . . . . .11
Engagement Trends . . . . . . . . . . . . . . . . . . . . . . . . . . . . . . . . . . . . . . . . . 12
Global Economic and Labor Dynamics . . . . . . . . . . . . . . . . . . . . . . . . . . 16
Work Experience Trends . . . . . . . . . . . . . . . . . . . . . . . . . . . . . . . . . . . . . . 20
Making Engagement Happen . . . . . . . . . . . . . . . . . . . . . . . . . . .23
The Top Employee Engagement Drivers . . . . . . . . . . . . . . . . . . . . . . . . . 24
Beyond Engagement Measurement— Solutions to Make Engagement Happen . . . . . . . . . . . . . . . . . . . . . . . . . 26
Final Thoughts . . . . . . . . . . . . . . . . . . . . . . . . . . . . . . . . . . . . . . . . . . . . . 31
Appendix . . . . . . . . . . . . . . . . . . . . . . . . . . . . . . . . . . . . . . . . . . .32
Table of Contents
Aon Hewitt 1
Build a Culture of Engagement— Make Employee Engagement Happen
The quote to the right from a leader at one of the Aon Hewitt Top Companies for Leaders®
reflects two concepts that we continually see in top-performing companies: 1) business
and talent strategies are intimately connected; and 2) leadership and employee
engagement are essential for success . The best companies build and sustain a culture of
engagement, led by CEOs who understand that employee engagement is not just a “nice
to have” but critical to achieving business results . Leaders in these elite organizations
also understand that employee engagement is primarily their responsibility .
The financial implications of an engaged workforce are significant . Our research reveals
consistent, statistically significant relationships between higher levels of employee
engagement and financial performance . In previous studies, we found that a 5% increase
in employee engagement is linked to a 3% increase in revenue growth in the subsequent
year .1 But is engagement alone enough to drive sustainable performance?
Further research shows Aon Hewitt Best Employers enjoy strong leadership, reputations,
and performance orientation in addition to strong employee engagement . Our latest
research on 270 global organizations from 2010 to 2013 indicates that these additional
cultural aspects of being an Aon Hewitt Best Employer drive incremental business
performance in sales, operating margin, and total shareholder return beyond top-quartile
employee engagement alone .2
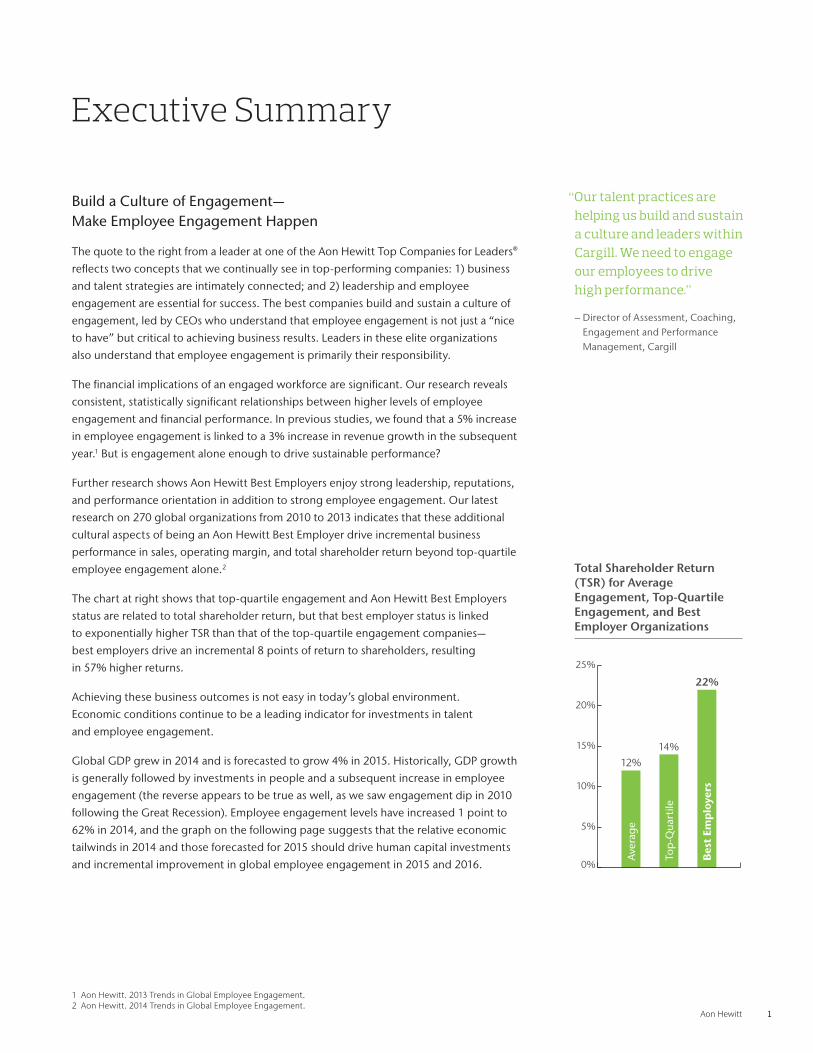
The chart at right shows that top-quartile engagement and Aon Hewitt Best Employers
status are related to total shareholder return, but that best employer status is linked
to exponentially higher TSR than that of the top-quartile engagement companies—
best employers drive an incremental 8 points of return to shareholders, resulting
in 57% higher returns .
Achieving these business outcomes is not easy in today’s global environment .
Economic conditions continue to be a leading indicator for investments in talent
and employee engagement .
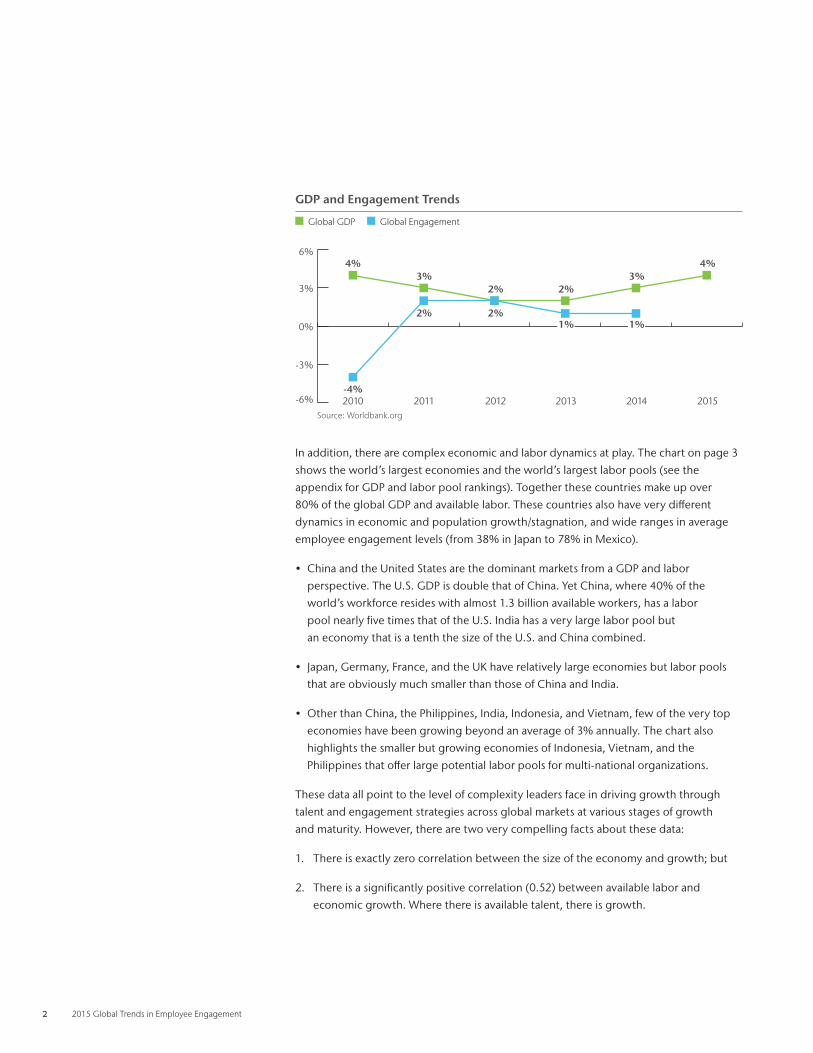
Global GDP grew in 2014 and is forecasted to grow 4% in 2015 . Historically, GDP growth
is generally followed by investments in people and a subsequent increase in employee
engagement (the reverse appears to be true as well, as we saw engagement dip in 2010
following the Great Recession) . Employee engagement levels have increased 1 point to
62% in 2014, and the graph on the following page suggests that the relative economic
tailwinds in 2014 and those forecasted for 2015 should drive human capital investments
and incremental improvement in global employee engagement in 2015 and 2016 .
1 Aon Hewitt. 2013 Trends in Global Employee Engagement.2 Aon Hewitt. 2014 Trends in Global Employee Engagement.
Executive Summary
“ Our talent practices are helping us build and sustain a culture and leaders within Cargill. We need to engage our employees to drive high performance.”
– Director of Assessment, Coaching, Engagement and Performance Management, Cargill
Total Shareholder Return (TSR) for Average Engagement, Top-Quartile Engagement, and Best Employer Organizations
0%
5%
10%
15%
20%
25%
12%14%
22%
Bes
t Em
plo
yers
Top
-Qua
rtile
Aver
age
2 2015 Global Trends in Employee Engagement
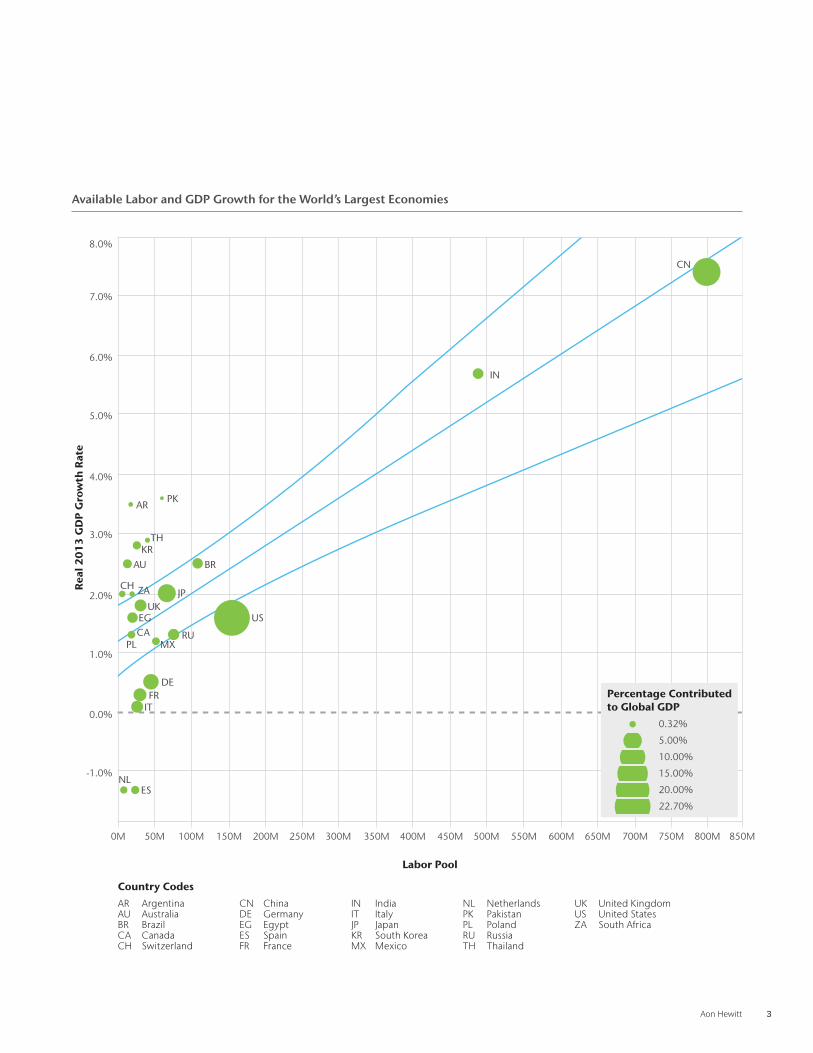
In addition, there are complex economic and labor dynamics at play . The chart on page 3
shows the world’s largest economies and the world’s largest labor pools (see the
appendix for GDP and labor pool rankings) . Together these countries make up over
80% of the global GDP and available labor . These countries also have very different
dynamics in economic and population growth/stagnation, and wide ranges in average
employee engagement levels (from 38% in Japan to 78% in Mexico) .
• China and the United States are the dominant markets from a GDP and labor
perspective . The U .S . GDP is double that of China . Yet China, where 40% of the
world’s workforce resides with almost 1 .3 billion available workers, has a labor
pool nearly five times that of the U .S . India has a very large labor pool but
an economy that is a tenth the size of the U .S . and China combined .
• Japan, Germany, France, and the UK have relatively large economies but labor pools
that are obviously much smaller than those of China and India .
• Other than China, the Philippines, India, Indonesia, and Vietnam, few of the very top
economies have been growing beyond an average of 3% annually . The chart also
highlights the smaller but growing economies of Indonesia, Vietnam, and the
Philippines that offer large potential labor pools for multi-national organizations .
These data all point to the level of complexity leaders face in driving growth through
talent and engagement strategies across global markets at various stages of growth
and maturity . However, there are two very compelling facts about these data:
1 . There is exactly zero correlation between the size of the economy and growth; but
2 . There is a significantly positive correlation (0 .52) between available labor and
economic growth . Where there is available talent, there is growth .
GDP and Engagement Trends
Global GDP Global Engagement
-6%
-3%
0%
3%
6%
2010 2011 2012 2013 20152014Source: Worldbank.org
4%3%
2% 2%3%
-4%
2% 2%1% 1%
4%
Aon Hewitt 3
Available Labor and GDP Growth for the World’s Largest Economies
8 .0%
-1 .0%
0 .0%
1 .0%
2 .0%
3 .0%
4 .0%
5 .0%
6 .0%
7 .0%
0M 50M 100M 150M 200M 250M 300M 350M 400M 450M 500M 550M 600M 650M 700M 750M 800M 850M
CN
IN
US
DEFR
IT
NLES
RUMX
PK
ZA JPUK
CH
THKR
BRAU
AR
PLCAEG
Labor Pool
Rea
l 20
13
GD
P G
row
th R
ate
Percentage Contributed to Global GDP
0 .32%
5 .00%
10 .00%
15 .00%
20 .00%
22 .70%
AR ArgentinaAU AustraliaBR BrazilCA CanadaCH Switzerland
CN ChinaDE GermanyEG EgyptES SpainFR France
IN IndiaIT ItalyJP JapanKR South KoreaMX Mexico
NL NetherlandsPK PakistanPL PolandRU RussiaTH Thailand
UK United KingdomUS United StatesZA South Africa
Country Codes
4 2015 Global Trends in Employee Engagement
Leaders seem to be making the connection between talent, engaged talent, and
business results at an exponentially increasing rate . However, companies are struggling
to make engagement happen by fully aligning the business strategy and talent strategy .
Many companies are experiencing a disconnect between the company’s productivity
and profit growth and the relatively flat increase in wages for the majority of workers .3
Our research shows that less than half of global employees (46%) think they are paid
fairly for what they contribute (a perception unchanged in the last year) . Although there
has been a slight improvement in other key engagement drivers like the employee
value proposition, recognition, and innovation, the overall net change in the average
employee’s work experience is negative . Most notably, global perceptions about
resources and practices that enable a general culture of engagement have fallen in
the last year .
So, the question becomes, “How do you create this culture of engagement and make
engagement happen?” Lessons from Aon Hewitt Best Employers and Aon Hewitt Top
Companies for Leaders® point to a holistic approach led by leaders . There are many
stakeholders involved in creating a culture of engagement, but leaders are the ultimate
owners . The four critical stakeholders are HR, people managers, the individual
employee, and senior leaders .
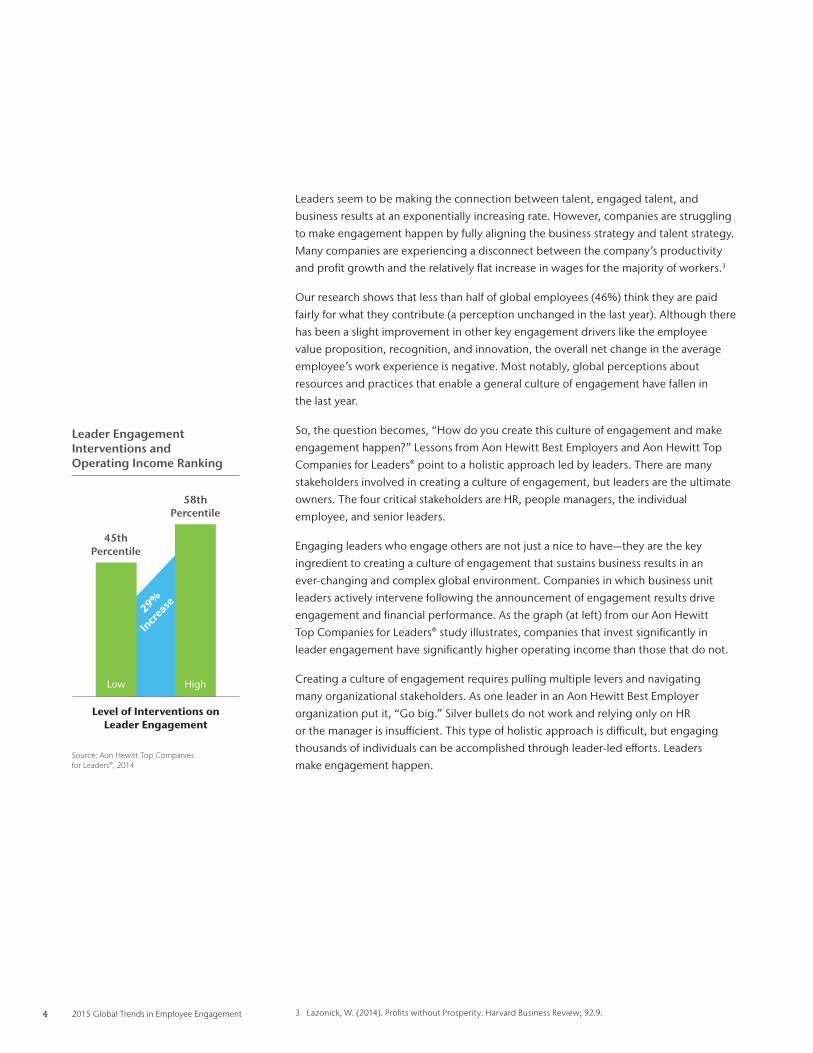
Engaging leaders who engage others are not just a nice to have—they are the key
ingredient to creating a culture of engagement that sustains business results in an
ever-changing and complex global environment . Companies in which business unit
leaders actively intervene following the announcement of engagement results drive
engagement and financial performance . As the graph (at left) from our Aon Hewitt
Top Companies for Leaders® study illustrates, companies that invest significantly in
leader engagement have significantly higher operating income than those that do not .
Creating a culture of engagement requires pulling multiple levers and navigating
many organizational stakeholders . As one leader in an Aon Hewitt Best Employer
organization put it, “Go big .” Silver bullets do not work and relying only on HR
or the manager is insufficient . This type of holistic approach is difficult, but engaging
thousands of individuals can be accomplished through leader-led efforts . Leaders
make engagement happen .
3 Lazonick, W. (2014). Profits without Prosperity. Harvard Business Review; 92.9.
Leader Engagement Interventions and Operating Income Ranking
Source: Aon Hewitt Top Companiesfor Leaders®, 2014
HighLow
Level of Interventions on Leader Engagement
45th Percentile
58th Percentile
29%
Incr
ease
Aon Hewitt 5
Key Findings
6 2015 Global Trends in Employee Engagement
Global Engagement Trends
Key Findings
Global2014 Engagement
62% +1pt2015 GDP Forecast
4%
Top Engagement Drivers
Career Opportunities -3
Reputation 0
Pay 0
EVP +3
Innovation +1
Largest Work Experience Changes
Leadership +5
EVP +3
Manager +2
HR Practices -5
People Focus -6
Resources -7
North America2014 Engagement
66% +1pt2015 GDP Forecast
3%
Top Engagement Drivers
Career Opportunities -3
Performance Management -1
Reputation 0
EVP +2
People Focus +1
Largest Work Experience Changes
Communication +8
Customer Focus +7
Innovation +6
Accomplishment -3
Career Opportunities -3
Resources -3
Latin America2014 Engagement
71% +1pt2015 GDP Forecast
4%
Top Engagement Drivers
Career Opportunities -3
Recognition +2
Pay +2
EVP +5
Innovation +1
Largest Work Experience Changes
Leadership +13
Benefits +9
Communication +9
Accomplishment -6
People Focus -9
Customer Focus -9
Aon Hewitt 7
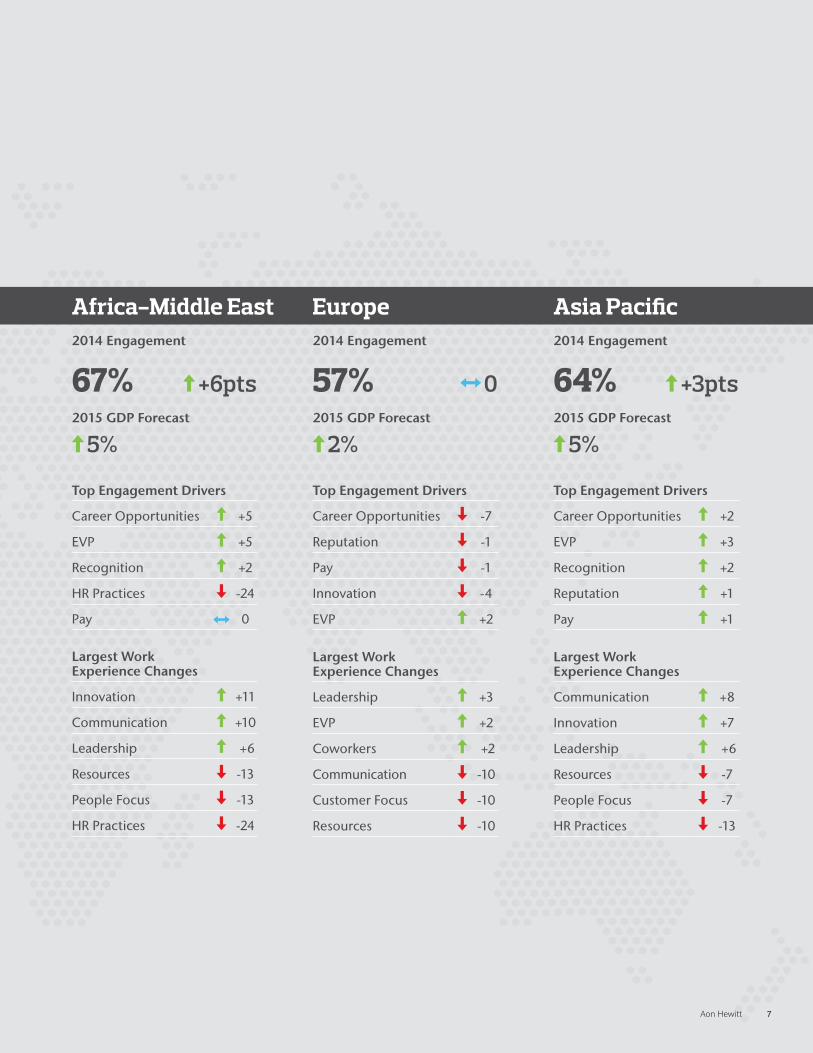
Africa-Middle East2014 Engagement
67% +6pts2015 GDP Forecast
5%
Top Engagement Drivers
Career Opportunities +5
EVP +5
Recognition +2
HR Practices -24
Pay 0
Largest Work Experience Changes
Innovation +11
Communication +10
Leadership +6
Resources -13
People Focus -13
HR Practices -24
Europe2014 Engagement
57% 02015 GDP Forecast
2%
Top Engagement Drivers
Career Opportunities -7
Reputation -1
Pay -1
Innovation -4
EVP +2
Largest Work Experience Changes
Leadership +3
EVP +2
Coworkers +2
Communication -10
Customer Focus -10
Resources -10
Asia Pacific2014 Engagement
64% +3pts2015 GDP Forecast
5%
Top Engagement Drivers
Career Opportunities +2
EVP +3
Recognition +2
Reputation +1
Pay +1
Largest Work Experience Changes
Communication +8
Innovation +7
Leadership +6
Resources -7
People Focus -7
HR Practices -13
8 2015 Global Trends in Employee Engagement
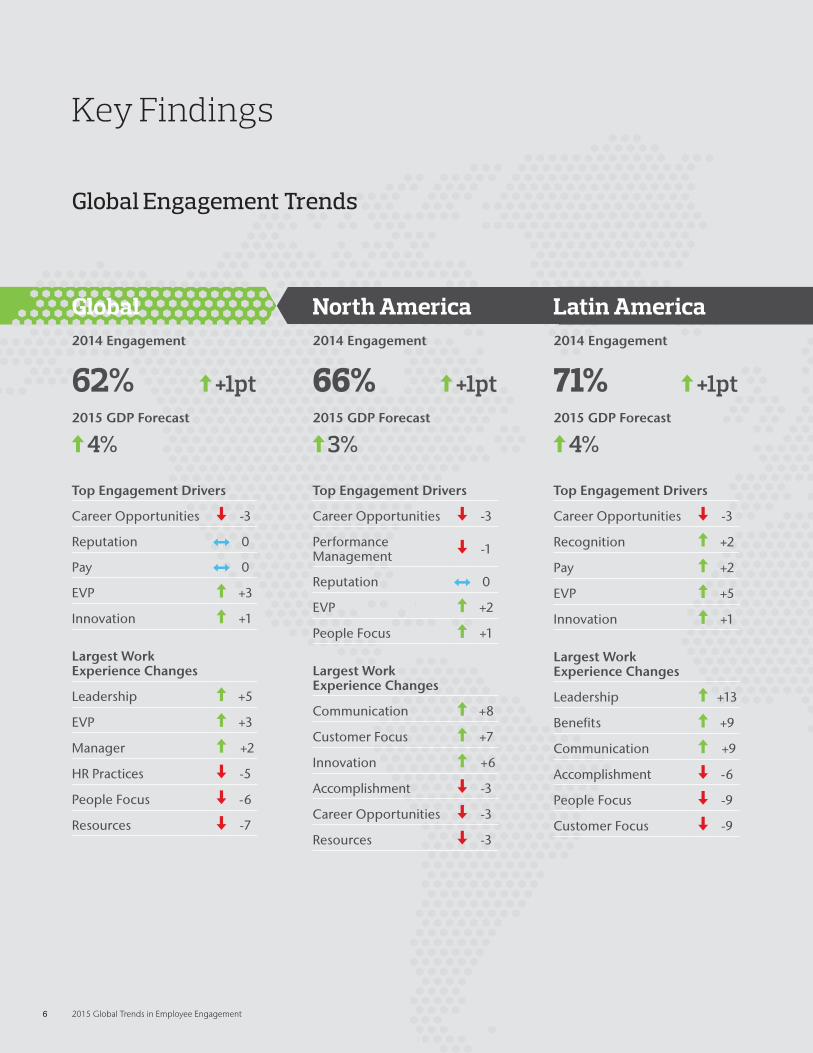
• Global employee engagement continues to rise gradually, up 1 point to 62%, as the economy continues to improve. The table on pages 6 and 7 shows considerable differences
across regions and markets, with engagement varying from
57% to 71% and changes in engagement ranging from no
change to 3-point improvements .
• Employee engagement in the world’s largest markets was 61%, unchanged from 2013 to 2014. Examining the
weighted average (by GDP and labor pool) of engagement
levels reveals that, on average, large companies operating
in the world’s largest markets have employee bases that
are slightly less engaged than those of companies in other
parts of the world .
• Economic tailwinds can spur a positive impact on employee engagement, but hyper-growth economic conditions can be disengaging. The rate of economic
growth moderates the impact on employee engagement .
Economic growth in the world’s struggling economies
spurred positive changes in employee engagement
a year later, but sustained high growth in rapidly growing
markets in Asia Pacific and Latin America was followed by
a downturn in employee engagement .
• The overall work experience is deteriorating—particularly in regard to enablement, autonomy, and sense of accom-plishment. The average trend is that the work experience
is deteriorating more than it is improving . In particular,
perceptions of resources and programs that empower are
falling across many markets . Employees who are engaged
but not empowered are at risk of frustration, burnout,
disengagement, suboptimal productivity, and turnover .
• Companies continue to struggle with providing growth opportunities for employees and other top engagement drivers. Career opportunities is the top engagement driver
globally; however, positive perceptions surrounding this
driver have fallen 3 points, to 44%, from 2013 to 2014 .
Perceptions of career opportunities are most positive in India,
Canada, and high-growth Latin American markets . Perceptions
of career opportunities are least positive in Japan and the
European region . The other top engagement drivers—
reputation, pay, employee value proposition, and innovation—
also show opportunity for improvement with about half of the
global population dissatisfied with these key aspects of the
work experience .
• A strong employee value proposition (EVP) is consistently valuable to employees across the world’s regions. Companies create strong EVPs when employees are clear on
performance expectations and feel that their employers in
turn deliver on promises to them . Strong EVPs are highly
engaging . A strong EVP is also a consistent element found
in Aon Hewitt Best Employers . Perceptions of EVP are on the
rise globally .
• Perceptions of senior leaders are improving. Sixty percent
of global employees view senior leaders favorably . This
perception has increased 5 points from 2013 to 2014 .
Leaders need to be both engaged themselves and engaging
of others to be able to effectively impact their organizations .
Senior leadership engagement has risen significantly since
2012, jumping 10 points to 76% . The key will be for these
leaders to invest their energy in engaging others in their
organizations .
• Engagement alone is not enough. Aon Hewitt Best
Employers and Aon Hewitt Top Companies for Leaders® do
more than simply drive above-average engagement . These
companies create cultures of engagement marked by strong
leadership, performance orientation, and brands (internal
and external) . They also empower leaders and individuals
to develop themselves and others and believe this to be
a critical part of sustainable value creation for the business .
They understand the roles various stakeholders play in
relation to engagement, and ensure success through
systematic, strategic interventions geared toward driving
desirable results .
Aon Hewitt 9
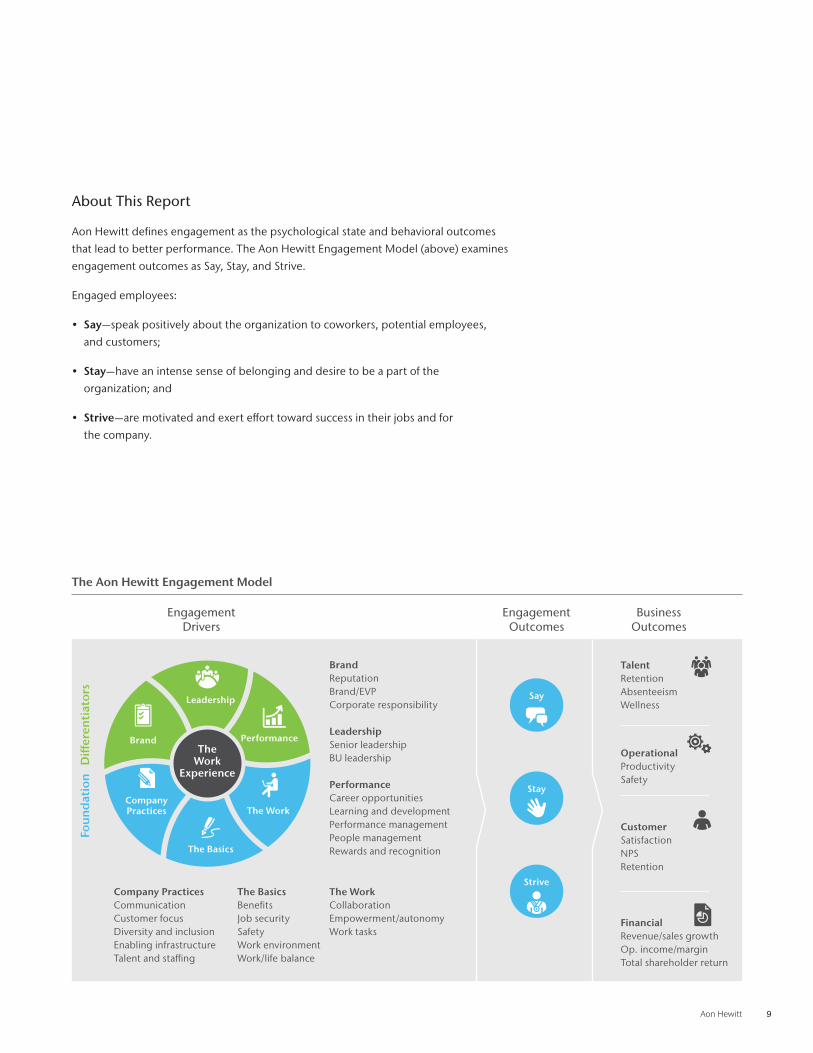
About This Report
Aon Hewitt defines engagement as the psychological state and behavioral outcomes
that lead to better performance . The Aon Hewitt Engagement Model (above) examines
engagement outcomes as Say, Stay, and Strive .
Engaged employees:
• Say—speak positively about the organization to coworkers, potential employees,
and customers;
• Stay—have an intense sense of belonging and desire to be a part of the
organization; and
• Strive—are motivated and exert effort toward success in their jobs and for
the company .
The Aon Hewitt Engagement Model
BusinessOutcomes
TalentRetentionAbsenteeismWellness
OperationalProductivitySafety
CustomerSatisfactionNPSRetention
FinancialRevenue/sales growthOp. income/marginTotal shareholder return
EngagementOutcomes
Say
Stay
Strive
EngagementDrivers
Differen
tiator
sFo
undation
The Basics
CompanyPractices
PerformanceBrand
The Work
Leadership
TheWork
Experience
The WorkCollaborationEmpowerment/autonomyWork tasks
The BasicsBenefits Job securitySafety Work environmentWork/life balance
Company PracticesCommunicationCustomer focusDiversity and inclusionEnabling infrastructureTalent and sta�ng
BrandReputationBrand/EVPCorporate responsibility
LeadershipSenior leadershipBU leadership
PerformanceCareer opportunitiesLearning and developmentPerformance managementPeople managementRewards and recognition
10 2015 Global Trends in Employee Engagement
In addition, we examine the work experience indicators that have an impact on
engagement . These are the engagement drivers within management control—brand,
leadership, performance, the work, the basics, and company practices . Finally, we
include the business outcomes that often result from strong engagement drivers
and higher employee engagement levels . Our research has consistently found that
companies with higher engagement levels also have better talent, operational,
customer, and financial outcomes .
The data in this report comes from Aon Hewitt’s global employee research database
consisting of over 8 million employee records from 2010 to 2014 . The Aon Hewitt
database represents companies from 68 industries operating in 164 countries around
the world . This report is further supplemented by data and executive interviews from
the 2014 Aon Hewitt Top Companies for Leaders® study .
Aon Hewitt 11
Trends in Global Employee Engagement
12 2015 Global Trends in Employee Engagement
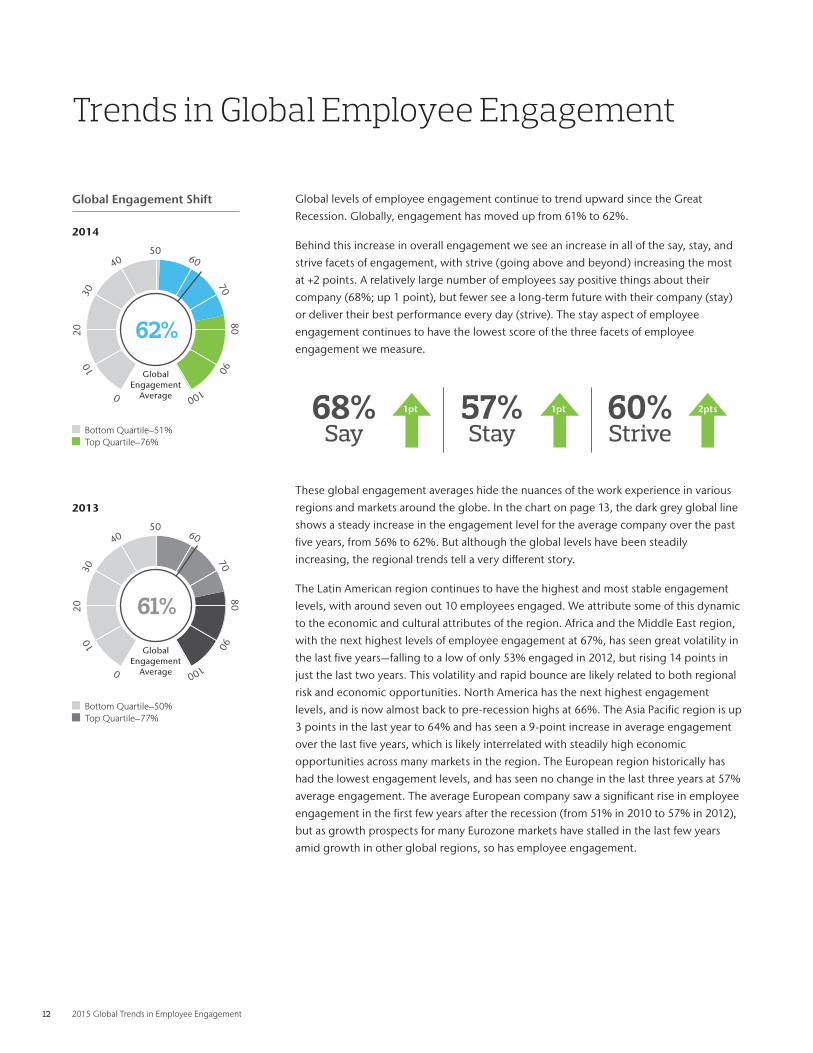
Global levels of employee engagement continue to trend upward since the Great
Recession . Globally, engagement has moved up from 61% to 62% .
Behind this increase in overall engagement we see an increase in all of the say, stay, and
strive facets of engagement, with strive (going above and beyond) increasing the most
at +2 points . A relatively large number of employees say positive things about their
company (68%; up 1 point), but fewer see a long-term future with their company (stay)
or deliver their best performance every day (strive) . The stay aspect of employee
engagement continues to have the lowest score of the three facets of employee
engagement we measure .
68% Say
1pt 57% Stay
1pt 60% Strive
2pts
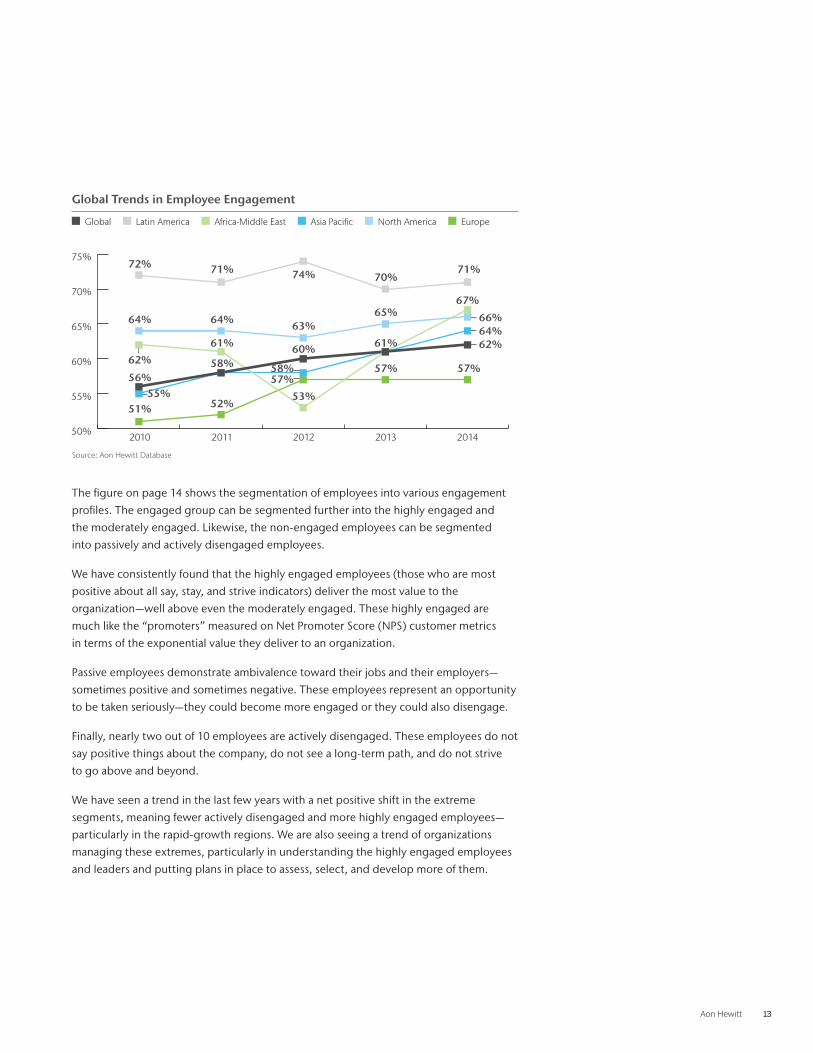
These global engagement averages hide the nuances of the work experience in various
regions and markets around the globe . In the chart on page 13, the dark grey global line
shows a steady increase in the engagement level for the average company over the past
five years, from 56% to 62% . But although the global levels have been steadily
increasing, the regional trends tell a very different story .
The Latin American region continues to have the highest and most stable engagement
levels, with around seven out 10 employees engaged . We attribute some of this dynamic
to the economic and cultural attributes of the region . Africa and the Middle East region,
with the next highest levels of employee engagement at 67%, has seen great volatility in
the last five years—falling to a low of only 53% engaged in 2012, but rising 14 points in
just the last two years . This volatility and rapid bounce are likely related to both regional
risk and economic opportunities . North America has the next highest engagement
levels, and is now almost back to pre-recession highs at 66% . The Asia Pacific region is up
3 points in the last year to 64% and has seen a 9-point increase in average engagement
over the last five years, which is likely interrelated with steadily high economic
opportunities across many markets in the region . The European region historically has
had the lowest engagement levels, and has seen no change in the last three years at 57%
average engagement . The average European company saw a significant rise in employee
engagement in the first few years after the recession (from 51% in 2010 to 57% in 2012),
but as growth prospects for many Eurozone markets have stalled in the last few years
amid growth in other global regions, so has employee engagement .
Trends in Global Employee Engagement
6050
40
3020
10
0100
9080
70
62%
Bottom Quartile–51% Top Quartile–76%
2014
Global Engagement
Average
Global Engagement Shift
6050
40
3020
10
0100
9080
70
61%
Bottom Quartile–50% Top Quartile–77%
2013
Global Engagement
Average
Aon Hewitt 13
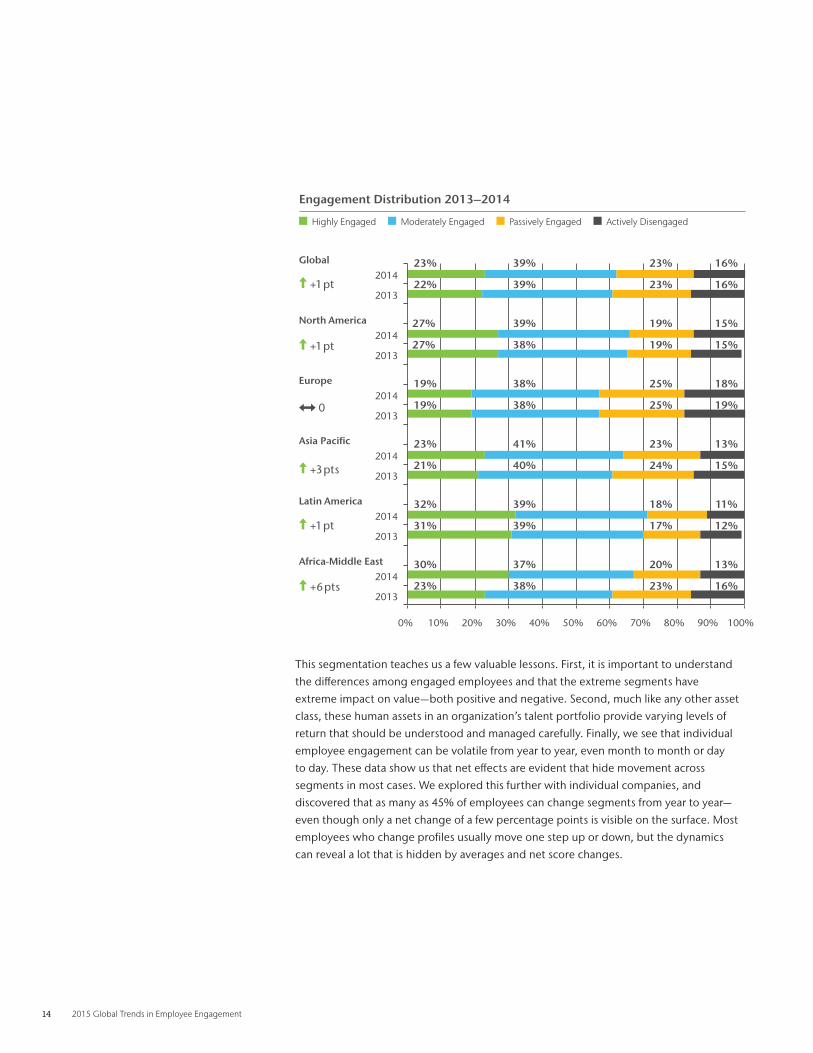
The figure on page 14 shows the segmentation of employees into various engagement
profiles . The engaged group can be segmented further into the highly engaged and
the moderately engaged . Likewise, the non-engaged employees can be segmented
into passively and actively disengaged employees .
We have consistently found that the highly engaged employees (those who are most
positive about all say, stay, and strive indicators) deliver the most value to the
organization—well above even the moderately engaged . These highly engaged are
much like the “promoters” measured on Net Promoter Score (NPS) customer metrics
in terms of the exponential value they deliver to an organization .
Passive employees demonstrate ambivalence toward their jobs and their employers—
sometimes positive and sometimes negative . These employees represent an opportunity
to be taken seriously—they could become more engaged or they could also disengage .
Finally, nearly two out of 10 employees are actively disengaged . These employees do not
say positive things about the company, do not see a long-term path, and do not strive
to go above and beyond .
We have seen a trend in the last few years with a net positive shift in the extreme
segments, meaning fewer actively disengaged and more highly engaged employees—
particularly in the rapid-growth regions . We are also seeing a trend of organizations
managing these extremes, particularly in understanding the highly engaged employees
and leaders and putting plans in place to assess, select, and develop more of them .
Global Trends in Employee Engagement
Global Latin America Africa-Middle East Asia Pacific North America Europe
50%
55%
60%
65%
70%
75%
52%
57%57% 57%
51%
2010 2011 2012 2013 2014
72%
64%
55%
58%
64%
62%
56%58%
60% 62%61%
53%
61%
67%
64% 63%65% 66%
71% 74% 70%71%
Source: Aon Hewitt Database
14 2015 Global Trends in Employee Engagement
This segmentation teaches us a few valuable lessons . First, it is important to understand
the differences among engaged employees and that the extreme segments have
extreme impact on value—both positive and negative . Second, much like any other asset
class, these human assets in an organization’s talent portfolio provide varying levels of
return that should be understood and managed carefully . Finally, we see that individual
employee engagement can be volatile from year to year, even month to month or day
to day . These data show us that net effects are evident that hide movement across
segments in most cases . We explored this further with individual companies, and
discovered that as many as 45% of employees can change segments from year to year—
even though only a net change of a few percentage points is visible on the surface . Most
employees who change profiles usually move one step up or down, but the dynamics
can reveal a lot that is hidden by averages and net score changes .
Engagement Distribution 2013–2014
Highly Engaged Moderately Engaged Passively Engaged Actively Disengaged
38%
37%
39%
39%
40%
41%
38%
38%
38%
39%
39%
39%
23%
30%
31%
32%
21%
23%
19%
19%
27%
27%
22%
23%
23%
20%
17%
18%
24%
23%
25%
25%
19%
19%
23%
23%
16%
13%
12%
11%
15%
13%
19%
18%
15%
15%
16%
16%
0% 10% 20% 30% 40% 50% 60% 70% 80% 90% 100%
2013
2014
2013
2014
2013
2014
2013
2014
2013
2014
2013
2014
Africa-Middle East
Latin America
Asia Pacific
Europe
North America
Global
+1 pt
+1 pt
0
+3 pts
+1 pt
+6 pts
Aon Hewitt 15
Year-over-year Net Engagement
+2%+15% Engaging
-13
% D
iseng
agin
g
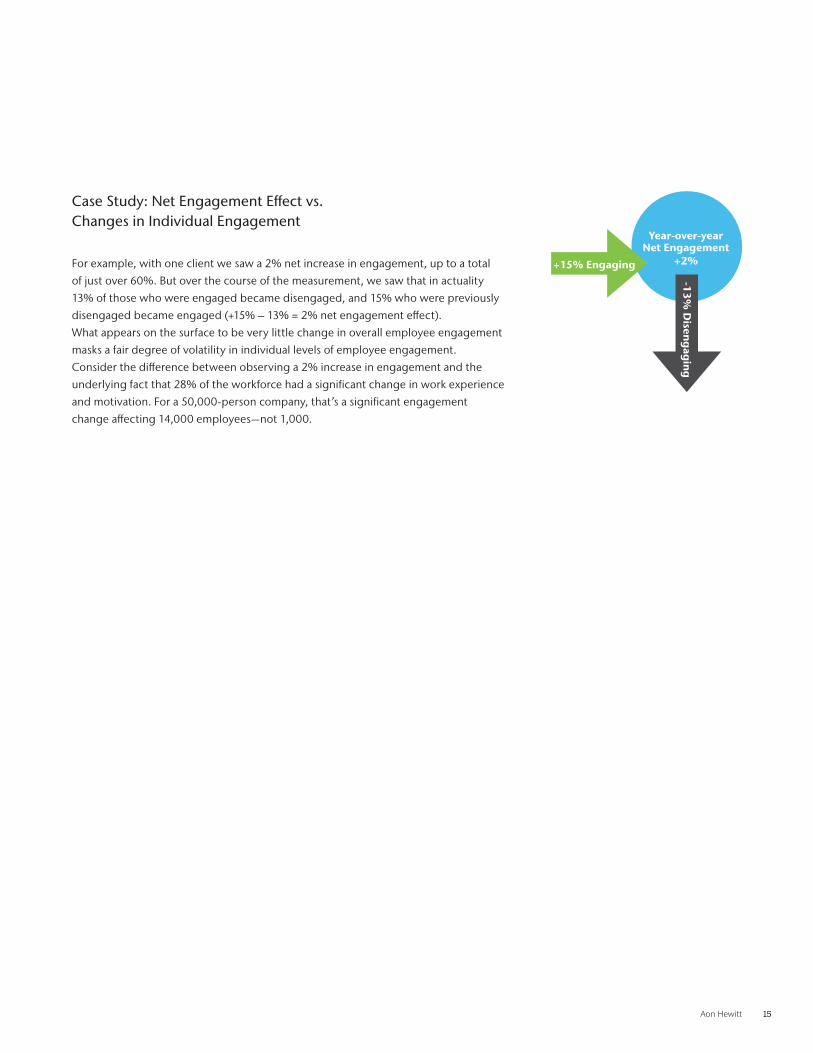
Case Study: Net Engagement Effect vs . Changes in Individual Engagement
For example, with one client we saw a 2% net increase in engagement, up to a total
of just over 60% . But over the course of the measurement, we saw that in actuality
13% of those who were engaged became disengaged, and 15% who were previously
disengaged became engaged (+15% – 13% = 2% net engagement effect) .
What appears on the surface to be very little change in overall employee engagement
masks a fair degree of volatility in individual levels of employee engagement .
Consider the difference between observing a 2% increase in engagement and the
underlying fact that 28% of the workforce had a significant change in work experience
and motivation . For a 50,000-person company, that’s a significant engagement
change affecting 14,000 employees—not 1,000 .
16 2015 Global Trends in Employee Engagement
Global Economic and Labor Dynamics
In order to take a realistic view of trends in global employee engagement, one must take
into account economic and labor indicators . As noted earlier, the average employee
engagement level across all markets has risen 1 point, to 62% . However, when looking
at engagement levels in companies operating in the world’s largest markets, we see a
slightly different picture . The average engagement level (weighted for both relative GDP
and labor size) in these large global markets is slightly less—at 61%—and has remained
unchanged from 2013 to 2014 . This average engagement level is brought down by lower
engagement levels in Europe and Japan . The upward trend in employee engagement
is greatly slowed down by some global “giants”—India, the U .S ., and Germany all have
had no change in engagement and the rate of engagement in China fell 4 points .
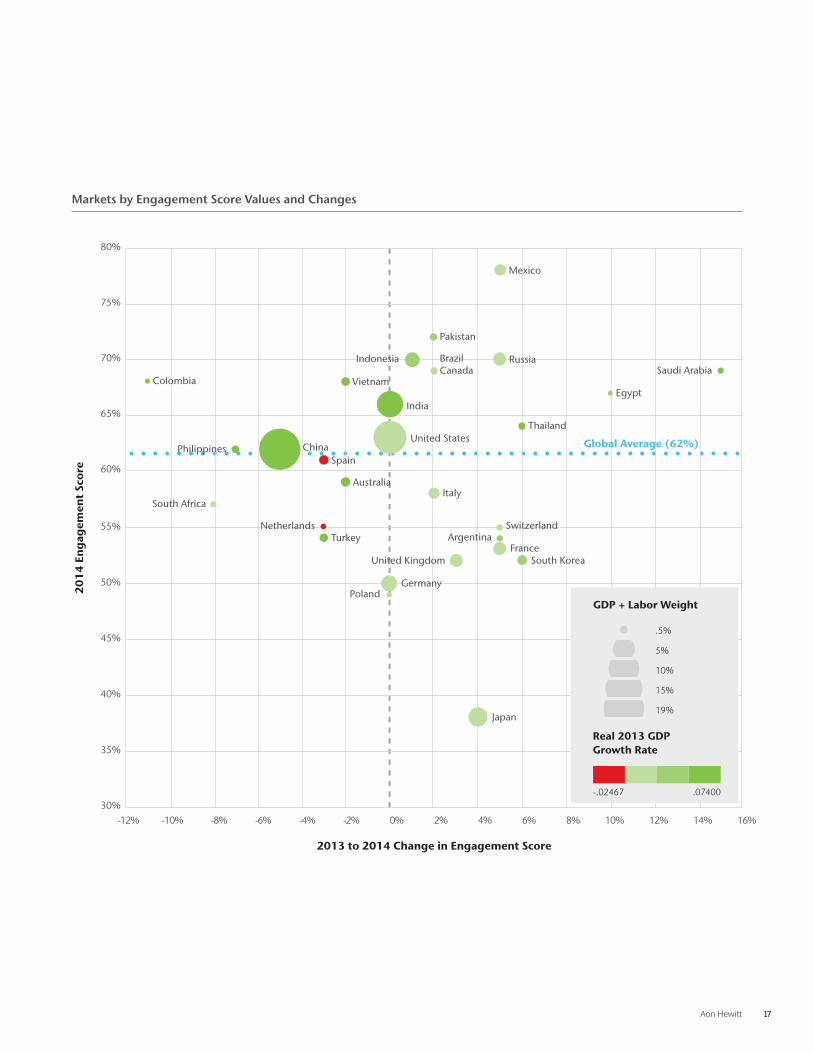
However, as the chart on page 17 illustrates, there is no clear pattern . Examining these
data further, we also see some other interesting groupings . We see that Europe’s largest
markets—Germany, UK, and France—have much lower average engagement in the
mid-50% range, but also show positive engagement trends . Russia, Pakistan, Egypt, and
Saudi Arabia are the markets with high and growing engagement levels . Japan and
Mexico demonstrate some of the extreme outlier conditions—Japan, with historically low
levels of employee engagement, shows positive engagement growth (+6 points) and
Mexico, with the highest engagement levels on the planet, also shows a positive 4-point
trend in engagement levels .
The interplay of macro, micro, labor, and behavioral economics covered in our previous
two Engagement Trends reports continues . We generally see a lagged feedback loop
from macro to behavioral trends, creating both virtuous and vicious circles for
organizations and employees .
Consider two companies: One is growing with favorable economic tailwinds .
Management in turn invests in employee growth, rewards, and recognition; employees
in turn are attracted to and stay with the company, and are engaged to contribute to
the company’s objectives . The second company is struggling to grow amid economic
headwinds and competitive labor conditions . Management has fewer profits to reinvest
in employees’ growth and rewards, employees become less motivated, and it becomes
more difficult to attract and retain top talent to deliver desperately needed growth .
We can see that the rate of economic growth plays a moderating role in this overly
simplistic view .
Aon Hewitt 17
Markets by Engagement Score Values and Changes
-12% 4%-10% 6%-8% 8%-4% 12%0% 16%-6% 10%-2% 14%2%
80%
75%
70%
65%
60%
55%
50%
45%
40%
35%
30%
Colombia
Philippines
South Africa
China
Vietnam
India
BrazilIndonesia
Pakistan
Mexico
CanadaRussia
Egypt
Saudi Arabia
United States
Spain
Italy
Thailand
Global Average (62%)
Australia
NetherlandsTurkey
Switzerland
FranceSouth Korea
Argentina
Germany
Japan
United Kingdom
Poland20
14
En
gag
emen
t Sc
ore
2013 to 2014 Change in Engagement Score
GDP + Labor Weight
.5%
5%
10%
15%
19%
Real 2013 GDP Growth Rate
-.02467 .07400
18 2015 Global Trends in Employee Engagement
Change in GDP vs. Change in Engagement
Region Africa-Middle East Asia Pacific Europe Latin America North America
16%
14%
12%
10%
8%
6%
4%
2%
0%
-2%
-4%
-6%
-8%
-10%
-12%
-2 .0% 1 .0%-1 .0% 2 .0%0 .0% 3 .0% 4 .0% 5 .0% 6 .0% 7 .0% 8 .0%
20
13
to
20
14
Ch
ang
e in
En
gag
emen
t Sc
ore
Real 2013 GDP Growth Rate
Colombia
Philippines
South Africa
China
India
Vietnam
Brazil Indonesia
Pakistan
Mexico
Canada
Russia
Egypt
Saudi Arabia
Spain
Italy
Thailand
AustraliaNetherlands
Turkey
Switzerland
Japan
France
South Korea
Argentina
United Kingdom
GDP + Labor Weight
.5%
5%
10%
15%
19%
Germany Poland United States
Aon Hewitt 19
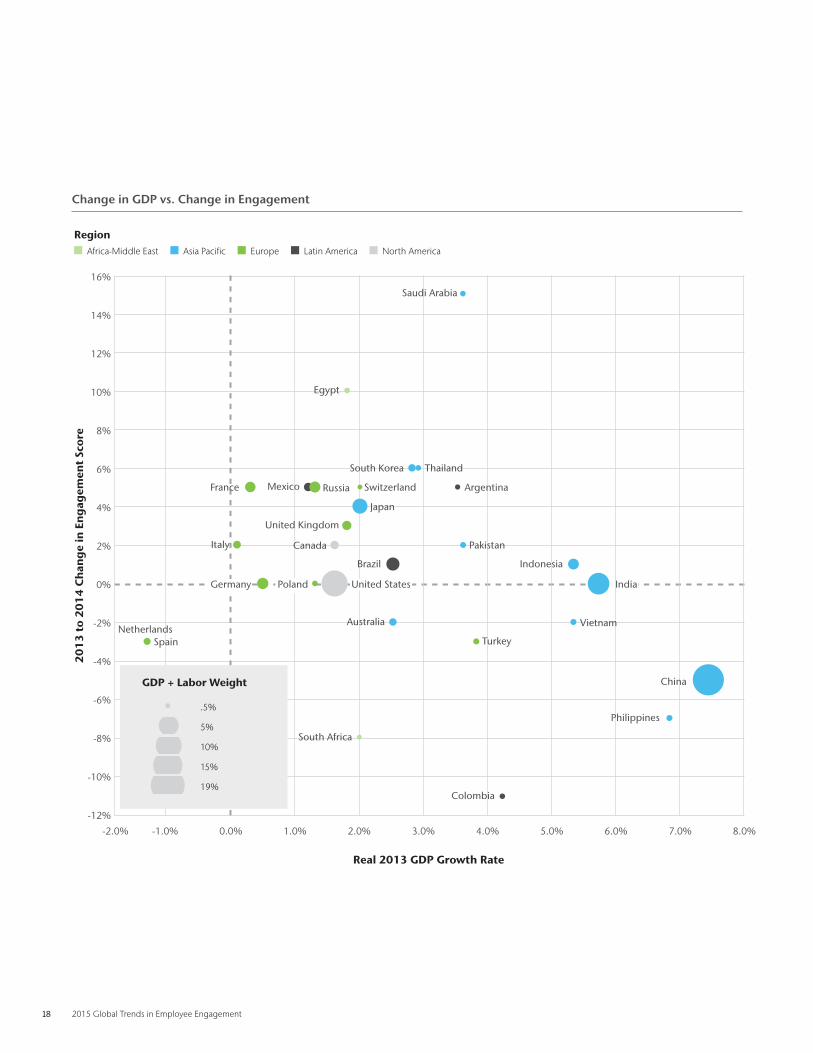
The chart on page 18 displays 2013 GDP growth and engagement growth a year later in
2014 for the world’s largest markets (weighted by GDP and labor pool) . At first glance,
there is no real pattern . However, there is a very distinct set of dynamics distinguishing
low-growth markets from high-growth markets . First, the low-growth European
markets (in green) show a significantly positive correlation (r = 0 .65 if Turkey is excluded)
between GDP growth and engagement level increases a year later . Perhaps this
represents the motivating effect of tailwinds and freed up human capital investments .
Examining the pattern of high-growth markets in Asia Pacific (blue) and Latin America
(grey), we see the opposite pattern . There is a distinctly negative correlation between
GDP growth and engagement change in these high-growth markets (r = -0 .61 and -0 .50,
respectively) . As GDP growth moves higher and higher, engagement falls . This suggests
that as growth and market opportunity exceed a company’s ability to enable employees
and deliver on customer expectations, pressure on the employees increases and
engagement falls . Excessive tailwinds can become barriers as companies and employees
struggle to keep up .
In the next section we will examine aspects of the work environment that further explain
the dynamics in these global regions .
20 2015 Global Trends in Employee Engagement
Work Experience Trends
Broadly speaking, the work experience is made up of several elements that can be
grouped as either foundational elements or potential differentiators . Foundational
elements consist of company practices like communication, policies, and infrastructure;
the basic areas like job security and benefits; and the work itself . Potential differentiators
are seen in perceptions of brand or reputation, leadership, and performance orientation .
In addition to driving strong engagement levels, these three areas of differentiation
are the critical areas in which Aon Hewitt Best Employer companies excel .
Despite some steady increases in some leadership and business alignment indicators,
these trends point to a general work experience of frustrated engagement . As we
found in our Engagement Outlier research4, the best way to rapidly improve low
engagement levels is to “fix the basics”—and the basics appear to be suffering . Looking
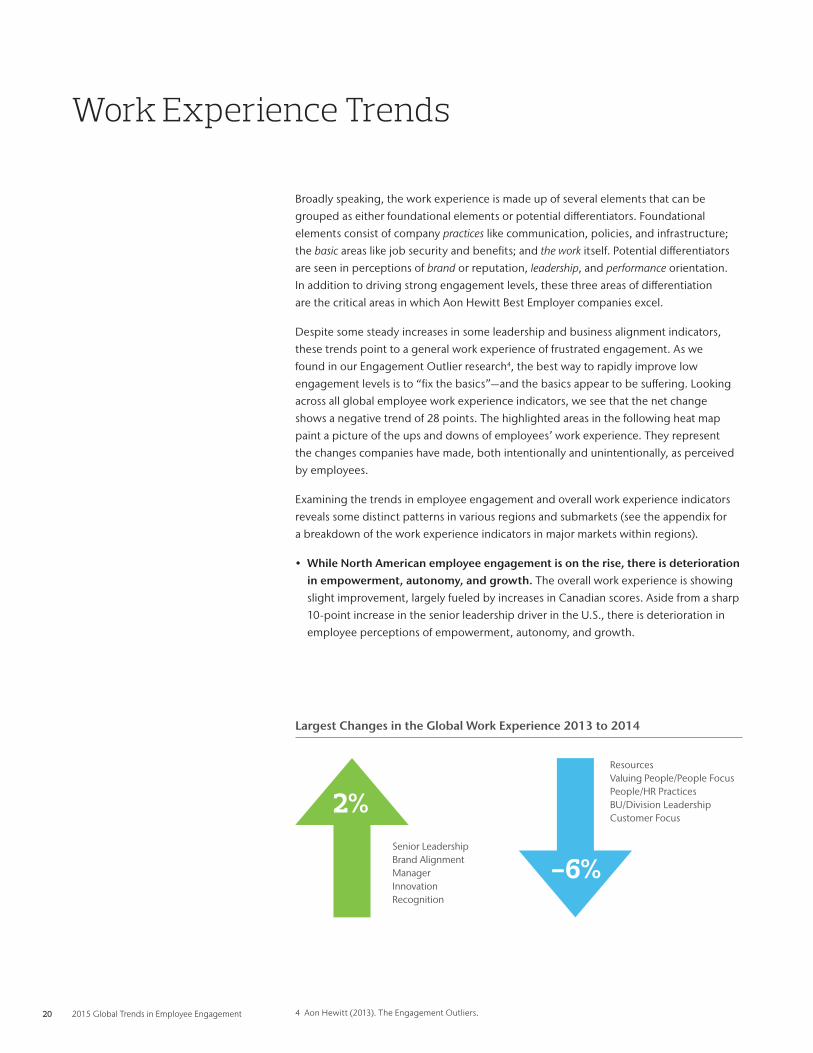
across all global employee work experience indicators, we see that the net change
shows a negative trend of 28 points . The highlighted areas in the following heat map
paint a picture of the ups and downs of employees’ work experience . They represent
the changes companies have made, both intentionally and unintentionally, as perceived
by employees .
Examining the trends in employee engagement and overall work experience indicators
reveals some distinct patterns in various regions and submarkets (see the appendix for
a breakdown of the work experience indicators in major markets within regions) .
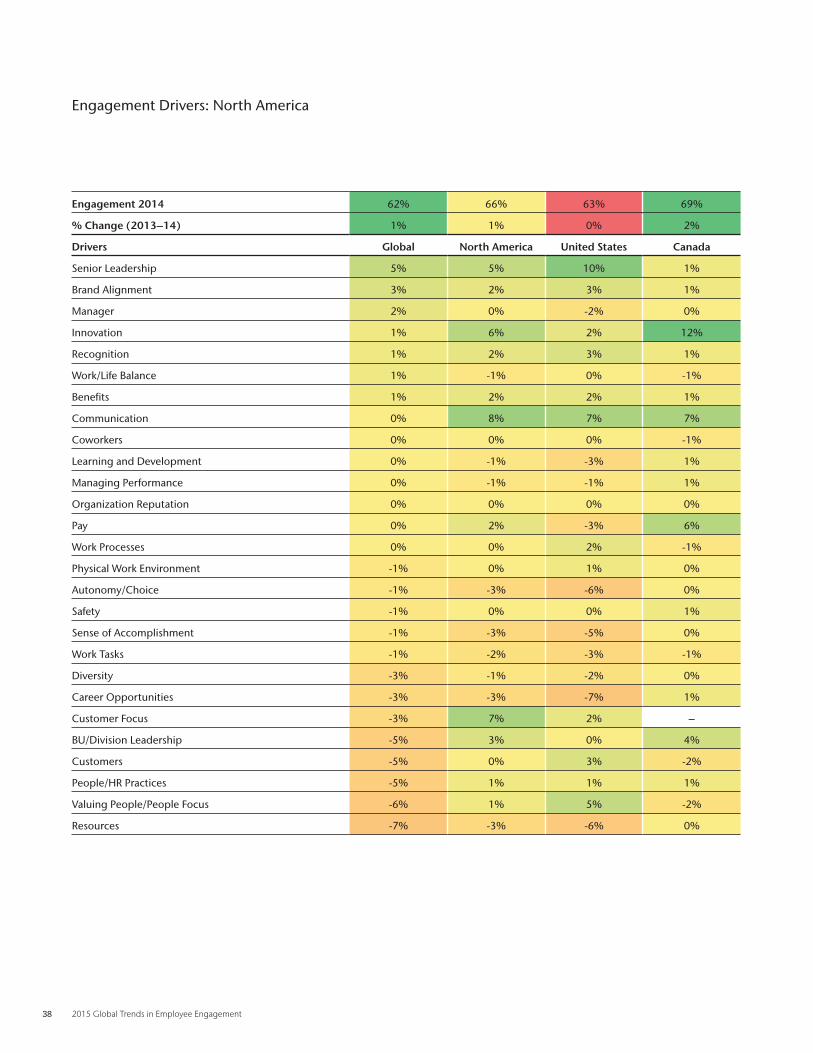
• While North American employee engagement is on the rise, there is deterioration in empowerment, autonomy, and growth. The overall work experience is showing
slight improvement, largely fueled by increases in Canadian scores . Aside from a sharp
10-point increase in the senior leadership driver in the U .S ., there is deterioration in
employee perceptions of empowerment, autonomy, and growth .
4 Aon Hewitt (2013). The Engagement Outliers.
Largest Changes in the Global Work Experience 2013 to 2014
2%
-6%Senior LeadershipBrand AlignmentManagerInnovationRecognition
ResourcesValuing People/People FocusPeople/HR PracticesBU/Division LeadershipCustomer Focus
Aon Hewitt 21
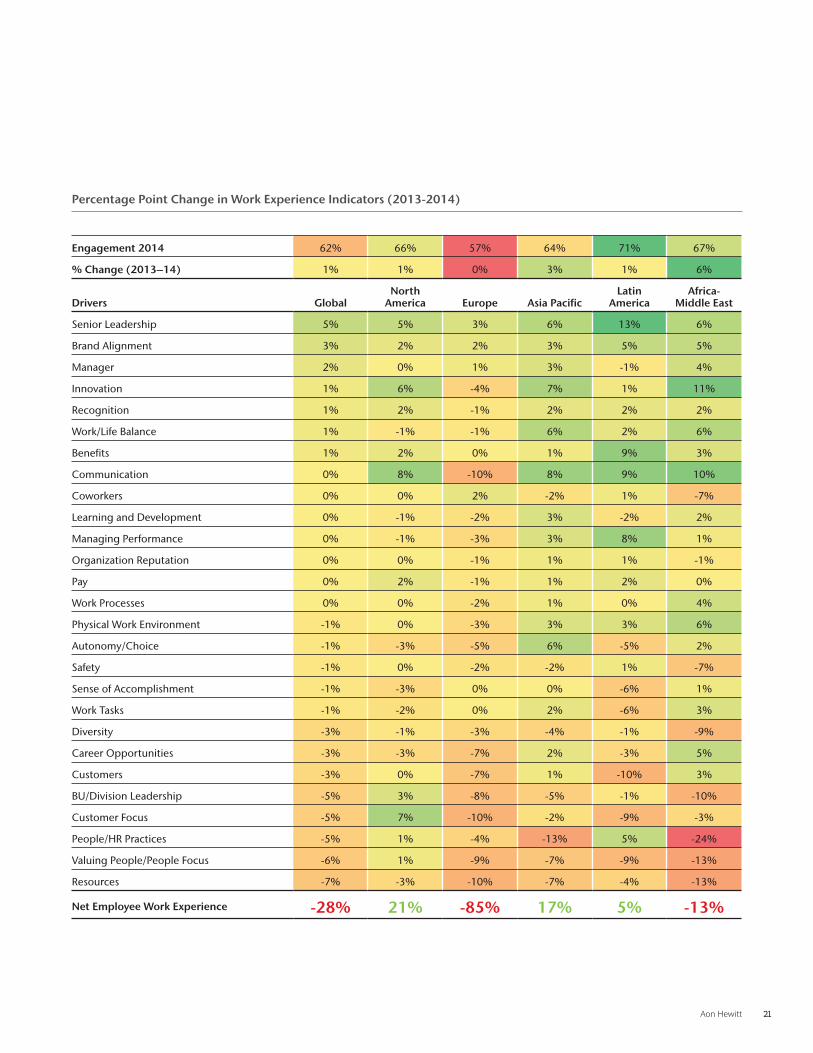
Engagement 2014 62% 66% 57% 64% 71% 67%
% Change (2013–14) 1% 1% 0% 3% 1% 6%
Drivers GlobalNorth
America Europe Asia PacificLatin
AmericaAfrica-
Middle East
Senior Leadership 5% 5% 3% 6% 13% 6%
Brand Alignment 3% 2% 2% 3% 5% 5%
Manager 2% 0% 1% 3% -1% 4%
Innovation 1% 6% -4% 7% 1% 11%
Recognition 1% 2% -1% 2% 2% 2%
Work/Life Balance 1% -1% -1% 6% 2% 6%
Benefits 1% 2% 0% 1% 9% 3%
Communication 0% 8% -10% 8% 9% 10%
Coworkers 0% 0% 2% -2% 1% -7%
Learning and Development 0% -1% -2% 3% -2% 2%
Managing Performance 0% -1% -3% 3% 8% 1%
Organization Reputation 0% 0% -1% 1% 1% -1%
Pay 0% 2% -1% 1% 2% 0%
Work Processes 0% 0% -2% 1% 0% 4%
Physical Work Environment -1% 0% -3% 3% 3% 6%
Autonomy/Choice -1% -3% -5% 6% -5% 2%
Safety -1% 0% -2% -2% 1% -7%
Sense of Accomplishment -1% -3% 0% 0% -6% 1%
Work Tasks -1% -2% 0% 2% -6% 3%
Diversity -3% -1% -3% -4% -1% -9%
Career Opportunities -3% -3% -7% 2% -3% 5%
Customers -3% 0% -7% 1% -10% 3%
BU/Division Leadership -5% 3% -8% -5% -1% -10%
Customer Focus -5% 7% -10% -2% -9% -3%
People/HR Practices -5% 1% -4% -13% 5% -24%
Valuing People/People Focus -6% 1% -9% -7% -9% -13%
Resources -7% -3% -10% -7% -4% -13%
Net Employee Work Experience -28% 21% -85% 17% 5% -13%
Percentage Point Change in Work Experience Indicators (2013-2014)
22 2015 Global Trends in Employee Engagement
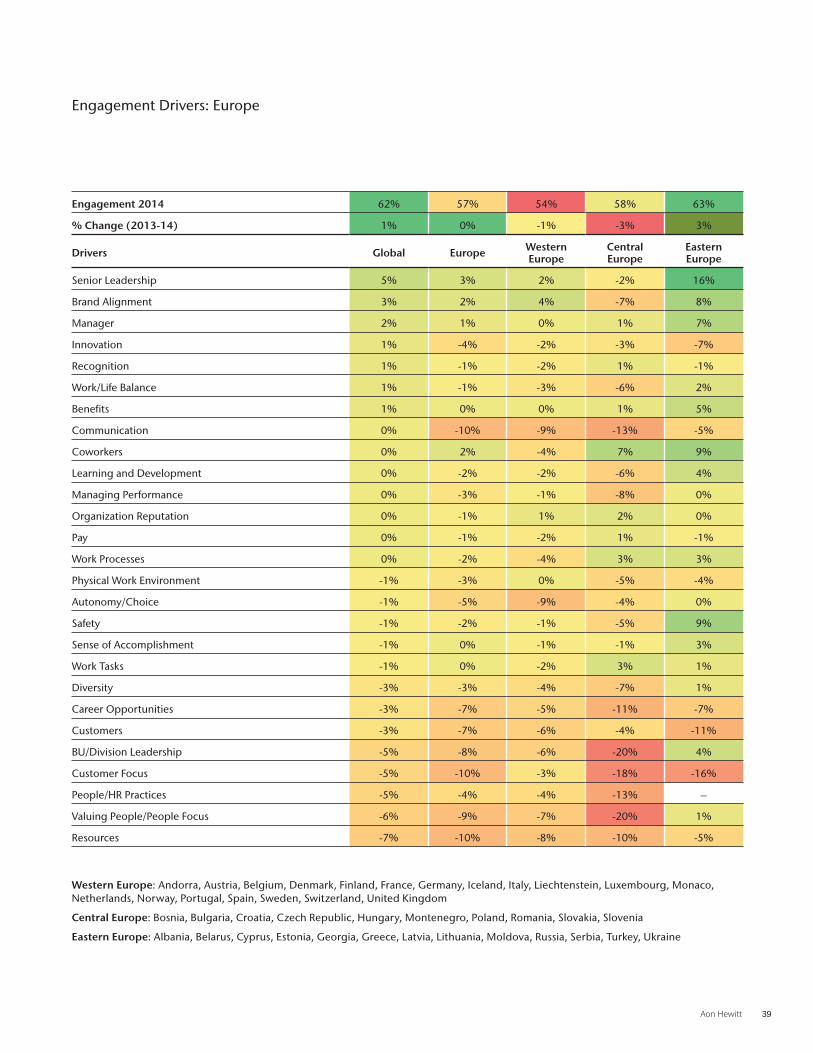
• The European region is struggling against relatively lower GDP forecasts, declining engagement, and a deteriorating work experience. This region’s work experience
has the largest negative trend relative to other global regions (net employee work
experience trend of -85 points) primarily in the areas of enabling resources, customer
focus, and communication and people practices . Engagement in this region lags the
global average with Western Europe experiencing lower and falling engagement
scores and Central Europe facing sharply negative trends . However, Eastern Europe
demonstrated significantly higher and improving levels of employee engagement .
• The Asia Pacific region shows continuing strong prospects but also local volatility and engagement risk. In this region, we see strong GDP growth and improved
engagement and work experience indicators across all key engagement drivers .
However, we also see the wild dynamics of low engagement in Japan (although
improving), deteriorating engagement and work experience indicators in China, and
increasing engagement and work experience indicators in South Korea . As noted earlier,
a combination of strong market growth without the resources to deliver on demand
and customer expectations can create engagement risks for markets like China .
• Latin America is improving moderately in terms of incremental economic growth, engagement levels, and improvement in all of the top engagement drivers. The overall work experience is improving for this region in the critical drivers
of leadership, EVP, communication, managing performance, pay, and career
opportunities . However, there is a great deal of variance across markets . Colombia,
Chile, and Peru seem to have negatively trending work experiences that indicate lack
of enablement with employees struggling to keep up . Colombia, in particular, is sharply
negative . But Argentina’s trend is positive, up from relatively low engagement levels .
Puerto Rico, Mexico, and Venezuela have high and improving engagement, although
work experience indicators in Venezuela indicate a contrast of positives and negatives .
• Africa and the Middle East markets are showing strong yet volatile economic, labor, and growth opportunities. The Middle East and North African region has seen
engagement levels grow 8 points, to 70% . Despite deterioration in enabling practices
and resources, the MENA region has seen a generally positive work experience trend
with strong improvement in areas of innovation, leadership, communication, and EVP .
However, sub-Sahara Africa’s average engagement is closer to the global average, and
falling . Basic work experience elements are generally trending negatively with the
greatest deterioration in resources, safety, and work-life balance in sub-Sahara Africa .
Aon Hewitt 23
Making Engagement Happen
24 2015 Global Trends in Employee Engagement
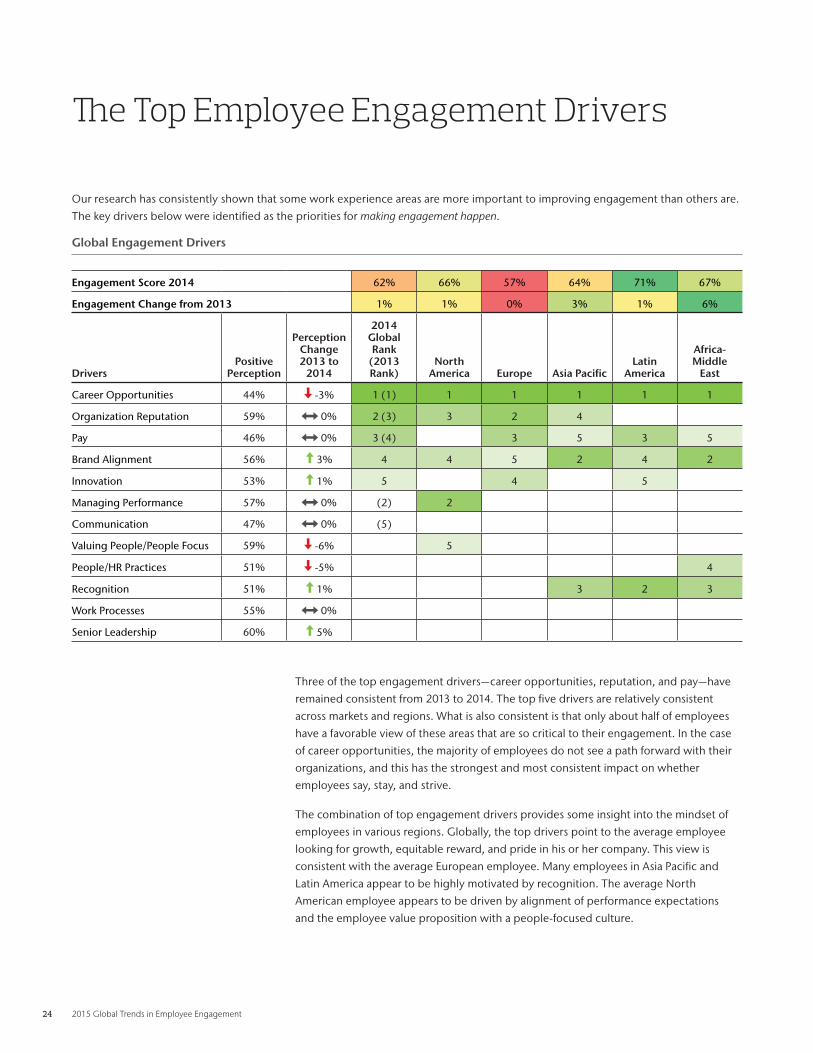
Three of the top engagement drivers—career opportunities, reputation, and pay—have
remained consistent from 2013 to 2014 . The top five drivers are relatively consistent
across markets and regions . What is also consistent is that only about half of employees
have a favorable view of these areas that are so critical to their engagement . In the case
of career opportunities, the majority of employees do not see a path forward with their
organizations, and this has the strongest and most consistent impact on whether
employees say, stay, and strive .
The combination of top engagement drivers provides some insight into the mindset of
employees in various regions . Globally, the top drivers point to the average employee
looking for growth, equitable reward, and pride in his or her company . This view is
consistent with the average European employee . Many employees in Asia Pacific and
Latin America appear to be highly motivated by recognition . The average North
American employee appears to be driven by alignment of performance expectations
and the employee value proposition with a people-focused culture .
Our research has consistently shown that some work experience areas are more important to improving engagement than others are .
The key drivers below were identified as the priorities for making engagement happen .
Global Engagement Drivers
The Top Employee Engagement Drivers
Engagement Score 2014 62% 66% 57% 64% 71% 67%
Engagement Change from 2013 1% 1% 0% 3% 1% 6%
DriversPositive
Perception
Perception Change 2013 to
2014
2014 Global Rank
(2013 Rank)
North America Europe Asia Pacific
Latin America
Africa-Middle
East
Career Opportunities 44% -3% 1 (1) 1 1 1 1 1
Organization Reputation 59% 0% 2 (3) 3 2 4
Pay 46% 0% 3 (4) 3 5 3 5
Brand Alignment 56% 3% 4 4 5 2 4 2
Innovation 53% 1% 5 4 5
Managing Performance 57% 0% (2) 2
Communication 47% 0% (5)
Valuing People/People Focus 59% -6% 5
People/HR Practices 51% -5% 4
Recognition 51% 1% 3 2 3
Work Processes 55% 0%
Senior Leadership 60% 5%
Aon Hewitt 25
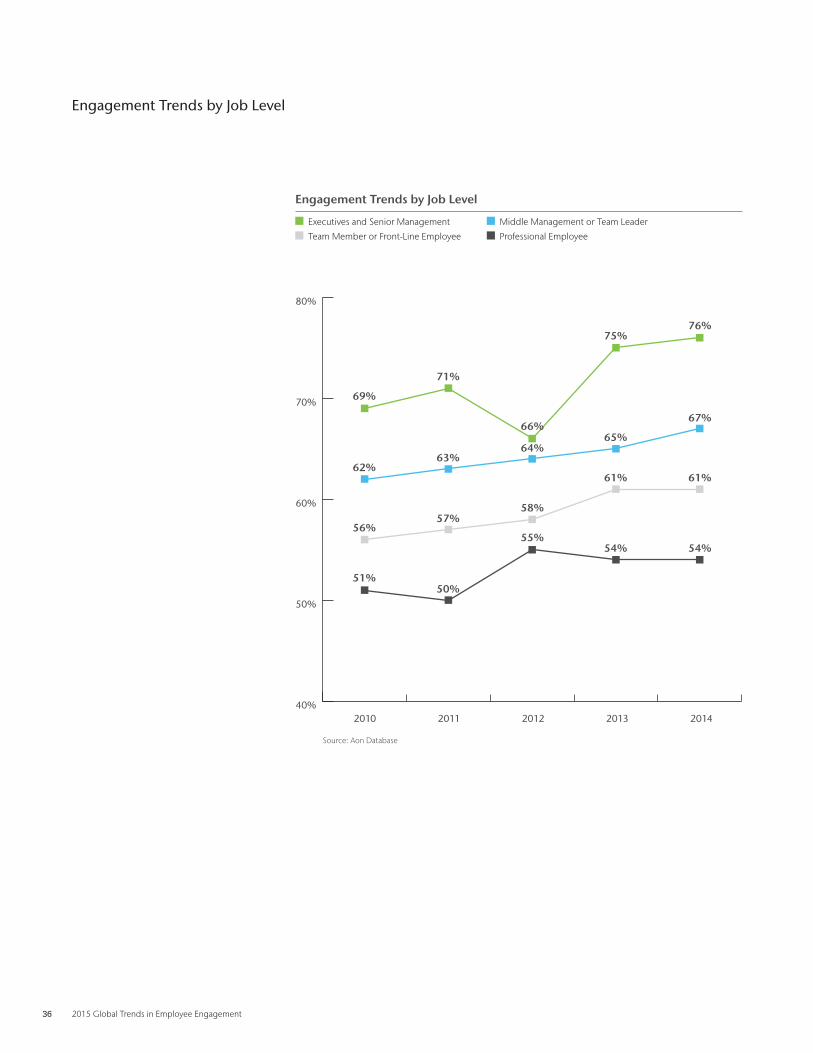
The greatest degree of variation in engagement drivers typically
is found by organizational level and job function . We do not see
as many differences in engagement drivers across generations
(see appendix) as for drivers by different job segments .
For example, executives and senior management have higher
than average engagement at 76%, and are most motivated
by the reputation of their companies . Professional individual
contributor employees have the lowest level of engagement
at 54%, and are most engaged by growth opportunities,
performance management that allows them to contribute, and
recognition . Engineering, production, and finance professionals
are most engaged by pay .
The differences in these segments—as well as others in various
companies and industries—show how important it is to
understand employees’ engagement drivers and create the
strategies with the greatest impact on factors such as
effectiveness compared to benchmarks, relative impact of
various drivers on engagement, and the ability to change
the conditions of a particular driver . The themes of the top
engagement drivers (innovative companies with strong
reputations; performance-oriented cultures that match results
with rewards; environments where employees are enabled
to perform, grow, and be recognized) are not only what
employees need to be engaged . Those themes are also
organizational, and are driven by the effective leaders and
practices commonly found in best employers with superior
and sustained financial performance . They are critical
ingredients to creating a culture of engagement .
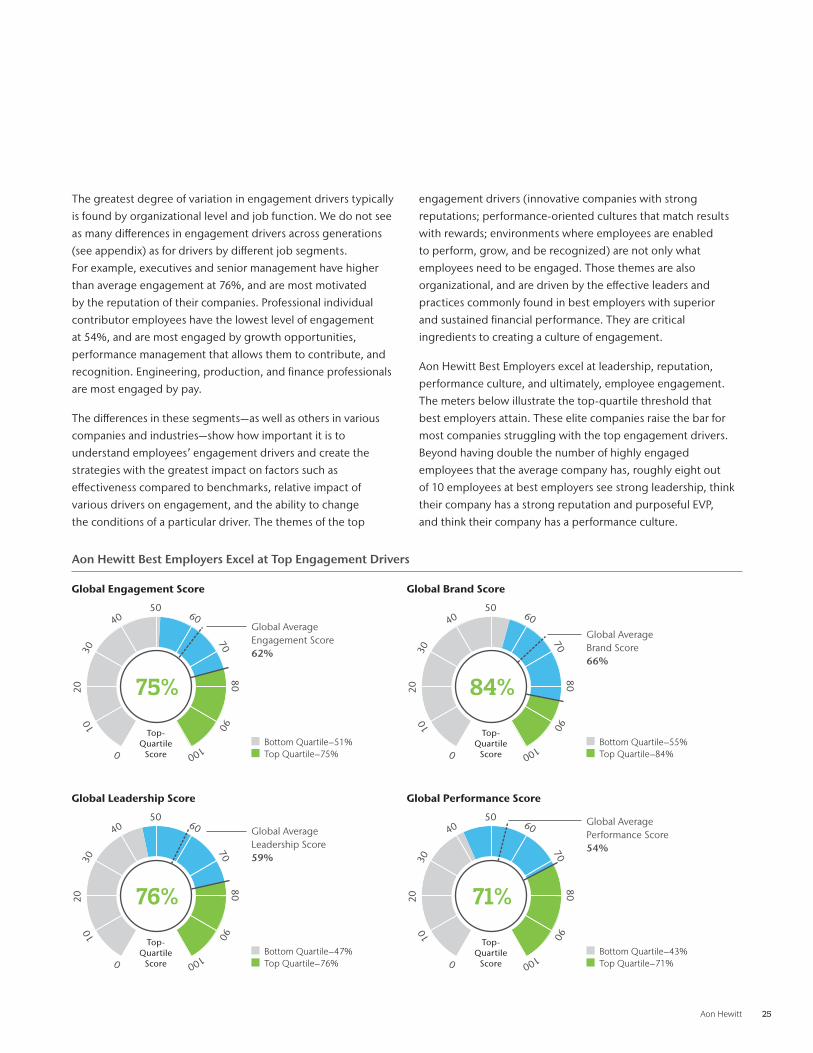
Aon Hewitt Best Employers excel at leadership, reputation,
performance culture, and ultimately, employee engagement .
The meters below illustrate the top-quartile threshold that
best employers attain . These elite companies raise the bar for
most companies struggling with the top engagement drivers .
Beyond having double the number of highly engaged
employees that the average company has, roughly eight out
of 10 employees at best employers see strong leadership, think
their company has a strong reputation and purposeful EVP,
and think their company has a performance culture .
Aon Hewitt Best Employers Excel at Top Engagement Drivers
6050
40
3020
10
0100
9080
70
75%
Bottom Quartile–51% Top Quartile–75%
Global Engagement Score
Top- Quartile
Score
Global Average Engagement Score 62%
6050
40
3020
100
100
9080
70
76%
6050
40
3020
10
0100
9080
70
71%
Bottom Quartile–47% Top Quartile–76%
Bottom Quartile–43% Top Quartile–71%
Global Leadership Score Global Performance Score
Top- Quartile
Score
Top- Quartile
Score
Global Average Leadership Score 59%
Global Average Performance Score 54%
6050
40
3020
10
0100
9080
70
84%
Bottom Quartile–55% Top Quartile–84%
Global Brand Score
Top- Quartile
Score
Global Average Brand Score 66%
26 2015 Global Trends in Employee Engagement
Whether companies are looking to become Aon Hewitt Best Employers or Aon Hewitt
Top Companies for Leaders®, reaping the financial rewards that come with this level of
execution requires a holistic approach . The findings in this report point to actions
companies can take to create a culture of engagement . Several executives from the
Aon Hewitt Top Companies for Leaders® study provide insights and thoughts on how
they have made engagement happen at their companies . Historically, moving the needle
on engagement has been the work of HR and of people managers . But best practices
from the best organizations demonstrate investments in helping leaders lead the way
to a culture of engagement . These leaders focus on building skills, empowering others
and driving individual accountability to take ownership of solutions and of one’s
own engagement .
Conventional wisdom may view HR as the owner of employee engagement, but current
research shows the role of the HR professional is to support the leaders of the organization
in achieving the engagement agenda . HR owns many programs required for engagement,
such as setting a strong employee value proposition (EVP), pay, development programs,
and often managing an employee survey program . HR business partners also typically
support the delivery of action plans at a managerial unit level . Another critical
stakeholder is the people manager, who owns the delivery of employee growth and
performance . Managers play a big role in the delivery of career planning and coaching
(essential elements for building a primary driver of engagement—career opportunities) .
While HR and people managers have traditionally been the primary stakeholders in an
engagement agenda, we see a rapidly accelerating shift in responsibility toward two
other critical stakeholders required to create a culture of engagement—senior leaders
and the individuals themselves .
Companies have been talking for many years about career development being a two-way
street requiring both company and individual responsibility . Likewise, many engagement
strategies are beginning to involve the individual as another important stakeholder in
managing his or her own engagement . Awareness and mindfulness in employees appear
to be prerequisites for enabling them to fully engage and unleash their energy . Thus,
individual feedback and reflection at the individual level are needed . Companies are now
beginning to provide more direct feedback to employees through websites and mobile
devices that challenge employees to reflect on their own engagement, to understand
when they are most/least engaged, and to get actively involved in ensuring they have
what they need to be optimally engaged .
As mentioned above, leaders are the ultimate owners of creating a culture of engagement .
“Leadership is what makes or breaks our projects . With strong leaders, projects hum,
clients are happy, and the teams are highly engaged .” (CEO, global top company) . Senior
leaders impact virtually every critical engagement driver we see in our research, ranging
from organizational reputation and innovation to the resources, policies, processes, and
infrastructure elements that enable (or frustrate and discourage) change and growth .
Leaders can also exponentially engage others through direct coaching and developing
other leaders (who, in turn, coach and develop other leaders) . Nearly all of the global top
Beyond Engagement Measurement— Solutions to Make Engagement Happen
“ To keep the more than 120,000 employees motivated and engaged you have to continuously provide a clear vision for the next 10 years, and clarify with your people their role in helping the organization achieve this vision.”
— Joseph Jimenez, (CEO), Novartis
Aon Hewitt 27
companies for leaders’ senior management teams get involved with most aspects of core
talent activities like coaching (100%), feedback (100%), and performance discussions
(96%) . We offer five key ingredients to building a culture of engagement below .
1 . Build Engaging Leadership
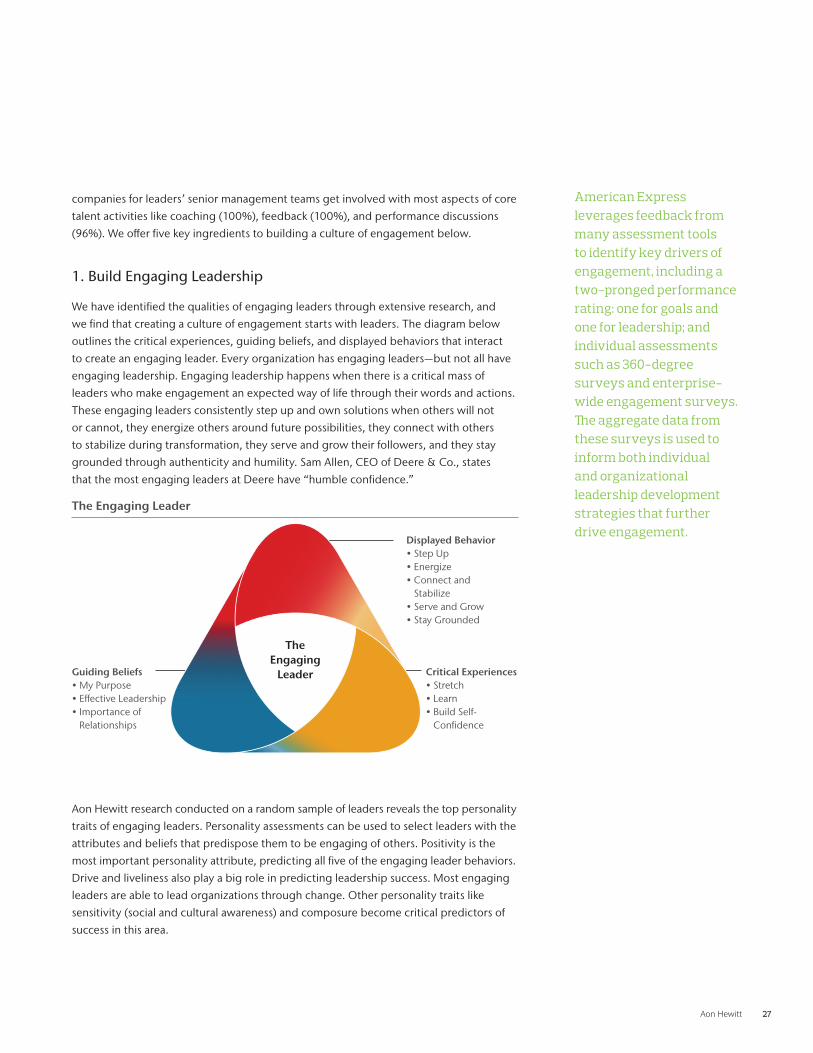
We have identified the qualities of engaging leaders through extensive research, and
we find that creating a culture of engagement starts with leaders . The diagram below
outlines the critical experiences, guiding beliefs, and displayed behaviors that interact
to create an engaging leader . Every organization has engaging leaders—but not all have
engaging leadership . Engaging leadership happens when there is a critical mass of
leaders who make engagement an expected way of life through their words and actions .
These engaging leaders consistently step up and own solutions when others will not
or cannot, they energize others around future possibilities, they connect with others
to stabilize during transformation, they serve and grow their followers, and they stay
grounded through authenticity and humility . Sam Allen, CEO of Deere & Co ., states
that the most engaging leaders at Deere have “humble confidence .”
The Engaging Leader
American Express leverages feedback from many assessment tools to identify key drivers of engagement, including a two-pronged performance rating: one for goals and one for leadership; and individual assessments such as 360-degree surveys and enterprise-wide engagement surveys. The aggregate data from these surveys is used to inform both individual and organizational leadership development strategies that further drive engagement.
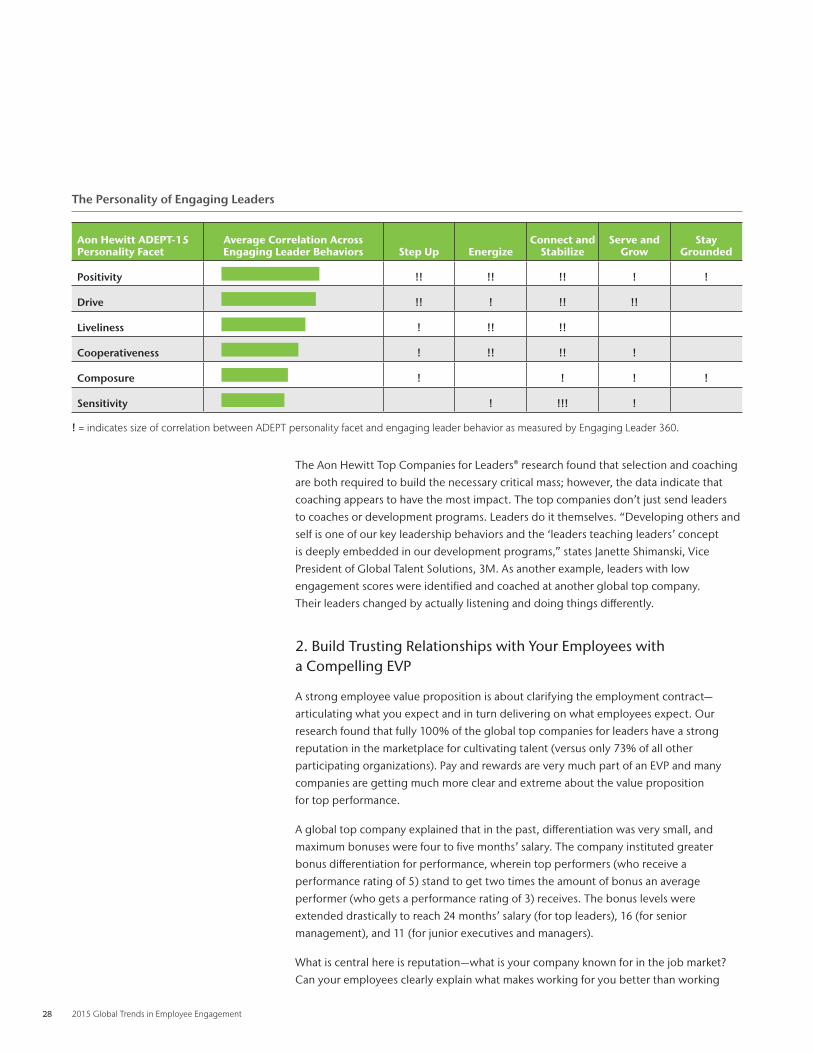
Aon Hewitt research conducted on a random sample of leaders reveals the top personality
traits of engaging leaders . Personality assessments can be used to select leaders with the
attributes and beliefs that predispose them to be engaging of others . Positivity is the
most important personality attribute, predicting all five of the engaging leader behaviors .
Drive and liveliness also play a big role in predicting leadership success . Most engaging
leaders are able to lead organizations through change . Other personality traits like
sensitivity (social and cultural awareness) and composure become critical predictors of
success in this area .
Guiding Beliefs• My Purpose• Effective Leadership• Importance of
Relationships
Critical Experiences• Stretch• Learn• Build Self-
Confidence
Displayed Behavior• Step Up• Energize• Connect and
Stabilize• Serve and Grow• Stay Grounded
TheEngaging
Leader
28 2015 Global Trends in Employee Engagement
The Personality of Engaging Leaders
Aon Hewitt ADEPT-15 Personality Facet
Average Correlation Across Engaging Leader Behaviors Step Up Energize
Connect and Stabilize
Serve and Grow
Stay Grounded
Positivity !! !! !! ! !
Drive !! ! !! !!
Liveliness ! !! !!
Cooperativeness ! !! !! !
Composure ! ! ! !
Sensitivity ! !!! !
! = indicates size of correlation between ADEPT personality facet and engaging leader behavior as measured by Engaging Leader 360.
The Aon Hewitt Top Companies for Leaders® research found that selection and coaching
are both required to build the necessary critical mass; however, the data indicate that
coaching appears to have the most impact . The top companies don’t just send leaders
to coaches or development programs . Leaders do it themselves . “Developing others and
self is one of our key leadership behaviors and the ‘leaders teaching leaders’ concept
is deeply embedded in our development programs,” states Janette Shimanski, Vice
President of Global Talent Solutions, 3M . As another example, leaders with low
engagement scores were identified and coached at another global top company .
Their leaders changed by actually listening and doing things differently .
2 . Build Trusting Relationships with Your Employees with a Compelling EVP
A strong employee value proposition is about clarifying the employment contract—
articulating what you expect and in turn delivering on what employees expect . Our
research found that fully 100% of the global top companies for leaders have a strong
reputation in the marketplace for cultivating talent (versus only 73% of all other
participating organizations) . Pay and rewards are very much part of an EVP and many
companies are getting much more clear and extreme about the value proposition
for top performance .
A global top company explained that in the past, differentiation was very small, and
maximum bonuses were four to five months’ salary . The company instituted greater
bonus differentiation for performance, wherein top performers (who receive a
performance rating of 5) stand to get two times the amount of bonus an average
performer (who gets a performance rating of 3) receives . The bonus levels were
extended drastically to reach 24 months’ salary (for top leaders), 16 (for senior
management), and 11 (for junior executives and managers) .
What is central here is reputation—what is your company known for in the job market?
Can your employees clearly explain what makes working for you better than working
Aon Hewitt 29
someplace else? Without solid answers to this, it is very difficult to attract, retain, and
engage talent (and only about six out of 10 employees can answer these questions) .
Getting clear on this value proposition and delivering on it builds trust . And trust is a
central part of employee engagement—whether they will say great things about your
company to others, whether they will stay with you, and whether they will try their
best to exceed expectations .
3 . Grow Your Talent
Employees need to develop learning agility and proactively create the solutions needed
for the future . IBM has developed a “Faculty Academy” to help employees find answers
instead of giving them the answers . Typically we see the immediate people manager as
the owner of career development and performance management, and this will always be
required, but we are seeing the conversation shift to empowering the individual to define
his or her own path . Some of the best make talent development part of the fabric of their
organizations . Procter & Gamble has created a company-wide culture of coaching where
employees experience training, coaching, mentoring, and recruiting with the desire to
do the same for others . “It is a combination of formal and informal, with the vast portion
being more organic,” states Mark Biegger, Chief Human Resources Officer, P&G .
As the Engaging Leader model illustrates, early critical experiences involving stretch
assignments are integral to development . General Mills has a disciplined approach for
matching people to potential roles and providing a framework for how a new person
could approach that role . “While we value placing people in uncomfortable or stretch
roles, we do not put people in new roles cold,” explains the Vice President of Talent
and Organization Capabilities at General Mills .
4 . Enable Engagement and Performance
The 2015 engagement research uncovered a disturbing trend—engagement is on the
rise, but enabling resources and programs are deteriorating . In fact, we found that
the first thing companies with really low engagement should do in order to drive big
improvements is to “fix the basics” that enable work to get done .5 And organizations
with engagement challenges typically have basics that are broken . What we hear from
many employees is that their companies are either bogged down in processes or
unclear governance, or they are in hyper-growth or transformative situations without
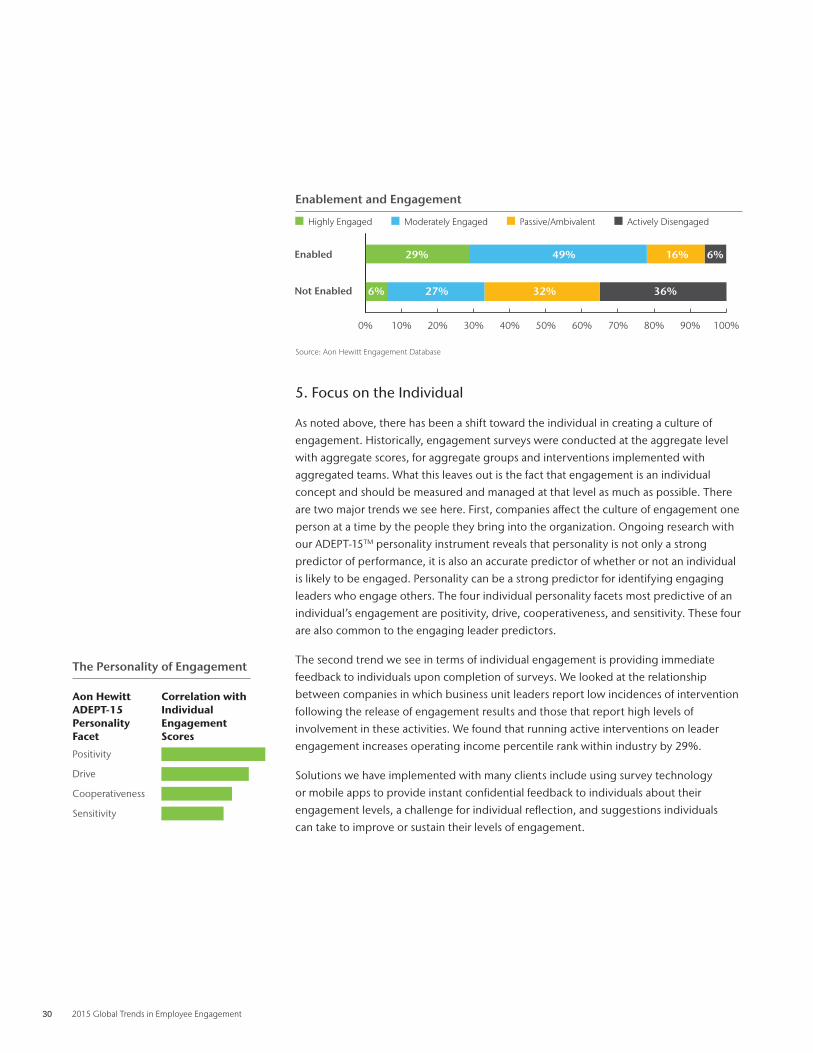
adequate resources to get things done . Only about half of employees feel enabled and,
on average, the vast majority of those who do not feel enabled are not engaged .
In fact, 36% of employees who do not feel enabled are in the actively disengaged category .
Within the group who do not feel enabled, approximately 33% are engaged—presenting
a significant risk for organizations . This combination can lead to frustration and burnout
that saps the energy of otherwise engaged employees . These “frustrated engaged”
will quickly disengage or leave . The enabling areas we see as most impactful center on
resources, processes, work/life balance, and even safety . We find that when employees
feel enabled with the right resources and programs, 78% of them are engaged .
5 Aon Hewitt (2013). The Engagement Outliers.
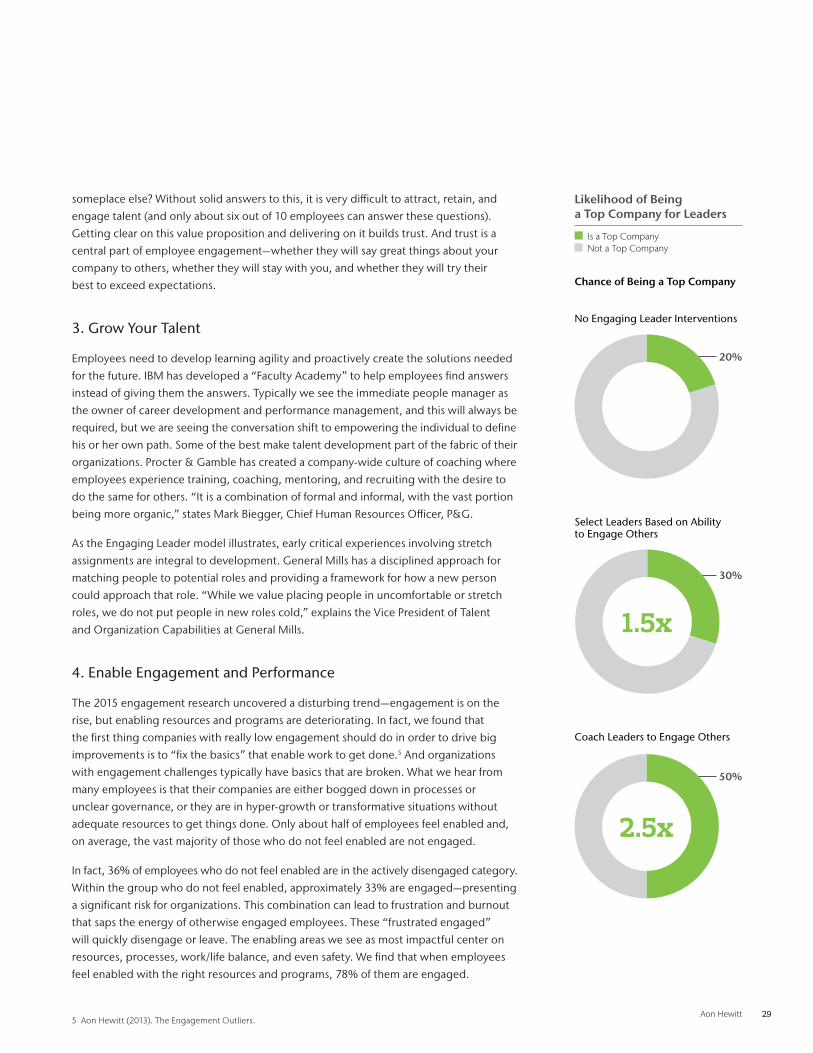
Likelihood of Being a Top Company for Leaders
Is a Top Company Not a Top Company
No Engaging Leader Interventions
Chance of Being a Top Company
Select Leaders Based on Ability to Engage Others
Coach Leaders to Engage Others
2.5x
50%
1.5x
30%
20%
30 2015 Global Trends in Employee Engagement
Enablement and Engagement
Highly Engaged Moderately Engaged Passive/Ambivalent Actively Disengaged
Source: Aon Hewitt Engagement Database
Enabled
Not Enabled
0% 10% 20% 30% 40% 50% 60% 70% 80% 90% 100%
29%
6% 27% 32% 36%
49% 16% 6%
The Personality of Engagement
Aon Hewitt ADEPT-15 Personality Facet
Correlation with Individual Engagement Scores
Positivity
Drive
Cooperativeness
Sensitivity
5 . Focus on the Individual
As noted above, there has been a shift toward the individual in creating a culture of
engagement . Historically, engagement surveys were conducted at the aggregate level
with aggregate scores, for aggregate groups and interventions implemented with
aggregated teams . What this leaves out is the fact that engagement is an individual
concept and should be measured and managed at that level as much as possible . There
are two major trends we see here . First, companies affect the culture of engagement one
person at a time by the people they bring into the organization . Ongoing research with
our ADEPT-15TM personality instrument reveals that personality is not only a strong
predictor of performance, it is also an accurate predictor of whether or not an individual
is likely to be engaged . Personality can be a strong predictor for identifying engaging
leaders who engage others . The four individual personality facets most predictive of an
individual’s engagement are positivity, drive, cooperativeness, and sensitivity . These four
are also common to the engaging leader predictors .
The second trend we see in terms of individual engagement is providing immediate
feedback to individuals upon completion of surveys . We looked at the relationship
between companies in which business unit leaders report low incidences of intervention
following the release of engagement results and those that report high levels of
involvement in these activities . We found that running active interventions on leader
engagement increases operating income percentile rank within industry by 29% .
Solutions we have implemented with many clients include using survey technology
or mobile apps to provide instant confidential feedback to individuals about their
engagement levels, a challenge for individual reflection, and suggestions individuals
can take to improve or sustain their levels of engagement .
Aon Hewitt 31
Making engagement happen is not about a development program or tools or
technology . It is not about managing to a score . It’s not about “HR’s survey .” There are
two words that consistently come up when we talk with executives from Aon Hewitt Top
Companies for Leaders® and Aon Hewitt Best Employers about the keys to their success
in talent and engagement—culture and leadership . Culture is about changing and aligning
people, programs, and infrastructure to drive a consistent set of beliefs, decisions,
and behaviors in an organization . Leaders are in a unique position to set the tone,
demonstrate the value of human capital, link people to the mission of the organization,
and act in consistent, authentic, and strategic ways to make engagement happen .
Final Thoughts
32 2015 Global Trends in Employee Engagement
Appendix
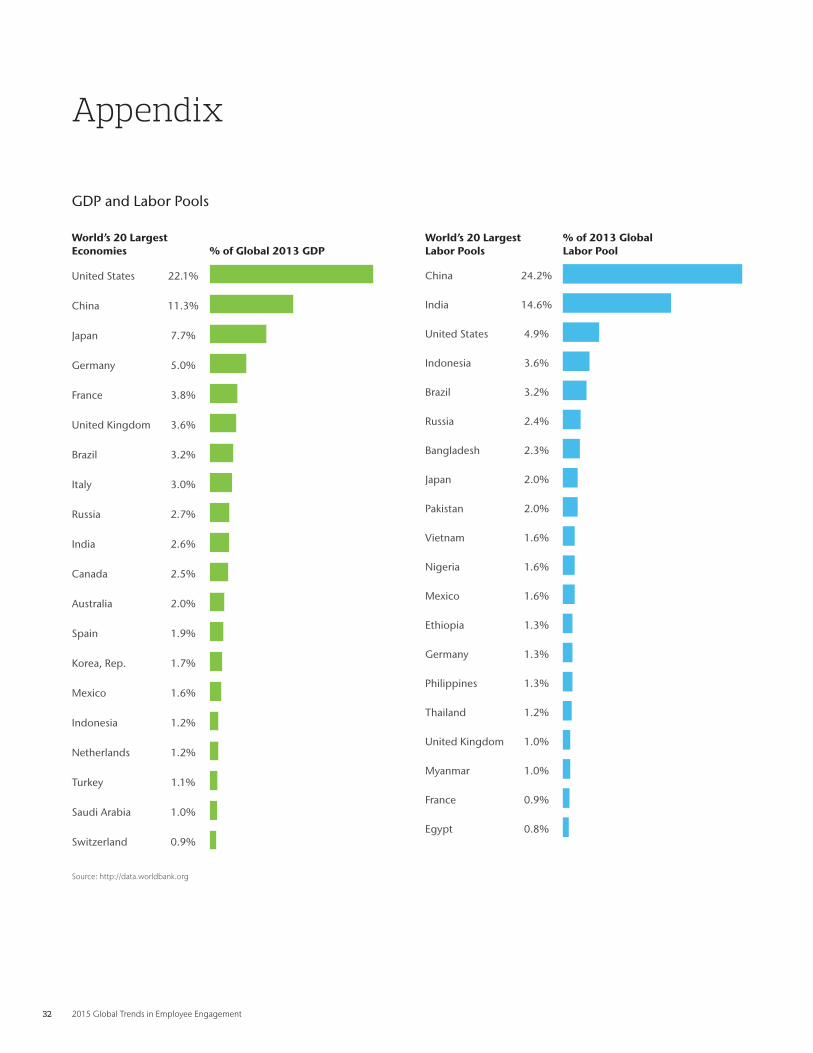
GDP and Labor Pools
Source: http://data.worldbank.org
World’s 20 Largest Economies % of Global 2013 GDP
United States 22 .1%
China 11 .3%
Japan 7 .7%
Germany 5 .0%
France 3 .8%
United Kingdom 3 .6%
Brazil 3 .2%
Italy 3 .0%
Russia 2 .7%
India 2 .6%
Canada 2 .5%
Australia 2 .0%
Spain 1 .9%
Korea, Rep . 1 .7%
Mexico 1 .6%
Indonesia 1 .2%
Netherlands 1 .2%
Turkey 1 .1%
Saudi Arabia 1 .0%
Switzerland 0 .9%
World’s 20 Largest Labor Pools
% of 2013 Global Labor Pool
China 24 .2%
India 14 .6%
United States 4 .9%
Indonesia 3 .6%
Brazil 3 .2%
Russia 2 .4%
Bangladesh 2 .3%
Japan 2 .0%
Pakistan 2 .0%
Vietnam 1 .6%
Nigeria 1 .6%
Mexico 1 .6%
Ethiopia 1 .3%
Germany 1 .3%
Philippines 1 .3%
Thailand 1 .2%
United Kingdom 1 .0%
Myanmar 1 .0%
France 0 .9%
Egypt 0 .8%

Aon Hewitt 33
Say, Stay, Strive by Region
Asia Pacific: 64%
71% Say
2 pts 58% Stay
3 pts 65% Strive
4 pts
Europe: 57%
62% Say
0 pt 54% Stay
0 pt 53% Strive
0 pt
Latin America: 71%
78% Say
2 pts 63% Stay 2 pts
67% Strive
0 pt
North America: 66%
71% Say
0 pt 61% Stay
0 pt 65% Strive
1 pt
Africa-Middle East: 67%
77% Say
5 pts 61% Stay
7 pts 68% Strive
7 pts
34 2015 Global Trends in Employee Engagement
30%
40%
50%
60%
70%
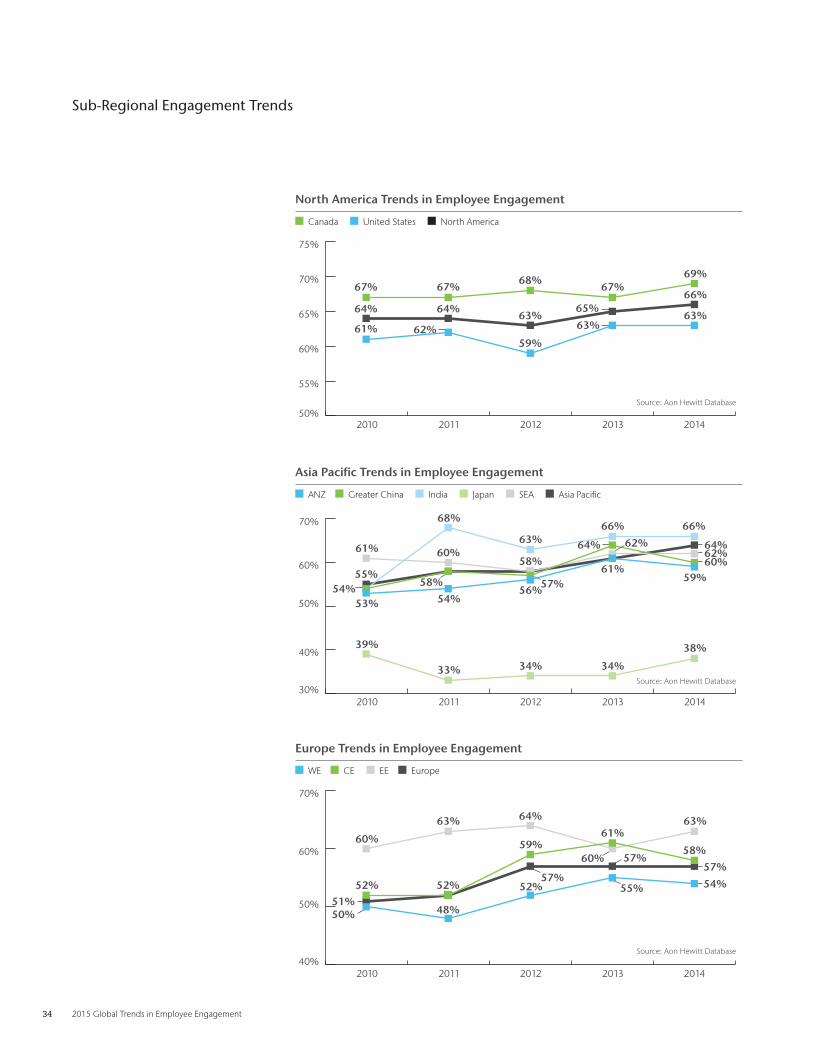
39%
33% 34% 34%
38%
53%
61% 60%58%
54%
68%
63%66% 66%
56%
61%59%
54%55%
58% 57%
64%
60%62%64%62%
2010 2011 2012 2013 2014
Sub-Regional Engagement Trends
Source: Aon Hewitt Database
Source: Aon Hewitt Database
Source: Aon Hewitt Database
62% 63%
50%
55%
60%
65%
70%
75%
2010 2011 2012 2013 2014
67% 67%68%
67%69%
64% 64%63%
65%66%
61%59%
63%
40%
50%
60%
70%
2010 2011 2012 2013 2014
60%
52%51%50%
57%55%
57%57%
54%52%
48%
52%
59%61%
58%
63% 64%
60%
63%
North America Trends in Employee Engagement
Canada United States North America
Asia Pacific Trends in Employee Engagement
ANZ Greater China India Japan SEA Asia Pacific
Europe Trends in Employee Engagement
WE CE EE Europe
Aon Hewitt 35
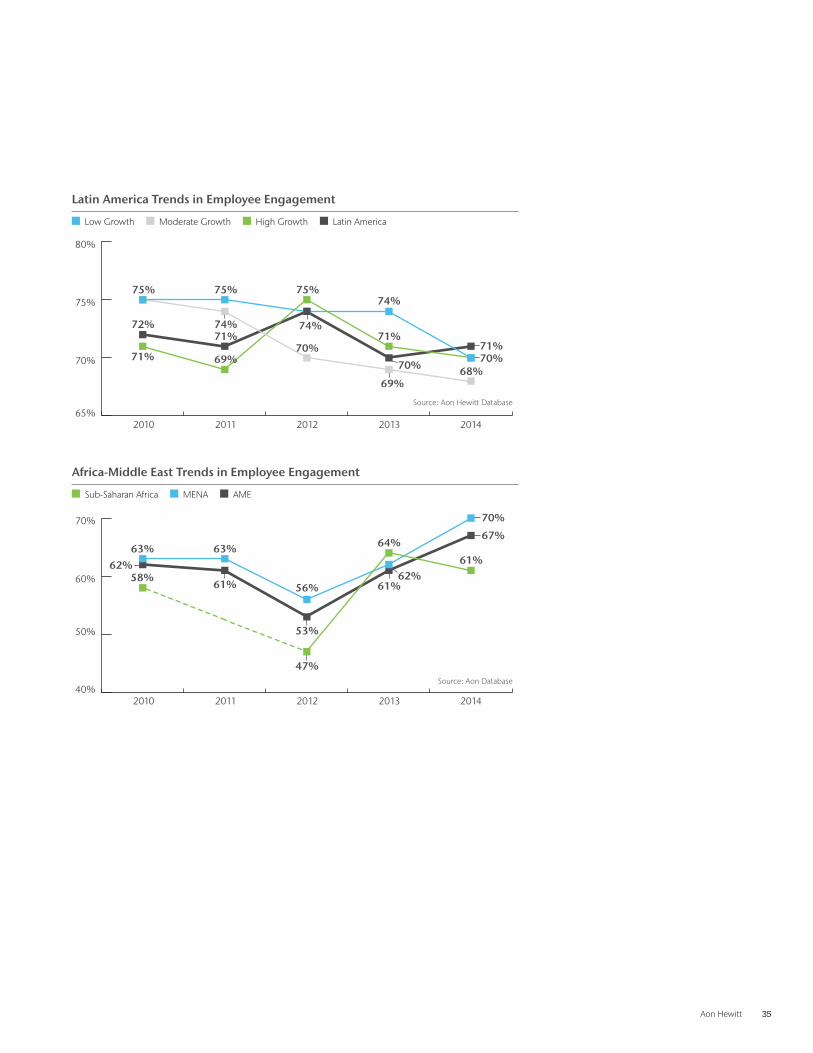
40%
50%
60%
70%
2010 2011 2012 2013 2014
62%
63%62%
63%
61%58%
56%
53%
47%
61%
61%
64%67%
70%
65%
70%
75%
80%
2010 2011 2012 2013 2014
75% 75% 75%
74%
69%
74%72%71% 71%
71% 69%
74%
70%71%
70%
70%
68%
Source: Aon Hewitt Database
Source: Aon Database
Latin America Trends in Employee Engagement
Low Growth Moderate Growth High Growth Latin America
Africa-Middle East Trends in Employee Engagement
Sub-Saharan Africa MENA AME
36 2015 Global Trends in Employee Engagement
Engagement Trends by Job Level
Executives and Senior Management Middle Management or Team Leader
Team Member or Front-Line Employee Professional Employee
Engagement Trends by Job Level
40%
50%
60%
70%
80%
2010 2011 2012 20142013
69%
71%
66%
75%76%
62%63%
64%65%
67%
56%57%
58%
61% 61%
51%50%
55%54% 54%
Source: Aon Database
Aon Hewitt 37
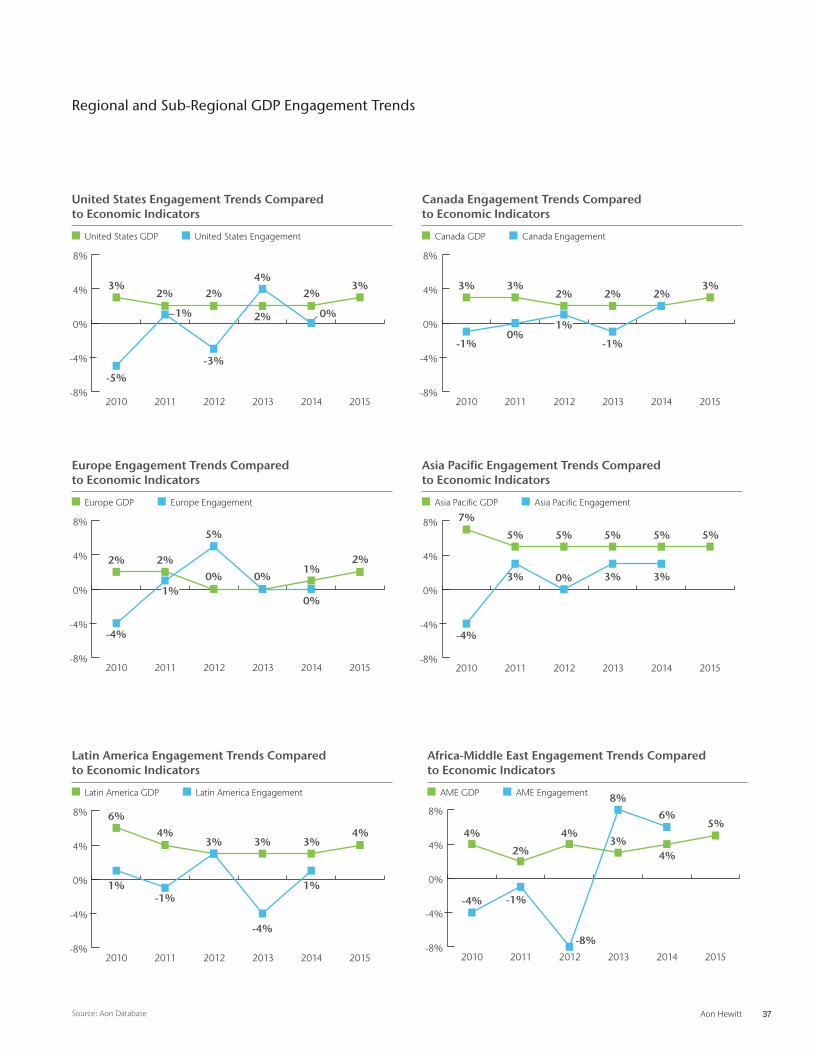
Regional and Sub-Regional GDP Engagement Trends
United States Engagement Trends Compared to Economic Indicators
United States GDP United States Engagement
Europe Engagement Trends Compared to Economic Indicators
Europe GDP Europe Engagement
Latin America Engagement Trends Compared to Economic Indicators
Latin America GDP Latin America Engagement
Africa-Middle East Engagement Trends Compared to Economic Indicators
AME GDP AME Engagement
Canada Engagement Trends Compared to Economic Indicators
Canada GDP Canada Engagement
Asia Pacific Engagement Trends Compared to Economic Indicators
Asia Pacific GDP Asia Pacific Engagement
Source: Aon Database
-8%
-4%
0%
4%
8%
2010 2011 2012 2013 20152014
-5%
1%
-3%
4%
0%
3%2% 2%
2%
2%3%
Source: Aon Database
-8%
-4%
0%
4%
8%
2010 2011 2012 2013 20152014
-4%
0%
0%0%
5%
2% 2%1%
2%
1%
Source: Aon Database
-8%
-4%
0%
4%
8%
2010 2011 2012 2013 20152014
3%3%3%
6%
4%4%
1%
-4%
1%-1%
Source: Aon Database
-8%
-4%
0%
4%
8%
2010 2011 2012 2013 20152014
4%3%
4%4%5%
2%
6%
8%
-8%
-4% -1%
-8%
-4%
0%
4%
8%
Source: Aon Database
2010 2011 2012 2013 20152014
3%
-1%
3% 3%2% 2%2%
0%-1%
1%
Source: Aon Database
-8%
-4%
0%
4%
8%
2010 2011 2012 2013 20152014
5%5%5%
7%
5%5%
3%3%0%
-4%
3%
Source: Aon Database
38 2015 Global Trends in Employee Engagement
Engagement 2014 62% 66% 63% 69%
% Change (2013–14) 1% 1% 0% 2%
Drivers Global North America United States Canada
Senior Leadership 5% 5% 10% 1%
Brand Alignment 3% 2% 3% 1%
Manager 2% 0% -2% 0%
Innovation 1% 6% 2% 12%
Recognition 1% 2% 3% 1%
Work/Life Balance 1% -1% 0% -1%
Benefits 1% 2% 2% 1%
Communication 0% 8% 7% 7%
Coworkers 0% 0% 0% -1%
Learning and Development 0% -1% -3% 1%
Managing Performance 0% -1% -1% 1%
Organization Reputation 0% 0% 0% 0%
Pay 0% 2% -3% 6%
Work Processes 0% 0% 2% -1%
Physical Work Environment -1% 0% 1% 0%
Autonomy/Choice -1% -3% -6% 0%
Safety -1% 0% 0% 1%
Sense of Accomplishment -1% -3% -5% 0%
Work Tasks -1% -2% -3% -1%
Diversity -3% -1% -2% 0%
Career Opportunities -3% -3% -7% 1%
Customer Focus -3% 7% 2% –
BU/Division Leadership -5% 3% 0% 4%
Customers -5% 0% 3% -2%
People/HR Practices -5% 1% 1% 1%
Valuing People/People Focus -6% 1% 5% -2%
Resources -7% -3% -6% 0%
Engagement Drivers: North America
Aon Hewitt 39
Engagement Drivers: Europe
Engagement 2014 62% 57% 54% 58% 63%
% Change (2013-14) 1% 0% -1% -3% 3%
Drivers Global Europe Western Europe
Central Europe
Eastern Europe
Senior Leadership 5% 3% 2% -2% 16%
Brand Alignment 3% 2% 4% -7% 8%
Manager 2% 1% 0% 1% 7%
Innovation 1% -4% -2% -3% -7%
Recognition 1% -1% -2% 1% -1%
Work/Life Balance 1% -1% -3% -6% 2%
Benefits 1% 0% 0% 1% 5%
Communication 0% -10% -9% -13% -5%
Coworkers 0% 2% -4% 7% 9%
Learning and Development 0% -2% -2% -6% 4%
Managing Performance 0% -3% -1% -8% 0%
Organization Reputation 0% -1% 1% 2% 0%
Pay 0% -1% -2% 1% -1%
Work Processes 0% -2% -4% 3% 3%
Physical Work Environment -1% -3% 0% -5% -4%
Autonomy/Choice -1% -5% -9% -4% 0%
Safety -1% -2% -1% -5% 9%
Sense of Accomplishment -1% 0% -1% -1% 3%
Work Tasks -1% 0% -2% 3% 1%
Diversity -3% -3% -4% -7% 1%
Career Opportunities -3% -7% -5% -11% -7%
Customers -3% -7% -6% -4% -11%
BU/Division Leadership -5% -8% -6% -20% 4%
Customer Focus -5% -10% -3% -18% -16%
People/HR Practices -5% -4% -4% -13% –
Valuing People/People Focus -6% -9% -7% -20% 1%
Resources -7% -10% -8% -10% -5%
Western Europe: Andorra, Austria, Belgium, Denmark, Finland, France, Germany, Iceland, Italy, Liechtenstein, Luxembourg, Monaco, Netherlands, Norway, Portugal, Spain, Sweden, Switzerland, United Kingdom
Central Europe: Bosnia, Bulgaria, Croatia, Czech Republic, Hungary, Montenegro, Poland, Romania, Slovakia, Slovenia
Eastern Europe: Albania, Belarus, Cyprus, Estonia, Georgia, Greece, Latvia, Lithuania, Moldova, Russia, Serbia, Turkey, Ukraine
40 2015 Global Trends in Employee Engagement
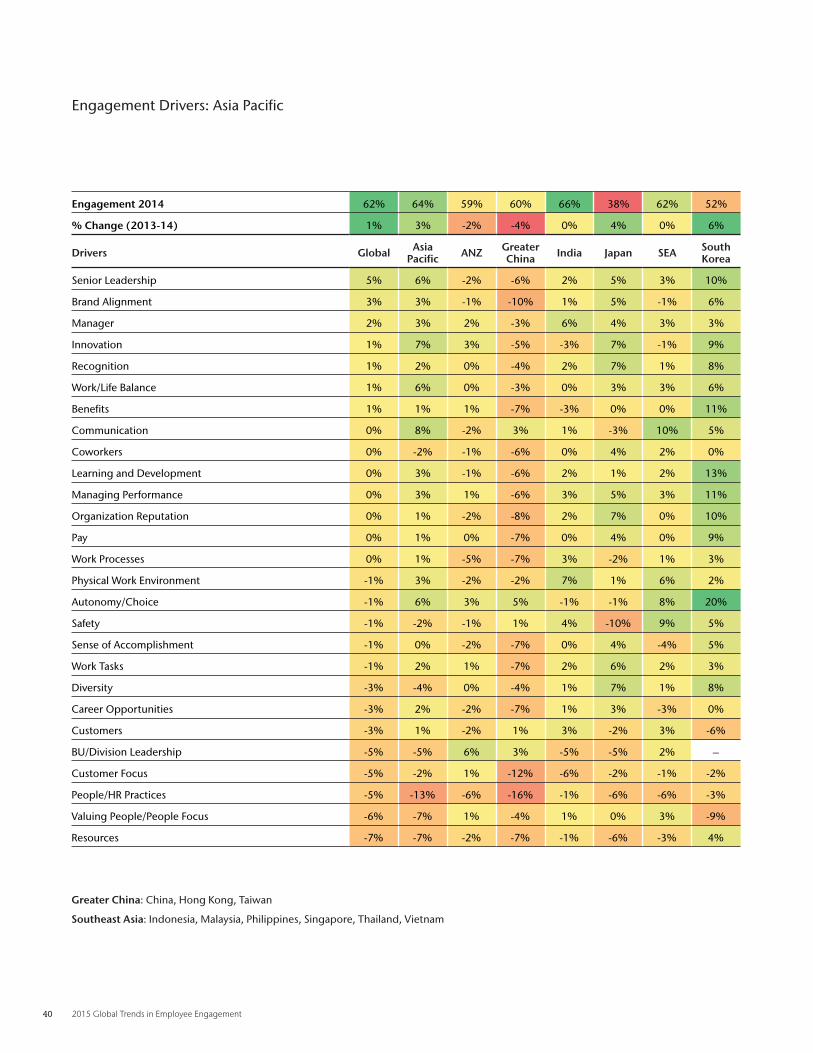
Engagement Drivers: Asia Pacific
Engagement 2014 62% 64% 59% 60% 66% 38% 62% 52%
% Change (2013-14) 1% 3% -2% -4% 0% 4% 0% 6%
Drivers Global Asia Pacific ANZ Greater
China India Japan SEA South Korea
Senior Leadership 5% 6% -2% -6% 2% 5% 3% 10%
Brand Alignment 3% 3% -1% -10% 1% 5% -1% 6%
Manager 2% 3% 2% -3% 6% 4% 3% 3%
Innovation 1% 7% 3% -5% -3% 7% -1% 9%
Recognition 1% 2% 0% -4% 2% 7% 1% 8%
Work/Life Balance 1% 6% 0% -3% 0% 3% 3% 6%
Benefits 1% 1% 1% -7% -3% 0% 0% 11%
Communication 0% 8% -2% 3% 1% -3% 10% 5%
Coworkers 0% -2% -1% -6% 0% 4% 2% 0%
Learning and Development 0% 3% -1% -6% 2% 1% 2% 13%
Managing Performance 0% 3% 1% -6% 3% 5% 3% 11%
Organization Reputation 0% 1% -2% -8% 2% 7% 0% 10%
Pay 0% 1% 0% -7% 0% 4% 0% 9%
Work Processes 0% 1% -5% -7% 3% -2% 1% 3%
Physical Work Environment -1% 3% -2% -2% 7% 1% 6% 2%
Autonomy/Choice -1% 6% 3% 5% -1% -1% 8% 20%
Safety -1% -2% -1% 1% 4% -10% 9% 5%
Sense of Accomplishment -1% 0% -2% -7% 0% 4% -4% 5%
Work Tasks -1% 2% 1% -7% 2% 6% 2% 3%
Diversity -3% -4% 0% -4% 1% 7% 1% 8%
Career Opportunities -3% 2% -2% -7% 1% 3% -3% 0%
Customers -3% 1% -2% 1% 3% -2% 3% -6%
BU/Division Leadership -5% -5% 6% 3% -5% -5% 2% –
Customer Focus -5% -2% 1% -12% -6% -2% -1% -2%
People/HR Practices -5% -13% -6% -16% -1% -6% -6% -3%
Valuing People/People Focus -6% -7% 1% -4% 1% 0% 3% -9%
Resources -7% -7% -2% -7% -1% -6% -3% 4%
Greater China: China, Hong Kong, Taiwan
Southeast Asia: Indonesia, Malaysia, Philippines, Singapore, Thailand, Vietnam
Aon Hewitt 41
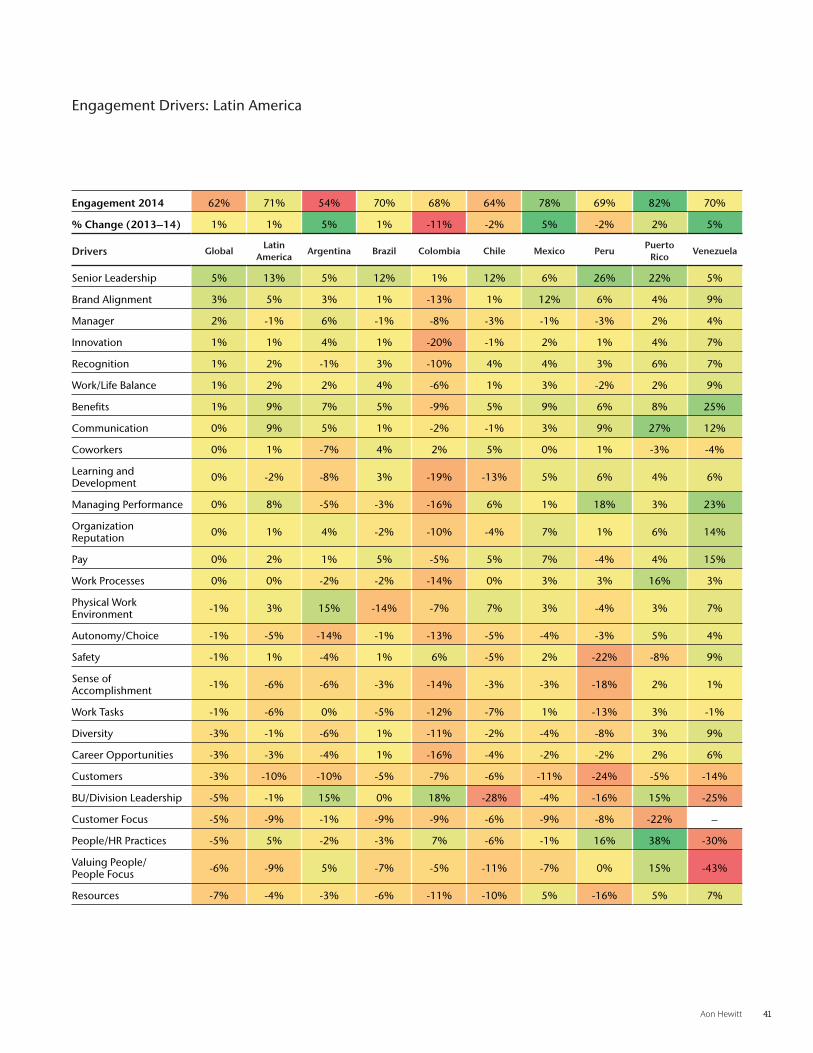
Engagement Drivers: Latin America
Engagement 2014 62% 71% 54% 70% 68% 64% 78% 69% 82% 70%
% Change (2013–14) 1% 1% 5% 1% -11% -2% 5% -2% 2% 5%
Drivers GlobalLatin
AmericaArgentina Brazil Colombia Chile Mexico Peru
Puerto Rico
Venezuela
Senior Leadership 5% 13% 5% 12% 1% 12% 6% 26% 22% 5%
Brand Alignment 3% 5% 3% 1% -13% 1% 12% 6% 4% 9%
Manager 2% -1% 6% -1% -8% -3% -1% -3% 2% 4%
Innovation 1% 1% 4% 1% -20% -1% 2% 1% 4% 7%
Recognition 1% 2% -1% 3% -10% 4% 4% 3% 6% 7%
Work/Life Balance 1% 2% 2% 4% -6% 1% 3% -2% 2% 9%
Benefits 1% 9% 7% 5% -9% 5% 9% 6% 8% 25%
Communication 0% 9% 5% 1% -2% -1% 3% 9% 27% 12%
Coworkers 0% 1% -7% 4% 2% 5% 0% 1% -3% -4%
Learning and Development 0% -2% -8% 3% -19% -13% 5% 6% 4% 6%
Managing Performance 0% 8% -5% -3% -16% 6% 1% 18% 3% 23%
Organization Reputation 0% 1% 4% -2% -10% -4% 7% 1% 6% 14%
Pay 0% 2% 1% 5% -5% 5% 7% -4% 4% 15%
Work Processes 0% 0% -2% -2% -14% 0% 3% 3% 16% 3%
Physical Work Environment -1% 3% 15% -14% -7% 7% 3% -4% 3% 7%
Autonomy/Choice -1% -5% -14% -1% -13% -5% -4% -3% 5% 4%
Safety -1% 1% -4% 1% 6% -5% 2% -22% -8% 9%
Sense of Accomplishment -1% -6% -6% -3% -14% -3% -3% -18% 2% 1%
Work Tasks -1% -6% 0% -5% -12% -7% 1% -13% 3% -1%
Diversity -3% -1% -6% 1% -11% -2% -4% -8% 3% 9%
Career Opportunities -3% -3% -4% 1% -16% -4% -2% -2% 2% 6%
Customers -3% -10% -10% -5% -7% -6% -11% -24% -5% -14%
BU/Division Leadership -5% -1% 15% 0% 18% -28% -4% -16% 15% -25%
Customer Focus -5% -9% -1% -9% -9% -6% -9% -8% -22% –
People/HR Practices -5% 5% -2% -3% 7% -6% -1% 16% 38% -30%
Valuing People/ People Focus -6% -9% 5% -7% -5% -11% -7% 0% 15% -43%
Resources -7% -4% -3% -6% -11% -10% 5% -16% 5% 7%
42 2015 Global Trends in Employee Engagement
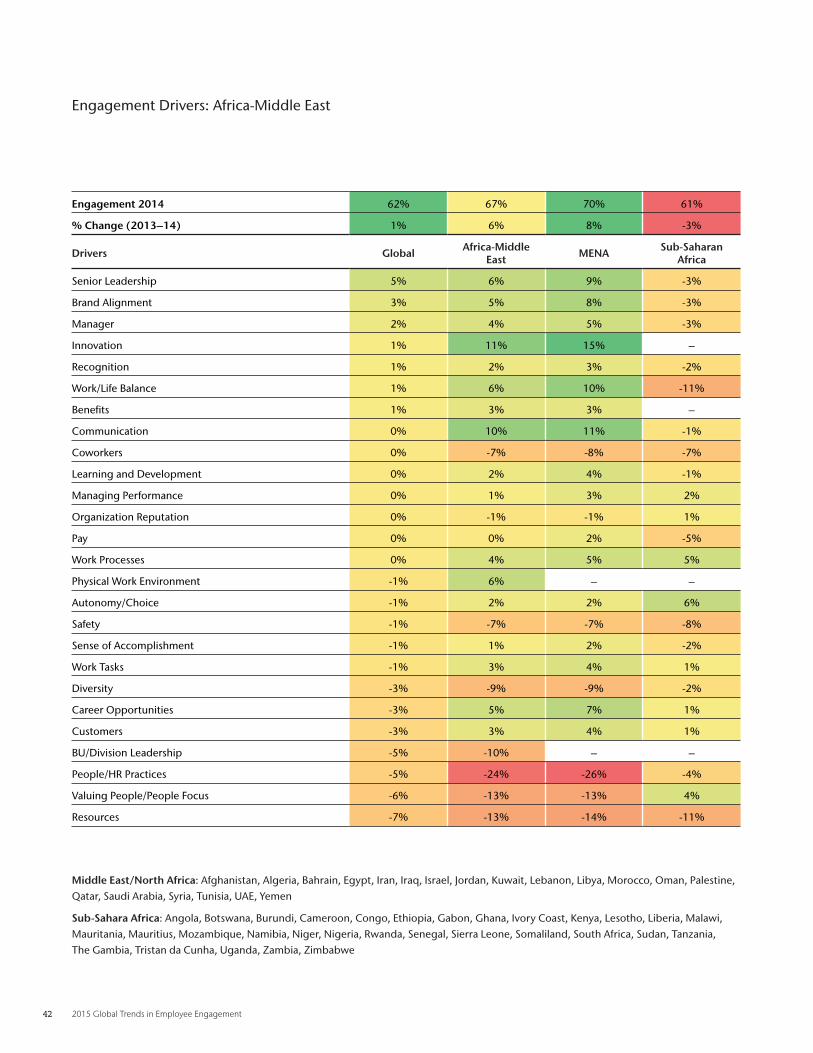
Engagement Drivers: Africa-Middle East
Engagement 2014 62% 67% 70% 61%
% Change (2013–14) 1% 6% 8% -3%
Drivers Global Africa-Middle East MENA Sub-Saharan
Africa
Senior Leadership 5% 6% 9% -3%
Brand Alignment 3% 5% 8% -3%
Manager 2% 4% 5% -3%
Innovation 1% 11% 15% –
Recognition 1% 2% 3% -2%
Work/Life Balance 1% 6% 10% -11%
Benefits 1% 3% 3% –
Communication 0% 10% 11% -1%
Coworkers 0% -7% -8% -7%
Learning and Development 0% 2% 4% -1%
Managing Performance 0% 1% 3% 2%
Organization Reputation 0% -1% -1% 1%
Pay 0% 0% 2% -5%
Work Processes 0% 4% 5% 5%
Physical Work Environment -1% 6% – –
Autonomy/Choice -1% 2% 2% 6%
Safety -1% -7% -7% -8%
Sense of Accomplishment -1% 1% 2% -2%
Work Tasks -1% 3% 4% 1%
Diversity -3% -9% -9% -2%
Career Opportunities -3% 5% 7% 1%
Customers -3% 3% 4% 1%
BU/Division Leadership -5% -10% – –
People/HR Practices -5% -24% -26% -4%
Valuing People/People Focus -6% -13% -13% 4%
Resources -7% -13% -14% -11%
Middle East/North Africa: Afghanistan, Algeria, Bahrain, Egypt, Iran, Iraq, Israel, Jordan, Kuwait, Lebanon, Libya, Morocco, Oman, Palestine, Qatar, Saudi Arabia, Syria, Tunisia, UAE, Yemen
Sub-Sahara Africa: Angola, Botswana, Burundi, Cameroon, Congo, Ethiopia, Gabon, Ghana, Ivory Coast, Kenya, Lesotho, Liberia, Malawi, Mauritania, Mauritius, Mozambique, Namibia, Niger, Nigeria, Rwanda, Senegal, Sierra Leone, Somaliland, South Africa, Sudan, Tanzania, The Gambia, Tristan da Cunha, Uganda, Zambia, Zimbabwe
Aon Hewitt 43
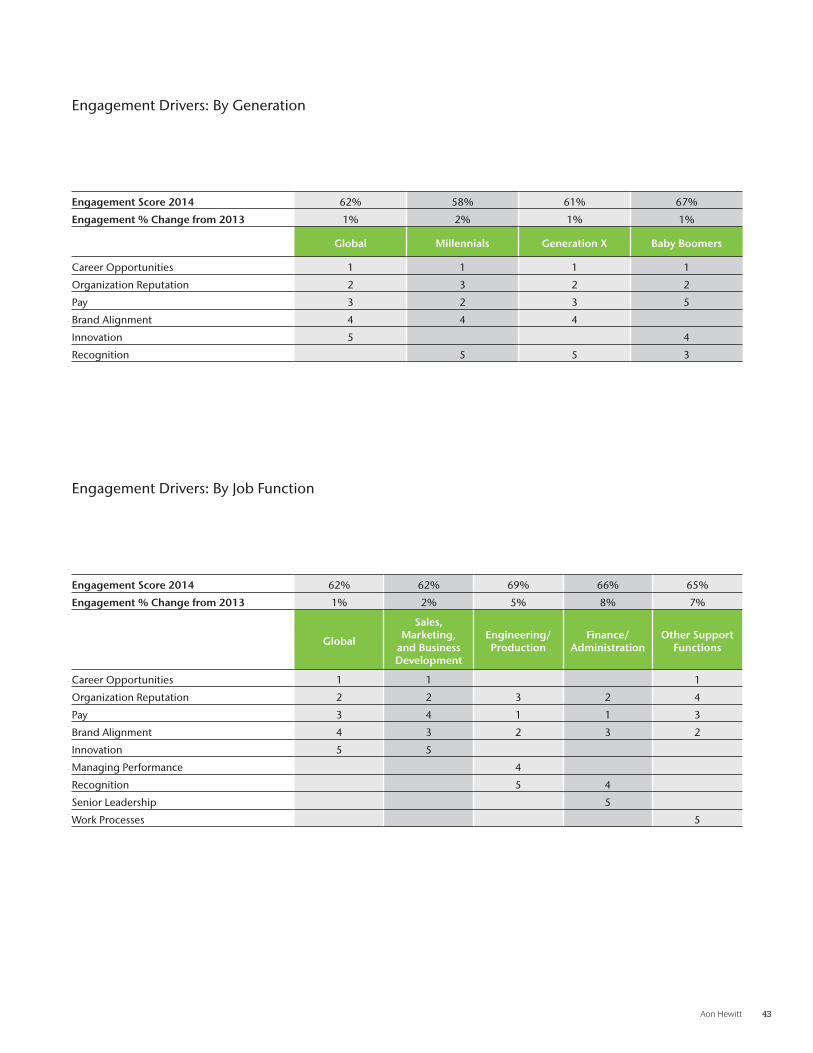
Engagement Drivers: By Generation
Engagement Score 2014 62% 58% 61% 67%
Engagement % Change from 2013 1% 2% 1% 1%
Global Millennials Generation X Baby Boomers
Career Opportunities 1 1 1 1
Organization Reputation 2 3 2 2
Pay 3 2 3 5
Brand Alignment 4 4 4
Innovation 5 4
Recognition 5 5 3
Engagement Drivers: By Job Function
Engagement Score 2014 62% 62% 69% 66% 65%
Engagement % Change from 2013 1% 2% 5% 8% 7%
Global
Sales, Marketing,
and Business Development
Engineering/ Production
Finance/ Administration
Other Support Functions
Career Opportunities 1 1 1
Organization Reputation 2 2 3 2 4
Pay 3 4 1 1 3
Brand Alignment 4 3 2 3 2
Innovation 5 5
Managing Performance 4
Recognition 5 4
Senior Leadership 5
Work Processes 5
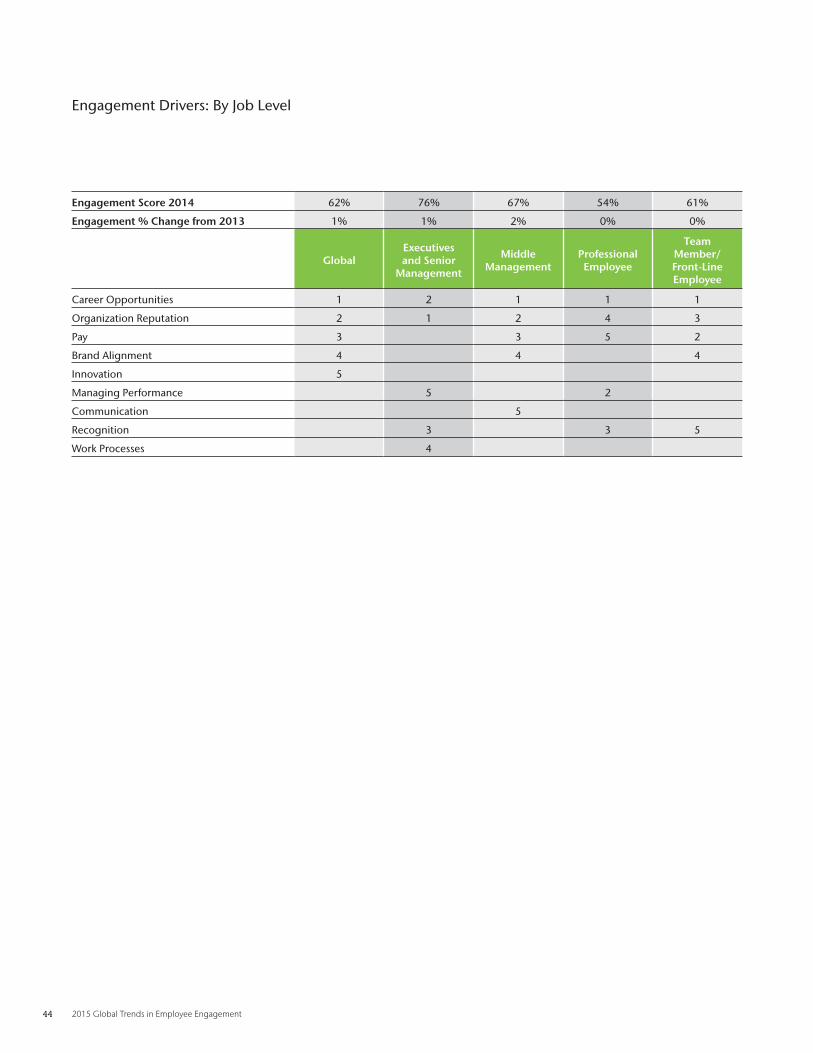
44 2015 Global Trends in Employee Engagement
Engagement Score 2014 62% 76% 67% 54% 61%
Engagement % Change from 2013 1% 1% 2% 0% 0%
Global
Executives and Senior
Management
Middle Management
Professional Employee
Team Member/ Front-Line Employee
Career Opportunities 1 2 1 1 1
Organization Reputation 2 1 2 4 3
Pay 3 3 5 2
Brand Alignment 4 4 4
Innovation 5
Managing Performance 5 2
Communication 5
Recognition 3 3 5
Work Processes 4
Engagement Drivers: By Job Level
ContactKen Oehler, Ph.D.Global Engagement Practice LeaderPerformance, Reward & Talentken .oehler@aonhewitt .com
Aon Hewitt empowers organizations and individuals to secure
a better future through innovative talent, retirement, and
health solutions . We advise, design, and execute a wide range
of solutions that enable clients to cultivate talent to drive
organizational and personal performance and growth, navigate
retirement risk while providing new levels of financial security,
and redefine health solutions for greater choice, affordability,
and wellness . Aon Hewitt is the global leader in human resource
solutions, with over 30,000 professionals in 90 countries serving
more than 20,000 clients worldwide .
About Aon Hewitt
Risk. Reinsurance. Human Resources.
About Aon Aon plc (NYSE:AON) is the leading global provider of risk management, insurance and reinsurance brokerage, and human resources solutions and outsourcing services. Through its more than 66,000 colleagues worldwide, Aon unites to empower results for clients in over 120 countries via innovative and effective risk and people solutions and through industry-leading global resources and technical expertise. Aon has been named repeatedly as the world’s best broker, best insurance intermediary, best reinsurance intermediary, best captives manager, and best employee benefits consulting firm by multiple industry sources. Visit aon.com for more information on Aon and aon.com/manchesterunited to learn about Aon’s global partnership with Manchester United.
© Aon plc 2015 . All rights reserved .The information contained herein and the statements expressed are of a general nature and are not intended to address the circumstances of any particular individual or entity. Although we endeavor to provide accurate and timely information and use sources we consider reliable, there can be no guarantee that such information is accurate as of the date it is received or that it will continue to be accurate in the future. No one should act on such information without appropriate profes-sional advice after a thorough examination of the particular situation.