2015 Treatment Episode Data Set - SAMHSA - … TEDS...Treatment Episode Data Set (TEDS) 2005-2015...
231
Treatment Episode Data Set (TEDS) 2005-2015 State Admissions to Substance Abuse Treatment Services DEPARTMENT OF HEALTH AND HUMAN SERVICES Substance Abuse and Mental Health Services Administration
Transcript of 2015 Treatment Episode Data Set - SAMHSA - … TEDS...Treatment Episode Data Set (TEDS) 2005-2015...
Treatment Episode Data Set (TEDS) 2005-2015
State Admissions to Substance Abuse Treatment Services
DEPARTMENT OF HEALTH AND HUMAN SERVICESSubstance Abuse and Mental Health Services Administration

ii
AcknowledgmentsThis report was prepared for the Substance Abuse and Mental Health Services Administration (SAMHSA), U.S. Department of Health and Human Services (HHS). Work was performed under Task Order HHSS283200700048I/HHSS28342001T, Reference No. 283-07-4803 (Cathie Alderks, Task Order Officer).
SAMHSA complies with applicable federal civil rights laws and does not discriminate on the basis of race, color, national origin, age, disability, or sex. SAMHSA cumple con las leyes federales de derechos civiles aplicables y no discrimina por motivos de raza, color, nacionalidad, edad, discapacidad, o sexo.
Public Domain NoticeAll material appearing in this report is in the public domain and may be reproduced or copied without permission from SAMHSA. Citation of the source is appreciated. However, this publication may not be reproduced or distributed for a fee without the specific, written authorization of the Office of Communications, SAMHSA, U.S. Department of Health and Human Services.
Recommended CitationSubstance Abuse and Mental Health Services Administration, Center for Behavioral Health Statis-tics and Quality. Treatment Episode Data Set (TEDS): 2005-2015. State Admissions to Substance Abuse Treatment Services. BHSIS Series S-95, HHS Publication No. (SMA) 17-4360. Rockville, MD: Substance Abuse and Mental Health Services Administration, 2017.
Electronic Access and Copies of PublicationThis publication may be downloaded or ordered at datafiles.samhsa.gov.
Or call SAMHSA at 1-877-SAMHSA-7 (1-877-726-4727) (English and Español).
Originating OfficeCenter for Behavioral Health Statistics and Quality
Substance Abuse and Mental Health Services Administration 5600 Fishers Lane, Room 15E85-D
Rockville, Maryland 20857
July 2017

iii
List of Tables ...................................................................................................................................v
List of Figures ............................................................................................................................. xiii
Highlights ........................................................................................................................................1
Chapter 1. Trends in Substance Abuse Treatment Admissions Aged 12 and Older: 2005-2015 ...................................................................................................................................5
All Admissions ...........................................................................................................................6Selected Primary Substance .......................................................................................................7
Chapter 2. Substance Abuse Treatment Admissions Aged 12 and Older, by Primary Substance of Abuse: 2015 ...........................................................................................17
Chapter 3. Characteristics of Substance Abuse Treatment Admissions Aged 12 and Older, by State or Jurisdiction and Primary Substance of Abuse: 2015..........................19
Tables .............................................................................................................................................47
Appendix A. About the Treatment Episode Data Set (TEDS) .................................................187Introduction ............................................................................................................................187History ..........................................................................................................................187State Data Collection Systems ...............................................................................................188Report-Specific Considerations ..............................................................................................190
Appendix B. TEDS Data Elements .........................................................................................201TEDS Minimum Data Set ......................................................................................................201TEDS Supplemental Data Set ................................................................................................209
Appendix C. List of Contributors.............................................................................................215
Table of Contents

iv
v
List of Tables
Trends in Substance Abuse Treatment Admissions Aged 12 and Older: 2005-2015All Admissions
1.1 Admissions aged 12 and older, by Census region, Census division, and state or jurisdiction: Number, 2005-2015...................................................................................................... 48
1.2 Admissions aged 12 and older, by Census region, Census division, and state or jurisdiction: Admissions per 100,000 population, 2005-2015 ......................................................... 50
1.3 Admissions aged 12 and older, adjusted for age, gender, and race/ethnicity, by Census region, Census division, and state or jurisdiction: Admissions per 100,000 population, 2005-2015 ...................................................................................................................... 52
Selected Primary Substance
1.4a Primary alcohol admissions aged 12 and older, by Census region, Census division, and state or jurisdiction: Number, 2005-2015 ............................................................................. 54
1.4b Primary alcohol admissions aged 12 and older, by Census region, Census division, and state or jurisdiction: Admissions per 100,000 population, 2005-2015 ................................... 56
1.5a Primary marijuana admissions aged 12 and older, by Census region, Census division, and state or jurisdiction: Number, 2005-2015..................................................................58
1.5b Primary marijuana admissions aged 12 and older, by Census region, Census division, and state or jurisdiction: Admissions per 100,000 population, 2005-2015 ......................60
1.6a Primary heroin admissions aged 12 and older, by Census region, Census division, and state or jurisdiction: Number, 2005-2015 .................................................................................. 62
1.6b Primary heroin admissions aged 12 and older, by Census region, Census division, and state or jurisdiction: Admissions per 100,000 population, 2005-2015 ..................................... 64
1.7a Primary cocaine admissions aged 12 and older, by Census region, Census division, and state or jurisdiction: Number, 2005-2015 .................................................................................. 66
1.7b Primary cocaine admissions aged 12 and older, by Census region, Census division, and state or jurisdiction: Admissions per 100,000 population, 2005-2015 ..................................... 68
1.8a Primary methamphetamine/amphetamine admissions aged 12 and older, by Census region, Census division, and state or jurisdiction: Number, 2005-2015 .........................................70
1.8b Primary methamphetamine/amphetamine admissions aged 12 and older, by Census region, Census division, and state or jurisdiction: Admissions per 100,000 population, 2005-2015 ....................................................................................................................72
1.9a Primary non-heroin opiates/synthetics admissions aged 12 and older, by Census region, Census division, and state or jurisdiction: Number, 2005-2015 .........................................74
vi
List of Tables (continued)
1.9b Primary non-heroin opiates/synthetics admissions aged 12 and older, by Census region, Census division, and state or jurisdiction: Admissions per 100,000 population, 2005-2015 .........................................................................................................................76
Substance Abuse Treatment Admissions Aged 12 and Older, by Primary Substance of Abuse: 20152.1a Admissions aged 12 and older, by type of service at admission and Census region,
Census division, and state or jurisdiction: Number, 2015 .................................................................79
2.1b Admissions aged 12 and older, by type of service at admission and Census region, Census division, and state or jurisdiction: Percent distribution, 2015 ............................................82
2.2 Admissions aged 12 and older, by primary substance of abuse and Census region, Census division, and state or jurisdiction: Number, 2015 .................................................................85
2.3 Admissions aged 12 and older, by primary substance of abuse and Census region, Census division, and state or jurisdiction: Admissions per 100,000 population, 2015 ................... 87
2.4 Admissions aged 12 and older, adjusted for age, gender, and race/ethnicity, by primary substance of abuse and Census region, Census division, and state or jurisdiction: Admissions per 100,000 population, 2015 .................................................................. 90
Characteristics of Substance Abuse Treatment Admissions Aged 12 and Older, by State or Jurisdiction and Primary Substance of Abuse: 20153.1a Alabama admissions aged 12 and older, by primary substance of abuse and gender,
age at admission, and race/ethnicity: Number, 2015 .........................................................................93
3.1b Alabama admissions aged 12 and older, by primary substance of abuse and gender, age at admission, and race/ethnicity: Percent distribution, 2015 ....................................................94
3.2a Alaska admissions aged 12 and older, by primary substance of abuse and gender, age at admission, and race/ethnicity: Number, 2015 ................................................................... 95
3.2b Alaska admissions aged 12 and older, by primary substance of abuse and gender, age at admission, and race/ethnicity: Percent distribution, 2015 ....................................................96
3.3a Arizona admissions aged 12 and older, by primary substance of abuse and gender, age at admission, and race/ethnicity: Number, 2015 .........................................................................97
3.3b Arizona admissions aged 12 and older, by primary substance of abuse and gender, age at admission, and race/ethnicity: Percent distribution, 2015 ....................................................98
3.4a Arkansas admissions aged 12 and older, by primary substance of abuse and gender, age at admission, and race/ethnicity: Number, 2015 ......................................................................99
3.4b Arkansas admissions aged 12 and older, by primary substance of abuse and gender, age at admission, and race/ethnicity: Percent distribution, 2015 ..................................................100

vii
List of Tables (continued)
3.5a California admissions aged 12 and older, by primary substance of abuse and gender, age at admission, and race/ethnicity: Number, 2015 ....................................................................101
3.5b California admissions aged 12 and older, by primary substance of abuse and gender, age at admission, and race/ethnicity: Percent distribution, 2015 ..................................................102
3.6a Colorado admissions aged 12 and older, by primary substance of abuse and gender, age at admission, and race/ethnicity: Number, 2015 .......................................................................103
3.6b Colorado admissions aged 12 and older, by primary substance of abuse and gender, age at admission, and race/ethnicity: Percent distribution, 2015 ..................................................104
3.7a Connecticut admissions aged 12 and older, by primary substance of abuse and gender, age at admission, and race/ethnicity: Number, 2015 ........................................................ 105
3.7b Connecticut admissions aged 12 and older, by primary substance of abuse and gender, age at admission, and race/ethnicity: Percent distribution, 2015 .......................................106
3.8a Delaware admissions aged 12 and older, by primary substance of abuse and gender, age at admission, and race/ethnicity: Number, 2015 ..................................................................... 107
3.8b Delaware admissions aged 12 and older, by primary substance of abuse and gender, age at admission, and race/ethnicity: Percent distribution, 2015 ..................................................108
3.9a District of Columbia admissions aged 12 and older, by primary substance of abuse and gender, age at admission, and race/ethnicity: Number, 2015. ................................................109
3.9b District of Columbia admissions aged 12 and older, by primary substance of abuse and gender, age at admission, and race/ethnicity: Percent distribution, 2015 ..............................110
3.10a Florida admissions aged 12 and older, by primary substance of abuse and gender, age at admission, and race/ethnicity: Number, 2015 .................................................................... 111
3.10b Florida admissions aged 12 and older, by primary substance of abuse and gender, age at admission, and race/ethnicity: Percent distribution, 2015 ..................................................112
3.11a Hawaii admissions aged 12 and older, by primary substance of abuse and gender, age at admission, and race/ethnicity: Number, 2015 ..................................................................113
3.11b Hawaii admissions aged 12 and older, by primary substance of abuse and gender, age at admission, and race/ethnicity: Percent distribution, 2015 ..................................................114
3.12a Idaho admissions aged 12 and older, by primary substance of abuse and gender, age at admission, and race/ethnicity: Number, 2015 ..................................................................115
3.12b Idaho admissions aged 12 and older, by primary substance of abuse and gender, age at admission, and race/ethnicity: Percent distribution, 2015 ..................................................116
3.13a Illinois admissions aged 12 and older, by primary substance of abuse and gender, age at admission, and race/ethnicity: Number, 2015 ..................................................................117
viii
List of Tables (continued)
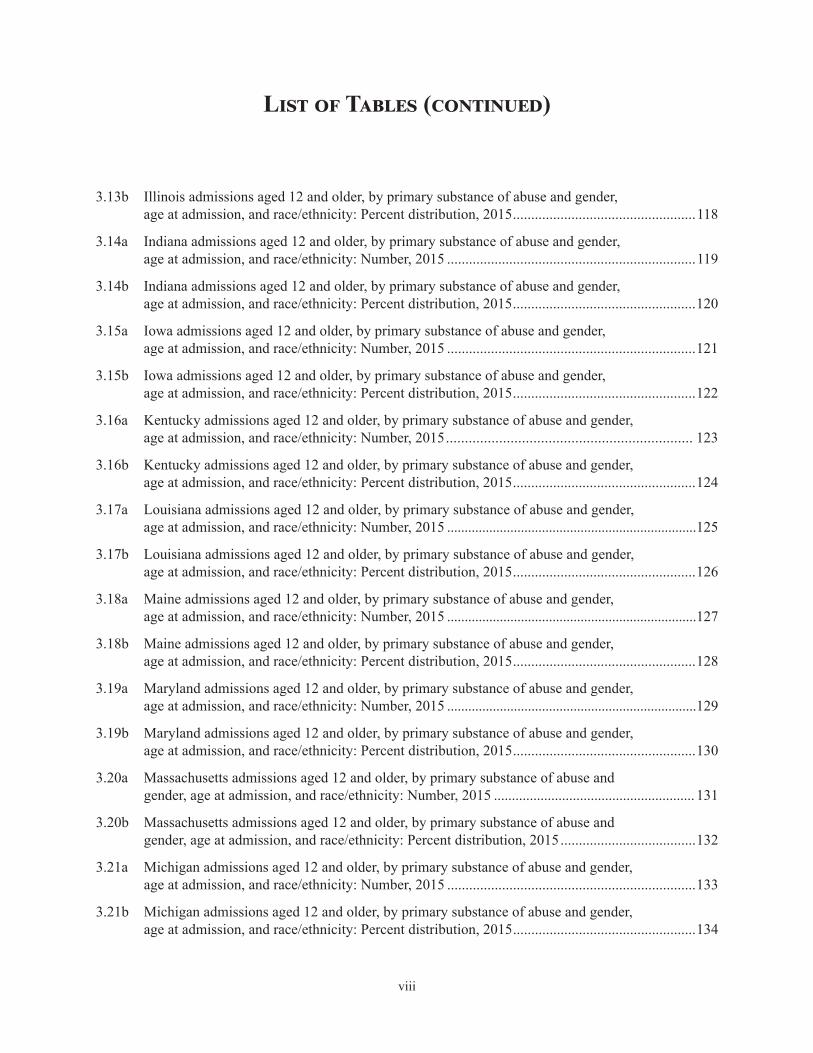
3.13b Illinois admissions aged 12 and older, by primary substance of abuse and gender, age at admission, and race/ethnicity: Percent distribution, 2015 ..................................................118
3.14a Indiana admissions aged 12 and older, by primary substance of abuse and gender, age at admission, and race/ethnicity: Number, 2015 ....................................................................119
3.14b Indiana admissions aged 12 and older, by primary substance of abuse and gender, age at admission, and race/ethnicity: Percent distribution, 2015 ..................................................120
3.15a Iowa admissions aged 12 and older, by primary substance of abuse and gender, age at admission, and race/ethnicity: Number, 2015 ....................................................................121
3.15b Iowa admissions aged 12 and older, by primary substance of abuse and gender, age at admission, and race/ethnicity: Percent distribution, 2015 ..................................................122
3.16a Kentucky admissions aged 12 and older, by primary substance of abuse and gender, age at admission, and race/ethnicity: Number, 2015 ................................................................. 123
3.16b Kentucky admissions aged 12 and older, by primary substance of abuse and gender, age at admission, and race/ethnicity: Percent distribution, 2015 ..................................................124
3.17a Louisiana admissions aged 12 and older, by primary substance of abuse and gender, age at admission, and race/ethnicity: Number, 2015 .......................................................................125
3.17b Louisiana admissions aged 12 and older, by primary substance of abuse and gender, age at admission, and race/ethnicity: Percent distribution, 2015 ..................................................126
3.18a Maine admissions aged 12 and older, by primary substance of abuse and gender, age at admission, and race/ethnicity: Number, 2015 .......................................................................127
3.18b Maine admissions aged 12 and older, by primary substance of abuse and gender, age at admission, and race/ethnicity: Percent distribution, 2015 ..................................................128
3.19a Maryland admissions aged 12 and older, by primary substance of abuse and gender, age at admission, and race/ethnicity: Number, 2015 .......................................................................129
3.19b Maryland admissions aged 12 and older, by primary substance of abuse and gender, age at admission, and race/ethnicity: Percent distribution, 2015 ..................................................130
3.20a Massachusetts admissions aged 12 and older, by primary substance of abuse and gender, age at admission, and race/ethnicity: Number, 2015 ........................................................ 131
3.20b Massachusetts admissions aged 12 and older, by primary substance of abuse and gender, age at admission, and race/ethnicity: Percent distribution, 2015 .....................................132
3.21a Michigan admissions aged 12 and older, by primary substance of abuse and gender, age at admission, and race/ethnicity: Number, 2015 ....................................................................133
3.21b Michigan admissions aged 12 and older, by primary substance of abuse and gender, age at admission, and race/ethnicity: Percent distribution, 2015 ..................................................134

ix
List of Tables (continued)
3.22a Minnesota admissions aged 12 and older, by primary substance of abuse and gender, age at admission, and race/ethnicity: Number, 2015 ..........................................................135
3.22b Minnesota admissions aged 12 and older, by primary substance of abuse and gender, age at admission, and race/ethnicity: Percent distribution, 2015 .......................................136
3.23a Mississippi admissions aged 12 and older, by primary substance of abuse and gender, age at admission, and race/ethnicity: Number, 2015 ...................................................... 137
3.23b Mississippi admissions aged 12 and older, by primary substance of abuse and gender, age at admission, and race/ethnicity: Percent distribution, 2015 .....................................138
3.24a Missouri admissions aged 12 and older, by primary substance of abuse and gender, age at admission, and race/ethnicity: Number, 2015 ........................................................ 139
3.24b Missouri admissions aged 12 and older, by primary substance of abuse and gender, age at admission, and race/ethnicity: Percent distribution, 2015 ..................................................140
3.25a Montana admissions aged 12 and older, by primary substance of abuse and gender, age at admission, and race/ethnicity: Number, 2015 ................................................................. 141
3.25b Montana admissions aged 12 and older, by primary substance of abuse and gender, age at admission, and race/ethnicity: Percent distribution, 2015 ..................................................142
3.26a Nebraska admissions aged 12 and older, by primary substance of abuse and gender, age at admission, and race/ethnicity: Number, 2015 ....................................................................143
3.26b Nebraska admissions aged 12 and older, by primary substance of abuse and gender, age at admission, and race/ethnicity: Percent distribution, 2015 ..................................................144
3.27a Nevada admissions aged 12 and older, by primary substance of abuse and gender, age at admission, and race/ethnicity: Number, 2015 ................................................................. 145
3.27b Nevada admissions aged 12 and older, by primary substance of abuse and gender, age at admission, and race/ethnicity: Percent distribution, 2015 ..................................................146
3.28a New Hampshire admissions aged 12 and older, by primary substance of abuse and gender, age at admission, and race/ethnicity: Number, 2015 ...................................................... 147
3.28b New Hampshire admissions aged 12 and older, by primary substance of abuse and gender, age at admission, and race/ethnicity: Percent distribution, 2015 .....................................148
3.29a New Jersey admissions aged 12 and older, by primary substance of abuse and gender, age at admission, and race/ethnicity: Number, 2015 ........................................................ 149
3.29b New Jersey admissions aged 12 and older, by primary substance of abuse and gender, age at admission, and race/ethnicity: Percent distribution, 2015 ..................................................150
3.30a New Mexico admissions aged 12 and older, by primary substance of abuse and gender, age at admission, and race/ethnicity: Number, 2015 ..........................................................151
x
List of Tables (continued)
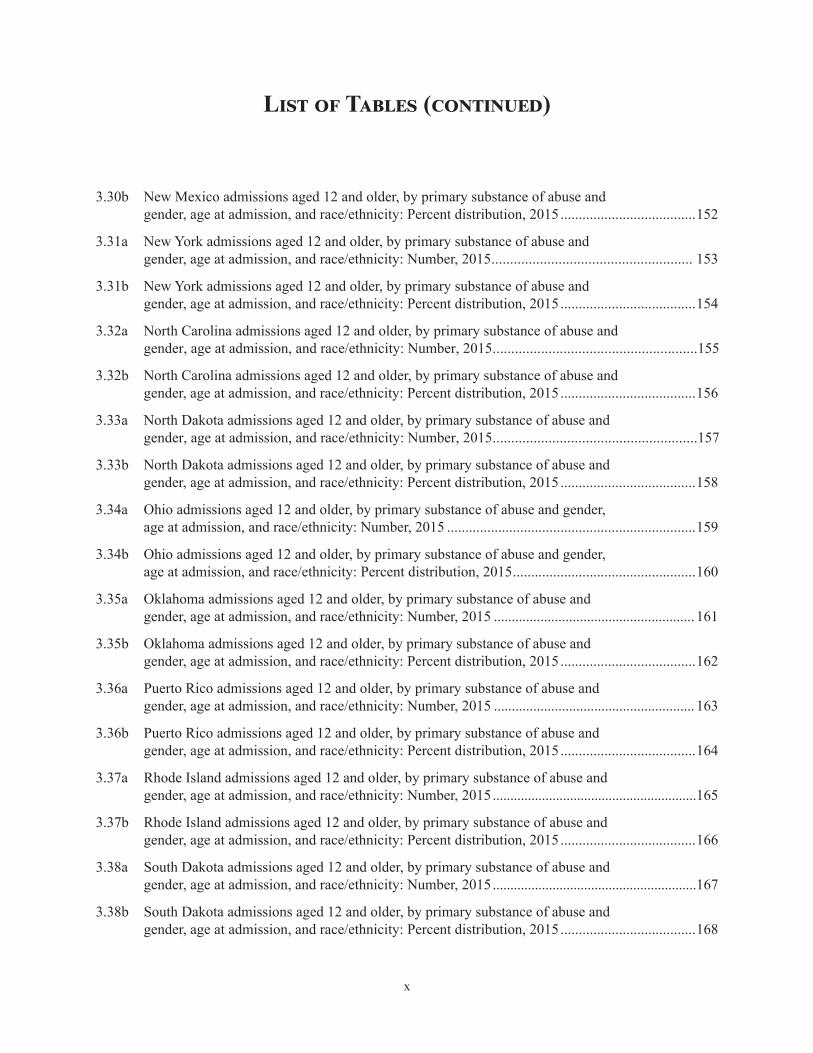
3.30b New Mexico admissions aged 12 and older, by primary substance of abuse and gender, age at admission, and race/ethnicity: Percent distribution, 2015 .....................................152
3.31a New York admissions aged 12 and older, by primary substance of abuse and gender, age at admission, and race/ethnicity: Number, 2015 ...................................................... 153
3.31b New York admissions aged 12 and older, by primary substance of abuse and gender, age at admission, and race/ethnicity: Percent distribution, 2015 .....................................154
3.32a North Carolina admissions aged 12 and older, by primary substance of abuse and gender, age at admission, and race/ethnicity: Number, 2015 .......................................................155
3.32b North Carolina admissions aged 12 and older, by primary substance of abuse and gender, age at admission, and race/ethnicity: Percent distribution, 2015 .....................................156
3.33a North Dakota admissions aged 12 and older, by primary substance of abuse and gender, age at admission, and race/ethnicity: Number, 2015 .......................................................157
3.33b North Dakota admissions aged 12 and older, by primary substance of abuse and gender, age at admission, and race/ethnicity: Percent distribution, 2015 .....................................158
3.34a Ohio admissions aged 12 and older, by primary substance of abuse and gender, age at admission, and race/ethnicity: Number, 2015 ....................................................................159
3.34b Ohio admissions aged 12 and older, by primary substance of abuse and gender, age at admission, and race/ethnicity: Percent distribution, 2015 ..................................................160
3.35a Oklahoma admissions aged 12 and older, by primary substance of abuse and gender, age at admission, and race/ethnicity: Number, 2015 ........................................................ 161
3.35b Oklahoma admissions aged 12 and older, by primary substance of abuse and gender, age at admission, and race/ethnicity: Percent distribution, 2015 .....................................162
3.36a Puerto Rico admissions aged 12 and older, by primary substance of abuse and gender, age at admission, and race/ethnicity: Number, 2015 ........................................................ 163
3.36b Puerto Rico admissions aged 12 and older, by primary substance of abuse and gender, age at admission, and race/ethnicity: Percent distribution, 2015 .....................................164
3.37a Rhode Island admissions aged 12 and older, by primary substance of abuse and gender, age at admission, and race/ethnicity: Number, 2015 ..........................................................165
3.37b Rhode Island admissions aged 12 and older, by primary substance of abuse and gender, age at admission, and race/ethnicity: Percent distribution, 2015 .....................................166
3.38a South Dakota admissions aged 12 and older, by primary substance of abuse and gender, age at admission, and race/ethnicity: Number, 2015 ..........................................................167
3.38b South Dakota admissions aged 12 and older, by primary substance of abuse and gender, age at admission, and race/ethnicity: Percent distribution, 2015 .....................................168

xi
List of Tables (continued)
3.39a Tennessee admissions aged 12 and older, by primary substance of abuse and gender, age at admission, and race/ethnicity: Number, 2015 ........................................................ 169
3.39b Tennessee admissions aged 12 and older, by primary substance of abuse and gender, age at admission, and race/ethnicity: Percent distribution, 2015 .......................................170
3.40a Texas admissions aged 12 and older, by primary substance of abuse and gender, age at admission, and race/ethnicity: Number, 2015 ....................................................................171
3.40b Texas admissions aged 12 and older, by primary substance of abuse and gender, age at admission, and race/ethnicity: Percent distribution, 2015 ..................................................172
3.41a Utah admissions aged 12 and older, by primary substance of abuse and gender, age at admission, and race/ethnicity: Number, 2015 ....................................................................173
3.41b Utah admissions aged 12 and older, by primary substance of abuse and gender, age at admission, and race/ethnicity: Percent distribution, 2015 ..................................................174
3.42a Vermont admissions aged 12 and older, by primary substance of abuse and gender, age at admission, and race/ethnicity: Number, 2015 ....................................................................175
3.42b Vermont admissions aged 12 and older, by primary substance of abuse and gender, age at admission, and race/ethnicity: Percent distribution, 2015 ..................................................176
3.43a Virginia admissions aged 12 and older, by primary substance of abuse and gender, age at admission, and race/ethnicity: Number, 2015 .......................................................................177
3.43b Virginia admissions aged 12 and older, by primary substance of abuse and gender, age at admission, and race/ethnicity: Percent distribution, 2015 ..................................................178
3.44a Washington admissions aged 12 and older, by primary substance of abuse and gender, age at admission, and race/ethnicity: Number, 2015 ........................................................ 179
3.44b Washington admissions aged 12 and older, by primary substance of abuse and gender, age at admission, and race/ethnicity: Percent distribution, 2015 .......................................180
3.45a West Virginia admissions aged 12 and older, by primary substance of abuse and gender, age at admission, and race/ethnicity: Number, 2015 ........................................................ 181
3.45b West Virginia admissions aged 12 and older, by primary substance of abuse and gender, age at admission, and race/ethnicity: Percent distribution, 2015 .....................................182
3.46a Wisconsin admissions aged 12 and older, by primary substance of abuse and gender, age at admission, and race/ethnicity: Number, 2015 ........................................................ 183
3.46b Wisconsin admissions aged 12 and older, by primary substance of abuse and gender, age at admission, and race/ethnicity: Percent distribution, 2015 .......................................184
3.47a Wyoming admissions aged 12 and older, by primary substance of abuse and gender, age at admission, and race/ethnicity: Number, 2015 ....................................................... .185

xii
List of Tables (continued)
3.47b Wyoming admissions aged 12 and older, by primary substance of abuse and gender, age at admission, and race/ethnicity: Percent distribution, 2015 .......................................186
Appendix A. About the Treatment Episode Data Set (TEDS)1 State data system reporting characteristics: 2015 .........................................................................192
2 Item percentage response rate, by state or jurisdiction: TEDS Minimum Data Set, 2015 ................................................................................................................................................. 196
3 Item percentage response rate, by state or jurisdiction: TEDS Supplemental Data Set, 2015 .......................................................................................................................................... 198

xiii
List of Figures
Trends in Substance Abuse Treatment Admissions Aged 12 and Older: 2005-20151 Census regions and Census divisions in the United States ..................................................................6
National Maps: Substance Abuse Treatment Admission Rates per 100,000 Population Aged 12 and Older
2 Primary alcohol admission rates, by state or jurisdiction: 2005-2015 (per 100,000 population aged 12 and older) ......................................................................................11
3 Primary marijuana admission rates, by state or jurisdiction: 2005-2015 (per 100,000 population aged 12 and older) ......................................................................................12
4 Primary heroin admission rates, by state or jurisdiction: 2005-2015 (per 100,000 population aged 12 and older) ......................................................................................13
5 Primary cocaine admission rates, by state or jurisdiction: 2005-2015 (per 100,000 population aged 12 and older) ......................................................................................14
6 Primary methamphetamine/amphetamine admission rates, by state or jurisdiction: 2005-2015 (per 100,000 population aged 12 and older) ...............................................15
7 Primary non-heroin opiates/synthetics admission rates, by state or jurisdiction: 2005-2015 (per 100,000 population aged 12 and older) .......................................................................16
Characteristics of Substance Abuse Treatment Admissions Aged 12 and Older, by State or Jurisdiction and Primary Substance of Abuse: 2015Percentage Distribution by State or Jurisdiction
8 Alabama admissions aged 12 and older, by primary substance of abuse: 2005-2015 ................................................................................................................................................20
9 Alaska admissions aged 12 and older, by primary substance of abuse: 2005-2015 ..........................................................................................................................................20
10 Arizona admissions aged 12 and older, by primary substance of abuse: 2005-2015 ..........................................................................................................................................21
11 Arkansas admissions aged 12 and older, by primary substance of abuse: 2005-2015 ..........................................................................................................................................21
12 California admissions aged 12 and older, by primary substance of abuse: 2005-2015 ..........................................................................................................................................22
13 Colorado admissions aged 12 and older, by primary substance of abuse: 2005-2015 ..........................................................................................................................................22
14 Connecticut admissions aged 12 and older, by primary substance of abuse: 2005-2015 ..........................................................................................................................................23

xiv
List of Figures (continued)
15 Delaware admissions aged 12 and older, by primary substance of abuse: 2005-2015 ..........................................................................................................................................23
16 District of Columbia admissions aged 12 and older, by primary substance of abuse: 2005-2015 ...............................................................................................................................24
17 Florida admissions aged 12 and older, by primary substance of abuse: 2005-2015 ..........................................................................................................................................24
18 Georgia admissions aged 12 and older, by primary substance of abuse: 2005-2015 ..........................................................................................................................................25
19 Hawaii admissions aged 12 and older, by primary substance of abuse: 2005-2015 ..........................................................................................................................................25
20 Idaho admissions aged 12 and older, by primary substance of abuse: 2005-2015 ..........................................................................................................................................26
21 Illinois admissions aged 12 and older, by primary substance of abuse: 2005-2015 ..........................................................................................................................................26
22 Indiana admissions aged 12 and older, by primary substance of abuse: 2005-2015 ..........................................................................................................................................27
23 Iowa admissions aged 12 and older, by primary substance of abuse: 2005-2015 ..........................................................................................................................................27
24 Kansas admissions aged 12 and older, by primary substance of abuse: 2005-2015 ..........................................................................................................................................28
25 Kentucky admissions aged 12 and older, by primary substance of abuse: 2005-2015 ..........................................................................................................................................28
26 Louisiana admissions aged 12 and older, by primary substance of abuse: 2005-2015 ..........................................................................................................................................29
27 Maine admissions aged 12 and older, by primary substance of abuse: 2005-2015 ..........................................................................................................................................29
28 Maryland admissions aged 12 and older, by primary substance of abuse: 2005-2015 ..........................................................................................................................................30
29 Massachusetts admissions aged 12 and older, by primary substance of abuse: 2005-2015 ..........................................................................................................................................30
30 Michigan admissions aged 12 and older, by primary substance of abuse: 2005-2015 ..........................................................................................................................................31
31 Minnesota admissions aged 12 and older, by primary substance of abuse: 2005-2015 ..........................................................................................................................................31
xv
List of Figures (continued)
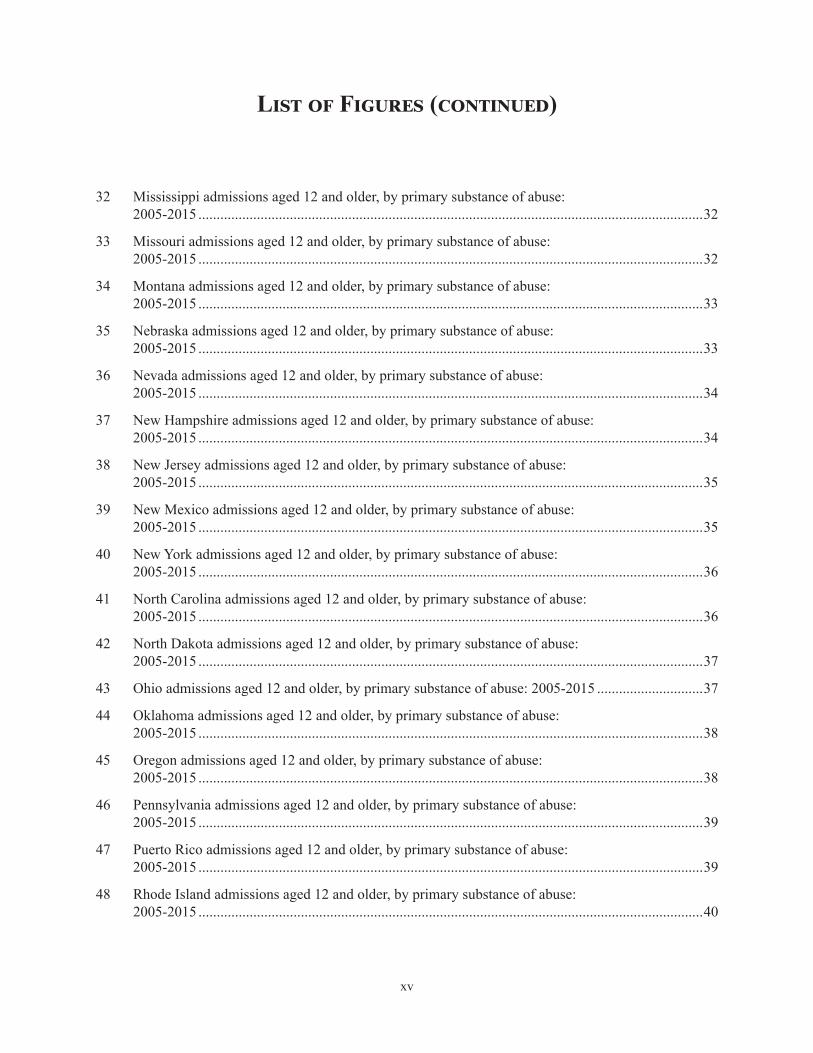
32 Mississippi admissions aged 12 and older, by primary substance of abuse: 2005-2015 ..........................................................................................................................................32
33 Missouri admissions aged 12 and older, by primary substance of abuse: 2005-2015 ..........................................................................................................................................32
34 Montana admissions aged 12 and older, by primary substance of abuse: 2005-2015 ..........................................................................................................................................33
35 Nebraska admissions aged 12 and older, by primary substance of abuse: 2005-2015 ..........................................................................................................................................33
36 Nevada admissions aged 12 and older, by primary substance of abuse: 2005-2015 ..........................................................................................................................................34
37 New Hampshire admissions aged 12 and older, by primary substance of abuse: 2005-2015 ..........................................................................................................................................34
38 New Jersey admissions aged 12 and older, by primary substance of abuse: 2005-2015 ..........................................................................................................................................35
39 New Mexico admissions aged 12 and older, by primary substance of abuse: 2005-2015 ..........................................................................................................................................35
40 New York admissions aged 12 and older, by primary substance of abuse: 2005-2015 ..........................................................................................................................................36
41 North Carolina admissions aged 12 and older, by primary substance of abuse: 2005-2015 ..........................................................................................................................................36
42 North Dakota admissions aged 12 and older, by primary substance of abuse: 2005-2015 ..........................................................................................................................................37
43 Ohio admissions aged 12 and older, by primary substance of abuse: 2005-2015 .............................37
44 Oklahoma admissions aged 12 and older, by primary substance of abuse: 2005-2015 ..........................................................................................................................................38
45 Oregon admissions aged 12 and older, by primary substance of abuse: 2005-2015 ..........................................................................................................................................38
46 Pennsylvania admissions aged 12 and older, by primary substance of abuse: 2005-2015 ..........................................................................................................................................39
47 Puerto Rico admissions aged 12 and older, by primary substance of abuse: 2005-2015 ..........................................................................................................................................39
48 Rhode Island admissions aged 12 and older, by primary substance of abuse: 2005-2015 ..........................................................................................................................................40
xvi
List of Figures (continued)
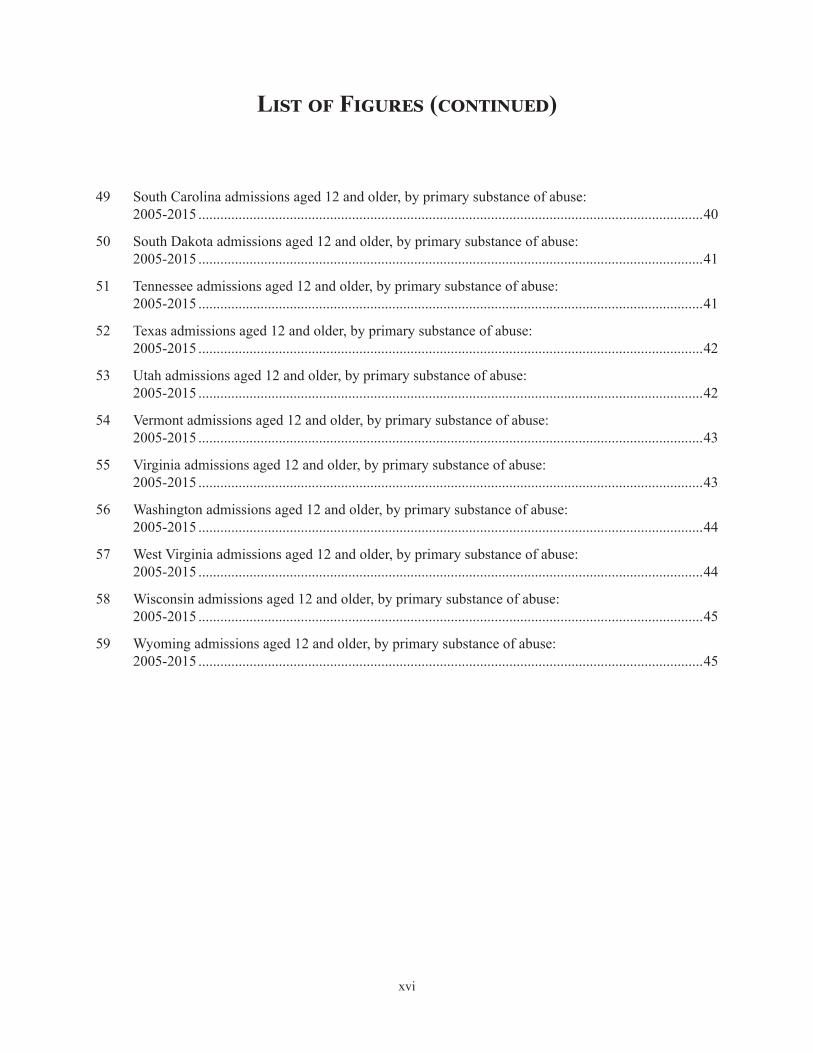
49 South Carolina admissions aged 12 and older, by primary substance of abuse: 2005-2015 ..........................................................................................................................................40
50 South Dakota admissions aged 12 and older, by primary substance of abuse: 2005-2015 ..........................................................................................................................................41
51 Tennessee admissions aged 12 and older, by primary substance of abuse: 2005-2015 ..........................................................................................................................................41
52 Texas admissions aged 12 and older, by primary substance of abuse: 2005-2015 ..........................................................................................................................................42
53 Utah admissions aged 12 and older, by primary substance of abuse: 2005-2015 ..........................................................................................................................................42
54 Vermont admissions aged 12 and older, by primary substance of abuse: 2005-2015 ..........................................................................................................................................43
55 Virginia admissions aged 12 and older, by primary substance of abuse: 2005-2015 ..........................................................................................................................................43
56 Washington admissions aged 12 and older, by primary substance of abuse: 2005-2015 ..........................................................................................................................................44
57 West Virginia admissions aged 12 and older, by primary substance of abuse: 2005-2015 ..........................................................................................................................................44
58 Wisconsin admissions aged 12 and older, by primary substance of abuse: 2005-2015 ..........................................................................................................................................45
59 Wyoming admissions aged 12 and older, by primary substance of abuse: 2005-2015 ..........................................................................................................................................45

1
Highlights
This report uses data from the Treatment Episode Data Set (TEDS) to examine treatment admis- sion data in 2015, and trend data from 2005 to 2015, nationally, regionally (by four Census
regions and nine Census divisions), and by state or jurisdiction. The report provides information on the demographic and substance abuse characteristics of admissions to treatment aged 12 and older for abuse of alcohol and/or drugs in facilities that report to individual state administrative data systems. It is important to note that values in charts, narrative lists, and percentage distributions are calculated using actual raw numbers and rounded for presentation in this report; calculations using rounded values may produce different results.
For 2015, a total of 1,537,025 admissions aged 12 and older were reported to TEDS by 45 states, the District of Columbia, and Puerto Rico (Georgia, Kansas, Oregon, Pennsylvania, and South Carolina did not report sufficient admissions for 2015 to be included in this report) [Table 1.1].
Trends in Substance Abuse Treatment Admissions Aged 12 and Older: 2005-2015
All Admissions• Between 2005 and 2015, about 23 percent of all admissions reported were in the Middle Atlantic
division [Table 1.1].
• The average rate of admissions was highest in the New England and Middle Atlantic divisions—1,530 and 980 per 100,000 population aged 12 and older, respectively, in 2015 [Table 1.2 and Figure 1].
• The U.S. population aged 12 and older grew about 10 percent between 2005 and 2015, but the number of annual treatment admissions was 19 percent lower in 2015 than in 2005 [Table 1.1]. The treatment admission rate in 2005 (756 per 100,000 population) was about 26 percent higher than the rate in 2015 (557 per 100,000 population aged 12 and older) [Table 1.2].
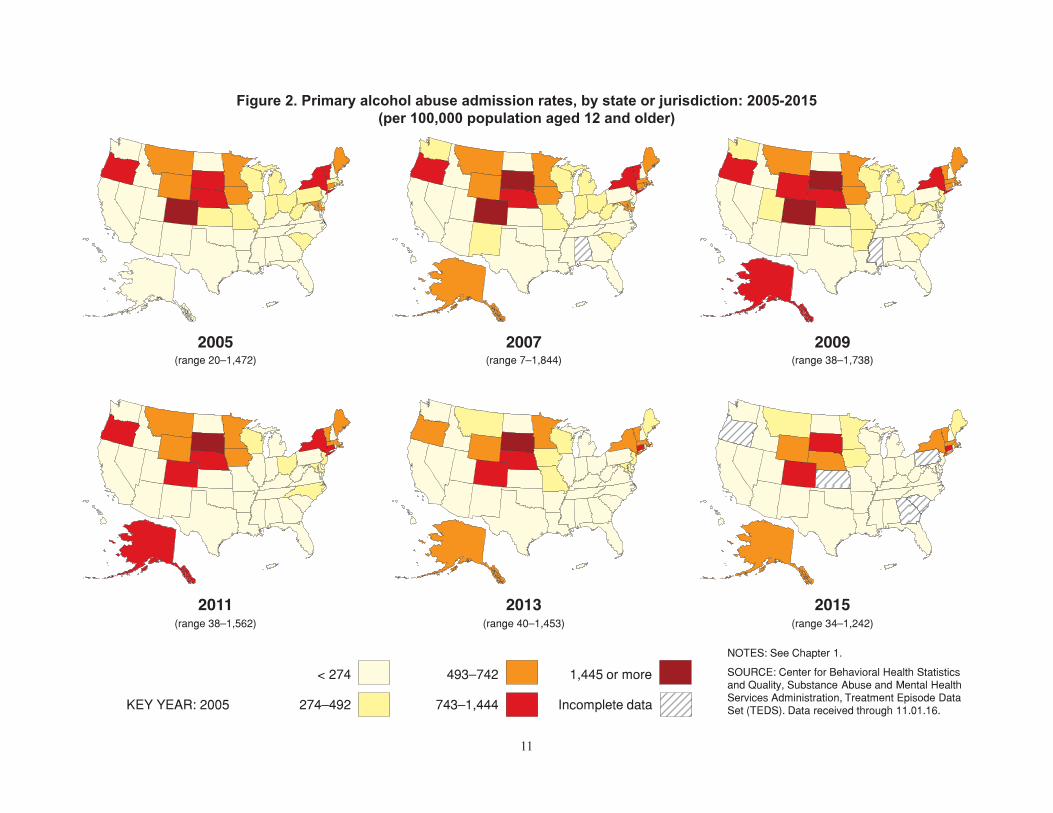
Alcohol• The treatment admission rate for primary alcohol abuse was higher in 2005 (298 per 100,000)
than in 2015, at 189 per 100,000 population aged 12 and older. The rate fluctuated between 2005 and 2015, but 2008 had the highest rate and 2015 had the lowest rate in this time period [Table 1.4b and Figure 2].
• Alcohol treatment admission rates were higher in 2005 than in 2015 in eight of the nine Census divisions. The rate was 14 percent lower in the New England division.
• From 2005 to 2015, alcohol treatment admission rates were generally higher in the New England, Middle Atlantic, Mountain, and West North Central than in other Census divisions.
2
Marijuana• The treatment admission rate for primary marijuana abuse was 36 percent higher in 2005, at
121 per 100,000 population aged 12 and older, than in 2015 (77 per 100,000) [Table 1.5b and Figure 3].
• Marijuana admission rates were between 13 and 60 percent higher in 2005 than in 2015 in eight of the nine Census divisions. The New England division had a 14 percent increase from 2005 to 2015.
• From 2005 to 2015, marijuana treatment admission rates were consistently highest in the West North Central and Middle Atlantic divisions.
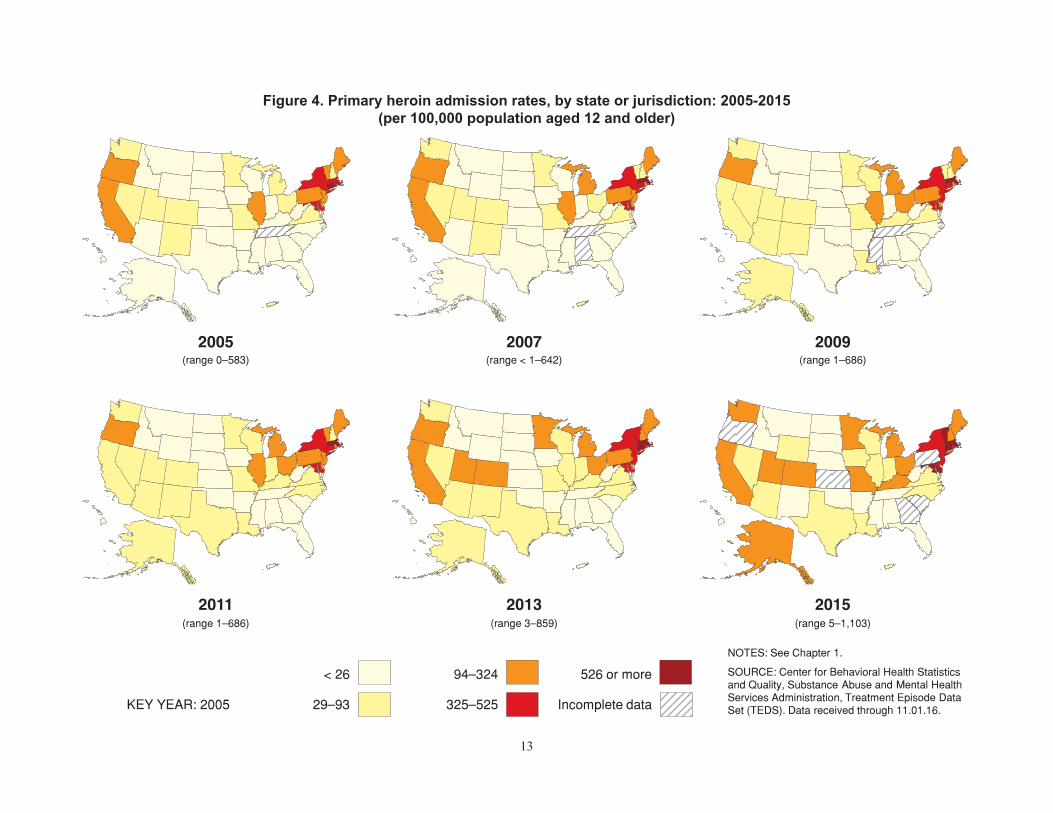
Heroin• The treatment admission rate for primary heroin abuse was 40 percent lower in 2005, at 104 per
100,000 population aged 12 and older, than in 2015 (146 per 100,000) [Table 1.6b and Figure 4].
• Heroin treatment admission rates were between 8 and 833 percent lower in 2005 than in 2015 in all nine Census divisions.
• From 2005 to 2015, heroin treatment admission rates were consistently highest in the New England and Middle Atlantic divisions.
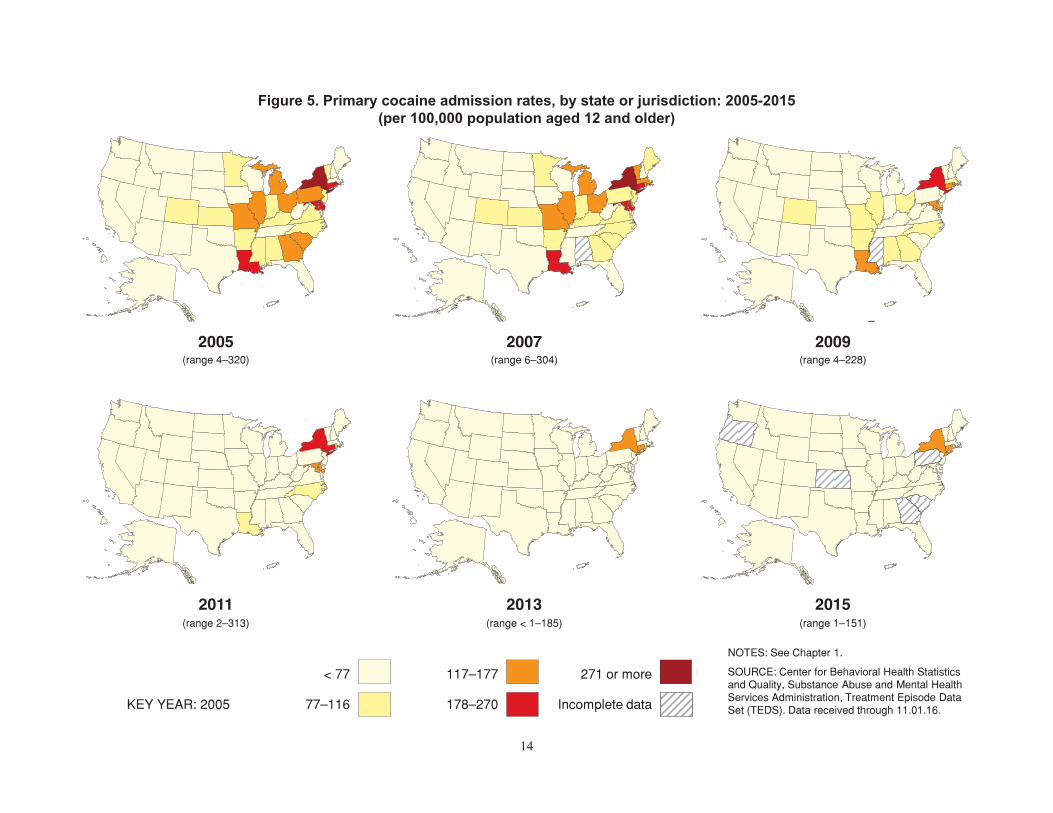
Cocaine• The treatment admission rate for primary cocaine abuse was 75 percent higher in 2005, at 107 per
100,000 population aged 12 and older, than in 2015 (27 per 100,000) [Table 1.7b and Figure 5].
• Cocaine treatment admission rates were higher in 2005 than in 2015 in all nine Census divisions.
• From 2005 through 2015, cocaine treatment admission rates were consistently highest in the Middle Atlantic division.
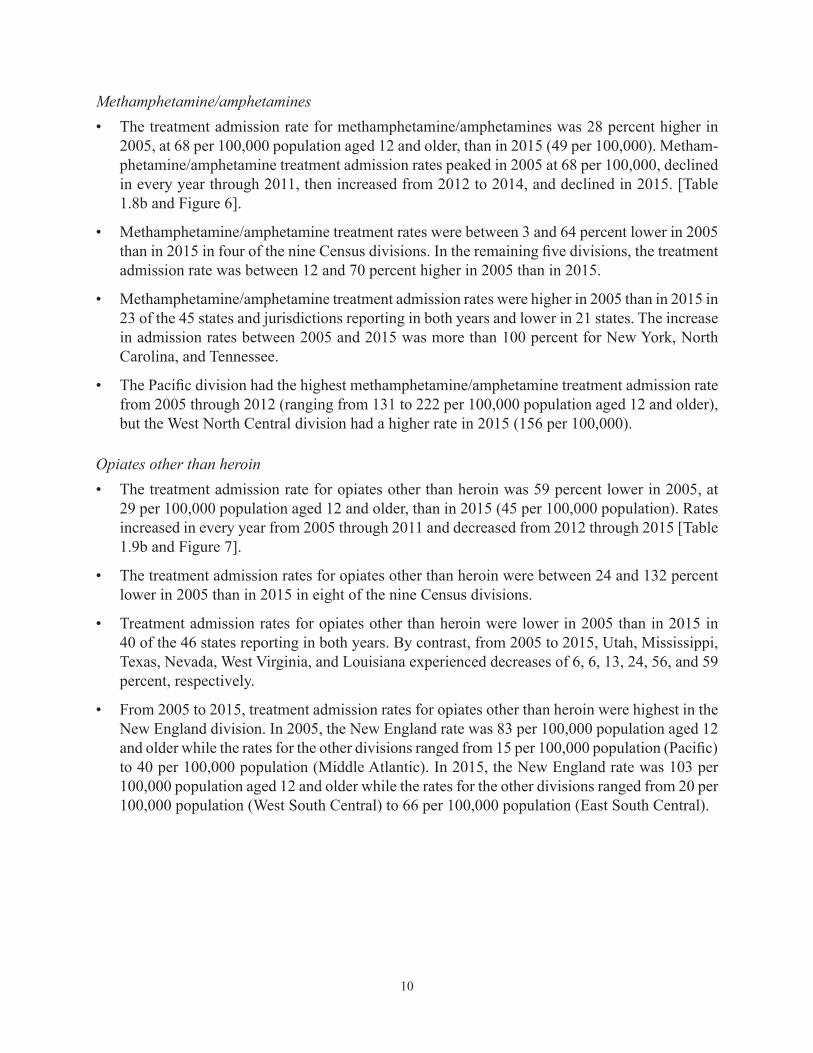
Methamphetamine/amphetamines• The treatment admission rate for methamphetamine/amphetamines was 28 percent higher in
2005, at 68 per 100,000 population aged 12 and older, than in 2015 (49 per 100,000). Metham-phetamine/amphetamine treatment admission rates peaked in 2005 at 68 per 100,000, declined in every year through 2011, then increased from 2012 to 2014, and declined in 2015 [Table 1.8b and Figure 6].
• Methamphetamine/amphetamine treatment admission rates were higher in 2005 than in 2015 in five of the nine Census divisions.
• From 2005 to 2015, methamphetamine/amphetamine treatment admission rates were highest in the Pacific, West North Central, and Mountain divisions.
3
Opiates other than heroin• The treatment admission rate for opiates other than heroin was 59 percent lower in 2005, at 29 per
100,000 population aged 12 and older, than in 2015 (45 per 100,000). Rates increased in every year from 2005 through 2011 and decreased from 2012 through 2015 [Table 1.9b and Figure 7].
• The treatment admission rates for opiates other than heroin increased between 2005 and 2015 in eight of the Census divisions. By contrast, treatment rates for opiates other than heroin decreased in the West South Central division between 2005 and 2015.
• From 2005 to 2015, treatment admission rates for opiates other than heroin were highest in the New England division.
Substance Abuse Treatment Admissions Aged 12 and Older: 2015• In 2015, the treatment admission rate was higher for primary alcohol abuse than for any
illicit drugs. The primary alcohol admission rate was 189 per 100,000 population (the rate for alcohol alone was 107 per 100,000 and the rate for alcohol with secondary drug abuse was 82 per 100,000). The highest rates for illicit drugs were for heroin (146 per 100,000) and marijuana (77 per 100,000) [Table 2.3].
• Treatment admission rates for 2015 were higher for primary alcohol abuse than for an illicit drug in six Census divisions, and in 36 of the 47 reporting states and jurisdictions. The primary illicit drug with the highest treatment admission rate varied by division: heroin in the New England, Middle Atlantic, East North Central, and South Atlantic divisions; methamphetamine/amphetamines in the West North Central, West South Central, Pacific, and Mountain divisions; and non-heroin opiates in the East South Central division.

4
5
Chapter 1
Trends in Substance Abuse Treatment Admissions Aged 12 and Older: 2005-2015
This report uses data from the Treatment Episode Data Set (TEDS) to examine treatment admis-sion data in 2015, and trend data from 2005 to 2015, nationally, regionally (by four Census
regions and nine Census divisions), and by state or jurisdiction. It is a companion to Treatment Episode Data Set (TEDS): 2005-2015 National Admissions to Substance Abuse Treatment. These reports provide information on the demographic and substance abuse characteristics of admissions to treatment aged 12 and older for abuse of alcohol and/or drugs in facilities that report to individual state administrative data systems. Data include records for admissions during calendar years 2005 through 2015 that were received and processed through November 1, 2016.1
TEDS is an admission-based system, and TEDS admissions do not represent individuals. Thus, an individual admitted to treatment twice within a calendar year would be counted as two admissions.
TEDS does not include all admissions to substance abuse treatment. It includes admissions to facilities that are licensed or certified by the state substance abuse agency to provide substance abuse treatment (or are administratively tracked for other reasons). In general, facilities reporting TEDS data are those that receive state alcohol and/or drug agency funds (including federal block grant funds) for the provision of alcohol and/or drug treatment services. Additional information on the history and methodology of TEDS and this report as well as important issues related to state data collection systems are detailed in Appendix A.
This chapter details trends in the annual numbers and rates of admissions aged 12 and older for 2005 to 2015. Trend data are used to monitor changing patterns in substance abuse treatment admissions. These patterns reflect underlying changes in substance abuse in the population as well as changing priorities in the treatment/reporting system. TEDS data thus have important implica-tions for resource allocation and program planning.
While the tables in this report present data by Census region and Census division (Figure 1), and by state or jurisdiction, it is important to note that comparisons between and across regions, divisions, and states should be made with caution. There are many factors (e.g., facilities included, clients included, ability to track multi-service episodes, services offered, and completeness and timeliness of reporting) that can affect comparability. See Appendix A for a full discussion.
1 For researchers interested in more detailed analysis, TEDS public use files are available for online data analysis or download at the Substance Abuse and Mental Health Data Archive, which can be accessed at https://datafiles.samhsa.gov. Summary data for individual states that have submitted the full year of data are available online through the TEDS Quick Statistics website at https://wwwdasis.samhsa.gov/webt/newmapv1.htm.

6
All AdmissionsTable 1.1 presents the total number of treatment admissions aged 12 and older by Census region, Census division, and state or jurisdiction for 2005 through 2015.2
• For 2015, a total of 1,537,025 admissions aged 12 and older were reported to TEDS by 45 states, the District of Columbia, and Puerto Rico for a total of 47 reporting states or jurisdictions (Georgia, Kansas, Oregon, Pennsylvania, and South Carolina did not report sufficient admis-sions for 2015 to be included in this report).
• The number of treatment admissions aged 12 and older was 19 percent higher in 2005 than in 2015.
• From 2005 to 2015, about 23 percent of all admissions reported were in the Middle Atlantic division. The East North Central, South Atlantic, and Pacific divisions each reported roughly 13 to 15 percent of all admissions; the Mountain, New England, and West North Central
Figure 1. Census regions and Census divisions of the United States
2 Data were not submitted or were incomplete for one or more years in some states or jurisdictions because of changes to their data collection systems: Alabama (2007), the District of Columbia (2005-2006 and 2008-2009), Georgia (2015), Kansas (2015), Mississippi (2009-2010), Oregon (2015), Pennsylvania (2015) and South Carolina (2014-2015).
7
divisions each reported about 8 to 10 percent of all admissions; and the East South Central and West South Central divisions each reported about 3 to 5 percent of all admissions.
Table 1.2 presents the treatment admission rates per 100,000 population aged 12 and older by Census region, Census division, and state or jurisdiction for 2005 through 2015.
• Between 2005 and 2015, the U.S. population aged 12 and older grew by about 10 percent,* but the number of annual treatment admissions was 19 percent lower in 2015 than in 2005 [Table 1.1]. The treatment admission rate in 2005 (756 per 100,000 population) was about 26 percent higher than the rate in 2015 (557 per 100,000 population aged 12 and older) [Table 1.2].
• Admission rates were highest in the New England and Middle Atlantic divisions. In New England, the rate was lowest in 2005, at 1,193 per 100,000 population aged 12 and older, and highest in 2014, at 1,568 per 100,000 population aged 12 and older. The rates in the Middle Atlantic division were at 1,307 per 100,000 in 2005 and 980 per 100,000 population aged 12 and older in 2015.
• In 2015, individual state admission rates varied from approximately 78 per 100,000 population to about 2,178 per 100,000. As noted above, there are many possible explanations for this varia-tion (see Appendix A), and comparisons among states should be made with caution.
Table 1.3 presents the treatment admission rate adjusted for age, gender, and race/ethnicity to the U.S. population in 2010 by Census region, Census division, and state or jurisdiction for 2005 to 2015. Adjusted rates take into account the different admission rates among population subgroups and the different proportions of the subgroups in each division, state, or jurisdiction. The adjusted rates are the rates that would be observed if each division, state, or jurisdiction had the same distribution of subgroups as the standardized U.S. population in 2010.
For example, the 2015 unadjusted rates for Alaska and Iowa were similar (1,063 and 1,083 per 100,000 population aged 12 and older, respectively) [Table 1.2], but the adjusted rates were not (541 per 100,000 for Alaska and 1,234 per 100,000 for Iowa) [Table 1.3]. Alaska’s adjusted rate was much lower than its unadjusted rate because Alaska had high admission rates in subgroups that were a large proportion of the state’s population but represented relatively lower proportions of the U.S. population in 2010. In contrast, the population distribution in Iowa closely resembled the population distribution in the U.S.; therefore, Iowa’s adjusted and unadjusted rates were similar. This example demonstrates that the difference between adjusted rates and unadjusted rates can vary depending on the state’s population distribution.
* See the source in Table 1.3.

8
Selected Primary SubstanceSix substance groups (alcohol, marijuana, heroin, cocaine, methamphetamine/amphetamines, and opiates other than heroin3) accounted for 96 percent of all TEDS admissions aged 12 and older in 2015.4
Tables 1.4a–1.9a present the numbers of admissions aged 12 and older by Census region, Census division, and state and jurisdiction from 2005 to 2015 for each of the selected primary substances.5
Tables 1.4b–1.9b present the admission rates per 100,000 population aged 12 and older by Census region, Census division, and state and jurisdiction from 2005 to 2015 for each of the selected pri-mary substances.
The admission rates are mapped in Figures 2–7. The map categories are based on the median, 75th, 90th, and 99th percentiles of the range of 2005 admission rates for each substance. Each map shows about one state or jurisdiction in dark red (the 99th percentile and above), about five states or jurisdictions in light red (the 90th to 98th percentiles), about eight states or jurisdictions in orange (the 75th to 89th percentiles), about 12 states or jurisdictions in yellow (the 50th to 74th percen-tiles), and about 24 states or jurisdictions in tan (below the median 2005 U.S. rate). Cross-hatching indicates states or jurisdictions where no data or less than a full calendar year of data were submitted.
Alcohol• The treatment admission rate for primary alcohol was higher in 2005 (298 per 100,000) than
in 2015, at 189 per 100,000 population aged 12 and older. The rate fluctuated between 2005 and 2015, but 2008 had the highest rate and 2015 had the lowest rate in this time period [Table 1.4b and Figure 2].
• Alcohol treatment admission rates were higher in 2005 than in 2015 in eight of the nine Census divisions. The rate was 14 percent lower in the New England division.
• Alcohol treatment admission rates were higher in 2005 than in 2015 in 40 of the 46 states and jurisdictions reporting in both years and lower in 6 states and jurisdictions. Connecticut expe-rienced a 49 percent increase from 500 per 100,000 in 2005 to 747 per 100,000 in 2015.
• From 2005 to 2015, alcohol treatment admission rates were generally highest in the New England, Middle Atlantic, Mountain, and West North Central divisions.
3 Opiates other than heroin include methadone, buprenorphine, codeine, hydrocodone, hydromorphone, meperidine, morphine, opium, oxycodone, pentazocine, propoxyphene, tramadol, and any other drug with morphine-like effects.
4 See: Substance Abuse and Mental Health Services Administration, Center for Behavioral Health Statistics and Qual-ity. Treatment Episode Data Set (TEDS): 2005-2015. National Admissions to Substance Abuse Treatment Services. BHSIS Series S-95, HHS Publication No. (SMA) 17-4360. Rockville, MD: Substance Abuse and Mental Health Services Administration, 2015, Table 1.1b.
5 Admissions can report up to three substances of abuse and are referred to as primary, secondary, and tertiary in the order that they reported. These represent the substances that led to the treatment episode and are not necessarily a complete enumeration of all substances used at the time of admission. Most of the information in this report is based on an admission’s primary or first mentioned substance of abuse unless otherwise specified. (See Appendix A for more details.)

9
Marijuana• The treatment admission rate for primary marijuana abuse was 36 percent higher in 2005, at
121 per 100,000 population aged 12 and older, than in 2015 (77 per 100,000) [Table 1.5b and Figure 3].
• Marijuana admission rates were between 13 and 60 percent higher in 2005 than in 2015 in eight of the nine Census divisions. The New England division had a 14 percent increase from 2005 to 2015.
• Marijuana admission rates were higher in 2005 than in 2015 in 34 of the 44 states and jurisdic-tions reporting in both years and lower in 10 states and jurisdictions. The admission rates of Connecticut and North Carolina more than doubled between 2005 and 2015.
• From 2005 to 2015, marijuana treatment admission rates were consistently highest in the West North Central and Middle Atlantic divisions.
Heroin• The treatment admission rate for primary heroin abuse was 40 percent lower in 2005, at 104 per
100,000 population aged 12 and older, than in 2015 (146 per 100,000) [Table 1.6b and Figure 4].
• Heroin treatment admission rates were between 8 and 833 percent lower in 2005 than in 2015 in all nine Census divisions.
• Heroin treatment admission rates were higher in 2005 than in 2015 in 3 of the 44 states and jurisdictions reporting in both years,6 and lower in 41 states and jurisdictions. Alaska, North Dakota, Kentucky, Wyoming, Arkansas, and Minnesota experienced the largest growth of heroin admissions from 2005 to 2015.
• From 2005 to 2015, heroin treatment admission rates were consistently highest in the New England and Middle Atlantic divisions.
Cocaine• The treatment admission rate for primary cocaine abuse was 75 percent higher in 2005, at 107 per
100,000 population aged 12 and older, than in 2015 (27 per 100,000) [Table 1.7b and Figure 5].
• Cocaine treatment admission rates were between 42 and 81 percent higher in 2005 than in 2015 in the nine Census divisions.
• Cocaine admission rates were higher in 2005 than in 2015 in 45 of the 46 states and jurisdic-tions reporting in both years. Alaska’s cocaine admissions rate was 32 percent lower in 2005, at 9 per 100,000, than in 2015 (12 per 100,000 population aged 12 and older).
• From 2005 to 2015, cocaine treatment admission rates were consistently highest in the Middle Atlantic division.
6 Tennessee reported all heroin admissions as Opiates other than heroin through June 2009. Tennessee began disag-gregating heroin admissions from other opiates in July 2009 (Figures 4 and 7).
10
Methamphetamine/amphetamines• The treatment admission rate for methamphetamine/amphetamines was 28 percent higher in
2005, at 68 per 100,000 population aged 12 and older, than in 2015 (49 per 100,000). Metham-phetamine/amphetamine treatment admission rates peaked in 2005 at 68 per 100,000, declined in every year through 2011, then increased from 2012 to 2014, and declined in 2015. [Table 1.8b and Figure 6].
• Methamphetamine/amphetamine treatment rates were between 3 and 64 percent lower in 2005 than in 2015 in four of the nine Census divisions. In the remaining five divisions, the treatment admission rate was between 12 and 70 percent higher in 2005 than in 2015.
• Methamphetamine/amphetamine treatment admission rates were higher in 2005 than in 2015 in 23 of the 45 states and jurisdictions reporting in both years and lower in 21 states. The increase in admission rates between 2005 and 2015 was more than 100 percent for New York, North Carolina, and Tennessee.
• The Pacific division had the highest methamphetamine/amphetamine treatment admission rate from 2005 through 2012 (ranging from 131 to 222 per 100,000 population aged 12 and older), but the West North Central division had a higher rate in 2015 (156 per 100,000).
Opiates other than heroin• The treatment admission rate for opiates other than heroin was 59 percent lower in 2005, at
29 per 100,000 population aged 12 and older, than in 2015 (45 per 100,000 population). Rates increased in every year from 2005 through 2011 and decreased from 2012 through 2015 [Table 1.9b and Figure 7].
• The treatment admission rates for opiates other than heroin were between 24 and 132 percent lower in 2005 than in 2015 in eight of the nine Census divisions.
• Treatment admission rates for opiates other than heroin were lower in 2005 than in 2015 in 40 of the 46 states reporting in both years. By contrast, from 2005 to 2015, Utah, Mississippi, Texas, Nevada, West Virginia, and Louisiana experienced decreases of 6, 6, 13, 24, 56, and 59 percent, respectively.
• From 2005 to 2015, treatment admission rates for opiates other than heroin were highest in the New England division. In 2005, the New England rate was 83 per 100,000 population aged 12 and older while the rates for the other divisions ranged from 15 per 100,000 population (Pacific) to 40 per 100,000 population (Middle Atlantic). In 2015, the New England rate was 103 per 100,000 population aged 12 and older while the rates for the other divisions ranged from 20 per 100,000 population (West South Central) to 66 per 100,000 population (East South Central).
11
Figure 2. Primary alcohol abuse admission rates, by state or jurisdiction: 2005-2015 (per 100,000 population aged 12 and older)
2005
2007
KEY YEAR: 2005
2009
1,445 or more < 274
274–492 Incomplete data
493–742
743–1,444
2011 2013 2015
NOTES: See Chapter 1.
SOURCE: Center for Behavioral Health Statistics and Quality, Substance Abuse and Mental Health Services Administration, Treatment Episode Data Set (TEDS). Data received through 11.01.16.
(range 20–1,472) (range 7–1,844) (range 38–1,738)
(range 38–1,562) (range 40–1,453) (range 34–1,242)

12
Figure 3. Primary marijuana abuse admission rates, by state or jurisdiction: 2005-2015 (per 100,000 population aged 12 and older)
KEY YEAR: 2005
NOTES: See Chapter 1.
SOURCE: Center for Behavioral Health Statistics and Quality, Substance Abuse and Mental Health Services Administration, Treatment Episode Data Set (TEDS). Data received through 11.01.16.
2005 2007 2009
280 or more < 117
117–180 Incomplete data
181–235
236–279
2011 2013 2015
(range 7–285) (range <1–288) (range 8–318)
(range 15–317) (range 20–310) (range 9–282)
13
Figure 4. Primary heroin admission rates, by state or jurisdiction: 2005-2015 (per 100,000 population aged 12 and older)
KEY YEAR: 2005
NOTES: See Chapter 1.
SOURCE: Center for Behavioral Health Statistics and Quality, Substance Abuse and Mental Health Services Administration, Treatment Episode Data Set (TEDS). Data received through 11.01.16.
2005 2007 2009
526 or more< 26
29–93 Incomplete data
94–324
325–525
2011 2013 2015
(range 0–583) (range < 1–642) (range 1–686)
(range 1–686) (range 3–859) (range 5–1,103)
14
Figure 5. Primary cocaine admission rates, by state or jurisdiction: 2005-2015 (per 100,000 population aged 12 and older)
KEY YEAR: 2005
NOTES: See Chapter 1.
SOURCE: Center for Behavioral Health Statistics and Quality, Substance Abuse and Mental Health Services Administration, Treatment Episode Data Set (TEDS). Data received through 11.01.16.
–
2005 2007 2009
271 or more< 77
77–116 Incomplete data
117–177
178–270
2011 2013 2015
(range 4–320) (range 6–304) (range 4–228)
(range 2–313) (range < 1–185) (range 1–151)

15
Figure 6. Primary methamphetamine/amphetamine admission rates, by state or jurisdiction: 2005-2015 (per 100,000 population aged 12 and older)

16
Figure 7. Primary non-heroin opiates/synthetics admission rates, by state or jurisdiction: 2005-2015 (per 100,000 population aged 12 and older)
KEY YEAR: 2005
NOTES: See Chapter 1.
SOURCE: Center for Behavioral Health Statistics and Quality, Substance Abuse and Mental Health Services Administration, Treatment Episode Data Set (TEDS). Data received through 11.01.16.
2005 2007 2009
210 or more< 27
27–40 Incomplete data
41–66
67–209
2011 2013 2015
(range < 1–216) (range 0–346) (range 1–397)
(range < 1–445) (range <1–472) (range < 1–352)
17
Chapter 2
Substance Abuse Treatment Admissions Aged 12 and Older, by Primary Substance of Abuse: 2015
This chapter presents numbers of substance abuse treatment admissions aged 12 and older and admission rates from the Treatment Episode Data Set (TEDS) by Census region, Census divi-
sion, and state or jurisdiction for admissions in 2015, according to primary substance of abuse.
As noted previously, comparisons between and across regions, divisions, and states or jurisdictions should be made with caution. There are many factors (e.g., facilities included, clients included, ability to track multi-service episodes, service type, and completeness and timeliness of reporting) that can affect comparability. See Appendix A for a full discussion.
Table 2.1b indicates the proportions of admissions in 2015 by service type according to Census region, Census division, and state or jurisdiction. A state’s mix of service types (e.g., outpatient, detoxification, rehabilitation/residential, opioid therapy) can have a significant effect on its admis- sion rates. There is higher client turnover and therefore more admissions in short-stay services such as detoxification than in long-stay services such as outpatient or long-term rehabilitation/residential treatment. Admission rates for individual substances of abuse may be affected as well (e.g., detoxification is more closely associated with alcohol, heroin, or tranquilizer use than with use of other substances).6
Table 2.2 presents the total number of treatment admissions aged 12 and older by primary substance of abuse, according to Census region, Census division, and state or jurisdiction for 2015.
Table 2.3 presents the treatment admission rates per 100,000 population aged 12 and older by primary substance of abuse, according to Census region, Census division, and state or jurisdiction for 2015.
• In 2015, the treatment admission rate was higher for primary alcohol abuse than for illicit drugs. The primary alcohol admission rate was 189 per 100,000 population (the rate for alcohol alone was 107 per 100,000 and the rate for alcohol with secondary drug abuse was 82 per 100,000). The highest rates for illicit drugs were for heroin (146 per 100,000) and marijuana (77 per 100,000).
• Treatment admission rates for 2015 were higher for primary alcohol abuse (alcohol alone and alcohol with secondary drug combined) than for illicit drugs in six of the nine Census divisions. The most common primary illicit drugs in each Census division were:
• New England—heroin, marijuana, and opiates other than heroin
• Middle Atlantic—heroin, marijuana, and opiates other than heroin
6 See: Substance Abuse and Mental Health Services Administration, Center for Behavioral Health Statistics and Quality. Treatment Episode Data Set (TEDS): 2005-2015. National Admissions to Substance Abuse Treatment Services. BHSIS Series S-95, HHS Publication No. (SMA) 17-4360. Rockville, MD: Substance Abuse and Mental Health Services Administration, 2016, Table 2.7a-b.
18
• East North Central—heroin, marijuana, and opiates other than heroin
• West North Central—methamphetamine/amphetamines, marijuana, and heroin
• South Atlantic—heroin, opiates other than heroin, and marijuana
• East South Central—opiates other than heroin, marijuana, and heroin
• West South Central—methamphetamine/amphetamines, marijuana, and heroin
• Mountain—methamphetamine/amphetamines, marijuana, and heroin
• Pacific—methamphetamine/amphetamines, heroin, and marijuana
• Treatment admission rates for 2015 were higher for primary alcohol abuse than for any of the major illicit drugs in 31 of the 47 reporting states and jurisdictions. The exceptions where an illicit drug admission rate was higher than the alcohol admission rate were: Alabama (marijuana); Arkansas, California, Hawaii, Idaho, and Oklahoma (methamphetamine/amphetamines); Con-necticut, Kentucky, Maryland, Massachusetts, New Hampshire, New Jersey, and Ohio (heroin); Delaware and Louisiana (other/none specified); and Tennessee (opiates other than heroin).
• In the 31 states and jurisdictions where admission rates for primary alcohol abuse were higher than the rate for any illicit drug, the primary illicit drugs with the highest treatment admission rates were:
• Marijuana—Indiana, Iowa, Mississippi, Missouri, North Carolina, North Dakota, South Dakota, Texas, and Virginia
• Heroin—Alaska, District of Columbia, Illinois, Maine, Michigan, New York, Puerto Rico, Rhode Island, Vermont, Washington, and Wisconsin
• Opiates other than heroin—Florida and West Virginia
• Methamphetamine/amphetamines—Arizona, Colorado, Minnesota, Montana, Nebraska, Nevada, Utah, and Wyoming
• Other/none specified—New Mexico
Table 2.4 presents the 2015 treatment admission rates by primary substance, adjusted for age, gender, and race/ethnicity to the U.S. population in 2010 by Census region, Census division, and state or jurisdiction. Adjusted rates take into account the different admission rates among popula-tion subgroups and the different proportions of the subgroups in each region, division, state, or jurisdiction. The adjusted rates are the rates that would be observed if each region, division, state, or jurisdiction had the same distribution of subgroups as the standardized U.S. population in 2010.
• Adjustment of the 2015 treatment admission rates for age, gender, and race/ethnicity did not change the relative ranking of alcohol and illicit drugs for the United States as a whole or for most of the Census divisions.
• Adjustment of the 2015 treatment admission rates for age, gender, and race/ethnicity did not change the relative ranking of alcohol and illicit drugs for most states. Of the 46 reporting states and jurisdictions (Puerto Rico is not included), 17 states’ relative ranking of alcohol and illicit drugs changed after adjusting for population composition of admissions.
19
Chapter 3
Characteristics of Substance Abuse Treatment Admissions Aged 12 and Older, by State or Jurisdiction and Primary
Substance of Abuse: 2015
This chapter presents data on the demographic characteristics of substance abuse treatment admissions aged 12 and older from the Treatment Episode Data Set (TEDS) by primary
substance of abuse for individual states and jurisdictions.
As noted previously, comparisons between and across states and jurisdictions should be made with caution. There are many factors (e.g., facilities included, clients included, ability to track multi- service episodes, services offered, and completeness and timeliness of reporting) that can affect comparability. See Appendix A for a full discussion.
Tables 3.1a–3.47a present, for each state or jurisdiction reporting admissions to TEDS for 2015, the number of admissions aged 12 and older with selected demographic characteristics (gender, age group, and race/ethnicity) by primary substance of abuse.
Tables 3.1b–3.47b present, for each state or jurisdiction reporting admissions to TEDS for 2015, the percentage distribution of demographic characteristics (gender, age group, and race/ethnicity) by primary substance of abuse for admissions aged 12 and older.
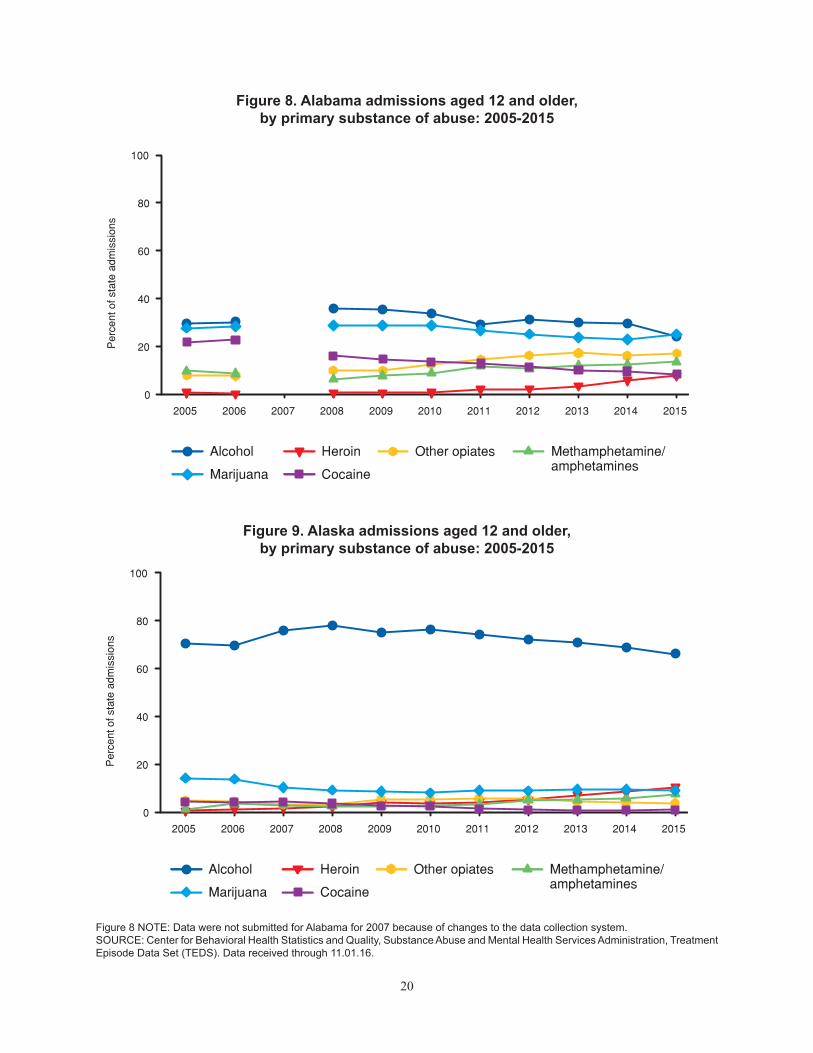
Figures 8–59 depict, for each individual state or jurisdiction, the percentage distribution of admis-sions aged 12 and older for selected primary substances for 2005 through 2015.
20
Figure 8. Alabama admissions aged 12 and older, by primary substance of abuse: 2005-2015
2005 2006 2007 2008 2009 2010 2011 2012 2013 2014 2015
Per
cent
of s
tate
adm
issi
ons
0
20
40
60
80
100
Alcohol
Marijuana
Heroin Other opiates
Cocaine
Methamphetamine/amphetamines
Figure 9. Alaska admissions aged 12 and older, by primary substance of abuse: 2005-2015
2005 2006 2007 2008 2009 2010 2011 2012 2013 2014 2015
Per
cent
of s
tate
adm
issi
ons
0
20
40
60
80
100
Alcohol
Marijuana
Heroin Other opiates
Cocaine
Methamphetamine/amphetamines
Figure 8 NOTE: Data were not submitted for Alabama for 2007 because of changes to the data collection system.SOURCE: Center for Behavioral Health Statistics and Quality, Substance Abuse and Mental Health Services Administration, Treatment Episode Data Set (TEDS). Data received through 11.01.16.

21
Figure 10. Arizona admissions aged 12 and older, by primary substance of abuse: 2005-2015
Methamphetamine/amphetamines
2005 2006 2007 2008 2009 2010 2011 2012 2013 2014 2015
Per
cent
of s
tate
adm
issi
ons
0
20
40
60
80
100
Cocaine
Other opiates Heroin
Marijuana
Alcohol
Figure 11. Arkansas admissions aged 12 and older, by primary substance of abuse: 2005-2015
SOURCE: Center for Behavioral Health Statistics and Quality, Substance Abuse and Mental Health Services Administration, Treatment Episode Data Set (TEDS). Data received through 11.01.16.

22
Figure 12. California admissions aged 12 and older, by primary substance of abuse: 2005-2015
2005 2006 2007 2008 2009 2010 2011 2012 2013 2014 2015
Per
cent
of s
tate
adm
issi
ons
0
20
40
60
80
100
Alcohol
Marijuana
Heroin Other opiates
Cocaine
Methamphetamine/amphetamines
Figure 13. Colorado admissions aged 12 and older, by primary substance of abuse: 2005-2015
2005 2006 2007 2008 2009 2010 2011 2012 2013 2014 2015
Per
cent
of s
tate
adm
issi
ons
0
20
40
60
80
100
Alcohol
Marijuana
Heroin Other opiates
Cocaine
Methamphetamine/amphetamines
SOURCE: Center for Behavioral Health Statistics and Quality, Substance Abuse and Mental Health Services Administration, Treatment Episode Data Set (TEDS). Data received through 11.01.16.

23
Figure 14. Connecticut admissions aged 12 and older, by primary substance of abuse: 2005-2015
2005 2006 2007 2008 2009 2010 2011 2012 2013 2014 2015
Per
cent
of s
tate
adm
issi
ons
0
20
40
60
80
100
Alcohol
Marijuana
Heroin Other opiates
Cocaine
Methamphetamine/amphetamines
Figure 15. Delaware admissions aged 12 and older, by primary substance of abuse: 2005-2015
2005 2006 2007 2008 2009 2010 2011 2012 2013 2014 2015
Per
cent
of s
tate
adm
issi
ons
0
20
40
60
80
100
Alcohol
Marijuana
Heroin Other opiates
Cocaine
Methamphetamine/amphetamines
SOURCE: Center for Behavioral Health Statistics and Quality, Substance Abuse and Mental Health Services Administration, Treatment Episode Data Set (TEDS). Data received through 11.01.16.

24
Figure 16. District of Columbia admissions aged 12 and older, by primary substance of abuse: 2005-2015
2005 2006 2007 2008 2009 2010 2011 2012 2013 2014 2015
Per
cent
of d
istr
ict a
dmis
sion
s
0
20
40
60
80
100
Alcohol
Marijuana
Heroin Other opiates
Cocaine
Methamphetamine/amphetamines
Figure 17. Florida admissions aged 12 and older, by primary substance of abuse: 2005-2015
2005 2006 2007 2008 2009 2010 2011 2012 2013 2014 2015
Per
cent
of s
tate
adm
issi
ons
0
20
40
60
80
100
Alcohol
Marijuana
Heroin Other opiates
Cocaine
Methamphetamine/amphetamines
Figure 16 NOTE: Data were not submitted for District of Columbia for 2005 to 2006 and 2008 to 2009 because of changes to the data collection system.SOURCE: Center for Behavioral Health Statistics and Quality, Substance Abuse and Mental Health Services Administration, Treatment Episode Data Set (TEDS). Data received through 11.01.16.

25
Figure 18. Georgia admissions aged 12 and older, by primary substance of abuse: 2005-2015
2005 2006 2007 2008 2009 2010 2011 2012 2013 2014 2015
Per
cent
of s
tate
adm
issi
ons
0
20
40
60
80
100
Alcohol
Marijuana
Heroin Other opiates
Cocaine
Methamphetamine/amphetamines
Figure 19. Hawaii admissions aged 12 and older, by primary substance of abuse: 2005-2015
2005 2006 2007 2008 2009 2010 2011 2012 2013 2014 2015
Per
cent
of s
tate
adm
issi
ons
0
20
40
60
80
100
Alcohol
Marijuana
Heroin Other opiates
Cocaine
Methamphetamine/amphetamines
Figure 18 NOTE: Data were not submitted for Georgia for 2015 because of changes to the data collection system. SOURCE: Center for Behavioral Health Statistics and Quality, Substance Abuse and Mental Health Services Administration, Treatment Episode Data Set (TEDS). Data received through 11.01.16.

26
Figure 20. Idaho admissions aged 12 and older, by primary substance of abuse: 2005-2015
2005 2006 2007 2008 2009 2010 2011 2012 2013 2014 2015
Per
cent
of s
tate
adm
issi
ons
0
20
40
60
80
100
Alcohol
Marijuana
Heroin Other opiates
Cocaine
Methamphetamine/amphetamines
Figure 21. Illinois admissions aged 12 and older, by primary substance of abuse: 2005-2015
2005 2006 2007 2008 2009 2010 2011 2012 2013 2014 2015
Per
cent
of s
tate
adm
issi
ons
0
20
40
60
80
100
Alcohol
Marijuana
Heroin Other opiates
Cocaine
Methamphetamine/amphetamines
SOURCE: Center for Behavioral Health Statistics and Quality, Substance Abuse and Mental Health Services Administration, Treatment Episode Data Set (TEDS). Data received through 11.01.16.

27
Figure 22. Indiana admissions aged 12 and older, by primary substance of abuse: 2005-2015
2005 2006 2007 2008 2009 2010 2011 2012 2013 2014 2015
Per
cent
of s
tate
adm
issi
ons
0
20
40
60
80
100
Alcohol
Marijuana
Heroin Other opiates
Cocaine
Methamphetamine/amphetamines
Figure 23. Iowa admissions aged 12 and older, by primary substance of abuse: 2005-2015
2005 2006 2007 2008 2009 2010 2011 2012 2013 2014 2015
Per
cent
of s
tate
adm
issi
ons
0
20
40
60
80
100
Alcohol
Marijuana
Heroin Other opiates
Cocaine
Methamphetamine/amphetamines
SOURCE: Center for Behavioral Health Statistics and Quality, Substance Abuse and Mental Health Services Administration, Treatment Episode Data Set (TEDS). Data received through 11.01.16.
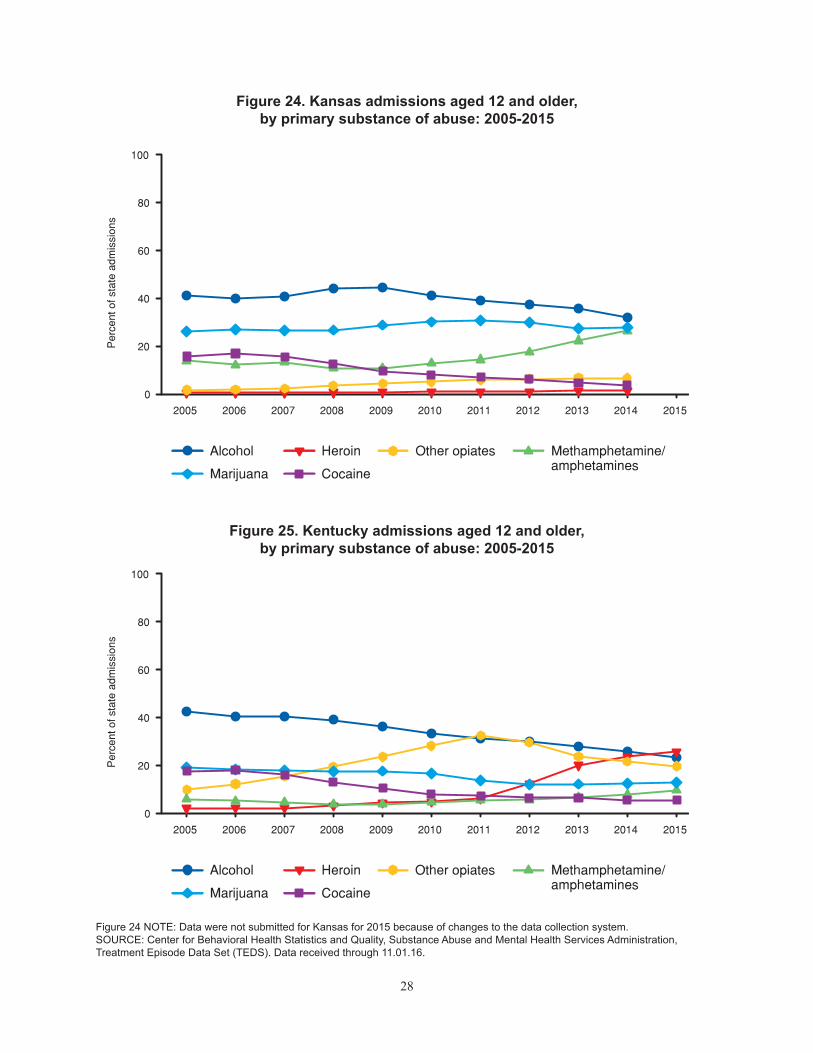
28
Figure 24. Kansas admissions aged 12 and older, by primary substance of abuse: 2005-2015
2005 2006 2007 2008 2009 2010 2011 2012 2013 2014 2015
Per
cent
of s
tate
adm
issi
ons
0
20
40
60
80
100
Alcohol
Marijuana
Heroin Other opiates
Cocaine
Methamphetamine/amphetamines
Figure 25. Kentucky admissions aged 12 and older, by primary substance of abuse: 2005-2015
2005 2006 2007 2008 2009 2010 2011 2012 2013 2014 2015
Per
cent
of s
tate
adm
issi
ons
0
20
40
60
80
100
Alcohol
Marijuana
Heroin Other opiates
Cocaine
Methamphetamine/amphetamines
Figure 24 NOTE: Data were not submitted for Kansas for 2015 because of changes to the data collection system. SOURCE: Center for Behavioral Health Statistics and Quality, Substance Abuse and Mental Health Services Administration, Treatment Episode Data Set (TEDS). Data received through 11.01.16.

29
Figure 26. Louisiana admissions aged 12 and older, by primary substance of abuse: 2005-2015
2005 2006 2007 2008 2009 2010 2011 2012 2013 2014 2015
Per
cent
of s
tate
adm
issi
ons
0
20
40
60
80
100
Alcohol
Marijuana
Heroin Other opiates
Cocaine
Methamphetamine/amphetamines
Figure 27. Maine admissions aged 12 and older, by primary substance of abuse: 2005-2015
2005 2006 2007 2008 2009 2010 2011 2012 2013 2014 2015
Per
cent
of s
tate
adm
issi
ons
0
20
40
60
80
100
Alcohol
Marijuana
Heroin Other opiates
Cocaine
Methamphetamine/amphetamines
SOURCE: Center for Behavioral Health Statistics and Quality, Substance Abuse and Mental Health Services Administration, Treatment Episode Data Set (TEDS). Data received through 11.01.16.

30
Figure 28. Maryland admissions aged 12 and older, by primary substance of abuse: 2005-2015
2005 2006 2007 2008 2009 2010 2011 2012 2013 2014 2015
Per
cent
of s
tate
adm
issi
ons
0
20
40
60
80
100
Alcohol
Marijuana
Heroin Other opiates
Cocaine
Methamphetamine/amphetamines
Figure 29. Massachusetts admissions aged 12 and older, by primary substance of abuse: 2005-2015
2005 2006 2007 2008 2009 2010 2011 2012 2013 2014 2015
Per
cent
of s
tate
adm
issi
ons
0
20
40
60
80
100
Alcohol
Marijuana
Heroin Other opiates
Cocaine
Methamphetamine/amphetamines
SOURCE: Center for Behavioral Health Statistics and Quality, Substance Abuse and Mental Health Services Administration, Treatment Episode Data Set (TEDS). Data received through 11.01.16.
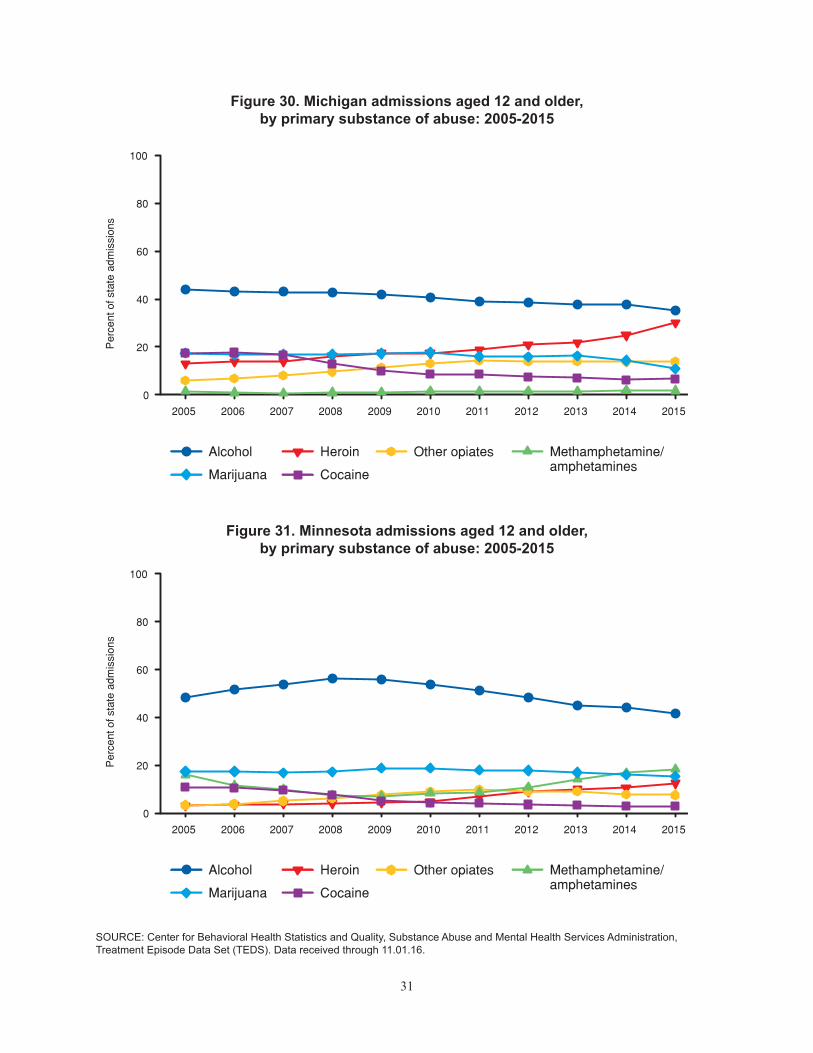
31
Figure 30. Michigan admissions aged 12 and older, by primary substance of abuse: 2005-2015
2005 2006 2007 2008 2009 2010 2011 2012 2013 2014 2015
Per
cent
of s
tate
adm
issi
ons
0
20
40
60
80
100
Alcohol
Marijuana
Heroin Other opiates
Cocaine
Methamphetamine/amphetamines
Figure 31. Minnesota admissions aged 12 and older, by primary substance of abuse: 2005-2015
2005 2006 2007 2008 2009 2010 2011 2012 2013 2014 2015
Per
cent
of s
tate
adm
issi
ons
0
20
40
60
80
100
Alcohol
Marijuana
Heroin Other opiates
Cocaine
Methamphetamine/amphetamines
SOURCE: Center for Behavioral Health Statistics and Quality, Substance Abuse and Mental Health Services Administration, Treatment Episode Data Set (TEDS). Data received through 11.01.16.
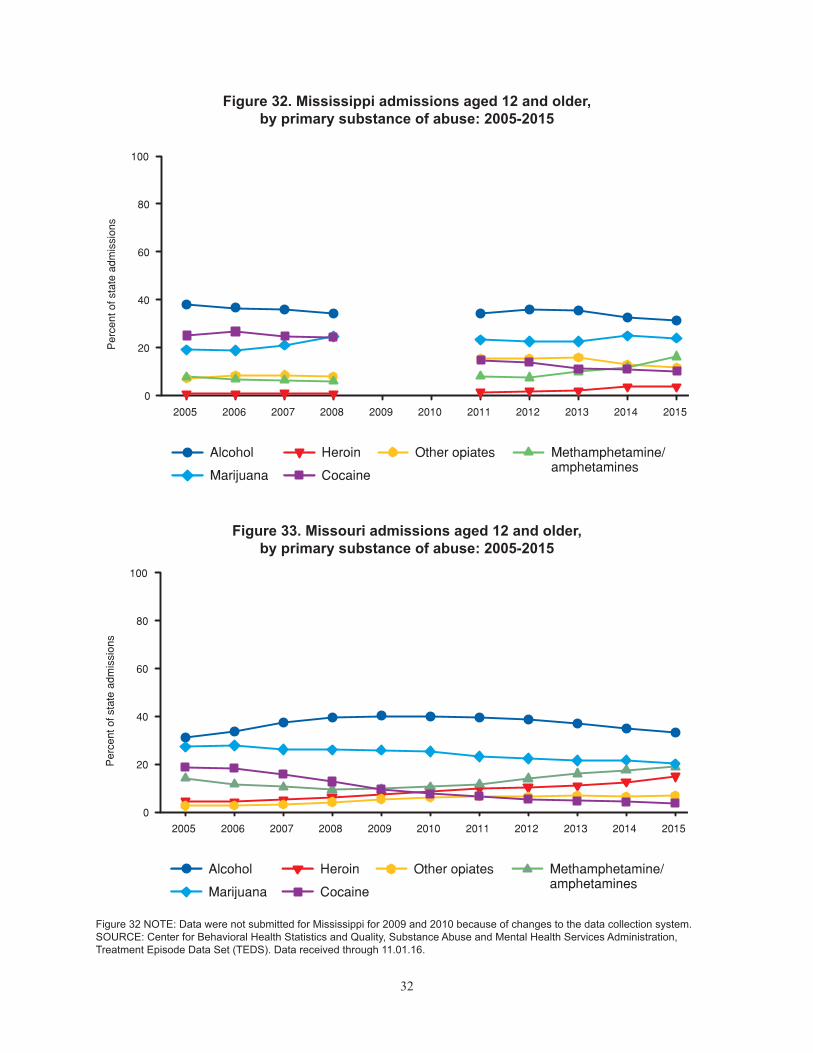
32
Figure 32. Mississippi admissions aged 12 and older, by primary substance of abuse: 2005-2015
2005 2006 2007 2008 2009 2010 2011 2012 2013 2014 2015
Per
cent
of s
tate
adm
issi
ons
0
20
40
60
80
100
Alcohol
Marijuana
Heroin Other opiates
Cocaine
Methamphetamine/amphetamines
Figure 33. Missouri admissions aged 12 and older, by primary substance of abuse: 2005-2015
2005 2006 2007 2008 2009 2010 2011 2012 2013 2014 2015
Per
cent
of s
tate
adm
issi
ons
0
20
40
60
80
100
Alcohol
Marijuana
Heroin Other opiates
Cocaine
Methamphetamine/amphetamines
Figure 32 NOTE: Data were not submitted for Mississippi for 2009 and 2010 because of changes to the data collection system.SOURCE: Center for Behavioral Health Statistics and Quality, Substance Abuse and Mental Health Services Administration, Treatment Episode Data Set (TEDS). Data received through 11.01.16.
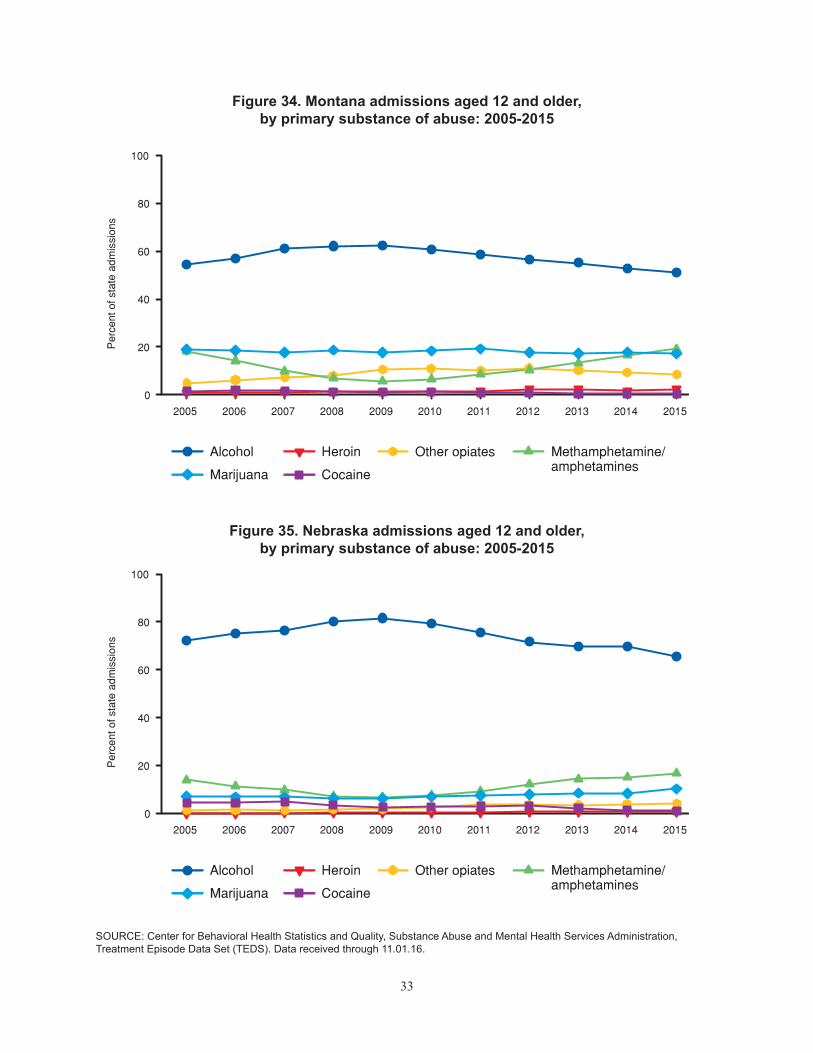
33
Figure 34. Montana admissions aged 12 and older, by primary substance of abuse: 2005-2015
2005 2006 2007 2008 2009 2010 2011 2012 2013 2014 2015
Per
cent
of s
tate
adm
issi
ons
0
20
40
60
80
100
Alcohol
Marijuana
Heroin Other opiates
Cocaine
Methamphetamine/amphetamines
Figure 35. Nebraska admissions aged 12 and older, by primary substance of abuse: 2005-2015
2005 2006 2007 2008 2009 2010 2011 2012 2013 2014 2015
Per
cent
of s
tate
adm
issi
ons
0
20
40
60
80
100
Alcohol
Marijuana
Heroin Other opiates
Cocaine
Methamphetamine/amphetamines
SOURCE: Center for Behavioral Health Statistics and Quality, Substance Abuse and Mental Health Services Administration, Treatment Episode Data Set (TEDS). Data received through 11.01.16.

34
Figure 36. Nevada admissions aged 12 and older, by primary substance of abuse: 2005-2015
2005 2006 2007 2008 2009 2010 2011 2012 2013 2014 2015
Per
cent
of s
tate
adm
issi
ons
0
20
40
60
80
100
Alcohol
Marijuana
Heroin Other opiates
Cocaine
Methamphetamine/amphetamines
Figure 37. New Hampshire admissions aged 12 and older, by primary substance of abuse: 2005-2015
2005 2006 2007 2008 2009 2010 2011 2012 2013 2014 2015
Per
cent
of s
tate
adm
issi
ons
0
20
40
60
80
100
Alcohol
Marijuana
Heroin Other opiates
Cocaine
Methamphetamine/amphetamines
SOURCE: Center for Behavioral Health Statistics and Quality, Substance Abuse and Mental Health Services Administration, Treatment Episode Data Set (TEDS). Data received through 11.01.16.

35
Figure 38. New Jersey admissions aged 12 and older, by primary substance of abuse: 2005-2015
2005 2006 2007 2008 2009 2010 2011 2012 2013 2014 2015
Per
cent
of s
tate
adm
issi
ons
0
20
40
60
80
100
Alcohol
Marijuana
Heroin Other opiates
Cocaine
Methamphetamine/amphetamines
Figure 39. New Mexico admissions aged 12 and older, by primary substance of abuse: 2005-2015
2005 2006 2007 2008 2009 2010 2011 2012 2013 2014 2015
Per
cent
of s
tate
adm
issi
ons
0
20
40
60
80
100
Alcohol
Marijuana
Heroin Other opiates
Cocaine
Methamphetamine/amphetamines
SOURCE: Center for Behavioral Health Statistics and Quality, Substance Abuse and Mental Health Services Administration, Treatment Episode Data Set (TEDS). Data received through 11.01.16.
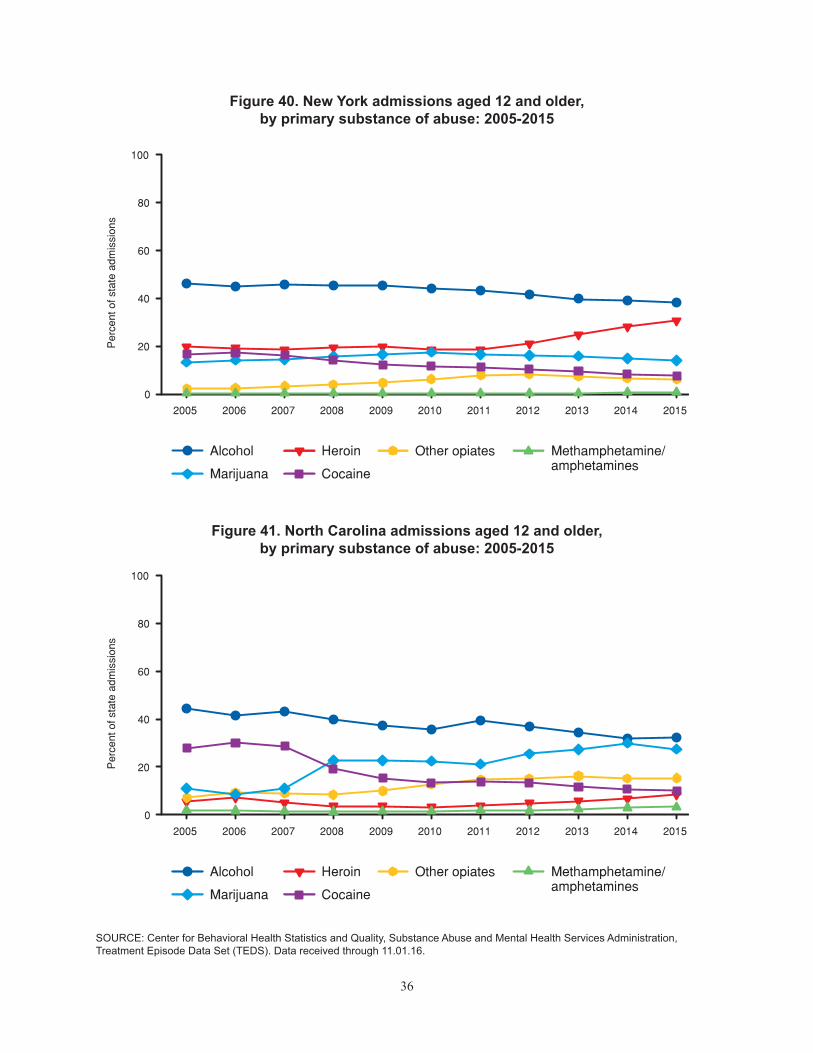
36
Figure 40. New York admissions aged 12 and older, by primary substance of abuse: 2005-2015
2005 2006 2007 2008 2009 2010 2011 2012 2013 2014 2015
Per
cent
of s
tate
adm
issi
ons
0
20
40
60
80
100
Alcohol
Marijuana
Heroin Other opiates
Cocaine
Methamphetamine/amphetamines
Figure 41. North Carolina admissions aged 12 and older, by primary substance of abuse: 2005-2015
2005 2006 2007 2008 2009 2010 2011 2012 2013 2014 2015
Per
cent
of s
tate
adm
issi
ons
0
20
40
60
80
100
Alcohol
Marijuana
Heroin Other opiates
Cocaine
Methamphetamine/amphetamines
SOURCE: Center for Behavioral Health Statistics and Quality, Substance Abuse and Mental Health Services Administration, Treatment Episode Data Set (TEDS). Data received through 11.01.16.

37
Figure 42. North Dakota admissions aged 12 and older, by primary substance of abuse: 2005-2015
2005 2006 2007 2008 2009 2010 2011 2012 2013 2014 2015
Per
cent
of s
tate
adm
issi
ons
0
20
40
60
80
100
Alcohol
Marijuana
Heroin Other opiates
Cocaine
Methamphetamine/amphetamines
Figure 43. Ohio admissions aged 12 and older, by primary substance of abuse: 2005-2015
2005 2006 2007 2008 2009 2010 2011 2012 2013 2014 2015
Per
cent
of s
tate
adm
issi
ons
0
20
40
60
80
100
Alcohol
Marijuana
Heroin Other opiates
Cocaine
Methamphetamine/amphetamines
SOURCE: Center for Behavioral Health Statistics and Quality, Substance Abuse and Mental Health Services Administration, Treatment Episode Data Set (TEDS). Data received through 11.01.16.
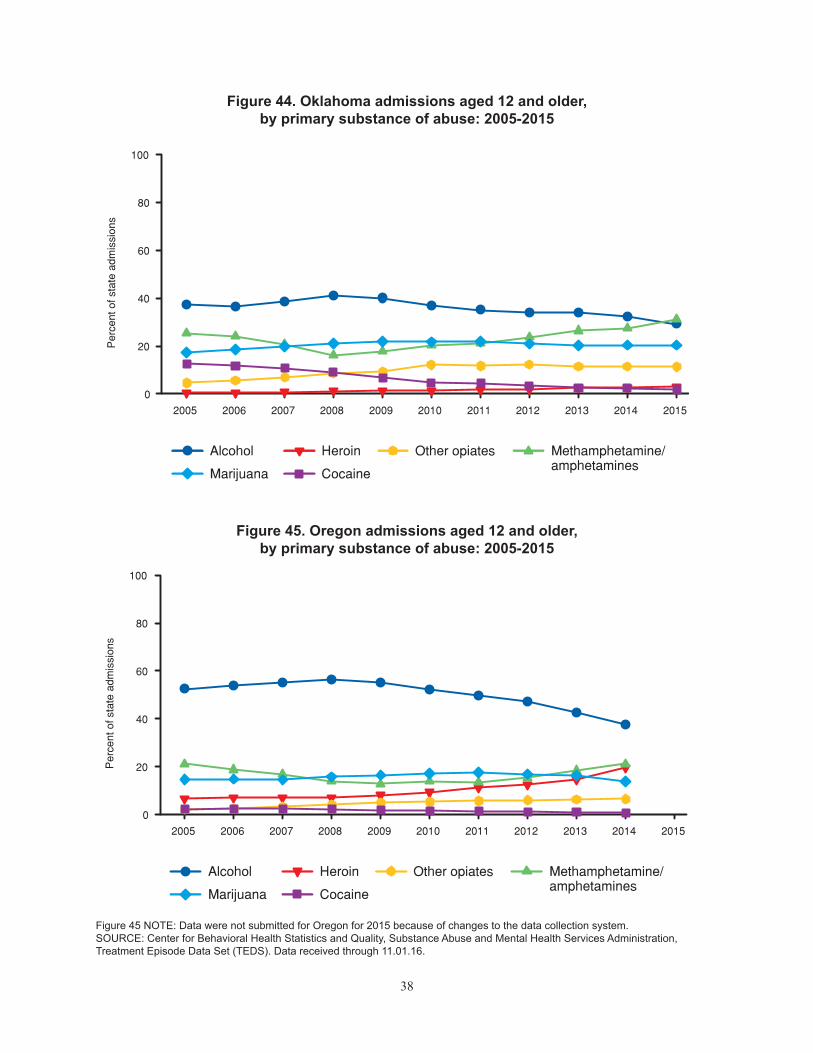
38
Figure 44. Oklahoma admissions aged 12 and older, by primary substance of abuse: 2005-2015
2005 2006 2007 2008 2009 2010 2011 2012 2013 2014 2015
Per
cent
of s
tate
adm
issi
ons
0
20
40
60
80
100
Alcohol
Marijuana
Heroin Other opiates
Cocaine
Methamphetamine/amphetamines
Figure 45. Oregon admissions aged 12 and older, by primary substance of abuse: 2005-2015
2005 2006 2007 2008 2009 2010 2011 2012 2013 2014 2015
Per
cent
of s
tate
adm
issi
ons
0
20
40
60
80
100
Alcohol
Marijuana
Heroin Other opiates
Cocaine
Methamphetamine/amphetamines
Figure 45 NOTE: Data were not submitted for Oregon for 2015 because of changes to the data collection system. SOURCE: Center for Behavioral Health Statistics and Quality, Substance Abuse and Mental Health Services Administration, Treatment Episode Data Set (TEDS). Data received through 11.01.16.
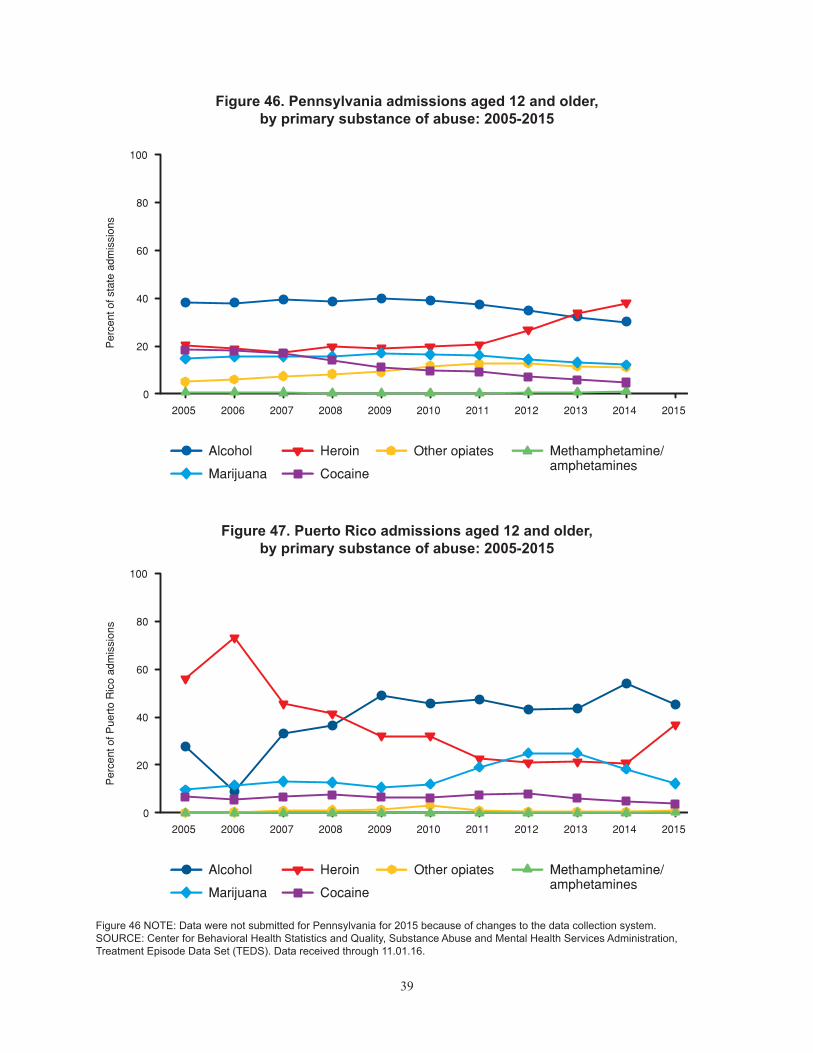
39
Figure 46. Pennsylvania admissions aged 12 and older, by primary substance of abuse: 2005-2015
2005 2006 2007 2008 2009 2010 2011 2012 2013 2014 2015
Per
cent
of s
tate
adm
issi
ons
0
20
40
60
80
100
Alcohol
Marijuana
Heroin Other opiates
Cocaine
Methamphetamine/amphetamines
Figure 47. Puerto Rico admissions aged 12 and older, by primary substance of abuse: 2005-2015
2005 2006 2007 2008 2009 2010 2011 2012 2013 2014 2015
Per
cent
of P
uert
o R
ico
adm
issi
ons
0
20
40
60
80
100
Alcohol
Marijuana
Heroin Other opiates
Cocaine
Methamphetamine/amphetamines
Figure 46 NOTE: Data were not submitted for Pennsylvania for 2015 because of changes to the data collection system. SOURCE: Center for Behavioral Health Statistics and Quality, Substance Abuse and Mental Health Services Administration, Treatment Episode Data Set (TEDS). Data received through 11.01.16.
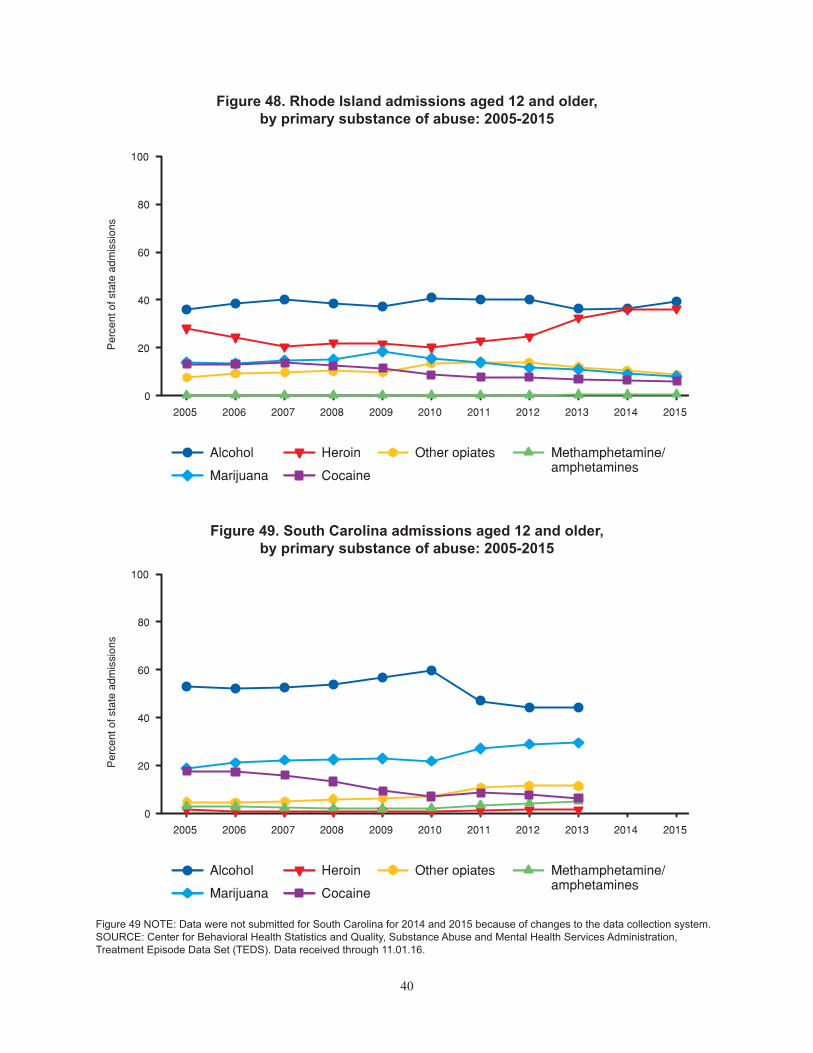
40
Figure 48. Rhode Island admissions aged 12 and older, by primary substance of abuse: 2005-2015
2005 2006 2007 2008 2009 2010 2011 2012 2013 2014 2015
Per
cent
of s
tate
adm
issi
ons
0
20
40
60
80
100
Alcohol
Marijuana
Heroin Other opiates
Cocaine
Methamphetamine/amphetamines
Figure 49. South Carolina admissions aged 12 and older, by primary substance of abuse: 2005-2015
2005 2006 2007 2008 2009 2010 2011 2012 2013 2014 2015
Per
cent
of s
tate
adm
issi
ons
0
20
40
60
80
100
Alcohol
Marijuana
Heroin Other opiates
Cocaine
Methamphetamine/amphetamines
Figure 49 NOTE: Data were not submitted for South Carolina for 2014 and 2015 because of changes to the data collection system.SOURCE: Center for Behavioral Health Statistics and Quality, Substance Abuse and Mental Health Services Administration, Treatment Episode Data Set (TEDS). Data received through 11.01.16.

41
Figure 50. South Dakota admissions aged 12 and older, by primary substance of abuse: 2005-2015
2005 2006 2007 2008 2009 2010 2011 2012 2013 2014 2015
Per
cent
of s
tate
adm
issi
ons
0
20
40
60
80
100
Alcohol
Marijuana
Heroin Other opiates
Cocaine
Methamphetamine/amphetamines
Figure 51. Tennessee admissions aged 12 and older, by primary substance of abuse: 2005-2015
2005 2006 2007 2008 2009 2010 2011 2012 2013 2014 2015
Per
cent
of s
tate
adm
issi
ons
0
20
40
60
80
100
Alcohol
Marijuana
Heroin Other opiates
Cocaine
Methamphetamine/amphetamines
Figure 51 NOTE: Tennessee began disaggregating heroin admissions from other opiates in July 2009. In this figure, all Tennessee’s 2009 heroin admissions are included in the other opiates category since there is less than a full year of disaggregated heroin data.SOURCE: Center for Behavioral Health Statistics and Quality, Substance Abuse and Mental Health Services Administration, Treatment Episode Data Set (TEDS). Data received through 11.01.16.

42
Figure 52. Texas admissions aged 12 and older, by primary substance of abuse: 2005-2015
2005 2006 2007 2008 2009 2010 2011 2012 2013 2014 2015
Per
cent
of s
tate
adm
issi
ons
0
20
40
60
80
100
Alcohol
Marijuana
Heroin Other opiates
Cocaine
Methamphetamine/amphetamines
Figure 53. Utah admissions aged 12 and older, by primary substance of abuse: 2005-2015
2005 2006 2007 2008 2009 2010 2011 2012 2013 2014 2015
Per
cent
of s
tate
adm
issi
ons
0
20
40
60
80
100
Alcohol
Marijuana
Heroin Other opiates
Cocaine
Methamphetamine/amphetamines
SOURCE: Center for Behavioral Health Statistics and Quality, Substance Abuse and Mental Health Services Administration, Treatment Episode Data Set (TEDS). Data received through 11.01.16.

43
Figure 54. Vermont admissions aged 12 and older, by primary substance of abuse: 2005-2015
2005 2006 2007 2008 2009 2010 2011 2012 2013 2014 2015
Per
cent
of s
tate
adm
issi
ons
0
20
40
60
80
100
Alcohol
Marijuana
Heroin Other opiates
Cocaine
Methamphetamine/amphetamines
Figure 55. Virginia admissions aged 12 and older, by primary substance of abuse: 2005-2015
2005 2006 2007 2008 2009 2010 2011 2012 2013 2014 2015
Per
cent
of s
tate
adm
issi
ons
0
20
40
60
80
100
Alcohol
Marijuana
Heroin Other opiates
Cocaine
Methamphetamine/amphetamines
SOURCE: Center for Behavioral Health Statistics and Quality, Substance Abuse and Mental Health Services Administration, Treatment Episode Data Set (TEDS). Data received through 11.01.16.

44
Figure 56. Washington admissions aged 12 and older, by primary substance of abuse: 2005-2015
2005 2006 2007 2008 2009 2010 2011 2012 2013 2014 2015
Per
cent
of s
tate
adm
issi
ons
0
20
40
60
80
100
Alcohol
Marijuana
Heroin Other opiates
Cocaine
Methamphetamine/amphetamines
Figure 57. West Virginia admissions aged 12 and older, by primary substance of abuse: 2005-2015
2005 2006 2007 2008 2009 2010 2011 2012 2013 2014 2015
Per
cent
of s
tate
adm
issi
ons
0
20
40
60
80
100
Alcohol
Marijuana
Heroin Other opiates
Cocaine
Methamphetamine/amphetamines
SOURCE: Center for Behavioral Health Statistics and Quality, Substance Abuse and Mental Health Services Administration, Treatment Episode Data Set (TEDS). Data received through 11.01.16.
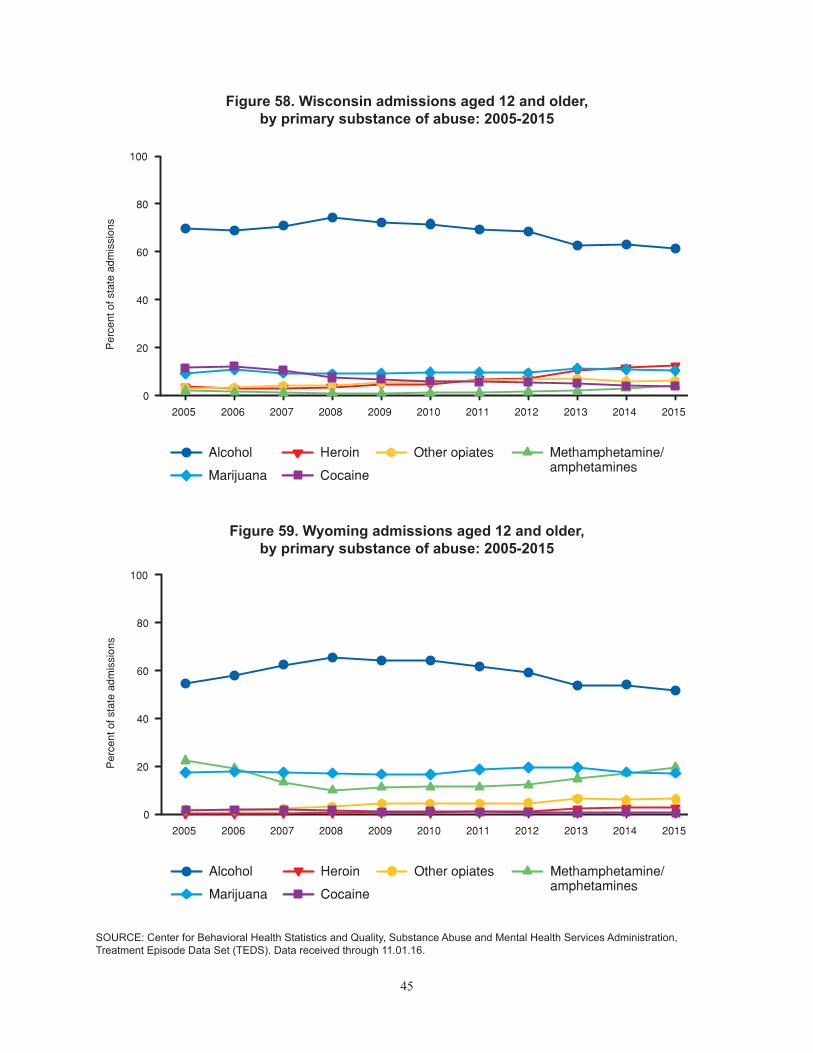
45
Figure 58. Wisconsin admissions aged 12 and older, by primary substance of abuse: 2005-2015
2005 2006 2007 2008 2009 2010 2011 2012 2013 2014 2015
Per
cent
of s
tate
adm
issi
ons
0
20
40
60
80
100
Alcohol
Marijuana
Heroin Other opiates
Cocaine
Methamphetamine/amphetamines
Figure 59. Wyoming admissions aged 12 and older, by primary substance of abuse: 2005-2015
2005 2006 2007 2008 2009 2010 2011 2012 2013 2014 2015
Per
cent
of s
tate
adm
issi
ons
0
20
40
60
80
100
Alcohol
Marijuana
Heroin Other opiates
Cocaine
Methamphetamine/amphetamines
SOURCE: Center for Behavioral Health Statistics and Quality, Substance Abuse and Mental Health Services Administration, Treatment Episode Data Set (TEDS). Data received through 11.01.16.

46

47
Tables

2005 2006 2007 2008 2009 2010 2011 2012 2013 2014 2015Total 1,896,299 1,962,666 1,969,869 2,074,988 2,055,918 1,932,533 1,936,298 1,834,624 1,762,106 1,639,519 1,537,025
Census region1
Northeast 592,273 618,642 618,356 636,822 623,560 625,369 620,778 604,902 618,418 590,380 545,929Midwest 437,992 466,396 478,651 489,371 498,757 451,233 413,416 385,827 360,395 338,685 303,945South 431,904 423,287 409,965 476,838 483,043 426,257 483,372 422,239 378,417 319,800 341,304West 431,774 452,352 459,159 468,634 448,074 427,790 416,120 418,499 401,719 386,528 343,504
Census divisionNew England 144,731 179,876 177,555 177,653 175,628 180,388 190,719 191,666 198,829 200,021 195,966Middle Atlantic 447,542 438,766 440,801 459,169 447,932 444,981 430,059 413,236 419,589 390,359 349,963East North Central 274,120 298,648 305,189 313,373 310,933 275,769 252,113 218,512 194,479 180,884 152,471West North Central 163,872 167,748 173,462 175,998 187,824 175,464 161,303 167,315 165,916 157,801 151,474
South Atlantic 270,834 264,672 268,046 309,473 313,939 274,892 340,125 289,489 253,651 199,960 217,422East South Central 62,701 63,181 41,443 50,819 53,273 55,582 49,187 46,023 47,484 46,861 49,814West South Central 98,369 95,434 100,476 116,546 115,831 95,783 94,060 86,727 77,282 72,979 74,068Mountain 159,287 161,856 157,359 161,774 162,644 157,408 153,699 163,583 156,722 152,849 145,723Pacific 272,487 290,496 301,800 306,860 285,430 270,382 262,421 254,916 244,997 233,679 197,781
State or jurisdictionAlabama 19,812 19,903 ‡ 15,063 21,604 21,736 8,078 9,519 10,225 9,539 11,074Alaska 1,323 1,673 3,976 5,493 6,049 6,952 6,955 6,172 6,390 6,350 6,496Arizona 30,624 26,940 21,160 20,971 19,217 28,740 23,290 24,163 21,623 22,835 20,865Arkansas 13,727 13,664 15,010 28,512 24,603 14,158 12,180 12,535 11,836 8,744 11,753California 181,152 195,649 199,912 199,993 178,953 166,587 159,775 160,250 156,935 158,831 150,071
Colorado 76,894 78,455 79,404 85,833 88,276 79,196 77,818 87,908 86,472 89,855 87,689Connecticut 47,116 46,451 44,757 47,177 46,067 51,951 62,315 61,993 64,040 67,129 67,706Delaware 8,197 8,169 8,424 7,935 7,784 6,702 6,917 7,483 6,447 7,766 7,900District of Columbia ‡ ‡ 1,938 ‡ ‡ 3,297 7,595 5,753 5,225 5,426 6,053Florida 47,343 50,544 52,668 80,987 80,234 61,126 104,100 64,389 50,219 33,114 30,104
Georgia 44,860 44,934 42,309 40,500 42,066 42,302 43,707 44,560 44,402 45,108 ‡ Hawaii 6,778 6,498 6,969 7,373 7,275 6,613 6,839 6,848 6,741 6,361 6,371Idaho 6,356 7,955 6,245 6,491 7,189 4,257 4,816 6,522 5,538 2,789 2,684Illinois 78,546 85,141 71,067 76,433 71,537 73,280 59,477 36,846 33,696 28,163 20,587Indiana 38,036 39,608 35,777 34,899 30,985 24,369 24,330 24,646 25,687 25,682 21,362
Iowa 28,404 28,453 26,927 26,262 30,751 33,271 27,643 28,181 29,521 28,461 28,578Kansas 15,798 13,037 15,033 16,790 19,127 14,979 13,845 13,367 10,869 6,405 ‡ Kentucky 22,705 24,677 24,076 22,148 21,474 22,142 20,601 16,566 17,171 18,016 19,001Louisiana 24,935 22,276 24,427 25,289 28,084 26,170 25,171 18,795 12,947 10,415 10,515Maine 13,980 14,573 16,136 15,853 14,856 13,072 14,634 14,475 14,766 13,823 12,046
Table 1.1. Admissions aged 12 and older, by Census region, Census division, and state or jurisdiction: Number, 2005-2015
Census region, Census division, and state or jurisdiction
Number of admissions aged 12 and older
Continued. See notes at end of table.
48

2005 2006 2007 2008 2009 2010 2011 2012 2013 2014 2015Maryland 72,572 67,421 67,419 65,793 63,236 42,889 65,905 62,467 51,394 41,086 107,509Massachusetts 57,771 92,606 91,490 88,433 90,313 90,624 88,915 91,217 94,020 92,789 91,164Michigan 57,311 66,915 66,944 65,449 64,563 61,322 58,077 55,359 54,726 61,080 55,180Minnesota 45,106 47,505 49,537 49,861 51,991 51,015 51,603 52,879 53,223 53,459 55,346Mississippi 8,464 7,414 7,072 3,702 ‡ ‡ 7,115 6,452 5,625 4,406 4,823
Missouri 43,642 45,374 47,255 49,243 52,503 43,314 34,201 38,073 38,215 37,817 36,131Montana 8,170 7,921 9,684 7,475 7,370 7,752 9,001 8,794 7,568 6,135 5,908Nebraska 15,170 14,942 16,509 16,252 16,001 15,727 17,994 17,611 17,750 16,159 16,463Nevada 10,017 9,999 9,847 9,371 9,901 8,708 9,135 9,238 8,688 8,005 6,630New Hampshire 5,146 6,020 5,647 6,224 6,355 6,321 5,470 4,274 4,635 4,154 3,580
New Jersey 55,514 56,181 60,854 66,181 70,361 71,441 73,251 76,078 88,892 64,370 68,628New Mexico 9,077 12,470 11,967 11,515 10,070 7,985 9,837 8,557 7,623 6,014 4,445New York 314,233 308,265 308,604 314,589 313,639 311,436 304,859 294,587 285,728 283,785 281,335North Carolina 24,278 17,879 23,339 38,391 53,620 60,253 62,004 55,638 52,679 38,934 39,917North Dakota 2,303 2,636 2,427 2,520 2,439 2,510 1,790 2,653 2,743 3,344 2,900
Ohio 74,668 75,425 101,581 107,487 114,719 87,446 82,508 71,847 55,013 47,026 39,046Oklahoma 16,683 15,644 16,461 16,974 16,928 13,944 13,493 13,155 12,823 14,335 14,430Oregon 47,620 49,364 52,870 54,273 53,288 52,073 52,002 47,358 41,324 26,905 ‡ Pennsylvania 77,795 74,320 71,343 78,399 63,932 62,104 51,949 42,571 44,969 42,204 ‡ Puerto Rico 2,356 1,989 3,738 3,323 2,484 1,884 2,612 3,157 3,157 4,126 2,343
Rhode Island 12,342 11,899 11,372 11,429 10,885 10,409 11,145 10,861 11,575 10,969 11,152South Carolina 27,089 25,960 26,329 27,184 27,875 27,800 19,207 19,928 16,032 ‡ ‡ South Dakota 13,449 15,801 15,774 15,070 15,012 14,648 14,227 14,551 13,595 12,156 12,056Tennessee 11,720 11,187 10,295 9,906 10,195 11,704 13,393 13,486 14,463 14,900 14,916Texas 43,024 43,850 44,578 45,771 46,216 41,511 43,216 42,242 39,676 39,485 37,370
Utah 12,270 13,561 14,242 14,519 14,790 15,062 14,202 13,220 13,775 11,801 11,939Vermont 8,376 8,327 8,153 8,537 7,152 8,011 8,240 8,846 9,793 11,157 10,318Virginia 36,647 34,955 31,488 33,751 30,023 26,689 27,684 27,740 25,033 24,944 22,910Washington 35,614 37,312 38,073 39,728 39,865 38,157 36,850 34,288 33,607 35,232 34,843West Virginia 9,848 14,810 14,132 14,932 9,101 3,834 3,006 1,531 2,220 3,582 3,029
Wisconsin 25,559 31,559 29,820 29,105 29,129 29,352 27,721 29,814 25,357 18,933 16,296Wyoming 5,879 4,555 4,810 5,599 5,831 5,708 5,600 5,181 5,435 5,415 5,563
Number of admissions aged 12 and olderCensus region, Census division, and state or jurisdiction
Table 1.1. Admissions aged 12 and older, by Census region, Census division, and state or jurisdiction: Number, 2005-2015 (continued)
‡ No data, or less than a full calendar year of data, submitted.
SOURCE: Center for Behavioral Health Statistics and Quality, Substance Abuse and Mental Health Services Administration, Treatment Episode Data Set (TEDS). Data received through 11.01.16.
NOTE: Based on administrative data reported to TEDS by all reporting states and jurisdictions. Comparisons among states should be made with caution.
1 Admissions reported for Census regions and divisions will not sum to the total number of admissions because Puerto Rico is not included in any Census region or division.
49

2005 2006 2007 2008 2009 2010 2011 2012 2013 2014 2015 Total 756 775 770 804 790 733 728 683 650 600 557
Census regionNortheast 1,277 1,328 1,322 1,355 1,321 1,318 1,301 1,261 1,283 1,220 1,125Midwest 793 840 858 874 887 800 730 678 630 590 527South 482 466 445 511 512 442 495 427 379 316 333West 767 792 794 799 755 710 682 678 643 611 535
Census divisionNew England 1,193 1,476 1,450 1,442 1,417 1,448 1,521 1,520 1,567 1,568 1,530Middle Atlantic 1,307 1,276 1,276 1,324 1,286 1,272 1,222 1,169 1,182 1,096 980East North Central 710 770 784 802 794 704 641 554 491 455 383West North Central 987 1,003 1,030 1,038 1,101 1,019 931 959 944 892 851South Atlantic 572 550 550 627 630 541 661 555 481 375 402East South Central 424 423 274 334 347 357 314 292 300 294 311West South Central 357 343 355 405 396 319 309 281 246 229 229Mountain 952 942 896 905 896 861 830 870 822 789 740Pacific 689 728 749 753 693 644 618 593 564 532 445
State or jurisdictionAlabama 519 515 ‡ 383 546 537 199 233 249 231 268Alaska 240 300 706 966 1,052 1,183 1,168 1,022 1,048 1,041 1,063Arizona 624 530 406 394 355 540 432 441 389 404 363Arkansas 591 580 632 1,190 1,020 578 494 506 476 350 468California 613 657 666 659 584 533 505 501 485 485 454Colorado 1,978 1,979 1,967 2,087 2,110 1,877 1,815 2,016 1,947 1,987 1,898Connecticut 1,603 1,573 1,511 1,583 1,536 1,697 2,024 2,006 2,065 2,161 2,178Delaware 1,158 1,135 1,154 1,073 1,043 877 895 957 816 970 974District of Columbia ‡ ‡ 380 ‡ ‡ 615 1,387 1,031 919 943 1,035Florida 312 327 338 515 507 376 631 385 296 192 171Georgia 599 585 540 509 521 525 536 539 532 534 ‡ Hawaii 631 600 643 675 663 570 584 579 563 527 523Idaho 545 664 510 521 570 333 372 498 417 207 196Illinois 744 802 666 712 663 679 549 339 309 258 188Indiana 729 753 675 654 577 449 445 449 465 462 383Iowa 1,140 1,137 1,071 1,040 1,213 1,296 1,070 1,086 1,131 1,084 1,083Kansas 692 568 651 721 816 632 581 557 451 265 ‡ Kentucky 644 694 671 613 590 604 558 447 461 482 506Louisiana 667 628 669 682 751 689 657 487 333 267 268Maine 1,233 1,280 1,413 1,384 1,297 1,133 1,265 1,248 1,271 1,187 1,034
Admissions per 100,000 population aged 12 and olderCensus region, Census division, and state or jurisdiction
Table 1.2. Admissions aged 12 and older, by Census region, Census division, and state or jurisdiction: Admissions per 100,000 population, 2005-2015
Continued. See notes at end of table.50

2005 2006 2007 2008 2009 2010 2011 2012 2013 2014 2015 Maryland 1,547 1,428 1,420 1,379 1,316 874 1,329 1,248 1,018 808 2,103Massachusetts 1,049 1,675 1,643 1,576 1,596 1,603 1,559 1,586 1,619 1,585 1,546Michigan 676 787 788 773 764 732 691 657 647 720 649Minnesota 1,052 1,098 1,136 1,134 1,175 1,144 1,148 1,168 1,165 1,162 1,195Mississippi 353 309 293 152 ‡ ‡ 287 259 225 176 192Missouri 894 920 950 982 1,042 857 674 747 746 735 699Montana 1,026 982 1,186 906 887 919 1,059 1,026 875 703 670Nebraska 1,040 1,019 1,121 1,097 1,074 1,035 1,176 1,142 1,142 1,031 1,043Nevada 504 486 466 435 455 385 401 399 369 334 271New Hampshire 464 537 500 548 557 556 479 372 402 358 307New Jersey 766 773 835 904 956 957 975 1,007 1,171 844 896New Mexico 571 773 733 699 606 465 568 491 436 343 253New York 1,918 1,875 1,868 1,897 1,884 1,876 1,823 1,752 1,691 1,673 1,654North Carolina 334 241 308 497 685 750 763 676 632 462 468North Dakota 424 484 445 460 442 437 308 446 449 537 456Ohio 772 778 1,044 1,103 1,175 895 843 732 559 476 394Oklahoma 565 524 547 560 553 445 428 413 399 443 442Oregon 1,554 1,584 1,671 1,692 1,642 1,594 1,577 1,421 1,229 790 ‡ Pennsylvania 732 696 665 728 591 569 474 387 408 382 ‡ Puerto Rico 75 63 118 105 79 60 83 101 102 135 78Rhode Island 1,355 1,309 1,254 1,261 1,200 1,143 1,224 1,190 1,265 1,195 1,212South Carolina 756 710 707 717 726 710 486 498 396 ‡ ‡ South Dakota 2,059 2,393 2,366 2,241 2,213 2,158 2,075 2,095 1,934 1,714 1,690Tennessee 232 218 198 189 192 218 247 247 262 268 266Texas 232 231 231 233 231 201 206 197 182 178 165Utah 625 669 684 682 681 696 645 589 602 507 502Vermont 1,564 1,547 1,510 1,578 1,319 1,471 1,508 1,616 1,784 2,031 1,877Virginia 576 543 484 514 452 393 403 399 356 352 321Washington 675 695 699 718 710 670 639 587 569 588 572West Virginia 634 952 906 956 581 240 188 95 139 224 190Wisconsin 545 669 628 610 608 610 573 613 519 386 331Wyoming 1,374 1,052 1,093 1,254 1,283 1,208 1,178 1,071 1,111 1,105 1,132
Table 1.2. Admissions aged 12 and older, by Census region, Census division, and state or jurisdiction: Admissions per 100,000 population, 2005-2015 (continued)
SOURCES: CBHSQ, SAMHSA, TEDS. Data received through 11.01.16. Population: U.S. Census Bureau, SC-EST2010-agesex-res, SC-EST2015-agesex-res, and SC-EST2015-ALLDATA6-ALL: Annual Estimates of the Resident Population by Single-Year of Age, Sex, Race and Hispanic origin for the U.S. and States: April 1, 2005 to July 1, 2015; SC-EST2015-agesex-res: Annual Estimates of the Resident Population by Single Year of Age and Sex for the U.S. and States: April 1, 2005 to July 1, 2015; PRC-EST2010-AGESEX-RES and PRC-EST2015-AGESEX-RES: Annual Estimates of the Resident Population by Single-Year of Age and Sex for Puerto Rico: April 1, 2005 to July 1, 2015; PEP_2015_PEPSYASEX: Annual Estimates of the Resident Population by Single Year of Age and Sex for Puerto Rico Commonwealth: April 1, 2005 to July 1, 2015.
Census region, Census division, and state or jurisdiction
Admissions per 100,000 population aged 12 and older
‡ No data, or less than a full calendar year of data, submitted.NOTE: Based on administrative data reported to TEDS by all reporting states and jurisdictions. Comparisons among states should be made with caution.
51

2005 2006 2007 2008 2009 2010 2011 2012 2013 2014 2015 Total 733 757 753 784 764 737 737 695 665 613 569
Census regionNortheast 1,352 1,400 1,393 1,425 1,394 1,394 1,377 1,337 1,357 1,292 1,198Midwest 761 823 816 816 795 800 730 673 627 587 527South 431 423 409 473 477 420 474 411 368 310 322West 792 824 828 844 802 769 743 748 708 650 570
Census divisionNew England 1,405 1,695 1,604 1,577 1,545 1,573 1,657 1,651 1,688 1,684 1,651Middle Atlantic 1,329 1,298 1,302 1,355 1,322 1,314 1,265 1,215 1,229 1,144 1,029East North Central 654 731 710 706 662 691 629 540 481 447 379West North Central 1,022 1,029 1,062 1,068 1,100 1,020 930 959 943 891 845
South Atlantic 509 496 501 581 587 510 631 530 463 363 377East South Central 338 351 234 275 312 350 311 292 304 301 321West South Central 332 322 337 390 384 317 309 280 250 237 241Mountain 939 956 882 890 883 862 840 884 837 755 714Pacific 741 782 811 830 773 739 711 692 657 612 505
State or jurisdictionAlabama 386 422 ‡ 287 415 410 131 182 194 173 201Alaska 110 168 409 523 558 621 608 538 540 534 541Arizona 630 539 424 406 355 567 458 476 418 423 382Arkansas 524 517 565 1,075 913 526 455 463 443 328 447California 664 716 729 734 660 619 590 597 580 580 544
Colorado 1,949 1,940 1,950 2,054 2,095 1,934 1,899 2,079 2,017 1,873 1,796Connecticut 1,796 1,759 1,645 1,688 1,640 1,828 2,178 2,161 2,212 2,308 2,326Delaware 1,045 1,047 1,079 1,016 997 843 878 955 825 985 971District of Columbia ‡ ‡ 210 ‡ ‡ 249 564 400 358 367 409Florida 336 354 367 569 568 437 740 461 360 237 213
Georgia 477 460 443 418 433 450 455 464 464 475 ‡ Hawaii 613 591 649 671 641 706 713 679 634 578 582Idaho 531 643 484 514 571 322 376 498 420 207 211Illinois 690 746 626 680 630 658 534 333 305 256 189Indiana 557 730 669 663 586 434 430 438 451 450 390
Iowa 1,344 1,349 1,298 1,254 1,470 1,503 1,258 1,245 1,286 1,246 1,234Kansas 746 623 712 771 876 674 619 595 482 287 ‡ Kentucky 586 618 595 541 525 536 492 393 415 433 472Louisiana 556 526 560 572 626 583 563 408 294 235 237Maine 1,435 1,421 1,676 1,539 1,510 1,317 1,654 1,570 1,643 1,386 1,176
Table 1.3. Admissions aged 12 and older, adjusted for age, gender, and race/ethnicity, by Census region, Census division, and state or jurisdiction: Admissions per 100,000 population, 2005-2015
Continued. See notes at end of table.
Census region, Census division, and state or jurisdiction
Admissions per 100,000 population aged 12 and older, adjusted for age, gender, and race/ethnicity 1
52

2005 2006 2007 2008 2009 2010 2011 2012 2013 2014 2015Maryland 1,303 1,228 1,237 1,212 1,164 802 1,239 1,176 968 773 1,884Massachusetts 1,200 1,821 1,754 1,659 1,659 1,656 1,600 1,626 1,661 1,618 1,593Michigan 626 731 742 736 726 700 663 634 619 702 641Minnesota 1,153 1,195 1,198 1,199 1,245 1,173 1,176 1,209 1,216 1,211 1,245Mississippi 297 267 253 126 ‡ ‡ 254 232 205 155 174
Missouri 850 871 893 928 978 804 632 703 704 697 666Montana 1,009 992 1,207 865 835 939 1,100 1,040 867 687 648Nebraska 1,157 1,124 1,236 1,185 788 1,093 1,264 1,221 1,218 1,073 1,097Nevada 506 504 478 453 484 411 438 439 412 376 308New Hampshire 475 584 530 563 581 585 466 380 397 369 321
New Jersey 759 784 855 937 998 1,036 1,068 1,114 1,296 939 1,005New Mexico 454 597 613 594 434 286 379 370 330 246 166New York 1,848 1,811 1,814 1,851 1,845 1,862 1,817 1,759 1,708 1,699 1,691North Carolina 274 200 255 411 572 645 666 592 556 410 416North Dakota 333 426 409 415 451 395 268 366 380 432 366
Ohio 719 719 863 758 664 863 816 704 538 451 371Oklahoma 521 479 510 526 527 424 408 391 378 415 417Oregon 1,744 1,795 1,883 1,898 1,855 1,821 1,762 1,598 1,357 828 ‡ Pennsylvania 787 727 678 745 604 573 477 396 414 383 ‡ Rhode Island 1,269 1,329 1,294 1,310 1,249 1,146 1,221 1,184 1,243 1,152 1,185
South Carolina 635 603 605 623 649 645 435 451 362 ‡ ‡ South Dakota 2,019 2,365 2,279 2,018 1,940 1,844 1,683 1,661 1,470 1,296 1,271Tennessee 181 177 170 159 215 301 315 308 331 340 343Texas 210 210 212 212 213 191 199 194 183 187 177Utah 970 2,185 846 819 817 863 765 677 707 573 540
Vermont 1,736 1,797 1,664 1,768 1,489 2,020 1,789 1,814 2,060 2,318 2,101Virginia 515 489 441 467 419 366 380 363 327 329 302Washington 711 737 750 776 773 727 684 635 612 629 607West Virginia 756 1,191 1,095 1,059 638 215 110 86 139 234 202Wisconsin 591 716 661 626 642 652 627 677 585 415 352
Wyoming 1,443 1,159 1,210 1,430 1,474 1,333 1,213 1,027 1,060 1,072 1,138
1 Adjusted for age, gender, and race/ethnicity to the 2010 U.S. resident population.‡ No data, or less than a full calendar year of data, submitted.
SOURCES: Center for Behavioral Health Statistics and Quality, Substance Abuse and Mental Health Services Administration, Treatment Episode Data Set (TEDS). Data received through 11.01.16. Population: U.S. Census Bureau, SC-EST2000-ALLDATA6-ALL through SC-EST2015-ALLDATA6-ALL: Annual State Resident Population Estimates for 6 Race Groups (5 Race Alone Groups and Two or More Races) by Age, Sex, and Hispanic Origin: April 1, 2000 to July 1, 2015.
Census region, Census division, and state or jurisdiction
Admissions per 100,000 population aged 12 and older, adjusted for age, gender, and race/ethnicity 1
Table 1.3. Admissions aged 12 and older, adjusted for age, gender, and race/ethnicity, by Census region, Census division, and state or jurisdiction: Admissions per 100,000 population 2005-2015 (continued)
NOTE: Based on administrative data reported to TEDS by all reporting states and jurisdictions (excl. Puerto Rico). Comparisons among states should be made with caution.
53

2005 2006 2007 2008 2009 2010 2011 2012 2013 2014 2015Total 746,544 781,349 804,581 860,742 856,180 782,764 759,017 709,891 654,808 591,404 521,089
Census region1
Northeast 244,723 255,690 259,682 265,402 257,952 255,204 244,998 229,338 220,611 205,403 190,474Midwest 191,976 207,805 217,837 227,506 230,369 203,985 181,532 168,618 152,099 138,591 120,216South 149,243 146,257 145,837 170,298 171,037 144,860 159,780 140,818 124,160 101,244 81,855West 159,961 171,425 180,022 196,362 195,636 177,874 171,524 169,832 156,660 144,097 127,509
Census divisionNew England 54,817 71,678 71,587 70,643 68,206 70,557 72,025 70,197 67,557 66,631 65,926Middle Atlantic 189,906 184,012 188,095 194,759 189,746 184,647 172,973 159,141 153,054 138,772 124,548East North Central 115,909 125,058 129,631 132,601 129,567 111,851 98,272 86,459 74,147 66,815 53,995West North Central 76,067 82,747 88,206 94,905 100,802 92,134 83,260 82,159 77,952 71,776 66,221
South Atlantic 98,605 96,566 100,986 114,400 114,208 96,390 116,034 101,261 88,093 67,515 49,522East South Central 23,131 23,016 15,530 18,104 18,719 18,480 15,086 14,179 13,788 13,197 12,815West South Central 27,507 26,675 29,321 37,794 38,110 29,990 28,660 25,378 22,279 20,532 19,518Mountain 84,711 87,870 88,887 96,798 99,596 89,487 88,521 93,193 88,366 85,292 78,523Pacific 75,250 83,555 91,135 99,564 96,040 88,387 83,003 76,639 68,294 58,805 48,986
State or jurisdictionAlabama 5,862 5,994 ‡ 5,211 7,539 7,288 2,366 2,966 3,045 2,833 2,676Alaska 792 1,044 2,853 4,151 4,419 5,148 5,025 4,374 4,433 4,310 4,241Arizona 6,206 5,761 4,863 6,178 6,276 9,935 8,629 8,289 6,947 7,051 6,315Arkansas 4,304 4,664 5,845 11,318 10,109 5,468 4,724 4,554 3,863 3,062 3,318California 33,073 38,766 41,028 45,031 42,028 38,107 35,718 35,703 32,562 31,148 31,750
Colorado 57,236 58,107 58,784 64,960 67,493 57,426 56,490 62,698 60,899 61,469 57,385Connecticut 14,705 14,803 15,409 17,093 16,970 19,905 24,050 24,685 23,129 23,250 23,223Delaware 2,123 1,973 2,230 1,960 1,926 1,513 1,496 1,468 1,074 1,038 750District of Columbia ‡ ‡ 37 ‡ ‡ 743 2,213 1,955 1,808 2,056 2,340Florida 13,479 13,816 15,035 23,435 22,552 14,387 28,566 19,966 16,960 12,400 11,053
Georgia 15,813 15,928 17,087 16,984 17,977 17,980 18,856 19,213 18,794 18,009 ‡ Hawaii 1,964 2,014 2,341 2,811 2,574 2,119 2,248 2,058 1,889 1,626 1,538Idaho 2,360 2,878 1,822 2,414 2,884 1,332 1,605 2,252 1,976 949 858Illinois 25,786 26,798 22,727 24,091 23,275 24,086 18,408 11,849 10,918 9,068 6,362Indiana 17,818 18,109 16,691 16,037 13,995 9,906 9,849 9,987 9,819 8,988 7,208
Iowa 13,107 13,645 13,848 14,415 16,476 16,447 13,077 12,527 12,598 12,270 11,592Kansas 6,499 5,223 6,117 7,415 8,489 6,162 5,409 4,965 3,862 2,046 ‡ Kentucky 9,433 9,790 9,451 8,571 7,732 7,399 6,382 4,985 4,751 4,599 4,435Louisiana 7,137 6,321 6,581 7,633 8,667 7,727 7,002 4,107 3,132 2,298 1,697Maine 7,735 7,579 8,125 7,419 6,839 6,013 6,175 5,466 5,395 5,106 4,342
Census region, Census division, and state or jurisdiction
Table 1.4a. Primary alcohol admissions aged 12 and older, by Census region, Census division, and state or jurisdiction: Number, 2005-2015
Number of admissions aged 12 and older
Continued. See notes at end of table.
54
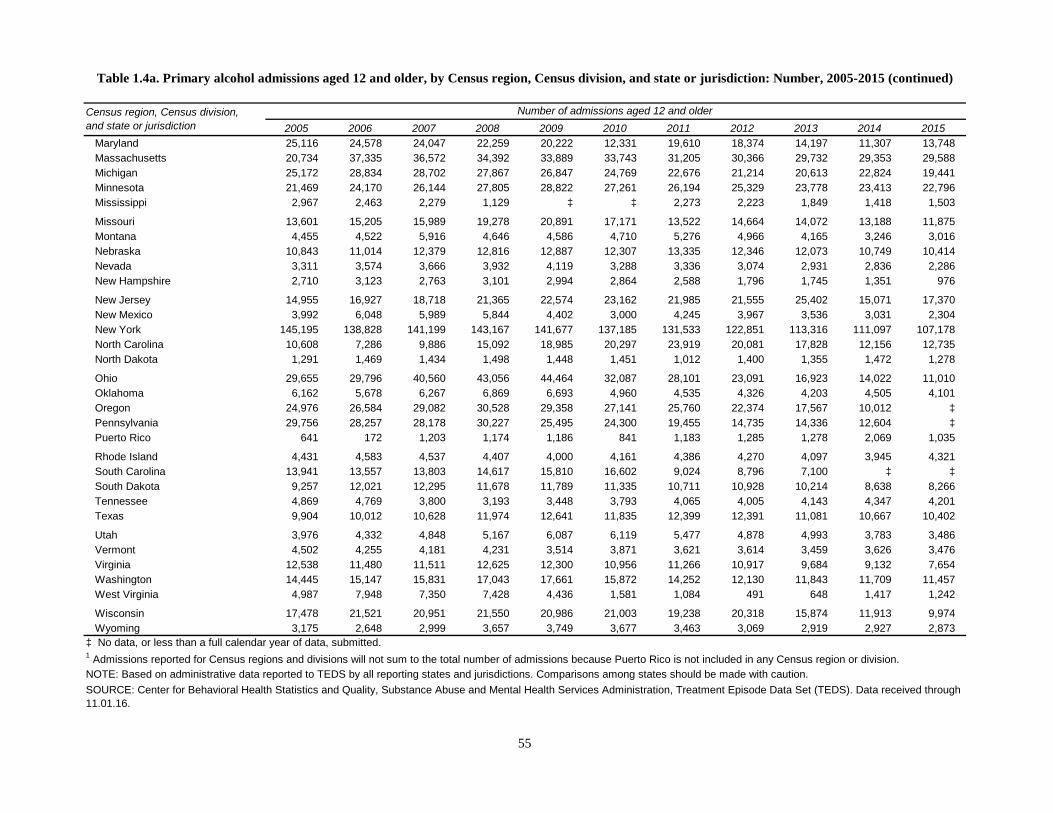
2005 2006 2007 2008 2009 2010 2011 2012 2013 2014 2015Maryland 25,116 24,578 24,047 22,259 20,222 12,331 19,610 18,374 14,197 11,307 13,748Massachusetts 20,734 37,335 36,572 34,392 33,889 33,743 31,205 30,366 29,732 29,353 29,588Michigan 25,172 28,834 28,702 27,867 26,847 24,769 22,676 21,214 20,613 22,824 19,441Minnesota 21,469 24,170 26,144 27,805 28,822 27,261 26,194 25,329 23,778 23,413 22,796Mississippi 2,967 2,463 2,279 1,129 ‡ ‡ 2,273 2,223 1,849 1,418 1,503
Missouri 13,601 15,205 15,989 19,278 20,891 17,171 13,522 14,664 14,072 13,188 11,875Montana 4,455 4,522 5,916 4,646 4,586 4,710 5,276 4,966 4,165 3,246 3,016Nebraska 10,843 11,014 12,379 12,816 12,887 12,307 13,335 12,346 12,073 10,749 10,414Nevada 3,311 3,574 3,666 3,932 4,119 3,288 3,336 3,074 2,931 2,836 2,286New Hampshire 2,710 3,123 2,763 3,101 2,994 2,864 2,588 1,796 1,745 1,351 976
New Jersey 14,955 16,927 18,718 21,365 22,574 23,162 21,985 21,555 25,402 15,071 17,370New Mexico 3,992 6,048 5,989 5,844 4,402 3,000 4,245 3,967 3,536 3,031 2,304New York 145,195 138,828 141,199 143,167 141,677 137,185 131,533 122,851 113,316 111,097 107,178North Carolina 10,608 7,286 9,886 15,092 18,985 20,297 23,919 20,081 17,828 12,156 12,735North Dakota 1,291 1,469 1,434 1,498 1,448 1,451 1,012 1,400 1,355 1,472 1,278
Ohio 29,655 29,796 40,560 43,056 44,464 32,087 28,101 23,091 16,923 14,022 11,010Oklahoma 6,162 5,678 6,267 6,869 6,693 4,960 4,535 4,326 4,203 4,505 4,101Oregon 24,976 26,584 29,082 30,528 29,358 27,141 25,760 22,374 17,567 10,012 ‡ Pennsylvania 29,756 28,257 28,178 30,227 25,495 24,300 19,455 14,735 14,336 12,604 ‡ Puerto Rico 641 172 1,203 1,174 1,186 841 1,183 1,285 1,278 2,069 1,035
Rhode Island 4,431 4,583 4,537 4,407 4,000 4,161 4,386 4,270 4,097 3,945 4,321South Carolina 13,941 13,557 13,803 14,617 15,810 16,602 9,024 8,796 7,100 ‡ ‡ South Dakota 9,257 12,021 12,295 11,678 11,789 11,335 10,711 10,928 10,214 8,638 8,266Tennessee 4,869 4,769 3,800 3,193 3,448 3,793 4,065 4,005 4,143 4,347 4,201Texas 9,904 10,012 10,628 11,974 12,641 11,835 12,399 12,391 11,081 10,667 10,402
Utah 3,976 4,332 4,848 5,167 6,087 6,119 5,477 4,878 4,993 3,783 3,486Vermont 4,502 4,255 4,181 4,231 3,514 3,871 3,621 3,614 3,459 3,626 3,476Virginia 12,538 11,480 11,511 12,625 12,300 10,956 11,266 10,917 9,684 9,132 7,654Washington 14,445 15,147 15,831 17,043 17,661 15,872 14,252 12,130 11,843 11,709 11,457West Virginia 4,987 7,948 7,350 7,428 4,436 1,581 1,084 491 648 1,417 1,242
Wisconsin 17,478 21,521 20,951 21,550 20,986 21,003 19,238 20,318 15,874 11,913 9,974Wyoming 3,175 2,648 2,999 3,657 3,749 3,677 3,463 3,069 2,919 2,927 2,873
SOURCE: Center for Behavioral Health Statistics and Quality, Substance Abuse and Mental Health Services Administration, Treatment Episode Data Set (TEDS). Data received through 11.01.16.
Census region, Census division, and state or jurisdiction
Number of admissions aged 12 and older
Table 1.4a. Primary alcohol admissions aged 12 and older, by Census region, Census division, and state or jurisdiction: Number, 2005-2015 (continued)
‡ No data, or less than a full calendar year of data, submitted.
NOTE: Based on administrative data reported to TEDS by all reporting states and jurisdictions. Comparisons among states should be made with caution.
1 Admissions reported for Census regions and divisions will not sum to the total number of admissions because Puerto Rico is not included in any Census region or division.
55
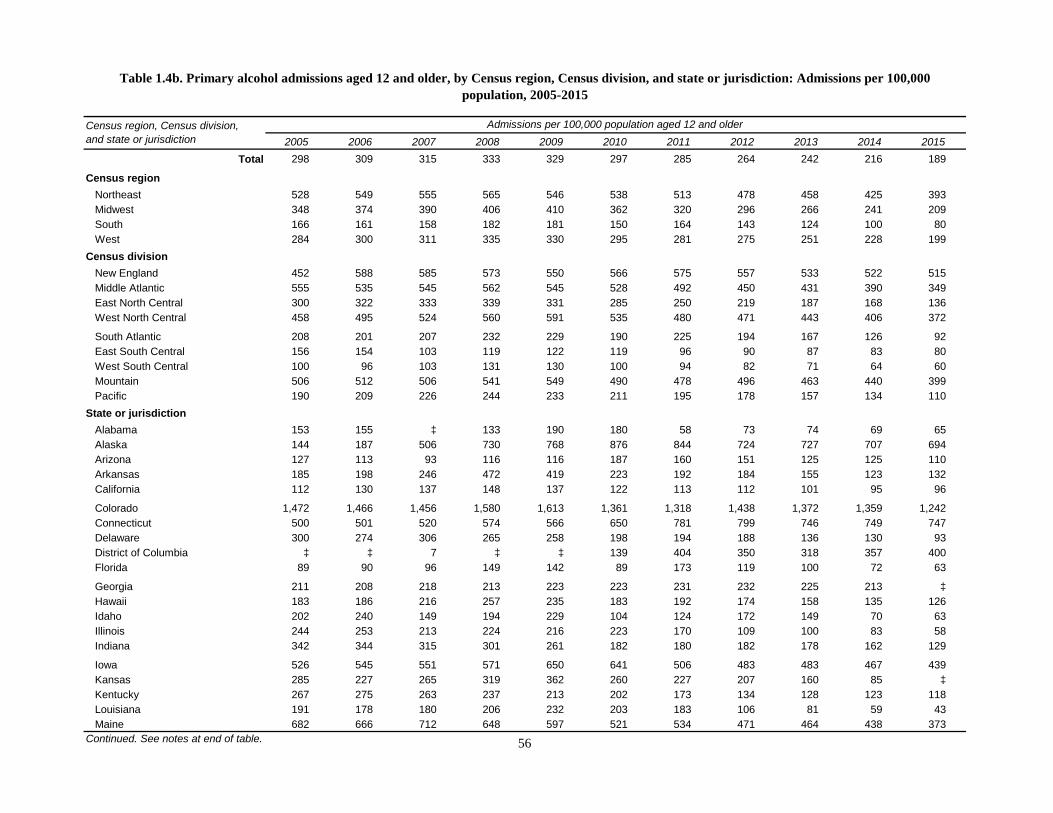
2005 2006 2007 2008 2009 2010 2011 2012 2013 2014 2015Total 298 309 315 333 329 297 285 264 242 216 189
Census regionNortheast 528 549 555 565 546 538 513 478 458 425 393Midwest 348 374 390 406 410 362 320 296 266 241 209South 166 161 158 182 181 150 164 143 124 100 80West 284 300 311 335 330 295 281 275 251 228 199
Census divisionNew England 452 588 585 573 550 566 575 557 533 522 515Middle Atlantic 555 535 545 562 545 528 492 450 431 390 349East North Central 300 322 333 339 331 285 250 219 187 168 136West North Central 458 495 524 560 591 535 480 471 443 406 372
South Atlantic 208 201 207 232 229 190 225 194 167 126 92East South Central 156 154 103 119 122 119 96 90 87 83 80West South Central 100 96 103 131 130 100 94 82 71 64 60Mountain 506 512 506 541 549 490 478 496 463 440 399Pacific 190 209 226 244 233 211 195 178 157 134 110
State or jurisdictionAlabama 153 155 ‡ 133 190 180 58 73 74 69 65Alaska 144 187 506 730 768 876 844 724 727 707 694Arizona 127 113 93 116 116 187 160 151 125 125 110Arkansas 185 198 246 472 419 223 192 184 155 123 132California 112 130 137 148 137 122 113 112 101 95 96
Colorado 1,472 1,466 1,456 1,580 1,613 1,361 1,318 1,438 1,372 1,359 1,242Connecticut 500 501 520 574 566 650 781 799 746 749 747Delaware 300 274 306 265 258 198 194 188 136 130 93District of Columbia ‡ ‡ 7 ‡ ‡ 139 404 350 318 357 400Florida 89 90 96 149 142 89 173 119 100 72 63
Georgia 211 208 218 213 223 223 231 232 225 213 ‡ Hawaii 183 186 216 257 235 183 192 174 158 135 126Idaho 202 240 149 194 229 104 124 172 149 70 63Illinois 244 253 213 224 216 223 170 109 100 83 58Indiana 342 344 315 301 261 182 180 182 178 162 129
Iowa 526 545 551 571 650 641 506 483 483 467 439Kansas 285 227 265 319 362 260 227 207 160 85 ‡ Kentucky 267 275 263 237 213 202 173 134 128 123 118Louisiana 191 178 180 206 232 203 183 106 81 59 43Maine 682 666 712 648 597 521 534 471 464 438 373
Census region, Census division, and state or jurisdiction
Admissions per 100,000 population aged 12 and older
Continued. See notes at end of table.
Table 1.4b. Primary alcohol admissions aged 12 and older, by Census region, Census division, and state or jurisdiction: Admissions per 100,000 population, 2005-2015
56
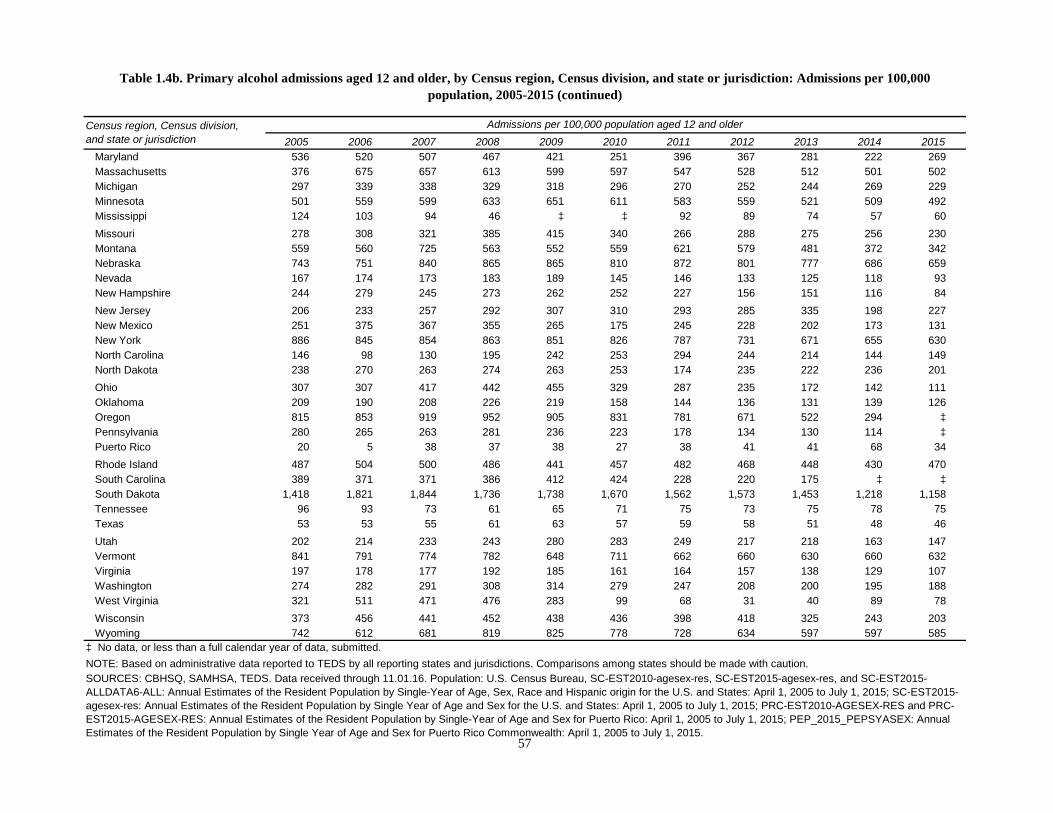
2005 2006 2007 2008 2009 2010 2011 2012 2013 2014 2015Maryland 536 520 507 467 421 251 396 367 281 222 269Massachusetts 376 675 657 613 599 597 547 528 512 501 502Michigan 297 339 338 329 318 296 270 252 244 269 229Minnesota 501 559 599 633 651 611 583 559 521 509 492Mississippi 124 103 94 46 ‡ ‡ 92 89 74 57 60Missouri 278 308 321 385 415 340 266 288 275 256 230Montana 559 560 725 563 552 559 621 579 481 372 342Nebraska 743 751 840 865 865 810 872 801 777 686 659Nevada 167 174 173 183 189 145 146 133 125 118 93New Hampshire 244 279 245 273 262 252 227 156 151 116 84New Jersey 206 233 257 292 307 310 293 285 335 198 227New Mexico 251 375 367 355 265 175 245 228 202 173 131New York 886 845 854 863 851 826 787 731 671 655 630North Carolina 146 98 130 195 242 253 294 244 214 144 149North Dakota 238 270 263 274 263 253 174 235 222 236 201Ohio 307 307 417 442 455 329 287 235 172 142 111Oklahoma 209 190 208 226 219 158 144 136 131 139 126Oregon 815 853 919 952 905 831 781 671 522 294 ‡ Pennsylvania 280 265 263 281 236 223 178 134 130 114 ‡ Puerto Rico 20 5 38 37 38 27 38 41 41 68 34Rhode Island 487 504 500 486 441 457 482 468 448 430 470South Carolina 389 371 371 386 412 424 228 220 175 ‡ ‡ South Dakota 1,418 1,821 1,844 1,736 1,738 1,670 1,562 1,573 1,453 1,218 1,158Tennessee 96 93 73 61 65 71 75 73 75 78 75Texas 53 53 55 61 63 57 59 58 51 48 46Utah 202 214 233 243 280 283 249 217 218 163 147Vermont 841 791 774 782 648 711 662 660 630 660 632Virginia 197 178 177 192 185 161 164 157 138 129 107Washington 274 282 291 308 314 279 247 208 200 195 188West Virginia 321 511 471 476 283 99 68 31 40 89 78Wisconsin 373 456 441 452 438 436 398 418 325 243 203Wyoming 742 612 681 819 825 778 728 634 597 597 585
SOURCES: CBHSQ, SAMHSA, TEDS. Data received through 11.01.16. Population: U.S. Census Bureau, SC-EST2010-agesex-res, SC-EST2015-agesex-res, and SC-EST2015-ALLDATA6-ALL: Annual Estimates of the Resident Population by Single-Year of Age, Sex, Race and Hispanic origin for the U.S. and States: April 1, 2005 to July 1, 2015; SC-EST2015-agesex-res: Annual Estimates of the Resident Population by Single Year of Age and Sex for the U.S. and States: April 1, 2005 to July 1, 2015; PRC-EST2010-AGESEX-RES and PRC-EST2015-AGESEX-RES: Annual Estimates of the Resident Population by Single-Year of Age and Sex for Puerto Rico: April 1, 2005 to July 1, 2015; PEP_2015_PEPSYASEX: Annual Estimates of the Resident Population by Single Year of Age and Sex for Puerto Rico Commonwealth: April 1, 2005 to July 1, 2015.
‡ No data, or less than a full calendar year of data, submitted.NOTE: Based on administrative data reported to TEDS by all reporting states and jurisdictions. Comparisons among states should be made with caution.
Admissions per 100,000 population aged 12 and older
Table 1.4b. Primary alcohol admissions aged 12 and older, by Census region, Census division, and state or jurisdiction: Admissions per 100,000 population, 2005-2015 (continued)
Census region, Census division, and state or jurisdiction
57
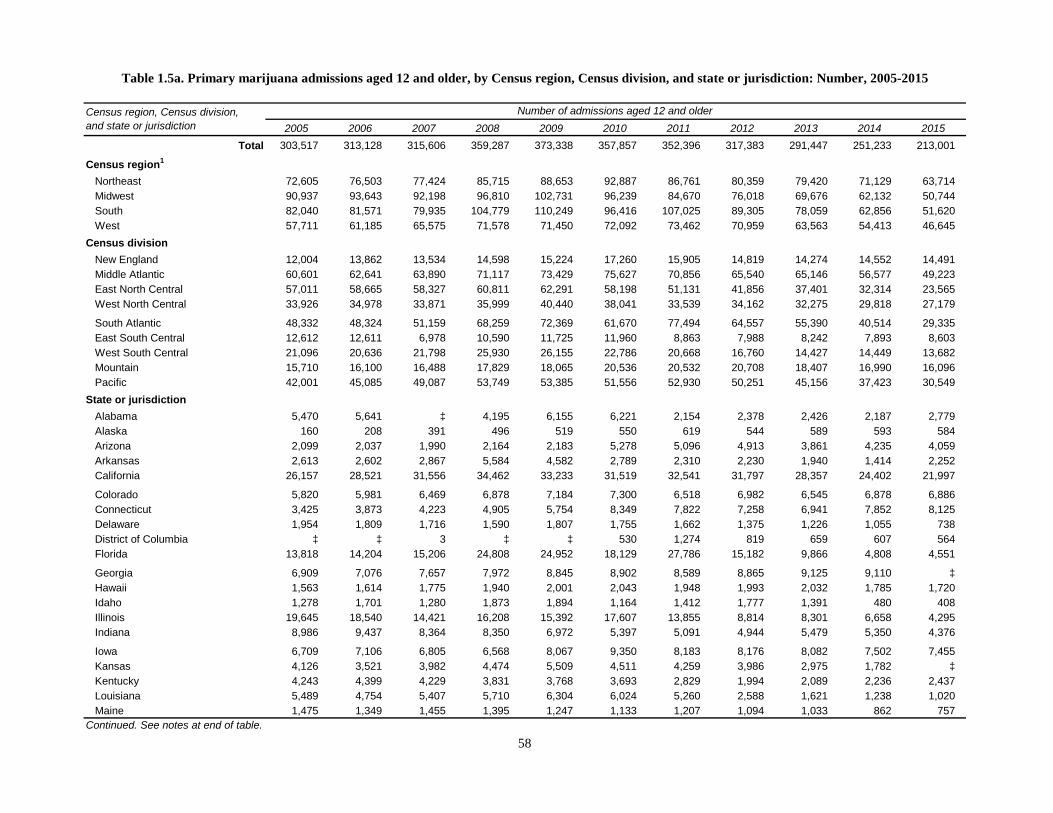
2005 2006 2007 2008 2009 2010 2011 2012 2013 2014 2015Total 303,517 313,128 315,606 359,287 373,338 357,857 352,396 317,383 291,447 251,233 213,001
Census region1
Northeast 72,605 76,503 77,424 85,715 88,653 92,887 86,761 80,359 79,420 71,129 63,714Midwest 90,937 93,643 92,198 96,810 102,731 96,239 84,670 76,018 69,676 62,132 50,744South 82,040 81,571 79,935 104,779 110,249 96,416 107,025 89,305 78,059 62,856 51,620West 57,711 61,185 65,575 71,578 71,450 72,092 73,462 70,959 63,563 54,413 46,645
Census divisionNew England 12,004 13,862 13,534 14,598 15,224 17,260 15,905 14,819 14,274 14,552 14,491Middle Atlantic 60,601 62,641 63,890 71,117 73,429 75,627 70,856 65,540 65,146 56,577 49,223East North Central 57,011 58,665 58,327 60,811 62,291 58,198 51,131 41,856 37,401 32,314 23,565West North Central 33,926 34,978 33,871 35,999 40,440 38,041 33,539 34,162 32,275 29,818 27,179
South Atlantic 48,332 48,324 51,159 68,259 72,369 61,670 77,494 64,557 55,390 40,514 29,335East South Central 12,612 12,611 6,978 10,590 11,725 11,960 8,863 7,988 8,242 7,893 8,603West South Central 21,096 20,636 21,798 25,930 26,155 22,786 20,668 16,760 14,427 14,449 13,682Mountain 15,710 16,100 16,488 17,829 18,065 20,536 20,532 20,708 18,407 16,990 16,096Pacific 42,001 45,085 49,087 53,749 53,385 51,556 52,930 50,251 45,156 37,423 30,549
State or jurisdictionAlabama 5,470 5,641 ‡ 4,195 6,155 6,221 2,154 2,378 2,426 2,187 2,779Alaska 160 208 391 496 519 550 619 544 589 593 584Arizona 2,099 2,037 1,990 2,164 2,183 5,278 5,096 4,913 3,861 4,235 4,059Arkansas 2,613 2,602 2,867 5,584 4,582 2,789 2,310 2,230 1,940 1,414 2,252California 26,157 28,521 31,556 34,462 33,233 31,519 32,541 31,797 28,357 24,402 21,997
Colorado 5,820 5,981 6,469 6,878 7,184 7,300 6,518 6,982 6,545 6,878 6,886Connecticut 3,425 3,873 4,223 4,905 5,754 8,349 7,822 7,258 6,941 7,852 8,125Delaware 1,954 1,809 1,716 1,590 1,807 1,755 1,662 1,375 1,226 1,055 738District of Columbia ‡ ‡ 3 ‡ ‡ 530 1,274 819 659 607 564Florida 13,818 14,204 15,206 24,808 24,952 18,129 27,786 15,182 9,866 4,808 4,551
Georgia 6,909 7,076 7,657 7,972 8,845 8,902 8,589 8,865 9,125 9,110 ‡ Hawaii 1,563 1,614 1,775 1,940 2,001 2,043 1,948 1,993 2,032 1,785 1,720Idaho 1,278 1,701 1,280 1,873 1,894 1,164 1,412 1,777 1,391 480 408Illinois 19,645 18,540 14,421 16,208 15,392 17,607 13,855 8,814 8,301 6,658 4,295Indiana 8,986 9,437 8,364 8,350 6,972 5,397 5,091 4,944 5,479 5,350 4,376
Iowa 6,709 7,106 6,805 6,568 8,067 9,350 8,183 8,176 8,082 7,502 7,455Kansas 4,126 3,521 3,982 4,474 5,509 4,511 4,259 3,986 2,975 1,782 ‡ Kentucky 4,243 4,399 4,229 3,831 3,768 3,693 2,829 1,994 2,089 2,236 2,437Louisiana 5,489 4,754 5,407 5,710 6,304 6,024 5,260 2,588 1,621 1,238 1,020Maine 1,475 1,349 1,455 1,395 1,247 1,133 1,207 1,094 1,033 862 757
Table 1.5a. Primary marijuana admissions aged 12 and older, by Census region, Census division, and state or jurisdiction: Number, 2005-2015
Continued. See notes at end of table.
Number of admissions aged 12 and olderCensus region, Census division, and state or jurisdiction
58
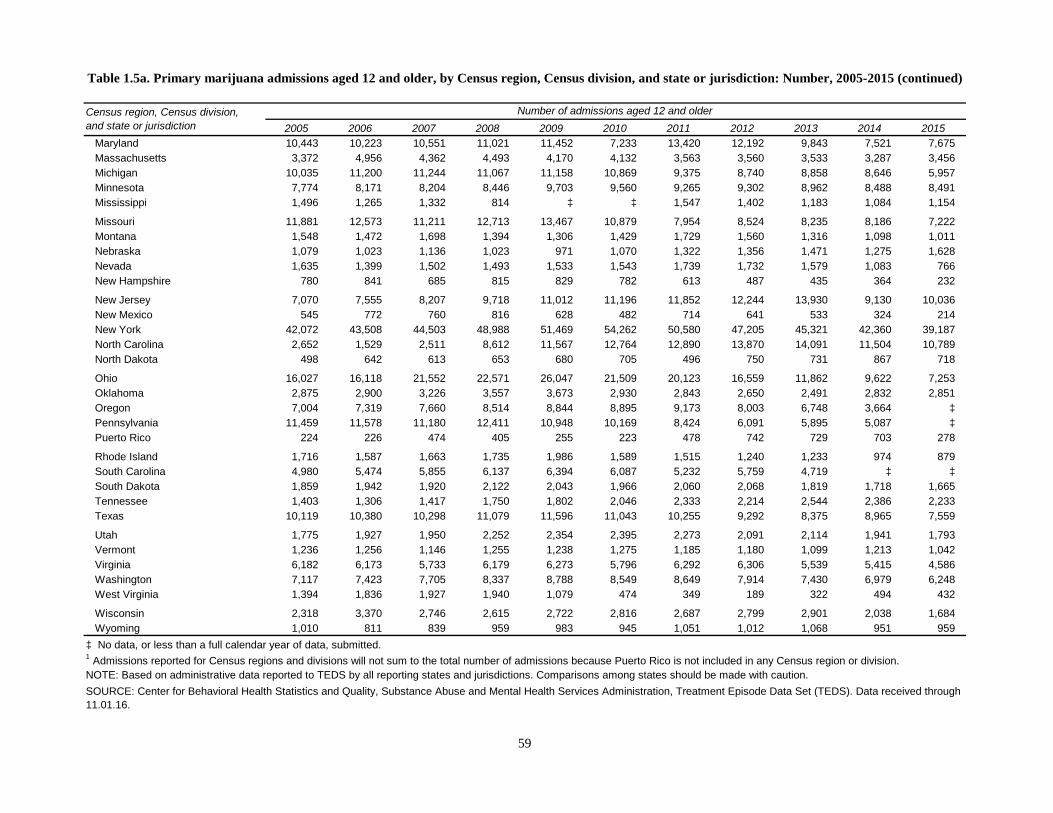
2005 2006 2007 2008 2009 2010 2011 2012 2013 2014 2015Maryland 10,443 10,223 10,551 11,021 11,452 7,233 13,420 12,192 9,843 7,521 7,675Massachusetts 3,372 4,956 4,362 4,493 4,170 4,132 3,563 3,560 3,533 3,287 3,456Michigan 10,035 11,200 11,244 11,067 11,158 10,869 9,375 8,740 8,858 8,646 5,957Minnesota 7,774 8,171 8,204 8,446 9,703 9,560 9,265 9,302 8,962 8,488 8,491Mississippi 1,496 1,265 1,332 814 ‡ ‡ 1,547 1,402 1,183 1,084 1,154
Missouri 11,881 12,573 11,211 12,713 13,467 10,879 7,954 8,524 8,235 8,186 7,222Montana 1,548 1,472 1,698 1,394 1,306 1,429 1,729 1,560 1,316 1,098 1,011Nebraska 1,079 1,023 1,136 1,023 971 1,070 1,322 1,356 1,471 1,275 1,628Nevada 1,635 1,399 1,502 1,493 1,533 1,543 1,739 1,732 1,579 1,083 766New Hampshire 780 841 685 815 829 782 613 487 435 364 232
New Jersey 7,070 7,555 8,207 9,718 11,012 11,196 11,852 12,244 13,930 9,130 10,036New Mexico 545 772 760 816 628 482 714 641 533 324 214New York 42,072 43,508 44,503 48,988 51,469 54,262 50,580 47,205 45,321 42,360 39,187North Carolina 2,652 1,529 2,511 8,612 11,567 12,764 12,890 13,870 14,091 11,504 10,789North Dakota 498 642 613 653 680 705 496 750 731 867 718
Ohio 16,027 16,118 21,552 22,571 26,047 21,509 20,123 16,559 11,862 9,622 7,253Oklahoma 2,875 2,900 3,226 3,557 3,673 2,930 2,843 2,650 2,491 2,832 2,851Oregon 7,004 7,319 7,660 8,514 8,844 8,895 9,173 8,003 6,748 3,664 ‡ Pennsylvania 11,459 11,578 11,180 12,411 10,948 10,169 8,424 6,091 5,895 5,087 ‡ Puerto Rico 224 226 474 405 255 223 478 742 729 703 278
Rhode Island 1,716 1,587 1,663 1,735 1,986 1,589 1,515 1,240 1,233 974 879South Carolina 4,980 5,474 5,855 6,137 6,394 6,087 5,232 5,759 4,719 ‡ ‡ South Dakota 1,859 1,942 1,920 2,122 2,043 1,966 2,060 2,068 1,819 1,718 1,665Tennessee 1,403 1,306 1,417 1,750 1,802 2,046 2,333 2,214 2,544 2,386 2,233Texas 10,119 10,380 10,298 11,079 11,596 11,043 10,255 9,292 8,375 8,965 7,559
Utah 1,775 1,927 1,950 2,252 2,354 2,395 2,273 2,091 2,114 1,941 1,793Vermont 1,236 1,256 1,146 1,255 1,238 1,275 1,185 1,180 1,099 1,213 1,042Virginia 6,182 6,173 5,733 6,179 6,273 5,796 6,292 6,306 5,539 5,415 4,586Washington 7,117 7,423 7,705 8,337 8,788 8,549 8,649 7,914 7,430 6,979 6,248West Virginia 1,394 1,836 1,927 1,940 1,079 474 349 189 322 494 432
Wisconsin 2,318 3,370 2,746 2,615 2,722 2,816 2,687 2,799 2,901 2,038 1,684Wyoming 1,010 811 839 959 983 945 1,051 1,012 1,068 951 959
‡ No data, or less than a full calendar year of data, submitted.
SOURCE: Center for Behavioral Health Statistics and Quality, Substance Abuse and Mental Health Services Administration, Treatment Episode Data Set (TEDS). Data received through 11.01.16.
Number of admissions aged 12 and older
Table 1.5a. Primary marijuana admissions aged 12 and older, by Census region, Census division, and state or jurisdiction: Number, 2005-2015 (continued)
NOTE: Based on administrative data reported to TEDS by all reporting states and jurisdictions. Comparisons among states should be made with caution.
Census region, Census division, and state or jurisdiction
1 Admissions reported for Census regions and divisions will not sum to the total number of admissions because Puerto Rico is not included in any Census region or division.
59

2005 2006 2007 2008 2009 2010 2011 2012 2013 2014 2015Total 121 124 123 139 143 136 132 118 108 92 77
Census regionNortheast 157 164 165 182 188 196 182 168 165 147 131Midwest 165 169 165 173 183 171 149 134 122 108 88South 92 90 87 112 117 100 110 90 78 62 50West 103 107 113 122 120 120 120 115 102 86 73
Census divisionNew England 99 114 111 118 123 139 127 118 113 114 113Middle Atlantic 177 182 185 205 211 216 201 185 183 159 138East North Central 148 151 150 156 159 148 130 106 94 81 59West North Central 204 209 201 212 237 221 194 196 184 169 153
South Atlantic 102 100 105 138 145 121 151 124 105 76 54East South Central 85 84 46 70 76 77 57 51 52 50 54West South Central 77 74 77 90 89 76 68 54 46 45 42Mountain 94 94 94 100 100 112 111 110 97 88 82Pacific 106 113 122 132 130 123 125 117 104 85 69
State or jurisdictionAlabama 143 146 ‡ 107 155 154 53 58 59 53 67Alaska 29 37 69 87 90 94 104 90 97 97 96Arizona 43 40 38 41 40 99 95 90 69 75 71Arkansas 112 111 121 233 190 114 94 90 78 57 90California 88 96 105 114 108 101 103 99 88 75 66
Colorado 150 151 160 167 172 173 152 160 147 152 149Connecticut 117 131 143 165 192 273 254 235 224 253 261Delaware 276 251 235 215 242 230 215 176 155 132 91District of Columbia ‡ ‡ † ‡ ‡ 99 233 147 116 105 96Florida 91 92 97 158 158 112 168 91 58 28 26
Georgia 92 92 98 100 110 111 105 107 109 108 ‡ Hawaii 146 149 164 177 182 176 166 168 170 148 141Idaho 110 142 105 150 150 91 109 136 105 36 30Illinois 186 175 135 151 143 163 128 81 76 61 39Indiana 172 179 158 157 130 99 93 90 99 96 78
Iowa 269 284 271 260 318 364 317 315 310 286 282Kansas 181 153 172 192 235 190 179 166 123 74 ‡ Kentucky 120 124 118 106 104 101 77 54 56 60 65Louisiana 147 134 148 154 169 159 137 67 42 32 26Maine 130 118 127 122 109 98 104 94 89 74 65
Table 1.5b. Primary marijuana admissions aged 12 and older, by Census region, Census division, and state or jurisdiction: Admissions per 100,000 population, 2005-2015
Admissions per 100,000 population aged 12 and olderCensus region, Census division, and state or jurisdiction
Continued. See notes at end of table. 60
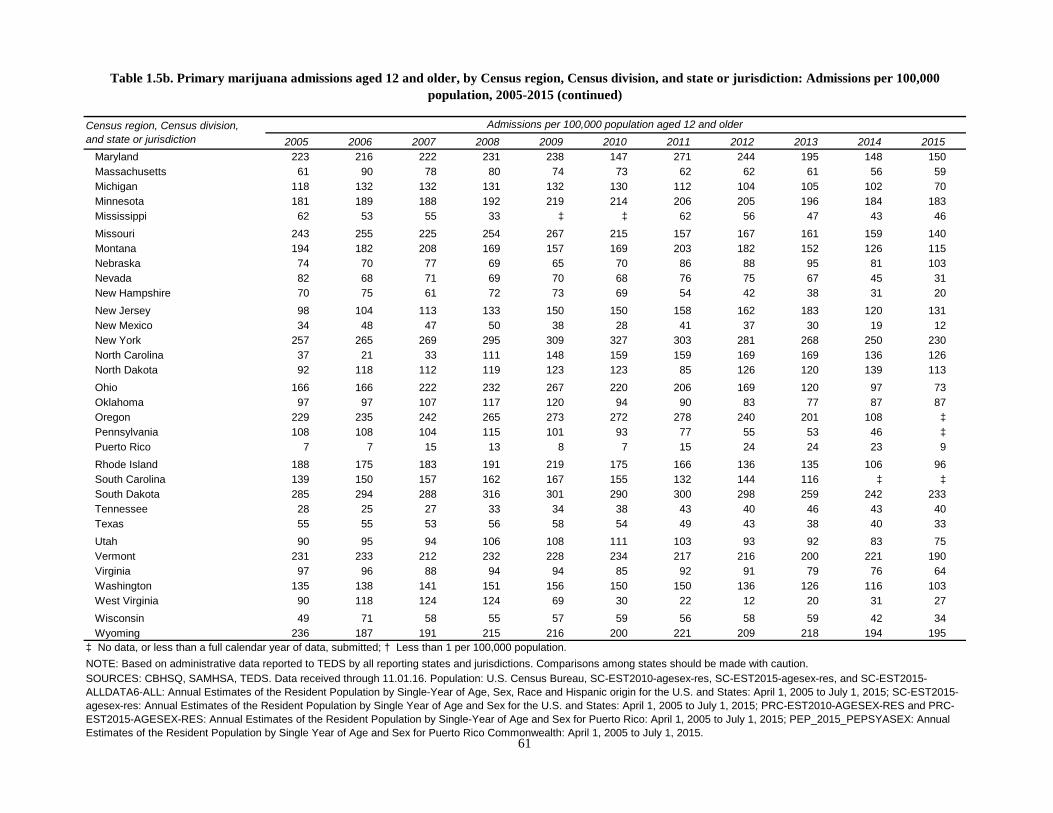
2005 2006 2007 2008 2009 2010 2011 2012 2013 2014 2015Maryland 223 216 222 231 238 147 271 244 195 148 150Massachusetts 61 90 78 80 74 73 62 62 61 56 59Michigan 118 132 132 131 132 130 112 104 105 102 70Minnesota 181 189 188 192 219 214 206 205 196 184 183Mississippi 62 53 55 33 ‡ ‡ 62 56 47 43 46Missouri 243 255 225 254 267 215 157 167 161 159 140Montana 194 182 208 169 157 169 203 182 152 126 115Nebraska 74 70 77 69 65 70 86 88 95 81 103Nevada 82 68 71 69 70 68 76 75 67 45 31New Hampshire 70 75 61 72 73 69 54 42 38 31 20New Jersey 98 104 113 133 150 150 158 162 183 120 131New Mexico 34 48 47 50 38 28 41 37 30 19 12New York 257 265 269 295 309 327 303 281 268 250 230North Carolina 37 21 33 111 148 159 159 169 169 136 126North Dakota 92 118 112 119 123 123 85 126 120 139 113Ohio 166 166 222 232 267 220 206 169 120 97 73Oklahoma 97 97 107 117 120 94 90 83 77 87 87Oregon 229 235 242 265 273 272 278 240 201 108 ‡ Pennsylvania 108 108 104 115 101 93 77 55 53 46 ‡ Puerto Rico 7 7 15 13 8 7 15 24 24 23 9Rhode Island 188 175 183 191 219 175 166 136 135 106 96South Carolina 139 150 157 162 167 155 132 144 116 ‡ ‡ South Dakota 285 294 288 316 301 290 300 298 259 242 233Tennessee 28 25 27 33 34 38 43 40 46 43 40Texas 55 55 53 56 58 54 49 43 38 40 33Utah 90 95 94 106 108 111 103 93 92 83 75Vermont 231 233 212 232 228 234 217 216 200 221 190Virginia 97 96 88 94 94 85 92 91 79 76 64Washington 135 138 141 151 156 150 150 136 126 116 103West Virginia 90 118 124 124 69 30 22 12 20 31 27Wisconsin 49 71 58 55 57 59 56 58 59 42 34Wyoming 236 187 191 215 216 200 221 209 218 194 195
SOURCES: CBHSQ, SAMHSA, TEDS. Data received through 11.01.16. Population: U.S. Census Bureau, SC-EST2010-agesex-res, SC-EST2015-agesex-res, and SC-EST2015-ALLDATA6-ALL: Annual Estimates of the Resident Population by Single-Year of Age, Sex, Race and Hispanic origin for the U.S. and States: April 1, 2005 to July 1, 2015; SC-EST2015-agesex-res: Annual Estimates of the Resident Population by Single Year of Age and Sex for the U.S. and States: April 1, 2005 to July 1, 2015; PRC-EST2010-AGESEX-RES and PRC-EST2015-AGESEX-RES: Annual Estimates of the Resident Population by Single-Year of Age and Sex for Puerto Rico: April 1, 2005 to July 1, 2015; PEP_2015_PEPSYASEX: Annual Estimates of the Resident Population by Single Year of Age and Sex for Puerto Rico Commonwealth: April 1, 2005 to July 1, 2015.
Census region, Census division, and state or jurisdiction
Admissions per 100,000 population aged 12 and older
Table 1.5b. Primary marijuana admissions aged 12 and older, by Census region, Census division, and state or jurisdiction: Admissions per 100,000 population, 2005-2015 (continued)
‡ No data, or less than a full calendar year of data, submitted; † Less than 1 per 100,000 population.NOTE: Based on administrative data reported to TEDS by all reporting states and jurisdictions. Comparisons among states should be made with caution.
61
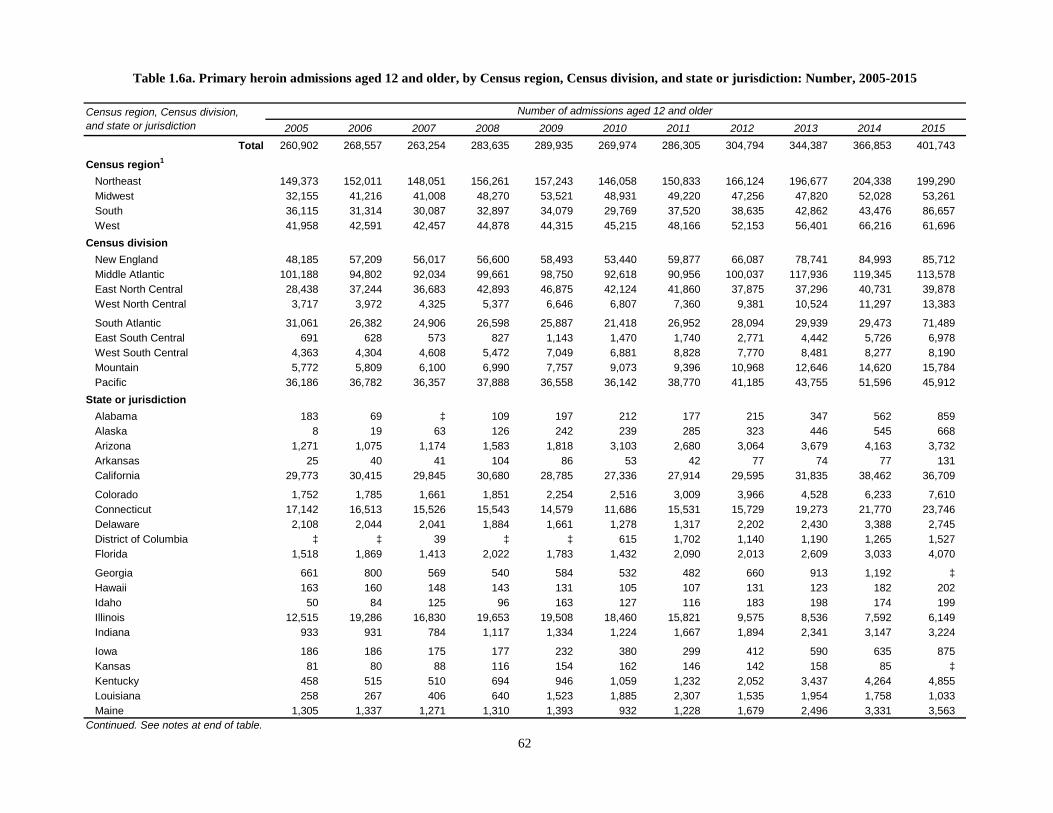
2005 2006 2007 2008 2009 2010 2011 2012 2013 2014 2015Total 260,902 268,557 263,254 283,635 289,935 269,974 286,305 304,794 344,387 366,853 401,743
Census region1
Northeast 149,373 152,011 148,051 156,261 157,243 146,058 150,833 166,124 196,677 204,338 199,290Midwest 32,155 41,216 41,008 48,270 53,521 48,931 49,220 47,256 47,820 52,028 53,261South 36,115 31,314 30,087 32,897 34,079 29,769 37,520 38,635 42,862 43,476 86,657West 41,958 42,591 42,457 44,878 44,315 45,215 48,166 52,153 56,401 66,216 61,696
Census divisionNew England 48,185 57,209 56,017 56,600 58,493 53,440 59,877 66,087 78,741 84,993 85,712Middle Atlantic 101,188 94,802 92,034 99,661 98,750 92,618 90,956 100,037 117,936 119,345 113,578East North Central 28,438 37,244 36,683 42,893 46,875 42,124 41,860 37,875 37,296 40,731 39,878West North Central 3,717 3,972 4,325 5,377 6,646 6,807 7,360 9,381 10,524 11,297 13,383
South Atlantic 31,061 26,382 24,906 26,598 25,887 21,418 26,952 28,094 29,939 29,473 71,489East South Central 691 628 573 827 1,143 1,470 1,740 2,771 4,442 5,726 6,978West South Central 4,363 4,304 4,608 5,472 7,049 6,881 8,828 7,770 8,481 8,277 8,190Mountain 5,772 5,809 6,100 6,990 7,757 9,073 9,396 10,968 12,646 14,620 15,784Pacific 36,186 36,782 36,357 37,888 36,558 36,142 38,770 41,185 43,755 51,596 45,912
State or jurisdictionAlabama 183 69 ‡ 109 197 212 177 215 347 562 859Alaska 8 19 63 126 242 239 285 323 446 545 668Arizona 1,271 1,075 1,174 1,583 1,818 3,103 2,680 3,064 3,679 4,163 3,732Arkansas 25 40 41 104 86 53 42 77 74 77 131California 29,773 30,415 29,845 30,680 28,785 27,336 27,914 29,595 31,835 38,462 36,709
Colorado 1,752 1,785 1,661 1,851 2,254 2,516 3,009 3,966 4,528 6,233 7,610Connecticut 17,142 16,513 15,526 15,543 14,579 11,686 15,531 15,729 19,273 21,770 23,746Delaware 2,108 2,044 2,041 1,884 1,661 1,278 1,317 2,202 2,430 3,388 2,745District of Columbia ‡ ‡ 39 ‡ ‡ 615 1,702 1,140 1,190 1,265 1,527Florida 1,518 1,869 1,413 2,022 1,783 1,432 2,090 2,013 2,609 3,033 4,070
Georgia 661 800 569 540 584 532 482 660 913 1,192 ‡ Hawaii 163 160 148 143 131 105 107 131 123 182 202Idaho 50 84 125 96 163 127 116 183 198 174 199Illinois 12,515 19,286 16,830 19,653 19,508 18,460 15,821 9,575 8,536 7,592 6,149Indiana 933 931 784 1,117 1,334 1,224 1,667 1,894 2,341 3,147 3,224
Iowa 186 186 175 177 232 380 299 412 590 635 875Kansas 81 80 88 116 154 162 146 142 158 85 ‡ Kentucky 458 515 510 694 946 1,059 1,232 2,052 3,437 4,264 4,855Louisiana 258 267 406 640 1,523 1,885 2,307 1,535 1,954 1,758 1,033Maine 1,305 1,337 1,271 1,310 1,393 932 1,228 1,679 2,496 3,331 3,563
Table 1.6a. Primary heroin admissions aged 12 and older, by Census region, Census division, and state or jurisdiction: Number, 2005-2015
Number of admissions aged 12 and olderCensus region, Census division, and state or jurisdiction
Continued. See notes at end of table.
62

2005 2006 2007 2008 2009 2010 2011 2012 2013 2014 2015Maryland 21,981 17,564 17,071 17,735 17,136 12,843 16,650 16,681 16,825 14,765 56,382Massachusetts 24,812 35,171 35,764 35,912 38,801 37,453 39,120 44,173 49,894 51,277 49,400Michigan 7,488 9,311 9,325 10,470 11,166 10,627 10,905 11,604 11,913 15,097 16,634Minnesota 1,419 1,682 1,817 1,975 2,311 2,355 3,454 4,687 5,291 5,614 6,835Mississippi 50 44 63 24 ‡ ‡ 91 114 104 157 181
Missouri 2,003 1,999 2,200 3,019 3,861 3,815 3,309 3,942 4,247 4,732 5,385Montana 64 80 106 109 98 99 150 207 187 106 136Nebraska - - - - 16 62 53 45 84 106 118 95 137Nevada 578 607 576 675 888 795 882 931 918 988 901New Hampshire 649 713 656 791 954 913 858 770 1,204 1,528 1,681
New Jersey 23,538 21,585 22,393 23,361 24,535 22,797 23,458 26,891 32,545 23,986 27,559New Mexico 778 742 722 742 591 384 467 562 705 514 441New York 61,821 59,156 57,411 60,766 61,968 57,574 56,797 61,913 70,348 79,397 86,019North Carolina 1,327 1,245 1,190 1,355 1,760 1,758 2,309 2,640 3,011 2,564 3,341North Dakota 5 1 4 9 6 10 7 16 22 63 87
Ohio 6,570 6,807 8,827 10,670 13,562 10,419 11,605 12,667 11,867 12,679 11,836Oklahoma 95 85 118 199 246 185 227 242 319 359 440Oregon 3,226 3,479 3,806 3,847 4,266 4,877 5,873 5,957 6,045 5,147 ‡ Pennsylvania 15,829 14,061 12,230 15,534 12,247 12,247 10,701 11,233 15,043 15,962 ‡ Puerto Rico 1,301 1,425 1,651 1,329 777 591 566 626 627 795 839
Rhode Island 3,475 2,909 2,328 2,506 2,346 2,058 2,502 2,615 3,677 3,878 3,982South Carolina 435 236 204 231 256 221 244 291 228 ‡ ‡ South Dakota 23 24 25 19 29 40 61 76 98 73 64Tennessee n/c n/c n/c n/c n/c 199 240 390 554 743 1,083Texas 3,985 3,912 4,043 4,529 5,194 4,758 6,252 5,916 6,134 6,083 6,586
Utah 1,257 1,420 1,712 1,889 1,891 2,001 2,035 1,986 2,307 2,285 2,603Vermont 802 566 472 538 420 398 638 1,121 2,197 3,209 3,340Virginia 2,643 2,202 2,081 2,441 2,424 1,994 1,992 2,353 2,396 2,744 3,021Washington 3,016 2,709 2,495 3,092 3,134 3,585 4,591 5,179 5,306 7,260 8,333West Virginia 388 422 298 390 283 155 166 114 337 522 403
Wisconsin 932 909 917 983 1,305 1,394 1,862 2,135 2,639 2,216 2,035Wyoming 22 16 24 45 54 48 57 69 124 157 162
Table 1.6a. Primary heroin admissions aged 12 and older, by Census region, Census division, and state or jurisdiction: Number, 2005-2015 (continued)
SOURCE: Center for Behavioral Health Statistics and Quality, Substance Abuse and Mental Health Services Administration, Treatment Episode Data Set (TEDS). Data received through 11.01.16.
- - Quantity is zero; ‡ No data, or less than a full calendar year of data, submitted; n/c Not collected. Tennessee began disaggregating heroin admissions from other opiates in July 2009. In this report, Tennessee's 2009 heroin admissions are included in the other opiates category since there is less than a full year of disaggregated heroin data.
Census region, Census division, and state or jurisdiction
Number of admissions aged 12 and older
NOTE: Based on administrative data reported to TEDS by all reporting states and jurisdictions. Comparisons among states should be made with caution.
1 Admissions reported for Census regions and divisions will not sum to the total number of admissions because Puerto Rico is not included in any Census region or division.
63
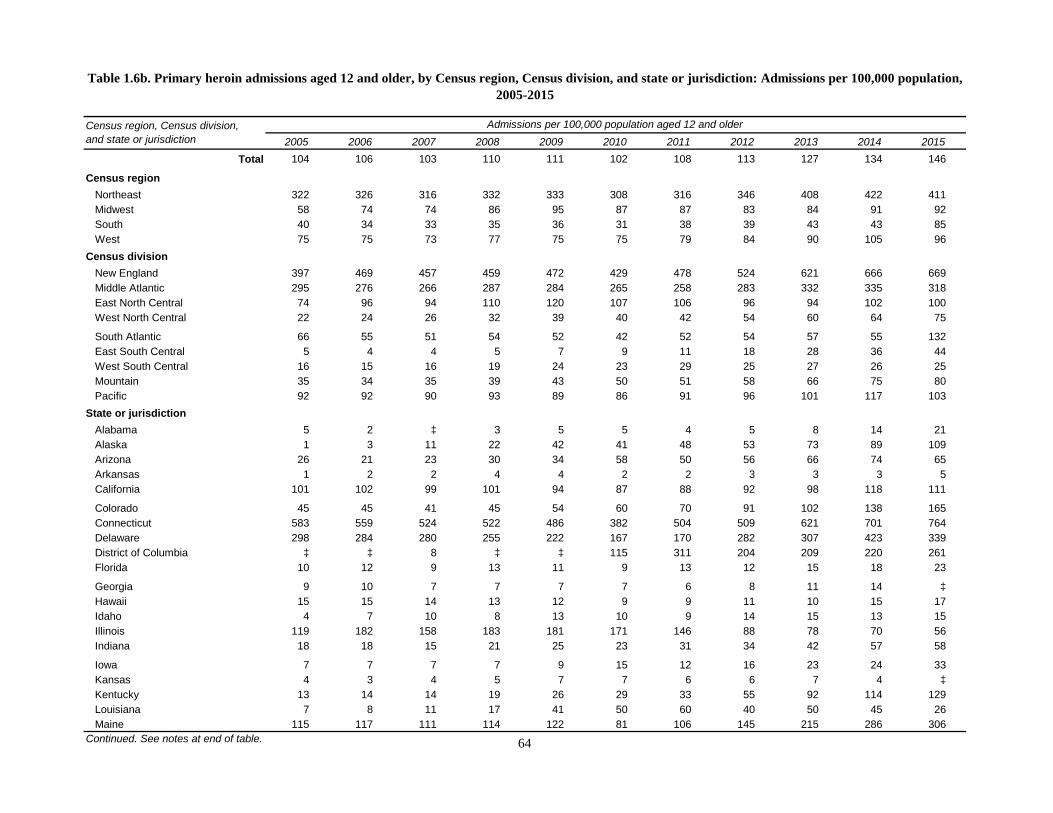
2005 2006 2007 2008 2009 2010 2011 2012 2013 2014 2015Total 104 106 103 110 111 102 108 113 127 134 146
Census regionNortheast 322 326 316 332 333 308 316 346 408 422 411Midwest 58 74 74 86 95 87 87 83 84 91 92South 40 34 33 35 36 31 38 39 43 43 85West 75 75 73 77 75 75 79 84 90 105 96
Census divisionNew England 397 469 457 459 472 429 478 524 621 666 669Middle Atlantic 295 276 266 287 284 265 258 283 332 335 318East North Central 74 96 94 110 120 107 106 96 94 102 100West North Central 22 24 26 32 39 40 42 54 60 64 75
South Atlantic 66 55 51 54 52 42 52 54 57 55 132East South Central 5 4 4 5 7 9 11 18 28 36 44West South Central 16 15 16 19 24 23 29 25 27 26 25Mountain 35 34 35 39 43 50 51 58 66 75 80Pacific 92 92 90 93 89 86 91 96 101 117 103
State or jurisdictionAlabama 5 2 ‡ 3 5 5 4 5 8 14 21Alaska 1 3 11 22 42 41 48 53 73 89 109Arizona 26 21 23 30 34 58 50 56 66 74 65Arkansas 1 2 2 4 4 2 2 3 3 3 5California 101 102 99 101 94 87 88 92 98 118 111
Colorado 45 45 41 45 54 60 70 91 102 138 165Connecticut 583 559 524 522 486 382 504 509 621 701 764Delaware 298 284 280 255 222 167 170 282 307 423 339District of Columbia ‡ ‡ 8 ‡ ‡ 115 311 204 209 220 261Florida 10 12 9 13 11 9 13 12 15 18 23
Georgia 9 10 7 7 7 7 6 8 11 14 ‡ Hawaii 15 15 14 13 12 9 9 11 10 15 17Idaho 4 7 10 8 13 10 9 14 15 13 15Illinois 119 182 158 183 181 171 146 88 78 70 56Indiana 18 18 15 21 25 23 31 34 42 57 58
Iowa 7 7 7 7 9 15 12 16 23 24 33Kansas 4 3 4 5 7 7 6 6 7 4 ‡ Kentucky 13 14 14 19 26 29 33 55 92 114 129Louisiana 7 8 11 17 41 50 60 40 50 45 26Maine 115 117 111 114 122 81 106 145 215 286 306
Continued. See notes at end of table.
Table 1.6b. Primary heroin admissions aged 12 and older, by Census region, Census division, and state or jurisdiction: Admissions per 100,000 population, 2005-2015
Admissions per 100,000 population aged 12 and olderCensus region, Census division, and state or jurisdiction
64
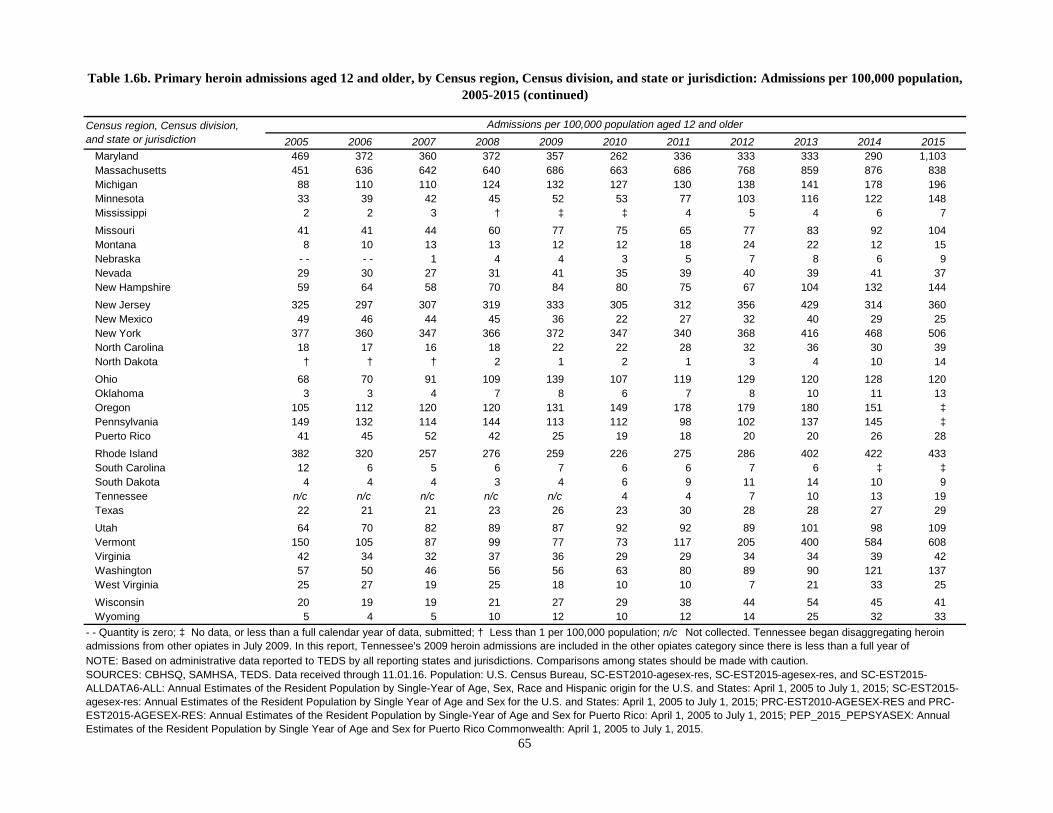
2005 2006 2007 2008 2009 2010 2011 2012 2013 2014 2015Maryland 469 372 360 372 357 262 336 333 333 290 1,103Massachusetts 451 636 642 640 686 663 686 768 859 876 838Michigan 88 110 110 124 132 127 130 138 141 178 196Minnesota 33 39 42 45 52 53 77 103 116 122 148Mississippi 2 2 3 † ‡ ‡ 4 5 4 6 7Missouri 41 41 44 60 77 75 65 77 83 92 104Montana 8 10 13 13 12 12 18 24 22 12 15Nebraska - - - - 1 4 4 3 5 7 8 6 9Nevada 29 30 27 31 41 35 39 40 39 41 37New Hampshire 59 64 58 70 84 80 75 67 104 132 144New Jersey 325 297 307 319 333 305 312 356 429 314 360New Mexico 49 46 44 45 36 22 27 32 40 29 25New York 377 360 347 366 372 347 340 368 416 468 506North Carolina 18 17 16 18 22 22 28 32 36 30 39North Dakota † † † 2 1 2 1 3 4 10 14Ohio 68 70 91 109 139 107 119 129 120 128 120Oklahoma 3 3 4 7 8 6 7 8 10 11 13Oregon 105 112 120 120 131 149 178 179 180 151 ‡ Pennsylvania 149 132 114 144 113 112 98 102 137 145 ‡ Puerto Rico 41 45 52 42 25 19 18 20 20 26 28Rhode Island 382 320 257 276 259 226 275 286 402 422 433South Carolina 12 6 5 6 7 6 6 7 6 ‡ ‡ South Dakota 4 4 4 3 4 6 9 11 14 10 9Tennessee n/c n/c n/c n/c n/c 4 4 7 10 13 19Texas 22 21 21 23 26 23 30 28 28 27 29Utah 64 70 82 89 87 92 92 89 101 98 109Vermont 150 105 87 99 77 73 117 205 400 584 608Virginia 42 34 32 37 36 29 29 34 34 39 42Washington 57 50 46 56 56 63 80 89 90 121 137West Virginia 25 27 19 25 18 10 10 7 21 33 25Wisconsin 20 19 19 21 27 29 38 44 54 45 41Wyoming 5 4 5 10 12 10 12 14 25 32 33
Table 1.6b. Primary heroin admissions aged 12 and older, by Census region, Census division, and state or jurisdiction: Admissions per 100,000 population, 2005-2015 (continued)
Census region, Census division, and state or jurisdiction
Admissions per 100,000 population aged 12 and older
SOURCES: CBHSQ, SAMHSA, TEDS. Data received through 11.01.16. Population: U.S. Census Bureau, SC-EST2010-agesex-res, SC-EST2015-agesex-res, and SC-EST2015-ALLDATA6-ALL: Annual Estimates of the Resident Population by Single-Year of Age, Sex, Race and Hispanic origin for the U.S. and States: April 1, 2005 to July 1, 2015; SC-EST2015-agesex-res: Annual Estimates of the Resident Population by Single Year of Age and Sex for the U.S. and States: April 1, 2005 to July 1, 2015; PRC-EST2010-AGESEX-RES and PRC-EST2015-AGESEX-RES: Annual Estimates of the Resident Population by Single-Year of Age and Sex for Puerto Rico: April 1, 2005 to July 1, 2015; PEP_2015_PEPSYASEX: Annual Estimates of the Resident Population by Single Year of Age and Sex for Puerto Rico Commonwealth: April 1, 2005 to July 1, 2015.
NOTE: Based on administrative data reported to TEDS by all reporting states and jurisdictions. Comparisons among states should be made with caution.
- - Quantity is zero; ‡ No data, or less than a full calendar year of data, submitted; † Less than 1 per 100,000 population; n/c Not collected. Tennessee began disaggregating heroin admissions from other opiates in July 2009. In this report, Tennessee's 2009 heroin admissions are included in the other opiates category since there is less than a full year of
65

2005 2006 2007 2008 2009 2010 2011 2012 2013 2014 2015Total 268,402 277,852 259,973 239,342 193,419 158,780 152,349 126,371 106,594 88,623 74,710
Census region1
Northeast 86,334 91,094 85,619 76,140 62,128 57,713 54,989 48,070 43,763 37,349 32,985Midwest 63,875 67,613 63,491 52,985 42,815 33,319 28,691 21,491 17,610 14,681 12,606South 87,250 85,541 77,269 76,546 63,110 47,390 50,764 40,438 31,857 25,341 20,105West 30,787 33,496 33,348 33,432 25,211 20,243 17,716 16,136 13,184 11,067 8,929
Census divisionNew England 13,429 17,675 16,445 14,531 11,797 10,712 11,187 10,417 9,338 8,632 8,192Middle Atlantic 72,905 73,419 69,174 61,609 50,331 47,001 43,802 37,653 34,425 28,717 24,793East North Central 45,701 49,056 46,895 38,561 31,762 25,161 21,910 15,370 12,609 10,425 8,888West North Central 18,174 18,557 16,596 14,424 11,053 8,158 6,781 6,121 5,001 4,256 3,718
South Atlantic 53,240 51,389 48,820 48,396 39,708 29,963 34,942 27,653 21,205 16,397 11,761East South Central 12,919 13,336 7,594 7,799 6,872 6,144 5,109 4,459 4,147 3,718 3,722West South Central 21,091 20,816 20,855 20,351 16,530 11,283 10,713 8,326 6,505 5,226 4,622Mountain 8,059 9,201 9,296 9,190 6,931 6,338 5,816 5,570 4,239 3,603 3,202Pacific 22,728 24,295 24,052 24,242 18,280 13,905 11,900 10,566 8,945 7,464 5,727
State or jurisdictionAlabama 4,324 4,531 ‡ 2,348 3,133 2,927 1,038 1,092 1,031 912 923Alaska 49 62 165 196 159 170 107 63 55 59 72Arizona 1,483 1,469 1,434 1,505 842 1,200 1,105 1,062 762 628 576Arkansas 2,120 2,174 1,880 3,277 2,145 1,051 918 815 660 395 499California 18,871 19,813 19,426 19,814 14,884 11,151 9,549 8,737 7,604 6,397 4,947
Colorado 4,154 4,787 4,652 4,445 3,638 3,340 3,127 3,167 2,404 2,184 2,042Connecticut 5,579 6,178 5,831 5,636 4,664 4,612 5,545 5,264 4,589 4,305 4,040Delaware 1,389 1,359 1,274 996 666 444 352 341 230 251 152District of Columbia ‡ ‡ 41 ‡ ‡ 556 1,714 1,217 1,052 934 884Florida 11,341 12,038 11,755 14,951 11,627 6,768 9,205 5,236 3,290 2,186 1,675
Georgia 11,271 10,774 8,858 7,633 6,341 5,523 5,185 4,797 4,452 4,700 ‡ Hawaii 222 302 245 247 221 153 191 151 113 131 142Idaho 66 101 101 104 99 48 30 33 24 12 19Illinois 15,766 15,751 13,911 12,351 10,189 8,974 7,205 3,490 2,875 2,195 1,572Indiana 4,575 4,880 4,191 3,143 2,306 1,498 1,642 1,469 1,132 966 784
Iowa 1,876 2,194 1,863 1,523 1,177 962 785 684 587 562 487Kansas 2,476 2,216 2,341 2,123 1,800 1,207 962 820 511 238 ‡ Kentucky 3,885 4,352 3,796 2,852 2,239 1,783 1,509 1,060 1,097 976 1,035Louisiana 6,685 6,170 6,508 5,662 5,349 3,799 3,592 1,979 1,302 773 640Maine 764 921 1,039 819 553 430 506 460 516 406 291
Table 1.7a. Primary cocaine admissions aged 12 and older, by Census region, Census division, and state or jurisdiction: Number, 2005-2015
Number of admissions aged 12 and olderCensus region, Census division, and state or jurisdiction
Continued. See notes at end of table.
66
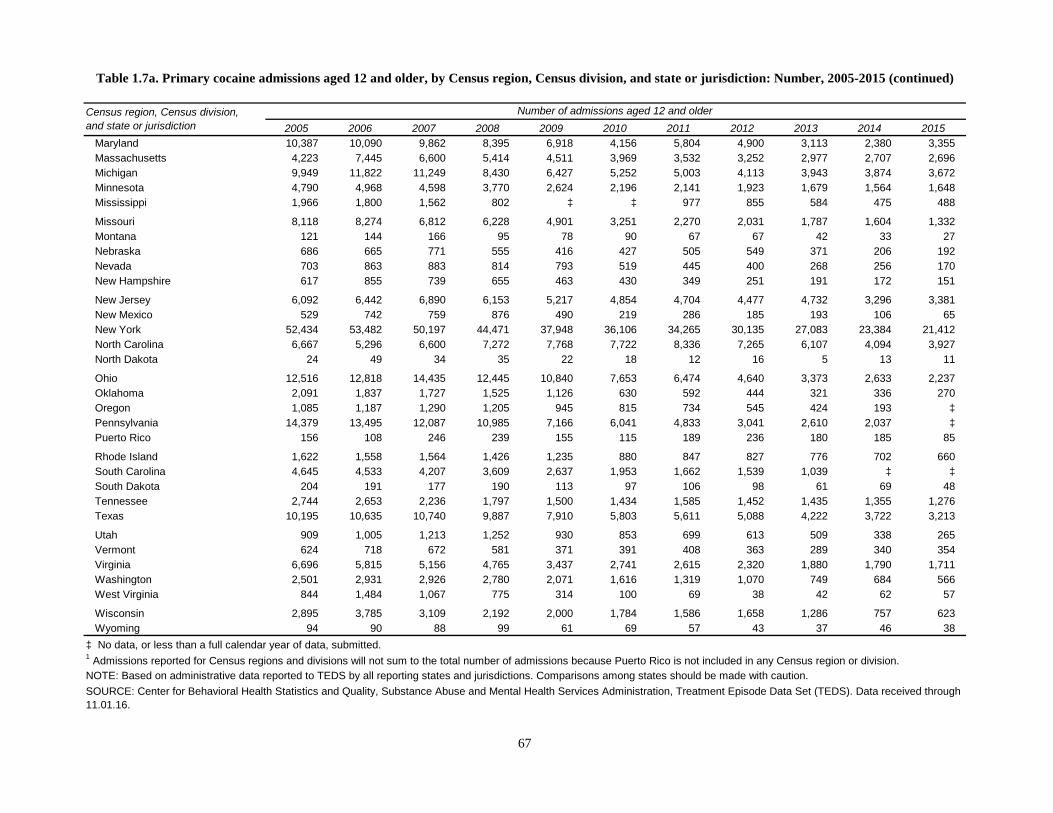
2005 2006 2007 2008 2009 2010 2011 2012 2013 2014 2015Maryland 10,387 10,090 9,862 8,395 6,918 4,156 5,804 4,900 3,113 2,380 3,355Massachusetts 4,223 7,445 6,600 5,414 4,511 3,969 3,532 3,252 2,977 2,707 2,696Michigan 9,949 11,822 11,249 8,430 6,427 5,252 5,003 4,113 3,943 3,874 3,672Minnesota 4,790 4,968 4,598 3,770 2,624 2,196 2,141 1,923 1,679 1,564 1,648Mississippi 1,966 1,800 1,562 802 ‡ ‡ 977 855 584 475 488
Missouri 8,118 8,274 6,812 6,228 4,901 3,251 2,270 2,031 1,787 1,604 1,332Montana 121 144 166 95 78 90 67 67 42 33 27Nebraska 686 665 771 555 416 427 505 549 371 206 192Nevada 703 863 883 814 793 519 445 400 268 256 170New Hampshire 617 855 739 655 463 430 349 251 191 172 151
New Jersey 6,092 6,442 6,890 6,153 5,217 4,854 4,704 4,477 4,732 3,296 3,381New Mexico 529 742 759 876 490 219 286 185 193 106 65New York 52,434 53,482 50,197 44,471 37,948 36,106 34,265 30,135 27,083 23,384 21,412North Carolina 6,667 5,296 6,600 7,272 7,768 7,722 8,336 7,265 6,107 4,094 3,927North Dakota 24 49 34 35 22 18 12 16 5 13 11
Ohio 12,516 12,818 14,435 12,445 10,840 7,653 6,474 4,640 3,373 2,633 2,237Oklahoma 2,091 1,837 1,727 1,525 1,126 630 592 444 321 336 270Oregon 1,085 1,187 1,290 1,205 945 815 734 545 424 193 ‡ Pennsylvania 14,379 13,495 12,087 10,985 7,166 6,041 4,833 3,041 2,610 2,037 ‡ Puerto Rico 156 108 246 239 155 115 189 236 180 185 85
Rhode Island 1,622 1,558 1,564 1,426 1,235 880 847 827 776 702 660South Carolina 4,645 4,533 4,207 3,609 2,637 1,953 1,662 1,539 1,039 ‡ ‡ South Dakota 204 191 177 190 113 97 106 98 61 69 48Tennessee 2,744 2,653 2,236 1,797 1,500 1,434 1,585 1,452 1,435 1,355 1,276Texas 10,195 10,635 10,740 9,887 7,910 5,803 5,611 5,088 4,222 3,722 3,213
Utah 909 1,005 1,213 1,252 930 853 699 613 509 338 265Vermont 624 718 672 581 371 391 408 363 289 340 354Virginia 6,696 5,815 5,156 4,765 3,437 2,741 2,615 2,320 1,880 1,790 1,711Washington 2,501 2,931 2,926 2,780 2,071 1,616 1,319 1,070 749 684 566West Virginia 844 1,484 1,067 775 314 100 69 38 42 62 57
Wisconsin 2,895 3,785 3,109 2,192 2,000 1,784 1,586 1,658 1,286 757 623Wyoming 94 90 88 99 61 69 57 43 37 46 38
SOURCE: Center for Behavioral Health Statistics and Quality, Substance Abuse and Mental Health Services Administration, Treatment Episode Data Set (TEDS). Data received through 11.01.16.
‡ No data, or less than a full calendar year of data, submitted.
Table 1.7a. Primary cocaine admissions aged 12 and older, by Census region, Census division, and state or jurisdiction: Number, 2005-2015 (continued)
Census region, Census division, and state or jurisdiction
Number of admissions aged 12 and older
NOTE: Based on administrative data reported to TEDS by all reporting states and jurisdictions. Comparisons among states should be made with caution.
1 Admissions reported for Census regions and divisions will not sum to the total number of admissions because Puerto Rico is not included in any Census region or division.
67
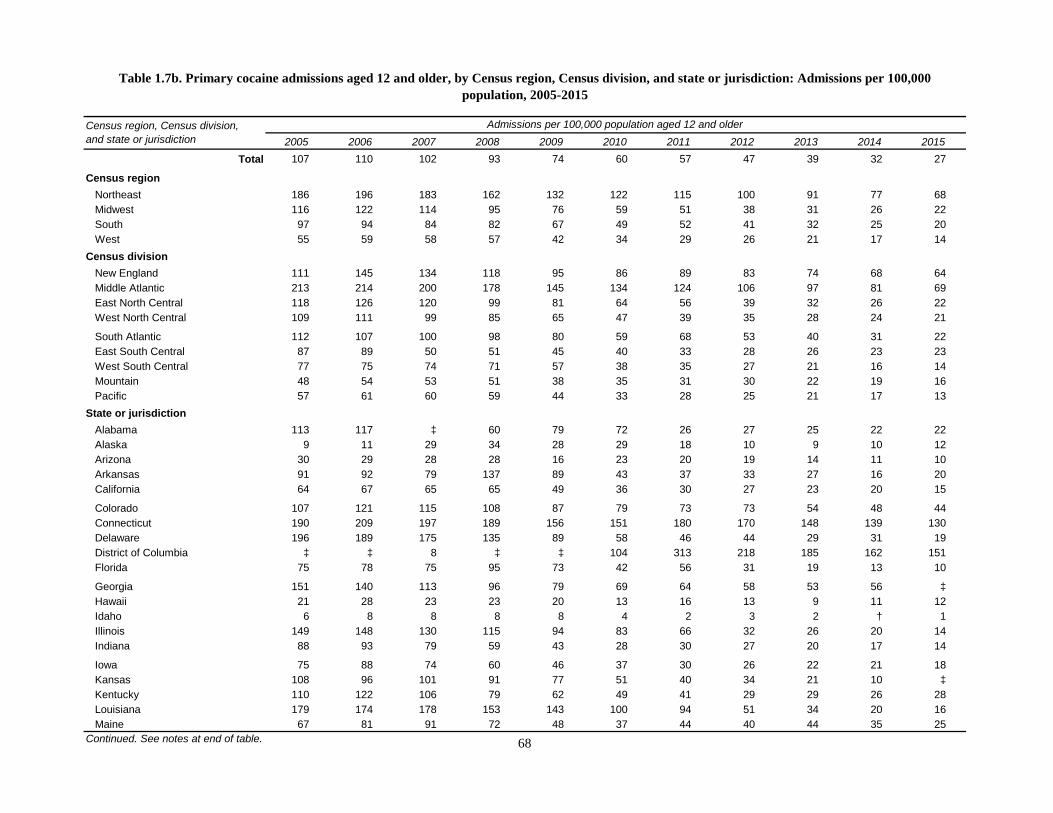
2005 2006 2007 2008 2009 2010 2011 2012 2013 2014 2015Total 107 110 102 93 74 60 57 47 39 32 27
Census regionNortheast 186 196 183 162 132 122 115 100 91 77 68Midwest 116 122 114 95 76 59 51 38 31 26 22South 97 94 84 82 67 49 52 41 32 25 20West 55 59 58 57 42 34 29 26 21 17 14
Census divisionNew England 111 145 134 118 95 86 89 83 74 68 64Middle Atlantic 213 214 200 178 145 134 124 106 97 81 69East North Central 118 126 120 99 81 64 56 39 32 26 22West North Central 109 111 99 85 65 47 39 35 28 24 21
South Atlantic 112 107 100 98 80 59 68 53 40 31 22East South Central 87 89 50 51 45 40 33 28 26 23 23West South Central 77 75 74 71 57 38 35 27 21 16 14Mountain 48 54 53 51 38 35 31 30 22 19 16Pacific 57 61 60 59 44 33 28 25 21 17 13
State or jurisdictionAlabama 113 117 ‡ 60 79 72 26 27 25 22 22Alaska 9 11 29 34 28 29 18 10 9 10 12Arizona 30 29 28 28 16 23 20 19 14 11 10Arkansas 91 92 79 137 89 43 37 33 27 16 20California 64 67 65 65 49 36 30 27 23 20 15
Colorado 107 121 115 108 87 79 73 73 54 48 44Connecticut 190 209 197 189 156 151 180 170 148 139 130Delaware 196 189 175 135 89 58 46 44 29 31 19District of Columbia ‡ ‡ 8 ‡ ‡ 104 313 218 185 162 151Florida 75 78 75 95 73 42 56 31 19 13 10
Georgia 151 140 113 96 79 69 64 58 53 56 ‡ Hawaii 21 28 23 23 20 13 16 13 9 11 12Idaho 6 8 8 8 8 4 2 3 2 † 1Illinois 149 148 130 115 94 83 66 32 26 20 14Indiana 88 93 79 59 43 28 30 27 20 17 14
Iowa 75 88 74 60 46 37 30 26 22 21 18Kansas 108 96 101 91 77 51 40 34 21 10 ‡ Kentucky 110 122 106 79 62 49 41 29 29 26 28Louisiana 179 174 178 153 143 100 94 51 34 20 16Maine 67 81 91 72 48 37 44 40 44 35 25
Census region, Census division, and state or jurisdiction
Admissions per 100,000 population aged 12 and older
Continued. See notes at end of table.
Table 1.7b. Primary cocaine admissions aged 12 and older, by Census region, Census division, and state or jurisdiction: Admissions per 100,000 population, 2005-2015
68

2005 2006 2007 2008 2009 2010 2011 2012 2013 2014 2015Maryland 221 214 208 176 144 85 117 98 62 47 66Massachusetts 77 135 119 96 80 70 62 57 51 46 46Michigan 117 139 132 100 76 63 60 49 47 46 43Minnesota 112 115 105 86 59 49 48 42 37 34 36Mississippi 82 75 65 33 ‡ ‡ 39 34 23 19 19Missouri 166 168 137 124 97 64 45 40 35 31 26Montana 15 18 20 12 9 11 8 8 5 4 3Nebraska 47 45 52 37 28 28 33 36 24 13 12Nevada 35 42 42 38 36 23 20 17 11 11 7New Hampshire 56 76 65 58 41 38 31 22 17 15 13New Jersey 84 89 95 84 71 65 63 59 62 43 44New Mexico 33 46 46 53 29 13 17 11 11 6 4New York 320 325 304 268 228 217 205 179 160 138 126North Carolina 92 71 87 94 99 96 103 88 73 49 46North Dakota 4 9 6 6 4 3 2 3 † 2 2Ohio 129 132 148 128 111 78 66 47 34 27 23Oklahoma 71 62 57 50 37 20 19 14 10 10 8Oregon 35 38 41 38 29 25 22 16 13 6 ‡ Pennsylvania 135 126 113 102 66 55 44 28 24 18 ‡ Puerto Rico 5 3 8 8 5 4 6 8 6 6 3Rhode Island 178 171 173 157 136 97 93 91 85 76 72South Carolina 130 124 113 95 69 50 42 38 26 ‡ ‡ South Dakota 31 29 27 28 17 14 15 14 9 10 7Tennessee 54 52 43 34 28 27 29 27 26 24 23Texas 55 56 56 50 40 28 27 24 19 17 14Utah 46 50 58 59 43 39 32 27 22 15 11Vermont 117 133 124 107 68 72 75 66 53 62 64Virginia 105 90 79 73 52 40 38 33 27 25 24Washington 47 55 54 50 37 28 23 18 13 11 9West Virginia 54 95 68 50 20 6 4 2 3 4 4Wisconsin 62 80 66 46 42 37 33 34 26 15 13Wyoming 22 21 20 22 13 15 12 9 8 9 8
SOURCES: CBHSQ, SAMHSA, TEDS. Data received through 11.01.16. Population: U.S. Census Bureau, SC-EST2010-agesex-res, SC-EST2015-agesex-res, and SC-EST2015-ALLDATA6-ALL: Annual Estimates of the Resident Population by Single-Year of Age, Sex, Race and Hispanic origin for the U.S. and States: April 1, 2005 to July 1, 2015; SC-EST2015-agesex-res: Annual Estimates of the Resident Population by Single Year of Age and Sex for the U.S. and States: April 1, 2005 to July 1, 2015; PRC-EST2010-AGESEX-RES and PRC-EST2015-AGESEX-RES: Annual Estimates of the Resident Population by Single-Year of Age and Sex for Puerto Rico: April 1, 2005 to July 1, 2015; PEP_2015_PEPSYASEX: Annual Estimates of the Resident Population by Single Year of Age and Sex for Puerto Rico Commonwealth: April 1, 2005 to July 1, 2015.
Census region, Census division, and state or jurisdiction
NOTE: Based on administrative data reported to TEDS by all reporting states and jurisdictions. Comparisons among states should be made with caution.
Table 1.7b. Primary cocaine admissions aged 12 and older, by Census region, Census division, and state or jurisdiction: Admissions per 100,000 population, 2005-2015 (continued)
‡ No data, or less than a full calendar year of data, submitted; † Less than 1 per 100,000 population.
Admissions per 100,000 population aged 12 and older
69
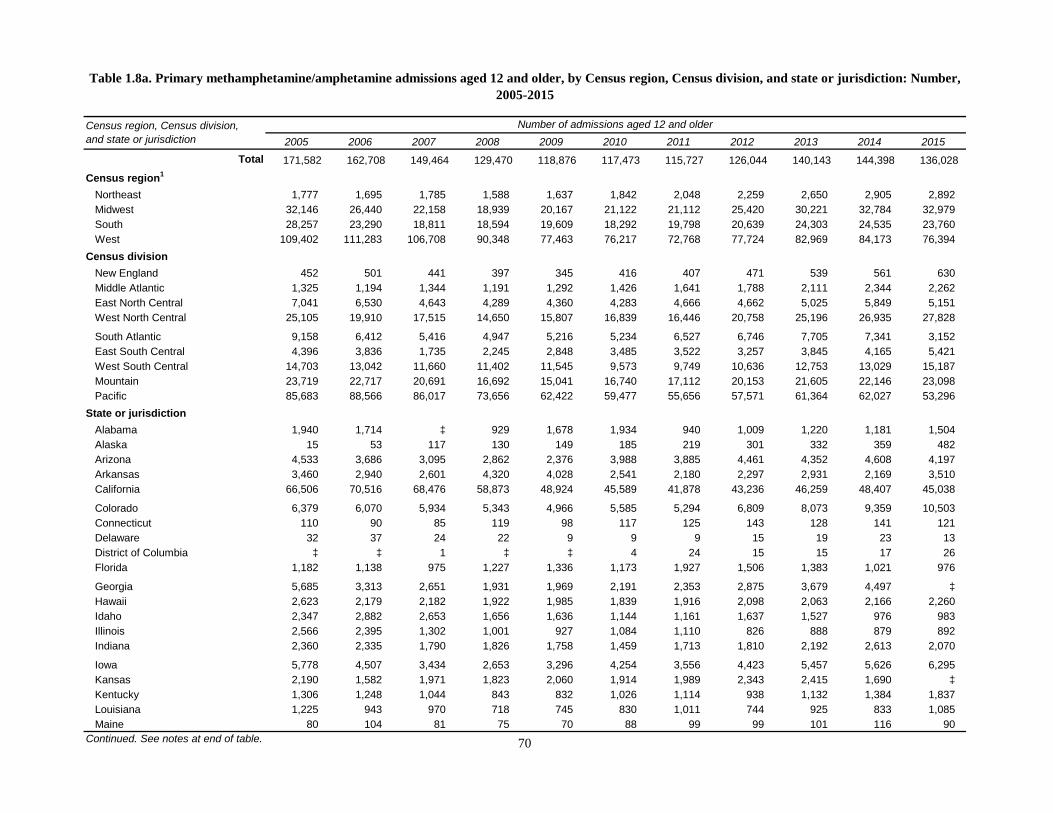
2005 2006 2007 2008 2009 2010 2011 2012 2013 2014 2015Total 171,582 162,708 149,464 129,470 118,876 117,473 115,727 126,044 140,143 144,398 136,028
Census region1
Northeast 1,777 1,695 1,785 1,588 1,637 1,842 2,048 2,259 2,650 2,905 2,892Midwest 32,146 26,440 22,158 18,939 20,167 21,122 21,112 25,420 30,221 32,784 32,979South 28,257 23,290 18,811 18,594 19,609 18,292 19,798 20,639 24,303 24,535 23,760West 109,402 111,283 106,708 90,348 77,463 76,217 72,768 77,724 82,969 84,173 76,394
Census divisionNew England 452 501 441 397 345 416 407 471 539 561 630Middle Atlantic 1,325 1,194 1,344 1,191 1,292 1,426 1,641 1,788 2,111 2,344 2,262East North Central 7,041 6,530 4,643 4,289 4,360 4,283 4,666 4,662 5,025 5,849 5,151West North Central 25,105 19,910 17,515 14,650 15,807 16,839 16,446 20,758 25,196 26,935 27,828
South Atlantic 9,158 6,412 5,416 4,947 5,216 5,234 6,527 6,746 7,705 7,341 3,152East South Central 4,396 3,836 1,735 2,245 2,848 3,485 3,522 3,257 3,845 4,165 5,421West South Central 14,703 13,042 11,660 11,402 11,545 9,573 9,749 10,636 12,753 13,029 15,187Mountain 23,719 22,717 20,691 16,692 15,041 16,740 17,112 20,153 21,605 22,146 23,098Pacific 85,683 88,566 86,017 73,656 62,422 59,477 55,656 57,571 61,364 62,027 53,296
State or jurisdictionAlabama 1,940 1,714 ‡ 929 1,678 1,934 940 1,009 1,220 1,181 1,504Alaska 15 53 117 130 149 185 219 301 332 359 482Arizona 4,533 3,686 3,095 2,862 2,376 3,988 3,885 4,461 4,352 4,608 4,197Arkansas 3,460 2,940 2,601 4,320 4,028 2,541 2,180 2,297 2,931 2,169 3,510California 66,506 70,516 68,476 58,873 48,924 45,589 41,878 43,236 46,259 48,407 45,038
Colorado 6,379 6,070 5,934 5,343 4,966 5,585 5,294 6,809 8,073 9,359 10,503Connecticut 110 90 85 119 98 117 125 143 128 141 121Delaware 32 37 24 22 9 9 9 15 19 23 13District of Columbia ‡ ‡ 1 ‡ ‡ 4 24 15 15 17 26Florida 1,182 1,138 975 1,227 1,336 1,173 1,927 1,506 1,383 1,021 976
Georgia 5,685 3,313 2,651 1,931 1,969 2,191 2,353 2,875 3,679 4,497 ‡ Hawaii 2,623 2,179 2,182 1,922 1,985 1,839 1,916 2,098 2,063 2,166 2,260Idaho 2,347 2,882 2,653 1,656 1,636 1,144 1,161 1,637 1,527 976 983Illinois 2,566 2,395 1,302 1,001 927 1,084 1,110 826 888 879 892Indiana 2,360 2,335 1,790 1,826 1,758 1,459 1,713 1,810 2,192 2,613 2,070
Iowa 5,778 4,507 3,434 2,653 3,296 4,254 3,556 4,423 5,457 5,626 6,295Kansas 2,190 1,582 1,971 1,823 2,060 1,914 1,989 2,343 2,415 1,690 ‡ Kentucky 1,306 1,248 1,044 843 832 1,026 1,114 938 1,132 1,384 1,837Louisiana 1,225 943 970 718 745 830 1,011 744 925 833 1,085Maine 80 104 81 75 70 88 99 99 101 116 90
Table 1.8a. Primary methamphetamine/amphetamine admissions aged 12 and older, by Census region, Census division, and state or jurisdiction: Number, 2005-2015
Number of admissions aged 12 and olderCensus region, Census division, and state or jurisdiction
Continued. See notes at end of table. 70

2005 2006 2007 2008 2009 2010 2011 2012 2013 2014 2015Maryland 215 222 219 162 148 94 131 135 130 94 130Massachusetts 152 190 164 101 84 119 100 136 186 175 239Michigan 797 605 452 601 706 819 817 858 807 1,182 936Minnesota 7,127 5,333 4,846 3,668 3,598 4,140 4,480 5,602 7,405 8,948 10,087Mississippi 609 460 404 196 ‡ ‡ 530 459 519 515 782
Missouri 6,154 5,294 4,513 4,544 5,056 4,537 3,937 5,286 6,146 6,595 6,818Montana 1,476 1,128 964 517 425 498 763 909 1,009 1,013 1,133Nebraska 2,094 1,658 1,591 1,147 1,068 1,191 1,645 2,081 2,500 2,323 2,668Nevada 3,419 3,180 2,775 1,965 1,891 1,884 1,951 2,267 2,230 2,178 2,003New Hampshire 56 75 53 51 45 45 30 34 45 47 89
New Jersey 173 191 203 189 248 246 274 242 392 255 359New Mexico 703 910 1,018 845 631 492 845 855 796 528 304New York 704 610 783 694 805 938 1,132 1,267 1,341 1,602 1,903North Carolina 487 302 319 495 791 851 1,064 936 1,238 1,166 1,308North Dakota 417 378 249 191 128 146 117 246 410 655 592
Ohio 835 752 744 586 680 613 711 698 651 600 590Oklahoma 4,194 3,728 3,365 2,687 2,964 2,740 2,729 2,991 3,268 3,808 4,359Oregon 10,075 9,267 8,864 7,499 6,843 7,149 6,998 7,240 7,571 5,626 ‡ Pennsylvania 448 393 358 308 239 242 235 279 378 487 ‡ Puerto Rico - - - - 2 1 - - - - 1 2 - - 1 3
Rhode Island 16 23 28 32 29 11 26 25 39 37 46South Carolina 778 712 605 596 551 560 622 839 797 ‡ ‡ South Dakota 1,345 1,158 911 624 601 657 722 777 863 1,098 1,368Tennessee 541 414 287 277 338 525 938 851 974 1,085 1,298Texas 5,824 5,431 4,724 3,677 3,808 3,462 3,829 4,604 5,629 6,219 6,233
Utah 3,567 3,989 3,605 2,944 2,457 2,496 2,574 2,577 2,807 2,560 2,889Vermont 38 19 30 19 19 36 27 34 40 45 45Virginia 514 350 363 282 298 283 325 407 396 456 630Washington 6,464 6,551 6,378 5,232 4,521 4,715 4,645 4,696 5,139 5,469 5,516West Virginia 265 338 259 232 114 69 72 18 48 67 69
Wisconsin 483 443 355 275 289 308 315 470 487 575 663Wyoming 1,295 872 647 560 659 653 639 638 811 924 1,086
SOURCE: Center for Behavioral Health Statistics and Quality, Substance Abuse and Mental Health Services Administration, Treatment Episode Data Set (TEDS). Data received through 11.01.16.
Table 1.8a. Primary methamphetamine/amphetamine admissions aged 12 and older, by Census region, Census division, and state or jurisdiction: Number, 2005-2015 (continued)
Census region, Census division, and state or jurisdiction
Number of admissions aged 12 and older
- - Quantity is zero; ‡ No data, or less than a full calendar year of data, submitted.
NOTE: Based on administrative data reported to TEDS by all reporting states and jurisdictions. Comparisons among states should be made with caution.
1 Admissions reported for Census regions and divisions will not sum to the total number of admissions because Puerto Rico is not included in any Census region or division.
71
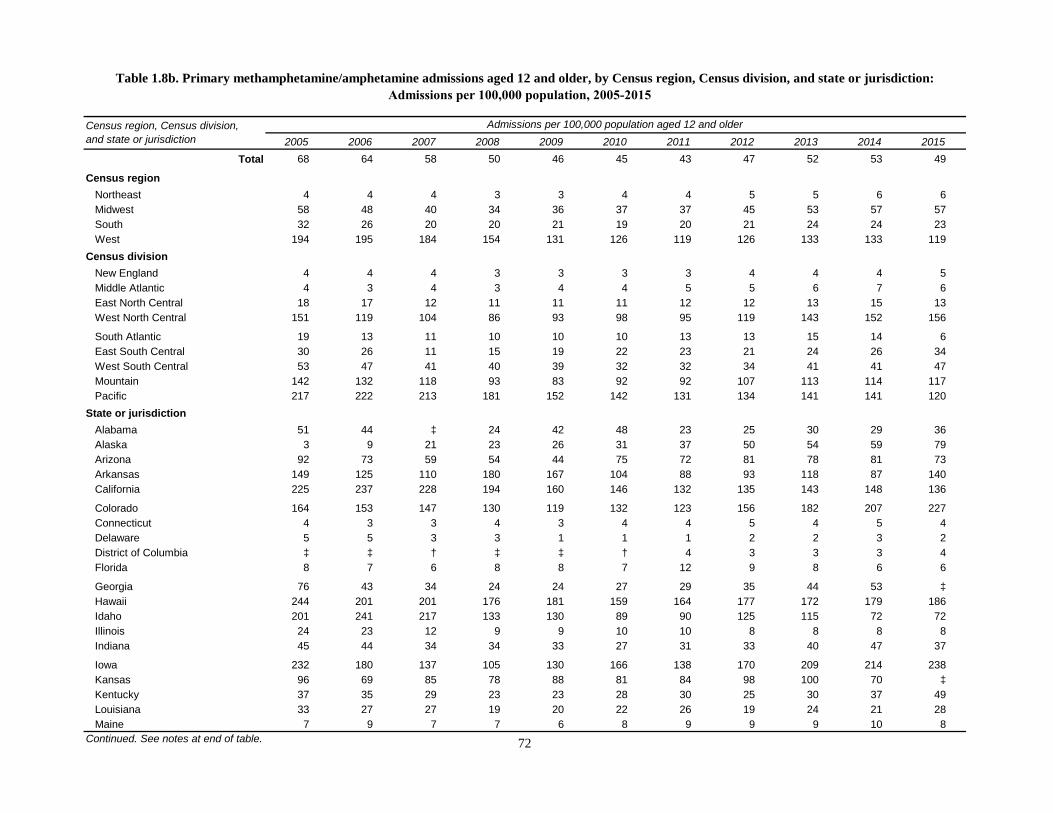
2005 2006 2007 2008 2009 2010 2011 2012 2013 2014 2015Total 68 64 58 50 46 45 43 47 52 53 49
Census regionNortheast 4 4 4 3 3 4 4 5 5 6 6Midwest 58 48 40 34 36 37 37 45 53 57 57South 32 26 20 20 21 19 20 21 24 24 23West 194 195 184 154 131 126 119 126 133 133 119
Census divisionNew England 4 4 4 3 3 3 3 4 4 4 5Middle Atlantic 4 3 4 3 4 4 5 5 6 7 6East North Central 18 17 12 11 11 11 12 12 13 15 13West North Central 151 119 104 86 93 98 95 119 143 152 156
South Atlantic 19 13 11 10 10 10 13 13 15 14 6East South Central 30 26 11 15 19 22 23 21 24 26 34West South Central 53 47 41 40 39 32 32 34 41 41 47Mountain 142 132 118 93 83 92 92 107 113 114 117Pacific 217 222 213 181 152 142 131 134 141 141 120
State or jurisdictionAlabama 51 44 ‡ 24 42 48 23 25 30 29 36Alaska 3 9 21 23 26 31 37 50 54 59 79Arizona 92 73 59 54 44 75 72 81 78 81 73Arkansas 149 125 110 180 167 104 88 93 118 87 140California 225 237 228 194 160 146 132 135 143 148 136
Colorado 164 153 147 130 119 132 123 156 182 207 227Connecticut 4 3 3 4 3 4 4 5 4 5 4Delaware 5 5 3 3 1 1 1 2 2 3 2District of Columbia ‡ ‡ † ‡ ‡ † 4 3 3 3 4Florida 8 7 6 8 8 7 12 9 8 6 6
Georgia 76 43 34 24 24 27 29 35 44 53 ‡ Hawaii 244 201 201 176 181 159 164 177 172 179 186Idaho 201 241 217 133 130 89 90 125 115 72 72Illinois 24 23 12 9 9 10 10 8 8 8 8Indiana 45 44 34 34 33 27 31 33 40 47 37
Iowa 232 180 137 105 130 166 138 170 209 214 238Kansas 96 69 85 78 88 81 84 98 100 70 ‡ Kentucky 37 35 29 23 23 28 30 25 30 37 49Louisiana 33 27 27 19 20 22 26 19 24 21 28Maine 7 9 7 7 6 8 9 9 9 10 8
Continued. See notes at end of table.
Table 1.8b. Primary methamphetamine/amphetamine admissions aged 12 and older, by Census region, Census division, and state or jurisdiction: Admissions per 100,000 population, 2005-2015
Admissions per 100,000 population aged 12 and olderCensus region, Census division, and state or jurisdiction
72
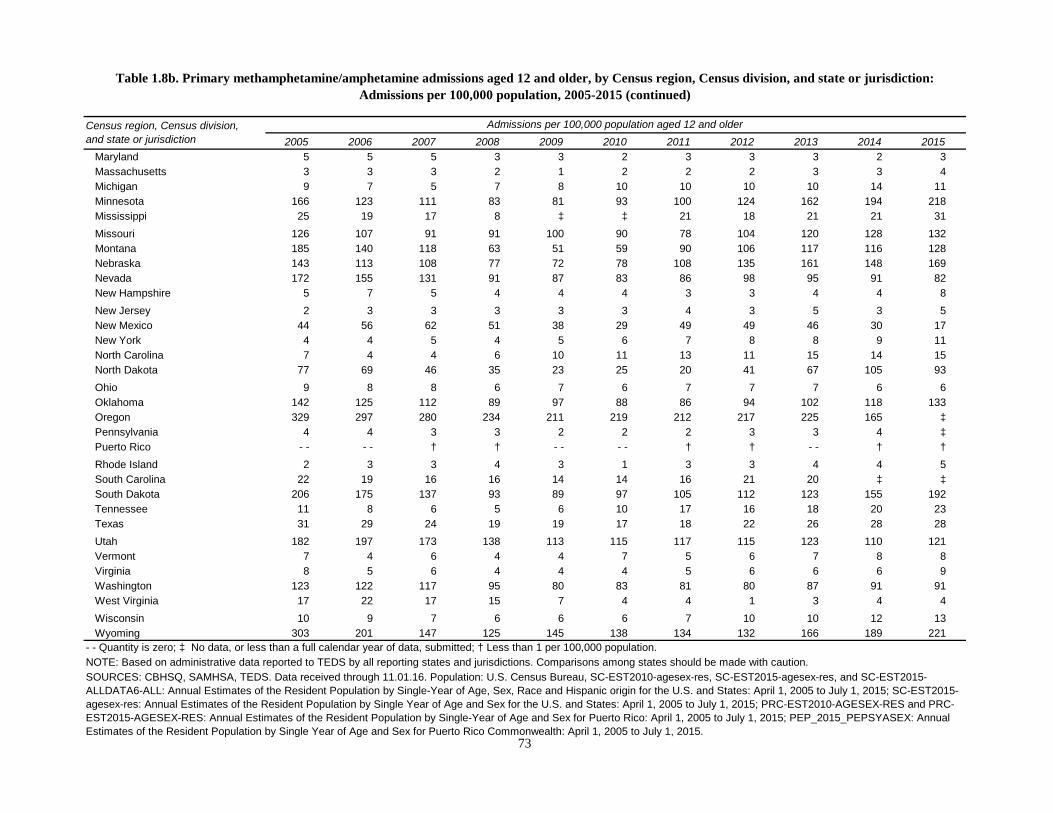
2005 2006 2007 2008 2009 2010 2011 2012 2013 2014 2015Maryland 5 5 5 3 3 2 3 3 3 2 3Massachusetts 3 3 3 2 1 2 2 2 3 3 4Michigan 9 7 5 7 8 10 10 10 10 14 11Minnesota 166 123 111 83 81 93 100 124 162 194 218Mississippi 25 19 17 8 ‡ ‡ 21 18 21 21 31Missouri 126 107 91 91 100 90 78 104 120 128 132Montana 185 140 118 63 51 59 90 106 117 116 128Nebraska 143 113 108 77 72 78 108 135 161 148 169Nevada 172 155 131 91 87 83 86 98 95 91 82New Hampshire 5 7 5 4 4 4 3 3 4 4 8New Jersey 2 3 3 3 3 3 4 3 5 3 5New Mexico 44 56 62 51 38 29 49 49 46 30 17New York 4 4 5 4 5 6 7 8 8 9 11North Carolina 7 4 4 6 10 11 13 11 15 14 15North Dakota 77 69 46 35 23 25 20 41 67 105 93Ohio 9 8 8 6 7 6 7 7 7 6 6Oklahoma 142 125 112 89 97 88 86 94 102 118 133Oregon 329 297 280 234 211 219 212 217 225 165 ‡ Pennsylvania 4 4 3 3 2 2 2 3 3 4 ‡ Puerto Rico - - - - † † - - - - † † - - † † Rhode Island 2 3 3 4 3 1 3 3 4 4 5South Carolina 22 19 16 16 14 14 16 21 20 ‡ ‡ South Dakota 206 175 137 93 89 97 105 112 123 155 192Tennessee 11 8 6 5 6 10 17 16 18 20 23Texas 31 29 24 19 19 17 18 22 26 28 28Utah 182 197 173 138 113 115 117 115 123 110 121Vermont 7 4 6 4 4 7 5 6 7 8 8Virginia 8 5 6 4 4 4 5 6 6 6 9Washington 123 122 117 95 80 83 81 80 87 91 91West Virginia 17 22 17 15 7 4 4 1 3 4 4Wisconsin 10 9 7 6 6 6 7 10 10 12 13Wyoming 303 201 147 125 145 138 134 132 166 189 221
SOURCES: CBHSQ, SAMHSA, TEDS. Data received through 11.01.16. Population: U.S. Census Bureau, SC-EST2010-agesex-res, SC-EST2015-agesex-res, and SC-EST2015-ALLDATA6-ALL: Annual Estimates of the Resident Population by Single-Year of Age, Sex, Race and Hispanic origin for the U.S. and States: April 1, 2005 to July 1, 2015; SC-EST2015-agesex-res: Annual Estimates of the Resident Population by Single Year of Age and Sex for the U.S. and States: April 1, 2005 to July 1, 2015; PRC-EST2010-AGESEX-RES and PRC-EST2015-AGESEX-RES: Annual Estimates of the Resident Population by Single-Year of Age and Sex for Puerto Rico: April 1, 2005 to July 1, 2015; PEP_2015_PEPSYASEX: Annual Estimates of the Resident Population by Single Year of Age and Sex for Puerto Rico Commonwealth: April 1, 2005 to July 1, 2015.
Census region, Census division, and state or jurisdiction
Admissions per 100,000 population aged 12 and older
NOTE: Based on administrative data reported to TEDS by all reporting states and jurisdictions. Comparisons among states should be made with caution.- - Quantity is zero; ‡ No data, or less than a full calendar year of data, submitted; † Less than 1 per 100,000 population.
Table 1.8b. Primary methamphetamine/amphetamine admissions aged 12 and older, by Census region, Census division, and state or jurisdiction: Admissions per 100,000 population, 2005-2015 (continued)
73

2005 2006 2007 2008 2009 2010 2011 2012 2013 2014 2015Total 71,499 85,342 101,360 127,666 149,891 172,841 200,424 183,244 163,602 134,827 124,943
Census region1
Northeast 23,090 28,326 34,319 39,799 43,764 54,828 62,464 59,696 53,994 43,661 35,580Midwest 13,448 16,591 20,196 24,453 30,034 33,791 35,149 33,260 31,066 28,073 24,817South 26,375 29,444 32,998 45,833 55,601 60,820 79,613 65,958 56,238 42,504 47,809West 8,584 10,975 13,813 17,545 20,457 23,345 23,171 24,316 22,290 20,571 16,720
Census divisionNew England 10,123 13,672 15,301 17,135 17,921 21,005 23,044 21,590 19,362 15,905 13,238Middle Atlantic 12,967 14,654 19,018 22,664 25,843 33,823 39,420 38,106 34,632 27,756 22,342East North Central 9,749 12,355 15,073 17,614 20,744 23,525 24,761 22,562 20,305 18,486 15,628West North Central 3,699 4,236 5,123 6,839 9,290 10,266 10,388 10,698 10,761 9,587 9,189
South Atlantic 14,565 16,695 19,180 27,210 34,757 38,509 55,870 44,104 36,541 25,177 30,820East South Central 5,913 6,587 5,901 8,047 9,662 12,308 12,781 11,591 11,127 10,514 10,511West South Central 5,897 6,162 7,917 10,576 11,182 10,003 10,962 10,263 8,570 6,813 6,478Mountain 2,703 3,337 3,996 4,730 5,928 7,206 7,653 8,897 8,019 7,258 5,967Pacific 5,881 7,638 9,817 12,815 14,529 16,139 15,518 15,419 14,271 13,313 10,753
State or jurisdictionAlabama 1,584 1,559 ‡ 1,468 2,155 2,685 1,176 1,539 1,758 1,533 1,895Alaska 55 69 124 174 323 357 391 342 277 270 241Arizona 157 271 357 495 720 1,392 1,471 1,772 1,587 1,562 1,140Arkansas 762 778 1,214 2,885 2,696 1,707 1,524 2,043 1,987 1,329 1,666California 3,219 5,031 6,306 7,624 8,409 9,662 9,199 9,285 8,628 8,500 8,023
Colorado 869 1,056 1,222 1,592 1,954 2,378 2,516 3,291 3,130 2,894 2,381Connecticut 1,722 1,790 2,050 2,369 2,420 2,567 3,494 3,460 3,450 3,202 2,934Delaware 312 568 820 1,101 1,397 1,346 1,687 1,432 860 669 423District of Columbia ‡ ‡ - - ‡ ‡ 47 66 52 47 62 113Florida 2,553 3,709 4,408 8,789 13,195 15,557 27,063 16,583 12,857 7,989 6,175
Georgia 2,177 2,067 1,683 1,949 2,422 3,064 3,248 3,412 3,248 3,173 ‡ Hawaii 155 133 173 195 212 249 303 314 303 288 278Idaho 129 244 213 279 356 326 358 501 327 150 171Illinois 899 1,423 1,432 1,660 1,709 2,404 2,303 1,679 1,592 1,257 957Indiana 1,810 2,214 2,346 2,731 2,426 2,289 2,723 3,121 3,212 3,089 2,436
Iowa 438 499 502 622 1,034 1,393 1,269 1,348 1,480 1,375 1,400Kansas 255 250 345 579 835 776 821 829 726 424 ‡ Kentucky 2,183 2,946 3,626 4,298 5,043 6,239 6,685 4,887 4,050 3,889 3,731Louisiana 2,269 2,004 2,620 2,845 3,179 3,328 4,328 3,092 2,184 1,289 977Maine 2,450 3,121 3,947 4,630 4,546 4,316 5,144 5,372 4,947 3,727 2,803
Number of admissions aged 12 and olderCensus region, Census division, and state or jurisdiction
Continued. See notes at end of table.
Table 1.9a. Primary non-heroin opiates/synthetics admissions aged 12 and older, by Census region, Census division, and state or jurisdiction: Number, 2005-2015
74

2005 2006 2007 2008 2009 2010 2011 2012 2013 2014 2015Maryland 3,201 3,740 4,447 4,962 5,988 5,203 8,665 8,468 5,927 3,879 14,700Massachusetts 3,697 5,926 6,250 6,455 7,499 9,675 9,649 7,981 6,100 4,640 4,244Michigan 3,412 4,599 5,383 6,301 7,289 8,007 8,374 7,807 7,620 8,413 7,626Minnesota 1,466 1,771 2,465 3,012 3,900 4,592 4,976 4,811 4,734 4,159 4,155Mississippi 568 553 532 259 ‡ ‡ 1,036 962 834 562 559Missouri 1,158 1,263 1,347 2,044 2,848 2,594 2,190 2,497 2,677 2,411 2,414Montana 402 488 711 599 776 841 920 981 768 578 502Nebraska 205 208 224 260 290 396 623 648 592 595 651Nevada 289 265 333 399 543 543 586 616 535 464 270New Hampshire 225 308 414 696 908 1,163 967 857 926 614 352New Jersey 2,229 2,718 3,518 4,186 5,341 7,386 8,883 8,675 7,999 4,589 4,881New Mexico 196 242 273 291 411 526 675 678 563 630 520New York 6,692 7,425 10,260 11,983 14,623 19,219 24,025 24,022 21,462 18,446 17,461North Carolina 1,717 1,601 2,088 3,158 5,091 7,196 8,948 8,239 8,398 5,822 6,007North Dakota 38 86 72 109 121 157 118 184 190 246 193Ohio 2,847 3,104 4,659 5,697 7,774 9,116 9,598 7,937 6,111 4,595 3,598Oklahoma 768 870 1,141 1,438 1,533 1,645 1,511 1,561 1,420 1,599 1,597Oregon 1,043 1,267 1,836 2,305 2,649 2,759 2,963 2,860 2,589 1,722 ‡ Pennsylvania 4,046 4,511 5,240 6,495 5,879 7,218 6,512 5,409 5,171 4,721 ‡ Puerto Rico 2 6 34 36 35 57 27 14 14 18 17Rhode Island 944 1,109 1,113 1,180 1,044 1,374 1,535 1,482 1,349 1,130 971South Carolina 1,242 1,155 1,284 1,618 1,801 1,981 2,053 2,282 1,829 ‡ ‡ South Dakota 139 159 168 213 262 358 391 381 362 377 376Tennessee2 1,578 1,529 1,743 2,022 2,464 3,384 3,884 4,203 4,485 4,530 4,326Texas 2,098 2,510 2,942 3,408 3,774 3,323 3,599 3,567 2,979 2,596 2,238Utah 555 694 766 898 909 942 877 817 757 655 631Vermont 1,085 1,418 1,527 1,805 1,504 1,910 2,255 2,438 2,590 2,592 1,934Virginia 1,730 1,531 1,601 1,933 2,306 2,776 2,980 3,014 2,648 2,646 2,657Washington 1,409 1,138 1,378 2,517 2,936 3,112 2,662 2,618 2,474 2,533 2,211West Virginia 1,633 2,324 2,849 3,700 2,557 1,339 1,160 622 727 937 745Wisconsin 781 1,015 1,253 1,225 1,546 1,709 1,763 2,018 1,770 1,132 1,011Wyoming 106 77 121 177 259 258 250 241 352 325 352
SOURCE: Center for Behavioral Health Statistics and Quality, Substance Abuse and Mental Health Services Administration, Treatment Episode Data Set (TEDS). Data received through 11.01.16.
Census region, Census division, and state or jurisdiction
Number of admissions aged 12 and older
2 Tennessee included heroin admissions in other opiates through June 2009. In this report, Tennessee's 2009 heroin admissions are still included in the other opiates category since there is less than a full year of disaggregated heroin data.NOTES: Based on administrative data reported to TEDS by all reporting states and jurisdictions. Comparisons among states should be made with caution. Non-heroin opiates/synthetics include codeine, hydrocodone, hydromorphone, meperidine, morphine, opium, oxycodone, pentazocine, propoxyphene, tramadol, and any other drug with morphine-like effects. Non-prescription use of methadone is not included.
1 Admissions reported for Census regions and divisions will not sum to the total number of admissions because Puerto Rico is not included in any Census region or division.- - Quantity is zero; ‡ No data, or less than a full calendar year of data, submitted.
Table 1.9a. Primary non-heroin opiates/synthetics admissions aged 12 and older, by Census region, Census division, and state or jurisdiction: Number, 2005-2015 (continued)
75

2005 2006 2007 2008 2009 2010 2011 2012 2013 2014 2015Total 29 34 40 49 58 66 75 68 60 49 45
Census regionNortheast 50 61 73 85 93 116 131 124 112 90 73Midwest 24 30 36 44 53 60 62 58 54 49 43South 29 32 36 49 59 63 82 67 56 42 47West 15 19 24 30 34 39 38 39 36 32 26
Census divisionNew England 83 112 125 139 145 169 184 171 153 125 103Middle Atlantic 38 43 55 65 74 97 112 108 98 78 63East North Central 25 32 39 45 53 60 63 57 51 46 39West North Central 22 25 30 40 54 60 60 61 61 54 52South Atlantic 31 35 39 55 70 76 109 85 69 47 57
East South Central 40 44 39 53 63 79 82 74 70 66 66West South Central 21 22 28 37 38 33 36 33 27 21 20Mountain 16 19 23 26 33 39 41 47 42 37 30Pacific 15 19 24 31 35 38 37 36 33 30 24
State or jurisdictionAlabama 41 40 ‡ 37 54 66 29 38 43 37 46Alaska 10 12 22 31 56 61 66 57 45 44 39Arizona 3 5 7 9 13 26 27 32 29 28 20Arkansas 33 33 51 120 112 70 62 82 80 53 66California 11 17 21 25 27 31 29 29 27 26 24
Colorado 22 27 30 39 47 56 59 75 70 64 52Connecticut 59 61 69 80 81 84 113 112 111 103 94Delaware 44 79 112 149 187 176 218 183 109 84 52District of Columbia ‡ ‡ - - ‡ ‡ 9 12 9 8 11 19Florida 17 24 28 56 83 96 164 99 76 46 35
Georgia 29 27 21 24 30 38 40 41 39 38 ‡ Hawaii 14 12 16 18 19 21 26 27 25 24 23Idaho 11 20 17 22 28 25 28 38 25 11 12Illinois 9 13 13 15 16 22 21 15 15 12 9Indiana 35 42 44 51 45 42 50 57 58 56 44
Table 1.9b. Primary non-heroin opiates/synthetics admissions aged 12 and older, by Census region, Census division, and state or jurisdiction: Admissions per 100,000 population, 2005-2015
Census region, Census division, and state or jurisdiction
Admissions per 100,000 population aged 12 and older
Continued. See notes at end of table.
76
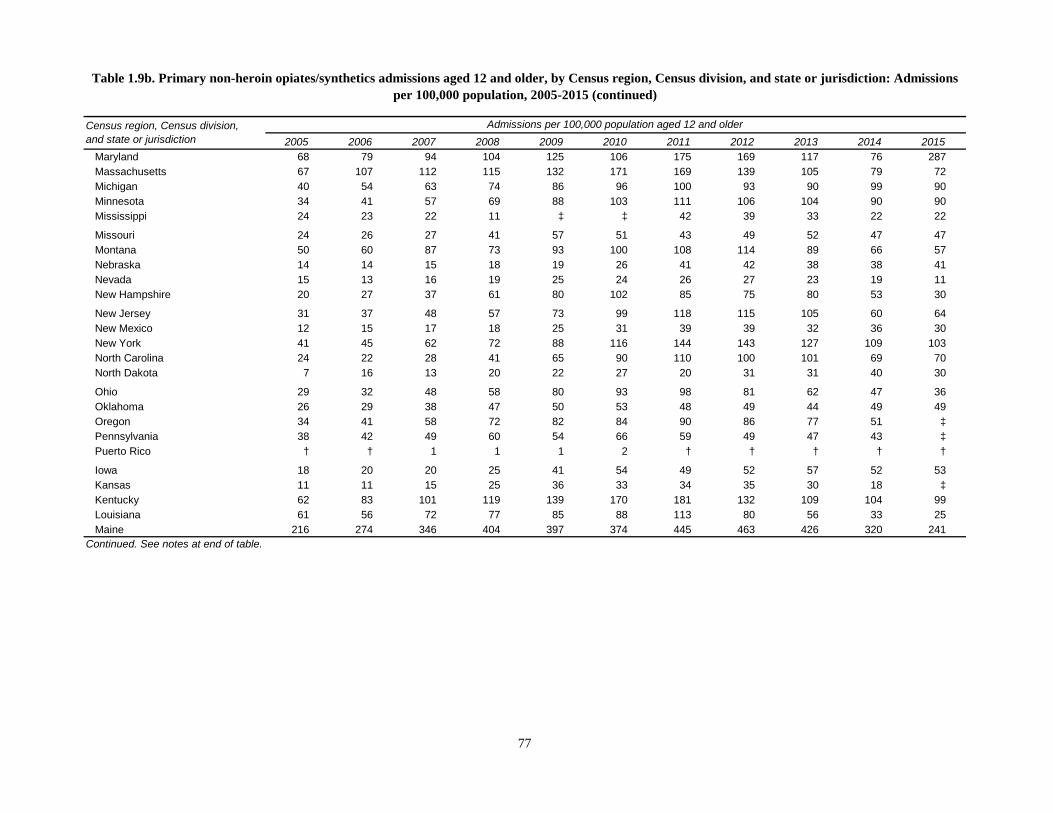
2005 2006 2007 2008 2009 2010 2011 2012 2013 2014 2015Maryland 68 79 94 104 125 106 175 169 117 76 287Massachusetts 67 107 112 115 132 171 169 139 105 79 72Michigan 40 54 63 74 86 96 100 93 90 99 90Minnesota 34 41 57 69 88 103 111 106 104 90 90Mississippi 24 23 22 11 ‡ ‡ 42 39 33 22 22
Missouri 24 26 27 41 57 51 43 49 52 47 47Montana 50 60 87 73 93 100 108 114 89 66 57Nebraska 14 14 15 18 19 26 41 42 38 38 41Nevada 15 13 16 19 25 24 26 27 23 19 11New Hampshire 20 27 37 61 80 102 85 75 80 53 30
New Jersey 31 37 48 57 73 99 118 115 105 60 64New Mexico 12 15 17 18 25 31 39 39 32 36 30New York 41 45 62 72 88 116 144 143 127 109 103North Carolina 24 22 28 41 65 90 110 100 101 69 70North Dakota 7 16 13 20 22 27 20 31 31 40 30
Ohio 29 32 48 58 80 93 98 81 62 47 36Oklahoma 26 29 38 47 50 53 48 49 44 49 49Oregon 34 41 58 72 82 84 90 86 77 51 ‡ Pennsylvania 38 42 49 60 54 66 59 49 47 43 ‡ Puerto Rico † † 1 1 1 2 † † † † †
Iowa 18 20 20 25 41 54 49 52 57 52 53Kansas 11 11 15 25 36 33 34 35 30 18 ‡ Kentucky 62 83 101 119 139 170 181 132 109 104 99Louisiana 61 56 72 77 85 88 113 80 56 33 25Maine 216 274 346 404 397 374 445 463 426 320 241
Table 1.9b. Primary non-heroin opiates/synthetics admissions aged 12 and older, by Census region, Census division, and state or jurisdiction: Admissions per 100,000 population, 2005-2015 (continued)
Census region, Census division, and state or jurisdiction
Admissions per 100,000 population aged 12 and older
Continued. See notes at end of table.
77
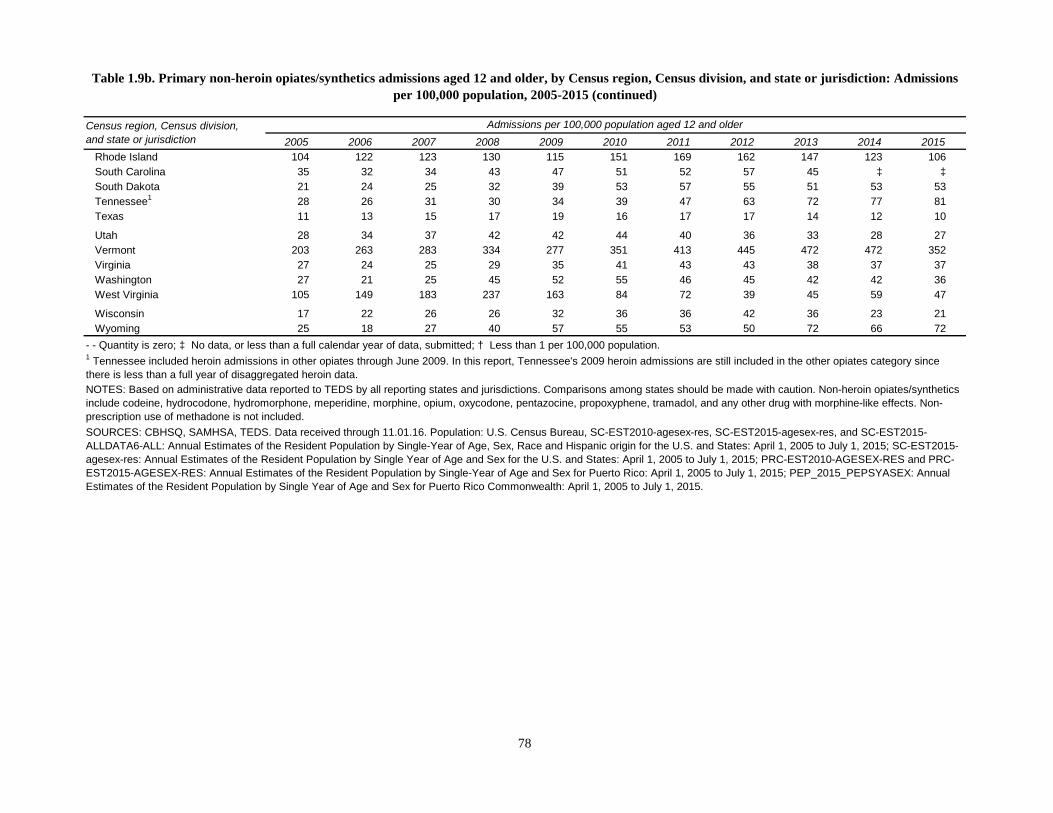
2005 2006 2007 2008 2009 2010 2011 2012 2013 2014 2015Rhode Island 104 122 123 130 115 151 169 162 147 123 106South Carolina 35 32 34 43 47 51 52 57 45 ‡ ‡ South Dakota 21 24 25 32 39 53 57 55 51 53 53Tennessee1 28 26 31 30 34 39 47 63 72 77 81Texas 11 13 15 17 19 16 17 17 14 12 10
Utah 28 34 37 42 42 44 40 36 33 28 27Vermont 203 263 283 334 277 351 413 445 472 472 352Virginia 27 24 25 29 35 41 43 43 38 37 37Washington 27 21 25 45 52 55 46 45 42 42 36West Virginia 105 149 183 237 163 84 72 39 45 59 47
Wisconsin 17 22 26 26 32 36 36 42 36 23 21Wyoming 25 18 27 40 57 55 53 50 72 66 72
SOURCES: CBHSQ, SAMHSA, TEDS. Data received through 11.01.16. Population: U.S. Census Bureau, SC-EST2010-agesex-res, SC-EST2015-agesex-res, and SC-EST2015-ALLDATA6-ALL: Annual Estimates of the Resident Population by Single-Year of Age, Sex, Race and Hispanic origin for the U.S. and States: April 1, 2005 to July 1, 2015; SC-EST2015-agesex-res: Annual Estimates of the Resident Population by Single Year of Age and Sex for the U.S. and States: April 1, 2005 to July 1, 2015; PRC-EST2010-AGESEX-RES and PRC-EST2015-AGESEX-RES: Annual Estimates of the Resident Population by Single-Year of Age and Sex for Puerto Rico: April 1, 2005 to July 1, 2015; PEP_2015_PEPSYASEX: Annual Estimates of the Resident Population by Single Year of Age and Sex for Puerto Rico Commonwealth: April 1, 2005 to July 1, 2015.
- - Quantity is zero; ‡ No data, or less than a full calendar year of data, submitted; † Less than 1 per 100,000 population.1 Tennessee included heroin admissions in other opiates through June 2009. In this report, Tennessee's 2009 heroin admissions are still included in the other opiates category since there is less than a full year of disaggregated heroin data.NOTES: Based on administrative data reported to TEDS by all reporting states and jurisdictions. Comparisons among states should be made with caution. Non-heroin opiates/synthetics include codeine, hydrocodone, hydromorphone, meperidine, morphine, opium, oxycodone, pentazocine, propoxyphene, tramadol, and any other drug with morphine-like effects. Non-prescription use of methadone is not included.
Table 1.9b. Primary non-heroin opiates/synthetics admissions aged 12 and older, by Census region, Census division, and state or jurisdiction: Admissions per 100,000 population, 2005-2015 (continued)
Census region, Census division, and state or jurisdiction
Admissions per 100,000 population aged 12 and older
78

Out-patient
Intensive outpatient
Free-standing
residentialHospital inpatient
Ambu-latory
Short-term(<30 days)
Long-term(30+ days)
Hospital (non-detox)
Out-patient
Detox-ification
Resi-dential
Total 1,537,025 577,631 182,217 280,004 43,582 10,392 138,248 103,914 3,793 163,787 18,679 14,778
Census region3
Northeast 545,929 185,661 43,291 112,267 37,154 3,298 52,607 34,199 1,278 58,755 6,332 11,087Midwest 303,945 118,038 67,056 30,817 1,596 4,539 34,724 21,375 643 17,540 5,131 2,486South 341,304 133,734 39,983 55,074 3,996 2,266 35,875 10,959 1,159 56,416 973 869West 343,504 139,319 31,874 81,846 437 284 15,042 37,239 594 30,309 6,233 327
Census divisionNew England 195,966 56,562 19,153 62,782 3,293 644 12,452 12,372 1,264 22,166 3,555 1,723Middle Atlantic 349,963 129,099 24,138 49,485 33,861 2,654 40,155 21,827 14 36,589 2,777 9,364East North Central 152,471 83,112 13,374 17,662 962 879 11,714 7,888 124 11,370 4,219 1,167West North Central 151,474 34,926 53,682 13,155 634 3,660 23,010 13,487 519 6,170 912 1,319South Atlantic 217,422 87,517 22,592 31,712 2,461 1,225 11,805 4,433 1,159 53,732 241 545
East South Central 49,814 17,899 7,969 9,673 1,508 - - 7,802 3,025 - - 1,559 307 72West South Central 74,068 28,318 9,422 13,689 27 1,041 16,268 3,501 - - 1,125 425 252Mountain 145,723 60,132 10,366 56,919 315 122 8,417 4,297 594 4,404 19 138Pacific 197,781 79,187 21,508 24,927 122 162 6,625 32,942 - - 25,905 6,214 189
State or jurisdictionAlabama 11,074 3,767 3,023 586 - - - - 1,277 1,948 - - 462 4 7Alaska 6,496 2,882 860 1,507 122 - - 123 913 - - 74 10 5Arizona 20,865 18,520 3 276 15 - - 576 13 113 1,328 7 14Arkansas 11,753 3,708 2,931 1,690 - - - - 2,495 - - - - 418 323 188
California 150,071 63,371 5,310 22,391 - - 162 1,071 29,425 - - 21,954 6,204 183Colorado 87,689 24,200 3,946 50,344 258 1 4,941 2,210 1 1,788 - - - - Connecticut 67,706 19,753 15,677 11,922 2,708 538 2,994 4,414 1,253 8,447 - - - - Delaware 7,900 3,770 991 1,502 - - 11 - - 519 - - 1,056 51 - - District of Columbia 6,053 1,246 738 1,184 640 - - 1,498 73 - - 137 41 496
Florida 30,104 6,580 167 19,951 - - 135 325 2,116 - - 633 148 49Georgia ‡ ‡ ‡ ‡ ‡ ‡ ‡ ‡ ‡ ‡ ‡ ‡Hawaii 6,371 2,338 1,604 1,029 - - - - - - 1,356 - - 43 - - 1Idaho 2,684 1,345 700 52 - - - - 559 20 - - 8 - - - - Illinois 20,587 10,173 2,609 2,156 - - - - 3,488 364 - - 1,637 15 145Indiana 21,362 17,595 611 1,420 213 - - 677 383 50 402 8 3
Census region, Census division, and state or jurisdiction No. of
admis-sions 12 and older
Ambulatory 1Detoxification
(24-hour service) 1 Rehabilitation/residential 1Medication-assisted
opioid therapy 2
Table 2.1a. Admissions aged 12 and older, by type of service at admission and Census region, Census division, and state or jurisdiction: Number, 2015
Type of service at admission
Continued. See notes at end of table.79
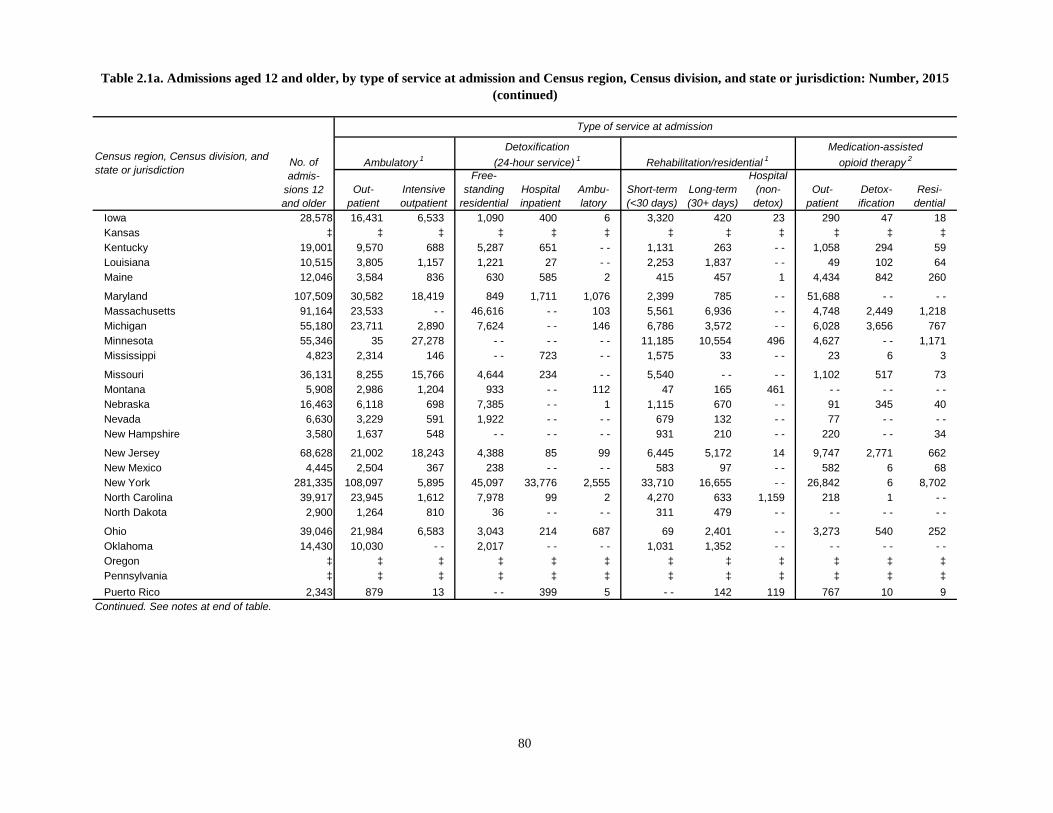
Out-patient
Intensive outpatient
Free-standing
residentialHospital inpatient
Ambu-latory
Short-term(<30 days)
Long-term(30+ days)
Hospital (non-detox)
Out-patient
Detox-ification
Resi-dential
Iowa 28,578 16,431 6,533 1,090 400 6 3,320 420 23 290 47 18Kansas ‡ ‡ ‡ ‡ ‡ ‡ ‡ ‡ ‡ ‡ ‡ ‡Kentucky 19,001 9,570 688 5,287 651 - - 1,131 263 - - 1,058 294 59Louisiana 10,515 3,805 1,157 1,221 27 - - 2,253 1,837 - - 49 102 64Maine 12,046 3,584 836 630 585 2 415 457 1 4,434 842 260
Maryland 107,509 30,582 18,419 849 1,711 1,076 2,399 785 - - 51,688 - - - - Massachusetts 91,164 23,533 - - 46,616 - - 103 5,561 6,936 - - 4,748 2,449 1,218Michigan 55,180 23,711 2,890 7,624 - - 146 6,786 3,572 - - 6,028 3,656 767Minnesota 55,346 35 27,278 - - - - - - 11,185 10,554 496 4,627 - - 1,171Mississippi 4,823 2,314 146 - - 723 - - 1,575 33 - - 23 6 3
Missouri 36,131 8,255 15,766 4,644 234 - - 5,540 - - - - 1,102 517 73Montana 5,908 2,986 1,204 933 - - 112 47 165 461 - - - - - - Nebraska 16,463 6,118 698 7,385 - - 1 1,115 670 - - 91 345 40Nevada 6,630 3,229 591 1,922 - - - - 679 132 - - 77 - - - - New Hampshire 3,580 1,637 548 - - - - - - 931 210 - - 220 - - 34
New Jersey 68,628 21,002 18,243 4,388 85 99 6,445 5,172 14 9,747 2,771 662New Mexico 4,445 2,504 367 238 - - - - 583 97 - - 582 6 68New York 281,335 108,097 5,895 45,097 33,776 2,555 33,710 16,655 - - 26,842 6 8,702North Carolina 39,917 23,945 1,612 7,978 99 2 4,270 633 1,159 218 1 - - North Dakota 2,900 1,264 810 36 - - - - 311 479 - - - - - - - -
Ohio 39,046 21,984 6,583 3,043 214 687 69 2,401 - - 3,273 540 252Oklahoma 14,430 10,030 - - 2,017 - - - - 1,031 1,352 - - - - - - - - Oregon ‡ ‡ ‡ ‡ ‡ ‡ ‡ ‡ ‡ ‡ ‡ ‡Pennsylvania ‡ ‡ ‡ ‡ ‡ ‡ ‡ ‡ ‡ ‡ ‡ ‡Puerto Rico 2,343 879 13 - - 399 5 - - 142 119 767 10 9
Continued. See notes at end of table.
Census region, Census division, and state or jurisdiction
No. of admis-
sions 12 and older
Ambulatory 1Detoxification
(24-hour service) 1 Rehabilitation/residential 1Medication-assisted
opioid therapy 2
Type of service at admission
Table 2.1a. Admissions aged 12 and older, by type of service at admission and Census region, Census division, and state or jurisdiction: Number, 2015 (continued)
80

Out-patient
Intensive outpatient
Free-standing
residentialHospital inpatient
Ambu-latory
Short-term(<30 days)
Long-term(30+ days)
Hospital (non-detox)
Out-patient
Detox-ification
Resi-dential
Rhode Island 11,152 3,439 1,604 2,262 - - 1 1,317 269 10 2,121 129 - - South Carolina ‡ ‡ ‡ ‡ ‡ ‡ ‡ ‡ ‡ ‡ ‡ ‡South Dakota 12,056 2,823 2,597 - - - - 3,653 1,539 1,364 - - 60 3 17Tennessee 14,916 2,248 4,112 3,800 134 - - 3,819 781 - - 16 3 3Texas 37,370 10,775 5,334 8,761 - - 1,041 10,489 312 - - 658 - - - -
Utah 11,939 5,055 2,147 3,128 - - 9 701 216 - - 621 6 56Vermont 10,318 4,616 488 1,352 - - - - 1,234 86 - - 2,196 135 211Virginia 22,910 18,870 403 165 11 - - 3,296 165 - - - - - - - - Washington 34,843 10,596 13,734 - - - - - - 5,431 1,248 - - 3,834 - - - - West Virginia 3,029 2,524 262 83 - - 1 17 142 - - - - - - - -
Wisconsin 16,296 9,649 681 3,419 535 46 694 1,168 74 30 - - - - Wyoming 5,563 2,293 1,408 26 42 - - 331 1,444 19 - - - - - -
- - Quantity is zero; ‡ No data, or less than a full calendar year of data, submitted.1 Ambulatory, detoxification, and rehabilitation/residential types of service exclude medication-assisted opioid therapy.2 Therapy with methadone or buprenorphine is part of client's treatment plan.
NOTE: Based on administrative data reported to TEDS by all reporting states and jurisdictions. Comparisons among states should be made with caution.SOURCE: Center for Behavioral Health Statistics and Quality, Substance Abuse and Mental Health Services Administration, Treatment Episode Data Set (TEDS). Data received through 11.01.16.
3 Admissions reported for Census regions and divisions will not sum to the total number of admissions because Puerto Rico is not included in any Census region or division.
Medication-assisted opioid therapy 2
Table 2.1a. Admissions aged 12 and older, by type of service at admission and Census region, Census division, and state or jurisdiction: Number, 2015 (continued)
Type of service at admission
Census region, Census division, and state or jurisdiction No. of
admis-sions 12 and older
Ambulatory 1Detoxification
(24-hour service) 1 Rehabilitation/residential 1
81

Out-patient
Intensive outpatient
Free-standing
residentialHospital inpatient
Ambu-latory
Short-term(<30 days)
Long-term(30+ days)
Hospital (non-detox)
Out-patient
Detox-ification
Resi-dential
Total 1,537,025 37.6 11.9 18.2 2.8 0.7 9.0 6.8 0.2 10.7 1.2 1.0 100.0
Census regionNortheast 545,929 34.0 7.9 20.6 6.8 0.6 9.6 6.3 0.2 10.8 1.2 2.0 100.0Midwest 303,945 38.8 22.1 10.1 0.5 1.5 11.4 7.0 0.2 5.8 1.7 0.8 100.0South 341,304 39.2 11.7 16.1 1.2 0.7 10.5 3.2 0.3 16.5 0.3 0.3 100.0West 343,504 40.6 9.3 23.8 0.1 0.1 4.4 10.8 0.2 8.8 1.8 0.1 100.0
Census division New England 195,966 28.9 9.8 32.0 1.7 0.3 6.4 6.3 0.6 11.3 1.8 0.9 100.0Middle Atlantic 349,963 36.9 6.9 14.1 9.7 0.8 11.5 6.2 * 10.5 0.8 2.7 100.0East North Central 152,471 54.5 8.8 11.6 0.6 0.6 7.7 5.2 0.1 7.5 2.8 0.8 100.0West North Central 151,474 23.1 35.4 8.7 0.4 2.4 15.2 8.9 0.3 4.1 0.6 0.9 100.0South Atlantic 217,422 40.3 10.4 14.6 1.1 0.6 5.4 2.0 0.5 24.7 0.1 0.3 100.0
East South Central 49,814 35.9 16.0 19.4 3.0 - - 15.7 6.1 - - 3.1 0.6 0.1 100.0West South Central 74,068 38.2 12.7 18.5 * 1.4 22.0 4.7 - - 1.5 0.6 0.3 100.0Mountain 145,723 41.3 7.1 39.1 0.2 0.1 5.8 2.9 0.4 3.0 * 0.1 100.0Pacific 197,781 40.0 10.9 12.6 0.1 0.1 3.3 16.7 - - 13.1 3.1 0.1 100.0
State or jurisdictionAlabama 11,074 34.0 27.3 5.3 - - - - 11.5 17.6 - - 4.2 * 0.1 100.0Alaska 6,496 44.4 13.2 23.2 1.9 - - 1.9 14.1 - - 1.1 0.2 0.1 100.0Arizona 20,865 88.8 * 1.3 0.1 - - 2.8 0.1 0.5 6.4 * 0.1 100.0Arkansas 11,753 31.5 24.9 14.4 - - - - 21.2 - - - - 3.6 2.7 1.6 100.0California 150,071 42.2 3.5 14.9 - - 0.1 0.7 19.6 - - 14.6 4.1 0.1 100.0
Colorado 87,689 27.6 4.5 57.4 0.3 * 5.6 2.5 * 2.0 - - - - 100.0Connecticut 67,706 29.2 23.2 17.6 4.0 0.8 4.4 6.5 1.9 12.5 - - - - 100.0Delaware 7,900 47.7 12.5 19.0 - - 0.1 - - 6.6 - - 13.4 0.6 - - 100.0District of Columbia 6,053 20.6 12.2 19.6 10.6 - - 24.7 1.2 - - 2.3 0.7 8.2 100.0Florida 30,104 21.9 0.6 66.3 - - 0.4 1.1 7.0 - - 2.1 0.5 0.2 100.0
Georgia ‡ ‡ ‡ ‡ ‡ ‡ ‡ ‡ ‡ ‡ ‡ ‡ ‡ Hawaii 6,371 36.7 25.2 16.2 - - - - - - 21.3 - - 0.7 - - * 100.0Idaho 2,684 50.1 26.1 1.9 - - - - 20.8 0.7 - - 0.3 - - - - 100.0Illinois 20,587 49.4 12.7 10.5 - - - - 16.9 1.8 - - 8.0 0.1 0.7 100.0Indiana 21,362 82.4 2.9 6.6 1.0 - - 3.2 1.8 0.2 1.9 * * 100.0
Continued. See notes at end of table.
Detoxification(24-hour service) 1 Rehabilitation/residential 1
Medication-assisted opioid therapy 2
Total
Table 2.1b. Admissions aged 12 and older, by type of service at admission and Census region, Census division, and state or jurisdiction: Percent distribution, 2015
Census region, Census division, and state or jurisdiction No. of
admis-sions 12 and older
Type of service at admission
Ambulatory 1
82

Out-patient
Intensive outpatient
Free-standing
residentialHospital inpatient
Ambu-latory
Short-term(<30 days)
Long-term(30+ days)
Hospital (non-detox)
Out-patient
Detox-ification
Resi-dential
Iowa 28,578 57.5 22.9 3.8 1.4 * 11.6 1.5 0.1 1.0 0.2 0.1 100.0Kansas ‡ ‡ ‡ ‡ ‡ ‡ ‡ ‡ ‡ ‡ ‡ ‡ ‡ Kentucky 19,001 50.4 3.6 27.8 3.4 - - 6.0 1.4 - - 5.6 1.5 0.3 100.0Louisiana 10,515 36.2 11.0 11.6 0.3 - - 21.4 17.5 - - 0.5 1.0 0.6 100.0Maine 12,046 29.8 6.9 5.2 4.9 * 3.4 3.8 * 36.8 7.0 2.2 100.0
Maryland 107,509 28.4 17.1 0.8 1.6 1.0 2.2 0.7 - - 48.1 - - - - 100.0Massachusetts 91,164 25.8 - - 51.1 - - 0.1 6.1 7.6 - - 5.2 2.7 1.3 100.0Michigan 55,180 43.0 5.2 13.8 - - 0.3 12.3 6.5 - - 10.9 6.6 1.4 100.0Minnesota 55,346 0.1 49.3 - - - - - - 20.2 19.1 0.9 8.4 - - 2.1 100.0Mississippi 4,823 48.0 3.0 - - 15.0 - - 32.7 0.7 - - 0.5 0.1 0.1 100.0
Missouri 36,131 22.8 43.6 12.9 0.6 - - 15.3 - - - - 3.1 1.4 0.2 100.0Montana 5,908 50.5 20.4 15.8 - - 1.9 0.8 2.8 7.8 - - - - - - 100.0Nebraska 16,463 37.2 4.2 44.9 - - * 6.8 4.1 - - 0.6 2.1 0.2 100.0Nevada 6,630 48.7 8.9 29.0 - - - - 10.2 2.0 - - 1.2 - - - - 100.0New Hampshire 3,580 45.7 15.3 - - - - - - 26.0 5.9 - - 6.1 - - 0.9 100.0
New Jersey 68,628 30.6 26.6 6.4 0.1 0.1 9.4 7.5 * 14.2 4.0 1.0 100.0New Mexico 4,445 56.3 8.3 5.4 - - - - 13.1 2.2 - - 13.1 0.1 1.5 100.0New York 281,335 38.4 2.1 16.0 12.0 0.9 12.0 5.9 - - 9.5 * 3.1 100.0North Carolina 39,917 60.0 4.0 20.0 0.2 * 10.7 1.6 2.9 0.5 * - - 100.0North Dakota 2,900 43.6 27.9 1.2 - - - - 10.7 16.5 - - - - - - - - 100.0
Ohio 39,046 56.3 16.9 7.8 0.5 1.8 0.2 6.1 - - 8.4 1.4 0.6 100.0Oklahoma 14,430 69.5 - - 14.0 - - - - 7.1 9.4 - - - - - - - - 100.0Oregon ‡ ‡ ‡ ‡ ‡ ‡ ‡ ‡ ‡ ‡ ‡ ‡ ‡ Pennsylvania ‡ ‡ ‡ ‡ ‡ ‡ ‡ ‡ ‡ ‡ ‡ ‡ ‡ Puerto Rico 2,343 37.5 0.6 - - 17.0 0.2 - - 6.1 5.1 32.7 0.4 0.4 100.0
Table 2.1b. Admissions aged 12 and older, by type of service at admission and Census region, Census division, and state or jurisdiction: Percent distribution, 2015 (continued)
Continued. See notes at end of table.
Census region, Census division, and state or jurisdiction No. of
admis-sions 12 and older
Type of service at admission
Ambulatory 1Detoxification
(24-hour service) 1 Rehabilitation/residential 1Medication-assisted
opioid therapy 2
Total
83

Out-patient
Intensive outpatient
Free-standing
residentialHospital inpatient
Ambu-latory
Short-term(<30 days)
Long-term(30+ days)
Hospital (non-detox)
Out-patient
Detox-ification
Resi-dential
Rhode Island 11,152 30.8 14.4 20.3 - - * 11.8 2.4 0.1 19.0 1.2 - - 100.0South Carolina ‡ ‡ ‡ ‡ ‡ ‡ ‡ ‡ ‡ ‡ ‡ ‡ ‡ South Dakota 12,056 23.4 21.5 - - - - 30.3 12.8 11.3 - - 0.5 * 0.1 100.0Tennessee 14,916 15.1 27.6 25.5 0.9 - - 25.6 5.2 - - 0.1 * * 100.0Texas 37,370 28.8 14.3 23.4 - - 2.8 28.1 0.8 - - 1.8 - - - - 100.0
Utah 11,939 42.3 18.0 26.2 - - 0.1 5.9 1.8 - - 5.2 0.1 0.5 100.0Vermont 10,318 44.7 4.7 13.1 - - - - 12.0 0.8 - - 21.3 1.3 2.0 100.0Virginia 22,910 82.4 1.8 0.7 * - - 14.4 0.7 - - - - - - - - 100.0Washington 34,843 30.4 39.4 - - - - - - 15.6 3.6 - - 11.0 - - - - 100.0West Virginia 3,029 83.3 8.6 2.7 - - * 0.6 4.7 - - - - - - - - 100.0
Wisconsin 16,296 59.2 4.2 21.0 3.3 0.3 4.3 7.2 0.5 0.2 - - - - 100.0Wyoming 5,563 41.2 25.3 0.5 0.8 - - 6.0 26.0 0.3 - - - - - - 100.0
2 Therapy with methadone or buprenorphine is part of client's treatment plan.
1 Ambulatory, detoxification, and rehabilitation/residential types of service exclude medication-assisted opioid therapy.
SOURCE: Center for Behavioral Health Statistics and Quality, Substance Abuse and Mental Health Services Administration, Treatment Episode Data Set (TEDS). Data received through 11.01.16.
NOTES: Based on administrative data reported to TEDS by all reporting states and jurisdictions. Comparisons among states should be made with caution. Percentages may not sum to 100 percent due to rounding.
- - Quantity is zero; * Less than 0.05 percent; ‡ No data, or less than a full calendar year of data, submitted.
Table 2.1b. Admissions aged 12 and older, by type of service at admission and Census region, Census division, and state or jurisdiction: Percent distribution, 2015 (continued)
Type of service at admission
No. of admis-
sions 12 and older
Census region, Census division, and state or jurisdiction
Total
Medication-assisted opioid therapy 2Rehabilitation/residential 1
Detoxification(24-hour service) 1Ambulatory 1
84

Table 2.2. Admissions aged 12 and older, by primary substance of abuse and Census region, Census division, and state or jurisdiction: Number, 2015
Census region, Census division, and state or jurisdiction
No. of admis-sions
aged 12 and older
Primary substance at admission
Alcohol Opiates CocaineMari-juana/
hashish
Metham-phetamine/
amphet-amines
Tran-quil-izers
Seda-tives
Hallu-cino-gens PCP
Inhal-ants
Other/nonespeci-fied
Alcohol only
With secondary
drug HeroinOther
opiatesSmoked cocaine
Other route
1Census regionNortheastMidwestSouthWest
Census divisionNew EnglandMiddle Atlantic East North CentralWest North CentralSouth Atlantic East South CentralWest South Central Mountain Pacific
State or jurisdictionAlabamaAlaskaArizonaArkansasCaliforniaColoradoConnecticutDelawareDistrict of ColumbiaFloridaGeorgiaHawaiiIdahoIllinoisIndianaIowaKansasKentuckyLouisianaMaine
Total 1,537,025
545,929303,945341,304343,504
195,966349,963152,471151,474217,42249,81474,068
145,723197,781
11,0746,496
20,86511,753
150,07187,68967,7067,9006,053
30,104‡
6,3712,684
20,58721,36228,578
‡ 19,00110,51512,046
294,303
103,05370,48347,93572,127
42,13360,92030,70139,78230,7787,142
10,01548,84723,280
1,9012,0413,6981,948
17,07935,79412,966
3341,0368,143
‡ 699 5003,4653,2426,539
‡ 2,398 6382,725
226,786
87,42149,73333,92055,382
23,79363,62823,29426,43918,7445,6739,503
29,67625,706
7752,2002,6171,370
14,67121,59110,257
4161,3042,910
‡ 839 3582,8973,9665,053
‡ 2,0371,0591,617
401,743
199,29053,26186,65761,696
85,712113,57839,87813,38371,4896,9788,190
15,78445,912
859 6683,732 131
36,7097,610
23,7462,7451,5274,070
‡ 202 1996,1493,224 875
‡ 4,8551,0333,563
124,943
35,58024,81747,80916,720
13,23822,34215,6289,189
30,82010,5116,4785,967
10,753
1,895 2411,1401,6668,0232,3812,934 423 1136,175
‡ 278 171 9572,4361,400
‡ 3,731 9772,803
47,384
19,4379,099
13,0115,797
4,57514,8626,6352,4647,7562,4552,8001,7074,090
596 34 247 3123,5761,1202,368 81 713 939
‡ 83 9
1,271 533 299
‡ 705 455 169
27,326
13,5483,5077,0943,132
3,6179,9312,2531,2544,0051,2671,8221,4951,637
327 38 329 1871,371 9221,672 71 171 736
‡ 59 10 301 251 188
‡ 330 185 122
213,001
63,71450,74451,62046,645
14,49149,22323,56527,17929,3358,603
13,68216,09630,549
2,779 5844,0592,252
21,9976,8868,125 738 5644,551
‡ 1,720 4084,2954,3767,455
‡ 2,4371,020 757
136,028
2,89232,97923,76076,394
6302,2625,151
27,8283,1525,421
15,18723,09853,296
1,504 4824,1973,510
45,03810,503
121 13 26 976
‡ 2,260 983 8922,0706,295
‡ 1,8371,085 90
14,217
6,6532,2144,3141,028
1,9914,6621,258 9562,372 8841,058 531 497
204 8 73 136 380 313 791 16 9
697‡
18 5
148 306 161
‡ 305 138 74
2,801
1,282 439 604 474
2121,070 290 149 297 139 168 146 328
51 17 20 52 272 79 171 6 1 76
‡ 1 4 22 40 30
‡ 15 24 5
1,917
613 496 429 379
254 359 186 310 252 42 135 200 179
13 4 46 19 87 95 188 4 58 48
‡ 2 3 46 45 68
‡ 16 6 6
4,626
2,521 3551,401 349
9621,559 109 2461,038
8 355 30 319
1 - - - - 29 299 13 910 18 480 2
‡ - - 1 43 7 8
‡ - - 21 1
695
139 225 162 169
60 79 88 137 78 26 58 100 69
4 3 13 15 47 40 34 3
- - 15
‡ 1 8 14 16 23
‡ 12 2 10
41,255
9,7865,593
22,5883,212
4,2985,4883,4352,158
17,306 6654,6172,0461,166
165 176 694 126 522 3423,4233,032 51 766
‡ 209 25 87 850 184
‡ 3233,872 104
Continued. See notes at end of table. 85

Table 2.2. Admissions aged 12 and older, by primary substance of abuse and Census region, Census division, and state or jurisdiction: Number, 2015 (continued)
Census region, Census division, and state or jurisdiction
No. of admis-sions
aged 12 and older
Primary substance at admission
Alcohol Opiates CocaineMari-juana/
hashish
Metham-phetamine/
amphet-amines
Tran-quil-izers
Seda-tives
Hallu-cino-gens PCP
Inhal-ants
Other/nonespeci-fied
Alcohol only
With secondary
drug HeroinOther
opiatesSmoked cocaine
Other route
MarylandMassachusettsMichiganMinnesotaMississippiMissouriMontanaNebraskaNevadaNew HampshireNew JerseyNew MexicoNew YorkNorth CarolinaNorth DakotaOhioOklahomaOregonPennsylvaniaPuerto RicoRhode IslandSouth CarolinaSouth DakotaTennesseeTexasUtahVermontVirginiaWashingtonWest VirginiaWisconsinWyoming
107,50991,16455,18055,3464,823
36,1315,908
16,4636,6303,580
68,6284,445
281,33539,9172,900
39,04614,430
‡ ‡
2,34311,152
‡ 12,05614,91637,37011,93910,31822,91034,8433,029
16,2965,563
8,56320,89411,18813,280
8036,3641,5527,6871,557 630
10,9501,802
49,9708,241 7575,1041,955
‡ ‡
7052,840
‡ 5,1552,0405,4742,0392,0783,6403,461 8217,7021,905
5,1858,6948,2539,516 7005,5111,4642,727 729 3466,420 502
57,2084,494 5215,9062,146
‡ ‡
3301,481
‡ 3,1112,1614,9281,4471,3984,0147,996 4212,272 968
56,38249,40016,6346,835 1815,385 136 137 9011,681
27,559 441
86,0193,341 87
11,836 440
‡ ‡
8393,982
‡ 64
1,0836,5862,6033,3403,0218,333 4032,035 162
14,7004,2447,6264,155 5592,414 502 651 270 3524,881 520
17,4616,007 1933,5981,597
‡ ‡
17 971
‡ 3764,3262,238 6311,9342,6572,211 7451,011 352
2,5021,3832,8431,015 3051,019
9 105 112 84
1,676 21
13,1862,459
71,526 182
‡ ‡
40 398
‡ 19 8491,851 182 1731,033 397 29 462 7
8531,313 829 633 183 313 18 87 58 67
1,705 44
8,2261,468
4 711 88
‡ ‡
45 262
‡ 29 4271,362 83 181 678 169 28 161 31
7,6753,4565,9578,4911,1547,2221,0111,628 766 232
10,036 214
39,18710,789
7187,2532,851
‡ ‡
278 879
‡ 1,6652,2337,5591,7931,0424,5866,248 4321,684 959
130 239 936
10,087 7826,8181,1332,6682,003 89 359 3041,9031,308 592 5904,359
‡ ‡
3 46
‡ 1,3681,2986,2332,889 45 6305,516 69 6631,086
775 969 511 427 91 295 21 58 36 10 617 9
4,045 583 5
192 154
‡ ‡
8 101
‡ 10 284 630 61 46 270 91 22 101 13
55 10 167 55 10 23 3 5 11 2 12 2
1,058 113 2 42 69
‡ ‡
2 16
‡ 34 63 23 16 8 44 38 2 19 11
61 31 26 148 9 59 7 24 8 3
146 1
213 35 3 47 48
‡ ‡
- - 8
‡ 8 4 62 20 18 44 86 2 22 20
422 51 1 40 6
185 - - 12 14 - - 595 - - 964 31 - - 58 75
‡ ‡
- - - -
‡ 1 1
230 2
- - 85 20 - - - - - -
13 6 29 55 4 22 30 10 1 4 8
- - 71 20 2 18 12
‡ ‡
- - 3
‡ 25 6 29 5 3 25 18 2 11 3
10,193 474 180 609 36 501 22 664 164 80
3,664 5851,8241,028
92,165 454
‡ ‡
76 165
‡ 191 141 165 168 52
2,183 259 53 153 46
- - Quantity is zero; ‡ No data, or less than a full calendar year of data, submitted.1 Admissions reported for Census regions and divisions will not sum to the total number of admissions because Puerto Rico is not included in any Census region or division.NOTE: Based on administrative data reported to TEDS by all reporting states and jurisdictions. Comparisons among states should be made with caution.SOURCE: Center for Behavioral Health Statistics and Quality, Substance Abuse and Mental Health Services Administration, Treatment Episode Data Set (TEDS). Data receive11.01.16. 86
d through

Table 2.3. Admissions aged 12 and older, by primary substance of abuse and Census region, Census division, and state or jurisdiction: Admissions per 100,000 population, 2015
Census region, Census division, state or jurisdiction
and No. of admis-sions
aged 12 and older
Admissions per 100,000 population aged 12 and older
Total
Primary substance at admission
Alcohol Opiates Cocaine
Mari-juana/
hashish
Metham-phetamine/
amphet-amines
Tran-quil-izers
Seda-tives
Hallu-cino-gens PCP
Inhal-ants
Other/nonespeci-fied
Alcohol only
With secondary
drug HeroinOther
opiatesSmoked cocaine
Other route
Total 1,537,025 557 107 82 146 45 17 10 77 49 5 1 † 2 † 15
Census regionNortheast 545,929 1,125 212 180 411 73 40 28 131 6 14 3 1 5 † 20Midwest 303,945 527 122 86 92 43 16 6 88 57 4 † † † † 10South 341,304 333 47 33 85 47 13 7 50 23 4 † † 1 † 22West 343,504 535 112 86 96 26 9 5 73 119 2 † † † † 5
Census divisionNew England 195,966 1,530 329 186 669 103 36 28 113 5 16 2 2 8 † 34Middle Atlantic 349,963 980 171 178 318 63 42 28 138 6 13 3 1 4 † 15East North Central 152,471 383 77 58 100 39 17 6 59 13 3 † † † † 9West North Central 151,474 851 224 149 75 52 14 7 153 156 5 † 2 1 † 12South Atlantic 217,422 402 57 35 132 57 14 7 54 6 4 † † 2 † 32
East South Central 49,814 311 45 35 44 66 15 8 54 34 6 † † † † 4West South Central 74,068 229 31 29 25 20 9 6 42 47 3 † † 1 † 14Mountain 145,723 740 248 151 80 30 9 8 82 117 3 † 1 † † 10Pacific 197,781 445 52 58 103 24 9 4 69 120 1 † † † † 3
State or jurisdictionAlabama 11,074 268 46 19 21 46 14 8 67 36 5 1 † † † 4Alaska 6,496 1,063 334 360 109 39 6 6 96 79 1 3 † - - † 29Arizona 20,865 363 64 45 65 20 4 6 71 73 1 † † - - † 12Arkansas 11,753 468 78 55 5 66 12 7 90 140 5 2 † 1 † 5California 150,071 454 52 44 111 24 11 4 66 136 1 † † † † 2
Colorado 87,689 1,898 775 467 165 52 24 20 149 227 7 2 2 † † 7Connecticut 67,706 2,178 417 330 764 94 76 54 261 4 25 6 6 29 1 110Delaware 7,900 974 41 51 339 52 10 9 91 2 2 † † 2 † 374District of Columbia 6,053 1,035 177 223 261 19 122 29 96 4 2 † 10 82 - - 9Florida 30,104 171 46 17 23 35 5 4 26 6 4 † † † † 4Georgia ‡ ‡ ‡ ‡ ‡ ‡ ‡ ‡ ‡ ‡ ‡ ‡ ‡ ‡ ‡ ‡
Hawaii 6,371 523 57 69 17 23 7 5 141 186 1 † † - - † 17Idaho 2,684 196 37 26 15 12 † † 30 72 † † † † † 2Illinois 20,587 188 32 27 56 9 12 3 39 8 1 † † † † †Indiana 21,362 383 58 71 58 44 10 4 78 37 5 † † † † 15
Continued. See notes at end of table. 87

Table 2.3. Admissions aged 12 and older, by primary substance of abuse and Census region, Census division, and state or jurisdiction: Admissions per 100,000 population, 2015 (continued)
Census region, Census division, state or jurisdiction
and No. of admis-sions
aged 12 and older
Admissions per 100,000 population aged 12 and older
Total
Primary substance at admission
Alcohol Opiates Cocaine
Mari-juana/
hashish
Metham-phetamine/
amphet-amines
Tran-quil-izers
Seda-tives
Hallu-cino-gens PCP
Inhal-ants
Other/nonespeci-fied
Alcohol only
With secondary
drug HeroinOther
opiatesSmoked cocaine
Other route
Iowa 28,578 1,083 248 191 33 53 11 7 282 238 6 1 3 † † 7Kansas ‡ ‡ ‡ ‡ ‡ ‡ ‡ ‡ ‡ ‡ ‡ ‡ ‡ ‡ ‡ ‡ Kentucky 19,001 506 64 54 129 99 19 9 65 49 8 † † - - † 9Louisiana 10,515 268 16 27 26 25 12 5 26 28 4 † † † † 99Maine 12,046 1,034 234 139 306 241 15 10 65 8 6 † † † † 9
Maryland 107,509 2,103 167 101 1103 287 49 17 150 3 15 1 1 8 † 199Massachusetts 91,164 1,546 354 147 838 72 23 22 59 4 16 † † † † 8Michigan 55,180 649 132 97 196 90 33 10 70 11 6 2 † † † 2Minnesota 55,346 1,195 287 205 148 90 22 14 183 218 9 1 3 † 1 13Mississippi 4,823 192 32 28 7 22 12 7 46 31 4 † † † † 1
Missouri 36,131 699 123 107 104 47 20 6 140 132 6 † 1 4 † 10Montana 5,908 670 176 166 15 57 1 2 115 128 2 † † - - 3 2Nebraska 16,463 1,043 487 173 9 41 7 6 103 169 4 † 2 † † 42Nevada 6,630 271 64 30 37 11 5 2 31 82 1 † † † † 7New Hampshire 3,580 307 54 30 144 30 7 6 20 8 † † † - - † 7
New Jersey 68,628 896 143 84 360 64 22 22 131 5 8 † 2 8 † 48New Mexico 4,445 253 103 29 25 30 1 3 12 17 † † † - - - - 33New York 281,335 1,654 294 336 506 103 78 48 230 11 24 6 1 6 † 11North Carolina 39,917 468 97 53 39 70 29 17 126 15 7 1 † † † 12North Dakota 2,900 456 119 82 14 30 1 † 113 93 † † † - - † 1
Ohio 39,046 394 52 60 120 36 15 7 73 6 2 † † † † 22Oklahoma 14,430 442 60 66 13 49 6 3 87 133 5 2 1 2 † 14Oregon ‡ ‡ ‡ ‡ ‡ ‡ ‡ ‡ ‡ ‡ ‡ ‡ ‡ ‡ ‡ ‡ Pennsylvania ‡ ‡ ‡ ‡ ‡ ‡ ‡ ‡ ‡ ‡ ‡ ‡ ‡ ‡ ‡ ‡ Puerto Rico 2,343 78 23 11 28 † 1 1 9 † † † - - - - - - 3
Continued. See notes at end of table.
88

Table 2.3. Admissions aged 12 and older, by primary substance of abuse and Census region, Census division, and state or jurisdiction: Admissions per 100,000 population, 2015 (continued)
Census region, Census division, state or jurisdiction
and No. of admis-sions
aged 12 and older
Admissions per 100,000 population aged 12 and older
Total
Primary substance at admission
Alcohol Opiates Cocaine
Mari-juana/
hashish
Metham-phetamine/
amphet-amines
Tran-quil-izers
Seda-tives
Hallu-cino-gens PCP
Inhal-ants
Other/nonespeci-fied
Alcohol only
With secondary
drug HeroinOther
opiatesSmoked cocaine
Other route
Rhode Island 11,152 1,212 309 161 433 106 43 28 96 5 11 2 † - - † 18South Carolina ‡ ‡ ‡ ‡ ‡ ‡ ‡ ‡ ‡ ‡ ‡ ‡ ‡ ‡ ‡ ‡ South Dakota 12,056 1,690 722 436 9 53 3 4 233 192 1 5 1 † 4 27Tennessee 14,916 266 36 38 19 77 15 8 40 23 5 1 † † † 3Texas 37,370 165 24 22 29 10 8 6 33 28 3 † † 1 † †
Utah 11,939 502 86 61 109 27 8 3 75 121 3 † † † † 7Vermont 10,318 1,877 378 254 608 352 31 33 190 8 8 1 3 - - † 9Virginia 22,910 321 51 56 42 37 14 9 64 9 4 † † 1 † 31Washington 34,843 572 57 131 137 36 7 3 103 91 1 † 1 † † 4West Virginia 3,029 190 51 26 25 47 2 2 27 4 1 † † - - † 3
Wisconsin 16,296 331 156 46 41 21 9 3 34 13 2 † † - - † 3Wyoming 5,563 1,132 388 197 33 72 1 6 195 221 3 2 4 - - † 9
- - Quantity is zero; ‡ No data, or less than a full calendar year of data, submitted; † Less than 1 per 100,000 population.NOTE: Based on administrative data reported to TEDS by all reporting states and jurisdictions. Comparisons among states should be made with caution.SOURCES: CBHSQ, SAMHSA, TEDS. Data received through 11.01.16. Population: U.S. Census Bureau, SC-EST2010-agesex-res, SC-EST2015-agesex-res, and SC-EST2015-ALLDATA6-ALL: Annual Estimates of the Resident Population by Single-Year of Age, Sex, Race and Hispanic origin for the U.S. and States: April 1, 2005 to July 1, 2015; SC-EST2015-agesex-res: Annual Estimates of the Resident Population by Single Year of Age and Sex for the U.S. and States: April 1, 2005 to July 1, 2015; PRC-EST2010-AGESEX-RES and PRC-EST2015-AGESEX-RES: Annual Estimates of the Resident Population by Single-Year of Age and Sex for Puerto Rico: April 1, 2005 to July 1, 2015; PEP_2015_PEPSYASEX: Annual Estimates of the Resident Population by Single Year of Age and Sex for Puerto Rico Commonwealth: April 1, 2005 to July 1, 2015.
89

Table 2.4. Admissions aged 12 and older, adjusted for age, gender, and race/ethnicity, by primary substance of abuse and Census region, Census division, and state or jurisdiction: Admissions per 100,000 population, 2015
Census region, Census division, and state or jurisdiction
No. of admis-sions
aged 12 and older
Admissions per 100,000
aged 12 and older
Admissions per 100,000 population aged 12 and older, adjusted for age, gender, and race/ethnicity 1
Primary substance at admission
Alcohol Opiates Cocaine
Mari-juana/
hashish
Metham-phetamine/ amphet-amines
Tran-quil-izers
Seda-tives
Hallu-cino-gens PCP
Inhal-ants
Other/nonespeci-fied
Unad-justed
Ad-justed 1
Alcohol only
With second-
ary drug Heroin
Other opiates
Smoked cocaine
Otherroute
Total 1,537,025 557 569 109 84 149 47 18 10 79 51 5 1 † 2 † 14Census region
Northeast 545,929 1,125 1,198 222 194 432 77 44 30 147 6 14 2 1 6 † 21Midwest 303,945 527 527 123 88 90 40 18 7 91 54 4 † † † † 9South 341,304 333 322 47 33 81 49 11 6 46 25 4 † † † † 19West 343,504 535 570 113 93 103 28 17 6 81 121 2 † † † † 5
Census divisionNew England 195,966 1,530 1,651 340 206 699 101 46 34 148 5 15 2 3 12 † 39Middle Atlantic 349,963 980 1,029 178 185 335 67 43 29 147 7 14 3 1 5 † 16East North Central 152,471 383 379 78 59 97 37 18 6 60 12 3 † † † † 8West North Central 151,474 851 845 216 147 78 46 23 10 164 140 5 † 2 2 † 12South Atlantic 217,422 402 377 56 33 122 61 12 7 48 6 5 † † 1 † 26East South Central 49,814 311 321 48 41 44 67 16 8 53 33 6 † † † † 4West South Central 74,068 229 241 33 31 26 23 8 5 40 54 4 † † † † 15Mountain 145,723 740 714 228 150 73 27 15 9 85 111 3 † 1 † † 10Pacific 197,781 445 505 59 67 120 29 17 4 77 124 1 † † † † 3
State or jurisdictionAlabama 11,074 268 201 34 15 18 36 8 5 45 32 4 1 † † † 3Alaska 6,496 1,063 541 140 144 83 26 5 6 59 56 † 2 † - - † 19Arizona 20,865 363 382 60 46 69 21 6 6 79 78 1 † 1 - - † 14Arkansas 11,753 468 447 78 55 5 61 11 7 85 131 5 2 † † † 5California 150,071 454 544 64 55 139 33 19 5 72 151 2 1 † 1 † 2Colorado 87,689 1,898 1,796 723 462 138 44 39 22 151 198 6 2 2 † † 7Connecticut 67,706 2,178 2,326 428 354 815 100 85 59 291 4 27 6 7 33 1 116Delaware 7,900 974 971 43 50 363 53 10 9 84 2 2 † † 2 † 354District of Columbia 6,053 1,035 409 104 80 92 9 38 9 39 2 2 † 4 25 - - 4Florida 30,104 171 213 57 20 30 46 6 5 31 7 5 † † † † 5Georgia ‡ ‡ ‡ ‡ ‡ ‡ ‡ ‡ ‡ ‡ ‡ ‡ ‡ ‡ ‡ ‡ ‡ Hawaii 6,371 523 582 87 96 28 29 9 6 168 136 2 † † - - † 20Idaho 2,684 196 211 44 26 11 12 † † 37 78 † † † - - † 1Illinois 20,587 188 189 32 27 55 9 11 3 40 9 1 † † † † †Indiana 21,362 383 390 66 76 52 41 12 5 84 35 5 † † † † 14
Continued. See notes at end of table. 90

Table 2.4. Admissions aged 12 and older, adjusted for age, gender, and race/ethnicity, by primary substance of abuse and Census region, Census division, and state or jurisdiction: Admissions per 100,000 population, 2015 (continued)
Census region, Census division, and state or jurisdiction
No. of admis-sions
aged 12 and older
Admissions per 100,000
aged 12 and older
Admissions per 100,000 population aged 12 and older, adjusted for age, gender, and race/ethnicity 1
Primary substance at admission
Alcohol Opiates Cocaine
Mari-juana/
hashish
Metham-phetamine/ amphet-amines
Tran-quil-izers
Seda-tives
Hallu-cino-gens PCP
Inhal-ants
Other/nonespeci-fied
Unad-justed
Ad-justed 1
Alcohol only
With second-
ary drug Heroin
Other opiates
Smoked cocaine
Otherroute
Iowa 28,578 1,083 1,234 270 223 40 47 39 11 361 195 5 1 5 † † 6Kansas ‡ ‡ ‡ ‡ ‡ ‡ ‡ ‡ ‡ ‡ ‡ ‡ ‡ ‡ ‡ ‡ ‡ Kentucky 19,001 506 472 63 55 112 83 24 10 66 44 7 † † - - † 7Louisiana 10,515 268 237 15 25 25 25 8 3 21 29 3 † † † † 83Maine 12,046 1,034 1,176 243 179 336 244 21 26 92 10 6 † † † † 17
Maryland 107,509 2,103 1,884 155 91 997 308 36 14 113 3 17 1 1 5 † 142Massachusetts 91,164 1,546 1,593 363 157 854 70 28 25 67 4 16 † † 1 † 8Michigan 55,180 649 641 131 97 190 86 34 10 71 11 6 2 † † † 2Minnesota 55,346 1,195 1,245 284 218 152 83 43 21 213 201 9 1 3 1 1 14Mississippi 4,823 192 174 29 23 8 25 7 5 34 36 4 † † † † 1
Missouri 36,131 699 666 121 103 98 41 22 7 138 117 5 † † 4 † 9Montana 5,908 670 648 160 144 17 54 6 6 136 113 5 † † - - 3 2Nebraska 16,463 1,043 1,097 527 178 9 39 13 7 111 157 3 † 2 2 † 47Nevada 6,630 271 308 71 34 43 13 6 3 36 91 2 † † † † 8New Hampshire 3,580 307 321 54 30 138 29 10 9 30 8 † † 1 - - † 12
New Jersey 68,628 896 1,005 154 92 419 75 23 24 139 5 9 † 2 8 † 56New Mexico 4,445 253 166 47 17 18 22 1 4 10 18 † † † - - - - 30New York 281,335 1,654 1,691 303 335 524 115 74 48 229 12 25 7 1 5 † 11North Carolina 39,917 468 416 86 48 38 69 22 14 102 15 7 1 † † † 11North Dakota 2,900 456 366 110 64 8 17 6 1 93 65 † † † - - † †
Ohio 39,046 394 371 49 57 108 33 15 7 71 5 2 † † † † 21Oklahoma 14,430 442 417 57 61 12 44 8 3 89 115 5 2 2 3 † 14Oregon ‡ ‡ ‡ ‡ ‡ ‡ ‡ ‡ ‡ ‡ ‡ ‡ ‡ ‡ ‡ ‡ ‡ Pennsylvania ‡ ‡ ‡ ‡ ‡ ‡ ‡ ‡ ‡ ‡ ‡ ‡ ‡ ‡ ‡ ‡ ‡ Puerto Rico 2,343 78 n/a n/a n/a n/a n/a n/a n/a n/a n/a n/a n/a n/a n/a n/a n/a
Continued. See notes at end of table.
91
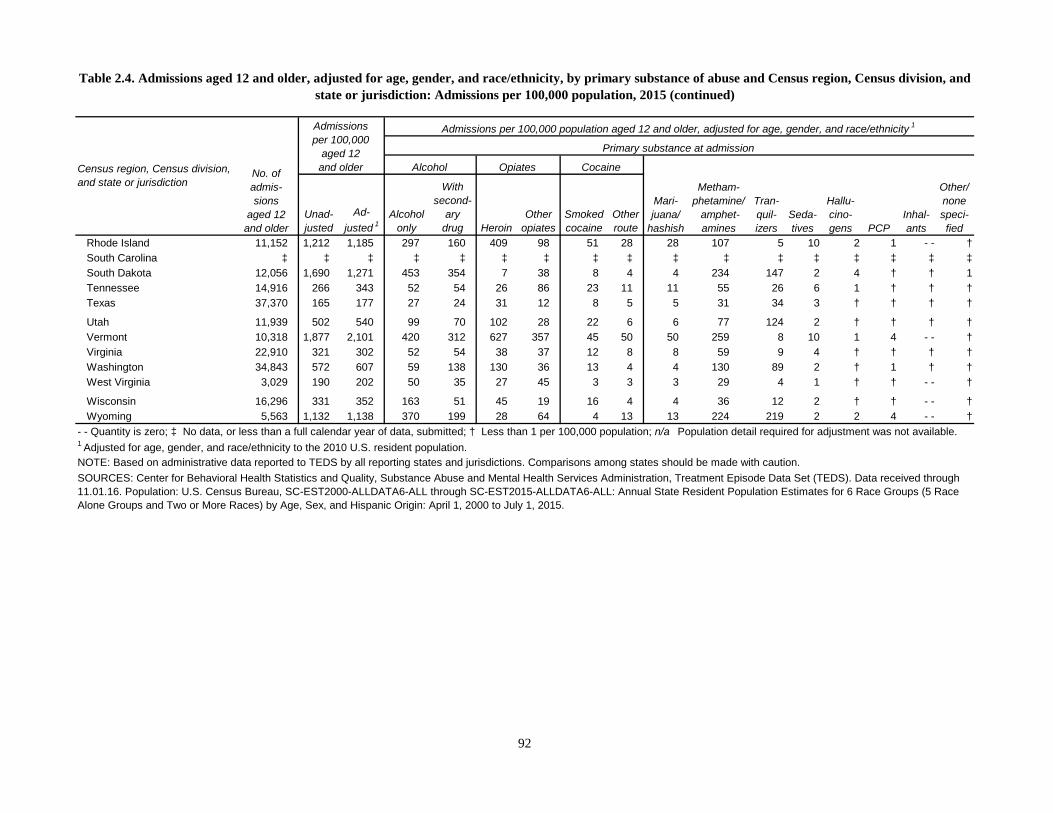
Table 2.4. Admissions aged 12 and older, adjusted for age, gender, and race/ethnicity, by primary substance of abuse and Census region, Census division, and state or jurisdiction: Admissions per 100,000 population, 2015 (continued)
Census region, Census division, and state or jurisdiction
No. of admis-sions
aged 12 and older
Admissions per 100,000
aged 12 and older
Admissions per 100,000 population aged 12 and older, adjusted for age, gender, and race/ethnicity 1
Primary substance at admission
Alcohol Opiates Cocaine
Mari-juana/
hashish
Metham-phetamine/ amphet-amines
Tran-quil-izers
Seda-tives
Hallu-cino-gens PCP
Inhal-ants
Other/nonespeci-fied
Unad-justed
Ad-justed 1
Alcohol only
With second-
ary drug Heroin
Other opiates
Smoked cocaine
Otherroute
Rhode Island 11,152 1,212 1,185 297 160 409 98 51 28 28 107 5 10 2 1 - - †South Carolina ‡ ‡ ‡ ‡ ‡ ‡ ‡ ‡ ‡ ‡ ‡ ‡ ‡ ‡ ‡ ‡ ‡South Dakota 12,056 1,690 1,271 453 354 7 38 8 4 4 234 147 2 4 † † 1Tennessee 14,916 266 343 52 54 26 86 23 11 11 55 26 6 1 † † †Texas 37,370 165 177 27 24 31 12 8 5 5 31 34 3 † † † †
Utah 11,939 502 540 99 70 102 28 22 6 6 77 124 2 † † † †Vermont 10,318 1,877 2,101 420 312 627 357 45 50 50 259 8 10 1 4 - - †Virginia 22,910 321 302 52 54 38 37 12 8 8 59 9 4 † † † †Washington 34,843 572 607 59 138 130 36 13 4 4 130 89 2 † 1 † †West Virginia 3,029 190 202 50 35 27 45 3 3 3 29 4 1 † † - - †
Wisconsin 16,296 331 352 163 51 45 19 16 4 4 36 12 2 † † - - †Wyoming 5,563 1,132 1,138 370 199 28 64 4 13 13 224 219 2 2 4 - - †
- - Quantity is zero; ‡ No data, or less than a full calendar year of data, submitted; † Less than 1 per 100,000 population; n/a Population detail required for adjustment was not available.1 Adjusted for age, gender, and race/ethnicity to the 2010 U.S. resident population.NOTE: Based on administrative data reported to TEDS by all reporting states and jurisdictions. Comparisons among states should be made with caution.SOURCES: Center for Behavioral Health Statistics and Quality, Substance Abuse and Mental Health Services Administration, Treatment Episode Data Set (TEDS). Data received through 11.01.16. Population: U.S. Census Bureau, SC-EST2000-ALLDATA6-ALL through SC-EST2015-ALLDATA6-ALL: Annual State Resident Population Estimates for 6 Race Groups (5 Race Alone Groups and Two or More Races) by Age, Sex, and Hispanic Origin: April 1, 2000 to July 1, 2015.
92
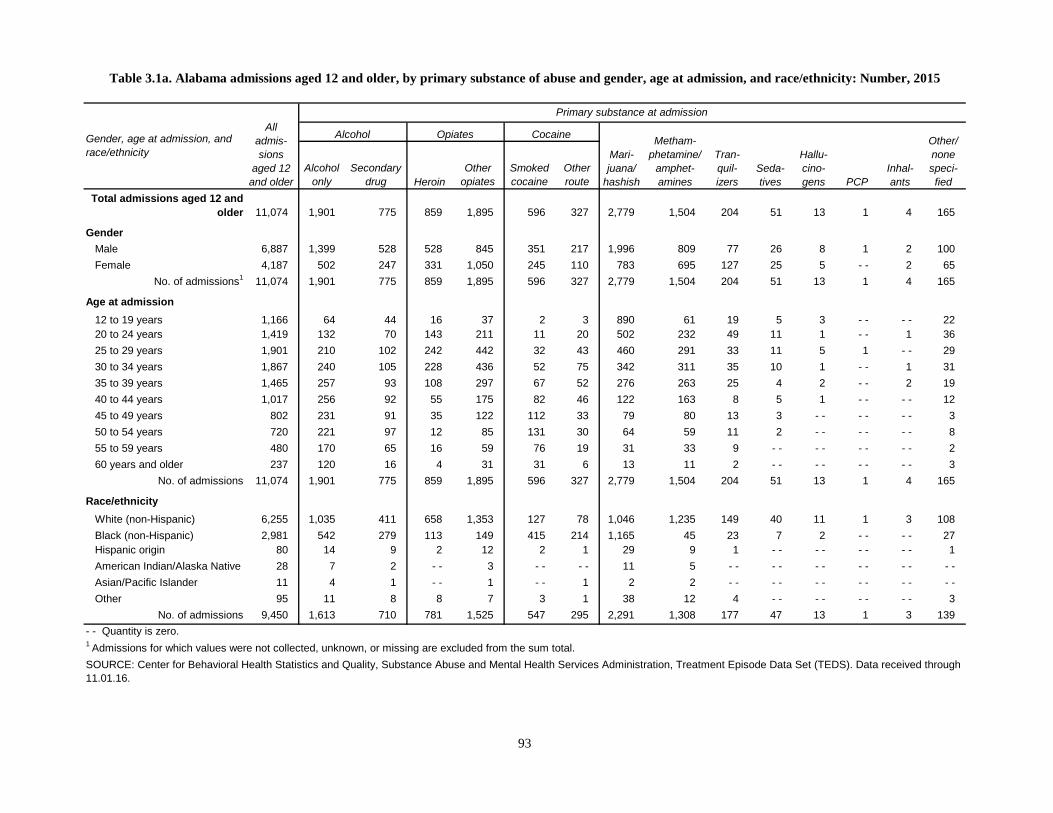
Alcohol only
Secondarydrug Heroin
Other opiates
Smoked cocaine
Other route
Total admissions aged 12 and older 11,074 1,901 775 859 1,895 596 327 2,779 1,504 204 51 13 1 4 165
GenderMale 6,887 1,399 528 528 845 351 217 1,996 809 77 26 8 1 2 100Female 4,187 502 247 331 1,050 245 110 783 695 127 25 5 - - 2 65
No. of admissions1 11,074 1,901 775 859 1,895 596 327 2,779 1,504 204 51 13 1 4 165
Age at admission12 to 19 years 1,166 64 44 16 37 2 3 890 61 19 5 3 - - - - 2220 to 24 years 1,419 132 70 143 211 11 20 502 232 49 11 1 - - 1 3625 to 29 years 1,901 210 102 242 442 32 43 460 291 33 11 5 1 - - 2930 to 34 years 1,867 240 105 228 436 52 75 342 311 35 10 1 - - 1 3135 to 39 years 1,465 257 93 108 297 67 52 276 263 25 4 2 - - 2 1940 to 44 years 1,017 256 92 55 175 82 46 122 163 8 5 1 - - - - 1245 to 49 years 802 231 91 35 122 112 33 79 80 13 3 - - - - - - 350 to 54 years 720 221 97 12 85 131 30 64 59 11 2 - - - - - - 855 to 59 years 480 170 65 16 59 76 19 31 33 9 - - - - - - - - 260 years and older 237 120 16 4 31 31 6 13 11 2 - - - - - - - - 3
No. of admissions 11,074 1,901 775 859 1,895 596 327 2,779 1,504 204 51 13 1 4 165
Race/ethnicityWhite (non-Hispanic) 6,255 1,035 411 658 1,353 127 78 1,046 1,235 149 40 11 1 3 108Black (non-Hispanic) 2,981 542 279 113 149 415 214 1,165 45 23 7 2 - - - - 27Hispanic origin 80 14 9 2 12 2 1 29 9 1 - - - - - - - - 1American Indian/Alaska Native 28 7 2 - - 3 - - - - 11 5 - - - - - - - - - - - -Asian/Pacific Islander 11 4 1 - - 1 - - 1 2 2 - - - - - - - - - - - -Other 95 11 8 8 7 3 1 38 12 4 - - - - - - - - 3
No. of admissions 9,450 1,613 710 781 1,525 547 295 2,291 1,308 177 47 13 1 3 139- - Quantity is zero.
SOURCE: Center for Behavioral Health Statistics and Quality, Substance Abuse and Mental Health Services Administration, Treatment Episode Data Set (TEDS). Data received through 11.01.16.
Seda-tives
Hallu-cino-gens PCP
Inhal-ants
Other/ none speci-fied
1 Admissions for which values were not collected, unknown, or missing are excluded from the sum total.
Table 3.1a. Alabama admissions aged 12 and older, by primary substance of abuse and gender, age at admission, and race/ethnicity: Number, 2015
Gender, age at admission, and race/ethnicity
All admis-sions
aged 12 and older
Primary substance at admission
Alcohol Opiates Cocaine
Mari-juana/
hashish
Metham-phetamine/
amphet-amines
Tran-quil-izers
93

Alcohol only
Secondarydrug Heroin
Other opiates
Smoked cocaine
Other route
Total admissions aged 12 and older 11,074 1,901 775 859 1,895 596 327 2,779 1,504 204 51 13 1 4 165
GenderMale 62.2 73.6 68.1 61.5 44.6 58.9 66.4 71.8 53.8 37.7 51.0 61.5 100.0 50.0 60.6Female 37.8 26.4 31.9 38.5 55.4 41.1 33.6 28.2 46.2 62.3 49.0 38.5 - - 50.0 39.4
Total 100.0 100.0 100.0 100.0 100.0 100.0 100.0 100.0 100.0 100.0 100.0 100.0 100.0 100.0 100.0No. of admissions 11,074 1,901 775 859 1,895 596 327 2,779 1,504 204 51 13 1 4 165
Age at admission12 to 19 years 10.5 3.4 5.7 1.9 2.0 0.3 0.9 32.0 4.1 9.3 9.8 23.1 - - - - 13.320 to 24 years 12.8 6.9 9.0 16.6 11.1 1.8 6.1 18.1 15.4 24.0 21.6 7.7 - - 25.0 21.825 to 29 years 17.2 11.0 13.2 28.2 23.3 5.4 13.1 16.6 19.3 16.2 21.6 38.5 100.0 - - 17.630 to 34 years 16.9 12.6 13.5 26.5 23.0 8.7 22.9 12.3 20.7 17.2 19.6 7.7 - - 25.0 18.835 to 39 years 13.2 13.5 12.0 12.6 15.7 11.2 15.9 9.9 17.5 12.3 7.8 15.4 - - 50.0 11.540 to 44 years 9.2 13.5 11.9 6.4 9.2 13.8 14.1 4.4 10.8 3.9 9.8 7.7 - - - - 7.345 to 49 years 7.2 12.2 11.7 4.1 6.4 18.8 10.1 2.8 5.3 6.4 5.9 - - - - - - 1.850 to 54 years 6.5 11.6 12.5 1.4 4.5 22.0 9.2 2.3 3.9 5.4 3.9 - - - - - - 4.855 to 59 years 4.3 8.9 8.4 1.9 3.1 12.8 5.8 1.1 2.2 4.4 - - - - - - - - 1.260 years and older 2.1 6.3 2.1 0.5 1.6 5.2 1.8 0.5 0.7 1.0 - - - - - - - - 1.8
Total 100.0 100.0 100.0 100.0 100.0 100.0 100.0 100.0 100.0 100.0 100.0 100.0 100.0 100.0 100.0No. of admissions 11,074 1,901 775 859 1,895 596 327 2,779 1,504 204 51 13 1 4 165
Race/ethnicityWhite (non-Hispanic) 66.2 64.2 57.9 84.3 88.7 23.2 26.4 45.7 94.4 84.2 85.1 84.6 100.0 100.0 77.7Black (non-Hispanic) 31.5 33.6 39.3 14.5 9.8 75.9 72.5 50.9 3.4 13.0 14.9 15.4 - - - - 19.4Hispanic origin 0.8 0.9 1.3 0.3 0.8 0.4 0.3 1.3 0.7 0.6 - - - - - - - - 0.7American Indian/Alaska Native 0.3 0.4 0.3 - - 0.2 - - - - 0.5 0.4 - - - - - - - - - - - -Asian/Pacific Islander 0.1 0.2 0.1 - - 0.1 - - 0.3 0.1 0.2 - - - - - - - - - - - -Other 1.0 0.7 1.1 1.0 0.5 0.5 0.3 1.7 0.9 2.3 - - - - - - - - 2.2
Total 100.0 100.0 100.0 100.0 100.0 100.0 100.0 100.0 100.0 100.0 100.0 100.0 100.0 100.0 100.0No. of admissions 9,450 1,613 710 781 1,525 547 295 2,291 1,308 177 47 13 1 3 139
NOTE: Percentages may not sum to 100 percent due to rounding. Percentages are based on all admissions with known and valid values. Admissions for which values were not collected, unknown, or missing are excluded from the percentage base (denominator).SOURCE: Center for Behavioral Health Statistics and Quality, Substance Abuse and Mental Health Services Administration, Treatment Episode Data Set (TEDS). Data received through 11.01.16.
Seda-tives
Hallu-cino-gens PCP
Inhal-ants
Other/ none speci-fied
- - Quantity is zero.
Table 3.1b. Alabama admissions aged 12 and older, by primary substance of abuse and gender, age at admission, and race/ethnicity: Percent distribution, 2015
Gender, age at admission, and race/ethnicity
All admis-sions
aged 12 and older
Primary substance at admission
Alcohol Opiates CocaineMari-juana/
hashish
Metham-phetamine/
amphet-amines
Tran-quil-izers
94

Alcohol only
Secondarydrug Heroin
Other opiates
Smoked cocaine
Other route
Total admissions aged 12 and older 6,496 2,041 2,200 668 241 34 38 584 482 8 17 4 - - 3 176
GenderMale 3,908 1,290 1,434 322 96 15 15 412 217 4 6 3 - - 3 91Female 2,588 751 766 346 145 19 23 172 265 4 11 1 - - - - 85
No. of admissions1 6,496 2,041 2,200 668 241 34 38 584 482 8 17 4 - - 3 176
Age at admission12 to 19 years 458 39 106 8 3 - - 2 236 25 - - - - 2 - - - - 3720 to 24 years 725 150 225 125 35 5 1 94 63 - - - - - - - - 2 2525 to 29 years 1,233 227 413 242 83 4 12 78 134 1 6 - - - - - - 3330 to 34 years 1,127 313 381 158 55 5 7 62 117 2 5 - - - - - - 2235 to 39 years 746 220 301 74 22 5 4 45 56 - - 2 - - - - - - 1740 to 44 years 576 216 228 33 15 3 4 26 38 - - 1 - - - - - - 1245 to 49 years 484 249 148 13 11 5 1 16 29 2 1 1 - - - - 850 to 54 years 496 257 171 7 8 4 4 13 19 2 - - - - - - - - 1155 to 59 years 434 235 163 4 5 2 2 13 - - - - 2 1 - - 1 660 years and older 217 135 64 4 4 1 1 1 1 1 - - - - - - - - 5
No. of admissions 6,496 2,041 2,200 668 241 34 38 584 482 8 17 4 - - 3 176
Race/ethnicityWhite (non-Hispanic) 2,131 528 511 398 125 18 7 153 290 6 11 2 - - 1 81Black (non-Hispanic) 103 22 33 11 1 3 6 22 3 - - - - - - - - - - 2Hispanic origin 147 34 34 31 9 - - 2 24 8 - - - - - - - - - - 5American Indian/Alaska Native 2,904 1,154 1,187 111 57 7 12 239 83 1 2 2 - - 1 48Asian/Pacific Islander 66 12 27 2 1 - - 1 9 14 - - - - - - - - - - - -Other 1,116 279 394 114 48 6 10 135 84 1 4 - - - - 1 40
No. of admissions 6,467 2,029 2,186 667 241 34 38 582 482 8 17 4 - - 3 176
Table 3.2a. Alaska admissions aged 12 and older, by primary substance of abuse and gender, age at admission, and race/ethnicity: Number, 2015
Gender, age at admission, and race/ethnicity
All admis-sions
aged 12 and older
Primary substance at admission
Alcohol Opiates Cocaine
Mari-juana/
hashish
Metham-phetamine/
amphet-amines
Tran-quil-izers
Seda-tives
Hallu-cino-gens PCP
1 Admissions for which values were not collected, unknown, or missing are excluded from the sum total.
Inhal-ants
Other/ none speci-fied
- - Quantity is zero.
SOURCE: Center for Behavioral Health Statistics and Quality, Substance Abuse and Mental Health Services Administration, Treatment Episode Data Set (TEDS). Data received through 11.01.16.
95

Alcohol only
Secondarydrug Heroin
Other opiates
Smoked cocaine
Other route
Total admissions aged 12 and older 6,496 2,041 2,200 668 241 34 38 584 482 8 17 4 - - 3 176
GenderMale 60.2 63.2 65.2 48.2 39.8 44.1 39.5 70.5 45.0 50.0 35.3 75.0 - - 100.0 51.7Female 39.8 36.8 34.8 51.8 60.2 55.9 60.5 29.5 55.0 50.0 64.7 25.0 - - - - 48.3
Total 100.0 100.0 100.0 100.0 100.0 100.0 100.0 100.0 100.0 100.0 100.0 100.0 - - 100.0 100.0No. of admissions 6,496 2,041 2,200 668 241 34 38 584 482 8 17 4 - - 3 176
Age at admission12 to 19 years 7.1 1.9 4.8 1.2 1.2 - - 5.3 40.4 5.2 - - - - 50.0 - - - - 21.020 to 24 years 11.2 7.3 10.2 18.7 14.5 14.7 2.6 16.1 13.1 - - - - - - - - 66.7 14.225 to 29 years 19.0 11.1 18.8 36.2 34.4 11.8 31.6 13.4 27.8 12.5 35.3 - - - - - - 18.830 to 34 years 17.3 15.3 17.3 23.7 22.8 14.7 18.4 10.6 24.3 25.0 29.4 - - - - - - 12.535 to 39 years 11.5 10.8 13.7 11.1 9.1 14.7 10.5 7.7 11.6 - - 11.8 - - - - - - 9.740 to 44 years 8.9 10.6 10.4 4.9 6.2 8.8 10.5 4.5 7.9 - - 5.9 - - - - - - 6.845 to 49 years 7.5 12.2 6.7 1.9 4.6 14.7 2.6 2.7 6.0 25.0 5.9 25.0 - - - - 4.550 to 54 years 7.6 12.6 7.8 1.0 3.3 11.8 10.5 2.2 3.9 25.0 - - - - - - - - 6.355 to 59 years 6.7 11.5 7.4 0.6 2.1 5.9 5.3 2.2 - - - - 11.8 25.0 - - 33.3 3.460 years and older 3.3 6.6 2.9 0.6 1.7 2.9 2.6 0.2 0.2 12.5 - - - - - - - - 2.8
Total 100.0 100.0 100.0 100.0 100.0 100.0 100.0 100.0 100.0 100.0 100.0 100.0 - - 100.0 100.0No. of admissions 6,496 2,041 2,200 668 241 34 38 584 482 8 17 4 - - 3 176
Race/ethnicityWhite (non-Hispanic) 33.0 26.0 23.4 59.7 51.9 52.9 18.4 26.3 60.2 75.0 64.7 50.0 - - 33.3 46.0Black (non-Hispanic) 1.6 1.1 1.5 1.6 0.4 8.8 15.8 3.8 0.6 - - - - - - - - - - 1.1Hispanic origin 2.3 1.7 1.6 4.6 3.7 - - 5.3 4.1 1.7 - - - - - - - - - - 2.8American Indian/Alaska Native 44.9 56.9 54.3 16.6 23.7 20.6 31.6 41.1 17.2 12.5 11.8 50.0 - - 33.3 27.3Asian/Pacific Islander 1.0 0.6 1.2 0.3 0.4 - - 2.6 1.5 2.9 - - - - - - - - - - - -Other 17.3 13.8 18.0 17.1 19.9 17.6 26.3 23.2 17.4 12.5 23.5 - - - - 33.3 22.7
Total 100.0 100.0 100.0 100.0 100.0 100.0 100.0 100.0 100.0 100.0 100.0 100.0 - - 100.0 100.0No. of admissions 6,467 2,029 2,186 667 241 34 38 582 482 8 17 4 - - 3 176
Table 3.2b. Alaska admissions aged 12 and older, by primary substance of abuse and gender, age at admission, and race/ethnicity: Percent distribution, 2015
Gender, age at admission, and race/ethnicity
All admis-sions
aged 12 and older
Primary substance at admission
Alcohol Opiates CocaineMari-juana/
hashish
Metham-phetamine/
amphet-amines
Tran-quil-izers
NOTE: Percentages may not sum to 100 percent due to rounding. Percentages are based on all admissions with known and valid values. Admissions for which values were not collected, unknown, or missing are excluded from the percentage base (denominator).SOURCE: Center for Behavioral Health Statistics and Quality, Substance Abuse and Mental Health Services Administration, Treatment Episode Data Set (TEDS). Data received through 11.01.16.
Seda-tives
Hallu-cino-gens PCP
Inhal-ants
Other/ none speci-fied
- - Quantity is zero.
96

Alcohol only
Secondarydrug Heroin
Other opiates
Smoked cocaine
Other route
Total admissions aged 12 and older 20,865 3,698 2,617 3,732 1,140 247 329 4,059 4,197 73 20 46 - - 13 694
GenderMale 11,478 2,123 1,610 2,222 530 136 187 2,332 1,942 33 11 29 - - 12 311Female 9,387 1,575 1,007 1,510 610 111 142 1,727 2,255 40 9 17 - - 1 383
No. of admissions1 20,865 3,698 2,617 3,732 1,140 247 329 4,059 4,197 73 20 46 - - 13 694
Age at admission12 to 19 years 907 43 88 133 19 1 13 447 106 5 1 5 - - - - 4620 to 24 years 3,379 311 318 870 154 10 29 1,035 542 11 4 8 - - 3 8425 to 29 years 4,042 455 425 1,097 288 23 59 829 735 8 3 7 - - 1 11230 to 34 years 3,460 520 421 567 219 32 59 618 903 15 3 13 - - 1 8935 to 39 years 2,636 478 379 382 160 28 54 394 648 7 4 8 - - 3 9140 to 44 years 1,887 453 270 216 104 34 31 258 446 6 1 2 - - 1 6545 to 49 years 1,629 439 263 153 57 44 27 185 390 6 2 2 - - - - 6150 to 54 years 1,446 473 237 147 53 44 30 134 260 3 2 - - - - 3 6055 to 59 years 941 318 141 105 56 22 20 96 119 7 - - - - - - 1 5660 years and older 538 208 75 62 30 9 7 63 48 5 - - 1 - - - - 30
No. of admissions 20,865 3,698 2,617 3,732 1,140 247 329 4,059 4,197 73 20 46 - - 13 694
Race/ethnicityWhite (non-Hispanic) 12,198 2,016 1,467 2,484 739 98 123 2,109 2,561 55 18 15 - - 10 503Black (non-Hispanic) 1,062 113 145 89 34 62 32 382 162 1 - - 16 - - - - 26Hispanic origin 5,503 742 606 960 309 70 152 1,292 1,219 15 2 12 - - 2 122American Indian/Alaska Native 1,448 706 334 60 29 7 11 147 126 1 - - 1 - - - - 26Asian/Pacific Islander 118 20 7 23 8 2 3 23 26 1 - - 1 - - - - 4Other 536 101 58 116 21 8 8 106 103 - - - - 1 - - 1 13
No. of admissions 20,865 3,698 2,617 3,732 1,140 247 329 4,059 4,197 73 20 46 - - 13 694
Table 3.3a. Arizona admissions aged 12 and older, by primary substance of abuse and gender, age at admission, and race/ethnicity: Number, 2015
Gender, age at admission, and race/ethnicity
All admis-sions
aged 12 and older
Primary substance at admission
Alcohol Opiates Cocaine
Mari-juana/
hashish
Metham-phetamine/
amphet-amines
Tran-quil-izers
Seda-tives
Hallu-cino-gens PCP
1 Admissions for which values were not collected, unknown, or missing are excluded from the sum total.
Inhal-ants
Other/ none speci-fied
- - Quantity is zero.
SOURCE: Center for Behavioral Health Statistics and Quality, Substance Abuse and Mental Health Services Administration, Treatment Episode Data Set (TEDS). Data received through 11.01.16.
97
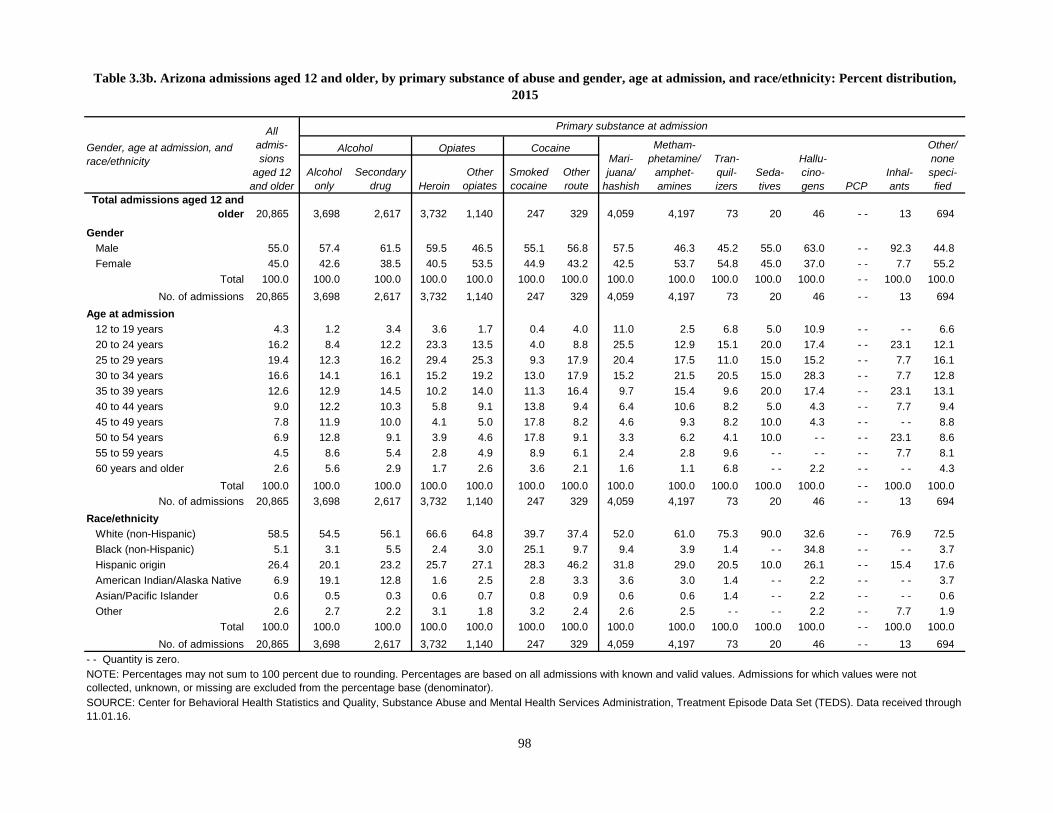
Alcohol only
Secondarydrug Heroin
Other opiates
Smoked cocaine
Other route
Total admissions aged 12 and older 20,865 3,698 2,617 3,732 1,140 247 329 4,059 4,197 73 20 46 - - 13 694
GenderMale 55.0 57.4 61.5 59.5 46.5 55.1 56.8 57.5 46.3 45.2 55.0 63.0 - - 92.3 44.8Female 45.0 42.6 38.5 40.5 53.5 44.9 43.2 42.5 53.7 54.8 45.0 37.0 - - 7.7 55.2
Total 100.0 100.0 100.0 100.0 100.0 100.0 100.0 100.0 100.0 100.0 100.0 100.0 - - 100.0 100.0No. of admissions 20,865 3,698 2,617 3,732 1,140 247 329 4,059 4,197 73 20 46 - - 13 694
Age at admission12 to 19 years 4.3 1.2 3.4 3.6 1.7 0.4 4.0 11.0 2.5 6.8 5.0 10.9 - - - - 6.620 to 24 years 16.2 8.4 12.2 23.3 13.5 4.0 8.8 25.5 12.9 15.1 20.0 17.4 - - 23.1 12.125 to 29 years 19.4 12.3 16.2 29.4 25.3 9.3 17.9 20.4 17.5 11.0 15.0 15.2 - - 7.7 16.130 to 34 years 16.6 14.1 16.1 15.2 19.2 13.0 17.9 15.2 21.5 20.5 15.0 28.3 - - 7.7 12.835 to 39 years 12.6 12.9 14.5 10.2 14.0 11.3 16.4 9.7 15.4 9.6 20.0 17.4 - - 23.1 13.140 to 44 years 9.0 12.2 10.3 5.8 9.1 13.8 9.4 6.4 10.6 8.2 5.0 4.3 - - 7.7 9.445 to 49 years 7.8 11.9 10.0 4.1 5.0 17.8 8.2 4.6 9.3 8.2 10.0 4.3 - - - - 8.850 to 54 years 6.9 12.8 9.1 3.9 4.6 17.8 9.1 3.3 6.2 4.1 10.0 - - - - 23.1 8.655 to 59 years 4.5 8.6 5.4 2.8 4.9 8.9 6.1 2.4 2.8 9.6 - - - - - - 7.7 8.160 years and older 2.6 5.6 2.9 1.7 2.6 3.6 2.1 1.6 1.1 6.8 - - 2.2 - - - - 4.3
Total 100.0 100.0 100.0 100.0 100.0 100.0 100.0 100.0 100.0 100.0 100.0 100.0 - - 100.0 100.0No. of admissions 20,865 3,698 2,617 3,732 1,140 247 329 4,059 4,197 73 20 46 - - 13 694
Race/ethnicityWhite (non-Hispanic) 58.5 54.5 56.1 66.6 64.8 39.7 37.4 52.0 61.0 75.3 90.0 32.6 - - 76.9 72.5Black (non-Hispanic) 5.1 3.1 5.5 2.4 3.0 25.1 9.7 9.4 3.9 1.4 - - 34.8 - - - - 3.7Hispanic origin 26.4 20.1 23.2 25.7 27.1 28.3 46.2 31.8 29.0 20.5 10.0 26.1 - - 15.4 17.6American Indian/Alaska Native 6.9 19.1 12.8 1.6 2.5 2.8 3.3 3.6 3.0 1.4 - - 2.2 - - - - 3.7Asian/Pacific Islander 0.6 0.5 0.3 0.6 0.7 0.8 0.9 0.6 0.6 1.4 - - 2.2 - - - - 0.6Other 2.6 2.7 2.2 3.1 1.8 3.2 2.4 2.6 2.5 - - - - 2.2 - - 7.7 1.9
Total 100.0 100.0 100.0 100.0 100.0 100.0 100.0 100.0 100.0 100.0 100.0 100.0 - - 100.0 100.0No. of admissions 20,865 3,698 2,617 3,732 1,140 247 329 4,059 4,197 73 20 46 - - 13 694
Table 3.3b. Arizona admissions aged 12 and older, by primary substance of abuse and gender, age at admission, and race/ethnicity: Percent distribution, 2015
Gender, age at admission, and race/ethnicity
All admis-sions
aged 12 and older
Primary substance at admission
Alcohol Opiates CocaineMari-juana/
hashish
Metham-phetamine/
amphet-amines
Tran-quil-izers
NOTE: Percentages may not sum to 100 percent due to rounding. Percentages are based on all admissions with known and valid values. Admissions for which values were not collected, unknown, or missing are excluded from the percentage base (denominator).SOURCE: Center for Behavioral Health Statistics and Quality, Substance Abuse and Mental Health Services Administration, Treatment Episode Data Set (TEDS). Data received through 11.01.16.
Seda-tives
Hallu-cino-gens PCP
Inhal-ants
Other/ none speci-fied
- - Quantity is zero.
98
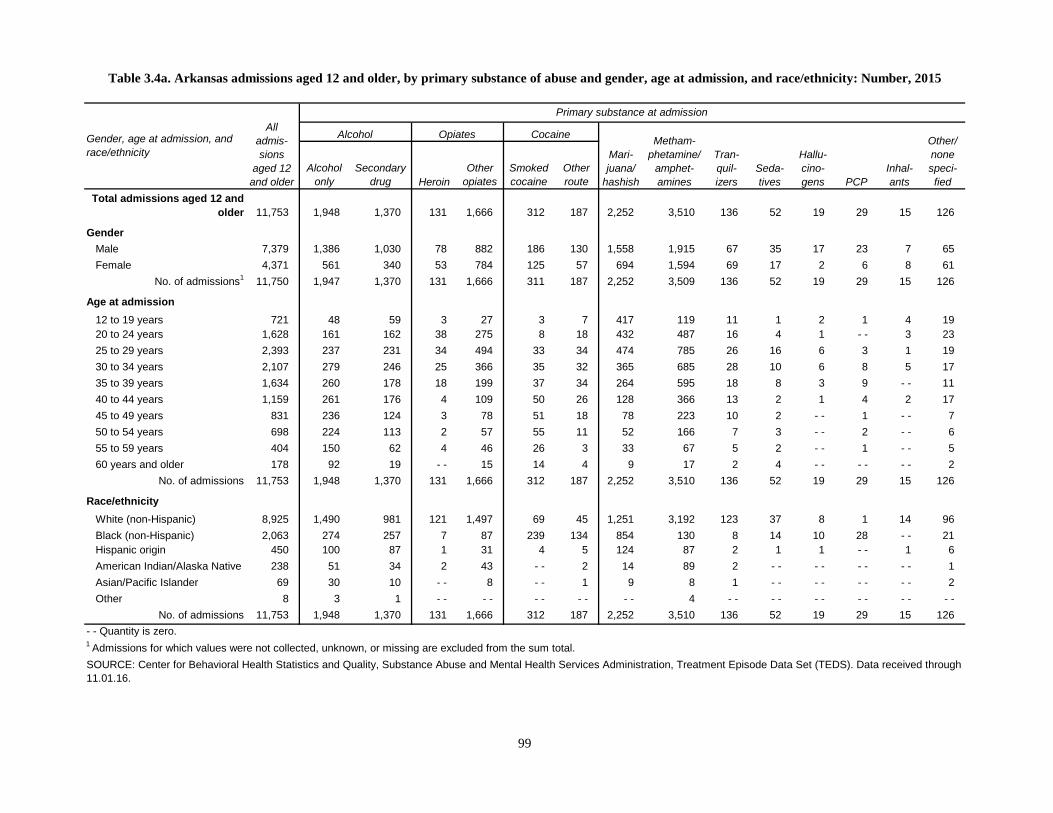
Alcohol only
Secondarydrug Heroin
Other opiates
Smoked cocaine
Other route
Total admissions aged 12 and older 11,753 1,948 1,370 131 1,666 312 187 2,252 3,510 136 52 19 29 15 126
GenderMale 7,379 1,386 1,030 78 882 186 130 1,558 1,915 67 35 17 23 7 65Female 4,371 561 340 53 784 125 57 694 1,594 69 17 2 6 8 61
No. of admissions1 11,750 1,947 1,370 131 1,666 311 187 2,252 3,509 136 52 19 29 15 126
Age at admission12 to 19 years 721 48 59 3 27 3 7 417 119 11 1 2 1 4 1920 to 24 years 1,628 161 162 38 275 8 18 432 487 16 4 1 - - 3 2325 to 29 years 2,393 237 231 34 494 33 34 474 785 26 16 6 3 1 1930 to 34 years 2,107 279 246 25 366 35 32 365 685 28 10 6 8 5 1735 to 39 years 1,634 260 178 18 199 37 34 264 595 18 8 3 9 - - 1140 to 44 years 1,159 261 176 4 109 50 26 128 366 13 2 1 4 2 1745 to 49 years 831 236 124 3 78 51 18 78 223 10 2 - - 1 - - 750 to 54 years 698 224 113 2 57 55 11 52 166 7 3 - - 2 - - 655 to 59 years 404 150 62 4 46 26 3 33 67 5 2 - - 1 - - 560 years and older 178 92 19 - - 15 14 4 9 17 2 4 - - - - - - 2
No. of admissions 11,753 1,948 1,370 131 1,666 312 187 2,252 3,510 136 52 19 29 15 126
Race/ethnicityWhite (non-Hispanic) 8,925 1,490 981 121 1,497 69 45 1,251 3,192 123 37 8 1 14 96Black (non-Hispanic) 2,063 274 257 7 87 239 134 854 130 8 14 10 28 - - 21Hispanic origin 450 100 87 1 31 4 5 124 87 2 1 1 - - 1 6American Indian/Alaska Native 238 51 34 2 43 - - 2 14 89 2 - - - - - - - - 1Asian/Pacific Islander 69 30 10 - - 8 - - 1 9 8 1 - - - - - - - - 2Other 8 3 1 - - - - - - - - - - 4 - - - - - - - - - - - -
No. of admissions 11,753 1,948 1,370 131 1,666 312 187 2,252 3,510 136 52 19 29 15 126- - Quantity is zero.
SOURCE: Center for Behavioral Health Statistics and Quality, Substance Abuse and Mental Health Services Administration, Treatment Episode Data Set (TEDS). Data received through 11.01.16.
Seda-tives
Hallu-cino-gens PCP
Inhal-ants
Other/ none speci-fied
1 Admissions for which values were not collected, unknown, or missing are excluded from the sum total.
Table 3.4a. Arkansas admissions aged 12 and older, by primary substance of abuse and gender, age at admission, and race/ethnicity: Number, 2015
Gender, age at admission, and race/ethnicity
All admis-sions
aged 12 and older
Primary substance at admission
Alcohol Opiates Cocaine
Mari-juana/
hashish
Metham-phetamine/
amphet-amines
Tran-quil-izers
99
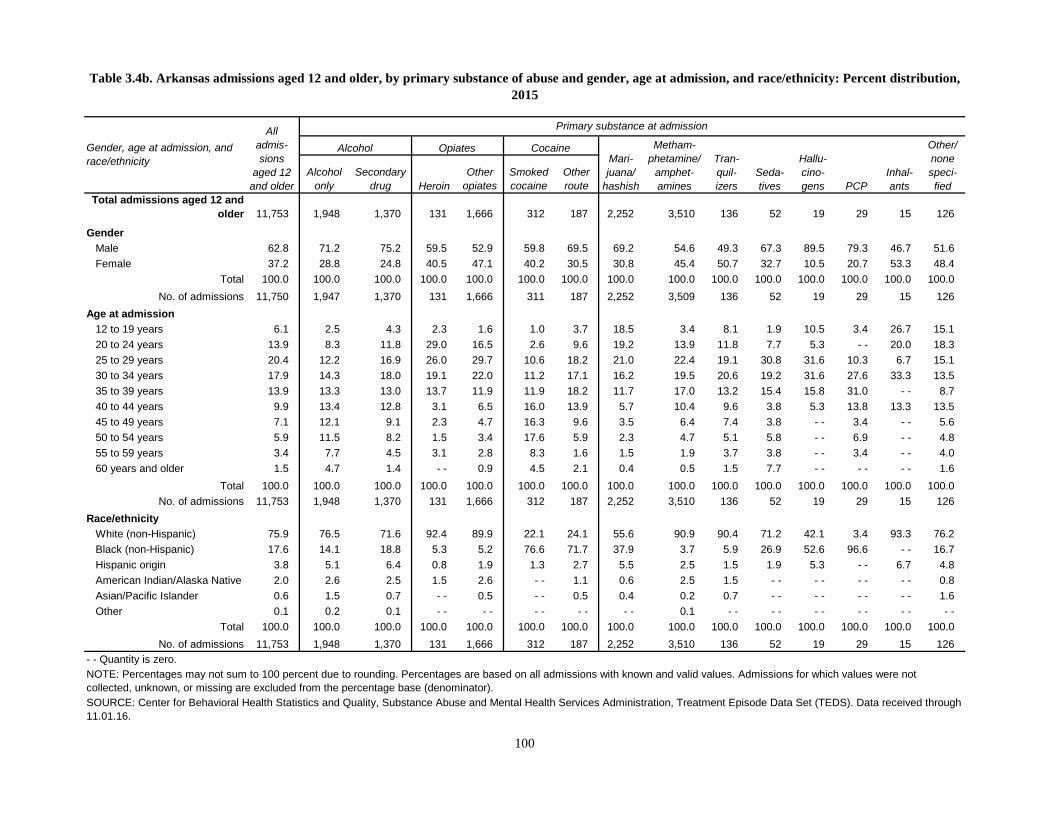
Alcohol only
Secondarydrug Heroin
Other opiates
Smoked cocaine
Other route
Total admissions aged 12 and older 11,753 1,948 1,370 131 1,666 312 187 2,252 3,510 136 52 19 29 15 126
GenderMale 62.8 71.2 75.2 59.5 52.9 59.8 69.5 69.2 54.6 49.3 67.3 89.5 79.3 46.7 51.6Female 37.2 28.8 24.8 40.5 47.1 40.2 30.5 30.8 45.4 50.7 32.7 10.5 20.7 53.3 48.4
Total 100.0 100.0 100.0 100.0 100.0 100.0 100.0 100.0 100.0 100.0 100.0 100.0 100.0 100.0 100.0No. of admissions 11,750 1,947 1,370 131 1,666 311 187 2,252 3,509 136 52 19 29 15 126
Age at admission12 to 19 years 6.1 2.5 4.3 2.3 1.6 1.0 3.7 18.5 3.4 8.1 1.9 10.5 3.4 26.7 15.120 to 24 years 13.9 8.3 11.8 29.0 16.5 2.6 9.6 19.2 13.9 11.8 7.7 5.3 - - 20.0 18.325 to 29 years 20.4 12.2 16.9 26.0 29.7 10.6 18.2 21.0 22.4 19.1 30.8 31.6 10.3 6.7 15.130 to 34 years 17.9 14.3 18.0 19.1 22.0 11.2 17.1 16.2 19.5 20.6 19.2 31.6 27.6 33.3 13.535 to 39 years 13.9 13.3 13.0 13.7 11.9 11.9 18.2 11.7 17.0 13.2 15.4 15.8 31.0 - - 8.740 to 44 years 9.9 13.4 12.8 3.1 6.5 16.0 13.9 5.7 10.4 9.6 3.8 5.3 13.8 13.3 13.545 to 49 years 7.1 12.1 9.1 2.3 4.7 16.3 9.6 3.5 6.4 7.4 3.8 - - 3.4 - - 5.650 to 54 years 5.9 11.5 8.2 1.5 3.4 17.6 5.9 2.3 4.7 5.1 5.8 - - 6.9 - - 4.855 to 59 years 3.4 7.7 4.5 3.1 2.8 8.3 1.6 1.5 1.9 3.7 3.8 - - 3.4 - - 4.060 years and older 1.5 4.7 1.4 - - 0.9 4.5 2.1 0.4 0.5 1.5 7.7 - - - - - - 1.6
Total 100.0 100.0 100.0 100.0 100.0 100.0 100.0 100.0 100.0 100.0 100.0 100.0 100.0 100.0 100.0No. of admissions 11,753 1,948 1,370 131 1,666 312 187 2,252 3,510 136 52 19 29 15 126
Race/ethnicityWhite (non-Hispanic) 75.9 76.5 71.6 92.4 89.9 22.1 24.1 55.6 90.9 90.4 71.2 42.1 3.4 93.3 76.2Black (non-Hispanic) 17.6 14.1 18.8 5.3 5.2 76.6 71.7 37.9 3.7 5.9 26.9 52.6 96.6 - - 16.7Hispanic origin 3.8 5.1 6.4 0.8 1.9 1.3 2.7 5.5 2.5 1.5 1.9 5.3 - - 6.7 4.8American Indian/Alaska Native 2.0 2.6 2.5 1.5 2.6 - - 1.1 0.6 2.5 1.5 - - - - - - - - 0.8Asian/Pacific Islander 0.6 1.5 0.7 - - 0.5 - - 0.5 0.4 0.2 0.7 - - - - - - - - 1.6Other 0.1 0.2 0.1 - - - - - - - - - - 0.1 - - - - - - - - - - - -
Total 100.0 100.0 100.0 100.0 100.0 100.0 100.0 100.0 100.0 100.0 100.0 100.0 100.0 100.0 100.0No. of admissions 11,753 1,948 1,370 131 1,666 312 187 2,252 3,510 136 52 19 29 15 126
NOTE: Percentages may not sum to 100 percent due to rounding. Percentages are based on all admissions with known and valid values. Admissions for which values were not collected, unknown, or missing are excluded from the percentage base (denominator).SOURCE: Center for Behavioral Health Statistics and Quality, Substance Abuse and Mental Health Services Administration, Treatment Episode Data Set (TEDS). Data received through 11.01.16.
Seda-tives
Hallu-cino-gens PCP
Inhal-ants
Other/ none speci-fied
- - Quantity is zero.
Table 3.4b. Arkansas admissions aged 12 and older, by primary substance of abuse and gender, age at admission, and race/ethnicity: Percent distribution, 2015
Gender, age at admission, and race/ethnicity
All admis-sions
aged 12 and older
Primary substance at admission
Alcohol Opiates CocaineMari-juana/
hashish
Metham-phetamine/
amphet-amines
Tran-quil-izers
100

Alcohol only
Secondarydrug Heroin
Other opiates
Smoked cocaine
Other route
Total admissions aged 12 and older 150,071 17,079 14,671 36,709 8,023 3,576 1,371 21,997 45,038 380 272 87 299 47 522
GenderMale 94,246 11,021 9,612 24,909 4,142 2,335 1,010 15,107 25,188 202 141 64 188 30 297Female 55,735 6,048 5,054 11,790 3,880 1,235 361 6,879 19,805 178 130 23 111 17 224
No. of admissions1 149,981 17,069 14,666 36,699 8,022 3,570 1,371 21,986 44,993 380 271 87 299 47 521
Age at admission12 to 19 years 15,772 856 1,058 569 123 38 121 11,130 1,642 63 42 35 1 13 8120 to 24 years 17,896 820 1,199 5,934 792 71 253 3,068 5,539 69 45 17 18 7 6425 to 29 years 25,437 1,623 2,023 8,111 1,619 148 267 2,668 8,740 60 42 10 34 8 8430 to 34 years 23,132 2,033 2,179 5,650 1,584 235 172 1,989 9,091 49 41 8 38 5 5835 to 39 years 17,398 1,827 1,932 3,739 1,125 302 148 1,174 6,963 38 36 9 51 2 5240 to 44 years 12,725 1,915 1,562 2,509 665 372 111 689 4,745 19 21 1 59 4 5345 to 49 years 12,819 2,238 1,685 2,800 582 685 106 541 4,071 21 18 2 31 7 3250 to 54 years 11,887 2,442 1,570 3,040 582 898 87 406 2,758 20 9 2 36 - - 3755 to 59 years 7,703 1,842 939 2,368 517 548 70 223 1,101 22 9 3 25 1 3560 years and older 5,302 1,483 524 1,989 434 279 36 109 388 19 9 - - 6 - - 26
No. of admissions 150,071 17,079 14,671 36,709 8,023 3,576 1,371 21,997 45,038 380 272 87 299 47 522
Race/ethnicityWhite (non-Hispanic) 67,227 8,911 6,909 20,927 5,160 385 322 4,766 19,135 240 144 55 21 17 235Black (non-Hispanic) 16,965 1,681 1,822 2,777 494 2,630 353 3,775 3,194 18 27 4 118 2 70Hispanic origin 48,666 4,624 4,280 9,743 1,532 300 513 10,609 16,634 83 55 18 107 16 152American Indian/Alaska Native 1,902 251 269 409 98 6 8 196 647 5 1 1 7 1 3Asian/Pacific Islander 3,212 380 220 436 153 98 54 459 1,369 10 11 - - 2 3 17Other 12,099 1,232 1,171 2,417 586 157 121 2,192 4,059 24 34 9 44 8 45
No. of admissions 150,071 17,079 14,671 36,709 8,023 3,576 1,371 21,997 45,038 380 272 87 299 47 522
1 Admissions for which values were not collected, unknown, or missing are excluded from the sum total.
Inhal-ants
Other/ none speci-fied
SOURCE: Center for Behavioral Health Statistics and Quality, Substance Abuse and Mental Health Services Administration, Treatment Episode Data Set (TEDS). Data received through 11.01.16.
- - Quantity is zero.
Table 3.5a. California admissions aged 12 and older, by primary substance of abuse and gender, age at admission, and race/ethnicity: Number, 2015
Gender, age at admission, and race/ethnicity
All admis-sions
aged 12 and older
Primary substance at admission
Alcohol Opiates Cocaine
Mari-juana/
hashish
Metham-phetamine/
amphet-amines
Tran-quil-izers
Seda-tives
Hallu-cino-gens PCP
101

Alcohol only
Secondarydrug Heroin
Other opiates
Smoked cocaine
Other route
Total admissions aged 12 and older 150,071 17,079 14,671 36,709 8,023 3,576 1,371 21,997 45,038 380 272 87 299 47 522
GenderMale 62.8 64.6 65.5 67.9 51.6 65.4 73.7 68.7 56.0 53.2 52.0 73.6 62.9 63.8 57.0Female 37.2 35.4 34.5 32.1 48.4 34.6 26.3 31.3 44.0 46.8 48.0 26.4 37.1 36.2 43.0
Total 100.0 100.0 100.0 100.0 100.0 100.0 100.0 100.0 100.0 100.0 100.0 100.0 100.0 100.0 100.0No. of admissions 149,981 17,069 14,666 36,699 8,022 3,570 1,371 21,986 44,993 380 271 87 299 47 521
Age at admission12 to 19 years 10.5 5.0 7.2 1.6 1.5 1.1 8.8 50.6 3.6 16.6 15.4 40.2 0.3 27.7 15.520 to 24 years 11.9 4.8 8.2 16.2 9.9 2.0 18.5 13.9 12.3 18.2 16.5 19.5 6.0 14.9 12.325 to 29 years 16.9 9.5 13.8 22.1 20.2 4.1 19.5 12.1 19.4 15.8 15.4 11.5 11.4 17.0 16.130 to 34 years 15.4 11.9 14.9 15.4 19.7 6.6 12.5 9.0 20.2 12.9 15.1 9.2 12.7 10.6 11.135 to 39 years 11.6 10.7 13.2 10.2 14.0 8.4 10.8 5.3 15.5 10.0 13.2 10.3 17.1 4.3 10.040 to 44 years 8.5 11.2 10.6 6.8 8.3 10.4 8.1 3.1 10.5 5.0 7.7 1.1 19.7 8.5 10.245 to 49 years 8.5 13.1 11.5 7.6 7.3 19.2 7.7 2.5 9.0 5.5 6.6 2.3 10.4 14.9 6.150 to 54 years 7.9 14.3 10.7 8.3 7.3 25.1 6.3 1.8 6.1 5.3 3.3 2.3 12.0 - - 7.155 to 59 years 5.1 10.8 6.4 6.5 6.4 15.3 5.1 1.0 2.4 5.8 3.3 3.4 8.4 2.1 6.760 years and older 3.5 8.7 3.6 5.4 5.4 7.8 2.6 0.5 0.9 5.0 3.3 - - 2.0 - - 5.0
Total 100.0 100.0 100.0 100.0 100.0 100.0 100.0 100.0 100.0 100.0 100.0 100.0 100.0 100.0 100.0No. of admissions 150,071 17,079 14,671 36,709 8,023 3,576 1,371 21,997 45,038 380 272 87 299 47 522
Race/ethnicityWhite (non-Hispanic) 44.8 52.2 47.1 57.0 64.3 10.8 23.5 21.7 42.5 63.2 52.9 63.2 7.0 36.2 45.0Black (non-Hispanic) 11.3 9.8 12.4 7.6 6.2 73.5 25.7 17.2 7.1 4.7 9.9 4.6 39.5 4.3 13.4Hispanic origin 32.4 27.1 29.2 26.5 19.1 8.4 37.4 48.2 36.9 21.8 20.2 20.7 35.8 34.0 29.1American Indian/Alaska Native 1.3 1.5 1.8 1.1 1.2 0.2 0.6 0.9 1.4 1.3 0.4 1.1 2.3 2.1 0.6Asian/Pacific Islander 2.1 2.2 1.5 1.2 1.9 2.7 3.9 2.1 3.0 2.6 4.0 - - 0.7 6.4 3.3Other 8.1 7.2 8.0 6.6 7.3 4.4 8.8 10.0 9.0 6.3 12.5 10.3 14.7 17.0 8.6
Total 100.0 100.0 100.0 100.0 100.0 100.0 100.0 100.0 100.0 100.0 100.0 100.0 100.0 100.0 100.0No. of admissions 150,071 17,079 14,671 36,709 8,023 3,576 1,371 21,997 45,038 380 272 87 299 47 522
NOTE: Percentages may not sum to 100 percent due to rounding. Percentages are based on all admissions with known and valid values. Admissions for which values were not collected, unknown, or missing are excluded from the percentage base (denominator).SOURCE: Center for Behavioral Health Statistics and Quality, Substance Abuse and Mental Health Services Administration, Treatment Episode Data Set (TEDS). Data received through 11.01.16.
Seda-tives
Hallu-cino-gens PCP
Inhal-ants
Other/ none speci-fied
- - Quantity is zero.
Table 3.5b. California admissions aged 12 and older, by primary substance of abuse and gender, age at admission, and race/ethnicity: Percent distribution, 2015
Gender, age at admission, and race/ethnicity
All admis-sions
aged 12 and older
Primary substance at admission
Alcohol Opiates CocaineMari-juana/
hashish
Metham-phetamine/
amphet-amines
Tran-quil-izers
102

Alcohol only
Secondarydrug Heroin
Other opiates
Smoked cocaine
Other route
Total admissions aged 12 and older 87,689 35,794 21,591 7,610 2,381 1,120 922 6,886 10,503 313 79 95 13 40 342
GenderMale 64,080 28,006 16,820 4,689 1,266 668 687 5,245 6,129 167 46 80 9 22 246Female 23,609 7,788 4,771 2,921 1,115 452 235 1,641 4,374 146 33 15 4 18 96
No. of admissions1 87,689 35,794 21,591 7,610 2,381 1,120 922 6,886 10,503 313 79 95 13 40 342
Age at admission12 to 19 years 3,737 623 371 381 67 17 49 1,741 413 13 2 29 - - 4 2720 to 24 years 10,870 2,903 1,954 2,386 408 33 136 1,404 1,502 61 9 19 2 6 4725 to 29 years 12,888 3,928 2,823 1,982 531 112 155 1,202 1,997 55 16 21 3 6 5730 to 34 years 12,285 4,130 2,918 1,232 488 131 130 928 2,199 44 14 11 3 3 5435 to 39 years 9,665 3,784 2,283 643 338 133 108 613 1,653 38 10 5 2 9 4640 to 44 years 8,512 3,832 2,323 367 160 162 92 385 1,111 33 3 5 - - 2 3745 to 49 years 9,050 4,699 2,540 204 114 226 103 267 843 17 5 3 2 3 2450 to 54 years 9,516 5,194 3,049 126 110 198 91 193 491 31 8 1 - - 1 2355 to 59 years 6,714 3,841 2,149 152 95 90 34 100 210 14 9 1 1 3 1560 years and older 4,452 2,860 1,181 137 70 18 24 53 84 7 3 - - - - 3 12
No. of admissions 87,689 35,794 21,591 7,610 2,381 1,120 922 6,886 10,503 313 79 95 13 40 342
Race/ethnicityWhite (non-Hispanic) 44,957 17,285 11,292 4,331 1,438 271 340 3,134 6,370 207 45 59 4 21 160Black (non-Hispanic) 6,037 2,344 1,872 152 52 425 139 724 275 10 6 3 4 1 30Hispanic origin 25,175 10,214 5,755 2,499 705 315 341 2,237 2,886 64 19 21 4 8 107American Indian/Alaska Native 3,645 2,293 942 69 24 13 12 126 153 2 1 - - - - 5 5Asian/Pacific Islander 581 297 79 52 8 8 8 44 77 3 2 1 - - - - 2Other 2,346 889 587 142 55 32 36 267 311 10 1 7 - - - - 9
No. of admissions 82,741 33,322 20,527 7,245 2,282 1,064 876 6,532 10,072 296 74 91 12 35 313
Table 3.6a. Colorado admissions aged 12 and older, by primary substance of abuse and gender, age at admission, and race/ethnicity: Number, 2015
Gender, age at admission, and race/ethnicity
All admis-sions
aged 12 and older
Primary substance at admission
Alcohol Opiates Cocaine
Mari-juana/
hashish
Metham-phetamine/
amphet-amines
Tran-quil-izers
Seda-tives
Hallu-cino-gens PCP
Inhal-ants
Other/ none speci-fied
- - Quantity is zero.
SOURCE: Center for Behavioral Health Statistics and Quality, Substance Abuse and Mental Health Services Administration, Treatment Episode Data Set (TEDS). Data received through 11.01.16.
1 Admissions for which values were not collected, unknown, or missing are excluded from the sum total.
103

Alcohol only
Secondarydrug Heroin
Other opiates
Smoked cocaine
Other route
Total admissions aged 12 and older 87,689 35,794 21,591 7,610 2,381 1,120 922 6,886 10,503 313 79 95 13 40 342
GenderMale 73.1 78.2 77.9 61.6 53.2 59.6 74.5 76.2 58.4 53.4 58.2 84.2 69.2 55.0 71.9Female 26.9 21.8 22.1 38.4 46.8 40.4 25.5 23.8 41.6 46.6 41.8 15.8 30.8 45.0 28.1
Total 100.0 100.0 100.0 100.0 100.0 100.0 100.0 100.0 100.0 100.0 100.0 100.0 100.0 100.0 100.0No. of admissions 87,689 35,794 21,591 7,610 2,381 1,120 922 6,886 10,503 313 79 95 13 40 342
Age at admission12 to 19 years 4.3 1.7 1.7 5.0 2.8 1.5 5.3 25.3 3.9 4.2 2.5 30.5 - - 10.0 7.920 to 24 years 12.4 8.1 9.1 31.4 17.1 2.9 14.8 20.4 14.3 19.5 11.4 20.0 15.4 15.0 13.725 to 29 years 14.7 11.0 13.1 26.0 22.3 10.0 16.8 17.5 19.0 17.6 20.3 22.1 23.1 15.0 16.730 to 34 years 14.0 11.5 13.5 16.2 20.5 11.7 14.1 13.5 20.9 14.1 17.7 11.6 23.1 7.5 15.835 to 39 years 11.0 10.6 10.6 8.4 14.2 11.9 11.7 8.9 15.7 12.1 12.7 5.3 15.4 22.5 13.540 to 44 years 9.7 10.7 10.8 4.8 6.7 14.5 10.0 5.6 10.6 10.5 3.8 5.3 - - 5.0 10.845 to 49 years 10.3 13.1 11.8 2.7 4.8 20.2 11.2 3.9 8.0 5.4 6.3 3.2 15.4 7.5 7.050 to 54 years 10.9 14.5 14.1 1.7 4.6 17.7 9.9 2.8 4.7 9.9 10.1 1.1 - - 2.5 6.755 to 59 years 7.7 10.7 10.0 2.0 4.0 8.0 3.7 1.5 2.0 4.5 11.4 1.1 7.7 7.5 4.460 years and older 5.1 8.0 5.5 1.8 2.9 1.6 2.6 0.8 0.8 2.2 3.8 - - - - 7.5 3.5
Total 100.0 100.0 100.0 100.0 100.0 100.0 100.0 100.0 100.0 100.0 100.0 100.0 100.0 100.0 100.0No. of admissions 87,689 35,794 21,591 7,610 2,381 1,120 922 6,886 10,503 313 79 95 13 40 342
Race/ethnicityWhite (non-Hispanic) 54.3 51.9 55.0 59.8 63.0 25.5 38.8 48.0 63.2 69.9 60.8 64.8 33.3 60.0 51.1Black (non-Hispanic) 7.3 7.0 9.1 2.1 2.3 39.9 15.9 11.1 2.7 3.4 8.1 3.3 33.3 2.9 9.6Hispanic origin 30.4 30.7 28.0 34.5 30.9 29.6 38.9 34.2 28.7 21.6 25.7 23.1 33.3 22.9 34.2American Indian/Alaska Native 4.4 6.9 4.6 1.0 1.1 1.2 1.4 1.9 1.5 0.7 1.4 - - - - 14.3 1.6Asian/Pacific Islander 0.7 0.9 0.4 0.7 0.4 0.8 0.9 0.7 0.8 1.0 2.7 1.1 - - - - 0.6Other 2.8 2.7 2.9 2.0 2.4 3.0 4.1 4.1 3.1 3.4 1.4 7.7 - - - - 2.9
Total 100.0 100.0 100.0 100.0 100.0 100.0 100.0 100.0 100.0 100.0 100.0 100.0 100.0 100.0 100.0No. of admissions 82,741 33,322 20,527 7,245 2,282 1,064 876 6,532 10,072 296 74 91 12 35 313
NOTE: Percentages may not sum to 100 percent due to rounding. Percentages are based on all admissions with known and valid values. Admissions for which values were not collected, unknown, or missing are excluded from the percentage base (denominator).SOURCE: Center for Behavioral Health Statistics and Quality, Substance Abuse and Mental Health Services Administration, Treatment Episode Data Set (TEDS). Data received through 11.01.16.
Seda-tives
Hallu-cino-gens PCP
Inhal-ants
Other/ none speci-fied
- - Quantity is zero.
Table 3.6b. Colorado admissions aged 12 and older, by primary substance of abuse and gender, age at admission, and race/ethnicity: Percent distribution, 2015
Gender, age at admission, and race/ethnicity
All admis-sions
aged 12 and older
Primary substance at admission
Alcohol Opiates CocaineMari-juana/
hashish
Metham-phetamine/
amphet-amines
Tran-quil-izers
104

Alcohol only
Secondarydrug Heroin
Other opiates
Smoked cocaine
Other route
Total admissions aged 12 and older 67,706 12,966 10,257 23,746 2,934 2,368 1,672 8,125 121 791 171 188 910 34 3,423
GenderMale 47,429 9,284 7,581 16,496 1,873 1,330 1,220 6,119 79 529 117 144 596 22 2,039Female 20,198 3,669 2,666 7,226 1,058 1,036 448 1,991 42 260 54 44 313 12 1,379
No. of admissions1 67,627 12,953 10,247 23,722 2,931 2,366 1,668 8,110 121 789 171 188 909 34 3,418
Age at admission12 to 19 years 1,348 86 136 280 35 8 14 603 6 13 5 5 4 1 15220 to 24 years 8,708 686 1,016 3,350 359 121 146 2,261 13 84 24 33 95 7 51325 to 29 years 12,865 1,346 1,575 5,716 630 228 250 2,047 19 161 34 53 226 9 57130 to 34 years 11,097 1,499 1,524 4,376 648 300 246 1,345 16 181 35 35 335 5 55235 to 39 years 8,130 1,545 1,280 2,918 403 294 219 730 27 100 19 29 160 3 40340 to 44 years 6,725 1,383 1,165 2,285 283 373 213 501 14 74 17 13 71 1 33245 to 49 years 7,255 1,994 1,399 2,202 223 443 250 276 12 71 10 9 17 1 34850 to 54 years 6,150 2,253 1,183 1,406 190 381 200 204 7 51 9 5 2 6 25355 to 59 years 3,508 1,352 671 796 106 149 90 122 6 26 16 6 - - 1 16760 years and older 1,920 822 308 417 57 71 44 36 1 30 2 - - - - - - 132
No. of admissions 67,706 12,966 10,257 23,746 2,934 2,368 1,672 8,125 121 791 171 188 910 34 3,423
Race/ethnicityWhite (non-Hispanic) 39,844 8,377 6,396 15,963 2,277 907 768 2,326 88 647 115 73 93 22 1,792Black (non-Hispanic) 10,631 1,543 1,955 1,662 157 834 348 3,032 15 28 17 69 386 4 581Hispanic origin 12,053 1,578 1,492 4,511 335 347 442 2,092 11 90 31 32 305 4 783American Indian/Alaska Native 226 39 53 51 12 11 9 38 - - - - - - - - 4 - - 9Asian/Pacific Islander 272 64 34 66 16 8 7 38 - - 1 2 - - 2 1 33Other 3,824 1,182 198 1,239 108 229 84 491 7 23 6 8 107 2 140
No. of admissions 66,850 12,783 10,128 23,492 2,905 2,336 1,658 8,017 121 789 171 182 897 33 3,338
SOURCE: Center for Behavioral Health Statistics and Quality, Substance Abuse and Mental Health Services Administration, Treatment Episode Data Set (TEDS). Data received through 11.01.16.
Seda-tives
Hallu-cino-gens PCP
Inhal-ants
Other/ none speci-fied
- - Quantity is zero.1 Admissions for which values were not collected, unknown, or missing are excluded from the sum total.
Table 3.7a. Connecticut admissions aged 12 and older, by primary substance of abuse and gender, age at admission, and race/ethnicity: Number, 2015
Gender, age at admission, and race/ethnicity
All admis-sions
aged 12 and older
Primary substance at admission
Alcohol Opiates Cocaine
Mari-juana/
hashish
Metham-phetamine/
amphet-amines
Tran-quil-izers
105
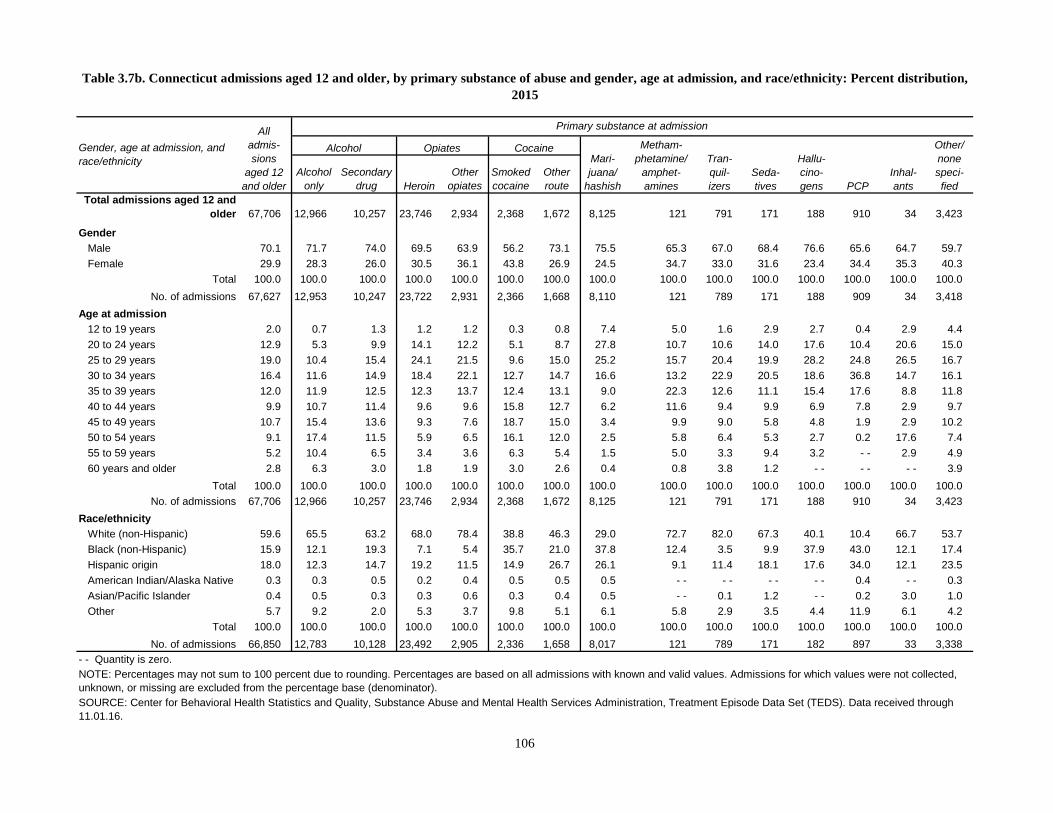
Alcohol only
Secondarydrug Heroin
Other opiates
Smoked cocaine
Other route
Total admissions aged 12 and older 67,706 12,966 10,257 23,746 2,934 2,368 1,672 8,125 121 791 171 188 910 34 3,423
GenderMale 70.1 71.7 74.0 69.5 63.9 56.2 73.1 75.5 65.3 67.0 68.4 76.6 65.6 64.7 59.7Female 29.9 28.3 26.0 30.5 36.1 43.8 26.9 24.5 34.7 33.0 31.6 23.4 34.4 35.3 40.3
Total 100.0 100.0 100.0 100.0 100.0 100.0 100.0 100.0 100.0 100.0 100.0 100.0 100.0 100.0 100.0No. of admissions 67,627 12,953 10,247 23,722 2,931 2,366 1,668 8,110 121 789 171 188 909 34 3,418
Age at admission12 to 19 years 2.0 0.7 1.3 1.2 1.2 0.3 0.8 7.4 5.0 1.6 2.9 2.7 0.4 2.9 4.420 to 24 years 12.9 5.3 9.9 14.1 12.2 5.1 8.7 27.8 10.7 10.6 14.0 17.6 10.4 20.6 15.025 to 29 years 19.0 10.4 15.4 24.1 21.5 9.6 15.0 25.2 15.7 20.4 19.9 28.2 24.8 26.5 16.730 to 34 years 16.4 11.6 14.9 18.4 22.1 12.7 14.7 16.6 13.2 22.9 20.5 18.6 36.8 14.7 16.135 to 39 years 12.0 11.9 12.5 12.3 13.7 12.4 13.1 9.0 22.3 12.6 11.1 15.4 17.6 8.8 11.840 to 44 years 9.9 10.7 11.4 9.6 9.6 15.8 12.7 6.2 11.6 9.4 9.9 6.9 7.8 2.9 9.745 to 49 years 10.7 15.4 13.6 9.3 7.6 18.7 15.0 3.4 9.9 9.0 5.8 4.8 1.9 2.9 10.250 to 54 years 9.1 17.4 11.5 5.9 6.5 16.1 12.0 2.5 5.8 6.4 5.3 2.7 0.2 17.6 7.455 to 59 years 5.2 10.4 6.5 3.4 3.6 6.3 5.4 1.5 5.0 3.3 9.4 3.2 - - 2.9 4.960 years and older 2.8 6.3 3.0 1.8 1.9 3.0 2.6 0.4 0.8 3.8 1.2 - - - - - - 3.9
Total 100.0 100.0 100.0 100.0 100.0 100.0 100.0 100.0 100.0 100.0 100.0 100.0 100.0 100.0 100.0No. of admissions 67,706 12,966 10,257 23,746 2,934 2,368 1,672 8,125 121 791 171 188 910 34 3,423
Race/ethnicityWhite (non-Hispanic) 59.6 65.5 63.2 68.0 78.4 38.8 46.3 29.0 72.7 82.0 67.3 40.1 10.4 66.7 53.7Black (non-Hispanic) 15.9 12.1 19.3 7.1 5.4 35.7 21.0 37.8 12.4 3.5 9.9 37.9 43.0 12.1 17.4Hispanic origin 18.0 12.3 14.7 19.2 11.5 14.9 26.7 26.1 9.1 11.4 18.1 17.6 34.0 12.1 23.5American Indian/Alaska Native 0.3 0.3 0.5 0.2 0.4 0.5 0.5 0.5 - - - - - - - - 0.4 - - 0.3Asian/Pacific Islander 0.4 0.5 0.3 0.3 0.6 0.3 0.4 0.5 - - 0.1 1.2 - - 0.2 3.0 1.0Other 5.7 9.2 2.0 5.3 3.7 9.8 5.1 6.1 5.8 2.9 3.5 4.4 11.9 6.1 4.2
Total 100.0 100.0 100.0 100.0 100.0 100.0 100.0 100.0 100.0 100.0 100.0 100.0 100.0 100.0 100.0No. of admissions 66,850 12,783 10,128 23,492 2,905 2,336 1,658 8,017 121 789 171 182 897 33 3,338
NOTE: Percentages may not sum to 100 percent due to rounding. Percentages are based on all admissions with known and valid values. Admissions for which values were not collected, unknown, or missing are excluded from the percentage base (denominator).SOURCE: Center for Behavioral Health Statistics and Quality, Substance Abuse and Mental Health Services Administration, Treatment Episode Data Set (TEDS). Data received through 11.01.16.
Seda-tives
Hallu-cino-gens PCP
Inhal-ants
Other/ none speci-fied
- - Quantity is zero.
Table 3.7b. Connecticut admissions aged 12 and older, by primary substance of abuse and gender, age at admission, and race/ethnicity: Percent distribution, 2015
Gender, age at admission, and race/ethnicity
All admis-sions
aged 12 and older
Primary substance at admission
Alcohol Opiates CocaineMari-juana/
hashish
Metham-phetamine/
amphet-amines
Tran-quil-izers
106
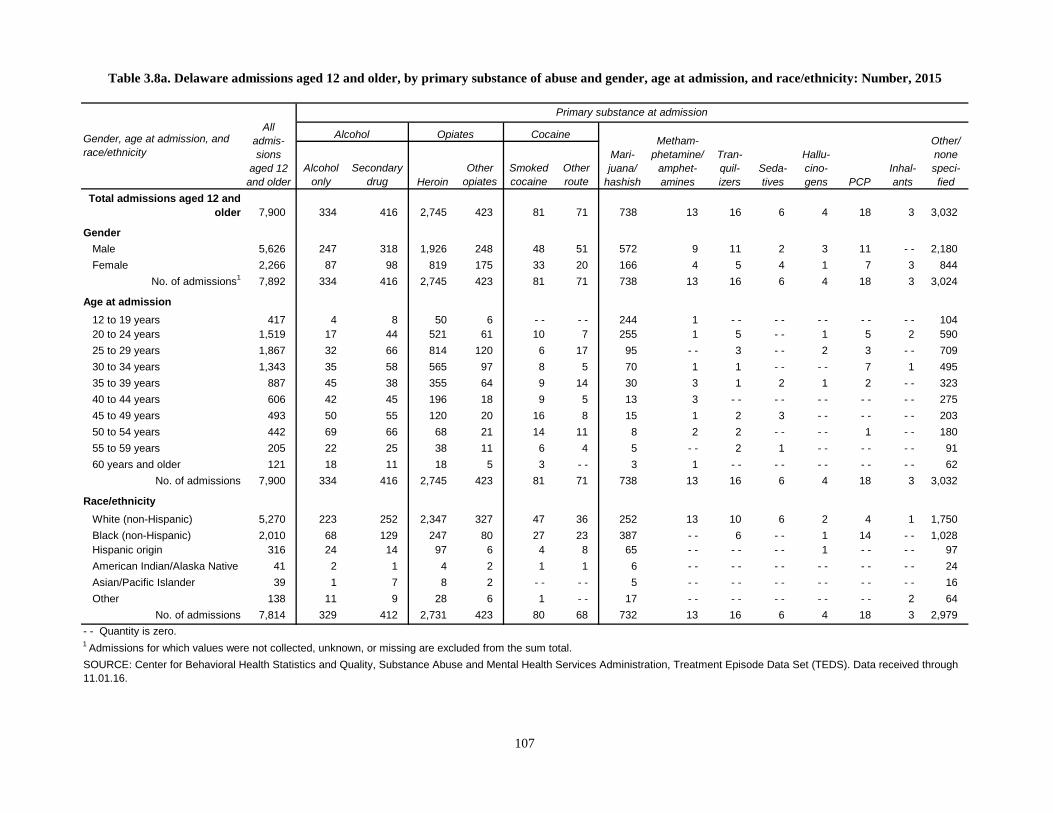
Alcohol only
Secondarydrug Heroin
Other opiates
Smoked cocaine
Other route
Total admissions aged 12 and older 7,900 334 416 2,745 423 81 71 738 13 16 6 4 18 3 3,032
GenderMale 5,626 247 318 1,926 248 48 51 572 9 11 2 3 11 - - 2,180Female 2,266 87 98 819 175 33 20 166 4 5 4 1 7 3 844
No. of admissions1 7,892 334 416 2,745 423 81 71 738 13 16 6 4 18 3 3,024
Age at admission12 to 19 years 417 4 8 50 6 - - - - 244 1 - - - - - - - - - - 10420 to 24 years 1,519 17 44 521 61 10 7 255 1 5 - - 1 5 2 59025 to 29 years 1,867 32 66 814 120 6 17 95 - - 3 - - 2 3 - - 70930 to 34 years 1,343 35 58 565 97 8 5 70 1 1 - - - - 7 1 49535 to 39 years 887 45 38 355 64 9 14 30 3 1 2 1 2 - - 32340 to 44 years 606 42 45 196 18 9 5 13 3 - - - - - - - - - - 27545 to 49 years 493 50 55 120 20 16 8 15 1 2 3 - - - - - - 20350 to 54 years 442 69 66 68 21 14 11 8 2 2 - - - - 1 - - 18055 to 59 years 205 22 25 38 11 6 4 5 - - 2 1 - - - - - - 9160 years and older 121 18 11 18 5 3 - - 3 1 - - - - - - - - - - 62
No. of admissions 7,900 334 416 2,745 423 81 71 738 13 16 6 4 18 3 3,032
Race/ethnicityWhite (non-Hispanic) 5,270 223 252 2,347 327 47 36 252 13 10 6 2 4 1 1,750Black (non-Hispanic) 2,010 68 129 247 80 27 23 387 - - 6 - - 1 14 - - 1,028Hispanic origin 316 24 14 97 6 4 8 65 - - - - - - 1 - - - - 97American Indian/Alaska Native 41 2 1 4 2 1 1 6 - - - - - - - - - - - - 24Asian/Pacific Islander 39 1 7 8 2 - - - - 5 - - - - - - - - - - - - 16Other 138 11 9 28 6 1 - - 17 - - - - - - - - - - 2 64
No. of admissions 7,814 329 412 2,731 423 80 68 732 13 16 6 4 18 3 2,979
Table 3.8a. Delaware admissions aged 12 and older, by primary substance of abuse and gender, age at admission, and race/ethnicity: Number, 2015
Gender, age at admission, and race/ethnicity
All admis-sions
aged 12 and older
Primary substance at admission
Alcohol Opiates Cocaine
Mari-juana/
hashish
Metham-phetamine/
amphet-amines
Tran-quil-izers
Seda-tives
Hallu-cino-gens PCP
1 Admissions for which values were not collected, unknown, or missing are excluded from the sum total.
Inhal-ants
Other/ none speci-fied
- - Quantity is zero.
SOURCE: Center for Behavioral Health Statistics and Quality, Substance Abuse and Mental Health Services Administration, Treatment Episode Data Set (TEDS). Data received through 11.01.16.
107
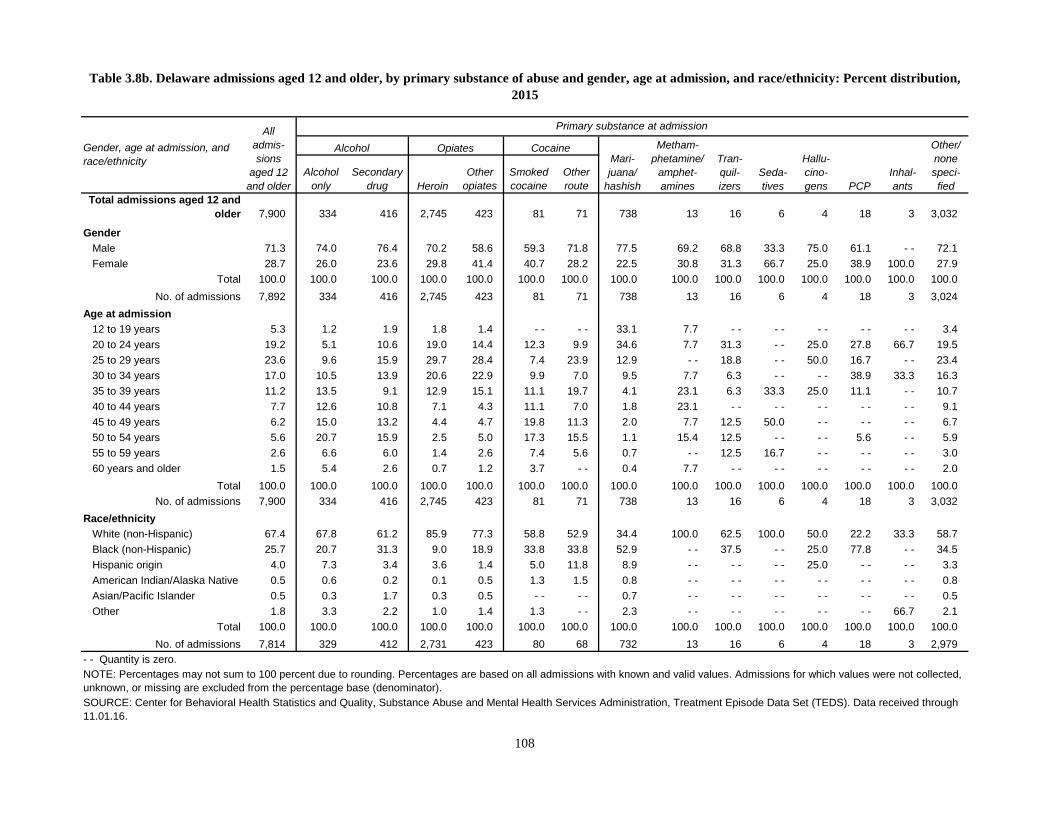
Alcohol only
Secondarydrug Heroin
Other opiates
Smoked cocaine
Other route
Total admissions aged 12 and older 7,900 334 416 2,745 423 81 71 738 13 16 6 4 18 3 3,032
GenderMale 71.3 74.0 76.4 70.2 58.6 59.3 71.8 77.5 69.2 68.8 33.3 75.0 61.1 - - 72.1Female 28.7 26.0 23.6 29.8 41.4 40.7 28.2 22.5 30.8 31.3 66.7 25.0 38.9 100.0 27.9
Total 100.0 100.0 100.0 100.0 100.0 100.0 100.0 100.0 100.0 100.0 100.0 100.0 100.0 100.0 100.0No. of admissions 7,892 334 416 2,745 423 81 71 738 13 16 6 4 18 3 3,024
Age at admission12 to 19 years 5.3 1.2 1.9 1.8 1.4 - - - - 33.1 7.7 - - - - - - - - - - 3.420 to 24 years 19.2 5.1 10.6 19.0 14.4 12.3 9.9 34.6 7.7 31.3 - - 25.0 27.8 66.7 19.525 to 29 years 23.6 9.6 15.9 29.7 28.4 7.4 23.9 12.9 - - 18.8 - - 50.0 16.7 - - 23.430 to 34 years 17.0 10.5 13.9 20.6 22.9 9.9 7.0 9.5 7.7 6.3 - - - - 38.9 33.3 16.335 to 39 years 11.2 13.5 9.1 12.9 15.1 11.1 19.7 4.1 23.1 6.3 33.3 25.0 11.1 - - 10.740 to 44 years 7.7 12.6 10.8 7.1 4.3 11.1 7.0 1.8 23.1 - - - - - - - - - - 9.145 to 49 years 6.2 15.0 13.2 4.4 4.7 19.8 11.3 2.0 7.7 12.5 50.0 - - - - - - 6.750 to 54 years 5.6 20.7 15.9 2.5 5.0 17.3 15.5 1.1 15.4 12.5 - - - - 5.6 - - 5.955 to 59 years 2.6 6.6 6.0 1.4 2.6 7.4 5.6 0.7 - - 12.5 16.7 - - - - - - 3.060 years and older 1.5 5.4 2.6 0.7 1.2 3.7 - - 0.4 7.7 - - - - - - - - - - 2.0
Total 100.0 100.0 100.0 100.0 100.0 100.0 100.0 100.0 100.0 100.0 100.0 100.0 100.0 100.0 100.0No. of admissions 7,900 334 416 2,745 423 81 71 738 13 16 6 4 18 3 3,032
Race/ethnicityWhite (non-Hispanic) 67.4 67.8 61.2 85.9 77.3 58.8 52.9 34.4 100.0 62.5 100.0 50.0 22.2 33.3 58.7Black (non-Hispanic) 25.7 20.7 31.3 9.0 18.9 33.8 33.8 52.9 - - 37.5 - - 25.0 77.8 - - 34.5Hispanic origin 4.0 7.3 3.4 3.6 1.4 5.0 11.8 8.9 - - - - - - 25.0 - - - - 3.3American Indian/Alaska Native 0.5 0.6 0.2 0.1 0.5 1.3 1.5 0.8 - - - - - - - - - - - - 0.8Asian/Pacific Islander 0.5 0.3 1.7 0.3 0.5 - - - - 0.7 - - - - - - - - - - - - 0.5Other 1.8 3.3 2.2 1.0 1.4 1.3 - - 2.3 - - - - - - - - - - 66.7 2.1
Total 100.0 100.0 100.0 100.0 100.0 100.0 100.0 100.0 100.0 100.0 100.0 100.0 100.0 100.0 100.0No. of admissions 7,814 329 412 2,731 423 80 68 732 13 16 6 4 18 3 2,979
NOTE: Percentages may not sum to 100 percent due to rounding. Percentages are based on all admissions with known and valid values. Admissions for which values were not collected, unknown, or missing are excluded from the percentage base (denominator).SOURCE: Center for Behavioral Health Statistics and Quality, Substance Abuse and Mental Health Services Administration, Treatment Episode Data Set (TEDS). Data received through 11.01.16.
Seda-tives
Hallu-cino-gens PCP
Inhal-ants
Other/ none speci-fied
- - Quantity is zero.
Table 3.8b. Delaware admissions aged 12 and older, by primary substance of abuse and gender, age at admission, and race/ethnicity: Percent distribution, 2015
Gender, age at admission, and race/ethnicity
All admis-sions
aged 12 and older
Primary substance at admission
Alcohol Opiates CocaineMari-juana/
hashish
Metham-phetamine/
amphet-amines
Tran-quil-izers
108

Alcohol only
Secondarydrug Heroin
Other opiates
Smoked cocaine
Other route
Total admissions aged 12 and older 6,053 1,036 1,304 1,527 113 713 171 564 26 9 1 58 480 - - 51
GenderMale 4,255 811 950 1,147 56 420 115 404 25 8 1 41 243 - - 34Female 1,796 224 353 380 57 293 56 160 1 1 - - 17 237 - - 17
No. of admissions1 6,051 1,035 1,303 1,527 113 713 171 564 26 9 1 58 480 - - 51
Age at admission12 to 19 years 123 1 4 - - - - - - 3 105 - - - - - - 5 - - - - 520 to 24 years 206 24 29 29 6 6 1 69 2 - - - - 6 28 - - 625 to 29 years 470 74 91 37 16 14 8 99 13 4 - - 14 88 - - 1230 to 34 years 598 87 123 82 17 29 12 93 4 2 - - 13 132 - - 435 to 39 years 598 85 138 114 11 41 11 63 3 - - - - 4 117 - - 1140 to 44 years 537 113 129 109 8 61 13 48 2 - - - - 4 47 - - 345 to 49 years 921 155 212 239 20 178 43 36 1 1 1 5 28 - - 250 to 54 years 1,276 232 295 402 9 219 46 33 - - - - - - 5 29 - - 655 to 59 years 846 160 184 318 16 115 23 15 1 2 - - 2 10 - - - -60 years and older 478 105 99 197 10 50 11 3 - - - - - - - - 1 - - 2
No. of admissions 6,053 1,036 1,304 1,527 113 713 171 564 26 9 1 58 480 - - 51
Race/ethnicityWhite (non-Hispanic) 170 58 20 53 13 6 1 2 4 8 - - 1 4 - - - -Black (non-Hispanic) 5,457 781 1,207 1,405 95 690 164 526 19 1 1 54 469 - - 45Hispanic origin 314 154 54 42 3 13 5 28 2 - - - - 3 5 - - 5American Indian/Alaska Native 10 3 6 - - - - - - - - 1 - - - - - - - - - - - - - -Asian/Pacific Islander 8 5 1 2 - - - - - - - - - - - - - - - - - - - - - -Other 65 27 9 12 2 4 - - 7 1 - - - - - - 2 - - 1
No. of admissions 6,024 1,028 1,297 1,514 113 713 170 564 26 9 1 58 480 - - 51
Table 3.9a. District of Columbia admissions aged 12 and older, by primary substance of abuse and gender, age at admission, and race/ethnicity: Number, 2015
Gender, age at admission, and race/ethnicity
All admis-sions
aged 12 and older
Primary substance at admission
Alcohol Opiates Cocaine
Mari-juana/
hashish
Metham-phetamine/
amphet-amines
Tran-quil-izers
Seda-tives
Hallu-cino-gens PCP
1 Admissions for which values were not collected, unknown, or missing are excluded from the sum total.
Inhal-ants
Other/ none speci-fied
- - Quantity is zero.
SOURCE: Center for Behavioral Health Statistics and Quality, Substance Abuse and Mental Health Services Administration, Treatment Episode Data Set (TEDS). Data received through 11.01.16.
109

Alcohol only
Secondarydrug Heroin
Other opiates
Smoked cocaine
Other route
Total admissions aged 12 and older 6,053 1,036 1,304 1,527 113 713 171 564 26 9 1 58 480 - - 51
GenderMale 70.3 78.4 72.9 75.1 49.6 58.9 67.3 71.6 96.2 88.9 100.0 70.7 50.6 - - 66.7Female 29.7 21.6 27.1 24.9 50.4 41.1 32.7 28.4 3.8 11.1 - - 29.3 49.4 - - 33.3
Total 100.0 100.0 100.0 100.0 100.0 100.0 100.0 100.0 100.0 100.0 100.0 100.0 100.0 - - 100.0No. of admissions 6,051 1,035 1,303 1,527 113 713 171 564 26 9 1 58 480 - - 51
Age at admission12 to 19 years 2.0 0.1 0.3 - - - - - - 1.8 18.6 - - - - - - 8.6 - - - - 9.820 to 24 years 3.4 2.3 2.2 1.9 5.3 0.8 0.6 12.2 7.7 - - - - 10.3 5.8 - - 11.825 to 29 years 7.8 7.1 7.0 2.4 14.2 2.0 4.7 17.6 50.0 44.4 - - 24.1 18.3 - - 23.530 to 34 years 9.9 8.4 9.4 5.4 15.0 4.1 7.0 16.5 15.4 22.2 - - 22.4 27.5 - - 7.835 to 39 years 9.9 8.2 10.6 7.5 9.7 5.8 6.4 11.2 11.5 - - - - 6.9 24.4 - - 21.640 to 44 years 8.9 10.9 9.9 7.1 7.1 8.6 7.6 8.5 7.7 - - - - 6.9 9.8 - - 5.945 to 49 years 15.2 15.0 16.3 15.7 17.7 25.0 25.1 6.4 3.8 11.1 100.0 8.6 5.8 - - 3.950 to 54 years 21.1 22.4 22.6 26.3 8.0 30.7 26.9 5.9 - - - - - - 8.6 6.0 - - 11.855 to 59 years 14.0 15.4 14.1 20.8 14.2 16.1 13.5 2.7 3.8 22.2 - - 3.4 2.1 - - - -60 years and older 7.9 10.1 7.6 12.9 8.8 7.0 6.4 0.5 - - - - - - - - 0.2 - - 3.9
Total 100.0 100.0 100.0 100.0 100.0 100.0 100.0 100.0 100.0 100.0 100.0 100.0 100.0 - - 100.0No. of admissions 6,053 1,036 1,304 1,527 113 713 171 564 26 9 1 58 480 - - 51
Race/ethnicityWhite (non-Hispanic) 2.8 5.6 1.5 3.5 11.5 0.8 0.6 0.4 15.4 88.9 - - 1.7 0.8 - - - -Black (non-Hispanic) 90.6 76.0 93.1 92.8 84.1 96.8 96.5 93.3 73.1 11.1 100.0 93.1 97.7 - - 88.2Hispanic origin 5.2 15.0 4.2 2.8 2.7 1.8 2.9 5.0 7.7 - - - - 5.2 1.0 - - 9.8American Indian/Alaska Native 0.2 0.3 0.5 - - - - - - - - 0.2 - - - - - - - - - - - - - -Asian/Pacific Islander 0.1 0.5 0.1 0.1 - - - - - - - - - - - - - - - - - - - - - -Other 1.1 2.6 0.7 0.8 1.8 0.6 - - 1.2 3.8 - - - - - - 0.4 - - 2.0
Total 100.0 100.0 100.0 100.0 100.0 100.0 100.0 100.0 100.0 100.0 100.0 100.0 100.0 - - 100.0No. of admissions 6,024 1,028 1,297 1,514 113 713 170 564 26 9 1 58 480 - - 51
NOTE: Percentages may not sum to 100 percent due to rounding. Percentages are based on all admissions with known and valid values. Admissions for which values were not collected, unknown, or missing are excluded from the percentage base (denominator).SOURCE: Center for Behavioral Health Statistics and Quality, Substance Abuse and Mental Health Services Administration, Treatment Episode Data Set (TEDS). Data received through 11.01.16.
Seda-tives
Hallu-cino-gens PCP
Inhal-ants
Other/ none speci-fied
- - Quantity is zero.
Table 3.9b. District of Columbia admissions aged 12 and older, by primary substance of abuse and gender, age at admission, and race/ethnicity: Percent distribution, 2015
Gender, age at admission, and race/ethnicity
All admis-sions
aged 12 and older
Primary substance at admission
Alcohol Opiates CocaineMari-juana/
hashish
Metham-phetamine/
amphet-amines
Tran-quil-izers
110

Alcohol only
Secondarydrug Heroin
Other opiates
Smoked cocaine
Other route
Total admissions aged 12 and older 30,104 8,143 2,910 4,070 6,175 939 736 4,551 976 697 76 48 2 15 766
GenderMale 19,363 5,763 2,059 2,584 3,382 539 448 3,230 511 338 40 36 2 8 423Female 10,741 2,380 851 1,486 2,793 400 288 1,321 465 359 36 12 - - 7 343
No. of admissions1 30,104 8,143 2,910 4,070 6,175 939 736 4,551 976 697 76 48 2 15 766
Age at admission12 to 19 years 3,756 181 78 52 91 22 24 2,830 66 53 6 18 - - 4 33120 to 24 years 2,899 228 198 570 835 71 84 555 154 105 13 12 - - 3 7125 to 29 years 4,951 568 354 1,111 1,697 98 125 474 211 163 15 10 - - - - 12530 to 34 years 4,765 822 419 987 1,489 147 159 283 233 125 16 3 - - 1 8135 to 39 years 3,371 850 440 582 806 110 111 170 135 95 7 1 2 1 6140 to 44 years 2,537 1,024 324 301 445 120 74 91 82 42 5 1 - - 2 2645 to 49 years 2,606 1,315 392 217 328 123 59 52 48 35 6 - - - - 1 3050 to 54 years 2,650 1,502 388 148 279 134 59 52 29 29 3 2 - - 3 2255 to 59 years 1,633 1,028 219 67 122 81 28 32 11 27 4 1 - - - - 1360 years and older 936 625 98 35 83 33 13 12 7 23 1 - - - - - - 6
No. of admissions 30,104 8,143 2,910 4,070 6,175 939 736 4,551 976 697 76 48 2 15 766
Race/ethnicityWhite (non-Hispanic) 22,270 6,577 2,201 3,313 5,519 439 388 1,958 792 593 62 26 2 15 385Black (non-Hispanic) 3,637 705 392 93 152 357 201 1,398 90 19 8 8 - - - - 214Hispanic origin 2,357 500 177 398 283 73 93 628 32 48 4 11 - - - - 110American Indian/Alaska Native 81 37 7 - - 13 3 2 15 3 1 - - - - - - - - - -Asian/Pacific Islander 132 41 16 13 19 4 2 27 4 2 - - - - - - - - 4Other 1,596 274 112 251 189 61 50 513 55 33 2 3 - - - - 53
No. of admissions 30,073 8,134 2,905 4,068 6,175 937 736 4,539 976 696 76 48 2 15 766
Table 3.10a. Florida admissions aged 12 and older, by primary substance of abuse and gender, age at admission, and race/ethnicity: Number, 2015
Gender, age at admission, and race/ethnicity
All admis-sions
aged 12 and older
Primary substance at admission
Alcohol Opiates Cocaine
Mari-juana/
hashish
Metham-phetamine/
amphet-amines
Tran-quil-izers
- - Quantity is zero.
SOURCE: Center for Behavioral Health Statistics and Quality, Substance Abuse and Mental Health Services Administration, Treatment Episode Data Set (TEDS). Data received through 11.01.16.
Seda-tives
Hallu-cino-gens PCP
Inhal-ants
Other/ none speci-fied
1 Admissions for which values were not collected, unknown, or missing are excluded from the sum total.
111

Alcohol only
Secondarydrug Heroin
Other opiates
Smoked cocaine
Other route
Total admissions aged 12 and older 30,104 8,143 2,910 4,070 6,175 939 736 4,551 976 697 76 48 2 15 766
GenderMale 64.3 70.8 70.8 63.5 54.8 57.4 60.9 71.0 52.4 48.5 52.6 75.0 100.0 53.3 55.2Female 35.7 29.2 29.2 36.5 45.2 42.6 39.1 29.0 47.6 51.5 47.4 25.0 - - 46.7 44.8
Total 100.0 100.0 100.0 100.0 100.0 100.0 100.0 100.0 100.0 100.0 100.0 100.0 100.0 100.0 100.0No. of admissions 30,104 8,143 2,910 4,070 6,175 939 736 4,551 976 697 76 48 2 15 766
Age at admission12 to 19 years 12.5 2.2 2.7 1.3 1.5 2.3 3.3 62.2 6.8 7.6 7.9 37.5 - - 26.7 43.220 to 24 years 9.6 2.8 6.8 14.0 13.5 7.6 11.4 12.2 15.8 15.1 17.1 25.0 - - 20.0 9.325 to 29 years 16.4 7.0 12.2 27.3 27.5 10.4 17.0 10.4 21.6 23.4 19.7 20.8 - - - - 16.330 to 34 years 15.8 10.1 14.4 24.3 24.1 15.7 21.6 6.2 23.9 17.9 21.1 6.3 - - 6.7 10.635 to 39 years 11.2 10.4 15.1 14.3 13.1 11.7 15.1 3.7 13.8 13.6 9.2 2.1 100.0 6.7 8.040 to 44 years 8.4 12.6 11.1 7.4 7.2 12.8 10.1 2.0 8.4 6.0 6.6 2.1 - - 13.3 3.445 to 49 years 8.7 16.1 13.5 5.3 5.3 13.1 8.0 1.1 4.9 5.0 7.9 - - - - 6.7 3.950 to 54 years 8.8 18.4 13.3 3.6 4.5 14.3 8.0 1.1 3.0 4.2 3.9 4.2 - - 20.0 2.955 to 59 years 5.4 12.6 7.5 1.6 2.0 8.6 3.8 0.7 1.1 3.9 5.3 2.1 - - - - 1.760 years and older 3.1 7.7 3.4 0.9 1.3 3.5 1.8 0.3 0.7 3.3 1.3 - - - - - - 0.8
Total 100.0 100.0 100.0 100.0 100.0 100.0 100.0 100.0 100.0 100.0 100.0 100.0 100.0 100.0 100.0No. of admissions 30,104 8,143 2,910 4,070 6,175 939 736 4,551 976 697 76 48 2 15 766
Race/ethnicityWhite (non-Hispanic) 74.1 80.9 75.8 81.4 89.4 46.9 52.7 43.1 81.1 85.2 81.6 54.2 100.0 100.0 50.3Black (non-Hispanic) 12.1 8.7 13.5 2.3 2.5 38.1 27.3 30.8 9.2 2.7 10.5 16.7 - - - - 27.9Hispanic origin 7.8 6.1 6.1 9.8 4.6 7.8 12.6 13.8 3.3 6.9 5.3 22.9 - - - - 14.4American Indian/Alaska Native 0.3 0.5 0.2 - - 0.2 0.3 0.3 0.3 0.3 0.1 - - - - - - - - - -Asian/Pacific Islander 0.4 0.5 0.6 0.3 0.3 0.4 0.3 0.6 0.4 0.3 - - - - - - - - 0.5Other 5.3 3.4 3.9 6.2 3.1 6.5 6.8 11.3 5.6 4.7 2.6 6.3 - - - - 6.9
Total 100.0 100.0 100.0 100.0 100.0 100.0 100.0 100.0 100.0 100.0 100.0 100.0 100.0 100.0 100.0No. of admissions 30,073 8,134 2,905 4,068 6,175 937 736 4,539 976 696 76 48 2 15 766
NOTE: Percentages may not sum to 100 percent due to rounding. Percentages are based on all admissions with known and valid values. Admissions for which values were not collected, unknown, or missing are excluded from the percentage base (denominator).SOURCE: Center for Behavioral Health Statistics and Quality, Substance Abuse and Mental Health Services Administration, Treatment Episode Data Set (TEDS). Data received through 11.01.16.
Seda-tives
Hallu-cino-gens PCP
Inhal-ants
Other/ none speci-fied
- - Quantity is zero.
Table 3.10b. Florida admissions aged 12 and older, by primary substance of abuse and gender, age at admission, and race/ethnicity: Percent distribution, 2015
Gender, age at admission, and race/ethnicity
All admis-sions
aged 12 and older
Primary substance at admission
Alcohol Opiates CocaineMari-juana/
hashish
Metham-phetamine/
amphet-amines
Tran-quil-izers
112

Alcohol only
Secondarydrug Heroin
Other opiates
Smoked cocaine
Other route
Total admissions aged 12 and older 6,371 699 839 202 278 83 59 1,720 2,260 18 1 2 - - 1 209
GenderMale 4,215 460 560 133 197 71 45 1,063 1,571 9 - - 2 - - 1 103Female 2,156 239 279 69 81 12 14 657 689 9 1 - - - - - - 106
No. of admissions1 6,371 699 839 202 278 83 59 1,720 2,260 18 1 2 - - 1 209
Age at admission12 to 19 years 2,126 228 245 8 9 5 6 1,341 71 11 1 - - - - - - 20120 to 24 years 634 38 65 40 74 18 15 107 277 - - - - - - - - - - - -25 to 29 years 705 29 102 51 64 16 12 82 345 2 - - 1 - - - - 130 to 34 years 708 56 72 44 57 5 6 61 405 1 - - - - - - - - 135 to 39 years 541 43 74 14 27 9 8 38 325 1 - - - - - - - - 240 to 44 years 460 43 70 7 17 8 3 31 278 - - - - 1 - - - - 245 to 49 years 443 45 81 8 9 5 2 33 257 1 - - - - - - 1 150 to 54 years 382 75 69 12 10 1 5 14 193 2 - - - - - - - - 155 to 59 years 210 72 29 10 5 13 - - 9 72 - - - - - - - - - - - -60 years and older 162 70 32 8 6 3 2 4 37 - - - - - - - - - - - -
No. of admissions 6,371 699 839 202 278 83 59 1,720 2,260 18 1 2 - - 1 209
Race/ethnicityWhite (non-Hispanic) 1,404 281 261 111 120 12 13 218 355 7 1 - - - - - - 25Black (non-Hispanic) 163 13 30 4 1 9 4 55 44 - - - - - - - - - - 3Hispanic origin 275 32 45 15 11 2 3 83 73 - - - - - - - - - - 11American Indian/Alaska Native 49 9 7 1 3 - - 1 13 13 - - - - - - - - - - 2Asian/Pacific Islander 3,872 322 405 67 125 56 37 1,129 1,575 10 - - 2 - - - - 144Other 574 39 89 3 15 4 1 207 193 1 - - - - - - 1 21
No. of admissions 6,337 696 837 201 275 83 59 1,705 2,253 18 1 2 - - 1 206
SOURCE: Center for Behavioral Health Statistics and Quality, Substance Abuse and Mental Health Services Administration, Treatment Episode Data Set (TEDS). Data received through 11.01.16.
- - Quantity is zero.
Seda-tives
Hallu-cino-gens PCP
Inhal-ants
Other/ none speci-fied
1 Admissions for which values were not collected, unknown, or missing are excluded from the sum total.
Table 3.11a. Hawaii admissions aged 12 and older, by primary substance of abuse and gender, age at admission, and race/ethnicity: Number, 2015
Gender, age at admission, and race/ethnicity
All admis-sions
aged 12 and older
Primary substance at admission
Alcohol Opiates Cocaine
Mari-juana/
hashish
Metham-phetamine/
amphet-amines
Tran-quil-izers
113
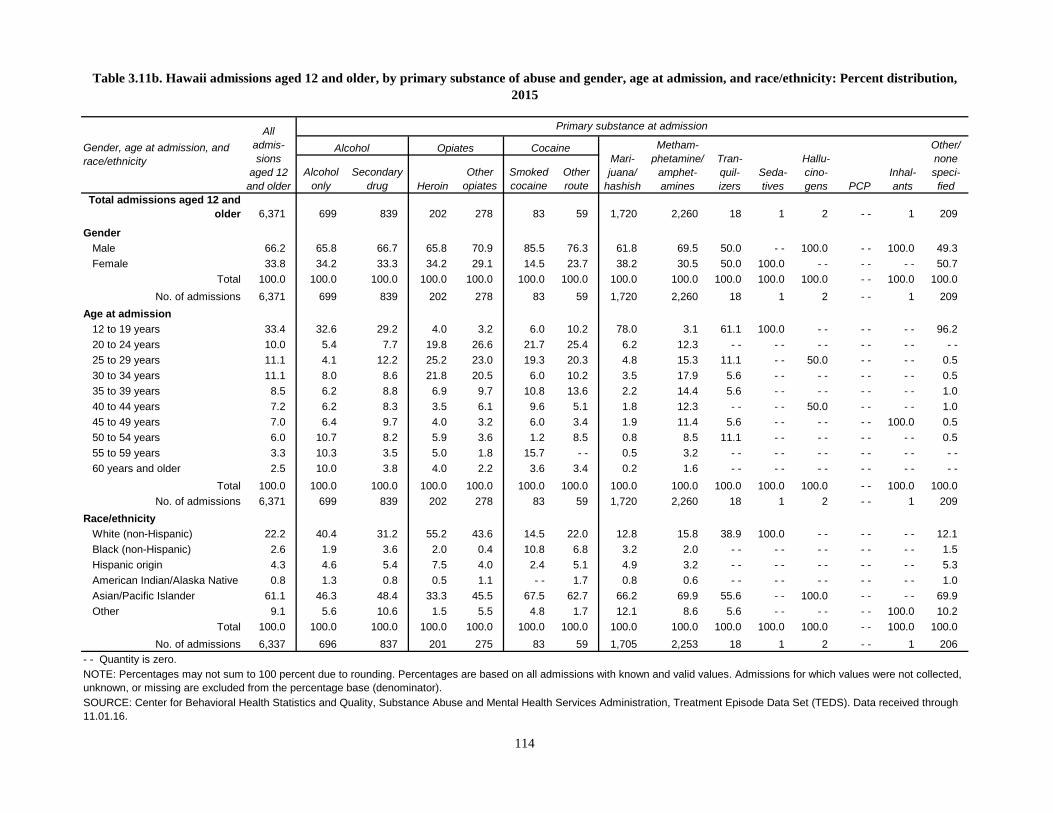
Alcohol only
Secondarydrug Heroin
Other opiates
Smoked cocaine
Other route
Total admissions aged 12 and older 6,371 699 839 202 278 83 59 1,720 2,260 18 1 2 - - 1 209
GenderMale 66.2 65.8 66.7 65.8 70.9 85.5 76.3 61.8 69.5 50.0 - - 100.0 - - 100.0 49.3Female 33.8 34.2 33.3 34.2 29.1 14.5 23.7 38.2 30.5 50.0 100.0 - - - - - - 50.7
Total 100.0 100.0 100.0 100.0 100.0 100.0 100.0 100.0 100.0 100.0 100.0 100.0 - - 100.0 100.0No. of admissions 6,371 699 839 202 278 83 59 1,720 2,260 18 1 2 - - 1 209
Age at admission12 to 19 years 33.4 32.6 29.2 4.0 3.2 6.0 10.2 78.0 3.1 61.1 100.0 - - - - - - 96.220 to 24 years 10.0 5.4 7.7 19.8 26.6 21.7 25.4 6.2 12.3 - - - - - - - - - - - -25 to 29 years 11.1 4.1 12.2 25.2 23.0 19.3 20.3 4.8 15.3 11.1 - - 50.0 - - - - 0.530 to 34 years 11.1 8.0 8.6 21.8 20.5 6.0 10.2 3.5 17.9 5.6 - - - - - - - - 0.535 to 39 years 8.5 6.2 8.8 6.9 9.7 10.8 13.6 2.2 14.4 5.6 - - - - - - - - 1.040 to 44 years 7.2 6.2 8.3 3.5 6.1 9.6 5.1 1.8 12.3 - - - - 50.0 - - - - 1.045 to 49 years 7.0 6.4 9.7 4.0 3.2 6.0 3.4 1.9 11.4 5.6 - - - - - - 100.0 0.550 to 54 years 6.0 10.7 8.2 5.9 3.6 1.2 8.5 0.8 8.5 11.1 - - - - - - - - 0.555 to 59 years 3.3 10.3 3.5 5.0 1.8 15.7 - - 0.5 3.2 - - - - - - - - - - - -60 years and older 2.5 10.0 3.8 4.0 2.2 3.6 3.4 0.2 1.6 - - - - - - - - - - - -
Total 100.0 100.0 100.0 100.0 100.0 100.0 100.0 100.0 100.0 100.0 100.0 100.0 - - 100.0 100.0No. of admissions 6,371 699 839 202 278 83 59 1,720 2,260 18 1 2 - - 1 209
Race/ethnicityWhite (non-Hispanic) 22.2 40.4 31.2 55.2 43.6 14.5 22.0 12.8 15.8 38.9 100.0 - - - - - - 12.1Black (non-Hispanic) 2.6 1.9 3.6 2.0 0.4 10.8 6.8 3.2 2.0 - - - - - - - - - - 1.5Hispanic origin 4.3 4.6 5.4 7.5 4.0 2.4 5.1 4.9 3.2 - - - - - - - - - - 5.3American Indian/Alaska Native 0.8 1.3 0.8 0.5 1.1 - - 1.7 0.8 0.6 - - - - - - - - - - 1.0Asian/Pacific Islander 61.1 46.3 48.4 33.3 45.5 67.5 62.7 66.2 69.9 55.6 - - 100.0 - - - - 69.9Other 9.1 5.6 10.6 1.5 5.5 4.8 1.7 12.1 8.6 5.6 - - - - - - 100.0 10.2
Total 100.0 100.0 100.0 100.0 100.0 100.0 100.0 100.0 100.0 100.0 100.0 100.0 - - 100.0 100.0No. of admissions 6,337 696 837 201 275 83 59 1,705 2,253 18 1 2 - - 1 206
NOTE: Percentages may not sum to 100 percent due to rounding. Percentages are based on all admissions with known and valid values. Admissions for which values were not collected, unknown, or missing are excluded from the percentage base (denominator).SOURCE: Center for Behavioral Health Statistics and Quality, Substance Abuse and Mental Health Services Administration, Treatment Episode Data Set (TEDS). Data received through 11.01.16.
Seda-tives
Hallu-cino-gens PCP
Inhal-ants
Other/ none speci-fied
- - Quantity is zero.
Table 3.11b. Hawaii admissions aged 12 and older, by primary substance of abuse and gender, age at admission, and race/ethnicity: Percent distribution, 2015
Gender, age at admission, and race/ethnicity
All admis-sions
aged 12 and older
Primary substance at admission
Alcohol Opiates CocaineMari-juana/
hashish
Metham-phetamine/
amphet-amines
Tran-quil-izers
114
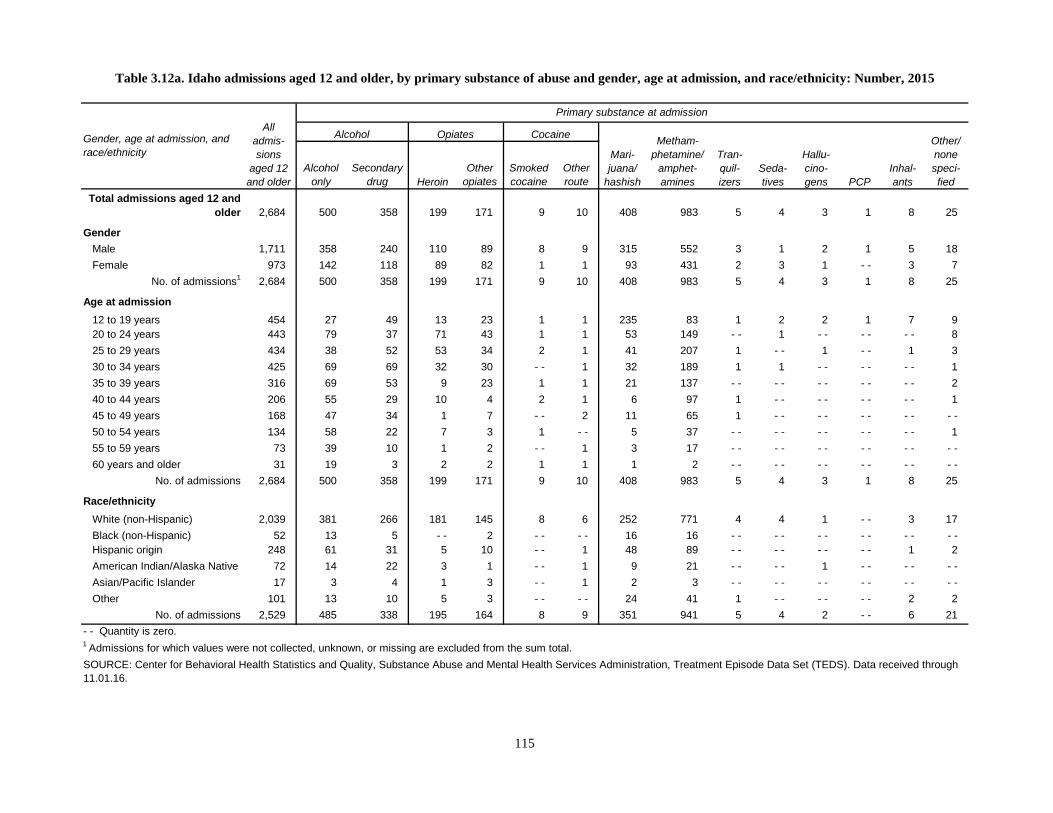
Alcohol only
Secondarydrug Heroin
Other opiates
Smoked cocaine
Other route
Total admissions aged 12 and older 2,684 500 358 199 171 9 10 408 983 5 4 3 1 8 25
GenderMale 1,711 358 240 110 89 8 9 315 552 3 1 2 1 5 18Female 973 142 118 89 82 1 1 93 431 2 3 1 - - 3 7
No. of admissions1 2,684 500 358 199 171 9 10 408 983 5 4 3 1 8 25
Age at admission12 to 19 years 454 27 49 13 23 1 1 235 83 1 2 2 1 7 920 to 24 years 443 79 37 71 43 1 1 53 149 - - 1 - - - - - - 825 to 29 years 434 38 52 53 34 2 1 41 207 1 - - 1 - - 1 330 to 34 years 425 69 69 32 30 - - 1 32 189 1 1 - - - - - - 135 to 39 years 316 69 53 9 23 1 1 21 137 - - - - - - - - - - 240 to 44 years 206 55 29 10 4 2 1 6 97 1 - - - - - - - - 145 to 49 years 168 47 34 1 7 - - 2 11 65 1 - - - - - - - - - -50 to 54 years 134 58 22 7 3 1 - - 5 37 - - - - - - - - - - 155 to 59 years 73 39 10 1 2 - - 1 3 17 - - - - - - - - - - - -60 years and older 31 19 3 2 2 1 1 1 2 - - - - - - - - - - - -
No. of admissions 2,684 500 358 199 171 9 10 408 983 5 4 3 1 8 25
Race/ethnicityWhite (non-Hispanic) 2,039 381 266 181 145 8 6 252 771 4 4 1 - - 3 17Black (non-Hispanic) 52 13 5 - - 2 - - - - 16 16 - - - - - - - - - - - -Hispanic origin 248 61 31 5 10 - - 1 48 89 - - - - - - - - 1 2American Indian/Alaska Native 72 14 22 3 1 - - 1 9 21 - - - - 1 - - - - - -Asian/Pacific Islander 17 3 4 1 3 - - 1 2 3 - - - - - - - - - - - -Other 101 13 10 5 3 - - - - 24 41 1 - - - - - - 2 2
No. of admissions 2,529 485 338 195 164 8 9 351 941 5 4 2 - - 6 21- - Quantity is zero.
SOURCE: Center for Behavioral Health Statistics and Quality, Substance Abuse and Mental Health Services Administration, Treatment Episode Data Set (TEDS). Data received through 11.01.16.
Seda-tives
Hallu-cino-gens PCP
Inhal-ants
Other/ none speci-fied
1 Admissions for which values were not collected, unknown, or missing are excluded from the sum total.
Table 3.12a. Idaho admissions aged 12 and older, by primary substance of abuse and gender, age at admission, and race/ethnicity: Number, 2015
Gender, age at admission, and race/ethnicity
All admis-sions
aged 12 and older
Primary substance at admission
Alcohol Opiates Cocaine
Mari-juana/
hashish
Metham-phetamine/
amphet-amines
Tran-quil-izers
115

Alcohol only
Secondarydrug Heroin
Other opiates
Smoked cocaine
Other route
Total admissions aged 12 and older 2,684 500 358 199 171 9 10 408 983 5 4 3 1 8 25
GenderMale 63.7 71.6 67.0 55.3 52.0 88.9 90.0 77.2 56.2 60.0 25.0 66.7 100.0 62.5 72.0Female 36.3 28.4 33.0 44.7 48.0 11.1 10.0 22.8 43.8 40.0 75.0 33.3 - - 37.5 28.0
Total 100.0 100.0 100.0 100.0 100.0 100.0 100.0 100.0 100.0 100.0 100.0 100.0 100.0 100.0 100.0No. of admissions 2,684 500 358 199 171 9 10 408 983 5 4 3 1 8 25
Age at admission12 to 19 years 16.9 5.4 13.7 6.5 13.5 11.1 10.0 57.6 8.4 20.0 50.0 66.7 100.0 87.5 36.020 to 24 years 16.5 15.8 10.3 35.7 25.1 11.1 10.0 13.0 15.2 - - 25.0 - - - - - - 32.025 to 29 years 16.2 7.6 14.5 26.6 19.9 22.2 10.0 10.0 21.1 20.0 - - 33.3 - - 12.5 12.030 to 34 years 15.8 13.8 19.3 16.1 17.5 - - 10.0 7.8 19.2 20.0 25.0 - - - - - - 4.035 to 39 years 11.8 13.8 14.8 4.5 13.5 11.1 10.0 5.1 13.9 - - - - - - - - - - 8.040 to 44 years 7.7 11.0 8.1 5.0 2.3 22.2 10.0 1.5 9.9 20.0 - - - - - - - - 4.045 to 49 years 6.3 9.4 9.5 0.5 4.1 - - 20.0 2.7 6.6 20.0 - - - - - - - - - -50 to 54 years 5.0 11.6 6.1 3.5 1.8 11.1 - - 1.2 3.8 - - - - - - - - - - 4.055 to 59 years 2.7 7.8 2.8 0.5 1.2 - - 10.0 0.7 1.7 - - - - - - - - - - - -60 years and older 1.2 3.8 0.8 1.0 1.2 11.1 10.0 0.2 0.2 - - - - - - - - - - - -
Total 100.0 100.0 100.0 100.0 100.0 100.0 100.0 100.0 100.0 100.0 100.0 100.0 100.0 100.0 100.0No. of admissions 2,684 500 358 199 171 9 10 408 983 5 4 3 1 8 25
Race/ethnicityWhite (non-Hispanic) 80.6 78.6 78.7 92.8 88.4 100.0 66.7 71.8 81.9 80.0 100.0 50.0 - - 50.0 81.0Black (non-Hispanic) 2.1 2.7 1.5 - - 1.2 - - - - 4.6 1.7 - - - - - - - - - - - -Hispanic origin 9.8 12.6 9.2 2.6 6.1 - - 11.1 13.7 9.5 - - - - - - - - 16.7 9.5American Indian/Alaska Native 2.8 2.9 6.5 1.5 0.6 - - 11.1 2.6 2.2 - - - - 50.0 - - - - - -Asian/Pacific Islander 0.7 0.6 1.2 0.5 1.8 - - 11.1 0.6 0.3 - - - - - - - - - - - -Other 4.0 2.7 3.0 2.6 1.8 - - - - 6.8 4.4 20.0 - - - - - - 33.3 9.5
Total 100.0 100.0 100.0 100.0 100.0 100.0 100.0 100.0 100.0 100.0 100.0 100.0 - - 100.0 100.0No. of admissions 2,529 485 338 195 164 8 9 351 941 5 4 2 - - 6 21
NOTE: Percentages may not sum to 100 percent due to rounding. Percentages are based on all admissions with known and valid values. Admissions for which values were not collected, unknown, or missing are excluded from the percentage base (denominator).SOURCE: Center for Behavioral Health Statistics and Quality, Substance Abuse and Mental Health Services Administration, Treatment Episode Data Set (TEDS). Data received through 11.01.16.
Seda-tives
Hallu-cino-gens PCP
Inhal-ants
Other/ none speci-fied
- - Quantity is zero.
Table 3.12b. Idaho admissions aged 12 and older, by primary substance of abuse and gender, age at admission, and race/ethnicity: Percent distribution, 2015
Gender, age at admission, and race/ethnicity
All admis-sions
aged 12 and older
Primary substance at admission
Alcohol Opiates CocaineMari-juana/
hashish
Metham-phetamine/
amphet-amines
Tran-quil-izers
116

Alcohol only
Secondarydrug Heroin
Other opiates
Smoked cocaine
Other route
Total admissions aged 12 and older 20,587 3,465 2,897 6,149 957 1,271 301 4,295 892 148 22 46 43 14 87
GenderMale 13,477 2,453 2,075 3,580 486 707 209 3,283 484 69 13 34 18 9 57Female 7,110 1,012 822 2,569 471 564 92 1,012 408 79 9 12 25 5 30
No. of admissions1 20,587 3,465 2,897 6,149 957 1,271 301 4,295 892 148 22 46 43 14 87
Age at admission12 to 19 years 2,045 81 162 86 38 8 12 1,552 49 25 7 2 1 2 2020 to 24 years 2,559 204 341 567 134 35 37 1,009 140 42 4 15 11 3 1725 to 29 years 3,137 413 475 951 248 78 40 666 189 34 3 14 8 - - 1830 to 34 years 2,774 477 455 791 195 126 47 430 199 13 2 6 9 5 1935 to 39 years 2,193 450 393 587 119 140 51 287 136 8 1 6 10 1 440 to 44 years 2,034 424 311 691 99 209 38 154 88 7 2 3 4 1 345 to 49 years 2,006 444 280 806 53 245 33 85 49 9 - - - - - - - - 250 to 54 years 1,853 441 246 791 31 220 26 60 28 6 1 - - - - 2 155 to 59 years 1,242 325 159 533 22 144 11 35 11 1 1 - - - - - - - -60 years and older 744 206 75 346 18 66 6 17 3 3 1 - - - - - - 3
No. of admissions 20,587 3,465 2,897 6,149 957 1,271 301 4,295 892 148 22 46 43 14 87
Race/ethnicityWhite (non-Hispanic) 10,349 2,077 1,524 2,612 813 371 161 1,726 802 123 16 34 3 10 77Black (non-Hispanic) 7,145 664 913 2,854 46 769 67 1,748 31 10 5 6 29 1 2Hispanic origin 2,692 654 407 573 86 111 70 713 46 12 - - 5 8 2 5American Indian/Alaska Native 88 19 15 14 3 7 1 25 2 1 - - - - - - - - 1Asian/Pacific Islander 60 12 9 9 2 2 1 17 5 - - - - 1 - - 1 1Other 253 39 29 87 7 11 1 66 6 2 1 - - 3 - - 1
No. of admissions 20,587 3,465 2,897 6,149 957 1,271 301 4,295 892 148 22 46 43 14 87
Table 3.13a. Illinois admissions aged 12 and older, by primary substance of abuse and gender, age at admission, and race/ethnicity: Number, 2015
Gender, age at admission, and race/ethnicity
All admis-sions
aged 12 and older
Primary substance at admission
Alcohol Opiates Cocaine
Mari-juana/
hashish
Metham-phetamine/
amphet-amines
Tran-quil-izers
- - Quantity is zero.
SOURCE: Center for Behavioral Health Statistics and Quality, Substance Abuse and Mental Health Services Administration, Treatment Episode Data Set (TEDS). Data received through 11.01.16.
Seda-tives
Hallu-cino-gens PCP
Inhal-ants
Other/ none speci-fied
1 Admissions for which values were not collected, unknown, or missing are excluded from the sum total.
117
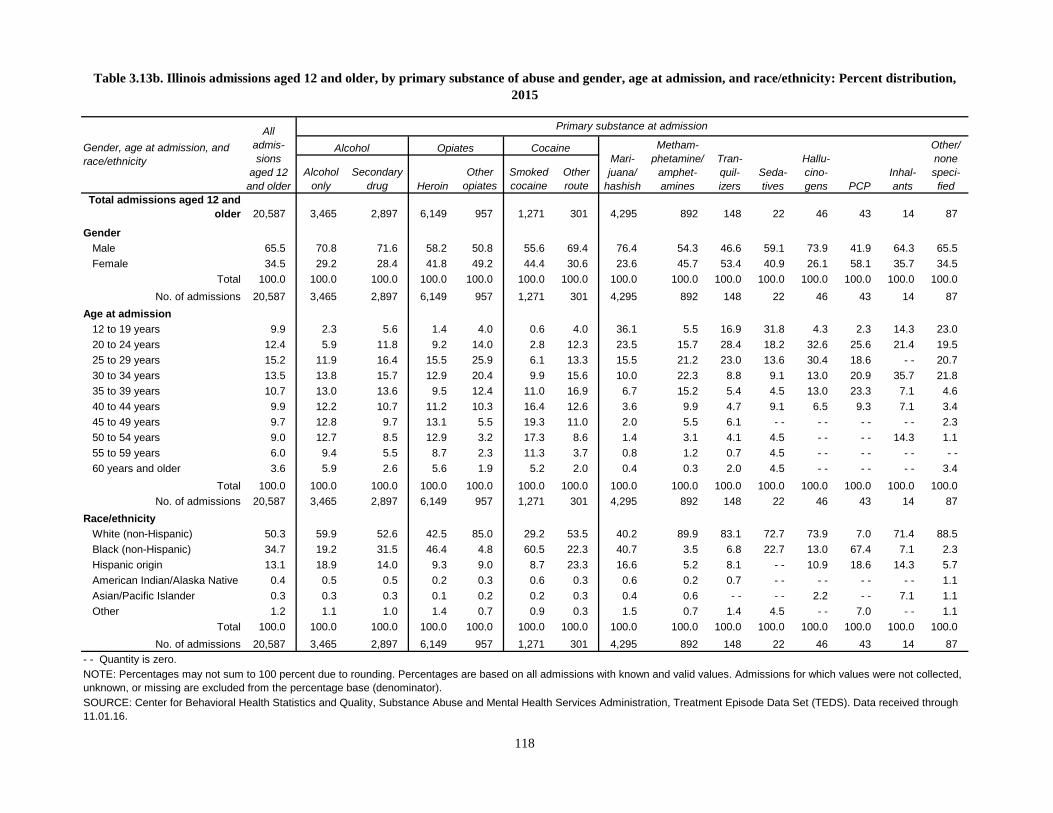
Alcohol only
Secondarydrug Heroin
Other opiates
Smoked cocaine
Other route
Total admissions aged 12 and older 20,587 3,465 2,897 6,149 957 1,271 301 4,295 892 148 22 46 43 14 87
GenderMale 65.5 70.8 71.6 58.2 50.8 55.6 69.4 76.4 54.3 46.6 59.1 73.9 41.9 64.3 65.5Female 34.5 29.2 28.4 41.8 49.2 44.4 30.6 23.6 45.7 53.4 40.9 26.1 58.1 35.7 34.5
Total 100.0 100.0 100.0 100.0 100.0 100.0 100.0 100.0 100.0 100.0 100.0 100.0 100.0 100.0 100.0No. of admissions 20,587 3,465 2,897 6,149 957 1,271 301 4,295 892 148 22 46 43 14 87
Age at admission12 to 19 years 9.9 2.3 5.6 1.4 4.0 0.6 4.0 36.1 5.5 16.9 31.8 4.3 2.3 14.3 23.020 to 24 years 12.4 5.9 11.8 9.2 14.0 2.8 12.3 23.5 15.7 28.4 18.2 32.6 25.6 21.4 19.525 to 29 years 15.2 11.9 16.4 15.5 25.9 6.1 13.3 15.5 21.2 23.0 13.6 30.4 18.6 - - 20.730 to 34 years 13.5 13.8 15.7 12.9 20.4 9.9 15.6 10.0 22.3 8.8 9.1 13.0 20.9 35.7 21.835 to 39 years 10.7 13.0 13.6 9.5 12.4 11.0 16.9 6.7 15.2 5.4 4.5 13.0 23.3 7.1 4.640 to 44 years 9.9 12.2 10.7 11.2 10.3 16.4 12.6 3.6 9.9 4.7 9.1 6.5 9.3 7.1 3.445 to 49 years 9.7 12.8 9.7 13.1 5.5 19.3 11.0 2.0 5.5 6.1 - - - - - - - - 2.350 to 54 years 9.0 12.7 8.5 12.9 3.2 17.3 8.6 1.4 3.1 4.1 4.5 - - - - 14.3 1.155 to 59 years 6.0 9.4 5.5 8.7 2.3 11.3 3.7 0.8 1.2 0.7 4.5 - - - - - - - -60 years and older 3.6 5.9 2.6 5.6 1.9 5.2 2.0 0.4 0.3 2.0 4.5 - - - - - - 3.4
Total 100.0 100.0 100.0 100.0 100.0 100.0 100.0 100.0 100.0 100.0 100.0 100.0 100.0 100.0 100.0No. of admissions 20,587 3,465 2,897 6,149 957 1,271 301 4,295 892 148 22 46 43 14 87
Race/ethnicityWhite (non-Hispanic) 50.3 59.9 52.6 42.5 85.0 29.2 53.5 40.2 89.9 83.1 72.7 73.9 7.0 71.4 88.5Black (non-Hispanic) 34.7 19.2 31.5 46.4 4.8 60.5 22.3 40.7 3.5 6.8 22.7 13.0 67.4 7.1 2.3Hispanic origin 13.1 18.9 14.0 9.3 9.0 8.7 23.3 16.6 5.2 8.1 - - 10.9 18.6 14.3 5.7American Indian/Alaska Native 0.4 0.5 0.5 0.2 0.3 0.6 0.3 0.6 0.2 0.7 - - - - - - - - 1.1Asian/Pacific Islander 0.3 0.3 0.3 0.1 0.2 0.2 0.3 0.4 0.6 - - - - 2.2 - - 7.1 1.1Other 1.2 1.1 1.0 1.4 0.7 0.9 0.3 1.5 0.7 1.4 4.5 - - 7.0 - - 1.1
Total 100.0 100.0 100.0 100.0 100.0 100.0 100.0 100.0 100.0 100.0 100.0 100.0 100.0 100.0 100.0No. of admissions 20,587 3,465 2,897 6,149 957 1,271 301 4,295 892 148 22 46 43 14 87
NOTE: Percentages may not sum to 100 percent due to rounding. Percentages are based on all admissions with known and valid values. Admissions for which values were not collected, unknown, or missing are excluded from the percentage base (denominator).SOURCE: Center for Behavioral Health Statistics and Quality, Substance Abuse and Mental Health Services Administration, Treatment Episode Data Set (TEDS). Data received through 11.01.16.
Seda-tives
Hallu-cino-gens PCP
Inhal-ants
Other/ none speci-fied
- - Quantity is zero.
Table 3.13b. Illinois admissions aged 12 and older, by primary substance of abuse and gender, age at admission, and race/ethnicity: Percent distribution, 2015
Gender, age at admission, and race/ethnicity
All admis-sions
aged 12 and older
Primary substance at admission
Alcohol Opiates CocaineMari-juana/
hashish
Metham-phetamine/
amphet-amines
Tran-quil-izers
118

Alcohol only
Secondarydrug Heroin
Other opiates
Smoked cocaine
Other route
Total admissions aged 12 and older 21,362 3,242 3,966 3,224 2,436 533 251 4,376 2,070 306 40 45 7 16 850
GenderMale 12,939 2,215 2,777 1,691 1,140 273 155 2,972 1,018 141 16 34 4 10 493Female 8,423 1,027 1,189 1,533 1,296 260 96 1,404 1,052 165 24 11 3 6 357
No. of admissions1 21,362 3,242 3,966 3,224 2,436 533 251 4,376 2,070 306 40 45 7 16 850
Age at admission12 to 19 years 1,414 99 177 69 35 2 5 879 46 18 - - 4 - - 3 7720 to 24 years 3,600 297 540 695 331 23 32 1,133 320 47 7 10 2 4 15925 to 29 years 4,105 347 616 986 605 36 33 790 433 66 8 13 - - 3 16930 to 34 years 3,568 405 604 690 559 38 44 594 431 48 10 7 1 2 13535 to 39 years 2,675 416 488 368 399 80 35 400 337 50 1 5 2 2 9240 to 44 years 1,916 414 423 172 197 90 33 246 238 28 7 1 1 1 6545 to 49 years 1,544 389 413 94 135 109 25 149 149 19 4 2 1 - - 5550 to 54 years 1,299 415 356 66 87 82 28 112 86 16 2 1 - - - - 4855 to 59 years 806 274 232 53 55 56 14 51 26 10 1 2 - - 1 3160 years and older 435 186 117 31 33 17 2 22 4 4 - - - - - - - - 19
No. of admissions 21,362 3,242 3,966 3,224 2,436 533 251 4,376 2,070 306 40 45 7 16 850
Race/ethnicityWhite (non-Hispanic) 16,125 2,243 2,913 2,783 2,081 226 138 2,859 1,833 258 36 35 4 14 702Black (non-Hispanic) 2,536 455 514 157 67 261 80 882 30 12 3 4 3 1 67Hispanic origin 838 202 186 73 46 15 18 212 48 10 - - 3 - - - - 25American Indian/Alaska Native 73 12 16 4 5 8 1 18 8 - - - - - - - - - - 1Asian/Pacific Islander 953 218 188 80 126 6 4 204 103 12 - - 1 - - - - 11Other 672 88 133 86 78 14 6 183 38 10 - - 2 - - 1 33
No. of admissions 21,197 3,218 3,950 3,183 2,403 530 247 4,358 2,060 302 39 45 7 16 839
1 Admissions for which values were not collected, unknown, or missing are excluded from the sum total.- - Quantity is zero.
SOURCE: Center for Behavioral Health Statistics and Quality, Substance Abuse and Mental Health Services Administration, Treatment Episode Data Set (TEDS). Data received through 11.01.16.
Table 3.14a. Indiana admissions aged 12 and older, by primary substance of abuse and gender, age at admission, and race/ethnicity: Number, 2015
Gender, age at admission, and race/ethnicity
All admis-sions
aged 12 and older
Primary substance at admission
Alcohol Opiates Cocaine
Mari-juana/
hashish
Metham-phetamine/
amphet-amines
Tran-quil-izers
Seda-tives
Hallu-cino-gens PCP
Inhal-ants
Other/ none speci-fied
119

Alcohol only
Secondarydrug Heroin
Other opiates
Smoked cocaine
Other route
Total admissions aged 12 and older 21,362 3,242 3,966 3,224 2,436 533 251 4,376 2,070 306 40 45 7 16 850
GenderMale 60.6 68.3 70.0 52.5 46.8 51.2 61.8 67.9 49.2 46.1 40.0 75.6 57.1 62.5 58.0Female 39.4 31.7 30.0 47.5 53.2 48.8 38.2 32.1 50.8 53.9 60.0 24.4 42.9 37.5 42.0
Total 100.0 100.0 100.0 100.0 100.0 100.0 100.0 100.0 100.0 100.0 100.0 100.0 100.0 100.0 100.0No. of admissions 21,362 3,242 3,966 3,224 2,436 533 251 4,376 2,070 306 40 45 7 16 850
Age at admission12 to 19 years 6.6 3.1 4.5 2.1 1.4 0.4 2.0 20.1 2.2 5.9 - - 8.9 - - 18.8 9.120 to 24 years 16.9 9.2 13.6 21.6 13.6 4.3 12.7 25.9 15.5 15.4 17.5 22.2 28.6 25.0 18.725 to 29 years 19.2 10.7 15.5 30.6 24.8 6.8 13.1 18.1 20.9 21.6 20.0 28.9 - - 18.8 19.930 to 34 years 16.7 12.5 15.2 21.4 22.9 7.1 17.5 13.6 20.8 15.7 25.0 15.6 14.3 12.5 15.935 to 39 years 12.5 12.8 12.3 11.4 16.4 15.0 13.9 9.1 16.3 16.3 2.5 11.1 28.6 12.5 10.840 to 44 years 9.0 12.8 10.7 5.3 8.1 16.9 13.1 5.6 11.5 9.2 17.5 2.2 14.3 6.3 7.645 to 49 years 7.2 12.0 10.4 2.9 5.5 20.5 10.0 3.4 7.2 6.2 10.0 4.4 14.3 - - 6.550 to 54 years 6.1 12.8 9.0 2.0 3.6 15.4 11.2 2.6 4.2 5.2 5.0 2.2 - - - - 5.655 to 59 years 3.8 8.5 5.8 1.6 2.3 10.5 5.6 1.2 1.3 3.3 2.5 4.4 - - 6.3 3.660 years and older 2.0 5.7 3.0 1.0 1.4 3.2 0.8 0.5 0.2 1.3 - - - - - - - - 2.2
Total 100.0 100.0 100.0 100.0 100.0 100.0 100.0 100.0 100.0 100.0 100.0 100.0 100.0 100.0 100.0No. of admissions 21,362 3,242 3,966 3,224 2,436 533 251 4,376 2,070 306 40 45 7 16 850
Race/ethnicityWhite (non-Hispanic) 76.1 69.7 73.7 87.4 86.6 42.6 55.9 65.6 89.0 85.4 92.3 77.8 57.1 87.5 83.7Black (non-Hispanic) 12.0 14.1 13.0 4.9 2.8 49.2 32.4 20.2 1.5 4.0 7.7 8.9 42.9 6.3 8.0Hispanic origin 4.0 6.3 4.7 2.3 1.9 2.8 7.3 4.9 2.3 3.3 - - 6.7 - - - - 3.0American Indian/Alaska Native 0.3 0.4 0.4 0.1 0.2 1.5 0.4 0.4 0.4 - - - - - - - - - - 0.1Asian/Pacific Islander 4.5 6.8 4.8 2.5 5.2 1.1 1.6 4.7 5.0 4.0 - - 2.2 - - - - 1.3Other 3.2 2.7 3.4 2.7 3.2 2.6 2.4 4.2 1.8 3.3 - - 4.4 - - 6.3 3.9
Total 100.0 100.0 100.0 100.0 100.0 100.0 100.0 100.0 100.0 100.0 100.0 100.0 100.0 100.0 100.0No. of admissions 21,197 3,218 3,950 3,183 2,403 530 247 4,358 2,060 302 39 45 7 16 839
NOTE: Percentages may not sum to 100 percent due to rounding. Percentages are based on all admissions with known and valid values. Admissions for which values were not collected, unknown, or missing are excluded from the percentage base (denominator).SOURCE: Center for Behavioral Health Statistics and Quality, Substance Abuse and Mental Health Services Administration, Treatment Episode Data Set (TEDS). Data received through 11.01.16.
Seda-tives
Hallu-cino-gens PCP
Inhal-ants
Other/ none speci-fied
- - Quantity is zero.
Table 3.14b. Indiana admissions aged 12 and older, by primary substance of abuse and gender, age at admission, and race/ethnicity: Percent distribution, 2015
Gender, age at admission, and race/ethnicity
All admis-sions
aged 12 and older
Primary substance at admission
Alcohol Opiates CocaineMari-juana/
hashish
Metham-phetamine/
amphet-amines
Tran-quil-izers
120

Alcohol only
Secondarydrug Heroin
Other opiates
Smoked cocaine
Other route
Total admissions aged 12 and older 28,578 6,539 5,053 875 1,400 299 188 7,455 6,295 161 30 68 8 23 184
GenderMale 18,999 4,690 3,686 549 733 163 138 5,390 3,380 73 16 55 7 21 98Female 9,575 1,847 1,366 325 667 136 50 2,065 2,915 88 14 13 1 2 86
No. of admissions1 28,574 6,537 5,052 874 1,400 299 188 7,455 6,295 161 30 68 8 23 184
Age at admission12 to 19 years 3,601 156 435 34 43 3 17 2,563 271 32 3 18 - - 4 2220 to 24 years 4,746 652 856 203 245 9 29 1,804 864 30 2 17 - - 2 3325 to 29 years 4,783 780 868 225 341 23 30 1,125 1,303 26 5 15 1 8 3330 to 34 years 4,303 842 740 164 295 40 26 786 1,339 21 8 7 3 2 3035 to 39 years 3,248 840 571 95 179 35 30 478 977 13 2 5 3 4 1640 to 44 years 2,307 736 437 41 94 43 16 278 631 11 3 2 1 1 1345 to 49 years 1,982 751 420 29 80 62 23 167 420 7 4 2 - - 1 1650 to 54 years 1,823 802 370 33 65 41 12 153 323 13 1 2 - - - - 855 to 59 years 1,089 538 245 22 30 27 3 71 140 4 1 - - - - 1 760 years and older 696 442 111 29 28 16 2 30 27 4 1 - - - - - - 6
No. of admissions 28,578 6,539 5,053 875 1,400 299 188 7,455 6,295 161 30 68 8 23 184
Race/ethnicityWhite (non-Hispanic) 23,337 5,585 4,097 729 1,286 150 89 5,360 5,650 144 28 46 - - 18 155Black (non-Hispanic) 2,344 347 422 86 38 121 56 1,123 111 7 2 11 8 1 11Hispanic origin 1,663 377 281 40 35 17 28 607 261 4 - - 4 - - 2 7American Indian/Alaska Native 343 74 92 2 9 3 1 64 93 - - - - 3 - - 1 1Asian/Pacific Islander 194 57 28 6 6 - - 3 48 44 - - - - - - - - - - 2Other 570 75 112 8 20 8 11 211 110 5 - - 2 - - 1 7
No. of admissions 28,451 6,515 5,032 871 1,394 299 188 7,413 6,269 160 30 66 8 23 183
1 Admissions for which values were not collected, unknown, or missing are excluded from the sum total.- - Quantity is zero.
SOURCE: Center for Behavioral Health Statistics and Quality, Substance Abuse and Mental Health Services Administration, Treatment Episode Data Set (TEDS). Data received through 11.01.16.
Table 3.15a. Iowa admissions aged 12 and older, by primary substance of abuse and gender, age at admission, and race/ethnicity: Number, 2015
Gender, age at admission, and race/ethnicity
All admis-sions
aged 12 and older
Primary substance at admission
Alcohol Opiates Cocaine
Mari-juana/
hashish
Metham-phetamine/
amphet-amines
Tran-quil-izers
Seda-tives
Hallu-cino-gens PCP
Inhal-ants
Other/ none speci-fied
121

Alcohol only
Secondarydrug Heroin
Other opiates
Smoked cocaine
Other route
Total admissions aged 12 and older 28,578 6,539 5,053 875 1,400 299 188 7,455 6,295 161 30 68 8 23 184
GenderMale 66.5 71.7 73.0 62.8 52.4 54.5 73.4 72.3 53.7 45.3 53.3 80.9 87.5 91.3 53.3Female 33.5 28.3 27.0 37.2 47.6 45.5 26.6 27.7 46.3 54.7 46.7 19.1 12.5 8.7 46.7
Total 100.0 100.0 100.0 100.0 100.0 100.0 100.0 100.0 100.0 100.0 100.0 100.0 100.0 100.0 100.0No. of admissions 28,574 6,537 5,052 874 1,400 299 188 7,455 6,295 161 30 68 8 23 184
Age at admission12 to 19 years 12.6 2.4 8.6 3.9 3.1 1.0 9.0 34.4 4.3 19.9 10.0 26.5 - - 17.4 12.020 to 24 years 16.6 10.0 16.9 23.2 17.5 3.0 15.4 24.2 13.7 18.6 6.7 25.0 - - 8.7 17.925 to 29 years 16.7 11.9 17.2 25.7 24.4 7.7 16.0 15.1 20.7 16.1 16.7 22.1 12.5 34.8 17.930 to 34 years 15.1 12.9 14.6 18.7 21.1 13.4 13.8 10.5 21.3 13.0 26.7 10.3 37.5 8.7 16.335 to 39 years 11.4 12.8 11.3 10.9 12.8 11.7 16.0 6.4 15.5 8.1 6.7 7.4 37.5 17.4 8.740 to 44 years 8.1 11.3 8.6 4.7 6.7 14.4 8.5 3.7 10.0 6.8 10.0 2.9 12.5 4.3 7.145 to 49 years 6.9 11.5 8.3 3.3 5.7 20.7 12.2 2.2 6.7 4.3 13.3 2.9 - - 4.3 8.750 to 54 years 6.4 12.3 7.3 3.8 4.6 13.7 6.4 2.1 5.1 8.1 3.3 2.9 - - - - 4.355 to 59 years 3.8 8.2 4.8 2.5 2.1 9.0 1.6 1.0 2.2 2.5 3.3 - - - - 4.3 3.860 years and older 2.4 6.8 2.2 3.3 2.0 5.4 1.1 0.4 0.4 2.5 3.3 - - - - - - 3.3
Total 100.0 100.0 100.0 100.0 100.0 100.0 100.0 100.0 100.0 100.0 100.0 100.0 100.0 100.0 100.0No. of admissions 28,578 6,539 5,053 875 1,400 299 188 7,455 6,295 161 30 68 8 23 184
Race/ethnicityWhite (non-Hispanic) 82.0 85.7 81.4 83.7 92.3 50.2 47.3 72.3 90.1 90.0 93.3 69.7 - - 78.3 84.7Black (non-Hispanic) 8.2 5.3 8.4 9.9 2.7 40.5 29.8 15.1 1.8 4.4 6.7 16.7 100.0 4.3 6.0Hispanic origin 5.8 5.8 5.6 4.6 2.5 5.7 14.9 8.2 4.2 2.5 - - 6.1 - - 8.7 3.8American Indian/Alaska Native 1.2 1.1 1.8 0.2 0.6 1.0 0.5 0.9 1.5 - - - - 4.5 - - 4.3 0.5Asian/Pacific Islander 0.7 0.9 0.6 0.7 0.4 - - 1.6 0.6 0.7 - - - - - - - - - - 1.1Other 2.0 1.2 2.2 0.9 1.4 2.7 5.9 2.8 1.8 3.1 - - 3.0 - - 4.3 3.8
Total 100.0 100.0 100.0 100.0 100.0 100.0 100.0 100.0 100.0 100.0 100.0 100.0 100.0 100.0 100.0No. of admissions 28,451 6,515 5,032 871 1,394 299 188 7,413 6,269 160 30 66 8 23 183
NOTE: Percentages may not sum to 100 percent due to rounding. Percentages are based on all admissions with known and valid values. Admissions for which values were not collected, unknown, or missing are excluded from the percentage base (denominator).SOURCE: Center for Behavioral Health Statistics and Quality, Substance Abuse and Mental Health Services Administration, Treatment Episode Data Set (TEDS). Data received through 11.01.16.
Seda-tives
Hallu-cino-gens PCP
Inhal-ants
Other/ none speci-fied
- - Quantity is zero.
Table 3.15b. Iowa admissions aged 12 and older, by primary substance of abuse and gender, age at admission, and race/ethnicity: Percent distribution, 2015
Gender, age at admission, and race/ethnicity
All admis-sions
aged 12 and older
Primary substance at admission
Alcohol Opiates CocaineMari-juana/
hashish
Metham-phetamine/
amphet-amines
Tran-quil-izers
122

Alcohol only
Secondarydrug Heroin
Other opiates
Smoked cocaine
Other route
Total admissions aged 12 and older 19,001 2,398 2,037 4,855 3,731 705 330 2,437 1,837 305 15 16 - - 12 323
GenderMale 10,884 1,785 1,374 2,537 1,788 376 191 1,543 977 125 4 10 - - 8 166Female 8,114 613 662 2,317 1,942 329 139 894 860 180 11 6 - - 4 157
No. of admissions1 18,998 2,398 2,036 4,854 3,730 705 330 2,437 1,837 305 15 16 - - 12 323
Age at admission12 to 19 years 880 52 50 106 33 4 7 514 62 13 - - 4 - - 1 3420 to 24 years 2,494 130 149 1,051 365 18 26 433 246 30 - - 1 - - - - 4525 to 29 years 3,950 208 280 1,470 855 60 57 482 397 53 1 4 - - 2 8130 to 34 years 3,631 328 306 1,053 927 73 61 345 391 67 3 5 - - 2 7035 to 39 years 2,777 304 322 567 694 137 46 268 337 57 4 - - - - 3 3840 to 44 years 1,830 330 278 284 365 110 45 165 192 34 3 - - - - 3 2145 to 49 years 1,479 386 264 170 246 121 34 110 108 22 1 2 - - 1 1450 to 54 years 1,044 311 210 91 151 85 34 75 60 15 3 - - - - - - 955 to 59 years 599 199 137 44 60 67 16 29 35 6 - - - - - - - - 660 years and older 317 150 41 19 35 30 4 16 9 8 - - - - - - - - 5
No. of admissions 19,001 2,398 2,037 4,855 3,731 705 330 2,437 1,837 305 15 16 - - 12 323
Race/ethnicityWhite (non-Hispanic) 16,115 2,028 1,572 4,394 3,504 294 215 1,830 1,658 283 14 12 - - 11 300Black (non-Hispanic) 1,877 216 340 290 81 387 97 411 29 11 1 2 - - - - 12Hispanic origin 242 50 31 54 30 8 6 39 19 1 - - - - - - 1 3American Indian/Alaska Native 35 6 5 15 4 - - - - 2 2 - - - - - - - - - - 1Asian/Pacific Islander 16 4 1 5 2 - - - - 3 - - - - - - - - - - - - 1Other 713 94 88 97 108 16 12 152 128 10 - - 2 - - - - 6
No. of admissions 18,998 2,398 2,037 4,855 3,729 705 330 2,437 1,836 305 15 16 - - 12 323
1 Admissions for which values were not collected, unknown, or missing are excluded from the sum total.
Inhal-ants
Other/ none speci-fied
SOURCE: Center for Behavioral Health Statistics and Quality, Substance Abuse and Mental Health Services Administration, Treatment Episode Data Set (TEDS). Data received through 11.01.16.
- - Quantity is zero.
Table 3.16a. Kentucky admissions aged 12 and older, by primary substance of abuse and gender, age at admission, and race/ethnicity: Number, 2015
Gender, age at admission, and race/ethnicity
All admis-sions
aged 12 and older
Primary substance at admission
Alcohol Opiates Cocaine
Mari-juana/
hashish
Metham-phetamine/
amphet-amines
Tran-quil-izers
Seda-tives
Hallu-cino-gens PCP
123

Alcohol only
Secondarydrug Heroin
Other opiates
Smoked cocaine
Other route
Total admissions aged 12 and older 19,001 2,398 2,037 4,855 3,731 705 330 2,437 1,837 305 15 16 - - 12 323
GenderMale 57.3 74.4 67.5 52.3 47.9 53.3 57.9 63.3 53.2 41.0 26.7 62.5 - - 66.7 51.4Female 42.7 25.6 32.5 47.7 52.1 46.7 42.1 36.7 46.8 59.0 73.3 37.5 - - 33.3 48.6
Total 100.0 100.0 100.0 100.0 100.0 100.0 100.0 100.0 100.0 100.0 100.0 100.0 - - 100.0 100.0No. of admissions 18,998 2,398 2,036 4,854 3,730 705 330 2,437 1,837 305 15 16 - - 12 323
Age at admission12 to 19 years 4.6 2.2 2.5 2.2 0.9 0.6 2.1 21.1 3.4 4.3 - - 25.0 - - 8.3 10.520 to 24 years 13.1 5.4 7.3 21.6 9.8 2.6 7.9 17.8 13.4 9.8 - - 6.3 - - - - 13.925 to 29 years 20.8 8.7 13.7 30.3 22.9 8.5 17.3 19.8 21.6 17.4 6.7 25.0 - - 16.7 25.130 to 34 years 19.1 13.7 15.0 21.7 24.8 10.4 18.5 14.2 21.3 22.0 20.0 31.3 - - 16.7 21.735 to 39 years 14.6 12.7 15.8 11.7 18.6 19.4 13.9 11.0 18.3 18.7 26.7 - - - - 25.0 11.840 to 44 years 9.6 13.8 13.6 5.8 9.8 15.6 13.6 6.8 10.5 11.1 20.0 - - - - 25.0 6.545 to 49 years 7.8 16.1 13.0 3.5 6.6 17.2 10.3 4.5 5.9 7.2 6.7 12.5 - - 8.3 4.350 to 54 years 5.5 13.0 10.3 1.9 4.0 12.1 10.3 3.1 3.3 4.9 20.0 - - - - - - 2.855 to 59 years 3.2 8.3 6.7 0.9 1.6 9.5 4.8 1.2 1.9 2.0 - - - - - - - - 1.960 years and older 1.7 6.3 2.0 0.4 0.9 4.3 1.2 0.7 0.5 2.6 - - - - - - - - 1.5
Total 100.0 100.0 100.0 100.0 100.0 100.0 100.0 100.0 100.0 100.0 100.0 100.0 - - 100.0 100.0No. of admissions 19,001 2,398 2,037 4,855 3,731 705 330 2,437 1,837 305 15 16 - - 12 323
Race/ethnicityWhite (non-Hispanic) 84.8 84.6 77.2 90.5 94.0 41.7 65.2 75.1 90.3 92.8 93.3 75.0 - - 91.7 92.9Black (non-Hispanic) 9.9 9.0 16.7 6.0 2.2 54.9 29.4 16.9 1.6 3.6 6.7 12.5 - - - - 3.7Hispanic origin 1.3 2.1 1.5 1.1 0.8 1.1 1.8 1.6 1.0 0.3 - - - - - - 8.3 0.9American Indian/Alaska Native 0.2 0.3 0.2 0.3 0.1 - - - - 0.1 0.1 - - - - - - - - - - 0.3Asian/Pacific Islander 0.1 0.2 * 0.1 0.1 - - - - 0.1 - - - - - - - - - - - - 0.3Other 3.8 3.9 4.3 2.0 2.9 2.3 3.6 6.2 7.0 3.3 - - 12.5 - - - - 1.9
Total 100.0 100.0 100.0 100.0 100.0 100.0 100.0 100.0 100.0 100.0 100.0 100.0 - - 100.0 100.0No. of admissions 18,998 2,398 2,037 4,855 3,729 705 330 2,437 1,836 305 15 16 - - 12 323
NOTE: Percentages may not sum to 100 percent due to rounding. Percentages are based on all admissions with known and valid values. Admissions for which values were not collected, unknown, or missing are excluded from the percentage base (denominator).SOURCE: Center for Behavioral Health Statistics and Quality, Substance Abuse and Mental Health Services Administration, Treatment Episode Data Set (TEDS). Data received through 11.01.16.
Seda-tives
Hallu-cino-gens PCP
Inhal-ants
Other/ none speci-fied
- - Quantity is zero; * Less than 0.05 percent.
Table 3.16b. Kentucky admissions aged 12 and older, by primary substance of abuse and gender, age at admission, and race/ethnicity: Percent distribution, 2015
Gender, age at admission, and race/ethnicity
All admis-sions
aged 12 and older
Primary substance at admission
Alcohol Opiates CocaineMari-juana/
hashish
Metham-phetamine/
amphet-amines
Tran-quil-izers
124

Alcohol only
Secondarydrug Heroin
Other opiates
Smoked cocaine
Other route
Total admissions aged 12 and older 10,515 638 1,059 1,033 977 455 185 1,020 1,085 138 24 6 21 2 3,872
GenderMale 6,575 456 740 686 522 290 117 705 605 61 8 5 15 2 2,363Female 3,937 182 319 347 455 165 68 315 480 77 16 1 6 - - 1,506
No. of admissions1 10,512 638 1,059 1,033 977 455 185 1,020 1,085 138 24 6 21 2 3,869
Age at admission12 to 19 years 875 3 21 12 39 4 5 520 43 3 1 1 - - - - 22320 to 24 years 1,266 26 72 135 122 12 20 141 140 26 4 1 3 1 56325 to 29 years 1,907 39 118 288 251 28 19 142 255 32 3 2 5 1 72430 to 34 years 1,898 85 183 233 247 39 41 80 283 32 6 2 2 - - 66535 to 39 years 1,442 85 148 183 159 63 32 51 218 19 5 - - 6 - - 47340 to 44 years 915 75 126 85 64 56 17 38 71 9 1 - - 5 - - 36845 to 49 years 871 96 166 50 45 89 24 23 41 9 1 - - - - - - 32750 to 54 years 699 110 116 27 29 88 16 19 20 6 2 - - - - - - 26655 to 59 years 434 73 85 13 15 52 8 4 12 1 - - - - - - - - 17160 years and older 208 46 24 7 6 24 3 2 2 1 1 - - - - - - 92
No. of admissions 10,515 638 1,059 1,033 977 455 185 1,020 1,085 138 24 6 21 2 3,872
Race/ethnicityWhite (non-Hispanic) 6,468 431 686 726 820 120 56 432 999 115 18 5 1 2 2,057Black (non-Hispanic) 3,540 190 338 255 134 322 127 534 57 19 6 1 20 - - 1,537Hispanic origin 237 9 22 37 13 7 1 22 18 1 - - - - - - - - 107American Indian/Alaska Native 36 - - 4 5 3 2 1 3 5 - - - - - - - - - - 13Asian/Pacific Islander 39 2 4 3 2 1 - - 6 2 1 - - - - - - - - 18Other 75 4 4 4 4 2 - - 16 2 2 - - - - - - - - 37
No. of admissions 10,395 636 1,058 1,030 976 454 185 1,013 1,083 138 24 6 21 2 3,769
Table 3.17a. Louisiana admissions aged 12 and older, by primary substance of abuse and gender, age at admission, and race/ethnicity: Number, 2015
Gender, age at admission, and race/ethnicity
All admis-sions
aged 12 and older
Primary substance at admission
Alcohol Opiates Cocaine
Mari-juana/
hashish
Metham-phetamine/
amphet-amines
Tran-quil-izers
Seda-tives
Hallu-cino-gens PCP
1 Admissions for which values were not collected, unknown, or missing are excluded from the sum total.
Inhal-ants
Other/ none speci-fied
- - Quantity is zero.
SOURCE: Center for Behavioral Health Statistics and Quality, Substance Abuse and Mental Health Services Administration, Treatment Episode Data Set (TEDS). Data received through 11.01.16.
125
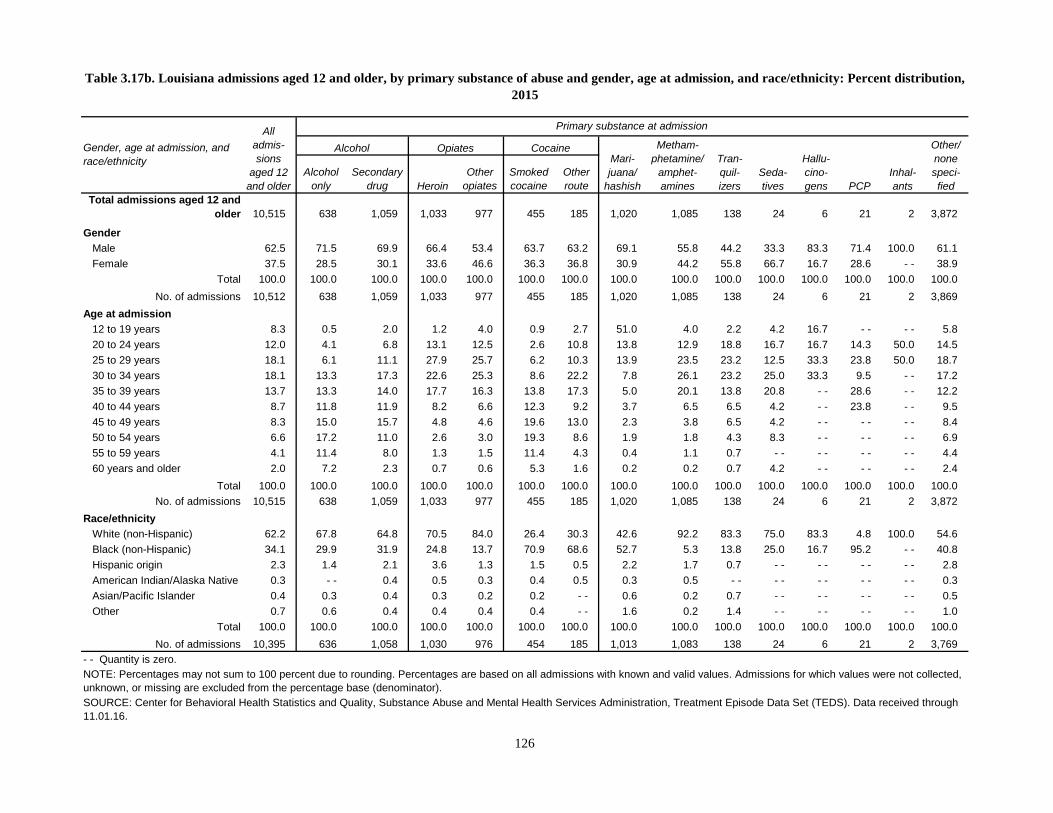
Alcohol only
Secondarydrug Heroin
Other opiates
Smoked cocaine
Other route
Total admissions aged 12 and older 10,515 638 1,059 1,033 977 455 185 1,020 1,085 138 24 6 21 2 3,872
GenderMale 62.5 71.5 69.9 66.4 53.4 63.7 63.2 69.1 55.8 44.2 33.3 83.3 71.4 100.0 61.1Female 37.5 28.5 30.1 33.6 46.6 36.3 36.8 30.9 44.2 55.8 66.7 16.7 28.6 - - 38.9
Total 100.0 100.0 100.0 100.0 100.0 100.0 100.0 100.0 100.0 100.0 100.0 100.0 100.0 100.0 100.0No. of admissions 10,512 638 1,059 1,033 977 455 185 1,020 1,085 138 24 6 21 2 3,869
Age at admission12 to 19 years 8.3 0.5 2.0 1.2 4.0 0.9 2.7 51.0 4.0 2.2 4.2 16.7 - - - - 5.820 to 24 years 12.0 4.1 6.8 13.1 12.5 2.6 10.8 13.8 12.9 18.8 16.7 16.7 14.3 50.0 14.525 to 29 years 18.1 6.1 11.1 27.9 25.7 6.2 10.3 13.9 23.5 23.2 12.5 33.3 23.8 50.0 18.730 to 34 years 18.1 13.3 17.3 22.6 25.3 8.6 22.2 7.8 26.1 23.2 25.0 33.3 9.5 - - 17.235 to 39 years 13.7 13.3 14.0 17.7 16.3 13.8 17.3 5.0 20.1 13.8 20.8 - - 28.6 - - 12.240 to 44 years 8.7 11.8 11.9 8.2 6.6 12.3 9.2 3.7 6.5 6.5 4.2 - - 23.8 - - 9.545 to 49 years 8.3 15.0 15.7 4.8 4.6 19.6 13.0 2.3 3.8 6.5 4.2 - - - - - - 8.450 to 54 years 6.6 17.2 11.0 2.6 3.0 19.3 8.6 1.9 1.8 4.3 8.3 - - - - - - 6.955 to 59 years 4.1 11.4 8.0 1.3 1.5 11.4 4.3 0.4 1.1 0.7 - - - - - - - - 4.460 years and older 2.0 7.2 2.3 0.7 0.6 5.3 1.6 0.2 0.2 0.7 4.2 - - - - - - 2.4
Total 100.0 100.0 100.0 100.0 100.0 100.0 100.0 100.0 100.0 100.0 100.0 100.0 100.0 100.0 100.0No. of admissions 10,515 638 1,059 1,033 977 455 185 1,020 1,085 138 24 6 21 2 3,872
Race/ethnicityWhite (non-Hispanic) 62.2 67.8 64.8 70.5 84.0 26.4 30.3 42.6 92.2 83.3 75.0 83.3 4.8 100.0 54.6Black (non-Hispanic) 34.1 29.9 31.9 24.8 13.7 70.9 68.6 52.7 5.3 13.8 25.0 16.7 95.2 - - 40.8Hispanic origin 2.3 1.4 2.1 3.6 1.3 1.5 0.5 2.2 1.7 0.7 - - - - - - - - 2.8American Indian/Alaska Native 0.3 - - 0.4 0.5 0.3 0.4 0.5 0.3 0.5 - - - - - - - - - - 0.3Asian/Pacific Islander 0.4 0.3 0.4 0.3 0.2 0.2 - - 0.6 0.2 0.7 - - - - - - - - 0.5Other 0.7 0.6 0.4 0.4 0.4 0.4 - - 1.6 0.2 1.4 - - - - - - - - 1.0
Total 100.0 100.0 100.0 100.0 100.0 100.0 100.0 100.0 100.0 100.0 100.0 100.0 100.0 100.0 100.0No. of admissions 10,395 636 1,058 1,030 976 454 185 1,013 1,083 138 24 6 21 2 3,769
NOTE: Percentages may not sum to 100 percent due to rounding. Percentages are based on all admissions with known and valid values. Admissions for which values were not collected, unknown, or missing are excluded from the percentage base (denominator).SOURCE: Center for Behavioral Health Statistics and Quality, Substance Abuse and Mental Health Services Administration, Treatment Episode Data Set (TEDS). Data received through 11.01.16.
Seda-tives
Hallu-cino-gens PCP
Inhal-ants
Other/ none speci-fied
- - Quantity is zero.
Table 3.17b. Louisiana admissions aged 12 and older, by primary substance of abuse and gender, age at admission, and race/ethnicity: Percent distribution, 2015
Gender, age at admission, and race/ethnicity
All admis-sions
aged 12 and older
Primary substance at admission
Alcohol Opiates CocaineMari-juana/
hashish
Metham-phetamine/
amphet-amines
Tran-quil-izers
126

Alcohol only
Secondarydrug Heroin
Other opiates
Smoked cocaine
Other route
Total admissions aged 12 and older 12,046 2,725 1,617 3,563 2,803 169 122 757 90 74 5 6 1 10 104
GenderMale 7,370 1,866 1,123 2,090 1,448 83 68 538 56 36 1 4 - - 5 52Female 4,676 859 494 1,473 1,355 86 54 219 34 38 4 2 1 5 52
No. of admissions1 12,046 2,725 1,617 3,563 2,803 169 122 757 90 74 5 6 1 10 104
Age at admission12 to 19 years 582 37 83 75 55 3 2 316 4 1 - - - - - - - - 620 to 24 years 1,454 126 172 623 341 12 15 120 21 13 - - 1 - - 3 725 to 29 years 2,347 202 262 990 683 30 19 95 18 20 - - 3 - - - - 2530 to 34 years 2,247 273 248 879 667 41 30 54 19 11 2 - - - - - - 2335 to 39 years 1,553 290 203 484 438 19 20 48 9 15 1 - - - - 5 2140 to 44 years 1,133 346 209 240 239 28 17 35 3 6 - - - - - - - - 1045 to 49 years 930 417 188 113 142 13 7 28 11 5 1 - - 1 2 250 to 54 years 883 470 136 95 118 11 5 33 5 3 1 - - - - - - 655 to 59 years 532 303 71 50 77 7 4 17 - - - - - - - - - - - - 360 years and older 385 261 45 14 43 5 3 11 - - - - - - 2 - - - - 1
No. of admissions 12,046 2,725 1,617 3,563 2,803 169 122 757 90 74 5 6 1 10 104
Race/ethnicityWhite (non-Hispanic) 11,231 2,580 1,472 3,362 2,637 151 101 665 84 68 5 5 1 8 92Black (non-Hispanic) 233 46 47 49 28 11 5 45 - - 1 - - - - - - - - 1Hispanic origin 225 36 46 65 34 1 13 16 4 - - - - - - - - - - 10American Indian/Alaska Native 239 45 26 50 89 2 2 15 2 5 - - - - - - 2 1Asian/Pacific Islander 39 3 9 16 1 3 - - 7 - - - - - - - - - - - - - -Other 71 11 16 19 13 1 1 9 - - - - - - 1 - - - - - -
No. of admissions 12,038 2,721 1,616 3,561 2,802 169 122 757 90 74 5 6 1 10 104- - Quantity is zero.
SOURCE: Center for Behavioral Health Statistics and Quality, Substance Abuse and Mental Health Services Administration, Treatment Episode Data Set (TEDS). Data received through 11.01.16.
1 Admissions for which values were not collected, unknown, or missing are excluded from the sum total.
Table 3.18a. Maine admissions aged 12 and older, by primary substance of abuse and gender, age at admission, and race/ethnicity: Number, 2015
Gender, age at admission, and race/ethnicity
All admis-sions
aged 12 and older
Primary substance at admission
Alcohol Opiates Cocaine
Mari-juana/
hashish
Metham-phetamine/
amphet-amines
Tran-quil-izers
Seda-tives
Hallu-cino-gens PCP
Inhal-ants
Other/ none speci-fied
127
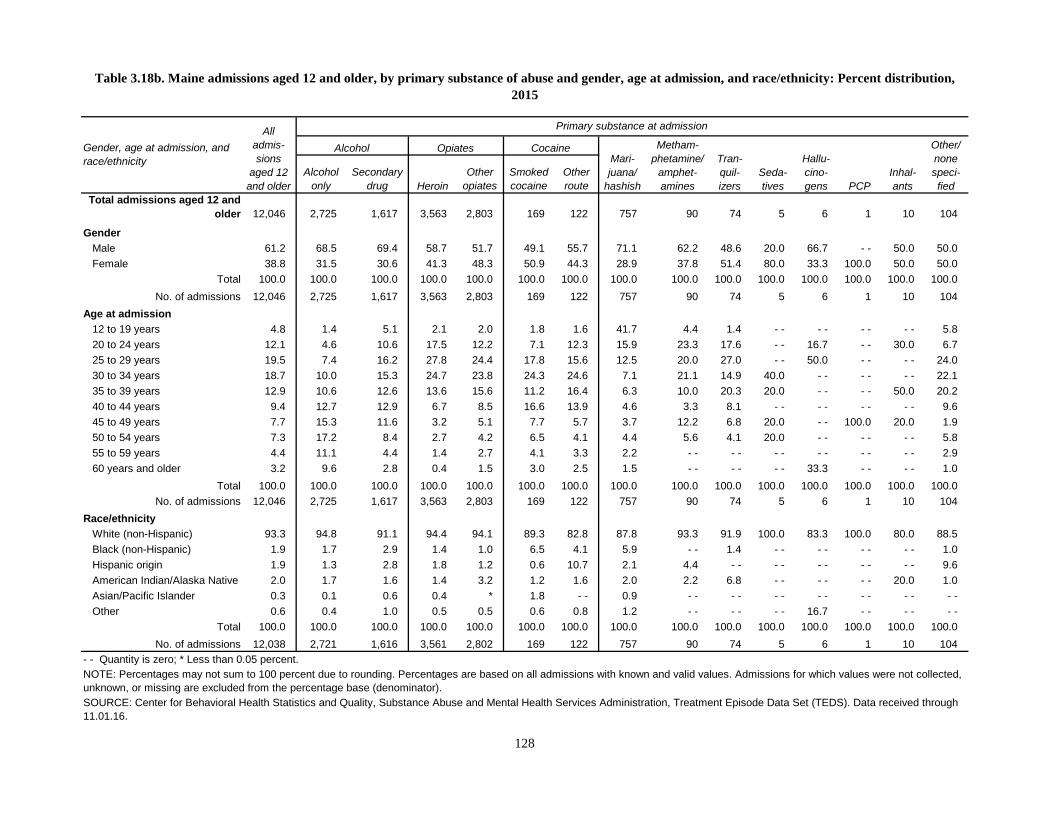
Alcohol only
Secondarydrug Heroin
Other opiates
Smoked cocaine
Other route
Total admissions aged 12 and older 12,046 2,725 1,617 3,563 2,803 169 122 757 90 74 5 6 1 10 104
GenderMale 61.2 68.5 69.4 58.7 51.7 49.1 55.7 71.1 62.2 48.6 20.0 66.7 - - 50.0 50.0Female 38.8 31.5 30.6 41.3 48.3 50.9 44.3 28.9 37.8 51.4 80.0 33.3 100.0 50.0 50.0
Total 100.0 100.0 100.0 100.0 100.0 100.0 100.0 100.0 100.0 100.0 100.0 100.0 100.0 100.0 100.0No. of admissions 12,046 2,725 1,617 3,563 2,803 169 122 757 90 74 5 6 1 10 104
Age at admission12 to 19 years 4.8 1.4 5.1 2.1 2.0 1.8 1.6 41.7 4.4 1.4 - - - - - - - - 5.820 to 24 years 12.1 4.6 10.6 17.5 12.2 7.1 12.3 15.9 23.3 17.6 - - 16.7 - - 30.0 6.725 to 29 years 19.5 7.4 16.2 27.8 24.4 17.8 15.6 12.5 20.0 27.0 - - 50.0 - - - - 24.030 to 34 years 18.7 10.0 15.3 24.7 23.8 24.3 24.6 7.1 21.1 14.9 40.0 - - - - - - 22.135 to 39 years 12.9 10.6 12.6 13.6 15.6 11.2 16.4 6.3 10.0 20.3 20.0 - - - - 50.0 20.240 to 44 years 9.4 12.7 12.9 6.7 8.5 16.6 13.9 4.6 3.3 8.1 - - - - - - - - 9.645 to 49 years 7.7 15.3 11.6 3.2 5.1 7.7 5.7 3.7 12.2 6.8 20.0 - - 100.0 20.0 1.950 to 54 years 7.3 17.2 8.4 2.7 4.2 6.5 4.1 4.4 5.6 4.1 20.0 - - - - - - 5.855 to 59 years 4.4 11.1 4.4 1.4 2.7 4.1 3.3 2.2 - - - - - - - - - - - - 2.960 years and older 3.2 9.6 2.8 0.4 1.5 3.0 2.5 1.5 - - - - - - 33.3 - - - - 1.0
Total 100.0 100.0 100.0 100.0 100.0 100.0 100.0 100.0 100.0 100.0 100.0 100.0 100.0 100.0 100.0No. of admissions 12,046 2,725 1,617 3,563 2,803 169 122 757 90 74 5 6 1 10 104
Race/ethnicityWhite (non-Hispanic) 93.3 94.8 91.1 94.4 94.1 89.3 82.8 87.8 93.3 91.9 100.0 83.3 100.0 80.0 88.5Black (non-Hispanic) 1.9 1.7 2.9 1.4 1.0 6.5 4.1 5.9 - - 1.4 - - - - - - - - 1.0Hispanic origin 1.9 1.3 2.8 1.8 1.2 0.6 10.7 2.1 4.4 - - - - - - - - - - 9.6American Indian/Alaska Native 2.0 1.7 1.6 1.4 3.2 1.2 1.6 2.0 2.2 6.8 - - - - - - 20.0 1.0Asian/Pacific Islander 0.3 0.1 0.6 0.4 * 1.8 - - 0.9 - - - - - - - - - - - - - -Other 0.6 0.4 1.0 0.5 0.5 0.6 0.8 1.2 - - - - - - 16.7 - - - - - -
Total 100.0 100.0 100.0 100.0 100.0 100.0 100.0 100.0 100.0 100.0 100.0 100.0 100.0 100.0 100.0No. of admissions 12,038 2,721 1,616 3,561 2,802 169 122 757 90 74 5 6 1 10 104
NOTE: Percentages may not sum to 100 percent due to rounding. Percentages are based on all admissions with known and valid values. Admissions for which values were not collected, unknown, or missing are excluded from the percentage base (denominator).SOURCE: Center for Behavioral Health Statistics and Quality, Substance Abuse and Mental Health Services Administration, Treatment Episode Data Set (TEDS). Data received through 11.01.16.
Seda-tives
Hallu-cino-gens PCP
Inhal-ants
Other/ none speci-fied
- - Quantity is zero; * Less than 0.05 percent.
Table 3.18b. Maine admissions aged 12 and older, by primary substance of abuse and gender, age at admission, and race/ethnicity: Percent distribution, 2015
Gender, age at admission, and race/ethnicity
All admis-sions
aged 12 and older
Primary substance at admission
Alcohol Opiates CocaineMari-juana/
hashish
Metham-phetamine/
amphet-amines
Tran-quil-izers
128

Alcohol only
Secondarydrug Heroin
Other opiates
Smoked cocaine
Other route
Total admissions aged 12 and older 107,509 8,563 5,185 56,382 14,700 2,502 853 7,675 130 775 55 61 422 13 10,193
GenderMale 60,851 5,769 3,542 30,895 6,426 1,323 550 5,134 79 362 32 42 268 12 6,417Female 46,656 2,794 1,643 25,486 8,273 1,179 303 2,541 51 413 23 19 154 1 3,776
No. of admissions1 107,507 8,563 5,185 56,381 14,699 2,502 853 7,675 130 775 55 61 422 13 10,193
Age at admission12 to 19 years 5,358 141 134 562 205 12 16 3,223 6 28 3 12 4 5 1,00720 to 24 years 9,513 498 378 4,284 1,374 67 44 1,398 14 65 5 14 39 1 1,33225 to 29 years 17,824 1,134 729 8,776 3,307 160 127 1,223 38 182 16 7 95 3 2,02730 to 34 years 16,403 1,185 789 7,948 3,263 240 130 816 33 208 12 11 130 2 1,63635 to 39 years 11,578 1,042 626 5,814 1,987 282 119 448 9 104 8 8 60 - - 1,07140 to 44 years 10,535 932 598 6,138 1,327 352 107 216 8 51 3 3 30 - - 77045 to 49 years 13,042 1,102 705 8,047 1,317 581 119 146 4 48 3 4 36 - - 93050 to 54 years 11,915 1,323 703 7,250 1,050 508 97 124 12 38 1 1 21 2 78555 to 59 years 7,357 846 405 4,667 587 212 64 58 6 34 4 1 6 - - 46760 years and older 3,984 360 118 2,896 283 88 30 23 - - 17 - - - - 1 - - 168
No. of admissions 107,509 8,563 5,185 56,382 14,700 2,502 853 7,675 130 775 55 61 422 13 10,193
Race/ethnicityWhite (non-Hispanic) 58,883 4,544 2,602 32,125 11,294 832 405 1,856 78 605 43 28 89 11 4,371Black (non-Hispanic) 39,278 3,192 2,313 21,117 2,429 1,570 391 5,056 39 131 7 31 311 1 2,690Hispanic origin 1,976 365 140 635 176 33 15 380 8 13 - - 1 9 - - 201American Indian/Alaska Native 399 45 28 205 34 19 4 31 - - 5 - - 1 4 - - 23Asian/Pacific Islander 330 62 18 128 31 5 6 34 1 3 2 - - - - - - 40Other 671 69 43 257 85 16 3 101 1 7 - - - - 2 1 86
No. of admissions 101,537 8,277 5,144 54,467 14,049 2,475 824 7,458 127 764 52 61 415 13 7,411
Table 3.19a. Maryland admissions aged 12 and older, by primary substance of abuse and gender, age at admission, and race/ethnicity: Number, 2015
Gender, age at admission, and race/ethnicity
All admis-sions
aged 12 and older
Primary substance at admission
Alcohol Opiates Cocaine
Mari-juana/
hashish
Metham-phetamine/
amphet-amines
Tran-quil-izers
- - Quantity is zero.
SOURCE: Center for Behavioral Health Statistics and Quality, Substance Abuse and Mental Health Services Administration, Treatment Episode Data Set (TEDS). Data received through 11.01.16.
Seda-tives
Hallu-cino-gens PCP
Inhal-ants
Other/ none speci-fied
1 Admissions for which values were not collected, unknown, or missing are excluded from the sum total.
129

Alcohol only
Secondarydrug Heroin
Other opiates
Smoked cocaine
Other route
Total admissions aged 12 and older 107,509 8,563 5,185 56,382 14,700 2,502 853 7,675 130 775 55 61 422 13 10,193
GenderMale 56.6 67.4 68.3 54.8 43.7 52.9 64.5 66.9 60.8 46.7 58.2 68.9 63.5 92.3 63.0Female 43.4 32.6 31.7 45.2 56.3 47.1 35.5 33.1 39.2 53.3 41.8 31.1 36.5 7.7 37.0
Total 100.0 100.0 100.0 100.0 100.0 100.0 100.0 100.0 100.0 100.0 100.0 100.0 100.0 100.0 100.0No. of admissions 107,507 8,563 5,185 56,381 14,699 2,502 853 7,675 130 775 55 61 422 13 10,193
Age at admission12 to 19 years 5.0 1.6 2.6 1.0 1.4 0.5 1.9 42.0 4.6 3.6 5.5 19.7 0.9 38.5 9.920 to 24 years 8.8 5.8 7.3 7.6 9.3 2.7 5.2 18.2 10.8 8.4 9.1 23.0 9.2 7.7 13.125 to 29 years 16.6 13.2 14.1 15.6 22.5 6.4 14.9 15.9 29.2 23.5 29.1 11.5 22.5 23.1 19.930 to 34 years 15.3 13.8 15.2 14.1 22.2 9.6 15.2 10.6 25.4 26.8 21.8 18.0 30.8 15.4 16.135 to 39 years 10.8 12.2 12.1 10.3 13.5 11.3 14.0 5.8 6.9 13.4 14.5 13.1 14.2 - - 10.540 to 44 years 9.8 10.9 11.5 10.9 9.0 14.1 12.5 2.8 6.2 6.6 5.5 4.9 7.1 - - 7.645 to 49 years 12.1 12.9 13.6 14.3 9.0 23.2 14.0 1.9 3.1 6.2 5.5 6.6 8.5 - - 9.150 to 54 years 11.1 15.5 13.6 12.9 7.1 20.3 11.4 1.6 9.2 4.9 1.8 1.6 5.0 15.4 7.755 to 59 years 6.8 9.9 7.8 8.3 4.0 8.5 7.5 0.8 4.6 4.4 7.3 1.6 1.4 - - 4.660 years and older 3.7 4.2 2.3 5.1 1.9 3.5 3.5 0.3 - - 2.2 - - - - 0.2 - - 1.6
Total 100.0 100.0 100.0 100.0 100.0 100.0 100.0 100.0 100.0 100.0 100.0 100.0 100.0 100.0 100.0No. of admissions 107,509 8,563 5,185 56,382 14,700 2,502 853 7,675 130 775 55 61 422 13 10,193
Race/ethnicityWhite (non-Hispanic) 58.0 54.9 50.6 59.0 80.4 33.6 49.2 24.9 61.4 79.2 82.7 45.9 21.4 84.6 59.0Black (non-Hispanic) 38.7 38.6 45.0 38.8 17.3 63.4 47.5 67.8 30.7 17.1 13.5 50.8 74.9 7.7 36.3Hispanic origin 1.9 4.4 2.7 1.2 1.3 1.3 1.8 5.1 6.3 1.7 - - 1.6 2.2 - - 2.7American Indian/Alaska Native 0.4 0.5 0.5 0.4 0.2 0.8 0.5 0.4 - - 0.7 - - 1.6 1.0 - - 0.3Asian/Pacific Islander 0.3 0.7 0.3 0.2 0.2 0.2 0.7 0.5 0.8 0.4 3.8 - - - - - - 0.5Other 0.7 0.8 0.8 0.5 0.6 0.6 0.4 1.4 0.8 0.9 - - - - 0.5 7.7 1.2
Total 100.0 100.0 100.0 100.0 100.0 100.0 100.0 100.0 100.0 100.0 100.0 100.0 100.0 100.0 100.0No. of admissions 101,537 8,277 5,144 54,467 14,049 2,475 824 7,458 127 764 52 61 415 13 7,411
NOTE: Percentages may not sum to 100 percent due to rounding. Percentages are based on all admissions with known and valid values. Admissions for which values were not collected, unknown, or missing are excluded from the percentage base (denominator).SOURCE: Center for Behavioral Health Statistics and Quality, Substance Abuse and Mental Health Services Administration, Treatment Episode Data Set (TEDS). Data received through 11.01.16.
Seda-tives
Hallu-cino-gens PCP
Inhal-ants
Other/ none speci-fied
- - Quantity is zero.
Table 3.19b. Maryland admissions aged 12 and older, by primary substance of abuse and gender, age at admission, and race/ethnicity: Percent distribution, 2015
Gender, age at admission, and race/ethnicity
All admis-sions
aged 12 and older
Primary substance at admission
Alcohol Opiates CocaineMari-juana/
hashish
Metham-phetamine/
amphet-amines
Tran-quil-izers
130

Alcohol only
Secondarydrug Heroin
Other opiates
Smoked cocaine
Other route
Total admissions aged 12 and older 91,164 20,894 8,694 49,400 4,244 1,383 1,313 3,456 239 969 10 31 51 6 474
GenderMale 63,214 14,481 6,197 34,498 2,622 793 874 2,678 187 494 4 25 41 4 316Female 27,885 6,401 2,489 14,877 1,617 585 436 771 52 475 6 6 10 2 158
No. of admissions1 91,099 20,882 8,686 49,375 4,239 1,378 1,310 3,449 239 969 10 31 51 6 474
Age at admission12 to 19 years 2,977 255 286 886 151 35 58 1,135 10 65 - - 16 5 - - 7520 to 24 years 12,317 1,523 936 8,076 631 85 144 701 20 108 - - 5 15 - - 7325 to 29 years 19,806 2,357 1,438 13,602 1,038 163 273 593 40 199 - - 4 12 1 8630 to 34 years 16,319 2,419 1,308 10,523 853 208 253 392 45 232 4 2 11 1 6835 to 39 years 11,154 2,279 1,155 6,281 563 179 198 237 38 165 2 1 5 - - 5140 to 44 years 8,154 2,364 989 3,889 313 197 117 133 29 85 - - 1 2 - - 3545 to 49 years 7,820 2,931 1,078 2,952 269 252 127 110 17 57 1 1 - - 2 2350 to 54 years 6,495 3,170 847 1,867 203 159 81 77 24 33 1 - - - - - - 3355 to 59 years 3,882 2,187 448 896 143 77 47 46 10 12 - - - - 1 2 1360 years and older 2,240 1,409 209 428 80 28 15 32 6 13 2 1 - - - - 17
No. of admissions 91,164 20,894 8,694 49,400 4,244 1,383 1,313 3,456 239 969 10 31 51 6 474
Race/ethnicityWhite (non-Hispanic) 69,706 16,259 6,486 38,464 3,533 791 838 1,831 195 866 8 27 16 5 387Black (non-Hispanic) 5,628 1,599 966 1,915 157 309 96 531 11 17 - - 1 4 - - 22Hispanic origin 9,735 1,633 710 5,902 285 150 246 690 14 46 1 1 27 - - 30American Indian/Alaska Native 373 89 30 195 15 10 11 14 2 2 - - 1 - - - - 4Asian/Pacific Islander 571 210 42 253 23 8 4 28 1 - - - - - - - - - - 2Other 4,193 843 374 2,317 161 98 91 252 8 27 - - - - 4 1 17
No. of admissions 90,206 20,633 8,608 49,046 4,174 1,366 1,286 3,346 231 958 9 30 51 6 462
Table 3.20a. Massachusetts admissions aged 12 and older, by primary substance of abuse and gender, age at admission, and race/ethnicity: Number, 2015
Gender, age at admission, and race/ethnicity
All admis-sions
aged 12 and older
Primary substance at admission
Alcohol Opiates Cocaine
Mari-juana/
hashish
Metham-phetamine/
amphet-amines
Tran-quil-izers
- - Quantity is zero.
SOURCE: Center for Behavioral Health Statistics and Quality, Substance Abuse and Mental Health Services Administration, Treatment Episode Data Set (TEDS). Data received through 11.01.16.
Seda-tives
Hallu-cino-gens PCP
Inhal-ants
Other/ none speci-fied
1 Admissions for which values were not collected, unknown, or missing are excluded from the sum total.
131

Alcohol only
Secondarydrug Heroin
Other opiates
Smoked cocaine
Other route
Total admissions aged 12 and older 91,164 20,894 8,694 49,400 4,244 1,383 1,313 3,456 239 969 10 31 51 6 474
GenderMale 69.4 69.3 71.3 69.9 61.9 57.5 66.7 77.6 78.2 51.0 40.0 80.6 80.4 66.7 66.7Female 30.6 30.7 28.7 30.1 38.1 42.5 33.3 22.4 21.8 49.0 60.0 19.4 19.6 33.3 33.3
Total 100.0 100.0 100.0 100.0 100.0 100.0 100.0 100.0 100.0 100.0 100.0 100.0 100.0 100.0 100.0No. of admissions 91,099 20,882 8,686 49,375 4,239 1,378 1,310 3,449 239 969 10 31 51 6 474
Age at admission12 to 19 years 3.3 1.2 3.3 1.8 3.6 2.5 4.4 32.8 4.2 6.7 - - 51.6 9.8 - - 15.820 to 24 years 13.5 7.3 10.8 16.3 14.9 6.1 11.0 20.3 8.4 11.1 - - 16.1 29.4 - - 15.425 to 29 years 21.7 11.3 16.5 27.5 24.5 11.8 20.8 17.2 16.7 20.5 - - 12.9 23.5 16.7 18.130 to 34 years 17.9 11.6 15.0 21.3 20.1 15.0 19.3 11.3 18.8 23.9 40.0 6.5 21.6 16.7 14.335 to 39 years 12.2 10.9 13.3 12.7 13.3 12.9 15.1 6.9 15.9 17.0 20.0 3.2 9.8 - - 10.840 to 44 years 8.9 11.3 11.4 7.9 7.4 14.2 8.9 3.8 12.1 8.8 - - 3.2 3.9 - - 7.445 to 49 years 8.6 14.0 12.4 6.0 6.3 18.2 9.7 3.2 7.1 5.9 10.0 3.2 - - 33.3 4.950 to 54 years 7.1 15.2 9.7 3.8 4.8 11.5 6.2 2.2 10.0 3.4 10.0 - - - - - - 7.055 to 59 years 4.3 10.5 5.2 1.8 3.4 5.6 3.6 1.3 4.2 1.2 - - - - 2.0 33.3 2.760 years and older 2.5 6.7 2.4 0.9 1.9 2.0 1.1 0.9 2.5 1.3 20.0 3.2 - - - - 3.6
Total 100.0 100.0 100.0 100.0 100.0 100.0 100.0 100.0 100.0 100.0 100.0 100.0 100.0 100.0 100.0No. of admissions 91,164 20,894 8,694 49,400 4,244 1,383 1,313 3,456 239 969 10 31 51 6 474
Race/ethnicityWhite (non-Hispanic) 77.3 78.8 75.3 78.4 84.6 57.9 65.2 54.7 84.4 90.4 88.9 90.0 31.4 83.3 83.8Black (non-Hispanic) 6.2 7.7 11.2 3.9 3.8 22.6 7.5 15.9 4.8 1.8 - - 3.3 7.8 - - 4.8Hispanic origin 10.8 7.9 8.2 12.0 6.8 11.0 19.1 20.6 6.1 4.8 11.1 3.3 52.9 - - 6.5American Indian/Alaska Native 0.4 0.4 0.3 0.4 0.4 0.7 0.9 0.4 0.9 0.2 - - 3.3 - - - - 0.9Asian/Pacific Islander 0.6 1.0 0.5 0.5 0.6 0.6 0.3 0.8 0.4 - - - - - - - - - - 0.4Other 4.6 4.1 4.3 4.7 3.9 7.2 7.1 7.5 3.5 2.8 - - - - 7.8 16.7 3.7
Total 100.0 100.0 100.0 100.0 100.0 100.0 100.0 100.0 100.0 100.0 100.0 100.0 100.0 100.0 100.0No. of admissions 90,206 20,633 8,608 49,046 4,174 1,366 1,286 3,346 231 958 9 30 51 6 462
NOTE: Percentages may not sum to 100 percent due to rounding. Percentages are based on all admissions with known and valid values. Admissions for which values were not collected, unknown, or missing are excluded from the percentage base (denominator).SOURCE: Center for Behavioral Health Statistics and Quality, Substance Abuse and Mental Health Services Administration, Treatment Episode Data Set (TEDS). Data received through 11.01.16.
Seda-tives
Hallu-cino-gens PCP
Inhal-ants
Other/ none speci-fied
- - Quantity is zero.
Table 3.20b. Massachusetts admissions aged 12 and older, by primary substance of abuse and gender, age at admission, and race/ethnicity: Percent distribution, 2015
Gender, age at admission, and race/ethnicity
All admis-sions
aged 12 and older
Primary substance at admission
Alcohol Opiates CocaineMari-juana/
hashish
Metham-phetamine/
amphet-amines
Tran-quil-izers
132

Alcohol only
Secondarydrug Heroin
Other opiates
Smoked cocaine
Other route
Total admissions aged 12 and older 55,180 11,188 8,253 16,634 7,626 2,843 829 5,957 936 511 167 26 1 29 180
GenderMale 33,685 7,668 5,627 9,660 3,553 1,641 513 4,145 438 216 82 22 - - 20 100Female 21,495 3,520 2,626 6,974 4,073 1,202 316 1,812 498 295 85 4 1 9 80
No. of admissions1 55,180 11,188 8,253 16,634 7,626 2,843 829 5,957 936 511 167 26 1 29 180
Age at admission12 to 19 years 2,597 162 269 200 123 8 22 1,597 51 46 26 14 - - 1 7820 to 24 years 6,002 693 746 1,918 858 72 59 1,373 162 72 20 6 1 6 1625 to 29 years 10,583 1,279 1,146 4,441 1,962 194 116 1,072 218 110 25 3 - - - - 1730 to 34 years 9,440 1,437 1,258 3,425 1,833 282 158 680 207 98 23 1 - - 14 2435 to 39 years 6,599 1,450 1,015 1,864 1,074 302 139 519 122 66 23 2 - - 8 1540 to 44 years 5,150 1,525 963 1,140 595 415 98 279 79 32 14 - - - - - - 1045 to 49 years 4,803 1,514 1,016 847 425 607 81 191 57 40 17 - - - - - - 850 to 54 years 4,788 1,657 1,057 935 350 514 81 131 20 26 12 - - - - - - 555 to 59 years 3,322 995 546 993 260 337 59 89 18 20 - - - - - - - - 560 years and older 1,896 476 237 871 146 112 16 26 2 1 7 - - - - - - 2
No. of admissions 55,180 11,188 8,253 16,634 7,626 2,843 829 5,957 936 511 167 26 1 29 180
Race/ethnicityWhite (non-Hispanic) 36,128 7,448 4,969 11,753 6,096 887 383 3,064 815 417 113 19 1 28 135Black (non-Hispanic) 10,846 2,112 2,033 2,438 405 1,538 312 1,914 31 24 14 1 - - - - 24Hispanic origin 1,375 323 188 290 184 42 34 266 20 10 4 1 - - - - 13American Indian/Alaska Native 560 131 85 73 171 13 8 61 7 7 1 1 - - - - 2Asian/Pacific Islander 319 58 46 130 35 10 3 30 5 1 1 - - - - - - - -Other 4,777 795 777 1,728 473 333 84 460 47 46 29 1 - - 1 3
No. of admissions 54,005 10,867 8,098 16,412 7,364 2,823 824 5,795 925 505 162 23 1 29 177
Table 3.21a. Michigan admissions aged 12 and older, by primary substance of abuse and gender, age at admission, and race/ethnicity: Number, 2015
Gender, age at admission, and race/ethnicity
All admis-sions
aged 12 and older
Primary substance at admission
Alcohol Opiates Cocaine
Mari-juana/
hashish
Metham-phetamine/
amphet-amines
Tran-quil-izers
Seda-tives
Hallu-cino-gens PCP
Inhal-ants
Other/ none speci-fied
- - Quantity is zero.
SOURCE: Center for Behavioral Health Statistics and Quality, Substance Abuse and Mental Health Services Administration, Treatment Episode Data Set (TEDS). Data received through 11.01.16.
1 Admissions for which values were not collected, unknown, or missing are excluded from the sum total.
133

Alcohol only
Secondarydrug Heroin
Other opiates
Smoked cocaine
Other route
Total admissions aged 12 and older 55,180 11,188 8,253 16,634 7,626 2,843 829 5,957 936 511 167 26 1 29 180
GenderMale 61.0 68.5 68.2 58.1 46.6 57.7 61.9 69.6 46.8 42.3 49.1 84.6 - - 69.0 55.6Female 39.0 31.5 31.8 41.9 53.4 42.3 38.1 30.4 53.2 57.7 50.9 15.4 100.0 31.0 44.4
Total 100.0 100.0 100.0 100.0 100.0 100.0 100.0 100.0 100.0 100.0 100.0 100.0 100.0 100.0 100.0No. of admissions 55,180 11,188 8,253 16,634 7,626 2,843 829 5,957 936 511 167 26 1 29 180
Age at admission12 to 19 years 4.7 1.4 3.3 1.2 1.6 0.3 2.7 26.8 5.4 9.0 15.6 53.8 - - 3.4 43.320 to 24 years 10.9 6.2 9.0 11.5 11.3 2.5 7.1 23.0 17.3 14.1 12.0 23.1 100.0 20.7 8.925 to 29 years 19.2 11.4 13.9 26.7 25.7 6.8 14.0 18.0 23.3 21.5 15.0 11.5 - - - - 9.430 to 34 years 17.1 12.8 15.2 20.6 24.0 9.9 19.1 11.4 22.1 19.2 13.8 3.8 - - 48.3 13.335 to 39 years 12.0 13.0 12.3 11.2 14.1 10.6 16.8 8.7 13.0 12.9 13.8 7.7 - - 27.6 8.340 to 44 years 9.3 13.6 11.7 6.9 7.8 14.6 11.8 4.7 8.4 6.3 8.4 - - - - - - 5.645 to 49 years 8.7 13.5 12.3 5.1 5.6 21.4 9.8 3.2 6.1 7.8 10.2 - - - - - - 4.450 to 54 years 8.7 14.8 12.8 5.6 4.6 18.1 9.8 2.2 2.1 5.1 7.2 - - - - - - 2.855 to 59 years 6.0 8.9 6.6 6.0 3.4 11.9 7.1 1.5 1.9 3.9 - - - - - - - - 2.860 years and older 3.4 4.3 2.9 5.2 1.9 3.9 1.9 0.4 0.2 0.2 4.2 - - - - - - 1.1
Total 100.0 100.0 100.0 100.0 100.0 100.0 100.0 100.0 100.0 100.0 100.0 100.0 100.0 100.0 100.0No. of admissions 55,180 11,188 8,253 16,634 7,626 2,843 829 5,957 936 511 167 26 1 29 180
Race/ethnicityWhite (non-Hispanic) 66.9 68.5 61.4 71.6 82.8 31.4 46.5 52.9 88.1 82.6 69.8 82.6 100.0 96.6 76.3Black (non-Hispanic) 20.1 19.4 25.1 14.9 5.5 54.5 37.9 33.0 3.4 4.8 8.6 4.3 - - - - 13.6Hispanic origin 2.5 3.0 2.3 1.8 2.5 1.5 4.1 4.6 2.2 2.0 2.5 4.3 - - - - 7.3American Indian/Alaska Native 1.0 1.2 1.0 0.4 2.3 0.5 1.0 1.1 0.8 1.4 0.6 4.3 - - - - 1.1Asian/Pacific Islander 0.6 0.5 0.6 0.8 0.5 0.4 0.4 0.5 0.5 0.2 0.6 - - - - - - - -Other 8.8 7.3 9.6 10.5 6.4 11.8 10.2 7.9 5.1 9.1 17.9 4.3 - - 3.4 1.7
Total 100.0 100.0 100.0 100.0 100.0 100.0 100.0 100.0 100.0 100.0 100.0 100.0 100.0 100.0 100.0No. of admissions 54,005 10,867 8,098 16,412 7,364 2,823 824 5,795 925 505 162 23 1 29 177
NOTE: Percentages may not sum to 100 percent due to rounding. Percentages are based on all admissions with known and valid values. Admissions for which values were not collected, unknown, or missing are excluded from the percentage base (denominator).SOURCE: Center for Behavioral Health Statistics and Quality, Substance Abuse and Mental Health Services Administration, Treatment Episode Data Set (TEDS). Data received through 11.01.16.
Seda-tives
Hallu-cino-gens PCP
Inhal-ants
Other/ none speci-fied
- - Quantity is zero.
Table 3.21b. Michigan admissions aged 12 and older, by primary substance of abuse and gender, age at admission, and race/ethnicity: Percent distribution, 2015
Gender, age at admission, and race/ethnicity
All admis-sions
aged 12 and older
Primary substance at admission
Alcohol Opiates CocaineMari-juana/
hashish
Metham-phetamine/
amphet-amines
Tran-quil-izers
134
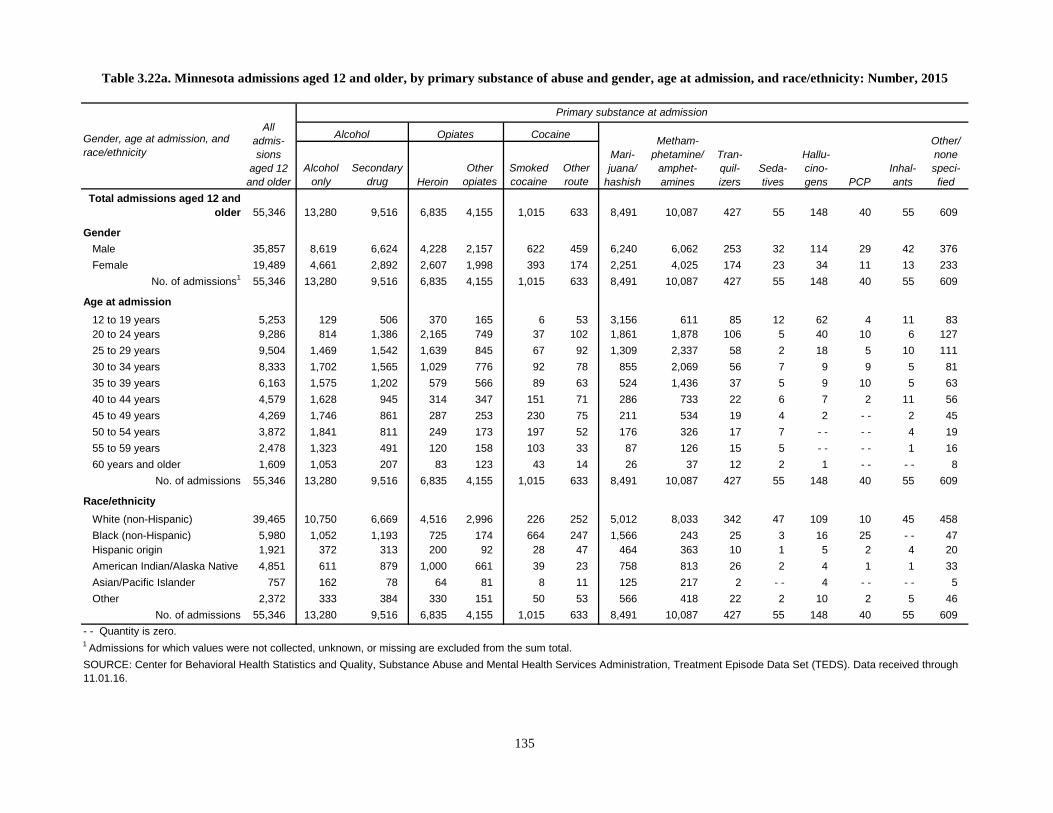
Alcohol only
Secondarydrug Heroin
Other opiates
Smoked cocaine
Other route
Total admissions aged 12 and older 55,346 13,280 9,516 6,835 4,155 1,015 633 8,491 10,087 427 55 148 40 55 609
GenderMale 35,857 8,619 6,624 4,228 2,157 622 459 6,240 6,062 253 32 114 29 42 376Female 19,489 4,661 2,892 2,607 1,998 393 174 2,251 4,025 174 23 34 11 13 233
No. of admissions1 55,346 13,280 9,516 6,835 4,155 1,015 633 8,491 10,087 427 55 148 40 55 609
Age at admission12 to 19 years 5,253 129 506 370 165 6 53 3,156 611 85 12 62 4 11 8320 to 24 years 9,286 814 1,386 2,165 749 37 102 1,861 1,878 106 5 40 10 6 12725 to 29 years 9,504 1,469 1,542 1,639 845 67 92 1,309 2,337 58 2 18 5 10 11130 to 34 years 8,333 1,702 1,565 1,029 776 92 78 855 2,069 56 7 9 9 5 8135 to 39 years 6,163 1,575 1,202 579 566 89 63 524 1,436 37 5 9 10 5 6340 to 44 years 4,579 1,628 945 314 347 151 71 286 733 22 6 7 2 11 5645 to 49 years 4,269 1,746 861 287 253 230 75 211 534 19 4 2 - - 2 4550 to 54 years 3,872 1,841 811 249 173 197 52 176 326 17 7 - - - - 4 1955 to 59 years 2,478 1,323 491 120 158 103 33 87 126 15 5 - - - - 1 1660 years and older 1,609 1,053 207 83 123 43 14 26 37 12 2 1 - - - - 8
No. of admissions 55,346 13,280 9,516 6,835 4,155 1,015 633 8,491 10,087 427 55 148 40 55 609
Race/ethnicityWhite (non-Hispanic) 39,465 10,750 6,669 4,516 2,996 226 252 5,012 8,033 342 47 109 10 45 458Black (non-Hispanic) 5,980 1,052 1,193 725 174 664 247 1,566 243 25 3 16 25 - - 47Hispanic origin 1,921 372 313 200 92 28 47 464 363 10 1 5 2 4 20American Indian/Alaska Native 4,851 611 879 1,000 661 39 23 758 813 26 2 4 1 1 33Asian/Pacific Islander 757 162 78 64 81 8 11 125 217 2 - - 4 - - - - 5Other 2,372 333 384 330 151 50 53 566 418 22 2 10 2 5 46
No. of admissions 55,346 13,280 9,516 6,835 4,155 1,015 633 8,491 10,087 427 55 148 40 55 609
Table 3.22a. Minnesota admissions aged 12 and older, by primary substance of abuse and gender, age at admission, and race/ethnicity: Number, 2015
Gender, age at admission, and race/ethnicity
All admis-sions
aged 12 and older
Primary substance at admission
Alcohol Opiates Cocaine
Mari-juana/
hashish
Metham-phetamine/
amphet-amines
Tran-quil-izers
- - Quantity is zero.
SOURCE: Center for Behavioral Health Statistics and Quality, Substance Abuse and Mental Health Services Administration, Treatment Episode Data Set (TEDS). Data received through 11.01.16.
Seda-tives
Hallu-cino-gens PCP
Inhal-ants
Other/ none speci-fied
1 Admissions for which values were not collected, unknown, or missing are excluded from the sum total.
135

Alcohol only
Secondarydrug Heroin
Other opiates
Smoked cocaine
Other route
Total admissions aged 12 and older 55,346 13,280 9,516 6,835 4,155 1,015 633 8,491 10,087 427 55 148 40 55 609
GenderMale 64.8 64.9 69.6 61.9 51.9 61.3 72.5 73.5 60.1 59.3 58.2 77.0 72.5 76.4 61.7Female 35.2 35.1 30.4 38.1 48.1 38.7 27.5 26.5 39.9 40.7 41.8 23.0 27.5 23.6 38.3
Total 100.0 100.0 100.0 100.0 100.0 100.0 100.0 100.0 100.0 100.0 100.0 100.0 100.0 100.0 100.0No. of admissions 55,346 13,280 9,516 6,835 4,155 1,015 633 8,491 10,087 427 55 148 40 55 609
Age at admission12 to 19 years 9.5 1.0 5.3 5.4 4.0 0.6 8.4 37.2 6.1 19.9 21.8 41.9 10.0 20.0 13.620 to 24 years 16.8 6.1 14.6 31.7 18.0 3.6 16.1 21.9 18.6 24.8 9.1 27.0 25.0 10.9 20.925 to 29 years 17.2 11.1 16.2 24.0 20.3 6.6 14.5 15.4 23.2 13.6 3.6 12.2 12.5 18.2 18.230 to 34 years 15.1 12.8 16.4 15.1 18.7 9.1 12.3 10.1 20.5 13.1 12.7 6.1 22.5 9.1 13.335 to 39 years 11.1 11.9 12.6 8.5 13.6 8.8 10.0 6.2 14.2 8.7 9.1 6.1 25.0 9.1 10.340 to 44 years 8.3 12.3 9.9 4.6 8.4 14.9 11.2 3.4 7.3 5.2 10.9 4.7 5.0 20.0 9.245 to 49 years 7.7 13.1 9.0 4.2 6.1 22.7 11.8 2.5 5.3 4.4 7.3 1.4 - - 3.6 7.450 to 54 years 7.0 13.9 8.5 3.6 4.2 19.4 8.2 2.1 3.2 4.0 12.7 - - - - 7.3 3.155 to 59 years 4.5 10.0 5.2 1.8 3.8 10.1 5.2 1.0 1.2 3.5 9.1 - - - - 1.8 2.660 years and older 2.9 7.9 2.2 1.2 3.0 4.2 2.2 0.3 0.4 2.8 3.6 0.7 - - - - 1.3
Total 100.0 100.0 100.0 100.0 100.0 100.0 100.0 100.0 100.0 100.0 100.0 100.0 100.0 100.0 100.0No. of admissions 55,346 13,280 9,516 6,835 4,155 1,015 633 8,491 10,087 427 55 148 40 55 609
Race/ethnicityWhite (non-Hispanic) 71.3 80.9 70.1 66.1 72.1 22.3 39.8 59.0 79.6 80.1 85.5 73.6 25.0 81.8 75.2Black (non-Hispanic) 10.8 7.9 12.5 10.6 4.2 65.4 39.0 18.4 2.4 5.9 5.5 10.8 62.5 - - 7.7Hispanic origin 3.5 2.8 3.3 2.9 2.2 2.8 7.4 5.5 3.6 2.3 1.8 3.4 5.0 7.3 3.3American Indian/Alaska Native 8.8 4.6 9.2 14.6 15.9 3.8 3.6 8.9 8.1 6.1 3.6 2.7 2.5 1.8 5.4Asian/Pacific Islander 1.4 1.2 0.8 0.9 1.9 0.8 1.7 1.5 2.2 0.5 - - 2.7 - - - - 0.8Other 4.3 2.5 4.0 4.8 3.6 4.9 8.4 6.7 4.1 5.2 3.6 6.8 5.0 9.1 7.6
Total 100.0 100.0 100.0 100.0 100.0 100.0 100.0 100.0 100.0 100.0 100.0 100.0 100.0 100.0 100.0No. of admissions 55,346 13,280 9,516 6,835 4,155 1,015 633 8,491 10,087 427 55 148 40 55 609
NOTE: Percentages may not sum to 100 percent due to rounding. Percentages are based on all admissions with known and valid values. Admissions for which values were not collected, unknown, or missing are excluded from the percentage base (denominator).SOURCE: Center for Behavioral Health Statistics and Quality, Substance Abuse and Mental Health Services Administration, Treatment Episode Data Set (TEDS). Data received through 11.01.16.
Seda-tives
Hallu-cino-gens PCP
Inhal-ants
Other/ none speci-fied
- - Quantity is zero.
Table 3.22b. Minnesota admissions aged 12 and older, by primary substance of abuse and gender, age at admission, and race/ethnicity: Percent distribution, 2015
Gender, age at admission, and race/ethnicity
All admis-sions
aged 12 and older
Primary substance at admission
Alcohol Opiates CocaineMari-juana/
hashish
Metham-phetamine/
amphet-amines
Tran-quil-izers
136

Alcohol only
Secondarydrug Heroin
Other opiates
Smoked cocaine
Other route
Total admissions aged 12 and older 4,823 803 700 181 559 305 183 1,154 782 91 10 9 6 4 36
GenderMale 3,076 590 527 104 277 169 114 805 404 47 3 8 5 4 19Female 1,747 213 173 77 282 136 69 349 378 44 7 1 1 - - 17
No. of admissions1 4,823 803 700 181 559 305 183 1,154 782 91 10 9 6 4 36
Age at admission12 to 19 years 339 16 23 3 7 3 4 229 39 7 - - 2 - - - - 620 to 24 years 641 42 64 37 80 9 27 237 115 16 1 2 1 1 925 to 29 years 877 75 103 56 146 36 38 210 181 20 2 3 1 2 430 to 34 years 859 106 131 34 127 25 33 188 179 22 4 1 2 - - 735 to 39 years 623 100 100 23 67 47 21 123 126 8 - - 1 2 1 440 to 44 years 425 88 68 11 49 43 20 69 66 8 1 - - - - - - 245 to 49 years 358 111 74 7 37 50 13 34 29 2 - - - - - - - - 150 to 54 years 347 126 54 5 20 60 12 31 34 3 1 - - - - - - 155 to 59 years 211 75 55 3 17 17 10 21 11 2 - - - - - - - - - -60 years and older 143 64 28 2 9 15 5 12 2 3 1 - - - - - - 2
No. of admissions 4,823 803 700 181 559 305 183 1,154 782 91 10 9 6 4 36
Race/ethnicityWhite (non-Hispanic) 3,092 485 389 165 509 84 73 518 740 82 10 8 1 4 24Black (non-Hispanic) 1,637 299 299 10 43 220 109 611 21 8 - - 1 5 - - 11Hispanic origin 36 10 5 1 4 - - 1 8 6 1 - - - - - - - - - -American Indian/Alaska Native 12 2 2 - - - - - - - - 4 4 - - - - - - - - - - - -Asian/Pacific Islander 7 1 - - - - 1 1 - - 3 - - - - - - - - - - - - 1Other 14 3 2 1 1 - - - - 4 3 - - - - - - - - - - - -
No. of admissions 4,798 800 697 177 558 305 183 1,148 774 91 10 9 6 4 36
Inhal-ants
1 Admissions for which values were not collected, unknown, or missing are excluded from the sum total.
Other/ none speci-fied
- - Quantity is zero.
SOURCE: Center for Behavioral Health Statistics and Quality, Substance Abuse and Mental Health Services Administration, Treatment Episode Data Set (TEDS). Data received through 11.01.16.
Table 3.23a. Mississippi admissions aged 12 and older, by primary substance of abuse and gender, age at admission, and race/ethnicity: Number, 2015
Gender, age at admission, and race/ethnicity
All admis-sions
aged 12 and older
Primary substance at admission
Alcohol Opiates Cocaine
Mari-juana/
hashish
Metham-phetamine/
amphet-amines
Tran-quil-izers
Seda-tives
Hallu-cino-gens PCP
137

Alcohol only
Secondarydrug Heroin
Other opiates
Smoked cocaine
Other route
Total admissions aged 12 and older 4,823 803 700 181 559 305 183 1,154 782 91 10 9 6 4 36
GenderMale 63.8 73.5 75.3 57.5 49.6 55.4 62.3 69.8 51.7 51.6 30.0 88.9 83.3 100.0 52.8Female 36.2 26.5 24.7 42.5 50.4 44.6 37.7 30.2 48.3 48.4 70.0 11.1 16.7 - - 47.2
Total 100.0 100.0 100.0 100.0 100.0 100.0 100.0 100.0 100.0 100.0 100.0 100.0 100.0 100.0 100.0No. of admissions 4,823 803 700 181 559 305 183 1,154 782 91 10 9 6 4 36
Age at admission12 to 19 years 7.0 2.0 3.3 1.7 1.3 1.0 2.2 19.8 5.0 7.7 - - 22.2 - - - - 16.720 to 24 years 13.3 5.2 9.1 20.4 14.3 3.0 14.8 20.5 14.7 17.6 10.0 22.2 16.7 25.0 25.025 to 29 years 18.2 9.3 14.7 30.9 26.1 11.8 20.8 18.2 23.1 22.0 20.0 33.3 16.7 50.0 11.130 to 34 years 17.8 13.2 18.7 18.8 22.7 8.2 18.0 16.3 22.9 24.2 40.0 11.1 33.3 - - 19.435 to 39 years 12.9 12.5 14.3 12.7 12.0 15.4 11.5 10.7 16.1 8.8 - - 11.1 33.3 25.0 11.140 to 44 years 8.8 11.0 9.7 6.1 8.8 14.1 10.9 6.0 8.4 8.8 10.0 - - - - - - 5.645 to 49 years 7.4 13.8 10.6 3.9 6.6 16.4 7.1 2.9 3.7 2.2 - - - - - - - - 2.850 to 54 years 7.2 15.7 7.7 2.8 3.6 19.7 6.6 2.7 4.3 3.3 10.0 - - - - - - 2.855 to 59 years 4.4 9.3 7.9 1.7 3.0 5.6 5.5 1.8 1.4 2.2 - - - - - - - - - -60 years and older 3.0 8.0 4.0 1.1 1.6 4.9 2.7 1.0 0.3 3.3 10.0 - - - - - - 5.6
Total 100.0 100.0 100.0 100.0 100.0 100.0 100.0 100.0 100.0 100.0 100.0 100.0 100.0 100.0 100.0No. of admissions 4,823 803 700 181 559 305 183 1,154 782 91 10 9 6 4 36
Race/ethnicityWhite (non-Hispanic) 64.4 60.6 55.8 93.2 91.2 27.5 39.9 45.1 95.6 90.1 100.0 88.9 16.7 100.0 66.7Black (non-Hispanic) 34.1 37.4 42.9 5.6 7.7 72.1 59.6 53.2 2.7 8.8 - - 11.1 83.3 - - 30.6Hispanic origin 0.8 1.3 0.7 0.6 0.7 - - 0.5 0.7 0.8 1.1 - - - - - - - - - -American Indian/Alaska Native 0.3 0.3 0.3 - - - - - - - - 0.3 0.5 - - - - - - - - - - - -Asian/Pacific Islander 0.1 0.1 - - - - 0.2 0.3 - - 0.3 - - - - - - - - - - - - 2.8Other 0.3 0.4 0.3 0.6 0.2 - - - - 0.3 0.4 - - - - - - - - - - - -
Total 100.0 100.0 100.0 100.0 100.0 100.0 100.0 100.0 100.0 100.0 100.0 100.0 100.0 100.0 100.0No. of admissions 4,798 800 697 177 558 305 183 1,148 774 91 10 9 6 4 36
NOTE: Percentages may not sum to 100 percent due to rounding. Percentages are based on all admissions with known and valid values. Admissions for which values were not collected, unknown, or missing are excluded from the percentage base (denominator).SOURCE: Center for Behavioral Health Statistics and Quality, Substance Abuse and Mental Health Services Administration, Treatment Episode Data Set (TEDS). Data received through 11.01.16.
Seda-tives
Hallu-cino-gens PCP
Inhal-ants
Other/ none speci-fied
- - Quantity is zero.
Table 3.23b. Mississippi admissions aged 12 and older, by primary substance of abuse and gender, age at admission, and race/ethnicity: Percent distribution, 2015
Gender, age at admission, and race/ethnicity
All admis-sions
aged 12 and older
Primary substance at admission
Alcohol Opiates CocaineMari-juana/
hashish
Metham-phetamine/
amphet-amines
Tran-quil-izers
138
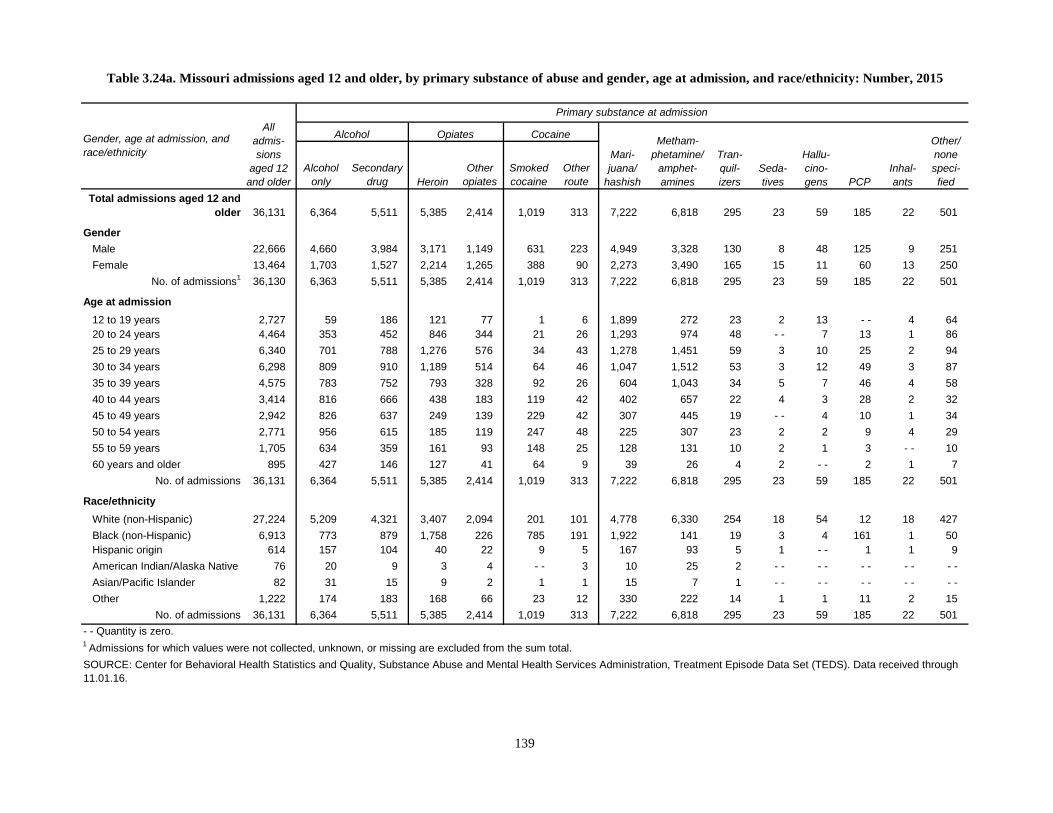
Alcohol only
Secondarydrug Heroin
Other opiates
Smoked cocaine
Other route
Total admissions aged 12 and older 36,131 6,364 5,511 5,385 2,414 1,019 313 7,222 6,818 295 23 59 185 22 501
GenderMale 22,666 4,660 3,984 3,171 1,149 631 223 4,949 3,328 130 8 48 125 9 251Female 13,464 1,703 1,527 2,214 1,265 388 90 2,273 3,490 165 15 11 60 13 250
No. of admissions1 36,130 6,363 5,511 5,385 2,414 1,019 313 7,222 6,818 295 23 59 185 22 501
Age at admission12 to 19 years 2,727 59 186 121 77 1 6 1,899 272 23 2 13 - - 4 6420 to 24 years 4,464 353 452 846 344 21 26 1,293 974 48 - - 7 13 1 8625 to 29 years 6,340 701 788 1,276 576 34 43 1,278 1,451 59 3 10 25 2 9430 to 34 years 6,298 809 910 1,189 514 64 46 1,047 1,512 53 3 12 49 3 8735 to 39 years 4,575 783 752 793 328 92 26 604 1,043 34 5 7 46 4 5840 to 44 years 3,414 816 666 438 183 119 42 402 657 22 4 3 28 2 3245 to 49 years 2,942 826 637 249 139 229 42 307 445 19 - - 4 10 1 3450 to 54 years 2,771 956 615 185 119 247 48 225 307 23 2 2 9 4 2955 to 59 years 1,705 634 359 161 93 148 25 128 131 10 2 1 3 - - 1060 years and older 895 427 146 127 41 64 9 39 26 4 2 - - 2 1 7
No. of admissions 36,131 6,364 5,511 5,385 2,414 1,019 313 7,222 6,818 295 23 59 185 22 501
Race/ethnicityWhite (non-Hispanic) 27,224 5,209 4,321 3,407 2,094 201 101 4,778 6,330 254 18 54 12 18 427Black (non-Hispanic) 6,913 773 879 1,758 226 785 191 1,922 141 19 3 4 161 1 50Hispanic origin 614 157 104 40 22 9 5 167 93 5 1 - - 1 1 9American Indian/Alaska Native 76 20 9 3 4 - - 3 10 25 2 - - - - - - - - - -Asian/Pacific Islander 82 31 15 9 2 1 1 15 7 1 - - - - - - - - - -Other 1,222 174 183 168 66 23 12 330 222 14 1 1 11 2 15
No. of admissions 36,131 6,364 5,511 5,385 2,414 1,019 313 7,222 6,818 295 23 59 185 22 501- - Quantity is zero.
SOURCE: Center for Behavioral Health Statistics and Quality, Substance Abuse and Mental Health Services Administration, Treatment Episode Data Set (TEDS). Data received through 11.01.16.
1 Admissions for which values were not collected, unknown, or missing are excluded from the sum total.
Table 3.24a. Missouri admissions aged 12 and older, by primary substance of abuse and gender, age at admission, and race/ethnicity: Number, 2015
Gender, age at admission, and race/ethnicity
All admis-sions
aged 12 and older
Primary substance at admission
Alcohol Opiates Cocaine
Mari-juana/
hashish
Metham-phetamine/
amphet-amines
Tran-quil-izers
Seda-tives
Hallu-cino-gens PCP
Inhal-ants
Other/ none speci-fied
139

Alcohol only
Secondarydrug Heroin
Other opiates
Smoked cocaine
Other route
Total admissions aged 12 and older 36,131 6,364 5,511 5,385 2,414 1,019 313 7,222 6,818 295 23 59 185 22 501
GenderMale 62.7 73.2 72.3 58.9 47.6 61.9 71.2 68.5 48.8 44.1 34.8 81.4 67.6 40.9 50.1Female 37.3 26.8 27.7 41.1 52.4 38.1 28.8 31.5 51.2 55.9 65.2 18.6 32.4 59.1 49.9
Total 100.0 100.0 100.0 100.0 100.0 100.0 100.0 100.0 100.0 100.0 100.0 100.0 100.0 100.0 100.0No. of admissions 36,130 6,363 5,511 5,385 2,414 1,019 313 7,222 6,818 295 23 59 185 22 501
Age at admission12 to 19 years 7.5 0.9 3.4 2.2 3.2 0.1 1.9 26.3 4.0 7.8 8.7 22.0 - - 18.2 12.820 to 24 years 12.4 5.5 8.2 15.7 14.3 2.1 8.3 17.9 14.3 16.3 - - 11.9 7.0 4.5 17.225 to 29 years 17.5 11.0 14.3 23.7 23.9 3.3 13.7 17.7 21.3 20.0 13.0 16.9 13.5 9.1 18.830 to 34 years 17.4 12.7 16.5 22.1 21.3 6.3 14.7 14.5 22.2 18.0 13.0 20.3 26.5 13.6 17.435 to 39 years 12.7 12.3 13.6 14.7 13.6 9.0 8.3 8.4 15.3 11.5 21.7 11.9 24.9 18.2 11.640 to 44 years 9.4 12.8 12.1 8.1 7.6 11.7 13.4 5.6 9.6 7.5 17.4 5.1 15.1 9.1 6.445 to 49 years 8.1 13.0 11.6 4.6 5.8 22.5 13.4 4.3 6.5 6.4 - - 6.8 5.4 4.5 6.850 to 54 years 7.7 15.0 11.2 3.4 4.9 24.2 15.3 3.1 4.5 7.8 8.7 3.4 4.9 18.2 5.855 to 59 years 4.7 10.0 6.5 3.0 3.9 14.5 8.0 1.8 1.9 3.4 8.7 1.7 1.6 - - 2.060 years and older 2.5 6.7 2.6 2.4 1.7 6.3 2.9 0.5 0.4 1.4 8.7 - - 1.1 4.5 1.4
Total 100.0 100.0 100.0 100.0 100.0 100.0 100.0 100.0 100.0 100.0 100.0 100.0 100.0 100.0 100.0No. of admissions 36,131 6,364 5,511 5,385 2,414 1,019 313 7,222 6,818 295 23 59 185 22 501
Race/ethnicityWhite (non-Hispanic) 75.3 81.9 78.4 63.3 86.7 19.7 32.3 66.2 92.8 86.1 78.3 91.5 6.5 81.8 85.2Black (non-Hispanic) 19.1 12.1 15.9 32.6 9.4 77.0 61.0 26.6 2.1 6.4 13.0 6.8 87.0 4.5 10.0Hispanic origin 1.7 2.5 1.9 0.7 0.9 0.9 1.6 2.3 1.4 1.7 4.3 - - 0.5 4.5 1.8American Indian/Alaska Native 0.2 0.3 0.2 0.1 0.2 - - 1.0 0.1 0.4 0.7 - - - - - - - - - -Asian/Pacific Islander 0.2 0.5 0.3 0.2 0.1 0.1 0.3 0.2 0.1 0.3 - - - - - - - - - -Other 3.4 2.7 3.3 3.1 2.7 2.3 3.8 4.6 3.3 4.7 4.3 1.7 5.9 9.1 3.0
Total 100.0 100.0 100.0 100.0 100.0 100.0 100.0 100.0 100.0 100.0 100.0 100.0 100.0 100.0 100.0No. of admissions 36,131 6,364 5,511 5,385 2,414 1,019 313 7,222 6,818 295 23 59 185 22 501
NOTE: Percentages may not sum to 100 percent due to rounding. Percentages are based on all admissions with known and valid values. Admissions for which values were not collected, unknown, or missing are excluded from the percentage base (denominator).SOURCE: Center for Behavioral Health Statistics and Quality, Substance Abuse and Mental Health Services Administration, Treatment Episode Data Set (TEDS). Data received through 11.01.16.
Seda-tives
Hallu-cino-gens PCP
Inhal-ants
Other/ none speci-fied
- - Quantity is zero.
Table 3.24b. Missouri admissions aged 12 and older, by primary substance of abuse and gender, age at admission, and race/ethnicity: Percent distribution, 2015
Gender, age at admission, and race/ethnicity
All admis-sions
aged 12 and older
Primary substance at admission
Alcohol Opiates CocaineMari-juana/
hashish
Metham-phetamine/
amphet-amines
Tran-quil-izers
140

Alcohol only
Secondarydrug Heroin
Other opiates
Smoked cocaine
Other route
Total admissions aged 12 and older 5,908 1,552 1,464 136 502 9 18 1,011 1,133 21 3 7 - - 30 22
GenderMale 3,747 1,091 1,015 78 238 8 11 715 547 12 - - 5 - - 16 11Female 2,161 461 449 58 264 1 7 296 586 9 3 2 - - 14 11
No. of admissions1 5,908 1,552 1,464 136 502 9 18 1,011 1,133 21 3 7 - - 30 22
Age at admission12 to 19 years 680 29 88 10 17 - - 3 424 88 4 - - 5 - - 6 620 to 24 years 774 146 150 36 67 - - 2 178 179 5 - - 1 - - 4 625 to 29 years 1,021 209 278 38 141 1 - - 117 224 3 3 1 - - 4 230 to 34 years 980 179 273 26 114 - - 3 126 247 1 - - - - - - 3 835 to 39 years 670 191 179 12 61 - - - - 61 160 3 - - - - - - 3 - -40 to 44 years 502 175 156 3 32 - - 3 34 95 - - - - - - - - 4 - -45 to 49 years 440 184 121 6 22 3 5 28 67 2 - - - - - - 2 - -50 to 54 years 405 184 120 2 20 3 1 24 47 - - - - - - - - 4 - -55 to 59 years 257 137 61 1 19 2 1 14 21 1 - - - - - - - - - -60 years and older 179 118 38 2 9 - - - - 5 5 2 - - - - - - - - - -
No. of admissions 5,908 1,552 1,464 136 502 9 18 1,011 1,133 21 3 7 - - 30 22
Race/ethnicityWhite (non-Hispanic) 4,144 1,162 975 102 332 7 12 738 756 18 2 5 - - 20 15Black (non-Hispanic) 42 9 7 - - 2 2 2 17 2 1 - - - - - - - - - -Hispanic origin 237 46 45 11 26 - - 1 51 53 1 - - - - - - 2 1American Indian/Alaska Native 1,313 298 398 14 123 - - 3 179 280 1 1 2 - - 8 6Asian/Pacific Islander 15 4 1 1 4 - - - - 2 3 - - - - - - - - - - - -Other 157 33 38 8 15 - - - - 24 39 - - - - - - - - - - - -
No. of admissions 5,908 1,552 1,464 136 502 9 18 1,011 1,133 21 3 7 - - 30 22- - Quantity is zero.
SOURCE: Center for Behavioral Health Statistics and Quality, Substance Abuse and Mental Health Services Administration, Treatment Episode Data Set (TEDS). Data received through 11.01.16.
Seda-tives
Hallu-cino-gens PCP
Inhal-ants
Other/ none speci-fied
1 Admissions for which values were not collected, unknown, or missing are excluded from the sum total.
Table 3.25a. Montana admissions aged 12 and older, by primary substance of abuse and gender, age at admission, and race/ethnicity: Number, 2015
Gender, age at admission, and race/ethnicity
All admis-sions
aged 12 and older
Primary substance at admission
Alcohol Opiates Cocaine
Mari-juana/
hashish
Metham-phetamine/
amphet-amines
Tran-quil-izers
141
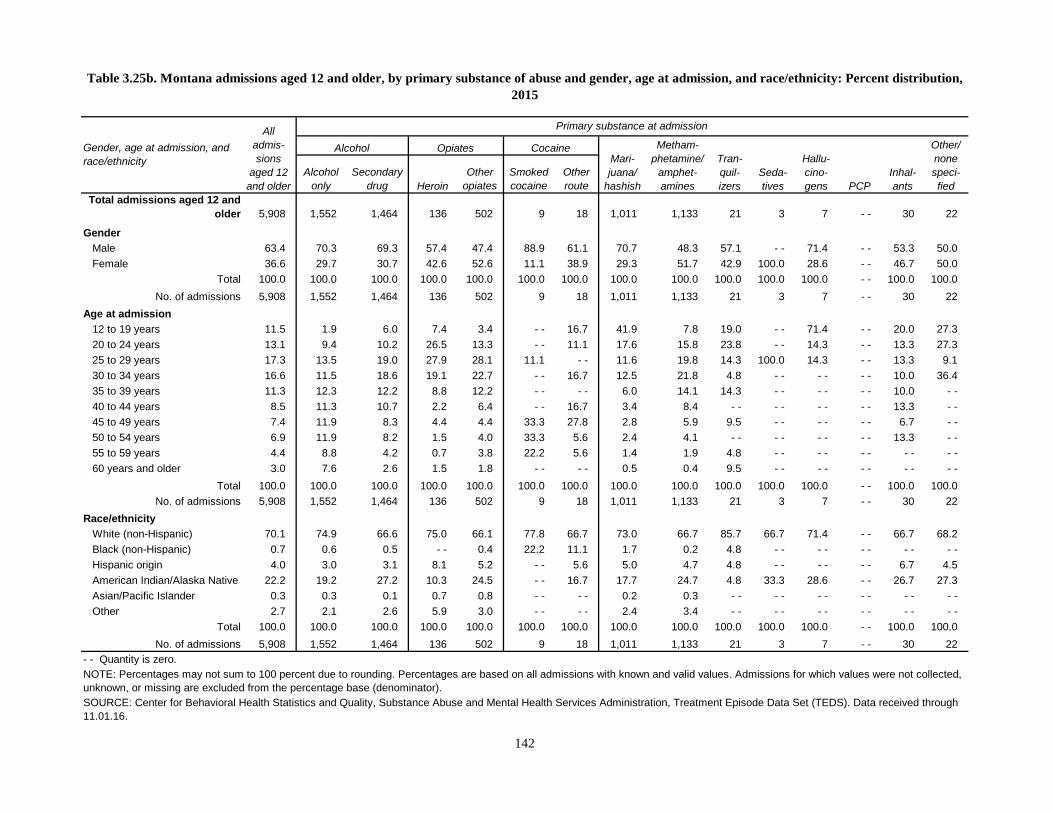
Alcohol only
Secondarydrug Heroin
Other opiates
Smoked cocaine
Other route
Total admissions aged 12 and older 5,908 1,552 1,464 136 502 9 18 1,011 1,133 21 3 7 - - 30 22
GenderMale 63.4 70.3 69.3 57.4 47.4 88.9 61.1 70.7 48.3 57.1 - - 71.4 - - 53.3 50.0Female 36.6 29.7 30.7 42.6 52.6 11.1 38.9 29.3 51.7 42.9 100.0 28.6 - - 46.7 50.0
Total 100.0 100.0 100.0 100.0 100.0 100.0 100.0 100.0 100.0 100.0 100.0 100.0 - - 100.0 100.0No. of admissions 5,908 1,552 1,464 136 502 9 18 1,011 1,133 21 3 7 - - 30 22
Age at admission12 to 19 years 11.5 1.9 6.0 7.4 3.4 - - 16.7 41.9 7.8 19.0 - - 71.4 - - 20.0 27.320 to 24 years 13.1 9.4 10.2 26.5 13.3 - - 11.1 17.6 15.8 23.8 - - 14.3 - - 13.3 27.325 to 29 years 17.3 13.5 19.0 27.9 28.1 11.1 - - 11.6 19.8 14.3 100.0 14.3 - - 13.3 9.130 to 34 years 16.6 11.5 18.6 19.1 22.7 - - 16.7 12.5 21.8 4.8 - - - - - - 10.0 36.435 to 39 years 11.3 12.3 12.2 8.8 12.2 - - - - 6.0 14.1 14.3 - - - - - - 10.0 - -40 to 44 years 8.5 11.3 10.7 2.2 6.4 - - 16.7 3.4 8.4 - - - - - - - - 13.3 - -45 to 49 years 7.4 11.9 8.3 4.4 4.4 33.3 27.8 2.8 5.9 9.5 - - - - - - 6.7 - -50 to 54 years 6.9 11.9 8.2 1.5 4.0 33.3 5.6 2.4 4.1 - - - - - - - - 13.3 - -55 to 59 years 4.4 8.8 4.2 0.7 3.8 22.2 5.6 1.4 1.9 4.8 - - - - - - - - - -60 years and older 3.0 7.6 2.6 1.5 1.8 - - - - 0.5 0.4 9.5 - - - - - - - - - -
Total 100.0 100.0 100.0 100.0 100.0 100.0 100.0 100.0 100.0 100.0 100.0 100.0 - - 100.0 100.0No. of admissions 5,908 1,552 1,464 136 502 9 18 1,011 1,133 21 3 7 - - 30 22
Race/ethnicityWhite (non-Hispanic) 70.1 74.9 66.6 75.0 66.1 77.8 66.7 73.0 66.7 85.7 66.7 71.4 - - 66.7 68.2Black (non-Hispanic) 0.7 0.6 0.5 - - 0.4 22.2 11.1 1.7 0.2 4.8 - - - - - - - - - -Hispanic origin 4.0 3.0 3.1 8.1 5.2 - - 5.6 5.0 4.7 4.8 - - - - - - 6.7 4.5American Indian/Alaska Native 22.2 19.2 27.2 10.3 24.5 - - 16.7 17.7 24.7 4.8 33.3 28.6 - - 26.7 27.3Asian/Pacific Islander 0.3 0.3 0.1 0.7 0.8 - - - - 0.2 0.3 - - - - - - - - - - - -Other 2.7 2.1 2.6 5.9 3.0 - - - - 2.4 3.4 - - - - - - - - - - - -
Total 100.0 100.0 100.0 100.0 100.0 100.0 100.0 100.0 100.0 100.0 100.0 100.0 - - 100.0 100.0No. of admissions 5,908 1,552 1,464 136 502 9 18 1,011 1,133 21 3 7 - - 30 22
NOTE: Percentages may not sum to 100 percent due to rounding. Percentages are based on all admissions with known and valid values. Admissions for which values were not collected, unknown, or missing are excluded from the percentage base (denominator).SOURCE: Center for Behavioral Health Statistics and Quality, Substance Abuse and Mental Health Services Administration, Treatment Episode Data Set (TEDS). Data received through 11.01.16.
Seda-tives
Hallu-cino-gens PCP
Inhal-ants
Other/ none speci-fied
- - Quantity is zero.
Table 3.25b. Montana admissions aged 12 and older, by primary substance of abuse and gender, age at admission, and race/ethnicity: Percent distribution, 2015
Gender, age at admission, and race/ethnicity
All admis-sions
aged 12 and older
Primary substance at admission
Alcohol Opiates CocaineMari-juana/
hashish
Metham-phetamine/
amphet-amines
Tran-quil-izers
142

Alcohol only
Secondarydrug Heroin
Other opiates
Smoked cocaine
Other route
Total admissions aged 12 and older 16,463 7,687 2,727 137 651 105 87 1,628 2,668 58 5 24 12 10 664
GenderMale 11,497 5,960 1,984 83 366 45 53 1,132 1,418 29 3 22 1 5 396Female 4,962 1,727 742 54 284 60 34 496 1,249 29 2 2 11 5 267
No. of admissions1 16,459 7,687 2,726 137 650 105 87 1,628 2,667 58 5 24 12 10 663
Age at admission12 to 19 years 693 310 59 1 4 1 3 206 69 3 - - 4 - - 3 3020 to 24 years 2,542 1,058 393 23 135 3 13 438 363 15 1 11 5 1 8325 to 29 years 2,723 960 461 42 157 2 15 347 600 9 - - - - 5 3 12230 to 34 years 2,517 909 479 20 135 13 8 247 571 12 1 3 1 3 11535 to 39 years 1,760 683 292 18 69 9 13 172 419 3 - - - - - - - - 8240 to 44 years 1,715 868 363 8 41 19 13 61 265 5 1 3 - - - - 6845 to 49 years 1,575 925 273 7 35 18 6 55 187 4 1 1 - - - - 6350 to 54 years 1,497 910 272 6 28 24 11 52 126 4 - - 2 1 - - 6155 to 59 years 868 608 102 4 25 14 4 37 50 2 - - - - - - - - 2260 years and older 573 456 33 8 22 2 1 13 18 1 1 - - - - - - 18
No. of admissions 16,463 7,687 2,727 137 651 105 87 1,628 2,668 58 5 24 12 10 664
Race/ethnicityWhite (non-Hispanic) 12,227 5,516 2,025 101 555 40 54 1,147 2,214 50 4 9 - - 10 502Black (non-Hispanic) 1,607 873 221 12 36 55 24 188 96 3 - - 13 9 - - 77Hispanic origin 925 292 171 15 42 2 3 169 178 2 - - 2 1 - - 48American Indian/Alaska Native 920 546 224 6 8 5 2 39 79 - - 1 - - 2 - - 8Asian/Pacific Islander 151 76 15 - - 3 - - 1 24 17 - - - - - - - - - - 15Other 585 375 65 3 4 2 3 53 67 1 - - - - - - - - 12
No. of admissions 16,415 7,678 2,721 137 648 104 87 1,620 2,651 56 5 24 12 10 662
Table 3.26a. Nebraska admissions aged 12 and older, by primary substance of abuse and gender, age at admission, and race/ethnicity: Number, 2015
Gender, age at admission, and race/ethnicity
All admis-sions
aged 12 and older
Primary substance at admission
Alcohol Opiates Cocaine
Mari-juana/
hashish
Metham-phetamine/
amphet-amines
Tran-quil-izers
Seda-tives
Hallu-cino-gens PCP
Inhal-ants
Other/ none speci-fied
- - Quantity is zero.
SOURCE: Center for Behavioral Health Statistics and Quality, Substance Abuse and Mental Health Services Administration, Treatment Episode Data Set (TEDS). Data received through 11.01.16.
1 Admissions for which values were not collected, unknown, or missing are excluded from the sum total.
143

Alcohol only
Secondarydrug Heroin
Other opiates
Smoked cocaine
Other route
Total admissions aged 12 and older 16,463 7,687 2,727 137 651 105 87 1,628 2,668 58 5 24 12 10 664
GenderMale 69.9 77.5 72.8 60.6 56.3 42.9 60.9 69.5 53.2 50.0 60.0 91.7 8.3 50.0 59.7Female 30.1 22.5 27.2 39.4 43.7 57.1 39.1 30.5 46.8 50.0 40.0 8.3 91.7 50.0 40.3
Total 100.0 100.0 100.0 100.0 100.0 100.0 100.0 100.0 100.0 100.0 100.0 100.0 100.0 100.0 100.0No. of admissions 16,459 7,687 2,726 137 650 105 87 1,628 2,667 58 5 24 12 10 663
Age at admission12 to 19 years 4.2 4.0 2.2 0.7 0.6 1.0 3.4 12.7 2.6 5.2 - - 16.7 - - 30.0 4.520 to 24 years 15.4 13.8 14.4 16.8 20.7 2.9 14.9 26.9 13.6 25.9 20.0 45.8 41.7 10.0 12.525 to 29 years 16.5 12.5 16.9 30.7 24.1 1.9 17.2 21.3 22.5 15.5 - - - - 41.7 30.0 18.430 to 34 years 15.3 11.8 17.6 14.6 20.7 12.4 9.2 15.2 21.4 20.7 20.0 12.5 8.3 30.0 17.335 to 39 years 10.7 8.9 10.7 13.1 10.6 8.6 14.9 10.6 15.7 5.2 - - - - - - - - 12.340 to 44 years 10.4 11.3 13.3 5.8 6.3 18.1 14.9 3.7 9.9 8.6 20.0 12.5 - - - - 10.245 to 49 years 9.6 12.0 10.0 5.1 5.4 17.1 6.9 3.4 7.0 6.9 20.0 4.2 - - - - 9.550 to 54 years 9.1 11.8 10.0 4.4 4.3 22.9 12.6 3.2 4.7 6.9 - - 8.3 8.3 - - 9.255 to 59 years 5.3 7.9 3.7 2.9 3.8 13.3 4.6 2.3 1.9 3.4 - - - - - - - - 3.360 years and older 3.5 5.9 1.2 5.8 3.4 1.9 1.1 0.8 0.7 1.7 20.0 - - - - - - 2.7
Total 100.0 100.0 100.0 100.0 100.0 100.0 100.0 100.0 100.0 100.0 100.0 100.0 100.0 100.0 100.0No. of admissions 16,463 7,687 2,727 137 651 105 87 1,628 2,668 58 5 24 12 10 664
Race/ethnicityWhite (non-Hispanic) 74.5 71.8 74.4 73.7 85.6 38.5 62.1 70.8 83.5 89.3 80.0 37.5 - - 100.0 75.8Black (non-Hispanic) 9.8 11.4 8.1 8.8 5.6 52.9 27.6 11.6 3.6 5.4 - - 54.2 75.0 - - 11.6Hispanic origin 5.6 3.8 6.3 10.9 6.5 1.9 3.4 10.4 6.7 3.6 - - 8.3 8.3 - - 7.3American Indian/Alaska Native 5.6 7.1 8.2 4.4 1.2 4.8 2.3 2.4 3.0 - - 20.0 - - 16.7 - - 1.2Asian/Pacific Islander 0.9 1.0 0.6 - - 0.5 - - 1.1 1.5 0.6 - - - - - - - - - - 2.3Other 3.6 4.9 2.4 2.2 0.6 1.9 3.4 3.3 2.5 1.8 - - - - - - - - 1.8
Total 100.0 100.0 100.0 100.0 100.0 100.0 100.0 100.0 100.0 100.0 100.0 100.0 100.0 100.0 100.0No. of admissions 16,415 7,678 2,721 137 648 104 87 1,620 2,651 56 5 24 12 10 662
NOTE: Percentages may not sum to 100 percent due to rounding. Percentages are based on all admissions with known and valid values. Admissions for which values were not collected, unknown, or missing are excluded from the percentage base (denominator).SOURCE: Center for Behavioral Health Statistics and Quality, Substance Abuse and Mental Health Services Administration, Treatment Episode Data Set (TEDS). Data received through 11.01.16.
Seda-tives
Hallu-cino-gens PCP
Inhal-ants
Other/ none speci-fied
- - Quantity is zero.
Table 3.26b. Nebraska admissions aged 12 and older, by primary substance of abuse and gender, age at admission, and race/ethnicity: Percent distribution, 2015
Gender, age at admission, and race/ethnicity
All admis-sions
aged 12 and older
Primary substance at admission
Alcohol Opiates CocaineMari-juana/
hashish
Metham-phetamine/
amphet-amines
Tran-quil-izers
144

Alcohol only
Secondarydrug Heroin
Other opiates
Smoked cocaine
Other route
Total admissions aged 12 and older 6,630 1,557 729 901 270 112 58 766 2,003 36 11 8 14 1 164
GenderMale 4,067 1,039 464 515 140 77 48 553 1,085 23 5 8 12 - - 98Female 2,563 518 265 386 130 35 10 213 918 13 6 - - 2 1 66
No. of admissions1 6,630 1,557 729 901 270 112 58 766 2,003 36 11 8 14 1 164
Age at admission12 to 19 years 478 37 50 31 9 - - 3 245 66 6 3 1 - - 1 2620 to 24 years 930 78 72 273 47 2 5 156 273 4 2 1 1 - - 1625 to 29 years 1,238 215 101 269 58 3 13 130 414 5 1 - - 2 - - 2730 to 34 years 1,057 180 138 141 60 4 5 72 419 7 2 3 6 - - 2035 to 39 years 766 169 97 77 29 7 8 69 284 2 - - 1 1 - - 2240 to 44 years 564 185 65 26 16 13 9 41 185 4 1 2 4 - - 1345 to 49 years 575 199 87 22 15 26 5 21 185 1 - - - - - - - - 1450 to 54 years 506 208 71 29 18 30 6 22 110 1 1 - - - - - - 1055 to 59 years 310 159 29 22 13 16 3 4 54 3 1 - - - - - - 660 years and older 206 127 19 11 5 11 1 6 13 3 - - - - - - - - 10
No. of admissions 6,630 1,557 729 901 270 112 58 766 2,003 36 11 8 14 1 164
Race/ethnicityWhite (non-Hispanic) 4,204 1,109 438 693 204 21 20 299 1,296 26 5 2 - - 1 90Black (non-Hispanic) 738 117 97 28 12 79 23 203 136 1 1 6 11 - - 24Hispanic origin 1,026 214 102 99 35 5 7 169 346 7 5 - - 3 - - 34American Indian/Alaska Native 158 45 38 11 4 1 - - 18 35 - - - - - - - - - - 6Asian/Pacific Islander 109 14 6 15 1 1 1 11 53 1 - - - - - - - - 6Other 342 37 43 50 13 5 7 60 122 1 - - - - - - - - 4
No. of admissions 6,577 1,536 724 896 269 112 58 760 1,988 36 11 8 14 1 164
Table 3.27a. Nevada admissions aged 12 and older, by primary substance of abuse and gender, age at admission, and race/ethnicity: Number, 2015
Gender, age at admission, and race/ethnicity
All admis-sions
aged 12 and older
Primary substance at admission
Alcohol Opiates Cocaine
Mari-juana/
hashish
Metham-phetamine/
amphet-amines
Tran-quil-izers
Seda-tives
Hallu-cino-gens PCP
Inhal-ants
Other/ none speci-fied
- - Quantity is zero.
SOURCE: Center for Behavioral Health Statistics and Quality, Substance Abuse and Mental Health Services Administration, Treatment Episode Data Set (TEDS). Data received through 11.01.16.
1 Admissions for which values were not collected, unknown, or missing are excluded from the sum total.
145
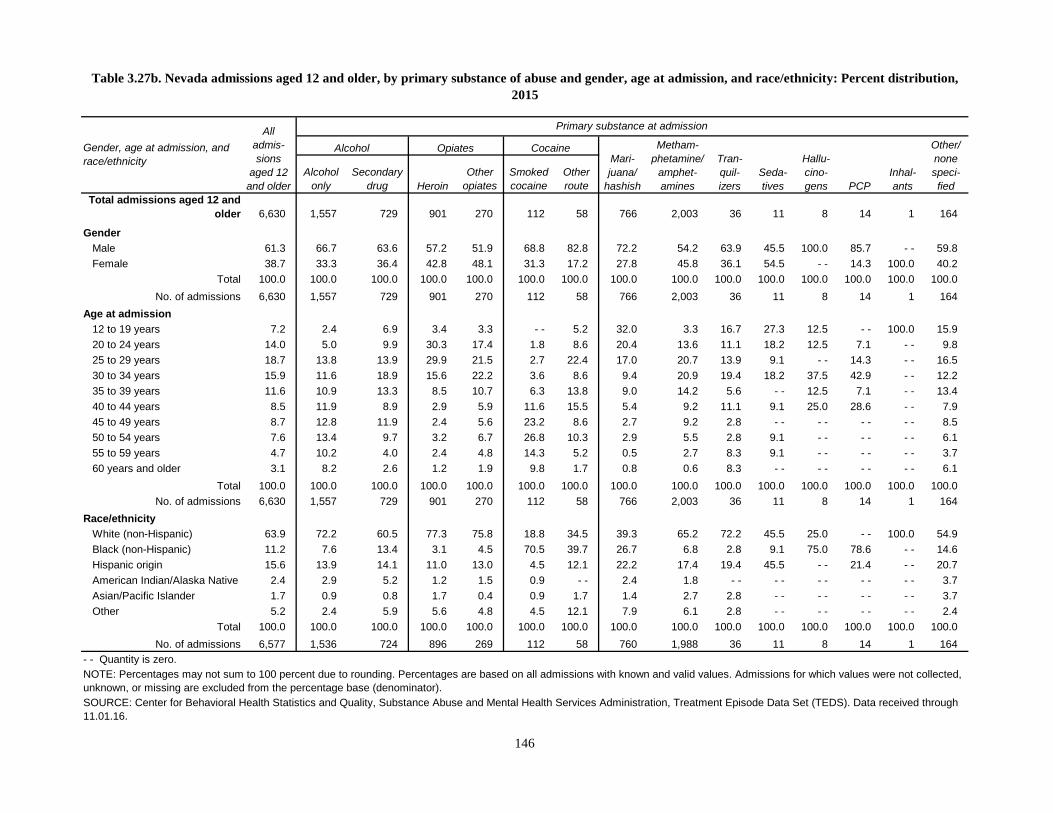
Alcohol only
Secondarydrug Heroin
Other opiates
Smoked cocaine
Other route
Total admissions aged 12 and older 6,630 1,557 729 901 270 112 58 766 2,003 36 11 8 14 1 164
GenderMale 61.3 66.7 63.6 57.2 51.9 68.8 82.8 72.2 54.2 63.9 45.5 100.0 85.7 - - 59.8Female 38.7 33.3 36.4 42.8 48.1 31.3 17.2 27.8 45.8 36.1 54.5 - - 14.3 100.0 40.2
Total 100.0 100.0 100.0 100.0 100.0 100.0 100.0 100.0 100.0 100.0 100.0 100.0 100.0 100.0 100.0No. of admissions 6,630 1,557 729 901 270 112 58 766 2,003 36 11 8 14 1 164
Age at admission12 to 19 years 7.2 2.4 6.9 3.4 3.3 - - 5.2 32.0 3.3 16.7 27.3 12.5 - - 100.0 15.920 to 24 years 14.0 5.0 9.9 30.3 17.4 1.8 8.6 20.4 13.6 11.1 18.2 12.5 7.1 - - 9.825 to 29 years 18.7 13.8 13.9 29.9 21.5 2.7 22.4 17.0 20.7 13.9 9.1 - - 14.3 - - 16.530 to 34 years 15.9 11.6 18.9 15.6 22.2 3.6 8.6 9.4 20.9 19.4 18.2 37.5 42.9 - - 12.235 to 39 years 11.6 10.9 13.3 8.5 10.7 6.3 13.8 9.0 14.2 5.6 - - 12.5 7.1 - - 13.440 to 44 years 8.5 11.9 8.9 2.9 5.9 11.6 15.5 5.4 9.2 11.1 9.1 25.0 28.6 - - 7.945 to 49 years 8.7 12.8 11.9 2.4 5.6 23.2 8.6 2.7 9.2 2.8 - - - - - - - - 8.550 to 54 years 7.6 13.4 9.7 3.2 6.7 26.8 10.3 2.9 5.5 2.8 9.1 - - - - - - 6.155 to 59 years 4.7 10.2 4.0 2.4 4.8 14.3 5.2 0.5 2.7 8.3 9.1 - - - - - - 3.760 years and older 3.1 8.2 2.6 1.2 1.9 9.8 1.7 0.8 0.6 8.3 - - - - - - - - 6.1
Total 100.0 100.0 100.0 100.0 100.0 100.0 100.0 100.0 100.0 100.0 100.0 100.0 100.0 100.0 100.0No. of admissions 6,630 1,557 729 901 270 112 58 766 2,003 36 11 8 14 1 164
Race/ethnicityWhite (non-Hispanic) 63.9 72.2 60.5 77.3 75.8 18.8 34.5 39.3 65.2 72.2 45.5 25.0 - - 100.0 54.9Black (non-Hispanic) 11.2 7.6 13.4 3.1 4.5 70.5 39.7 26.7 6.8 2.8 9.1 75.0 78.6 - - 14.6Hispanic origin 15.6 13.9 14.1 11.0 13.0 4.5 12.1 22.2 17.4 19.4 45.5 - - 21.4 - - 20.7American Indian/Alaska Native 2.4 2.9 5.2 1.2 1.5 0.9 - - 2.4 1.8 - - - - - - - - - - 3.7Asian/Pacific Islander 1.7 0.9 0.8 1.7 0.4 0.9 1.7 1.4 2.7 2.8 - - - - - - - - 3.7Other 5.2 2.4 5.9 5.6 4.8 4.5 12.1 7.9 6.1 2.8 - - - - - - - - 2.4
Total 100.0 100.0 100.0 100.0 100.0 100.0 100.0 100.0 100.0 100.0 100.0 100.0 100.0 100.0 100.0No. of admissions 6,577 1,536 724 896 269 112 58 760 1,988 36 11 8 14 1 164
NOTE: Percentages may not sum to 100 percent due to rounding. Percentages are based on all admissions with known and valid values. Admissions for which values were not collected, unknown, or missing are excluded from the percentage base (denominator).SOURCE: Center for Behavioral Health Statistics and Quality, Substance Abuse and Mental Health Services Administration, Treatment Episode Data Set (TEDS). Data received through 11.01.16.
Seda-tives
Hallu-cino-gens PCP
Inhal-ants
Other/ none speci-fied
- - Quantity is zero.
Table 3.27b. Nevada admissions aged 12 and older, by primary substance of abuse and gender, age at admission, and race/ethnicity: Percent distribution, 2015
Gender, age at admission, and race/ethnicity
All admis-sions
aged 12 and older
Primary substance at admission
Alcohol Opiates CocaineMari-juana/
hashish
Metham-phetamine/
amphet-amines
Tran-quil-izers
146

Alcohol only
Secondarydrug Heroin
Other opiates
Smoked cocaine
Other route
Total admissions aged 12 and older 3,580 630 346 1,681 352 84 67 232 89 10 2 3 - - 4 80
GenderMale 2,057 412 230 878 178 36 46 167 57 4 1 2 - - 1 45Female 1,523 218 116 803 174 48 21 65 32 6 1 1 - - 3 35
No. of admissions1 3,580 630 346 1,681 352 84 67 232 89 10 2 3 - - 4 80
Age at admission12 to 19 years 303 12 21 61 4 1 1 128 6 1 - - 1 - - - - 6720 to 24 years 657 45 41 427 72 6 5 38 14 - - 1 - - - - 1 725 to 29 years 847 71 54 554 87 12 13 24 27 1 - - 1 - - 1 230 to 34 years 637 70 57 349 88 20 21 14 15 2 - - - - - - - - 135 to 39 years 347 62 51 140 45 5 12 14 16 1 - - - - - - - - 140 to 44 years 255 79 36 76 27 12 5 7 7 3 - - 1 - - - - 245 to 49 years 192 80 42 39 13 8 3 4 1 1 1 - - - - - - - -50 to 54 years 162 89 25 16 8 12 6 1 2 1 - - - - - - 2 - -55 to 59 years 125 84 14 13 7 4 1 1 1 - - - - - - - - - - - -60 years and older 55 38 5 6 1 4 - - 1 - - - - - - - - - - - - - -
No. of admissions 3,580 630 346 1,681 352 84 67 232 89 10 2 3 - - 4 80
Race/ethnicityWhite (non-Hispanic) 3,255 575 322 1,560 330 68 52 192 81 9 2 2 - - 2 60Black (non-Hispanic) 49 7 3 18 5 4 1 9 - - - - - - 1 - - - - 1Hispanic origin 123 20 8 35 5 3 11 20 6 - - - - - - - - - - 15American Indian/Alaska Native 13 5 2 3 2 - - - - 1 - - - - - - - - - - - - - -Asian/Pacific Islander 11 2 - - 4 - - - - - - 2 1 - - - - - - - - - - 2Other 88 13 10 33 8 8 3 7 1 1 - - - - - - 2 2
No. of admissions 3,539 622 345 1,653 350 83 67 231 89 10 2 3 - - 4 80
Table 3.28a. New Hampshire admissions aged 12 and older, by primary substance of abuse and gender, age at admission, and race/ethnicity: Number, 2015
Gender, age at admission, and race/ethnicity
All admis-sions
aged 12 and older
Primary substance at admission
Alcohol Opiates Cocaine
Mari-juana/
hashish
Metham-phetamine/
amphet-amines
Tran-quil-izers
- - Quantity is zero.
SOURCE: Center for Behavioral Health Statistics and Quality, Substance Abuse and Mental Health Services Administration, Treatment Episode Data Set (TEDS). Data received through 11.01.16.
Seda-tives
Hallu-cino-gens PCP
Inhal-ants
Other/ none speci-fied
1 Admissions for which values were not collected, unknown, or missing are excluded from the sum total.
147

Alcohol only
Secondarydrug Heroin
Other opiates
Smoked cocaine
Other route
Total admissions aged 12 and older 3,580 630 346 1,681 352 84 67 232 89 10 2 3 - - 4 80
GenderMale 57.5 65.4 66.5 52.2 50.6 42.9 68.7 72.0 64.0 40.0 50.0 66.7 - - 25.0 56.3Female 42.5 34.6 33.5 47.8 49.4 57.1 31.3 28.0 36.0 60.0 50.0 33.3 - - 75.0 43.8
Total 100.0 100.0 100.0 100.0 100.0 100.0 100.0 100.0 100.0 100.0 100.0 100.0 - - 100.0 100.0No. of admissions 3,580 630 346 1,681 352 84 67 232 89 10 2 3 - - 4 80
Age at admission12 to 19 years 8.5 1.9 6.1 3.6 1.1 1.2 1.5 55.2 6.7 10.0 - - 33.3 - - - - 83.820 to 24 years 18.4 7.1 11.8 25.4 20.5 7.1 7.5 16.4 15.7 - - 50.0 - - - - 25.0 8.825 to 29 years 23.7 11.3 15.6 33.0 24.7 14.3 19.4 10.3 30.3 10.0 - - 33.3 - - 25.0 2.530 to 34 years 17.8 11.1 16.5 20.8 25.0 23.8 31.3 6.0 16.9 20.0 - - - - - - - - 1.335 to 39 years 9.7 9.8 14.7 8.3 12.8 6.0 17.9 6.0 18.0 10.0 - - - - - - - - 1.340 to 44 years 7.1 12.5 10.4 4.5 7.7 14.3 7.5 3.0 7.9 30.0 - - 33.3 - - - - 2.545 to 49 years 5.4 12.7 12.1 2.3 3.7 9.5 4.5 1.7 1.1 10.0 50.0 - - - - - - - -50 to 54 years 4.5 14.1 7.2 1.0 2.3 14.3 9.0 0.4 2.2 10.0 - - - - - - 50.0 - -55 to 59 years 3.5 13.3 4.0 0.8 2.0 4.8 1.5 0.4 1.1 - - - - - - - - - - - -60 years and older 1.5 6.0 1.4 0.4 0.3 4.8 - - 0.4 - - - - - - - - - - - - - -
Total 100.0 100.0 100.0 100.0 100.0 100.0 100.0 100.0 100.0 100.0 100.0 100.0 - - 100.0 100.0No. of admissions 3,580 630 346 1,681 352 84 67 232 89 10 2 3 - - 4 80
Race/ethnicityWhite (non-Hispanic) 92.0 92.4 93.3 94.4 94.3 81.9 77.6 83.1 91.0 90.0 100.0 66.7 - - 50.0 75.0Black (non-Hispanic) 1.4 1.1 0.9 1.1 1.4 4.8 1.5 3.9 - - - - - - 33.3 - - - - 1.3Hispanic origin 3.5 3.2 2.3 2.1 1.4 3.6 16.4 8.7 6.7 - - - - - - - - - - 18.8American Indian/Alaska Native 0.4 0.8 0.6 0.2 0.6 - - - - 0.4 - - - - - - - - - - - - - -Asian/Pacific Islander 0.3 0.3 - - 0.2 - - - - - - 0.9 1.1 - - - - - - - - - - 2.5Other 2.5 2.1 2.9 2.0 2.3 9.6 4.5 3.0 1.1 10.0 - - - - - - 50.0 2.5
Total 100.0 100.0 100.0 100.0 100.0 100.0 100.0 100.0 100.0 100.0 100.0 100.0 - - 100.0 100.0No. of admissions 3,539 622 345 1,653 350 83 67 231 89 10 2 3 - - 4 80
NOTE: Percentages may not sum to 100 percent due to rounding. Percentages are based on all admissions with known and valid values. Admissions for which values were not collected, unknown, or missing are excluded from the percentage base (denominator).SOURCE: Center for Behavioral Health Statistics and Quality, Substance Abuse and Mental Health Services Administration, Treatment Episode Data Set (TEDS). Data received through 11.01.16.
Seda-tives
Hallu-cino-gens PCP
Inhal-ants
Other/ none speci-fied
- - Quantity is zero.
Table 3.28b. New Hampshire admissions aged 12 and older, by primary substance of abuse and gender, age at admission, and race/ethnicity: Percent distribution, 2015
Gender, age at admission, and race/ethnicity
All admis-sions
aged 12 and older
Primary substance at admission
Alcohol Opiates CocaineMari-juana/
hashish
Metham-phetamine/
amphet-amines
Tran-quil-izers
148

Alcohol only
Secondarydrug Heroin
Other opiates
Smoked cocaine
Other route
Total admissions aged 12 and older 68,628 10,950 6,420 27,559 4,881 1,676 1,705 10,036 359 617 12 146 595 8 3,664
GenderMale 46,323 7,591 4,679 17,662 3,013 1,027 1,279 7,513 244 355 7 109 328 - - 2,516Female 22,291 3,358 1,737 9,895 1,868 649 426 2,517 115 261 5 37 267 8 1,148
No. of admissions1 68,614 10,949 6,416 27,557 4,881 1,676 1,705 10,030 359 616 12 146 595 8 3,664
Age at admission12 to 19 years 3,731 141 219 567 89 4 19 2,372 8 75 - - 11 2 - - 22420 to 24 years 10,511 772 919 4,412 718 53 98 2,503 63 101 - - 29 60 1 78225 to 29 years 13,342 1,208 1,026 6,392 1,215 142 196 2,055 68 118 3 26 182 - - 71130 to 34 years 11,228 1,424 968 5,112 984 188 256 1,375 79 112 - - 32 200 6 49235 to 39 years 7,763 1,347 848 3,007 661 220 252 832 55 75 2 18 94 - - 35240 to 44 years 5,866 1,273 591 2,332 387 250 251 386 31 44 3 10 31 1 27645 to 49 years 6,107 1,426 642 2,427 344 344 294 229 30 39 - - 11 20 - - 30150 to 54 years 5,379 1,553 690 1,889 262 286 207 179 11 23 2 6 6 - - 26555 to 59 years 3,048 1,076 369 938 149 153 92 72 10 23 2 2 - - - - 16260 years and older 1,653 730 148 483 72 36 40 33 4 7 - - 1 - - - - 99
No. of admissions 68,628 10,950 6,420 27,559 4,881 1,676 1,705 10,036 359 617 12 146 595 8 3,664
Race/ethnicityWhite (non-Hispanic) 41,939 6,934 3,515 19,887 3,680 634 767 2,878 213 476 5 86 81 6 2,777Black (non-Hispanic) 14,720 1,626 1,764 4,028 619 785 532 4,386 80 73 5 31 331 2 458Hispanic origin 9,811 1,918 957 3,024 459 204 333 2,307 36 54 1 24 159 - - 335American Indian/Alaska Native 139 32 15 38 8 10 6 20 - - - - - - - - 2 - - 8Asian/Pacific Islander 842 242 70 245 51 14 21 128 24 9 - - 3 1 - - 34Other 1,126 189 94 322 63 27 42 309 6 5 1 2 20 - - 46
No. of admissions 68,577 10,941 6,415 27,544 4,880 1,674 1,701 10,028 359 617 12 146 594 8 3,658
Table 3.29a. New Jersey admissions aged 12 and older, by primary substance of abuse and gender, age at admission, and race/ethnicity: Number, 2015
Gender, age at admission, and race/ethnicity
All admis-sions
aged 12 and older
Primary substance at admission
Alcohol Opiates Cocaine
Mari-juana/
hashish
Metham-phetamine/
amphet-amines
Tran-quil-izers
- - Quantity is zero.
SOURCE: Center for Behavioral Health Statistics and Quality, Substance Abuse and Mental Health Services Administration, Treatment Episode Data Set (TEDS). Data received through 11.01.16.
Seda-tives
Hallu-cino-gens PCP
Inhal-ants
Other/ none speci-fied
1 Admissions for which values were not collected, unknown, or missing are excluded from the sum total.
149

Alcohol only
Secondarydrug Heroin
Other opiates
Smoked cocaine
Other route
Total admissions aged 12 and older 68,628 10,950 6,420 27,559 4,881 1,676 1,705 10,036 359 617 12 146 595 8 3,664
GenderMale 67.5 69.3 72.9 64.1 61.7 61.3 75.0 74.9 68.0 57.6 58.3 74.7 55.1 - - 68.7Female 32.5 30.7 27.1 35.9 38.3 38.7 25.0 25.1 32.0 42.4 41.7 25.3 44.9 100.0 31.3
Total 100.0 100.0 100.0 100.0 100.0 100.0 100.0 100.0 100.0 100.0 100.0 100.0 100.0 100.0 100.0No. of admissions 68,614 10,949 6,416 27,557 4,881 1,676 1,705 10,030 359 616 12 146 595 8 3,664
Age at admission12 to 19 years 5.4 1.3 3.4 2.1 1.8 0.2 1.1 23.6 2.2 12.2 - - 7.5 0.3 - - 6.120 to 24 years 15.3 7.1 14.3 16.0 14.7 3.2 5.7 24.9 17.5 16.4 - - 19.9 10.1 12.5 21.325 to 29 years 19.4 11.0 16.0 23.2 24.9 8.5 11.5 20.5 18.9 19.1 25.0 17.8 30.6 - - 19.430 to 34 years 16.4 13.0 15.1 18.5 20.2 11.2 15.0 13.7 22.0 18.2 - - 21.9 33.6 75.0 13.435 to 39 years 11.3 12.3 13.2 10.9 13.5 13.1 14.8 8.3 15.3 12.2 16.7 12.3 15.8 - - 9.640 to 44 years 8.5 11.6 9.2 8.5 7.9 14.9 14.7 3.8 8.6 7.1 25.0 6.8 5.2 12.5 7.545 to 49 years 8.9 13.0 10.0 8.8 7.0 20.5 17.2 2.3 8.4 6.3 - - 7.5 3.4 - - 8.250 to 54 years 7.8 14.2 10.7 6.9 5.4 17.1 12.1 1.8 3.1 3.7 16.7 4.1 1.0 - - 7.255 to 59 years 4.4 9.8 5.7 3.4 3.1 9.1 5.4 0.7 2.8 3.7 16.7 1.4 - - - - 4.460 years and older 2.4 6.7 2.3 1.8 1.5 2.1 2.3 0.3 1.1 1.1 - - 0.7 - - - - 2.7
Total 100.0 100.0 100.0 100.0 100.0 100.0 100.0 100.0 100.0 100.0 100.0 100.0 100.0 100.0 100.0No. of admissions 68,628 10,950 6,420 27,559 4,881 1,676 1,705 10,036 359 617 12 146 595 8 3,664
Race/ethnicityWhite (non-Hispanic) 61.2 63.4 54.8 72.2 75.4 37.9 45.1 28.7 59.3 77.1 41.7 58.9 13.6 75.0 75.9Black (non-Hispanic) 21.5 14.9 27.5 14.6 12.7 46.9 31.3 43.7 22.3 11.8 41.7 21.2 55.7 25.0 12.5Hispanic origin 14.3 17.5 14.9 11.0 9.4 12.2 19.6 23.0 10.0 8.8 8.3 16.4 26.8 - - 9.2American Indian/Alaska Native 0.2 0.3 0.2 0.1 0.2 0.6 0.4 0.2 - - - - - - - - 0.3 - - 0.2Asian/Pacific Islander 1.2 2.2 1.1 0.9 1.0 0.8 1.2 1.3 6.7 1.5 - - 2.1 0.2 - - 0.9Other 1.6 1.7 1.5 1.2 1.3 1.6 2.5 3.1 1.7 0.8 8.3 1.4 3.4 - - 1.3
Total 100.0 100.0 100.0 100.0 100.0 100.0 100.0 100.0 100.0 100.0 100.0 100.0 100.0 100.0 100.0No. of admissions 68,577 10,941 6,415 27,544 4,880 1,674 1,701 10,028 359 617 12 146 594 8 3,658
Table 3.29b. New Jersey admissions aged 12 and older, by primary substance of abuse and gender, age at admission, and race/ethnicity: Percent distribution, 2015
Gender, age at admission, and race/ethnicity
All admis-sions
aged 12 and older
Primary substance at admission
Alcohol Opiates CocaineMari-juana/
hashish
Metham-phetamine/
amphet-amines
Tran-quil-izers
NOTE: Percentages may not sum to 100 percent due to rounding. Percentages are based on all admissions with known and valid values. Admissions for which values were not collected, unknown, or missing are excluded from the percentage base (denominator).SOURCE: Center for Behavioral Health Statistics and Quality, Substance Abuse and Mental Health Services Administration, Treatment Episode Data Set (TEDS). Data received through 11.01.16.
Seda-tives
Hallu-cino-gens PCP
Inhal-ants
Other/ none speci-fied
- - Quantity is zero.
150

Alcohol only
Secondarydrug Heroin
Other opiates
Smoked cocaine
Other route
Total admissions aged 12 and older 4,445 1,802 502 441 520 21 44 214 304 9 2 1 - - - - 585
GenderMale 3,056 1,341 364 263 322 11 16 166 187 7 2 1 - - - - 376Female 1,333 460 138 177 197 10 28 48 115 2 - - - - - - - - 158
No. of admissions1 4,389 1,801 502 440 519 21 44 214 302 9 2 1 - - - - 534
Age at admission12 to 19 years 194 43 32 14 4 - - - - 72 9 - - - - - - - - - - 2020 to 24 years 658 222 58 97 94 2 6 51 51 - - - - - - - - - - 7725 to 29 years 814 296 101 99 125 3 9 31 61 2 - - - - - - - - 8730 to 34 years 697 282 82 63 89 5 11 20 68 1 - - - - - - - - 7635 to 39 years 587 264 60 50 71 4 7 14 46 2 - - - - - - - - 6940 to 44 years 429 208 43 30 46 2 1 6 30 1 - - - - - - - - 6245 to 49 years 351 172 34 19 30 3 2 10 23 1 2 - - - - - - 5550 to 54 years 328 156 44 17 26 2 3 3 11 - - - - - - - - - - 6655 to 59 years 199 87 27 22 23 - - 4 1 2 2 - - - - - - - - 3160 years and older 188 72 21 30 12 - - 1 6 3 - - - - 1 - - - - 42
No. of admissions 4,445 1,802 502 441 520 21 44 214 304 9 2 1 - - - - 585
Race/ethnicityWhite (non-Hispanic) 915 204 109 99 153 4 11 42 117 2 2 1 - - - - 171Black (non-Hispanic) 61 20 1 2 3 1 6 7 5 - - - - - - - - - - 16Hispanic origin 1,787 525 210 298 204 13 22 112 149 2 - - - - - - - - 252American Indian/Alaska Native 1,186 896 168 13 8 1 - - 38 18 5 - - - - - - - - 39Asian/Pacific Islander 7 2 - - - - 1 - - - - 1 - - - - - - - - - - - - 3Other 214 118 8 25 18 2 5 10 6 - - - - - - - - - - 22
No. of admissions 4,170 1,765 496 437 387 21 44 210 295 9 2 1 - - - - 503
Table 3.30a. New Mexico admissions aged 12 and older, by primary substance of abuse and gender, age at admission, and race/ethnicity: Number, 2015
Gender, age at admission, and race/ethnicity
All admis-sions
aged 12 and older
Primary substance at admission
Alcohol Opiates Cocaine
Mari-juana/
hashish
Metham-phetamine/
amphet-amines
Tran-quil-izers
Seda-tives
Hallu-cino-gens PCP
1 Admissions for which values were not collected, unknown, or missing are excluded from the sum total.
Inhal-ants
Other/ none speci-fied
- - Quantity is zero.
SOURCE: Center for Behavioral Health Statistics and Quality, Substance Abuse and Mental Health Services Administration, Treatment Episode Data Set (TEDS). Data received through 11.01.16.
151
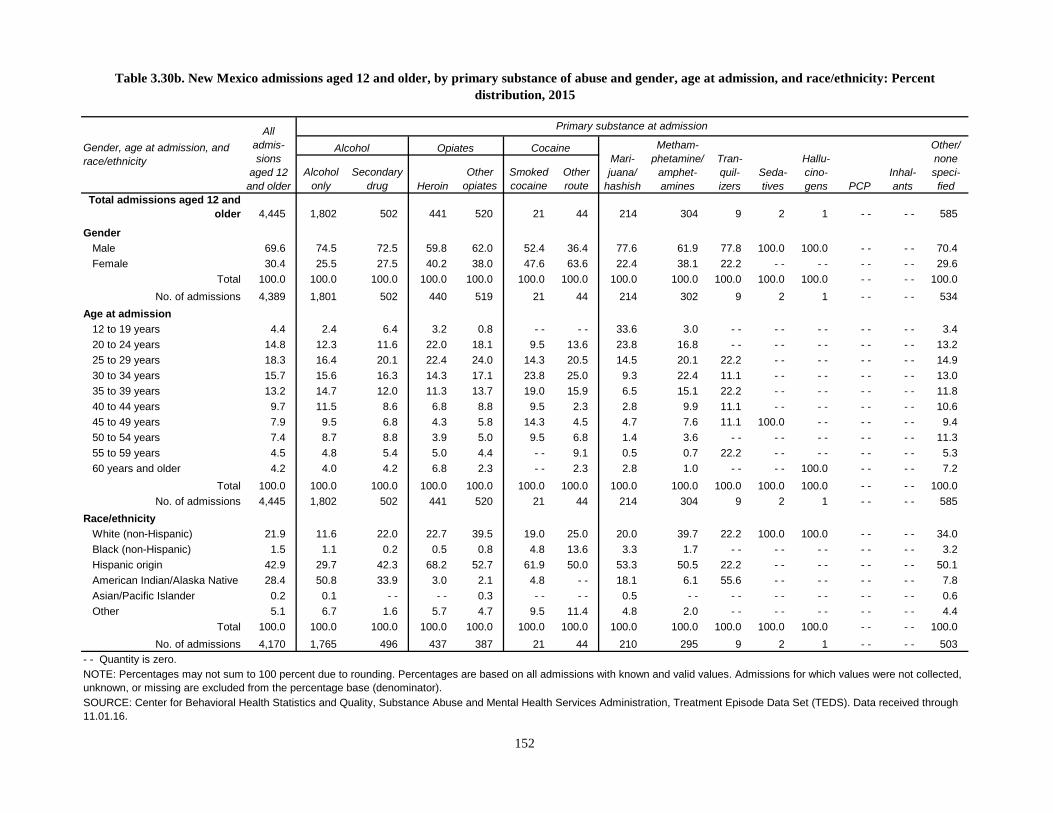
Alcohol only
Secondarydrug Heroin
Other opiates
Smoked cocaine
Other route
Total admissions aged 12 and older 4,445 1,802 502 441 520 21 44 214 304 9 2 1 - - - - 585
GenderMale 69.6 74.5 72.5 59.8 62.0 52.4 36.4 77.6 61.9 77.8 100.0 100.0 - - - - 70.4Female 30.4 25.5 27.5 40.2 38.0 47.6 63.6 22.4 38.1 22.2 - - - - - - - - 29.6
Total 100.0 100.0 100.0 100.0 100.0 100.0 100.0 100.0 100.0 100.0 100.0 100.0 - - - - 100.0No. of admissions 4,389 1,801 502 440 519 21 44 214 302 9 2 1 - - - - 534
Age at admission12 to 19 years 4.4 2.4 6.4 3.2 0.8 - - - - 33.6 3.0 - - - - - - - - - - 3.420 to 24 years 14.8 12.3 11.6 22.0 18.1 9.5 13.6 23.8 16.8 - - - - - - - - - - 13.225 to 29 years 18.3 16.4 20.1 22.4 24.0 14.3 20.5 14.5 20.1 22.2 - - - - - - - - 14.930 to 34 years 15.7 15.6 16.3 14.3 17.1 23.8 25.0 9.3 22.4 11.1 - - - - - - - - 13.035 to 39 years 13.2 14.7 12.0 11.3 13.7 19.0 15.9 6.5 15.1 22.2 - - - - - - - - 11.840 to 44 years 9.7 11.5 8.6 6.8 8.8 9.5 2.3 2.8 9.9 11.1 - - - - - - - - 10.645 to 49 years 7.9 9.5 6.8 4.3 5.8 14.3 4.5 4.7 7.6 11.1 100.0 - - - - - - 9.450 to 54 years 7.4 8.7 8.8 3.9 5.0 9.5 6.8 1.4 3.6 - - - - - - - - - - 11.355 to 59 years 4.5 4.8 5.4 5.0 4.4 - - 9.1 0.5 0.7 22.2 - - - - - - - - 5.360 years and older 4.2 4.0 4.2 6.8 2.3 - - 2.3 2.8 1.0 - - - - 100.0 - - - - 7.2
Total 100.0 100.0 100.0 100.0 100.0 100.0 100.0 100.0 100.0 100.0 100.0 100.0 - - - - 100.0No. of admissions 4,445 1,802 502 441 520 21 44 214 304 9 2 1 - - - - 585
Race/ethnicityWhite (non-Hispanic) 21.9 11.6 22.0 22.7 39.5 19.0 25.0 20.0 39.7 22.2 100.0 100.0 - - - - 34.0Black (non-Hispanic) 1.5 1.1 0.2 0.5 0.8 4.8 13.6 3.3 1.7 - - - - - - - - - - 3.2Hispanic origin 42.9 29.7 42.3 68.2 52.7 61.9 50.0 53.3 50.5 22.2 - - - - - - - - 50.1American Indian/Alaska Native 28.4 50.8 33.9 3.0 2.1 4.8 - - 18.1 6.1 55.6 - - - - - - - - 7.8Asian/Pacific Islander 0.2 0.1 - - - - 0.3 - - - - 0.5 - - - - - - - - - - - - 0.6Other 5.1 6.7 1.6 5.7 4.7 9.5 11.4 4.8 2.0 - - - - - - - - - - 4.4
Total 100.0 100.0 100.0 100.0 100.0 100.0 100.0 100.0 100.0 100.0 100.0 100.0 - - - - 100.0No. of admissions 4,170 1,765 496 437 387 21 44 210 295 9 2 1 - - - - 503
Table 3.30b. New Mexico admissions aged 12 and older, by primary substance of abuse and gender, age at admission, and race/ethnicity: Percent distribution, 2015
Gender, age at admission, and race/ethnicity
All admis-sions
aged 12 and older
Primary substance at admission
Alcohol Opiates CocaineMari-juana/
hashish
Metham-phetamine/
amphet-amines
Tran-quil-izers
NOTE: Percentages may not sum to 100 percent due to rounding. Percentages are based on all admissions with known and valid values. Admissions for which values were not collected, unknown, or missing are excluded from the percentage base (denominator).SOURCE: Center for Behavioral Health Statistics and Quality, Substance Abuse and Mental Health Services Administration, Treatment Episode Data Set (TEDS). Data received through 11.01.16.
Seda-tives
Hallu-cino-gens PCP
Inhal-ants
Other/ none speci-fied
- - Quantity is zero.
152

Alcohol only
Secondarydrug Heroin
Other opiates
Smoked cocaine
Other route
Total admissions aged 12 and older 281,335 49,970 57,208 86,019 17,461 13,186 8,226 39,187 1,903 4,045 1,058 213 964 71 1,824
GenderMale 203,971 37,083 44,256 61,170 10,567 8,326 6,148 29,735 1,448 2,660 364 160 684 41 1,329Female 77,364 12,887 12,952 24,849 6,894 4,860 2,078 9,452 455 1,385 694 53 280 30 495
No. of admissions1 281,335 49,970 57,208 86,019 17,461 13,186 8,226 39,187 1,903 4,045 1,058 213 964 71 1,824
Age at admission12 to 19 years 13,088 424 995 1,698 461 49 153 8,671 94 296 21 51 16 6 15320 to 24 years 34,062 2,183 3,966 13,856 3,011 343 624 8,616 300 629 32 44 90 15 35325 to 29 years 44,548 4,103 6,075 18,902 4,388 874 1,123 7,359 371 692 46 40 206 10 35930 to 34 years 37,357 4,921 6,357 13,458 3,479 1,164 1,208 5,159 411 627 42 26 210 11 28435 to 39 years 30,021 5,316 6,086 9,312 2,135 1,320 1,104 3,493 277 440 36 29 228 10 23540 to 44 years 26,018 5,653 6,389 7,208 1,217 1,703 938 2,166 186 303 25 9 77 4 14045 to 49 years 33,089 7,459 9,960 8,113 927 3,004 1,184 1,730 122 349 23 6 65 6 14150 to 54 years 31,808 8,444 9,838 6,990 834 2,863 1,082 1,190 97 278 43 4 56 4 8555 to 59 years 18,725 6,205 5,132 3,923 584 1,347 581 595 32 227 41 1 12 1 4460 years and older 12,619 5,262 2,410 2,559 425 519 229 208 13 204 749 3 4 4 30
No. of admissions 281,335 49,970 57,208 86,019 17,461 13,186 8,226 39,187 1,903 4,045 1,058 213 964 71 1,824
Race/ethnicityWhite (non-Hispanic) 141,666 27,188 22,903 52,341 14,420 3,785 3,207 11,467 1,365 2,778 970 124 148 60 910Black (non-Hispanic) 71,612 10,387 21,663 10,525 885 7,263 2,644 16,790 219 293 15 37 456 3 432Hispanic origin 55,824 9,584 10,410 19,854 1,455 1,746 2,033 9,006 210 789 48 33 310 7 339American Indian/Alaska Native 1,827 361 435 370 182 95 48 282 8 12 4 2 3 - - 25Asian/Pacific Islander 2,040 684 307 430 83 46 51 281 39 38 10 8 9 1 53Other 8,366 1,766 1,490 2,499 436 251 243 1,361 62 135 11 9 38 - - 65
No. of admissions 281,335 49,970 57,208 86,019 17,461 13,186 8,226 39,187 1,903 4,045 1,058 213 964 71 1,824
SOURCE: Center for Behavioral Health Statistics and Quality, Substance Abuse and Mental Health Services Administration, Treatment Episode Data Set (TEDS). Data received through 11.01.16.
Seda-tives
Hallu-cino-gens PCP
Inhal-ants
Other/ none speci-fied
- - Quantity is zero.1 Admissions for which values were not collected, unknown, or missing are excluded from the sum total.
Table 3.31a. New York admissions aged 12 and older, by primary substance of abuse and gender, age at admission, and race/ethnicity: Number, 2015
Gender, age at admission, and race/ethnicity
All admis-sions
aged 12 and older
Primary substance at admission
Alcohol Opiates Cocaine
Mari-juana/
hashish
Metham-phetamine/
amphet-amines
Tran-quil-izers
153

Alcohol only
Secondarydrug Heroin
Other opiates
Smoked cocaine
Other route
Total admissions aged 12 and older 281,335 49,970 57,208 86,019 17,461 13,186 8,226 39,187 1,903 4,045 1,058 213 964 71 1,824
GenderMale 72.5 74.2 77.4 71.1 60.5 63.1 74.7 75.9 76.1 65.8 34.4 75.1 71.0 57.7 72.9Female 27.5 25.8 22.6 28.9 39.5 36.9 25.3 24.1 23.9 34.2 65.6 24.9 29.0 42.3 27.1
Total 100.0 100.0 100.0 100.0 100.0 100.0 100.0 100.0 100.0 100.0 100.0 100.0 100.0 100.0 100.0No. of admissions 281,335 49,970 57,208 86,019 17,461 13,186 8,226 39,187 1,903 4,045 1,058 213 964 71 1,824
Age at admission12 to 19 years 4.7 0.8 1.7 2.0 2.6 0.4 1.9 22.1 4.9 7.3 2.0 23.9 1.7 8.5 8.420 to 24 years 12.1 4.4 6.9 16.1 17.2 2.6 7.6 22.0 15.8 15.6 3.0 20.7 9.3 21.1 19.425 to 29 years 15.8 8.2 10.6 22.0 25.1 6.6 13.7 18.8 19.5 17.1 4.3 18.8 21.4 14.1 19.730 to 34 years 13.3 9.8 11.1 15.6 19.9 8.8 14.7 13.2 21.6 15.5 4.0 12.2 21.8 15.5 15.635 to 39 years 10.7 10.6 10.6 10.8 12.2 10.0 13.4 8.9 14.6 10.9 3.4 13.6 23.7 14.1 12.940 to 44 years 9.2 11.3 11.2 8.4 7.0 12.9 11.4 5.5 9.8 7.5 2.4 4.2 8.0 5.6 7.745 to 49 years 11.8 14.9 17.4 9.4 5.3 22.8 14.4 4.4 6.4 8.6 2.2 2.8 6.7 8.5 7.750 to 54 years 11.3 16.9 17.2 8.1 4.8 21.7 13.2 3.0 5.1 6.9 4.1 1.9 5.8 5.6 4.755 to 59 years 6.7 12.4 9.0 4.6 3.3 10.2 7.1 1.5 1.7 5.6 3.9 0.5 1.2 1.4 2.460 years and older 4.5 10.5 4.2 3.0 2.4 3.9 2.8 0.5 0.7 5.0 70.8 1.4 0.4 5.6 1.6
Total 100.0 100.0 100.0 100.0 100.0 100.0 100.0 100.0 100.0 100.0 100.0 100.0 100.0 100.0 100.0No. of admissions 281,335 49,970 57,208 86,019 17,461 13,186 8,226 39,187 1,903 4,045 1,058 213 964 71 1,824
Race/ethnicityWhite (non-Hispanic) 50.4 54.4 40.0 60.8 82.6 28.7 39.0 29.3 71.7 68.7 91.7 58.2 15.4 84.5 49.9Black (non-Hispanic) 25.5 20.8 37.9 12.2 5.1 55.1 32.1 42.8 11.5 7.2 1.4 17.4 47.3 4.2 23.7Hispanic origin 19.8 19.2 18.2 23.1 8.3 13.2 24.7 23.0 11.0 19.5 4.5 15.5 32.2 9.9 18.6American Indian/Alaska Native 0.6 0.7 0.8 0.4 1.0 0.7 0.6 0.7 0.4 0.3 0.4 0.9 0.3 - - 1.4Asian/Pacific Islander 0.7 1.4 0.5 0.5 0.5 0.3 0.6 0.7 2.0 0.9 0.9 3.8 0.9 1.4 2.9Other 3.0 3.5 2.6 2.9 2.5 1.9 3.0 3.5 3.3 3.3 1.0 4.2 3.9 - - 3.6
Total 100.0 100.0 100.0 100.0 100.0 100.0 100.0 100.0 100.0 100.0 100.0 100.0 100.0 100.0 100.0No. of admissions 281,335 49,970 57,208 86,019 17,461 13,186 8,226 39,187 1,903 4,045 1,058 213 964 71 1,824
Table 3.31b. New York admissions aged 12 and older, by primary substance of abuse and gender, age at admission, and race/ethnicity: Percent distribution, 2015
Gender, age at admission, and race/ethnicity
All admis-sions
aged 12 and older
Primary substance at admission
Alcohol Opiates CocaineMari-juana/
hashish
Metham-phetamine/
amphet-amines
Tran-quil-izers
NOTE: Percentages may not sum to 100 percent due to rounding. Percentages are based on all admissions with known and valid values. Admissions for which values were not collected, unknown, or missing are excluded from the percentage base (denominator).SOURCE: Center for Behavioral Health Statistics and Quality, Substance Abuse and Mental Health Services Administration, Treatment Episode Data Set (TEDS). Data received through 11.01.16.
Seda-tives
Hallu-cino-gens PCP
Inhal-ants
Other/ none speci-fied
- - Quantity is zero.
154

Alcohol only
Secondarydrug Heroin
Other opiates
Smoked cocaine
Other route
Total admissions aged 12 and older 39,917 8,241 4,494 3,341 6,007 2,459 1,468 10,789 1,308 583 113 35 31 20 1,028
GenderMale 27,382 6,025 3,271 2,086 3,360 1,457 1,012 8,351 741 278 76 28 25 9 663Female 12,471 2,198 1,215 1,249 2,635 997 455 2,430 563 305 37 7 6 11 363
No. of admissions1 39,853 8,223 4,486 3,335 5,995 2,454 1,467 10,781 1,304 583 113 35 31 20 1,026
Age at admission12 to 19 years 1,776 103 23 50 112 8 21 1,387 28 17 5 1 - - 2 1920 to 24 years 6,487 522 283 639 1,050 85 133 3,327 204 106 20 7 - - - - 11125 to 29 years 7,687 926 549 989 1,657 186 206 2,479 312 132 30 13 7 7 19430 to 34 years 6,172 1,027 667 683 1,249 270 254 1,445 254 91 27 2 13 3 18735 to 39 years 4,558 976 553 354 758 310 258 879 226 74 11 3 4 4 14840 to 44 years 3,766 990 590 252 483 383 185 549 146 60 3 2 5 3 11545 to 49 years 3,488 1,150 665 189 308 452 151 331 91 46 9 4 - - 1 9150 to 54 years 3,104 1,218 665 85 211 412 148 205 28 31 4 1 2 - - 9455 to 59 years 1,818 752 346 54 119 262 69 126 15 21 3 1 - - - - 5060 years and older 1,061 577 153 46 60 91 43 61 4 5 1 1 - - - - 19
No. of admissions 39,917 8,241 4,494 3,341 6,007 2,459 1,468 10,789 1,308 583 113 35 31 20 1,028
Race/ethnicityWhite (non-Hispanic) 24,125 4,958 2,900 2,828 5,269 969 695 3,838 1,219 517 96 23 13 20 780Black (non-Hispanic) 12,952 2,672 1,371 344 362 1,313 670 5,909 36 46 12 9 15 - - 193Hispanic origin 799 204 85 61 51 26 27 320 8 5 - - - - - - - - 12American Indian/Alaska Native 1,084 172 69 13 213 109 56 400 22 4 2 - - 2 - - 22Asian/Pacific Islander 128 26 9 12 20 3 3 44 8 2 - - 1 - - - - - -Other 585 131 33 40 63 10 15 259 6 3 3 2 1 - - 19
No. of admissions 39,673 8,163 4,467 3,298 5,978 2,430 1,466 10,770 1,299 577 113 35 31 20 1,026
SOURCE: Center for Behavioral Health Statistics and Quality, Substance Abuse and Mental Health Services Administration, Treatment Episode Data Set (TEDS). Data received through 11.01.16.
Seda-tives
Hallu-cino-gens PCP
Inhal-ants
Other/ none speci-fied
- - Quantity is zero.1 Admissions for which values were not collected, unknown, or missing are excluded from the sum total.
Table 3.32a. North Carolina admissions aged 12 and older, by primary substance of abuse and gender, age at admission, and race/ethnicity: Number, 2015
Gender, age at admission, and race/ethnicity
All admis-sions
aged 12 and older
Primary substance at admission
Alcohol Opiates Cocaine
Mari-juana/
hashish
Metham-phetamine/
amphet-amines
Tran-quil-izers
155

Alcohol only
Secondarydrug Heroin
Other opiates
Smoked cocaine
Other route
Total admissions aged 12 and older 39,917 8,241 4,494 3,341 6,007 2,459 1,468 10,789 1,308 583 113 35 31 20 1,028
GenderMale 68.7 73.3 72.9 62.5 56.0 59.4 69.0 77.5 56.8 47.7 67.3 80.0 80.6 45.0 64.6Female 31.3 26.7 27.1 37.5 44.0 40.6 31.0 22.5 43.2 52.3 32.7 20.0 19.4 55.0 35.4
Total 100.0 100.0 100.0 100.0 100.0 100.0 100.0 100.0 100.0 100.0 100.0 100.0 100.0 100.0 100.0No. of admissions 39,853 8,223 4,486 3,335 5,995 2,454 1,467 10,781 1,304 583 113 35 31 20 1,026
Age at admission12 to 19 years 4.4 1.2 0.5 1.5 1.9 0.3 1.4 12.9 2.1 2.9 4.4 2.9 - - 10.0 1.820 to 24 years 16.3 6.3 6.3 19.1 17.5 3.5 9.1 30.8 15.6 18.2 17.7 20.0 - - - - 10.825 to 29 years 19.3 11.2 12.2 29.6 27.6 7.6 14.0 23.0 23.9 22.6 26.5 37.1 22.6 35.0 18.930 to 34 years 15.5 12.5 14.8 20.4 20.8 11.0 17.3 13.4 19.4 15.6 23.9 5.7 41.9 15.0 18.235 to 39 years 11.4 11.8 12.3 10.6 12.6 12.6 17.6 8.1 17.3 12.7 9.7 8.6 12.9 20.0 14.440 to 44 years 9.4 12.0 13.1 7.5 8.0 15.6 12.6 5.1 11.2 10.3 2.7 5.7 16.1 15.0 11.245 to 49 years 8.7 14.0 14.8 5.7 5.1 18.4 10.3 3.1 7.0 7.9 8.0 11.4 - - 5.0 8.950 to 54 years 7.8 14.8 14.8 2.5 3.5 16.8 10.1 1.9 2.1 5.3 3.5 2.9 6.5 - - 9.155 to 59 years 4.6 9.1 7.7 1.6 2.0 10.7 4.7 1.2 1.1 3.6 2.7 2.9 - - - - 4.960 years and older 2.7 7.0 3.4 1.4 1.0 3.7 2.9 0.6 0.3 0.9 0.9 2.9 - - - - 1.8
Total 100.0 100.0 100.0 100.0 100.0 100.0 100.0 100.0 100.0 100.0 100.0 100.0 100.0 100.0 100.0No. of admissions 39,917 8,241 4,494 3,341 6,007 2,459 1,468 10,789 1,308 583 113 35 31 20 1,028
Race/ethnicityWhite (non-Hispanic) 60.8 60.7 64.9 85.7 88.1 39.9 47.4 35.6 93.8 89.6 85.0 65.7 41.9 100.0 76.0Black (non-Hispanic) 32.6 32.7 30.7 10.4 6.1 54.0 45.7 54.9 2.8 8.0 10.6 25.7 48.4 - - 18.8Hispanic origin 2.0 2.5 1.9 1.8 0.9 1.1 1.8 3.0 0.6 0.9 - - - - - - - - 1.2American Indian/Alaska Native 2.7 2.1 1.5 0.4 3.6 4.5 3.8 3.7 1.7 0.7 1.8 - - 6.5 - - 2.1Asian/Pacific Islander 0.3 0.3 0.2 0.4 0.3 0.1 0.2 0.4 0.6 0.3 - - 2.9 - - - - - -Other 1.5 1.6 0.7 1.2 1.1 0.4 1.0 2.4 0.5 0.5 2.7 5.7 3.2 - - 1.9
Total 100.0 100.0 100.0 100.0 100.0 100.0 100.0 100.0 100.0 100.0 100.0 100.0 100.0 100.0 100.0No. of admissions 39,673 8,163 4,467 3,298 5,978 2,430 1,466 10,770 1,299 577 113 35 31 20 1,026
Table 3.32b. North Carolina admissions aged 12 and older, by primary substance of abuse and gender, age at admission, and race/ethnicity: Percent distribution, 2015
Gender, age at admission, and race/ethnicity
All admis-sions
aged 12 and older
Primary substance at admission
Alcohol Opiates CocaineMari-juana/
hashish
Metham-phetamine/
amphet-amines
Tran-quil-izers
NOTE: Percentages may not sum to 100 percent due to rounding. Percentages are based on all admissions with known and valid values. Admissions for which values were not collected, unknown, or missing are excluded from the percentage base (denominator).SOURCE: Center for Behavioral Health Statistics and Quality, Substance Abuse and Mental Health Services Administration, Treatment Episode Data Set (TEDS). Data received through 11.01.16.
Seda-tives
Hallu-cino-gens PCP
Inhal-ants
Other/ none speci-fied
- - Quantity is zero.
156
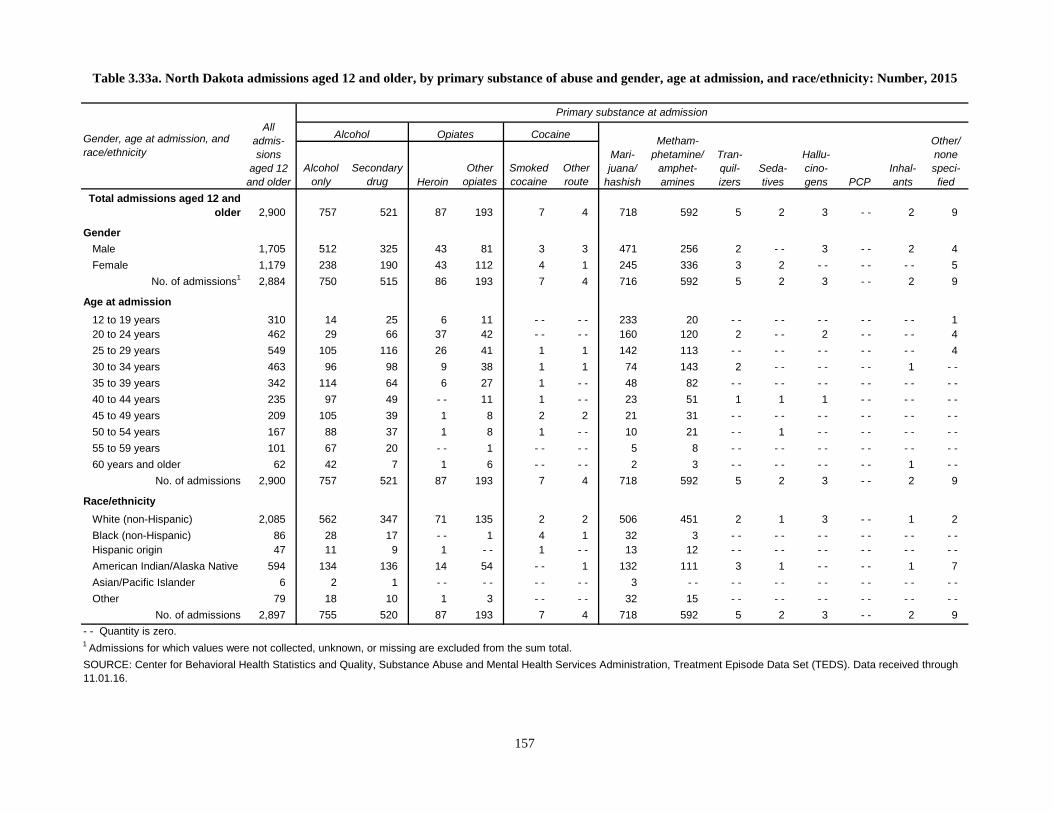
Alcohol only
Secondarydrug Heroin
Other opiates
Smoked cocaine
Other route
Total admissions aged 12 and older 2,900 757 521 87 193 7 4 718 592 5 2 3 - - 2 9
GenderMale 1,705 512 325 43 81 3 3 471 256 2 - - 3 - - 2 4Female 1,179 238 190 43 112 4 1 245 336 3 2 - - - - - - 5
No. of admissions1 2,884 750 515 86 193 7 4 716 592 5 2 3 - - 2 9
Age at admission12 to 19 years 310 14 25 6 11 - - - - 233 20 - - - - - - - - - - 120 to 24 years 462 29 66 37 42 - - - - 160 120 2 - - 2 - - - - 425 to 29 years 549 105 116 26 41 1 1 142 113 - - - - - - - - - - 430 to 34 years 463 96 98 9 38 1 1 74 143 2 - - - - - - 1 - -35 to 39 years 342 114 64 6 27 1 - - 48 82 - - - - - - - - - - - -40 to 44 years 235 97 49 - - 11 1 - - 23 51 1 1 1 - - - - - -45 to 49 years 209 105 39 1 8 2 2 21 31 - - - - - - - - - - - -50 to 54 years 167 88 37 1 8 1 - - 10 21 - - 1 - - - - - - - -55 to 59 years 101 67 20 - - 1 - - - - 5 8 - - - - - - - - - - - -60 years and older 62 42 7 1 6 - - - - 2 3 - - - - - - - - 1 - -
No. of admissions 2,900 757 521 87 193 7 4 718 592 5 2 3 - - 2 9
Race/ethnicityWhite (non-Hispanic) 2,085 562 347 71 135 2 2 506 451 2 1 3 - - 1 2Black (non-Hispanic) 86 28 17 - - 1 4 1 32 3 - - - - - - - - - - - -Hispanic origin 47 11 9 1 - - 1 - - 13 12 - - - - - - - - - - - -American Indian/Alaska Native 594 134 136 14 54 - - 1 132 111 3 1 - - - - 1 7Asian/Pacific Islander 6 2 1 - - - - - - - - 3 - - - - - - - - - - - - - -Other 79 18 10 1 3 - - - - 32 15 - - - - - - - - - - - -
No. of admissions 2,897 755 520 87 193 7 4 718 592 5 2 3 - - 2 9
SOURCE: Center for Behavioral Health Statistics and Quality, Substance Abuse and Mental Health Services Administration, Treatment Episode Data Set (TEDS). Data received through 11.01.16.
Seda-tives
Hallu-cino-gens PCP
Inhal-ants
Other/ none speci-fied
- - Quantity is zero.1 Admissions for which values were not collected, unknown, or missing are excluded from the sum total.
Table 3.33a. North Dakota admissions aged 12 and older, by primary substance of abuse and gender, age at admission, and race/ethnicity: Number, 2015
Gender, age at admission, and race/ethnicity
All admis-sions
aged 12 and older
Primary substance at admission
Alcohol Opiates Cocaine
Mari-juana/
hashish
Metham-phetamine/
amphet-amines
Tran-quil-izers
157

Alcohol only
Secondarydrug Heroin
Other opiates
Smoked cocaine
Other route
Total admissions aged 12 and older 2,900 757 521 87 193 7 4 718 592 5 2 3 - - 2 9
GenderMale 59.1 68.3 63.1 50.0 42.0 42.9 75.0 65.8 43.2 40.0 - - 100.0 - - 100.0 44.4Female 40.9 31.7 36.9 50.0 58.0 57.1 25.0 34.2 56.8 60.0 100.0 - - - - - - 55.6
Total 100.0 100.0 100.0 100.0 100.0 100.0 100.0 100.0 100.0 100.0 100.0 100.0 - - 100.0 100.0No. of admissions 2,884 750 515 86 193 7 4 716 592 5 2 3 - - 2 9
Age at admission12 to 19 years 10.7 1.8 4.8 6.9 5.7 - - - - 32.5 3.4 - - - - - - - - - - 11.120 to 24 years 15.9 3.8 12.7 42.5 21.8 - - - - 22.3 20.3 40.0 - - 66.7 - - - - 44.425 to 29 years 18.9 13.9 22.3 29.9 21.2 14.3 25.0 19.8 19.1 - - - - - - - - - - 44.430 to 34 years 16.0 12.7 18.8 10.3 19.7 14.3 25.0 10.3 24.2 40.0 - - - - - - 50.0 - -35 to 39 years 11.8 15.1 12.3 6.9 14.0 14.3 - - 6.7 13.9 - - - - - - - - - - - -40 to 44 years 8.1 12.8 9.4 - - 5.7 14.3 - - 3.2 8.6 20.0 50.0 33.3 - - - - - -45 to 49 years 7.2 13.9 7.5 1.1 4.1 28.6 50.0 2.9 5.2 - - - - - - - - - - - -50 to 54 years 5.8 11.6 7.1 1.1 4.1 14.3 - - 1.4 3.5 - - 50.0 - - - - - - - -55 to 59 years 3.5 8.9 3.8 - - 0.5 - - - - 0.7 1.4 - - - - - - - - - - - -60 years and older 2.1 5.5 1.3 1.1 3.1 - - - - 0.3 0.5 - - - - - - - - 50.0 - -
Total 100.0 100.0 100.0 100.0 100.0 100.0 100.0 100.0 100.0 100.0 100.0 100.0 - - 100.0 100.0No. of admissions 2,900 757 521 87 193 7 4 718 592 5 2 3 - - 2 9
Race/ethnicityWhite (non-Hispanic) 72.0 74.4 66.7 81.6 69.9 28.6 50.0 70.5 76.2 40.0 50.0 100.0 - - 50.0 22.2Black (non-Hispanic) 3.0 3.7 3.3 - - 0.5 57.1 25.0 4.5 0.5 - - - - - - - - - - - -Hispanic origin 1.6 1.5 1.7 1.1 - - 14.3 - - 1.8 2.0 - - - - - - - - - - - -American Indian/Alaska Native 20.5 17.7 26.2 16.1 28.0 - - 25.0 18.4 18.8 60.0 50.0 - - - - 50.0 77.8Asian/Pacific Islander 0.2 0.3 0.2 - - - - - - - - 0.4 - - - - - - - - - - - - - -Other 2.7 2.4 1.9 1.1 1.6 - - - - 4.5 2.5 - - - - - - - - - - - -
Total 100.0 100.0 100.0 100.0 100.0 100.0 100.0 100.0 100.0 100.0 100.0 100.0 - - 100.0 100.0No. of admissions 2,897 755 520 87 193 7 4 718 592 5 2 3 - - 2 9
Table 3.33b. North Dakota admissions aged 12 and older, by primary substance of abuse and gender, age at admission, and race/ethnicity: Percent distribution, 2015
Gender, age at admission, and race/ethnicity
All admis-sions
aged 12 and older
Primary substance at admission
Alcohol Opiates CocaineMari-juana/
hashish
Metham-phetamine/
amphet-amines
Tran-quil-izers
NOTE: Percentages may not sum to 100 percent due to rounding. Percentages are based on all admissions with known and valid values. Admissions for which values were not collected, unknown, or missing are excluded from the percentage base (denominator).SOURCE: Center for Behavioral Health Statistics and Quality, Substance Abuse and Mental Health Services Administration, Treatment Episode Data Set (TEDS). Data received through 11.01.16.
Seda-tives
Hallu-cino-gens PCP
Inhal-ants
Other/ none speci-fied
- - Quantity is zero.
158

Alcohol only
Secondarydrug Heroin
Other opiates
Smoked cocaine
Other route
Total admissions aged 12 and older 39,046 5,104 5,906 11,836 3,598 1,526 711 7,253 590 192 42 47 58 18 2,165
GenderMale 23,943 3,565 4,195 6,351 1,741 732 411 5,302 308 79 22 42 34 12 1,149Female 15,102 1,538 1,711 5,485 1,857 794 300 1,951 282 113 20 5 24 6 1,016
No. of admissions1 39,045 5,103 5,906 11,836 3,598 1,526 711 7,253 590 192 42 47 58 18 2,165
Age at admission12 to 19 years 3,110 189 252 222 67 8 20 1,959 33 14 4 8 - - 1 33320 to 24 years 5,962 437 713 2,062 568 63 56 1,627 94 18 10 17 - - 3 29425 to 29 years 7,878 627 980 3,246 899 122 114 1,310 142 46 5 6 10 5 36630 to 34 years 6,772 661 876 2,698 812 176 117 908 111 52 4 9 21 2 32535 to 39 years 4,887 619 798 1,584 534 188 116 641 91 21 7 5 16 1 26640 to 44 years 3,245 627 645 806 276 233 71 321 59 19 4 - - 7 2 17545 to 49 years 2,749 652 638 500 179 283 98 220 27 10 - - 1 4 2 13550 to 54 years 2,264 595 550 341 140 260 63 153 20 9 2 1 - - - - 13055 to 59 years 1,386 419 312 213 87 137 43 87 10 2 5 - - - - 2 6960 years and older 793 278 142 164 36 56 13 27 3 1 1 - - - - - - 72
No. of admissions 39,046 5,104 5,906 11,836 3,598 1,526 711 7,253 590 192 42 47 58 18 2,165
Race/ethnicityWhite (non-Hispanic) 30,228 4,026 4,111 10,830 3,284 761 434 4,294 561 175 36 39 6 17 1,654Black (non-Hispanic) 7,378 865 1,616 603 208 722 250 2,637 14 11 5 6 45 1 395Hispanic origin 703 103 87 219 61 14 14 130 10 1 - - - - 4 - - 60American Indian/Alaska Native 65 11 14 16 2 2 - - 15 1 - - - - 1 - - - - 3Asian/Pacific Islander 75 12 8 16 2 3 - - 20 1 1 - - 1 - - - - 11Other 166 21 25 31 12 10 3 53 - - 1 1 - - 3 - - 6
No. of admissions 38,615 5,038 5,861 11,715 3,569 1,512 701 7,149 587 189 42 47 58 18 2,129
SOURCE: Center for Behavioral Health Statistics and Quality, Substance Abuse and Mental Health Services Administration, Treatment Episode Data Set (TEDS). Data received through 11.01.16.
Seda-tives
Hallu-cino-gens PCP
Inhal-ants
Other/ none speci-fied
- - Quantity is zero.1 Admissions for which values were not collected, unknown, or missing are excluded from the sum total.
Table 3.34a. Ohio admissions aged 12 and older, by primary substance of abuse and gender, age at admission, and race/ethnicity: Number, 2015
Gender, age at admission, and race/ethnicity
All admis-sions
aged 12 and older
Primary substance at admission
Alcohol Opiates Cocaine
Mari-juana/
hashish
Metham-phetamine/
amphet-amines
Tran-quil-izers
159

Alcohol only
Secondarydrug Heroin
Other opiates
Smoked cocaine
Other route
Total admissions aged 12 and older 39,046 5,104 5,906 11,836 3,598 1,526 711 7,253 590 192 42 47 58 18 2,165
GenderMale 61.3 69.9 71.0 53.7 48.4 48.0 57.8 73.1 52.2 41.1 52.4 89.4 58.6 66.7 53.1Female 38.7 30.1 29.0 46.3 51.6 52.0 42.2 26.9 47.8 58.9 47.6 10.6 41.4 33.3 46.9
Total 100.0 100.0 100.0 100.0 100.0 100.0 100.0 100.0 100.0 100.0 100.0 100.0 100.0 100.0 100.0No. of admissions 39,045 5,103 5,906 11,836 3,598 1,526 711 7,253 590 192 42 47 58 18 2,165
Age at admission12 to 19 years 8.0 3.7 4.3 1.9 1.9 0.5 2.8 27.0 5.6 7.3 9.5 17.0 - - 5.6 15.420 to 24 years 15.3 8.6 12.1 17.4 15.8 4.1 7.9 22.4 15.9 9.4 23.8 36.2 - - 16.7 13.625 to 29 years 20.2 12.3 16.6 27.4 25.0 8.0 16.0 18.1 24.1 24.0 11.9 12.8 17.2 27.8 16.930 to 34 years 17.3 13.0 14.8 22.8 22.6 11.5 16.5 12.5 18.8 27.1 9.5 19.1 36.2 11.1 15.035 to 39 years 12.5 12.1 13.5 13.4 14.8 12.3 16.3 8.8 15.4 10.9 16.7 10.6 27.6 5.6 12.340 to 44 years 8.3 12.3 10.9 6.8 7.7 15.3 10.0 4.4 10.0 9.9 9.5 - - 12.1 11.1 8.145 to 49 years 7.0 12.8 10.8 4.2 5.0 18.5 13.8 3.0 4.6 5.2 - - 2.1 6.9 11.1 6.250 to 54 years 5.8 11.7 9.3 2.9 3.9 17.0 8.9 2.1 3.4 4.7 4.8 2.1 - - - - 6.055 to 59 years 3.5 8.2 5.3 1.8 2.4 9.0 6.0 1.2 1.7 1.0 11.9 - - - - 11.1 3.260 years and older 2.0 5.4 2.4 1.4 1.0 3.7 1.8 0.4 0.5 0.5 2.4 - - - - - - 3.3
Total 100.0 100.0 100.0 100.0 100.0 100.0 100.0 100.0 100.0 100.0 100.0 100.0 100.0 100.0 100.0No. of admissions 39,046 5,104 5,906 11,836 3,598 1,526 711 7,253 590 192 42 47 58 18 2,165
Race/ethnicityWhite (non-Hispanic) 78.3 79.9 70.1 92.4 92.0 50.3 61.9 60.1 95.6 92.6 85.7 83.0 10.3 94.4 77.7Black (non-Hispanic) 19.1 17.2 27.6 5.1 5.8 47.8 35.7 36.9 2.4 5.8 11.9 12.8 77.6 5.6 18.6Hispanic origin 1.8 2.0 1.5 1.9 1.7 0.9 2.0 1.8 1.7 0.5 - - - - 6.9 - - 2.8American Indian/Alaska Native 0.2 0.2 0.2 0.1 0.1 0.1 - - 0.2 0.2 - - - - 2.1 - - - - 0.1Asian/Pacific Islander 0.2 0.2 0.1 0.1 0.1 0.2 - - 0.3 0.2 0.5 - - 2.1 - - - - 0.5Other 0.4 0.4 0.4 0.3 0.3 0.7 0.4 0.7 - - 0.5 2.4 - - 5.2 - - 0.3
Total 100.0 100.0 100.0 100.0 100.0 100.0 100.0 100.0 100.0 100.0 100.0 100.0 100.0 100.0 100.0No. of admissions 38,615 5,038 5,861 11,715 3,569 1,512 701 7,149 587 189 42 47 58 18 2,129
Table 3.34b. Ohio admissions aged 12 and older, by primary substance of abuse and gender, age at admission, and race/ethnicity: Percent distribution, 2015
Gender, age at admission, and race/ethnicity
All admis-sions
aged 12 and older
Primary substance at admission
Alcohol Opiates CocaineMari-juana/
hashish
Metham-phetamine/
amphet-amines
Tran-quil-izers
NOTE: Percentages may not sum to 100 percent due to rounding. Percentages are based on all admissions with known and valid values. Admissions for which values were not collected, unknown, or missing are excluded from the percentage base (denominator).SOURCE: Center for Behavioral Health Statistics and Quality, Substance Abuse and Mental Health Services Administration, Treatment Episode Data Set (TEDS). Data received through 11.01.16.
Seda-tives
Hallu-cino-gens PCP
Inhal-ants
Other/ none speci-fied
- - Quantity is zero.
160
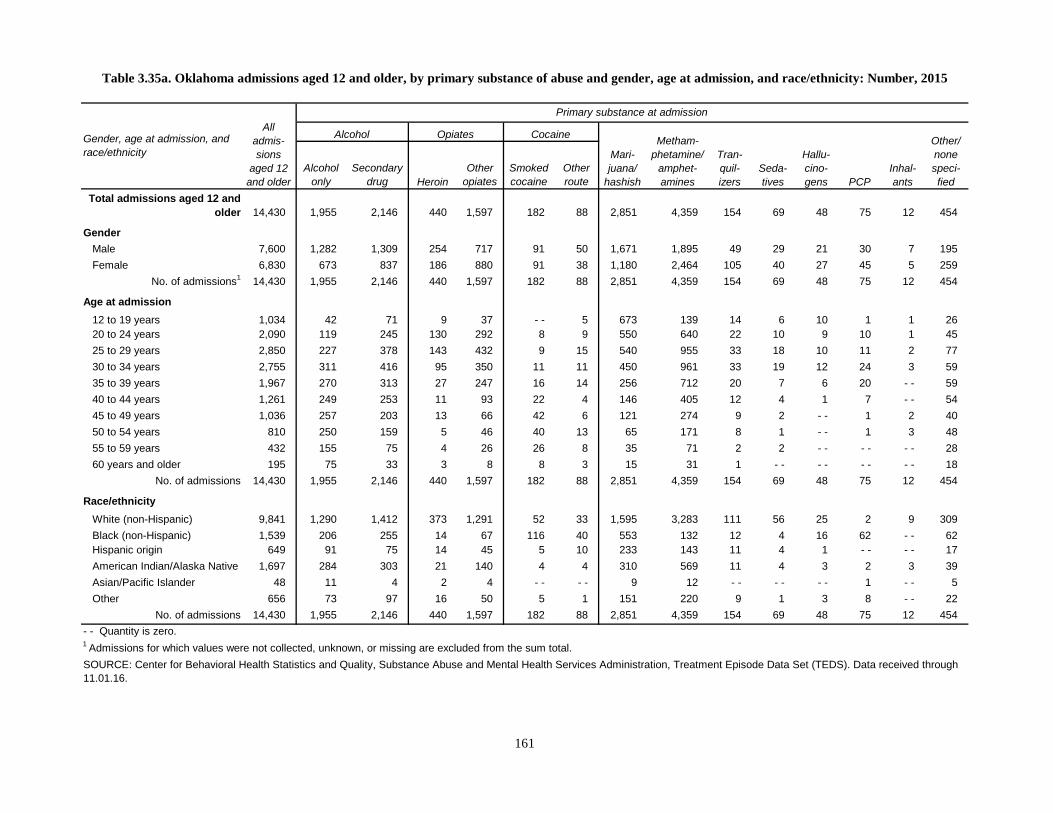
Alcohol only
Secondarydrug Heroin
Other opiates
Smoked cocaine
Other route
Total admissions aged 12 and older 14,430 1,955 2,146 440 1,597 182 88 2,851 4,359 154 69 48 75 12 454
GenderMale 7,600 1,282 1,309 254 717 91 50 1,671 1,895 49 29 21 30 7 195Female 6,830 673 837 186 880 91 38 1,180 2,464 105 40 27 45 5 259
No. of admissions1 14,430 1,955 2,146 440 1,597 182 88 2,851 4,359 154 69 48 75 12 454
Age at admission12 to 19 years 1,034 42 71 9 37 - - 5 673 139 14 6 10 1 1 2620 to 24 years 2,090 119 245 130 292 8 9 550 640 22 10 9 10 1 4525 to 29 years 2,850 227 378 143 432 9 15 540 955 33 18 10 11 2 7730 to 34 years 2,755 311 416 95 350 11 11 450 961 33 19 12 24 3 5935 to 39 years 1,967 270 313 27 247 16 14 256 712 20 7 6 20 - - 5940 to 44 years 1,261 249 253 11 93 22 4 146 405 12 4 1 7 - - 5445 to 49 years 1,036 257 203 13 66 42 6 121 274 9 2 - - 1 2 4050 to 54 years 810 250 159 5 46 40 13 65 171 8 1 - - 1 3 4855 to 59 years 432 155 75 4 26 26 8 35 71 2 2 - - - - - - 2860 years and older 195 75 33 3 8 8 3 15 31 1 - - - - - - - - 18
No. of admissions 14,430 1,955 2,146 440 1,597 182 88 2,851 4,359 154 69 48 75 12 454
Race/ethnicityWhite (non-Hispanic) 9,841 1,290 1,412 373 1,291 52 33 1,595 3,283 111 56 25 2 9 309Black (non-Hispanic) 1,539 206 255 14 67 116 40 553 132 12 4 16 62 - - 62Hispanic origin 649 91 75 14 45 5 10 233 143 11 4 1 - - - - 17American Indian/Alaska Native 1,697 284 303 21 140 4 4 310 569 11 4 3 2 3 39Asian/Pacific Islander 48 11 4 2 4 - - - - 9 12 - - - - - - 1 - - 5Other 656 73 97 16 50 5 1 151 220 9 1 3 8 - - 22
No. of admissions 14,430 1,955 2,146 440 1,597 182 88 2,851 4,359 154 69 48 75 12 454
SOURCE: Center for Behavioral Health Statistics and Quality, Substance Abuse and Mental Health Services Administration, Treatment Episode Data Set (TEDS). Data received through 11.01.16.
Seda-tives
Hallu-cino-gens PCP
Inhal-ants
Other/ none speci-fied
- - Quantity is zero.1 Admissions for which values were not collected, unknown, or missing are excluded from the sum total.
Table 3.35a. Oklahoma admissions aged 12 and older, by primary substance of abuse and gender, age at admission, and race/ethnicity: Number, 2015
Gender, age at admission, and race/ethnicity
All admis-sions
aged 12 and older
Primary substance at admission
Alcohol Opiates Cocaine
Mari-juana/
hashish
Metham-phetamine/
amphet-amines
Tran-quil-izers
161
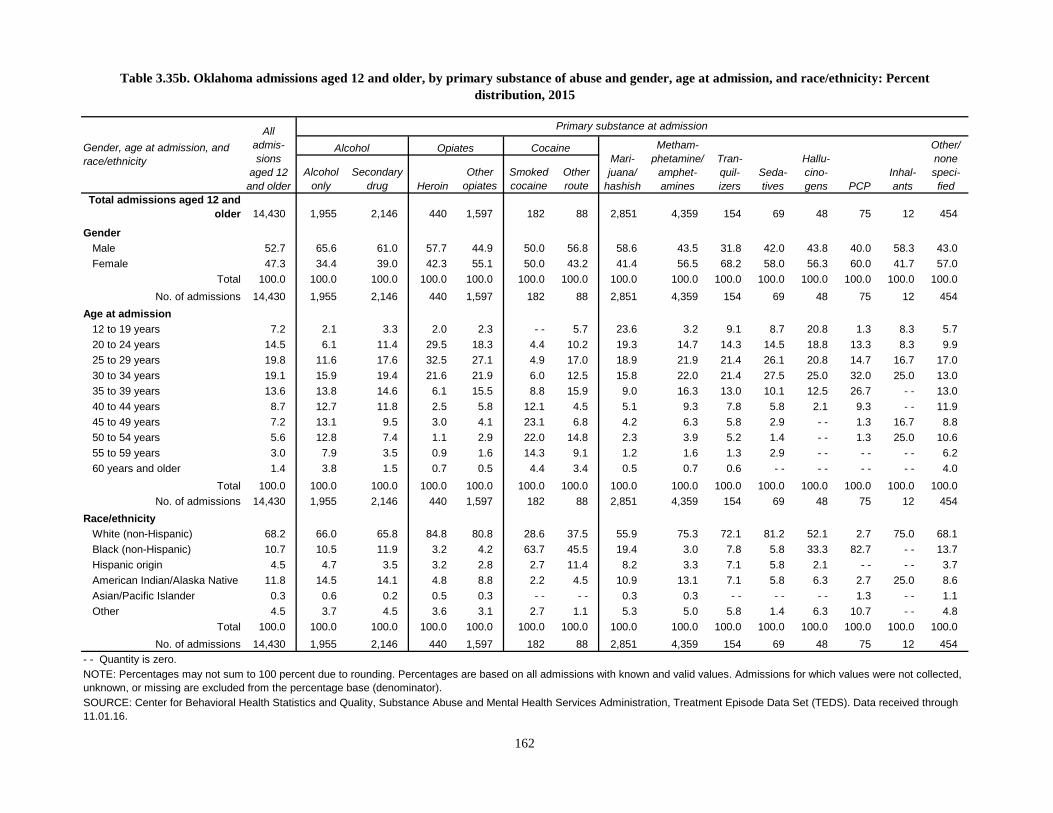
Alcohol only
Secondarydrug Heroin
Other opiates
Smoked cocaine
Other route
Total admissions aged 12 and older 14,430 1,955 2,146 440 1,597 182 88 2,851 4,359 154 69 48 75 12 454
GenderMale 52.7 65.6 61.0 57.7 44.9 50.0 56.8 58.6 43.5 31.8 42.0 43.8 40.0 58.3 43.0Female 47.3 34.4 39.0 42.3 55.1 50.0 43.2 41.4 56.5 68.2 58.0 56.3 60.0 41.7 57.0
Total 100.0 100.0 100.0 100.0 100.0 100.0 100.0 100.0 100.0 100.0 100.0 100.0 100.0 100.0 100.0No. of admissions 14,430 1,955 2,146 440 1,597 182 88 2,851 4,359 154 69 48 75 12 454
Age at admission12 to 19 years 7.2 2.1 3.3 2.0 2.3 - - 5.7 23.6 3.2 9.1 8.7 20.8 1.3 8.3 5.720 to 24 years 14.5 6.1 11.4 29.5 18.3 4.4 10.2 19.3 14.7 14.3 14.5 18.8 13.3 8.3 9.925 to 29 years 19.8 11.6 17.6 32.5 27.1 4.9 17.0 18.9 21.9 21.4 26.1 20.8 14.7 16.7 17.030 to 34 years 19.1 15.9 19.4 21.6 21.9 6.0 12.5 15.8 22.0 21.4 27.5 25.0 32.0 25.0 13.035 to 39 years 13.6 13.8 14.6 6.1 15.5 8.8 15.9 9.0 16.3 13.0 10.1 12.5 26.7 - - 13.040 to 44 years 8.7 12.7 11.8 2.5 5.8 12.1 4.5 5.1 9.3 7.8 5.8 2.1 9.3 - - 11.945 to 49 years 7.2 13.1 9.5 3.0 4.1 23.1 6.8 4.2 6.3 5.8 2.9 - - 1.3 16.7 8.850 to 54 years 5.6 12.8 7.4 1.1 2.9 22.0 14.8 2.3 3.9 5.2 1.4 - - 1.3 25.0 10.655 to 59 years 3.0 7.9 3.5 0.9 1.6 14.3 9.1 1.2 1.6 1.3 2.9 - - - - - - 6.260 years and older 1.4 3.8 1.5 0.7 0.5 4.4 3.4 0.5 0.7 0.6 - - - - - - - - 4.0
Total 100.0 100.0 100.0 100.0 100.0 100.0 100.0 100.0 100.0 100.0 100.0 100.0 100.0 100.0 100.0No. of admissions 14,430 1,955 2,146 440 1,597 182 88 2,851 4,359 154 69 48 75 12 454
Race/ethnicityWhite (non-Hispanic) 68.2 66.0 65.8 84.8 80.8 28.6 37.5 55.9 75.3 72.1 81.2 52.1 2.7 75.0 68.1Black (non-Hispanic) 10.7 10.5 11.9 3.2 4.2 63.7 45.5 19.4 3.0 7.8 5.8 33.3 82.7 - - 13.7Hispanic origin 4.5 4.7 3.5 3.2 2.8 2.7 11.4 8.2 3.3 7.1 5.8 2.1 - - - - 3.7American Indian/Alaska Native 11.8 14.5 14.1 4.8 8.8 2.2 4.5 10.9 13.1 7.1 5.8 6.3 2.7 25.0 8.6Asian/Pacific Islander 0.3 0.6 0.2 0.5 0.3 - - - - 0.3 0.3 - - - - - - 1.3 - - 1.1Other 4.5 3.7 4.5 3.6 3.1 2.7 1.1 5.3 5.0 5.8 1.4 6.3 10.7 - - 4.8
Total 100.0 100.0 100.0 100.0 100.0 100.0 100.0 100.0 100.0 100.0 100.0 100.0 100.0 100.0 100.0No. of admissions 14,430 1,955 2,146 440 1,597 182 88 2,851 4,359 154 69 48 75 12 454
Table 3.35b. Oklahoma admissions aged 12 and older, by primary substance of abuse and gender, age at admission, and race/ethnicity: Percent distribution, 2015
Gender, age at admission, and race/ethnicity
All admis-sions
aged 12 and older
Primary substance at admission
Alcohol Opiates CocaineMari-juana/
hashish
Metham-phetamine/
amphet-amines
Tran-quil-izers
NOTE: Percentages may not sum to 100 percent due to rounding. Percentages are based on all admissions with known and valid values. Admissions for which values were not collected, unknown, or missing are excluded from the percentage base (denominator).SOURCE: Center for Behavioral Health Statistics and Quality, Substance Abuse and Mental Health Services Administration, Treatment Episode Data Set (TEDS). Data received through 11.01.16.
Seda-tives
Hallu-cino-gens PCP
Inhal-ants
Other/ none speci-fied
- - Quantity is zero.
162
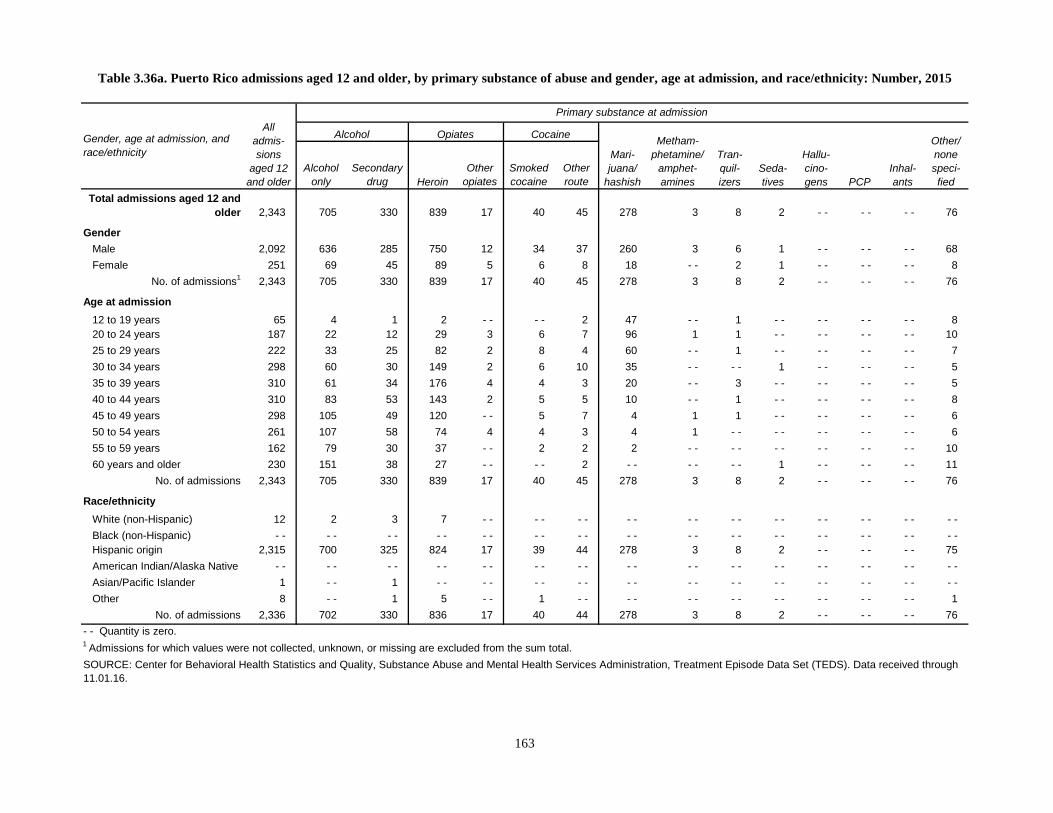
Alcohol only
Secondarydrug Heroin
Other opiates
Smoked cocaine
Other route
Total admissions aged 12 and older 2,343 705 330 839 17 40 45 278 3 8 2 - - - - - - 76
GenderMale 2,092 636 285 750 12 34 37 260 3 6 1 - - - - - - 68Female 251 69 45 89 5 6 8 18 - - 2 1 - - - - - - 8
No. of admissions1 2,343 705 330 839 17 40 45 278 3 8 2 - - - - - - 76
Age at admission12 to 19 years 65 4 1 2 - - - - 2 47 - - 1 - - - - - - - - 820 to 24 years 187 22 12 29 3 6 7 96 1 1 - - - - - - - - 1025 to 29 years 222 33 25 82 2 8 4 60 - - 1 - - - - - - - - 730 to 34 years 298 60 30 149 2 6 10 35 - - - - 1 - - - - - - 535 to 39 years 310 61 34 176 4 4 3 20 - - 3 - - - - - - - - 540 to 44 years 310 83 53 143 2 5 5 10 - - 1 - - - - - - - - 845 to 49 years 298 105 49 120 - - 5 7 4 1 1 - - - - - - - - 650 to 54 years 261 107 58 74 4 4 3 4 1 - - - - - - - - - - 655 to 59 years 162 79 30 37 - - 2 2 2 - - - - - - - - - - - - 1060 years and older 230 151 38 27 - - - - 2 - - - - - - 1 - - - - - - 11
No. of admissions 2,343 705 330 839 17 40 45 278 3 8 2 - - - - - - 76
Race/ethnicityWhite (non-Hispanic) 12 2 3 7 - - - - - - - - - - - - - - - - - - - - - -Black (non-Hispanic) - - - - - - - - - - - - - - - - - - - - - - - - - - - - - -Hispanic origin 2,315 700 325 824 17 39 44 278 3 8 2 - - - - - - 75American Indian/Alaska Native - - - - - - - - - - - - - - - - - - - - - - - - - - - - - -Asian/Pacific Islander 1 - - 1 - - - - - - - - - - - - - - - - - - - - - - - -Other 8 - - 1 5 - - 1 - - - - - - - - - - - - - - - - 1
No. of admissions 2,336 702 330 836 17 40 44 278 3 8 2 - - - - - - 76
SOURCE: Center for Behavioral Health Statistics and Quality, Substance Abuse and Mental Health Services Administration, Treatment Episode Data Set (TEDS). Data received through 11.01.16.
Seda-tives
Hallu-cino-gens PCP
Inhal-ants
Other/ none speci-fied
- - Quantity is zero.1 Admissions for which values were not collected, unknown, or missing are excluded from the sum total.
Table 3.36a. Puerto Rico admissions aged 12 and older, by primary substance of abuse and gender, age at admission, and race/ethnicity: Number, 2015
Gender, age at admission, and race/ethnicity
All admis-sions
aged 12 and older
Primary substance at admission
Alcohol Opiates Cocaine
Mari-juana/
hashish
Metham-phetamine/
amphet-amines
Tran-quil-izers
163
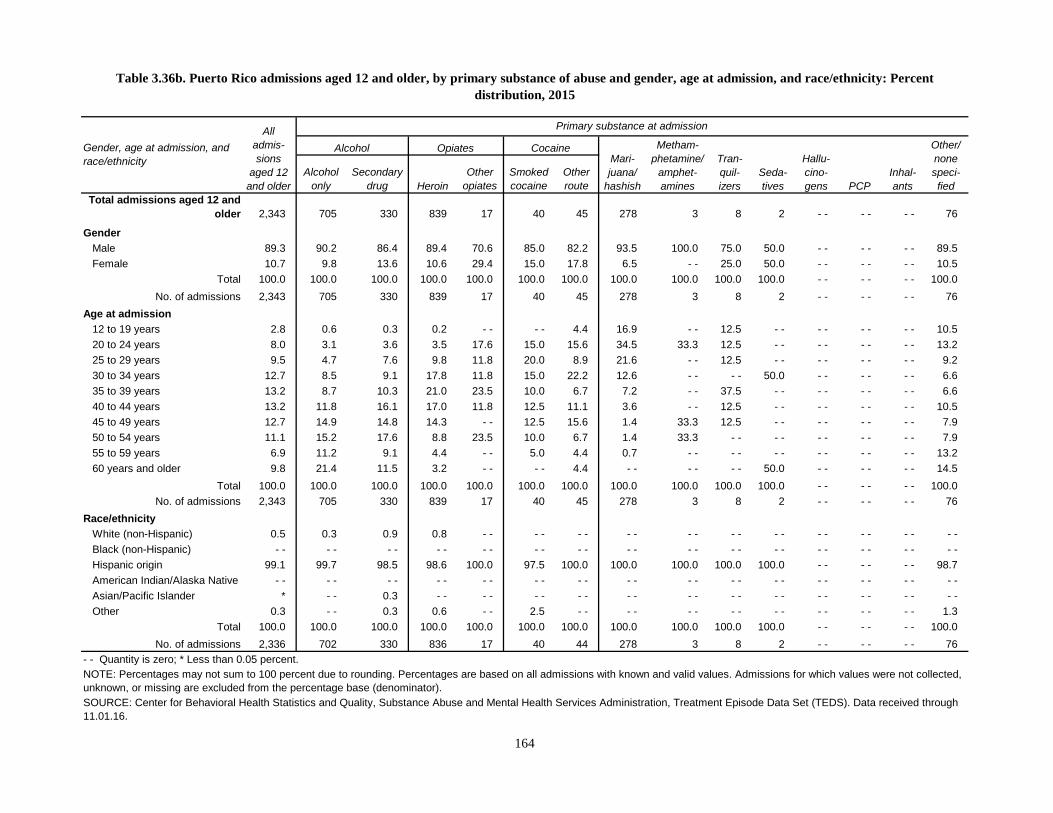
Alcohol only
Secondarydrug Heroin
Other opiates
Smoked cocaine
Other route
Total admissions aged 12 and older 2,343 705 330 839 17 40 45 278 3 8 2 - - - - - - 76
GenderMale 89.3 90.2 86.4 89.4 70.6 85.0 82.2 93.5 100.0 75.0 50.0 - - - - - - 89.5Female 10.7 9.8 13.6 10.6 29.4 15.0 17.8 6.5 - - 25.0 50.0 - - - - - - 10.5
Total 100.0 100.0 100.0 100.0 100.0 100.0 100.0 100.0 100.0 100.0 100.0 - - - - - - 100.0No. of admissions 2,343 705 330 839 17 40 45 278 3 8 2 - - - - - - 76
Age at admission12 to 19 years 2.8 0.6 0.3 0.2 - - - - 4.4 16.9 - - 12.5 - - - - - - - - 10.520 to 24 years 8.0 3.1 3.6 3.5 17.6 15.0 15.6 34.5 33.3 12.5 - - - - - - - - 13.225 to 29 years 9.5 4.7 7.6 9.8 11.8 20.0 8.9 21.6 - - 12.5 - - - - - - - - 9.230 to 34 years 12.7 8.5 9.1 17.8 11.8 15.0 22.2 12.6 - - - - 50.0 - - - - - - 6.635 to 39 years 13.2 8.7 10.3 21.0 23.5 10.0 6.7 7.2 - - 37.5 - - - - - - - - 6.640 to 44 years 13.2 11.8 16.1 17.0 11.8 12.5 11.1 3.6 - - 12.5 - - - - - - - - 10.545 to 49 years 12.7 14.9 14.8 14.3 - - 12.5 15.6 1.4 33.3 12.5 - - - - - - - - 7.950 to 54 years 11.1 15.2 17.6 8.8 23.5 10.0 6.7 1.4 33.3 - - - - - - - - - - 7.955 to 59 years 6.9 11.2 9.1 4.4 - - 5.0 4.4 0.7 - - - - - - - - - - - - 13.260 years and older 9.8 21.4 11.5 3.2 - - - - 4.4 - - - - - - 50.0 - - - - - - 14.5
Total 100.0 100.0 100.0 100.0 100.0 100.0 100.0 100.0 100.0 100.0 100.0 - - - - - - 100.0No. of admissions 2,343 705 330 839 17 40 45 278 3 8 2 - - - - - - 76
Race/ethnicityWhite (non-Hispanic) 0.5 0.3 0.9 0.8 - - - - - - - - - - - - - - - - - - - - - -Black (non-Hispanic) - - - - - - - - - - - - - - - - - - - - - - - - - - - - - -Hispanic origin 99.1 99.7 98.5 98.6 100.0 97.5 100.0 100.0 100.0 100.0 100.0 - - - - - - 98.7American Indian/Alaska Native - - - - - - - - - - - - - - - - - - - - - - - - - - - - - -Asian/Pacific Islander * - - 0.3 - - - - - - - - - - - - - - - - - - - - - - - -Other 0.3 - - 0.3 0.6 - - 2.5 - - - - - - - - - - - - - - - - 1.3
Total 100.0 100.0 100.0 100.0 100.0 100.0 100.0 100.0 100.0 100.0 100.0 - - - - - - 100.0No. of admissions 2,336 702 330 836 17 40 44 278 3 8 2 - - - - - - 76
Table 3.36b. Puerto Rico admissions aged 12 and older, by primary substance of abuse and gender, age at admission, and race/ethnicity: Percent distribution, 2015
Gender, age at admission, and race/ethnicity
All admis-sions
aged 12 and older
Primary substance at admission
Alcohol Opiates CocaineMari-juana/
hashish
Metham-phetamine/
amphet-amines
Tran-quil-izers
NOTE: Percentages may not sum to 100 percent due to rounding. Percentages are based on all admissions with known and valid values. Admissions for which values were not collected, unknown, or missing are excluded from the percentage base (denominator).SOURCE: Center for Behavioral Health Statistics and Quality, Substance Abuse and Mental Health Services Administration, Treatment Episode Data Set (TEDS). Data received through 11.01.16.
Seda-tives
Hallu-cino-gens PCP
Inhal-ants
Other/ none speci-fied
- - Quantity is zero; * Less than 0.05 percent.
164

Alcohol only
Secondarydrug Heroin
Other opiates
Smoked cocaine
Other route
Total admissions aged 12 and older 11,152 2,840 1,481 3,982 971 398 262 879 46 101 16 8 - - 3 165
GenderMale 7,696 2,005 1,115 2,703 607 208 183 654 28 70 9 6 - - 2 106Female 3,456 835 366 1,279 364 190 79 225 18 31 7 2 - - 1 59
No. of admissions1 11,152 2,840 1,481 3,982 971 398 262 879 46 101 16 8 - - 3 165
Age at admission12 to 19 years 435 20 33 80 17 3 9 255 4 6 2 1 - - - - 520 to 24 years 1,459 176 198 661 114 20 33 212 5 16 1 3 - - 1 1925 to 29 years 2,053 281 243 1,037 180 33 57 159 8 24 1 - - - - 1 2930 to 34 years 1,821 333 217 766 204 73 58 99 11 24 5 4 - - - - 2735 to 39 years 1,331 312 195 499 150 63 24 50 6 11 - - - - - - - - 2140 to 44 years 1,144 351 166 387 83 66 28 39 3 8 - - - - - - - - 1345 to 49 years 1,104 447 142 265 96 67 25 32 2 7 4 - - - - 1 1650 to 54 years 936 439 177 155 62 46 14 18 3 5 1 - - - - - - 1655 to 59 years 550 276 78 103 43 23 8 8 - - - - 1 - - - - - - 1060 years and older 319 205 32 29 22 4 6 7 4 - - 1 - - - - - - 9
No. of admissions 11,152 2,840 1,481 3,982 971 398 262 879 46 101 16 8 - - 3 165
Race/ethnicityWhite (non-Hispanic) 8,811 2,350 1,106 3,367 843 265 162 451 42 94 14 5 - - 1 111Black (non-Hispanic) 646 144 134 89 26 73 26 138 2 2 1 1 - - - - 10Hispanic origin 998 190 106 349 45 37 38 210 1 3 - - 1 - - - - 18American Indian/Alaska Native 56 8 19 12 3 5 - - 7 - - - - 1 1 - - - - - -Asian/Pacific Islander 79 17 7 24 8 3 7 10 - - - - - - - - - - - - 3Other 94 16 10 31 8 4 3 19 - - - - - - - - - - - - 3
No. of admissions 10,684 2,725 1,382 3,872 933 387 236 835 45 99 16 8 - - 1 145
SOURCE: Center for Behavioral Health Statistics and Quality, Substance Abuse and Mental Health Services Administration, Treatment Episode Data Set (TEDS). Data received through 11.01.16.
Seda-tives
Hallu-cino-gens PCP
Inhal-ants
Other/ none speci-fied
- - Quantity is zero.1 Admissions for which values were not collected, unknown, or missing are excluded from the sum total.
Table 3.37a. Rhode Island admissions aged 12 and older, by primary substance of abuse and gender, age at admission, and race/ethnicity: Number, 2015
Gender, age at admission, and race/ethnicity
All admis-sions
aged 12 and older
Primary substance at admission
Alcohol Opiates Cocaine
Mari-juana/
hashish
Metham-phetamine/
amphet-amines
Tran-quil-izers
165

Alcohol only
Secondarydrug Heroin
Other opiates
Smoked cocaine
Other route
Total admissions aged 12 and older 11,152 2,840 1,481 3,982 971 398 262 879 46 101 16 8 - - 3 165
GenderMale 69.0 70.6 75.3 67.9 62.5 52.3 69.8 74.4 60.9 69.3 56.3 75.0 - - 66.7 64.2Female 31.0 29.4 24.7 32.1 37.5 47.7 30.2 25.6 39.1 30.7 43.8 25.0 - - 33.3 35.8
Total 100.0 100.0 100.0 100.0 100.0 100.0 100.0 100.0 100.0 100.0 100.0 100.0 - - 100.0 100.0No. of admissions 11,152 2,840 1,481 3,982 971 398 262 879 46 101 16 8 - - 3 165
Age at admission12 to 19 years 3.9 0.7 2.2 2.0 1.8 0.8 3.4 29.0 8.7 5.9 12.5 12.5 - - - - 3.020 to 24 years 13.1 6.2 13.4 16.6 11.7 5.0 12.6 24.1 10.9 15.8 6.3 37.5 - - 33.3 11.525 to 29 years 18.4 9.9 16.4 26.0 18.5 8.3 21.8 18.1 17.4 23.8 6.3 - - - - 33.3 17.630 to 34 years 16.3 11.7 14.7 19.2 21.0 18.3 22.1 11.3 23.9 23.8 31.3 50.0 - - - - 16.435 to 39 years 11.9 11.0 13.2 12.5 15.4 15.8 9.2 5.7 13.0 10.9 - - - - - - - - 12.740 to 44 years 10.3 12.4 11.2 9.7 8.5 16.6 10.7 4.4 6.5 7.9 - - - - - - - - 7.945 to 49 years 9.9 15.7 9.6 6.7 9.9 16.8 9.5 3.6 4.3 6.9 25.0 - - - - 33.3 9.750 to 54 years 8.4 15.5 12.0 3.9 6.4 11.6 5.3 2.0 6.5 5.0 6.3 - - - - - - 9.755 to 59 years 4.9 9.7 5.3 2.6 4.4 5.8 3.1 0.9 - - - - 6.3 - - - - - - 6.160 years and older 2.9 7.2 2.2 0.7 2.3 1.0 2.3 0.8 8.7 - - 6.3 - - - - - - 5.5
Total 100.0 100.0 100.0 100.0 100.0 100.0 100.0 100.0 100.0 100.0 100.0 100.0 - - 100.0 100.0No. of admissions 11,152 2,840 1,481 3,982 971 398 262 879 46 101 16 8 - - 3 165
Race/ethnicityWhite (non-Hispanic) 82.5 86.2 80.0 87.0 90.4 68.5 68.6 54.0 93.3 94.9 87.5 62.5 - - 100.0 76.6Black (non-Hispanic) 6.0 5.3 9.7 2.3 2.8 18.9 11.0 16.5 4.4 2.0 6.3 12.5 - - - - 6.9Hispanic origin 9.3 7.0 7.7 9.0 4.8 9.6 16.1 25.1 2.2 3.0 - - 12.5 - - - - 12.4American Indian/Alaska Native 0.5 0.3 1.4 0.3 0.3 1.3 - - 0.8 - - - - 6.3 12.5 - - - - - -Asian/Pacific Islander 0.7 0.6 0.5 0.6 0.9 0.8 3.0 1.2 - - - - - - - - - - - - 2.1Other 0.9 0.6 0.7 0.8 0.9 1.0 1.3 2.3 - - - - - - - - - - - - 2.1
Total 100.0 100.0 100.0 100.0 100.0 100.0 100.0 100.0 100.0 100.0 100.0 100.0 - - 100.0 100.0No. of admissions 10,684 2,725 1,382 3,872 933 387 236 835 45 99 16 8 - - 1 145
Table 3.37b. Rhode Island admissions aged 12 and older, by primary substance of abuse and gender, age at admission, and race/ethnicity: Percent distribution, 2015
Gender, age at admission, and race/ethnicity
All admis-sions
aged 12 and older
Primary substance at admission
Alcohol Opiates CocaineMari-juana/
hashish
Metham-phetamine/
amphet-amines
Tran-quil-izers
NOTE: Percentages may not sum to 100 percent due to rounding. Percentages are based on all admissions with known and valid values. Admissions for which values were not collected, unknown, or missing are excluded from the percentage base (denominator).SOURCE: Center for Behavioral Health Statistics and Quality, Substance Abuse and Mental Health Services Administration, Treatment Episode Data Set (TEDS). Data received through 11.01.16.
Seda-tives
Hallu-cino-gens PCP
Inhal-ants
Other/ none speci-fied
- - Quantity is zero.
166

Alcohol only
Secondarydrug Heroin
Other opiates
Smoked cocaine
Other route
Total admissions aged 12 and older 12,056 5,155 3,111 64 376 19 29 1,665 1,368 10 34 8 1 25 191
GenderMale 8,065 3,712 2,164 39 193 10 17 1,133 641 5 12 3 1 6 129Female 3,991 1,443 947 25 183 9 12 532 727 5 22 5 - - 19 62
No. of admissions1 12,056 5,155 3,111 64 376 19 29 1,665 1,368 10 34 8 1 25 191
Age at admission12 to 19 years 1,330 99 333 4 22 - - 2 736 82 3 7 2 - - 10 3020 to 24 years 1,543 313 464 17 81 1 4 350 266 - - 3 3 - - 7 3425 to 29 years 1,746 526 519 15 102 4 4 209 315 1 6 2 - - 4 3930 to 34 years 1,822 735 565 12 60 1 5 152 269 - - 4 - - - - 1 1835 to 39 years 1,430 696 341 9 51 4 2 103 189 3 7 - - - - - - 2540 to 44 years 1,235 766 270 5 22 1 4 41 110 - - 2 1 1 - - 1245 to 49 years 911 574 189 1 16 5 3 34 66 1 - - - - - - 1 2150 to 54 years 1,015 693 232 1 9 3 2 21 45 2 1 - - - - 2 455 to 59 years 593 402 141 - - 8 - - 3 12 19 - - 3 - - - - - - 560 years and older 431 351 57 - - 5 - - - - 7 7 - - 1 - - - - - - 3
No. of admissions 12,056 5,155 3,111 64 376 19 29 1,665 1,368 10 34 8 1 25 191
Race/ethnicityWhite (non-Hispanic) 5,776 1,886 1,540 45 275 6 18 972 863 8 28 6 1 9 119Black (non-Hispanic) 338 105 115 - - 2 5 2 83 23 - - - - - - - - - - 3Hispanic origin 281 98 82 2 8 - - - - 57 30 1 1 - - - - - - 2American Indian/Alaska Native 5,305 2,898 1,299 13 87 7 8 489 417 1 3 2 - - 16 65Asian/Pacific Islander 57 17 13 1 - - - - 1 19 6 - - - - - - - - - - - -Other 295 150 60 3 4 1 - - 45 29 - - 2 - - - - - - 1
No. of admissions 12,052 5,154 3,109 64 376 19 29 1,665 1,368 10 34 8 1 25 190
Table 3.38a. South Dakota admissions aged 12 and older, by primary substance of abuse and gender, age at admission, and race/ethnicity: Number, 2015
Gender, age at admission, and race/ethnicity
All admis-sions
aged 12 and older
Primary substance at admission
Alcohol Opiates Cocaine
Mari-juana/
hashish
Metham-phetamine/
amphet-amines
Tran-quil-izers
SOURCE: Center for Behavioral Health Statistics and Quality, Substance Abuse and Mental Health Services Administration, Treatment Episode Data Set (TEDS). Data received through 11.01.16.
Seda-tives
Hallu-cino-gens PCP
Inhal-ants
Other/ none speci-fied
- - Quantity is zero.1 Admissions for which values were not collected, unknown, or missing are excluded from the sum total.
167

Alcohol only
Secondarydrug Heroin
Other opiates
Smoked cocaine
Other route
Total admissions aged 12 and older 12,056 5,155 3,111 64 376 19 29 1,665 1,368 10 34 8 1 25 191
GenderMale 66.9 72.0 69.6 60.9 51.3 52.6 58.6 68.0 46.9 50.0 35.3 37.5 100.0 24.0 67.5Female 33.1 28.0 30.4 39.1 48.7 47.4 41.4 32.0 53.1 50.0 64.7 62.5 - - 76.0 32.5
Total 100.0 100.0 100.0 100.0 100.0 100.0 100.0 100.0 100.0 100.0 100.0 100.0 100.0 100.0 100.0No. of admissions 12,056 5,155 3,111 64 376 19 29 1,665 1,368 10 34 8 1 25 191
Age at admission12 to 19 years 11.0 1.9 10.7 6.3 5.9 - - 6.9 44.2 6.0 30.0 20.6 25.0 - - 40.0 15.720 to 24 years 12.8 6.1 14.9 26.6 21.5 5.3 13.8 21.0 19.4 - - 8.8 37.5 - - 28.0 17.825 to 29 years 14.5 10.2 16.7 23.4 27.1 21.1 13.8 12.6 23.0 10.0 17.6 25.0 - - 16.0 20.430 to 34 years 15.1 14.3 18.2 18.8 16.0 5.3 17.2 9.1 19.7 - - 11.8 - - - - 4.0 9.435 to 39 years 11.9 13.5 11.0 14.1 13.6 21.1 6.9 6.2 13.8 30.0 20.6 - - - - - - 13.140 to 44 years 10.2 14.9 8.7 7.8 5.9 5.3 13.8 2.5 8.0 - - 5.9 12.5 100.0 - - 6.345 to 49 years 7.6 11.1 6.1 1.6 4.3 26.3 10.3 2.0 4.8 10.0 - - - - - - 4.0 11.050 to 54 years 8.4 13.4 7.5 1.6 2.4 15.8 6.9 1.3 3.3 20.0 2.9 - - - - 8.0 2.155 to 59 years 4.9 7.8 4.5 - - 2.1 - - 10.3 0.7 1.4 - - 8.8 - - - - - - 2.660 years and older 3.6 6.8 1.8 - - 1.3 - - - - 0.4 0.5 - - 2.9 - - - - - - 1.6
Total 100.0 100.0 100.0 100.0 100.0 100.0 100.0 100.0 100.0 100.0 100.0 100.0 100.0 100.0 100.0No. of admissions 12,056 5,155 3,111 64 376 19 29 1,665 1,368 10 34 8 1 25 191
Race/ethnicityWhite (non-Hispanic) 47.9 36.6 49.5 70.3 73.1 31.6 62.1 58.4 63.1 80.0 82.4 75.0 100.0 36.0 62.6Black (non-Hispanic) 2.8 2.0 3.7 - - 0.5 26.3 6.9 5.0 1.7 - - - - - - - - - - 1.6Hispanic origin 2.3 1.9 2.6 3.1 2.1 - - - - 3.4 2.2 10.0 2.9 - - - - - - 1.1American Indian/Alaska Native 44.0 56.2 41.8 20.3 23.1 36.8 27.6 29.4 30.5 10.0 8.8 25.0 - - 64.0 34.2Asian/Pacific Islander 0.5 0.3 0.4 1.6 - - - - 3.4 1.1 0.4 - - - - - - - - - - - -Other 2.4 2.9 1.9 4.7 1.1 5.3 - - 2.7 2.1 - - 5.9 - - - - - - 0.5
Total 100.0 100.0 100.0 100.0 100.0 100.0 100.0 100.0 100.0 100.0 100.0 100.0 100.0 100.0 100.0No. of admissions 12,052 5,154 3,109 64 376 19 29 1,665 1,368 10 34 8 1 25 190
Table 3.38b. South Dakota admissions aged 12 and older, by primary substance of abuse and gender, age at admission, and race/ethnicity: Percent distribution, 2015
Gender, age at admission, and race/ethnicity
All admis-sions
aged 12 and older
Primary substance at admission
Alcohol Opiates CocaineMari-juana/
hashish
Metham-phetamine/
amphet-amines
Tran-quil-izers
NOTE: Percentages may not sum to 100 percent due to rounding. Percentages are based on all admissions with known and valid values. Admissions for which values were not collected, unknown, or missing are excluded from the percentage base (denominator).SOURCE: Center for Behavioral Health Statistics and Quality, Substance Abuse and Mental Health Services Administration, Treatment Episode Data Set (TEDS). Data received through 11.01.16.
Seda-tives
Hallu-cino-gens PCP
Inhal-ants
Other/ none speci-fied
- - Quantity is zero.
168

Alcohol only
Secondarydrug Heroin
Other opiates
Smoked cocaine
Other route
Total admissions aged 12 and older 14,916 2,040 2,161 1,083 4,326 849 427 2,233 1,298 284 63 4 1 6 141
GenderMale 9,628 1,491 1,578 685 2,349 516 316 1,704 755 116 29 1 1 3 84Female 5,286 549 583 398 1,977 332 111 529 543 168 34 2 - - 3 57
No. of admissions1 14,914 2,040 2,161 1,083 4,326 848 427 2,233 1,298 284 63 3 1 6 141
Age at admission12 to 19 years 897 42 47 20 60 1 3 641 34 5 2 3 1 - - 3820 to 24 years 1,705 89 159 161 565 23 39 437 176 36 7 - - - - - - 1325 to 29 years 2,990 197 296 335 1,224 55 84 410 282 60 16 1 - - 1 2930 to 34 years 2,809 243 340 242 1,032 111 92 295 345 72 19 - - - - 2 1635 to 39 years 2,068 252 327 159 659 124 68 196 221 46 2 - - - - 2 1240 to 44 years 1,574 302 301 78 378 140 66 140 127 26 6 - - - - - - 1045 to 49 years 1,171 307 276 41 219 141 37 49 64 24 4 - - - - 1 850 to 54 years 947 306 243 20 121 141 18 48 32 9 2 - - - - - - 755 to 59 years 531 210 122 14 46 85 14 13 14 5 4 - - - - - - 460 years and older 224 92 50 13 22 28 6 4 3 1 1 - - - - - - 4
No. of admissions 14,916 2,040 2,161 1,083 4,326 849 427 2,233 1,298 284 63 4 1 6 141
Race/ethnicityWhite (non-Hispanic) 9,919 1,331 1,264 761 3,712 247 108 979 1,137 224 53 3 - - 6 94Black (non-Hispanic) 2,234 255 405 87 127 379 201 716 16 16 1 - - 1 - - 30Hispanic origin 2,551 423 464 225 433 213 113 486 131 40 7 1 - - - - 15American Indian/Alaska Native 19 3 1 1 6 - - - - 3 4 - - 1 - - - - - - - -Asian/Pacific Islander 20 5 2 2 5 1 1 1 1 2 - - - - - - - - - -Other 153 21 24 5 34 9 4 45 7 2 1 - - - - - - 1
No. of admissions 14,896 2,038 2,160 1,081 4,317 849 427 2,230 1,296 284 63 4 1 6 140
Table 3.39a. Tennessee admissions aged 12 and older, by primary substance of abuse and gender, age at admission, and race/ethnicity: Number, 2015
Gender, age at admission, and race/ethnicity
All admis-sions
aged 12 and older
Primary substance at admission
Alcohol Opiates Cocaine
Mari-juana/
hashish
Metham-phetamine/
amphet-amines
Tran-quil-izers
SOURCE: Center for Behavioral Health Statistics and Quality, Substance Abuse and Mental Health Services Administration, Treatment Episode Data Set (TEDS). Data received through 11.01.16.
Seda-tives
Hallu-cino-gens PCP
Inhal-ants
Other/ none speci-fied
- - Quantity is zero.1 Admissions for which values were not collected, unknown, or missing are excluded from the sum total.
169

Alcohol only
Secondarydrug Heroin
Other opiates
Smoked cocaine
Other route
Total admissions aged 12 and older 14,916 2,040 2,161 1,083 4,326 849 427 2,233 1,298 284 63 4 1 6 141
GenderMale 64.6 73.1 73.0 63.3 54.3 60.8 74.0 76.3 58.2 40.8 46.0 33.3 100.0 50.0 59.6Female 35.4 26.9 27.0 36.7 45.7 39.2 26.0 23.7 41.8 59.2 54.0 66.7 - - 50.0 40.4
Total 100.0 100.0 100.0 100.0 100.0 100.0 100.0 100.0 100.0 100.0 100.0 100.0 100.0 100.0 100.0No. of admissions 14,914 2,040 2,161 1,083 4,326 848 427 2,233 1,298 284 63 3 1 6 141
Age at admission12 to 19 years 6.0 2.1 2.2 1.8 1.4 0.1 0.7 28.7 2.6 1.8 3.2 75.0 100.0 - - 27.020 to 24 years 11.4 4.4 7.4 14.9 13.1 2.7 9.1 19.6 13.6 12.7 11.1 - - - - - - 9.225 to 29 years 20.0 9.7 13.7 30.9 28.3 6.5 19.7 18.4 21.7 21.1 25.4 25.0 - - 16.7 20.630 to 34 years 18.8 11.9 15.7 22.3 23.9 13.1 21.5 13.2 26.6 25.4 30.2 - - - - 33.3 11.335 to 39 years 13.9 12.4 15.1 14.7 15.2 14.6 15.9 8.8 17.0 16.2 3.2 - - - - 33.3 8.540 to 44 years 10.6 14.8 13.9 7.2 8.7 16.5 15.5 6.3 9.8 9.2 9.5 - - - - - - 7.145 to 49 years 7.9 15.0 12.8 3.8 5.1 16.6 8.7 2.2 4.9 8.5 6.3 - - - - 16.7 5.750 to 54 years 6.3 15.0 11.2 1.8 2.8 16.6 4.2 2.1 2.5 3.2 3.2 - - - - - - 5.055 to 59 years 3.6 10.3 5.6 1.3 1.1 10.0 3.3 0.6 1.1 1.8 6.3 - - - - - - 2.860 years and older 1.5 4.5 2.3 1.2 0.5 3.3 1.4 0.2 0.2 0.4 1.6 - - - - - - 2.8
Total 100.0 100.0 100.0 100.0 100.0 100.0 100.0 100.0 100.0 100.0 100.0 100.0 100.0 100.0 100.0No. of admissions 14,916 2,040 2,161 1,083 4,326 849 427 2,233 1,298 284 63 4 1 6 141
Race/ethnicityWhite (non-Hispanic) 66.6 65.3 58.5 70.4 86.0 29.1 25.3 43.9 87.7 78.9 84.1 75.0 - - 100.0 67.1Black (non-Hispanic) 15.0 12.5 18.8 8.0 2.9 44.6 47.1 32.1 1.2 5.6 1.6 - - 100.0 - - 21.4Hispanic origin 17.1 20.8 21.5 20.8 10.0 25.1 26.5 21.8 10.1 14.1 11.1 25.0 - - - - 10.7American Indian/Alaska Native 0.1 0.1 * 0.1 0.1 - - - - 0.1 0.3 - - 1.6 - - - - - - - -Asian/Pacific Islander 0.1 0.2 0.1 0.2 0.1 0.1 0.2 * 0.1 0.7 - - - - - - - - - -Other 1.0 1.0 1.1 0.5 0.8 1.1 0.9 2.0 0.5 0.7 1.6 - - - - - - 0.7
Total 100.0 100.0 100.0 100.0 100.0 100.0 100.0 100.0 100.0 100.0 100.0 100.0 100.0 100.0 100.0No. of admissions 14,896 2,038 2,160 1,081 4,317 849 427 2,230 1,296 284 63 4 1 6 140
Table 3.39b. Tennessee admissions aged 12 and older, by primary substance of abuse and gender, age at admission, and race/ethnicity: Percent distribution, 2015
Gender, age at admission, and race/ethnicity
All admis-sions
aged 12 and older
Primary substance at admission
Alcohol Opiates CocaineMari-juana/
hashish
Metham-phetamine/
amphet-amines
Tran-quil-izers
NOTE: Percentages may not sum to 100 percent due to rounding. Percentages are based on all admissions with known and valid values. Admissions for which values were not collected, unknown, or missing are excluded from the percentage base (denominator).SOURCE: Center for Behavioral Health Statistics and Quality, Substance Abuse and Mental Health Services Administration, Treatment Episode Data Set (TEDS). Data received through 11.01.16.
Seda-tives
Hallu-cino-gens PCP
Inhal-ants
Other/ none speci-fied
- - Quantity is zero; * Less than 0.05 percent.
170

Alcohol only
Secondarydrug Heroin
Other opiates
Smoked cocaine
Other route
Total admissions aged 12 and older 37,370 5,474 4,928 6,586 2,238 1,851 1,362 7,559 6,233 630 23 62 230 29 165
GenderMale 22,420 3,850 3,299 4,306 1,003 1,051 692 5,026 2,682 258 8 44 93 14 94Female 14,950 1,624 1,629 2,280 1,235 800 670 2,533 3,551 372 15 18 137 15 71
No. of admissions1 37,370 5,474 4,928 6,586 2,238 1,851 1,362 7,559 6,233 630 23 62 230 29 165
Age at admission12 to 19 years 3,859 34 159 149 34 7 70 3,075 206 88 - - 14 1 7 1520 to 24 years 4,956 274 464 1,145 228 49 169 1,535 923 95 4 10 24 3 3325 to 29 years 7,110 571 796 1,602 534 142 311 1,322 1,560 180 5 5 48 2 3230 to 34 years 6,715 762 898 1,408 591 243 301 776 1,483 121 5 17 72 4 3435 to 39 years 4,435 719 730 809 286 223 202 409 899 58 7 5 62 6 2040 to 44 years 3,239 807 564 474 182 263 128 188 574 27 - - 2 19 3 845 to 49 years 2,728 813 538 352 139 328 73 126 324 16 1 3 4 2 950 to 54 years 2,325 753 454 287 126 339 68 72 183 27 - - 4 - - 2 1055 to 59 years 1,372 486 244 239 84 172 22 38 67 14 1 2 - - - - 360 years and older 631 255 81 121 34 85 18 18 14 4 - - - - - - - - 1
No. of admissions 37,370 5,474 4,928 6,586 2,238 1,851 1,362 7,559 6,233 630 23 62 230 29 165
Race/ethnicityWhite (non-Hispanic) 20,151 3,215 2,749 3,960 1,623 520 326 2,470 4,726 388 14 28 22 16 94Black (non-Hispanic) 5,617 514 715 471 178 970 381 1,853 243 68 6 18 187 2 11Hispanic origin 11,006 1,608 1,380 2,085 408 341 637 3,114 1,163 164 3 14 21 8 60American Indian/Alaska Native 151 37 33 14 10 4 3 19 29 2 - - - - - - - - - -Asian/Pacific Islander 170 41 16 13 4 7 4 41 36 8 - - - - - - - - - -Other 273 58 34 43 15 9 11 62 36 - - - - 2 - - 3 - -
No. of admissions 37,368 5,473 4,927 6,586 2,238 1,851 1,362 7,559 6,233 630 23 62 230 29 165
Table 3.40a. Texas admissions aged 12 and older, by primary substance of abuse and gender, age at admission, and race/ethnicity: Number, 2015
Gender, age at admission, and race/ethnicity
All admis-sions
aged 12 and older
Primary substance at admission
Alcohol Opiates Cocaine
Mari-juana/
hashish
Metham-phetamine/
amphet-amines
Tran-quil-izers
SOURCE: Center for Behavioral Health Statistics and Quality, Substance Abuse and Mental Health Services Administration, Treatment Episode Data Set (TEDS). Data received through 11.01.16.
Seda-tives
Hallu-cino-gens PCP
Inhal-ants
Other/ none speci-fied
- - Quantity is zero.1 Admissions for which values were not collected, unknown, or missing are excluded from the sum total.
171

Alcohol only
Secondarydrug Heroin
Other opiates
Smoked cocaine
Other route
Total admissions aged 12 and older 37,370 5,474 4,928 6,586 2,238 1,851 1,362 7,559 6,233 630 23 62 230 29 165
GenderMale 60.0 70.3 66.9 65.4 44.8 56.8 50.8 66.5 43.0 41.0 34.8 71.0 40.4 48.3 57.0Female 40.0 29.7 33.1 34.6 55.2 43.2 49.2 33.5 57.0 59.0 65.2 29.0 59.6 51.7 43.0
Total 100.0 100.0 100.0 100.0 100.0 100.0 100.0 100.0 100.0 100.0 100.0 100.0 100.0 100.0 100.0No. of admissions 37,370 5,474 4,928 6,586 2,238 1,851 1,362 7,559 6,233 630 23 62 230 29 165
Age at admission12 to 19 years 10.3 0.6 3.2 2.3 1.5 0.4 5.1 40.7 3.3 14.0 - - 22.6 0.4 24.1 9.120 to 24 years 13.3 5.0 9.4 17.4 10.2 2.6 12.4 20.3 14.8 15.1 17.4 16.1 10.4 10.3 20.025 to 29 years 19.0 10.4 16.2 24.3 23.9 7.7 22.8 17.5 25.0 28.6 21.7 8.1 20.9 6.9 19.430 to 34 years 18.0 13.9 18.2 21.4 26.4 13.1 22.1 10.3 23.8 19.2 21.7 27.4 31.3 13.8 20.635 to 39 years 11.9 13.1 14.8 12.3 12.8 12.0 14.8 5.4 14.4 9.2 30.4 8.1 27.0 20.7 12.140 to 44 years 8.7 14.7 11.4 7.2 8.1 14.2 9.4 2.5 9.2 4.3 - - 3.2 8.3 10.3 4.845 to 49 years 7.3 14.9 10.9 5.3 6.2 17.7 5.4 1.7 5.2 2.5 4.3 4.8 1.7 6.9 5.550 to 54 years 6.2 13.8 9.2 4.4 5.6 18.3 5.0 1.0 2.9 4.3 - - 6.5 - - 6.9 6.155 to 59 years 3.7 8.9 5.0 3.6 3.8 9.3 1.6 0.5 1.1 2.2 4.3 3.2 - - - - 1.860 years and older 1.7 4.7 1.6 1.8 1.5 4.6 1.3 0.2 0.2 0.6 - - - - - - - - 0.6
Total 100.0 100.0 100.0 100.0 100.0 100.0 100.0 100.0 100.0 100.0 100.0 100.0 100.0 100.0 100.0No. of admissions 37,370 5,474 4,928 6,586 2,238 1,851 1,362 7,559 6,233 630 23 62 230 29 165
Race/ethnicityWhite (non-Hispanic) 53.9 58.7 55.8 60.1 72.5 28.1 23.9 32.7 75.8 61.6 60.9 45.2 9.6 55.2 57.0Black (non-Hispanic) 15.0 9.4 14.5 7.2 8.0 52.4 28.0 24.5 3.9 10.8 26.1 29.0 81.3 6.9 6.7Hispanic origin 29.5 29.4 28.0 31.7 18.2 18.4 46.8 41.2 18.7 26.0 13.0 22.6 9.1 27.6 36.4American Indian/Alaska Native 0.4 0.7 0.7 0.2 0.4 0.2 0.2 0.3 0.5 0.3 - - - - - - - - - -Asian/Pacific Islander 0.5 0.7 0.3 0.2 0.2 0.4 0.3 0.5 0.6 1.3 - - - - - - - - - -Other 0.7 1.1 0.7 0.7 0.7 0.5 0.8 0.8 0.6 - - - - 3.2 - - 10.3 - -
Total 100.0 100.0 100.0 100.0 100.0 100.0 100.0 100.0 100.0 100.0 100.0 100.0 100.0 100.0 100.0No. of admissions 37,368 5,473 4,927 6,586 2,238 1,851 1,362 7,559 6,233 630 23 62 230 29 165
Table 3.40b. Texas admissions aged 12 and older, by primary substance of abuse and gender, age at admission, and race/ethnicity: Percent distribution, 2015
Gender, age at admission, and race/ethnicity
All admis-sions
aged 12 and older
Primary substance at admission
Alcohol Opiates CocaineMari-juana/
hashish
Metham-phetamine/
amphet-amines
Tran-quil-izers
NOTE: Percentages may not sum to 100 percent due to rounding. Percentages are based on all admissions with known and valid values. Admissions for which values were not collected, unknown, or missing are excluded from the percentage base (denominator).SOURCE: Center for Behavioral Health Statistics and Quality, Substance Abuse and Mental Health Services Administration, Treatment Episode Data Set (TEDS). Data received through 11.01.16.
Seda-tives
Hallu-cino-gens PCP
Inhal-ants
Other/ none speci-fied
- - Quantity is zero.
172
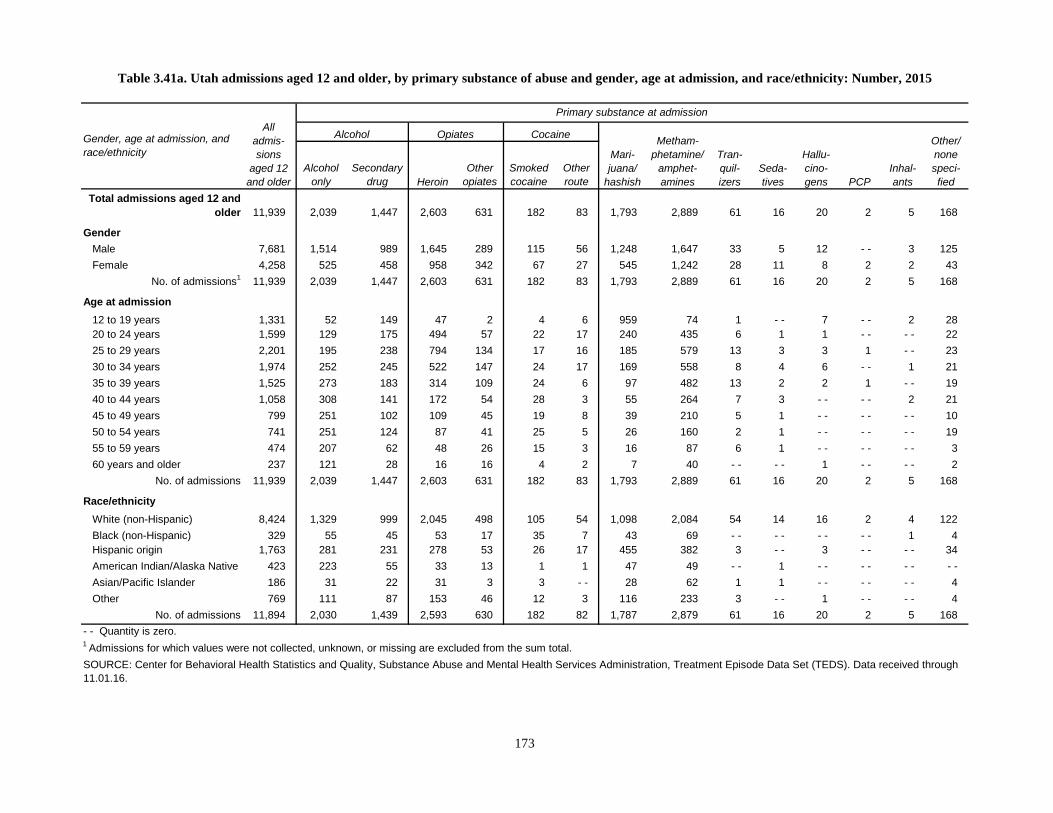
Alcohol only
Secondarydrug Heroin
Other opiates
Smoked cocaine
Other route
Total admissions aged 12 and older 11,939 2,039 1,447 2,603 631 182 83 1,793 2,889 61 16 20 2 5 168
GenderMale 7,681 1,514 989 1,645 289 115 56 1,248 1,647 33 5 12 - - 3 125Female 4,258 525 458 958 342 67 27 545 1,242 28 11 8 2 2 43
No. of admissions1 11,939 2,039 1,447 2,603 631 182 83 1,793 2,889 61 16 20 2 5 168
Age at admission12 to 19 years 1,331 52 149 47 2 4 6 959 74 1 - - 7 - - 2 2820 to 24 years 1,599 129 175 494 57 22 17 240 435 6 1 1 - - - - 2225 to 29 years 2,201 195 238 794 134 17 16 185 579 13 3 3 1 - - 2330 to 34 years 1,974 252 245 522 147 24 17 169 558 8 4 6 - - 1 2135 to 39 years 1,525 273 183 314 109 24 6 97 482 13 2 2 1 - - 1940 to 44 years 1,058 308 141 172 54 28 3 55 264 7 3 - - - - 2 2145 to 49 years 799 251 102 109 45 19 8 39 210 5 1 - - - - - - 1050 to 54 years 741 251 124 87 41 25 5 26 160 2 1 - - - - - - 1955 to 59 years 474 207 62 48 26 15 3 16 87 6 1 - - - - - - 360 years and older 237 121 28 16 16 4 2 7 40 - - - - 1 - - - - 2
No. of admissions 11,939 2,039 1,447 2,603 631 182 83 1,793 2,889 61 16 20 2 5 168
Race/ethnicityWhite (non-Hispanic) 8,424 1,329 999 2,045 498 105 54 1,098 2,084 54 14 16 2 4 122Black (non-Hispanic) 329 55 45 53 17 35 7 43 69 - - - - - - - - 1 4Hispanic origin 1,763 281 231 278 53 26 17 455 382 3 - - 3 - - - - 34American Indian/Alaska Native 423 223 55 33 13 1 1 47 49 - - 1 - - - - - - - -Asian/Pacific Islander 186 31 22 31 3 3 - - 28 62 1 1 - - - - - - 4Other 769 111 87 153 46 12 3 116 233 3 - - 1 - - - - 4
No. of admissions 11,894 2,030 1,439 2,593 630 182 82 1,787 2,879 61 16 20 2 5 168
SOURCE: Center for Behavioral Health Statistics and Quality, Substance Abuse and Mental Health Services Administration, Treatment Episode Data Set (TEDS). Data received through 11.01.16.
Seda-tives
Hallu-cino-gens PCP
Inhal-ants
Other/ none speci-fied
- - Quantity is zero.1 Admissions for which values were not collected, unknown, or missing are excluded from the sum total.
Table 3.41a. Utah admissions aged 12 and older, by primary substance of abuse and gender, age at admission, and race/ethnicity: Number, 2015
Gender, age at admission, and race/ethnicity
All admis-sions
aged 12 and older
Primary substance at admission
Alcohol Opiates Cocaine
Mari-juana/
hashish
Metham-phetamine/
amphet-amines
Tran-quil-izers
173
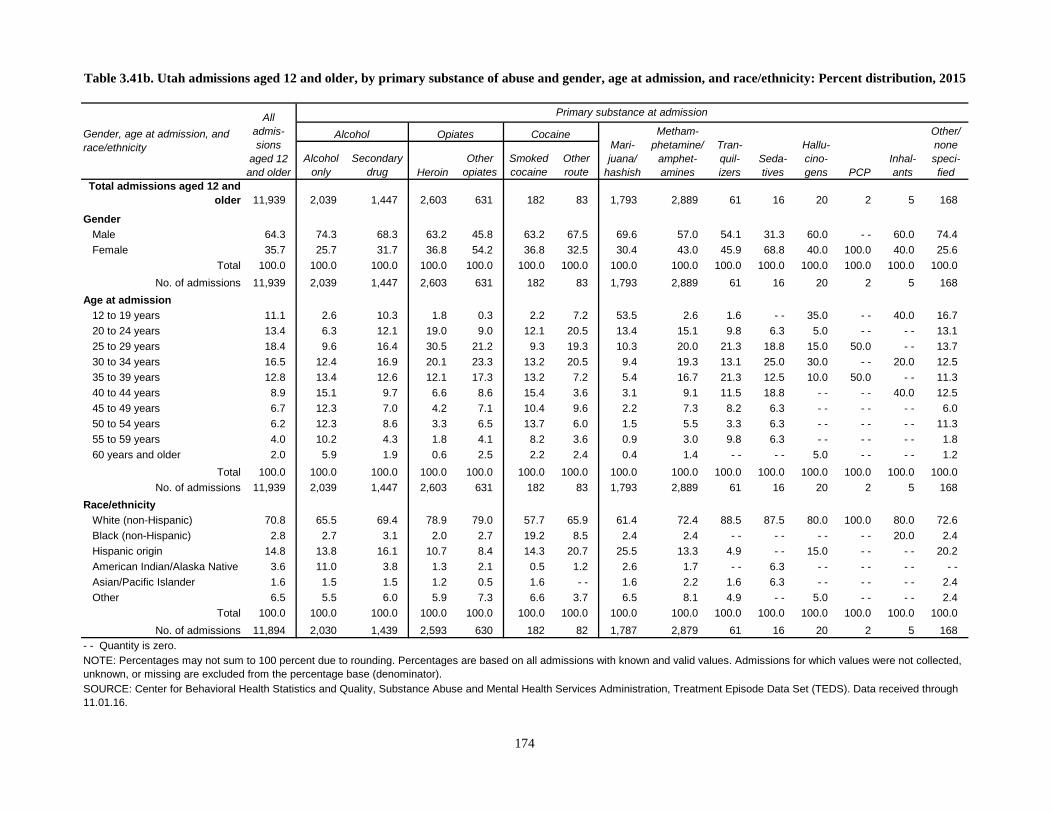
Alcohol only
Secondarydrug Heroin
Other opiates
Smoked cocaine
Other route
Total admissions aged 12 and older 11,939 2,039 1,447 2,603 631 182 83 1,793 2,889 61 16 20 2 5 168
GenderMale 64.3 74.3 68.3 63.2 45.8 63.2 67.5 69.6 57.0 54.1 31.3 60.0 - - 60.0 74.4Female 35.7 25.7 31.7 36.8 54.2 36.8 32.5 30.4 43.0 45.9 68.8 40.0 100.0 40.0 25.6
Total 100.0 100.0 100.0 100.0 100.0 100.0 100.0 100.0 100.0 100.0 100.0 100.0 100.0 100.0 100.0No. of admissions 11,939 2,039 1,447 2,603 631 182 83 1,793 2,889 61 16 20 2 5 168
Age at admission12 to 19 years 11.1 2.6 10.3 1.8 0.3 2.2 7.2 53.5 2.6 1.6 - - 35.0 - - 40.0 16.720 to 24 years 13.4 6.3 12.1 19.0 9.0 12.1 20.5 13.4 15.1 9.8 6.3 5.0 - - - - 13.125 to 29 years 18.4 9.6 16.4 30.5 21.2 9.3 19.3 10.3 20.0 21.3 18.8 15.0 50.0 - - 13.730 to 34 years 16.5 12.4 16.9 20.1 23.3 13.2 20.5 9.4 19.3 13.1 25.0 30.0 - - 20.0 12.535 to 39 years 12.8 13.4 12.6 12.1 17.3 13.2 7.2 5.4 16.7 21.3 12.5 10.0 50.0 - - 11.340 to 44 years 8.9 15.1 9.7 6.6 8.6 15.4 3.6 3.1 9.1 11.5 18.8 - - - - 40.0 12.545 to 49 years 6.7 12.3 7.0 4.2 7.1 10.4 9.6 2.2 7.3 8.2 6.3 - - - - - - 6.050 to 54 years 6.2 12.3 8.6 3.3 6.5 13.7 6.0 1.5 5.5 3.3 6.3 - - - - - - 11.355 to 59 years 4.0 10.2 4.3 1.8 4.1 8.2 3.6 0.9 3.0 9.8 6.3 - - - - - - 1.860 years and older 2.0 5.9 1.9 0.6 2.5 2.2 2.4 0.4 1.4 - - - - 5.0 - - - - 1.2
Total 100.0 100.0 100.0 100.0 100.0 100.0 100.0 100.0 100.0 100.0 100.0 100.0 100.0 100.0 100.0No. of admissions 11,939 2,039 1,447 2,603 631 182 83 1,793 2,889 61 16 20 2 5 168
Race/ethnicityWhite (non-Hispanic) 70.8 65.5 69.4 78.9 79.0 57.7 65.9 61.4 72.4 88.5 87.5 80.0 100.0 80.0 72.6Black (non-Hispanic) 2.8 2.7 3.1 2.0 2.7 19.2 8.5 2.4 2.4 - - - - - - - - 20.0 2.4Hispanic origin 14.8 13.8 16.1 10.7 8.4 14.3 20.7 25.5 13.3 4.9 - - 15.0 - - - - 20.2American Indian/Alaska Native 3.6 11.0 3.8 1.3 2.1 0.5 1.2 2.6 1.7 - - 6.3 - - - - - - - -Asian/Pacific Islander 1.6 1.5 1.5 1.2 0.5 1.6 - - 1.6 2.2 1.6 6.3 - - - - - - 2.4Other 6.5 5.5 6.0 5.9 7.3 6.6 3.7 6.5 8.1 4.9 - - 5.0 - - - - 2.4
Total 100.0 100.0 100.0 100.0 100.0 100.0 100.0 100.0 100.0 100.0 100.0 100.0 100.0 100.0 100.0No. of admissions 11,894 2,030 1,439 2,593 630 182 82 1,787 2,879 61 16 20 2 5 168
Table 3.41b. Utah admissions aged 12 and older, by primary substance of abuse and gender, age at admission, and race/ethnicity: Percent distribution, 2015
Gender, age at admission, and race/ethnicity
All admis-sions
aged 12 and older
Primary substance at admission
Alcohol Opiates CocaineMari-juana/
hashish
Metham-phetamine/
amphet-amines
Tran-quil-izers
NOTE: Percentages may not sum to 100 percent due to rounding. Percentages are based on all admissions with known and valid values. Admissions for which values were not collected, unknown, or missing are excluded from the percentage base (denominator).SOURCE: Center for Behavioral Health Statistics and Quality, Substance Abuse and Mental Health Services Administration, Treatment Episode Data Set (TEDS). Data received through 11.01.16.
Seda-tives
Hallu-cino-gens PCP
Inhal-ants
Other/ none speci-fied
- - Quantity is zero.
174
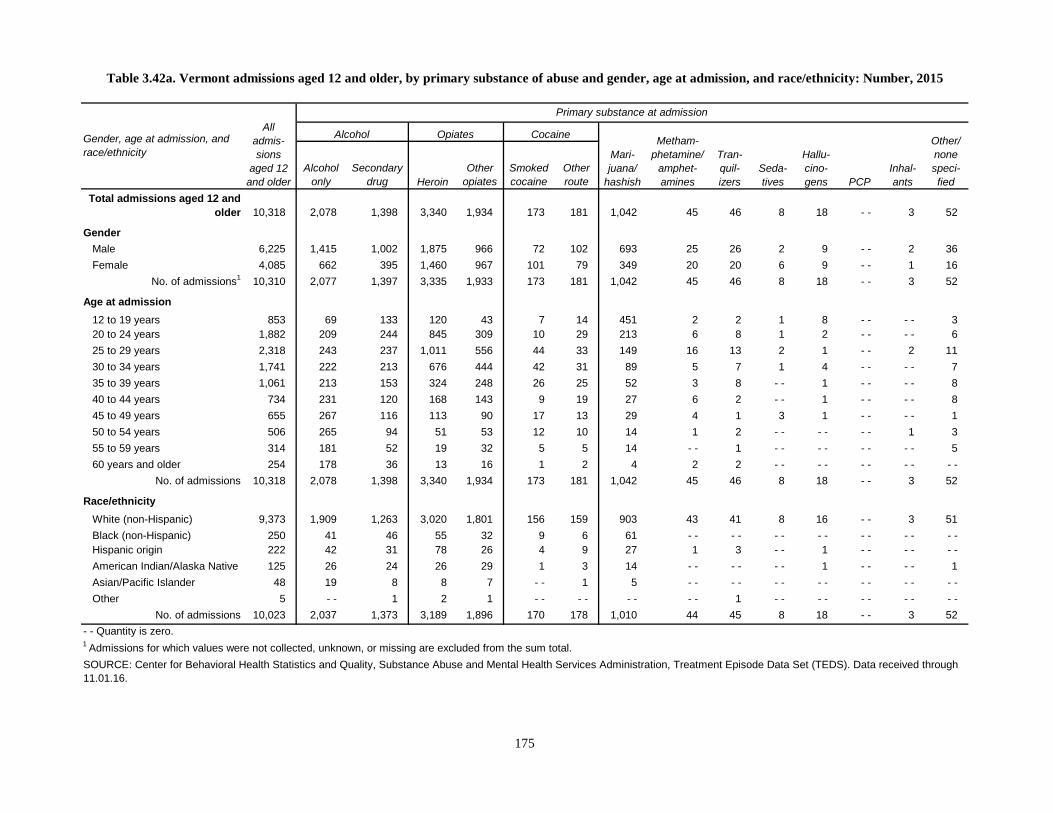
Alcohol only
Secondarydrug Heroin
Other opiates
Smoked cocaine
Other route
Total admissions aged 12 and older 10,318 2,078 1,398 3,340 1,934 173 181 1,042 45 46 8 18 - - 3 52
GenderMale 6,225 1,415 1,002 1,875 966 72 102 693 25 26 2 9 - - 2 36Female 4,085 662 395 1,460 967 101 79 349 20 20 6 9 - - 1 16
No. of admissions1 10,310 2,077 1,397 3,335 1,933 173 181 1,042 45 46 8 18 - - 3 52
Age at admission12 to 19 years 853 69 133 120 43 7 14 451 2 2 1 8 - - - - 320 to 24 years 1,882 209 244 845 309 10 29 213 6 8 1 2 - - - - 625 to 29 years 2,318 243 237 1,011 556 44 33 149 16 13 2 1 - - 2 1130 to 34 years 1,741 222 213 676 444 42 31 89 5 7 1 4 - - - - 735 to 39 years 1,061 213 153 324 248 26 25 52 3 8 - - 1 - - - - 840 to 44 years 734 231 120 168 143 9 19 27 6 2 - - 1 - - - - 845 to 49 years 655 267 116 113 90 17 13 29 4 1 3 1 - - - - 150 to 54 years 506 265 94 51 53 12 10 14 1 2 - - - - - - 1 355 to 59 years 314 181 52 19 32 5 5 14 - - 1 - - - - - - - - 560 years and older 254 178 36 13 16 1 2 4 2 2 - - - - - - - - - -
No. of admissions 10,318 2,078 1,398 3,340 1,934 173 181 1,042 45 46 8 18 - - 3 52
Race/ethnicityWhite (non-Hispanic) 9,373 1,909 1,263 3,020 1,801 156 159 903 43 41 8 16 - - 3 51Black (non-Hispanic) 250 41 46 55 32 9 6 61 - - - - - - - - - - - - - -Hispanic origin 222 42 31 78 26 4 9 27 1 3 - - 1 - - - - - -American Indian/Alaska Native 125 26 24 26 29 1 3 14 - - - - - - 1 - - - - 1Asian/Pacific Islander 48 19 8 8 7 - - 1 5 - - - - - - - - - - - - - -Other 5 - - 1 2 1 - - - - - - - - 1 - - - - - - - - - -
No. of admissions 10,023 2,037 1,373 3,189 1,896 170 178 1,010 44 45 8 18 - - 3 52
Table 3.42a. Vermont admissions aged 12 and older, by primary substance of abuse and gender, age at admission, and race/ethnicity: Number, 2015
Gender, age at admission, and race/ethnicity
All admis-sions
aged 12 and older
Primary substance at admission
Alcohol Opiates Cocaine
Mari-juana/
hashish
Metham-phetamine/
amphet-amines
Tran-quil-izers
SOURCE: Center for Behavioral Health Statistics and Quality, Substance Abuse and Mental Health Services Administration, Treatment Episode Data Set (TEDS). Data received through 11.01.16.
Seda-tives
Hallu-cino-gens PCP
Inhal-ants
Other/ none speci-fied
- - Quantity is zero.1 Admissions for which values were not collected, unknown, or missing are excluded from the sum total.
175

Alcohol only
Secondarydrug Heroin
Other opiates
Smoked cocaine
Other route
Total admissions aged 12 and older 10,318 2,078 1,398 3,340 1,934 173 181 1,042 45 46 8 18 - - 3 52
GenderMale 60.4 68.1 71.7 56.2 50.0 41.6 56.4 66.5 55.6 56.5 25.0 50.0 - - 66.7 69.2Female 39.6 31.9 28.3 43.8 50.0 58.4 43.6 33.5 44.4 43.5 75.0 50.0 - - 33.3 30.8
Total 100.0 100.0 100.0 100.0 100.0 100.0 100.0 100.0 100.0 100.0 100.0 100.0 - - 100.0 100.0No. of admissions 10,310 2,077 1,397 3,335 1,933 173 181 1,042 45 46 8 18 - - 3 52
Age at admission12 to 19 years 8.3 3.3 9.5 3.6 2.2 4.0 7.7 43.3 4.4 4.3 12.5 44.4 - - - - 5.820 to 24 years 18.2 10.1 17.5 25.3 16.0 5.8 16.0 20.4 13.3 17.4 12.5 11.1 - - - - 11.525 to 29 years 22.5 11.7 17.0 30.3 28.7 25.4 18.2 14.3 35.6 28.3 25.0 5.6 - - 66.7 21.230 to 34 years 16.9 10.7 15.2 20.2 23.0 24.3 17.1 8.5 11.1 15.2 12.5 22.2 - - - - 13.535 to 39 years 10.3 10.3 10.9 9.7 12.8 15.0 13.8 5.0 6.7 17.4 - - 5.6 - - - - 15.440 to 44 years 7.1 11.1 8.6 5.0 7.4 5.2 10.5 2.6 13.3 4.3 - - 5.6 - - - - 15.445 to 49 years 6.3 12.8 8.3 3.4 4.7 9.8 7.2 2.8 8.9 2.2 37.5 5.6 - - - - 1.950 to 54 years 4.9 12.8 6.7 1.5 2.7 6.9 5.5 1.3 2.2 4.3 - - - - - - 33.3 5.855 to 59 years 3.0 8.7 3.7 0.6 1.7 2.9 2.8 1.3 - - 2.2 - - - - - - - - 9.660 years and older 2.5 8.6 2.6 0.4 0.8 0.6 1.1 0.4 4.4 4.3 - - - - - - - - - -
Total 100.0 100.0 100.0 100.0 100.0 100.0 100.0 100.0 100.0 100.0 100.0 100.0 - - 100.0 100.0No. of admissions 10,318 2,078 1,398 3,340 1,934 173 181 1,042 45 46 8 18 - - 3 52
Race/ethnicityWhite (non-Hispanic) 93.5 93.7 92.0 94.7 95.0 91.8 89.3 89.4 97.7 91.1 100.0 88.9 - - 100.0 98.1Black (non-Hispanic) 2.5 2.0 3.4 1.7 1.7 5.3 3.4 6.0 - - - - - - - - - - - - - -Hispanic origin 2.2 2.1 2.3 2.4 1.4 2.4 5.1 2.7 2.3 6.7 - - 5.6 - - - - - -American Indian/Alaska Native 1.2 1.3 1.7 0.8 1.5 0.6 1.7 1.4 - - - - - - 5.6 - - - - 1.9Asian/Pacific Islander 0.5 0.9 0.6 0.3 0.4 - - 0.6 0.5 - - - - - - - - - - - - - -Other * - - 0.1 0.1 0.1 - - - - - - - - 2.2 - - - - - - - - - -
Total 100.0 100.0 100.0 100.0 100.0 100.0 100.0 100.0 100.0 100.0 100.0 100.0 - - 100.0 100.0No. of admissions 10,023 2,037 1,373 3,189 1,896 170 178 1,010 44 45 8 18 - - 3 52
Table 3.42b. Vermont admissions aged 12 and older, by primary substance of abuse and gender, age at admission, and race/ethnicity: Percent distribution, 2015
Gender, age at admission, and race/ethnicity
All admis-sions
aged 12 and older
Primary substance at admission
Alcohol Opiates CocaineMari-juana/
hashish
Metham-phetamine/
amphet-amines
Tran-quil-izers
NOTE: Percentages may not sum to 100 percent due to rounding. Percentages are based on all admissions with known and valid values. Admissions for which values were not collected, unknown, or missing are excluded from the percentage base (denominator).SOURCE: Center for Behavioral Health Statistics and Quality, Substance Abuse and Mental Health Services Administration, Treatment Episode Data Set (TEDS). Data received through 11.01.16.
Seda-tives
Hallu-cino-gens PCP
Inhal-ants
Other/ none speci-fied
- - Quantity is zero; * Less than 0.05 percent.
176

Alcohol only
Secondarydrug Heroin
Other opiates
Smoked cocaine
Other route
Total admissions aged 12 and older 22,910 3,640 4,014 3,021 2,657 1,033 678 4,586 630 270 44 44 85 25 2,183
GenderMale 14,291 2,543 2,906 1,626 1,285 513 435 3,165 317 108 20 36 55 17 1,265Female 8,617 1,095 1,108 1,395 1,372 520 243 1,421 313 162 24 8 30 8 918
No. of admissions1 22,908 3,638 4,014 3,021 2,657 1,033 678 4,586 630 270 44 44 85 25 2,183
Age at admission12 to 19 years 1,841 83 162 46 39 3 11 1,259 24 8 6 6 - - 1 19320 to 24 years 2,954 210 427 496 321 19 49 995 92 27 4 13 6 6 28925 to 29 years 4,195 413 665 729 649 51 92 911 165 62 10 9 15 7 41730 to 34 years 3,718 468 605 586 641 89 121 654 114 55 11 5 27 3 33935 to 39 years 2,600 439 440 370 418 121 94 315 91 40 5 8 15 3 24140 to 44 years 2,068 435 390 227 242 198 95 187 59 23 2 2 14 2 19245 to 49 years 2,031 516 441 212 167 219 92 127 46 16 1 - - 5 1 18850 to 54 years 1,810 530 457 166 95 183 72 88 23 16 3 1 1 1 17455 to 59 years 1,121 318 324 107 64 111 43 34 15 6 - - - - - - 1 9860 years and older 572 228 103 82 21 39 9 16 1 17 2 - - 2 - - 52
No. of admissions 22,910 3,640 4,014 3,021 2,657 1,033 678 4,586 630 270 44 44 85 25 2,183
Race/ethnicityWhite (non-Hispanic) 14,254 2,285 2,536 2,028 2,335 345 273 2,054 576 242 35 26 11 17 1,491Black (non-Hispanic) 5,790 702 992 758 168 604 342 1,679 15 8 7 11 63 1 440Hispanic origin 1,171 382 205 73 50 13 22 333 9 6 1 3 3 4 67American Indian/Alaska Native 53 12 10 6 3 2 4 6 2 - - - - - - - - - - 8Asian/Pacific Islander 126 35 27 13 3 2 2 33 3 - - - - - - - - 1 7Other 981 148 192 92 53 58 23 318 8 9 1 4 7 1 67
No. of admissions 22,375 3,564 3,962 2,970 2,612 1,024 666 4,423 613 265 44 44 84 24 2,080
Table 3.43a. Virginia admissions aged 12 and older, by primary substance of abuse and gender, age at admission, and race/ethnicity: Number, 2015
Gender, age at admission, and race/ethnicity
All admis-sions
aged 12 and older
Primary substance at admission
Alcohol Opiates Cocaine
Mari-juana/
hashish
Metham-phetamine/
amphet-amines
Tran-quil-izers
SOURCE: Center for Behavioral Health Statistics and Quality, Substance Abuse and Mental Health Services Administration, Treatment Episode Data Set (TEDS). Data received through 11.01.16.
Seda-tives
Hallu-cino-gens PCP
Inhal-ants
Other/ none speci-fied
- - Quantity is zero.1 Admissions for which values were not collected, unknown, or missing are excluded from the sum total.
177

Alcohol only
Secondarydrug Heroin
Other opiates
Smoked cocaine
Other route
Total admissions aged 12 and older 22,910 3,640 4,014 3,021 2,657 1,033 678 4,586 630 270 44 44 85 25 2,183
GenderMale 62.4 69.9 72.4 53.8 48.4 49.7 64.2 69.0 50.3 40.0 45.5 81.8 64.7 68.0 57.9Female 37.6 30.1 27.6 46.2 51.6 50.3 35.8 31.0 49.7 60.0 54.5 18.2 35.3 32.0 42.1
Total 100.0 100.0 100.0 100.0 100.0 100.0 100.0 100.0 100.0 100.0 100.0 100.0 100.0 100.0 100.0No. of admissions 22,908 3,638 4,014 3,021 2,657 1,033 678 4,586 630 270 44 44 85 25 2,183
Age at admission12 to 19 years 8.0 2.3 4.0 1.5 1.5 0.3 1.6 27.5 3.8 3.0 13.6 13.6 - - 4.0 8.820 to 24 years 12.9 5.8 10.6 16.4 12.1 1.8 7.2 21.7 14.6 10.0 9.1 29.5 7.1 24.0 13.225 to 29 years 18.3 11.3 16.6 24.1 24.4 4.9 13.6 19.9 26.2 23.0 22.7 20.5 17.6 28.0 19.130 to 34 years 16.2 12.9 15.1 19.4 24.1 8.6 17.8 14.3 18.1 20.4 25.0 11.4 31.8 12.0 15.535 to 39 years 11.3 12.1 11.0 12.2 15.7 11.7 13.9 6.9 14.4 14.8 11.4 18.2 17.6 12.0 11.040 to 44 years 9.0 12.0 9.7 7.5 9.1 19.2 14.0 4.1 9.4 8.5 4.5 4.5 16.5 8.0 8.845 to 49 years 8.9 14.2 11.0 7.0 6.3 21.2 13.6 2.8 7.3 5.9 2.3 - - 5.9 4.0 8.650 to 54 years 7.9 14.6 11.4 5.5 3.6 17.7 10.6 1.9 3.7 5.9 6.8 2.3 1.2 4.0 8.055 to 59 years 4.9 8.7 8.1 3.5 2.4 10.7 6.3 0.7 2.4 2.2 - - - - - - 4.0 4.560 years and older 2.5 6.3 2.6 2.7 0.8 3.8 1.3 0.3 0.2 6.3 4.5 - - 2.4 - - 2.4
Total 100.0 100.0 100.0 100.0 100.0 100.0 100.0 100.0 100.0 100.0 100.0 100.0 100.0 100.0 100.0No. of admissions 22,910 3,640 4,014 3,021 2,657 1,033 678 4,586 630 270 44 44 85 25 2,183
Race/ethnicityWhite (non-Hispanic) 63.7 64.1 64.0 68.3 89.4 33.7 41.0 46.4 94.0 91.3 79.5 59.1 13.1 70.8 71.7Black (non-Hispanic) 25.9 19.7 25.0 25.5 6.4 59.0 51.4 38.0 2.4 3.0 15.9 25.0 75.0 4.2 21.2Hispanic origin 5.2 10.7 5.2 2.5 1.9 1.3 3.3 7.5 1.5 2.3 2.3 6.8 3.6 16.7 3.2American Indian/Alaska Native 0.2 0.3 0.3 0.2 0.1 0.2 0.6 0.1 0.3 - - - - - - - - - - 0.4Asian/Pacific Islander 0.6 1.0 0.7 0.4 0.1 0.2 0.3 0.7 0.5 - - - - - - - - 4.2 0.3Other 4.4 4.2 4.8 3.1 2.0 5.7 3.5 7.2 1.3 3.4 2.3 9.1 8.3 4.2 3.2
Total 100.0 100.0 100.0 100.0 100.0 100.0 100.0 100.0 100.0 100.0 100.0 100.0 100.0 100.0 100.0No. of admissions 22,375 3,564 3,962 2,970 2,612 1,024 666 4,423 613 265 44 44 84 24 2,080
Table 3.43b. Virginia admissions aged 12 and older, by primary substance of abuse and gender, age at admission, and race/ethnicity: Percent distribution, 2015
Gender, age at admission, and race/ethnicity
All admis-sions
aged 12 and older
Primary substance at admission
Alcohol Opiates CocaineMari-juana/
hashish
Metham-phetamine/
amphet-amines
Tran-quil-izers
NOTE: Percentages may not sum to 100 percent due to rounding. Percentages are based on all admissions with known and valid values. Admissions for which values were not collected, unknown, or missing are excluded from the percentage base (denominator).SOURCE: Center for Behavioral Health Statistics and Quality, Substance Abuse and Mental Health Services Administration, Treatment Episode Data Set (TEDS). Data received through 11.01.16.
Seda-tives
Hallu-cino-gens PCP
Inhal-ants
Other/ none speci-fied
- - Quantity is zero.
178
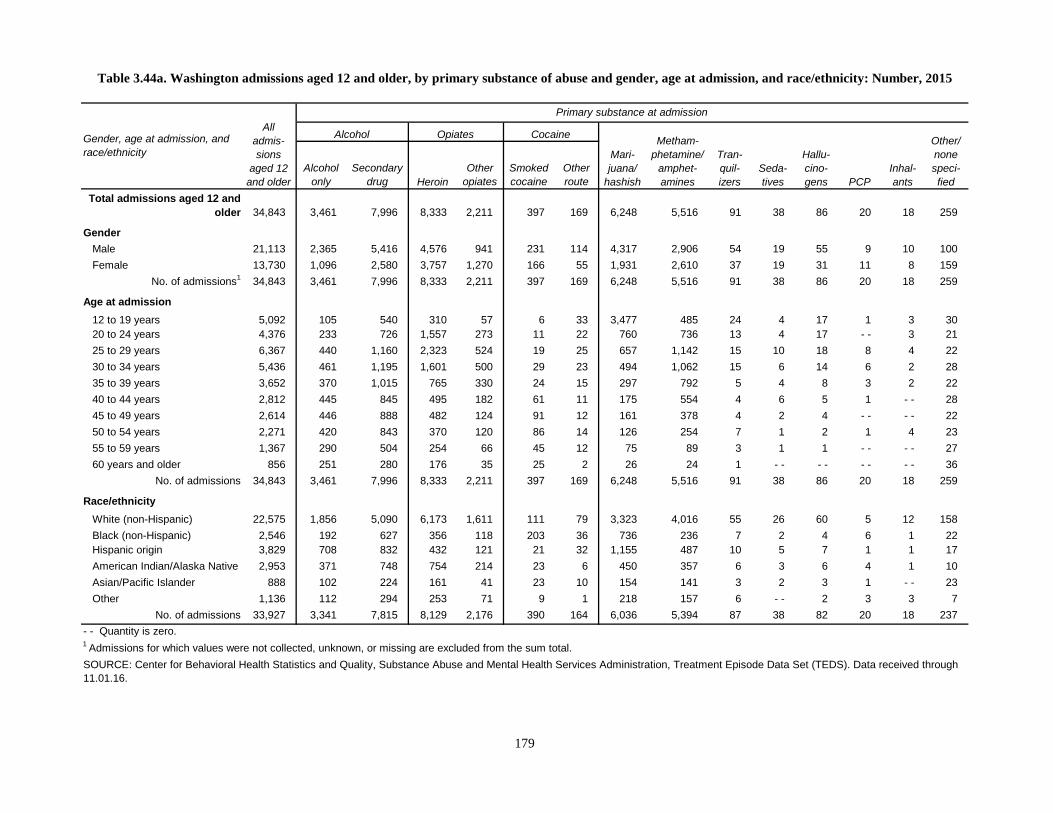
Alcohol only
Secondarydrug Heroin
Other opiates
Smoked cocaine
Other route
Total admissions aged 12 and older 34,843 3,461 7,996 8,333 2,211 397 169 6,248 5,516 91 38 86 20 18 259
GenderMale 21,113 2,365 5,416 4,576 941 231 114 4,317 2,906 54 19 55 9 10 100Female 13,730 1,096 2,580 3,757 1,270 166 55 1,931 2,610 37 19 31 11 8 159
No. of admissions1 34,843 3,461 7,996 8,333 2,211 397 169 6,248 5,516 91 38 86 20 18 259
Age at admission12 to 19 years 5,092 105 540 310 57 6 33 3,477 485 24 4 17 1 3 3020 to 24 years 4,376 233 726 1,557 273 11 22 760 736 13 4 17 - - 3 2125 to 29 years 6,367 440 1,160 2,323 524 19 25 657 1,142 15 10 18 8 4 2230 to 34 years 5,436 461 1,195 1,601 500 29 23 494 1,062 15 6 14 6 2 2835 to 39 years 3,652 370 1,015 765 330 24 15 297 792 5 4 8 3 2 2240 to 44 years 2,812 445 845 495 182 61 11 175 554 4 6 5 1 - - 2845 to 49 years 2,614 446 888 482 124 91 12 161 378 4 2 4 - - - - 2250 to 54 years 2,271 420 843 370 120 86 14 126 254 7 1 2 1 4 2355 to 59 years 1,367 290 504 254 66 45 12 75 89 3 1 1 - - - - 2760 years and older 856 251 280 176 35 25 2 26 24 1 - - - - - - - - 36
No. of admissions 34,843 3,461 7,996 8,333 2,211 397 169 6,248 5,516 91 38 86 20 18 259
Race/ethnicityWhite (non-Hispanic) 22,575 1,856 5,090 6,173 1,611 111 79 3,323 4,016 55 26 60 5 12 158Black (non-Hispanic) 2,546 192 627 356 118 203 36 736 236 7 2 4 6 1 22Hispanic origin 3,829 708 832 432 121 21 32 1,155 487 10 5 7 1 1 17American Indian/Alaska Native 2,953 371 748 754 214 23 6 450 357 6 3 6 4 1 10Asian/Pacific Islander 888 102 224 161 41 23 10 154 141 3 2 3 1 - - 23Other 1,136 112 294 253 71 9 1 218 157 6 - - 2 3 3 7
No. of admissions 33,927 3,341 7,815 8,129 2,176 390 164 6,036 5,394 87 38 82 20 18 237
Table 3.44a. Washington admissions aged 12 and older, by primary substance of abuse and gender, age at admission, and race/ethnicity: Number, 2015
Gender, age at admission, and race/ethnicity
All admis-sions
aged 12 and older
Primary substance at admission
Alcohol Opiates Cocaine
Mari-juana/
hashish
Metham-phetamine/
amphet-amines
Tran-quil-izers
SOURCE: Center for Behavioral Health Statistics and Quality, Substance Abuse and Mental Health Services Administration, Treatment Episode Data Set (TEDS). Data received through 11.01.16.
Seda-tives
Hallu-cino-gens PCP
Inhal-ants
Other/ none speci-fied
- - Quantity is zero.1 Admissions for which values were not collected, unknown, or missing are excluded from the sum total.
179
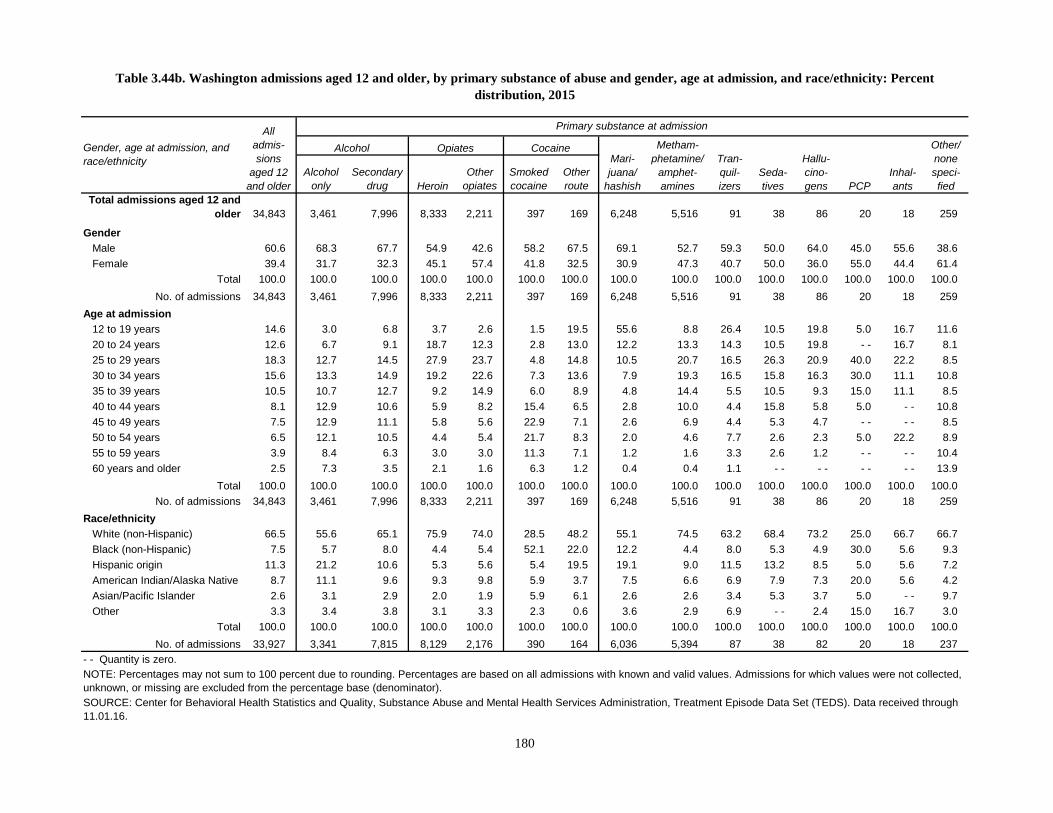
Alcohol only
Secondarydrug Heroin
Other opiates
Smoked cocaine
Other route
Total admissions aged 12 and older 34,843 3,461 7,996 8,333 2,211 397 169 6,248 5,516 91 38 86 20 18 259
GenderMale 60.6 68.3 67.7 54.9 42.6 58.2 67.5 69.1 52.7 59.3 50.0 64.0 45.0 55.6 38.6Female 39.4 31.7 32.3 45.1 57.4 41.8 32.5 30.9 47.3 40.7 50.0 36.0 55.0 44.4 61.4
Total 100.0 100.0 100.0 100.0 100.0 100.0 100.0 100.0 100.0 100.0 100.0 100.0 100.0 100.0 100.0No. of admissions 34,843 3,461 7,996 8,333 2,211 397 169 6,248 5,516 91 38 86 20 18 259
Age at admission12 to 19 years 14.6 3.0 6.8 3.7 2.6 1.5 19.5 55.6 8.8 26.4 10.5 19.8 5.0 16.7 11.620 to 24 years 12.6 6.7 9.1 18.7 12.3 2.8 13.0 12.2 13.3 14.3 10.5 19.8 - - 16.7 8.125 to 29 years 18.3 12.7 14.5 27.9 23.7 4.8 14.8 10.5 20.7 16.5 26.3 20.9 40.0 22.2 8.530 to 34 years 15.6 13.3 14.9 19.2 22.6 7.3 13.6 7.9 19.3 16.5 15.8 16.3 30.0 11.1 10.835 to 39 years 10.5 10.7 12.7 9.2 14.9 6.0 8.9 4.8 14.4 5.5 10.5 9.3 15.0 11.1 8.540 to 44 years 8.1 12.9 10.6 5.9 8.2 15.4 6.5 2.8 10.0 4.4 15.8 5.8 5.0 - - 10.845 to 49 years 7.5 12.9 11.1 5.8 5.6 22.9 7.1 2.6 6.9 4.4 5.3 4.7 - - - - 8.550 to 54 years 6.5 12.1 10.5 4.4 5.4 21.7 8.3 2.0 4.6 7.7 2.6 2.3 5.0 22.2 8.955 to 59 years 3.9 8.4 6.3 3.0 3.0 11.3 7.1 1.2 1.6 3.3 2.6 1.2 - - - - 10.460 years and older 2.5 7.3 3.5 2.1 1.6 6.3 1.2 0.4 0.4 1.1 - - - - - - - - 13.9
Total 100.0 100.0 100.0 100.0 100.0 100.0 100.0 100.0 100.0 100.0 100.0 100.0 100.0 100.0 100.0No. of admissions 34,843 3,461 7,996 8,333 2,211 397 169 6,248 5,516 91 38 86 20 18 259
Race/ethnicityWhite (non-Hispanic) 66.5 55.6 65.1 75.9 74.0 28.5 48.2 55.1 74.5 63.2 68.4 73.2 25.0 66.7 66.7Black (non-Hispanic) 7.5 5.7 8.0 4.4 5.4 52.1 22.0 12.2 4.4 8.0 5.3 4.9 30.0 5.6 9.3Hispanic origin 11.3 21.2 10.6 5.3 5.6 5.4 19.5 19.1 9.0 11.5 13.2 8.5 5.0 5.6 7.2American Indian/Alaska Native 8.7 11.1 9.6 9.3 9.8 5.9 3.7 7.5 6.6 6.9 7.9 7.3 20.0 5.6 4.2Asian/Pacific Islander 2.6 3.1 2.9 2.0 1.9 5.9 6.1 2.6 2.6 3.4 5.3 3.7 5.0 - - 9.7Other 3.3 3.4 3.8 3.1 3.3 2.3 0.6 3.6 2.9 6.9 - - 2.4 15.0 16.7 3.0
Total 100.0 100.0 100.0 100.0 100.0 100.0 100.0 100.0 100.0 100.0 100.0 100.0 100.0 100.0 100.0No. of admissions 33,927 3,341 7,815 8,129 2,176 390 164 6,036 5,394 87 38 82 20 18 237
Table 3.44b. Washington admissions aged 12 and older, by primary substance of abuse and gender, age at admission, and race/ethnicity: Percent distribution, 2015
Gender, age at admission, and race/ethnicity
All admis-sions
aged 12 and older
Primary substance at admission
Alcohol Opiates CocaineMari-juana/
hashish
Metham-phetamine/
amphet-amines
Tran-quil-izers
NOTE: Percentages may not sum to 100 percent due to rounding. Percentages are based on all admissions with known and valid values. Admissions for which values were not collected, unknown, or missing are excluded from the percentage base (denominator).SOURCE: Center for Behavioral Health Statistics and Quality, Substance Abuse and Mental Health Services Administration, Treatment Episode Data Set (TEDS). Data received through 11.01.16.
Seda-tives
Hallu-cino-gens PCP
Inhal-ants
Other/ none speci-fied
- - Quantity is zero.
180

Alcohol only
Secondarydrug Heroin
Other opiates
Smoked cocaine
Other route
Total admissions aged 12 and older 3,029 821 421 403 745 29 28 432 69 22 2 2 - - 2 53
GenderMale 1,865 608 297 185 386 14 16 272 46 11 1 2 - - - - 27Female 1,164 213 124 218 359 15 12 160 23 11 1 - - - - 2 26
No. of admissions1 3,029 821 421 403 745 29 28 432 69 22 2 2 - - 2 53
Age at admission12 to 19 years 168 15 16 10 11 - - 1 105 3 1 - - - - - - 1 520 to 24 years 438 82 54 89 116 3 2 76 7 2 - - - - - - 1 625 to 29 years 572 92 64 113 164 4 3 101 19 4 - - - - - - - - 830 to 34 years 509 97 69 94 169 3 6 43 12 2 1 - - - - - - 1335 to 39 years 395 93 61 51 124 5 2 38 8 5 - - 1 - - - - 740 to 44 years 282 99 43 23 68 4 1 22 15 1 1 1 - - - - 445 to 49 years 232 106 32 15 43 1 2 26 3 2 - - - - - - - - 250 to 54 years 206 92 44 5 36 3 8 12 1 2 - - - - - - - - 355 to 59 years 131 82 22 3 9 2 1 7 1 1 - - - - - - - - 360 years and older 96 63 16 - - 5 4 2 2 - - 2 - - - - - - - - 2
No. of admissions 3,029 821 421 403 745 29 28 432 69 22 2 2 - - 2 53
Race/ethnicityWhite (non-Hispanic) 2,017 531 259 287 540 15 14 271 43 17 2 1 - - 1 36Black (non-Hispanic) 97 24 24 7 4 7 5 25 1 - - - - - - - - - - - -Hispanic origin 78 23 21 8 11 1 2 7 1 - - - - - - - - - - 4American Indian/Alaska Native - - - - - - - - - - - - - - - - - - - - - - - - - - - - - -Asian/Pacific Islander 3 1 1 - - - - - - - - 1 - - - - - - - - - - - - - -Other 242 28 33 46 72 2 2 45 7 2 - - 1 - - 1 3
No. of admissions 2,437 607 338 348 627 25 23 349 52 19 2 2 - - 2 43
Table 3.45a. West Virginia admissions aged 12 and older, by primary substance of abuse and gender, age at admission, and race/ethnicity: Number, 2015
Gender, age at admission, and race/ethnicity
All admis-sions
aged 12 and older
Primary substance at admission
Alcohol Opiates Cocaine
Mari-juana/
hashish
Metham-phetamine/
amphet-amines
Tran-quil-izers
SOURCE: Center for Behavioral Health Statistics and Quality, Substance Abuse and Mental Health Services Administration, Treatment Episode Data Set (TEDS). Data received through 11.01.16.
Seda-tives
Hallu-cino-gens PCP
Inhal-ants
Other/ none speci-fied
- - Quantity is zero.1 Admissions for which values were not collected, unknown, or missing are excluded from the sum total.
181

Alcohol only
Secondarydrug Heroin
Other opiates
Smoked cocaine
Other route
Total admissions aged 12 and older 3,029 821 421 403 745 29 28 432 69 22 2 2 - - 2 53
GenderMale 61.6 74.1 70.5 45.9 51.8 48.3 57.1 63.0 66.7 50.0 50.0 100.0 - - - - 50.9Female 38.4 25.9 29.5 54.1 48.2 51.7 42.9 37.0 33.3 50.0 50.0 - - - - 100.0 49.1
Total 100.0 100.0 100.0 100.0 100.0 100.0 100.0 100.0 100.0 100.0 100.0 100.0 - - 100.0 100.0No. of admissions 3,029 821 421 403 745 29 28 432 69 22 2 2 - - 2 53
Age at admission12 to 19 years 5.5 1.8 3.8 2.5 1.5 - - 3.6 24.3 4.3 4.5 - - - - - - 50.0 9.420 to 24 years 14.5 10.0 12.8 22.1 15.6 10.3 7.1 17.6 10.1 9.1 - - - - - - 50.0 11.325 to 29 years 18.9 11.2 15.2 28.0 22.0 13.8 10.7 23.4 27.5 18.2 - - - - - - - - 15.130 to 34 years 16.8 11.8 16.4 23.3 22.7 10.3 21.4 10.0 17.4 9.1 50.0 - - - - - - 24.535 to 39 years 13.0 11.3 14.5 12.7 16.6 17.2 7.1 8.8 11.6 22.7 - - 50.0 - - - - 13.240 to 44 years 9.3 12.1 10.2 5.7 9.1 13.8 3.6 5.1 21.7 4.5 50.0 50.0 - - - - 7.545 to 49 years 7.7 12.9 7.6 3.7 5.8 3.4 7.1 6.0 4.3 9.1 - - - - - - - - 3.850 to 54 years 6.8 11.2 10.5 1.2 4.8 10.3 28.6 2.8 1.4 9.1 - - - - - - - - 5.755 to 59 years 4.3 10.0 5.2 0.7 1.2 6.9 3.6 1.6 1.4 4.5 - - - - - - - - 5.760 years and older 3.2 7.7 3.8 - - 0.7 13.8 7.1 0.5 - - 9.1 - - - - - - - - 3.8
Total 100.0 100.0 100.0 100.0 100.0 100.0 100.0 100.0 100.0 100.0 100.0 100.0 - - 100.0 100.0No. of admissions 3,029 821 421 403 745 29 28 432 69 22 2 2 - - 2 53
Race/ethnicityWhite (non-Hispanic) 82.8 87.5 76.6 82.5 86.1 60.0 60.9 77.7 82.7 89.5 100.0 50.0 - - 50.0 83.7Black (non-Hispanic) 4.0 4.0 7.1 2.0 0.6 28.0 21.7 7.2 1.9 - - - - - - - - - - - -Hispanic origin 3.2 3.8 6.2 2.3 1.8 4.0 8.7 2.0 1.9 - - - - - - - - - - 9.3American Indian/Alaska Native - - - - - - - - - - - - - - - - - - - - - - - - - - - - - -Asian/Pacific Islander 0.1 0.2 0.3 - - - - - - - - 0.3 - - - - - - - - - - - - - -Other 9.9 4.6 9.8 13.2 11.5 8.0 8.7 12.9 13.5 10.5 - - 50.0 - - 50.0 7.0
Total 100.0 100.0 100.0 100.0 100.0 100.0 100.0 100.0 100.0 100.0 100.0 100.0 - - 100.0 100.0No. of admissions 2,437 607 338 348 627 25 23 349 52 19 2 2 - - 2 43
Table 3.45b. West Virginia admissions aged 12 and older, by primary substance of abuse and gender, age at admission, and race/ethnicity: Percent distribution, 2015
Gender, age at admission, and race/ethnicity
All admis-sions
aged 12 and older
Primary substance at admission
Alcohol Opiates CocaineMari-juana/
hashish
Metham-phetamine/
amphet-amines
Tran-quil-izers
NOTE: Percentages may not sum to 100 percent due to rounding. Percentages are based on all admissions with known and valid values. Admissions for which values were not collected, unknown, or missing are excluded from the percentage base (denominator).SOURCE: Center for Behavioral Health Statistics and Quality, Substance Abuse and Mental Health Services Administration, Treatment Episode Data Set (TEDS). Data received through 11.01.16.
Seda-tives
Hallu-cino-gens PCP
Inhal-ants
Other/ none speci-fied
- - Quantity is zero.
182
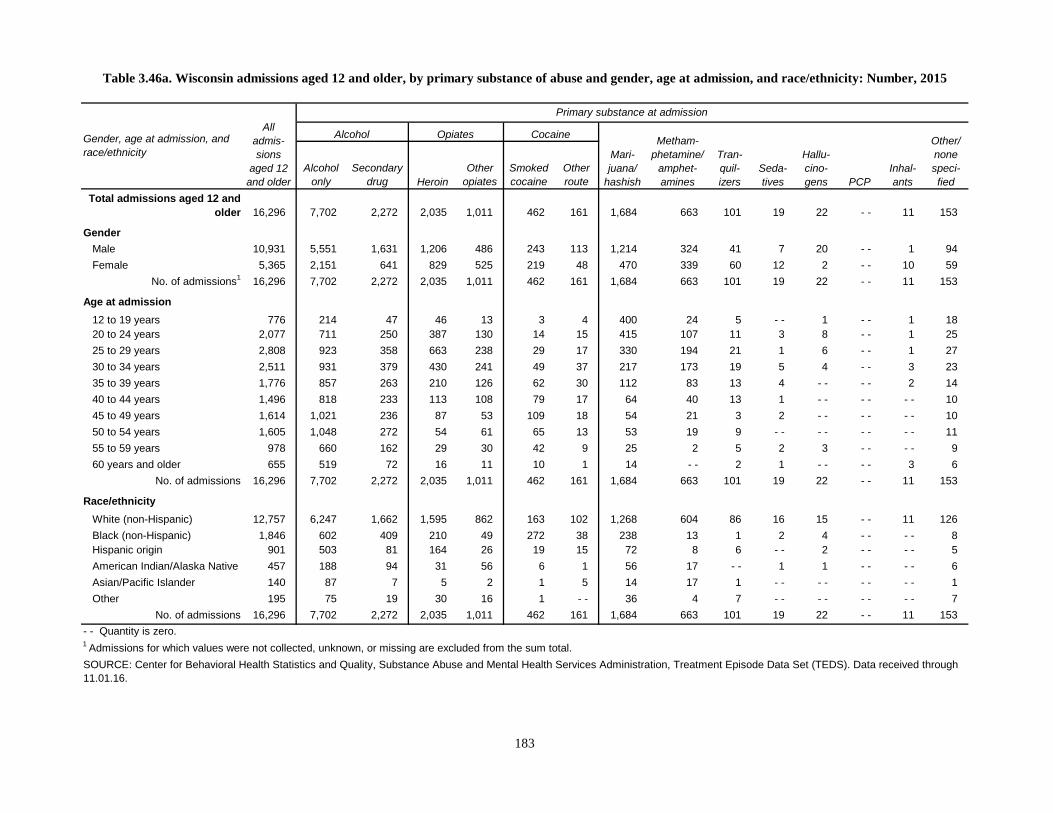
Alcohol only
Secondarydrug Heroin
Other opiates
Smoked cocaine
Other route
Total admissions aged 12 and older 16,296 7,702 2,272 2,035 1,011 462 161 1,684 663 101 19 22 - - 11 153
GenderMale 10,931 5,551 1,631 1,206 486 243 113 1,214 324 41 7 20 - - 1 94Female 5,365 2,151 641 829 525 219 48 470 339 60 12 2 - - 10 59
No. of admissions1 16,296 7,702 2,272 2,035 1,011 462 161 1,684 663 101 19 22 - - 11 153
Age at admission12 to 19 years 776 214 47 46 13 3 4 400 24 5 - - 1 - - 1 1820 to 24 years 2,077 711 250 387 130 14 15 415 107 11 3 8 - - 1 2525 to 29 years 2,808 923 358 663 238 29 17 330 194 21 1 6 - - 1 2730 to 34 years 2,511 931 379 430 241 49 37 217 173 19 5 4 - - 3 2335 to 39 years 1,776 857 263 210 126 62 30 112 83 13 4 - - - - 2 1440 to 44 years 1,496 818 233 113 108 79 17 64 40 13 1 - - - - - - 1045 to 49 years 1,614 1,021 236 87 53 109 18 54 21 3 2 - - - - - - 1050 to 54 years 1,605 1,048 272 54 61 65 13 53 19 9 - - - - - - - - 1155 to 59 years 978 660 162 29 30 42 9 25 2 5 2 3 - - - - 960 years and older 655 519 72 16 11 10 1 14 - - 2 1 - - - - 3 6
No. of admissions 16,296 7,702 2,272 2,035 1,011 462 161 1,684 663 101 19 22 - - 11 153
Race/ethnicityWhite (non-Hispanic) 12,757 6,247 1,662 1,595 862 163 102 1,268 604 86 16 15 - - 11 126Black (non-Hispanic) 1,846 602 409 210 49 272 38 238 13 1 2 4 - - - - 8Hispanic origin 901 503 81 164 26 19 15 72 8 6 - - 2 - - - - 5American Indian/Alaska Native 457 188 94 31 56 6 1 56 17 - - 1 1 - - - - 6Asian/Pacific Islander 140 87 7 5 2 1 5 14 17 1 - - - - - - - - 1Other 195 75 19 30 16 1 - - 36 4 7 - - - - - - - - 7
No. of admissions 16,296 7,702 2,272 2,035 1,011 462 161 1,684 663 101 19 22 - - 11 153
Table 3.46a. Wisconsin admissions aged 12 and older, by primary substance of abuse and gender, age at admission, and race/ethnicity: Number, 2015
Gender, age at admission, and race/ethnicity
All admis-sions
aged 12 and older
Primary substance at admission
Alcohol Opiates Cocaine
Mari-juana/
hashish
Metham-phetamine/
amphet-amines
Tran-quil-izers
SOURCE: Center for Behavioral Health Statistics and Quality, Substance Abuse and Mental Health Services Administration, Treatment Episode Data Set (TEDS). Data received through 11.01.16.
Seda-tives
Hallu-cino-gens PCP
Inhal-ants
Other/ none speci-fied
- - Quantity is zero.1 Admissions for which values were not collected, unknown, or missing are excluded from the sum total.
183

Alcohol only
Secondarydrug Heroin
Other opiates
Smoked cocaine
Other route
Total admissions aged 12 and older 16,296 7,702 2,272 2,035 1,011 462 161 1,684 663 101 19 22 - - 11 153
GenderMale 67.1 72.1 71.8 59.3 48.1 52.6 70.2 72.1 48.9 40.6 36.8 90.9 - - 9.1 61.4Female 32.9 27.9 28.2 40.7 51.9 47.4 29.8 27.9 51.1 59.4 63.2 9.1 - - 90.9 38.6
Total 100.0 100.0 100.0 100.0 100.0 100.0 100.0 100.0 100.0 100.0 100.0 100.0 - - 100.0 100.0No. of admissions 16,296 7,702 2,272 2,035 1,011 462 161 1,684 663 101 19 22 - - 11 153
Age at admission12 to 19 years 4.8 2.8 2.1 2.3 1.3 0.6 2.5 23.8 3.6 5.0 - - 4.5 - - 9.1 11.820 to 24 years 12.7 9.2 11.0 19.0 12.9 3.0 9.3 24.6 16.1 10.9 15.8 36.4 - - 9.1 16.325 to 29 years 17.2 12.0 15.8 32.6 23.5 6.3 10.6 19.6 29.3 20.8 5.3 27.3 - - 9.1 17.630 to 34 years 15.4 12.1 16.7 21.1 23.8 10.6 23.0 12.9 26.1 18.8 26.3 18.2 - - 27.3 15.035 to 39 years 10.9 11.1 11.6 10.3 12.5 13.4 18.6 6.7 12.5 12.9 21.1 - - - - 18.2 9.240 to 44 years 9.2 10.6 10.3 5.6 10.7 17.1 10.6 3.8 6.0 12.9 5.3 - - - - - - 6.545 to 49 years 9.9 13.3 10.4 4.3 5.2 23.6 11.2 3.2 3.2 3.0 10.5 - - - - - - 6.550 to 54 years 9.8 13.6 12.0 2.7 6.0 14.1 8.1 3.1 2.9 8.9 - - - - - - - - 7.255 to 59 years 6.0 8.6 7.1 1.4 3.0 9.1 5.6 1.5 0.3 5.0 10.5 13.6 - - - - 5.960 years and older 4.0 6.7 3.2 0.8 1.1 2.2 0.6 0.8 - - 2.0 5.3 - - - - 27.3 3.9
Total 100.0 100.0 100.0 100.0 100.0 100.0 100.0 100.0 100.0 100.0 100.0 100.0 - - 100.0 100.0No. of admissions 16,296 7,702 2,272 2,035 1,011 462 161 1,684 663 101 19 22 - - 11 153
Race/ethnicityWhite (non-Hispanic) 78.3 81.1 73.2 78.4 85.3 35.3 63.4 75.3 91.1 85.1 84.2 68.2 - - 100.0 82.4Black (non-Hispanic) 11.3 7.8 18.0 10.3 4.8 58.9 23.6 14.1 2.0 1.0 10.5 18.2 - - - - 5.2Hispanic origin 5.5 6.5 3.6 8.1 2.6 4.1 9.3 4.3 1.2 5.9 - - 9.1 - - - - 3.3American Indian/Alaska Native 2.8 2.4 4.1 1.5 5.5 1.3 0.6 3.3 2.6 - - 5.3 4.5 - - - - 3.9Asian/Pacific Islander 0.9 1.1 0.3 0.2 0.2 0.2 3.1 0.8 2.6 1.0 - - - - - - - - 0.7Other 1.2 1.0 0.8 1.5 1.6 0.2 - - 2.1 0.6 6.9 - - - - - - - - 4.6
Total 100.0 100.0 100.0 100.0 100.0 100.0 100.0 100.0 100.0 100.0 100.0 100.0 - - 100.0 100.0No. of admissions 16,296 7,702 2,272 2,035 1,011 462 161 1,684 663 101 19 22 - - 11 153
Table 3.46b. Wisconsin admissions aged 12 and older, by primary substance of abuse and gender, age at admission, and race/ethnicity: Percent distribution, 2015
Gender, age at admission, and race/ethnicity
All admis-sions
aged 12 and older
Primary substance at admission
Alcohol Opiates CocaineMari-juana/
hashish
Metham-phetamine/
amphet-amines
Tran-quil-izers
NOTE: Percentages may not sum to 100 percent due to rounding. Percentages are based on all admissions with known and valid values. Admissions for which values were not collected, unknown, or missing are excluded from the percentage base (denominator).SOURCE: Center for Behavioral Health Statistics and Quality, Substance Abuse and Mental Health Services Administration, Treatment Episode Data Set (TEDS). Data received through 11.01.16.
Seda-tives
Hallu-cino-gens PCP
Inhal-ants
Other/ none speci-fied
- - Quantity is zero.
184

Alcohol only
Secondarydrug Heroin
Other opiates
Smoked cocaine
Other route
Total admissions aged 12 and older 5,563 1,905 968 162 352 7 31 959 1,086 13 11 20 - - 3 46
GenderMale 3,677 1,348 685 81 182 5 16 726 577 3 2 16 - - 3 33Female 1,886 557 283 81 170 2 15 233 509 10 9 4 - - - - 13
No. of admissions1 5,563 1,905 968 162 352 7 31 959 1,086 13 11 20 - - 3 46
Age at admission12 to 19 years 599 51 94 8 13 - - 2 354 52 - - 1 8 - - 2 1420 to 24 years 847 183 140 56 62 3 7 210 166 2 - - 6 - - - - 1225 to 29 years 980 279 177 53 89 1 2 130 233 3 3 1 - - 1 830 to 34 years 915 297 136 28 72 1 4 106 264 - - 1 2 - - - - 435 to 39 years 600 218 123 12 35 - - 3 58 144 2 - - - - - - - - 540 to 44 years 529 244 112 - - 26 - - 4 36 98 5 2 2 - - - - - -45 to 49 years 361 191 62 1 17 1 1 23 60 1 2 - - - - - - 250 to 54 years 342 205 55 1 17 - - 3 21 38 - - 1 1 - - - - - -55 to 59 years 254 143 44 3 17 1 5 16 23 - - 1 - - - - - - 160 years and older 136 94 25 - - 4 - - - - 5 8 - - - - - - - - - - - -
No. of admissions 5,563 1,905 968 162 352 7 31 959 1,086 13 11 20 - - 3 46
Race/ethnicityWhite (non-Hispanic) 4,271 1,451 714 144 289 4 20 694 878 11 11 18 - - 2 35Black (non-Hispanic) 98 27 14 1 3 2 3 29 19 - - - - - - - - - - - -Hispanic origin 570 167 115 11 36 1 4 123 104 1 - - 2 - - - - 6American Indian/Alaska Native 313 174 54 2 11 - - 1 41 29 - - - - - - - - - - 1Asian/Pacific Islander 29 8 8 2 - - - - 1 5 5 - - - - - - - - - - - -Other 267 74 60 2 13 - - 2 64 48 1 - - - - - - - - 3
No. of admissions 5,548 1,901 965 162 352 7 31 956 1,083 13 11 20 - - 2 45
Table 3.47a. Wyoming admissions aged 12 and older, by primary substance of abuse and gender, age at admission, and race/ethnicity: Number, 2015
Gender, age at admission, and race/ethnicity
All admis-sions
aged 12 and older
Primary substance at admission
Alcohol Opiates Cocaine
Mari-juana/
hashish
Metham-phetamine/
amphet-amines
Tran-quil-izers
SOURCE: Center for Behavioral Health Statistics and Quality, Substance Abuse and Mental Health Services Administration, Treatment Episode Data Set (TEDS). Data received through 11.01.16.
Seda-tives
Hallu-cino-gens PCP
Inhal-ants
Other/ none speci-fied
- - Quantity is zero.1 Admissions for which values were not collected, unknown, or missing are excluded from the sum total.
185
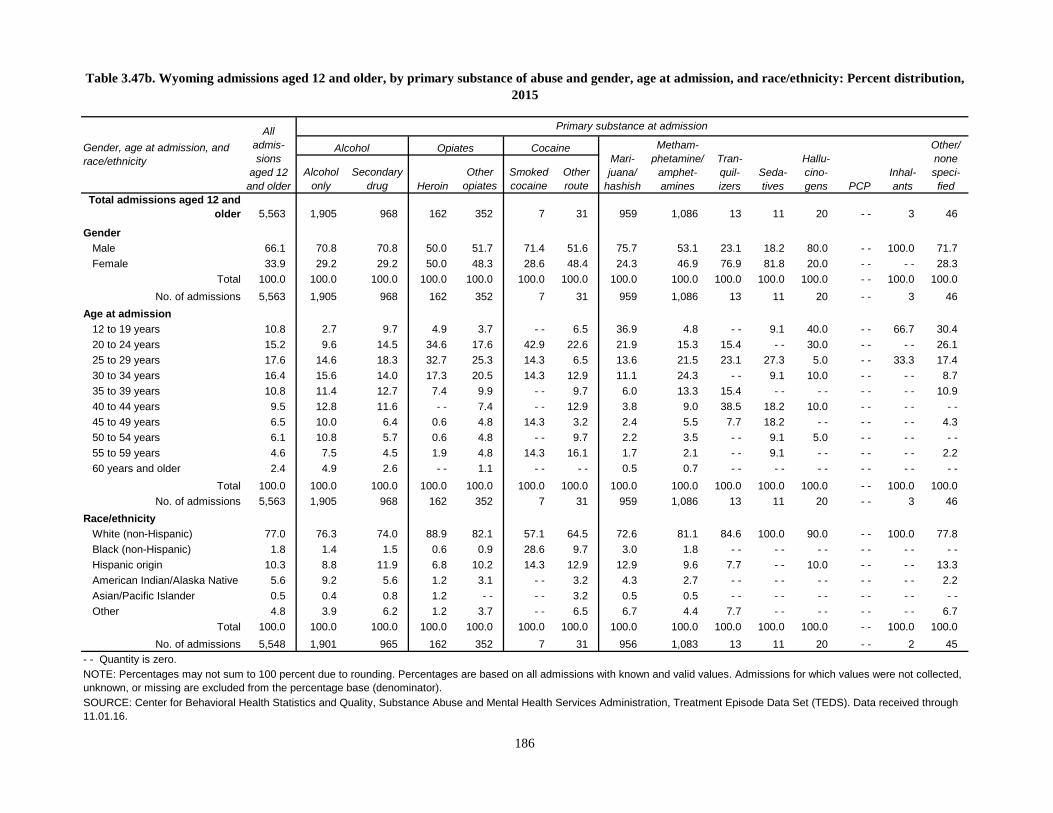
Alcohol only
Secondarydrug Heroin
Other opiates
Smoked cocaine
Other route
Total admissions aged 12 and older 5,563 1,905 968 162 352 7 31 959 1,086 13 11 20 - - 3 46
GenderMale 66.1 70.8 70.8 50.0 51.7 71.4 51.6 75.7 53.1 23.1 18.2 80.0 - - 100.0 71.7Female 33.9 29.2 29.2 50.0 48.3 28.6 48.4 24.3 46.9 76.9 81.8 20.0 - - - - 28.3
Total 100.0 100.0 100.0 100.0 100.0 100.0 100.0 100.0 100.0 100.0 100.0 100.0 - - 100.0 100.0No. of admissions 5,563 1,905 968 162 352 7 31 959 1,086 13 11 20 - - 3 46
Age at admission12 to 19 years 10.8 2.7 9.7 4.9 3.7 - - 6.5 36.9 4.8 - - 9.1 40.0 - - 66.7 30.420 to 24 years 15.2 9.6 14.5 34.6 17.6 42.9 22.6 21.9 15.3 15.4 - - 30.0 - - - - 26.125 to 29 years 17.6 14.6 18.3 32.7 25.3 14.3 6.5 13.6 21.5 23.1 27.3 5.0 - - 33.3 17.430 to 34 years 16.4 15.6 14.0 17.3 20.5 14.3 12.9 11.1 24.3 - - 9.1 10.0 - - - - 8.735 to 39 years 10.8 11.4 12.7 7.4 9.9 - - 9.7 6.0 13.3 15.4 - - - - - - - - 10.940 to 44 years 9.5 12.8 11.6 - - 7.4 - - 12.9 3.8 9.0 38.5 18.2 10.0 - - - - - -45 to 49 years 6.5 10.0 6.4 0.6 4.8 14.3 3.2 2.4 5.5 7.7 18.2 - - - - - - 4.350 to 54 years 6.1 10.8 5.7 0.6 4.8 - - 9.7 2.2 3.5 - - 9.1 5.0 - - - - - -55 to 59 years 4.6 7.5 4.5 1.9 4.8 14.3 16.1 1.7 2.1 - - 9.1 - - - - - - 2.260 years and older 2.4 4.9 2.6 - - 1.1 - - - - 0.5 0.7 - - - - - - - - - - - -
Total 100.0 100.0 100.0 100.0 100.0 100.0 100.0 100.0 100.0 100.0 100.0 100.0 - - 100.0 100.0No. of admissions 5,563 1,905 968 162 352 7 31 959 1,086 13 11 20 - - 3 46
Race/ethnicityWhite (non-Hispanic) 77.0 76.3 74.0 88.9 82.1 57.1 64.5 72.6 81.1 84.6 100.0 90.0 - - 100.0 77.8Black (non-Hispanic) 1.8 1.4 1.5 0.6 0.9 28.6 9.7 3.0 1.8 - - - - - - - - - - - -Hispanic origin 10.3 8.8 11.9 6.8 10.2 14.3 12.9 12.9 9.6 7.7 - - 10.0 - - - - 13.3American Indian/Alaska Native 5.6 9.2 5.6 1.2 3.1 - - 3.2 4.3 2.7 - - - - - - - - - - 2.2Asian/Pacific Islander 0.5 0.4 0.8 1.2 - - - - 3.2 0.5 0.5 - - - - - - - - - - - -Other 4.8 3.9 6.2 1.2 3.7 - - 6.5 6.7 4.4 7.7 - - - - - - - - 6.7
Total 100.0 100.0 100.0 100.0 100.0 100.0 100.0 100.0 100.0 100.0 100.0 100.0 - - 100.0 100.0No. of admissions 5,548 1,901 965 162 352 7 31 956 1,083 13 11 20 - - 2 45
Table 3.47b. Wyoming admissions aged 12 and older, by primary substance of abuse and gender, age at admission, and race/ethnicity: Percent distribution, 2015
Gender, age at admission, and race/ethnicity
All admis-sions
aged 12 and older
Primary substance at admission
Alcohol Opiates CocaineMari-juana/
hashish
Metham-phetamine/
amphet-amines
Tran-quil-izers
NOTE: Percentages may not sum to 100 percent due to rounding. Percentages are based on all admissions with known and valid values. Admissions for which values were not collected, unknown, or missing are excluded from the percentage base (denominator).SOURCE: Center for Behavioral Health Statistics and Quality, Substance Abuse and Mental Health Services Administration, Treatment Episode Data Set (TEDS). Data received through 11.01.16.
Seda-tives
Hallu-cino-gens PCP
Inhal-ants
Other/ none speci-fied
- - Quantity is zero.
186
187
Appendix A
About the Treatment Episode Data Set (TEDS)
Introduction
This report presents data from the Treatment Episode Data Set (TEDS) on the demographic and substance abuse characteristics of admissions to substance abuse treatment. The Center for Behavioral Health Statistics and Quality (CBHSQ), Substance Abuse and Mental Health Services Administration (SAMHSA), coordinates and manages collection of TEDS data from the states.
The TEDS is a compilation of client-level data routinely collected by the individual state administra-tive data systems to monitor their substance abuse treatment systems. Generally, facilities that are required to report to the State Substance Abuse Agency (SSA) are those that receive public funds and/or are licensed or certified by the SSA to provide substance abuse treatment (or are adminis-tratively tracked for other reasons).
The TEDS system comprises two major components, the Admissions Data Set and the Discharge Data Set. The TEDS Admissions Data Set includes client-level data on substance abuse treatment admissions from 1992 through the present. The TEDS Discharge Data Set can be linked at record level to admissions and includes information from clients discharged in 2000 and later. For both data sets, selected data items from the individual state data files are converted to a standardized format consistent across states. These standardized data constitute TEDS.
The TEDS Admissions Data System consists of a Minimum Data Set of items collected by all states and a Supplemental Data Set where individual data items are reported at the states’ option.
The Minimum Data Set consists of 19 items that include:
• Demographic information
• Primary, secondary, and tertiary substances and the usual route of administration, frequency of use, and age at first use
• Source of referral to treatment
• Number of prior treatment episodes
• Service type, including planned use of medication-assisted opioid therapy
The Supplemental Data Set consists of 17 items that include psychiatric, social, and economic measures.
History
National-level data collection on admissions to substance abuse treatment was first mandated in 1972 under the Drug Abuse Office and Treatment Act, P.L. 92-255. This act initiated federal funding for drug treatment and rehabilitation and required reporting on clients entering drug (but not alcohol)
188
abuse treatment. The Client-Oriented Data Acquisition Process (CODAP) was developed to collect admission and discharge data directly from federally-funded drug treatment programs. (Programs for treatment of alcohol abuse were not included.) Reporting was mandatory for all such programs, and data were collected using a standard form. CODAP included all clients in federally-funded programs regardless of individual funding source. Reports were issued from 1973 to 1981 based on data from 1,800 to 2,000 programs, including some 200,000 annual admissions.
In 1981, collection of national-level data on admissions to substance abuse treatment was discontin-ued because of the introduction of the Alcohol, Drug Abuse, and Mental Health Services (ADMS) Block Grant. The Block Grant transferred federal funding from individual programs to the states for distribution, and it included no data reporting requirement. Participation in CODAP became voluntary; although several states submitted data through 1984, the data were in no way nationally representative.
In 1988, the Comprehensive Alcohol Abuse, Drug Abuse, and Mental Health Amendments (P.L. 100-690) established a revised Substance Abuse Prevention and Treatment (SAPT) Block Grant and mandated federal data collection on clients receiving treatment for either alcohol or drug abuse. The TEDS data collection effort represents the federal response to this mandate. TEDS began in 1989 with the issue of 3-year development grants to states.
State Data Collection Systems
TEDS is an exceptionally large and powerful data set that covers a significant proportion of all admis-sions to substance abuse treatment. TEDS is a compilation of data collected through the individual data collection systems of the State Substance Abuse Agencies (SSA) for substance abuse treatment. States have cooperated with the federal government in the data collection process, and substantial progress has been made toward developing a standardized data set. However, because each state system is unique and each state has unique powers and mandates, significant differences exist among state data collection systems. These differences are compounded by evolving health care payment systems, so state-to-state comparisons must be made with extreme caution.
The number and client mix of TEDS admissions do not represent the total national demand for substance abuse treatment or the prevalence of substance abuse in the general population.
States differ widely in the amount of public funding available for substance abuse treatment and in the constraints placed on the use of funds. States may be directed to target special populations such as pregnant women or adolescents. Where funds are limited, states may be compelled to exercise triage in admitting persons to treatment, admitting only those with the most “severe” problems. In states with higher funding levels, a larger proportion of the population in need of treatment may be admitted, including the less severely impaired.
States may include or exclude reporting by certain sectors of the treatment population, and these sectors may change over time. For example, treatment programs based in the criminal justice system may or may not be administered through the SSA. Detoxification facilities, which can generate large numbers of admissions, are not uniformly considered treatment facilities and are not uniformly reported by all states.
189
Appendix Table 1 presents key characteristics of state data collection systems for 2015. However, these characteristics can change as state substance abuse treatment systems change, and thus may be responsible for some year-to-year variation within states.
• Facilities included. The scope of facilities included in TEDS is affected by differences in state licensure, certification, and accreditation practices, and disbursement of public funds. Most SSAs require facilities that receive state/public funding (including Federal Block Grant funds) for the provision of alcohol and/or drug treatment services to report data to the SSA. Generally this funding is distributed by the SSA but may be distributed by another public agency.
• Some SSAs regulate private facilities, methadone clinics, and/or individual practitioners and require them to report TEDS data. Others do not because of the difficulty in obtaining data from these facilities, although these facilities may report voluntarily.
• Facilities operated by federal agencies (e.g., the Bureau of Prisons, the Department of Defense, and the Department of Veterans Affairs) generally do not report TEDS data to the SSA, although some facilities operated by the Indian Health Service are included.
• Hospital-based substance abuse treatment facilities are frequently not licensed through the SSA and do not report TEDS data.
• Correctional facilities (state prisons and local jails) are monitored by the SSA and report TEDS data in some states but not in others.
• The primary goal of TEDS is to monitor the characteristics of clients admitted to planned, continuing treatment regimens. Thus early intervention and crisis intervention programs that do not lead to enrollment in continued treatment are excluded from TEDS.
• Clients included. About 60 percent of states reported data on all admissions to all eligible facilities, although some reported only, or largely, admissions financed by public funds. TEDS is an admission-based system; therefore, TEDS admissions do not represent individuals. For example, an individual admitted to treatment twice within a calendar year would be counted as two admissions.
• Ability to track multi-service episodes. The goal for the TEDS system is to enumerate treatment episodes by distinguishing the initial admission of a client from his/her subsequent transfer to a different service type (e.g., from rehabilitation/residential treatment to outpatient) within a single continuous treatment episode. Thus TEDS records are ideally coded as admissions if they represent the initial treatment service in a treatment episode and as transfers if they represent a change in service type or a change in provider without an interruption in treatment.
This requires, however, that clients be assigned unique IDs that can be linked across providers; not all states are legally and/or technologically able to do this. Most states can identify trans-fers when there is a change in service type within the structure of a given provider. However, fewer can also identify a transfer involving a change of provider. Several states do not track transfers, but instead report as transfers those clients who are discharged and readmitted within a specified (state-specific) time period.
Because some admission records in fact may represent transfers, the number of admissions reported probably overestimates the number of treatment episodes. Some states reported a

190
limited data set on codependents of substance abusers entering treatment. On average, from 2005 to 2015, 89 percent of all records submitted were client admissions, 10 percent were client transfers, and 1 percent were codependents of substance abusers.
• Services offered. A state’s mix of service types (e.g., outpatient, detoxification, rehabilitation/residential, opioid therapy) can have a significant effect on its admission rate. There is higher client turnover and therefore more admissions in short-stay services such as detoxification than in long-stay services such as outpatient or long-term residential treatment. Admission rates for individual substances of abuse may be affected as well (e.g., detoxification is more closely associated with alcohol or heroin use than with use of other substances).
• Completeness and timeliness of reporting. SAMHSA, in reporting TEDS data, must balance timeliness of reporting and completeness of the data set. There may be a time lag in the publica-tion of SAMHSA’s annual reports because preparation cannot begin until states have completed their data submission for that year. States in turn rely on individual facilities to report in a timely manner so they can submit TEDS data to SAMHSA at regular intervals.
Admissions from facilities that report late to the states will appear in a later data submission to SAMHSA, so the number of annual admissions in a report may be higher in subsequent reports. The number of additional admissions is small because of the time lag in issuing the report. Thus the percentage distributions will change very little in subsequent reports, although Census region-, Census division-, and state-level data may change somewhat more for states with reporting delays (this applies to state report only).
States continually review and improve their data collection and processing. When systematic errors are identified, states may revise or replace historical TEDS data files. While this process represents an improvement in the data system, the historical statistics in this report will differ slightly from those in earlier reports.
Appendix Tables 2 and 3 indicate the proportions of records by state or jurisdiction for which valid data were received for 2015. States are expected to report all variables in the Minimum Data Set (Appendix Table 2). Variables in the Supplemental Data Set are collected at the states’ option (Appendix Table 3).
Report-Specific Considerations
• The report focuses on treatment admissions for substance abusers, so admissions for treatment as a codependent of a substance abuser are excluded. Records for identifiable transfers within a single treatment episode are also excluded.
• Records with partially complete data have been retained. Where records include missing or invalid data for a specific variable other than primary, secondary, or tertiary substance, those records are excluded from tabulations of that variable. For substance variables, missing or unknown responses were included in the category “Other.” The total number of admissions on which a percentage distribution is based is reported in each table.
• Records with partially complete data have been retained. If a variable is coded with a value indicating the data were missing or miscoded, the record is excluded from tabulations of that
191
variable. The total number of records on which a percentage distribution is based is reported in each table.
• Variables in the Supplemental Data Set are not collected by all states. States that did not collect a specific variable are excluded from tabulations of that variable. The total number of admis-sions on which a percentage distribution is based is reported in each table.
• The primary, secondary, and tertiary substances of abuse reported to TEDS are those substances that led to the treatment episode and not necessarily a complete enumeration of all substances used at the time of admission.
• Primary alcohol admissions are classified as “Alcohol only” or “Alcohol with secondary drug abuse.” The latter indicates a primary alcohol admission with a specified secondary and/or tertiary drug. All other primary alcohol substances admissions are classified as “Alcohol only.”
• Cocaine admissions are classified according to usual route of administration as smoked and other route. Smoked cocaine primarily represents crack or rock cocaine, but it can also include cocaine hydrochloride (powder cocaine) when it is free-based. Non-smoked cocaine includes all cocaine admissions where cocaine is injected, inhaled, or taken orally; it also includes admis-sions where the route of administration is unknown or not collected. Thus the TEDS estimate of admissions for smoked cocaine is conservative.
• Methamphetamine/amphetamine admissions include admissions for both substances, but are primarily for methamphetamine. In 2015, methamphetamine constituted about 94 percent of combined methamphetamine/amphetamine admissions. Texas, which has large numbers of methamphetamine admissions, reported them as Other amphetamines until 2006.
• For this report, secondary and tertiary substances (see Appendix B) are grouped and referred to as secondary substances.
• Significant changes in the clients or facilities reported to TEDS by some states and jurisdictions can result in changes in the number of admissions large enough to influence trends.

Facilities required to report to the state SSA 1Facilities reporting
voluntarily to the state SSA
Alabama Facilities that receive state/public funding None All clients in facility Admission Admission
Alaska Facilities that receive state/public funding NoneAll clients in facility who receive substance abuse treatment services
Admission (for most providers)
Transfer (for some providers)
Admission
Arizona Facilities that receive state/public funding None State/public-funded clients only n/a 2 n/a 2
Arkansas Facilities that are licensed by state SSAState Community Correction facilitiesSome private facilities
All clients in a licensed facility Transfer Admission
California Facilities that receive state fundingAll licensed narcotic treatment facilities None All clients in facility except DUI Transfer Transfer
Colorado
State-licensed facilitiesMethadone facilitiesCommunity-based juvenile and adult justice treatment programs, except institutionally-based
None All clients receiving substance abuse treatment services in facility Admission Admission
Connecticut
Facilities that receive state/public funding (including corrections)Facilities serving adults that are licensed by state Dept of Public Health Some facilities treating youth < 18General hospitals funded by SSA
None All clients in facility Admission Admission
Delaware
Facilities that receive state/public funding, excluding:- Child/youth services- Most Medicaid-funded services- Most criminal justice system services
None State/public-funded clients only Admission Admission
Dist. of Columbia Facilities that receive state/public funding None State/public-funded clients only Transfer Admission
Florida Facilities that receive state/public funding None State/public-funded clients only Transfer Admission
Georgia
Facilities that receive SAPT/BG, state, and Medicaid funding through the state SSA (This includes Medicaid eligibile aged blind, and disabled adults and youth. Medicaid individuals in Managed Care Plans are excluded.)
NoneSSA funded clients with SA or co-occurring SA and mental disorders
n/a 3 Admission
Hawaii Facilities that receive state/public funding None All clients in facility Admission Admission
Continued. See notes at end of table.
Appendix Table 1. State data system reporting characteristics: 2015
State or jurisdiction
Facilities reporting TEDS data to the state SSA
Eligible clientsChange of
service within episode
Change of provider within
episode
192

Facilities required to report to the state SSA 1Facilities reporting
voluntarily to the state SSA
Idaho Facilities that receive state/public funding None State/public-funded clients only Transfer Admission
Illinois Facilities that receive funding through the state SSA (this includes Medicaid paid sub-acute addiction treatment services) None State/public-funded clients only Transfer Admission
Indiana Facilities that receive state/public funding None State/public-funded clients only Transfer Admission
Iowa Facilities that receive state/public fundingFacilities that are licensed/certified by state SSA None All clients in facility n/a 4 Admission
KansasFacilities that receive state/public fundingMedicaid-certified facilitiesDepartment of Corrections 4th-time DUI facilities
None All clients in facility Transfer Transfer
Kentucky Facilities that receive state/public funding None All clients in facility Transfer Admission
Louisiana Facilities that receive state/public fundingState programs None All clients in facility Admission Admission
Maine Facilities that receive state/federal/public funding Facilities licensed by the state
Some private substance abuse providers report
All clients in facility Admission Admission
Maryland Facilities that receive state/public funding None All clients in facility Transfer Admission
Massachusetts Facilities that are licensed/certified and hold a contract with the state SSA
Houses of corrections and some private opioid treatment programs that do not have a contract with the state
All clients in facility Admission Admission
Michigan State licensed facilities that receive state/public funding Medicaid providers of behavioral health services None
Clients whose services are supported by state/public funds through the Dept of Health and Human Services, including Medicaid
n/a 3 Transfer
Minnesota Providers serving publicly-funded clients None All clients in facility Admission Admission
Mississippi Facilities that receive state/public fundingFacilities certified by Mental Health Department None All clients in facility Transfer Admission
Missouri Facilities that receive state/public funding None State/public-funded clients only Transfer Admission
Continued. See notes at end of table.
Appendix Table 1. State data system reporting characteristics: 2015 (continued)
State or jurisdiction
Facilities reporting TEDS data to the state SSA
Eligible clientsChange of
service within episode
Change of provider within
episode
193
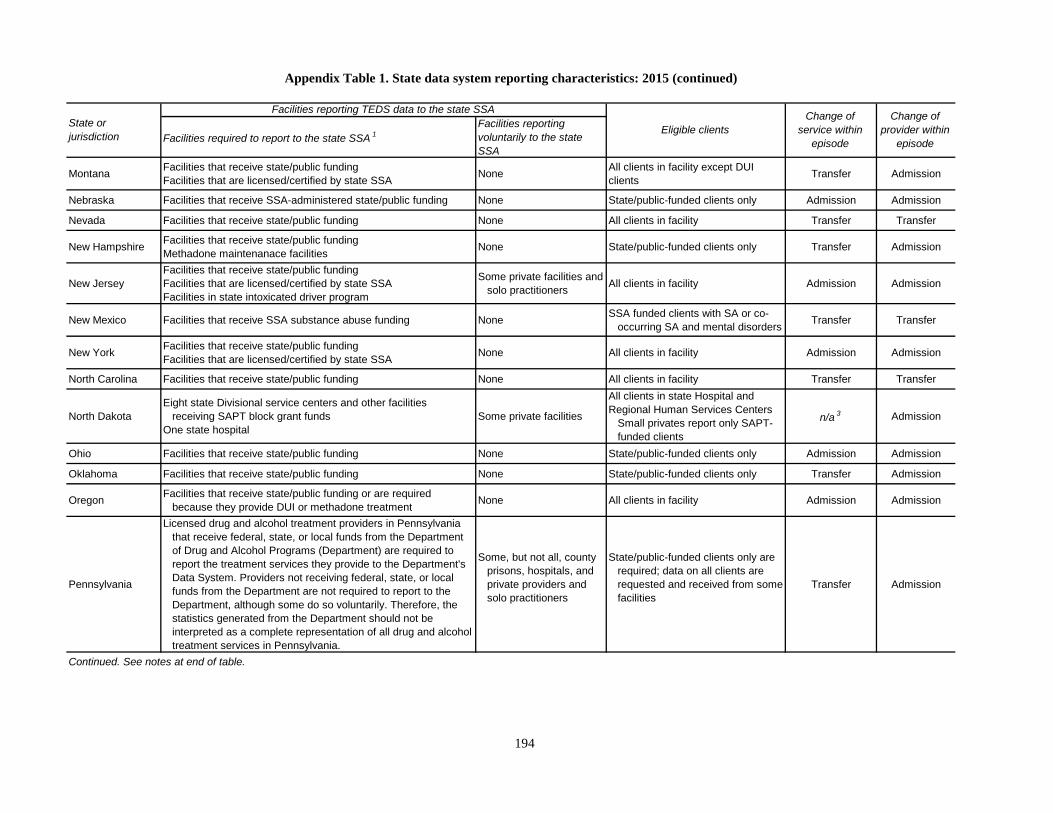
Facilities required to report to the state SSA 1Facilities reporting voluntarily to the state SSA
Montana Facilities that receive state/public fundingFacilities that are licensed/certified by state SSA None All clients in facility except DUI
clients Transfer Admission
Nebraska Facilities that receive SSA-administered state/public funding None State/public-funded clients only Admission Admission
Nevada Facilities that receive state/public funding None All clients in facility Transfer Transfer
New Hampshire Facilities that receive state/public fundingMethadone maintenanace facilities None State/public-funded clients only Transfer Admission
New JerseyFacilities that receive state/public fundingFacilities that are licensed/certified by state SSAFacilities in state intoxicated driver program
Some private facilities and solo practitioners All clients in facility Admission Admission
New Mexico Facilities that receive SSA substance abuse funding None SSA funded clients with SA or co- occurring SA and mental disorders Transfer Transfer
New York Facilities that receive state/public fundingFacilities that are licensed/certified by state SSA None All clients in facility Admission Admission
North Carolina Facilities that receive state/public funding None All clients in facility Transfer Transfer
North DakotaEight state Divisional service centers and other facilities receiving SAPT block grant fundsOne state hospital
Some private facilities
All clients in state Hospital and Regional Human Services Centers Small privates report only SAPT- funded clients
n/a 3 Admission
Ohio Facilities that receive state/public funding None State/public-funded clients only Admission Admission
Oklahoma Facilities that receive state/public funding None State/public-funded clients only Transfer Admission
Oregon Facilities that receive state/public funding or are required because they provide DUI or methadone treatment None All clients in facility Admission Admission
Pennsylvania
Licensed drug and alcohol treatment providers in Pennsylvania that receive federal, state, or local funds from the Department of Drug and Alcohol Programs (Department) are required to report the treatment services they provide to the Department's Data System. Providers not receiving federal, state, or local funds from the Department are not required to report to the Department, although some do so voluntarily. Therefore, the statistics generated from the Department should not be interpreted as a complete representation of all drug and alcohol treatment services in Pennsylvania.
Some, but not all, county prisons, hospitals, and private providers and solo practitioners
State/public-funded clients only are required; data on all clients are requested and received from some facilities
Transfer Admission
Continued. See notes at end of table.
Appendix Table 1. State data system reporting characteristics: 2015 (continued)
State or jurisdiction
Facilities reporting TEDS data to the state SSA
Eligible clientsChange of
service within episode
Change of provider within
episode
194

Facilities required to report to the state SSA 1Facilities reporting voluntarily to the state SSA
Puerto Rico Facilities that receive state/public funding None All clients in facility Admission Admission
Rhode Island Facilities that receive state/public fundingFacilities that are licensed/certified by state SSA None All clients in facility Admission Admission
South Carolina Facilities that receive state/public funding None All clients in facility Transfer Admission
South DakotaFacilities that receive state/public fundingFacilities that are licensed/certified by state SSA Medicare- certified facilities
None All clients in facility Transfer Admission
Tennessee Facilities that receive state/public funding None State/public-funded clients only Transfer Admission
Texas Facilities that receive state/public funding None State/public-funded clients only Admission Admission
Utah Facilities that receive state/public funding None All clients in facility Transfer Transfer
Vermont Facilities that receive state/public funding None All clients in facility Transfer Admission
Virginia Facilities that receive state/public funding None All clients in facility n/a 3 Admission
Washington Facilities that receive state/public fundingMedicare-certified facilities
State-certified privately funded methadone treatment programs
State/public-funded clients only are required Transfer Transfer
West Virginia Facilities that receive state/public funding None All clients in facility Transfer Transfer
Wisconsin Facilities that receive state/public funding None State/County/public-funded clients are required Admission Admission
Wyoming Facilities that receive state/public funding None All clients in a facility Admission Admission
SOURCE: State Substance Abuse Agencies, January 2017.
Appendix Table 1. State data system reporting characteristics: 2015 (continued)
State or jurisdiction
Facilities reporting TEDS data to the state SSA
Eligible clientsChange of
service within episode
Change of provider within
episode
n/a Not applicable.1 "State/public funding" generally refers to funding by the state Substance Abuse Agency but may also include funding by another public agency.2 Neither an admission nor transfer record results from a change in service or provider.3 Neither an admission nor transfer record results from a change in service within a provider.4 Not reporting as of July 1, 2014.
195

Appendix A Table 2. Item percentage response rate, by state or jurisdiction: TEDS Minimum Data Set, 2015
State or jurisdiction Prior
treat-ment
Refer-ral
source AgeGen-der Race
Ethni-city
Edu-ca-tion
Em-ploy-ment
Primary substance Secondary substance Tertiary substanceType
ofser-vice
Opioid therapy
Sub-stance Route 1
Fre-quen-
1cy
Ageat 1st
1useSub-
stance Route 2
Fre-quen-
2cy
Ageat 1st
2useSub-
stance Route 3
Fre-quen-
3cy
Ageat 1st
3useTotal 91 98 100 100 98 98 95 98 99 99 99 98 93 97 97 97 80 94 95 94 100 98
Alabama 99 98 100 100 86 80 99 99 100 100 96 100 41 99 97 99 99 100 99 100 100 100Alaska 100 100 100 100 100 99 98 99 99 100 99 99 99 100 99 99 99 100 100 99 100 100Arizona 100 90 100 100 100 100 98 100 100 99 100 100 100 99 100 100 100 100 100 100 100 100Arkansas 100 100 100 100 100 95 98 100 100 100 100 100 100 100 100 100 100 100 100 100 100 97California 100 100 100 100 100 100 100 100 100 100 100 100 100 100 100 100 - - - - - - - - 100 98Colorado 100 100 100 100 80 100 99 100 100 100 100 95 100 100 100 100 100 100 100 100 100 100Connecticut 90 89 100 100 99 98 97 95 100 100 100 100 99 99 100 100 99 100 100 100 100 100Delaware 2 65 100 100 98 96 68 63 91 65 99 63 87 44 99 43 85 22 99 21 100 98Dist. of Columbia 100 94 100 100 99 98 88 97 100 100 100 95 100 100 100 97 100 100 100 98 100 100Florida 100 97 100 100 100 100 90 99 100 100 100 100 100 100 100 98 100 100 100 99 100 100Georgia ‡ ‡ ‡ ‡ ‡ ‡ ‡ ‡ ‡ ‡ ‡ ‡ ‡ ‡ ‡ ‡ ‡ ‡ ‡ ‡ ‡ ‡Hawaii 100 100 100 100 100 98 99 100 100 100 100 100 100 100 100 100 100 100 100 100 100 100Idaho 100 100 100 100 94 93 84 100 100 100 100 88 100 100 100 97 100 100 100 99 100 100Illinois 100 100 100 100 100 100 100 100 100 100 100 100 100 100 100 100 57 100 100 100 100 100Indiana 100 100 100 100 100 97 ** 99 99 100 100 100 99 65 65 65 99 37 37 37 100 100Iowa 100 100 100 100 98 100 100 100 100 100 100 99 100 100 100 98 100 100 100 98 100 100Kansas ‡ ‡ ‡ ‡ ‡ ‡ ‡ ‡ ‡ ‡ ‡ ‡ ‡ ‡ ‡ ‡ ‡ ‡ ‡ ‡ ‡ ‡Kentucky 100 100 100 100 100 100 99 99 100 100 100 99 100 100 100 99 100 100 100 99 100 100Louisiana 84 87 100 100 99 98 62 73 100 99 99 99 100 100 100 100 45 99 99 99 100 87Maine 100 100 100 100 100 100 100 100 100 100 99 100 99 62 61 84 100 31 31 72 100 100Maryland 98 100 100 100 94 92 86 98 93 100 93 81 36 94 93 88 14 77 75 92 100 100Massachusetts 100 99 100 100 98 98 95 98 100 100 99 100 100 100 100 100 99 100 100 100 100 100Michigan 99 100 100 100 99 97 100 100 100 100 100 100 100 67 67 70 100 43 43 43 100 87Minnesota 99 100 100 100 100 100 97 97 99 99 100 100 99 100 100 100 99 100 100 100 100 100Mississippi 93 96 100 100 99 94 96 96 100 100 98 99 90 99 99 97 83 99 99 99 100 99Missouri 99 95 100 100 100 100 99 99 99 100 100 100 99 100 100 100 99 100 100 93 100 99Montana 100 100 100 100 100 100 100 100 100 100 100 100 100 100 100 100 100 100 100 100 100 100Nebraska 100 100 100 100 100 96 92 100 100 99 95 100 100 99 97 100 100 100 98 100 100 100Nevada 94 98 100 100 99 96 98 98 100 93 96 96 96 43 98 56 93 14 99 14 100 100New Hampshire 100 99 100 100 99 98 94 99 98 100 100 97 100 100 100 98 100 100 100 99 100 100Continued. See notes at end of table.
196

Appendix A Table 2. Item percentage response rate, by state or jurisdiction: TEDS Minimum Data Set, 2015 (continued)
State or jurisdiction Prior
treat-ment
Refer-ral
source AgeGen-der Race
Ethni-city
Edu-ca-tion
Em-ploy-ment
Primary substance Secondary substance Tertiary substanceType
ofser-vice
Opioid therapy
Sub-stance Route 1
Fre-quen-
1cy
Ageat 1st
1useSub-
stance Route 2
Fre-quen-
2cy
Ageat 1st
2useSub-
stance Route 3
Fre-quen-
3cy
Ageat 1st
3use
New Jersey 96 100 100 100 100 100 96 95 95 98 99 94 70 99 99 96 57 100 100 98 100 83New Mexico 55 52 100 99 87 89 76 81 92 87 71 100 92 98 93 100 92 99 98 100 100 62New York 71 100 100 100 100 100 100 100 100 100 100 100 100 100 100 100 100 100 100 100 100 100North Carolina 100 97 100 100 99 100 99 99 100 100 100 100 100 100 99 100 100 99 100 100 100 100North Dakota 98 100 100 99 100 100 99 100 100 100 99 100 100 100 99 56 100 100 100 100 100 100Ohio 94 97 100 100 98 99 98 99 100 98 97 98 100 99 98 99 100 99 99 99 100 92Oklahoma 100 100 100 100 100 100 100 100 100 100 100 100 59 100 100 100 29 100 100 99 100 100Oregon ‡ ‡ ‡ ‡ ‡ ‡ ‡ ‡ ‡ ‡ ‡ ‡ ‡ ‡ ‡ ‡ ‡ ‡ ‡ ‡ ‡ ‡Pennsylvania ‡ ‡ ‡ ‡ ‡ ‡ ‡ ‡ ‡ ‡ ‡ ‡ ‡ ‡ ‡ ‡ ‡ ‡ ‡ ‡ ‡ ‡Puerto Rico 77 98 100 100 70 99 96 99 100 100 97 97 100 99 98 85 100 100 99 78 100 100Rhode Island 100 99 100 100 89 96 96 98 99 99 97 94 96 100 99 97 95 100 99 99 100 100South Carolina ‡ ‡ ‡ ‡ ‡ ‡ ‡ ‡ ‡ ‡ ‡ ‡ ‡ ‡ ‡ ‡ ‡ ‡ ‡ ‡ ‡ ‡South Dakota 98 100 100 100 100 100 100 100 100 98 100 100 100 98 100 100 100 97 100 100 100 100Tennessee 100 98 100 100 100 99 99 99 100 100 100 96 100 100 100 98 100 100 100 99 100 100Texas 100 100 100 100 100 100 99 100 100 100 99 100 100 100 99 100 100 100 100 100 100 100Utah 99 99 100 100 100 99 100 100 100 100 100 100 100 100 100 100 100 100 100 100 100 100Vermont 85 97 100 100 97 91 98 100 100 100 100 99 100 100 100 99 100 100 100 100 100 99Virginia 88 92 100 100 98 94 86 96 94 96 94 92 80 96 95 92 67 97 96 95 100 100Washington 100 94 100 100 98 94 99 100 100 100 99 100 99 100 100 100 99 100 100 100 100 100West Virginia 100 99 100 100 80 97 100 100 99 99 99 100 97 51 100 100 98 24 100 100 100 - -Wisconsin - - 99 100 100 100 100 95 97 100 99 98 99 100 100 100 100 100 100 100 100 100 100Wyoming 100 100 100 100 100 99 99 94 100 46 100 99 100 17 100 79 100 6 100 21 100 - -- - Quantity is zero; ** Less than 1 percent; ‡ No data, or less than a full calendar year of data, submitted.1 Percent of admissions reporting a specified primary substance.2 Percent of admissions reporting a specified secondary substance.3 Percent of admissions reporting a specified tertiary substance.NOTES: Based on administrative data reported to TEDS by all reporting states and jurisdictions. Comparisons amSOURCE: Center for Behavioral Health Statistics and Quality, Substance Abuse and Mental Health Services Adm11.01.16.
ong stinistrat
ation,
es shou Treat
ld be made withment Episode D
cautionata Set
. (TEDS). Data received through
197

State or jurisdiction Primary
detailed drug 1
Secondary detailed drug 2
Tertiary detailed drug 3
DSM diag-nosis
Psych-iatric
problemPreg-nant 4
Veter-an
Living arrange-ments
Income source
Health insur-ance
Pay-ment
source
Detailed not in labor
force 5
Detailed criminal justice
referral 6Marital status
Days waiting
for treat-ment
Arrests in past
30 days
Frequency of atten-dance at self-help programs
Total 48 45 51 20 82 93 92 97 64 43 100 39 24 79 58 92 78
Alabama 95 87 97 90 12 95 17 96 97 96 100 43 51 70 100 100 26Alaska - - - - - - 56 100 98 97 97 100 97 100 40 37 100 100 100 97Arizona - - - - - - 54 100 100 89 97 - - - - 100 19 - - 31 100 100 100Arkansas - - - - - - 91 93 99 98 100 94 86 100 ‡ 31 99 100 100 95California - - - - - - - - 100 99 100 100 - - - - 100 56 34 - - 100 100 - -
Colorado 100 100 100 50 86 100 100 100 91 91 100 16 41 100 100 100 100Connecticut - - - - - - - - 100 90 97 95 - - - - 100 34 - - 88 - - 96 89Delaware - - - - - - 50 83 63 67 69 66 86 100 16 13 69 2 51 - -District of Columbia 100 100 100 86 100 97 97 98 93 97 100 33 12 98 100 100 31Florida 100 100 100 95 100 100 100 98 33 - - 100 23 25 99 100 100 100
Georgia ‡ ‡ ‡ ‡ ‡ ‡ ‡ ‡ ‡ ‡ ‡ ‡ ‡ ‡ ‡ ‡ ‡Hawaii 100 100 100 47 77 98 100 99 94 87 100 60 30 100 100 100 96Idaho 100 100 100 59 100 80 78 99 100 100 100 31 69 100 100 100 24Idaho - - - - - - 23 100 100 100 100 100 100 100 40 39 100 100 100 96Indiana - - - - - - 59 100 100 1 96 - - 99 100 20 - - 100 - - 99 99
Iowa - - - - - - - - 100 100 100 100 100 100 100 28 50 99 100 100 100Kansas ‡ ‡ ‡ ‡ ‡ ‡ ‡ ‡ ‡ ‡ ‡ ‡ ‡ ‡ ‡ ‡ ‡Kentucky 100 98 97 99 100 100 100 98 99 100 100 20 30 99 - - 100 100Louisiana - - - - - - - - 100 37 94 76 86 71 100 61 23 75 73 65 71Maine 99 99 91 41 99 99 100 100 83 100 100 20 - - 100 25 100 82
Maryland 100 99 99 - - 89 91 92 89 67 100 100 40 14 94 100 89 96Massachusetts - - - - - - - - 100 100 100 99 100 99 100 53 19 99 72 100 94Michigan - - - - - - 52 100 100 100 100 - - - - 100 25 5 100 100 100 88Minnesota - - - - - - - - - - 100 98 98 95 - - 100 21 - - 98 - - 99 96Mississippi 100 100 85 55 97 97 99 99 91 70 100 47 31 100 100 98 - -
Missouri 100 100 100 39 99 96 99 96 99 99 100 37 42 99 93 99 99Montana 100 100 100 28 100 100 100 100 100 100 100 26 52 100 100 100 100Nebraska 100 100 100 74 100 100 100 95 100 100 100 39 57 98 100 100 100Nevada - - - - - - 58 8 72 98 96 91 92 100 9 34 81 92 99 96New Hampshire 100 100 100 63 98 98 93 100 99 98 100 25 23 100 100 100 94
Appendix A Table 3. Item percentage response rate, by state or jurisdiction: TEDS Supplemental Data Set, 2015
Continued. See notes at end of table.198
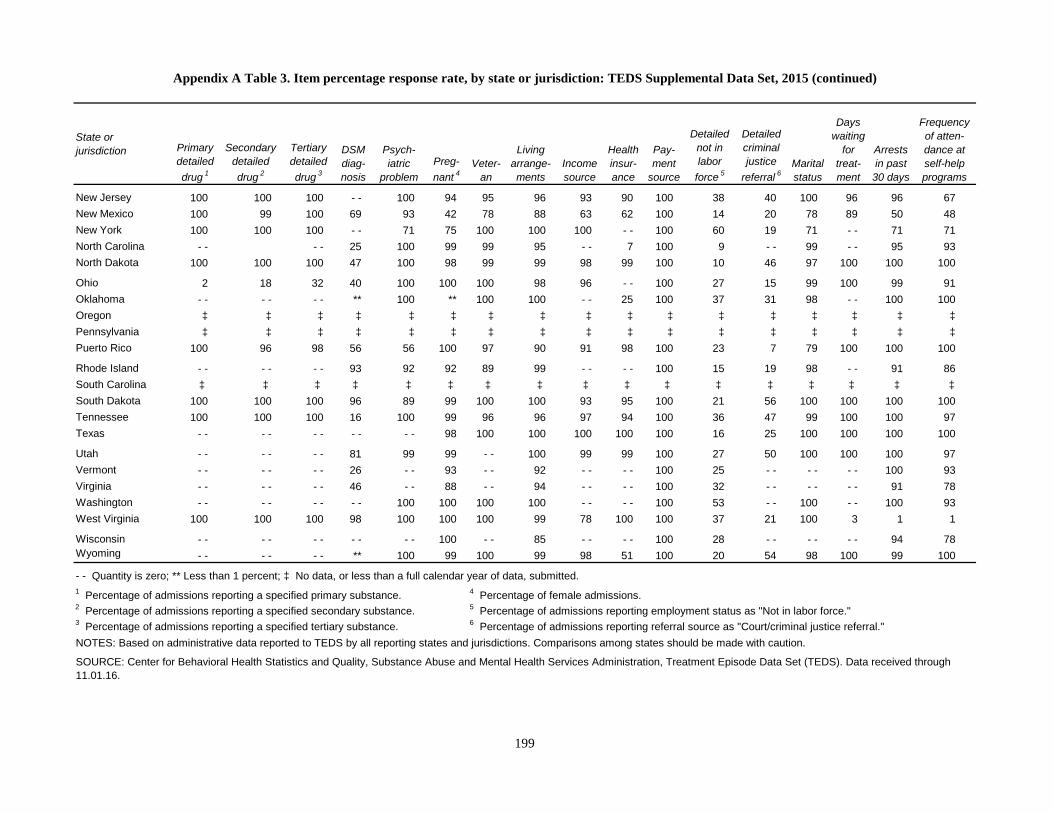
State or jurisdiction Primary
detailed drug 1
Secondary detailed drug 2
Tertiary detailed drug 3
DSM diag-nosis
Psych-iatric
problemPreg-nant 4
Veter-an
Living arrange-ments
Income source
Health insur-ance
Pay-ment
source
Detailed not inlabor
force 5
Detailed criminal justice
referral 6Marital status
Days waiting
for treat-ment
Arrests in past
30 days
Frequency of atten-dance at self-help programs
New Jersey 100 100 100 - - 100 94 95 96 93 90 100 38 40 100 96 96 67New Mexico 100 99 100 69 93 42 78 88 63 62 100 14 20 78 89 50 48New York 100 100 100 - - 71 75 100 100 100 - - 100 60 19 71 - - 71 71North Carolina - - - - 25 100 99 99 95 - - 7 100 9 - - 99 - - 95 93North Dakota 100 100 100 47 100 98 99 99 98 99 100 10 46 97 100 100 100
Ohio 2 18 32 40 100 100 100 98 96 - - 100 27 15 99 100 99 91Oklahoma - - - - - - ** 100 ** 100 100 - - 25 100 37 31 98 - - 100 100Oregon ‡ ‡ ‡ ‡ ‡ ‡ ‡ ‡ ‡ ‡ ‡ ‡ ‡ ‡ ‡ ‡ ‡Pennsylvania ‡ ‡ ‡ ‡ ‡ ‡ ‡ ‡ ‡ ‡ ‡ ‡ ‡ ‡ ‡ ‡ ‡Puerto Rico 100 96 98 56 56 100 97 90 91 98 100 23 7 79 100 100 100
Rhode Island - - - - - - 93 92 92 89 99 - - - - 100 15 19 98 - - 91 86South Carolina ‡ ‡ ‡ ‡ ‡ ‡ ‡ ‡ ‡ ‡ ‡ ‡ ‡ ‡ ‡ ‡ ‡ South Dakota 100 100 100 96 89 99 100 100 93 95 100 21 56 100 100 100 100Tennessee 100 100 100 16 100 99 96 96 97 94 100 36 47 99 100 100 97Texas - - - - - - - - - - 98 100 100 100 100 100 16 25 100 100 100 100
Utah - - - - - - 81 99 99 - - 100 99 99 100 27 50 100 100 100 97Vermont - - - - - - 26 - - 93 - - 92 - - - - 100 25 - - - - - - 100 93Virginia - - - - - - 46 - - 88 - - 94 - - - - 100 32 - - - - - - 91 78Washington - - - - - - - - 100 100 100 100 - - - - 100 53 - - 100 - - 100 93West Virginia 100 100 100 98 100 100 100 99 78 100 100 37 21 100 3 1 1
Wisconsin - - - - - - - - - - 100 - - 85 - - - - 100 28 - - - - - - 94 78Wyoming - - - - - - ** 100 99 100 99 98 51 100 20 54 98 100 99 100
NOTES: Based on administrative data reported to TEDS by all reporting states and jurisdictions. Comparisons among states should be made with caution.
4 Percentage of female admissions.5 Percentage of admissions reporting employment status as "Not in labor force."6 Percentage of admissions reporting referral source as "Court/criminal justice referral."
1 Percentage of admissions reporting a specified primary substance.2 Percentage of admissions reporting a specified secondary substance.3 Percentage of admissions reporting a specified tertiary substance.
Appendix A Table 3. Item percentage response rate, by state or jurisdiction: TEDS Supplemental Data Set, 2015 (continued)
- - Quantity is zero; ** Less than 1 percent; ‡ No data, or less than a full calendar year of data, submitted.
SOURCE: Center for Behavioral Health Statistics and Quality, Substance Abuse and Mental Health Services Administration, Treatment Episode Data Set (TEDS). Data received through 11.01.16.
199

200

201
Appendix BTEDS Data Elements
TEDS Minimum Data Set
AGE OF FIRST USE (OF PRIMARY, SECONDARY, AND TERTIARY SUBSTANCE)
For drugs other than alcohol, these fields identify the age at which the client first used the respective substance. For alcohol, these fields record the age of first intoxication.
• 0—Indicates a newborn with a substance dependency problem
• 1-95—Indicates the age at first use
CLIENT OR CODEPENDENT/COLLATERAL
Specifies whether the admission record is for a substance abuse treatment client, or a person being treated for his/her codependency or collateral relationship with a substance abuser.
• Client—Must meet all of the following criteria:
• Has an alcohol or drug related problem
• Has completed the screening and intake process
• Has been formally admitted for treatment or recovery service in an alcohol or drug treatment unit
• Has his or her own client record
A person is not a client if he or she has completed only a screening or intake process or has been placed on a waiting list.
• Codependent/collateral—Must meet all of the following criteria:
• Has no alcohol or drug related problem
• Is seeking services because of problems arising from his or her relationship with an alcohol or drug user
• Has been formally admitted for service to a treatment unit
• Has his or her own client record or has a record within a primary client record
GUIDELINES: Reporting of data for Codependent/collaterals is optional. If the state opts to report codependent/collateral clients, the mandatory fields are State code, Provider identifier, Client identifier, Client transaction type, Codependent/collateral, and Date of admission. Reporting of the

202
remaining fields in the TEDS Minimum and Supplemental Data Sets is optional. For all items not reported, the data field should be coded with the appropriate “Not collected” or “Not applicable” code.
If a substance abuse client with an existing record in TEDS becomes a codependent, a new client record should be submitted indicating that the client has been admitted as a codependent, and vice versa.
If a record does not include a value for this field, it is assumed to be a substance abuse client record.
DATE OF ADMISSION
The day when the client receives his or her first direct treatment or recovery service. For transfers, this is the date when client receives his or her first direct treatment after the transfer has occurred.
DEMOGRAPHICS
AGE
Identifies client’s age at admission. Derived from client’s date of birth and date of admission.
• 0—Indicates a newborn with a substance dependency problem
• 1-95—Indicates the age at admission
EDUCATION
Specifies the highest school grade (number of school years) completed by the client.
• 0—Less than one grade completed
• 1-25—Years of school (highest grade) completed. For General Equivalency Degree, use 12.
GUIDELINES: States that use specific categories for designating education level should map their codes to a logical number of years of school completed. For Associate’s Degree, use 14. For Bachelor’s Degree, use 16.
EMPLOYMENT STATUS
Identifies the client’s employment status at the time of admission or transfer.
• Full time—Working 35 hours or more each week, including active duty members of the uni-formed services
• Part time—Working fewer than 35 hours each week
• Unemployed—Looking for work during the past 30 days, or on layoff from a job
• Not in labor force—Not looking for work during the past 30 days, or a student, homemaker, disabled, retired, or an inmate of an institution. Clients in this category are further defined in the TEDS Supplemental Data Set item Detailed not in labor force.
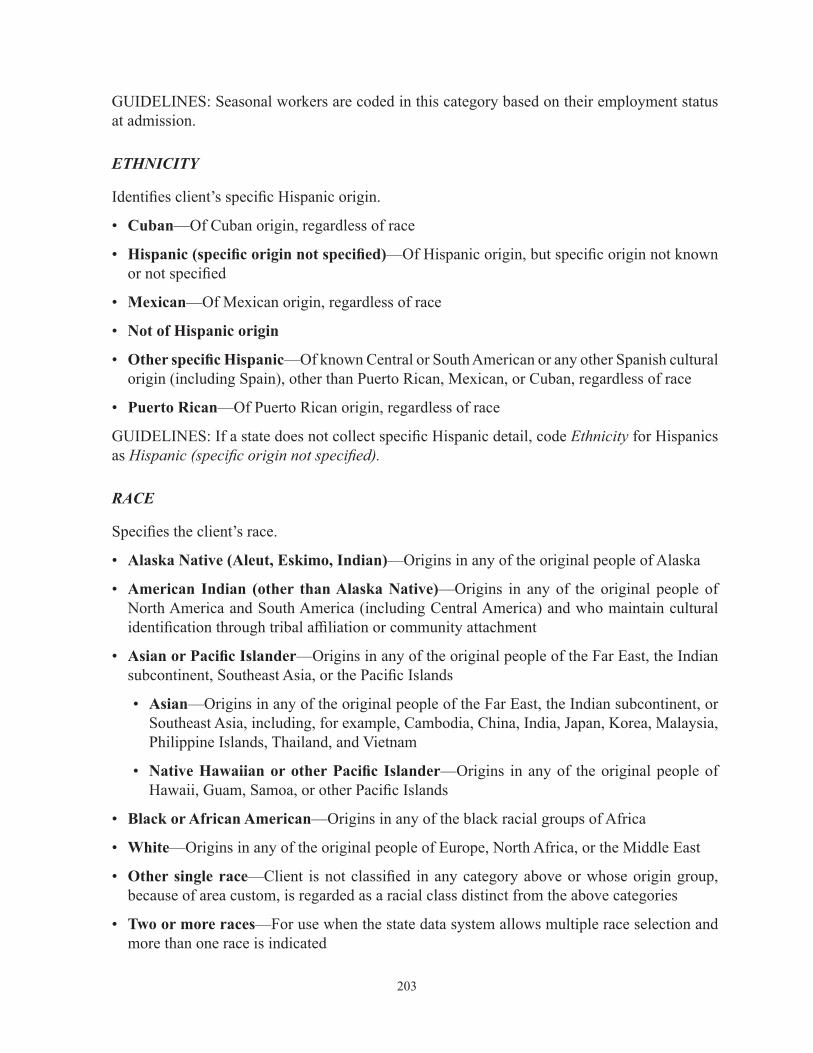
203
GUIDELINES: Seasonal workers are coded in this category based on their employment status at admission.
ETHNICITY
Identifies client’s specific Hispanic origin.
• Cuban—Of Cuban origin, regardless of race
• Hispanic (specific origin not specified)—Of Hispanic origin, but specific origin not known or not specified
• Mexican—Of Mexican origin, regardless of race
• Not of Hispanic origin
• Other specific Hispanic—Of known Central or South American or any other Spanish cultural origin (including Spain), other than Puerto Rican, Mexican, or Cuban, regardless of race
• Puerto Rican—Of Puerto Rican origin, regardless of race
GUIDELINES: If a state does not collect specific Hispanic detail, code Ethnicity for Hispanics as Hispanic (specific origin not specified).
RACE
Specifies the client’s race.
• Alaska Native (Aleut, Eskimo, Indian)—Origins in any of the original people of Alaska
• American Indian (other than Alaska Native)—Origins in any of the original people of North America and South America (including Central America) and who maintain cultural identification through tribal affiliation or community attachment
• Asian or Pacific Islander—Origins in any of the original people of the Far East, the Indian subcontinent, Southeast Asia, or the Pacific Islands
• Asian—Origins in any of the original people of the Far East, the Indian subcontinent, or Southeast Asia, including, for example, Cambodia, China, India, Japan, Korea, Malaysia, Philippine Islands, Thailand, and Vietnam
• Native Hawaiian or other Pacific Islander—Origins in any of the original people of Hawaii, Guam, Samoa, or other Pacific Islands
• Black or African American—Origins in any of the black racial groups of Africa
• White—Origins in any of the original people of Europe, North Africa, or the Middle East
• Other single race—Client is not classified in any category above or whose origin group, because of area custom, is regarded as a racial class distinct from the above categories
• Two or more races—For use when the state data system allows multiple race selection and more than one race is indicated
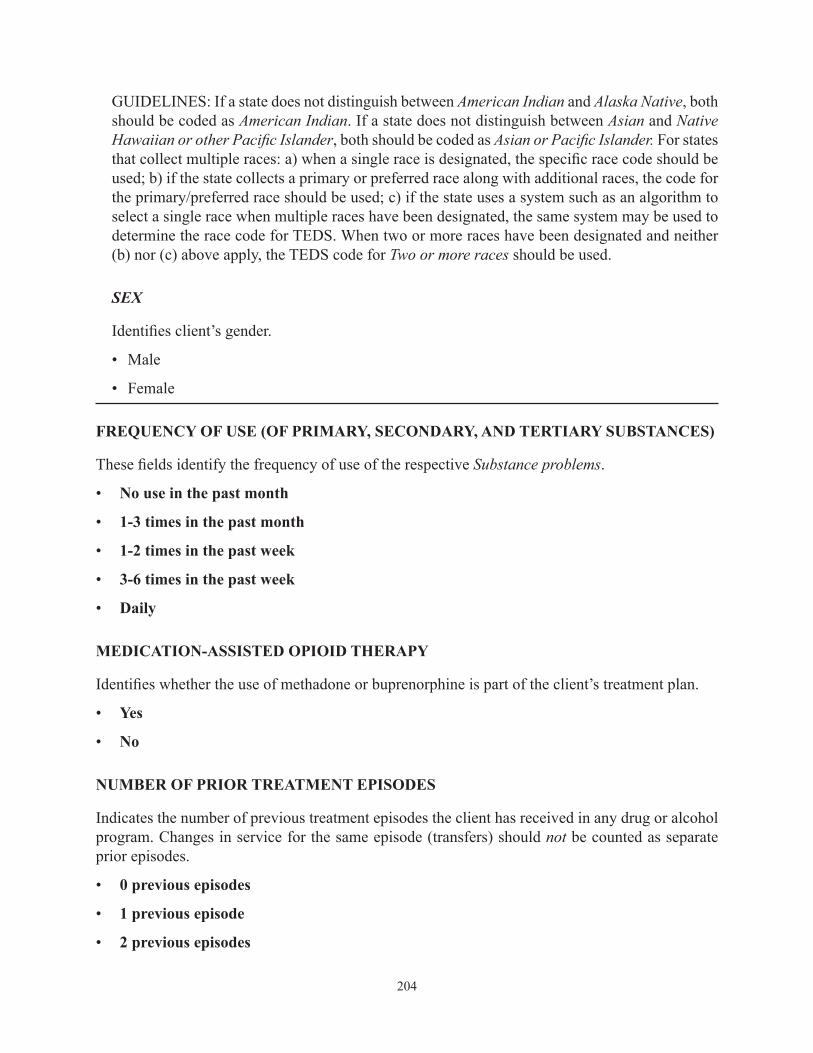
204
GUIDELINES: If a state does not distinguish between American Indian and Alaska Native, both should be coded as American Indian. If a state does not distinguish between Asian and Native Hawaiian or other Pacific Islander, both should be coded as Asian or Pacific Islander. For states that collect multiple races: a) when a single race is designated, the specific race code should be used; b) if the state collects a primary or preferred race along with additional races, the code for the primary/preferred race should be used; c) if the state uses a system such as an algorithm to select a single race when multiple races have been designated, the same system may be used to determine the race code for TEDS. When two or more races have been designated and neither (b) nor (c) above apply, the TEDS code for Two or more races should be used.
SEX
Identifies client’s gender.
• Male
• Female
FREQUENCY OF USE (OF PRIMARY, SECONDARY, AND TERTIARY SUBSTANCES)
These fields identify the frequency of use of the respective Substance problems.
• No use in the past month
• 1-3 times in the past month
• 1-2 times in the past week
• 3-6 times in the past week
• Daily
MEDICATION-ASSISTED OPIOID THERAPY
Identifies whether the use of methadone or buprenorphine is part of the client’s treatment plan.
• Yes
• No
NUMBER OF PRIOR TREATMENT EPISODES
Indicates the number of previous treatment episodes the client has received in any drug or alcohol program. Changes in service for the same episode (transfers) should not be counted as separate prior episodes.
• 0 previous episodes
• 1 previous episode
• 2 previous episodes
205
• 3 previous episodes
• 4 previous episodes
• 5 or more previous episodes
GUIDELINES: It is preferred that the number of prior treatments be a self-reporting field collected at the time of client intake. However, this data item may be derived from the state data system if the system has that capability and episodes can be counted for at least several years.
PRINCIPAL SOURCE OF REFERRAL
Describes the person or agency referring the client to the alcohol or drug abuse treatment program.
• Alcohol/drug abuse care provider—Any program, clinic, or other health care provider whose principal objective is treating clients with substance abuse problems, or a program whose activi-ties are related to alcohol or other drug abuse prevention, education, or treatment
• Court/criminal justice referral/DUI/DWI—Any police official, judge, prosecutor, probation officer, or other person affiliated with a federal, state, or county judicial system. Includes referral by a court for DWI/DUI, clients referred in lieu of or for deferred prosecution, or during pretrial release, or before or after official adjudication. Includes clients on pre-parole, pre-release, work or home furlough, or TASC. Client need not be officially designated as “on parole.” Includes clients referred through civil commitment. Client referrals on this category are further defined in the TEDS Supplemental Data Set item Detailed criminal justice referral.
• Employer/EAP—A supervisor or an employee counselor
• Individual (includes self-referral)—Includes the client, a family member, friend, or any other individual who would not be included in any of the following categories; includes self-referral due to pending DWI/DUI
• Other community referral—Community or religious organization or any federal, state, or local agency that provides aid in the areas of poverty relief, unemployment, shelter, or social welfare. Self-help groups such as Alcoholics Anonymous (AA), Al-Anon, and Narcotics Anonymous (NA) are also included in this category. Defense attorneys are included in this category.
• Other health care provider—A physician, psychiatrist, or other licensed health care profes-sional; or a general hospital, psychiatric hospital, mental health program, or nursing home
• School (educational)—A school principal, counselor, or teacher; or a student assistance program (SAP), the school system, or an educational agency
SUBSTANCE PROBLEM (PRIMARY, SECONDARY, OR TERTIARY)
These fields identify the client’s primary, secondary, and tertiary substance problems. Each Sub-stance problem (primary, secondary, and tertiary) has associated fields for Route of administration, Frequency of use, Age at first use, and the TEDS Supplemental Data Set item Detailed drug code.

206
• Alcohol
• Barbiturates—Amobarbital, pentobarbital, phenobarbital, secobarbital, etc.
• Benzodiazepines—Includes alprazolam, chlordiazepoxide, clonazepam, clorazepate, diazepam, flunitrazepam, flurazepam, halazepam, lorazepam, oxazepam, prazepam, temazepam, triazolam, and other unspecified benzodiazepines
• Cocaine/crack
• Heroin
• Inhalants—Includes chloroform, ether, gasoline, glue, nitrous oxide, paint thinner, etc.
• Marijuana/hashish—Includes THC and any other cannabis sativa preparations
• Methamphetamine
• Non-prescription methadone
• Other amphetamines—Includes amphetamines, MDMA, phenmetrazine, and other unspeci-fied amines and related drugs
• Other hallucinogens—Includes LSD, DMT, STP, hallucinogens, mescaline, peyote, psilocybin, etc.
• Other non-barbiturate sedatives or hypnotics—Includes chloral hydrate, ethchlorvynol, glutethimide, methaqualone, and other non-barbiturate sedatives or hypnotics
• Other non-benzodiazepine tranquilizers—Includes meprobamate and other non-benzodiaz-epine tranquilizers
• Other opiates and synthetics—Includes buprenorphine, codeine, hydrocodone, hydromorphone, meperidine, morphine, opium, oxycodone, pentazocine, propoxyphene, tramadol, and any other drug with morphine-like effects
• Other stimulants—Includes methylphenidate and any other stimulants
• Over-the-counter medications—Includes aspirin, cough syrup, diphenhydramine and other antihistamines, sleep aids, and any other legally obtained nonprescription medication
• PCP—Phencyclidine
• Other—Includes diphenylhydantoin/phenytoin, GHB/GBL, ketamine, etc.
• None
GUIDELINES: Substance problems are further defined in the TEDS Supplemental Data Set item Detailed drug code. For guidance on which specific substances to include in the substance catego-ries, please refer to the detailed drug categories listed for Detailed drug code.
• Substance problem and Route of administration:

207
• For states that do collect Detailed drug code—Records may have duplicate Substance problems and identical Route of administration IF the corresponding Detailed drug codes are different or are ‘‘multiple’’ drug codes
• For states that do not collect Detailed drug code—A record may not have duplicate Substance problems with identical Routes of administration
TRANSACTION TYPE
Identifies whether a record is for an initial admission or a transfer/change in service. Note: Some states may use other terminology such as “initial admission” and “transfer admission” in place of “admission” and “transfer.”
• A—Admission
• T—Transfer/change in service
GUIDELINES: For TEDS, a treatment episode is defined as that period of service between the beginning of treatment for a drug or alcohol problem and the termination of services for the pre-scribed treatment plan. The episode includes one admission (when services begin) and at least one discharge (when services end). Within a treatment episode, a client may transfer to a different service, facility, provider, program, or location. Each admission and transfer record should have an associated discharge record.
When it is feasible for the state to identify transfers, they should be reported as transfers in admis-sions data submissions. When admissions and transfers cannot be differentiated in a state data system, such changes in service or facility should be reported to TEDS as admissions.
Data set considerations for transfers:
• All fields from the transfer record should be updated to reflect values at the time of transfer except the following fields, which must have the same values as in the associated (preceding) admission record: Client ID, Codependent/collateral, Date of birth, Sex, Race, and Ethnicity. If a field cannot be updated, it should be transmitted to TEDS with its value from the associated (preceding) admission record.
• Date of admission is defined as the date services begin after the transfer to another service or facility.
TYPE OF TREATMENT SERVICE
Describes the type of service and treatment setting in which the client is placed at the time of admission or transfer.
• Ambulatory, detoxification—Outpatient treatment services providing for safe withdrawal in an ambulatory setting (pharmacological or non-pharmacological)
• Ambulatory, intensive outpatient—As a minimum, the client must receive treatment lasting two or more hours per day for three or more days per week

208
• Ambulatory, non-intensive outpatient—Ambulatory treatment services including individual, family, and/or group services, and may include pharmacological therapies
• Detoxification, 24-hour service, free-standing residential—24-hour per day services in a non-hospital setting providing for safe withdrawal and transition to ongoing treatment
• Detoxification, 24-hour service, hospital inpatient—24-hour per day medical acute care services in a hospital setting for detoxification of persons with severe medical complications associated with withdrawal
• Rehabilitation/residential, hospital (other than detoxification)—24-hour per day medical care in a hospital facility in conjunction with treatment services for alcohol and other drug abuse and dependency
• Rehabilitation/residential, short-term (30 days or fewer)—Typically , 30 days or less of non-acute care in a setting with treatment services for alcohol and other drug abuse and dependency
• Rehabilitation/residential, long-term (more than 30 days)—Typically, more than 30 days of non-acute care in a setting with treatment services for alcohol and other drug abuse and depen-dency; this may include transitional living arrangements such as halfway houses
USUAL ROUTE OF ADMINISTRATION (OF PRIMARY, SECONDARY, AND TERTIARY SUBSTANCES)
These fields identify the usual route of administration of the respective Substance problems.
• Inhalation
• Injection (IV or intramuscular)
• Oral
• Smoking
• Other

209
TEDS Supplemental Data Set
DAYS WAITING TO ENTER TREATMENT
Indicates the number of days from the first contact or request for service until the client was admit-ted and the first clinical service was provided.
• 0-996—Number of days waiting
GUIDELINES: This item is intended to capture the number of days the client must wait to begin treatment because of program capacity, treatment availability, admissions requirements, or other program requirements. It should not include time delays caused by client unavailability or client failure to meet any requirement or obligation.
DETAILED CRIMINAL JUSTICE REFERRAL
This item gives more detailed information about those clients who are coded as “Court/criminal justice referral/DUI/DWI” in the TEDS Minimum Data Set item Principal source of referral.
• Diversionary program (e.g., TASC)
• DUI/DWI
• Other court (not state or federal)
• Other recognized legal entity (e.g., local law enforcement agency, corrections agency, youth services, review board/agency)
• Prison
• Probation/parole
• State/federal court
• Other
• Not applicable
DETAILED DRUG CODE (PRIMARY, SECONDARY, AND TERTIARY)
These fields identify, in greater detail, the drug problems recorded in the TEDS Minimum Data Set item Substance problem.
• Aerosols• Alcohol

210
• Alprazolam (Xanax)• Amphetamines• Anesthetics• Chlordiazepoxide (Librium)• Clonazepam (Klonopin, Rivotril)• Clorazepate (Tranxene)• Codeine• Crack• Diazepam (Valium)• Diphenhydramine• Diphenylhydantoin/phenytoin (Dilantin)• Ethchlorvynol (Placidyl)• Flunitrazepam (Rohypnol)• Flurazepam (Dalmane)• GHB/GBL (gamma-hydroxybutyrate, gamma-butyrolactone)• Glutethimide (Doriden)• Heroin• Hydrocodone (Vicodin)• Hydromorphone (Dilaudid)• Ketamine (Special K)• Lorazepam (Ativan)• LSD• Marijuana/hashish• Meperidine (Demerol)• Meprobamate (Miltown)• Methadone (non-prescription)• Methamphetamine/speed• Methaqualone• Methylenedioxymethamphetamine (MDMA, Ecstasy)• Methylphenidate (Ritalin)• Nitrites
DETAILED NOT IN LABOR FORCE
This item gives more detailed information about those clients who are coded as “Not in labor force” in the TEDS Minimum Data Set item Employment Status.
• Disabled
• Homemaker
• Inmate of institution (prison or institution that keeps a person, otherwise able, from entering the labor force)
• Retired
• Student
211
• Other
• Not applicable
DSM CRITERIA DIAGNOSIS
The diagnosis of the substance abuse problem from the American Psychiatric Association’s Diagnostic and Statistical Manual of Mental Disorders. DSM-IV is preferred, but use of the Third Edition or ICD codes is permissible.
EXPECTED/ACTUAL PRIMARY SOURCE OF PAYMENT
Identifies the primary source of payment for this treatment episode.
• Blue Cross/Blue Shield
• Medicaid
• Medicare
• Other government payments
• Other health insurance companies
• Self-pay
• Worker’s Compensation
• No charge (free, charity, special research, or teaching)
• Other
FREQUENCY OF ATTENDANCE AT SELF-HELP PROGRAMS
This field records the number of times the client has attended a self-help program in the 30 days preceding the date of admission to treatment services.
• No attendance in the past month
• 1-3 times in the past month
• 4-7 times in the past month
• 8-15 times in the past month
• 16-30 times in the past month
• Some attendance in the past month, but frequency unknown
212
HEALTH INSURANCE
Specifies the client’s health insurance (if any). The insurance may or may not cover alcohol or drug treatment.
• Blue Cross/Blue Shield
• Health maintenance organization (HMO)
• Medicaid
• Medicare
• Private insurance (other than Blue Cross/Blue Shield or an HMO)
• Other (e.g., TRICARE)
• None
LIVING ARRANGEMENTS
Specifies whether the client is homeless, living with parents, in a supervised setting, or living on his or her own.
• Dependent living—Clients living in a supervised setting such as a residential institution, halfway house, or group home, and children (under age 18) living with parents, relatives, or guardians, or in foster care
• Homeless—Clients with no fixed address; includes shelters
• Independent living—Clients living alone or with others without supervision
MARITAL STATUS
Describes the client’s marital status. The following categories are compatible with the U.S. Census.
• Divorced
• Never married—Includes clients whose only marriage was annulled
• Now married—Includes those living together as married
• Separated—Includes those separated legally or otherwise absent from spouse because of marital discord
• Widowed
NUMBER OF ARRESTS IN 30 DAYS PRIOR TO ADMISSION
This field records the number of arrests in the 30 days preceding the date of admission to treat-ment services.

213
• 00-96—Number of arrests
PREGNANT AT TIME OF ADMISSION
Specifies whether the client was pregnant at the time of admission.
• Yes
• No
• Not applicable. Use this code for male clients
PSYCHIATRIC PROBLEM IN ADDITION TO ALCOHOL OR DRUG PROBLEM
Identifies whether the client has a psychiatric problem in addition to his or her alcohol or drug use problem.
• Yes
• No
SOURCE OF INCOME SUPPORT
Identifies the client’s principal source of financial support. For children under 18, this field indicates the parents’ primary source of income/support.
• Disability
• Public assistance
• Retirement/pension
• Wages/salary
• Other
• None
VETERAN STATUS
Identifies whether the client has served in the uniformed services (Army, Navy, Air Force, Marines, Coast Guard, Public Health Service Commissioned Corps, Coast and Geodetic Survey, etc.).
• Yes
• No

214
215
Appendix C
List of Contributors
This report was prepared for the Center for Behavioral Health Statistics and Quality (CBHSQ), Substance Abuse and Mental Health Services Administration, U.S. Department of Health and Human Services (HHS) under Contract No. HHSS283200700048I/HHSS28342001T.
Production of the report at SAMHSA was managed by Cathie Alderks. SAMHSA contributors and reviewers, listed alphabetically, include: Cathie Alderks, Herman Alvarado, Elizabeth Hoeffel, Heydy Juarez, Sharon Liu, and Nichele Waller.