2015 senior health rankings
144
A CALL TO ACTION FOR INDIVIDUALS AND THEIR COMMUNITIES 2015 EDITION
description
United Health Foundation senior report
Transcript of 2015 senior health rankings
A CALL TO ACTION FOR INDIVIDUALS
AND THEIR COMMUNITIES
2015 EDITION

America’s Health Rankings® and America’s Health Rankings® Senior Report were built upon the WHO
defi nition of health: “Health is a state of complete
physical, mental, and social well-being and not merely
the absence of disease or infi rmity.”
Our model refl ects that determinants of health
directly infl uence health outcomes, with determinants
accounting for three-quarters and outcomes
accounting for one-quarter of each state’s overall
score and ranking. Four categories of determinants are
included in our model of health: Behaviors, Community
& Environment, Policy, and Clinical Care.

in support of healthier
seniors

2 w w w . a m e r i c a s h e a l t h r a n k i n g s . o r g
America’s Health Rankings® Senior Report: A Call to Action for Individuals and Their Communities.
Why study senior health? Today, 1 in 7 Americans are aged 65 and older, and in the next 2 decades the rest of the 77 million baby boomers will move into this demographic. Knowing this, we believe that taking an in-depth look at the health of seniors and the specific challenges they face as a population is key to understanding and addressing our health as a nation.
The third edition of the annual America’s Health Rankings® Senior Report shows encouraging news for senior health nationally, but some notable setbacks are offsetting that progress. We see continued improvements in preventable hospitalizations and in the use of end-of-life care. Also, there are increases in the number of seniors getting their flu vaccine and reporting better health overall.
While we should celebrate these gains, we must remember that states face serious challenges with a growing aging population. America’s senior population is poised to double by 2050, making it crucial that we focus on healthy behaviors and work together to create adequate community support. Unfortunately, physical inactivity moved in the wrong direction in 2015. After showing promising improvements in the 2014 edition, this year’s report indicates that 33.1% of seniors did not get enough physical activity—a 15% increase from the previous year.
To address such challenges, this year’s report features a commentary from Jewel Mullen, MD,
MPH, MPA, President of the Association of State and Territorial Health Officials (ASTHO) and Commissioner of the Connecticut Department of Public Health. The commentary calls upon her counterparts in the 50 states, the District of Columbia, and 8 US territories to join a national movement promoting the health of older adults and their communities. Healthy Aging: Living Longer Better is her President’s Challenge for 2014-15.
United Health Foundation is actively engaged in putting a spotlight on the health of America as well as the evidence-based ideas and means required to improve it. We have designed this report and its related tools to identify 1) health opportunities in communities and 2) multi-stakeholder, multi-discipline approaches to improving the health of our populations. To learn more about what we are doing and to gather information on how you can help improve community health, please visit our website: americashealthrankings.org. Also, follow us on social media at www.facebook.com/AmericasHealthRankings and @AHR_Rankings on Twitter.
We invite you to share proven or innovative programs that have made a difference in your community by emailing [email protected], posting on our Facebook page, or tweeting us. A healthy exchange of ideas allows us to share and learn from one another. It also allows us
United Health Foundation is pleased to present

A M E R I C A’ S H E A LT H R A N K I N G S ® S E N I O R R E P O R T 3
to work together to address our nation’s—and our seniors’—health challenges and to improve the lives of all.
We appreciate the efforts of our expert panel, listed in the report, in designing this model. These practitioners and public health experts annually review available models and metrics to select a set that reflects the holistic health of seniors, including behaviors, community, environment, clinical care, policy, and outcomes.
Finally, we once again offer our gratitude and respect to the dedicated public health, clinical, and health policy professionals who serve our nation. And a special thank you goes out to the people—be they family, friends, community organizations, or medical professionals—who provide care to seniors. They work tirelessly every day and deserve our appreciation.
America’s senior population is poised to double by 2050, making it crucial that we focus on healthy behaviors and work together to create adequate community support.

4 w w w . a m e r i c a s h e a l t h r a n k i n g s . o r g
As president of the Association of State and Territorial Health Officials (ASTHO), I have called upon my counterparts in the 50 states, the District of Columbia, and 8 US territories to join a national movement to promote the health of older adults and their communities. Healthy Aging: Living Longer Better is my President’s Challenge for 2014-15. The projected doubling of the number of adults aged 65 and older by 2050 requires that public health leaders focus on the needs of this demographic group as they plan and implement population health improvement initiatives in their jurisdictions.1 States’ policy- and systems-level actions to improve the health of individuals, communities, and populations should be grounded in a life course approach that truly extends to the oldest members of society. Such an approach should address psychosocial and clinical determinants of health and of healthy aging.
The America’s Health Rankings® Senior Report encompasses several clinical, social, and behavioral measures of health determinants and outcomes, and it can be used to guide priority setting for health-improvement planning. While America’s Health Rankings® annual report enables state health officials to compare their state with others and the nation, the senior report highlights factors of particular importance to the health and well-being of their older adult residents. Viewed alongside the annual report, the senior report provides a fuller picture of state health across the lifespan. As companion documents, they also illustrate that a state’s general and senior health rankings may differ. The data in these reports can prompt individuals and communities to confront many unmet needs of older adults. They also denote the significance of the 2014-15 ASTHO President’s Challenge.
Living Longer Better and the National Prevention StrategyBecause community and environmental conditions constitute many determinants of healthy aging, improving them often is best achieved through alliances between public health and other disciplines. Healthy Aging: Living Longer Better advances the vision of state health official partnership in multi-sectoral collaborations that
Living Longer Better: A Call to Action for State Health Officials to Promote Healthy Aging
Jewel Mullen, MD, MPH, MPA President, Association of State and Territorial Health Officials
Commissioner, Connecticut Department of Public Health
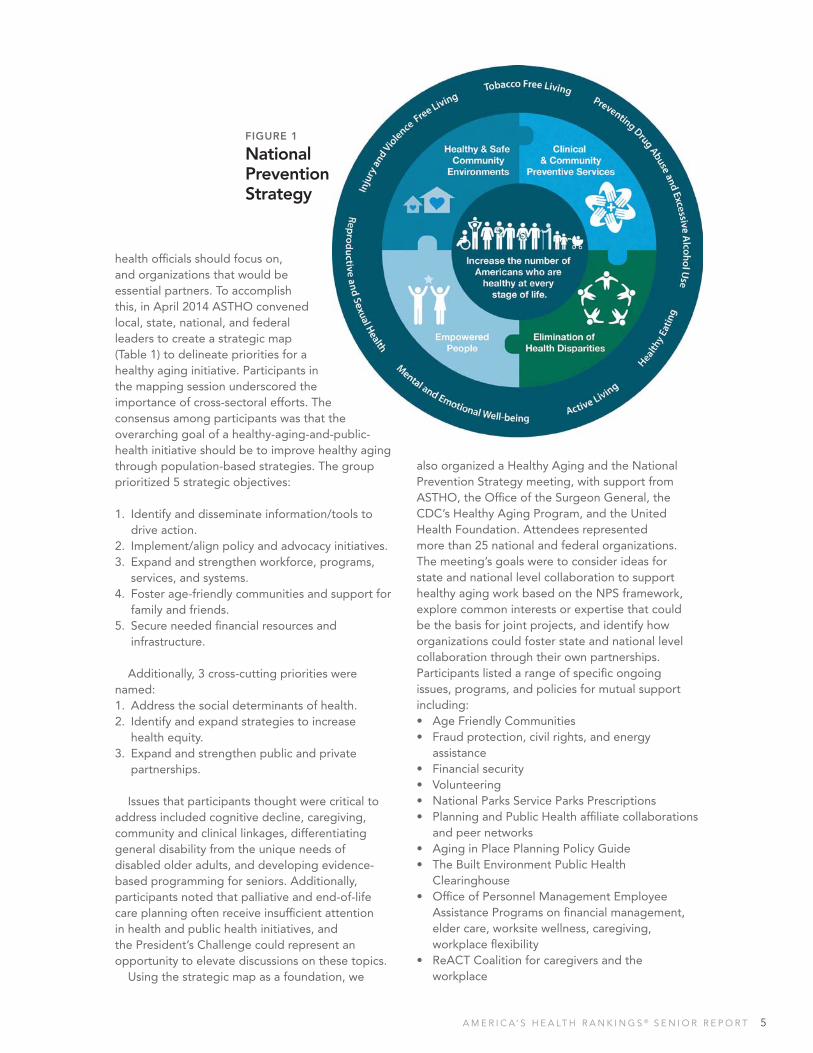
ensure older adults achieve the highest level of social, physical, and mental well-being in their communities. An established model for such collaboration, the National Prevention Strategy (NPS) (Figure 1) guides states’ participation in the President’s Challenge.2 Over the past several months, state health officials, in collaboration with public or private sector partners, have answered the challenge by pledging to undertake 1 of NPS’s 4 strategic directions or 7 priorities. In addition to advancing the health of all age groups and consistent with the strategy’s goal to increase the number of Americans who are healthy at every stage of life, this approach encourages teams to adopt policy and system-level actions. It also fosters partnerships across a range of disciplines. For many health officials, the most apparent partner may be the leader of the state’s aging or human services agency, with whom the authority for services and programs for seniors usually resides.
In order to tackle a strategy or priority of interest, officials may choose to collaborate with partners who administer programs such as housing, transportation, elder justice, or caregiving.
Strengthening Federal and Local Partnerships for the President’s ChallengeIn preparation for Healthy Aging: Living Longer Better, it was essential to gather input from federal and local leaders on the health and social conditions we should address, policies and systems
1 Ortman, JM, Velkiff VA, Hogan H. An aging nation: The older population in the United States. Current Population Reports. US Census Bureau. May 2014.
2 National Prevention Council, National Prevention Strategy, Washington, DC: U.S. Department of Health and Human Services, Office of the Surgeon General, 2011. Available at: http://www.surgeongeneral.gov/initiatives/prevention/strategy/report.pdf.
A M E R I C A’ S H E A LT H R A N K I N G S ® S E N I O R R E P O R T 5
health officials should focus on, and organizations that would be essential partners. To accomplish this, in April 2014 ASTHO convened local, state, national, and federal leaders to create a strategic map (Table 1) to delineate priorities for a healthy aging initiative. Participants in the mapping session underscored the importance of cross-sectoral efforts. The consensus among participants was that the overarching goal of a healthy-aging-and-public-health initiative should be to improve healthy aging through population-based strategies. The group prioritized 5 strategic objectives:
1. Identify and disseminate information/tools to drive action.
2. Implement/align policy and advocacy initiatives.3. Expand and strengthen workforce, programs,
services, and systems.4. Foster age-friendly communities and support for
family and friends.5. Secure needed financial resources and
infrastructure.
Additionally, 3 cross-cutting priorities were named:1. Address the social determinants of health.2. Identify and expand strategies to increase
health equity.3. Expand and strengthen public and private
partnerships.
Issues that participants thought were critical to address included cognitive decline, caregiving, community and clinical linkages, differentiating general disability from the unique needs of disabled older adults, and developing evidence-based programming for seniors. Additionally, participants noted that palliative and end-of-life care planning often receive insufficient attention in health and public health initiatives, and the President’s Challenge could represent an opportunity to elevate discussions on these topics.
Using the strategic map as a foundation, we
also organized a Healthy Aging and the National Prevention Strategy meeting, with support from ASTHO, the Office of the Surgeon General, the CDC’s Healthy Aging Program, and the United Health Foundation. Attendees represented more than 25 national and federal organizations. The meeting’s goals were to consider ideas for state and national level collaboration to support healthy aging work based on the NPS framework, explore common interests or expertise that could be the basis for joint projects, and identify how organizations could foster state and national level collaboration through their own partnerships. Participants listed a range of specific ongoing issues, programs, and policies for mutual support including:• Age Friendly Communities• Fraud protection, civil rights, and energy
assistance• Financial security • Volunteering• National Parks Service Parks Prescriptions• Planning and Public Health affiliate collaborations
and peer networks• Aging in Place Planning Policy Guide• The Built Environment Public Health
Clearinghouse• Office of Personnel Management Employee
Assistance Programs on financial management, elder care, worksite wellness, caregiving, workplace flexibility
• ReACT Coalition for caregivers and the workplace
FIGURE 1
National Prevention Strategy

6 w w w . a m e r i c a s h e a l t h r a n k i n g s . o r g
TABLE 1
Healthy Aging and Public Health Strategic Map: 2014 to 2016
Identify/Use Existing State and Local Data Sources with National
Benchmarks
Identify Top Population Health Priorities Using Agreed-Upon Criteria
Identify and Prioritize Interventions and Tools with the Highest Impact
Determine and Catalogue Relevant
Community Resources
Implement Strategies for Dissemination in Collaboration with
Partners
Evaluate Outcomes and Monitor
Progress
Create Social Marketing to Promote the Value of Older Adults and Mobilize Support for
Health Aging
Encourage Political Leaders to Set and
Promote Healthy Aging as a Priority
Align and Leverage Federal, State, and
Local Plans and Funding that Relate
to Aging
Create an AdvocacyStrategy that Supports
Caregivers
Advocate for Policies that Support Older Adults and Health
Aging
Implement Focused Efforts to Address
Communities in Need
Increase Community Engagement and Family Support
Convene Stakeholders to Address Specific Community Needs
and Partner to Address Them
Create Incentives and Rewards to Drive Successful
Collaborative Efforts
Align Efforts with Community Planning
and Development
Create the Business/Social Case and Build Support for Funding
and Infrastructure
Convene Public and Private Partners to Develop Revenue
Streams
Implement Innovative Funding/Resource
Strategies
Evaluate and Report Social and Financial
Return on Investment
Identify and Disseminate Information/
Tools to Drive Action
Implement/Align Policy
and Advocacy Initiatives
Expand and Strengthen Workforce,
Programs, Services and Systems
Address the Social Determinants of Health
Identify and Implement Strategies to Increase Health Equity
Expand and Strengthen Public and Private Partnerships
Improve Healthy Aging Using Population-Based Strategies
Foster Age-Friendly
Communities and Support for Family
and Friends
Secure the Needed Financial
Resources and Infrastructure
Develop, Implement, and Sustain Evidence-
Based Programming for Older Adults
Develop/Enhance Systems and Policies to Increase Utilization of
Community and Clinical Preventive Services
Promote Systems of Care Coordination and
Community/Clinical Linkages
Increase the Number, Competence, and Integration of the
Workforce Supporting Healthy Aging
Promote Policies and Programs Specific to Older Adults in the
Workplace
Promote Policies and Systems to Support
Volunteerism
A M E R I C A’ S H E A LT H R A N K I N G S ® S E N I O R R E P O R T 7
• National Institute on Aging Go4Life exercise and physical activity campaign
• CDC Injury Center programs on suicide, abuse, falls, mobility, driving, and prescription drug overdose
Participants noted the excellent potential to build momentum on these issues since 2015 is the year for the White House Conference on Aging, the HHS Healthy Aging Summit, and, hopefully, reauthorization of the Older Americans Act. Echoing the perspective of Strategic Mapping partners, the group cited the imperative to establish and implement effective strategies for palliative and end-of-life care planning on the national level.
ASTHO Members’ Implementation of Living Longer Better Since the President’s Challenge launch in September 2014, a growing number of state health officials have pledged support by working with partners to implement new initiatives and strengthen existing ones. The diversity of their efforts reflects the breadth of public health and exemplifies the approach envisioned by the NPS. Oregon’s public health agency, for example, is creating an Index for Healthy Aging to strengthen data, monitoring, and surveillance activities. Oregon’s state collaborators include the departments of human services and transportation as well as the Alzheimer’s Association. Georgia has developed an Alzheimer’s and Related Dementias Registry and is promoting a “Roadmap for Cognitive Screening for Primary Care Doctors,” which is a toolkit to assist physicians in identifying and diagnosing Alzheimer’s disease and related dementias. These efforts have increased Georgia’s surveillance capacity for Alzheimer’s disease and other dementias. Vermont will support a town-planning initiative through local conversations on the needs of older adults, with the goal of advancing healthy and safe community environments; leaders there are cultivating new partnerships between the state’s public health and aging agencies. The Connecticut Department of Public Health has incorporated goals for falls prevention and improving transportation access in its State Health Improvement Plan. In Michigan, the health department and partners such as the Area Agency on Aging and the Michigan Patient
Centered Transformation Project will address community and clinical preventive services, falls prevention, diabetes management, and injury- and violence-free living.
Living Longer Better as a Platform for Future WorkOngoing efforts to ensure that seniors can live and age well in their communities must take into account the diversity of the older adult population. Promoting healthy aging obligates us to focus on increasing healthy years of life, not just on extending life expectancy. As partners combine forces for advocacy and action, they should consider stratifying the older adult population first so that their strategies are informed by the data and surveillance results on the segment of the older adult population they are designed for. As America’s Health Rankings® Senior Report illustrates, the health effects of social determinants persist in later life; maintaining a focus on them will be essential to achieving health equity.
Policy and systems-level strategies that promote equity include age-friendly buildings, neighborhood and transportation design that supports older adults living in rural, urban, and tribal communities; and caregiver initiatives for older adults who are formal or informal caregivers—not just for those who need care. Effective workforce management that leverages the knowledge and assets brought to bear by an experienced senior workforce that includes salaried employees and volunteers will be essential for facilitating financial security for seniors, for fostering their social connectedness, and for affirming their sense of purpose. Such policies and actions signal a collective value for older adults.
Partnerships to promote healthy aging and the ASTHO President’s Challenge can be a reminder that society does not depreciate the value of adults as they age. Moreover, a call to action that includes them in efforts to increase their healthy years of life reinforces a collaborative commitment to them. It also may increase their trust in the systems being established to advance their well-being. Increasing that trust may broaden the acceptance of advance care planning as an essential strategy that promotes healthy aging. Empowering and supporting seniors in that planning increases their opportunity to live longer better.

8 w w w . a m e r i c a s h e a l t h r a n k i n g s . o r g
Health is a state of complete physical, mental, and social well-being

ContentsAcknowledgement 2
Commentary 4
Living Longer Better: A Call to Action for State Health Officials to Promote Healthy Aging Jewel Mullen, MD, MPH, MPA President, Association of State and Territorial Health Officials and Commissioner, Connecticut Department of Public Health
Introduction 11
Findings 12
An Aging Nation 19
Core Measures 21
Behaviors 22
Community & Environment 36
Policy 42
Clinical Care 46
Outcomes 59
Supplemental Measures 72
State Summaries 76
Appendix 129
Summary of Core Measures 130
Summary of Supplemental Measures 133
Methodology 134
2015 Model Development 135
2015 Senior Health Advisory Group 136
The Team 137


A M E R I C A’ S H E A LT H R A N K I N G S ® S E N I O R R E P O R T 1 1
Now in its third year, America’s Health Rankings® Senior Report serves to:
1. Help states prepare for the rapid growth of their senior population. Today, 1 in 7 Americans are aged 65 and older, and in 35 years this age group is projected to double to 83.7 million. This surge and the increasing rates of obesity, diabetes, and other chronic diseases are poised to overwhelm our health care system; those who are 65 and older spend nearly twice as much yearly on health care as those aged 45 to 64.
2. Provide a benchmark for gauging how a state’s senior health changes and compares with that of other states and the nation. The data are also used when forming a wide-angle, holistic view of the health of older adults.
3. Stimulate discussion and action. This is the overarching purpose of the 2015 report—to kindle and continue to fuel dialogue among individuals, community leaders, policymakers, public health officials, and the media on steps required to improve the health of older adults.
As you read America’s Health Rankings® Senior Report, we invite you to look for strengths and challenges; every state has them regardless of where it ranks. Also, appreciate the interplay of the metrics. Each measure does not stand alone but
is a strand in the web of health and everyday life of seniors. Example: A change for the good in physical inactivity could affect obesity, pain management, falls, the number of people categorized as able-bodied, etc.
We also invite you to go beyond where your state is in the rankings. America’s Health Rankings® Senior Report is a “still” in an ever-rolling video of state health for older adults, so use the report to investigate why your state fell or rose in the rankings. Most important, look for actions to take—everything from learning more to taking direct advocacy steps to implement programs that positively affect the health of not only seniors but all in your state.
Please refer to our website and select your state of interest http://www.americashealthrankings.org/states. While on the state page, click on the Measures tab to display the Core Measure Impact diagram. This illustrates the specific measures that have the greatest impact on a state’s overall current ranking with circles of varying size and color (green is positive impact and red is negative impact). It is possible to see which measures are having the greatest impact on your overall rank with a quick glimpse. Also work the Change My Rank tool from the state page by selecting the Change My Rank tab. This visual shows how improving the rank of one or many individual metrics can affect the state’s overall rank.
Introduction
Look for actions to take—everything from
learning more to taking direct advocacy steps.

1 2 w w w . a m e r i c a s h e a l t h r a n k i n g s . o r g
FindingsWe call your attention to these highlights in the third edition of America’s Health Rankings® Senior Report:
• Vermont tops the list of healthiest states for older adults (Tables 2 and 3). The state has a 10% decrease in chronic drinking since the last edition, which moves it up 8 places in the ranking of that measure. Hospice care increases 13%, and Vermont rises 9 places in the ranking of poor mental health days; it is also strong in the community support measure. See Vermont’s State Summary on p 121.
• Other top-5 states: (2) New Hampshire, (3) Minnesota, (4) Hawaii, and (5) Utah. Utah is new to the top 5, replacing Massachusetts (6). In 2014, Massachusetts replaced Iowa, which was No. 5 in the original 2013 report. Minnesota, Vermont, and New Hampshire have consistently been in the top 5, while Hawaii has been in this group every year except 2013.
• Louisiana is No. 50. The state’s strengths have been a high prevalence of flu vaccination and ready availability of home health care providers. But the high prevalence of smoking, obesity, and physical inactivity have been yearly challenges, and 2015 challenges include a low percentage of seniors who visited a dentist in the past year and a high prevalence of food insecurity. See Louisiana’s State Summary on p 94.
• Other bottom-5 states: (49) Mississippi, (48) Kentucky, (47) Arkansas, and (46) Oklahoma. West Virginia was in the bottom 5 in 2013 but has been out of this group since. All other states in the 2015 group have been in the bottom 5 all 3 years except Kentucky, which was No. 48 in 2014 but not in this group in 2013.
• National successes since last year are heartening, while national challenges are concerning (p 16). Two examples: Hip fractures are down 15% since the last edition from 7.3 to 6.2 hospitalizations per 100 000 Medicare beneficiaries. However, physical inactivity is up 15%; this year, 33.1% of seniors were inactive, up from 28.7% last year.
Selection Process for the 35 MeasuresThe selection of the 35 measures that make up America’s Health Rankings® Senior Report is driven by these 5 factors:1. The overall rankings represent a broad
range of issues that affect senior health.2. Individual measures use common health-
measurement criteria.3. Data must be available at a state level.4. Data must be current and updated
periodically.5. The aspect being measured should be
amenable to change.While imperfect, these 35 measures are the best available indicators of the various aspects of senior health.
Physical inactivity is up 15%; this year, 33.1% of
seniors were inactive, up from 28.7% last year.
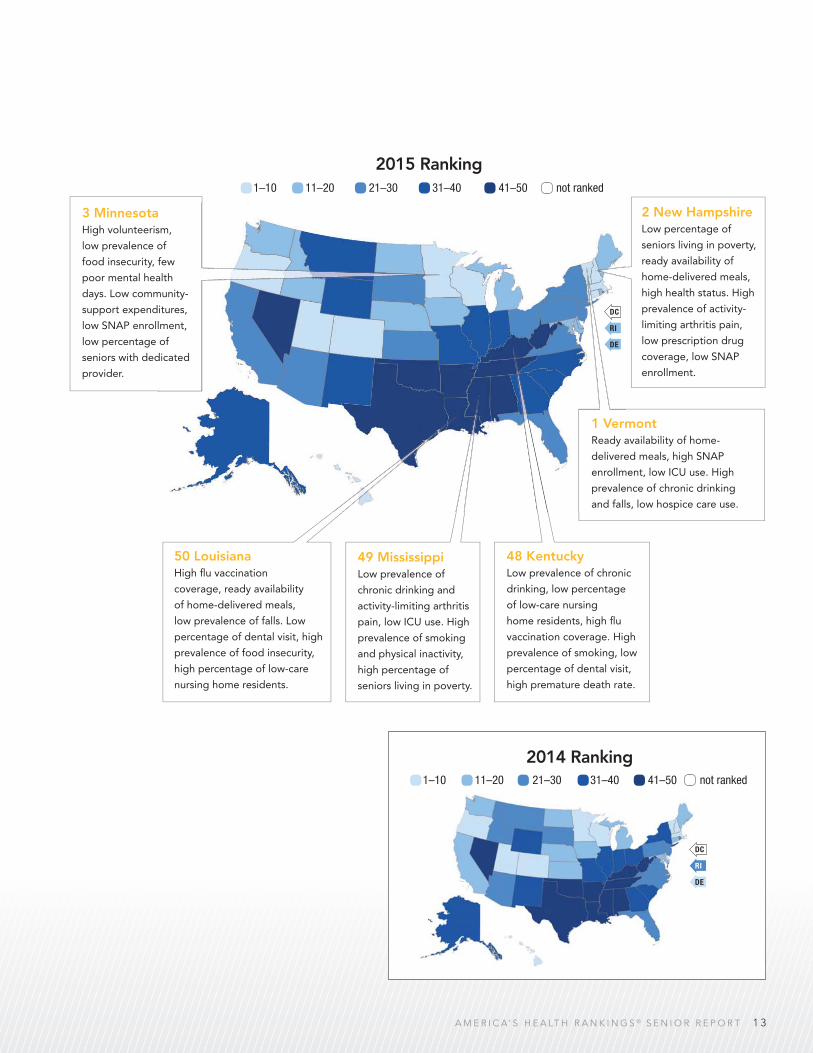
A M E R I C A’ S H E A LT H R A N K I N G S ® S E N I O R R E P O R T 1 3
2015 Ranking1–10 11–20 21–30 31–40 41–50 not ranked
DC
RI
DE
1 Vermont Ready availability of home-
delivered meals, high SNAP
enrollment, low ICU use. High
prevalence of chronic drinking
and falls, low hospice care use.
3 Minnesota
High volunteerism,
low prevalence of
food insecurity, few
poor mental health
days. Low community-
support expenditures,
low SNAP enrollment,
low percentage of
seniors with dedicated
provider.
2 New Hampshire Low percentage of
seniors living in poverty,
ready availability of
home-delivered meals,
high health status. High
prevalence of activity-
limiting arthritis pain,
low prescription drug
coverage, low SNAP
enrollment.
50 LouisianaHigh fl u vaccination
coverage, ready availability
of home-delivered meals,
low prevalence of falls. Low
percentage of dental visit, high
prevalence of food insecurity,
high percentage of low-care
nursing home residents.
49 MississippiLow prevalence of
chronic drinking and
activity-limiting arthritis
pain, low ICU use. High
prevalence of smoking
and physical inactivity,
high percentage of
seniors living in poverty.
48 KentuckyLow prevalence of chronic
drinking, low percentage
of low-care nursing
home residents, high fl u
vaccination coverage. High
prevalence of smoking, low
percentage of dental visit,
high premature death rate.
1–10 11–20 21–30 31–40 41–50 not ranked
2014 Ranking
DC
RI
DE

1 4 w w w . a m e r i c a s h e a l t h r a n k i n g s . o r g
Findings20
15 R
AN
KIN
G
2015 Rank (1–50) State Score
TABLE 2
2015 Ranking
1 Vermont 0.664
2 New Hampshire 0.633
3 Minnesota 0.616
4 Hawaii 0.587
5 Utah 0.518
6 Massachusetts 0.517
7 Wisconsin 0.452
8 Colorado 0.436
9 Oregon 0.409
10 Connecticut 0.368
11 Maine 0.343
11 Washington 0.343
13 Maryland 0.293
14 Rhode Island 0.274
15 Iowa 0.250
16 Nebraska 0.210
17 Michigan 0.201
18 Delaware 0.198
19 North Dakota 0.187
20 Idaho 0.168
21 New York 0.166
22 Arizona 0.162
23 South Dakota 0.132
24 Kansas 0.101
25 Pennsylvania 0.076
26 New Jersey 0.073
27 Florida 0.025
28 Virginia -0.002
29 California -0.014
30 Ohio -0.016
31 Alaska -0.032
32 North Carolina -0.063
33 New Mexico -0.066
34 Montana -0.102
35 Wyoming -0.150
36 South Carolina -0.167
37 Illinois -0.173
38 Missouri -0.214
39 Georgia -0.236
40 Indiana -0.243
41 Texas -0.365
42 Alabama -0.449
43 Nevada -0.450
44 Tennessee -0.495
45 West Virginia -0.543
46 Oklahoma -0.630
47 Arkansas -0.662
48 Kentucky -0.767
49 Mississippi -0.817
50 Louisiana -0.864
2015 Rank (1–50) State Score
TABLE 3
2015 Alphabetical Ranking
42 Alabama -0.449
31 Alaska -0.032
22 Arizona 0.162
47 Arkansas -0.662
29 California -0.014
8 Colorado 0.436
10 Connecticut 0.368
18 Delaware 0.198
27 Florida 0.025
39 Georgia -0.236
4 Hawaii 0.587
20 Idaho 0.168
37 Illinois -0.173
40 Indiana -0.243
15 Iowa 0.250
24 Kansas 0.101
48 Kentucky -0.767
50 Louisiana -0.864
11 Maine 0.343
13 Maryland 0.293
6 Massachusetts 0.517
17 Michigan 0.201
3 Minnesota 0.616
49 Mississippi -0.817
38 Missouri -0.214
34 Montana -0.102
16 Nebraska 0.210
43 Nevada -0.450
2 New Hampshire 0.633
26 New Jersey 0.073
33 New Mexico -0.066
21 New York 0.166
32 North Carolina -0.063
19 North Dakota 0.187
30 Ohio -0.016
46 Oklahoma -0.630
9 Oregon 0.409
25 Pennsylvania 0.076
14 Rhode Island 0.274
36 South Carolina -0.167
23 South Dakota 0.132
44 Tennessee -0.495
41 Texas -0.365
5 Utah 0.518
1 Vermont 0.664
28 Virginia -0.002
11 Washington 0.343
45 West Virginia -0.543
7 Wisconsin 0.452
35 Wyoming -0.150
How to Use the Rankings®
America’s Health Rankings® Senior Report is about digging deeper, digesting data, and then doing something that will improve your state’s health. Of course, the rankings are important, but they are only a starting point. Here are general guidelines about using the rankings if your state: • Shows no change. Check
the metrics because it may be that there has been a notable change in one or more measures that has been offset by equally notable changes in the opposite direction by other measures. Or it may be that there have been changes in your state but, relative to changes in other states, there’s been no change in the overall ranking.
• Shows little change. Check the metrics. A big shift in a metric or 2 may be masked by an abundance of smaller shifts with other measures.
• Shows big change. Again, investigate further to see what’s driving the change.
Once you have completed the investigation, again, use that information to take action.

A M E R I C A’ S H E A LT H R A N K I N G S ® S E N I O R R E P O R T 1 5
Change in Rank Since 2014 EditionUp 4 or more Up 2 to 3 Up 1, no change, or down 1 Down 2 or 3 Down 4 or more Not ranked
DC
RI
DE
29 California
Down from 18th.
Physical inactivity
increased 28% and
poor mental health
days increased 16%.
The state ranks 50th in
SNAP Reach at 22.6%
of seniors aged 60+
living in poverty.
21 New York Up from 32nd. Smoking
decreased 20%, fl u
vaccination increased
13%, and home health
care workers increased
14%. New York ranks
2nd in SNAP reach at
119.9% of seniors aged
60+ living in poverty.
14 Rhode Island Up from 26th. Rhode Island ranks
4th in SNAP reach at 112.3%
of seniors aged 60+ living in
poverty. Smoking decreased 21%,
underweight seniors decreased
29%, and ICU use decreased 21%.
24 Kansas
Down from 17th.
Physical inactivity
increased 14%,
pain management
decreased 17%,
and food insecurity
increased 17%.
28 Virginia
Down from 21st.
Physical inactivity
increased 21%,
pain management
decreased 19%,
and food insecurity
increased 43%.
18 Delaware
Down from ninth. Pain
management decreased 34%,
obesity increased 17%, and
physical inactivity increased 14%.
Senior Health Advisory Group From its beginning, America’s Health Rankings® Senior Report has had as its foundation and touchstone the Senior Health Advisory Group, a panel of experts in senior health. With the launch of the fi rst report, the 9-member panel was charged with 1) identifying
the areas of health and well-being most pertinent to older adults, and 2) creating a model for assessing population health at a state level. Before each edition, the panel re-convenes to review the model and the measures. For more see page 136.
A M E R I C A’ S H E A LT H R A N K I N G S ® S E N I O R R E P O R T 1 5

TABLE 4
National Successes
5%from 60.1% to 62.8% of
adults aged 65+
Flu Vaccination
5%from 39.9% to 41.8% of
adults aged 65+, up 9%
since 2013 edition
Excellent or Very Good Health Status
7%from 47.5% to 50.6% of
decedents aged 65+ who
received hospice in the last
6 months of life
Hospice Care
4%from 22.2% to 23.1% of
adults aged 65+ with a
college degree
Education
Findings
u Vaccinati
Hospice Care
cellent oVery GoodHealth Status
ducation
9%from 95.4 to 104.3 workers per
1000 adults aged 75+, up 11%
since 2013 edition
Home Health Care Workers
meHealth CareWorkers
1 6 w w w . a m e r i c a s h e a l t h r a n k i n g s . o r g

A M E R I C A’ S H E A LT H R A N K I N G S ® S E N I O R R E P O R T 1 7
TABLE 4 (continued)
National Successes
15%since 2013 edition from 7.3 to
6.2 hospitalizations per 100 000
Medicare benefi ciaries
6% from 1909 to 1803 deaths per
100 000 adults aged 65 to 74
Premature Death
Hip Fractures
9%from 64.9 to 59.3 discharges per
1000 Medicare benefi ciaries,
down 11% since 2013 edition
Preventable Hospitalizations
9%from 25.0 to 22.8 deaths per
100 000 Medicare benefi ciaries,
down 24% since 2013 edition
Hospital Deaths
Premature eath
Hospitalaths
Preventableospitalizati
Hip Fracture
1 8 w w w . a m e r i c a s h e a l t h r a n k i n g s . o r g
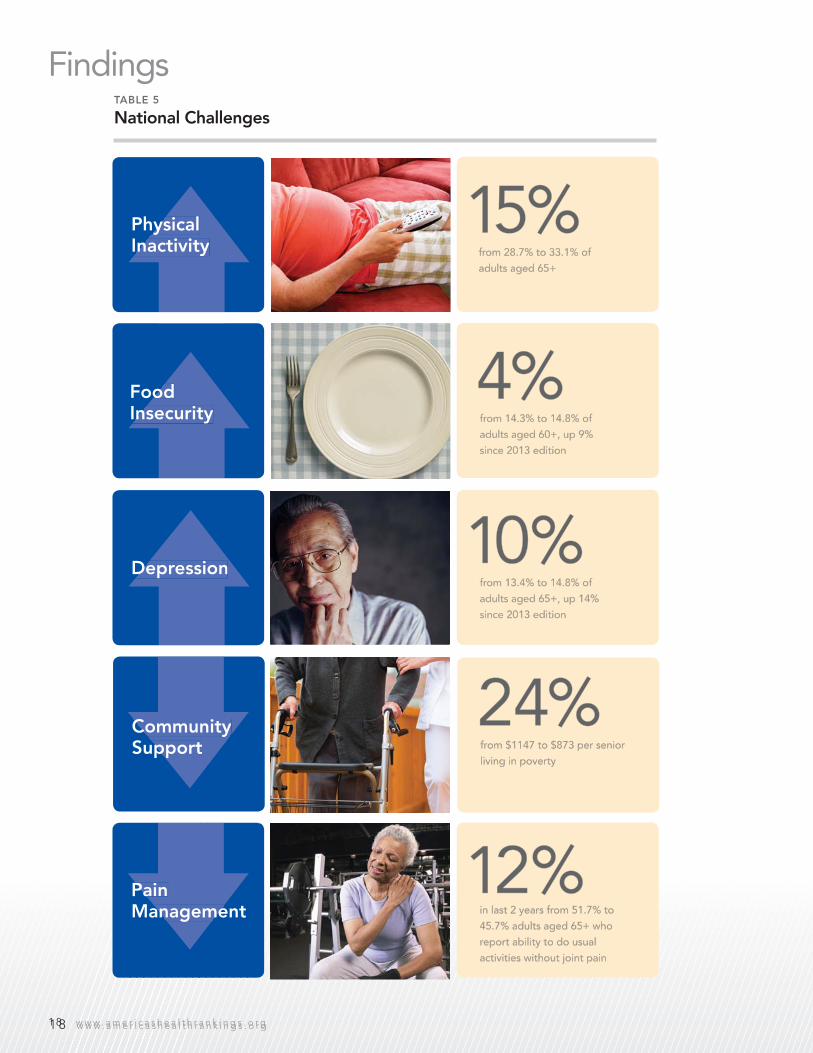
TABLE 5
National Challenges
15%from 28.7% to 33.1% of
adults aged 65+
24%from $1147 to $873 per senior
living in poverty
Community Support
Physical Inactivity
4%from 14.3% to 14.8% of
adults aged 60+, up 9%
since 2013 edition
Food Insecurity
10%from 13.4% to 14.8% of
adults aged 65+, up 14%
since 2013 edition
Depression
12%in last 2 years from 51.7% to
45.7% adults aged 65+ who
report ability to do usual
activities without joint pain
Pain Management
hysicalInactivity
odInsecurity
Depression
Communityupport
Painanageme
Findings
1 8 w w w . a m e r i c a s h e a l t h r a n k i n g s . o r g

A M E R I C A’ S H E A LT H R A N K I N G S ® S E N I O R R E P O R T 1 9A M E R I C A’ S H E A LT H R A N K I N G S ® S E N I O R R E P O R T 1 9
An Aging NationIn 2010 the median age in the US increased to 37.2 years, a new high1 that shows how the nation is aging. Our aging population became more discussed in 2011 when the baby boomers began turning 65 and a remarkable demographic/societal shift in the US population commenced. It marked the start of a surge, a surge that will continue steadily until both the increase in the number of older adults and their percent of the total population fl atten by 2050 (Figure 2).
Using the 2012 National Projections, which are based on the 2010 Census, here are key statistics concerning the senior population of the nation:
• In 2050 adults aged 65 and older are projected to equal 83.7 million, almost double the estimated population of 43.1 million in 2012.
• Between 2012 and 2050, the US population’s projected growth will swell from 314 million to 400 million—a 27% increase.
• By 2030 it is projected that more than 20% of
the population will be aged 65 and older, up from 13% in 2010 and 9.8% in 1970.
This seniors surge threatens to swamp the health care system at state and national levels. Adults aged 65 and older are the largest consumers of health care because aging carries with it the need for more frequent care. The projected growth of the senior population in the United States will pose challenges to policymakers, Medicare, Medicaid, and Social Security, not to mention the effect it will have on families, businesses, and health care providers.
1 Howden LM, Meyer JA. Age and sex composition: 2010. 2010 Census Briefs. US Department of Commerce, Economics and Statistics Administration. US Census Bureau. (2010).
100
80
60
40
20
02015 2020 2025 2030 2035 2040 2045 2050 2055 2060
POPU
LATI
ON
IN M
ILLI
ON
S
65 years and older 85 years and older
FIGURE 2
Projected Population Growth for Selected Age Groups
Data Source: US Census Bureau, 2012 Population Estimates and 2012 National Projections.

2 0 w w w . a m e r i c a s h e a l t h r a n k i n g s . o r g
15-Year Rank of State Increase Increase
TABLE 6
Projected 15-Year Population Increases in Adults Aged 65 and Older by State (Based on 2015 and 2030 Projections)
States in bold have the highest 15-year increase
in adults aged 65 and older.
Data Source: File 2. Interim State Projections
of Population for Five-Year Age Groups and Selected
Age Groups by Sex: July 1, 2004 to 2030. US Census
Bureau, Population Division, Interim State Population
Projections, 2005.
United States 53%
Alabama 41% 38
Alaska 70% 4
Arizona 101% 1
Arkansas 40% 39
California 59% 13
Colorado 52% 21
Connecticut 38% 42
Delaware 60% 12
District of Columbia -6% 51
Florida 88% 3
Georgia 61% 11
Hawaii 45% 29
Idaho 64% 6
Illinois 36% 45
Indiana 36% 44
Iowa 34% 47
Kansas 41% 34
Kentucky 42% 32
Louisiana 42% 31
Maine 50% 22
Maryland 48% 25
Massachusetts 43% 30
Michigan 38% 41
Minnesota 54% 19
Mississippi 46% 27
Missouri 41% 36
Montana 55% 17
Nebraska 39% 40
Nevada 89% 2
New Hampshire 62% 8
New Jersey 42% 33
New Mexico 62% 10
New York 33% 49
North Carolina 58% 14
North Dakota 41% 35
Ohio 33% 48
Oklahoma 37% 43
Oregon 49% 23
Pennsylvania 35% 46
Rhode Island 41% 47
South Carolina 56% 16
South Dakota 45% 28
Tennessee 46% 26
Texas 67% 5
Utah 64% 7
Vermont 53% 20
Virginia 55% 18
Washington 62% 9
West Virginia 29% 50
Wisconsin 49% 24
Wyoming 56% 15
States With Most GrowthThe pressure that this aging-of-America shift places on the nation is not evenly distributed among the states (Table 6).
A Diverse, Aging NationAs the US population ages, it also becomes more diverse over the next several decades. According to the 2012 National Projections, the aggregate minority population is to become the majority in 2043. This diversity in population is making the disparities in health—presented throughout America’s Health Rankings® Senior Report—increasingly more important.
For example, between 2012 and 2050 life expectancy at age 85 is expected to increase by 0.5 to 1.4 years in all race/ethnicity groups but one. The increase is notably smaller for the exception, Hispanic males; the 2012 projection for their life expectancy is 7.1 years, but the 2050 projection falls to 7.0 years.
This example provides context as you read America’s Health Rankings® Senior Report and analyze the disparity for individual metrics such as smoking, obesity, health status, and others.
An Aging Nation

Core Measures

2 2 w w w . a m e r i c a s h e a l t h r a n k i n g s . o r g
Smoking is the leading cause of preventable death in the United States. Older smokers are at increased risk of smoking-related illness as they tend to be heavy smokers with an average smoking duration of 40 years. They are less likely than younger smokers to believe that smoking harms their health. Chronic obstructive pulmonary disease (COPD) is the fourth-leading cause of death and most prevalent in adults aged 65 and older. Smoking is responsible for more than 90% of COPD deaths. Cessation, even in older smokers,
can have profound benefi ts on current health status as well as long-term outcomes.
Smoking by StatePercentage of adults aged 65 and older who regularly smoke (at least 100 cigarettes in their lifetime and currently smoke daily or some days)
Smoking
Utah 4.2%
Hawaii 6.0%
Wisconsin 6.4%
New York 6.5%
Maine 6.8%
United States 8.7%
Top 5 States
Nevada 15.4%
Mississippi 12.9%
Kentucky 11.8%
Alaska 11.7%
Louisiana 11.5%
United States 8.7%
Bottom 5 States
DC
RI
DE
10%
8%
5%
2%
0
2013 2014 2015AD
ULTS
AGE
D 65
+, %
Data source: Behavioral Risk Factor Surveillance System, 2013
For details: www.americashealthrankings.org/ALL/smoking_sr
CORE MEASURES Behaviors
<7.4% 7.4% to <8.6% 8.6% to <9.4% 9.4% to <10.1% >_10.1%

A M E R I C A’ S H E A LT H R A N K I N G S ® S E N I O R R E P O R T 2 3
Disparities in Smoking
US Rate
Maximum & Minimum
Ranking
Rank State Value
1 Utah 4.2
2 Hawaii 6.0
3 Wisconsin 6.4
4 New York 6.5
5 Maine 6.8
6 Rhode Island 7.0
7 New Hampshire 7.1
8 California 7.2
9 Washington 7.3
10 Connecticut 7.4
10 Vermont 7.4
12 New Jersey 7.7
13 Arizona 7.9
14 Iowa 8.0
14 Oregon 8.0
16 Idaho 8.2
17 Delaware 8.4
17 South Carolina 8.4
17 South Dakota 8.4
20 Illinois 8.6
20 Nebraska 8.6
22 Florida 8.7
22 Georgia 8.7
22 Maryland 8.7
22 Texas 8.7
26 Alabama 8.9
27 Colorado 9.1
27 Kansas 9.1
29 Minnesota 9.3
30 Michigan 9.4
31 Wyoming 9.5
32 Indiana 9.6
32 Massachusetts 9.6
34 Montana 9.7
34 North Carolina 9.7
34 Ohio 9.7
37 New Mexico 9.9
37 Oklahoma 9.9
39 Pennsylvania 10.0
40 North Dakota 10.1
41 Virginia 10.4
42 Missouri 10.7
43 Tennessee 10.8
44 Arkansas 11.1
45 West Virginia 11.2
46 Louisiana 11.5
47 Alaska 11.7
48 Kentucky 11.8
49 Mississippi 12.9
50 Nevada 15.4
United States 8.7
District of Columbia 8.0
by Smoking
avo
• L IFESTYLE • C OUNSELING•PATIEN
CE
avo
AV
OID
T
RIGGERS
MEDICATION
• EF
FO
RT
SUPPORT NETW
ORK •
PLA
N T
O
QU
IT set a quit date • medication • nicotine patch • Nicotine AnonymousTM
• remove ash trays • support network • counseling • avoid triggers • manage withdrawal symptoms • choose smoke-free settings • patience
CHA
NG
E
Prevalence by Income
Less Than $25 000
$25 000 to $49 999
$50 000 to $74 999
$75 000 or More
0 5 10 15 20 Adults aged 65+, %
Prevalence by Education
Less Than High School
High School
Some College
College Graduate
0 5 10 15 20 25Adults aged 65+, %
Prevalence by Race
Non-Hispanic White
Non-Hispanic Black
Hispanic
Native American
Asian
Non-Hispanic Hawaiian/ Pacific Islander
Adults aged 65+, %0 10 20 30
Prevalence by Gender
Male
Female
Adults aged 65+, %0 5 10 15
Prevalence by Urbanicity
Urban
Suburban
Rural
Adults aged 65+, %0 5 10 15

2 4 w w w . a m e r i c a s h e a l t h r a n k i n g s . o r g
Excessive alcohol consumption is the third-leading cause of preventable death in the United States. Seniors experience the highest alcohol-attributed death rate at 60.3 per 100 000, compared with 28.5 per 100 000 in the general population. Excessive alcohol consumption in older adults can lead to sleep disorders, depression, anxiety, suicide, liver diseases, cardiovascular diseases, and cancer. Alcoholism is also a signifi cant risk factor for dementia. Heavy drinking can exacerbate such health problems as diabetes and high blood pressure. Bereavement, loneliness, and social isolation may
contribute to excessive drinking. The US Preventive Services Task Force recommends physicians screen all adults for alcohol-related problems.
Chronic Drinking by StatePercentage of adults aged 65 and older who consumed more than 60 drinks in the last 30 days for men and more than 30 drinks in the last 30 days for women
Chronic Drinking
Tennessee 1.5%
West Virginia 1.5%
Alabama 1.9%
South Dakota 2.1%
Utah 2.1%
United States 4.0%
Top 5 States
Nevada 6.9%
Alaska 6.7%
Oregon 5.7%
Massachusetts 5.5%
California 5.3%
United States 4.0%
Bottom 5 States
4.5%
3.5%
2.5%
1.5%
.5%
0 2013 2014 2015
ADU
LTS
AGED
65+
, %
Data source: Behavioral Risk Factor Surveillance System, 2013
For details: www.americashealthrankings.org/ALL/chronic_drinking_sr
CORE MEASURES Behaviors
<2.6% 2.6% to <3.3% 3.3% to <4.3% 4.3% to <4.8% >_ 4.8%
DC
RI
DE

A M E R I C A’ S H E A LT H R A N K I N G S ® S E N I O R R E P O R T 2 5
Disparities in Chronic Drinking
US Rate
Maximum & Minimum
Ranking
Rank State Value
1 Tennessee 1.5
1 West Virginia 1.5
3 Alabama 1.9
4 South Dakota 2.1
4 Utah 2.1
6 Kansas 2.2
7 Kentucky 2.3
7 North Dakota 2.3
7 Oklahoma 2.3
10 Mississippi 2.4
11 North Carolina 2.6
12 Georgia 2.9
12 Indiana 2.9
12 New Jersey 2.9
15 Arkansas 3.0
15 Iowa 3.0
15 Nebraska 3.0
15 Wyoming 3.0
19 Ohio 3.2
20 Illinois 3.3
20 Louisiana 3.3
22 Idaho 3.5
22 Missouri 3.5
22 New Mexico 3.5
25 Virginia 3.7
26 Maryland 4.0
26 Minnesota 4.0
26 New Hampshire 4.0
26 Pennsylvania 4.0
30 Michigan 4.3
30 New York 4.3
30 Wisconsin 4.3
33 Colorado 4.4
33 Delaware 4.4
35 South Carolina 4.5
35 Vermont 4.5
37 Arizona 4.6
37 Hawaii 4.6
39 Connecticut 4.8
39 Maine 4.8
39 Washington 4.8
42 Florida 4.9
42 Montana 4.9
42 Rhode Island 4.9
45 Texas 5.1
46 California 5.3
47 Massachusetts 5.5
48 Oregon 5.7
49 Alaska 6.7
50 Nevada 6.9
United States 4.0
District of Columbia 5.8
by Chronic Drinking
Prevalence by Income
Less Than $25 000
$25 000 to $49 999
$50 000 to $74 999
$75 000 or More
0 2 4 6 8 10 12 Adults aged 65+, %
Prevalence by Education
Less Than High School
High School
Some College
College Graduate
0 2 4 6 8 10Adults aged 65+, %
Prevalence by Race
Non-Hispanic White
Non-Hispanic Black
Hispanic
Native American
Asian
Non-Hispanic Hawaiian/ Pacific Islander
Adults aged 65+, %0 2 4 6 8
Prevalence by Gender
Male
Female
Adults aged 65+, %0 2 4 6 8
Prevalence by Urbanicity
Urban
Suburban
Rural
Adults aged 65+, %0 2 4 6 8
moderation • set goals • accountability • drive sober • ask for help • admit you have a problem • talk
with loved ones • find a support network • make a plan• don’t keep alcohol at home • recognize triggers • slow the pace • exercise • find productive ways to handle stress • fill your time with healthy activities • drink
water between alcoholic beverages • set limits •drive sober establish drinking rules • never drink alone • reward
yourself for sobriety • avoid heavy drinkers • goals
Asupp-
ort groupmeeting

2 6 w w w . a m e r i c a s h e a l t h r a n k i n g s . o r g
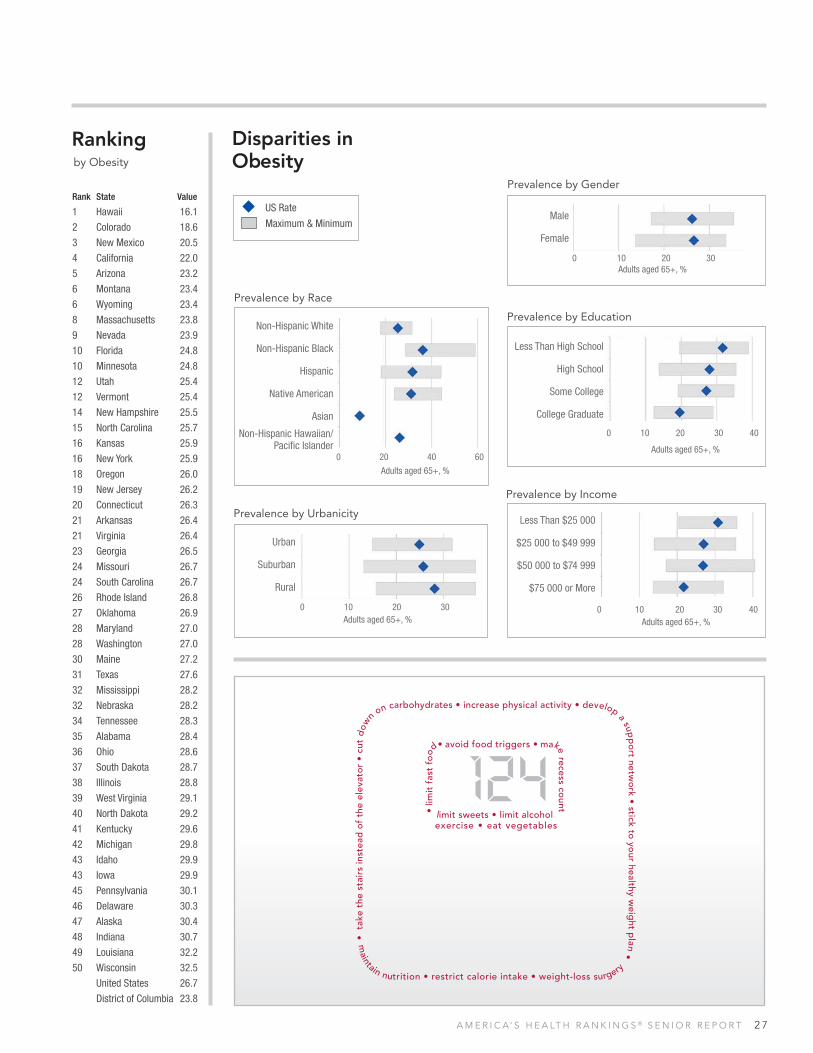
Obesity predisposes older adults to such chronic diseases as heart disease, diabetes, stroke, and certain cancers; it may also lead to disability due to excess weight on joints. Obesity is associated with shrinkage of the hippocampus, contributing to cognitive decline in older adults. Obese seniors experience more hospitalizations, emergency room visits, and use of outpatient health services than non-obese seniors, leading to higher health care costs. Physical activity, healthy diet, supportive communities and social
networks, and an environment that encourages exercise all play a role in reducing obesity in older adults.
Obesity by StatePercentage of adults aged 65 and older estimated to be obese, with a body mass index (BMI) of 30.0 or higher
Hawaii 16.1%Colorado 18.6%New Mexico 20.5%California 22.0%Arizona 23.2%United States 26.7%
Top 5 States
Wisconsin 32.5%Louisiana 32.2%Indiana 30.7%Alaska 30.4%Delaware 30.3%United States 26.7%
Bottom 5 States
30%
20%
10%
0
2013 2014 2015
ADUL
TS A
GED
65+
, %Data source: Behavioral Risk Factor Surveillance System, 2013
For details: www.americashealthrankings.org/ALL/obesity_sr
CORE MEASURES Behaviors
<24.8% 24.8% to <26.3% 26.3% to <27.2% 27.2% to <29.2% >_ 29.2%
DC
RI
DE
Obesity
A M E R I C A’ S H E A LT H R A N K I N G S ® S E N I O R R E P O R T 2 7
Disparities inObesity
US Rate
Maximum & Minimum
Ranking
Rank State Value
1 Hawaii 16.1
2 Colorado 18.6
3 New Mexico 20.5
4 California 22.0
5 Arizona 23.2
6 Montana 23.4
6 Wyoming 23.4
8 Massachusetts 23.8
9 Nevada 23.9
10 Florida 24.8
10 Minnesota 24.8
12 Utah 25.4
12 Vermont 25.4
14 New Hampshire 25.5
15 North Carolina 25.7
16 Kansas 25.9
16 New York 25.9
18 Oregon 26.0
19 New Jersey 26.2
20 Connecticut 26.3
21 Arkansas 26.4
21 Virginia 26.4
23 Georgia 26.5
24 Missouri 26.7
24 South Carolina 26.7
26 Rhode Island 26.8
27 Oklahoma 26.9
28 Maryland 27.0
28 Washington 27.0
30 Maine 27.2
31 Texas 27.6
32 Mississippi 28.2
32 Nebraska 28.2
34 Tennessee 28.3
35 Alabama 28.4
36 Ohio 28.6
37 South Dakota 28.7
38 Illinois 28.8
39 West Virginia 29.1
40 North Dakota 29.2
41 Kentucky 29.6
42 Michigan 29.8
43 Idaho 29.9
43 Iowa 29.9
45 Pennsylvania 30.1
46 Delaware 30.3
47 Alaska 30.4
48 Indiana 30.7
49 Louisiana 32.2
50 Wisconsin 32.5
United States 26.7
District of Columbia 23.8
by Obesity
Prevalence by Income
Less Than $25 000
$25 000 to $49 999
$50 000 to $74 999
$75 000 or More
0 10 20 30 40 Adults aged 65+, %
Prevalence by Education
Less Than High School
High School
Some College
College Graduate
0 10 20 30 40
Adults aged 65+, %
Prevalence by Race
Non-Hispanic White
Non-Hispanic Black
Hispanic
Native American
Asian
Non-Hispanic Hawaiian/ Pacific Islander
Adults aged 65+, %
0 20 40 60
Prevalence by Gender
Male
Female
Adults aged 65+, %0 10 20 30
Prevalence by Urbanicity
Urban
Suburban
Rural
Adults aged 65+, %0 10 20 30
• t
ake
the
stai
rs in
stea
d o
f th
e el
evat
or
• cu
t d
ow
n on carbohydrates • increase physical activity • develop a supp
ort netw
ork • stick to
your healthy w
eight p
l an •
maintain nutrition • restrict calorie intake • weight-loss surgery
• lim
it f
ast
food
• avoid food triggers • make recess count limit sweets • limit alcohol
exercise • eat vegetables

2 8 w w w . a m e r i c a s h e a l t h r a n k i n g s . o r g
Underweight older adults are at an increased risk of falls, hospitalizations, long hospital stays, postoperative complications, acute illness, and even death. Social isolation, poverty, psychological disorders, physiological function, medications, and poor oral health are all factors that put older adults at an increased risk of being underweight. Promoting healthy weight among seniors requires multiple approaches. Community meal services, education for adults at risk of being underweight, encouraging physical activity, and nutritional-
management training for care workers likely all play a role in helping seniors maintain a healthy weight.
Underweight by StatePercentage of adults aged 65 and older with fair or better health status estimated to be underweight, with a body mass index (BMI) of 18.5 or less
Underweight
Michigan 0.9%Iowa 1.0%Minnesota 1.0%Rhode Island 1.0%South Dakota 1.0%United States 1.6%
Top 5 States
Hawaii 4.0%Nevada 2.6%Kentucky 2.3%New Mexico 2.2%CA, CO, NJ & WY (tie) 2.0%United States 1.6%
Bottom 5 States
2.0%
1.4%
0.8%
0 2013 2014 2015
ADUL
TS A
GED
65+
, %Data source: Behavioral Risk Factor Surveillance System, 2013
For details: www.americashealthrankings.org/ALL/underweight_sr
CORE MEASURES Behaviors
<1.3% 1.3% to <1.5% 1.5% to <1.7% 1.7% to <1.9% >_ 1.9%
DC
RI
DE
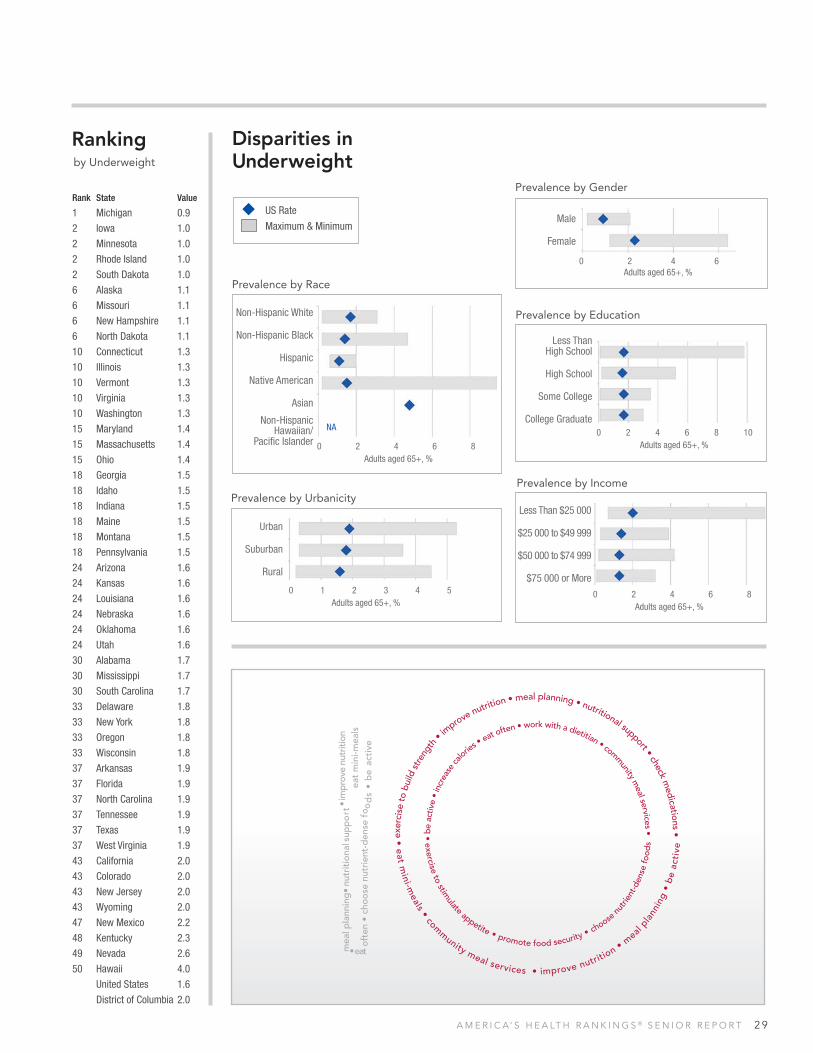
A M E R I C A’ S H E A LT H R A N K I N G S ® S E N I O R R E P O R T 2 9
Disparities in Underweight
US Rate
Maximum & Minimum
Ranking
Rank State Value
1 Michigan 0.9
2 Iowa 1.0
2 Minnesota 1.0
2 Rhode Island 1.0
2 South Dakota 1.0
6 Alaska 1.1
6 Missouri 1.1
6 New Hampshire 1.1
6 North Dakota 1.1
10 Connecticut 1.3
10 Illinois 1.3
10 Vermont 1.3
10 Virginia 1.3
10 Washington 1.3
15 Maryland 1.4
15 Massachusetts 1.4
15 Ohio 1.4
18 Georgia 1.5
18 Idaho 1.5
18 Indiana 1.5
18 Maine 1.5
18 Montana 1.5
18 Pennsylvania 1.5
24 Arizona 1.6
24 Kansas 1.6
24 Louisiana 1.6
24 Nebraska 1.6
24 Oklahoma 1.6
24 Utah 1.6
30 Alabama 1.7
30 Mississippi 1.7
30 South Carolina 1.7
33 Delaware 1.8
33 New York 1.8
33 Oregon 1.8
33 Wisconsin 1.8
37 Arkansas 1.9
37 Florida 1.9
37 North Carolina 1.9
37 Tennessee 1.9
37 Texas 1.9
37 West Virginia 1.9
43 California 2.0
43 Colorado 2.0
43 New Jersey 2.0
43 Wyoming 2.0
47 New Mexico 2.2
48 Kentucky 2.3
49 Nevada 2.6
50 Hawaii 4.0
United States 1.6
District of Columbia 2.0
by Underweight
Prevalence by Income
0 2 4 6 8Adults aged 65+, %
Prevalence by Education
Less Than
High School
High School
Some College
College Graduate0 2 4 6 8 10
Adults aged 65+, %
Prevalence by Gender
Male
Female
Adults aged 65+, %0 2 4 6
Prevalence by Urbanicity
Urban
Suburban
Rural
Adults aged 65+, %0 1 2 3 4 5
be a
ctiv
e •
incr
ease
ca
lories •
eat often • work with a dietitian • community m
eal services •
• exercise to stimulate appetite • promote food security • choose
nutri
ent-d
ense
food
s • eat mini-m
eals • com
munity meal services • improve nutrition • m
eal p
lann
ing
• b
e ac
tive
exer
cise
to
build
stre
ngth
• im
prove nutrition • meal planning • nutritional support • check m
edications •
mea
l pla
nnin
g•
nutr
itio
nal s
upp
ort
• im
prov
e nu
triti
on
• eat oft
en •
cho
ose
nutr
ient
-den
se f
ood
s •
be
acti
veea
t m
ini-m
eals
Prevalence by Race
Adults aged 65+, %0 2 4 6 8
Non-Hispanic White
Non-Hispanic Black
Hispanic
Native American
Asian
Non-HispanicHawaiian/
Pacific IslanderNA
Less Than $25 000
$25 000 to $49 999
$50 000 to $74 999
$75 000 or More

3 0 w w w . a m e r i c a s h e a l t h r a n k i n g s . o r g
The natural process of aging means a decrease in muscle mass and strength, making it challenging for many older adults to be active as they age. Just 40% of older adults take part in regular physical activity. Physical inactivity increases the risk of cardiovascular disease, diabetes, hypertension, obesity, and premature death. Fortunately, physical activity has been shown to increase bone density, reduce falls, and decrease depression for older adults. Increasing physical activity, especially from a
complete absence, can help seniors manage and prevent chronic disease.
Physical Inactivity by StatePercentage of adults aged 65 and older with fair or better health status who report doing no physical activity or exercise (such as running, calisthenics, golf, gardening, or walking) other than their regular job in the last 30 days
Oregon 22.8%Colorado 23.9%Washington 24.4%New Mexico 25.6%Utah 26.8%United States 33.1%
Top 5 StatesMississippi 45.3%
Oklahoma 42.3%
Tennessee 41.7%
Kentucky 40.2%
Arkansas 39.6%
United States 33.1%
Bottom 5 States
35%
25%
15%
0 2013 2014 2015
ADUL
TS A
GED
65+
, %Data source: Behavioral Risk Factor Surveillance System, 2013
For details: www.americashealthrankings.org/ALL/physical_inactivity_sr
CORE MEASURES Behaviors
< 27.6% 27.6% to <32.0% 32.0% to <34.0% 34.0% to <36.7% >_ 36.7%
DC
RI
DE
Physical Inactivity

A M E R I C A’ S H E A LT H R A N K I N G S ® S E N I O R R E P O R T 3 1
Disparities in Physical Inactivity
US Rate
Maximum & Minimum
Ranking
Rank State Value
1 Oregon 22.8
2 Colorado 23.9
3 Washington 24.4
4 New Mexico 25.6
5 Utah 26.8
6 Vermont 26.9
7 Idaho 27.0
8 California 27.4
8 Hawaii 27.4
10 New Hampshire 27.6
11 Arizona 27.9
12 Maine 28.6
13 Nebraska 30.1
13 Wisconsin 30.1
15 Montana 30.2
16 Michigan 30.8
17 South Dakota 31.1
18 Alaska 31.8
18 North Carolina 31.8
20 Florida 32.0
20 Kansas 32.0
20 South Carolina 32.0
23 Wyoming 32.1
24 New York 32.9
25 Massachusetts 33.1
26 Minnesota 33.5
27 Connecticut 33.6
28 Missouri 33.8
29 Illinois 34.0
29 Maryland 34.0
31 New Jersey 34.3
31 North Dakota 34.3
33 Georgia 34.4
34 Nevada 34.6
34 Virginia 34.6
36 Alabama 34.9
36 Rhode Island 34.9
38 Iowa 35.9
39 Delaware 36.2
40 Pennsylvania 36.7
41 Ohio 37.0
42 Louisiana 38.1
42 Texas 38.1
44 West Virginia 38.4
45 Indiana 39.2
46 Arkansas 39.6
47 Kentucky 40.2
48 Tennessee 41.7
49 Oklahoma 42.3
50 Mississippi 45.3
United States 33.1
District of Columbia 25.6
by Physical Inactivity
Prevalence by Income
Less Than $25 000
$25 000 to $49 999
$50 000 to $74 999
$75 000 or More
0 10 20 30 40 50
Adults aged 65+, %
Prevalence by Education
Less Than High School
High School
Some College
College Graduate
0 10 20 30 40 50Adults aged 65+, %
Prevalence by Race
Non-Hispanic White
Non-Hispanic Black
Hispanic
Native American
Asian
Non-Hispanic Hawaiian/ Pacific Islander
Adults aged 65+, %0 20 40 60
Prevalence by Gender
Male
Female
Adults aged 65+, %0 10 20 30 40 50
Prevalence by Urbanicity
Urban
Suburban
Rural
Adults aged 65+, %0 10 20 30 40
• ri
de
an e
xerc
ise b
ike • take the stairs instead of the elevator •
•
red
uce
time sp
ent watching television • jog
•
• wal
k to
sch
ool or work • sw
im • run •
• w
alk
the
dog • do push-ups • tennis•
join a fitness club • do jumping jacks • mow the lawn
• g
olf
•
create more sidewalks
mall walk rake leaves
• •

3 2 w w w . a m e r i c a s h e a l t h r a n k i n g s . o r g
Oral health tends to decline with age, and problems can arise quickly if routine care is not maintained. Gum disease affects nearly a quarter of adults aged 65 to 74 years, and more than 800 000 emergency department visits occur as a result of preventable dental conditions. Poor oral health is associated with such chronic diseases as diabetes and cardiovascular disease, and it can have a large impact on quality of life. It may cause pain, and in the long term it can affect the ability to chew or speak. Seniors need access to
affordable oral hygiene services and routine care to maintain proper oral health.
Dental Visit by StatePercentage of adults aged 65 and older who report having visited a dental health professional within the last 12 months
Dental Visit
Hawaii 77.2%Minnesota 77.2%Wisconsin 75.1%Connecticut 74.5%Massachusetts 73.7%United States 65.6%
Top 5 StatesWest Virginia 49.6%
Mississippi 50.3%
Louisiana 51.0%
Kentucky 53.0%
Arkansas 53.8%
United States 65.6%
Bottom 5 States
80%
50%
30%
0 2013 2014 2015
ADUL
TS A
GED
65+
, %Data source: Behavioral Risk Factor Surveillance System, 2012
For details: www.americashealthrankings.org/ALL/dental_visit_sr
CORE MEASURES Behaviors
>_ 71.1% <71.1% to 67.8% <67.8% to 63.6% <63.6% to 61.2% <61.2%
DC
RI
DE

A M E R I C A’ S H E A LT H R A N K I N G S ® S E N I O R R E P O R T 3 3
Disparities in Dental Visit
US Rate
Maximum & Minimum
Ranking
Rank State Value
1 Hawaii 77.2
1 Minnesota 77.2
3 Wisconsin 75.1
4 Connecticut 74.5
5 Massachusetts 73.7
6 California 73.2
7 New Hampshire 72.8
8 Rhode Island 72.3
9 Michigan 71.7
10 Maryland 71.6
11 Utah 71.1
12 Vermont 70.6
13 Washington 70.5
14 Colorado 70.2
14 New Jersey 70.2
16 Delaware 69.6
17 Virginia 69.1
18 Iowa 68.6
19 Nebraska 68.5
20 Oregon 68.0
21 Kansas 67.8
22 New York 66.7
23 Idaho 66.4
24 Florida 65.7
25 Arizona 65.6
26 Nevada 64.9
27 South Dakota 64.0
28 North Carolina 63.8
29 New Mexico 63.6
29 Ohio 63.6
31 Illinois 63.4
31 Pennsylvania 63.4
33 Georgia 63.3
34 Montana 63.0
35 Alaska 62.4
36 Indiana 62.0
36 North Dakota 62.0
38 South Carolina 61.3
39 Texas 61.2
39 Wyoming 61.2
41 Maine 60.9
42 Tennessee 59.8
43 Missouri 58.7
44 Alabama 56.7
45 Oklahoma 56.5
46 Arkansas 53.8
47 Kentucky 53.0
48 Louisiana 51.0
49 Mississippi 50.3
50 West Virginia 49.6
United States 65.6
District of Columbia 66.6
by Dental Visit
Prevalence by Income
Less Than $25 000
$25 000 to $49 999
$50 000 to $74 999
$75 000 or More
0 20 40 60 80 Adults aged 65+, %
Prevalence by Education
Less Than High School
High School
Some College
College Graduate
0 20 40 60 80Adults aged 65+, %
Prevalence by Race
Non-Hispanic White
Non-Hispanic Black
Hispanic
Native American
Asian
Non-Hispanic Hawaiian/ Pacific Islander
Adults aged 65+, %0 20 40 60 80
Prevalence by Gender
Male
Female
Adults aged 65+, %0 20 40 60 80
Prevalence by Urbanicity
Urban
Suburban
Rural
Adults aged 65+, %0 20 40 60 80
•x
ray
s••
••
••
•
•flu
orid
e••f
loss
ing
•
•b
rush
ing
•
• dental cleaning • examine tissues in the mouth • remove plaque buildup
• •
tooth restoratio n • diminished sense of taste • check for broken teeth
• w
ater
fluo
rid
atio
n • remove tartar buildup • oral cancer screening •
eva lua te dentures • p revent tooth decay • reg
ula
r ch
eck
up
• x
rays
xray
s • flo
ssing
• examine g
um
s •
bru
sh
• • • •
• • • • • • • ••

3 4 w w w . a m e r i c a s h e a l t h r a n k i n g s . o r g
This measure looks at seniors with arthritis whose joint pain does not restrict normal functioning and activities. Arthritis, the leading cause of disability among US adults, limits functional mobility and often interferes with activities of daily living (ADL). Older adults with ADL limitations may have more diffi culty living independently, or they may require community services or long-term care. Osteoarthritis, the most common form of arthritis among seniors, is most prevalent in older adults who are overweight or with a history of joint injury.
Physical activity can prevent arthritis and improve quality of life for people with the disease.
Pain ManagementPercentage of adults aged 65 and older with arthritis who report that arthritis or joint pain does not limit usual activities
Hawaii 37.2%Delaware 38.7%Minnesota 39.4%Nevada 40.3%Nebraska 40.5%United States 45.7%
Top 5 StatesOklahoma 53.2%
Mississippi 52.5%
New Mexico 51.2%
Arkansas 50.9%
Alabama & Washington (tie) 50.3%
United States 45.7%
Bottom 5 States
Data source: Behavioral Risk Factor Surveillance System, 2013
For details: www.americashealthrankings.org/ALL/pain_management_sr
CORE MEASURES Behaviors
>_ 47.9% <47.9% to 45.9% <45.9% to 44.4% <44.4% to 42.7% <42.7%
DC
RI
DE
60%
40%
20%
0 2013 2014 2015
ADUL
TS A
GED
65+
, %
Pain Management

A M E R I C A’ S H E A LT H R A N K I N G S ® S E N I O R R E P O R T 3 5
Disparities in Pain Management
US Rate
Maximum & Minimum
Ranking
Rank State Value
1 Oklahoma 53.2
2 Mississippi 52.5
3 New Mexico 51.2
4 Arkansas 50.9
5 Alabama 50.3
5 Washington 50.3
7 Texas 49.9
8 Kentucky 49.3
9 Tennessee 48.9
10 North Carolina 48.8
11 Georgia 47.9
12 New York 47.7
13 Oregon 47.3
14 Florida 46.9
14 Idaho 46.9
16 Louisiana 46.8
17 Missouri 46.5
17 West Virginia 46.5
19 Montana 46.4
20 South Carolina 46.1
21 Alaska 45.9
21 Maryland 45.9
21 Ohio 45.9
24 North Dakota 45.8
25 Illinois 45.7
25 Utah 45.7
27 California 45.3
28 Vermont 45.2
29 Arizona 44.8
30 Michigan 44.5
31 Indiana 44.4
32 Massachusetts 44.1
33 Pennsylvania 43.9
34 Kansas 43.8
34 New Jersey 43.8
34 Rhode Island 43.8
37 Wyoming 43.2
38 Maine 42.9
39 Wisconsin 42.8
40 Virginia 42.7
41 Colorado 42.2
42 South Dakota 41.8
43 Connecticut 41.5
44 New Hampshire 41.2
45 Iowa 40.7
46 Nebraska 40.5
47 Nevada 40.3
48 Minnesota 39.4
49 Delaware 38.7
50 Hawaii 37.2
United States 45.7
District of Columbia 43.2
by Pain Management
Prevalence by Income
Less Than $25 000
$25 000 to $49 999
$50 000 to $74 999
$75 000 or More
0 10 20 30 40 50 60Adults aged 65+, %
Prevalence by Education
Less Than High School
High School
Some College
College Graduate0 10 20 30 40 50 60
Adults aged 65+, %
Prevalence by Race
Non-Hispanic White
Non-Hispanic Black
Hispanic
Native American
Asian
Non-Hispanic Hawaiian/ Pacific Islander
Adults aged 65+, %0 20 40 60
Prevalence by Gender
Male
Female
Adults aged 65+, %0 10 20 30 40 50
Prevalence by Urbanicity
Urban
Suburban
Rural
Adults aged 65+, %0 10 20 30 40 50
st
ress
man
agem
ent •
massage therapy • pain
reduction • meditation •
• re gular e
xerci
se •
adequate sleep • acupunctu re • stretch in g
• her
bal
the
rap
ies
• relaxation
p r o per
nut
riti
on •
• analgesics •
• counsel i n g
• phy
sical therapy •
y o g a
NA

3 6 w w w . a m e r i c a s h e a l t h r a n k i n g s . o r g
The offi cial poverty measure estimates that 1 in 10 older adults live in poverty, but when medical costs and other costs of living are accounted for, the number jumps to 1 in 6. Poverty infl uences environmental exposures and health-related behaviors, and it is associated with an increased risk of mortality and chronic disease. Most seniors live on modest retirement incomes, and many struggle with rising costs of housing and health care as well as access to healthy food and reliable transportation. Senior women, seniors aged 80
and older, as well as black and Hispanic older adults face an increased risk of poverty.
PovertyPercentage of adults aged 65 and older who live in households at or below 100% of the poverty threshold
Poverty
Alaska 5.1%New Hampshire 6.1%Wyoming 6.2%Utah 6.5%Delaware 6.8%United States 9.5%
Top 5 StatesMississippi 14.3%
Louisiana 12.7%
New Mexico 11.8%
Kentucky 11.8%
New York 11.6%
United States 9.5%
Bottom 5 States
Data source: American Community Survey, 2011 to 2013
For details: http://www.americashealthrankings.org/ALL/poverty_sr
CORE MEASURES Community & Environment: Macro
<7.6% 7.6% to <8.2% 8.2% to <9.2% 9.2% to <10.5% >_10.5%
DC
RI
DE
10%
8%
6%
4%
2%
0 2013 2014 2015
ADUL
TS A
GED
65+
, %
A M E R I C A’ S H E A LT H R A N K I N G S ® S E N I O R R E P O R T 3 7
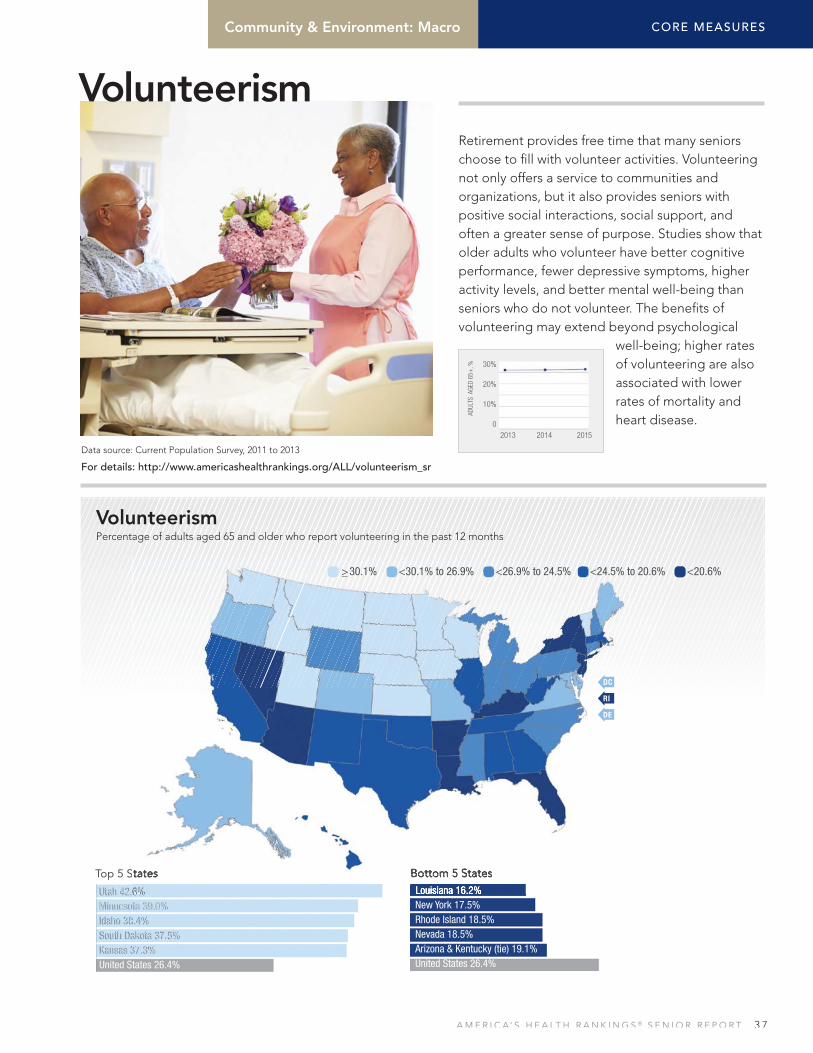
Retirement provides free time that many seniors choose to fi ll with volunteer activities. Volunteering not only offers a service to communities and organizations, but it also provides seniors with positive social interactions, social support, and often a greater sense of purpose. Studies show that older adults who volunteer have better cognitive performance, fewer depressive symptoms, higher activity levels, and better mental well-being than seniors who do not volunteer. The benefi ts of volunteering may extend beyond psychological
well-being; higher rates of volunteering are also associated with lower rates of mortality and heart disease.
VolunteerismPercentage of adults aged 65 and older who report volunteering in the past 12 months
Volunteerism
Utah 42.6%Minnesota 39.0%Idaho 38.4%South Dakota 37.5%Kansas 37.3%United States 26.4%
Top 5 StatesLouisiana 16.2%New York 17.5%Rhode Island 18.5%Nevada 18.5%Arizona & Kentucky (tie) 19.1%United States 26.4%
Bottom 5 States
Data source: Current Population Survey, 2011 to 2013
For details: http://www.americashealthrankings.org/ALL/volunteerism_sr
CORE MEASURES
>_ 30.1% <30.1% to 26.9% <26.9% to 24.5% <24.5% to 20.6% <20.6%
DC
RI
DE
30%
20%
10%
0 2013 2014 2015
ADUL
TS A
GED
65+
, %
Community & Environment: Macro

3 8 w w w . a m e r i c a s h e a l t h r a n k i n g s . o r g
Poor quality care in nursing homes has an enormous impact on the health and fi nances of millions of US nursing home residents and taxpayers. Millions of dollars are spent yearly for medical treatment and hospitalizations related to falls, pressure ulcers, urinary incontinence, malnutrition, dehydration, and ambulatory care-sensitive diagnoses. Quality nursing home practices can largely prevent these negative health outcomes, and nursing homes nationwide are making efforts toward systematic quality improvement. This year, the Centers for
Medicare & Medicaid Services amended the Nursing Home Compare rating scale, raising quality standards in nursing homes across the country.
Nursing Home QualityPercentage of certifi ed nursing home beds rated 4- or 5-stars
Idaho 57.9%Delaware 57.6%Maine 55.2%Hawaii 54.1%New Hampshire 53.9%
United States 42.5%
Top 5 StatesTexas 25.9%
Louisiana 27.5%
Georgia 28.4%
Oklahoma 28.8%
West Virginia 29.3%
United States 42.5%
Bottom 5 States
Data source: Nursing Home Compare, 2015
For details: http://www.americashealthrankings.org/ALL/nursing_home_quality_sr
CORE MEASURES
>_48.8% <48.8% to 45.9% <45.9% to 42.0% <42.0% to 34.6% <34.6%
DC
RI
DE
50%
25%
0 2013 2014 2015 B
EDS
RATE
D 4-
OR
5-ST
ARS,
%
Nursing Home Quality
Community & Environment: Macro

A M E R I C A’ S H E A LT H R A N K I N G S ® S E N I O R R E P O R T 3 9
Access to healthy food is a struggle for some older adults and is of particular concern for seniors living at home. Home-delivered meal programs can enhance quality of life, provide a stable source of nutrition, increase nutrient intake, and help older adults remain independent despite functional limitations. Allowing low-care seniors to remain in their homes with the support of home-delivered meals has a projected cost savings of $109 million. The Elderly Nutrition Program provides grant funding to states to
administer home- and community-meal services. These programs target seniors at high risk for undernutrition and food insecurity.
Home-Delivered MealsNumber of persons served a home-delivered meal as a percentage of adults aged 65 and older living in poverty
Home-Delivered Meals
Wyoming 108.1%Alaska 100.2%New Hampshire 98.3%Vermont 64.0%Utah 57.6%
United States 20.6%
Top 5 States Bottom 5 States
Data source: State Program Reports, 2012
For details: http://www.americashealthrankings.org/ALL/home_delivered_meals
CORE MEASURES
<15.4% 15.4% to <19.4% 19.4% to <26.5% 26.5% to <39.8% >_39.8%
DC
RI
DE
25%
20%
15%
10%
5%
0 2013 2014 2015PART
ICIP
ANTS
AS
% O
F AD
ULTS
AG
ED 6
5+ IN
POV
ERTY
Florida 8.9%
Maryland 9.6%
Tennessee 10.1%
Georgia 11.3%
California 11.8%United States 20.6%
Community & Environment: Macro
4 0 w w w . a m e r i c a s h e a l t h r a n k i n g s . o r g
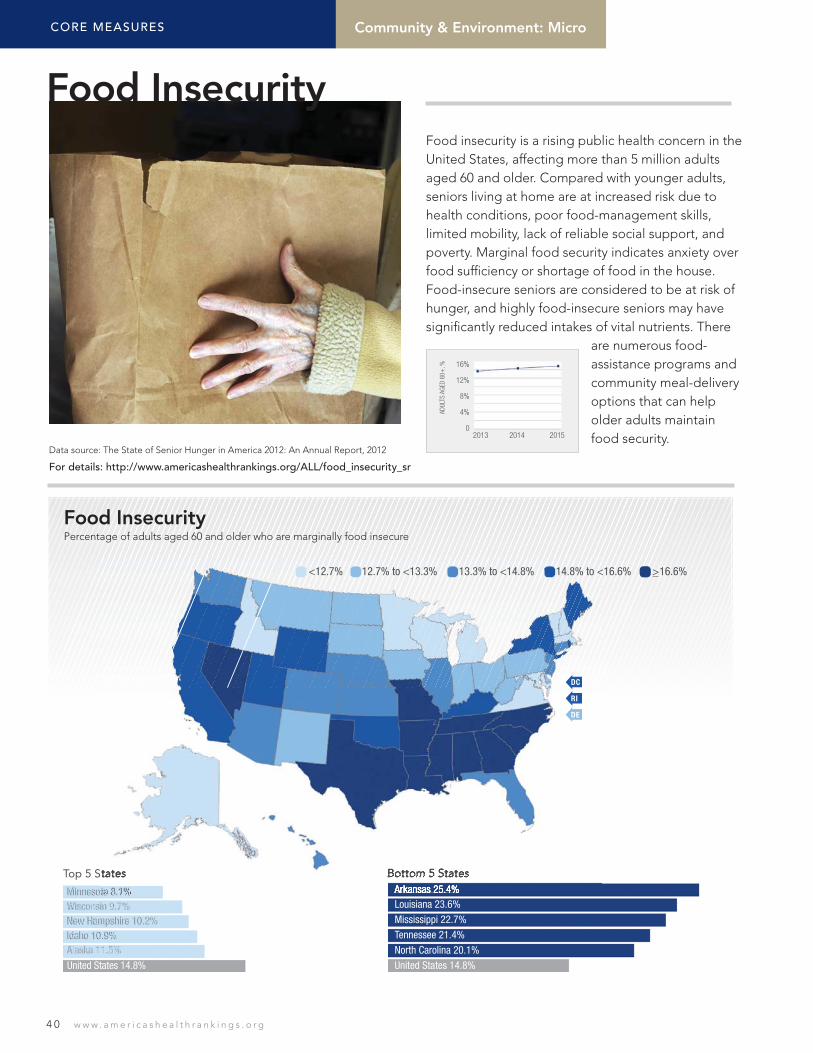
Food insecurity is a rising public health concern in the United States, affecting more than 5 million adults aged 60 and older. Compared with younger adults, seniors living at home are at increased risk due to health conditions, poor food-management skills, limited mobility, lack of reliable social support, and poverty. Marginal food security indicates anxiety over food suffi ciency or shortage of food in the house. Food-insecure seniors are considered to be at risk of hunger, and highly food-insecure seniors may have signifi cantly reduced intakes of vital nutrients. There
are numerous food-assistance programs and community meal-delivery options that can help older adults maintain food security.
Food InsecurityPercentage of adults aged 60 and older who are marginally food insecure
Food Insecurity
Minnesota 8.1%Wisconsin 9.7%New Hampshire 10.2%Idaho 10.9%Alaska 11.5%
United States 14.8%
Top 5 StatesArkansas 25.4%
Louisiana 23.6%
Mississippi 22.7%
Tennessee 21.4%
North Carolina 20.1%
United States 14.8%
Bottom 5 States
Data source: The State of Senior Hunger in America 2012: An Annual Report, 2012
For details: http://www.americashealthrankings.org/ALL/food_insecurity_sr
CORE MEASURES
<12.7% 12.7% to <13.3% 13.3% to <14.8% 14.8% to <16.6% >_16.6%
DC
RI
DE
16%
12%
8%
4%
0 2013 2014 2015
ADUL
TS A
GED
60+
, %
Community & Environment: Micro
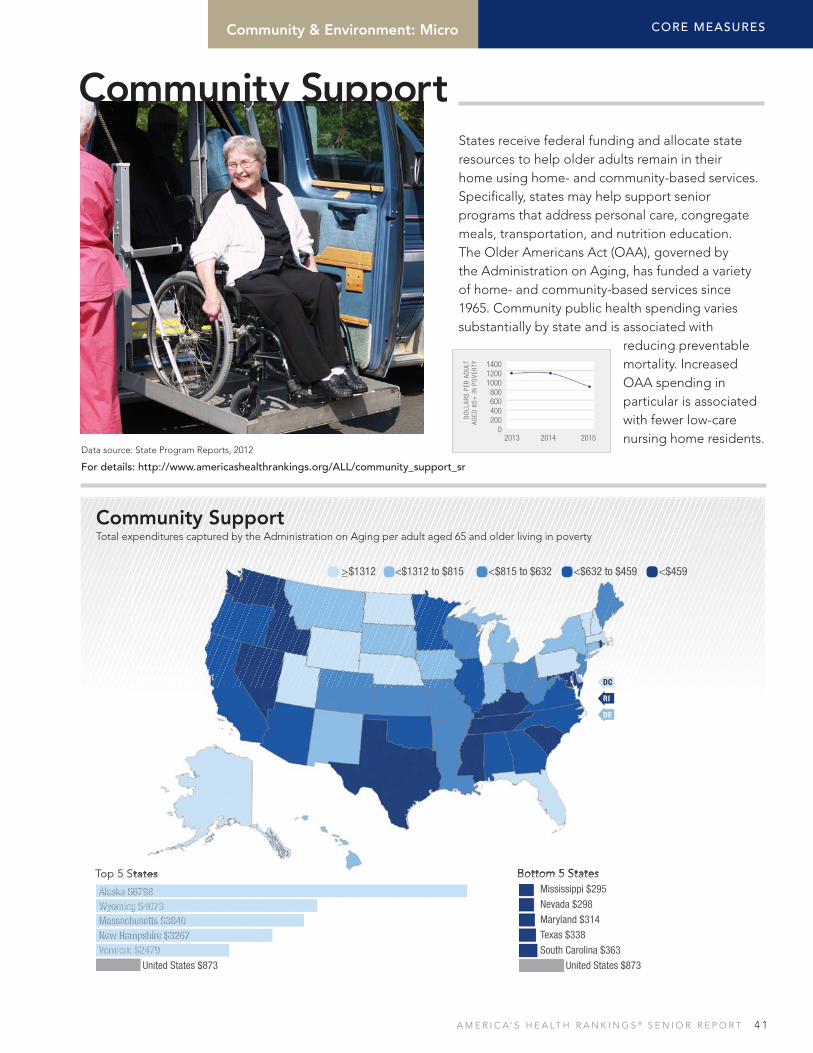
A M E R I C A’ S H E A LT H R A N K I N G S ® S E N I O R R E P O R T 4 1
States receive federal funding and allocate state resources to help older adults remain in their home using home- and community-based services. Specifi cally, states may help support senior programs that address personal care, congregate meals, transportation, and nutrition education. The Older Americans Act (OAA), governed by the Administration on Aging, has funded a variety of home- and community-based services since 1965. Community public health spending varies substantially by state and is associated with
reducing preventable mortality. Increased OAA spending in particular is associated with fewer low-care nursing home residents.
Community SupportTotal expenditures captured by the Administration on Aging per adult aged 65 and older living in poverty
Community Support
Alaska $6798Wyoming $4073Massachusetts $3840New Hampshire $3267Vermont $2479
United States $873
Top 5 StatesMississippi $295
Nevada $298
Maryland $314
Texas $338
South Carolina $363
United States $873
Bottom 5 States
Data source: State Program Reports, 2012
For details: http://www.americashealthrankings.org/ALL/community_support_sr
CORE MEASURES
>_$1312 <$1312 to $815 <$815 to $632 <$632 to $459 <$459
DC
RI
DE
140012001000
800600400200
0 2013 2014 2015
DO
LLA
RS
PER
AD
ULT
A
GED
65+
IN P
OVE
RTY
Community & Environment: Micro

4 2 w w w . a m e r i c a s h e a l t h r a n k i n g s . o r g
Low-care nursing home residents are not likely to require the suite of services provided by nursing homes, and they may be able to live in a less restrictive environment with the aid of community support. Community-based transportation programs, visiting home-health aides, and services such as Meals on Wheels allow older adults to age in place as well as maintain personal freedoms and well-being. Research suggests that state investment in home-delivered meals is associated with fewer low care nursing home residents; and increasing Older Americans Act and
Medicaid funding on home- and community-based services is associated with decreasing prevalence of low-care residents over time.
Low-Care Nursing Home ResidentsPercentage of nursing home residents who were low-care, according to the broad defi nition (no physical assistance required for late-loss activities of daily living)
Maine 1.1%Hawaii 4.7%Utah 5.6%South Carolina 5.7%Pennsylvania 6.0%
United States 12.2%
Top 5 StatesIllinois 26.7%
Oklahoma 25.0%
Louisiana 22.8%
Missouri 21.1%
Wyoming 19.2%
United States 12.2%
Bottom 5 States
Data source: Shaping Long Term Care in America Project, 2010
For details: www.americashealthrankings.org/ALL/low_care_nursing_home_residents_sr
CORE MEASURES Policy
<7.1% 7.1% to <10.3% 10.3% to <12.8% 12.8% to <16.3% >_16.3%
DC
RI
DE
14%
7%
0 2013 2014 2015
RESI
DENT
S, %
Low-Care Nursing Home Residents

A M E R I C A’ S H E A LT H R A N K I N G S ® S E N I O R R E P O R T 4 3
Prescription drug coverage impacts the overall health of older adults by increasing medication adherence and decreasing fi nancial strain. All seniors are eligible for prescription drug coverage through Medicare Part D, but some choose to be insured through an employer or individual insurance plan. Seniors who do not enroll in Medicare Part D when they become eligible may incur a late penalty if they enroll in the future. In 2010, Medicare benefi ciaries spent $4734 out of their own pockets for health care spending, on average, and 11% of that was spent on prescription
drugs. Medicare Part D and private insurance plans vary in cost and coverage by state.
Prescription Drug CoveragePercentage of adults aged 65 and older who have a creditable prescription drug plan
Minnesota 89.6%Iowa 89.3%North Dakota 88.6%South Dakota 88.6%AL, CA, NE, & OH (tie) 88.4%
United States 86.5%
Top 5 States
New Hampshire 78.3%Wisconsin 80.2%Alaska 81.4%Wyoming 81.8%
Washington 82.2%
United States 86.5%
Bottom 5 States
Data source: Kaiser State Health Facts, 2010
For Details: www.americashealthrankings.org/ALL/creditable_drug_coverage_sr
CORE MEASURES
>_87.9% <87.9% to 87.0% <87.0% to 86.2% <86.2% to 84.2% <84.2%
DC
RI
DE
100%
80%
60%
40%
20%
0 2013 2014 2015
AD
ULT
S A
GED
65+
, %
Policy
Prescription Drug Coverage

4 4 w w w . a m e r i c a s h e a l t h r a n k i n g s . o r g
The Supplemental Nutrition Assistance Program (SNAP), administered by the Food and Nutrition Service (FNS), is the largest federal nutrition program, helping millions of low-income people access food. Today, 4 million low-income adults aged 60 and older rely on SNAP to stretch their food budget. On average, senior SNAP benefi ciaries receive $113 per month to help put food on the table. Compared with other demographic groups, older adults who are eligible for SNAP are signifi cantly less likely to participate in the program. FNS works with states to promote SNAP; however, only one-third of eligible
seniors enroll in the program, which may be due to ineffective messaging or outreach to eligible individuals.
SNAP ReachNumber of adults aged 60 and older who participate in SNAP as a percentage of adults aged 60 and older living in poverty
Vermont 136.8%New York 119.9%Oregon 116.2%Rhode Island 112.3%Massachusetts 107.1%
United States 75.2%
Top 5 StatesCalifornia 22.6%
Wyoming 27.7%
North Dakota 41.3%
South Dakota 43.6%
Utah 45.8%
United States 75.2%
Bottom 5 States
Data source: Food and Nutrition Service, 2013
For details: www.americashealthrankings.org/ALL/SNAP_reach
CORE MEASURES
>_92.3% <92.3% to 79.4% <79.4% to 66.4% <66.4% to 56.6% <56.6%
DC
RI
DE
80%
60%
40%
20%
0 2013 2014 2015PA
RTIC
IPAN
TS A
S %
OF
ADUL
TS
AGED
60+
IN P
OVER
TY
Policy
SNAP Reach

A M E R I C A’ S H E A LT H R A N K I N G S ® S E N I O R R E P O R T 4 5
With an aging baby boomer population, the number of geriatricians needed is expected to increase dramatically. Unfortunately, the shortage of geriatricians is growing. Geriatricians are vital to the health of seniors in outpatient and inpatient settings. Compared with older adults who receive standard hospital care, older adults who receive care in special geriatric units function better when discharged. Inpatient rehabilitative services that involve geriatricians result in lower nursing home admissions and improved function at follow-up.
Increasing the number of geriatricians to meet anticipated need should be an important goal for improving senior health.
Geriatrician ShortfallEstimated geriatrician shortfall as a percentage of the minimum number required
Hawaii 25.8%Maryland 39.8%Massachusetts 40.8%New York 41.6%Connecticut 45.7%
United States 65.1%
Top 5 States
Idaho 89.4%Montana 87.8%Oklahoma 86.1%Mississippi 86.0%Tennessee 81.2%United States 65.1%
Bottom 5 States
Data source: American Geriatrics Society, 2015
For details: www.americashealthrankings.org/ALL/geriatrician_shortfall_sr
CORE MEASURES
<53.3% 53.3% to <65.4% 65.4% to <72.0% 72.0% to <76.9% >_76.9%
DC
RI
DE
70%
35%
0
2013 2014 2015
ESTI
MAT
ED G
ERIA
TRIC
IAN
SHO
RTFA
LL,
%
Policy
Geriatrician Shortfall
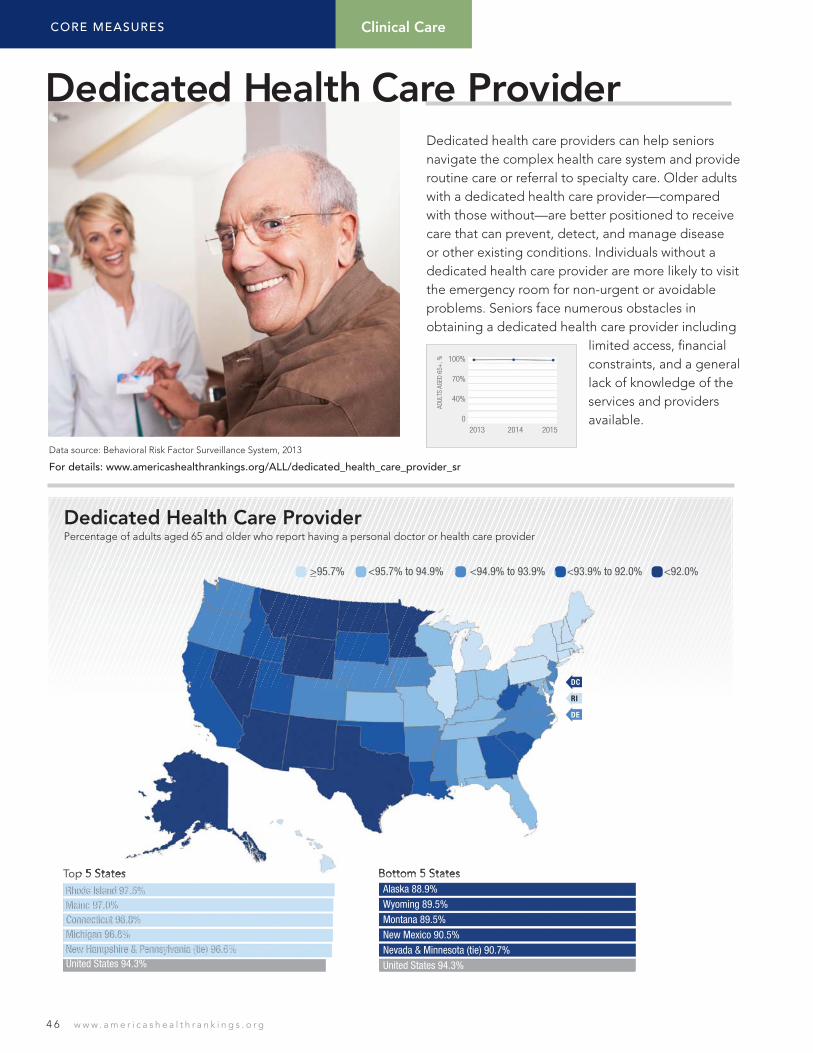
4 6 w w w . a m e r i c a s h e a l t h r a n k i n g s . o r g
Dedicated health care providers can help seniors navigate the complex health care system and provide routine care or referral to specialty care. Older adults with a dedicated health care provider—compared with those without—are better positioned to receive care that can prevent, detect, and manage disease or other existing conditions. Individuals without a dedicated health care provider are more likely to visit the emergency room for non-urgent or avoidable problems. Seniors face numerous obstacles in obtaining a dedicated health care provider including
limited access, fi nancial constraints, and a general lack of knowledge of the services and providers available.
Dedicated Health Care ProviderPercentage of adults aged 65 and older who report having a personal doctor or health care provider
Rhode Island 97.5%Maine 97.0%Connecticut 96.8%Michigan 96.8%New Hampshire & Pennsylvania (tie) 96.6%United States 94.3%
Top 5 StatesAlaska 88.9%
Wyoming 89.5%
Montana 89.5%
New Mexico 90.5%
Nevada & Minnesota (tie) 90.7%
United States 94.3%
Bottom 5 States
100%
70%
40%
0 2013 2014 2015
ADUL
TS A
GED
65+
, %
Data source: Behavioral Risk Factor Surveillance System, 2013
For details: www.americashealthrankings.org/ALL/dedicated_health_care_provider_sr
CORE MEASURES Clinical Care
>_95.7% <95.7% to 94.9% <94.9% to 93.9% <93.9% to 92.0% <92.0%
DC
RI
DE
Dedicated Health Care Provider
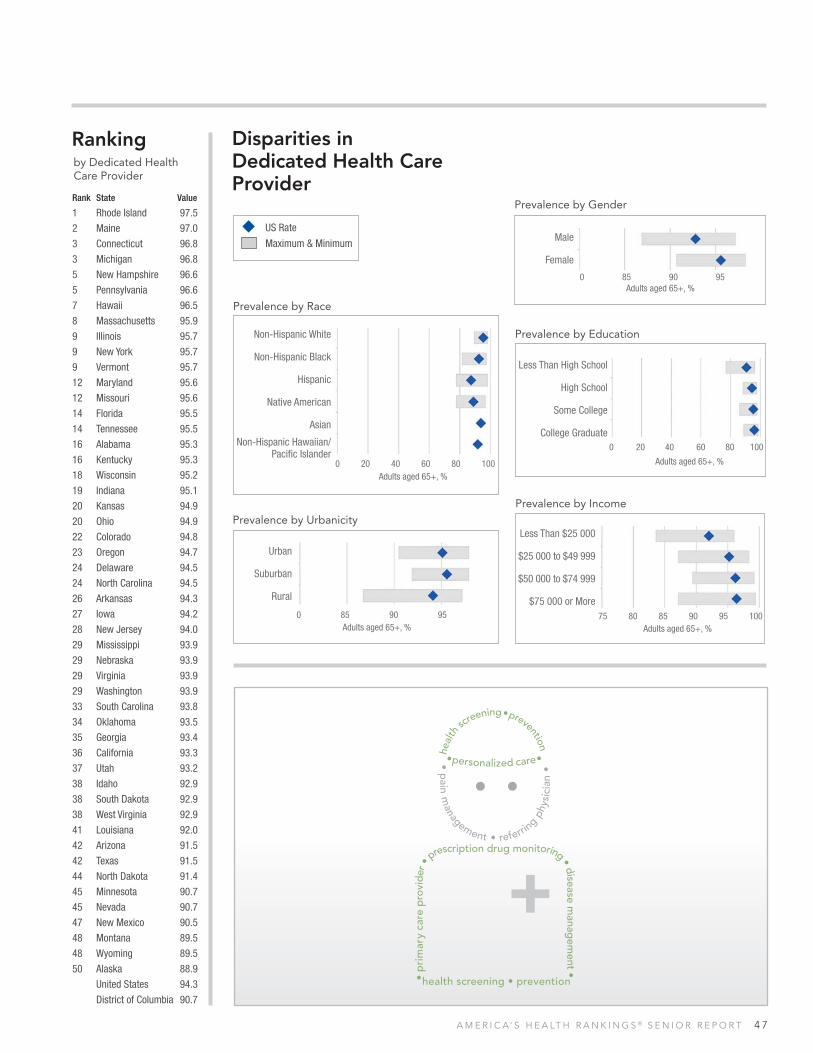
A M E R I C A’ S H E A LT H R A N K I N G S ® S E N I O R R E P O R T 4 7
Disparities in Dedicated Health Care Provider
US Rate
Maximum & Minimum
Ranking
Rank State Value
1 Rhode Island 97.5
2 Maine 97.0
3 Connecticut 96.8
3 Michigan 96.8
5 New Hampshire 96.6
5 Pennsylvania 96.6
7 Hawaii 96.5
8 Massachusetts 95.9
9 Illinois 95.7
9 New York 95.7
9 Vermont 95.7
12 Maryland 95.6
12 Missouri 95.6
14 Florida 95.5
14 Tennessee 95.5
16 Alabama 95.3
16 Kentucky 95.3
18 Wisconsin 95.2
19 Indiana 95.1
20 Kansas 94.9
20 Ohio 94.9
22 Colorado 94.8
23 Oregon 94.7
24 Delaware 94.5
24 North Carolina 94.5
26 Arkansas 94.3
27 Iowa 94.2
28 New Jersey 94.0
29 Mississippi 93.9
29 Nebraska 93.9
29 Virginia 93.9
29 Washington 93.9
33 South Carolina 93.8
34 Oklahoma 93.5
35 Georgia 93.4
36 California 93.3
37 Utah 93.2
38 Idaho 92.9
38 South Dakota 92.9
38 West Virginia 92.9
41 Louisiana 92.0
42 Arizona 91.5
42 Texas 91.5
44 North Dakota 91.4
45 Minnesota 90.7
45 Nevada 90.7
47 New Mexico 90.5
48 Montana 89.5
48 Wyoming 89.5
50 Alaska 88.9
United States 94.3
District of Columbia 90.7
by Dedicated Health Care Provider
Prevalence by Income
Less Than $25 000
$25 000 to $49 999
$50 000 to $74 999
$75 000 or More75 80 85 90 95 100
Adults aged 65+, %
Prevalence by Education
Less Than High School
High School
Some College
College Graduate0 20 40 60 80 100
Adults aged 65+, %
Prevalence by Race
Non-Hispanic White
Non-Hispanic Black
Hispanic
Native American
Asian
Non-Hispanic Hawaiian/ Pacific Islander
Adults aged 65+, %0 20 40 60 80 100
Prevalence by Gender
Male
Female
Adults aged 65+, %0 85 90 95
Prevalence by Urbanicity
Urban
Suburban
Rural
Adults aged 65+, %0 85 90 95
• p
rim
ary
care
pro
vide
r • prescription drug monitoring • disease m
anagem
ent •
health screening • prevention
• pain m
anagement • referrin
g phy
sici
an •
hea
lth
screening • prevention
• personalized care •

4 8 w w w . a m e r i c a s h e a l t h r a n k i n g s . o r g
The fl u vaccine helps protect individuals against seasonal infl uenza virus, a contagious respiratory infection that can cause severe illness in older adults. Seniors are encouraged to receive the vaccine because they are at increased risk of contracting the virus; also, 90% of fl u-related deaths and more than half of hospitalizations for fl u are among older adults. An alternative high-dose shot designed specifi cally for seniors is available. Flu vaccination is a highly cost-effective intervention; vaccination signifi cantly reduces the number of
hospitalizations in adults aged 65 and older. Medicare covers the cost of a single fl u vaccination per year.
Flu VaccinePercentage of adults aged 65 and older who received a fl u vaccine in the last year
Flu Vaccine
West Virginia 73.9%Tennessee 73.4%South Dakota 71.3%North Carolina 70.9%Hawaii 69.9%United States 62.8%
Top 5 StatesNevada 51.6%
Alaska 52.6%
Wisconsin 54.4%
Florida 54.5%
Georgia 54.6%
United States 62.8%
Bottom 5 States
70%
35%
0
2013 2014 2015 A
DULT
S AG
ED 6
5+, %
Data source: Behavioral Risk Factor Surveillance System, 2013
For details: www.americashealthrankings.org/ALL/fl u_vaccine_sr
>_ 66.3% <66.3% to 63.6% <63.6% to 61.0% <61.0% to 57.2% <57.2%
DC
RI
DE
CORE MEASURES Clinical Care

A M E R I C A’ S H E A LT H R A N K I N G S ® S E N I O R R E P O R T 4 9
Disparities in Flu Vaccine
US Rate
Maximum & Minimum
Ranking
Rank State Value
1 West Virginia 73.9
2 Tennessee 73.4
3 South Dakota 71.3
4 North Carolina 70.9
5 Hawaii 69.9
6 Missouri 69.5
7 Oklahoma 68.7
8 Colorado 67.8
9 Iowa 67.4
10 Maryland 66.9
11 Louisiana 66.3
12 Nebraska 66.2
13 Massachusetts 66.1
14 Minnesota 66.0
15 Delaware 65.8
16 Kentucky 65.6
17 South Carolina 65.3
18 Vermont 65.0
19 Kansas 64.8
20 New Hampshire 63.7
21 Connecticut 63.6
22 Maine 63.4
23 Rhode Island 63.1
24 Alabama 62.9
24 Mississippi 62.9
26 Virginia 62.8
27 Ohio 62.6
28 California 62.5
29 New York 62.2
30 Montana 61.1
31 Texas 61.0
32 Washington 60.8
33 Arizona 60.0
34 Pennsylvania 59.4
35 North Dakota 59.0
36 Illinois 58.6
37 Arkansas 58.0
38 Indiana 57.6
39 Utah 57.4
40 New Jersey 57.2
41 Michigan 56.8
42 Idaho 56.6
43 Oregon 56.2
44 Wyoming 55.7
45 New Mexico 55.6
46 Georgia 54.6
47 Florida 54.5
48 Wisconsin 54.4
49 Alaska 52.6
50 Nevada 51.6
United States 62.8
District of Columbia 58.5
by Flu Vaccine
Prevalence by Income
Less Than $25 000
$25 000 to $49 999
$50 000 to $74 999
$75 000 or More0 20 40 60 80
Adults aged 65+, %
Prevalence by Education
Less Than High School
High School
Some College
College Graduate0 20 40 60 80
Adults aged 65+, %
Prevalence by Race
Non-Hispanic White
Non-Hispanic Black
Hispanic
Native American
Asian
Non-Hispanic Hawaiian/ Pacific Islander
Adults aged 65+, %0 20 40 60
Prevalence by Gender
Male
Female
Adults aged 65+, %0 20 40 60
Prevalence by Urbanicity
Urban
Suburban
Rural
Adults aged 65+, %
0 20 40 60 80
• us
ually
pai
nles
s •
• influenza a •• f lu season •• antibodies •
• se
nior
s ar
e m
ore
susc
eptib
le t
o flu
•
• av
aila
ble
eve
ryw
here
• especially important in nursing homes • prevent respiratory illness people with weak immune system • fl u-related ho s pitalizations •
• high-dose trivalent shot •
herd
imm
unity
influ
enza
b
triv
alen
t va
ccin
es
• Medicare -covered •
annu
al v
acci
ne

5 0 w w w . a m e r i c a s h e a l t h r a n k i n g s . o r g
Health screenings detect a disease early when it is most easily treated. The US Preventive Services Task Force recommends screening for breast and colon cancer up to age 75. Colon cancer risk increases with age, and more than half of breast cancer deaths occur in women aged 65 and older. Older adults are also recommended to have regular blood pressure, cholesterol, and diabetes screenings. Additional screenings are recommended for adults with a history of smoking. This measure not only depicts the percentage of older adults receiving
recommended screenings, but also it indicates if routine visits to a health care professional take place.
Health ScreeningsPercentage of adults aged 65 to 74 who have had mammograms and/or fecal occult/colonoscopy/sigmoidoscopy screens within the recommended time period
Health Screenings
Rhode Island 92.4%Massachusetts 91.7%New Hampshire 91.3%Delaware 91.2%Maryland 90.1%United States 86.2%
Top 5 StatesArkansas 78.8%
Wyoming 79.1%
Montana 80.2%
Idaho 80.7%
Oklahoma 81.7%
United States 86.2%
Bottom 5 States
100%
60%
40%
02013 2014 2015
ADU
LTS
AGED
65
TO 7
4, %
Data source: Behavioral Risk Factor Surveillance System, 2012
For details: www.americashealthrankings.org/ALL/health_screenings_sr
>_ 89.2% <89.2% to 86.7% <86.7% to 85.7% <85.7% to 83.7% <83.7%
DC
RI
DE
CORE MEASURES Clinical Care

A M E R I C A’ S H E A LT H R A N K I N G S ® S E N I O R R E P O R T 5 1
Disparities in Health Screenings
US Rate
Maximum & Minimum
Ranking
Rank State Value
1 Rhode Island 92.4
2 Massachusetts 91.7
3 New Hampshire 91.3
4 Delaware 91.2
5 Maryland 90.1
6 Minnesota 89.8
7 Connecticut 89.7
8 Georgia 89.6
9 Wisconsin 89.3
10 California 89.2
10 Vermont 89.2
12 Maine 88.7
13 New York 87.9
13 Virginia 87.9
15 Oregon 87.7
15 Pennsylvania 87.7
17 North Carolina 87.6
18 Michigan 87.2
19 New Jersey 86.8
20 Florida 86.7
20 Louisiana 86.7
22 Kansas 86.6
23 Hawaii 86.5
24 Alabama 86.3
25 Alaska 86.2
25 South Dakota 86.2
27 Missouri 86.1
28 South Carolina 86.0
29 Iowa 85.9
30 Ohio 85.7
31 Tennessee 85.2
32 Arizona 85.1
33 Texas 85.0
34 Washington 84.5
35 Nevada 84.4
36 North Dakota 84.2
37 West Virginia 83.9
38 Colorado 83.8
38 Illinois 83.8
40 Utah 83.7
41 Indiana 83.1
42 Kentucky 82.9
43 Nebraska 82.3
44 Mississippi 82.2
45 New Mexico 81.8
46 Oklahoma 81.7
47 Idaho 80.7
48 Montana 80.2
49 Wyoming 79.1
50 Arkansas 78.8
United States 86.2
District of Columbia 89.4
by Health Screenings
Prevalence by Income
Less Than $25 000
$25 000 to $49 999
$50 000 to $74 999
$75 000 or More
0 20 40 60 80 100Adults aged 65 to 74, %
Prevalence by Education
Less Than High School
High School
Some College
College Graduate0 20 40 60 80 100
Adults aged 65 to 74, %
Prevalence by Race
Non-Hispanic White
Non-Hispanic Black
Hispanic
Native American
Asian
Adults aged 65 to 74, %
0 20 40 60 80 100
Prevalence by Gender
Male
Female
Adults aged 65 to 74, %0 20 40 60 80 100
Prevalence by Urbanicity
Urban
Suburban
Rural
Adults aged 65 to 74, %
0 20 40 60 80
eye exam • m
ental health assessment • regular chec
kups
• c
hole
ster
ol c
heck
• physical exam •
• height and w
eight • diabetes screening • injury prevention • immunizations
•
blood pressure • dental screening • body mass index • regular checkups •
• mam
mo
gra
ph
y • colonoscopy • p
hysical exam •

5 2 w w w . a m e r i c a s h e a l t h r a n k i n g s . o r g
Despite making up only 15% of the population, adults aged 65 and over account for 36% of hospital stays. The conditions assessed in this measure (heart attack, heart failure, pneumonia, and surgical procedure) are part of the Centers for Medicare & Medicaid Service’s quality initiative and were chosen for their validity and general acceptance as markers of quality. The provision of recommended care denotes high quality and can generate cost savings; hospitals with low complication rates tend to spend less per episode than those with high complication
rates, indicating that foregoing proper care can be more costly.
Recommended Hospital CarePercentage of hospitalized patients aged 65 and older who received the recommended care for heart attack, heart failure, pneumonia, and surgical procedures
Maine 98.4%Virginia 97.9%Nebraska 97.5%New Hampshire 97.5%FL, MT, NC, PA & UT (tie) 97.2%United States 96.3%
Top 5 StatesMaryland 89.9%
Mississippi 95.0%
Louisiana 95.2%
Rhode Island 95.4%
Oklahoma & Texas (tie) 95.6%
United States 96.3%
Bottom 5 States
100%
80%
60%
40%
20%
02013 2014 2015
HOSP
ITAL
IZED
PAT
IENT
S AG
ED 6
5+, %
Data source: The Commonwealth Fund, 2013 to 2014
For details: www.americashealthrankings.org/ALL/recommended_hospital_care_sr
>_ 97.1% <97.1% to 96.7% <96.7% to 96.3% <96.3% to 96.1% <96.1%
DC
RI
DE
CORE MEASURES Clinical Care
Recommended Hospital Care

A M E R I C A’ S H E A LT H R A N K I N G S ® S E N I O R R E P O R T 5 3
The risk of diabetes increases with age; 25.9% of adults aged 65 and older have diagnosed and undiagnosed diabetes, compared with 16.2% of adults aged 45 to 64. Diabetes is the seventh-leading cause of death in the United States and contributes to heart disease and stroke. Unmanaged diabetes can lead to infection, eye disease, kidney disease, and nerve disease. Type 2 diabetes is a largely preventable progressive condition that may be managed through lifestyle modifi cations and health care interventions. More than half of health
care costs associated with diabetes are attributable to seniors with an average annual excess cost of $11 825.
Diabetes ManagementPercentage of Medicare benefi ciaries aged 65 to 75 with diabetes receiving a blood lipids test
Florida 86.0%Massachusetts 85.1%Wisconsin 84.2%New York 84.1%Delaware & New Hampshire (tie) 84.0%United States 80.8%
Top 5 StatesWyoming 59.4%
Alaska 67.4%
New Mexico 68.8%
Montana 71.5%
Oklahoma 72.9%
United States 80.8%
Bottom 5 States
90%
60%
30%
02013 2014 2015M
EDIC
ARE
BENE
FICI
ARIE
S W
ITH
DIAB
ETES
AGE
D 65
TO
75, %
Data source: The Dartmouth Atlas of Health Care, 2012
For details: www.americashealthrankings.org/ALL/diabetes_management_sr
>_ 82.5% <82.5% to 81.3% <81.3% to 78.8% <78.8% to 75.2% <75.2%
DC
RI
DE
CORE MEASURESClinical Care
Diabetes Management
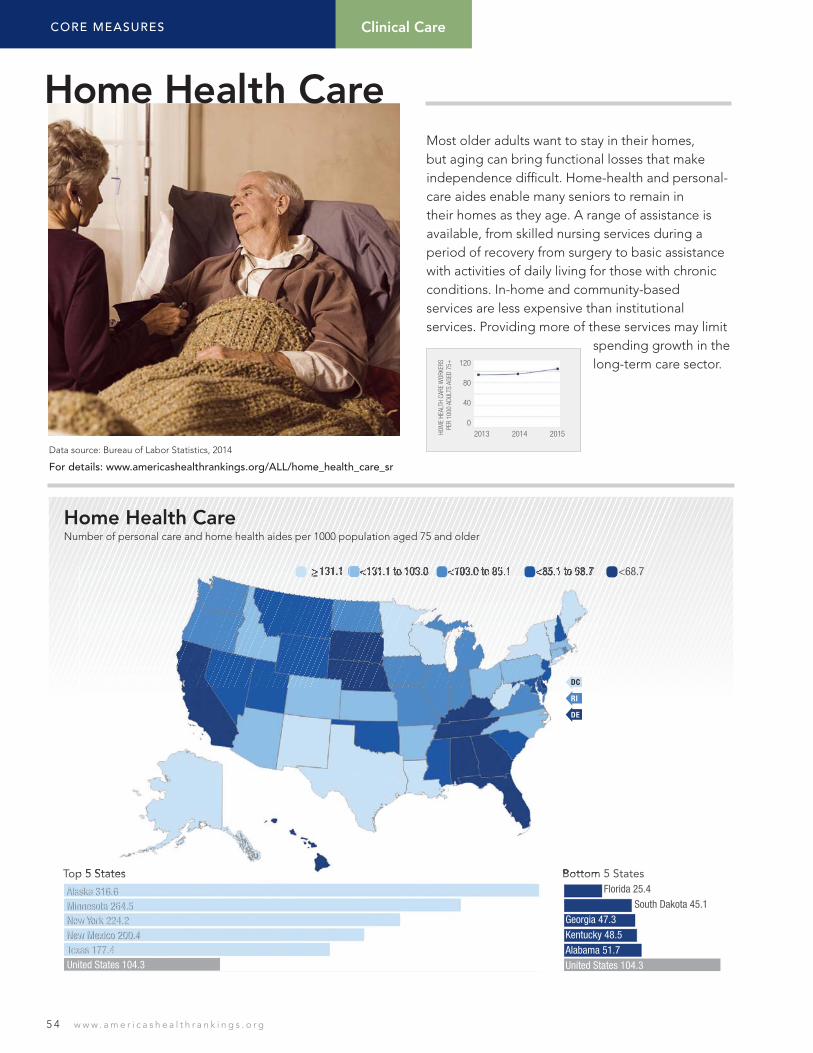
5 4 w w w . a m e r i c a s h e a l t h r a n k i n g s . o r g
Most older adults want to stay in their homes, but aging can bring functional losses that make independence diffi cult. Home-health and personal-care aides enable many seniors to remain in their homes as they age. A range of assistance is available, from skilled nursing services during a period of recovery from surgery to basic assistance with activities of daily living for those with chronic conditions. In-home and community-based services are less expensive than institutional services. Providing more of these services may limit
spending growth in the long-term care sector.
Home Health CareNumber of personal care and home health aides per 1000 population aged 75 and older
Alaska 316.6Minnesota 264.5New York 224.2New Mexico 200.4Texas 177.4United States 104.3
Top 5 States Florida 25.4
South Dakota 45.1
Georgia 47.3
Kentucky 48.5
Alabama 51.7
United States 104.3
Bottom 5 States
120
80
40
02013 2014 2015HO
ME
HEAL
TH C
ARE
WOR
KERS
PE
R 10
00 A
DULT
S AG
ED 7
5+Data source: Bureau of Labor Statistics, 2014
For details: www.americashealthrankings.org/ALL/home_health_care_sr
>_ 131.1 <131.1 to 103.0 <103.0 to 85.1 <85.1 to 68.7 <68.7
DC
RI
DE
CORE MEASURES Clinical Care
Home Health Care
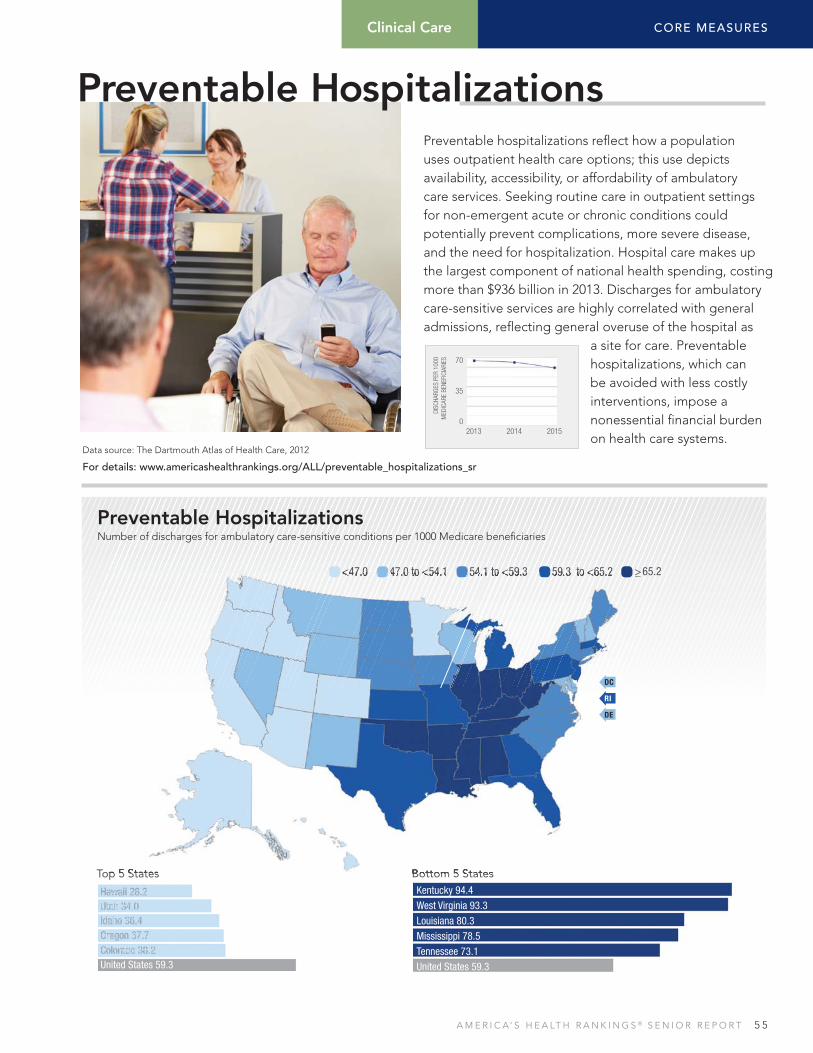
A M E R I C A’ S H E A LT H R A N K I N G S ® S E N I O R R E P O R T 5 5
Preventable hospitalizations refl ect how a population uses outpatient health care options; this use depicts availability, accessibility, or affordability of ambulatory care services. Seeking routine care in outpatient settings for non-emergent acute or chronic conditions could potentially prevent complications, more severe disease, and the need for hospitalization. Hospital care makes up the largest component of national health spending, costing more than $936 billion in 2013. Discharges for ambulatory care-sensitive services are highly correlated with general admissions, refl ecting general overuse of the hospital as
a site for care. Preventable hospitalizations, which can be avoided with less costly interventions, impose a nonessential fi nancial burden on health care systems.
Preventable HospitalizationsNumber of discharges for ambulatory care-sensitive conditions per 1000 Medicare benefi ciaries
Hawaii 28.2Utah 34.0Idaho 36.4Oregon 37.7Colorado 38.2United States 59.3
Top 5 StatesKentucky 94.4
West Virginia 93.3
Louisiana 80.3
Mississippi 78.5
Tennessee 73.1
United States 59.3
Bottom 5 States
70
35
02013 2014 2015
DISC
HARG
ES P
ER 1
000
MED
ICAR
E BE
NEFI
CIAR
IES
Data source: The Dartmouth Atlas of Health Care, 2012
For details: www.americashealthrankings.org/ALL/preventable_hospitalizations_sr
<47.0 47.0 to <54.1 54.1 to <59.3 59.3 to <65.2 >_ 65.2
DC
RI
DE
CORE MEASURESClinical Care
Preventable Hospitalizations
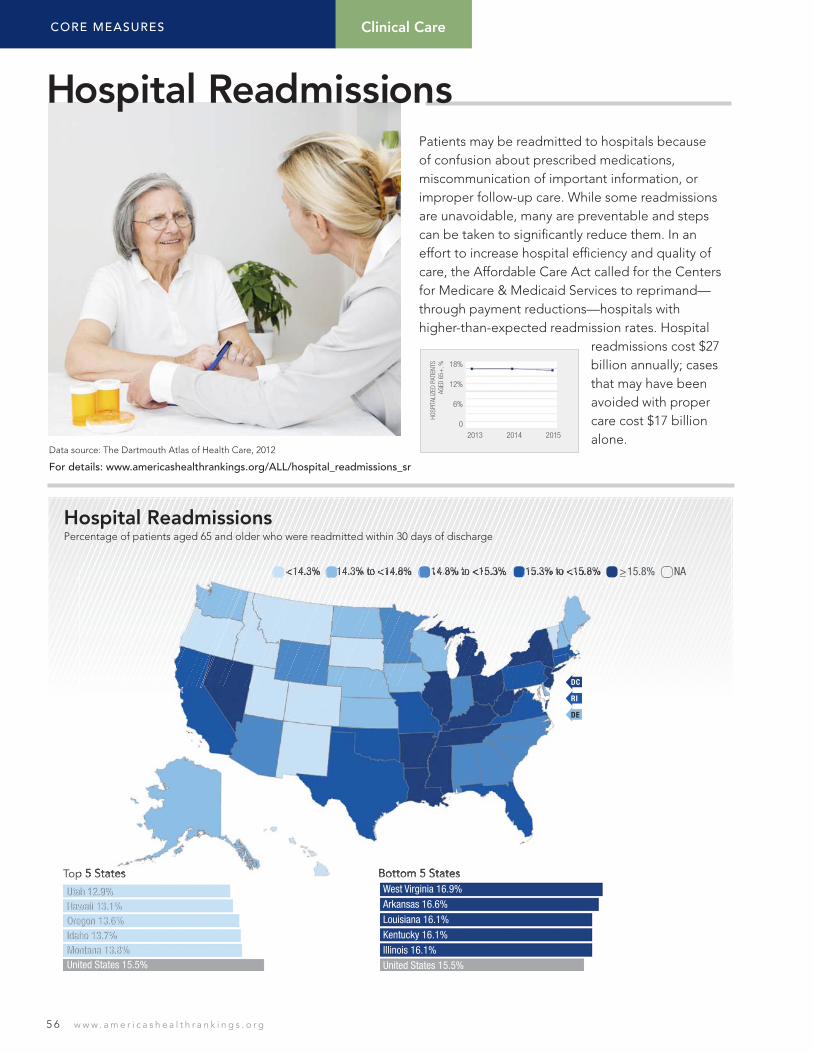
5 6 w w w . a m e r i c a s h e a l t h r a n k i n g s . o r g
Patients may be readmitted to hospitals because of confusion about prescribed medications, miscommunication of important information, or improper follow-up care. While some readmissions are unavoidable, many are preventable and steps can be taken to signifi cantly reduce them. In an effort to increase hospital effi ciency and quality of care, the Affordable Care Act called for the Centers for Medicare & Medicaid Services to reprimand—through payment reductions—hospitals with higher-than-expected readmission rates. Hospital
readmissions cost $27 billion annually; cases that may have been avoided with proper care cost $17 billion alone.
Hospital ReadmissionsPercentage of patients aged 65 and older who were readmitted within 30 days of discharge
Utah 12.9%Hawaii 13.1%Oregon 13.6%Idaho 13.7%Montana 13.8%United States 15.5%
Top 5 StatesWest Virginia 16.9%
Arkansas 16.6%
Louisiana 16.1%
Kentucky 16.1%
Illinois 16.1%
United States 15.5%
Bottom 5 States
18%
12%
6%
02013 2014 2015
HOSP
ITAL
IZED
PAT
IENT
S AG
ED 6
5+, %
Data source: The Dartmouth Atlas of Health Care, 2012
For details: www.americashealthrankings.org/ALL/hospital_readmissions_sr
<14.3% 14.3% to <14.8% 14.8% to <15.3% 15.3% to <15.8% >_ 15.8% NA
DC
RI
DE
CORE MEASURES Clinical Care
Hospital Readmissions

A M E R I C A’ S H E A LT H R A N K I N G S ® S E N I O R R E P O R T 5 7
Hospice care is for terminally-ill patients and emphasizes pain control as well as emotional support for the patient and family. It can be provided in a health care facility or within the patient’s home. In 2012, seniors accounted for 83.4% of hospice patients. The number of individuals receiving this care has recently increased dramatically, in part due to the increase in Medicare-certifi ed hospices. Medicare Part A benefi ts cover certifi ed services for any patient with a prognosis of 6 months or less. There is a
signifi cant disparity in hospice care, with white patients accounting for 82.8% of hospice users in 2011.
Hospice CarePercentage of decedents aged 65 and older who were enrolled in hospice during the last 6 months of life after diagnosis of condition with high probability of death
Arizona 65.4%Utah 64.8%Delaware 62.7%Florida 61.5%Georgia 59.6%United States 50.6%
Top 5 StatesAlaska 24.0%
North Dakota 30.2%
New York 31.7%
Wyoming 31.9%
Vermont 32.2%
United States 50.6%
Bottom 5 States
60%
40%
20%
02013 2014 2015
DECE
DENT
S AG
ED 6
5+, %
Data source: The Dartmouth Atlas of Health Care, 2012
For details: www.americashealthrankings.org/ALL/hospice_care_sr
>_ 56.8% <56.8% to 51.0% <51.0% to 47.3% <47.3% to 44.6% <44.6%
DC
RI
DE
CORE MEASURESClinical Care
Hospice Care

5 8 w w w . a m e r i c a s h e a l t h r a n k i n g s . o r g
Most seniors prefer to die in the comfort of their own home, with free-standing hospice facilities as their second choice. Despite a societal preference for death at home or in a hospice, many seniors spend their last days of life in a hospital. This occurs for various reasons, but in many circumstances it may be avoidable through in-home hospice care, for example. Studies show that patients who lack caregivers are more likely to die in an institution than patients with caregivers. In the past decade, the percentage of older adults dying in hospitals
has declined, though this overall trend varies signifi cantly geographically.
Hospital DeathsPercentage of decedents aged 65 and older who died in a hospital
Utah 15.1%Arizona 15.9%Colorado 17.1%Iowa 17.5%Ohio 18.2%United States 22.8%
Top 5 StatesNew York 32.6%
Hawaii 28.2%
California 27.0%
Alaska 27.0%
New Jersey 26.6%
United States 22.8%
Bottom 5 States
35%
25%
15%
02013 2014 2015
DECE
DENT
S AG
ED 6
5+, %
Data source: The Dartmouth Atlas of Health Care, 2012
For details: www.americashealthrankings.org/ALL/hospital_deaths_sr
<19.5% 19.5% to <21.8% 21.8% to <23.0% 23.0% to <25.3% >_ 25.3%
DC
RI
DE
CORE MEASURES Clinical Care
Hospital Deaths

A M E R I C A’ S H E A LT H R A N K I N G S ® S E N I O R R E P O R T 5 9
Outcomes

6 0 w w w . a m e r i c a s h e a l t h r a n k i n g s . o r g
Overusing the critical care system is costly and often goes against the wishes of dying patients. While not correlated with better outcomes or longer life, intensive care unit (ICU) use is correlated with availability of ICU beds; this could indicate a supply-induced demand. Areas with higher ICU use are high-use areas in other aspects as well, including physician visits and hospitalizations. Because such a high volume of Medicare spending is for care of chronic illness in the last years of life, it is possible to increase both cost savings and patient-preference
satisfaction by decreasing ICU use.
ICU UsePercentage of decedents aged 65 and older spending 7 or more days in the intensive care unit or critical care unit during the last 6 months of life
North Dakota 4.2%Vermont 4.4%Maine 5.5%Idaho 5.9%Oregon 5.9%United States 14.7%
Top 5 StatesNew Jersey 23.5%
Florida 21.7%
Nevada 19.6%
California 19.4%
Illinois 17.4%
United States 14.7%
Bottom 5 States
16%
10%
6%
02013 2014 2015
DECE
DENT
S AG
ED 6
5+, %
Data source: The Dartmouth Atlas of Health Care, 2012
For details: www.americashealthrankings.org/ALL/icu_sr
<8.1% 8.1% to <10.4% 10.4% to <13.9% 13.9% to <15.5% >_ 15.5%
DC
RI
DE
CORE MEASURES Outcomes
ICU Use
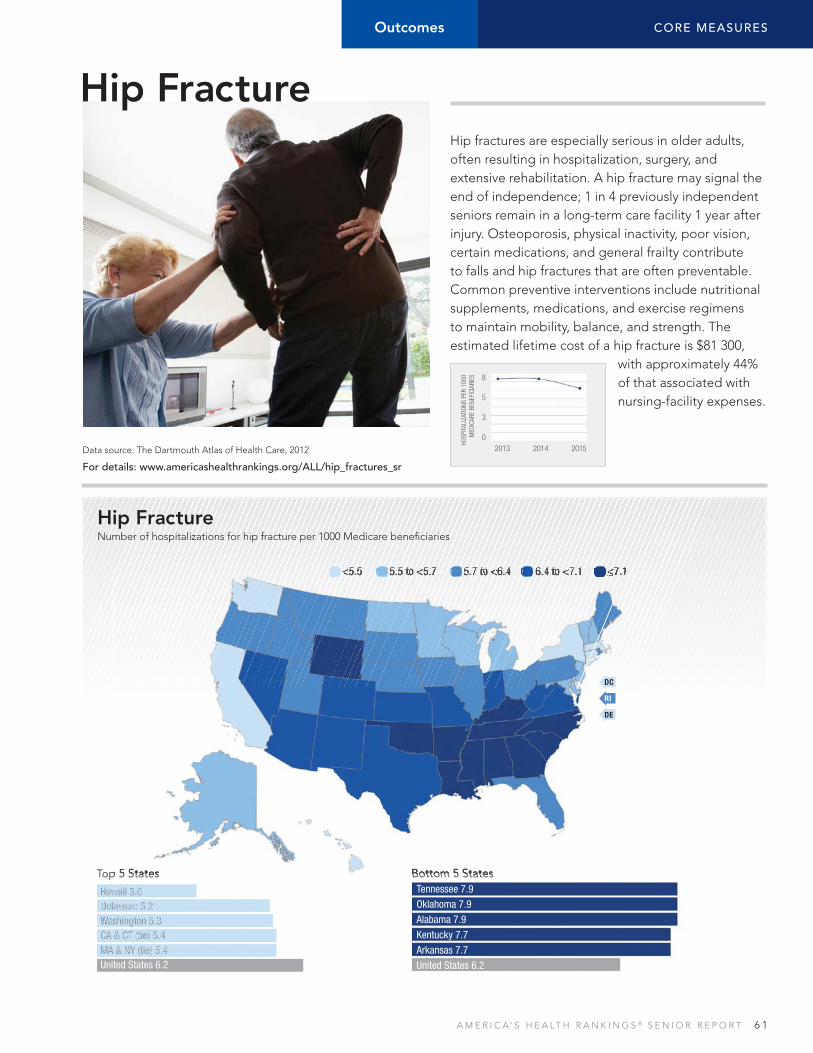
A M E R I C A’ S H E A LT H R A N K I N G S ® S E N I O R R E P O R T 6 1
Hip fractures are especially serious in older adults, often resulting in hospitalization, surgery, and extensive rehabilitation. A hip fracture may signal the end of independence; 1 in 4 previously independent seniors remain in a long-term care facility 1 year after injury. Osteoporosis, physical inactivity, poor vision, certain medications, and general frailty contribute to falls and hip fractures that are often preventable. Common preventive interventions include nutritional supplements, medications, and exercise regimens to maintain mobility, balance, and strength. The estimated lifetime cost of a hip fracture is $81 300,
with approximately 44% of that associated with nursing-facility expenses.
Hip FractureNumber of hospitalizations for hip fracture per 1000 Medicare benefi ciaries
Hawaii 3.0Delaware 5.2Washington 5.3CA & CT (tie) 5.4MA & NY (tie) 5.4United States 6.2
Top 5 StatesTennessee 7.9
Oklahoma 7.9
Alabama 7.9
Kentucky 7.7
Arkansas 7.7
United States 6.2
Bottom 5 States
2013 2014 2015
8
5
3
0
HOSP
ITAL
IZAT
IONS
PER
100
0 M
EDIC
ARE
BENE
FICI
ARIE
S
Data source: The Dartmouth Atlas of Health Care, 2012
For details: www.americashealthrankings.org/ALL/hip_fractures_sr
<5.5 5.5 to <5.7 5.7 to <6.4 6.4 to <7.1 _<7.1
DC
RI
DE
CORE MEASURESOutcomes
Hip Fracture

6 2 w w w . a m e r i c a s h e a l t h r a n k i n g s . o r g
Annually, 1 in 3 adults aged 65 and older fall; 20% to 30% of those incidents result in injuries that affect the ability to engage in daily activities. The risk of falls and their resulting injuries increases with age, making falls particularly problematic for persons over age 75. Falls and injuries can impair quality of life by limiting mobility, which contributes to social isolation and premature death. Medicare bears nearly 80% of fall-related medical expenses, which totaled approximately $34 billion in 2013.
FallsPercentage of adults aged 65 and older who report having had a fall within the last 12 months
Falls
Wisconsin 14.5%Michigan 16.2%Oregon 18.4%Hawaii 21.7%New Jersey 22.3%United States 28.4%
Top 5 StatesAlaska 33.7%
Montana 33.6%
Washington 32.7%
Oklahoma 32.6%
Wyoming 32.1%
United States 28.4%
Bottom 5 States
30%
20%
10%
02013 2014 2015
ADUL
TS A
GED
65+
, %
Data source: Behavioral Risk Factor Surveillance System, 2012
For details: www.americashealthrankings.org/ALL/falls_sr
CORE MEASURES Outcomes
<24.4% 24.4% to <27.4% 27.4% to <29.4% 29.4% to <31.0% >_ 31.0%
DC
RI
DE

A M E R I C A’ S H E A LT H R A N K I N G S ® S E N I O R R E P O R T 6 3
Disparities in Falls
US Rate
Maximum & Minimum
Ranking
Rank State Value
1 Wisconsin 14.5
2 Michigan 16.2
3 Oregon 18.4
4 Hawaii 21.7
5 New Jersey 22.3
6 Maryland 23.4
7 Florida 23.7
7 Nevada 23.7
9 Louisiana 24.1
10 Connecticut 24.4
10 Rhode Island 24.4
12 Delaware 24.9
13 Massachusetts 25.5
14 Minnesota 25.6
14 Pennsylvania 25.6
16 Virginia 26.1
17 Ohio 26.7
18 Arizona 27.1
19 South Carolina 27.2
20 North Carolina 27.3
21 Colorado 27.4
21 West Virginia 27.4
23 South Dakota 27.9
23 Tennessee 27.9
25 North Dakota 28.4
26 Georgia 28.7
26 Illinois 28.7
28 New York 28.8
29 Alabama 29.1
30 Kansas 29.4
31 Maine 29.7
31 Mississippi 29.7
33 New Hampshire 29.9
34 California 30.2
34 Texas 30.2
36 Iowa 30.4
37 Kentucky 30.6
38 Indiana 30.8
39 Utah 30.9
40 Arkansas 31.0
41 Missouri 31.1
42 Nebraska 31.2
43 Idaho 32.0
43 New Mexico 32.0
43 Vermont 32.0
46 Wyoming 32.1
47 Oklahoma 32.6
48 Washington 32.7
49 Montana 33.6
50 Alaska 33.7
United States 28.4
District of Columbia 27.5
by Falls
Prevalence by Income
Less Than $25 000
$25 000 to $49 999
$50 000 to $74 999
$75 000 or More
0 10 20 30 40 Adults aged 65+, %
Prevalence by Education
Less Than High School
High School
Some College
College Graduate0 10 20 30 40
Adults aged 65+, %
Prevalence by Race
Non-Hispanic White
Non-Hispanic Black
Hispanic
Native American
Asian
Non-Hispanic Hawaiian/ Pacific Islander
Adults aged 65+, %0 10 20 30 40
Prevalence by Gender
Male
Female
Adults aged 65+, %0 10 20 30
Prevalence by Urbanicity
Urban
Suburban
Rural
Adults aged 65+, %0 10 20 30 40
• p e rsonal ale
rt sys
tem
s • avoid uneven fl oors • check vision quality
use a
cane
• proper foot wea
r
kee
p fl o
ors p
icked
u
p
get adequat
e ca
lciu
m a
nd v
itam
in d
• u
se a
walk
er •
• use railings • re
view
medication side-effects •
use a wheelchair • take it slow •
exerc
ise
regu
larly • reduce tripp
ing hazards •

6 4 w w w . a m e r i c a s h e a l t h r a n k i n g s . o r g
Poor self-reported health status is associated with higher rates of mortality from all causes, making this a valuable measure of comprehensive health. This measure also detects variations in population well-being that go largely unnoticed in standard measurements of disease burden and mortality. Self-reported health status is a subjective measure that is not limited to certain health conditions or outcomes. Due to the subjective perspective of respondents, this measure may be infl uenced by life experiences
and many other factors indirectly affecting well-being.
Health StatusPercentage of adults aged 65 and older who report their health is very good or excellent
Health Status
New Hampshire 50.2%Colorado 50.1%Vermont 49.9%Maine 48.1%Oregon 47.5%United States 41.8%
Top 5 StatesMississippi 28.4%
West Virginia 29.5%
Alabama 29.5%
Louisiana 31.6%
Tennessee 32.7%
United States 41.8%
Bottom 5 States
45%
30%
15%
02013 2014 2015
ADUL
TS A
GED
65+
, %Data source: Behavioral Risk Factor Surveillance System, 2013
For details: www.americashealthrankings.org/ALL/health_status_sr
CORE MEASURES Outcomes
>_ 45.8% <45.8% to 42.4% <42.4% to 40.0% <40.0% to 36.9% <36.9%
DC
RI
DE

A M E R I C A’ S H E A LT H R A N K I N G S ® S E N I O R R E P O R T 6 5
Disparities in Health Status
US Rate
Maximum & Minimum
Ranking
Rank State Value
1 New Hampshire 50.2
2 Colorado 50.1
3 Vermont 49.9
4 Maine 48.1
5 Oregon 47.5
6 Utah 47.1
7 Arizona 46.5
8 Connecticut 46.0
8 Nevada 46.0
10 Alaska 45.8
11 Massachusetts 45.6
11 Minnesota 45.6
13 California 45.3
14 Idaho 45.0
14 Washington 45.0
16 Nebraska 44.4
17 Delaware 43.9
18 Rhode Island 43.3
19 Wyoming 42.6
20 Maryland 42.4
20 Michigan 42.4
20 Montana 42.4
23 Virginia 42.2
24 Wisconsin 42.1
25 Kansas 41.8
26 Iowa 41.1
26 New Jersey 41.1
28 Florida 40.9
29 New Mexico 40.0
29 South Dakota 40.0
31 Indiana 39.8
32 North Carolina 39.3
33 Pennsylvania 39.1
34 Ohio 38.2
35 Missouri 38.1
36 Illinois 37.8
36 New York 37.8
38 Hawaii 37.0
38 Texas 37.0
40 South Carolina 36.9
41 North Dakota 36.0
42 Oklahoma 35.7
43 Georgia 35.6
44 Kentucky 33.7
45 Arkansas 32.9
46 Tennessee 32.7
47 Louisiana 31.6
48 Alabama 29.5
48 West Virginia 29.5
50 Mississippi 28.4
United States 41.8
District of Columbia 46.3
by Health Status
Prevalence by Income
Less Than $25 000
$25 000 to $49 999
$50 000 to $74 999
$75 000 or More0 10 20 30 40 50 60 70
Adults aged 65+, %
Prevalence by Education
Less Than High School
High School
Some College
College Graduate0 10 20 30 40 50 60
Adults aged 65+, %
Prevalence by Gender
Male
Female
Adults aged 65+, %0 10 20 30 40 50
Prevalence by Urbanicity
Urban
Suburban
Rural
Adults aged 65+, %0 10 20 30 40 50
• annu
al h
ealt
h ex
ams • physically a
ctive
• he
alth
insur
ance
cove
rage • disease m
anagement
• community engagement
social support sys tem • access to hea l t h car
e • h
ealt h
y l i f
esty
le •
• social w
ell-being
•• structural health •• continuous learning
•• g
en
etic m
arkers
•• volunteer • education •• eco
nom
ic status
•
Prevalence by Race
Non-Hispanic White
Non-Hispanic Black
Hispanic
Native American
Asian
Non-Hispanic
Adults aged 65+, %0 10 20 30 40 50
Hawaiian/ Pacific Islander
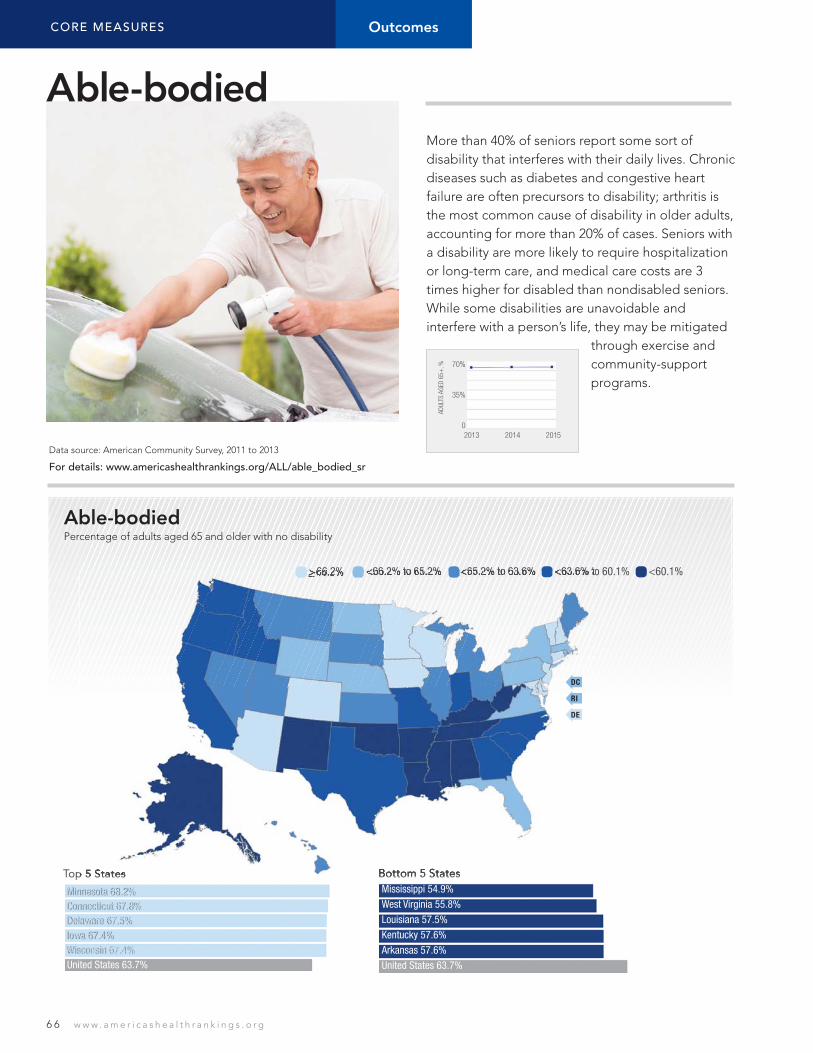
6 6 w w w . a m e r i c a s h e a l t h r a n k i n g s . o r g
More than 40% of seniors report some sort of disability that interferes with their daily lives. Chronic diseases such as diabetes and congestive heart failure are often precursors to disability; arthritis is the most common cause of disability in older adults, accounting for more than 20% of cases. Seniors with a disability are more likely to require hospitalization or long-term care, and medical care costs are 3 times higher for disabled than nondisabled seniors. While some disabilities are unavoidable and interfere with a person’s life, they may be mitigated
through exercise and community-support programs.
Able-bodiedPercentage of adults aged 65 and older with no disability
Minnesota 68.2%Connecticut 67.8%Delaware 67.5%Iowa 67.4%Wisconsin 67.4%United States 63.7%
Top 5 StatesMississippi 54.9%
West Virginia 55.8%
Louisiana 57.5%
Kentucky 57.6%
Arkansas 57.6%
United States 63.7%
Bottom 5 States
70%
35%
02013 2014 2015
ADUL
TS A
GED
65+
, %
Data source: American Community Survey, 2011 to 2013
For details: www.americashealthrankings.org/ALL/able_bodied_sr
>_ 66.2% <66.2% to 65.2% <65.2% to 63.6% <63.6% to 60.1% <60.1%
DC
RI
DE
CORE MEASURES Outcomes
Able-bodied
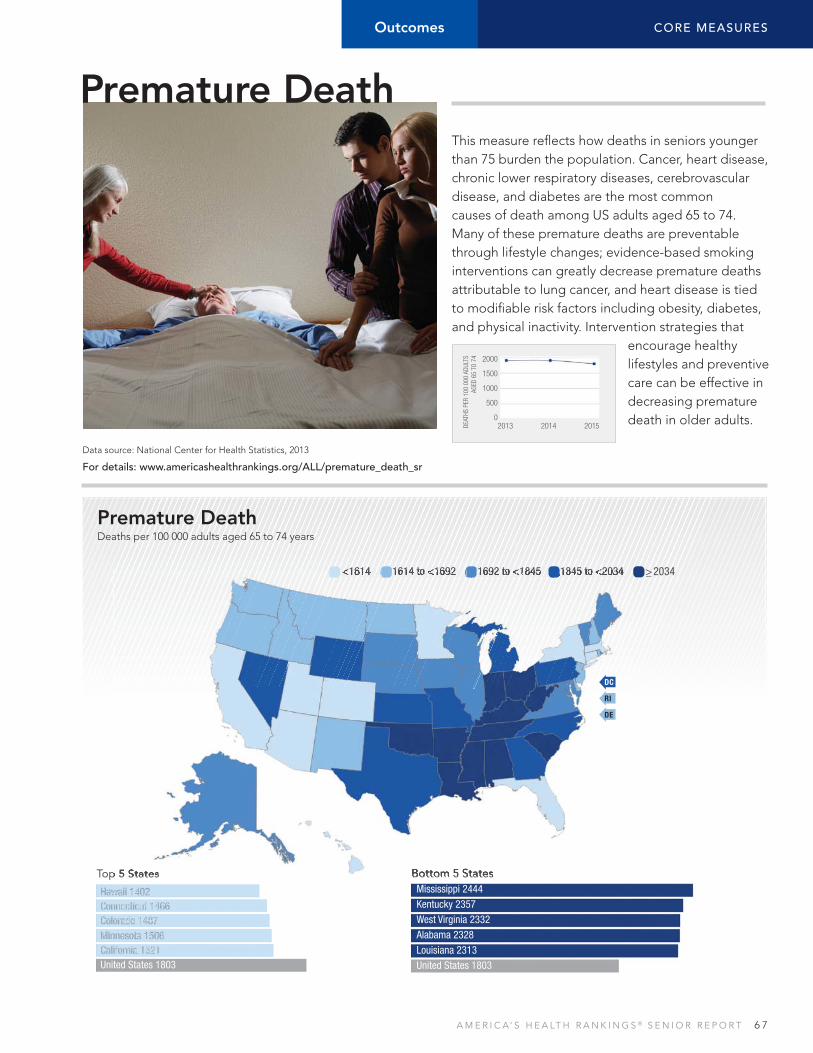
A M E R I C A’ S H E A LT H R A N K I N G S ® S E N I O R R E P O R T 6 7
This measure refl ects how deaths in seniors younger than 75 burden the population. Cancer, heart disease, chronic lower respiratory diseases, cerebrovascular disease, and diabetes are the most common causes of death among US adults aged 65 to 74. Many of these premature deaths are preventable through lifestyle changes; evidence-based smoking interventions can greatly decrease premature deaths attributable to lung cancer, and heart disease is tied to modifi able risk factors including obesity, diabetes, and physical inactivity. Intervention strategies that
encourage healthy lifestyles and preventive care can be effective in decreasing premature death in older adults.
Premature DeathDeaths per 100 000 adults aged 65 to 74 years
Hawaii 1402Connecticut 1466Colorado 1487Minnesota 1506California 1521United States 1803
Top 5 StatesMississippi 2444
Kentucky 2357
West Virginia 2332
Alabama 2328
Louisiana 2313
United States 1803
Bottom 5 States
2000
1500
1000
500
02013 2014 2015DE
ATHS
PER
100
000
ADU
LTS
AGED
65
TO 7
4
Data source: National Center for Health Statistics, 2013
For details: www.americashealthrankings.org/ALL/premature_death_sr
<1614 1614 to <1692 1692 to <1845 1845 to <2034 >_ 2034
DC
RI
DE
CORE MEASURESOutcomes
Premature Death

6 8 w w w . a m e r i c a s h e a l t h r a n k i n g s . o r g
Dental caries and periodontal disease are the most common causes of teeth extraction. Preventable risk factors include poor diet and tobacco use. Absence of natural teeth affects nutrition; dentures are less effi cient for chewing than are natural teeth, so people using dentures may choose foods softer than fruits and vegetables. Also, tooth loss may negatively impact social interactions and general quality of life for older adults. The percentage of seniors without natural teeth is decreasing, likely due to improved access to oral health care, public
water-fl uoridation programs, and reduced smoking rates.
Teeth ExtractionsPercentage of adults aged 65 and older who have had all teeth removed due to tooth decay or gum disease
Hawaii 7.0%California 8.7%Washington 10.9%Minnesota 12.0%Colorado 12.4%United States 16.1%
Top 5 StatesWest Virginia 33.7%
Louisiana 28.7%
Mississippi 25.0%
Missouri 24.9%
Tennessee 24.8%
United States 16.1%
Bottom 5 States
Data source: Behavioral Risk Factor Surveillance System, 2012
For details: www.americashealthrankings.org/ALL/teeth_extractions_sr
CORE MEASURES Outcomes
<3.9% 3.9% to <4.9% 4.9% to <5.7% 5.7% to <7.1% >_ 7.1%
DC
RI
DE
18%
12%
6%
02013 2014 2015
ADUL
TS A
GED
65+
, %
Teeth Extractions

A M E R I C A’ S H E A LT H R A N K I N G S ® S E N I O R R E P O R T 6 9
Disparities in Teeth Extractions
US Rate
Maximum & Minimum
Ranking
Rank State Value
1 Hawaii 7.0
2 California 8.7
3 Washington 10.9
4 Minnesota 12.0
5 Colorado 12.4
6 Rhode Island 12.5
7 Utah 12.9
8 New Hampshire 13.1
9 Arizona 13.3
9 Michigan 13.3
11 Nebraska 13.4
11 Texas 13.4
13 Wisconsin 13.5
14 Connecticut 13.6
15 New Jersey 13.9
16 Maryland 14.5
17 Oregon 15.0
18 Nevada 15.1
18 New York 15.1
20 Massachusetts 15.5
21 Alaska 15.6
22 Florida 15.8
23 Idaho 16.1
23 Illinois 16.1
23 Virginia 16.1
26 New Mexico 16.2
27 Delaware 16.9
28 North Dakota 17.1
29 Iowa 17.3
30 Vermont 17.5
31 Wyoming 17.7
32 Montana 18.1
33 Pennsylvania 18.2
34 Georgia 18.4
35 Kansas 18.8
36 South Dakota 19.4
37 South Carolina 19.5
38 Indiana 19.7
39 Ohio 20.3
40 North Carolina 21.0
40 Oklahoma 21.0
42 Maine 22.1
43 Alabama 23.6
44 Arkansas 23.7
45 Kentucky 24.7
46 Tennessee 24.8
47 Missouri 24.9
48 Mississippi 25.0
49 Louisiana 28.7
50 West Virginia 33.7
United States 16.1
District of Columbia 13.1
by Teeth Extractions
Prevalence by Income
Less Than $25 000
$25 000 to $49 999
$50 000 to $74 999
$75 000 or More
0 10 20 30 40Adults aged 65+, %
Prevalence by Education
Less Than High School
High School
Some College
College Graduate0 10 20 30 40 50
Adults aged 65+, %
Prevalence by Race
Non-Hispanic White
Non-Hispanic Black
Hispanic
Native American
Asian
Non-Hispanic Hawaiian/ Pacific Islander
Adults aged 65+, %
0 10 20 30
Prevalence by Gender
Male
Female
Adults aged 65+, %0 10 20 30
Prevalence by Urbanicity
Urban
Suburban
Rural
Adults aged 65+, %0 10 20 30
gum
dis
ease
• tr
eat
infe
ctio
n •
adva
nced tooth decay • don’t chew on hard objects • rem
ove broken tooth •
• do not sm
oke • eat so f t f oo
ds
• av
oid
gri
ndin
g your teeth • perio
do
ntal dise a s e •
rou
tine
den
tal e
xam
s

7 0 w w w . a m e r i c a s h e a l t h r a n k i n g s . o r g
Poor mental health days provide a general indication of health-related quality of life, mental distress, and the burden that serious mental illnesses place on older adults. Also, poor mental health days forecast future health, as this measure predicts 1-month and 12-month offi ce visits and hospitalizations. Occasional short periods of mental distress may be unavoidable, and yet many seniors experience mental health issues such as anxiety, cognitive impairment, bipolar disorder, and depression. That said, prolonged and serious
episodes are often treatable and may be prevented with early interventions and quality care.
Poor Mental Health DaysNumber of days in the previous 30 that adults aged 65 and older indicate their activities were limited due to mental health diffi culties
Minnesota 1.3Wisconsin 1.4South Dakota 1.5Iowa 1.7New Hampshire 1.7United States 2.2
Top 5 StatesKentucky 2.9
California 2.9
Alabama 2.9
Oklahoma 2.7
Arkansas 2.7
United States 2.2
Bottom 5 States
Data source: Behavioral Risk Factor Surveillance System, 2013
For details: www.americashealthrankings.org/ALL/mental_health_days_sr
CORE MEASURES Outcomes
<1.9 1.9 to <2.2 2.2 to <2.3 2.3 to <2.5 >_ 2.5
DC
RI
DE
3
2
1
02013 2014 2015
DAYS
IN P
REVI
OUS
30
Poor Mental Health Days

A M E R I C A’ S H E A LT H R A N K I N G S ® S E N I O R R E P O R T 7 1
Disparities in Poor Mental Health Days
US Rate
Maximum & Minimum
Ranking
Rank State Value
1 Minnesota 1.3
2 Wisconsin 1.4
3 South Dakota 1.5
4 Iowa 1.7
4 New Hampshire 1.7
6 Kansas 1.8
6 North Dakota 1.8
6 Wyoming 1.8
9 Colorado 1.9
9 Nebraska 1.9
9 Texas 1.9
9 Vermont 1.9
13 Hawaii 2.0
13 Maine 2.0
13 Montana 2.0
16 Arizona 2.1
16 Connecticut 2.1
16 Maryland 2.1
16 Ohio 2.1
16 Rhode Island 2.1
21 Georgia 2.2
21 Michigan 2.2
21 Missouri 2.2
21 New Mexico 2.2
21 Utah 2.2
21 Washington 2.2
27 Indiana 2.3
27 Massachusetts 2.3
27 Nevada 2.3
27 North Carolina 2.3
27 Tennessee 2.3
27 Virginia 2.3
33 Alaska 2.4
33 Delaware 2.4
33 New Jersey 2.4
36 Idaho 2.5
36 Louisiana 2.5
36 Mississippi 2.5
36 New York 2.5
36 Pennsylvania 2.5
41 Florida 2.6
41 Illinois 2.6
41 Oregon 2.6
41 South Carolina 2.6
41 West Virginia 2.6
46 Arkansas 2.7
46 Oklahoma 2.7
48 Alabama 2.9
48 California 2.9
48 Kentucky 2.9
United States 2.2
District of Columbia 2.4
by Poor Mental Health Days
Prevalence by Income
Less Than $25 000
$25 000 to $49 999
$50 000 to $74 999
$75 000 or More
0 1 2 3 4 Adults aged 65+, %
Prevalence by Race
Adults aged 65+, %0 2 4 6
Non-Hispanic White
Non-Hispanic Black
Hispanic
Native American
Asian
Non-Hispanic Hawaiian/ Pacific Islander
Prevalence by Gender
Male
Female
Adults aged 65+, %0 1 2 3
Prevalence by Urbanicity
Urban
Suburban
Rural
Adults aged 65+, %0 1 2 3
• • • • •
• • • • • • • • •
• •
• •
•
• •••
•
•••••
• •
• •
• •
• •
• •
• •
• •
• •
• •
• • •
• • • • • • • • • • • • • • • • • • • • • • • • • • • • • • • • • • • • • • • • • • • • • • • • • • • • • • • • • • • • •
build a support system •
identify stress triggers • peer support relationships • hope •
suicide prevention line • set goals •know warning signs • raise awareness•
recognize signs • talk about issues • listen • early treatment • destigmatize • ask for
help • understanding • medication • therapy • manage stress • recovery plan •
Prevalence by Education
0 1 2 3 4 5
Adults aged 65+, %
Less Than High School
High School
Some College
College Graduate

Supplemental Measures

SUPPLEMENTAL MEASURES
A M E R I C A’ S H E A LT H R A N K I N G S ® S E N I O R R E P O R T 7 3
BehaviorsEducationEducation fosters health; it enables people to learn about, create, and maintain a healthy lifestyle. Education is also a strong predictor of life expectancy as well as overall well-being. Individuals with more education are more likely to have higher incomes, health insurance coverage, and increased access to
_>27.3%
<27.3% to 24.2%
<24.2% to 21.6%
< 21.6% to 18.5%
<18.5%
Percentage of adults aged 65 and older with a college degree
health care. Increasing educational attainment has been shown to improve the health status of the population as a whole; each additional year of education is associated with an increase in health-promoting behaviors. Investments in education in early life can have signifi cant long-term impacts on health.
DC
RI
DE
Data source: American Community Survey, 2011 to 2013
For details: www.americashealthrankings.org/ALL/education_sr
25%
20%
15%
10%
5%
0 2013 2014 2015
ADUL
TS A
GED
65+
, %
Policy
With Medicare Part D, typical prescription drug coverage includes a “coverage gap” or “donut hole” where the insured pays a share of total costs. The coverage gap begins once an out-of-pocket threshold—$2960 in 2015—is spent; it ends when a maximum spending limit is reached. In the coverage gap, benefi ciaries pay a higher portion of drug costs than
Data source: Kaiser State Health Facts, 2014
For details: www.americashealthrankings.org/ALL/drug_plan_with_gap
Percentage of Medicare prescription drug plans with a payment gap (“donut hole”)
the copayment or coinsurance paid below the coverage gap. Typically, coinsurance requires paying 25% of costs, versus 45% in the coverage gap. The Affordable Care Act instituted policies that will shrink the coverage gap until it disappears in 2020.
Prescription Drug Plan With Gap
DC
RI
DE
90%
60%
30%
0
2013 2014 2015
<75.8%
75.8% to <77.4%
77.4% to <78.1%
78.1% to <80.0%
_>80.0%
MED
ICAR
E PL
ANS
WIT
H A
GAP
, %

SUPPLEMENTAL MEASURES
7 4 w w w . a m e r i c a s h e a l t h r a n k i n g s . o r g
Outcomes
More than 16 million US individuals have cognitive impairment (CI). Mild CI, marked by memory decline, affects nearly 25% of seniors living at home. Alzheimer’s disease, a severe form of CI, affects nearly 5.1 million adults nationwide. Age is the greatest risk factor, and with the growing baby boomer population, demand
< 7.7%
7.7% to <8.4%
8.4% to <9.2%
9.2% to < 10.8%
_>10.8%
Percentage of adults aged 65 and older who report having a cognitive diffi culty
Cognition
DC
RI
DE
Data source: American Community Survey, 2011 to 2013
For details: www.americashealthrankings.org/ALL/cognition_sr
is soaring for support services related to cognitive issues. Cognitive impairment carries a large cost as individuals with CI have 3 times as many hospitalizations compared with those without. Evidence suggests that keeping intellectually engaged and physically active promote successful cognitive aging.
10%
8%
6%
4%
2%
0 2013 2014 2015
ADUL
TS A
GED
65+
, %
Outcomes
Chronic conditions negatively impact daily functioning and contribute to an increased mortality risk. More than 2 in 3 adults aged 65 and older have 2 or more chronic conditions. Roughly two-thirds of all Medicare spending is for persons with more than 5 chronic conditions. Adults aged 65 and older with 3 or more multiple chronic conditions, when compared
Percentage of Medicare benefi ciaries aged 65 and older with 4 or more chronic conditions (2015 defi nition)
with those with none, spend $35 000 more on medical care over a lifetime—and their lives are 5.3 years shorter. Many common chronic conditions are largely preventable. Tobacco use, diet, exercise, and alcohol consumption are modifi able behaviors that are major factors contributing signifi cantly to multiple chronic conditions.
Multiple Chronic Conditions
DC
RI
DE
Data source: Centers for Medicare & Medicaid Services, 2012
For details: www.americashealthrankings.org/ALL/
multiple_chronic_conditions_sr
40%
30%
20%
10%
0
2013 2014 2015MED
ICA
RE
BEN
EFIC
IAR
IES
AG
ED 6
5+,
%
<29.4%
29.4% to <33.8%
33.8% to <37.6%
37.6% to <40.2%
_>40.2%
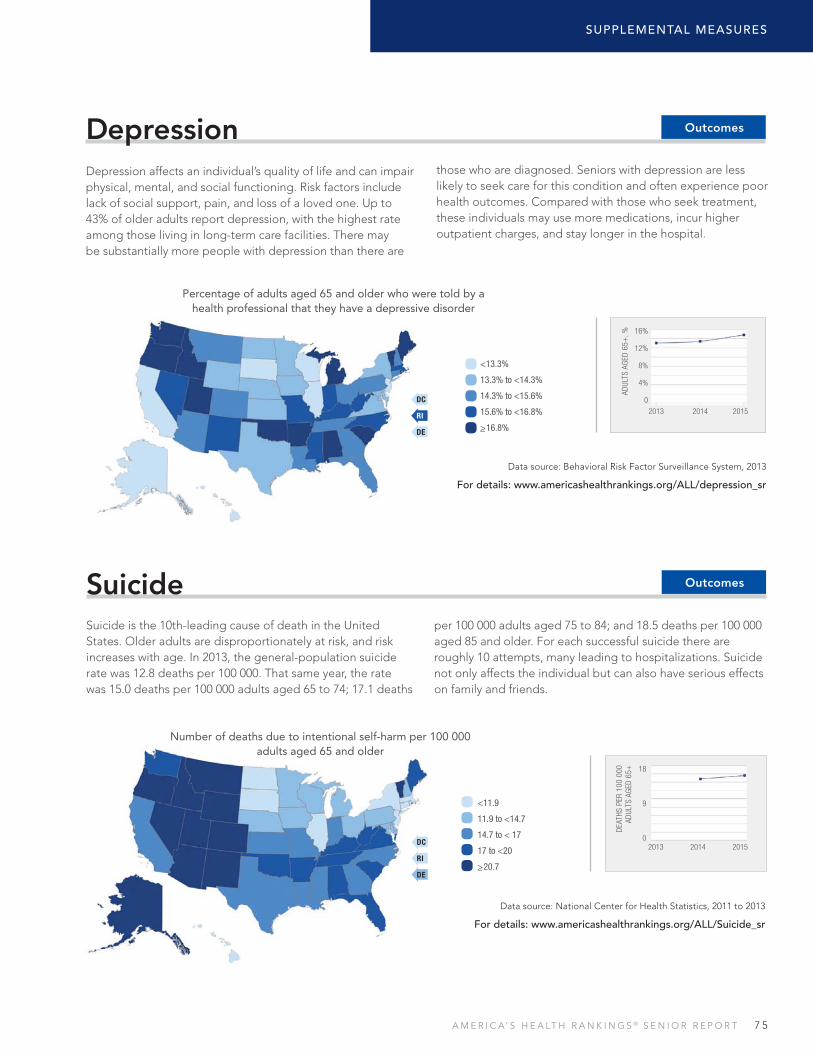
SUPPLEMENTAL MEASURES
A M E R I C A’ S H E A LT H R A N K I N G S ® S E N I O R R E P O R T 7 5
Outcomes
Depression affects an individual’s quality of life and can impair physical, mental, and social functioning. Risk factors include lack of social support, pain, and loss of a loved one. Up to 43% of older adults report depression, with the highest rate among those living in long-term care facilities. There may be substantially more people with depression than there are
<13.3%
13.3% to <14.3%
14.3% to <15.6%
15.6% to <16.8%
_>16.8%
Percentage of adults aged 65 and older who were told by a health professional that they have a depressive disorder
those who are diagnosed. Seniors with depression are less likely to seek care for this condition and often experience poor health outcomes. Compared with those who seek treatment, these individuals may use more medications, incur higher outpatient charges, and stay longer in the hospital.
Depression
DC
RI
DE
Data source: Behavioral Risk Factor Surveillance System, 2013
For details: www.americashealthrankings.org/ALL/depression_sr
16%
12%
8%
4%
02013 2014 2015
ADUL
TS A
GED
65+
, %
OutcomesSuicideSuicide is the 10th-leading cause of death in the United States. Older adults are disproportionately at risk, and risk increases with age. In 2013, the general-population suicide rate was 12.8 deaths per 100 000. That same year, the rate was 15.0 deaths per 100 000 adults aged 65 to 74; 17.1 deaths
<11.9
11.9 to <14.7
14.7 to < 17
17 to <20
_>20.7
Number of deaths due to intentional self-harm per 100 000 adults aged 65 and older
per 100 000 adults aged 75 to 84; and 18.5 deaths per 100 000 aged 85 and older. For each successful suicide there are roughly 10 attempts, many leading to hospitalizations. Suicide not only affects the individual but can also have serious effects on family and friends.
DC
RI
DE
Data source: National Center for Health Statistics, 2011 to 2013
For details: www.americashealthrankings.org/ALL/Suicide_sr
18
9
0 2013 2014 2015
DEA
THS
PER
100
000
ADUL
TS A
GED
65+

State Summaries

77
U N I T E D H E A LT H F O U N D AT I O N | A M E R I C A’ S H E A LT H R A N K I N G S ® S E N I O R R E P O RT 2 0 15
Projected Increase 2015 to 2030 Senior Population Growth State US
Behaviors Smoking (% of adults aged 65+)
Chronic Drinking (% of adults aged 65+) Obesity (% of adults aged 65+) Underweight (% of adults aged 65+ in fair or better health) Physical Inactivity (% of adults aged 65+ in fair or better health)
Dental Visit (% of adults aged 65+)Pain Management (% of adults aged 65+ with joint pain)
Behaviors Total
Community & EnvironmentPoverty (% of adults aged 65+)
Volunteerism (% of adults aged 65+)Nursing Home Quality (% of 4- & 5-star beds)
Community & Environment—Macro Total Home-Delivered Meals (participants as % of adults aged 65+ in poverty) Food Insecurity (% of adults aged 60+) Community Support (dollars per adult aged 65+ in poverty)
Community & Environment—Micro TotalCommunity & Environment Total
Policy Low-Care Nursing Home Residents (% of residents) SNAP Reach (participants as % of adults aged 60+ in poverty)
Prescription Drug Coverage (% of adults aged 65+) Geriatrician Shortfall (% of needed geriatricians)
Policy Total
Clinical CareDedicated Health Care Provider (% of adults aged 65+)
Flu Vaccine (% of adults aged 65+) Health Screenings (% of adults aged 65 to 74)
Recommended Hospital Care (% of hospitalized patients aged 65+)Diabetes Management (% of Medicare beneficiaries)
Home Health Care (number of workers per 1000 adults aged 75+)Preventable Hospitalizations (discharges per 1000 Medicare beneficiaries)
Hospital Readmissions (% of hospitalized patients aged 65+)Hospice Care (% of decedents aged 65+)
Hospital Deaths (% of decedents aged 65+)Clinical Care Total
All Determinants
OutcomesICU Use (% of decedents aged 65+)
Falls (% of adults aged 65+) Hip Fractures (hospitalizations per 1000 Medicare beneficiaries)
Health Status (very good or excellent as % of adults aged 65+)Able-bodied (% of adults aged 65+)
Premature Death (deaths per 100 000 adults aged 65 to 74)Teeth Extractions (% of adults aged 65+)
Poor Mental Health Days (days in previous 30) All Outcomes Overall
2015 No. 1 Value Rank State
Supplemental MeasuresEducation (% of adults aged 65+)
Multiple Chronic Conditions (% of Medicare beneficiaries aged 65+)Cognition (% of adults aged 65+)
Depression (% of adults aged 65+)Suicide (deaths per 100 000 adults aged 65+)
2015 No. 1 Value Rank State
OverallRank: 42Change: 2Determinants Rank: 36Outcomes Rank: 49
Strengths:• Low prevalence of chronic drinking• Low prevalence of activity-limiting
arthritis pain• High prescription drug coverage
Challenges: • Low percentage of dental visit • Low health status• High premature death rate
Highlights: • In the past year, chronic drinking
decreased 27% from 2.6% to 1.9% of adults aged 65 and older.
• In the past year, physical inactivity increased 22% from 28.6% to 34.9% of adults aged 65 and older.
• In the past year, volunteerism increased 13% from 21.1% to 23.8% of adults aged 65 and older.
• In the past year, food insecurity decreased 14% from 20.3% to 17.5% of adults aged 60 and older.
• In the past year, recommended hospital care decreased 3% from 98.6% to 95.8% of hospitalized patients aged 65 and older.
Ranking:Alabama ranks 42nd in America’s Health Rankings® Senior Report; it was 44th last year. In the 2014 America’s Health Rankings® (all ages), the state ranks 43rd.
State DOH Website: www.adph.org
8.91.9
28.41.7
34.956.750.3
0.016
10.623.846.6
-0.01717.317.5$513
-0.041-0.058
14.569.888.481.1
-0.038
95.362.986.395.880.751.771.515.053.325.7
-0.026-0.106
14.229.17.9
29.557.7232823.62.9
-0.343-0.449
18.539.811.618.918.0
4039464933
40.5 52.7
32.522.46.58.77.1
263
353036445
23
433418333543354135
35275
4532
162424432346432316453736
33294848454743484942
4.21.5
16.10.9
22.877.253.2
5.142.657.9
108.18.1
$6798
1.1
136.889.625.8
97.573.992.498.486.0
316.628.212.965.415.1
4.2
14.53.0
50.268.214027.01.3
AL
AB
AM
A
Alabama
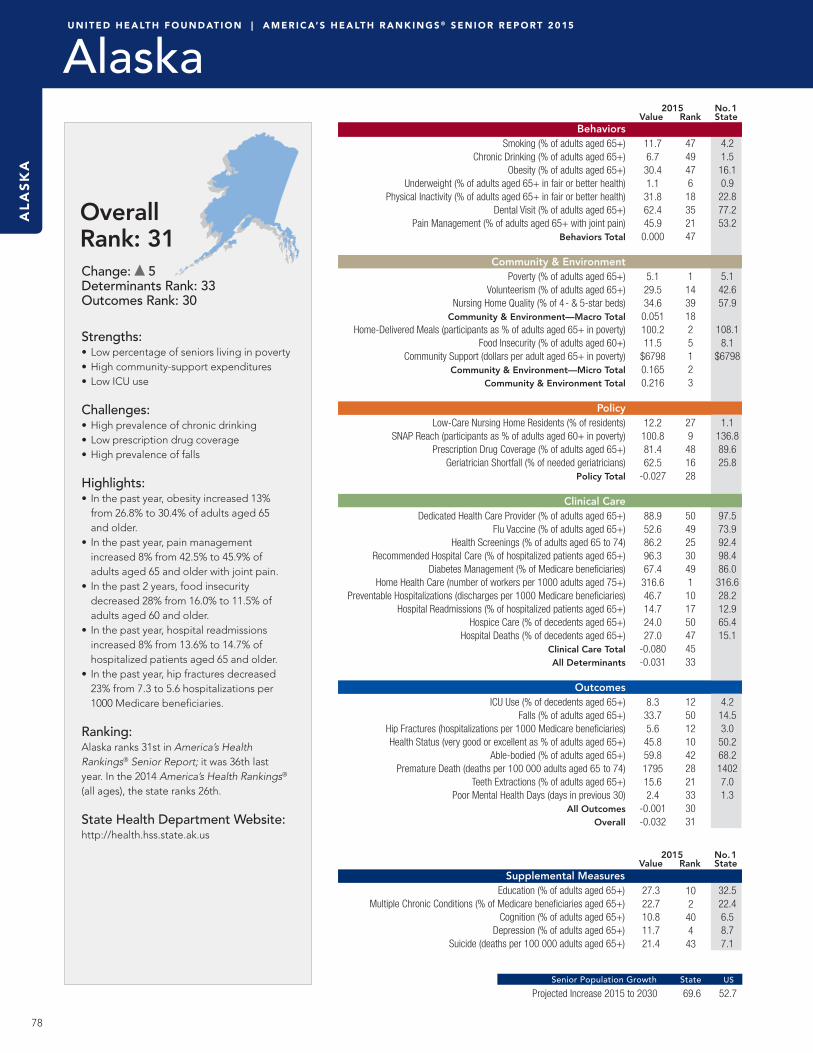
78
U N I T E D H E A LT H F O U N D AT I O N | A M E R I C A’ S H E A LT H R A N K I N G S ® S E N I O R R E P O RT 2 0 15
Projected Increase 2015 to 2030 Senior Population Growth State US
Behaviors Smoking (% of adults aged 65+)
Chronic Drinking (% of adults aged 65+) Obesity (% of adults aged 65+) Underweight (% of adults aged 65+ in fair or better health) Physical Inactivity (% of adults aged 65+ in fair or better health)
Dental Visit (% of adults aged 65+)Pain Management (% of adults aged 65+ with joint pain)
Behaviors Total
Community & EnvironmentPoverty (% of adults aged 65+)
Volunteerism (% of adults aged 65+)Nursing Home Quality (% of 4- & 5-star beds)
Community & Environment—Macro Total Home-Delivered Meals (participants as % of adults aged 65+ in poverty) Food Insecurity (% of adults aged 60+) Community Support (dollars per adult aged 65+ in poverty)
Community & Environment—Micro TotalCommunity & Environment Total
Policy Low-Care Nursing Home Residents (% of residents) SNAP Reach (participants as % of adults aged 60+ in poverty)
Prescription Drug Coverage (% of adults aged 65+) Geriatrician Shortfall (% of needed geriatricians)
Policy Total
Clinical CareDedicated Health Care Provider (% of adults aged 65+)
Flu Vaccine (% of adults aged 65+) Health Screenings (% of adults aged 65 to 74)
Recommended Hospital Care (% of hospitalized patients aged 65+)Diabetes Management (% of Medicare beneficiaries)
Home Health Care (number of workers per 1000 adults aged 75+)Preventable Hospitalizations (discharges per 1000 Medicare beneficiaries)
Hospital Readmissions (% of hospitalized patients aged 65+)Hospice Care (% of decedents aged 65+)
Hospital Deaths (% of decedents aged 65+)Clinical Care Total
All Determinants
OutcomesICU Use (% of decedents aged 65+)
Falls (% of adults aged 65+) Hip Fractures (hospitalizations per 1000 Medicare beneficiaries)
Health Status (very good or excellent as % of adults aged 65+)Able-bodied (% of adults aged 65+)
Premature Death (deaths per 100 000 adults aged 65 to 74)Teeth Extractions (% of adults aged 65+)
Poor Mental Health Days (days in previous 30) All Outcomes Overall
2015 No. 1 Value Rank State
Supplemental MeasuresEducation (% of adults aged 65+)
Multiple Chronic Conditions (% of Medicare beneficiaries aged 65+)Cognition (% of adults aged 65+)
Depression (% of adults aged 65+)Suicide (deaths per 100 000 adults aged 65+)
2015 No. 1 Value Rank State
AL
AS
KA
Alaska
OverallRank: 31Change: 5Determinants Rank: 33Outcomes Rank: 30
Strengths:• Low percentage of seniors living in poverty• High community-support expenditures• Low ICU use
Challenges: • High prevalence of chronic drinking• Low prescription drug coverage• High prevalence of falls
Highlights: • In the past year, obesity increased 13%
from 26.8% to 30.4% of adults aged 65 and older.
• In the past year, pain management increased 8% from 42.5% to 45.9% of adults aged 65 and older with joint pain.
• In the past 2 years, food insecurity decreased 28% from 16.0% to 11.5% of adults aged 60 and older.
• In the past year, hospital readmissions increased 8% from 13.6% to 14.7% of hospitalized patients aged 65 and older.
• In the past year, hip fractures decreased 23% from 7.3 to 5.6 hospitalizations per 1000 Medicare beneficiaries.
Ranking:Alaska ranks 31st in America’s Health Rankings® Senior Report; it was 36th last year. In the 2014 America’s Health Rankings® (all ages), the state ranks 26th.
State Health Department Website: http://health.hss.state.ak.us
11.76.7
30.41.1
31.862.445.9
0.000
5.129.534.6
0.051100.211.5
$67980.1650.216
12.2
100.881.462.5
-0.027
88.952.686.296.367.4
316.646.714.724.027.0
-0.080-0.031
8.3
33.75.6
45.859.8179515.62.4
-0.001-0.032
27.322.710.811.721.4
10240443
69.6 52.7
32.522.46.58.77.1
474947618352147
114391825123
279481628
50492530491101750474533
12501210422821333031
4.21.516.10.922.877.253.2
5.142.657.9
108.1
8.1$6798
1.1
136.889.625.8
97.573.992.498.486.0316.628.212.965.415.1
4.214.53.050.268.214027.01.3

79
U N I T E D H E A LT H F O U N D AT I O N | A M E R I C A’ S H E A LT H R A N K I N G S ® S E N I O R R E P O RT 2 0 15
Projected Increase 2015 to 2030 Senior Population Growth State US
Behaviors Smoking (% of adults aged 65+)
Chronic Drinking (% of adults aged 65+) Obesity (% of adults aged 65+) Underweight (% of adults aged 65+ in fair or better health) Physical Inactivity (% of adults aged 65+ in fair or better health)
Dental Visit (% of adults aged 65+)Pain Management (% of adults aged 65+ with joint pain)
Behaviors Total
Community & EnvironmentPoverty (% of adults aged 65+)
Volunteerism (% of adults aged 65+)Nursing Home Quality (% of 4- & 5-star beds)
Community & Environment—Macro Total Home-Delivered Meals (participants as % of adults aged 65+ in poverty) Food Insecurity (% of adults aged 60+) Community Support (dollars per adult aged 65+ in poverty)
Community & Environment—Micro TotalCommunity & Environment Total
Policy Low-Care Nursing Home Residents (% of residents) SNAP Reach (participants as % of adults aged 60+ in poverty)
Prescription Drug Coverage (% of adults aged 65+) Geriatrician Shortfall (% of needed geriatricians)
Policy Total
Clinical CareDedicated Health Care Provider (% of adults aged 65+)
Flu Vaccine (% of adults aged 65+) Health Screenings (% of adults aged 65 to 74)
Recommended Hospital Care (% of hospitalized patients aged 65+)Diabetes Management (% of Medicare beneficiaries)
Home Health Care (number of workers per 1000 adults aged 75+)Preventable Hospitalizations (discharges per 1000 Medicare beneficiaries)
Hospital Readmissions (% of hospitalized patients aged 65+)Hospice Care (% of decedents aged 65+)
Hospital Deaths (% of decedents aged 65+)Clinical Care Total
All Determinants
OutcomesICU Use (% of decedents aged 65+)
Falls (% of adults aged 65+) Hip Fractures (hospitalizations per 1000 Medicare beneficiaries)
Health Status (very good or excellent as % of adults aged 65+)Able-bodied (% of adults aged 65+)
Premature Death (deaths per 100 000 adults aged 65 to 74)Teeth Extractions (% of adults aged 65+)
Poor Mental Health Days (days in previous 30) All Outcomes Overall
2015 No. 1 Value Rank State
Supplemental MeasuresEducation (% of adults aged 65+)
Multiple Chronic Conditions (% of Medicare beneficiaries aged 65+)Cognition (% of adults aged 65+)
Depression (% of adults aged 65+)Suicide (deaths per 100 000 adults aged 65+)
2015 No. 1 Value Rank State
OverallRank: 22Change: 1Determinants Rank: 24Outcomes Rank: 19
Strengths:• Low prevalence of obesity• High hospice care use• High health status
Challenges: • High prevalence of chronic drinking• Low volunteerism• Low percentage of seniors with
dedicated provider
Highlights: • In the past year, smoking decreased
17% from 9.5% to 7.9% of adults aged 65 and older.
• In the past year, underweight seniors decreased 24% from 2.1% to 1.6% of adults aged 65 and older.
• In the past year, pain management decreased 18% from 54.8% to 44.8% of adults aged 65 and older with joint pain.
• In the past year, food insecurity increased 11% from 12.3% to 13.6% of adults aged 60 and older.
• In the past year, flu vaccine coverage increased 15% from 52.3% to 60.0% of adults aged 65 and older.
Ranking:Arizona ranks 22nd in America’s Health Rankings® Senior Report; it was 23rd last year. In the 2014 America’s Health Rankings® (all ages), the state ranks 29th.
State Health Department Website: www.azdhs.gov
7.94.6
23.21.6
27.965.644.8
-2.131
8.619.147.1
-0.00414.113.6$490
-0.009-0.013
10.467.087.075.5
-0.020
91.560.085.196.376.1
103.045.214.965.415.9
0.0350.067
15.727.16.4
46.566.2159713.32.1
0.0950.162
26.331.78.1
14.721.2
1415132241
100.7 52.7
32.522.46.58.77.1
13375
241125298
264515284425383431
2129203625
4233323036208
2112
1624
4118307
1199
161922
4.21.5
16.10.9
22.877.253.2
5.142.657.9
108.18.1
$6798
1.1136.889.625.8
97.573.992.498.486.0
316.628.212.965.415.1
4.214.53.0
50.268.214027.01.3
AR
IZO
NA
Arizona

80
U N I T E D H E A LT H F O U N D AT I O N | A M E R I C A’ S H E A LT H R A N K I N G S ® S E N I O R R E P O RT 2 0 15
Projected Increase 2015 to 2030 Senior Population Growth State US
Behaviors Smoking (% of adults aged 65+)
Chronic Drinking (% of adults aged 65+) Obesity (% of adults aged 65+) Underweight (% of adults aged 65+ in fair or better health) Physical Inactivity (% of adults aged 65+ in fair or better health)
Dental Visit (% of adults aged 65+)Pain Management (% of adults aged 65+ with joint pain)
Behaviors Total
Community & EnvironmentPoverty (% of adults aged 65+)
Volunteerism (% of adults aged 65+)Nursing Home Quality (% of 4- & 5-star beds)
Community & Environment—Macro Total Home-Delivered Meals (participants as % of adults aged 65+ in poverty) Food Insecurity (% of adults aged 60+) Community Support (dollars per adult aged 65+ in poverty)
Community & Environment—Micro TotalCommunity & Environment Total
Policy Low-Care Nursing Home Residents (% of residents) SNAP Reach (participants as % of adults aged 60+ in poverty)
Prescription Drug Coverage (% of adults aged 65+) Geriatrician Shortfall (% of needed geriatricians)
Policy Total
Clinical CareDedicated Health Care Provider (% of adults aged 65+)
Flu Vaccine (% of adults aged 65+) Health Screenings (% of adults aged 65 to 74)
Recommended Hospital Care (% of hospitalized patients aged 65+)Diabetes Management (% of Medicare beneficiaries)
Home Health Care (number of workers per 1000 adults aged 75+)Preventable Hospitalizations (discharges per 1000 Medicare beneficiaries)
Hospital Readmissions (% of hospitalized patients aged 65+)Hospice Care (% of decedents aged 65+)
Hospital Deaths (% of decedents aged 65+)Clinical Care Total
All Determinants
OutcomesICU Use (% of decedents aged 65+)
Falls (% of adults aged 65+) Hip Fractures (hospitalizations per 1000 Medicare beneficiaries)
Health Status (very good or excellent as % of adults aged 65+)Able-bodied (% of adults aged 65+)
Premature Death (deaths per 100 000 adults aged 65 to 74)Teeth Extractions (% of adults aged 65+)
Poor Mental Health Days (days in previous 30) All Outcomes Overall
2015 No. 1 Value Rank State
Supplemental MeasuresEducation (% of adults aged 65+)
Multiple Chronic Conditions (% of Medicare beneficiaries aged 65+)Cognition (% of adults aged 65+)
Depression (% of adults aged 65+)Suicide (deaths per 100 000 adults aged 65+)
2015 No. 1 Value Rank State
AR
KA
NS
AS
Arkansas
OverallRank: 47Change: 1Determinants Rank: 46Outcomes Rank: 46
Strengths:• Low prevalence of chronic drinking• Ready availability of home-delivered meals• Low ICU use
Challenges: • Low percentage of dental visit• High prevalence of food insecurity• Low percentage of able-bodied seniors
Highlights: • In the past year, physical inactivity
increased 19% from 33.2% to 39.6% of adults aged 65 and older.
• In the past year, seniors with a dedicated health care provider increased 2% from 92.4% to 94.3% of adults aged 65 and older.
• In the past year, recommended hospital care decreased 2% from 98.2% to 96.3% of hospitalized patients aged 65 and older.
• In the past year, hospice care increased 11% from 45.8% to 50.6% of decedents aged 65 and older.
• In the past year, ICU use decreased 18% from 11.9% to 9.8% of decedents aged 65 and older.
Ranking:Arkansas ranks 47th in America’s Health Rankings® Senior Report; it was 46th last year. In the 2014 America’s Health Rankings® (all ages), the state ranks 49th.
State Health Department Website: www.healthy.arkansas.gov
11.13.0
26.41.9
39.653.850.9
0.278
10.519.344.7
-0.04733.025.4$772
-0.051-0.098
17.349.086.573.1
-0.099
94.358.078.896.376.1
113.771.616.650.623.1
-0.087-0.375
9.8
31.07.7
32.957.6229023.72.7
-0.287-0.662
16.435.711.117.017.0
4724424329
40.3 52.7
32.522.46.58.77.1
441521374646441
414324401550234443
4345253143
263750303615444822324746
20404645464544464647
4.21.516.10.922.877.253.2
5.142.657.9
108.1
8.1$6798
1.1
136.889.625.8
97.573.992.498.486.0316.628.212.965.415.1
4.214.53.050.268.214027.01.3
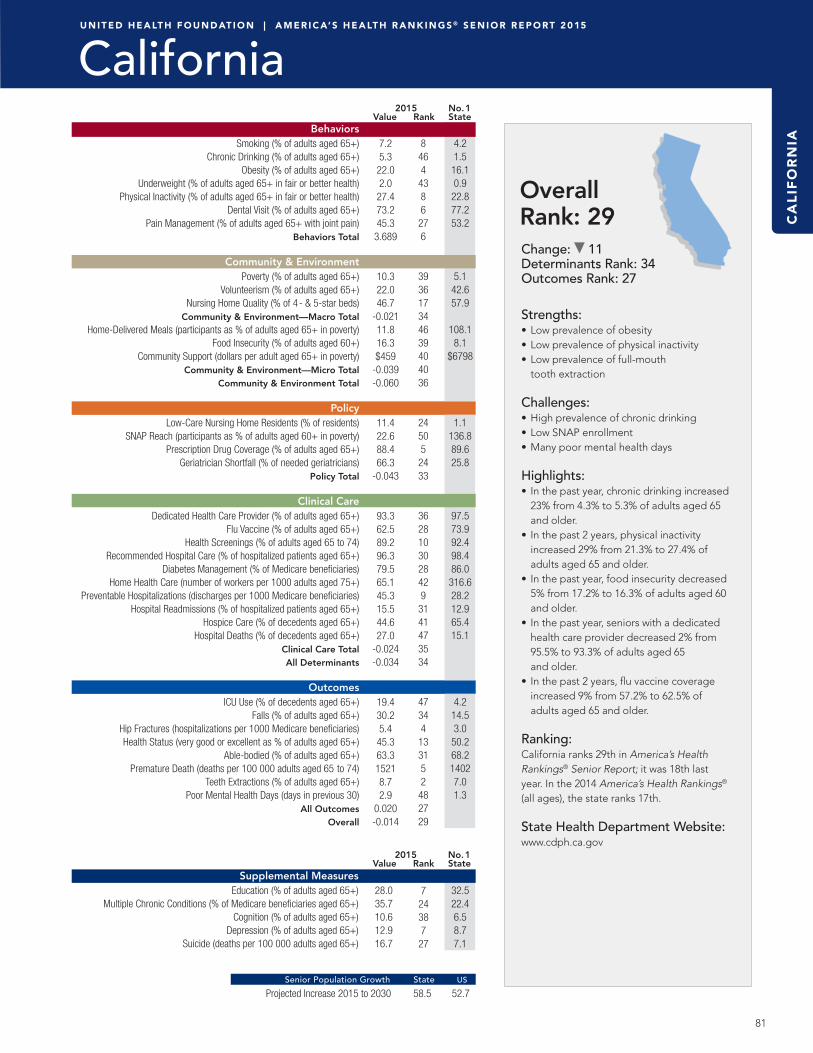
81
U N I T E D H E A LT H F O U N D AT I O N | A M E R I C A’ S H E A LT H R A N K I N G S ® S E N I O R R E P O RT 2 0 15
Projected Increase 2015 to 2030 Senior Population Growth State US
Behaviors Smoking (% of adults aged 65+)
Chronic Drinking (% of adults aged 65+) Obesity (% of adults aged 65+) Underweight (% of adults aged 65+ in fair or better health) Physical Inactivity (% of adults aged 65+ in fair or better health)
Dental Visit (% of adults aged 65+)Pain Management (% of adults aged 65+ with joint pain)
Behaviors Total
Community & EnvironmentPoverty (% of adults aged 65+)
Volunteerism (% of adults aged 65+)Nursing Home Quality (% of 4- & 5-star beds)
Community & Environment—Macro Total Home-Delivered Meals (participants as % of adults aged 65+ in poverty) Food Insecurity (% of adults aged 60+) Community Support (dollars per adult aged 65+ in poverty)
Community & Environment—Micro TotalCommunity & Environment Total
Policy Low-Care Nursing Home Residents (% of residents) SNAP Reach (participants as % of adults aged 60+ in poverty)
Prescription Drug Coverage (% of adults aged 65+) Geriatrician Shortfall (% of needed geriatricians)
Policy Total
Clinical CareDedicated Health Care Provider (% of adults aged 65+)
Flu Vaccine (% of adults aged 65+) Health Screenings (% of adults aged 65 to 74)
Recommended Hospital Care (% of hospitalized patients aged 65+)Diabetes Management (% of Medicare beneficiaries)
Home Health Care (number of workers per 1000 adults aged 75+)Preventable Hospitalizations (discharges per 1000 Medicare beneficiaries)
Hospital Readmissions (% of hospitalized patients aged 65+)Hospice Care (% of decedents aged 65+)
Hospital Deaths (% of decedents aged 65+)Clinical Care Total
All Determinants
OutcomesICU Use (% of decedents aged 65+)
Falls (% of adults aged 65+) Hip Fractures (hospitalizations per 1000 Medicare beneficiaries)
Health Status (very good or excellent as % of adults aged 65+)Able-bodied (% of adults aged 65+)
Premature Death (deaths per 100 000 adults aged 65 to 74)Teeth Extractions (% of adults aged 65+)
Poor Mental Health Days (days in previous 30) All Outcomes Overall
2015 No. 1 Value Rank State
Supplemental MeasuresEducation (% of adults aged 65+)
Multiple Chronic Conditions (% of Medicare beneficiaries aged 65+)Cognition (% of adults aged 65+)
Depression (% of adults aged 65+)Suicide (deaths per 100 000 adults aged 65+)
2015 No. 1 Value Rank State
OverallRank: 29Change: 11Determinants Rank: 34Outcomes Rank: 27
Strengths:• Low prevalence of obesity• Low prevalence of physical inactivity• Low prevalence of full-mouth
tooth extraction
Challenges: • High prevalence of chronic drinking• Low SNAP enrollment• Many poor mental health days
Highlights: • In the past year, chronic drinking increased
23% from 4.3% to 5.3% of adults aged 65 and older.
• In the past 2 years, physical inactivity increased 29% from 21.3% to 27.4% of adults aged 65 and older.
• In the past year, food insecurity decreased 5% from 17.2% to 16.3% of adults aged 60 and older.
• In the past year, seniors with a dedicated health care provider decreased 2% from 95.5% to 93.3% of adults aged 65 and older.
• In the past 2 years, flu vaccine coverage increased 9% from 57.2% to 62.5% of adults aged 65 and older.
Ranking:California ranks 29th in America’s Health Rankings® Senior Report; it was 18th last year. In the 2014 America’s Health Rankings® (all ages), the state ranks 17th.
State Health Department Website: www.cdph.ca.gov
7.25.3
22.02.0
27.473.245.3
3.689
10.322.046.7
-0.02111.816.3$459
-0.039-0.060
11.422.688.466.3
-0.043
93.362.589.296.379.565.145.315.544.627.0
-0.024-0.034
19.430.25.4
45.363.315218.72.9
0.020-0.014
28.035.710.612.916.7
724387
27
58.5 52.7
32.522.46.58.77.1
8464
4386
276
393617344639404036
24505
2433
3628103028429
3141473534
47344
133152
482729
4.21.5
16.10.9
22.877.253.2
5.142.657.9
108.18.1
$6798
1.1136.889.625.8
97.573.992.498.486.0
316.628.212.965.415.1
4.214.53.0
50.268.214027.01.3
CA
LIF
OR
NIA
California

82
U N I T E D H E A LT H F O U N D AT I O N | A M E R I C A’ S H E A LT H R A N K I N G S ® S E N I O R R E P O RT 2 0 15
Projected Increase 2015 to 2030 Senior Population Growth State US
Behaviors Smoking (% of adults aged 65+)
Chronic Drinking (% of adults aged 65+) Obesity (% of adults aged 65+) Underweight (% of adults aged 65+ in fair or better health) Physical Inactivity (% of adults aged 65+ in fair or better health)
Dental Visit (% of adults aged 65+)Pain Management (% of adults aged 65+ with joint pain)
Behaviors Total
Community & EnvironmentPoverty (% of adults aged 65+)
Volunteerism (% of adults aged 65+)Nursing Home Quality (% of 4- & 5-star beds)
Community & Environment—Macro Total Home-Delivered Meals (participants as % of adults aged 65+ in poverty) Food Insecurity (% of adults aged 60+) Community Support (dollars per adult aged 65+ in poverty)
Community & Environment—Micro TotalCommunity & Environment Total
Policy Low-Care Nursing Home Residents (% of residents) SNAP Reach (participants as % of adults aged 60+ in poverty)
Prescription Drug Coverage (% of adults aged 65+) Geriatrician Shortfall (% of needed geriatricians)
Policy Total
Clinical CareDedicated Health Care Provider (% of adults aged 65+)
Flu Vaccine (% of adults aged 65+) Health Screenings (% of adults aged 65 to 74)
Recommended Hospital Care (% of hospitalized patients aged 65+)Diabetes Management (% of Medicare beneficiaries)
Home Health Care (number of workers per 1000 adults aged 75+)Preventable Hospitalizations (discharges per 1000 Medicare beneficiaries)
Hospital Readmissions (% of hospitalized patients aged 65+)Hospice Care (% of decedents aged 65+)
Hospital Deaths (% of decedents aged 65+)Clinical Care Total
All Determinants
OutcomesICU Use (% of decedents aged 65+)
Falls (% of adults aged 65+) Hip Fractures (hospitalizations per 1000 Medicare beneficiaries)
Health Status (very good or excellent as % of adults aged 65+)Able-bodied (% of adults aged 65+)
Premature Death (deaths per 100 000 adults aged 65 to 74)Teeth Extractions (% of adults aged 65+)
Poor Mental Health Days (days in previous 30) All Outcomes Overall
2015 No. 1 Value Rank State
Supplemental MeasuresEducation (% of adults aged 65+)
Multiple Chronic Conditions (% of Medicare beneficiaries aged 65+)Cognition (% of adults aged 65+)
Depression (% of adults aged 65+)Suicide (deaths per 100 000 adults aged 65+)
2015 No. 1 Value Rank State
CO
LO
RA
DO
Colorado
OverallRank: 8Change: 2Determinants Rank: 8Outcomes Rank: 5
Strengths:• Low prevalence of obesity• Low prevalence of physical inactivity• High health status
Challenges: • High prevalence of chronic drinking • High prevalence of underweight seniors• Low percentage of diabetes management
Highlights: • In the past year, chronic drinking
decreased 15% from 5.2% to 4.4% of adults aged 65 and older.
• In the past year, pain management decreased 20% from 52.7% to 42.2% of adults aged 65 and older with joint pain.
• In the past year, food insecurity increased 22% from 10.9% to 13.3% of adults aged 60 and older.
• In the past year, hospital readmissions decreased 6% from 14.8% to 13.9% of hospitalized patients aged 65 and older.
• In the past 2 years, very good or excellent health status increased 12% from 44.9% to 50.1% of adults aged 65 and older.
Ranking:Colorado ranks 8th in America’s Health Rankings® Senior Report; it was 6th last year. In the 2014 America’s Health Rankings® (all ages), the state ranks 8th.
State Health Department Website: www.cdphe.state.co.us
9.14.4
18.62.0
23.970.242.2
-4.362
7.728.448.8
0.06917.813.3$6370.0040.073
12.772.387.165.4
0.001
94.867.883.896.975.6
122.938.213.956.917.1
0.0910.244
9.7
27.46.4
50.166.5148712.41.9
0.1920.436
32.526.67.7
14.321.5
15111945
52.4 52.7
32.522.46.58.77.1
2733243214417
131610143321292816
2926182020
22838133812569318
18213021035958
4.21.516.10.922.877.253.2
5.142.657.9
108.1
8.1$6798
1.1
136.889.625.8
97.573.992.498.486.0316.628.212.965.415.1
4.214.53.050.268.214027.01.3

83
U N I T E D H E A LT H F O U N D AT I O N | A M E R I C A’ S H E A LT H R A N K I N G S ® S E N I O R R E P O RT 2 0 15
Projected Increase 2015 to 2030 Senior Population Growth State US
Behaviors Smoking (% of adults aged 65+)
Chronic Drinking (% of adults aged 65+) Obesity (% of adults aged 65+) Underweight (% of adults aged 65+ in fair or better health) Physical Inactivity (% of adults aged 65+ in fair or better health)
Dental Visit (% of adults aged 65+)Pain Management (% of adults aged 65+ with joint pain)
Behaviors Total
Community & EnvironmentPoverty (% of adults aged 65+)
Volunteerism (% of adults aged 65+)Nursing Home Quality (% of 4- & 5-star beds)
Community & Environment—Macro Total Home-Delivered Meals (participants as % of adults aged 65+ in poverty) Food Insecurity (% of adults aged 60+) Community Support (dollars per adult aged 65+ in poverty)
Community & Environment—Micro TotalCommunity & Environment Total
Policy Low-Care Nursing Home Residents (% of residents) SNAP Reach (participants as % of adults aged 60+ in poverty)
Prescription Drug Coverage (% of adults aged 65+) Geriatrician Shortfall (% of needed geriatricians)
Policy Total
Clinical CareDedicated Health Care Provider (% of adults aged 65+)
Flu Vaccine (% of adults aged 65+) Health Screenings (% of adults aged 65 to 74)
Recommended Hospital Care (% of hospitalized patients aged 65+)Diabetes Management (% of Medicare beneficiaries)
Home Health Care (number of workers per 1000 adults aged 75+)Preventable Hospitalizations (discharges per 1000 Medicare beneficiaries)
Hospital Readmissions (% of hospitalized patients aged 65+)Hospice Care (% of decedents aged 65+)
Hospital Deaths (% of decedents aged 65+)Clinical Care Total
All Determinants
OutcomesICU Use (% of decedents aged 65+)
Falls (% of adults aged 65+) Hip Fractures (hospitalizations per 1000 Medicare beneficiaries)
Health Status (very good or excellent as % of adults aged 65+)Able-bodied (% of adults aged 65+)
Premature Death (deaths per 100 000 adults aged 65 to 74)Teeth Extractions (% of adults aged 65+)
Poor Mental Health Days (days in previous 30) All Outcomes Overall
2015 No. 1 Value Rank State
Supplemental MeasuresEducation (% of adults aged 65+)
Multiple Chronic Conditions (% of Medicare beneficiaries aged 65+)Cognition (% of adults aged 65+)
Depression (% of adults aged 65+)Suicide (deaths per 100 000 adults aged 65+)
2015 No. 1 Value Rank State
OverallRank: 10Change: 2Determinants Rank: 11Outcomes Rank: 6
Strengths:• High percentage of dental visit• Low percentage of seniors living in poverty• Low geriatrician shortfall
Challenges: • High prevalence of chronic drinking• High percentage of low-care nursing
home residents• High percentage of hospital deaths
Highlights: • In the past year, pain management
decreased 20% from 52.0% to 41.5% of adults aged 65 and older with joint pain.
• In the past year, food insecurity increased 23% from 11.4% to 14.0% of adults aged 60 and older.
• In the past year, flu vaccine coverage increased 7% from 59.5% to 63.6% of adults aged 65 and older.
• In the past year, home health care increased 22% from 89.2 to 108.9 home health care workers per 1000 adults aged 75 and older.
• In the past year, ICU use increased 16% from 12.5% to 14.5% of decedents aged 65 and older.
Ranking:Connecticut ranks 10th in America’s Health Rankings® Senior Report; it was 12th last year. In the 2014 America’s Health Rankings® (all ages), the state ranks 4th.
State Health Department Website: www.dph.state.ct.us
7.44.8
26.31.3
33.674.541.5
2.381
7.026.346.2
0.06017.114.0$9150.0040.064
15.1
101.286.645.7
0.074
96.863.689.796.181.6
108.956.715.545.325.1
0.0210.187
14.524.45.4
46.067.8146613.62.1
0.1820.368
28.238.97.6
14.89.5
6379
243
37.7 52.7
32.522.46.58.77.1
10392010274
4321
62519163727192820
388
2459
3
217
372018263138392111
35104822
14166
10
4.21.5
16.10.9
22.877.253.2
5.142.657.9
108.18.1
$6798
1.1136.889.625.8
97.573.992.498.486.0
316.628.212.965.415.1
4.214.53.0
50.268.214027.01.3
CO
NN
EC
TIC
UT
Connecticut

84
U N I T E D H E A LT H F O U N D AT I O N | A M E R I C A’ S H E A LT H R A N K I N G S ® S E N I O R R E P O RT 2 0 15
Projected Increase 2015 to 2030 Senior Population Growth State US
Behaviors Smoking (% of adults aged 65+)
Chronic Drinking (% of adults aged 65+) Obesity (% of adults aged 65+) Underweight (% of adults aged 65+ in fair or better health) Physical Inactivity (% of adults aged 65+ in fair or better health)
Dental Visit (% of adults aged 65+)Pain Management (% of adults aged 65+ with joint pain)
Behaviors Total
Community & EnvironmentPoverty (% of adults aged 65+)
Volunteerism (% of adults aged 65+)Nursing Home Quality (% of 4- & 5-star beds)
Community & Environment—Macro Total Home-Delivered Meals (participants as % of adults aged 65+ in poverty) Food Insecurity (% of adults aged 60+) Community Support (dollars per adult aged 65+ in poverty)
Community & Environment—Micro TotalCommunity & Environment Total
Policy Low-Care Nursing Home Residents (% of residents) SNAP Reach (participants as % of adults aged 60+ in poverty)
Prescription Drug Coverage (% of adults aged 65+) Geriatrician Shortfall (% of needed geriatricians)
Policy Total
Clinical CareDedicated Health Care Provider (% of adults aged 65+)
Flu Vaccine (% of adults aged 65+) Health Screenings (% of adults aged 65 to 74)
Recommended Hospital Care (% of hospitalized patients aged 65+)Diabetes Management (% of Medicare beneficiaries)
Home Health Care (number of workers per 1000 adults aged 75+)Preventable Hospitalizations (discharges per 1000 Medicare beneficiaries)
Hospital Readmissions (% of hospitalized patients aged 65+)Hospice Care (% of decedents aged 65+)
Hospital Deaths (% of decedents aged 65+)Clinical Care Total
All Determinants
OutcomesICU Use (% of decedents aged 65+)
Falls (% of adults aged 65+) Hip Fractures (hospitalizations per 1000 Medicare beneficiaries)
Health Status (very good or excellent as % of adults aged 65+)Able-bodied (% of adults aged 65+)
Premature Death (deaths per 100 000 adults aged 65 to 74)Teeth Extractions (% of adults aged 65+)
Poor Mental Health Days (days in previous 30) All Outcomes Overall
2015 No. 1 Value Rank State
Supplemental MeasuresEducation (% of adults aged 65+)
Multiple Chronic Conditions (% of Medicare beneficiaries aged 65+)Cognition (% of adults aged 65+)
Depression (% of adults aged 65+)Suicide (deaths per 100 000 adults aged 65+)
2015 No. 1 Value Rank State
DE
LA
WA
RE
Delaware
OverallRank: 18Change: 9Determinants Rank: 20Outcomes Rank: 15
Strengths:• High percentage of quality
nursing home beds• High percentage of health screenings• Low hip fracture rate
Challenges: • High prevalence of obesity• High prevalence of physical inactivity• High prevalence of activity-limiting
arthritis pain
Highlights: • In the past year, pain management
decreased 34% from 58.6% to 38.7% of adults aged 65 and older with joint pain.
• In the past year, volunteerism increased 19% from 22.7% to 26.9% of adults aged 65 and older.
• In the past year, seniors with a dedicated health care provider decreased 3% from 97.4% to 94.5% of adults aged 65 and older.
• In the past year, hospital readmissions decreased 8% from 15.8% to 14.6% of hospitalized patients aged 65 and older.
• In the past year, poor mental health days increased 20% from 2.0 to 2.4 days in previous 30.
Ranking:Delaware ranks 18th in America’s Health Rankings® Senior Report; it was 9th last year. In the 2014 America’s Health Rankings® (all ages), the state ranks 35th.
State Health Department Website: www.dhss.delaware.gov/dhss
8.44.4
30.31.8
36.269.638.7
-0.738
6.826.957.6
0.11339.812.9$9670.0490.162
14.572.987.671.9
-0.021
94.565.891.295.984.063.353.914.662.718.7
0.0860.095
14.624.95.2
43.967.5163916.92.4
0.1030.198
23.940.87.6
12.912.3
21419712
60 52.7
32.522.46.58.77.1
1733463339164946
519241113161310
3624132926
2415442544191536320
361221731427331518
4.21.516.10.922.877.253.2
5.142.657.9
108.1
8.1$6798
1.1
136.889.625.8
97.573.992.498.486.0316.628.212.965.415.1
4.214.53.050.268.214027.01.3

85
U N I T E D H E A LT H F O U N D AT I O N | A M E R I C A’ S H E A LT H R A N K I N G S ® S E N I O R R E P O RT 2 0 15
Projected Increase 2015 to 2030 Senior Population Growth State US
Behaviors Smoking (% of adults aged 65+)
Chronic Drinking (% of adults aged 65+) Obesity (% of adults aged 65+) Underweight (% of adults aged 65+ in fair or better health) Physical Inactivity (% of adults aged 65+ in fair or better health)
Dental Visit (% of adults aged 65+)Pain Management (% of adults aged 65+ with joint pain)
Behaviors Total
Community & EnvironmentPoverty (% of adults aged 65+)
Volunteerism (% of adults aged 65+)Nursing Home Quality (% of 4- & 5-star beds)
Community & Environment—Macro Total Home-Delivered Meals (participants as % of adults aged 65+ in poverty) Food Insecurity (% of adults aged 60+) Community Support (dollars per adult aged 65+ in poverty)
Community & Environment—Micro TotalCommunity & Environment Total
Policy Low-Care Nursing Home Residents (% of residents) SNAP Reach (participants as % of adults aged 60+ in poverty)
Prescription Drug Coverage (% of adults aged 65+) Geriatrician Shortfall (% of needed geriatricians)
Policy Total
Clinical CareDedicated Health Care Provider (% of adults aged 65+)
Flu Vaccine (% of adults aged 65+) Health Screenings (% of adults aged 65 to 74)
Recommended Hospital Care (% of hospitalized patients aged 65+)Diabetes Management (% of Medicare beneficiaries)
Home Health Care (number of workers per 1000 adults aged 75+)Preventable Hospitalizations (discharges per 1000 Medicare beneficiaries)
Hospital Readmissions (% of hospitalized patients aged 65+)Hospice Care (% of decedents aged 65+)
Hospital Deaths (% of decedents aged 65+)Clinical Care Total
All Determinants
OutcomesICU Use (% of decedents aged 65+)
Falls (% of adults aged 65+) Hip Fractures (hospitalizations per 1000 Medicare beneficiaries)
Health Status (very good or excellent as % of adults aged 65+)Able-bodied (% of adults aged 65+)
Premature Death (deaths per 100 000 adults aged 65 to 74)Teeth Extractions (% of adults aged 65+)
Poor Mental Health Days (days in previous 30) All Outcomes Overall
2015 No. 1 Value Rank State
Supplemental MeasuresEducation (% of adults aged 65+)
Multiple Chronic Conditions (% of Medicare beneficiaries aged 65+)Cognition (% of adults aged 65+)
Depression (% of adults aged 65+)Suicide (deaths per 100 000 adults aged 65+)
2015 No. 1 Value Rank State
OverallRank: 27Change: 1Determinants Rank: 28Outcomes Rank: 32
Strengths:• High community-support expenditures• High SNAP enrollment• Low prevalence of falls
Challenges: • Low volunteerism• Low flu vaccination coverage• High ICU use
Highlights: • In the past year, underweight seniors
increased 36% from 1.4% to 1.9% of adults aged 65 and older.
• In the past year, physical inactivity increased 26% from 25.4% to 32.0% of adults aged 65 and older.
• In the past year, volunteerism increased 8% from 18.7% to 20.2% of adults aged 65 and older.
• In the past year, food insecurity decreased 11% from 16.1% to 14.4% of adults aged 60 and older.
• In the past year, poor mental health days decreased 13% from 3.0 to 2.6 days in previous 30.
Ranking:Florida ranks 27th in America’s Health Rankings® Senior Report; it was 28th last year. In the 2014 America’s Health Rankings® (all ages), the state ranks 32nd.
State Health Department Website: www.doh.state.fl.us
8.74.9
24.81.9
32.065.746.9
-1.014
10.320.245.1
-0.0378.9
14.4$17020.010-0.027
8.5
92.287.476.1
0.038
95.554.586.797.286.025.459.315.761.519.3
0.0230.029
21.723.76.3
40.966.0158615.82.6
-0.0050.025
24.244.99.0
14.719.1
2050292237
87.9 52.7
32.522.46.58.77.1
2242103720241430
3942223750287
2432
1312153714
14472051
50303649
2028
497
2828128
22413227
4.21.5
16.10.9
22.877.253.2
5.142.657.9
108.18.1
$6798
1.1136.889.625.8
97.573.992.498.486.0
316.628.212.965.415.1
4.214.53.0
50.268.214027.01.3
FL
OR
IDA
Florida

86
U N I T E D H E A LT H F O U N D AT I O N | A M E R I C A’ S H E A LT H R A N K I N G S ® S E N I O R R E P O RT 2 0 15
Projected Increase 2015 to 2030 Senior Population Growth State US
Behaviors Smoking (% of adults aged 65+)
Chronic Drinking (% of adults aged 65+) Obesity (% of adults aged 65+) Underweight (% of adults aged 65+ in fair or better health) Physical Inactivity (% of adults aged 65+ in fair or better health)
Dental Visit (% of adults aged 65+)Pain Management (% of adults aged 65+ with joint pain)
Behaviors Total
Community & EnvironmentPoverty (% of adults aged 65+)
Volunteerism (% of adults aged 65+)Nursing Home Quality (% of 4- & 5-star beds)
Community & Environment—Macro Total Home-Delivered Meals (participants as % of adults aged 65+ in poverty) Food Insecurity (% of adults aged 60+) Community Support (dollars per adult aged 65+ in poverty)
Community & Environment—Micro TotalCommunity & Environment Total
Policy Low-Care Nursing Home Residents (% of residents) SNAP Reach (participants as % of adults aged 60+ in poverty)
Prescription Drug Coverage (% of adults aged 65+) Geriatrician Shortfall (% of needed geriatricians)
Policy Total
Clinical CareDedicated Health Care Provider (% of adults aged 65+)
Flu Vaccine (% of adults aged 65+) Health Screenings (% of adults aged 65 to 74)
Recommended Hospital Care (% of hospitalized patients aged 65+)Diabetes Management (% of Medicare beneficiaries)
Home Health Care (number of workers per 1000 adults aged 75+)Preventable Hospitalizations (discharges per 1000 Medicare beneficiaries)
Hospital Readmissions (% of hospitalized patients aged 65+)Hospice Care (% of decedents aged 65+)
Hospital Deaths (% of decedents aged 65+)Clinical Care Total
All Determinants
OutcomesICU Use (% of decedents aged 65+)
Falls (% of adults aged 65+) Hip Fractures (hospitalizations per 1000 Medicare beneficiaries)
Health Status (very good or excellent as % of adults aged 65+)Able-bodied (% of adults aged 65+)
Premature Death (deaths per 100 000 adults aged 65 to 74)Teeth Extractions (% of adults aged 65+)
Poor Mental Health Days (days in previous 30) All Outcomes Overall
2015 No. 1 Value Rank State
Supplemental MeasuresEducation (% of adults aged 65+)
Multiple Chronic Conditions (% of Medicare beneficiaries aged 65+)Cognition (% of adults aged 65+)
Depression (% of adults aged 65+)Suicide (deaths per 100 000 adults aged 65+)
2015 No. 1 Value Rank State
GE
OR
GIA
Georgia
OverallRank: 39Change: 1Determinants Rank: 38Outcomes Rank: 40
Strengths:• Low prevalence of chronic drinking• High SNAP enrollment• High percentage of health screenings
Challenges: • Low percentage of quality
nursing home beds• High hip fracture rate• Low health status
Highlights: • In the past year, smoking decreased
12% from 9.9% to 8.7% of adults aged 65 and older.
• In the past year, chronic drinking decreased 24% from 3.8% to 2.9% of adults aged 65 and older.
• In the past year, obesity increased 4% from 25.4% to 26.5% of adults aged 65 and older.
• In the past year, pain management decreased 5% from 50.3% to 47.9% of adults aged 65 and older with joint pain.
• In the past year, flu vaccine coverage decreased 9% from 60.1% to 54.6% of adults aged 65 and older.
Ranking:Georgia ranks 39th in America’s Health Rankings® Senior Report; it was 40th last year. In the 2014 America’s Health Rankings® (all ages), the state ranks 38th.
State Health Department Website: www.health.state.ga.us
8.72.9
26.51.5
34.463.347.9
0.000
11.020.928.4
-0.11411.317.0$495
-0.045-0.159
10.487.785.873.5
-0.001
93.454.689.696.181.247.360.615.159.619.9
0.005-0.115
13.128.77.4
35.661.8200618.42.2
-0.122-0.236
21.637.811.015.115.8
3031412921
60.6 52.7
32.522.46.58.77.1
2212231833331118
443948484741374346
2214323221
3546837224833265142738
27264343393834214039
4.21.516.10.922.877.253.2
5.142.657.9
108.1
8.1$6798
1.1
136.889.625.8
97.573.992.498.486.0316.628.212.965.415.1
4.214.53.050.268.214027.01.3
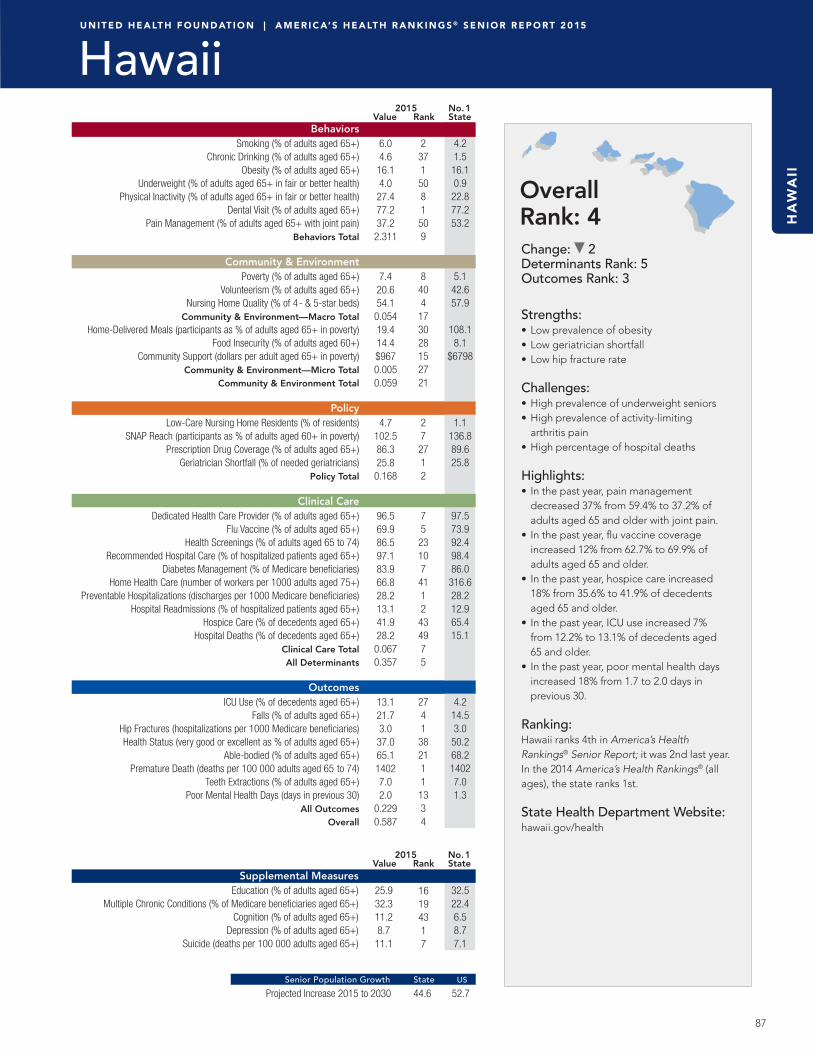
87
U N I T E D H E A LT H F O U N D AT I O N | A M E R I C A’ S H E A LT H R A N K I N G S ® S E N I O R R E P O RT 2 0 15
Projected Increase 2015 to 2030 Senior Population Growth State US
Behaviors Smoking (% of adults aged 65+)
Chronic Drinking (% of adults aged 65+) Obesity (% of adults aged 65+) Underweight (% of adults aged 65+ in fair or better health) Physical Inactivity (% of adults aged 65+ in fair or better health)
Dental Visit (% of adults aged 65+)Pain Management (% of adults aged 65+ with joint pain)
Behaviors Total
Community & EnvironmentPoverty (% of adults aged 65+)
Volunteerism (% of adults aged 65+)Nursing Home Quality (% of 4- & 5-star beds)
Community & Environment—Macro Total Home-Delivered Meals (participants as % of adults aged 65+ in poverty) Food Insecurity (% of adults aged 60+) Community Support (dollars per adult aged 65+ in poverty)
Community & Environment—Micro TotalCommunity & Environment Total
Policy Low-Care Nursing Home Residents (% of residents) SNAP Reach (participants as % of adults aged 60+ in poverty)
Prescription Drug Coverage (% of adults aged 65+) Geriatrician Shortfall (% of needed geriatricians)
Policy Total
Clinical CareDedicated Health Care Provider (% of adults aged 65+)
Flu Vaccine (% of adults aged 65+) Health Screenings (% of adults aged 65 to 74)
Recommended Hospital Care (% of hospitalized patients aged 65+)Diabetes Management (% of Medicare beneficiaries)
Home Health Care (number of workers per 1000 adults aged 75+)Preventable Hospitalizations (discharges per 1000 Medicare beneficiaries)
Hospital Readmissions (% of hospitalized patients aged 65+)Hospice Care (% of decedents aged 65+)
Hospital Deaths (% of decedents aged 65+)Clinical Care Total
All Determinants
OutcomesICU Use (% of decedents aged 65+)
Falls (% of adults aged 65+) Hip Fractures (hospitalizations per 1000 Medicare beneficiaries)
Health Status (very good or excellent as % of adults aged 65+)Able-bodied (% of adults aged 65+)
Premature Death (deaths per 100 000 adults aged 65 to 74)Teeth Extractions (% of adults aged 65+)
Poor Mental Health Days (days in previous 30) All Outcomes Overall
2015 No. 1 Value Rank State
Supplemental MeasuresEducation (% of adults aged 65+)
Multiple Chronic Conditions (% of Medicare beneficiaries aged 65+)Cognition (% of adults aged 65+)
Depression (% of adults aged 65+)Suicide (deaths per 100 000 adults aged 65+)
2015 No. 1 Value Rank State
OverallRank: 4Change: 2Determinants Rank: 5Outcomes Rank: 3
Strengths:• Low prevalence of obesity• Low geriatrician shortfall• Low hip fracture rate
Challenges: • High prevalence of underweight seniors• High prevalence of activity-limiting
arthritis pain• High percentage of hospital deaths
Highlights: • In the past year, pain management
decreased 37% from 59.4% to 37.2% of adults aged 65 and older with joint pain.
• In the past year, flu vaccine coverage increased 12% from 62.7% to 69.9% of adults aged 65 and older.
• In the past year, hospice care increased 18% from 35.6% to 41.9% of decedents aged 65 and older.
• In the past year, ICU use increased 7% from 12.2% to 13.1% of decedents aged 65 and older.
• In the past year, poor mental health days increased 18% from 1.7 to 2.0 days in previous 30.
Ranking:Hawaii ranks 4th in America’s Health Rankings® Senior Report; it was 2nd last year. In the 2014 America’s Health Rankings® (all ages), the state ranks 1st.
State Health Department Website: hawaii.gov/health
6.04.6
16.14.0
27.477.237.2
2.311
7.420.654.1
0.05419.414.4$9670.0050.059
4.7
102.586.325.8
0.168
96.569.986.597.183.966.828.213.141.928.2
0.0670.357
13.121.73.0
37.065.114027.02.0
0.2290.587
25.932.311.28.7
11.1
16194317
44.6 52.7
32.522.46.58.77.1
2371
5081
509
8404
173028152721
27
2712
75
23107
4112
434975
2741
382111
1334
4.21.5
16.10.9
22.877.253.2
5.142.657.9
108.18.1
$6798
1.1136.889.625.8
97.573.992.498.486.0
316.628.212.965.415.1
4.214.53.0
50.268.214027.01.3
HA
WA
II
Hawaii

88
U N I T E D H E A LT H F O U N D AT I O N | A M E R I C A’ S H E A LT H R A N K I N G S ® S E N I O R R E P O RT 2 0 15
Projected Increase 2015 to 2030 Senior Population Growth State US
Behaviors Smoking (% of adults aged 65+)
Chronic Drinking (% of adults aged 65+) Obesity (% of adults aged 65+) Underweight (% of adults aged 65+ in fair or better health) Physical Inactivity (% of adults aged 65+ in fair or better health)
Dental Visit (% of adults aged 65+)Pain Management (% of adults aged 65+ with joint pain)
Behaviors Total
Community & EnvironmentPoverty (% of adults aged 65+)
Volunteerism (% of adults aged 65+)Nursing Home Quality (% of 4- & 5-star beds)
Community & Environment—Macro Total Home-Delivered Meals (participants as % of adults aged 65+ in poverty) Food Insecurity (% of adults aged 60+) Community Support (dollars per adult aged 65+ in poverty)
Community & Environment—Micro TotalCommunity & Environment Total
Policy Low-Care Nursing Home Residents (% of residents) SNAP Reach (participants as % of adults aged 60+ in poverty)
Prescription Drug Coverage (% of adults aged 65+) Geriatrician Shortfall (% of needed geriatricians)
Policy Total
Clinical CareDedicated Health Care Provider (% of adults aged 65+)
Flu Vaccine (% of adults aged 65+) Health Screenings (% of adults aged 65 to 74)
Recommended Hospital Care (% of hospitalized patients aged 65+)Diabetes Management (% of Medicare beneficiaries)
Home Health Care (number of workers per 1000 adults aged 75+)Preventable Hospitalizations (discharges per 1000 Medicare beneficiaries)
Hospital Readmissions (% of hospitalized patients aged 65+)Hospice Care (% of decedents aged 65+)
Hospital Deaths (% of decedents aged 65+)Clinical Care Total
All Determinants
OutcomesICU Use (% of decedents aged 65+)
Falls (% of adults aged 65+) Hip Fractures (hospitalizations per 1000 Medicare beneficiaries)
Health Status (very good or excellent as % of adults aged 65+)Able-bodied (% of adults aged 65+)
Premature Death (deaths per 100 000 adults aged 65 to 74)Teeth Extractions (% of adults aged 65+)
Poor Mental Health Days (days in previous 30) All Outcomes Overall
2015 No. 1 Value Rank State
Supplemental MeasuresEducation (% of adults aged 65+)
Multiple Chronic Conditions (% of Medicare beneficiaries aged 65+)Cognition (% of adults aged 65+)
Depression (% of adults aged 65+)Suicide (deaths per 100 000 adults aged 65+)
2015 No. 1 Value Rank State
IDA
HO
Idaho
OverallRank: 20Change: 5Determinants Rank: 14Outcomes Rank: 24
Strengths:• High volunteerism• High percentage of quality
nursing home beds• Low ICU use
Challenges: • High prevalence of obesity• Low SNAP enrollment• High geriatrician shortfall
Highlights: • In the past year, chronic drinking
decreased 26% from 4.7% to 3.5% of adults aged 65 and older.
• In the past year, obesity increased 11% from 26.9% to 29.9% of adults aged 65 and older.
• In the past year, community support increased 16% from $389 to $450 per adult aged 65 and older in poverty.
• In the past year, hip fractures decreased 19% from 7.3 to 5.9 hospitalizations per 1000 Medicare beneficiaries.
• In the past 2 years, poor mental health days increased 25% from 2.0 to 2.5 days in previous 30.
Ranking:Idaho ranks 20th in America’s Health Rankings® Senior Report; it was 25th last year. In the 2014 America’s Health Rankings® (all ages), the state ranks 18th.
State Health Department Website: www.healthandwelfare.idaho.gov
8.23.5
29.91.5
27.066.446.9
0.178
8.238.457.9
0.15023.110.9$4500.0290.179
7.6
50.684.389.4
-0.106
92.956.680.796.773.1
115.636.413.748.918.8
0.0040.132
5.9
32.05.9
45.062.2168916.12.5
0.0360.168
22.627.48.7
18.121.3
278264742
64.0 52.7
32.522.46.58.77.1
162243187231411
2131126442187
1143395045
384247214514342972914
4432214372023362420
4.21.516.10.922.877.253.2
5.142.657.9
108.1
8.1$6798
1.1
136.889.625.8
97.573.992.498.486.0316.628.212.965.415.1
4.214.53.050.268.214027.01.3
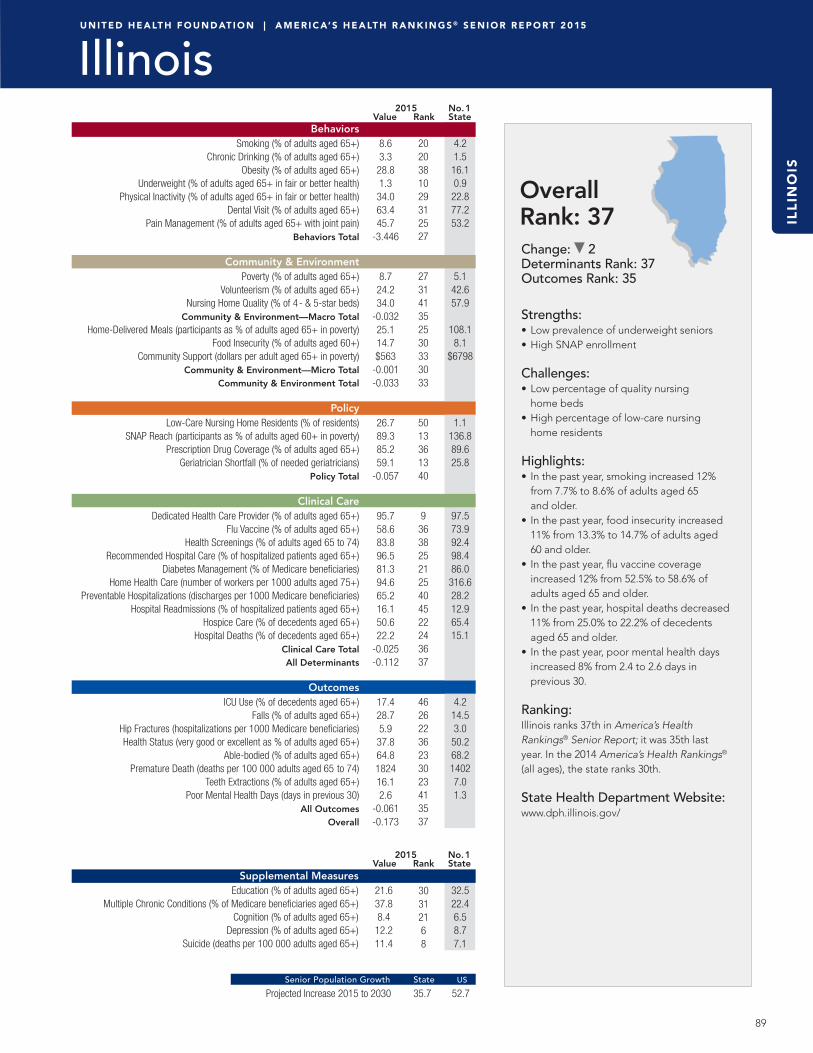
89
U N I T E D H E A LT H F O U N D AT I O N | A M E R I C A’ S H E A LT H R A N K I N G S ® S E N I O R R E P O RT 2 0 15
Projected Increase 2015 to 2030 Senior Population Growth State US
Behaviors Smoking (% of adults aged 65+)
Chronic Drinking (% of adults aged 65+) Obesity (% of adults aged 65+) Underweight (% of adults aged 65+ in fair or better health) Physical Inactivity (% of adults aged 65+ in fair or better health)
Dental Visit (% of adults aged 65+)Pain Management (% of adults aged 65+ with joint pain)
Behaviors Total
Community & EnvironmentPoverty (% of adults aged 65+)
Volunteerism (% of adults aged 65+)Nursing Home Quality (% of 4- & 5-star beds)
Community & Environment—Macro Total Home-Delivered Meals (participants as % of adults aged 65+ in poverty) Food Insecurity (% of adults aged 60+) Community Support (dollars per adult aged 65+ in poverty)
Community & Environment—Micro TotalCommunity & Environment Total
Policy Low-Care Nursing Home Residents (% of residents) SNAP Reach (participants as % of adults aged 60+ in poverty)
Prescription Drug Coverage (% of adults aged 65+) Geriatrician Shortfall (% of needed geriatricians)
Policy Total
Clinical CareDedicated Health Care Provider (% of adults aged 65+)
Flu Vaccine (% of adults aged 65+) Health Screenings (% of adults aged 65 to 74)
Recommended Hospital Care (% of hospitalized patients aged 65+)Diabetes Management (% of Medicare beneficiaries)
Home Health Care (number of workers per 1000 adults aged 75+)Preventable Hospitalizations (discharges per 1000 Medicare beneficiaries)
Hospital Readmissions (% of hospitalized patients aged 65+)Hospice Care (% of decedents aged 65+)
Hospital Deaths (% of decedents aged 65+)Clinical Care Total
All Determinants
OutcomesICU Use (% of decedents aged 65+)
Falls (% of adults aged 65+) Hip Fractures (hospitalizations per 1000 Medicare beneficiaries)
Health Status (very good or excellent as % of adults aged 65+)Able-bodied (% of adults aged 65+)
Premature Death (deaths per 100 000 adults aged 65 to 74)Teeth Extractions (% of adults aged 65+)
Poor Mental Health Days (days in previous 30) All Outcomes Overall
2015 No. 1 Value Rank State
Supplemental MeasuresEducation (% of adults aged 65+)
Multiple Chronic Conditions (% of Medicare beneficiaries aged 65+)Cognition (% of adults aged 65+)
Depression (% of adults aged 65+)Suicide (deaths per 100 000 adults aged 65+)
2015 No. 1 Value Rank State
OverallRank: 37Change: 2Determinants Rank: 37Outcomes Rank: 35
Strengths:• Low prevalence of underweight seniors• High SNAP enrollment
Challenges: • Low percentage of quality nursing
home beds• High percentage of low-care nursing
home residents
Highlights: • In the past year, smoking increased 12%
from 7.7% to 8.6% of adults aged 65 and older.
• In the past year, food insecurity increased 11% from 13.3% to 14.7% of adults aged 60 and older.
• In the past year, flu vaccine coverage increased 12% from 52.5% to 58.6% of adults aged 65 and older.
• In the past year, hospital deaths decreased 11% from 25.0% to 22.2% of decedents aged 65 and older.
• In the past year, poor mental health days increased 8% from 2.4 to 2.6 days in previous 30.
Ranking:Illinois ranks 37th in America’s Health Rankings® Senior Report; it was 35th last year. In the 2014 America’s Health Rankings® (all ages), the state ranks 30th.
State Health Department Website: www.dph.illinois.gov/
8.63.3
28.81.3
34.063.445.7
-3.446
8.724.234.0
-0.03225.114.7$563
-0.001-0.033
26.789.385.259.1
-0.057
95.758.683.896.581.394.665.216.150.622.2
-0.025-0.112
17.428.75.9
37.864.8182416.12.6
-0.061-0.173
21.637.88.4
12.211.4
30312168
35.7 52.7
32.522.46.58.77.1
2020381029312527
273141352530333033
5013361340
9
3638252125404522243637
46262236233023413537
4.21.5
16.10.9
22.877.253.2
5.142.657.9
108.18.1
$6798
1.1136.889.625.8
97.573.992.498.486.0
316.628.212.965.415.1
4.214.53.0
50.268.214027.01.3
ILL
INO
IS
Illinois

90
U N I T E D H E A LT H F O U N D AT I O N | A M E R I C A’ S H E A LT H R A N K I N G S ® S E N I O R R E P O RT 2 0 15
Projected Increase 2015 to 2030 Senior Population Growth State US
Behaviors Smoking (% of adults aged 65+)
Chronic Drinking (% of adults aged 65+) Obesity (% of adults aged 65+) Underweight (% of adults aged 65+ in fair or better health) Physical Inactivity (% of adults aged 65+ in fair or better health)
Dental Visit (% of adults aged 65+)Pain Management (% of adults aged 65+ with joint pain)
Behaviors Total
Community & EnvironmentPoverty (% of adults aged 65+)
Volunteerism (% of adults aged 65+)Nursing Home Quality (% of 4- & 5-star beds)
Community & Environment—Macro Total Home-Delivered Meals (participants as % of adults aged 65+ in poverty) Food Insecurity (% of adults aged 60+) Community Support (dollars per adult aged 65+ in poverty)
Community & Environment—Micro TotalCommunity & Environment Total
Policy Low-Care Nursing Home Residents (% of residents) SNAP Reach (participants as % of adults aged 60+ in poverty)
Prescription Drug Coverage (% of adults aged 65+) Geriatrician Shortfall (% of needed geriatricians)
Policy Total
Clinical CareDedicated Health Care Provider (% of adults aged 65+)
Flu Vaccine (% of adults aged 65+) Health Screenings (% of adults aged 65 to 74)
Recommended Hospital Care (% of hospitalized patients aged 65+)Diabetes Management (% of Medicare beneficiaries)
Home Health Care (number of workers per 1000 adults aged 75+)Preventable Hospitalizations (discharges per 1000 Medicare beneficiaries)
Hospital Readmissions (% of hospitalized patients aged 65+)Hospice Care (% of decedents aged 65+)
Hospital Deaths (% of decedents aged 65+)Clinical Care Total
All Determinants
OutcomesICU Use (% of decedents aged 65+)
Falls (% of adults aged 65+) Hip Fractures (hospitalizations per 1000 Medicare beneficiaries)
Health Status (very good or excellent as % of adults aged 65+)Able-bodied (% of adults aged 65+)
Premature Death (deaths per 100 000 adults aged 65 to 74)Teeth Extractions (% of adults aged 65+)
Poor Mental Health Days (days in previous 30) All Outcomes Overall
2015 No. 1 Value Rank State
Supplemental MeasuresEducation (% of adults aged 65+)
Multiple Chronic Conditions (% of Medicare beneficiaries aged 65+)Cognition (% of adults aged 65+)
Depression (% of adults aged 65+)Suicide (deaths per 100 000 adults aged 65+)
2015 No. 1 Value Rank State
IND
IAN
A
Indiana
OverallRank: 40Change: 3Determinants Rank: 40Outcomes Rank: 39
Strengths:• Low prevalence of chronic drinking• Low percentage of seniors living in poverty• Low prevalence of food insecurity
Challenges: • High prevalence of obesity • High prevalence of physical inactivity• High premature death rate
Highlights: • In the past year, physical inactivity
increased 19% from 33.0% to 39.2% of adults aged 65 and older.
• In the past year, pain management decreased 15% from 52.5% to 44.4% of adults aged 65 and older with joint pain.
• In the past year, community support increased 5% from $890 to $931 per adult aged 65 and older in poverty.
• In the past year, hospital deaths decreased 7% from 23.4% to 21.8% of decedents aged 65 and older.
• In the past year, poor mental health days decreased 15% from 2.7 to 2.3 days in previous 30.
Ranking:Indiana ranks 40th in America’s Health Rankings® Senior Report; it was 37th last year. In the 2014 America’s Health Rankings® (all ages), the state ranks 41st.
State Health Department Website: www.in.gov/isdh
9.62.9
30.71.5
39.262.044.4
-0.161
7.425.544.8
0.04315.912.9$9310.0130.056
10.056.386.276.5
-0.050
95.157.683.196.575.292.470.015.047.321.8
-0.044-0.138
13.830.86.4
39.862.7211619.72.3
-0.105-0.243
16.938.18.6
15.914.7
4634253220
35.9 52.7
32.522.46.58.77.1
3212481845363142
82623203913182322
1741293836
193841254027412331214040
30383031334238273940
4.21.516.10.922.877.253.2
5.142.657.9
108.1
8.1$6798
1.1
136.889.625.8
97.573.992.498.486.0316.628.212.965.415.1
4.214.53.050.268.214027.01.3

91
U N I T E D H E A LT H F O U N D AT I O N | A M E R I C A’ S H E A LT H R A N K I N G S ® S E N I O R R E P O RT 2 0 15
Projected Increase 2015 to 2030 Senior Population Growth State US
Behaviors Smoking (% of adults aged 65+)
Chronic Drinking (% of adults aged 65+) Obesity (% of adults aged 65+) Underweight (% of adults aged 65+ in fair or better health) Physical Inactivity (% of adults aged 65+ in fair or better health)
Dental Visit (% of adults aged 65+)Pain Management (% of adults aged 65+ with joint pain)
Behaviors Total
Community & EnvironmentPoverty (% of adults aged 65+)
Volunteerism (% of adults aged 65+)Nursing Home Quality (% of 4- & 5-star beds)
Community & Environment—Macro Total Home-Delivered Meals (participants as % of adults aged 65+ in poverty) Food Insecurity (% of adults aged 60+) Community Support (dollars per adult aged 65+ in poverty)
Community & Environment—Micro TotalCommunity & Environment Total
Policy Low-Care Nursing Home Residents (% of residents) SNAP Reach (participants as % of adults aged 60+ in poverty)
Prescription Drug Coverage (% of adults aged 65+) Geriatrician Shortfall (% of needed geriatricians)
Policy Total
Clinical CareDedicated Health Care Provider (% of adults aged 65+)
Flu Vaccine (% of adults aged 65+) Health Screenings (% of adults aged 65 to 74)
Recommended Hospital Care (% of hospitalized patients aged 65+)Diabetes Management (% of Medicare beneficiaries)
Home Health Care (number of workers per 1000 adults aged 75+)Preventable Hospitalizations (discharges per 1000 Medicare beneficiaries)
Hospital Readmissions (% of hospitalized patients aged 65+)Hospice Care (% of decedents aged 65+)
Hospital Deaths (% of decedents aged 65+)Clinical Care Total
All Determinants
OutcomesICU Use (% of decedents aged 65+)
Falls (% of adults aged 65+) Hip Fractures (hospitalizations per 1000 Medicare beneficiaries)
Health Status (very good or excellent as % of adults aged 65+)Able-bodied (% of adults aged 65+)
Premature Death (deaths per 100 000 adults aged 65 to 74)Teeth Extractions (% of adults aged 65+)
Poor Mental Health Days (days in previous 30) All Outcomes Overall
2015 No. 1 Value Rank State
Supplemental MeasuresEducation (% of adults aged 65+)
Multiple Chronic Conditions (% of Medicare beneficiaries aged 65+)Cognition (% of adults aged 65+)
Depression (% of adults aged 65+)Suicide (deaths per 100 000 adults aged 65+)
2015 No. 1 Value Rank State
OverallRank: 15Change: 2Determinants Rank: 15Outcomes Rank: 13
Strengths:• Low prevalence of underweight seniors• High prescription drug coverage• Low ICU use
Challenges: • High prevalence of obesity• High prevalence of activity-limiting
arthritis pain• High percentage of low-care
nursing home residents
Highlights: • In the past year, underweight seniors
decreased 23% from 1.3% to 1.0% of adults aged 65 and older.
• In the past year, physical inactivity increased 17% from 30.8% to 35.9% of adults aged 65 and older.
• In the past year, pain management decreased 29% from 57.3% to 40.7% of adults aged 65 and older with joint pain.
• In the past year, home health care increased 11% from 76.5 to 85.1 home health care workers per 1000 adults aged 75 and older.
• In the past year, hip fractures decreased 21% from 7.2 to 5.7 hospitalizations per 1000 Medicare beneficiaries.
Ranking:Iowa ranks 15th in America’s Health Rankings® Senior Report; it was 13th last year. In the 2014 America’s Health Rankings® (all ages), the state ranks 24th.
State Health Department Website: http://www.idph.state.ia.us/
8.03.0
29.91.0
35.968.640.7
1.791
7.633.842.0
0.07238.612.8$9380.0480.120
16.957.889.376.9
-0.048
94.267.485.996.580.185.155.714.559.317.5
0.0660.131
8.1
30.45.7
41.167.4170917.31.7
0.1200.250
17.831.76.5
13.913.3
44151
1516
34.1 52.7
32.522.46.58.77.1
1415432
38184532
118
30131412171413
42392
4035
279
292524302311648
15
113617264
24294
1315
4.21.5
16.10.9
22.877.253.2
5.142.657.9
108.18.1
$6798
1.1136.889.625.8
97.573.992.498.486.0
316.628.212.965.415.1
4.214.53.0
50.268.214027.01.3
IOW
A
Iowa

92
U N I T E D H E A LT H F O U N D AT I O N | A M E R I C A’ S H E A LT H R A N K I N G S ® S E N I O R R E P O RT 2 0 15
Projected Increase 2015 to 2030 Senior Population Growth State US
Behaviors Smoking (% of adults aged 65+)
Chronic Drinking (% of adults aged 65+) Obesity (% of adults aged 65+) Underweight (% of adults aged 65+ in fair or better health) Physical Inactivity (% of adults aged 65+ in fair or better health)
Dental Visit (% of adults aged 65+)Pain Management (% of adults aged 65+ with joint pain)
Behaviors Total
Community & EnvironmentPoverty (% of adults aged 65+)
Volunteerism (% of adults aged 65+)Nursing Home Quality (% of 4- & 5-star beds)
Community & Environment—Macro Total Home-Delivered Meals (participants as % of adults aged 65+ in poverty) Food Insecurity (% of adults aged 60+) Community Support (dollars per adult aged 65+ in poverty)
Community & Environment—Micro TotalCommunity & Environment Total
Policy Low-Care Nursing Home Residents (% of residents) SNAP Reach (participants as % of adults aged 60+ in poverty)
Prescription Drug Coverage (% of adults aged 65+) Geriatrician Shortfall (% of needed geriatricians)
Policy Total
Clinical CareDedicated Health Care Provider (% of adults aged 65+)
Flu Vaccine (% of adults aged 65+) Health Screenings (% of adults aged 65 to 74)
Recommended Hospital Care (% of hospitalized patients aged 65+)Diabetes Management (% of Medicare beneficiaries)
Home Health Care (number of workers per 1000 adults aged 75+)Preventable Hospitalizations (discharges per 1000 Medicare beneficiaries)
Hospital Readmissions (% of hospitalized patients aged 65+)Hospice Care (% of decedents aged 65+)
Hospital Deaths (% of decedents aged 65+)Clinical Care Total
All Determinants
OutcomesICU Use (% of decedents aged 65+)
Falls (% of adults aged 65+) Hip Fractures (hospitalizations per 1000 Medicare beneficiaries)
Health Status (very good or excellent as % of adults aged 65+)Able-bodied (% of adults aged 65+)
Premature Death (deaths per 100 000 adults aged 65 to 74)Teeth Extractions (% of adults aged 65+)
Poor Mental Health Days (days in previous 30) All Outcomes Overall
2015 No. 1 Value Rank State
Supplemental MeasuresEducation (% of adults aged 65+)
Multiple Chronic Conditions (% of Medicare beneficiaries aged 65+)Cognition (% of adults aged 65+)
Depression (% of adults aged 65+)Suicide (deaths per 100 000 adults aged 65+)
2015 No. 1 Value Rank State
KA
NS
AS
Kansas
OverallRank: 24Change: 7Determinants Rank: 22Outcomes Rank: 28
Strengths:• Low prevalence of chronic drinking• High volunteerism• Few poor mental health days
Challenges: • High percentage of low-care nursing
home residents• Low SNAP enrollment• Low percentage of diabetes management
Highlights: • In the past year, underweight seniors
decreased 11% from 1.8% to 1.6% of adults aged 65 and older.
• In the past year, physical inactivity increased 14% from 28.2% to 32.0% of adults aged 65 and older.
• In the past year, pain management decreased 17% from 52.5% to 43.8% of adults aged 65 and older with joint pain.
• In the past 2 years, flu vaccine coverage decreased 4% from 67.6% to 64.8% of adults aged 65 and older.
• In the past year, hip fractures decreased 21% from 8.3 to 6.6 hospitalizations per 1000 Medicare beneficiaries.
Ranking:Kansas ranks 24th in America’s Health Rankings® Senior Report; it was 17th last year. In the 2014 America’s Health Rankings® (all ages), the state ranks 27th.
State Health Department Website: www.kdheks.gov
9.12.2
25.91.6
32.067.843.8
0.778
7.437.340.5
0.08839.313.4$8110.0390.127
18.256.685.174.4
-0.118
94.964.886.697.074.6
128.059.914.751.721.9
0.0290.091
10.429.46.6
41.863.8193518.81.8
0.0100.101
23.133.98.2
14.016.4
2422141725
41.3 52.7
32.522.46.58.77.1
276162420213413
853191222211612
4540373346
201922124111311720231822
2130342528353562824
4.21.516.10.922.877.253.2
5.142.657.9
108.1
8.1$6798
1.1
136.889.625.8
97.573.992.498.486.0316.628.212.965.415.1
4.214.53.050.268.214027.01.3

93
U N I T E D H E A LT H F O U N D AT I O N | A M E R I C A’ S H E A LT H R A N K I N G S ® S E N I O R R E P O RT 2 0 15
Projected Increase 2015 to 2030 Senior Population Growth State US
Behaviors Smoking (% of adults aged 65+)
Chronic Drinking (% of adults aged 65+) Obesity (% of adults aged 65+) Underweight (% of adults aged 65+ in fair or better health) Physical Inactivity (% of adults aged 65+ in fair or better health)
Dental Visit (% of adults aged 65+)Pain Management (% of adults aged 65+ with joint pain)
Behaviors Total
Community & EnvironmentPoverty (% of adults aged 65+)
Volunteerism (% of adults aged 65+)Nursing Home Quality (% of 4- & 5-star beds)
Community & Environment—Macro Total Home-Delivered Meals (participants as % of adults aged 65+ in poverty) Food Insecurity (% of adults aged 60+) Community Support (dollars per adult aged 65+ in poverty)
Community & Environment—Micro TotalCommunity & Environment Total
Policy Low-Care Nursing Home Residents (% of residents) SNAP Reach (participants as % of adults aged 60+ in poverty)
Prescription Drug Coverage (% of adults aged 65+) Geriatrician Shortfall (% of needed geriatricians)
Policy Total
Clinical CareDedicated Health Care Provider (% of adults aged 65+)
Flu Vaccine (% of adults aged 65+) Health Screenings (% of adults aged 65 to 74)
Recommended Hospital Care (% of hospitalized patients aged 65+)Diabetes Management (% of Medicare beneficiaries)
Home Health Care (number of workers per 1000 adults aged 75+)Preventable Hospitalizations (discharges per 1000 Medicare beneficiaries)
Hospital Readmissions (% of hospitalized patients aged 65+)Hospice Care (% of decedents aged 65+)
Hospital Deaths (% of decedents aged 65+)Clinical Care Total
All Determinants
OutcomesICU Use (% of decedents aged 65+)
Falls (% of adults aged 65+) Hip Fractures (hospitalizations per 1000 Medicare beneficiaries)
Health Status (very good or excellent as % of adults aged 65+)Able-bodied (% of adults aged 65+)
Premature Death (deaths per 100 000 adults aged 65 to 74)Teeth Extractions (% of adults aged 65+)
Poor Mental Health Days (days in previous 30) All Outcomes Overall
2015 No. 1 Value Rank State
Supplemental MeasuresEducation (% of adults aged 65+)
Multiple Chronic Conditions (% of Medicare beneficiaries aged 65+)Cognition (% of adults aged 65+)
Depression (% of adults aged 65+)Suicide (deaths per 100 000 adults aged 65+)
2015 No. 1 Value Rank State
Overall Rank: 48Change: No ChangeDeterminants Rank: 47Outcomes Rank: 50
Strengths:• Low prevalence of chronic drinking• Low percentage of low-care nursing
home residents• High flu vaccination coverage
Challenges: • High prevalence of smoking• Low percentage of dental visit• High premature death rate
Highlights: • In the past year, underweight seniors
increased 44% from 1.6% to 2.3% of adults aged 65 and older.
• In the past 2 years, physical inactivity increased 17% from 34.5% to 40.2% of adults aged 65 and older.
• In the past year, food insecurity decreased 9% from 16.5% to 15.1% of adults aged 60 and older.
• In the past year, hip fractures decreased 13% from 8.8 to 7.7 hospitalizations per 1000 Medicare beneficiaries.
• In the past year, very good or excellent health status increased 8% from 31.2% to 33.7% of adults aged 65 and older.
Ranking:Kentucky ranks 48th in America’s Health Rankings® Senior Report; it was 48th last year. In the 2014 America’s Health Rankings® (all ages), the state ranks 47th.
State Health Department Website: www.chfs.ky.gov
11.82.3
29.62.3
40.253.049.3
-1.680
11.819.134.6
-0.11312.515.1$371
-0.029-0.142
7.1
66.486.779.9
-0.015
95.365.682.996.281.848.594.416.141.025.4
-0.083-0.412
16.630.67.7
33.757.6235724.72.9
-0.355-0.767
15.641.611.216.119.1
4945433437
41.8 52.7
32.522.46.58.77.1
487
414847478
48
474539474532453845
1030234223
161642351847504544434647
43374644464945485048
4.21.5
16.10.9
22.877.253.2
5.142.657.9
108.18.1
$6798
1.1136.889.625.8
97.573.992.498.486.0
316.628.212.965.415.1
4.214.53.0
50.268.214027.01.3
KE
NT
UC
KY
Kentucky
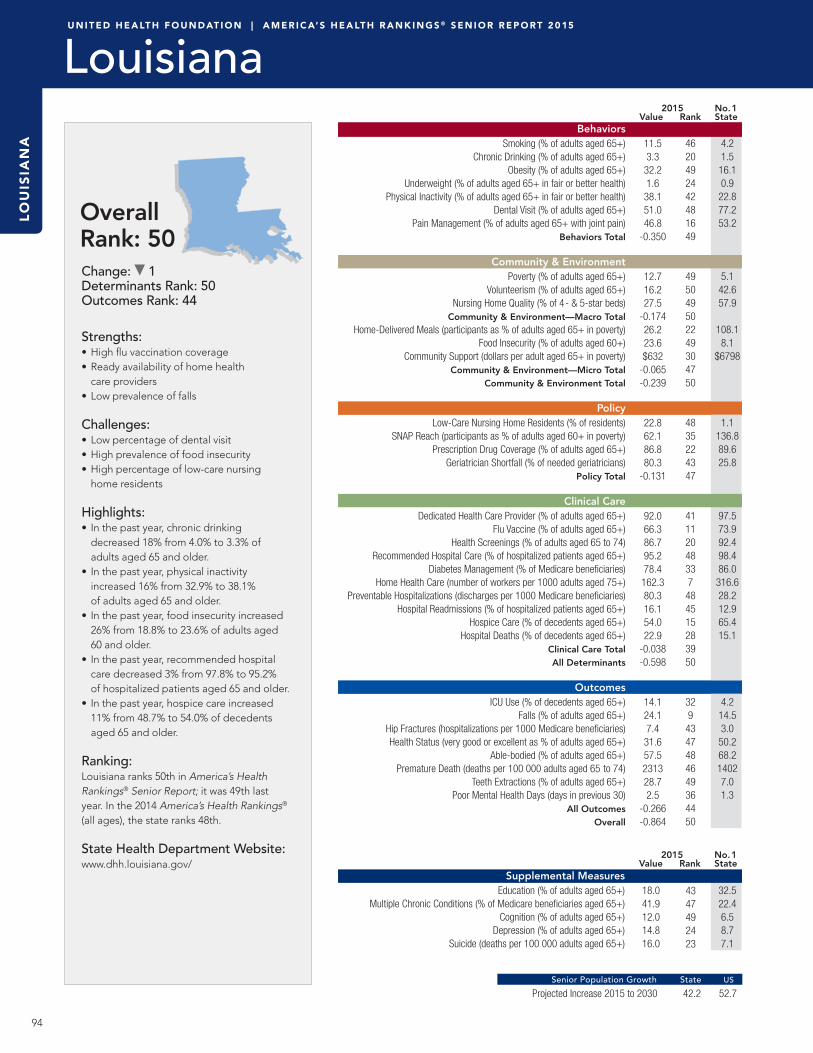
94
U N I T E D H E A LT H F O U N D AT I O N | A M E R I C A’ S H E A LT H R A N K I N G S ® S E N I O R R E P O RT 2 0 15
Projected Increase 2015 to 2030 Senior Population Growth State US
Behaviors Smoking (% of adults aged 65+)
Chronic Drinking (% of adults aged 65+) Obesity (% of adults aged 65+) Underweight (% of adults aged 65+ in fair or better health) Physical Inactivity (% of adults aged 65+ in fair or better health)
Dental Visit (% of adults aged 65+)Pain Management (% of adults aged 65+ with joint pain)
Behaviors Total
Community & EnvironmentPoverty (% of adults aged 65+)
Volunteerism (% of adults aged 65+)Nursing Home Quality (% of 4- & 5-star beds)
Community & Environment—Macro Total Home-Delivered Meals (participants as % of adults aged 65+ in poverty) Food Insecurity (% of adults aged 60+) Community Support (dollars per adult aged 65+ in poverty)
Community & Environment—Micro TotalCommunity & Environment Total
Policy Low-Care Nursing Home Residents (% of residents) SNAP Reach (participants as % of adults aged 60+ in poverty)
Prescription Drug Coverage (% of adults aged 65+) Geriatrician Shortfall (% of needed geriatricians)
Policy Total
Clinical CareDedicated Health Care Provider (% of adults aged 65+)
Flu Vaccine (% of adults aged 65+) Health Screenings (% of adults aged 65 to 74)
Recommended Hospital Care (% of hospitalized patients aged 65+)Diabetes Management (% of Medicare beneficiaries)
Home Health Care (number of workers per 1000 adults aged 75+)Preventable Hospitalizations (discharges per 1000 Medicare beneficiaries)
Hospital Readmissions (% of hospitalized patients aged 65+)Hospice Care (% of decedents aged 65+)
Hospital Deaths (% of decedents aged 65+)Clinical Care Total
All Determinants
OutcomesICU Use (% of decedents aged 65+)
Falls (% of adults aged 65+) Hip Fractures (hospitalizations per 1000 Medicare beneficiaries)
Health Status (very good or excellent as % of adults aged 65+)Able-bodied (% of adults aged 65+)
Premature Death (deaths per 100 000 adults aged 65 to 74)Teeth Extractions (% of adults aged 65+)
Poor Mental Health Days (days in previous 30) All Outcomes Overall
2015 No. 1 Value Rank State
Supplemental MeasuresEducation (% of adults aged 65+)
Multiple Chronic Conditions (% of Medicare beneficiaries aged 65+)Cognition (% of adults aged 65+)
Depression (% of adults aged 65+)Suicide (deaths per 100 000 adults aged 65+)
2015 No. 1 Value Rank State
LO
UIS
IAN
A
Louisiana
OverallRank: 50Change: 1Determinants Rank: 50Outcomes Rank: 44
Strengths:• High flu vaccination coverage• Ready availability of home health
care providers• Low prevalence of falls
Challenges: • Low percentage of dental visit• High prevalence of food insecurity• High percentage of low-care nursing
home residents
Highlights: • In the past year, chronic drinking
decreased 18% from 4.0% to 3.3% of adults aged 65 and older.
• In the past year, physical inactivity increased 16% from 32.9% to 38.1% of adults aged 65 and older.
• In the past year, food insecurity increased 26% from 18.8% to 23.6% of adults aged 60 and older.
• In the past year, recommended hospital care decreased 3% from 97.8% to 95.2% of hospitalized patients aged 65 and older.
• In the past year, hospice care increased 11% from 48.7% to 54.0% of decedents aged 65 and older.
Ranking:Louisiana ranks 50th in America’s Health Rankings® Senior Report; it was 49th last year. In the 2014 America’s Health Rankings® (all ages), the state ranks 48th.
State Health Department Website: www.dhh.louisiana.gov/
11.53.3
32.21.6
38.151.046.8
-0.350
12.716.227.5
-0.17426.223.6$632
-0.065-0.239
22.862.186.880.3
-0.131
92.066.386.795.278.4
162.380.316.154.022.9
-0.038-0.598
14.124.17.4
31.657.5231328.72.5
-0.266-0.864
18.041.912.014.816.0
4347492423
42.2 52.7
32.522.46.58.77.1
4620492442481649
495049502249304750
4835224347
41112048337484515283950
3294347484649364450
4.21.516.10.922.877.253.2
5.142.657.9
108.1
8.1$6798
1.1
136.889.625.8
97.573.992.498.486.0316.628.212.965.415.1
4.214.53.050.268.214027.01.3

95
U N I T E D H E A LT H F O U N D AT I O N | A M E R I C A’ S H E A LT H R A N K I N G S ® S E N I O R R E P O RT 2 0 15
Projected Increase 2015 to 2030 Senior Population Growth State US
Behaviors Smoking (% of adults aged 65+)
Chronic Drinking (% of adults aged 65+) Obesity (% of adults aged 65+) Underweight (% of adults aged 65+ in fair or better health) Physical Inactivity (% of adults aged 65+ in fair or better health)
Dental Visit (% of adults aged 65+)Pain Management (% of adults aged 65+ with joint pain)
Behaviors Total
Community & EnvironmentPoverty (% of adults aged 65+)
Volunteerism (% of adults aged 65+)Nursing Home Quality (% of 4- & 5-star beds)
Community & Environment—Macro Total Home-Delivered Meals (participants as % of adults aged 65+ in poverty) Food Insecurity (% of adults aged 60+) Community Support (dollars per adult aged 65+ in poverty)
Community & Environment—Micro TotalCommunity & Environment Total
Policy Low-Care Nursing Home Residents (% of residents) SNAP Reach (participants as % of adults aged 60+ in poverty)
Prescription Drug Coverage (% of adults aged 65+) Geriatrician Shortfall (% of needed geriatricians)
Policy Total
Clinical CareDedicated Health Care Provider (% of adults aged 65+)
Flu Vaccine (% of adults aged 65+) Health Screenings (% of adults aged 65 to 74)
Recommended Hospital Care (% of hospitalized patients aged 65+)Diabetes Management (% of Medicare beneficiaries)
Home Health Care (number of workers per 1000 adults aged 75+)Preventable Hospitalizations (discharges per 1000 Medicare beneficiaries)
Hospital Readmissions (% of hospitalized patients aged 65+)Hospice Care (% of decedents aged 65+)
Hospital Deaths (% of decedents aged 65+)Clinical Care Total
All Determinants
OutcomesICU Use (% of decedents aged 65+)
Falls (% of adults aged 65+) Hip Fractures (hospitalizations per 1000 Medicare beneficiaries)
Health Status (very good or excellent as % of adults aged 65+)Able-bodied (% of adults aged 65+)
Premature Death (deaths per 100 000 adults aged 65 to 74)Teeth Extractions (% of adults aged 65+)
Poor Mental Health Days (days in previous 30) All Outcomes Overall
2015 No. 1 Value Rank State
Supplemental MeasuresEducation (% of adults aged 65+)
Multiple Chronic Conditions (% of Medicare beneficiaries aged 65+)Cognition (% of adults aged 65+)
Depression (% of adults aged 65+)Suicide (deaths per 100 000 adults aged 65+)
2015 No. 1 Value Rank State
OverallRank: 11Change: 3Determinants Rank: 9Outcomes Rank: 17
Strengths:• High percentage of quality
nursing home beds• Low percentage of low-care
nursing home residents• Low ICU use
Challenges: • Low percentage of dental visit• Low prescription drug coverage• High prevalence of full-mouth
tooth extraction
Highlights: • In the past year, obesity increased 5%
from 25.9% to 27.2% of adults aged 65 and older.
• In the past year, pain management decreased 15% from 50.7% to 42.9% of adults aged 65 and older with joint pain.
• In the past year, community support increased 22% from $525 to $639 per adult aged 65 and older in poverty.
• In the past year, home health care increased 29% from 106.3 to 137.4 home health care workers per 1000 adults aged 75 and older.
• In the past year, premature death decreased 11% from 1902 to 1692 deaths per 100 000 adults aged 65 to 74.
Ranking:Maine ranks 11th in America’s Health Rankings® Senior Report; it was 14th last year. In the 2014 America’s Health Rankings® (all ages), the state ranks 20th.
State Health Department Website: www.maine.gov/dhhs
6.84.8
27.21.5
28.660.942.9
-3.446
8.527.955.2
0.07825.516.1$639
-0.0120.066
1.1
92.384.155.1
0.091
97.063.488.798.482.5
137.455.114.347.223.0
0.0910.243
5.5
29.75.7
48.163.9169222.12.0
0.1000.343
25.133.88.7
16.818.3
1721264034
49.5 52.7
32.522.46.58.77.1
539301812413831
25183
102335283518
1
1142116
2
22121
119
2110332919
3
31174
272142131711
4.21.5
16.10.9
22.877.253.2
5.142.657.9
108.18.1
$6798
1.1136.889.625.8
97.573.992.498.486.0
316.628.212.965.415.1
4.214.53.0
50.268.214027.01.3
MA
INE
Maine

96
U N I T E D H E A LT H F O U N D AT I O N | A M E R I C A’ S H E A LT H R A N K I N G S ® S E N I O R R E P O RT 2 0 15
Projected Increase 2015 to 2030 Senior Population Growth State US
Behaviors Smoking (% of adults aged 65+)
Chronic Drinking (% of adults aged 65+) Obesity (% of adults aged 65+) Underweight (% of adults aged 65+ in fair or better health) Physical Inactivity (% of adults aged 65+ in fair or better health)
Dental Visit (% of adults aged 65+)Pain Management (% of adults aged 65+ with joint pain)
Behaviors Total
Community & EnvironmentPoverty (% of adults aged 65+)
Volunteerism (% of adults aged 65+)Nursing Home Quality (% of 4- & 5-star beds)
Community & Environment—Macro Total Home-Delivered Meals (participants as % of adults aged 65+ in poverty) Food Insecurity (% of adults aged 60+) Community Support (dollars per adult aged 65+ in poverty)
Community & Environment—Micro TotalCommunity & Environment Total
Policy Low-Care Nursing Home Residents (% of residents) SNAP Reach (participants as % of adults aged 60+ in poverty)
Prescription Drug Coverage (% of adults aged 65+) Geriatrician Shortfall (% of needed geriatricians)
Policy Total
Clinical CareDedicated Health Care Provider (% of adults aged 65+)
Flu Vaccine (% of adults aged 65+) Health Screenings (% of adults aged 65 to 74)
Recommended Hospital Care (% of hospitalized patients aged 65+)Diabetes Management (% of Medicare beneficiaries)
Home Health Care (number of workers per 1000 adults aged 75+)Preventable Hospitalizations (discharges per 1000 Medicare beneficiaries)
Hospital Readmissions (% of hospitalized patients aged 65+)Hospice Care (% of decedents aged 65+)
Hospital Deaths (% of decedents aged 65+)Clinical Care Total
All Determinants
OutcomesICU Use (% of decedents aged 65+)
Falls (% of adults aged 65+) Hip Fractures (hospitalizations per 1000 Medicare beneficiaries)
Health Status (very good or excellent as % of adults aged 65+)Able-bodied (% of adults aged 65+)
Premature Death (deaths per 100 000 adults aged 65 to 74)Teeth Extractions (% of adults aged 65+)
Poor Mental Health Days (days in previous 30) All Outcomes Overall
2015 No. 1 Value Rank State
Supplemental MeasuresEducation (% of adults aged 65+)
Multiple Chronic Conditions (% of Medicare beneficiaries aged 65+)Cognition (% of adults aged 65+)
Depression (% of adults aged 65+)Suicide (deaths per 100 000 adults aged 65+)
2015 No. 1 Value Rank State
MA
RY
LA
ND
Maryland
OverallRank: 13Change: 2Determinants Rank: 13Outcomes Rank: 11
Strengths:• High percentage of dental visit• Low geriatrician shortfall• Low prevalence of falls
Challenges: • Limited availability of home-
delivered meals• Low prescription drug coverage• Low percentage of recommended
hospital care
Highlights: • In the past 2 years, physical inactivity
increased 19% from 28.5% to 34.0% of adults aged 65 and older.
• In the past year, pain management decreased 24% from 60.7% to 45.9% of adults aged 65 and older with joint pain.
• In the past year, food insecurity decreased 12% from 13.5% to 11.9% of adults aged 60 and older.
• In the past year, community support decreased 49% from $609 to $314 per adult aged 65 and older in poverty.
• In the past year, hip fractures decreased 20% from 6.9 to 5.5 hospitalizations per 1000 Medicare beneficiaries.
Ranking:Maryland ranks 13th in America’s Health Rankings® Senior Report; it was 11th last year. In the 2014 America’s Health Rankings®
(all ages), the state ranks 16th.
State Health Department Website: www.dhmh.maryland.gov
8.74.0
27.01.4
34.071.645.9
-1.404
7.728.144.1
0.0489.6
11.9$314
-0.0050.043
8.2
95.882.839.8
0.071
95.666.990.189.982.172.853.8NA
47.323.7
0.0000.152
12.523.45.5
42.467.0169514.52.1
0.1400.293
29.838.18.4
13.311.9
33421910
47.6 52.7
32.522.46.58.77.1
2226281529102119
13172719497483225
121045210
1210550153718NA31353113
26682062216161113
4.21.516.10.922.877.253.2
5.142.657.9
108.1
8.1$6798
1.1
136.889.625.8
97.573.992.498.486.0316.628.212.965.415.1
4.214.53.050.268.214027.01.3

97
U N I T E D H E A LT H F O U N D AT I O N | A M E R I C A’ S H E A LT H R A N K I N G S ® S E N I O R R E P O RT 2 0 15
Projected Increase 2015 to 2030 Senior Population Growth State US
Behaviors Smoking (% of adults aged 65+)
Chronic Drinking (% of adults aged 65+) Obesity (% of adults aged 65+) Underweight (% of adults aged 65+ in fair or better health) Physical Inactivity (% of adults aged 65+ in fair or better health)
Dental Visit (% of adults aged 65+)Pain Management (% of adults aged 65+ with joint pain)
Behaviors Total
Community & EnvironmentPoverty (% of adults aged 65+)
Volunteerism (% of adults aged 65+)Nursing Home Quality (% of 4- & 5-star beds)
Community & Environment—Macro Total Home-Delivered Meals (participants as % of adults aged 65+ in poverty) Food Insecurity (% of adults aged 60+) Community Support (dollars per adult aged 65+ in poverty)
Community & Environment—Micro TotalCommunity & Environment Total
Policy Low-Care Nursing Home Residents (% of residents) SNAP Reach (participants as % of adults aged 60+ in poverty)
Prescription Drug Coverage (% of adults aged 65+) Geriatrician Shortfall (% of needed geriatricians)
Policy Total
Clinical CareDedicated Health Care Provider (% of adults aged 65+)
Flu Vaccine (% of adults aged 65+) Health Screenings (% of adults aged 65 to 74)
Recommended Hospital Care (% of hospitalized patients aged 65+)Diabetes Management (% of Medicare beneficiaries)
Home Health Care (number of workers per 1000 adults aged 75+)Preventable Hospitalizations (discharges per 1000 Medicare beneficiaries)
Hospital Readmissions (% of hospitalized patients aged 65+)Hospice Care (% of decedents aged 65+)
Hospital Deaths (% of decedents aged 65+)Clinical Care Total
All Determinants
OutcomesICU Use (% of decedents aged 65+)
Falls (% of adults aged 65+) Hip Fractures (hospitalizations per 1000 Medicare beneficiaries)
Health Status (very good or excellent as % of adults aged 65+)Able-bodied (% of adults aged 65+)
Premature Death (deaths per 100 000 adults aged 65 to 74)Teeth Extractions (% of adults aged 65+)
Poor Mental Health Days (days in previous 30) All Outcomes Overall
2015 No. 1 Value Rank State
Supplemental MeasuresEducation (% of adults aged 65+)
Multiple Chronic Conditions (% of Medicare beneficiaries aged 65+)Cognition (% of adults aged 65+)
Depression (% of adults aged 65+)Suicide (deaths per 100 000 adults aged 65+)
2015 No. 1 Value Rank State
Overall Rank: 6Change: 1Determinants Rank: 4Outcomes Rank: 7
Strengths:• High percentage of dental visit• High community-support expenditures• Low geriatrician shortfall
Challenges: • High prevalence of chronic drinking• Low volunteerism• High percentage of hospital deaths
Highlights: • In the past year, smoking increased
14% from 8.4% to 9.6% of adults aged 65 and older.
• In the past year, underweight seniors decreased 22% from 1.8% to 1.4% of adults aged 65 and older.
• In the past year, physical inactivity increased 27% from 26.1% to 33.1% of adults aged 65 and older.
• In the past year, pain management decreased 22% from 56.5% to 44.1% of adults aged 65 and older with joint pain.
• In the past year, hip fractures decreased 17% from 6.5 to 5.4 hospitalizations per 1000 Medicare beneficiaries.
Ranking:Massachusetts ranks 6th in America’s Health Rankings® Senior Report; it was 5th last year. In the 2014 America’s Health Rankings® (all ages), the state ranks 3rd.
State Health Department Website: www.mass.gov/dph
9.65.5
23.81.4
33.173.744.1
-0.237
9.222.352.1
0.02253.111.6
$38390.1450.167
10.3
107.187.140.8
0.138
95.966.191.796.485.1
106.062.715.546.124.5
0.0400.359
8.7
25.55.4
45.666.0155315.52.3
0.1580.517
27.837.38.4
15.67.1
82821301
42.7 52.7
32.522.46.58.77.1
32478
15255
3225
31356
2366338
205
1833
8
132
282
1936313638144
15134
11126
202776
4.21.5
16.10.9
22.877.253.2
5.142.657.9
108.18.1
$6798
1.1136.889.625.8
97.573.992.498.486.0
316.628.212.965.415.1
4.214.53.0
50.268.214027.01.3
MA
SS
AC
HU
SE
TT
S
Massachusetts

98
U N I T E D H E A LT H F O U N D AT I O N | A M E R I C A’ S H E A LT H R A N K I N G S ® S E N I O R R E P O RT 2 0 15
Projected Increase 2015 to 2030 Senior Population Growth State US
Behaviors Smoking (% of adults aged 65+)
Chronic Drinking (% of adults aged 65+) Obesity (% of adults aged 65+) Underweight (% of adults aged 65+ in fair or better health) Physical Inactivity (% of adults aged 65+ in fair or better health)
Dental Visit (% of adults aged 65+)Pain Management (% of adults aged 65+ with joint pain)
Behaviors Total
Community & EnvironmentPoverty (% of adults aged 65+)
Volunteerism (% of adults aged 65+)Nursing Home Quality (% of 4- & 5-star beds)
Community & Environment—Macro Total Home-Delivered Meals (participants as % of adults aged 65+ in poverty) Food Insecurity (% of adults aged 60+) Community Support (dollars per adult aged 65+ in poverty)
Community & Environment—Micro TotalCommunity & Environment Total
Policy Low-Care Nursing Home Residents (% of residents) SNAP Reach (participants as % of adults aged 60+ in poverty)
Prescription Drug Coverage (% of adults aged 65+) Geriatrician Shortfall (% of needed geriatricians)
Policy Total
Clinical CareDedicated Health Care Provider (% of adults aged 65+)
Flu Vaccine (% of adults aged 65+) Health Screenings (% of adults aged 65 to 74)
Recommended Hospital Care (% of hospitalized patients aged 65+)Diabetes Management (% of Medicare beneficiaries)
Home Health Care (number of workers per 1000 adults aged 75+)Preventable Hospitalizations (discharges per 1000 Medicare beneficiaries)
Hospital Readmissions (% of hospitalized patients aged 65+)Hospice Care (% of decedents aged 65+)
Hospital Deaths (% of decedents aged 65+)Clinical Care Total
All Determinants
OutcomesICU Use (% of decedents aged 65+)
Falls (% of adults aged 65+) Hip Fractures (hospitalizations per 1000 Medicare beneficiaries)
Health Status (very good or excellent as % of adults aged 65+)Able-bodied (% of adults aged 65+)
Premature Death (deaths per 100 000 adults aged 65 to 74)Teeth Extractions (% of adults aged 65+)
Poor Mental Health Days (days in previous 30) All Outcomes Overall
2015 No. 1 Value Rank State
Supplemental MeasuresEducation (% of adults aged 65+)
Multiple Chronic Conditions (% of Medicare beneficiaries aged 65+)Cognition (% of adults aged 65+)
Depression (% of adults aged 65+)Suicide (deaths per 100 000 adults aged 65+)
2015 No. 1 Value Rank State
MIC
HIG
AN
Michigan
OverallRank: 17Change: 3Determinants Rank: 19Outcomes Rank: 18
Strengths:• Low prevalence of underweight seniors• Ready availability of home-delivered meals• Low prevalence of falls
Challenges: • High prevalence of obesity• Low prescription drug coverage• Low flu vaccination coverage
Highlights: • In the past year, smoking increased
22% from 7.7% to 9.4% of adults aged 65 and older.
• In the past year, pain management decreased 13% from 51.3% to 44.5% of adults aged 65 and older with joint pain.
• In the past year, food insecurity decreased 6% from 12.9% to 12.1% of adults aged 60 and older.
• In the past 2 years, home health care increased 26% from 75.0 to 94.7 home health care workers per 1000 adults aged 75 and older.
• In the past year, hospital deaths decreased 10% from 21.8% to 19.7% of decedents aged 65 and older.
Ranking:Michigan ranks 17th in America’s Health Rankings® Senior Report; it was 20th last year. In the 2014 America’s Health Rankings® (all ages), the state ranks 34th.
State Health Department Website: www.michigan.gov/mdch
9.44.3
29.80.9
30.871.744.5
1.323
8.224.547.5
0.03443.312.1$8150.0580.092
10.380.783.265.6
-0.031
96.856.887.296.479.994.764.515.856.819.7
0.0150.105
13.916.25.6
42.463.7190813.32.2
0.0960.201
20.341.89.2
16.913.2
3446314115
38.1 52.7
32.522.46.58.77.1
30304211693020
2130132299201015
1918432129
34118282524383811132519
312122029349211817
4.21.516.10.922.877.253.2
5.142.657.9
108.1
8.1$6798
1.1
136.889.625.8
97.573.992.498.486.0316.628.212.965.415.1
4.214.53.050.268.214027.01.3

99
U N I T E D H E A LT H F O U N D AT I O N | A M E R I C A’ S H E A LT H R A N K I N G S ® S E N I O R R E P O RT 2 0 15
Projected Increase 2015 to 2030 Senior Population Growth State US
Behaviors Smoking (% of adults aged 65+)
Chronic Drinking (% of adults aged 65+) Obesity (% of adults aged 65+) Underweight (% of adults aged 65+ in fair or better health) Physical Inactivity (% of adults aged 65+ in fair or better health)
Dental Visit (% of adults aged 65+)Pain Management (% of adults aged 65+ with joint pain)
Behaviors Total
Community & EnvironmentPoverty (% of adults aged 65+)
Volunteerism (% of adults aged 65+)Nursing Home Quality (% of 4- & 5-star beds)
Community & Environment—Macro Total Home-Delivered Meals (participants as % of adults aged 65+ in poverty) Food Insecurity (% of adults aged 60+) Community Support (dollars per adult aged 65+ in poverty)
Community & Environment—Micro TotalCommunity & Environment Total
Policy Low-Care Nursing Home Residents (% of residents) SNAP Reach (participants as % of adults aged 60+ in poverty)
Prescription Drug Coverage (% of adults aged 65+) Geriatrician Shortfall (% of needed geriatricians)
Policy Total
Clinical CareDedicated Health Care Provider (% of adults aged 65+)
Flu Vaccine (% of adults aged 65+) Health Screenings (% of adults aged 65 to 74)
Recommended Hospital Care (% of hospitalized patients aged 65+)Diabetes Management (% of Medicare beneficiaries)
Home Health Care (number of workers per 1000 adults aged 75+)Preventable Hospitalizations (discharges per 1000 Medicare beneficiaries)
Hospital Readmissions (% of hospitalized patients aged 65+)Hospice Care (% of decedents aged 65+)
Hospital Deaths (% of decedents aged 65+)Clinical Care Total
All Determinants
OutcomesICU Use (% of decedents aged 65+)
Falls (% of adults aged 65+) Hip Fractures (hospitalizations per 1000 Medicare beneficiaries)
Health Status (very good or excellent as % of adults aged 65+)Able-bodied (% of adults aged 65+)
Premature Death (deaths per 100 000 adults aged 65 to 74)Teeth Extractions (% of adults aged 65+)
Poor Mental Health Days (days in previous 30) All Outcomes Overall
2015 No. 1 Value Rank State
Supplemental MeasuresEducation (% of adults aged 65+)
Multiple Chronic Conditions (% of Medicare beneficiaries aged 65+)Cognition (% of adults aged 65+)
Depression (% of adults aged 65+)Suicide (deaths per 100 000 adults aged 65+)
2015 No. 1 Value Rank State
OverallRank: 3Change: 2Determinants Rank: 6Outcomes Rank: 1
Strengths:• High volunteerism• Low prevalence of food insecurity• Few poor mental health days
Challenges: • Low community-support expenditures• Low SNAP enrollment• Low percentage of seniors with
dedicated provider
Highlights: • In the past year, obesity decreased
6% from 26.3% to 24.8% of adults aged 65 and older.
• In the past year, physical inactivity increased 28% from 26.2% to 33.5% of adults aged 65 and older.
• In the past year, pain management decreased 26% from 53.3% to 39.4% of adults aged 65 and older with joint pain.
• In the past 2 years, poverty decreased 6% from 8.3% to 7.8% of adults aged 65 and older.
• In the past year, recommended hospital care decreased 2% from 98.1% to 96.1% of hospitalized patients aged 65 and older.
Ranking:Minnesota ranks 3rd in America’s Health Rankings® Senior Report; it was 1st last year. In the 2014 America’s Health Rankings® (all ages), the state ranks 6th.
State Health Department Website: www.health.state.mn.us
9.34.0
24.81.0
33.577.239.4
3.963
7.839.049.2
0.12520.08.1
$6150.0560.181
12.958.389.656.3
0.041
90.766.089.896.182.8
264.544.914.849.220.7
0.0680.336
6.5
25.65.6
45.668.2150612.01.3
0.2800.616
23.727.66.7
13.412.8
2293
1114
54.1 52.7
32.522.46.58.77.1
2926102
261
4815
15292
281
31116
31381
1213
45146
371027
20281866
6
141211144113
4.21.5
16.10.9
22.877.253.2
5.142.657.9
108.18.1
$6798
1.1136.889.625.8
97.573.992.498.486.0
316.628.212.965.415.1
4.214.53.0
50.268.214027.01.3
MIN
NE
SO
TA
Minnesota
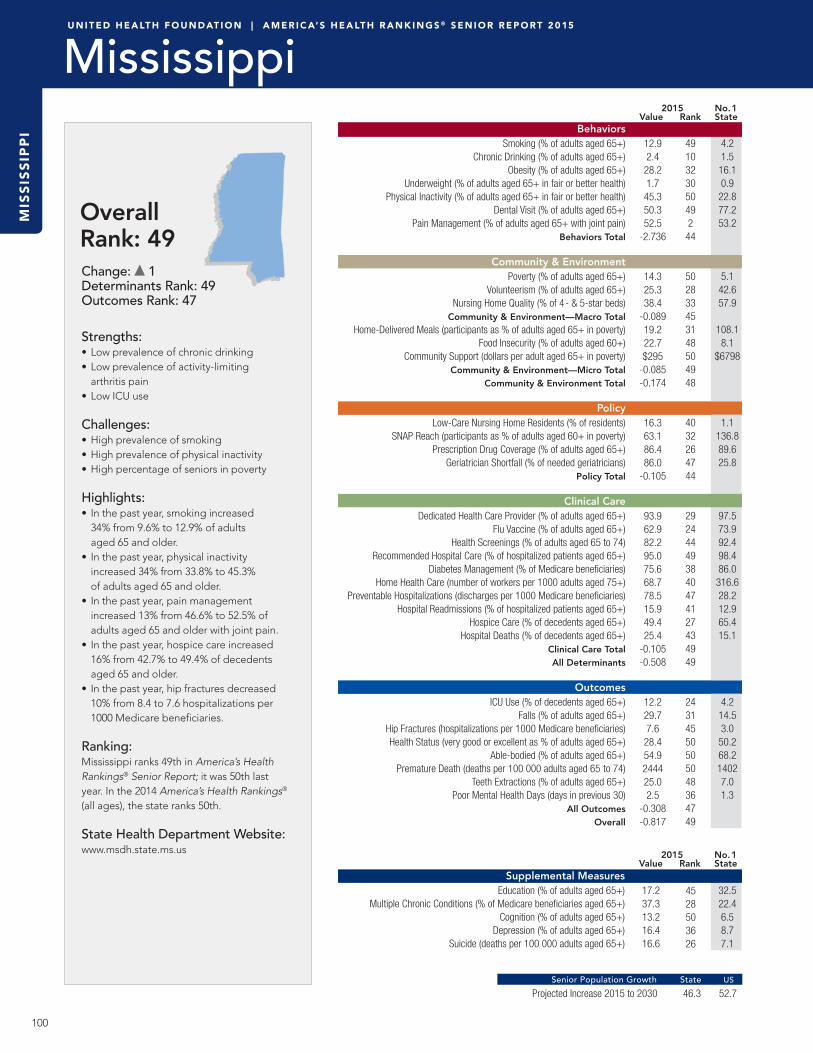
100
U N I T E D H E A LT H F O U N D AT I O N | A M E R I C A’ S H E A LT H R A N K I N G S ® S E N I O R R E P O RT 2 0 15
Projected Increase 2015 to 2030 Senior Population Growth State US
Behaviors Smoking (% of adults aged 65+)
Chronic Drinking (% of adults aged 65+) Obesity (% of adults aged 65+) Underweight (% of adults aged 65+ in fair or better health) Physical Inactivity (% of adults aged 65+ in fair or better health)
Dental Visit (% of adults aged 65+)Pain Management (% of adults aged 65+ with joint pain)
Behaviors Total
Community & EnvironmentPoverty (% of adults aged 65+)
Volunteerism (% of adults aged 65+)Nursing Home Quality (% of 4- & 5-star beds)
Community & Environment—Macro Total Home-Delivered Meals (participants as % of adults aged 65+ in poverty) Food Insecurity (% of adults aged 60+) Community Support (dollars per adult aged 65+ in poverty)
Community & Environment—Micro TotalCommunity & Environment Total
Policy Low-Care Nursing Home Residents (% of residents) SNAP Reach (participants as % of adults aged 60+ in poverty)
Prescription Drug Coverage (% of adults aged 65+) Geriatrician Shortfall (% of needed geriatricians)
Policy Total
Clinical CareDedicated Health Care Provider (% of adults aged 65+)
Flu Vaccine (% of adults aged 65+) Health Screenings (% of adults aged 65 to 74)
Recommended Hospital Care (% of hospitalized patients aged 65+)Diabetes Management (% of Medicare beneficiaries)
Home Health Care (number of workers per 1000 adults aged 75+)Preventable Hospitalizations (discharges per 1000 Medicare beneficiaries)
Hospital Readmissions (% of hospitalized patients aged 65+)Hospice Care (% of decedents aged 65+)
Hospital Deaths (% of decedents aged 65+)Clinical Care Total
All Determinants
OutcomesICU Use (% of decedents aged 65+)
Falls (% of adults aged 65+) Hip Fractures (hospitalizations per 1000 Medicare beneficiaries)
Health Status (very good or excellent as % of adults aged 65+)Able-bodied (% of adults aged 65+)
Premature Death (deaths per 100 000 adults aged 65 to 74)Teeth Extractions (% of adults aged 65+)
Poor Mental Health Days (days in previous 30) All Outcomes Overall
2015 No. 1 Value Rank State
Supplemental MeasuresEducation (% of adults aged 65+)
Multiple Chronic Conditions (% of Medicare beneficiaries aged 65+)Cognition (% of adults aged 65+)
Depression (% of adults aged 65+)Suicide (deaths per 100 000 adults aged 65+)
2015 No. 1 Value Rank State
MIS
SIS
SIP
PI
Mississippi
OverallRank: 49Change: 1Determinants Rank: 49Outcomes Rank: 47
Strengths:• Low prevalence of chronic drinking• Low prevalence of activity-limiting
arthritis pain• Low ICU use
Challenges: • High prevalence of smoking• High prevalence of physical inactivity• High percentage of seniors in poverty
Highlights: • In the past year, smoking increased
34% from 9.6% to 12.9% of adults aged 65 and older.
• In the past year, physical inactivity increased 34% from 33.8% to 45.3% of adults aged 65 and older.
• In the past year, pain management increased 13% from 46.6% to 52.5% of adults aged 65 and older with joint pain.
• In the past year, hospice care increased 16% from 42.7% to 49.4% of decedents aged 65 and older.
• In the past year, hip fractures decreased 10% from 8.4 to 7.6 hospitalizations per 1000 Medicare beneficiaries.
Ranking:Mississippi ranks 49th in America’s Health Rankings® Senior Report; it was 50th last year. In the 2014 America’s Health Rankings® (all ages), the state ranks 50th.
State Health Department Website: www.msdh.state.ms.us
12.92.4
28.21.7
45.350.352.5
-2.736
14.325.338.4
-0.08919.222.7$295
-0.085-0.174
16.363.186.486.0
-0.105
93.962.982.295.075.668.778.515.949.425.4
-0.105-0.508
12.229.77.6
28.454.9244425.02.5
-0.308-0.817
17.237.313.216.416.6
4528503626
46.3 52.7
32.522.46.58.77.1
491032305049244
502833453148504948
4032264744
292444493840474127434949
24314550505048364749
4.21.516.10.922.877.253.2
5.142.657.9
108.1
8.1$6798
1.1
136.889.625.8
97.573.992.498.486.0316.628.212.965.415.1
4.214.53.050.268.214027.01.3

101
U N I T E D H E A LT H F O U N D AT I O N | A M E R I C A’ S H E A LT H R A N K I N G S ® S E N I O R R E P O RT 2 0 15
Projected Increase 2015 to 2030 Senior Population Growth State US
Behaviors Smoking (% of adults aged 65+)
Chronic Drinking (% of adults aged 65+) Obesity (% of adults aged 65+) Underweight (% of adults aged 65+ in fair or better health) Physical Inactivity (% of adults aged 65+ in fair or better health)
Dental Visit (% of adults aged 65+)Pain Management (% of adults aged 65+ with joint pain)
Behaviors Total
Community & EnvironmentPoverty (% of adults aged 65+)
Volunteerism (% of adults aged 65+)Nursing Home Quality (% of 4- & 5-star beds)
Community & Environment—Macro Total Home-Delivered Meals (participants as % of adults aged 65+ in poverty) Food Insecurity (% of adults aged 60+) Community Support (dollars per adult aged 65+ in poverty)
Community & Environment—Micro TotalCommunity & Environment Total
Policy Low-Care Nursing Home Residents (% of residents) SNAP Reach (participants as % of adults aged 60+ in poverty)
Prescription Drug Coverage (% of adults aged 65+) Geriatrician Shortfall (% of needed geriatricians)
Policy Total
Clinical CareDedicated Health Care Provider (% of adults aged 65+)
Flu Vaccine (% of adults aged 65+) Health Screenings (% of adults aged 65 to 74)
Recommended Hospital Care (% of hospitalized patients aged 65+)Diabetes Management (% of Medicare beneficiaries)
Home Health Care (number of workers per 1000 adults aged 75+)Preventable Hospitalizations (discharges per 1000 Medicare beneficiaries)
Hospital Readmissions (% of hospitalized patients aged 65+)Hospice Care (% of decedents aged 65+)
Hospital Deaths (% of decedents aged 65+)Clinical Care Total
All Determinants
OutcomesICU Use (% of decedents aged 65+)
Falls (% of adults aged 65+) Hip Fractures (hospitalizations per 1000 Medicare beneficiaries)
Health Status (very good or excellent as % of adults aged 65+)Able-bodied (% of adults aged 65+)
Premature Death (deaths per 100 000 adults aged 65 to 74)Teeth Extractions (% of adults aged 65+)
Poor Mental Health Days (days in previous 30) All Outcomes Overall
2015 No. 1 Value Rank State
Supplemental MeasuresEducation (% of adults aged 65+)
Multiple Chronic Conditions (% of Medicare beneficiaries aged 65+)Cognition (% of adults aged 65+)
Depression (% of adults aged 65+)Suicide (deaths per 100 000 adults aged 65+)
2015 No. 1 Value Rank State
OverallRank: 38Change: 1Determinants Rank: 35Outcomes Rank: 42
Strengths:• Low prevalence of underweight seniors• Ready availability of home-delivered meals• High flu vaccination coverage
Challenges: • High prevalence of smoking• High percentage of low-care
nursing home residents• High prevalence of full-mouth tooth
extraction
Highlights: • In the past year, obesity decreased 5%
from 28.1% to 26.7% of adults aged 65 and older.
• In the past year, pain management decreased 16% from 55.2% to 46.5% of adults aged 65 and older with joint pain.
• In the past year, food insecurity increased 5% from 15.8% to 16.6% of adults aged 60 and older.
• In the past 2 years, flu vaccine coverage increased 10% from 63.1% to 69.5% of adults aged 65 and older.
• In the past year, home health care increased 22% from 82.8 to 100.6 home health care workers per 1000 adults aged 75 and older.
Ranking:Missouri ranks 38th in America’s Health Rankings® Senior Report; it was 39th last year. In the 2014 America’s Health Rankings® (all ages), the state ranks 36th.
State Health Department Website: www.dhss.mo.gov
10.73.5
26.71.1
33.858.746.5
-0.571
9.028.738.0
0.00340.416.6$7380.0080.011
21.161.687.366.8
-0.076
95.669.586.196.879.7
100.664.715.652.423.1
0.024-0.062
14.331.16.9
38.162.4202524.92.2
-0.152-0.214
18.937.69.0
16.716.8
3830293928
41.1 52.7
32.522.46.58.77.1
4222246
28431735
301534251040252629
4736172542
126
27172622393418321935
34413735353947214238
4.21.5
16.10.9
22.877.253.2
5.142.657.9
108.18.1
$6798
1.1136.889.625.8
97.573.992.498.486.0
316.628.212.965.415.1
4.214.53.0
50.268.214027.01.3
MIS
SO
UR
I
Missouri
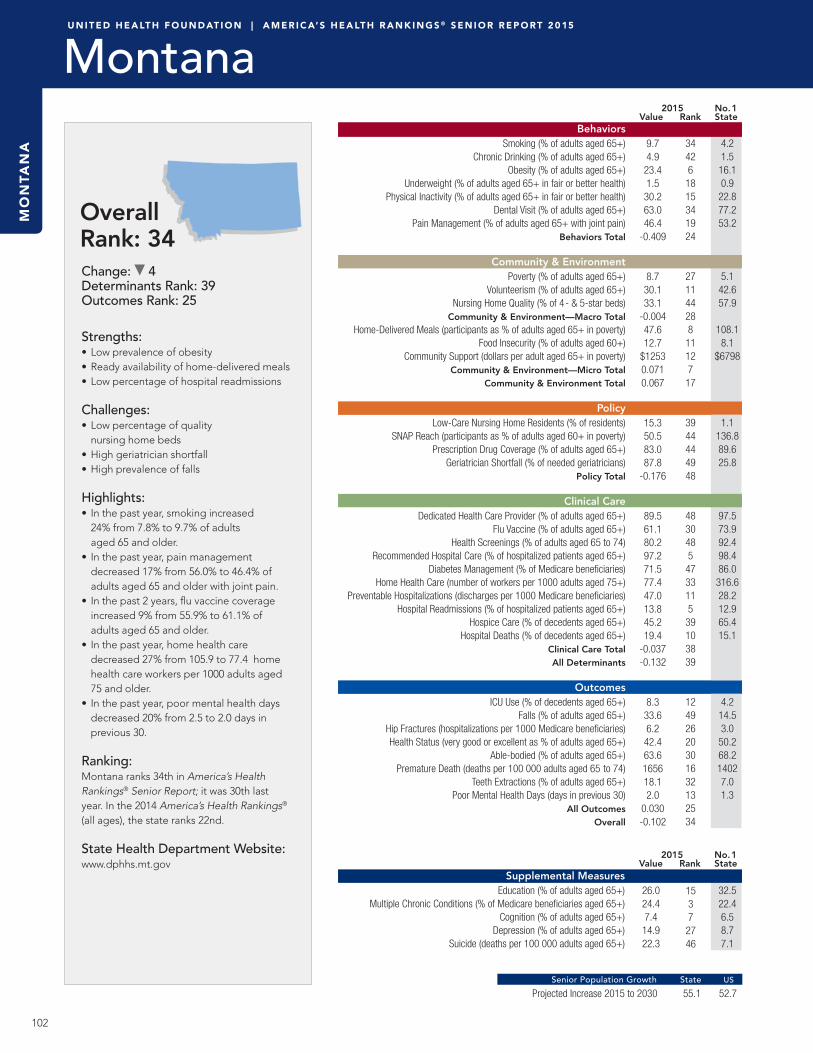
102
U N I T E D H E A LT H F O U N D AT I O N | A M E R I C A’ S H E A LT H R A N K I N G S ® S E N I O R R E P O RT 2 0 15
Projected Increase 2015 to 2030 Senior Population Growth State US
Behaviors Smoking (% of adults aged 65+)
Chronic Drinking (% of adults aged 65+) Obesity (% of adults aged 65+) Underweight (% of adults aged 65+ in fair or better health) Physical Inactivity (% of adults aged 65+ in fair or better health)
Dental Visit (% of adults aged 65+)Pain Management (% of adults aged 65+ with joint pain)
Behaviors Total
Community & EnvironmentPoverty (% of adults aged 65+)
Volunteerism (% of adults aged 65+)Nursing Home Quality (% of 4- & 5-star beds)
Community & Environment—Macro Total Home-Delivered Meals (participants as % of adults aged 65+ in poverty) Food Insecurity (% of adults aged 60+) Community Support (dollars per adult aged 65+ in poverty)
Community & Environment—Micro TotalCommunity & Environment Total
Policy Low-Care Nursing Home Residents (% of residents) SNAP Reach (participants as % of adults aged 60+ in poverty)
Prescription Drug Coverage (% of adults aged 65+) Geriatrician Shortfall (% of needed geriatricians)
Policy Total
Clinical CareDedicated Health Care Provider (% of adults aged 65+)
Flu Vaccine (% of adults aged 65+) Health Screenings (% of adults aged 65 to 74)
Recommended Hospital Care (% of hospitalized patients aged 65+)Diabetes Management (% of Medicare beneficiaries)
Home Health Care (number of workers per 1000 adults aged 75+)Preventable Hospitalizations (discharges per 1000 Medicare beneficiaries)
Hospital Readmissions (% of hospitalized patients aged 65+)Hospice Care (% of decedents aged 65+)
Hospital Deaths (% of decedents aged 65+)Clinical Care Total
All Determinants
OutcomesICU Use (% of decedents aged 65+)
Falls (% of adults aged 65+) Hip Fractures (hospitalizations per 1000 Medicare beneficiaries)
Health Status (very good or excellent as % of adults aged 65+)Able-bodied (% of adults aged 65+)
Premature Death (deaths per 100 000 adults aged 65 to 74)Teeth Extractions (% of adults aged 65+)
Poor Mental Health Days (days in previous 30) All Outcomes Overall
2015 No. 1 Value Rank State
Supplemental MeasuresEducation (% of adults aged 65+)
Multiple Chronic Conditions (% of Medicare beneficiaries aged 65+)Cognition (% of adults aged 65+)
Depression (% of adults aged 65+)Suicide (deaths per 100 000 adults aged 65+)
2015 No. 1 Value Rank State
MO
NTA
NA
Montana
OverallRank: 34Change: 4Determinants Rank: 39Outcomes Rank: 25
Strengths:• Low prevalence of obesity• Ready availability of home-delivered meals• Low percentage of hospital readmissions
Challenges: • Low percentage of quality
nursing home beds• High geriatrician shortfall• High prevalence of falls
Highlights: • In the past year, smoking increased
24% from 7.8% to 9.7% of adults aged 65 and older.
• In the past year, pain management decreased 17% from 56.0% to 46.4% of adults aged 65 and older with joint pain.
• In the past 2 years, flu vaccine coverage increased 9% from 55.9% to 61.1% of adults aged 65 and older.
• In the past year, home health care decreased 27% from 105.9 to 77.4 home health care workers per 1000 adults aged 75 and older.
• In the past year, poor mental health days decreased 20% from 2.5 to 2.0 days in previous 30.
Ranking:Montana ranks 34th in America’s Health Rankings® Senior Report; it was 30th last year. In the 2014 America’s Health Rankings® (all ages), the state ranks 22nd.
State Health Department Website: www.dphhs.mt.gov
9.74.9
23.41.5
30.263.046.4
-0.409
8.730.133.1
-0.00447.612.7
$12530.0710.067
15.350.583.087.8
-0.176
89.561.180.297.271.577.447.013.845.219.4
-0.037-0.132
8.3
33.66.2
42.463.6165618.12.0
0.030-0.102
26.024.47.4
14.922.3
15372746
55.1 52.7
32.522.46.58.77.1
344261815341924
2711442881112717
3944444948
4830485473311539103839
12492620301632132534
4.21.516.10.922.877.253.2
5.142.657.9
108.1
8.1$6798
1.1
136.889.625.8
97.573.992.498.486.0316.628.212.965.415.1
4.214.53.050.268.214027.01.3
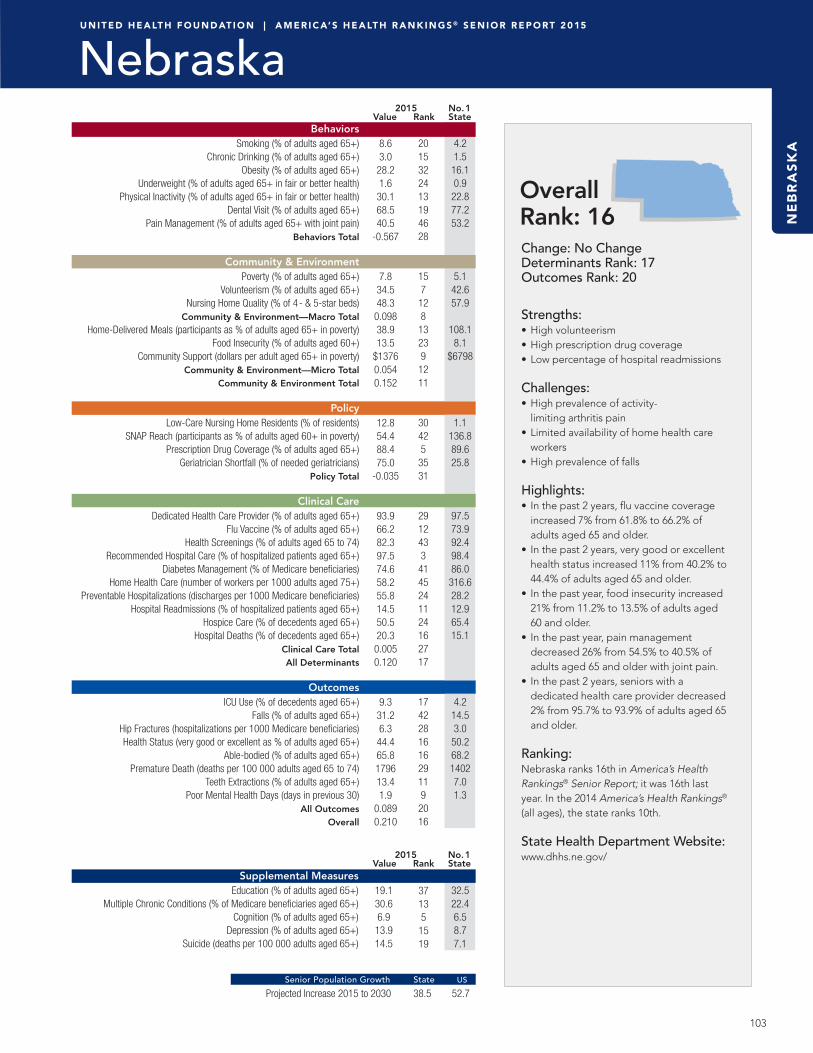
103
U N I T E D H E A LT H F O U N D AT I O N | A M E R I C A’ S H E A LT H R A N K I N G S ® S E N I O R R E P O RT 2 0 15
Projected Increase 2015 to 2030 Senior Population Growth State US
Behaviors Smoking (% of adults aged 65+)
Chronic Drinking (% of adults aged 65+) Obesity (% of adults aged 65+) Underweight (% of adults aged 65+ in fair or better health) Physical Inactivity (% of adults aged 65+ in fair or better health)
Dental Visit (% of adults aged 65+)Pain Management (% of adults aged 65+ with joint pain)
Behaviors Total
Community & EnvironmentPoverty (% of adults aged 65+)
Volunteerism (% of adults aged 65+)Nursing Home Quality (% of 4- & 5-star beds)
Community & Environment—Macro Total Home-Delivered Meals (participants as % of adults aged 65+ in poverty) Food Insecurity (% of adults aged 60+) Community Support (dollars per adult aged 65+ in poverty)
Community & Environment—Micro TotalCommunity & Environment Total
Policy Low-Care Nursing Home Residents (% of residents) SNAP Reach (participants as % of adults aged 60+ in poverty)
Prescription Drug Coverage (% of adults aged 65+) Geriatrician Shortfall (% of needed geriatricians)
Policy Total
Clinical CareDedicated Health Care Provider (% of adults aged 65+)
Flu Vaccine (% of adults aged 65+) Health Screenings (% of adults aged 65 to 74)
Recommended Hospital Care (% of hospitalized patients aged 65+)Diabetes Management (% of Medicare beneficiaries)
Home Health Care (number of workers per 1000 adults aged 75+)Preventable Hospitalizations (discharges per 1000 Medicare beneficiaries)
Hospital Readmissions (% of hospitalized patients aged 65+)Hospice Care (% of decedents aged 65+)
Hospital Deaths (% of decedents aged 65+)Clinical Care Total
All Determinants
OutcomesICU Use (% of decedents aged 65+)
Falls (% of adults aged 65+) Hip Fractures (hospitalizations per 1000 Medicare beneficiaries)
Health Status (very good or excellent as % of adults aged 65+)Able-bodied (% of adults aged 65+)
Premature Death (deaths per 100 000 adults aged 65 to 74)Teeth Extractions (% of adults aged 65+)
Poor Mental Health Days (days in previous 30) All Outcomes Overall
2015 No. 1 Value Rank State
Supplemental MeasuresEducation (% of adults aged 65+)
Multiple Chronic Conditions (% of Medicare beneficiaries aged 65+)Cognition (% of adults aged 65+)
Depression (% of adults aged 65+)Suicide (deaths per 100 000 adults aged 65+)
2015 No. 1 Value Rank State
OverallRank: 16Change: No ChangeDeterminants Rank: 17Outcomes Rank: 20
Strengths:• High volunteerism• High prescription drug coverage• Low percentage of hospital readmissions
Challenges: • High prevalence of activity-
limiting arthritis pain• Limited availability of home health care
workers• High prevalence of falls
Highlights: • In the past 2 years, flu vaccine coverage
increased 7% from 61.8% to 66.2% of adults aged 65 and older.
• In the past 2 years, very good or excellent health status increased 11% from 40.2% to 44.4% of adults aged 65 and older.
• In the past year, food insecurity increased 21% from 11.2% to 13.5% of adults aged 60 and older.
• In the past year, pain management decreased 26% from 54.5% to 40.5% of adults aged 65 and older with joint pain.
• In the past 2 years, seniors with a dedicated health care provider decreased 2% from 95.7% to 93.9% of adults aged 65 and older.
Ranking:Nebraska ranks 16th in America’s Health Rankings® Senior Report; it was 16th last year. In the 2014 America’s Health Rankings® (all ages), the state ranks 10th.
State Health Department Website: www.dhhs.ne.gov/
8.63.0
28.21.6
30.168.540.5
-0.567
7.834.548.3
0.09838.913.5
$13760.0540.152
12.854.488.475.0
-0.035
93.966.282.397.574.658.255.814.550.520.3
0.0050.120
9.3
31.26.3
44.465.8179613.41.9
0.0890.210
19.130.66.9
13.914.5
37135
1519
38.5 52.7
32.522.46.58.77.1
2015322413194628
157
128
13239
1211
30425
3531
2912433
4145241124162717
174228161629119
2016
4.21.5
16.10.9
22.877.253.2
5.142.657.9
108.18.1
$6798
1.1136.889.625.8
97.573.992.498.486.0
316.628.212.965.415.1
4.214.53.0
50.268.214027.01.3
NE
BR
AS
KA
Nebraska
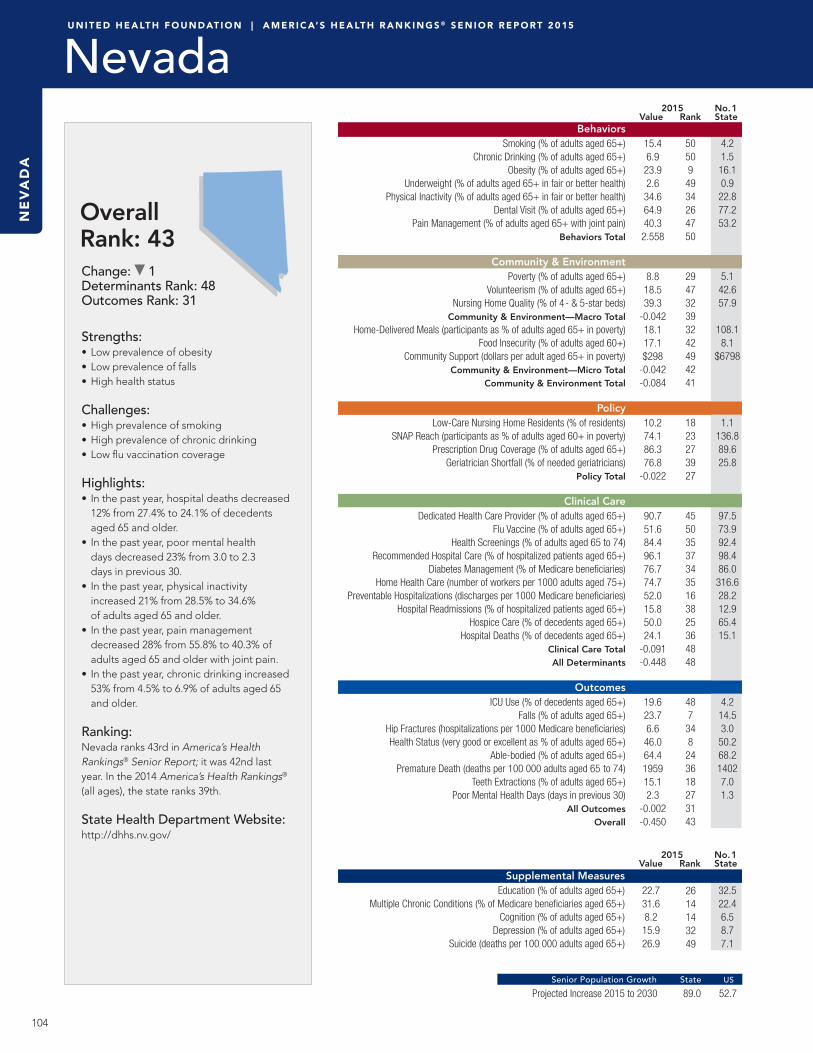
104
U N I T E D H E A LT H F O U N D AT I O N | A M E R I C A’ S H E A LT H R A N K I N G S ® S E N I O R R E P O RT 2 0 15
Projected Increase 2015 to 2030 Senior Population Growth State US
Behaviors Smoking (% of adults aged 65+)
Chronic Drinking (% of adults aged 65+) Obesity (% of adults aged 65+) Underweight (% of adults aged 65+ in fair or better health) Physical Inactivity (% of adults aged 65+ in fair or better health)
Dental Visit (% of adults aged 65+)Pain Management (% of adults aged 65+ with joint pain)
Behaviors Total
Community & EnvironmentPoverty (% of adults aged 65+)
Volunteerism (% of adults aged 65+)Nursing Home Quality (% of 4- & 5-star beds)
Community & Environment—Macro Total Home-Delivered Meals (participants as % of adults aged 65+ in poverty) Food Insecurity (% of adults aged 60+) Community Support (dollars per adult aged 65+ in poverty)
Community & Environment—Micro TotalCommunity & Environment Total
Policy Low-Care Nursing Home Residents (% of residents) SNAP Reach (participants as % of adults aged 60+ in poverty)
Prescription Drug Coverage (% of adults aged 65+) Geriatrician Shortfall (% of needed geriatricians)
Policy Total
Clinical CareDedicated Health Care Provider (% of adults aged 65+)
Flu Vaccine (% of adults aged 65+) Health Screenings (% of adults aged 65 to 74)
Recommended Hospital Care (% of hospitalized patients aged 65+)Diabetes Management (% of Medicare beneficiaries)
Home Health Care (number of workers per 1000 adults aged 75+)Preventable Hospitalizations (discharges per 1000 Medicare beneficiaries)
Hospital Readmissions (% of hospitalized patients aged 65+)Hospice Care (% of decedents aged 65+)
Hospital Deaths (% of decedents aged 65+)Clinical Care Total
All Determinants
OutcomesICU Use (% of decedents aged 65+)
Falls (% of adults aged 65+) Hip Fractures (hospitalizations per 1000 Medicare beneficiaries)
Health Status (very good or excellent as % of adults aged 65+)Able-bodied (% of adults aged 65+)
Premature Death (deaths per 100 000 adults aged 65 to 74)Teeth Extractions (% of adults aged 65+)
Poor Mental Health Days (days in previous 30) All Outcomes Overall
2015 No. 1 Value Rank State
Supplemental MeasuresEducation (% of adults aged 65+)
Multiple Chronic Conditions (% of Medicare beneficiaries aged 65+)Cognition (% of adults aged 65+)
Depression (% of adults aged 65+)Suicide (deaths per 100 000 adults aged 65+)
2015 No. 1 Value Rank State
NE
VA
DA
Nevada
OverallRank: 43Change: 1Determinants Rank: 48Outcomes Rank: 31
Strengths:• Low prevalence of obesity• Low prevalence of falls• High health status
Challenges: • High prevalence of smoking• High prevalence of chronic drinking• Low flu vaccination coverage
Highlights: • In the past year, hospital deaths decreased
12% from 27.4% to 24.1% of decedents aged 65 and older.
• In the past year, poor mental health days decreased 23% from 3.0 to 2.3 days in previous 30.
• In the past year, physical inactivity increased 21% from 28.5% to 34.6% of adults aged 65 and older.
• In the past year, pain management decreased 28% from 55.8% to 40.3% of adults aged 65 and older with joint pain.
• In the past year, chronic drinking increased 53% from 4.5% to 6.9% of adults aged 65 and older.
Ranking:Nevada ranks 43rd in America’s Health Rankings® Senior Report; it was 42nd last year. In the 2014 America’s Health Rankings® (all ages), the state ranks 39th.
State Health Department Website: http://dhhs.nv.gov/
15.46.9
23.92.6
34.664.940.3
2.558
8.818.539.3
-0.04218.117.1$298
-0.042-0.084
10.274.186.376.8
-0.022
90.751.684.496.176.774.752.015.850.024.1
-0.091-0.448
19.623.76.6
46.064.4195915.12.3
-0.002-0.450
22.731.68.2
15.926.9
2614143249
89.0 52.7
32.522.46.58.77.1
505094934264750
294732393242494241
1823273927
455035373435163825364848
487348243618273143
4.21.516.10.922.877.253.2
5.142.657.9
108.1
8.1$6798
1.1
136.889.625.8
97.573.992.498.486.0316.628.212.965.415.1
4.214.53.050.268.214027.01.3

105
U N I T E D H E A LT H F O U N D AT I O N | A M E R I C A’ S H E A LT H R A N K I N G S ® S E N I O R R E P O RT 2 0 15
Projected Increase 2015 to 2030 Senior Population Growth State US
Behaviors Smoking (% of adults aged 65+)
Chronic Drinking (% of adults aged 65+) Obesity (% of adults aged 65+) Underweight (% of adults aged 65+ in fair or better health) Physical Inactivity (% of adults aged 65+ in fair or better health)
Dental Visit (% of adults aged 65+)Pain Management (% of adults aged 65+ with joint pain)
Behaviors Total
Community & EnvironmentPoverty (% of adults aged 65+)
Volunteerism (% of adults aged 65+)Nursing Home Quality (% of 4- & 5-star beds)
Community & Environment—Macro Total Home-Delivered Meals (participants as % of adults aged 65+ in poverty) Food Insecurity (% of adults aged 60+) Community Support (dollars per adult aged 65+ in poverty)
Community & Environment—Micro TotalCommunity & Environment Total
Policy Low-Care Nursing Home Residents (% of residents) SNAP Reach (participants as % of adults aged 60+ in poverty)
Prescription Drug Coverage (% of adults aged 65+) Geriatrician Shortfall (% of needed geriatricians)
Policy Total
Clinical CareDedicated Health Care Provider (% of adults aged 65+)
Flu Vaccine (% of adults aged 65+) Health Screenings (% of adults aged 65 to 74)
Recommended Hospital Care (% of hospitalized patients aged 65+)Diabetes Management (% of Medicare beneficiaries)
Home Health Care (number of workers per 1000 adults aged 75+)Preventable Hospitalizations (discharges per 1000 Medicare beneficiaries)
Hospital Readmissions (% of hospitalized patients aged 65+)Hospice Care (% of decedents aged 65+)
Hospital Deaths (% of decedents aged 65+)Clinical Care Total
All Determinants
OutcomesICU Use (% of decedents aged 65+)
Falls (% of adults aged 65+) Hip Fractures (hospitalizations per 1000 Medicare beneficiaries)
Health Status (very good or excellent as % of adults aged 65+)Able-bodied (% of adults aged 65+)
Premature Death (deaths per 100 000 adults aged 65 to 74)Teeth Extractions (% of adults aged 65+)
Poor Mental Health Days (days in previous 30) All Outcomes Overall
2015 No. 1 Value Rank State
Supplemental MeasuresEducation (% of adults aged 65+)
Multiple Chronic Conditions (% of Medicare beneficiaries aged 65+)Cognition (% of adults aged 65+)
Depression (% of adults aged 65+)Suicide (deaths per 100 000 adults aged 65+)
2015 No. 1 Value Rank State
OverallRank: 2Change: 1Determinants Rank: 2Outcomes Rank: 4
Strengths:• Low percentage of seniors living in poverty• Ready availability of home-delivered meals• High health status
Challenges: • High prevalence of activity-limiting
arthritis pain• Low prescription drug coverage• Low SNAP enrollment
Highlights: • In the past year, obesity decreased
4% from 26.5% to 25.5% of adults aged 65 and older.
• In the past year, underweight seniors decreased 35% from 1.7% to 1.1% of adults aged 65 and older.
• In the past 2 years, flu vaccine coverage increased 11% from 57.4% to 63.7% of adults aged 65 and older.
• In the past year, pain management decreased 28% from 57.0% to 41.2% of adults aged 65 and older with joint pain.
• In the past year, ICU use increased 14% from 6.5% to 7.4% of decedents aged 65 and older.
Ranking:New Hampshire ranks 2nd in America’s Health Rankings® Senior Report; it was 3rd last year. In the 2014 America’s Health Rankings® (all ages), the state ranks 7th.
State Health Department Website: www.dhhs.state.nh.us
7.14.0
25.51.1
27.672.841.2
2.821
6.126.753.9
0.11098.310.2
$32670.1770.287
12.363.178.350.5
-0.056
96.663.791.397.584.081.250.714.546.922.6
0.0820.424
7.4
29.95.5
50.266.6167513.11.7
0.2080.633
27.432.27.4
14.312.0
9187
1911
62.2 52.7
32.522.46.58.77.1
726146
107
444
2215533411
2832508
39
5
20335
321511342742
1033818
188442
4.21.5
16.10.9
22.877.253.2
5.142.657.9
108.18.1
$6798
1.1136.889.625.8
97.573.992.498.486.0
316.628.212.965.415.1
4.214.53.0
50.268.214027.01.3
NE
W H
AM
PS
HIR
E
New Hampshire

106
U N I T E D H E A LT H F O U N D AT I O N | A M E R I C A’ S H E A LT H R A N K I N G S ® S E N I O R R E P O RT 2 0 15
Projected Increase 2015 to 2030 Senior Population Growth State US
Behaviors Smoking (% of adults aged 65+)
Chronic Drinking (% of adults aged 65+) Obesity (% of adults aged 65+) Underweight (% of adults aged 65+ in fair or better health) Physical Inactivity (% of adults aged 65+ in fair or better health)
Dental Visit (% of adults aged 65+)Pain Management (% of adults aged 65+ with joint pain)
Behaviors Total
Community & EnvironmentPoverty (% of adults aged 65+)
Volunteerism (% of adults aged 65+)Nursing Home Quality (% of 4- & 5-star beds)
Community & Environment—Macro Total Home-Delivered Meals (participants as % of adults aged 65+ in poverty) Food Insecurity (% of adults aged 60+) Community Support (dollars per adult aged 65+ in poverty)
Community & Environment—Micro TotalCommunity & Environment Total
Policy Low-Care Nursing Home Residents (% of residents) SNAP Reach (participants as % of adults aged 60+ in poverty)
Prescription Drug Coverage (% of adults aged 65+) Geriatrician Shortfall (% of needed geriatricians)
Policy Total
Clinical CareDedicated Health Care Provider (% of adults aged 65+)
Flu Vaccine (% of adults aged 65+) Health Screenings (% of adults aged 65 to 74)
Recommended Hospital Care (% of hospitalized patients aged 65+)Diabetes Management (% of Medicare beneficiaries)
Home Health Care (number of workers per 1000 adults aged 75+)Preventable Hospitalizations (discharges per 1000 Medicare beneficiaries)
Hospital Readmissions (% of hospitalized patients aged 65+)Hospice Care (% of decedents aged 65+)
Hospital Deaths (% of decedents aged 65+)Clinical Care Total
All Determinants
OutcomesICU Use (% of decedents aged 65+)
Falls (% of adults aged 65+) Hip Fractures (hospitalizations per 1000 Medicare beneficiaries)
Health Status (very good or excellent as % of adults aged 65+)Able-bodied (% of adults aged 65+)
Premature Death (deaths per 100 000 adults aged 65 to 74)Teeth Extractions (% of adults aged 65+)
Poor Mental Health Days (days in previous 30) All Outcomes Overall
2015 No. 1 Value Rank State
Supplemental MeasuresEducation (% of adults aged 65+)
Multiple Chronic Conditions (% of Medicare beneficiaries aged 65+)Cognition (% of adults aged 65+)
Depression (% of adults aged 65+)Suicide (deaths per 100 000 adults aged 65+)
2015 No. 1 Value Rank State
NE
W J
ER
SE
Y
New Jersey
OverallRank: 26Change: 2Determinants Rank: 29Outcomes Rank: 22
Strengths:• Low prevalence of chronic drinking• Low geriatrician shortfall• Low prevalence of falls
Challenges: • High prevalence of underweight seniors• Low volunteerism• High ICU use
Highlights: • In the past year, hip fractures decreased
14% from 6.4 to 5.5 hospitalizations per 1000 Medicare beneficiaries.
• In the past year, hospice care increased 4% from 45.9% to 47.6% of decedents aged 65 and older.
• In the past year, flu vaccine coverage decreased 6% from 61.1% to 57.2% of adults aged 65 and older.
• In the past year, pain management decreased 18% from 53.6% to 43.8% of adults aged 65 and older with joint pain.
• In the past year, poor mental health days increased 14% from 2.1 to 2.4 days in previous 30.
Ranking:New Jersey ranks 26th in America’s Health Rankings® Senior Report; it was 24th last year. In the 2014 America’s Health Rankings® (all ages), the state ranks 11th.
State Health Department Website: www.state.nj.us/health
7.72.9
26.22.0
34.370.243.8
-0.290
8.019.344.2
-0.00429.813.7$6880.0190.015
13.083.985.852.4
0.032
94.057.286.896.283.974.060.816.047.626.6
-0.0470.024
23.522.35.5
41.166.9162313.92.4
0.0490.073
25.044.28.3
12.09.2
18491652
41.5 52.7
32.522.46.58.77.1
1212194331143422
174326281826272228
321732916
28401935736344330464129
50582671215332226
4.21.516.10.922.877.253.2
5.142.657.9
108.1
8.1$6798
1.1
136.889.625.8
97.573.992.498.486.0316.628.212.965.415.1
4.214.53.050.268.214027.01.3

107
U N I T E D H E A LT H F O U N D AT I O N | A M E R I C A’ S H E A LT H R A N K I N G S ® S E N I O R R E P O RT 2 0 15
Projected Increase 2015 to 2030 Senior Population Growth State US
Behaviors Smoking (% of adults aged 65+)
Chronic Drinking (% of adults aged 65+) Obesity (% of adults aged 65+) Underweight (% of adults aged 65+ in fair or better health) Physical Inactivity (% of adults aged 65+ in fair or better health)
Dental Visit (% of adults aged 65+)Pain Management (% of adults aged 65+ with joint pain)
Behaviors Total
Community & EnvironmentPoverty (% of adults aged 65+)
Volunteerism (% of adults aged 65+)Nursing Home Quality (% of 4- & 5-star beds)
Community & Environment—Macro Total Home-Delivered Meals (participants as % of adults aged 65+ in poverty) Food Insecurity (% of adults aged 60+) Community Support (dollars per adult aged 65+ in poverty)
Community & Environment—Micro TotalCommunity & Environment Total
Policy Low-Care Nursing Home Residents (% of residents) SNAP Reach (participants as % of adults aged 60+ in poverty)
Prescription Drug Coverage (% of adults aged 65+) Geriatrician Shortfall (% of needed geriatricians)
Policy Total
Clinical CareDedicated Health Care Provider (% of adults aged 65+)
Flu Vaccine (% of adults aged 65+) Health Screenings (% of adults aged 65 to 74)
Recommended Hospital Care (% of hospitalized patients aged 65+)Diabetes Management (% of Medicare beneficiaries)
Home Health Care (number of workers per 1000 adults aged 75+)Preventable Hospitalizations (discharges per 1000 Medicare beneficiaries)
Hospital Readmissions (% of hospitalized patients aged 65+)Hospice Care (% of decedents aged 65+)
Hospital Deaths (% of decedents aged 65+)Clinical Care Total
All Determinants
OutcomesICU Use (% of decedents aged 65+)
Falls (% of adults aged 65+) Hip Fractures (hospitalizations per 1000 Medicare beneficiaries)
Health Status (very good or excellent as % of adults aged 65+)Able-bodied (% of adults aged 65+)
Premature Death (deaths per 100 000 adults aged 65 to 74)Teeth Extractions (% of adults aged 65+)
Poor Mental Health Days (days in previous 30) All Outcomes Overall
2015 No. 1 Value Rank State
Supplemental MeasuresEducation (% of adults aged 65+)
Multiple Chronic Conditions (% of Medicare beneficiaries aged 65+)Cognition (% of adults aged 65+)
Depression (% of adults aged 65+)Suicide (deaths per 100 000 adults aged 65+)
2015 No. 1 Value Rank State
OverallRank: 33Change: 5Determinants Rank: 30Outcomes Rank: 36
Strengths:• Low prevalence of obesity• Low prevalence of activity-limiting
arthritis pain• Ready availability of home
health care providers
Challenges: • High prevalence of underweight seniors• High percentage of seniors in poverty• Low percentage of able-bodied seniors
Highlights: • In the past year, food insecurity decreased
28% from 18.1% to 13.1% of adults aged 60 and older.
• In the past year, hospital deaths decreased 14% from 22.6% to 19.5% of decedents aged 65 and older.
• In the past year, pain management increased 10% from 46.6% to 51.2% of adults aged 65 and older with joint pain.
• In the past year, flu vaccine coverage decreased 4% from 57.8% to 55.6% of adults aged 65 and older.
• In the past year, underweight seniors increased 29% from 1.7% to 2.2% of adults aged 65 and older.
Ranking:New Mexico ranks 33rd in America’s Health Rankings® Senior Report; it was 38th last year. In the 2014 America’s Health Rankings® (all ages), the state ranks 33rd.
State Health Department Website: www.health.state.nm.us
9.93.5
20.52.2
25.663.651.2
-1.535
11.823.933.9
-0.09027.413.1$9760.029-0.061
13.362.385.766.0
-0.043
90.555.681.896.368.8
200.450.114.052.719.5
-0.017-0.003
11.632.06.8
40.058.9166716.22.2
-0.063-0.066
26.629.911.616.623.5
1312463848
61.6 52.7
32.522.46.58.77.1
37223
474
2933
473342462018141837
3334342233
47454530484
138
17113330
22433629431726213633
4.21.5
16.10.9
22.877.253.2
5.142.657.9
108.18.1
$6798
1.1136.889.625.8
97.573.992.498.486.0
316.628.212.965.415.1
4.214.53.0
50.268.214027.01.3
NE
W M
EX
ICO
New Mexico

108
U N I T E D H E A LT H F O U N D AT I O N | A M E R I C A’ S H E A LT H R A N K I N G S ® S E N I O R R E P O RT 2 0 15
Projected Increase 2015 to 2030 Senior Population Growth State US
Behaviors Smoking (% of adults aged 65+)
Chronic Drinking (% of adults aged 65+) Obesity (% of adults aged 65+) Underweight (% of adults aged 65+ in fair or better health) Physical Inactivity (% of adults aged 65+ in fair or better health)
Dental Visit (% of adults aged 65+)Pain Management (% of adults aged 65+ with joint pain)
Behaviors Total
Community & EnvironmentPoverty (% of adults aged 65+)
Volunteerism (% of adults aged 65+)Nursing Home Quality (% of 4- & 5-star beds)
Community & Environment—Macro Total Home-Delivered Meals (participants as % of adults aged 65+ in poverty) Food Insecurity (% of adults aged 60+) Community Support (dollars per adult aged 65+ in poverty)
Community & Environment—Micro TotalCommunity & Environment Total
Policy Low-Care Nursing Home Residents (% of residents) SNAP Reach (participants as % of adults aged 60+ in poverty)
Prescription Drug Coverage (% of adults aged 65+) Geriatrician Shortfall (% of needed geriatricians)
Policy Total
Clinical CareDedicated Health Care Provider (% of adults aged 65+)
Flu Vaccine (% of adults aged 65+) Health Screenings (% of adults aged 65 to 74)
Recommended Hospital Care (% of hospitalized patients aged 65+)Diabetes Management (% of Medicare beneficiaries)
Home Health Care (number of workers per 1000 adults aged 75+)Preventable Hospitalizations (discharges per 1000 Medicare beneficiaries)
Hospital Readmissions (% of hospitalized patients aged 65+)Hospice Care (% of decedents aged 65+)
Hospital Deaths (% of decedents aged 65+)Clinical Care Total
All Determinants
OutcomesICU Use (% of decedents aged 65+)
Falls (% of adults aged 65+) Hip Fractures (hospitalizations per 1000 Medicare beneficiaries)
Health Status (very good or excellent as % of adults aged 65+)Able-bodied (% of adults aged 65+)
Premature Death (deaths per 100 000 adults aged 65 to 74)Teeth Extractions (% of adults aged 65+)
Poor Mental Health Days (days in previous 30) All Outcomes Overall
2015 No. 1 Value Rank State
Supplemental MeasuresEducation (% of adults aged 65+)
Multiple Chronic Conditions (% of Medicare beneficiaries aged 65+)Cognition (% of adults aged 65+)
Depression (% of adults aged 65+)Suicide (deaths per 100 000 adults aged 65+)
2015 No. 1 Value Rank State
NE
W Y
OR
K
New York
OverallRank: 21Change: 11Determinants Rank: 16Outcomes Rank: 23
Strengths:• Low prevalence of smoking• High SNAP enrollment• Ready availability of home
health care providers
Challenges: • High percentage of seniors in poverty• Low volunteerism• High percentage of hospital deaths
Highlights: • In the past year, flu vaccine coverage
increased 13% from 55.1% to 62.2% of adults aged 65 and older.
• In the past year, smoking decreased 20% from 8.1% to 6.5% of adults aged 65 and older.
• In the past year, poor mental health days decreased 22% from 3.2 to 2.5 days in previous 30.
• In the past year, hospice care increased 10% from 28.9% to 31.7% of decedents aged 65 and older.
• In the past year, food insecurity increased 6% from 14.8% to 15.7% of adults aged 60 and older.
Ranking:New York ranks 21st in America’s Health Rankings® Senior Report; it was 32nd last year. In the 2014 America’s Health Rankings® (all ages), the state ranks 14th.
State Health Department Website: www.health.state.ny.us
6.54.3
25.91.8
32.966.747.7
0.563
11.617.543.9
-0.08017.615.7
$1281-0.001-0.081
8.9
119.987.541.6
0.173
95.762.287.995.684.1
224.259.216.031.732.6
-0.0230.123
12.428.85.4
37.866.0161015.12.5
0.0430.166
24.443.08.7
13.310.2
19482695
33.1 52.7
32.522.46.58.77.1
430163324221211
464928443434113040
1521441
929134543294348503416
2528436121018362321
4.21.516.10.922.877.253.2
5.142.657.9
108.1
8.1$6798
1.1
136.889.625.8
97.573.992.498.486.0316.628.212.965.415.1
4.214.53.050.268.214027.01.3

109
U N I T E D H E A LT H F O U N D AT I O N | A M E R I C A’ S H E A LT H R A N K I N G S ® S E N I O R R E P O RT 2 0 15
Projected Increase 2015 to 2030 Senior Population Growth State US
Behaviors Smoking (% of adults aged 65+)
Chronic Drinking (% of adults aged 65+) Obesity (% of adults aged 65+) Underweight (% of adults aged 65+ in fair or better health) Physical Inactivity (% of adults aged 65+ in fair or better health)
Dental Visit (% of adults aged 65+)Pain Management (% of adults aged 65+ with joint pain)
Behaviors Total
Community & EnvironmentPoverty (% of adults aged 65+)
Volunteerism (% of adults aged 65+)Nursing Home Quality (% of 4- & 5-star beds)
Community & Environment—Macro Total Home-Delivered Meals (participants as % of adults aged 65+ in poverty) Food Insecurity (% of adults aged 60+) Community Support (dollars per adult aged 65+ in poverty)
Community & Environment—Micro TotalCommunity & Environment Total
Policy Low-Care Nursing Home Residents (% of residents) SNAP Reach (participants as % of adults aged 60+ in poverty)
Prescription Drug Coverage (% of adults aged 65+) Geriatrician Shortfall (% of needed geriatricians)
Policy Total
Clinical CareDedicated Health Care Provider (% of adults aged 65+)
Flu Vaccine (% of adults aged 65+) Health Screenings (% of adults aged 65 to 74)
Recommended Hospital Care (% of hospitalized patients aged 65+)Diabetes Management (% of Medicare beneficiaries)
Home Health Care (number of workers per 1000 adults aged 75+)Preventable Hospitalizations (discharges per 1000 Medicare beneficiaries)
Hospital Readmissions (% of hospitalized patients aged 65+)Hospice Care (% of decedents aged 65+)
Hospital Deaths (% of decedents aged 65+)Clinical Care Total
All Determinants
OutcomesICU Use (% of decedents aged 65+)
Falls (% of adults aged 65+) Hip Fractures (hospitalizations per 1000 Medicare beneficiaries)
Health Status (very good or excellent as % of adults aged 65+)Able-bodied (% of adults aged 65+)
Premature Death (deaths per 100 000 adults aged 65 to 74)Teeth Extractions (% of adults aged 65+)
Poor Mental Health Days (days in previous 30) All Outcomes Overall
2015 No. 1 Value Rank State
Supplemental MeasuresEducation (% of adults aged 65+)
Multiple Chronic Conditions (% of Medicare beneficiaries aged 65+)Cognition (% of adults aged 65+)
Depression (% of adults aged 65+)Suicide (deaths per 100 000 adults aged 65+)
2015 No. 1 Value Rank State
OverallRank: 32Change: 3Determinants Rank: 27Outcomes Rank: 38
Strengths:• Low prevalence of chronic drinking• Low percentage of low-care nursing
home residents• High flu vaccination coverage
Challenges: • Low percentage of quality
nursing home beds• High prevalence of food insecurity• High hip fracture rate
Highlights: • In the past 2 years, very good or excellent
health status increased 15% from 34.1% to 39.3% of adults aged 65 and older.
• In the past year, chronic drinking decreased 24% from 3.4% to 2.6% of adults aged 65 and older.
• In the past year, physical inactivity increased 10% from 29.0% to 31.8% of adults aged 65 and older.
• In the past year, smoking increased 5% from 9.2% to 9.7% of adults aged 65 and older.
• In the past 2 years, food insecurity increased 28% from 15.7% to 20.1% of adults aged 60 and older.
Ranking:North Carolina ranks 32nd in America’s Health Rankings® Senior Report; it was 29th last year. In the 2014 America’s Health Rankings® (all ages), the state ranks 37th.
State Health Department Website: www.dhhs.state.nc.us
9.72.6
25.71.9
31.863.848.8
3.892
10.026.634.9
-0.03914.520.1$554
-0.069-0.108
7.0
61.487.963.3
0.042
94.570.987.697.283.3
110.056.714.951.023.5
0.0610.037
13.327.37.1
39.362.3198421.02.3
-0.100-0.063
21.435.710.016.515.9
3224343722
58.1 52.7
32.522.46.58.77.1
3411153718281017
352238384346344844
9
37111711
244
1759
17262121349
27
29204032363740273832
4.21.5
16.10.9
22.877.253.2
5.142.657.9
108.18.1
$6798
1.1136.889.625.8
97.573.992.498.486.0
316.628.212.965.415.1
4.214.53.0
50.268.214027.01.3
NO
RT
H C
AR
OL
INA
North Carolina
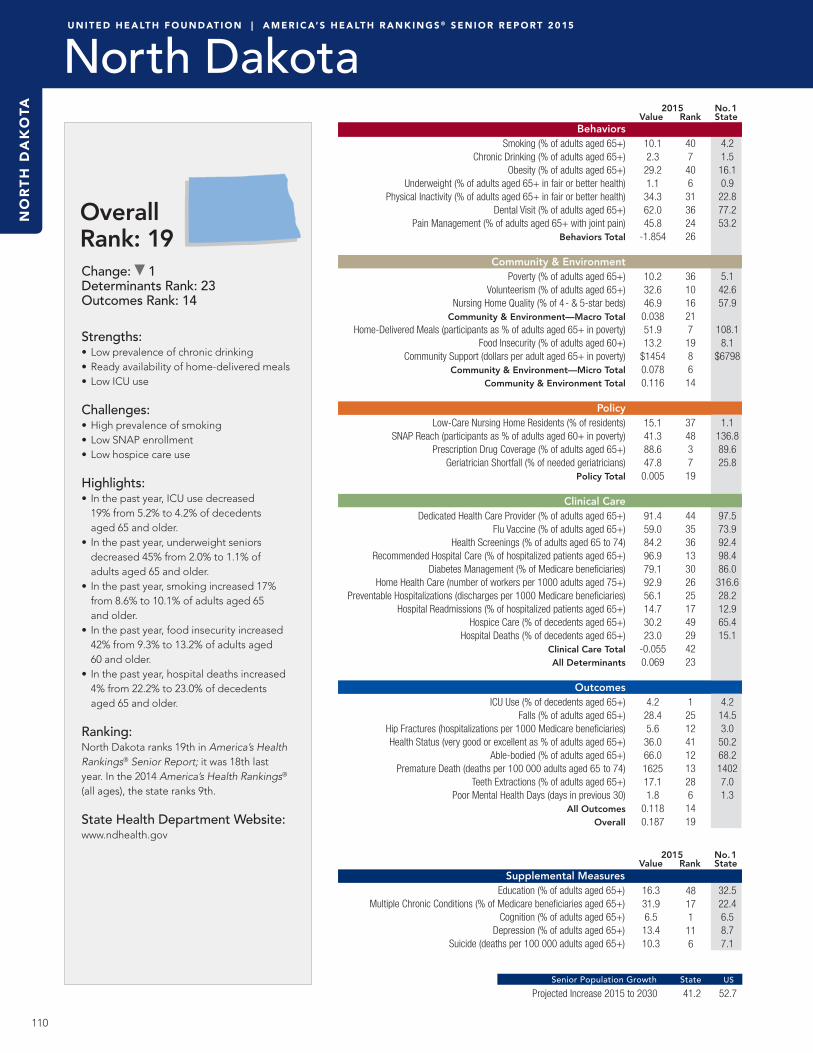
110
U N I T E D H E A LT H F O U N D AT I O N | A M E R I C A’ S H E A LT H R A N K I N G S ® S E N I O R R E P O RT 2 0 15
Projected Increase 2015 to 2030 Senior Population Growth State US
Behaviors Smoking (% of adults aged 65+)
Chronic Drinking (% of adults aged 65+) Obesity (% of adults aged 65+) Underweight (% of adults aged 65+ in fair or better health) Physical Inactivity (% of adults aged 65+ in fair or better health)
Dental Visit (% of adults aged 65+)Pain Management (% of adults aged 65+ with joint pain)
Behaviors Total
Community & EnvironmentPoverty (% of adults aged 65+)
Volunteerism (% of adults aged 65+)Nursing Home Quality (% of 4- & 5-star beds)
Community & Environment—Macro Total Home-Delivered Meals (participants as % of adults aged 65+ in poverty) Food Insecurity (% of adults aged 60+) Community Support (dollars per adult aged 65+ in poverty)
Community & Environment—Micro TotalCommunity & Environment Total
Policy Low-Care Nursing Home Residents (% of residents) SNAP Reach (participants as % of adults aged 60+ in poverty)
Prescription Drug Coverage (% of adults aged 65+) Geriatrician Shortfall (% of needed geriatricians)
Policy Total
Clinical CareDedicated Health Care Provider (% of adults aged 65+)
Flu Vaccine (% of adults aged 65+) Health Screenings (% of adults aged 65 to 74)
Recommended Hospital Care (% of hospitalized patients aged 65+)Diabetes Management (% of Medicare beneficiaries)
Home Health Care (number of workers per 1000 adults aged 75+)Preventable Hospitalizations (discharges per 1000 Medicare beneficiaries)
Hospital Readmissions (% of hospitalized patients aged 65+)Hospice Care (% of decedents aged 65+)
Hospital Deaths (% of decedents aged 65+)Clinical Care Total
All Determinants
OutcomesICU Use (% of decedents aged 65+)
Falls (% of adults aged 65+) Hip Fractures (hospitalizations per 1000 Medicare beneficiaries)
Health Status (very good or excellent as % of adults aged 65+)Able-bodied (% of adults aged 65+)
Premature Death (deaths per 100 000 adults aged 65 to 74)Teeth Extractions (% of adults aged 65+)
Poor Mental Health Days (days in previous 30) All Outcomes Overall
2015 No. 1 Value Rank State
Supplemental MeasuresEducation (% of adults aged 65+)
Multiple Chronic Conditions (% of Medicare beneficiaries aged 65+)Cognition (% of adults aged 65+)
Depression (% of adults aged 65+)Suicide (deaths per 100 000 adults aged 65+)
2015 No. 1 Value Rank State
NO
RT
H D
AK
OTA
North Dakota
OverallRank: 19Change: 1Determinants Rank: 23Outcomes Rank: 14
Strengths:• Low prevalence of chronic drinking• Ready availability of home-delivered meals• Low ICU use
Challenges: • High prevalence of smoking• Low SNAP enrollment• Low hospice care use
Highlights: • In the past year, ICU use decreased
19% from 5.2% to 4.2% of decedents aged 65 and older.
• In the past year, underweight seniors decreased 45% from 2.0% to 1.1% of adults aged 65 and older.
• In the past year, smoking increased 17% from 8.6% to 10.1% of adults aged 65 and older.
• In the past year, food insecurity increased 42% from 9.3% to 13.2% of adults aged 60 and older.
• In the past year, hospital deaths increased 4% from 22.2% to 23.0% of decedents aged 65 and older.
Ranking:North Dakota ranks 19th in America’s Health Rankings® Senior Report; it was 18th last year. In the 2014 America’s Health Rankings® (all ages), the state ranks 9th.
State Health Department Website: www.ndhealth.gov
10.12.3
29.21.1
34.362.045.8
-1.854
10.232.646.9
0.03851.913.2
$14540.0780.116
15.141.388.647.8
0.005
91.459.084.296.979.192.956.114.730.223.0
-0.0550.069
4.2
28.45.6
36.066.0162517.11.8
0.1180.187
16.331.96.5
13.410.3
48171116
41.2 52.7
32.522.46.58.77.1
40740631362426
361016217198614
37483719
443536133026251749294223
125124112132861419
4.21.516.10.922.877.253.2
5.142.657.9
108.1
8.1$6798
1.1
136.889.625.8
97.573.992.498.486.0316.628.212.965.415.1
4.214.53.050.268.214027.01.3

111
U N I T E D H E A LT H F O U N D AT I O N | A M E R I C A’ S H E A LT H R A N K I N G S ® S E N I O R R E P O RT 2 0 15
Projected Increase 2015 to 2030 Senior Population Growth State US
Behaviors Smoking (% of adults aged 65+)
Chronic Drinking (% of adults aged 65+) Obesity (% of adults aged 65+) Underweight (% of adults aged 65+ in fair or better health) Physical Inactivity (% of adults aged 65+ in fair or better health)
Dental Visit (% of adults aged 65+)Pain Management (% of adults aged 65+ with joint pain)
Behaviors Total
Community & EnvironmentPoverty (% of adults aged 65+)
Volunteerism (% of adults aged 65+)Nursing Home Quality (% of 4- & 5-star beds)
Community & Environment—Macro Total Home-Delivered Meals (participants as % of adults aged 65+ in poverty) Food Insecurity (% of adults aged 60+) Community Support (dollars per adult aged 65+ in poverty)
Community & Environment—Micro TotalCommunity & Environment Total
Policy Low-Care Nursing Home Residents (% of residents) SNAP Reach (participants as % of adults aged 60+ in poverty)
Prescription Drug Coverage (% of adults aged 65+) Geriatrician Shortfall (% of needed geriatricians)
Policy Total
Clinical CareDedicated Health Care Provider (% of adults aged 65+)
Flu Vaccine (% of adults aged 65+) Health Screenings (% of adults aged 65 to 74)
Recommended Hospital Care (% of hospitalized patients aged 65+)Diabetes Management (% of Medicare beneficiaries)
Home Health Care (number of workers per 1000 adults aged 75+)Preventable Hospitalizations (discharges per 1000 Medicare beneficiaries)
Hospital Readmissions (% of hospitalized patients aged 65+)Hospice Care (% of decedents aged 65+)
Hospital Deaths (% of decedents aged 65+)Clinical Care Total
All Determinants
OutcomesICU Use (% of decedents aged 65+)
Falls (% of adults aged 65+) Hip Fractures (hospitalizations per 1000 Medicare beneficiaries)
Health Status (very good or excellent as % of adults aged 65+)Able-bodied (% of adults aged 65+)
Premature Death (deaths per 100 000 adults aged 65 to 74)Teeth Extractions (% of adults aged 65+)
Poor Mental Health Days (days in previous 30) All Outcomes Overall
2015 No. 1 Value Rank State
Supplemental MeasuresEducation (% of adults aged 65+)
Multiple Chronic Conditions (% of Medicare beneficiaries aged 65+)Cognition (% of adults aged 65+)
Depression (% of adults aged 65+)Suicide (deaths per 100 000 adults aged 65+)
2015 No. 1 Value Rank State
OverallRank: 30Change: 1Determinants Rank: 26Outcomes Rank: 34
Strengths:• Low percentage of seniors living in poverty• High prescription drug coverage• Low percentage of hospital deaths
Challenges: • High prevalence of physical inactivity• Low percentage of quality nursing
home beds• High premature death rate
Highlights: • In the past year, food insecurity
decreased 7% from 13.8% to 12.9% of adults aged 60 and older.
• In the past year, smoking decreased 5% from 10.2% to 9.7% of adults aged 65 and older.
• In the past year, poor mental health days decreased 16% from 2.5 to 2.1 days in previous 30.
• In the past year, pain management decreased 18% from 56.2% to 45.9% of adults aged 65 and older with joint pain.
• In the past year, community support decreased 17% from $835 to $691 per adult aged 65 and older in poverty.
Ranking:Ohio ranks 30th in America’s Health Rankings® Senior Report; it was 31st last year. In the 2014 America’s Health Rankings® (all ages), the state ranks 40th.
State Health Department Website: www.odh.ohio.gov
9.73.2
28.61.4
37.063.645.9
0.492
8.125.536.6
-0.00326.512.9$6910.0210.018
9.2
78.188.470.0
0.042
94.962.685.796.979.2
110.471.715.958.118.2
0.0180.039
15.526.76.2
38.264.4206120.32.1
-0.055-0.016
18.340.98.5
14.814.1
4142242417
33.4 52.7
32.522.46.58.77.1
3419361541292138
192635262113262127
16215
2711
202730132916454175
2326
40172634244139163430
4.21.5
16.10.9
22.877.253.2
5.142.657.9
108.18.1
$6798
1.1136.889.625.8
97.573.992.498.486.0
316.628.212.965.415.1
4.214.53.0
50.268.214027.01.3
OH
IO
Ohio

112
U N I T E D H E A LT H F O U N D AT I O N | A M E R I C A’ S H E A LT H R A N K I N G S ® S E N I O R R E P O RT 2 0 15
Projected Increase 2015 to 2030 Senior Population Growth State US
Behaviors Smoking (% of adults aged 65+)
Chronic Drinking (% of adults aged 65+) Obesity (% of adults aged 65+) Underweight (% of adults aged 65+ in fair or better health) Physical Inactivity (% of adults aged 65+ in fair or better health)
Dental Visit (% of adults aged 65+)Pain Management (% of adults aged 65+ with joint pain)
Behaviors Total
Community & EnvironmentPoverty (% of adults aged 65+)
Volunteerism (% of adults aged 65+)Nursing Home Quality (% of 4- & 5-star beds)
Community & Environment—Macro Total Home-Delivered Meals (participants as % of adults aged 65+ in poverty) Food Insecurity (% of adults aged 60+) Community Support (dollars per adult aged 65+ in poverty)
Community & Environment—Micro TotalCommunity & Environment Total
Policy Low-Care Nursing Home Residents (% of residents) SNAP Reach (participants as % of adults aged 60+ in poverty)
Prescription Drug Coverage (% of adults aged 65+) Geriatrician Shortfall (% of needed geriatricians)
Policy Total
Clinical CareDedicated Health Care Provider (% of adults aged 65+)
Flu Vaccine (% of adults aged 65+) Health Screenings (% of adults aged 65 to 74)
Recommended Hospital Care (% of hospitalized patients aged 65+)Diabetes Management (% of Medicare beneficiaries)
Home Health Care (number of workers per 1000 adults aged 75+)Preventable Hospitalizations (discharges per 1000 Medicare beneficiaries)
Hospital Readmissions (% of hospitalized patients aged 65+)Hospice Care (% of decedents aged 65+)
Hospital Deaths (% of decedents aged 65+)Clinical Care Total
All Determinants
OutcomesICU Use (% of decedents aged 65+)
Falls (% of adults aged 65+) Hip Fractures (hospitalizations per 1000 Medicare beneficiaries)
Health Status (very good or excellent as % of adults aged 65+)Able-bodied (% of adults aged 65+)
Premature Death (deaths per 100 000 adults aged 65 to 74)Teeth Extractions (% of adults aged 65+)
Poor Mental Health Days (days in previous 30) All Outcomes Overall
2015 No. 1 Value Rank State
Supplemental MeasuresEducation (% of adults aged 65+)
Multiple Chronic Conditions (% of Medicare beneficiaries aged 65+)Cognition (% of adults aged 65+)
Depression (% of adults aged 65+)Suicide (deaths per 100 000 adults aged 65+)
2015 No. 1 Value Rank State
OK
LA
HO
MA
Oklahoma
OverallRank: 46Change: 1Determinants Rank: 45Outcomes Rank: 45
Strengths:• Low prevalence of activity-
limiting arthritis pain• High flu vaccination coverage• Low ICU use
Challenges: • High prevalence of physical inactivity• High percentage of low-care nursing
home residents• High hip fracture rate
Highlights: • In the past year, pain management
increased 9% from 48.9% to 53.2% of adults aged 65 and older with joint pain.
• In the past year, hip fractures decreased 14% from 9.2 to 7.9 hospitalizations per 1000 Medicare beneficiaries.
• In the past year, smoking decreased 7% from 10.6% to 9.9% of adults aged 65 and older.
• In the past year, physical inactivity increased 15% from 36.7% to 42.3% of adults aged 65 and older.
• In the past year, seniors with a dedicated health care provider decreased 2% from 95.7% to 93.5% of adults aged 65 and older.
Ranking:Oklahoma ranks 46th in America’s Health Rankings® Senior Report; it was 47th last year. In the 2014 America’s Health Rankings® (all ages), the state ranks 46th.
State Health Department Website: www.ok.gov/health
9.92.3
26.91.6
42.356.553.2
3.547
9.724.228.8
-0.07121.115.4$468
-0.017-0.088
25.066.284.286.1
-0.182
93.568.781.795.672.984.371.415.754.123.0
-0.059-0.347
11.832.67.9
35.758.0227421.02.7
-0.283-0.630
19.737.810.017.819.4
3631344639
36.8 52.7
32.522.46.58.77.1
37727244945133
343147412733393742
4931414849
34746454631423614294345
23474842444440464546
4.21.516.10.922.877.253.2
5.142.657.9
108.1
8.1$6798
1.1
136.889.625.8
97.573.992.498.486.0316.628.212.965.415.1
4.214.53.050.268.214027.01.3

113
U N I T E D H E A LT H F O U N D AT I O N | A M E R I C A’ S H E A LT H R A N K I N G S ® S E N I O R R E P O RT 2 0 15
Projected Increase 2015 to 2030 Senior Population Growth State US
Behaviors Smoking (% of adults aged 65+)
Chronic Drinking (% of adults aged 65+) Obesity (% of adults aged 65+) Underweight (% of adults aged 65+ in fair or better health) Physical Inactivity (% of adults aged 65+ in fair or better health)
Dental Visit (% of adults aged 65+)Pain Management (% of adults aged 65+ with joint pain)
Behaviors Total
Community & EnvironmentPoverty (% of adults aged 65+)
Volunteerism (% of adults aged 65+)Nursing Home Quality (% of 4- & 5-star beds)
Community & Environment—Macro Total Home-Delivered Meals (participants as % of adults aged 65+ in poverty) Food Insecurity (% of adults aged 60+) Community Support (dollars per adult aged 65+ in poverty)
Community & Environment—Micro TotalCommunity & Environment Total
Policy Low-Care Nursing Home Residents (% of residents) SNAP Reach (participants as % of adults aged 60+ in poverty)
Prescription Drug Coverage (% of adults aged 65+) Geriatrician Shortfall (% of needed geriatricians)
Policy Total
Clinical CareDedicated Health Care Provider (% of adults aged 65+)
Flu Vaccine (% of adults aged 65+) Health Screenings (% of adults aged 65 to 74)
Recommended Hospital Care (% of hospitalized patients aged 65+)Diabetes Management (% of Medicare beneficiaries)
Home Health Care (number of workers per 1000 adults aged 75+)Preventable Hospitalizations (discharges per 1000 Medicare beneficiaries)
Hospital Readmissions (% of hospitalized patients aged 65+)Hospice Care (% of decedents aged 65+)
Hospital Deaths (% of decedents aged 65+)Clinical Care Total
All Determinants
OutcomesICU Use (% of decedents aged 65+)
Falls (% of adults aged 65+) Hip Fractures (hospitalizations per 1000 Medicare beneficiaries)
Health Status (very good or excellent as % of adults aged 65+)Able-bodied (% of adults aged 65+)
Premature Death (deaths per 100 000 adults aged 65 to 74)Teeth Extractions (% of adults aged 65+)
Poor Mental Health Days (days in previous 30) All Outcomes Overall
2015 No. 1 Value Rank State
Supplemental MeasuresEducation (% of adults aged 65+)
Multiple Chronic Conditions (% of Medicare beneficiaries aged 65+)Cognition (% of adults aged 65+)
Depression (% of adults aged 65+)Suicide (deaths per 100 000 adults aged 65+)
2015 No. 1 Value Rank State
OverallRank: 9Change: 1Determinants Rank: 7Outcomes Rank: 10
Strengths:• Low prevalence of physical inactivity• High SNAP enrollment• Low prevalence of falls
Challenges: • High prevalence of chronic drinking• Low flu vaccination coverage• Many poor mental health days
Highlights: • In the past year, home health care
increased 11% from 79.8 to 88.9 home health care workers per 1000 adults aged 75 and older.
• In the past year, hip fractures decreased 17% from 6.9 to 5.7 hospitalizations per 1000 Medicare beneficiaries.
• In the past year, food insecurity increased 10% from 14.8% to 16.2% of adults aged 60 and older.
• In the past year, community support decreased 14% from $574 to $495 per adult aged 65 and older in poverty.
• In the past year, poor mental health days increased 8% from 2.4 to 2.6 days in previous 30.
Ranking:Oregon ranks 9th in America’s Health Rankings® Senior Report; it was 8th last year. In the 2014 America’s Health Rankings® (all ages), the state ranks 12th.
State Health Department Website: http://public.health.oregon.gov/
8.05.7
26.01.8
22.868.047.3
-3.007
8.130.050.4
0.07729.016.2$495
-0.0120.065
6.5
116.285.766.0
0.090
94.756.287.795.878.688.937.713.655.720.2
0.0500.264
5.918.45.7
47.562.2168015.02.6
0.1450.409
27.126.410.119.822.7
114
365047
49.3 52.7
32.522.46.58.77.1
144818331
201310
19137
111937363519
83
34227
23431543322843
1315127
43
175
37191741109
4.21.5
16.10.9
22.877.253.2
5.142.657.9
108.18.1
$6798
1.1136.889.625.8
97.573.992.498.486.0
316.628.212.965.415.1
4.214.53.0
50.268.214027.01.3
OR
EG
ON
Oregon

114
U N I T E D H E A LT H F O U N D AT I O N | A M E R I C A’ S H E A LT H R A N K I N G S ® S E N I O R R E P O RT 2 0 15
Projected Increase 2015 to 2030 Senior Population Growth State US
Behaviors Smoking (% of adults aged 65+)
Chronic Drinking (% of adults aged 65+) Obesity (% of adults aged 65+) Underweight (% of adults aged 65+ in fair or better health) Physical Inactivity (% of adults aged 65+ in fair or better health)
Dental Visit (% of adults aged 65+)Pain Management (% of adults aged 65+ with joint pain)
Behaviors Total
Community & EnvironmentPoverty (% of adults aged 65+)
Volunteerism (% of adults aged 65+)Nursing Home Quality (% of 4- & 5-star beds)
Community & Environment—Macro Total Home-Delivered Meals (participants as % of adults aged 65+ in poverty) Food Insecurity (% of adults aged 60+) Community Support (dollars per adult aged 65+ in poverty)
Community & Environment—Micro TotalCommunity & Environment Total
Policy Low-Care Nursing Home Residents (% of residents) SNAP Reach (participants as % of adults aged 60+ in poverty)
Prescription Drug Coverage (% of adults aged 65+) Geriatrician Shortfall (% of needed geriatricians)
Policy Total
Clinical CareDedicated Health Care Provider (% of adults aged 65+)
Flu Vaccine (% of adults aged 65+) Health Screenings (% of adults aged 65 to 74)
Recommended Hospital Care (% of hospitalized patients aged 65+)Diabetes Management (% of Medicare beneficiaries)
Home Health Care (number of workers per 1000 adults aged 75+)Preventable Hospitalizations (discharges per 1000 Medicare beneficiaries)
Hospital Readmissions (% of hospitalized patients aged 65+)Hospice Care (% of decedents aged 65+)
Hospital Deaths (% of decedents aged 65+)Clinical Care Total
All Determinants
OutcomesICU Use (% of decedents aged 65+)
Falls (% of adults aged 65+) Hip Fractures (hospitalizations per 1000 Medicare beneficiaries)
Health Status (very good or excellent as % of adults aged 65+)Able-bodied (% of adults aged 65+)
Premature Death (deaths per 100 000 adults aged 65 to 74)Teeth Extractions (% of adults aged 65+)
Poor Mental Health Days (days in previous 30) All Outcomes Overall
2015 No. 1 Value Rank State
Supplemental MeasuresEducation (% of adults aged 65+)
Multiple Chronic Conditions (% of Medicare beneficiaries aged 65+)Cognition (% of adults aged 65+)
Depression (% of adults aged 65+)Suicide (deaths per 100 000 adults aged 65+)
2015 No. 1 Value Rank State
PE
NN
SY
LVA
NIA
Pennsylvania
OverallRank: 25Change: 3Determinants Rank: 21Outcomes Rank: 33
Strengths:• High community-support expenditures• Low percentage of low-care nursing
home residents• Low geriatrician shortfall
Challenges: • High prevalence of obesity• High prevalence of physical inactivity• Low percentage of quality nursing
home beds
Highlights: • In the past year, food insecurity decreased
16% from 15.3% to 12.9% of adults aged 60 and older.
• In the past year, home health care increased 12% from 105.5 to 118.5 home health care workers per 1000 adults aged 75 and older.
• In the past year, pain management decreased 17% from 52.9% to 43.9% of adults aged 65 and older with joint pain.
• In the past year, hip fractures decreased 15% from 6.7 to 5.7 hospitalizations per 1000 Medicare beneficiaries.
• In the past 2 years, physical inactivity increased 13% from 32.4% to 36.7% of adults aged 65 and older.
Ranking:Pennsylvania ranks 25th in America’s Health Rankings® Senior Report; it was 22nd last year. In the 2014 America’s Health Rankings® (all ages), the state ranks 28th.
State Health Department Website: www.health.state.pa.us
10.04.0
30.11.5
36.763.443.9
1.276
8.326.635.3
-0.00617.212.9
$19170.0430.037
6.0
87.187.446.4
0.126
96.659.487.797.282.5
118.562.615.349.721.0
0.0400.092
15.325.65.7
39.165.2187718.22.5
-0.0160.076
18.641.18.3
14.314.4
3943161918
34.5 52.7
32.522.46.58.77.1
3926451840313343
24223731361361526
5151564
5341551113352826191421
39141733203333363325
4.21.516.10.922.877.253.2
5.142.657.9
108.1
8.1$6798
1.1
136.889.625.8
97.573.992.498.486.0316.628.212.965.415.1
4.214.53.050.268.214027.01.3
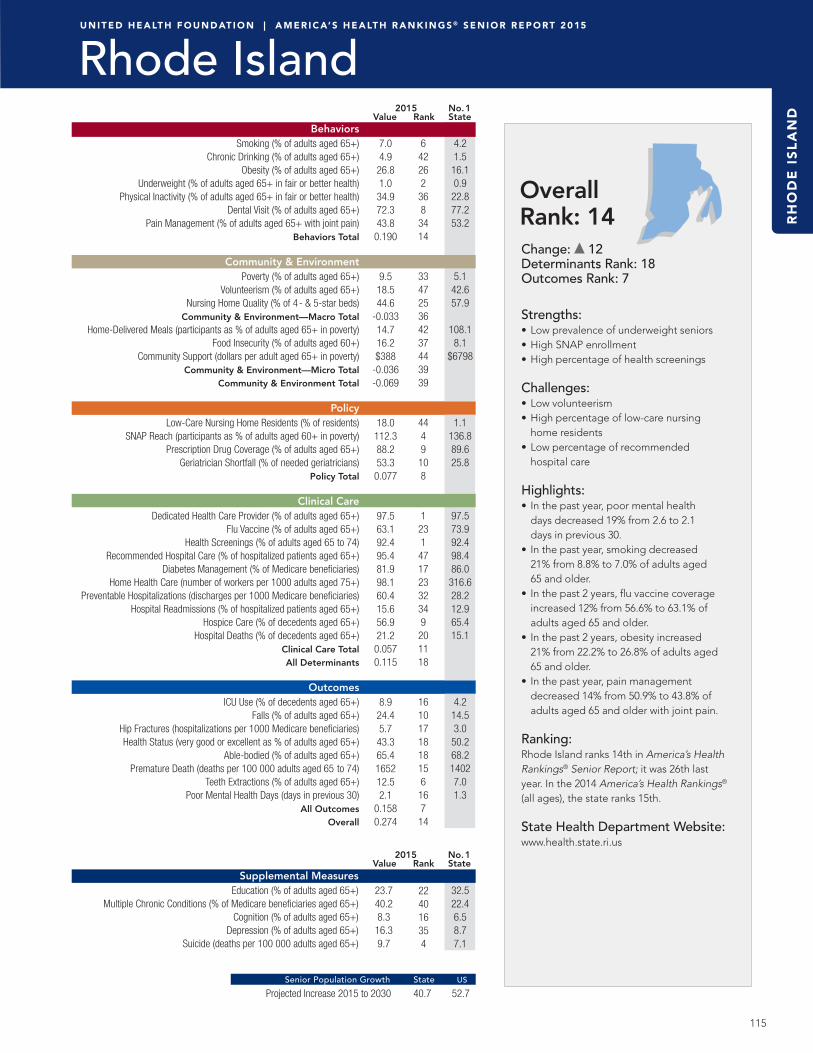
115
U N I T E D H E A LT H F O U N D AT I O N | A M E R I C A’ S H E A LT H R A N K I N G S ® S E N I O R R E P O RT 2 0 15
Projected Increase 2015 to 2030 Senior Population Growth State US
Behaviors Smoking (% of adults aged 65+)
Chronic Drinking (% of adults aged 65+) Obesity (% of adults aged 65+) Underweight (% of adults aged 65+ in fair or better health) Physical Inactivity (% of adults aged 65+ in fair or better health)
Dental Visit (% of adults aged 65+)Pain Management (% of adults aged 65+ with joint pain)
Behaviors Total
Community & EnvironmentPoverty (% of adults aged 65+)
Volunteerism (% of adults aged 65+)Nursing Home Quality (% of 4- & 5-star beds)
Community & Environment—Macro Total Home-Delivered Meals (participants as % of adults aged 65+ in poverty) Food Insecurity (% of adults aged 60+) Community Support (dollars per adult aged 65+ in poverty)
Community & Environment—Micro TotalCommunity & Environment Total
Policy Low-Care Nursing Home Residents (% of residents) SNAP Reach (participants as % of adults aged 60+ in poverty)
Prescription Drug Coverage (% of adults aged 65+) Geriatrician Shortfall (% of needed geriatricians)
Policy Total
Clinical CareDedicated Health Care Provider (% of adults aged 65+)
Flu Vaccine (% of adults aged 65+) Health Screenings (% of adults aged 65 to 74)
Recommended Hospital Care (% of hospitalized patients aged 65+)Diabetes Management (% of Medicare beneficiaries)
Home Health Care (number of workers per 1000 adults aged 75+)Preventable Hospitalizations (discharges per 1000 Medicare beneficiaries)
Hospital Readmissions (% of hospitalized patients aged 65+)Hospice Care (% of decedents aged 65+)
Hospital Deaths (% of decedents aged 65+)Clinical Care Total
All Determinants
OutcomesICU Use (% of decedents aged 65+)
Falls (% of adults aged 65+) Hip Fractures (hospitalizations per 1000 Medicare beneficiaries)
Health Status (very good or excellent as % of adults aged 65+)Able-bodied (% of adults aged 65+)
Premature Death (deaths per 100 000 adults aged 65 to 74)Teeth Extractions (% of adults aged 65+)
Poor Mental Health Days (days in previous 30) All Outcomes Overall
2015 No. 1 Value Rank State
Supplemental MeasuresEducation (% of adults aged 65+)
Multiple Chronic Conditions (% of Medicare beneficiaries aged 65+)Cognition (% of adults aged 65+)
Depression (% of adults aged 65+)Suicide (deaths per 100 000 adults aged 65+)
2015 No. 1 Value Rank State
OverallRank: 14Change: 12Determinants Rank: 18Outcomes Rank: 7
Strengths:• Low prevalence of underweight seniors• High SNAP enrollment• High percentage of health screenings
Challenges: • Low volunteerism• High percentage of low-care nursing
home residents• Low percentage of recommended
hospital care
Highlights: • In the past year, poor mental health
days decreased 19% from 2.6 to 2.1 days in previous 30.
• In the past year, smoking decreased 21% from 8.8% to 7.0% of adults aged 65 and older.
• In the past 2 years, flu vaccine coverage increased 12% from 56.6% to 63.1% of adults aged 65 and older.
• In the past 2 years, obesity increased 21% from 22.2% to 26.8% of adults aged 65 and older.
• In the past year, pain management decreased 14% from 50.9% to 43.8% of adults aged 65 and older with joint pain.
Ranking:Rhode Island ranks 14th in America’s Health Rankings® Senior Report; it was 26th last year. In the 2014 America’s Health Rankings® (all ages), the state ranks 15th.
State Health Department Website: www.health.state.ri.us
7.04.9
26.81.0
34.972.343.8
0.190
9.518.544.6
-0.03314.716.2$388
-0.036-0.069
18.0
112.388.253.3
0.077
97.563.192.495.481.998.160.415.656.921.2
0.0570.115
8.9
24.45.7
43.365.4165212.52.1
0.1580.274
23.740.28.3
16.39.7
224016354
40.7 52.7
32.522.46.58.77.1
642262
368
3414
334725364237443939
4449
108
1
231
47172332349
201118
1610171818156
167
14
4.21.5
16.10.9
22.877.253.2
5.142.657.9
108.18.1
$6798
1.1136.889.625.8
97.573.992.498.486.0
316.628.212.965.415.1
4.214.53.0
50.268.214027.01.3
RH
OD
E I
SL
AN
D
Rhode Island

116
U N I T E D H E A LT H F O U N D AT I O N | A M E R I C A’ S H E A LT H R A N K I N G S ® S E N I O R R E P O RT 2 0 15
Projected Increase 2015 to 2030 Senior Population Growth State US
Behaviors Smoking (% of adults aged 65+)
Chronic Drinking (% of adults aged 65+) Obesity (% of adults aged 65+) Underweight (% of adults aged 65+ in fair or better health) Physical Inactivity (% of adults aged 65+ in fair or better health)
Dental Visit (% of adults aged 65+)Pain Management (% of adults aged 65+ with joint pain)
Behaviors Total
Community & EnvironmentPoverty (% of adults aged 65+)
Volunteerism (% of adults aged 65+)Nursing Home Quality (% of 4- & 5-star beds)
Community & Environment—Macro Total Home-Delivered Meals (participants as % of adults aged 65+ in poverty) Food Insecurity (% of adults aged 60+) Community Support (dollars per adult aged 65+ in poverty)
Community & Environment—Micro TotalCommunity & Environment Total
Policy Low-Care Nursing Home Residents (% of residents) SNAP Reach (participants as % of adults aged 60+ in poverty)
Prescription Drug Coverage (% of adults aged 65+) Geriatrician Shortfall (% of needed geriatricians)
Policy Total
Clinical CareDedicated Health Care Provider (% of adults aged 65+)
Flu Vaccine (% of adults aged 65+) Health Screenings (% of adults aged 65 to 74)
Recommended Hospital Care (% of hospitalized patients aged 65+)Diabetes Management (% of Medicare beneficiaries)
Home Health Care (number of workers per 1000 adults aged 75+)Preventable Hospitalizations (discharges per 1000 Medicare beneficiaries)
Hospital Readmissions (% of hospitalized patients aged 65+)Hospice Care (% of decedents aged 65+)
Hospital Deaths (% of decedents aged 65+)Clinical Care Total
All Determinants
OutcomesICU Use (% of decedents aged 65+)
Falls (% of adults aged 65+) Hip Fractures (hospitalizations per 1000 Medicare beneficiaries)
Health Status (very good or excellent as % of adults aged 65+)Able-bodied (% of adults aged 65+)
Premature Death (deaths per 100 000 adults aged 65 to 74)Teeth Extractions (% of adults aged 65+)
Poor Mental Health Days (days in previous 30) All Outcomes Overall
2015 No. 1 Value Rank State
Supplemental MeasuresEducation (% of adults aged 65+)
Multiple Chronic Conditions (% of Medicare beneficiaries aged 65+)Cognition (% of adults aged 65+)
Depression (% of adults aged 65+)Suicide (deaths per 100 000 adults aged 65+)
2015 No. 1 Value Rank State
SO
UT
H C
AR
OL
INA
South Carolina
OverallRank: 36Change: 2Determinants Rank: 32Outcomes Rank: 41
Strengths:• High percentage of quality
nursing home beds• Low percentage of low-care
nursing home residents• High hospice care use
Challenges: • High prevalence of food insecurity• High hip fracture rate• Many poor mental health days
Highlights: • In the past year, flu vaccine coverage
increased 9% from 60.1% to 65.3% of adults aged 65 and older.
• In the past year, smoking decreased 17% from 10.1% to 8.4% of adults aged 65 and older.
• In the past year, physical inactivity increased 15% from 27.8% to 32.0% of adults aged 65 and older.
• In the past year, pain management decreased 17% from 55.7% to 46.1% of adults aged 65 and older with joint pain.
• In the past year, community support decreased 11% from $409 to $363 per adult aged 65 and older in poverty.
Ranking:South Carolina ranks 36th in America’s Health Rankings® Senior Report; it was 34th last year. In the 2014 America’s Health Rankings®
(all ages), the state ranks 42nd.
State Health Department Website: www.scdhec.gov
8.44.5
26.71.7
32.061.346.1
-0.163
10.224.745.2
-0.01116.718.4$363
-0.055-0.066
5.7
72.587.071.2
0.033
93.865.386.096.882.072.754.115.056.522.2
0.032-0.027
14.727.27.1
36.962.7203419.52.6
-0.140-0.167
22.036.410.316.917.4
2927374132
55.6 52.7
32.522.46.58.77.1
1735243020382037
362921323844464538
425202815
331728171638202312241732
37194040334037414136
4.21.516.10.922.877.253.2
5.142.657.9
108.1
8.1$6798
1.1
136.889.625.8
97.573.992.498.486.0316.628.212.965.415.1
4.214.53.050.268.214027.01.3

117
U N I T E D H E A LT H F O U N D AT I O N | A M E R I C A’ S H E A LT H R A N K I N G S ® S E N I O R R E P O RT 2 0 15
Projected Increase 2015 to 2030 Senior Population Growth State US
Behaviors Smoking (% of adults aged 65+)
Chronic Drinking (% of adults aged 65+) Obesity (% of adults aged 65+) Underweight (% of adults aged 65+ in fair or better health) Physical Inactivity (% of adults aged 65+ in fair or better health)
Dental Visit (% of adults aged 65+)Pain Management (% of adults aged 65+ with joint pain)
Behaviors Total
Community & EnvironmentPoverty (% of adults aged 65+)
Volunteerism (% of adults aged 65+)Nursing Home Quality (% of 4- & 5-star beds)
Community & Environment—Macro Total Home-Delivered Meals (participants as % of adults aged 65+ in poverty) Food Insecurity (% of adults aged 60+) Community Support (dollars per adult aged 65+ in poverty)
Community & Environment—Micro TotalCommunity & Environment Total
Policy Low-Care Nursing Home Residents (% of residents) SNAP Reach (participants as % of adults aged 60+ in poverty)
Prescription Drug Coverage (% of adults aged 65+) Geriatrician Shortfall (% of needed geriatricians)
Policy Total
Clinical CareDedicated Health Care Provider (% of adults aged 65+)
Flu Vaccine (% of adults aged 65+) Health Screenings (% of adults aged 65 to 74)
Recommended Hospital Care (% of hospitalized patients aged 65+)Diabetes Management (% of Medicare beneficiaries)
Home Health Care (number of workers per 1000 adults aged 75+)Preventable Hospitalizations (discharges per 1000 Medicare beneficiaries)
Hospital Readmissions (% of hospitalized patients aged 65+)Hospice Care (% of decedents aged 65+)
Hospital Deaths (% of decedents aged 65+)Clinical Care Total
All Determinants
OutcomesICU Use (% of decedents aged 65+)
Falls (% of adults aged 65+) Hip Fractures (hospitalizations per 1000 Medicare beneficiaries)
Health Status (very good or excellent as % of adults aged 65+)Able-bodied (% of adults aged 65+)
Premature Death (deaths per 100 000 adults aged 65 to 74)Teeth Extractions (% of adults aged 65+)
Poor Mental Health Days (days in previous 30) All Outcomes Overall
2015 No. 1 Value Rank State
Supplemental MeasuresEducation (% of adults aged 65+)
Multiple Chronic Conditions (% of Medicare beneficiaries aged 65+)Cognition (% of adults aged 65+)
Depression (% of adults aged 65+)Suicide (deaths per 100 000 adults aged 65+)
2015 No. 1 Value Rank State
OverallRank: 23Change: 4Determinants Rank: 25Outcomes Rank: 21
Strengths:• Low prevalence of chronic drinking• High volunteerism• Few poor mental health days
Challenges: • Low SNAP enrollment• Limited availability of home health care
workers• Low hospice care use
Highlights: • In the past year, flu vaccine coverage
increased 7% from 66.4% to 71.3% of adults aged 65 and older.
• In the past year, chronic drinking decreased 42% from 3.6% to 2.1% of adults aged 65 and older.
• In the past year, smoking decreased 9% from 9.2% to 8.4% of adults aged 65 and older.
• In the past year, ICU use increased 20% from 6.9% to 8.3% of decedents aged 65 and older.
• In the past year, pain management decreased 20% from 52.1% to 41.8% of adults aged 65 and older with joint pain.
Ranking:South Dakota ranks 23rd in America’s Health Rankings® Senior Report; it was 27th last year. In the 2014 America’s Health Rankings® (all ages), the state ranks 18th.
State Health Department Website: http://doh.sd.gov
8.42.1
28.71.0
31.164.041.8
0.714
10.537.536.4
0.01625.213.0
$11410.0320.048
16.743.688.667.3
-0.055
92.971.386.296.874.545.157.514.238.319.5
0.0040.043
8.3
27.96.1
40.064.3176919.41.5
0.0880.132
20.529.47.8
10.511.4
33111228
44.6 52.7
32.522.46.58.77.1
174
372
17274215
414
36242417131724
41473
2638
383
25174349289
45112925
122324292626363
2123
4.21.5
16.10.9
22.877.253.2
5.142.657.9
108.18.1
$6798
1.1136.889.625.8
97.573.992.498.486.0
316.628.212.965.415.1
4.214.53.0
50.268.214027.01.3
SO
UT
H D
AK
OTA
South Dakota

118
U N I T E D H E A LT H F O U N D AT I O N | A M E R I C A’ S H E A LT H R A N K I N G S ® S E N I O R R E P O RT 2 0 15
Projected Increase 2015 to 2030 Senior Population Growth State US
Behaviors Smoking (% of adults aged 65+)
Chronic Drinking (% of adults aged 65+) Obesity (% of adults aged 65+) Underweight (% of adults aged 65+ in fair or better health) Physical Inactivity (% of adults aged 65+ in fair or better health)
Dental Visit (% of adults aged 65+)Pain Management (% of adults aged 65+ with joint pain)
Behaviors Total
Community & EnvironmentPoverty (% of adults aged 65+)
Volunteerism (% of adults aged 65+)Nursing Home Quality (% of 4- & 5-star beds)
Community & Environment—Macro Total Home-Delivered Meals (participants as % of adults aged 65+ in poverty) Food Insecurity (% of adults aged 60+) Community Support (dollars per adult aged 65+ in poverty)
Community & Environment—Micro TotalCommunity & Environment Total
Policy Low-Care Nursing Home Residents (% of residents) SNAP Reach (participants as % of adults aged 60+ in poverty)
Prescription Drug Coverage (% of adults aged 65+) Geriatrician Shortfall (% of needed geriatricians)
Policy Total
Clinical CareDedicated Health Care Provider (% of adults aged 65+)
Flu Vaccine (% of adults aged 65+) Health Screenings (% of adults aged 65 to 74)
Recommended Hospital Care (% of hospitalized patients aged 65+)Diabetes Management (% of Medicare beneficiaries)
Home Health Care (number of workers per 1000 adults aged 75+)Preventable Hospitalizations (discharges per 1000 Medicare beneficiaries)
Hospital Readmissions (% of hospitalized patients aged 65+)Hospice Care (% of decedents aged 65+)
Hospital Deaths (% of decedents aged 65+)Clinical Care Total
All Determinants
OutcomesICU Use (% of decedents aged 65+)
Falls (% of adults aged 65+) Hip Fractures (hospitalizations per 1000 Medicare beneficiaries)
Health Status (very good or excellent as % of adults aged 65+)Able-bodied (% of adults aged 65+)
Premature Death (deaths per 100 000 adults aged 65 to 74)Teeth Extractions (% of adults aged 65+)
Poor Mental Health Days (days in previous 30) All Outcomes Overall
2015 No. 1 Value Rank State
Supplemental MeasuresEducation (% of adults aged 65+)
Multiple Chronic Conditions (% of Medicare beneficiaries aged 65+)Cognition (% of adults aged 65+)
Depression (% of adults aged 65+)Suicide (deaths per 100 000 adults aged 65+)
2015 No. 1 Value Rank State
TE
NN
ES
SE
E
Tennessee
Overall Rank: 44Change: 1Determinants Rank: 43Outcomes Rank: 43
Strengths:• Low prevalence of chronic drinking• High prescription drug coverage• High flu vaccination coverage
Challenges: • High prevalence of physical inactivity• High prevalence of food insecurity• High hip fracture rate
Highlights: • In the past year, chronic drinking
decreased 29% from 2.1% to 1.5% of adults aged 65 and older.
• In the past year, smoking decreased 14% from 12.5% to 10.8% of adults aged 65 and older.
• In the past year, physical inactivity increased 30% from 32.2% to 41.7% of adults aged 65 and older.
• In the past year, food insecurity increased 20% from 17.9% to 21.4% of adults aged 60 and older.
• In the past year, home health care decreased 11% from 72.9 to 64.8 home health care workers per 1000 adults aged 75 and older.
Ranking:Tennessee ranks 44th in America’s Health Rankings® Senior Report; it was 43rd last year. In the 2014 America’s Health Rankings® (all ages), the state ranks 45th.
State Health Department Website: http://health.state.tn.us
10.81.5
28.31.9
41.759.848.9
-0.602
10.221.033.7
-0.07710.121.4$458
-0.090-0.167
10.677.587.881.2
-0.007
95.573.485.296.882.364.873.115.845.224.3
-0.001-0.243
15.127.97.9
32.759.9221524.82.3
-0.251-0.495
18.138.211.215.019.0
4236432836
46.3 52.7
32.522.46.58.77.1
43134374842939
363843424847415047
2322124622
14231171443463839373243
38234846414346274344
4.21.516.10.922.877.253.2
5.142.657.9
108.1
8.1$6798
1.1
136.889.625.8
97.573.992.498.486.0316.628.212.965.415.1
4.214.53.050.268.214027.01.3

119
U N I T E D H E A LT H F O U N D AT I O N | A M E R I C A’ S H E A LT H R A N K I N G S ® S E N I O R R E P O RT 2 0 15
Projected Increase 2015 to 2030 Senior Population Growth State US
Behaviors Smoking (% of adults aged 65+)
Chronic Drinking (% of adults aged 65+) Obesity (% of adults aged 65+) Underweight (% of adults aged 65+ in fair or better health) Physical Inactivity (% of adults aged 65+ in fair or better health)
Dental Visit (% of adults aged 65+)Pain Management (% of adults aged 65+ with joint pain)
Behaviors Total
Community & EnvironmentPoverty (% of adults aged 65+)
Volunteerism (% of adults aged 65+)Nursing Home Quality (% of 4- & 5-star beds)
Community & Environment—Macro Total Home-Delivered Meals (participants as % of adults aged 65+ in poverty) Food Insecurity (% of adults aged 60+) Community Support (dollars per adult aged 65+ in poverty)
Community & Environment—Micro TotalCommunity & Environment Total
Policy Low-Care Nursing Home Residents (% of residents) SNAP Reach (participants as % of adults aged 60+ in poverty)
Prescription Drug Coverage (% of adults aged 65+) Geriatrician Shortfall (% of needed geriatricians)
Policy Total
Clinical CareDedicated Health Care Provider (% of adults aged 65+)
Flu Vaccine (% of adults aged 65+) Health Screenings (% of adults aged 65 to 74)
Recommended Hospital Care (% of hospitalized patients aged 65+)Diabetes Management (% of Medicare beneficiaries)
Home Health Care (number of workers per 1000 adults aged 75+)Preventable Hospitalizations (discharges per 1000 Medicare beneficiaries)
Hospital Readmissions (% of hospitalized patients aged 65+)Hospice Care (% of decedents aged 65+)
Hospital Deaths (% of decedents aged 65+)Clinical Care Total
All Determinants
OutcomesICU Use (% of decedents aged 65+)
Falls (% of adults aged 65+) Hip Fractures (hospitalizations per 1000 Medicare beneficiaries)
Health Status (very good or excellent as % of adults aged 65+)Able-bodied (% of adults aged 65+)
Premature Death (deaths per 100 000 adults aged 65 to 74)Teeth Extractions (% of adults aged 65+)
Poor Mental Health Days (days in previous 30) All Outcomes Overall
2015 No. 1 Value Rank State
Supplemental MeasuresEducation (% of adults aged 65+)
Multiple Chronic Conditions (% of Medicare beneficiaries aged 65+)Cognition (% of adults aged 65+)
Depression (% of adults aged 65+)Suicide (deaths per 100 000 adults aged 65+)
2015 No. 1 Value Rank State
OverallRank: 41Change: No ChangeDeterminants Rank: 44Outcomes Rank: 37
Strengths:• Ready availability of home
health care providers• Low prevalence of full-mouth
tooth extraction• Few poor mental health days
Challenges: • High prevalence of physical inactivity• Low percentage of quality nursing
home beds• High prevalence of food insecurity
Highlights: • In the past year, hip fractures decreased
17% from 8.4 to 7.0 hospitalizations per 1000 Medicare beneficiaries.
• In the past year, poor mental health days decreased 24% from 2.5 to 1.9 days in previous 30.
• In the past year, physical inactivity increased 35% from 28.3% to 38.1% of adults aged 65 and older.
• In the past year, food insecurity increased 8% from 18.4% to 19.8% of adults aged 60 and older.
• In the past year, chronic drinking increased 59% from 3.2% to 5.1% of adults aged 65 and older.
Ranking:Texas ranks 41st in America’s Health Rankings® Senior Report; it was 41st last year. In the 2014 America’s Health Rankings® (all ages), the state ranks 31st.
State Health Department Website: www.dshs.state.tx.us
8.75.1
27.61.9
38.161.249.9
-3.382
11.321.925.9
-0.12319.819.8$338
-0.064-0.187
14.379.486.272.0
-0.031
91.561.085.096.781.7
177.462.915.357.220.5
0.017-0.280
17.130.27.0
37.060.1186913.41.9
-0.085-0.365
22.839.510.713.716.0
2538391423
66.6 52.7
32.522.46.58.77.1
2245313742397
40
453750492945474649
3420293029
42313321195
37288
172444
453438384032119
3741
4.21.5
16.10.9
22.877.253.2
5.142.657.9
108.18.1
$6798
1.1136.889.625.8
97.573.992.498.486.0
316.628.212.965.415.1
4.214.53.0
50.268.214027.01.3
TE
XA
S
Texas

120
U N I T E D H E A LT H F O U N D AT I O N | A M E R I C A’ S H E A LT H R A N K I N G S ® S E N I O R R E P O RT 2 0 15
Projected Increase 2015 to 2030 Senior Population Growth State US
Behaviors Smoking (% of adults aged 65+)
Chronic Drinking (% of adults aged 65+) Obesity (% of adults aged 65+) Underweight (% of adults aged 65+ in fair or better health) Physical Inactivity (% of adults aged 65+ in fair or better health)
Dental Visit (% of adults aged 65+)Pain Management (% of adults aged 65+ with joint pain)
Behaviors Total
Community & EnvironmentPoverty (% of adults aged 65+)
Volunteerism (% of adults aged 65+)Nursing Home Quality (% of 4- & 5-star beds)
Community & Environment—Macro Total Home-Delivered Meals (participants as % of adults aged 65+ in poverty) Food Insecurity (% of adults aged 60+) Community Support (dollars per adult aged 65+ in poverty)
Community & Environment—Micro TotalCommunity & Environment Total
Policy Low-Care Nursing Home Residents (% of residents) SNAP Reach (participants as % of adults aged 60+ in poverty)
Prescription Drug Coverage (% of adults aged 65+) Geriatrician Shortfall (% of needed geriatricians)
Policy Total
Clinical CareDedicated Health Care Provider (% of adults aged 65+)
Flu Vaccine (% of adults aged 65+) Health Screenings (% of adults aged 65 to 74)
Recommended Hospital Care (% of hospitalized patients aged 65+)Diabetes Management (% of Medicare beneficiaries)
Home Health Care (number of workers per 1000 adults aged 75+)Preventable Hospitalizations (discharges per 1000 Medicare beneficiaries)
Hospital Readmissions (% of hospitalized patients aged 65+)Hospice Care (% of decedents aged 65+)
Hospital Deaths (% of decedents aged 65+)Clinical Care Total
All Determinants
OutcomesICU Use (% of decedents aged 65+)
Falls (% of adults aged 65+) Hip Fractures (hospitalizations per 1000 Medicare beneficiaries)
Health Status (very good or excellent as % of adults aged 65+)Able-bodied (% of adults aged 65+)
Premature Death (deaths per 100 000 adults aged 65 to 74)Teeth Extractions (% of adults aged 65+)
Poor Mental Health Days (days in previous 30) All Outcomes Overall
2015 No. 1 Value Rank State
Supplemental MeasuresEducation (% of adults aged 65+)
Multiple Chronic Conditions (% of Medicare beneficiaries aged 65+)Cognition (% of adults aged 65+)
Depression (% of adults aged 65+)Suicide (deaths per 100 000 adults aged 65+)
2015 No. 1 Value Rank State
UTA
H
Utah
OverallRank: 5Change: 2Determinants Rank: 3Outcomes Rank: 12
Strengths:• Low prevalence of smoking• High volunteerism• Ready availability of home-delivered meals
Challenges: • Low SNAP enrollment• High geriatrician shortfall• Low percentage of diabetes management
Highlights: • In the past year, home health care
increased 57% from 44.9 to 70.3 home health care workers per 1000 adults aged 75 and older.
• In the past year, very good or excellent health status increased 10% from 42.7% to 47.1% of adults aged 65 and older.
• In the past year, volunteerism increased 10% from 38.6% to 42.6% of adults aged 65 and older.
• In the past year, poverty increased 7% from 6.1% to 6.5% of adults aged 65 and older.
• In the past year, community support decreased 16% from $1569 to $1312 per adult aged 65 and older in poverty.
Ranking:Utah ranks 5th in America’s Health Rankings® Senior Report; it was 7th last year. In the 2014 America’s Health Rankings® (all ages), the state ranks 5th.
State Health Department Website: www.health.utah.gov
4.22.1
25.41.6
26.871.145.7
-3.223
6.542.642.8
0.12357.614.8
$13120.0670.190
5.6
45.884.480.8
-0.075
93.257.483.797.273.970.334.012.964.815.1
0.0610.391
6.9
30.96.1
47.165.0156812.92.2
0.1270.518
29.126.98.3
17.721.4
46164543
63.9 52.7
32.522.46.58.77.1
141224511251
412935311085
346384441
37394054439212193
839246227721125
4.21.516.10.922.877.253.2
5.142.657.9
108.1
8.1$6798
1.1
136.889.625.8
97.573.992.498.486.0316.628.212.965.415.1
4.214.53.050.268.214027.01.3

121
U N I T E D H E A LT H F O U N D AT I O N | A M E R I C A’ S H E A LT H R A N K I N G S ® S E N I O R R E P O RT 2 0 15
Projected Increase 2015 to 2030 Senior Population Growth State US
Behaviors Smoking (% of adults aged 65+)
Chronic Drinking (% of adults aged 65+) Obesity (% of adults aged 65+) Underweight (% of adults aged 65+ in fair or better health) Physical Inactivity (% of adults aged 65+ in fair or better health)
Dental Visit (% of adults aged 65+)Pain Management (% of adults aged 65+ with joint pain)
Behaviors Total
Community & EnvironmentPoverty (% of adults aged 65+)
Volunteerism (% of adults aged 65+)Nursing Home Quality (% of 4- & 5-star beds)
Community & Environment—Macro Total Home-Delivered Meals (participants as % of adults aged 65+ in poverty) Food Insecurity (% of adults aged 60+) Community Support (dollars per adult aged 65+ in poverty)
Community & Environment—Micro TotalCommunity & Environment Total
Policy Low-Care Nursing Home Residents (% of residents) SNAP Reach (participants as % of adults aged 60+ in poverty)
Prescription Drug Coverage (% of adults aged 65+) Geriatrician Shortfall (% of needed geriatricians)
Policy Total
Clinical CareDedicated Health Care Provider (% of adults aged 65+)
Flu Vaccine (% of adults aged 65+) Health Screenings (% of adults aged 65 to 74)
Recommended Hospital Care (% of hospitalized patients aged 65+)Diabetes Management (% of Medicare beneficiaries)
Home Health Care (number of workers per 1000 adults aged 75+)Preventable Hospitalizations (discharges per 1000 Medicare beneficiaries)
Hospital Readmissions (% of hospitalized patients aged 65+)Hospice Care (% of decedents aged 65+)
Hospital Deaths (% of decedents aged 65+)Clinical Care Total
All Determinants
OutcomesICU Use (% of decedents aged 65+)
Falls (% of adults aged 65+) Hip Fractures (hospitalizations per 1000 Medicare beneficiaries)
Health Status (very good or excellent as % of adults aged 65+)Able-bodied (% of adults aged 65+)
Premature Death (deaths per 100 000 adults aged 65 to 74)Teeth Extractions (% of adults aged 65+)
Poor Mental Health Days (days in previous 30) All Outcomes Overall
2015 No. 1 Value Rank State
Supplemental MeasuresEducation (% of adults aged 65+)
Multiple Chronic Conditions (% of Medicare beneficiaries aged 65+)Cognition (% of adults aged 65+)
Depression (% of adults aged 65+)Suicide (deaths per 100 000 adults aged 65+)
2015 No. 1 Value Rank State
OverallRank: 1Change: 3Determinants Rank: 1Outcomes Rank: 9
Strengths:• Ready availability of home-delivered meals• High SNAP enrollment• Low ICU use
Challenges: • High prevalence of chronic drinking• Low hospice care use• High prevalence of falls
Highlights: • In the past year, hip fractures decreased
19% from 6.9 to 5.6 hospitalizations per 1000 Medicare beneficiaries.
• In the past year, hospice care increased 13% from 28.5% to 32.2% of decedents aged 65 and older.
• In the past year, poor mental health days decreased 14% from 2.2 to 1.9 days in previous 30.
• In the past year, food insecurity increased 14% from 10.8% to 12.3% of adults aged 60 and older.
• In the past year, diabetes management decreased 4% from 79.7% to 76.7% of Medicare beneficiaries.
Ranking:Vermont ranks 1st in America’s Health Rankings® Senior Report; it was 4th last year. In the 2014 America’s Health Rankings® (all ages), the state ranks 2nd.
State Health Department Website: www.healthvermont.gov
7.44.5
25.41.3
26.970.645.2
0.000
7.332.848.7
0.09964.012.3
$24790.1340.233
6.5
136.886.261.2
0.122
95.765.089.297.176.7
175.348.313.932.225.1
0.0460.512
4.4
32.05.6
49.966.6170817.51.9
0.1530.664
30.627.08.3
17.420.7
27
164440
53.3 52.7
32.522.46.58.77.1
103512106
12284
79
1174
10542
71
29155
9
181010346
126
4639131
2
431238
2330991
4.21.5
16.10.9
22.877.253.2
5.142.657.9
108.18.1
$6798
1.1136.889.625.8
97.573.992.498.486.0
316.628.212.965.415.1
4.214.53.0
50.268.214027.01.3
VE
RM
ON
T
Vermont

122
U N I T E D H E A LT H F O U N D AT I O N | A M E R I C A’ S H E A LT H R A N K I N G S ® S E N I O R R E P O RT 2 0 15
Projected Increase 2015 to 2030 Senior Population Growth State US
Behaviors Smoking (% of adults aged 65+)
Chronic Drinking (% of adults aged 65+) Obesity (% of adults aged 65+) Underweight (% of adults aged 65+ in fair or better health) Physical Inactivity (% of adults aged 65+ in fair or better health)
Dental Visit (% of adults aged 65+)Pain Management (% of adults aged 65+ with joint pain)
Behaviors Total
Community & EnvironmentPoverty (% of adults aged 65+)
Volunteerism (% of adults aged 65+)Nursing Home Quality (% of 4- & 5-star beds)
Community & Environment—Macro Total Home-Delivered Meals (participants as % of adults aged 65+ in poverty) Food Insecurity (% of adults aged 60+) Community Support (dollars per adult aged 65+ in poverty)
Community & Environment—Micro TotalCommunity & Environment Total
Policy Low-Care Nursing Home Residents (% of residents) SNAP Reach (participants as % of adults aged 60+ in poverty)
Prescription Drug Coverage (% of adults aged 65+) Geriatrician Shortfall (% of needed geriatricians)
Policy Total
Clinical CareDedicated Health Care Provider (% of adults aged 65+)
Flu Vaccine (% of adults aged 65+) Health Screenings (% of adults aged 65 to 74)
Recommended Hospital Care (% of hospitalized patients aged 65+)Diabetes Management (% of Medicare beneficiaries)
Home Health Care (number of workers per 1000 adults aged 75+)Preventable Hospitalizations (discharges per 1000 Medicare beneficiaries)
Hospital Readmissions (% of hospitalized patients aged 65+)Hospice Care (% of decedents aged 65+)
Hospital Deaths (% of decedents aged 65+)Clinical Care Total
All Determinants
OutcomesICU Use (% of decedents aged 65+)
Falls (% of adults aged 65+) Hip Fractures (hospitalizations per 1000 Medicare beneficiaries)
Health Status (very good or excellent as % of adults aged 65+)Able-bodied (% of adults aged 65+)
Premature Death (deaths per 100 000 adults aged 65 to 74)Teeth Extractions (% of adults aged 65+)
Poor Mental Health Days (days in previous 30) All Outcomes Overall
2015 No. 1 Value Rank State
Supplemental MeasuresEducation (% of adults aged 65+)
Multiple Chronic Conditions (% of Medicare beneficiaries aged 65+)Cognition (% of adults aged 65+)
Depression (% of adults aged 65+)Suicide (deaths per 100 000 adults aged 65+)
2015 No. 1 Value Rank State
VIR
GIN
IA
Virginia
Overall Rank: 28Change: 7Determinants Rank: 31Outcomes Rank: 29
Strengths:• Low percentage of seniors living in poverty• Low prevalence of food insecurity• High percentage of recommended
hospital care
Challenges: • High prevalence of smoking• Low percentage of quality nursing
home beds• Low prescription drug coverage
Highlights: • In the past year, home health care
increased 18% from 86.0 to 101.3 home health care workers per 1000 adults aged 75 and older.
• In the past year, hip fractures decreased 16% from 7.7 to 6.5 hospitalizations per 1000 Medicare beneficiaries.
• In the past year, physical inactivity increased 21% from 28.6% to 34.6% of adults aged 65 and older.
• In the past year, pain management decreased 19% from 52.6% to 42.7% of adults aged 65 and older with joint pain.
• In the past year, food insecurity increased 43% from 8.4% to 12.0% of adults aged 60 and older.
Ranking:Virginia ranks 28th in America’s Health Rankings® Senior Report; it was 21st last year. In the 2014 America’s Health Rankings® (all ages), the state ranks 21st.
State Health Department Website: www.vdh.state.va.us
10.43.7
26.41.3
34.669.142.7
-1.354
7.626.932.6
-0.00315.212.0$5640.0100.007
8.6
69.084.363.8
-0.015
93.962.887.997.982.4
101.355.215.346.625.3
0.019-0.011
16.526.16.5
42.265.8179416.12.3
0.009-0.002
27.035.29.3
14.117.3
1223321831
54.5 52.7
32.522.46.58.77.1
4125211034174035
11194526418322430
1428391823
29261321321222835412231
42163323162723272928
4.21.516.10.922.877.253.2
5.142.657.9
108.1
8.1$6798
1.1
136.889.625.8
97.573.992.498.486.0316.628.212.965.415.1
4.214.53.050.268.214027.01.3

123
U N I T E D H E A LT H F O U N D AT I O N | A M E R I C A’ S H E A LT H R A N K I N G S ® S E N I O R R E P O RT 2 0 15
Projected Increase 2015 to 2030 Senior Population Growth State US
Behaviors Smoking (% of adults aged 65+)
Chronic Drinking (% of adults aged 65+) Obesity (% of adults aged 65+) Underweight (% of adults aged 65+ in fair or better health) Physical Inactivity (% of adults aged 65+ in fair or better health)
Dental Visit (% of adults aged 65+)Pain Management (% of adults aged 65+ with joint pain)
Behaviors Total
Community & EnvironmentPoverty (% of adults aged 65+)
Volunteerism (% of adults aged 65+)Nursing Home Quality (% of 4- & 5-star beds)
Community & Environment—Macro Total Home-Delivered Meals (participants as % of adults aged 65+ in poverty) Food Insecurity (% of adults aged 60+) Community Support (dollars per adult aged 65+ in poverty)
Community & Environment—Micro TotalCommunity & Environment Total
Policy Low-Care Nursing Home Residents (% of residents) SNAP Reach (participants as % of adults aged 60+ in poverty)
Prescription Drug Coverage (% of adults aged 65+) Geriatrician Shortfall (% of needed geriatricians)
Policy Total
Clinical CareDedicated Health Care Provider (% of adults aged 65+)
Flu Vaccine (% of adults aged 65+) Health Screenings (% of adults aged 65 to 74)
Recommended Hospital Care (% of hospitalized patients aged 65+)Diabetes Management (% of Medicare beneficiaries)
Home Health Care (number of workers per 1000 adults aged 75+)Preventable Hospitalizations (discharges per 1000 Medicare beneficiaries)
Hospital Readmissions (% of hospitalized patients aged 65+)Hospice Care (% of decedents aged 65+)
Hospital Deaths (% of decedents aged 65+)Clinical Care Total
All Determinants
OutcomesICU Use (% of decedents aged 65+)
Falls (% of adults aged 65+) Hip Fractures (hospitalizations per 1000 Medicare beneficiaries)
Health Status (very good or excellent as % of adults aged 65+)Able-bodied (% of adults aged 65+)
Premature Death (deaths per 100 000 adults aged 65 to 74)Teeth Extractions (% of adults aged 65+)
Poor Mental Health Days (days in previous 30) All Outcomes Overall
2015 No. 1 Value Rank State
Supplemental MeasuresEducation (% of adults aged 65+)
Multiple Chronic Conditions (% of Medicare beneficiaries aged 65+)Cognition (% of adults aged 65+)
Depression (% of adults aged 65+)Suicide (deaths per 100 000 adults aged 65+)
2015 No. 1 Value Rank State
OverallRank: 11Change: 4Determinants Rank: 10Outcomes Rank: 15
Strengths:• Low prevalence of physical inactivity• High SNAP enrollment• Low prevalence of full-mouth tooth
extraction
Challenges: • High prevalence of chronic drinking• Low prescription drug coverage• High prevalence of falls
Highlights: • In the past year, hip fractures decreased
21% from 6.7 to 5.3 hospitalizations per 1000 Medicare beneficiaries.
• In the past 2 years, home health care increased 17% from 73.2 to 85.5 home health care workers per 1000 adults aged 75 and older.
• In the past 2 years, preventable hospitalizations decreased 15% from 46.4 to 39.3 discharges per 1000 Medicare beneficiaries.
• In the past year, obesity increased 6% from 25.6% to 27.0% of adults aged 65 and older.
• In the past year, poverty increased 5% from 7.8% to 8.2% of adults aged 65 and older.
Ranking:Washington ranks 11th in America’s Health Rankings® Senior Report; it was 15th last year. In the 2014 America’s Health Rankings® (all ages), the state ranks 13th.
State Health Department Website: www.doh.wa.gov
7.34.8
27.01.3
24.470.550.3
3.615
8.230.147.4
0.06315.413.5$436
-0.0080.055
6.4
103.082.263.8
0.021
93.960.884.596.678.885.539.314.545.722.3
0.0080.240
9.7
32.75.3
45.063.3161410.92.2
0.1030.343
29.128.09.4
18.118.8
410334735
62.0 52.7
32.522.46.58.77.1
93928103
1352
211114154023433323
66
461817
2932342331296
1137262610
18483
1431113
211511
4.21.5
16.10.9
22.877.253.2
5.142.657.9
108.18.1
$6798
1.1136.889.625.8
97.573.992.498.486.0
316.628.212.965.415.1
4.214.53.0
50.268.214027.01.3
WA
SH
ING
TO
N
Washington

124
U N I T E D H E A LT H F O U N D AT I O N | A M E R I C A’ S H E A LT H R A N K I N G S ® S E N I O R R E P O RT 2 0 15
Projected Increase 2015 to 2030 Senior Population Growth State US
Behaviors Smoking (% of adults aged 65+)
Chronic Drinking (% of adults aged 65+) Obesity (% of adults aged 65+) Underweight (% of adults aged 65+ in fair or better health) Physical Inactivity (% of adults aged 65+ in fair or better health)
Dental Visit (% of adults aged 65+)Pain Management (% of adults aged 65+ with joint pain)
Behaviors Total
Community & EnvironmentPoverty (% of adults aged 65+)
Volunteerism (% of adults aged 65+)Nursing Home Quality (% of 4- & 5-star beds)
Community & Environment—Macro Total Home-Delivered Meals (participants as % of adults aged 65+ in poverty) Food Insecurity (% of adults aged 60+) Community Support (dollars per adult aged 65+ in poverty)
Community & Environment—Micro TotalCommunity & Environment Total
Policy Low-Care Nursing Home Residents (% of residents) SNAP Reach (participants as % of adults aged 60+ in poverty)
Prescription Drug Coverage (% of adults aged 65+) Geriatrician Shortfall (% of needed geriatricians)
Policy Total
Clinical CareDedicated Health Care Provider (% of adults aged 65+)
Flu Vaccine (% of adults aged 65+) Health Screenings (% of adults aged 65 to 74)
Recommended Hospital Care (% of hospitalized patients aged 65+)Diabetes Management (% of Medicare beneficiaries)
Home Health Care (number of workers per 1000 adults aged 75+)Preventable Hospitalizations (discharges per 1000 Medicare beneficiaries)
Hospital Readmissions (% of hospitalized patients aged 65+)Hospice Care (% of decedents aged 65+)
Hospital Deaths (% of decedents aged 65+)Clinical Care Total
All Determinants
OutcomesICU Use (% of decedents aged 65+)
Falls (% of adults aged 65+) Hip Fractures (hospitalizations per 1000 Medicare beneficiaries)
Health Status (very good or excellent as % of adults aged 65+)Able-bodied (% of adults aged 65+)
Premature Death (deaths per 100 000 adults aged 65 to 74)Teeth Extractions (% of adults aged 65+)
Poor Mental Health Days (days in previous 30) All Outcomes Overall
2015 No. 1 Value Rank State
Supplemental MeasuresEducation (% of adults aged 65+)
Multiple Chronic Conditions (% of Medicare beneficiaries aged 65+)Cognition (% of adults aged 65+)
Depression (% of adults aged 65+)Suicide (deaths per 100 000 adults aged 65+)
2015 No. 1 Value Rank State
WE
ST
VIR
GIN
IA
West Virginia
OverallRank: 45Change: No ChangeDeterminants Rank: 42Outcomes Rank: 48
Strengths:• Low prevalence of chronic drinking• High prescription drug coverage• High flu vaccination coverage
Challenges: • Low percentage of dental visit• Low health status• High prevalence of full-mouth tooth
extraction
Highlights: • In the past year, food insecurity decreased
19% from 16.3% to 13.2% of adults aged 60 and older.
• In the past 2 years, flu vaccine coverage increased 8% from 68.5% to 73.9% of adults aged 65 and older.
• In the past year, preventable hospitalizations decreased 10% from 103.1 to 93.3 discharges per 1000 Medicare beneficiaries.
• In the past year, ICU use increased 6% from 15.8% to 16.8% of decedents aged 65 and older.
• In the past year, very good or excellent health status decreased 8% from 32.0% to 29.5% of adults aged 65 and older.
Ranking:West Virginia ranks 45th in America’s Health Rankings® Senior Report; it was 45th last year. In the 2014 America’s Health Rankings® (all ages), the state ranks 44th.
State Health Department Website: www.dhhr.wv.gov
11.21.5
29.11.9
38.449.646.5
0.344
9.220.629.3
-0.07931.413.2$7450.028-0.051
11.784.488.074.5
0.016
92.973.983.996.179.6
131.193.316.944.525.3
-0.064-0.225
16.827.47.0
29.555.8233233.72.6
-0.318-0.543
13.341.211.715.817.0
5044483129
29.3 52.7
32.522.46.58.77.1
451393744501744
314046431619242034
2516103418
38137372710494942414442
44213848494850414845
4.21.516.10.922.877.253.2
5.142.657.9
108.1
8.1$6798
1.1
136.889.625.8
97.573.992.498.486.0316.628.212.965.415.1
4.214.53.050.268.214027.01.3

125
U N I T E D H E A LT H F O U N D AT I O N | A M E R I C A’ S H E A LT H R A N K I N G S ® S E N I O R R E P O RT 2 0 15
Projected Increase 2015 to 2030 Senior Population Growth State US
Behaviors Smoking (% of adults aged 65+)
Chronic Drinking (% of adults aged 65+) Obesity (% of adults aged 65+) Underweight (% of adults aged 65+ in fair or better health) Physical Inactivity (% of adults aged 65+ in fair or better health)
Dental Visit (% of adults aged 65+)Pain Management (% of adults aged 65+ with joint pain)
Behaviors Total
Community & EnvironmentPoverty (% of adults aged 65+)
Volunteerism (% of adults aged 65+)Nursing Home Quality (% of 4- & 5-star beds)
Community & Environment—Macro Total Home-Delivered Meals (participants as % of adults aged 65+ in poverty) Food Insecurity (% of adults aged 60+) Community Support (dollars per adult aged 65+ in poverty)
Community & Environment—Micro TotalCommunity & Environment Total
Policy Low-Care Nursing Home Residents (% of residents) SNAP Reach (participants as % of adults aged 60+ in poverty)
Prescription Drug Coverage (% of adults aged 65+) Geriatrician Shortfall (% of needed geriatricians)
Policy Total
Clinical CareDedicated Health Care Provider (% of adults aged 65+)
Flu Vaccine (% of adults aged 65+) Health Screenings (% of adults aged 65 to 74)
Recommended Hospital Care (% of hospitalized patients aged 65+)Diabetes Management (% of Medicare beneficiaries)
Home Health Care (number of workers per 1000 adults aged 75+)Preventable Hospitalizations (discharges per 1000 Medicare beneficiaries)
Hospital Readmissions (% of hospitalized patients aged 65+)Hospice Care (% of decedents aged 65+)
Hospital Deaths (% of decedents aged 65+)Clinical Care Total
All Determinants
OutcomesICU Use (% of decedents aged 65+)
Falls (% of adults aged 65+) Hip Fractures (hospitalizations per 1000 Medicare beneficiaries)
Health Status (very good or excellent as % of adults aged 65+)Able-bodied (% of adults aged 65+)
Premature Death (deaths per 100 000 adults aged 65 to 74)Teeth Extractions (% of adults aged 65+)
Poor Mental Health Days (days in previous 30) All Outcomes Overall
2015 No. 1 Value Rank State
Supplemental MeasuresEducation (% of adults aged 65+)
Multiple Chronic Conditions (% of Medicare beneficiaries aged 65+)Cognition (% of adults aged 65+)
Depression (% of adults aged 65+)Suicide (deaths per 100 000 adults aged 65+)
2015 No. 1 Value Rank State
OverallRank: 7Change: 3Determinants Rank: 12Outcomes Rank: 2
Strengths:• High percentage of dental visit• Low prevalence of food insecurity• Low prevalence of falls
Challenges: • High prevalence of obesity• Low prescription drug coverage• Low flu vaccination coverage
Highlights: • In the past year, chronic drinking
decreased 25% from 5.7% to 4.3% of adults aged 65 and older.
• In the past year, home health care increased 24% from 127.3 to 157.6 home health care workers per 1000 adults aged 75 and older.
• In the past year, hip fractures decreased 18% from 6.7 to 5.5 hospitalizations per 1000 Medicare beneficiaries.
• In the past year, community support decreased 22% from $1013 to $794 per adult aged 65 and older in poverty.
• In the past year, poor mental health days decreased 33% from 2.1 to 1.4 days in previous 30.
Ranking:Wisconsin ranks 7th in America’s Health Rankings® Senior Report; it was 10th last year. In the 2014 America’s Health Rankings®
(all ages), the state ranks 23rd.
State Health Department Website: www.dhs.wisconsin.gov
6.44.3
32.51.8
30.175.142.8
2.006
8.035.050.3
0.10530.79.7
$7940.0610.166
11.880.780.260.8
-0.052
95.254.489.396.984.2
157.650.614.651.918.8
0.0740.186
6.6
14.55.5
42.167.4171013.51.4
0.2660.452
19.832.67.0
10.912.6
352063
13
48.8 52.7
32.522.46.58.77.1
3305033133
3928
17686
172
2299
2618491437
18489
1338
14151975
12
718
244
2513227
4.21.5
16.10.9
22.877.253.2
5.142.657.9
108.18.1
$6798
1.1136.889.625.8
97.573.992.498.486.0
316.628.212.965.415.1
4.214.53.0
50.268.214027.01.3
WIS
CO
NS
IN
Wisconsin

126
U N I T E D H E A LT H F O U N D AT I O N | A M E R I C A’ S H E A LT H R A N K I N G S ® S E N I O R R E P O RT 2 0 15
Projected Increase 2015 to 2030 Senior Population Growth State US
Behaviors Smoking (% of adults aged 65+)
Chronic Drinking (% of adults aged 65+) Obesity (% of adults aged 65+) Underweight (% of adults aged 65+ in fair or better health) Physical Inactivity (% of adults aged 65+ in fair or better health)
Dental Visit (% of adults aged 65+)Pain Management (% of adults aged 65+ with joint pain)
Behaviors Total
Community & EnvironmentPoverty (% of adults aged 65+)
Volunteerism (% of adults aged 65+)Nursing Home Quality (% of 4- & 5-star beds)
Community & Environment—Macro Total Home-Delivered Meals (participants as % of adults aged 65+ in poverty) Food Insecurity (% of adults aged 60+) Community Support (dollars per adult aged 65+ in poverty)
Community & Environment—Micro TotalCommunity & Environment Total
Policy Low-Care Nursing Home Residents (% of residents) SNAP Reach (participants as % of adults aged 60+ in poverty)
Prescription Drug Coverage (% of adults aged 65+) Geriatrician Shortfall (% of needed geriatricians)
Policy Total
Clinical CareDedicated Health Care Provider (% of adults aged 65+)
Flu Vaccine (% of adults aged 65+) Health Screenings (% of adults aged 65 to 74)
Recommended Hospital Care (% of hospitalized patients aged 65+)Diabetes Management (% of Medicare beneficiaries)
Home Health Care (number of workers per 1000 adults aged 75+)Preventable Hospitalizations (discharges per 1000 Medicare beneficiaries)
Hospital Readmissions (% of hospitalized patients aged 65+)Hospice Care (% of decedents aged 65+)
Hospital Deaths (% of decedents aged 65+)Clinical Care Total
All Determinants
OutcomesICU Use (% of decedents aged 65+)
Falls (% of adults aged 65+) Hip Fractures (hospitalizations per 1000 Medicare beneficiaries)
Health Status (very good or excellent as % of adults aged 65+)Able-bodied (% of adults aged 65+)
Premature Death (deaths per 100 000 adults aged 65 to 74)Teeth Extractions (% of adults aged 65+)
Poor Mental Health Days (days in previous 30) All Outcomes Overall
2015 No. 1 Value Rank State
Supplemental MeasuresEducation (% of adults aged 65+)
Multiple Chronic Conditions (% of Medicare beneficiaries aged 65+)Cognition (% of adults aged 65+)
Depression (% of adults aged 65+)Suicide (deaths per 100 000 adults aged 65+)
2015 No. 1 Value Rank State
WY
OM
ING
Wyoming
OverallRank: 35Change: 2Determinants Rank: 41Outcomes Rank: 25
Strengths:• Low prevalence of obesity• Low percentage of seniors living in poverty• Ready availability of home-delivered meals
Challenges: • Low SNAP enrollment• Low percentage of health screenings• High hip fracture rate
Highlights: • In the past year, ICU use decreased
20% from 8.6% to 6.9% of decedents aged 65 and older.
• In the past year, smoking decreased 15% from 11.2% to 9.5% of adults aged 65 and older.
• In the past year, food insecurity increased 17% from 13.8% to 16.1% of adults aged 60 and older.
• In the past year, pain management decreased 17% from 52.2% to 43.2% of adults aged 65 and older with joint pain.
• In the past year, recommended hospital care decreased 2% from 98.7% to 96.6% of hospitalized patients aged 65 and older.
Ranking:Wyoming ranks 35th in America’s Health Rankings® Senior Report; it was 33rd last year. In the 2014 America’s Health Rankings® (all ages), the state ranks 25th.
State Health Department Website: http://www.health.wyo.gov
9.53.0
23.42.0
32.161.243.2
2.720
6.226.645.9
0.075108.116.1
$40730.1210.196
19.227.781.878.9
-0.234
89.555.779.196.659.475.252.715.131.921.8
-0.124-0.180
6.9
32.17.2
42.665.4184517.71.8
0.030-0.150
22.122.46.8
13.430.0
28141150
56.0 52.7
32.522.46.58.77.1
311564323393733
3222012135254
4649474150
484449235034172647215041
846421918313162535
4.21.516.10.922.877.253.2
5.142.657.9
108.1
8.1$6798
1.1
136.889.625.8
97.573.992.498.486.0316.628.212.965.415.1
4.214.53.050.268.214027.01.3

127
U N I T E D H E A LT H F O U N D AT I O N | A M E R I C A’ S H E A LT H R A N K I N G S ® S E N I O R R E P O RT 2 0 15
Projected Increase 2015 to 2030 Senior Population Growth State US
Behaviors Smoking (% of adults aged 65+)
Chronic Drinking (% of adults aged 65+) Obesity (% of adults aged 65+) Underweight (% of adults aged 65+ in fair or better health) Physical Inactivity (% of adults aged 65+ in fair or better health)
Dental Visit (% of adults aged 65+)Pain Management (% of adults aged 65+ with joint pain)
Behaviors Total
Community & EnvironmentPoverty (% of adults aged 65+)
Volunteerism (% of adults aged 65+)Nursing Home Quality (% of 4- & 5-star beds)
Community & Environment—Macro Total Home-Delivered Meals (participants as % of adults aged 65+ in poverty) Food Insecurity (% of adults aged 60+) Community Support (dollars per adult aged 65+ in poverty)
Community & Environment—Micro TotalCommunity & Environment Total
Policy Low-Care Nursing Home Residents (% of residents) SNAP Reach (participants as % of adults aged 60+ in poverty)
Prescription Drug Coverage (% of adults aged 65+) Geriatrician Shortfall (% of needed geriatricians)
Policy Total
Clinical CareDedicated Health Care Provider (% of adults aged 65+)
Flu Vaccine (% of adults aged 65+) Health Screenings (% of adults aged 65 to 74)
Recommended Hospital Care (% of hospitalized patients aged 65+)Diabetes Management (% of Medicare beneficiaries)
Home Health Care (number of workers per 1000 adults aged 75+)Preventable Hospitalizations (discharges per 1000 Medicare beneficiaries)
Hospital Readmissions (% of hospitalized patients aged 65+)Hospice Care (% of decedents aged 65+)
Hospital Deaths (% of decedents aged 65+)Clinical Care Total
All Determinants
OutcomesICU Use (% of decedents aged 65+)
Falls (% of adults aged 65+) Hip Fractures (hospitalizations per 1000 Medicare beneficiaries)
Health Status (very good or excellent as % of adults aged 65+)Able-bodied (% of adults aged 65+)
Premature Death (deaths per 100 000 adults aged 65 to 74)Teeth Extractions (% of adults aged 65+)
Poor Mental Health Days (days in previous 30) All Outcomes Overall
2015 No. 1 Value Rank State
Supplemental MeasuresEducation (% of adults aged 65+)
Multiple Chronic Conditions (% of Medicare beneficiaries aged 65+)Cognition (% of adults aged 65+)
Depression (% of adults aged 65+)Suicide (deaths per 100 000 adults aged 65+)
2015 No. 1 Value Rank State
OverallRank: not rankedStrengths:• Low prevalence of physical inactivity• High percentage of quality nursing
home beds• Ready availability of home health
care providers
Challenges: • High prevalence of chronic drinking• High percentage of seniors in poverty• Low flu vaccination coverage
Highlights: • In the past year, volunteerism increased
16% from 23.4% to 27.1% of adults aged 65 and older.
• In the past year, home health care increased 12% from 202.2 to 226.0 home health care workers per 1000 adults aged 75 and older.
• In the past 2 years, very good or excellent health status increased 18% from 39.3% to 46.3% of adults aged 65 and older.
• In the past year, obesity increased 25% from 19.1% to 23.8% of adults aged 65 and older.
• In the past year, food insecurity increased 25% from 12.1% to 15.2% of adults aged 60 and older.
State Health Department Website: www.dchealth.dc.gov
8.05.8
23.82.0
25.666.643.2—
14.027.151.9—
20.615.2
$1947——
NA
82.779.119.2—
90.758.589.490.075.4
226.047.215.842.527.8——
15.527.55.0
46.365.4196213.12.4——
38.634.99.4
11.9Unreliable
—————
-5.6 52.7
32.522.46.58.77.1
————————
—————————
—————
————————————
——————————
4.21.5
16.10.9
22.877.253.2
5.142.657.9
108.18.1
$6798
1.1136.889.625.8
97.573.992.498.486.0
316.628.212.965.415.1
4.214.53.0
50.268.214027.01.3
DIS
TR
ICT
OF
CO
LU
MB
IADistrict of Columbia

128
U N I T E D H E A LT H F O U N D AT I O N | A M E R I C A’ S H E A LT H R A N K I N G S ® S E N I O R R E P O RT 2 0 15
Projected Increase 2015 to 2030 Senior Population Growth State US
Behaviors Smoking (% of adults aged 65+)
Chronic Drinking (% of adults aged 65+) Obesity (% of adults aged 65+) Underweight (% of adults aged 65+ in fair or better health) Physical Inactivity (% of adults aged 65+ in fair or better health)
Dental Visit (% of adults aged 65+)Pain Management (% of adults aged 65+ with joint pain)
Behaviors Total
Community & EnvironmentPoverty (% of adults aged 65+)
Volunteerism (% of adults aged 65+)Nursing Home Quality (% of 4- & 5-star beds)
Community & Environment—Macro Total Home-Delivered Meals (participants as % of adults aged 65+ in poverty) Food Insecurity (% of adults aged 60+) Community Support (dollars per adult aged 65+ in poverty)
Community & Environment—Micro TotalCommunity & Environment Total
Policy Low-Care Nursing Home Residents (% of residents) SNAP Reach (participants as % of adults aged 60+ in poverty)
Prescription Drug Coverage (% of adults aged 65+) Geriatrician Shortfall (% of needed geriatricians)
Policy Total
Clinical CareDedicated Health Care Provider (% of adults aged 65+)
Flu Vaccine (% of adults aged 65+) Health Screenings (% of adults aged 65 to 74)
Recommended Hospital Care (% of hospitalized patients aged 65+)Diabetes Management (% of Medicare beneficiaries)
Home Health Care (number of workers per 1000 adults aged 75+)Preventable Hospitalizations (discharges per 1000 Medicare beneficiaries)
Hospital Readmissions (% of hospitalized patients aged 65+)Hospice Care (% of decedents aged 65+)
Hospital Deaths (% of decedents aged 65+)Clinical Care Total
All Determinants
OutcomesICU Use (% of decedents aged 65+)
Falls (% of adults aged 65+) Hip Fractures (hospitalizations per 1000 Medicare beneficiaries)
Health Status (very good or excellent as % of adults aged 65+)Able-bodied (% of adults aged 65+)
Premature Death (deaths per 100 000 adults aged 65 to 74)Teeth Extractions (% of adults aged 65+)
Poor Mental Health Days (days in previous 30) All Outcomes Overall
2015 No. 1 Value Rank State
Supplemental MeasuresEducation (% of adults aged 65+)
Multiple Chronic Conditions (% of Medicare beneficiaries aged 65+)Cognition (% of adults aged 65+)
Depression (% of adults aged 65+)Suicide (deaths per 100 000 adults aged 65+)
2015 No. 1 Value Rank State
Strengths: • In the past year, flu vaccine coverage
increased 5% from 60.1% to 62.8% of adults aged 65 and older.
• In the past year, home health care increased 9% from 95.4 to 104.3 home health care workers per 1000 adults aged 75 and older.
• In the past year, preventable hospitalizations decreased 9% from 64.9 to 59.3 discharges per 1000 Medicare beneficiaries.
• In the past year, hospice care increased 7% from 47.5% to 50.6% of decedents aged 65 and older.
• In the past year, hip fractures decreased 15% from 7.3 to 6.2 hospitalizations per 1000 Medicare beneficiaries.
• In the past year, seniors with a college education increased 4% from 22.2% to 23.1% of adults aged 65 and older.
Challenges:• In the past year, physical inactivity
increased 15% from 28.7% to 33.1% of adults aged 65 and older.
• In the past year, pain management decreased 12% from 51.7% to 45.7% of adults aged 65 and older with joint pain.
• In the past year, community support decreased 24% from $1147 to $873 per adult aged 65 and older in poverty.
• In the past year, recommended hospital care decreased 2% from 98.1% to 96.3% of hospitalized patients aged 65 and older.
• In the past year, depression increased 10% from 13.4% to 14.8% of adults aged 65 and older.
• In the past year, suicide increased 5% from 14.8 to 15.6 deaths per 100 000 adults aged 65 and older.
Websites:Center for Disease Control and Prevention: www.cdc.govHealthy People: www.healthypeople.govAdministration on Aging: www.aoa.govOffice of Disease Prevention and Health Promotion: www.health.govUS Department of Health & Human Services: www.hhs.govMedicare: www.medicare.gov
UN
ITE
D S
TAT
ES
United States
8.74.0
26.71.6
33.165.645.7—
9.526.442.5—
20.614.8$873——
12.275.286.565.1—
94.362.886.296.380.8
104.359.315.550.622.8——
14.728.46.2
41.863.7180316.12.2——
————————
—————————
—————
————————————
——————————
4.21.516.10.922.877.253.2
5.142.657.9
108.1
8.1$6798
1.1
136.889.625.8
97.573.992.498.486.0316.628.212.965.415.1
4.214.53.050.268.214027.01.3
23.137.69.3
14.815.6
—————
— 52.7
32.522.46.58.77.1
Projected Increase 2015 to 2030 Senior Population Growth State US
NA 52.7

Appendix

1 3 0 w w w . a m e r i c a s h e a l t h r a n k i n g s . o r g
Appendix
Behaviors
Measure Description Source, Data Year(s)
Measure Description Source, Data Year(s)
Measure Description Source, Data Year(s)
Smoking
Chronic Drinking
Obesity
Underweight
Physical Inactivity
Dental Visit
Pain Management
Centers for Disease Control and Prevention (CDC). Behavioral Risk Factor Surveillance System, 2013
CDC. Behavioral Risk Factor Surveillance System, 2013
CDC. Behavioral Risk Factor Surveillance System, 2013
CDC. Behavioral Risk Factor Surveillance System, 2013
CDC. Behavioral Risk Factor Surveillance System, 2013
CDC. Behavioral Risk Factor Surveillance System, 2012
CDC. Behavioral Risk Factor Surveillance System, 2013
Percentage of adults aged 65 and older who regularly smoke (at least 100 cigarettes in their lifetime and currently smoke daily or some days)
Percentage of adults aged 65 and older who consumed more than 60 drinks in the last 30 days for men and more than 30 drinks in the last 30 days for women
Percentage of adults aged 65 and older estimated to be obese, with a body mass index (BMI) of 30.0 or higher
Percentage of adults aged 65 and older with fair or better health status estimated to be underweight, with a body mass index (BMI) of 18.5 or less
Percentage of adults aged 65 and older with fair or better health status who report doing no physical activity or exercise (such as running, calisthenics, golf, gardening, or walking) other than their regular job in the last 30 days
Percentage of adults aged 65 and older who report having visited a dental health professional within the last 12 months
Percentage of adults aged 65 and older with arthritis who report arthritis or joint pain does not limit their usual activities
Community &Environment
— Macro
Community &Environment
— Micro
Poverty
Volunteerism
Nursing Home Quality
Home-Delivered Meals
Food Insecurity
Community Support
US Census Bureau. American Community Survey, 2011 to 2013
US Census Bureau. Current Population Survey, 2011 to 2013
Centers for Medicare & Medicaid Services (CMS). Nursing Home Compare, 2015
Numerator: Administration on Aging (AoA). State Program Reports, 2012Denominator: US Census Bureau. American Community Survey, 2011 to 2013
National Foundation to End Senior Hunger. The State of Senior Hunger in America 2012: An Annual Report, 2012
Numerator: AoA. State Program Reports, 2012Denominator: US Census Bureau. American Community Survey, 2011 to 2013
Percentage of adults aged 65 and older who live in households at or below 100% of the poverty threshold
Percentage of adults aged 65 and older who report volunteering in the past 12 months
Percentage of certified nursing home beds rated 4- or 5-stars. (2015 revised CMS definition)
Number of persons served a home-delivered meal as a percentage of adults aged 65 and older living in poverty
Percentage of adults aged 60 and older who are marginally food insecure
Total expenditures captured by the Administration on Aging per adult aged 65 and older living in poverty
TABLE 9
Summary of Core Measures
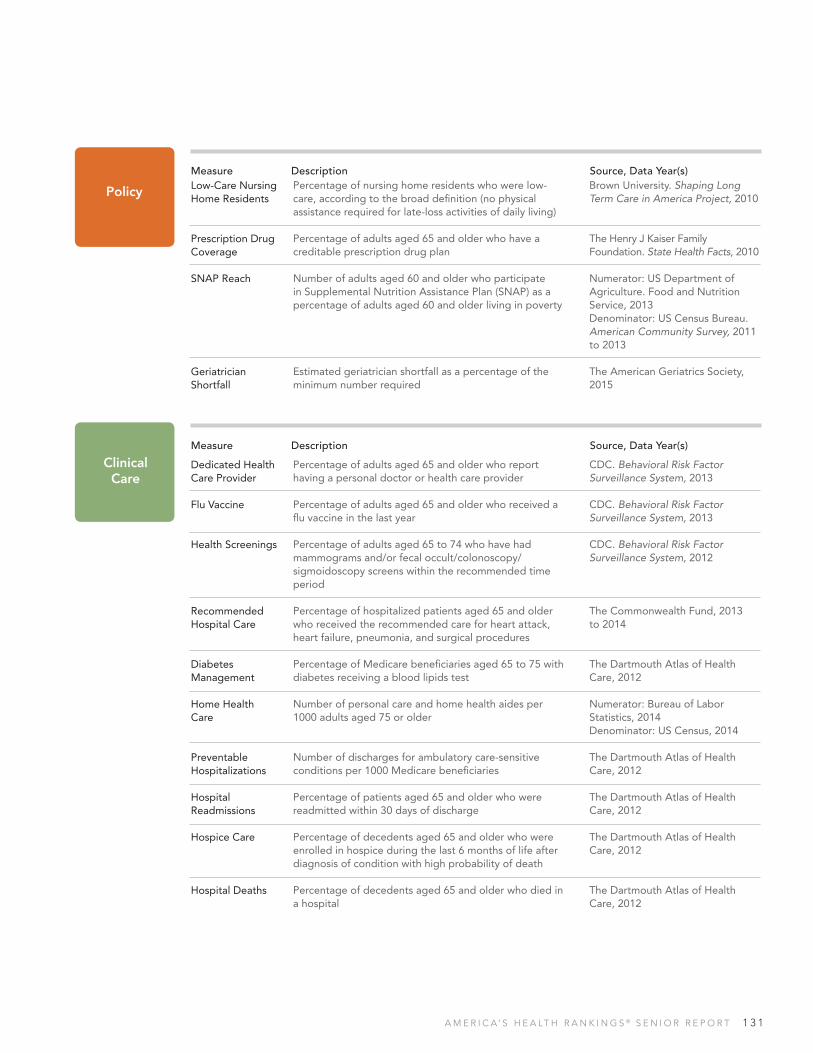
A M E R I C A’ S H E A LT H R A N K I N G S ® S E N I O R R E P O R T 1 3 1
Policy
Clinical Care
Measure Description Source, Data Year(s)
Measure Description Source, Data Year(s)
Low-Care Nursing Home Residents
Prescription Drug Coverage
SNAP Reach
Geriatrician Shortfall
Dedicated Health Care Provider
Flu Vaccine
Health Screenings
Recommended Hospital Care
Diabetes Management
Home Health Care
Preventable Hospitalizations
Hospital Readmissions
Hospice Care
Hospital Deaths
Brown University. Shaping Long Term Care in America Project, 2010
The Henry J Kaiser Family Foundation. State Health Facts, 2010
Numerator: US Department of Agriculture. Food and Nutrition Service, 2013Denominator: US Census Bureau. American Community Survey, 2011 to 2013
The American Geriatrics Society, 2015
CDC. Behavioral Risk Factor Surveillance System, 2013
CDC. Behavioral Risk Factor Surveillance System, 2013
CDC. Behavioral Risk Factor Surveillance System, 2012
The Commonwealth Fund, 2013 to 2014
The Dartmouth Atlas of Health Care, 2012
Numerator: Bureau of Labor Statistics, 2014Denominator: US Census, 2014
The Dartmouth Atlas of Health Care, 2012
The Dartmouth Atlas of Health Care, 2012
The Dartmouth Atlas of Health Care, 2012
The Dartmouth Atlas of Health Care, 2012
Percentage of nursing home residents who were low-care, according to the broad definition (no physical assistance required for late-loss activities of daily living)
Percentage of adults aged 65 and older who have a creditable prescription drug plan
Number of adults aged 60 and older who participate in Supplemental Nutrition Assistance Plan (SNAP) as a percentage of adults aged 60 and older living in poverty
Estimated geriatrician shortfall as a percentage of the minimum number required
Percentage of adults aged 65 and older who report having a personal doctor or health care provider
Percentage of adults aged 65 and older who received a flu vaccine in the last year
Percentage of adults aged 65 to 74 who have had mammograms and/or fecal occult/colonoscopy/sigmoidoscopy screens within the recommended time period
Percentage of hospitalized patients aged 65 and older who received the recommended care for heart attack, heart failure, pneumonia, and surgical procedures
Percentage of Medicare beneficiaries aged 65 to 75 with diabetes receiving a blood lipids test
Number of personal care and home health aides per 1000 adults aged 75 or older
Number of discharges for ambulatory care-sensitive conditions per 1000 Medicare beneficiaries
Percentage of patients aged 65 and older who were readmitted within 30 days of discharge
Percentage of decedents aged 65 and older who were enrolled in hospice during the last 6 months of life after diagnosis of condition with high probability of death
Percentage of decedents aged 65 and older who died in a hospital

1 3 2 w w w . a m e r i c a s h e a l t h r a n k i n g s . o r g
AppendixTABLE 9 (continued)
Summary of Core Measures
Outcomes
Measure Description Source, Data Year(s)ICU Use
Hip Fracture
Falls
Health Status
Able-bodied
Premature Death
Teeth Extractions
Poor Mental Health Days
Percentage of decedents aged 65 and older spending 7 or more days in the intensive care or critical care unit during the last 6 months of life
Rate of hospitalization for hip fracture per 1000 Medicare beneficiaries
Percentage of adults aged 65 and older who report having had a fall in the last 12 months (2012 definition)
Percentage of adults aged 65 and older who report their health is very good or excellent
Percentage of adults aged 65 and older with no disability
Number of deaths per 100 000 adults aged 65 to 74 years
Percentage of adults aged 65 and older who have had all teeth removed due to tooth decay or gum disease
Number of days in the previous 30 that adults aged 65 and older indicate their activities were limited due to mental health difficulties
The Dartmouth Atlas of Health Care, 2012
The Dartmouth Atlas of Health Care, 2012
CDC. Behavioral Risk Factor Surveillance System, 2012
CDC. Behavioral Risk Factor Surveillance System, 2013
US Census. American Community Survey, 2011 to 2013
CDC. National Center for Health Statistics, 2013
CDC. Behavioral Risk Factor Surveillance System, 2012
CDC. Behavioral Risk Factor Surveillance System, 2013

A M E R I C A’ S H E A LT H R A N K I N G S ® S E N I O R R E P O R T 1 3 3
Behaviors
Outcomes
Measure Description Source, Data Year(s)
Measure Description Source, Data Year(s)
Education
Multiple Chronic Conditions
Cognition
Depression
Suicide
US Census Bureau. American Community Survey, 2011 to 2013
Centers for Medicare & Medicaid Services, 2012
US Census Bureau. American Community Survey, 2011 to 2013
Centers for Disease Control and Prevention (CDC). Behavioral Risk Factor Surveillance System, 2013
CDC. National Center for Health Statistics, 2011 to 2013
Percentage of adults aged 65 and older with a college degree
Percentage of Medicare beneficiaries aged 65 and older with 4 or more chronic conditions (2015 definition)
Percentage of adults aged 65 and older who report having a cognitive difficulty
Percentage of adults aged 65 and older who were told by a health professional that they have a depressive disorder
Number of deaths due to intentional self-harm per 100 000 adults aged 65 and older
Policy
Measure Description Source, Data Year(s)Prescription Drug Plan With Gap
The Henry J Kaiser Family Foundation. State Health Facts, 2014
Percentage of Medicare prescription drug plans with a payment gap (“donut hole”)
TABLE 10
Summary of Supplemental Measures

1 3 4 w w w . a m e r i c a s h e a l t h r a n k i n g s . o r g
Appendix
MethodologyFor each measure, the raw data are obtained from secondary sources and presented as “value”. The score for each state is based on the following formula:
This “z score” indicates the number of standard deviations a state is above or below the national value. A 0.00 indicates a state has the same value as the nation. States with higher values than the national value have a positive score; states below the national value have a negative score. To
SCORE = STATE VALUE – NATIONAL VALUE
STANDARD DEVIATION OF ALL STATE VALUES
prevent an extreme score from exerting exces-sive influence, the maximum score for a measure is capped at +/- 2.00. If a US value is not available for a measure, the mean of all state values is used with the exception of measures from the Behavioral Risk Factor Surveillance System (BRFSS). For BRFSS measures, the median of the state values is used for the US value to conform to the Centers for Disease Control and Prevention tradition. Overall score is calculated by adding the scores of each measure multiplied by its assigned weight (the percentage of total overall ranking). Not all changes in rank are statistically significant.
The overall ranking is the ordering of each state according to the overall score. The ranking of individual measures is the ordering of each state according to the measure’s value. Ties in values are assigned equal ranks.
See more details at http://www.ameri-cashealthrankings.org/about/senior?tabname= SeniorMethodology
1. Gather data 2. Normalize state values for each metric using US value (calculate z score)
3. Eliminate outliers 4. Multiply by weights and direction of effect on score
5. Sum weighted scores
6. Rank states by sum of all metric scores
–2 –1 1 2
BehaviorsCommunity & Environment
Public & Health PoliciesClinical Care
Health Outcomes

A M E R I C A’ S H E A LT H R A N K I N G S ® S E N I O R R E P O R T 1 3 5
The measures and model for America’s Health Rankings® Senior Report were developed by a panel of experts in the field of senior health for the inaugural edition in 2013. The panel was charged with identifying the areas of health and well-being most pertinent to the older adult population and developing a model for assessing population health at a state level.
In February 2015, the panel convened by tele-phone, and each measure included in the 2014 edition was reviewed. Panelists recommended that the following items be explored:
1. Replace Social Support. This is a Behavioral Risk Factor Surveillance System measure that is no longer collected in all 50 states.
2. Consider replacing Low-Care Nursing Home Residents. This measure, produced by the Shaping Long Term Care in America Project at Brown University, has not been updated since 2010.
3. Consider replacing Prescription Drug Coverage. This measure, calculated by Kaiser State Health Facts, has not been updated since 2010.
4. Identify improved measures relating to social isolation.
5. Explore elder abuse metrics, including such proxies as the variation in mandatory reporting in each state.
6. Separate community expenditures (based on Administration on Aging data) into sub-cate-gories to highlight the variation in utilization of different aspects of the programs, such as home-based health care spending.
2015 Model Development7. Explore the inclusion of metrics related to
overuse of clinical care, such as prostate cancer screening.
8. Measure out-of-pocket health care expenses for seniors.
9. Identify improved measures of diet and/or nutrition.
Changes Implemented in 2015Social Support, a Community & Environment measure, was replaced with Home-Delivered Meals (p 39).
A Policy measure, SNAP Reach (p 44), was added.
A new supplemental measure was added, Prescription Drug Plan With Gap (p 73).
The denominator of supplemental measure Multiple Chronic Conditions was amended from all Medicare beneficiaries to Medicare beneficia-ries aged 65 and older.
In addition to the changes made at the sug-gestion of the expert panel, The Centers for Medicare & Medicaid Services (CMS) revised its Five Star Quality Rating System, impacting the Nursing Home Quality metric (p 38).

1 3 6 w w w . a m e r i c a s h e a l t h r a n k i n g s . o r g
Appendix
Soo Borson, MDProfessor Emerita, University of Washington
School of MedicineDementia Care Research and Consulting
Randy Brown, PhDDirector of Health Research Mathematica Policy Research
Julie Bynum, MD, MPHAssociate Professor of The Dartmouth InstituteAssociate Professor of MedicineAssociate Director, Center for
Health Policy ResearchThe Dartmouth Institute for
Health Policy & Clinical Practice Geisel School of Medicine at Dartmouth
Tom Eckstein, MBAPrincipal and author, America’s Health Rankings®
and America’s Health Rankings® Senior ReportArundel Metrics, Inc
Sarah Milder, MPHEpidemiologist and author,
America’s Health Rankings® and America’s Health Rankings® Senior Report
Arundel Metrics, Inc
Jewel Mullen, MD, MPH, MPAPresident, Association of State
and Territorial Health OfficialsCommissioner, Connecticut Department
of Public Health
Rhonda Randall, DOChief Medical Officer UnitedHealthcare Retiree Solutions
2015 Senior Health Advisory Group
Barbara Resnick, PhD, RN, CRNP, FAAN, FAANPProfessor of Nursing Sonya Ziporkin Gershowitz Chair in GerontologyUniversity of Maryland Chairman of the Board, American Geriatrics Society
Anna Schenck, PhD, MSPHProfessor of the Practice,
Associate Dean for PracticeDirector, Public Health Leadership Program and the
North Carolina Institute for Public HealthUNC Gillings School of Global Public HealthUniversity of North Carolina at Chapel Hill
Gail Vasterling, JDDirectorMissouri Department of Health and Senior Services
The Senior Health Advisory Group members include:

A M E R I C A’ S H E A LT H R A N K I N G S ® S E N I O R R E P O R T 1 3 7
The Team America’s Health Rankings® Senior Report is a team effort. Members of this team, listed alphabetically below by organization, all contribute a vital part to the creation and dissemination of this report and website, www.americashealthrankings.org.
Aldrich Design Emily Aldrich Jenna Brouse Ian Kolstad
Arundel Metrics, Inc Tom Eckstein Kate Jensen Ben Kofoed Gary Legwold Sarah Milder Mariah Quick
Bahr Digital Elen Bahr
Balsera Communications Sonia Diaz
The Glover Park Group Carol Andes Megan Lowry Cara Paley Morgan Warners Scott Weier
Rockfish Interactive Lance Adams Tom Black Bill Mason David Nowlin Steve Plunkett David Routon Jennifer Wiens
RoninWare Inc TJ Kellie
Tuckson Health Connections Reed Tuckson
United Health Foundation Russell Bennett Shelly Espinosa Lauren Mihajlov Jane Pennington Rhonda Randall Ipyana Spencer Kathy Spenler

1 3 8 w w w . a m e r i c a s h e a l t h r a n k i n g s . o r g
Appendix
America’s Health Rankings® Senior Report is available in its entirety at www.ameri-cashealthrankings.org. Visit the site to request or download additional copies.
America’s Health Rankings® Senior Report—2015 Edition is funded entirely by United Health Foundation, a recognized 501(c)(3) organization.
Data contained within this document were obtained from and used with permission of:
US Department of Agriculture, Food and Nutrition ServiceUS Department of Health and Human Services Centers for Disease Control and Prevention Behavioral Risk Factor Surveillance System National Center for Health Statistics Administration on Aging, State Program Reports Centers for Medicare & Medicaid Services Nursing Home CompareUS Department of Commerce US Census Bureau American Community Survey Current Population SurveyUS Department of Labor, Bureau of Labor StatisticsThe Dartmouth Atlas of Health CareNational Foundation to End Senior Hunger, The State of Senior Hunger in America 2012: An Annual ReportThe Henry J Kaiser Family Foundation, Kaiser State Health Facts Brown University, Shaping Long Term Care in America ProjectAmerican Geriatrics SocietyThe Commonwealth Fund
United Health Foundation encourages the distribution of information contained in this publication for non-commercial and charitable, educational, or scientific purposes. Please acknowledge America’s Health Rankings® Senior Report as the source and provide the following notice: ©2015 United Health Foundation. All Rights Reserved. Please acknowl-edge the original source of specific data as cited.
Questions and comments on the report should be directed to United Health Foundation at [email protected].
Copyright ©2015 United Health Foundation


Change My RankAt America’s Health Rankings® website, you can fi nd information about the health of your state compared with other states, build custom reports, and download graphs to share. And you can discover ways to take action and make changes in the health of your state.
What impact will you have on your overall ranking if you reduce physical inactivity? Lower obesity rates? Improve your fl u vaccination coverage? Reduce food insecurity among seniors? You can answer these and other questions by going to the Change My Rank applica-tion. This tool is located on its own tab on each state information page.
Go to your state’s information page by clicking on your state’s image or by selecting the state from various drop-down lists. Then click on the Change My Rank tab. Use the plus and minus buttons to change your rate for physical inactivity, food insecurity, fl u vaccine, or whatever measure interests you. You’ll immediately see the change in rank for that measure and how that change may affect the overall ranking for your state. Click on the Change Measures button at the bottom of the page to choose other measures to explore.

Guided by a passion to help people live
healthier lives, United Health Foundation
provides helpful information to support
decisions that lead to better health outcomes
and healthier communities. The Foundation also
supports activities that expand access to quality
health care services for those in challenging
circumstances and partners with others to
improve the well-being of communities.
United Health Foundation9900 Bren Road EastMinnetonka, MN 55343
www.unitedhealthfoundation.org
America’s Health Rankings® Senior Report is available in its entirety at www.americashealthrankings.org. Visit the website to request or download additional copies.
MAY 2015