2015 Report on Workers’ Compensation Insuranceinsurance.maryland.gov/Consumer/Appeals and...
54
2015 Report on Workers’ Compensation Insurance November 2, 2015 MSAR# 802
Transcript of 2015 Report on Workers’ Compensation Insuranceinsurance.maryland.gov/Consumer/Appeals and...

2015 Report on Workers’ Compensation Insurance
November 2, 2015 MSAR# 802
1
Table of Contents
Executive Summary .............................................................................................................3
Introduction ..........................................................................................................................4
Overview… ..........................................................................................................................4
2015 Legislative Changes Impacting Workers’ Compensation...........................................5
Workers’ Compensation Insurers ........................................................................................7
Premium Rates .....................................................................................................................9
Terrorism Risk Insurance Program ....................................................................................12
Conclusion .........................................................................................................................12
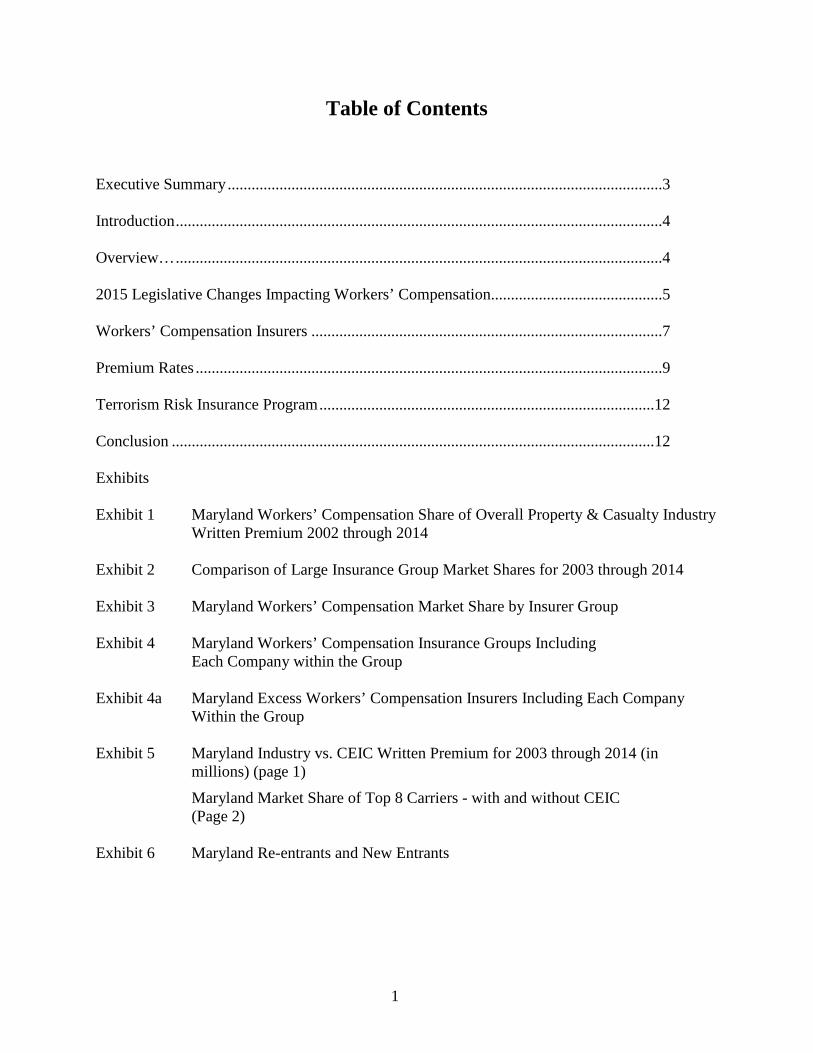
Exhibits Exhibit 1 Maryland Workers’ Compensation Share of Overall Property & Casualty Industry
Written Premium 2002 through 2014
Exhibit 2 Comparison of Large Insurance Group Market Shares for 2003 through 2014
Exhibit 3 Maryland Workers’ Compensation Market Share by Insurer Group Exhibit 4 Maryland Workers’ Compensation Insurance Groups Including Each Company within the Group Exhibit 4a Maryland Excess Workers’ Compensation Insurers Including Each Company
Within the Group Exhibit 5 Maryland Industry vs. CEIC Written Premium for 2003 through 2014 (in
millions) (page 1)
Maryland Market Share of Top 8 Carriers - with and without CEIC (Page 2) Exhibit 6 Maryland Re-entrants and New Entrants
2
Exhibit 7 Maryland Industry vs. CEIC Loss Ratios from 2003 through 2014 Exhibit 8 Comparison of Changes in NCCI Maryland Pure Premium Loss Cost Filings with
the Maryland Insurance Administration for the Years 1998 through 2016
Exhibit 9 History of NCCI Maryland Pure Premium Loss Cost Changes by Industry Group for the Years 2003 through 2016
Exhibit 10 Largest Payroll Classes by Industry Group for Maryland Exhibit 11 Changes in the Components of NCCI Maryland Pure Premium Loss Cost Filings
from 2004 through 2016 Exhibit 12 Cumulative Impact of NCCI Maryland Pure Premium Loss Cost Filings for the
Years 1990 through 2016 (page 1)
Cumulative Impact of NCCI Maryland Pure Premium Loss Cost Changes by Industry Group from 1990 through 2016 (page 2)
3
Executive Summary
• Employers are required to purchase or self-insure for workers’ compensation insurance. They may buy workers’ compensation insurance from an insurer authorized to write workers’ compensation insurance in the State or from Chesapeake Employers’ Insurance Company (“CEIC”)1. Subject to regulatory approval, an employer may self-insure.2
• Ninety- nine insurance groups offer workers’ compensation insurance to Maryland
employers. Workers’ compensation insurance is the third largest line in property and casualty insurance following auto insurance and homeowners insurance.
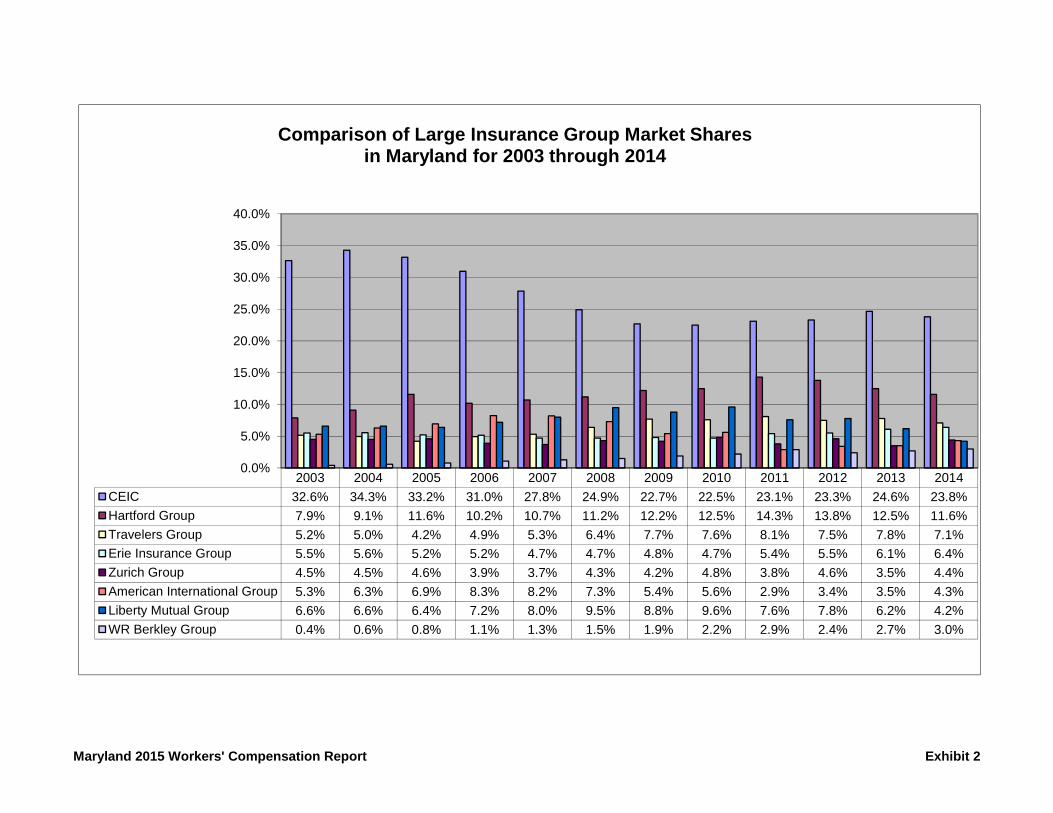
• The top eight workers’ compensation insurance groups, including CEIC, wrote
approximately 64.9 percent of the market in 2014 (Exhibit 3). CEIC is the largest writer, accounting for about 23.8 percent of the market in 2014. The second largest writer is Hartford Fire and Casualty Group, accounting for about 11.6 percent of the market in 2014.
• The National Council on Compensation Insurance, Inc. (“NCCI”) files pure premium loss
costs rates with the MIA on behalf of all insurers who write workers’ compensation insurance in the State with the exception of CEIC. No insurer may use the NCCI’s pure premium loss costs until those pure premium loss costs are approved by the MIA.
• NCCI filed decreases to the pure premium loss costs for calendar years 2007 through 2009
(ranging from a low of -5.4 percent for 2009 to a high of -1.7 percent for 2008), then increases for calendar years 2010 through 2014 (ranging from a high of 5.7 percent in 2011 to a low of 1.4 percent for 2012 and 2014) and a decrease of 2.7% for calendar year 2015. For 2015, the decrease of 2.7% was primarily due to a reduction in rate of growth of the experience, trend and benefit costs. For 2016, the NCCI filed a 5.3% decrease to the pure premium loss costs. The decrease is due primarily to improved claims experience, flat loss ratio trends and an increase in indemnity and medical benefits.
• Maryland’s workers’ compensation insurance market remains competitive.
1 As of October 1, 2013, the Injured Workers’ Insurance Fund (“IWIF”) became the Chesapeake Employers’ Insurance Company. For this report, all references will be to CEIC. 2 In order to be self-insured, approval must be obtained from either the Workers’ Compensation Commission or the Maryland Insurance Administration depending on the nature of the employer seeking to self-insure.
4
Introduction
Pursuant to §2-10A-03 of the State Government Article of the Annotated Code of
Maryland, the Maryland Insurance Commissioner issues an Annual Report to the Joint
Committee on Workers’ Compensation Benefit and Insurance Oversight (“Committee”)3
regarding the condition of workers’ compensation benefits and workers’ compensation insurance
in Maryland, and the effect of Chapters 590 and 591 of the Laws of Maryland of 1987 on those
benefits and that insurance.4
Overview
Since the early 1900s, every state has required employers to provide some form of
protection for their employees who are injured while working. Workers’ compensation laws are
based on a no-fault system designed to compensate workers who sustain accidental injuries
arising out of and in the course of their employment. The forms of compensation may include
payment for medical services, rehabilitation services, lost or replacement income, and any
permanent partial or permanent total disability the worker may sustain as a result of the work-
related injury or occupational disease. When a worker dies as a result of a work-related injury or
disease, the benefits also may include funeral expenses and survivor benefits. Employers may
purchase workers’ compensation insurance from an insurer authorized to write workers’
compensation insurance in the State or from the CEIC. Subject to regulatory approval, an
3 The Workers’ Compensation Commission (“WCC”) also submits a report to the Committee pursuant to § 2-10A-03. 4 Among other things, Chapter 590 established competitive rating for workers’ compensation insurance under certain circumstances. It also requires workers’ compensation insurers to adhere to a uniform classification system and uniform experience rating plan; permits an insurer to develop subclassifications in certain cases; requires workers’ compensation insurers to record and report certain workers’ compensation experience; requires a rating organization to develop and file certain rules; prohibits insurers from agreeing with other insurers to adhere to certain rules; specifies the contents of an experience rating plan; and permits insurers to file rating plans providing for retrospective premium adjustments. Chapter 591 provides, among other things, that the allowable fees and other charges for medical treatment and services established by the WCC shall be reviewed by the WCC at least once every two years for completeness and reasonableness, and that WCC-adopted guidelines be revised accordingly.

5
employer may self-insure.
Workers’ compensation insurance is a “long-tail” line of business, as claims may be open
for long periods of time; benefits may be awarded in stages and in various combinations of
disability determinations, and claims may be reopened at a later point in time resulting in the
payment of additional benefits. All of these factors can make it difficult to accurately predict
costs of workers’ compensation claims.
Maryland’s Workers’ Compensation Commission’s Medical Fee Guide is one tool
Maryland has used to curtail medical cost increases and make it easier for workers’
compensation insurers to predict cost of claims. In an effort to further decrease medical cost
trends, some workers’ compensation insurers have entered into contracts with Preferred Provider
Organizations (PPOs). Providers contracting with a PPO may agree to accept a lower fee than
that established by the Workers’ Compensation Commission’s Fee Guide. If an injured worker
receives services from such a provider, the workers’ compensation insurer pays the provider in
accordance with the PPO contracted rate or the Workers’ Compensation Commission’s Medical
Fee Guide, whichever is less. Furthermore, under the State’s all-payer hospital rate setting
system, workers’ compensation insurers pay the same amount for hospital services as all other
payers.
2015 Legislative Changes Impacting Workers’ Compensation HOUSE BILL 358 (Chapter 88) – Workers’ Compensation Insurance-Cancellation and Nonrenewal – Notice
• Increases the number of days to at least 45 days before the date of cancellation or renewal within which an insurer is required to provide a specified notice to an employer before the insurer may cancel or refuse to renew the employer’s workers’ compensation insurance policy midterm/before its expiration for a reason other than nonpayment of premium.
6
• Specifies the notice must contain (1) the date the cancellation or nonrenewal takes effect and (2) the actual reason the insurer is proposing to cancel or refuse to renew the policy. The notice must also be filed with the Workers’ Compensation Commission.
Effective Date: January 1, 2016
SENATE BILL 135 (Chapter 324) Workers’ Compensation - Heart Disease and Hypertension Presumption - Anne Arundel County Detention Officers
• Extends to all Anne Arundel County detention officers an occupational disease presumption for heart disease or hypertension that is more severe than the individual's prior condition and that results in partial or total disability or death. Alters the definition of "public safety employee" to include Anne Arundel County detention officers, making these officers eligible for enhanced workers' compensation benefits. Provisions related to designation as a "public safety employee" must be construed to apply only prospectively and may not be applied or interpreted to have any effect on, or application to, any claims arising before the bill's effective date.
Effective Date: October 1, 2015
SENATE BILL 331 (Chapter 339) - Workers' Compensation-Baltimore County Deputy Sheriff
• Alters the definition of "public safety employee" to include a Baltimore County deputy sheriff only when the deputy sheriff sustains an accidental personal injury that arises out of and in the cause and scope of performing duties directly related to (1) courthouse security; (2) prisoner transportation; (3) service of warrants; (4) personnel management; or (5) other administrative duties. Designation as a "public safety employee" makes these officers eligible for enhanced workers' compensation benefits in those circumstances.
Effective Date: October 1, 2015
SENATE BILL 465 (Chapter 36) – Chesapeake Employers’ Insurance Company
• Authorizes Chesapeake to establish, own, or control a subsidiary for any lawful purpose if the subsidiary: (1) is, or after acquisition will be, wholly owned by Chesapeake; (2) engages in a business activity that is ancillary to the workers’ compensation insurance business; and (3) is operated for the purposes of benefiting Chesapeake.
• Requires that two of the board’s nine members must be appointed by the Governor. The
other seven members must be selected by policyholders under the procedures required by the board’s bylaws. The Governor may only remove a member of the board for incompetence or misconduct if that member was appointed by the Governor; however, the policyholders may remove a member appointed by the policyholders at any time, with or without cause, by majority vote.
7
• Authorizes the Insurance Commissioner to remove a board member appointed by the policyholders for misconduct, incompetence, or malfeasance after notice and opportunity for a hearing. Board members are no longer required to take the oath required by the Maryland Constitution. The bill specifies the appointment dates and term limits of board members through 2029.
Outlines future changes as follows:
• Effective January 1, 2023, that Chesapeake is no longer exempt from Title 11 of the Insurance Article, which regulates insurance rates and ratemaking procedures and Chesapeake must join the rating organization chosen by the Insurance Commissioner and follow all reporting and ratemaking requirements in the same manner as all other workers’ compensation insurers in the State.
• On or before October 1, 2016, and each following year through October 1, 2022, the
rating organization, in consultation with Chesapeake, must submit a report to the Senate Finance Committee and the House Economic Matters Committee on the progress that Chesapeake has made in preparing to become a member of the rating organization.
• Effective January 1, 2022, the rating organization must create and maintain an exception
in its occupation classification system to allow any authorized insurer in the State to use a single classification code for governmental occupations that are not already included in police, firefighter, and clerical classifications.
• Requires the Commissioner to review the State’s self-insured workers’ compensation
program at least once every five years and submit a report to the State Treasurer. Effective Date: October 1, 2015
Workers’ Compensation Insurers
Ninety-nine insurance groups, including CEIC, offer workers’ compensation insurance to
Maryland employers. Together, these insurers had $931,390,242 direct written premium in
2014. This represents 9.4% of the direct written premiums written by all property and casualty
(“P&C”) insurers, making workers’ compensation insurance the third largest line in P&C
insurance following auto insurance and homeowner’s insurance. Exhibit 1 displays the workers’
compensation share of total Property and Casualty industry (“Industry”) written premium in the
State for the period 2002 to 2014.
8
The top eight workers’ compensation insurance groups, including CEIC, wrote 64.9% of
the market in 2014. Table 1 below displays the market share for each of these insurance groups.
CEIC is the largest writer of workers’ compensation insurance in Maryland, with a market share
of 23.8 percent in 2014.
Table 1: Market Share Largest Writers, 2013 and 2014 Insurance Group Percentage Market
Share, 2014
Percentage Market Share, 2013
Chesapeake Employers Insurance Company 23.8 24.6 Hartford Fire and Casualty Group 11.6 12.5 Travelers Group 7.1 7.8 Erie Insurance Group 6.4 5.5 Zurich Insurance Group 4.4 3.5 American Insurance Group 4.3 3.5 Liberty Mutual Group 4.2 6.2 WR Berkley Corp Group 3.0 2.7 Exhibits 2 through 6 provide additional related data as follows:
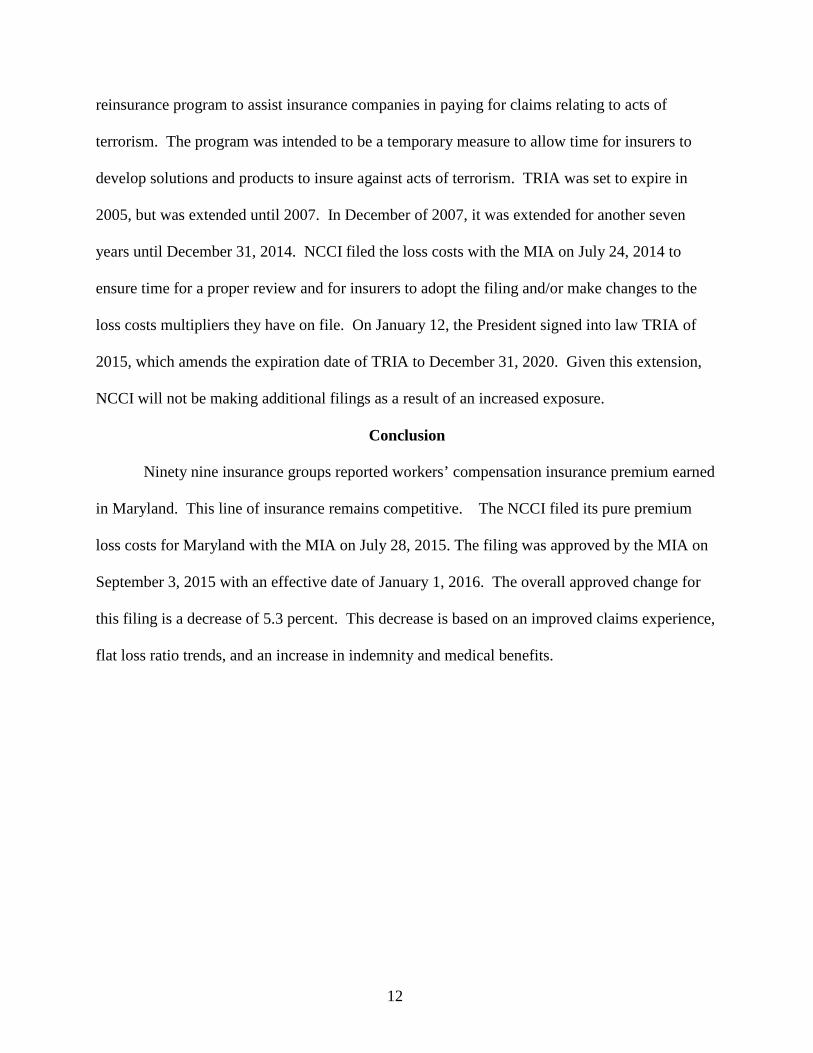
• Exhibit 2 displays a comparison of the top eight workers’ compensation insurance
groups’ market shares as referenced in Table 1. This exhibit shows market shares for
these top eight workers’ compensation writers for a twelve-year period from 2003
through 2014.
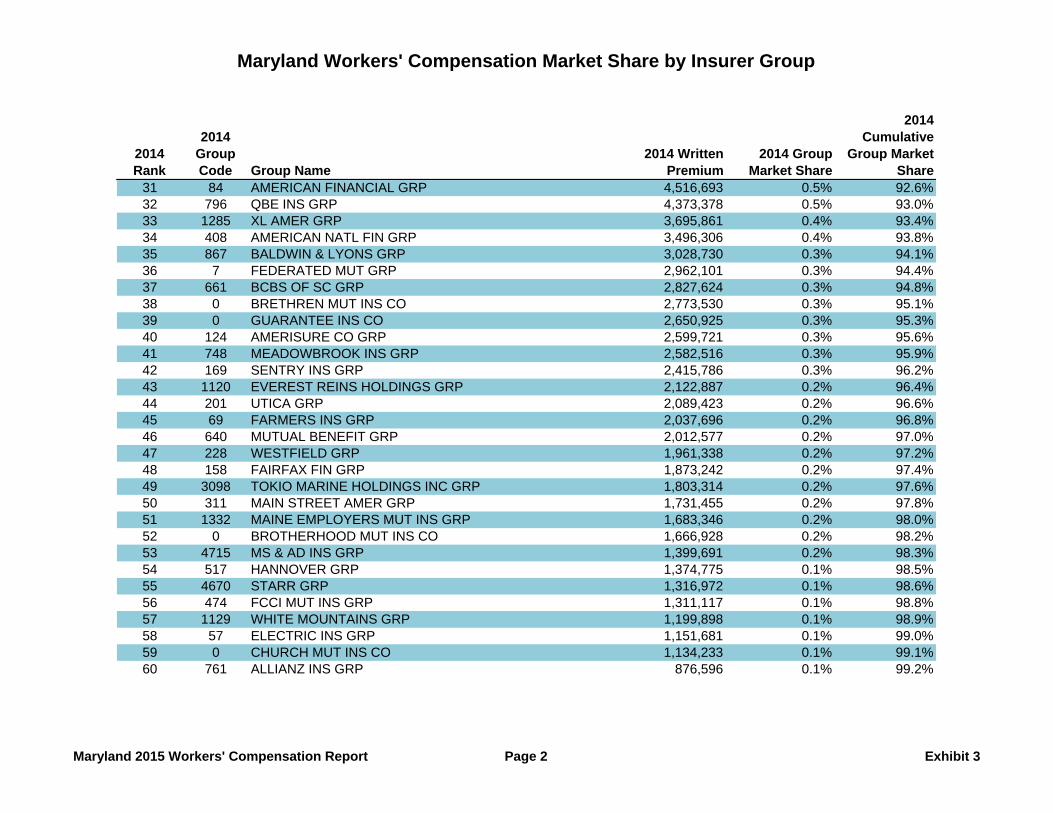
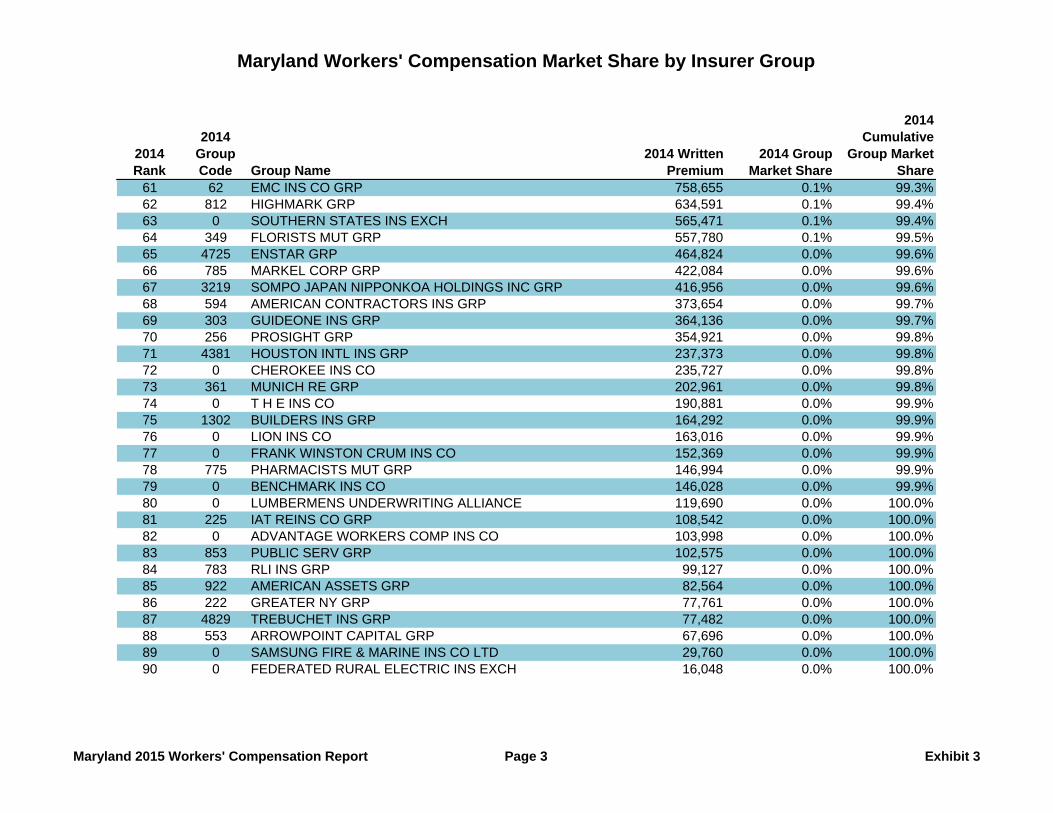
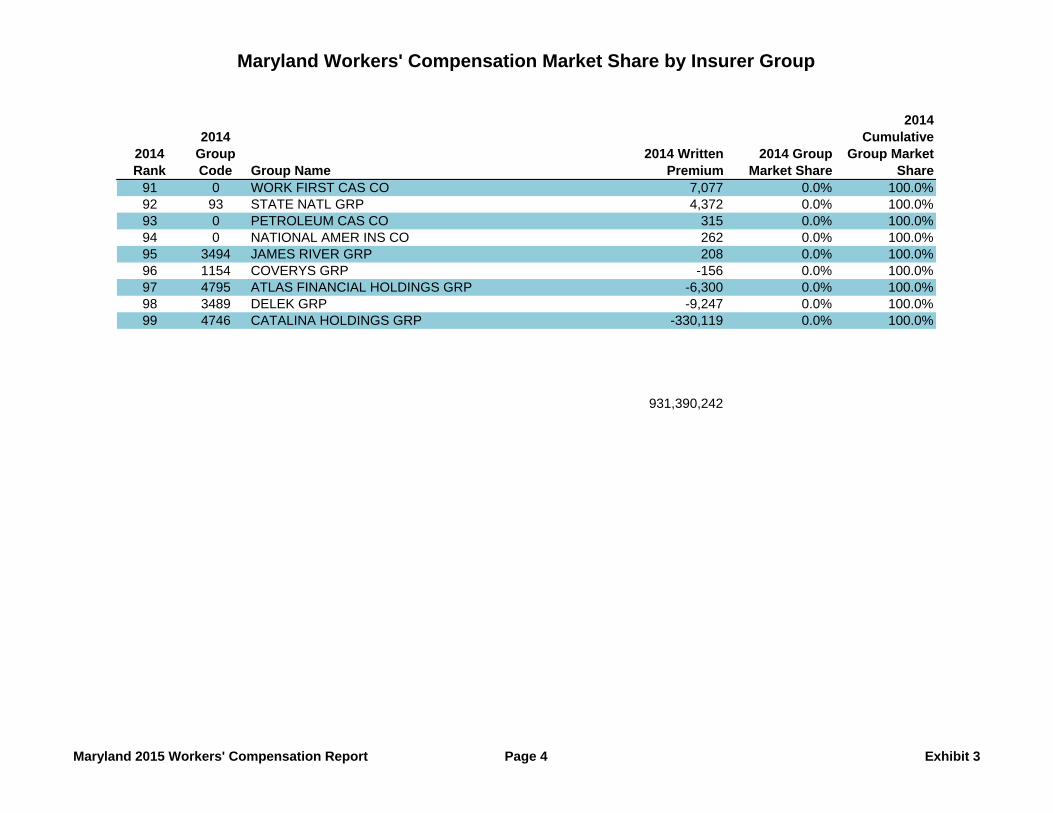
• Exhibit 3 displays a complete listing of the market shares for all Maryland workers’
compensation insurer groups operating in Maryland. This information represents 2014
written premiums.
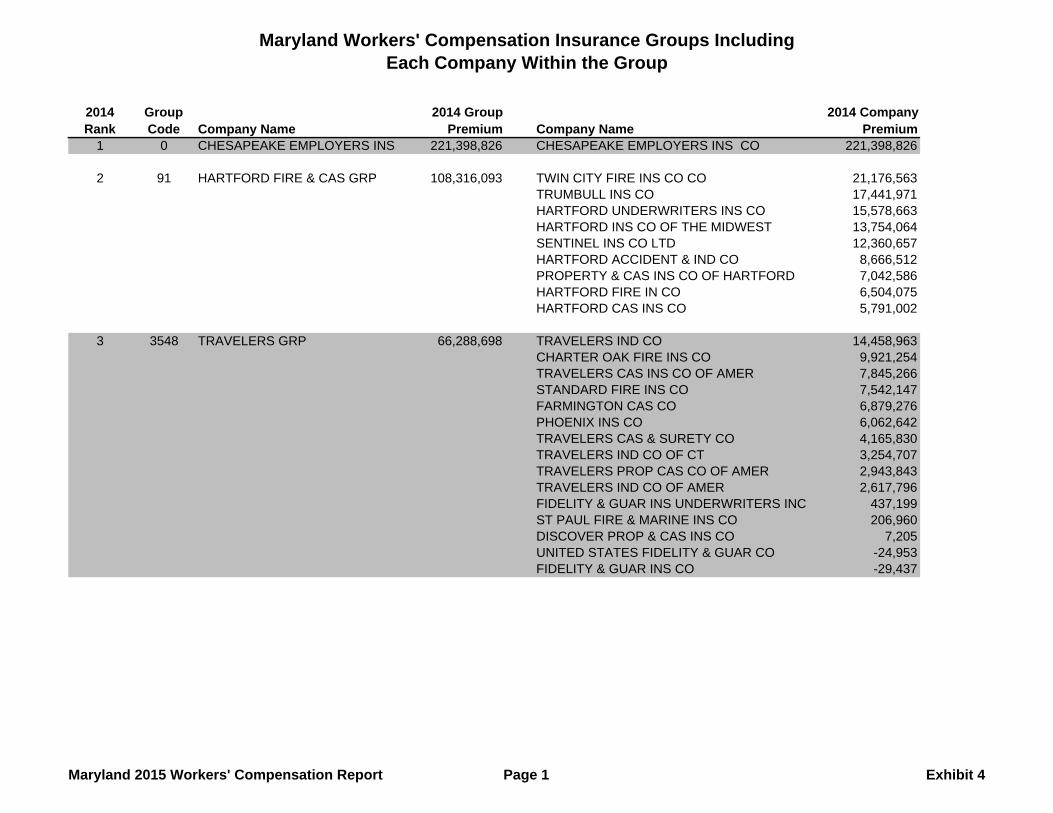
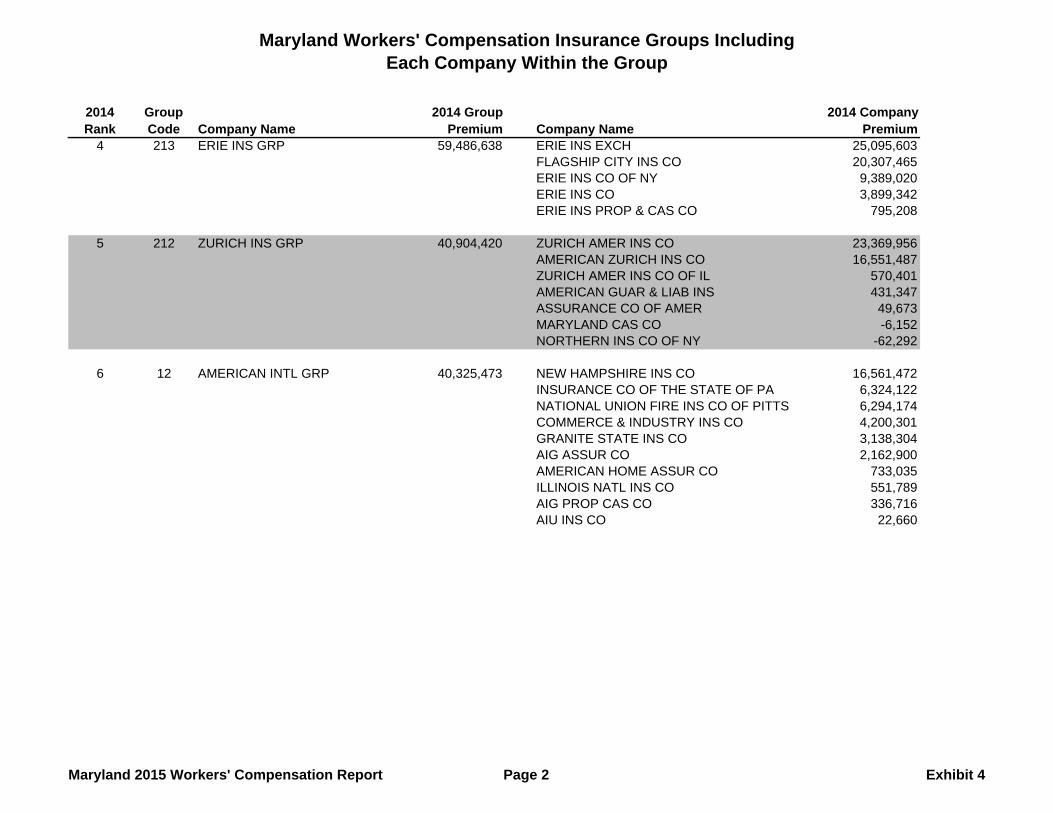
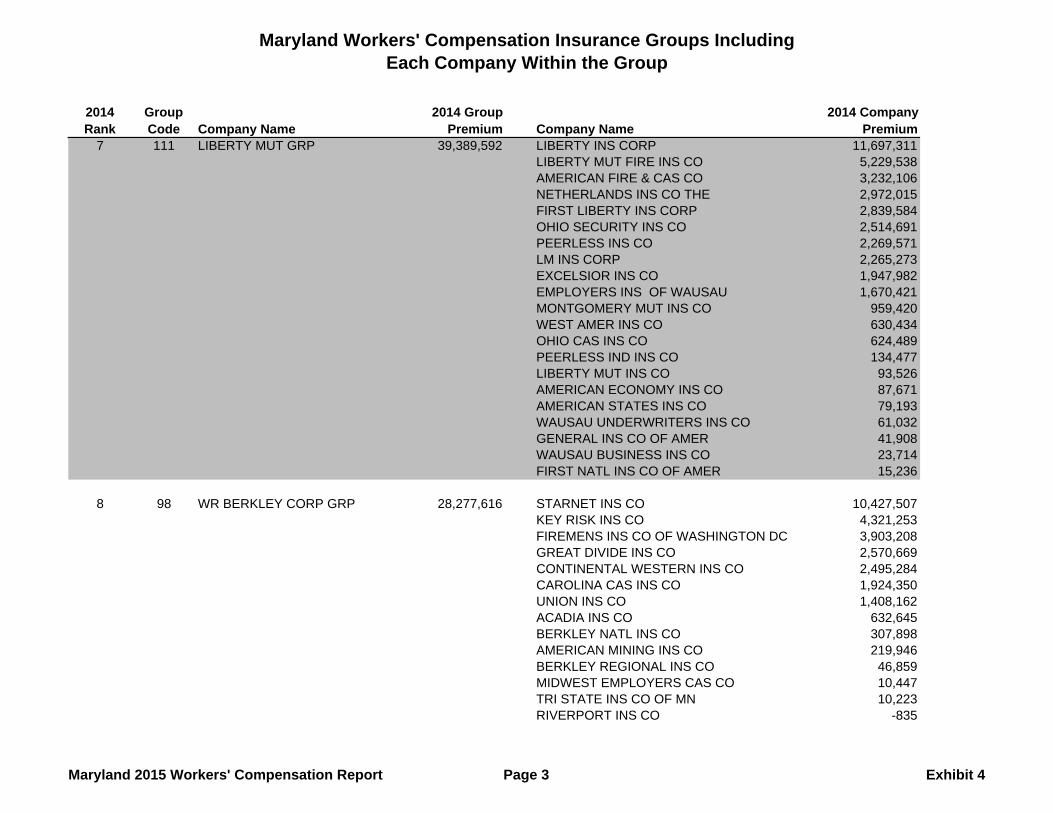
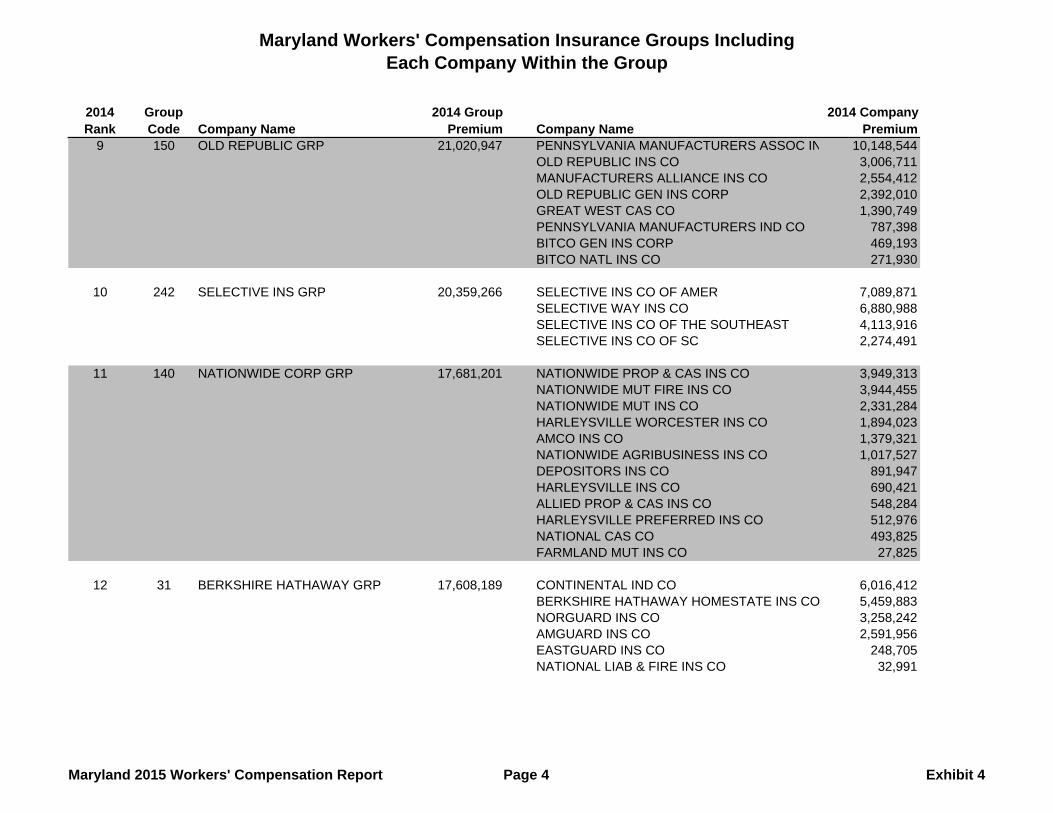
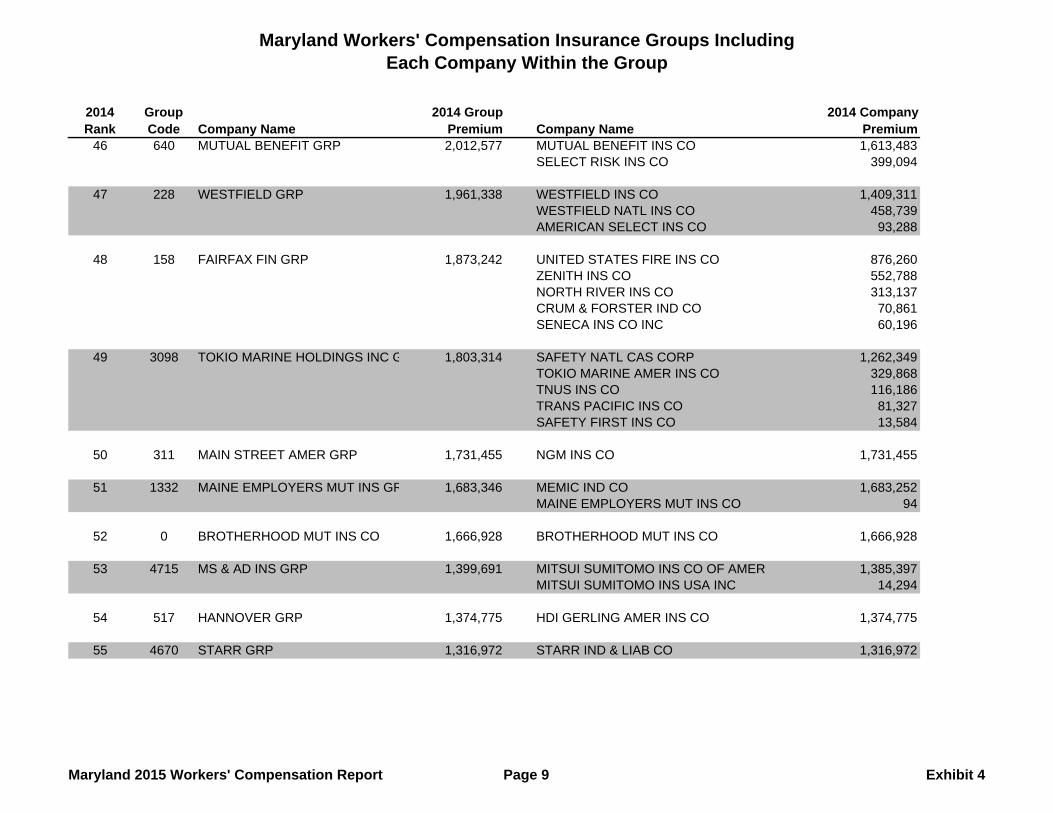
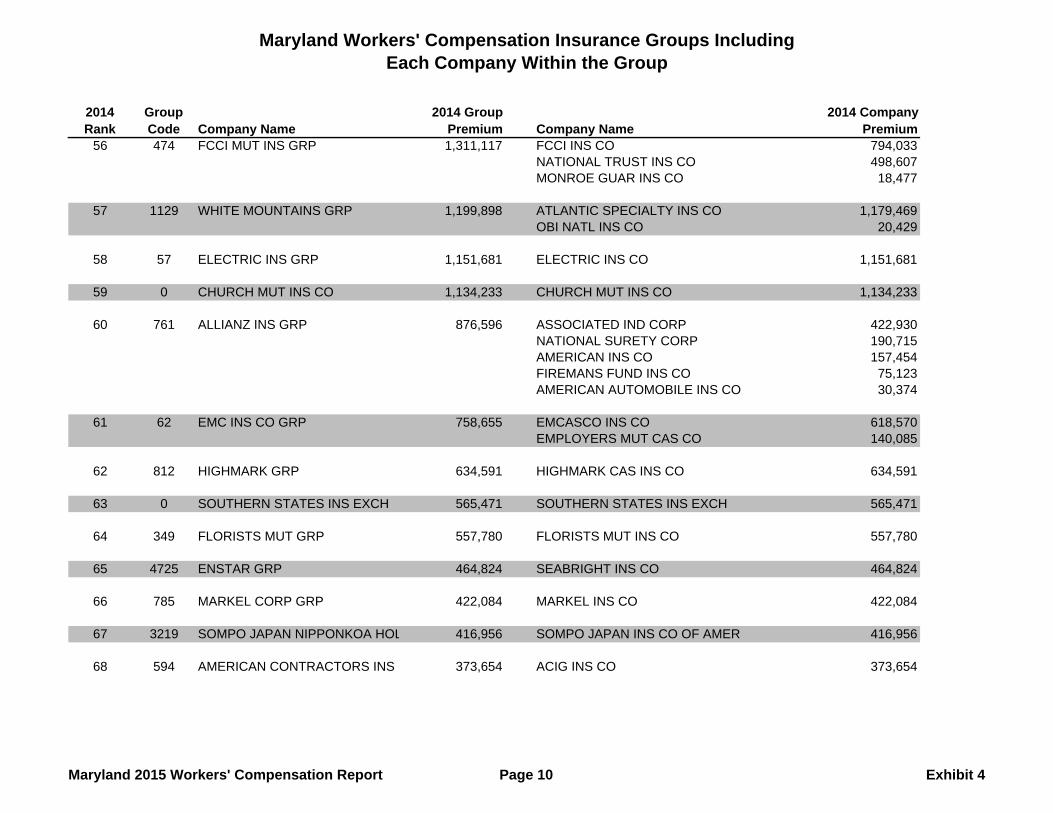
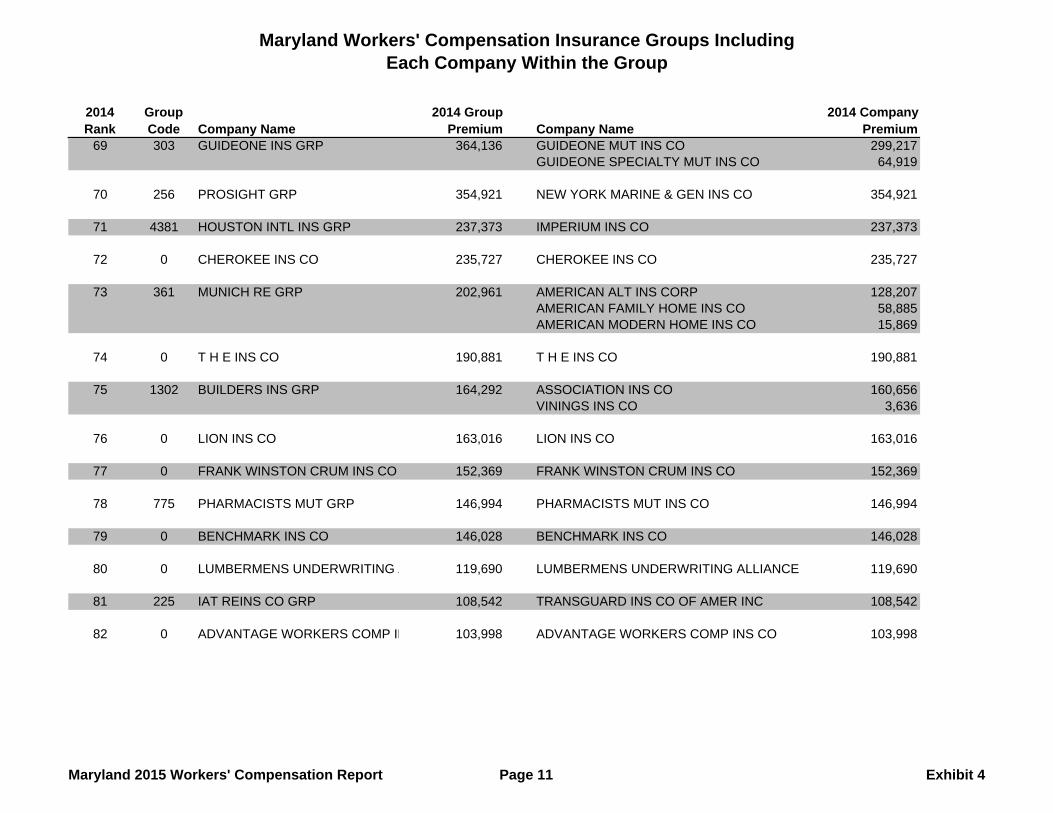
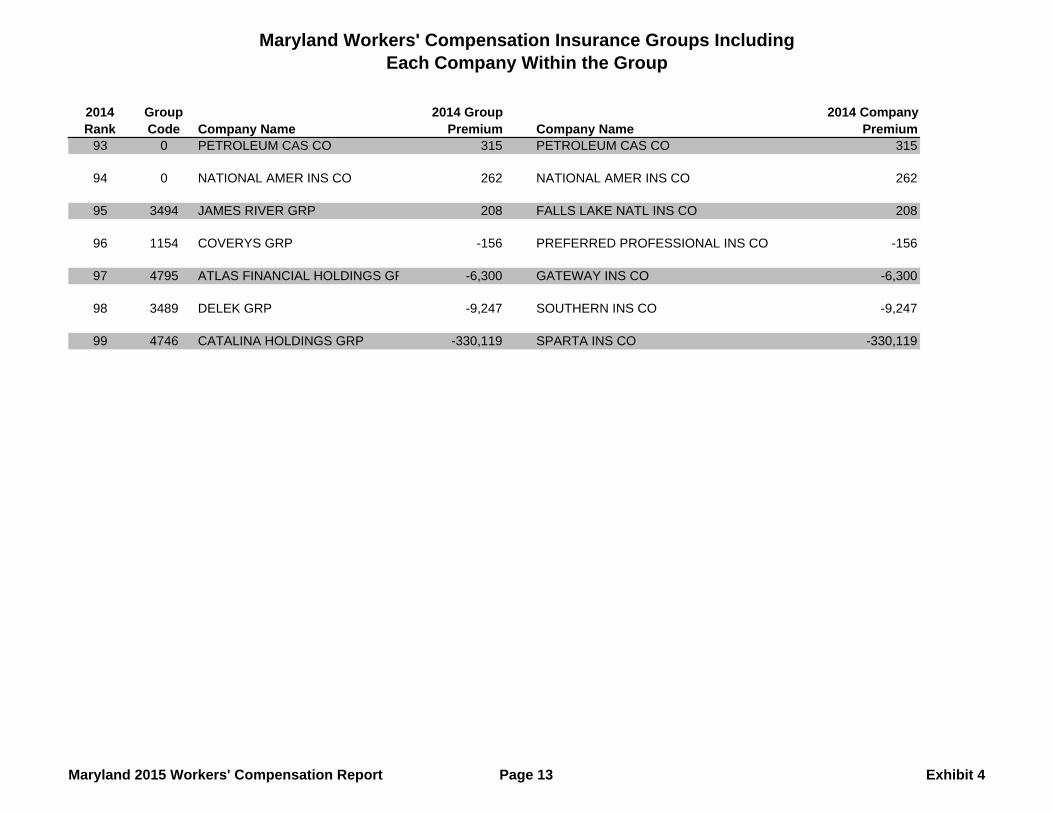
• Exhibit 4 displays the individual insurers associated with each workers’ compensation
insurer group.
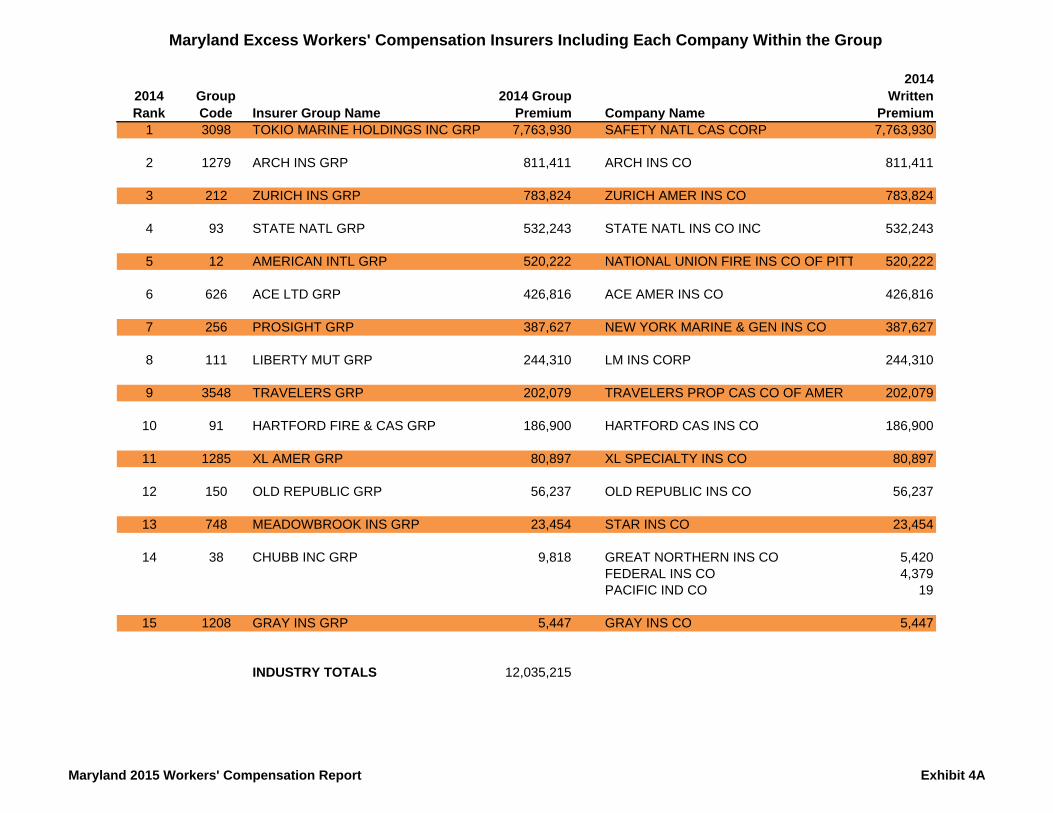
• Exhibit 4a lists Maryland Excess Workers’ Compensation Insurers. This coverage is
designed for employers that self-insure up to a certain point, and then purchase additional
coverage for risk beyond that point.
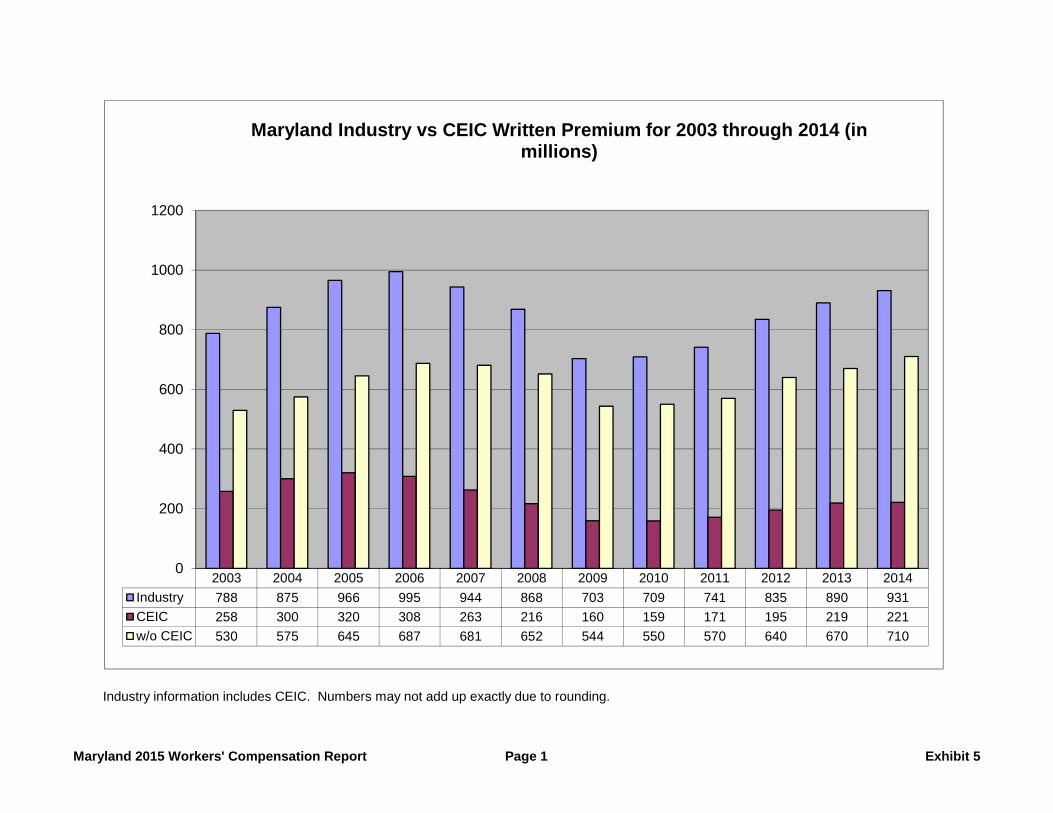
• Exhibit 5, page 1, compares CEIC’s written premium to the Industry for the period 2002
9
through 2014.
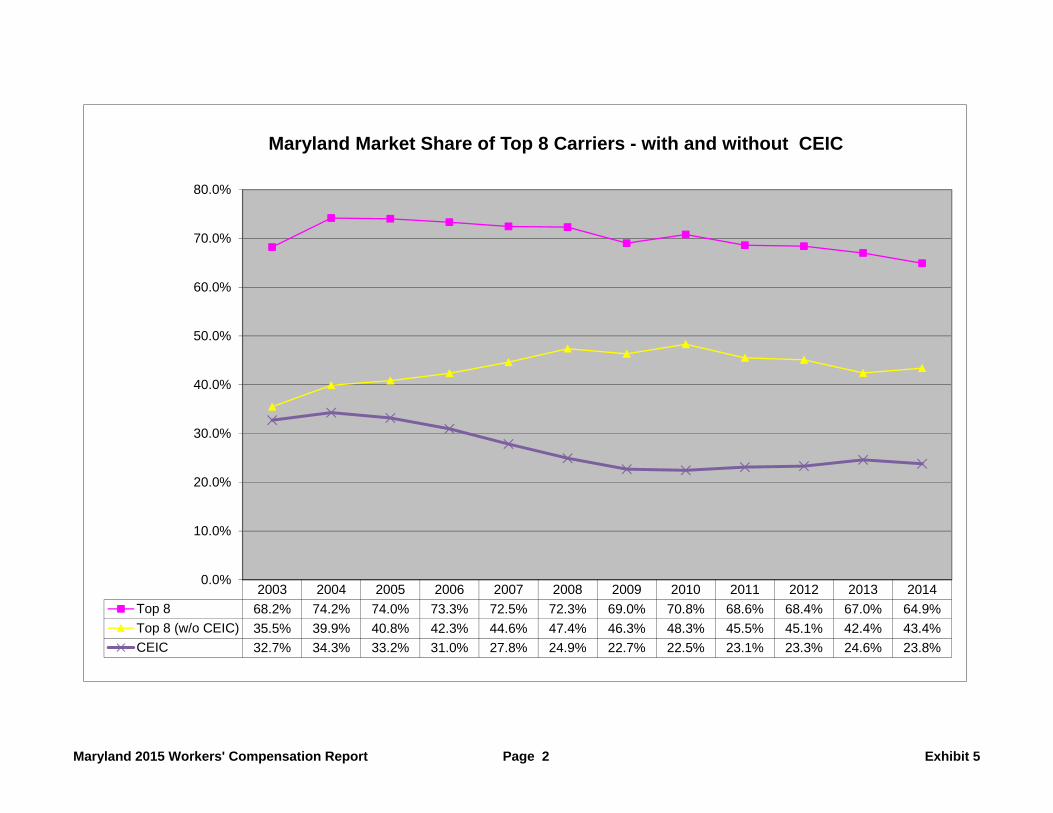
• Exhibit 5, Page 2 illustrates that CEIC remains the largest workers’ compensation insurer
in Maryland. CEIC lost market share to other workers’ compensation insurance groups
in the insurance industry from 2005 through 2010, but reversed that trend in 2011and
gained an additional 1.3 % of the market in 2013.
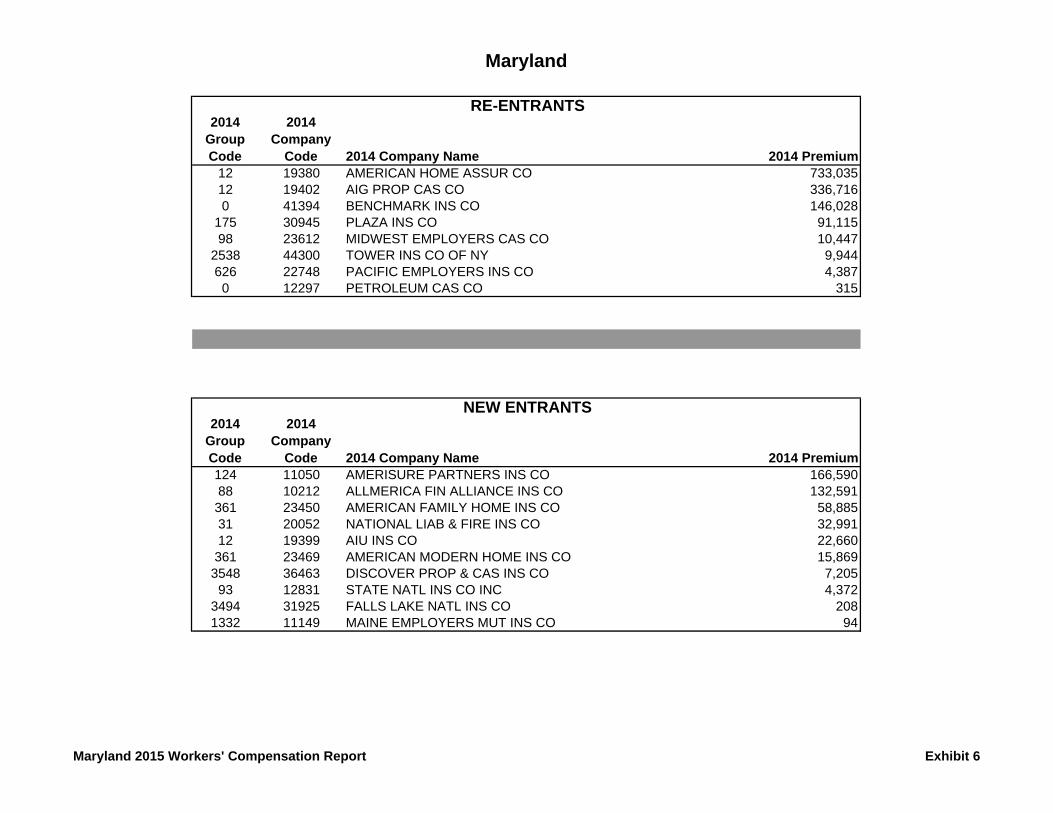
• Exhibit 6 lists new entrants and re-entrants into the market for 2014. New entrants are
companies with no written premium in 2012 and 2013. Re-entrants are those carriers that
had premium in 2012, but no premium in 2013.
Premium Rates
Insurance premium rates can be regulated either through prior approval or through
competitive rating (also known as “file and use”). Under prior approval, insurers must file their
proposed rates with the MIA and may only begin to use those rates to determine the premium for
a particular risk after the MIA has approved them. Under competitive rating, insurers file their
proposed rates with the MIA and may begin to use those rates to determine the premium for a
particular risk as soon as the MIA has received the filing.
In Maryland, workers’ compensation insurance is a blend of prior approval and
competitive rating. In this line, all insurers, with the exception of CEIC, are required to
subscribe to the NCCI. NCCI is a licensed rating and advisory organization which files pure
premium loss costs with the MIA. Pure premium loss costs reflect actual claim information
submitted by insurers to the NCCI. Claim information includes lost wages and medical costs.
The NCCI then aggregates this claim information for use in its pure premium loss costs filings.
Pure premium loss costs do not, however, include any other costs associated with writing
workers’ compensation insurance, such as profit, commissions, taxes and the expenses associated
10
with providing the benefits to the injured worker (known as loss adjustment expenses). No
insurer may use NCCI’s pure premium loss costs until those costs have been approved by the
MIA. The rates usually are effective beginning January 1 of each year.
Once the MIA has approved the NCCI’s pure premium loss costs, insurers submit
independent rate filings. These filings adopt the NCCI pure premium loss costs and then include
the insurer’s expense multipliers. The expense multiplier consists of the following elements
from an insurer’s expense and profit information: (1) commission; (2) general expense; (3) taxes,
licenses and fees; and (4) profit. In addition, since the NCCI does not include loss adjustment
expense in its pure premium loss cost filings, companies modify their expense multiplier to
include a component for loss adjustment expense. The insurer’s rates are derived by multiplying
NCCI’s pure premium loss costs by the insurer’s calculated expense multiplier. These rate
filings are made under competitive rating, which means that insurers may begin to charge
premiums based on the specific expense multiplier as soon as it has been filed with the MIA.
CEIC is not required to join NCCI or adhere to the policy forms filed by NCCI.
However, CEIC’s ratemaking practices are reviewed by the MIA at least once every five years
through the financial examination process.
A common measure to determine how much of the premium dollar is used to cover
benefits is the loss ratio. A loss ratio of 70 percent, for example, means the insurer spent 70
cents of each dollar collected through direct written premium on benefits. As a group, workers’
compensation insurers had a collective loss ratio of 69.2 percent. CEIC’s loss ratio was 76.4% in
2013, and 87.9% in 2014. From the period of 2003 to 2014, CEIC’s loss ratios generally have
been higher than the rest of the Industry. (See Exhibit 7 for a comparison of CEIC’s loss ratios to
those of the Industry for the period 2003 to 2014).
Exhibits 8 through 12 illustrate various aspects of the history of NCCI pure premium loss
11
costs filings in the state of Maryland as follows:
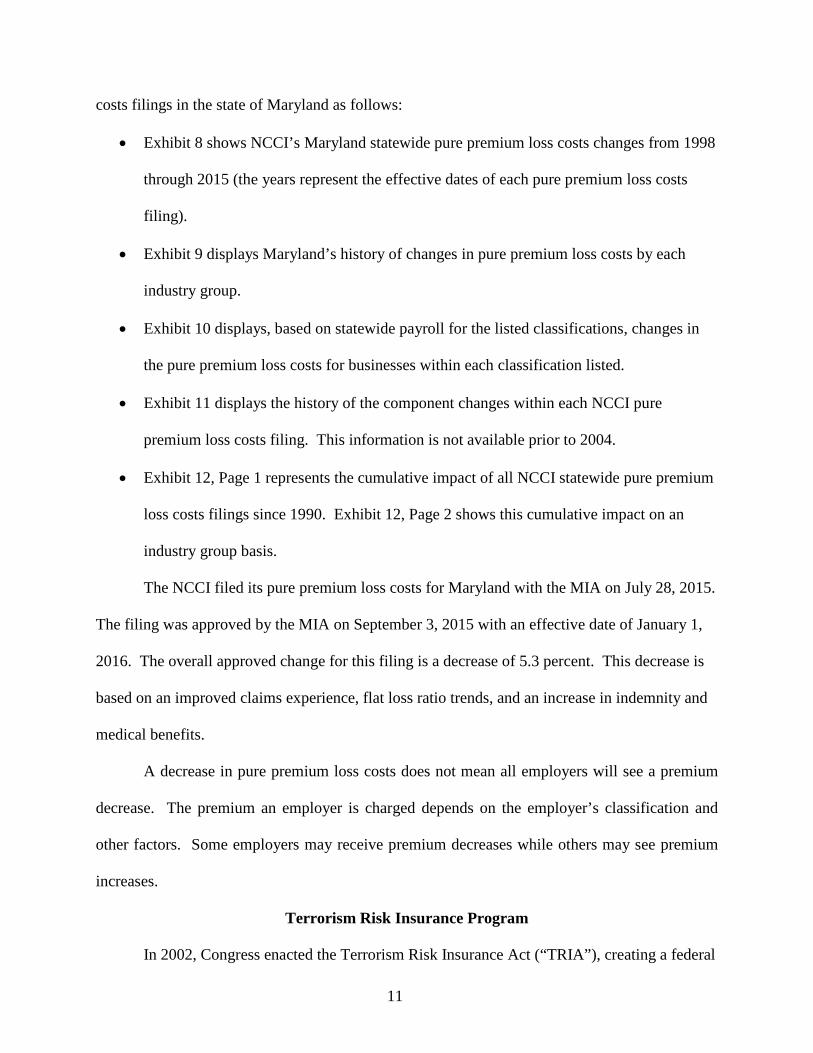
• Exhibit 8 shows NCCI’s Maryland statewide pure premium loss costs changes from 1998
through 2015 (the years represent the effective dates of each pure premium loss costs
filing).
• Exhibit 9 displays Maryland’s history of changes in pure premium loss costs by each
industry group.
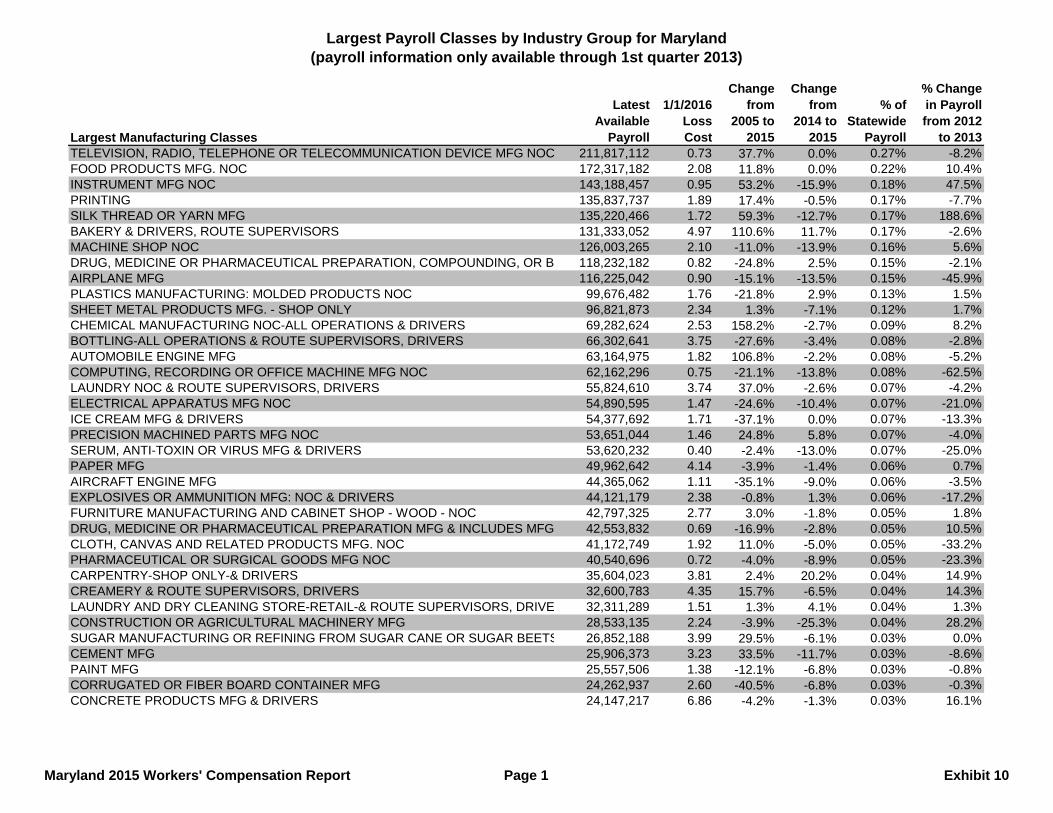
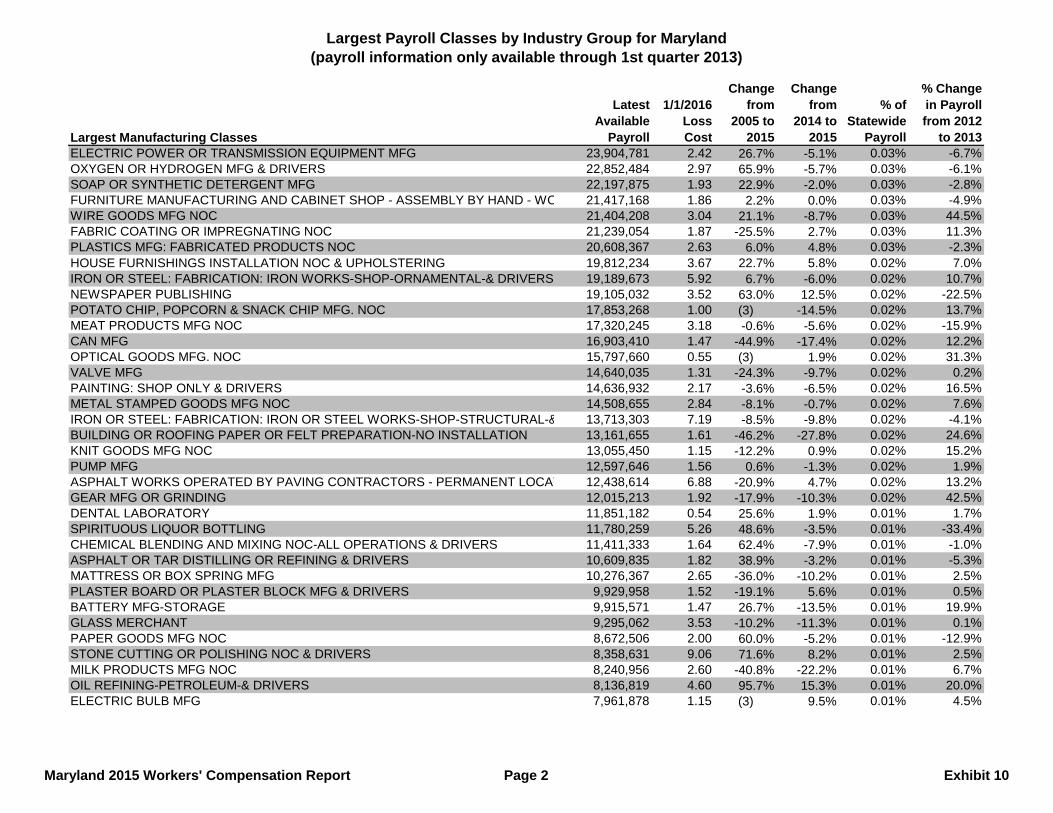
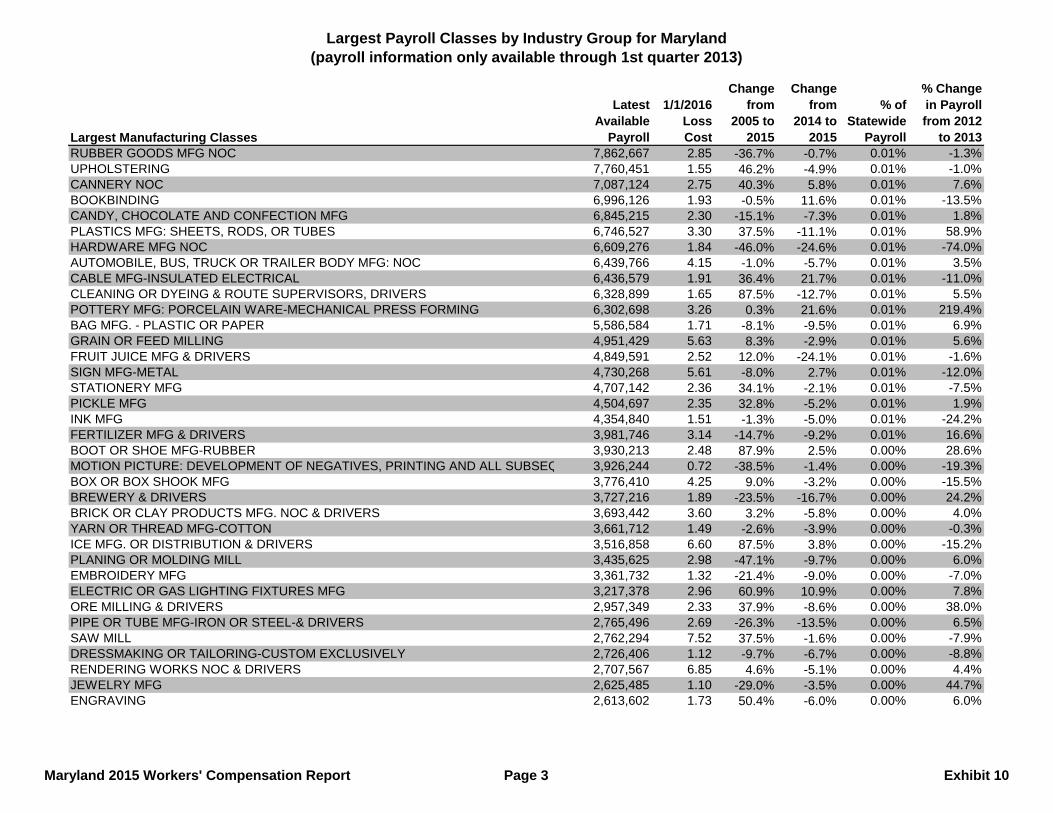
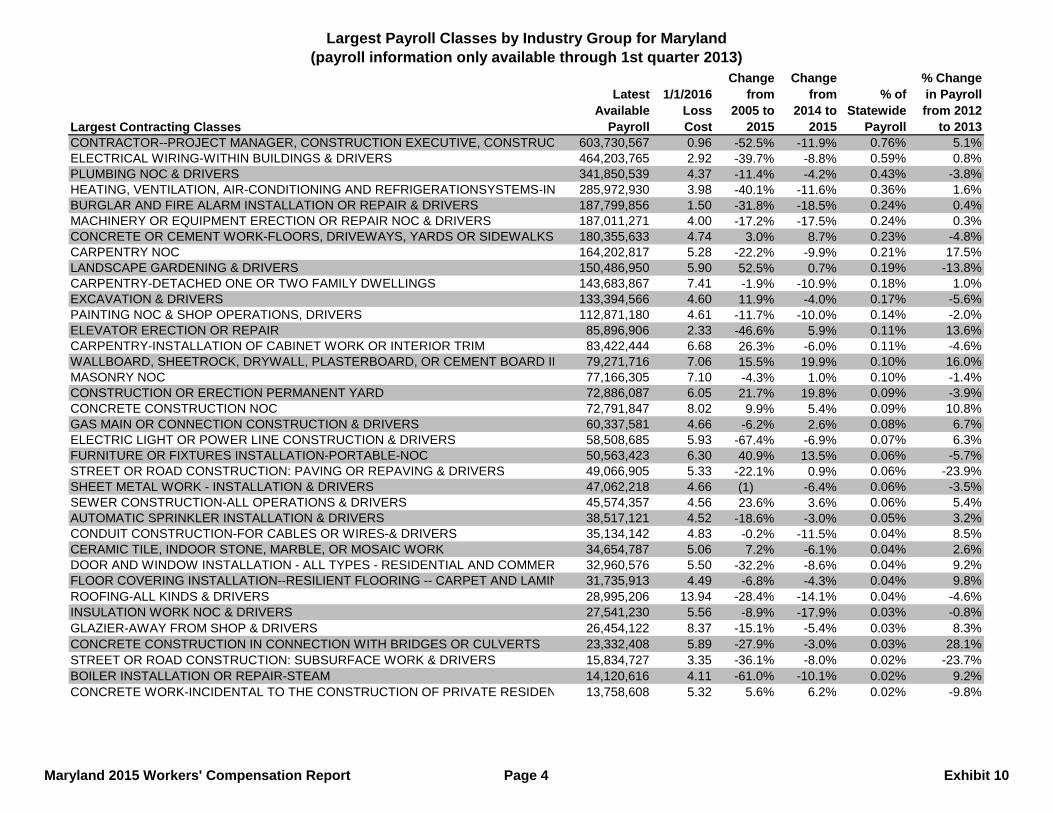
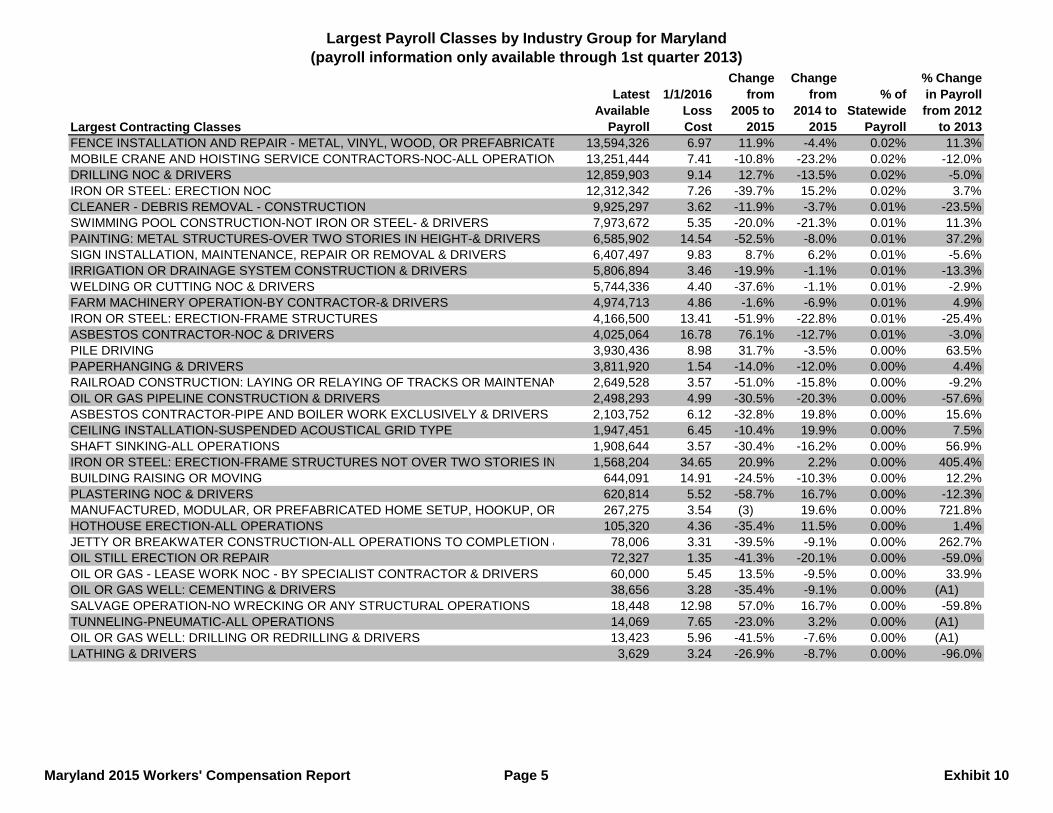
• Exhibit 10 displays, based on statewide payroll for the listed classifications, changes in
the pure premium loss costs for businesses within each classification listed.
• Exhibit 11 displays the history of the component changes within each NCCI pure
premium loss costs filing. This information is not available prior to 2004.
• Exhibit 12, Page 1 represents the cumulative impact of all NCCI statewide pure premium
loss costs filings since 1990. Exhibit 12, Page 2 shows this cumulative impact on an
industry group basis.
The NCCI filed its pure premium loss costs for Maryland with the MIA on July 28, 2015.
The filing was approved by the MIA on September 3, 2015 with an effective date of January 1,
2016. The overall approved change for this filing is a decrease of 5.3 percent. This decrease is
based on an improved claims experience, flat loss ratio trends, and an increase in indemnity and
medical benefits.
A decrease in pure premium loss costs does not mean all employers will see a premium
decrease. The premium an employer is charged depends on the employer’s classification and
other factors. Some employers may receive premium decreases while others may see premium
increases.
Terrorism Risk Insurance Program
In 2002, Congress enacted the Terrorism Risk Insurance Act (“TRIA”), creating a federal
12
reinsurance program to assist insurance companies in paying for claims relating to acts of
terrorism. The program was intended to be a temporary measure to allow time for insurers to
develop solutions and products to insure against acts of terrorism. TRIA was set to expire in
2005, but was extended until 2007. In December of 2007, it was extended for another seven
years until December 31, 2014. NCCI filed the loss costs with the MIA on July 24, 2014 to
ensure time for a proper review and for insurers to adopt the filing and/or make changes to the
loss costs multipliers they have on file. On January 12, the President signed into law TRIA of
2015, which amends the expiration date of TRIA to December 31, 2020. Given this extension,
NCCI will not be making additional filings as a result of an increased exposure.
Conclusion
Ninety nine insurance groups reported workers’ compensation insurance premium earned
in Maryland. This line of insurance remains competitive. The NCCI filed its pure premium
loss costs for Maryland with the MIA on July 28, 2015. The filing was approved by the MIA on
September 3, 2015 with an effective date of January 1, 2016. The overall approved change for
this filing is a decrease of 5.3 percent. This decrease is based on an improved claims experience,
flat loss ratio trends, and an increase in indemnity and medical benefits.

2002 2003 2004 2005 2006 2007 2008 2009 2010 2011 2012 2013 2014WC Share 10.3% 10.4% 10.8% 11.4% 11.3% 10.8% 9.9% 8.2% 8.2% 8.5% 9.0% 9.0% 9.4%
0.0%
2.0%
4.0%
6.0%
8.0%
10.0%
12.0%
14.0%
Maryland Workers' Compensation Share of Overall Property & Casualty Industry Written Premium
Maryland 2015 Workers' Compensation Report Exhibit 1
2003 2004 2005 2006 2007 2008 2009 2010 2011 2012 2013 2014CEIC 32.6% 34.3% 33.2% 31.0% 27.8% 24.9% 22.7% 22.5% 23.1% 23.3% 24.6% 23.8%Hartford Group 7.9% 9.1% 11.6% 10.2% 10.7% 11.2% 12.2% 12.5% 14.3% 13.8% 12.5% 11.6%Travelers Group 5.2% 5.0% 4.2% 4.9% 5.3% 6.4% 7.7% 7.6% 8.1% 7.5% 7.8% 7.1%Erie Insurance Group 5.5% 5.6% 5.2% 5.2% 4.7% 4.7% 4.8% 4.7% 5.4% 5.5% 6.1% 6.4%Zurich Group 4.5% 4.5% 4.6% 3.9% 3.7% 4.3% 4.2% 4.8% 3.8% 4.6% 3.5% 4.4%American International Group 5.3% 6.3% 6.9% 8.3% 8.2% 7.3% 5.4% 5.6% 2.9% 3.4% 3.5% 4.3%Liberty Mutual Group 6.6% 6.6% 6.4% 7.2% 8.0% 9.5% 8.8% 9.6% 7.6% 7.8% 6.2% 4.2%WR Berkley Group 0.4% 0.6% 0.8% 1.1% 1.3% 1.5% 1.9% 2.2% 2.9% 2.4% 2.7% 3.0%
0.0%
5.0%
10.0%
15.0%
20.0%
25.0%
30.0%
35.0%
40.0%
Comparison of Large Insurance Group Market Sharesin Maryland for 2003 through 2014
Maryland 2015 Workers' Compensation Report Exhibit 2
Maryland Workers' Compensation Market Share by Insurer Group
2014 Rank
2014 Group Code Group Name
2014 Written Premium
2014 Group Market Share
2014 Cumulative
Group Market Share
1 0 CHESAPEAKE EMPLOYERS INS CO 221,398,826 23.8% 23.8%2 91 HARTFORD FIRE & CAS GRP 108,316,093 11.6% 35.4%3 3548 TRAVELERS GRP 66,288,698 7.1% 42.5%4 213 ERIE INS GRP 59,486,638 6.4% 48.9%5 212 ZURICH INS GRP 40,904,420 4.4% 53.3%6 12 AMERICAN INTL GRP 40,325,473 4.3% 57.6%7 111 LIBERTY MUT GRP 39,389,592 4.2% 61.9%8 98 WR BERKLEY CORP GRP 28,277,616 3.0% 64.9%9 150 OLD REPUBLIC GRP 21,020,947 2.3% 67.1%
10 242 SELECTIVE INS GRP 20,359,266 2.2% 69.3%11 140 NATIONWIDE CORP GRP 17,681,201 1.9% 71.2%12 31 BERKSHIRE HATHAWAY GRP 17,608,189 1.9% 73.1%13 2538 AMTRUST NGH GRP 17,537,329 1.9% 75.0%14 38 CHUBB INC GRP 16,240,509 1.7% 76.7%15 218 CNA INS GRP 13,864,100 1.5% 78.2%16 572 BCBS OF MI GRP 13,291,108 1.4% 79.7%17 626 ACE LTD GRP 12,083,645 1.3% 81.0%18 4507 BUILDERS GRP 11,805,685 1.3% 82.2%19 244 CINCINNATI FIN GRP 11,665,767 1.3% 83.5%20 447 HARFORD GRP 10,658,058 1.1% 84.6%21 175 STATE AUTO MUT GRP 9,783,389 1.1% 85.7%22 250 DONEGAL GRP 8,196,006 0.9% 86.6%23 680 AMERISAFE GRP 7,690,264 0.8% 87.4%24 176 STATE FARM GRP 7,064,515 0.8% 88.1%25 1279 ARCH INS GRP 6,744,430 0.7% 88.9%26 88 THE HANOVER INS GRP 6,702,153 0.7% 89.6%27 457 ARGONAUT GRP 6,133,672 0.7% 90.2%28 2698 PROASSURANCE CORP GRP 6,072,590 0.7% 90.9%29 271 PENNSYLVANIA NATL INS GRP 5,749,168 0.6% 91.5%30 3363 EMPLOYERS HOLDINGS GRP 5,276,187 0.6% 92.1%
Maryland 2015 Workers' Compensation Report Page 1 Exhibit 3
Maryland Workers' Compensation Market Share by Insurer Group
2014 Rank
2014 Group Code Group Name
2014 Written Premium
2014 Group Market Share
2014 Cumulative
Group Market Share
31 84 AMERICAN FINANCIAL GRP 4,516,693 0.5% 92.6%32 796 QBE INS GRP 4,373,378 0.5% 93.0%33 1285 XL AMER GRP 3,695,861 0.4% 93.4%34 408 AMERICAN NATL FIN GRP 3,496,306 0.4% 93.8%35 867 BALDWIN & LYONS GRP 3,028,730 0.3% 94.1%36 7 FEDERATED MUT GRP 2,962,101 0.3% 94.4%37 661 BCBS OF SC GRP 2,827,624 0.3% 94.8%38 0 BRETHREN MUT INS CO 2,773,530 0.3% 95.1%39 0 GUARANTEE INS CO 2,650,925 0.3% 95.3%40 124 AMERISURE CO GRP 2,599,721 0.3% 95.6%41 748 MEADOWBROOK INS GRP 2,582,516 0.3% 95.9%42 169 SENTRY INS GRP 2,415,786 0.3% 96.2%43 1120 EVEREST REINS HOLDINGS GRP 2,122,887 0.2% 96.4%44 201 UTICA GRP 2,089,423 0.2% 96.6%45 69 FARMERS INS GRP 2,037,696 0.2% 96.8%46 640 MUTUAL BENEFIT GRP 2,012,577 0.2% 97.0%47 228 WESTFIELD GRP 1,961,338 0.2% 97.2%48 158 FAIRFAX FIN GRP 1,873,242 0.2% 97.4%49 3098 TOKIO MARINE HOLDINGS INC GRP 1,803,314 0.2% 97.6%50 311 MAIN STREET AMER GRP 1,731,455 0.2% 97.8%51 1332 MAINE EMPLOYERS MUT INS GRP 1,683,346 0.2% 98.0%52 0 BROTHERHOOD MUT INS CO 1,666,928 0.2% 98.2%53 4715 MS & AD INS GRP 1,399,691 0.2% 98.3%54 517 HANNOVER GRP 1,374,775 0.1% 98.5%55 4670 STARR GRP 1,316,972 0.1% 98.6%56 474 FCCI MUT INS GRP 1,311,117 0.1% 98.8%57 1129 WHITE MOUNTAINS GRP 1,199,898 0.1% 98.9%58 57 ELECTRIC INS GRP 1,151,681 0.1% 99.0%59 0 CHURCH MUT INS CO 1,134,233 0.1% 99.1%60 761 ALLIANZ INS GRP 876,596 0.1% 99.2%
Maryland 2015 Workers' Compensation Report Page 2 Exhibit 3
Maryland Workers' Compensation Market Share by Insurer Group
2014 Rank
2014 Group Code Group Name
2014 Written Premium
2014 Group Market Share
2014 Cumulative
Group Market Share
61 62 EMC INS CO GRP 758,655 0.1% 99.3%62 812 HIGHMARK GRP 634,591 0.1% 99.4%63 0 SOUTHERN STATES INS EXCH 565,471 0.1% 99.4%64 349 FLORISTS MUT GRP 557,780 0.1% 99.5%65 4725 ENSTAR GRP 464,824 0.0% 99.6%66 785 MARKEL CORP GRP 422,084 0.0% 99.6%67 3219 SOMPO JAPAN NIPPONKOA HOLDINGS INC GRP 416,956 0.0% 99.6%68 594 AMERICAN CONTRACTORS INS GRP 373,654 0.0% 99.7%69 303 GUIDEONE INS GRP 364,136 0.0% 99.7%70 256 PROSIGHT GRP 354,921 0.0% 99.8%71 4381 HOUSTON INTL INS GRP 237,373 0.0% 99.8%72 0 CHEROKEE INS CO 235,727 0.0% 99.8%73 361 MUNICH RE GRP 202,961 0.0% 99.8%74 0 T H E INS CO 190,881 0.0% 99.9%75 1302 BUILDERS INS GRP 164,292 0.0% 99.9%76 0 LION INS CO 163,016 0.0% 99.9%77 0 FRANK WINSTON CRUM INS CO 152,369 0.0% 99.9%78 775 PHARMACISTS MUT GRP 146,994 0.0% 99.9%79 0 BENCHMARK INS CO 146,028 0.0% 99.9%80 0 LUMBERMENS UNDERWRITING ALLIANCE 119,690 0.0% 100.0%81 225 IAT REINS CO GRP 108,542 0.0% 100.0%82 0 ADVANTAGE WORKERS COMP INS CO 103,998 0.0% 100.0%83 853 PUBLIC SERV GRP 102,575 0.0% 100.0%84 783 RLI INS GRP 99,127 0.0% 100.0%85 922 AMERICAN ASSETS GRP 82,564 0.0% 100.0%86 222 GREATER NY GRP 77,761 0.0% 100.0%87 4829 TREBUCHET INS GRP 77,482 0.0% 100.0%88 553 ARROWPOINT CAPITAL GRP 67,696 0.0% 100.0%89 0 SAMSUNG FIRE & MARINE INS CO LTD 29,760 0.0% 100.0%90 0 FEDERATED RURAL ELECTRIC INS EXCH 16,048 0.0% 100.0%
Maryland 2015 Workers' Compensation Report Page 3 Exhibit 3
Maryland Workers' Compensation Market Share by Insurer Group
2014 Rank
2014 Group Code Group Name
2014 Written Premium
2014 Group Market Share
2014 Cumulative
Group Market Share
91 0 WORK FIRST CAS CO 7,077 0.0% 100.0%92 93 STATE NATL GRP 4,372 0.0% 100.0%93 0 PETROLEUM CAS CO 315 0.0% 100.0%94 0 NATIONAL AMER INS CO 262 0.0% 100.0%95 3494 JAMES RIVER GRP 208 0.0% 100.0%96 1154 COVERYS GRP -156 0.0% 100.0%97 4795 ATLAS FINANCIAL HOLDINGS GRP -6,300 0.0% 100.0%98 3489 DELEK GRP -9,247 0.0% 100.0%99 4746 CATALINA HOLDINGS GRP -330,119 0.0% 100.0%
931,390,242
Maryland 2015 Workers' Compensation Report Page 4 Exhibit 3
Maryland Workers' Compensation Market Share by Insurer Group
.
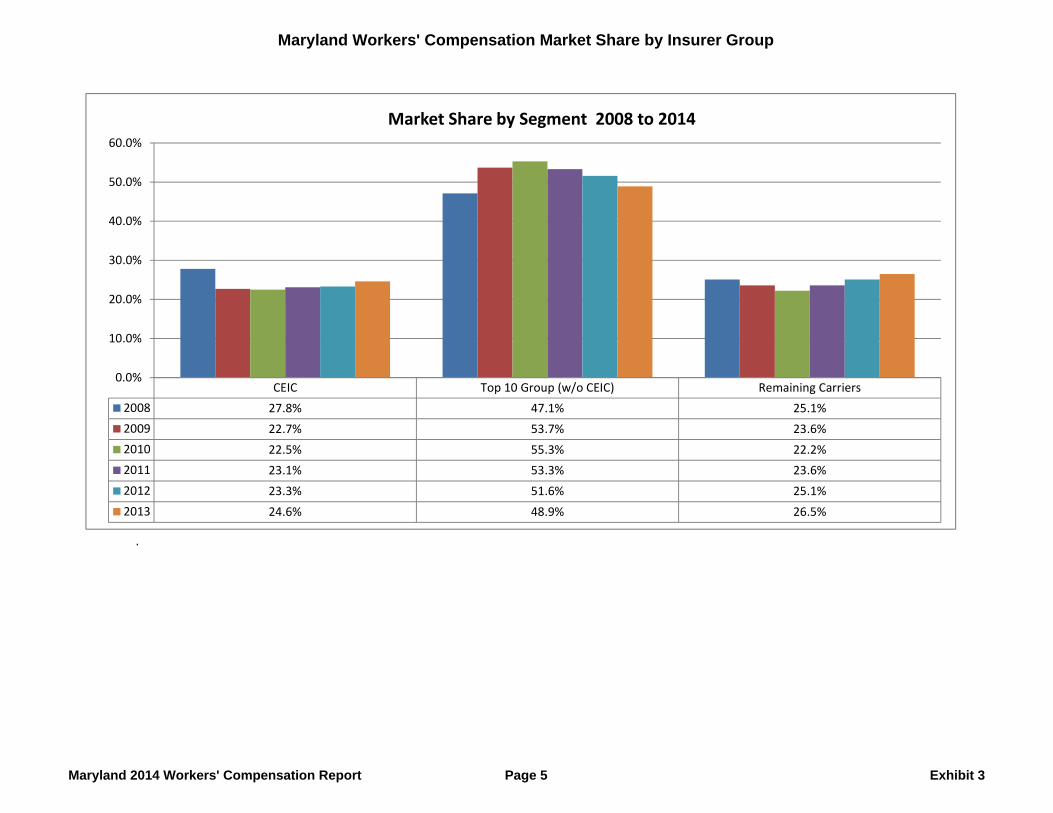
CEIC Top 10 Group (w/o CEIC) Remaining Carriers2008 27.8% 47.1% 25.1%2009 22.7% 53.7% 23.6%2010 22.5% 55.3% 22.2%2011 23.1% 53.3% 23.6%2012 23.3% 51.6% 25.1%2013 24.6% 48.9% 26.5%
0.0%
10.0%
20.0%
30.0%
40.0%
50.0%
60.0%
Market Share by Segment 2008 to 2014
Maryland 2014 Workers' Compensation Report Page 5 Exhibit 3
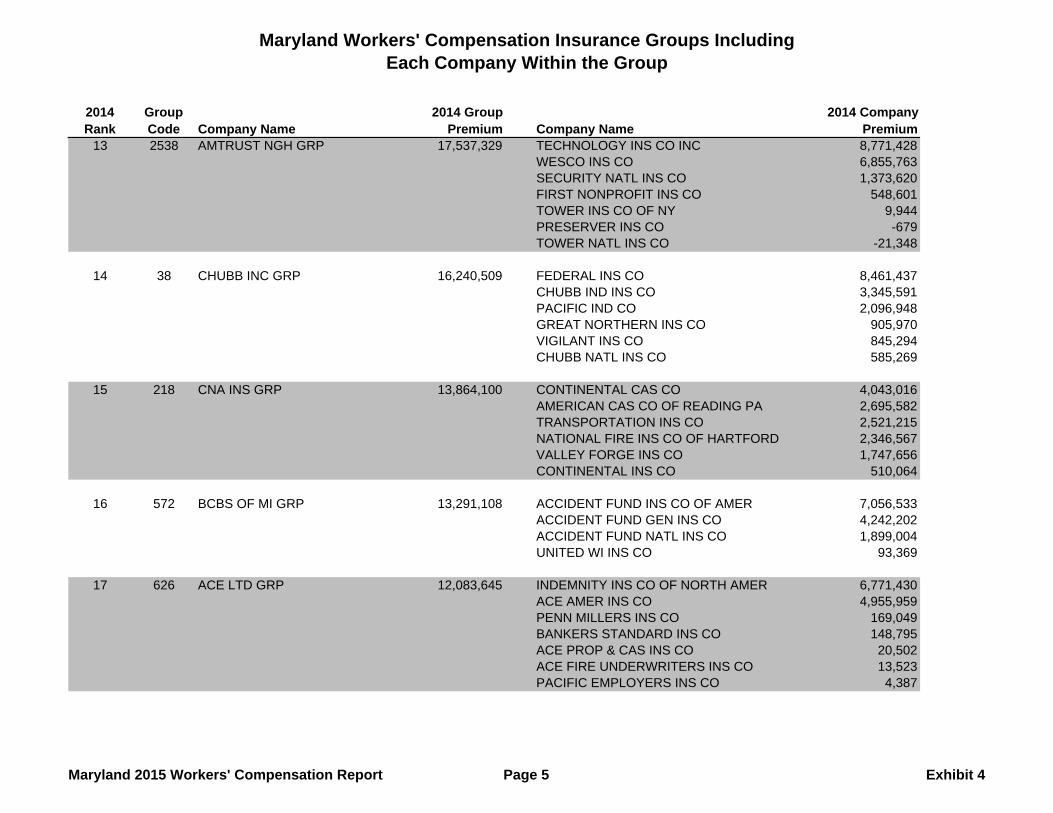
Maryland Workers' Compensation Insurance Groups IncludingEach Company Within the Group
2014 Rank
Group Code Company Name
2014 Group Premium Company Name
2014 Company Premium
1 0 CHESAPEAKE EMPLOYERS INS 221,398,826 CHESAPEAKE EMPLOYERS INS CO 221,398,826
2 91 HARTFORD FIRE & CAS GRP 108,316,093 TWIN CITY FIRE INS CO CO 21,176,563TRUMBULL INS CO 17,441,971HARTFORD UNDERWRITERS INS CO 15,578,663HARTFORD INS CO OF THE MIDWEST 13,754,064SENTINEL INS CO LTD 12,360,657HARTFORD ACCIDENT & IND CO 8,666,512PROPERTY & CAS INS CO OF HARTFORD 7,042,586HARTFORD FIRE IN CO 6,504,075HARTFORD CAS INS CO 5,791,002
3 3548 TRAVELERS GRP 66,288,698 TRAVELERS IND CO 14,458,963CHARTER OAK FIRE INS CO 9,921,254TRAVELERS CAS INS CO OF AMER 7,845,266STANDARD FIRE INS CO 7,542,147FARMINGTON CAS CO 6,879,276PHOENIX INS CO 6,062,642TRAVELERS CAS & SURETY CO 4,165,830TRAVELERS IND CO OF CT 3,254,707TRAVELERS PROP CAS CO OF AMER 2,943,843TRAVELERS IND CO OF AMER 2,617,796FIDELITY & GUAR INS UNDERWRITERS INC 437,199ST PAUL FIRE & MARINE INS CO 206,960DISCOVER PROP & CAS INS CO 7,205UNITED STATES FIDELITY & GUAR CO -24,953FIDELITY & GUAR INS CO -29,437
Maryland 2015 Workers' Compensation Report Page 1 Exhibit 4
Maryland Workers' Compensation Insurance Groups IncludingEach Company Within the Group
2014 Rank
Group Code Company Name
2014 Group Premium Company Name
2014 Company Premium
4 213 ERIE INS GRP 59,486,638 ERIE INS EXCH 25,095,603FLAGSHIP CITY INS CO 20,307,465ERIE INS CO OF NY 9,389,020ERIE INS CO 3,899,342ERIE INS PROP & CAS CO 795,208
5 212 ZURICH INS GRP 40,904,420 ZURICH AMER INS CO 23,369,956AMERICAN ZURICH INS CO 16,551,487ZURICH AMER INS CO OF IL 570,401AMERICAN GUAR & LIAB INS 431,347ASSURANCE CO OF AMER 49,673MARYLAND CAS CO -6,152NORTHERN INS CO OF NY -62,292
6 12 AMERICAN INTL GRP 40,325,473 NEW HAMPSHIRE INS CO 16,561,472INSURANCE CO OF THE STATE OF PA 6,324,122NATIONAL UNION FIRE INS CO OF PITTS 6,294,174COMMERCE & INDUSTRY INS CO 4,200,301GRANITE STATE INS CO 3,138,304AIG ASSUR CO 2,162,900AMERICAN HOME ASSUR CO 733,035ILLINOIS NATL INS CO 551,789AIG PROP CAS CO 336,716AIU INS CO 22,660
Maryland 2015 Workers' Compensation Report Page 2 Exhibit 4
Maryland Workers' Compensation Insurance Groups IncludingEach Company Within the Group
2014 Rank
Group Code Company Name
2014 Group Premium Company Name
2014 Company Premium
7 111 LIBERTY MUT GRP 39,389,592 LIBERTY INS CORP 11,697,311LIBERTY MUT FIRE INS CO 5,229,538AMERICAN FIRE & CAS CO 3,232,106NETHERLANDS INS CO THE 2,972,015FIRST LIBERTY INS CORP 2,839,584OHIO SECURITY INS CO 2,514,691PEERLESS INS CO 2,269,571LM INS CORP 2,265,273EXCELSIOR INS CO 1,947,982EMPLOYERS INS OF WAUSAU 1,670,421MONTGOMERY MUT INS CO 959,420WEST AMER INS CO 630,434OHIO CAS INS CO 624,489PEERLESS IND INS CO 134,477LIBERTY MUT INS CO 93,526AMERICAN ECONOMY INS CO 87,671AMERICAN STATES INS CO 79,193WAUSAU UNDERWRITERS INS CO 61,032GENERAL INS CO OF AMER 41,908WAUSAU BUSINESS INS CO 23,714FIRST NATL INS CO OF AMER 15,236
8 98 WR BERKLEY CORP GRP 28,277,616 STARNET INS CO 10,427,507KEY RISK INS CO 4,321,253FIREMENS INS CO OF WASHINGTON DC 3,903,208GREAT DIVIDE INS CO 2,570,669CONTINENTAL WESTERN INS CO 2,495,284CAROLINA CAS INS CO 1,924,350UNION INS CO 1,408,162ACADIA INS CO 632,645BERKLEY NATL INS CO 307,898AMERICAN MINING INS CO 219,946BERKLEY REGIONAL INS CO 46,859MIDWEST EMPLOYERS CAS CO 10,447TRI STATE INS CO OF MN 10,223RIVERPORT INS CO -835
Maryland 2015 Workers' Compensation Report Page 3 Exhibit 4
Maryland Workers' Compensation Insurance Groups IncludingEach Company Within the Group
2014 Rank
Group Code Company Name
2014 Group Premium Company Name
2014 Company Premium
9 150 OLD REPUBLIC GRP 21,020,947 PENNSYLVANIA MANUFACTURERS ASSOC IN 10,148,544OLD REPUBLIC INS CO 3,006,711MANUFACTURERS ALLIANCE INS CO 2,554,412OLD REPUBLIC GEN INS CORP 2,392,010GREAT WEST CAS CO 1,390,749PENNSYLVANIA MANUFACTURERS IND CO 787,398BITCO GEN INS CORP 469,193BITCO NATL INS CO 271,930
10 242 SELECTIVE INS GRP 20,359,266 SELECTIVE INS CO OF AMER 7,089,871SELECTIVE WAY INS CO 6,880,988SELECTIVE INS CO OF THE SOUTHEAST 4,113,916SELECTIVE INS CO OF SC 2,274,491
11 140 NATIONWIDE CORP GRP 17,681,201 NATIONWIDE PROP & CAS INS CO 3,949,313NATIONWIDE MUT FIRE INS CO 3,944,455NATIONWIDE MUT INS CO 2,331,284HARLEYSVILLE WORCESTER INS CO 1,894,023AMCO INS CO 1,379,321NATIONWIDE AGRIBUSINESS INS CO 1,017,527DEPOSITORS INS CO 891,947HARLEYSVILLE INS CO 690,421ALLIED PROP & CAS INS CO 548,284HARLEYSVILLE PREFERRED INS CO 512,976NATIONAL CAS CO 493,825FARMLAND MUT INS CO 27,825
12 31 BERKSHIRE HATHAWAY GRP 17,608,189 CONTINENTAL IND CO 6,016,412BERKSHIRE HATHAWAY HOMESTATE INS CO 5,459,883NORGUARD INS CO 3,258,242AMGUARD INS CO 2,591,956EASTGUARD INS CO 248,705NATIONAL LIAB & FIRE INS CO 32,991
Maryland 2015 Workers' Compensation Report Page 4 Exhibit 4
Maryland Workers' Compensation Insurance Groups IncludingEach Company Within the Group
2014 Rank
Group Code Company Name
2014 Group Premium Company Name
2014 Company Premium
13 2538 AMTRUST NGH GRP 17,537,329 TECHNOLOGY INS CO INC 8,771,428WESCO INS CO 6,855,763SECURITY NATL INS CO 1,373,620FIRST NONPROFIT INS CO 548,601TOWER INS CO OF NY 9,944PRESERVER INS CO -679TOWER NATL INS CO -21,348
14 38 CHUBB INC GRP 16,240,509 FEDERAL INS CO 8,461,437CHUBB IND INS CO 3,345,591PACIFIC IND CO 2,096,948GREAT NORTHERN INS CO 905,970VIGILANT INS CO 845,294CHUBB NATL INS CO 585,269
15 218 CNA INS GRP 13,864,100 CONTINENTAL CAS CO 4,043,016AMERICAN CAS CO OF READING PA 2,695,582TRANSPORTATION INS CO 2,521,215NATIONAL FIRE INS CO OF HARTFORD 2,346,567VALLEY FORGE INS CO 1,747,656CONTINENTAL INS CO 510,064
16 572 BCBS OF MI GRP 13,291,108 ACCIDENT FUND INS CO OF AMER 7,056,533ACCIDENT FUND GEN INS CO 4,242,202ACCIDENT FUND NATL INS CO 1,899,004UNITED WI INS CO 93,369
17 626 ACE LTD GRP 12,083,645 INDEMNITY INS CO OF NORTH AMER 6,771,430ACE AMER INS CO 4,955,959PENN MILLERS INS CO 169,049BANKERS STANDARD INS CO 148,795ACE PROP & CAS INS CO 20,502ACE FIRE UNDERWRITERS INS CO 13,523PACIFIC EMPLOYERS INS CO 4,387
Maryland 2015 Workers' Compensation Report Page 5 Exhibit 4
Maryland Workers' Compensation Insurance Groups IncludingEach Company Within the Group
2014 Rank
Group Code Company Name
2014 Group Premium Company Name
2014 Company Premium
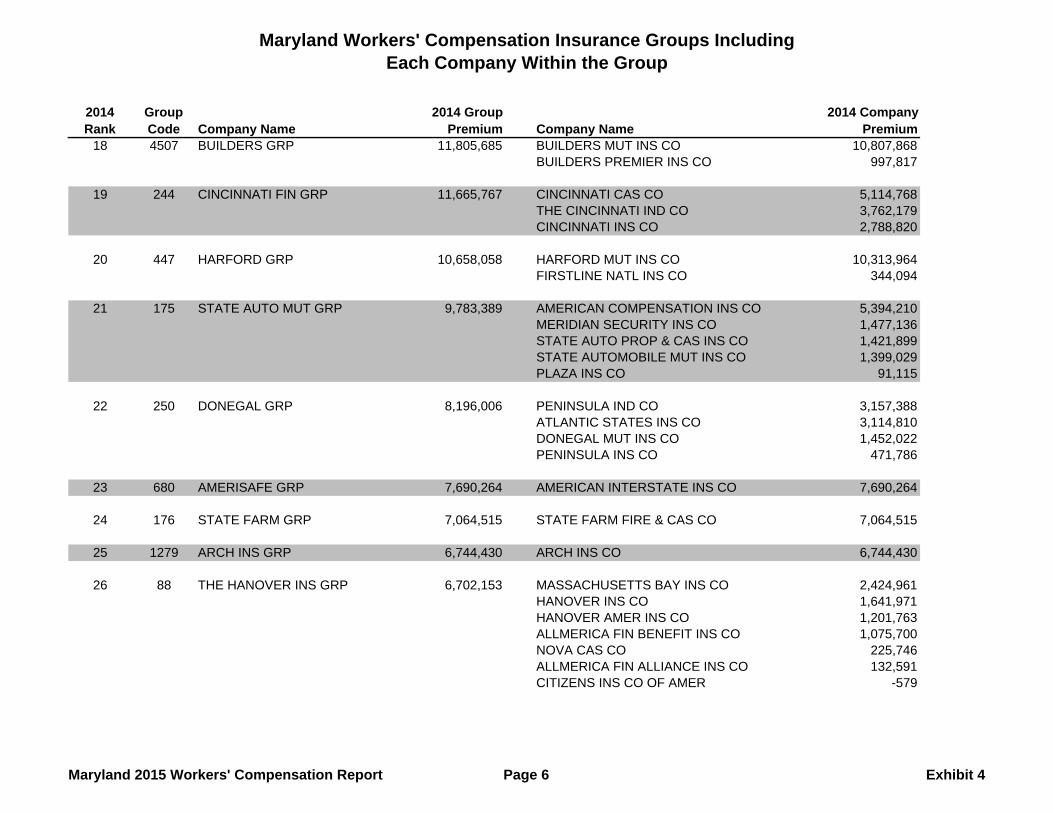
18 4507 BUILDERS GRP 11,805,685 BUILDERS MUT INS CO 10,807,868BUILDERS PREMIER INS CO 997,817
19 244 CINCINNATI FIN GRP 11,665,767 CINCINNATI CAS CO 5,114,768THE CINCINNATI IND CO 3,762,179CINCINNATI INS CO 2,788,820
20 447 HARFORD GRP 10,658,058 HARFORD MUT INS CO 10,313,964FIRSTLINE NATL INS CO 344,094
21 175 STATE AUTO MUT GRP 9,783,389 AMERICAN COMPENSATION INS CO 5,394,210MERIDIAN SECURITY INS CO 1,477,136STATE AUTO PROP & CAS INS CO 1,421,899STATE AUTOMOBILE MUT INS CO 1,399,029PLAZA INS CO 91,115
22 250 DONEGAL GRP 8,196,006 PENINSULA IND CO 3,157,388ATLANTIC STATES INS CO 3,114,810DONEGAL MUT INS CO 1,452,022PENINSULA INS CO 471,786
23 680 AMERISAFE GRP 7,690,264 AMERICAN INTERSTATE INS CO 7,690,264
24 176 STATE FARM GRP 7,064,515 STATE FARM FIRE & CAS CO 7,064,515
25 1279 ARCH INS GRP 6,744,430 ARCH INS CO 6,744,430
26 88 THE HANOVER INS GRP 6,702,153 MASSACHUSETTS BAY INS CO 2,424,961HANOVER INS CO 1,641,971HANOVER AMER INS CO 1,201,763ALLMERICA FIN BENEFIT INS CO 1,075,700NOVA CAS CO 225,746ALLMERICA FIN ALLIANCE INS CO 132,591CITIZENS INS CO OF AMER -579
Maryland 2015 Workers' Compensation Report Page 6 Exhibit 4
Maryland Workers' Compensation Insurance Groups IncludingEach Company Within the Group
2014 Rank
Group Code Company Name
2014 Group Premium Company Name
2014 Company Premium
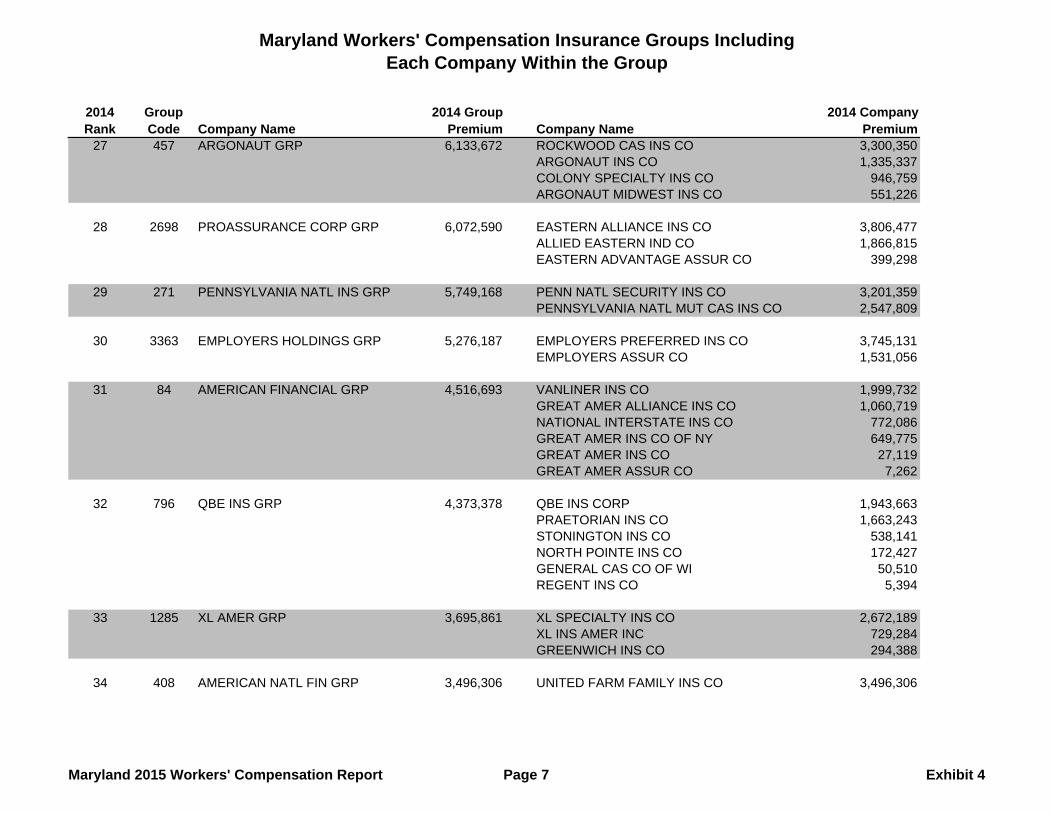
27 457 ARGONAUT GRP 6,133,672 ROCKWOOD CAS INS CO 3,300,350ARGONAUT INS CO 1,335,337COLONY SPECIALTY INS CO 946,759ARGONAUT MIDWEST INS CO 551,226
28 2698 PROASSURANCE CORP GRP 6,072,590 EASTERN ALLIANCE INS CO 3,806,477ALLIED EASTERN IND CO 1,866,815EASTERN ADVANTAGE ASSUR CO 399,298
29 271 PENNSYLVANIA NATL INS GRP 5,749,168 PENN NATL SECURITY INS CO 3,201,359PENNSYLVANIA NATL MUT CAS INS CO 2,547,809
30 3363 EMPLOYERS HOLDINGS GRP 5,276,187 EMPLOYERS PREFERRED INS CO 3,745,131EMPLOYERS ASSUR CO 1,531,056
31 84 AMERICAN FINANCIAL GRP 4,516,693 VANLINER INS CO 1,999,732GREAT AMER ALLIANCE INS CO 1,060,719NATIONAL INTERSTATE INS CO 772,086GREAT AMER INS CO OF NY 649,775GREAT AMER INS CO 27,119GREAT AMER ASSUR CO 7,262
32 796 QBE INS GRP 4,373,378 QBE INS CORP 1,943,663PRAETORIAN INS CO 1,663,243STONINGTON INS CO 538,141NORTH POINTE INS CO 172,427GENERAL CAS CO OF WI 50,510REGENT INS CO 5,394
33 1285 XL AMER GRP 3,695,861 XL SPECIALTY INS CO 2,672,189XL INS AMER INC 729,284GREENWICH INS CO 294,388
34 408 AMERICAN NATL FIN GRP 3,496,306 UNITED FARM FAMILY INS CO 3,496,306
Maryland 2015 Workers' Compensation Report Page 7 Exhibit 4
Maryland Workers' Compensation Insurance Groups IncludingEach Company Within the Group
2014 Rank
Group Code Company Name
2014 Group Premium Company Name
2014 Company Premium
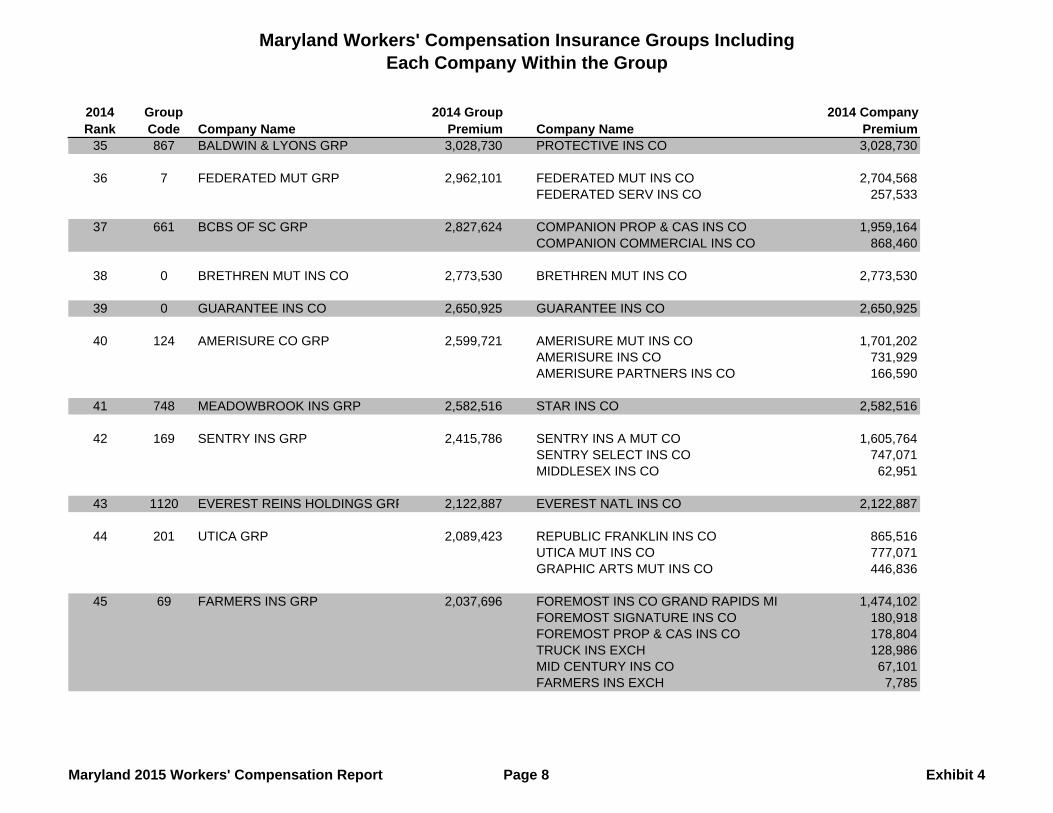
35 867 BALDWIN & LYONS GRP 3,028,730 PROTECTIVE INS CO 3,028,730
36 7 FEDERATED MUT GRP 2,962,101 FEDERATED MUT INS CO 2,704,568FEDERATED SERV INS CO 257,533
37 661 BCBS OF SC GRP 2,827,624 COMPANION PROP & CAS INS CO 1,959,164COMPANION COMMERCIAL INS CO 868,460
38 0 BRETHREN MUT INS CO 2,773,530 BRETHREN MUT INS CO 2,773,530
39 0 GUARANTEE INS CO 2,650,925 GUARANTEE INS CO 2,650,925
40 124 AMERISURE CO GRP 2,599,721 AMERISURE MUT INS CO 1,701,202AMERISURE INS CO 731,929AMERISURE PARTNERS INS CO 166,590
41 748 MEADOWBROOK INS GRP 2,582,516 STAR INS CO 2,582,516
42 169 SENTRY INS GRP 2,415,786 SENTRY INS A MUT CO 1,605,764SENTRY SELECT INS CO 747,071MIDDLESEX INS CO 62,951
43 1120 EVEREST REINS HOLDINGS GRP 2,122,887 EVEREST NATL INS CO 2,122,887
44 201 UTICA GRP 2,089,423 REPUBLIC FRANKLIN INS CO 865,516UTICA MUT INS CO 777,071GRAPHIC ARTS MUT INS CO 446,836
45 69 FARMERS INS GRP 2,037,696 FOREMOST INS CO GRAND RAPIDS MI 1,474,102FOREMOST SIGNATURE INS CO 180,918FOREMOST PROP & CAS INS CO 178,804TRUCK INS EXCH 128,986MID CENTURY INS CO 67,101FARMERS INS EXCH 7,785
Maryland 2015 Workers' Compensation Report Page 8 Exhibit 4
Maryland Workers' Compensation Insurance Groups IncludingEach Company Within the Group
2014 Rank
Group Code Company Name
2014 Group Premium Company Name
2014 Company Premium
46 640 MUTUAL BENEFIT GRP 2,012,577 MUTUAL BENEFIT INS CO 1,613,483SELECT RISK INS CO 399,094
47 228 WESTFIELD GRP 1,961,338 WESTFIELD INS CO 1,409,311WESTFIELD NATL INS CO 458,739AMERICAN SELECT INS CO 93,288
48 158 FAIRFAX FIN GRP 1,873,242 UNITED STATES FIRE INS CO 876,260ZENITH INS CO 552,788NORTH RIVER INS CO 313,137CRUM & FORSTER IND CO 70,861SENECA INS CO INC 60,196
49 3098 TOKIO MARINE HOLDINGS INC G 1,803,314 SAFETY NATL CAS CORP 1,262,349TOKIO MARINE AMER INS CO 329,868TNUS INS CO 116,186TRANS PACIFIC INS CO 81,327SAFETY FIRST INS CO 13,584
50 311 MAIN STREET AMER GRP 1,731,455 NGM INS CO 1,731,455
51 1332 MAINE EMPLOYERS MUT INS GR 1,683,346 MEMIC IND CO 1,683,252MAINE EMPLOYERS MUT INS CO 94
52 0 BROTHERHOOD MUT INS CO 1,666,928 BROTHERHOOD MUT INS CO 1,666,928
53 4715 MS & AD INS GRP 1,399,691 MITSUI SUMITOMO INS CO OF AMER 1,385,397MITSUI SUMITOMO INS USA INC 14,294
54 517 HANNOVER GRP 1,374,775 HDI GERLING AMER INS CO 1,374,775
55 4670 STARR GRP 1,316,972 STARR IND & LIAB CO 1,316,972
Maryland 2015 Workers' Compensation Report Page 9 Exhibit 4
Maryland Workers' Compensation Insurance Groups IncludingEach Company Within the Group
2014 Rank
Group Code Company Name
2014 Group Premium Company Name
2014 Company Premium
56 474 FCCI MUT INS GRP 1,311,117 FCCI INS CO 794,033NATIONAL TRUST INS CO 498,607MONROE GUAR INS CO 18,477
57 1129 WHITE MOUNTAINS GRP 1,199,898 ATLANTIC SPECIALTY INS CO 1,179,469OBI NATL INS CO 20,429
58 57 ELECTRIC INS GRP 1,151,681 ELECTRIC INS CO 1,151,681
59 0 CHURCH MUT INS CO 1,134,233 CHURCH MUT INS CO 1,134,233
60 761 ALLIANZ INS GRP 876,596 ASSOCIATED IND CORP 422,930NATIONAL SURETY CORP 190,715AMERICAN INS CO 157,454FIREMANS FUND INS CO 75,123AMERICAN AUTOMOBILE INS CO 30,374
61 62 EMC INS CO GRP 758,655 EMCASCO INS CO 618,570EMPLOYERS MUT CAS CO 140,085
62 812 HIGHMARK GRP 634,591 HIGHMARK CAS INS CO 634,591
63 0 SOUTHERN STATES INS EXCH 565,471 SOUTHERN STATES INS EXCH 565,471
64 349 FLORISTS MUT GRP 557,780 FLORISTS MUT INS CO 557,780
65 4725 ENSTAR GRP 464,824 SEABRIGHT INS CO 464,824
66 785 MARKEL CORP GRP 422,084 MARKEL INS CO 422,084
67 3219 SOMPO JAPAN NIPPONKOA HOL 416,956 SOMPO JAPAN INS CO OF AMER 416,956
68 594 AMERICAN CONTRACTORS INS G 373,654 ACIG INS CO 373,654
Maryland 2015 Workers' Compensation Report Page 10 Exhibit 4
Maryland Workers' Compensation Insurance Groups IncludingEach Company Within the Group
2014 Rank
Group Code Company Name
2014 Group Premium Company Name
2014 Company Premium
69 303 GUIDEONE INS GRP 364,136 GUIDEONE MUT INS CO 299,217GUIDEONE SPECIALTY MUT INS CO 64,919
70 256 PROSIGHT GRP 354,921 NEW YORK MARINE & GEN INS CO 354,921
71 4381 HOUSTON INTL INS GRP 237,373 IMPERIUM INS CO 237,373
72 0 CHEROKEE INS CO 235,727 CHEROKEE INS CO 235,727
73 361 MUNICH RE GRP 202,961 AMERICAN ALT INS CORP 128,207AMERICAN FAMILY HOME INS CO 58,885AMERICAN MODERN HOME INS CO 15,869
74 0 T H E INS CO 190,881 T H E INS CO 190,881
75 1302 BUILDERS INS GRP 164,292 ASSOCIATION INS CO 160,656VININGS INS CO 3,636
76 0 LION INS CO 163,016 LION INS CO 163,016
77 0 FRANK WINSTON CRUM INS CO 152,369 FRANK WINSTON CRUM INS CO 152,369
78 775 PHARMACISTS MUT GRP 146,994 PHARMACISTS MUT INS CO 146,994
79 0 BENCHMARK INS CO 146,028 BENCHMARK INS CO 146,028
80 0 LUMBERMENS UNDERWRITING A 119,690 LUMBERMENS UNDERWRITING ALLIANCE 119,690
81 225 IAT REINS CO GRP 108,542 TRANSGUARD INS CO OF AMER INC 108,542
82 0 ADVANTAGE WORKERS COMP IN 103,998 ADVANTAGE WORKERS COMP INS CO 103,998
Maryland 2015 Workers' Compensation Report Page 11 Exhibit 4

Maryland Workers' Compensation Insurance Groups IncludingEach Company Within the Group
2014 Rank
Group Code Company Name
2014 Group Premium Company Name
2014 Company Premium
83 853 PUBLIC SERV GRP 102,575 PUBLIC SERV INS CO 102,575
84 783 RLI INS GRP 99,127 RLI INS CO 99,127
85 922 AMERICAN ASSETS GRP 82,564 INSURANCE CO OF THE WEST 82,564
86 222 GREATER NY GRP 77,761 GREATER NY MUT INS CO 77,761
87 4829 TREBUCHET INS GRP 77,482 BEDIVERE INS CO 48,018EMPLOYERS FIRE INS CO 43,477ONEBEACON AMER INS CO -14,013
88 553 ARROWPOINT CAPITAL GRP 67,696 ARROWOOD IND CO 67,696
89 0 SAMSUNG FIRE & MARINE INS C 29,760 SAMSUNG FIRE & MARINE INS CO LTD 29,760
90 0 FEDERATED RURAL ELECTRIC I 16,048 FEDERATED RURAL ELECTRIC INS EXCH 16,048
91 0 WORK FIRST CAS CO 7,077 WORK FIRST CAS CO 7,077
92 93 STATE NATL GRP 4,372 STATE NATL INS CO INC 4,372
Maryland 2015 Workers' Compensation Report Page 12 Exhibit 4
Maryland Workers' Compensation Insurance Groups IncludingEach Company Within the Group
2014 Rank
Group Code Company Name
2014 Group Premium Company Name
2014 Company Premium
93 0 PETROLEUM CAS CO 315 PETROLEUM CAS CO 315
94 0 NATIONAL AMER INS CO 262 NATIONAL AMER INS CO 262
95 3494 JAMES RIVER GRP 208 FALLS LAKE NATL INS CO 208
96 1154 COVERYS GRP -156 PREFERRED PROFESSIONAL INS CO -156
97 4795 ATLAS FINANCIAL HOLDINGS GR -6,300 GATEWAY INS CO -6,300
98 3489 DELEK GRP -9,247 SOUTHERN INS CO -9,247
99 4746 CATALINA HOLDINGS GRP -330,119 SPARTA INS CO -330,119
Maryland 2015 Workers' Compensation Report Page 13 Exhibit 4
Maryland Excess Workers' Compensation Insurers Including Each Company Within the Group
2014 Rank
Group Code Insurer Group Name
2014 Group Premium Company Name
2014 Written
Premium1 3098 TOKIO MARINE HOLDINGS INC GRP 7,763,930 SAFETY NATL CAS CORP 7,763,930
2 1279 ARCH INS GRP 811,411 ARCH INS CO 811,411
3 212 ZURICH INS GRP 783,824 ZURICH AMER INS CO 783,824
4 93 STATE NATL GRP 532,243 STATE NATL INS CO INC 532,243
5 12 AMERICAN INTL GRP 520,222 NATIONAL UNION FIRE INS CO OF PITT 520,222
6 626 ACE LTD GRP 426,816 ACE AMER INS CO 426,816
7 256 PROSIGHT GRP 387,627 NEW YORK MARINE & GEN INS CO 387,627
8 111 LIBERTY MUT GRP 244,310 LM INS CORP 244,310
9 3548 TRAVELERS GRP 202,079 TRAVELERS PROP CAS CO OF AMER 202,079
10 91 HARTFORD FIRE & CAS GRP 186,900 HARTFORD CAS INS CO 186,900
11 1285 XL AMER GRP 80,897 XL SPECIALTY INS CO 80,897
12 150 OLD REPUBLIC GRP 56,237 OLD REPUBLIC INS CO 56,237
13 748 MEADOWBROOK INS GRP 23,454 STAR INS CO 23,454
14 38 CHUBB INC GRP 9,818 GREAT NORTHERN INS CO 5,420FEDERAL INS CO 4,379PACIFIC IND CO 19
15 1208 GRAY INS GRP 5,447 GRAY INS CO 5,447
INDUSTRY TOTALS 12,035,215
Maryland 2015 Workers' Compensation Report Exhibit 4A
Industry information includes CEIC. Numbers may not add up exactly due to rounding.
2003 2004 2005 2006 2007 2008 2009 2010 2011 2012 2013 2014Industry 788 875 966 995 944 868 703 709 741 835 890 931CEIC 258 300 320 308 263 216 160 159 171 195 219 221w/o CEIC 530 575 645 687 681 652 544 550 570 640 670 710
0
200
400
600
800
1000
1200
Maryland Industry vs CEIC Written Premium for 2003 through 2014 (in millions)
Maryland 2015 Workers' Compensation Report Page 1 Exhibit 5
2003 2004 2005 2006 2007 2008 2009 2010 2011 2012 2013 2014Top 8 68.2% 74.2% 74.0% 73.3% 72.5% 72.3% 69.0% 70.8% 68.6% 68.4% 67.0% 64.9%Top 8 (w/o CEIC) 35.5% 39.9% 40.8% 42.3% 44.6% 47.4% 46.3% 48.3% 45.5% 45.1% 42.4% 43.4%CEIC 32.7% 34.3% 33.2% 31.0% 27.8% 24.9% 22.7% 22.5% 23.1% 23.3% 24.6% 23.8%
0.0%
10.0%
20.0%
30.0%
40.0%
50.0%
60.0%
70.0%
80.0%
Maryland Market Share of Top 8 Carriers - with and without CEIC
Maryland 2015 Workers' Compensation Report Page 2 Exhibit 5
Maryland
RE-ENTRANTS2014
Group Code
2014 Company
Code 2014 Company Name 2014 Premium12 19380 AMERICAN HOME ASSUR CO 733,03512 19402 AIG PROP CAS CO 336,7160 41394 BENCHMARK INS CO 146,028
175 30945 PLAZA INS CO 91,11598 23612 MIDWEST EMPLOYERS CAS CO 10,447
2538 44300 TOWER INS CO OF NY 9,944626 22748 PACIFIC EMPLOYERS INS CO 4,3870 12297 PETROLEUM CAS CO 315
NEW ENTRANTS2014
Group Code
2014 Company
Code 2014 Company Name 2014 Premium124 11050 AMERISURE PARTNERS INS CO 166,59088 10212 ALLMERICA FIN ALLIANCE INS CO 132,591361 23450 AMERICAN FAMILY HOME INS CO 58,88531 20052 NATIONAL LIAB & FIRE INS CO 32,99112 19399 AIU INS CO 22,660361 23469 AMERICAN MODERN HOME INS CO 15,8693548 36463 DISCOVER PROP & CAS INS CO 7,20593 12831 STATE NATL INS CO INC 4,372
3494 31925 FALLS LAKE NATL INS CO 2081332 11149 MAINE EMPLOYERS MUT INS CO 94
Maryland 2015 Workers' Compensation Report Exhibit 6
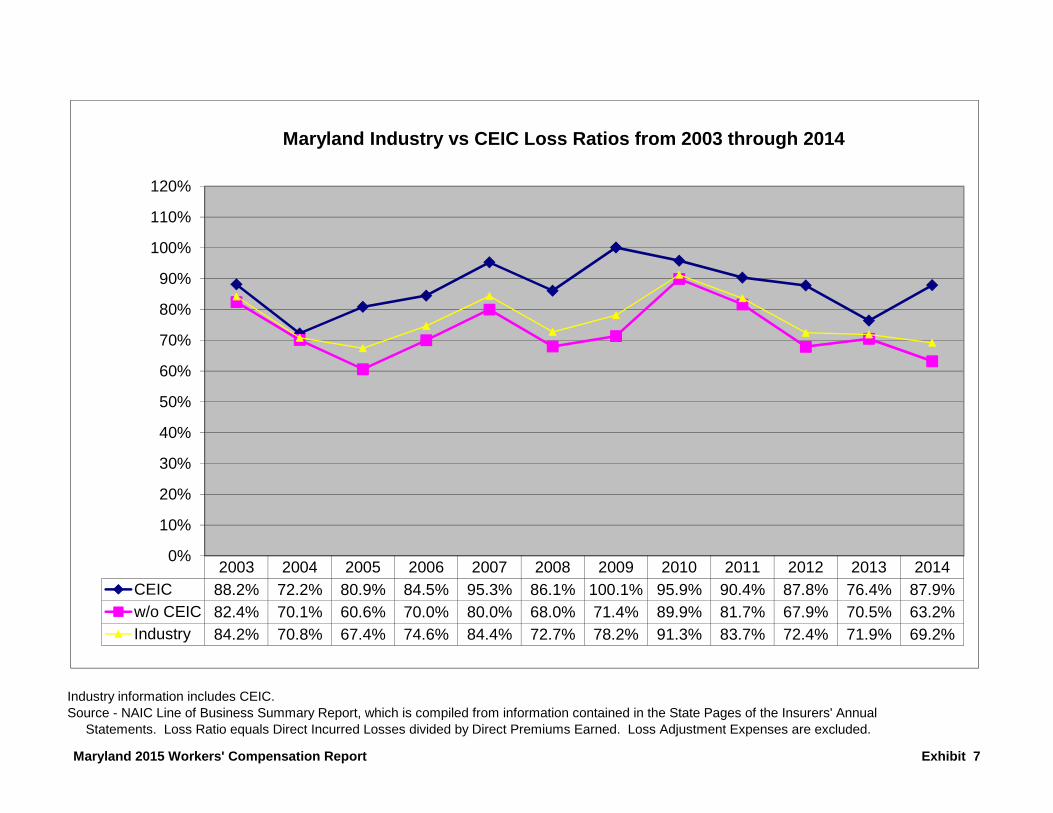
Industry information includes CEIC. Source - NAIC Line of Business Summary Report, which is compiled from information contained in the State Pages of the Insurers' Annual Statements. Loss Ratio equals Direct Incurred Losses divided by Direct Premiums Earned. Loss Adjustment Expenses are excluded.
2003 2004 2005 2006 2007 2008 2009 2010 2011 2012 2013 2014CEIC 88.2% 72.2% 80.9% 84.5% 95.3% 86.1% 100.1% 95.9% 90.4% 87.8% 76.4% 87.9%w/o CEIC 82.4% 70.1% 60.6% 70.0% 80.0% 68.0% 71.4% 89.9% 81.7% 67.9% 70.5% 63.2%Industry 84.2% 70.8% 67.4% 74.6% 84.4% 72.7% 78.2% 91.3% 83.7% 72.4% 71.9% 69.2%
0%
10%
20%
30%
40%
50%
60%
70%
80%
90%
100%
110%
120%
Maryland Industry vs CEIC Loss Ratios from 2003 through 2014
Maryland 2015 Workers' Compensation Report Exhibit 7
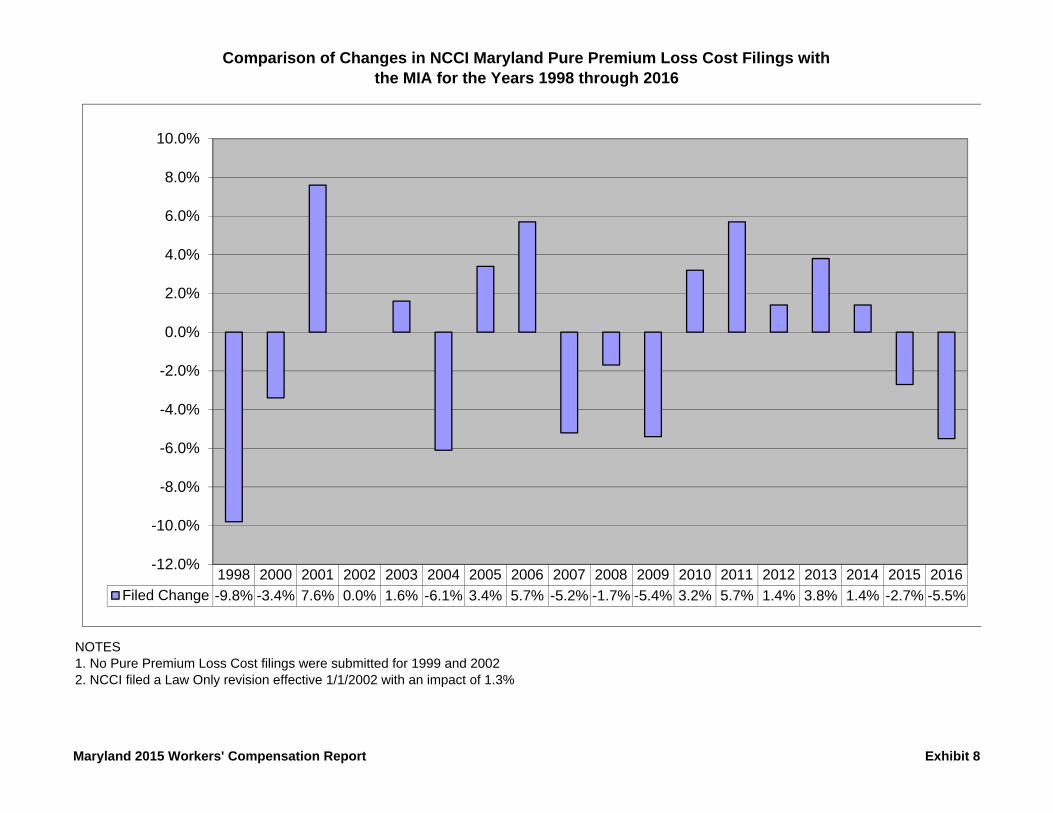
Comparison of Changes in NCCI Maryland Pure Premium Loss Cost Filings withthe MIA for the Years 1998 through 2016
NOTES1. No Pure Premium Loss Cost filings were submitted for 1999 and 20022. NCCI filed a Law Only revision effective 1/1/2002 with an impact of 1.3%
1998 2000 2001 2002 2003 2004 2005 2006 2007 2008 2009 2010 2011 2012 2013 2014 2015 2016Filed Change -9.8% -3.4% 7.6% 0.0% 1.6% -6.1% 3.4% 5.7% -5.2% -1.7% -5.4% 3.2% 5.7% 1.4% 3.8% 1.4% -2.7% -5.5%
-12.0%
-10.0%
-8.0%
-6.0%
-4.0%
-2.0%
0.0%
2.0%
4.0%
6.0%
8.0%
10.0%
Maryland 2015 Workers' Compensation Report Exhibit 8
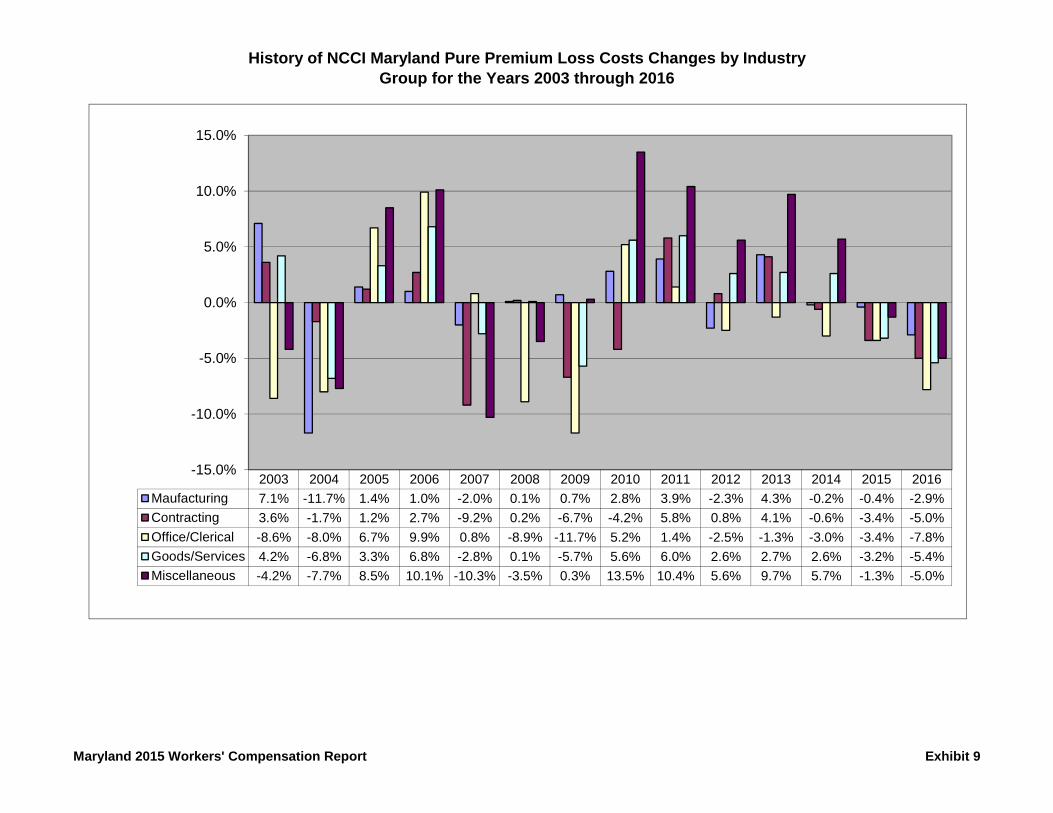
History of NCCI Maryland Pure Premium Loss Costs Changes by IndustryGroup for the Years 2003 through 2016
2003 2004 2005 2006 2007 2008 2009 2010 2011 2012 2013 2014 2015 2016Maufacturing 7.1% -11.7% 1.4% 1.0% -2.0% 0.1% 0.7% 2.8% 3.9% -2.3% 4.3% -0.2% -0.4% -2.9%Contracting 3.6% -1.7% 1.2% 2.7% -9.2% 0.2% -6.7% -4.2% 5.8% 0.8% 4.1% -0.6% -3.4% -5.0%Office/Clerical -8.6% -8.0% 6.7% 9.9% 0.8% -8.9% -11.7% 5.2% 1.4% -2.5% -1.3% -3.0% -3.4% -7.8%Goods/Services 4.2% -6.8% 3.3% 6.8% -2.8% 0.1% -5.7% 5.6% 6.0% 2.6% 2.7% 2.6% -3.2% -5.4%Miscellaneous -4.2% -7.7% 8.5% 10.1% -10.3% -3.5% 0.3% 13.5% 10.4% 5.6% 9.7% 5.7% -1.3% -5.0%
-15.0%
-10.0%
-5.0%
0.0%
5.0%
10.0%
15.0%
Maryland 2015 Workers' Compensation Report Exhibit 9
Largest Payroll Classes by Industry Group for Maryland(payroll information only available through 1st quarter 2013)
Largest Manufacturing Classes
Latest Available
Payroll
1/1/2016 Loss Cost
Change from
2005 to 2015
Change from
2014 to 2015
% of Statewide
Payroll
% Change in Payroll from 2012
to 2013TELEVISION, RADIO, TELEPHONE OR TELECOMMUNICATION DEVICE MFG NOC 211,817,112 0.73 37.7% 0.0% 0.27% -8.2%FOOD PRODUCTS MFG. NOC 172,317,182 2.08 11.8% 0.0% 0.22% 10.4%INSTRUMENT MFG NOC 143,188,457 0.95 53.2% -15.9% 0.18% 47.5%PRINTING 135,837,737 1.89 17.4% -0.5% 0.17% -7.7%SILK THREAD OR YARN MFG 135,220,466 1.72 59.3% -12.7% 0.17% 188.6%BAKERY & DRIVERS, ROUTE SUPERVISORS 131,333,052 4.97 110.6% 11.7% 0.17% -2.6%MACHINE SHOP NOC 126,003,265 2.10 -11.0% -13.9% 0.16% 5.6%DRUG, MEDICINE OR PHARMACEUTICAL PREPARATION, COMPOUNDING, OR B 118,232,182 0.82 -24.8% 2.5% 0.15% -2.1%AIRPLANE MFG 116,225,042 0.90 -15.1% -13.5% 0.15% -45.9%PLASTICS MANUFACTURING: MOLDED PRODUCTS NOC 99,676,482 1.76 -21.8% 2.9% 0.13% 1.5%SHEET METAL PRODUCTS MFG. - SHOP ONLY 96,821,873 2.34 1.3% -7.1% 0.12% 1.7%CHEMICAL MANUFACTURING NOC-ALL OPERATIONS & DRIVERS 69,282,624 2.53 158.2% -2.7% 0.09% 8.2%BOTTLING-ALL OPERATIONS & ROUTE SUPERVISORS, DRIVERS 66,302,641 3.75 -27.6% -3.4% 0.08% -2.8%AUTOMOBILE ENGINE MFG 63,164,975 1.82 106.8% -2.2% 0.08% -5.2%COMPUTING, RECORDING OR OFFICE MACHINE MFG NOC 62,162,296 0.75 -21.1% -13.8% 0.08% -62.5%LAUNDRY NOC & ROUTE SUPERVISORS, DRIVERS 55,824,610 3.74 37.0% -2.6% 0.07% -4.2%ELECTRICAL APPARATUS MFG NOC 54,890,595 1.47 -24.6% -10.4% 0.07% -21.0%ICE CREAM MFG & DRIVERS 54,377,692 1.71 -37.1% 0.0% 0.07% -13.3%PRECISION MACHINED PARTS MFG NOC 53,651,044 1.46 24.8% 5.8% 0.07% -4.0%SERUM, ANTI-TOXIN OR VIRUS MFG & DRIVERS 53,620,232 0.40 -2.4% -13.0% 0.07% -25.0%PAPER MFG 49,962,642 4.14 -3.9% -1.4% 0.06% 0.7%AIRCRAFT ENGINE MFG 44,365,062 1.11 -35.1% -9.0% 0.06% -3.5%EXPLOSIVES OR AMMUNITION MFG: NOC & DRIVERS 44,121,179 2.38 -0.8% 1.3% 0.06% -17.2%FURNITURE MANUFACTURING AND CABINET SHOP - WOOD - NOC 42,797,325 2.77 3.0% -1.8% 0.05% 1.8%DRUG, MEDICINE OR PHARMACEUTICAL PREPARATION MFG & INCLUDES MFG 42,553,832 0.69 -16.9% -2.8% 0.05% 10.5%CLOTH, CANVAS AND RELATED PRODUCTS MFG. NOC 41,172,749 1.92 11.0% -5.0% 0.05% -33.2%PHARMACEUTICAL OR SURGICAL GOODS MFG NOC 40,540,696 0.72 -4.0% -8.9% 0.05% -23.3%CARPENTRY-SHOP ONLY-& DRIVERS 35,604,023 3.81 2.4% 20.2% 0.04% 14.9%CREAMERY & ROUTE SUPERVISORS, DRIVERS 32,600,783 4.35 15.7% -6.5% 0.04% 14.3%LAUNDRY AND DRY CLEANING STORE-RETAIL-& ROUTE SUPERVISORS, DRIVE 32,311,289 1.51 1.3% 4.1% 0.04% 1.3%CONSTRUCTION OR AGRICULTURAL MACHINERY MFG 28,533,135 2.24 -3.9% -25.3% 0.04% 28.2%SUGAR MANUFACTURING OR REFINING FROM SUGAR CANE OR SUGAR BEETS 26,852,188 3.99 29.5% -6.1% 0.03% 0.0%CEMENT MFG 25,906,373 3.23 33.5% -11.7% 0.03% -8.6%PAINT MFG 25,557,506 1.38 -12.1% -6.8% 0.03% -0.8%CORRUGATED OR FIBER BOARD CONTAINER MFG 24,262,937 2.60 -40.5% -6.8% 0.03% -0.3%CONCRETE PRODUCTS MFG & DRIVERS 24,147,217 6.86 -4.2% -1.3% 0.03% 16.1%
Maryland 2015 Workers' Compensation Report Page 1 Exhibit 10
Largest Payroll Classes by Industry Group for Maryland(payroll information only available through 1st quarter 2013)
Largest Manufacturing Classes
Latest Available
Payroll
1/1/2016 Loss Cost
Change from
2005 to 2015
Change from
2014 to 2015
% of Statewide
Payroll
% Change in Payroll from 2012
to 2013ELECTRIC POWER OR TRANSMISSION EQUIPMENT MFG 23,904,781 2.42 26.7% -5.1% 0.03% -6.7%OXYGEN OR HYDROGEN MFG & DRIVERS 22,852,484 2.97 65.9% -5.7% 0.03% -6.1%SOAP OR SYNTHETIC DETERGENT MFG 22,197,875 1.93 22.9% -2.0% 0.03% -2.8%FURNITURE MANUFACTURING AND CABINET SHOP - ASSEMBLY BY HAND - WO 21,417,168 1.86 2.2% 0.0% 0.03% -4.9%WIRE GOODS MFG NOC 21,404,208 3.04 21.1% -8.7% 0.03% 44.5%FABRIC COATING OR IMPREGNATING NOC 21,239,054 1.87 -25.5% 2.7% 0.03% 11.3%PLASTICS MFG: FABRICATED PRODUCTS NOC 20,608,367 2.63 6.0% 4.8% 0.03% -2.3%HOUSE FURNISHINGS INSTALLATION NOC & UPHOLSTERING 19,812,234 3.67 22.7% 5.8% 0.02% 7.0%IRON OR STEEL: FABRICATION: IRON WORKS-SHOP-ORNAMENTAL-& DRIVERS 19,189,673 5.92 6.7% -6.0% 0.02% 10.7%NEWSPAPER PUBLISHING 19,105,032 3.52 63.0% 12.5% 0.02% -22.5%POTATO CHIP, POPCORN & SNACK CHIP MFG. NOC 17,853,268 1.00 (3) -14.5% 0.02% 13.7%MEAT PRODUCTS MFG NOC 17,320,245 3.18 -0.6% -5.6% 0.02% -15.9%CAN MFG 16,903,410 1.47 -44.9% -17.4% 0.02% 12.2%OPTICAL GOODS MFG. NOC 15,797,660 0.55 (3) 1.9% 0.02% 31.3%VALVE MFG 14,640,035 1.31 -24.3% -9.7% 0.02% 0.2%PAINTING: SHOP ONLY & DRIVERS 14,636,932 2.17 -3.6% -6.5% 0.02% 16.5%METAL STAMPED GOODS MFG NOC 14,508,655 2.84 -8.1% -0.7% 0.02% 7.6%IRON OR STEEL: FABRICATION: IRON OR STEEL WORKS-SHOP-STRUCTURAL-& 13,713,303 7.19 -8.5% -9.8% 0.02% -4.1%BUILDING OR ROOFING PAPER OR FELT PREPARATION-NO INSTALLATION 13,161,655 1.61 -46.2% -27.8% 0.02% 24.6%KNIT GOODS MFG NOC 13,055,450 1.15 -12.2% 0.9% 0.02% 15.2%PUMP MFG 12,597,646 1.56 0.6% -1.3% 0.02% 1.9%ASPHALT WORKS OPERATED BY PAVING CONTRACTORS - PERMANENT LOCAT 12,438,614 6.88 -20.9% 4.7% 0.02% 13.2%GEAR MFG OR GRINDING 12,015,213 1.92 -17.9% -10.3% 0.02% 42.5%DENTAL LABORATORY 11,851,182 0.54 25.6% 1.9% 0.01% 1.7%SPIRITUOUS LIQUOR BOTTLING 11,780,259 5.26 48.6% -3.5% 0.01% -33.4%CHEMICAL BLENDING AND MIXING NOC-ALL OPERATIONS & DRIVERS 11,411,333 1.64 62.4% -7.9% 0.01% -1.0%ASPHALT OR TAR DISTILLING OR REFINING & DRIVERS 10,609,835 1.82 38.9% -3.2% 0.01% -5.3%MATTRESS OR BOX SPRING MFG 10,276,367 2.65 -36.0% -10.2% 0.01% 2.5%PLASTER BOARD OR PLASTER BLOCK MFG & DRIVERS 9,929,958 1.52 -19.1% 5.6% 0.01% 0.5%BATTERY MFG-STORAGE 9,915,571 1.47 26.7% -13.5% 0.01% 19.9%GLASS MERCHANT 9,295,062 3.53 -10.2% -11.3% 0.01% 0.1%PAPER GOODS MFG NOC 8,672,506 2.00 60.0% -5.2% 0.01% -12.9%STONE CUTTING OR POLISHING NOC & DRIVERS 8,358,631 9.06 71.6% 8.2% 0.01% 2.5%MILK PRODUCTS MFG NOC 8,240,956 2.60 -40.8% -22.2% 0.01% 6.7%OIL REFINING-PETROLEUM-& DRIVERS 8,136,819 4.60 95.7% 15.3% 0.01% 20.0%ELECTRIC BULB MFG 7,961,878 1.15 (3) 9.5% 0.01% 4.5%
Maryland 2015 Workers' Compensation Report Page 2 Exhibit 10
Largest Payroll Classes by Industry Group for Maryland(payroll information only available through 1st quarter 2013)
Largest Manufacturing Classes
Latest Available
Payroll
1/1/2016 Loss Cost
Change from
2005 to 2015
Change from
2014 to 2015
% of Statewide
Payroll
% Change in Payroll from 2012
to 2013RUBBER GOODS MFG NOC 7,862,667 2.85 -36.7% -0.7% 0.01% -1.3%UPHOLSTERING 7,760,451 1.55 46.2% -4.9% 0.01% -1.0%CANNERY NOC 7,087,124 2.75 40.3% 5.8% 0.01% 7.6%BOOKBINDING 6,996,126 1.93 -0.5% 11.6% 0.01% -13.5%CANDY, CHOCOLATE AND CONFECTION MFG 6,845,215 2.30 -15.1% -7.3% 0.01% 1.8%PLASTICS MFG: SHEETS, RODS, OR TUBES 6,746,527 3.30 37.5% -11.1% 0.01% 58.9%HARDWARE MFG NOC 6,609,276 1.84 -46.0% -24.6% 0.01% -74.0%AUTOMOBILE, BUS, TRUCK OR TRAILER BODY MFG: NOC 6,439,766 4.15 -1.0% -5.7% 0.01% 3.5%CABLE MFG-INSULATED ELECTRICAL 6,436,579 1.91 36.4% 21.7% 0.01% -11.0%CLEANING OR DYEING & ROUTE SUPERVISORS, DRIVERS 6,328,899 1.65 87.5% -12.7% 0.01% 5.5%POTTERY MFG: PORCELAIN WARE-MECHANICAL PRESS FORMING 6,302,698 3.26 0.3% 21.6% 0.01% 219.4%BAG MFG. - PLASTIC OR PAPER 5,586,584 1.71 -8.1% -9.5% 0.01% 6.9%GRAIN OR FEED MILLING 4,951,429 5.63 8.3% -2.9% 0.01% 5.6%FRUIT JUICE MFG & DRIVERS 4,849,591 2.52 12.0% -24.1% 0.01% -1.6%SIGN MFG-METAL 4,730,268 5.61 -8.0% 2.7% 0.01% -12.0%STATIONERY MFG 4,707,142 2.36 34.1% -2.1% 0.01% -7.5%PICKLE MFG 4,504,697 2.35 32.8% -5.2% 0.01% 1.9%INK MFG 4,354,840 1.51 -1.3% -5.0% 0.01% -24.2%FERTILIZER MFG & DRIVERS 3,981,746 3.14 -14.7% -9.2% 0.01% 16.6%BOOT OR SHOE MFG-RUBBER 3,930,213 2.48 87.9% 2.5% 0.00% 28.6%MOTION PICTURE: DEVELOPMENT OF NEGATIVES, PRINTING AND ALL SUBSEQ 3,926,244 0.72 -38.5% -1.4% 0.00% -19.3%BOX OR BOX SHOOK MFG 3,776,410 4.25 9.0% -3.2% 0.00% -15.5%BREWERY & DRIVERS 3,727,216 1.89 -23.5% -16.7% 0.00% 24.2%BRICK OR CLAY PRODUCTS MFG. NOC & DRIVERS 3,693,442 3.60 3.2% -5.8% 0.00% 4.0%YARN OR THREAD MFG-COTTON 3,661,712 1.49 -2.6% -3.9% 0.00% -0.3%ICE MFG. OR DISTRIBUTION & DRIVERS 3,516,858 6.60 87.5% 3.8% 0.00% -15.2%PLANING OR MOLDING MILL 3,435,625 2.98 -47.1% -9.7% 0.00% 6.0%EMBROIDERY MFG 3,361,732 1.32 -21.4% -9.0% 0.00% -7.0%ELECTRIC OR GAS LIGHTING FIXTURES MFG 3,217,378 2.96 60.9% 10.9% 0.00% 7.8%ORE MILLING & DRIVERS 2,957,349 2.33 37.9% -8.6% 0.00% 38.0%PIPE OR TUBE MFG-IRON OR STEEL-& DRIVERS 2,765,496 2.69 -26.3% -13.5% 0.00% 6.5%SAW MILL 2,762,294 7.52 37.5% -1.6% 0.00% -7.9%DRESSMAKING OR TAILORING-CUSTOM EXCLUSIVELY 2,726,406 1.12 -9.7% -6.7% 0.00% -8.8%RENDERING WORKS NOC & DRIVERS 2,707,567 6.85 4.6% -5.1% 0.00% 4.4%JEWELRY MFG 2,625,485 1.10 -29.0% -3.5% 0.00% 44.7%ENGRAVING 2,613,602 1.73 50.4% -6.0% 0.00% 6.0%
Maryland 2015 Workers' Compensation Report Page 3 Exhibit 10
Largest Payroll Classes by Industry Group for Maryland(payroll information only available through 1st quarter 2013)
Largest Contracting Classes
Latest Available
Payroll
1/1/2016 Loss Cost
Change from
2005 to 2015
Change from
2014 to 2015
% of Statewide
Payroll
% Change in Payroll from 2012
to 2013CONTRACTOR--PROJECT MANAGER, CONSTRUCTION EXECUTIVE, CONSTRUC 603,730,567 0.96 -52.5% -11.9% 0.76% 5.1%ELECTRICAL WIRING-WITHIN BUILDINGS & DRIVERS 464,203,765 2.92 -39.7% -8.8% 0.59% 0.8%PLUMBING NOC & DRIVERS 341,850,539 4.37 -11.4% -4.2% 0.43% -3.8%HEATING, VENTILATION, AIR-CONDITIONING AND REFRIGERATIONSYSTEMS-IN 285,972,930 3.98 -40.1% -11.6% 0.36% 1.6%BURGLAR AND FIRE ALARM INSTALLATION OR REPAIR & DRIVERS 187,799,856 1.50 -31.8% -18.5% 0.24% 0.4%MACHINERY OR EQUIPMENT ERECTION OR REPAIR NOC & DRIVERS 187,011,271 4.00 -17.2% -17.5% 0.24% 0.3%CONCRETE OR CEMENT WORK-FLOORS, DRIVEWAYS, YARDS OR SIDEWALKS- 180,355,633 4.74 3.0% 8.7% 0.23% -4.8%CARPENTRY NOC 164,202,817 5.28 -22.2% -9.9% 0.21% 17.5%LANDSCAPE GARDENING & DRIVERS 150,486,950 5.90 52.5% 0.7% 0.19% -13.8%CARPENTRY-DETACHED ONE OR TWO FAMILY DWELLINGS 143,683,867 7.41 -1.9% -10.9% 0.18% 1.0%EXCAVATION & DRIVERS 133,394,566 4.60 11.9% -4.0% 0.17% -5.6%PAINTING NOC & SHOP OPERATIONS, DRIVERS 112,871,180 4.61 -11.7% -10.0% 0.14% -2.0%ELEVATOR ERECTION OR REPAIR 85,896,906 2.33 -46.6% 5.9% 0.11% 13.6%CARPENTRY-INSTALLATION OF CABINET WORK OR INTERIOR TRIM 83,422,444 6.68 26.3% -6.0% 0.11% -4.6%WALLBOARD, SHEETROCK, DRYWALL, PLASTERBOARD, OR CEMENT BOARD IN 79,271,716 7.06 15.5% 19.9% 0.10% 16.0%MASONRY NOC 77,166,305 7.10 -4.3% 1.0% 0.10% -1.4%CONSTRUCTION OR ERECTION PERMANENT YARD 72,886,087 6.05 21.7% 19.8% 0.09% -3.9%CONCRETE CONSTRUCTION NOC 72,791,847 8.02 9.9% 5.4% 0.09% 10.8%GAS MAIN OR CONNECTION CONSTRUCTION & DRIVERS 60,337,581 4.66 -6.2% 2.6% 0.08% 6.7%ELECTRIC LIGHT OR POWER LINE CONSTRUCTION & DRIVERS 58,508,685 5.93 -67.4% -6.9% 0.07% 6.3%FURNITURE OR FIXTURES INSTALLATION-PORTABLE-NOC 50,563,423 6.30 40.9% 13.5% 0.06% -5.7%STREET OR ROAD CONSTRUCTION: PAVING OR REPAVING & DRIVERS 49,066,905 5.33 -22.1% 0.9% 0.06% -23.9%SHEET METAL WORK - INSTALLATION & DRIVERS 47,062,218 4.66 (1) -6.4% 0.06% -3.5%SEWER CONSTRUCTION-ALL OPERATIONS & DRIVERS 45,574,357 4.56 23.6% 3.6% 0.06% 5.4%AUTOMATIC SPRINKLER INSTALLATION & DRIVERS 38,517,121 4.52 -18.6% -3.0% 0.05% 3.2%CONDUIT CONSTRUCTION-FOR CABLES OR WIRES-& DRIVERS 35,134,142 4.83 -0.2% -11.5% 0.04% 8.5%CERAMIC TILE, INDOOR STONE, MARBLE, OR MOSAIC WORK 34,654,787 5.06 7.2% -6.1% 0.04% 2.6%DOOR AND WINDOW INSTALLATION - ALL TYPES - RESIDENTIAL AND COMMER 32,960,576 5.50 -32.2% -8.6% 0.04% 9.2%FLOOR COVERING INSTALLATION--RESILIENT FLOORING -- CARPET AND LAMIN 31,735,913 4.49 -6.8% -4.3% 0.04% 9.8%ROOFING-ALL KINDS & DRIVERS 28,995,206 13.94 -28.4% -14.1% 0.04% -4.6%INSULATION WORK NOC & DRIVERS 27,541,230 5.56 -8.9% -17.9% 0.03% -0.8%GLAZIER-AWAY FROM SHOP & DRIVERS 26,454,122 8.37 -15.1% -5.4% 0.03% 8.3%CONCRETE CONSTRUCTION IN CONNECTION WITH BRIDGES OR CULVERTS 23,332,408 5.89 -27.9% -3.0% 0.03% 28.1%STREET OR ROAD CONSTRUCTION: SUBSURFACE WORK & DRIVERS 15,834,727 3.35 -36.1% -8.0% 0.02% -23.7%BOILER INSTALLATION OR REPAIR-STEAM 14,120,616 4.11 -61.0% -10.1% 0.02% 9.2%CONCRETE WORK-INCIDENTAL TO THE CONSTRUCTION OF PRIVATE RESIDEN 13,758,608 5.32 5.6% 6.2% 0.02% -9.8%
Maryland 2015 Workers' Compensation Report Page 4 Exhibit 10
Largest Payroll Classes by Industry Group for Maryland(payroll information only available through 1st quarter 2013)
Largest Contracting Classes
Latest Available
Payroll
1/1/2016 Loss Cost
Change from
2005 to 2015
Change from
2014 to 2015
% of Statewide
Payroll
% Change in Payroll from 2012
to 2013FENCE INSTALLATION AND REPAIR - METAL, VINYL, WOOD, OR PREFABRICATE 13,594,326 6.97 11.9% -4.4% 0.02% 11.3%MOBILE CRANE AND HOISTING SERVICE CONTRACTORS-NOC-ALL OPERATION 13,251,444 7.41 -10.8% -23.2% 0.02% -12.0%DRILLING NOC & DRIVERS 12,859,903 9.14 12.7% -13.5% 0.02% -5.0%IRON OR STEEL: ERECTION NOC 12,312,342 7.26 -39.7% 15.2% 0.02% 3.7%CLEANER - DEBRIS REMOVAL - CONSTRUCTION 9,925,297 3.62 -11.9% -3.7% 0.01% -23.5%SWIMMING POOL CONSTRUCTION-NOT IRON OR STEEL- & DRIVERS 7,973,672 5.35 -20.0% -21.3% 0.01% 11.3%PAINTING: METAL STRUCTURES-OVER TWO STORIES IN HEIGHT-& DRIVERS 6,585,902 14.54 -52.5% -8.0% 0.01% 37.2%SIGN INSTALLATION, MAINTENANCE, REPAIR OR REMOVAL & DRIVERS 6,407,497 9.83 8.7% 6.2% 0.01% -5.6%IRRIGATION OR DRAINAGE SYSTEM CONSTRUCTION & DRIVERS 5,806,894 3.46 -19.9% -1.1% 0.01% -13.3%WELDING OR CUTTING NOC & DRIVERS 5,744,336 4.40 -37.6% -1.1% 0.01% -2.9%FARM MACHINERY OPERATION-BY CONTRACTOR-& DRIVERS 4,974,713 4.86 -1.6% -6.9% 0.01% 4.9%IRON OR STEEL: ERECTION-FRAME STRUCTURES 4,166,500 13.41 -51.9% -22.8% 0.01% -25.4%ASBESTOS CONTRACTOR-NOC & DRIVERS 4,025,064 16.78 76.1% -12.7% 0.01% -3.0%PILE DRIVING 3,930,436 8.98 31.7% -3.5% 0.00% 63.5%PAPERHANGING & DRIVERS 3,811,920 1.54 -14.0% -12.0% 0.00% 4.4%RAILROAD CONSTRUCTION: LAYING OR RELAYING OF TRACKS OR MAINTENAN 2,649,528 3.57 -51.0% -15.8% 0.00% -9.2%OIL OR GAS PIPELINE CONSTRUCTION & DRIVERS 2,498,293 4.99 -30.5% -20.3% 0.00% -57.6%ASBESTOS CONTRACTOR-PIPE AND BOILER WORK EXCLUSIVELY & DRIVERS 2,103,752 6.12 -32.8% 19.8% 0.00% 15.6%CEILING INSTALLATION-SUSPENDED ACOUSTICAL GRID TYPE 1,947,451 6.45 -10.4% 19.9% 0.00% 7.5%SHAFT SINKING-ALL OPERATIONS 1,908,644 3.57 -30.4% -16.2% 0.00% 56.9%IRON OR STEEL: ERECTION-FRAME STRUCTURES NOT OVER TWO STORIES IN 1,568,204 34.65 20.9% 2.2% 0.00% 405.4%BUILDING RAISING OR MOVING 644,091 14.91 -24.5% -10.3% 0.00% 12.2%PLASTERING NOC & DRIVERS 620,814 5.52 -58.7% 16.7% 0.00% -12.3%MANUFACTURED, MODULAR, OR PREFABRICATED HOME SETUP, HOOKUP, OR 267,275 3.54 (3) 19.6% 0.00% 721.8%HOTHOUSE ERECTION-ALL OPERATIONS 105,320 4.36 -35.4% 11.5% 0.00% 1.4%JETTY OR BREAKWATER CONSTRUCTION-ALL OPERATIONS TO COMPLETION & 78,006 3.31 -39.5% -9.1% 0.00% 262.7%OIL STILL ERECTION OR REPAIR 72,327 1.35 -41.3% -20.1% 0.00% -59.0%OIL OR GAS - LEASE WORK NOC - BY SPECIALIST CONTRACTOR & DRIVERS 60,000 5.45 13.5% -9.5% 0.00% 33.9%OIL OR GAS WELL: CEMENTING & DRIVERS 38,656 3.28 -35.4% -9.1% 0.00% (A1)SALVAGE OPERATION-NO WRECKING OR ANY STRUCTURAL OPERATIONS 18,448 12.98 57.0% 16.7% 0.00% -59.8%TUNNELING-PNEUMATIC-ALL OPERATIONS 14,069 7.65 -23.0% 3.2% 0.00% (A1)OIL OR GAS WELL: DRILLING OR REDRILLING & DRIVERS 13,423 5.96 -41.5% -7.6% 0.00% (A1)LATHING & DRIVERS 3,629 3.24 -26.9% -8.7% 0.00% -96.0%
Maryland 2015 Workers' Compensation Report Page 5 Exhibit 10
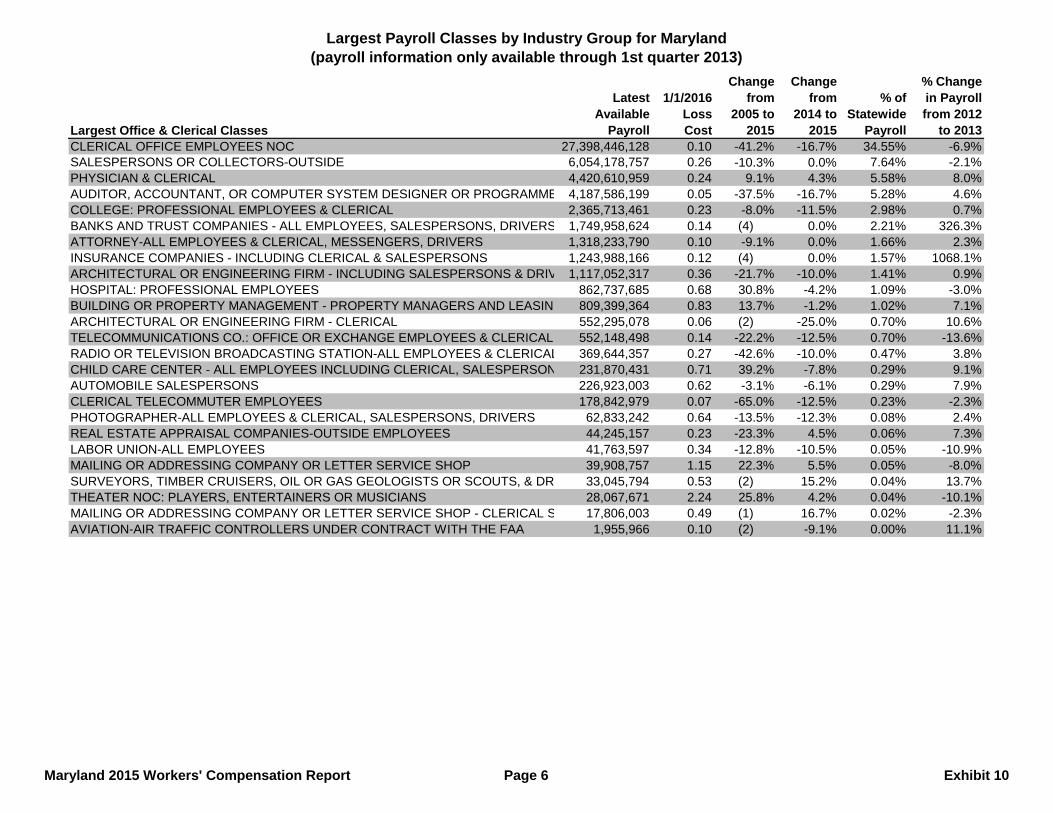
Largest Payroll Classes by Industry Group for Maryland(payroll information only available through 1st quarter 2013)
Largest Office & Clerical Classes
Latest Available
Payroll
1/1/2016 Loss Cost
Change from
2005 to 2015
Change from
2014 to 2015
% of Statewide
Payroll
% Change in Payroll from 2012
to 2013CLERICAL OFFICE EMPLOYEES NOC 27,398,446,128 0.10 -41.2% -16.7% 34.55% -6.9%SALESPERSONS OR COLLECTORS-OUTSIDE 6,054,178,757 0.26 -10.3% 0.0% 7.64% -2.1%PHYSICIAN & CLERICAL 4,420,610,959 0.24 9.1% 4.3% 5.58% 8.0%AUDITOR, ACCOUNTANT, OR COMPUTER SYSTEM DESIGNER OR PROGRAMME 4,187,586,199 0.05 -37.5% -16.7% 5.28% 4.6%COLLEGE: PROFESSIONAL EMPLOYEES & CLERICAL 2,365,713,461 0.23 -8.0% -11.5% 2.98% 0.7%BANKS AND TRUST COMPANIES - ALL EMPLOYEES, SALESPERSONS, DRIVERS 1,749,958,624 0.14 (4) 0.0% 2.21% 326.3%ATTORNEY-ALL EMPLOYEES & CLERICAL, MESSENGERS, DRIVERS 1,318,233,790 0.10 -9.1% 0.0% 1.66% 2.3%INSURANCE COMPANIES - INCLUDING CLERICAL & SALESPERSONS 1,243,988,166 0.12 (4) 0.0% 1.57% 1068.1%ARCHITECTURAL OR ENGINEERING FIRM - INCLUDING SALESPERSONS & DRIV 1,117,052,317 0.36 -21.7% -10.0% 1.41% 0.9%HOSPITAL: PROFESSIONAL EMPLOYEES 862,737,685 0.68 30.8% -4.2% 1.09% -3.0%BUILDING OR PROPERTY MANAGEMENT - PROPERTY MANAGERS AND LEASING 809,399,364 0.83 13.7% -1.2% 1.02% 7.1%ARCHITECTURAL OR ENGINEERING FIRM - CLERICAL 552,295,078 0.06 (2) -25.0% 0.70% 10.6%TELECOMMUNICATIONS CO.: OFFICE OR EXCHANGE EMPLOYEES & CLERICAL 552,148,498 0.14 -22.2% -12.5% 0.70% -13.6%RADIO OR TELEVISION BROADCASTING STATION-ALL EMPLOYEES & CLERICAL 369,644,357 0.27 -42.6% -10.0% 0.47% 3.8%CHILD CARE CENTER - ALL EMPLOYEES INCLUDING CLERICAL, SALESPERSON 231,870,431 0.71 39.2% -7.8% 0.29% 9.1%AUTOMOBILE SALESPERSONS 226,923,003 0.62 -3.1% -6.1% 0.29% 7.9%CLERICAL TELECOMMUTER EMPLOYEES 178,842,979 0.07 -65.0% -12.5% 0.23% -2.3%PHOTOGRAPHER-ALL EMPLOYEES & CLERICAL, SALESPERSONS, DRIVERS 62,833,242 0.64 -13.5% -12.3% 0.08% 2.4%REAL ESTATE APPRAISAL COMPANIES-OUTSIDE EMPLOYEES 44,245,157 0.23 -23.3% 4.5% 0.06% 7.3%LABOR UNION-ALL EMPLOYEES 41,763,597 0.34 -12.8% -10.5% 0.05% -10.9%MAILING OR ADDRESSING COMPANY OR LETTER SERVICE SHOP 39,908,757 1.15 22.3% 5.5% 0.05% -8.0%SURVEYORS, TIMBER CRUISERS, OIL OR GAS GEOLOGISTS OR SCOUTS, & DR 33,045,794 0.53 (2) 15.2% 0.04% 13.7%THEATER NOC: PLAYERS, ENTERTAINERS OR MUSICIANS 28,067,671 2.24 25.8% 4.2% 0.04% -10.1%MAILING OR ADDRESSING COMPANY OR LETTER SERVICE SHOP - CLERICAL S 17,806,003 0.49 (1) 16.7% 0.02% -2.3%AVIATION-AIR TRAFFIC CONTROLLERS UNDER CONTRACT WITH THE FAA 1,955,966 0.10 (2) -9.1% 0.00% 11.1%
Maryland 2015 Workers' Compensation Report Page 6 Exhibit 10
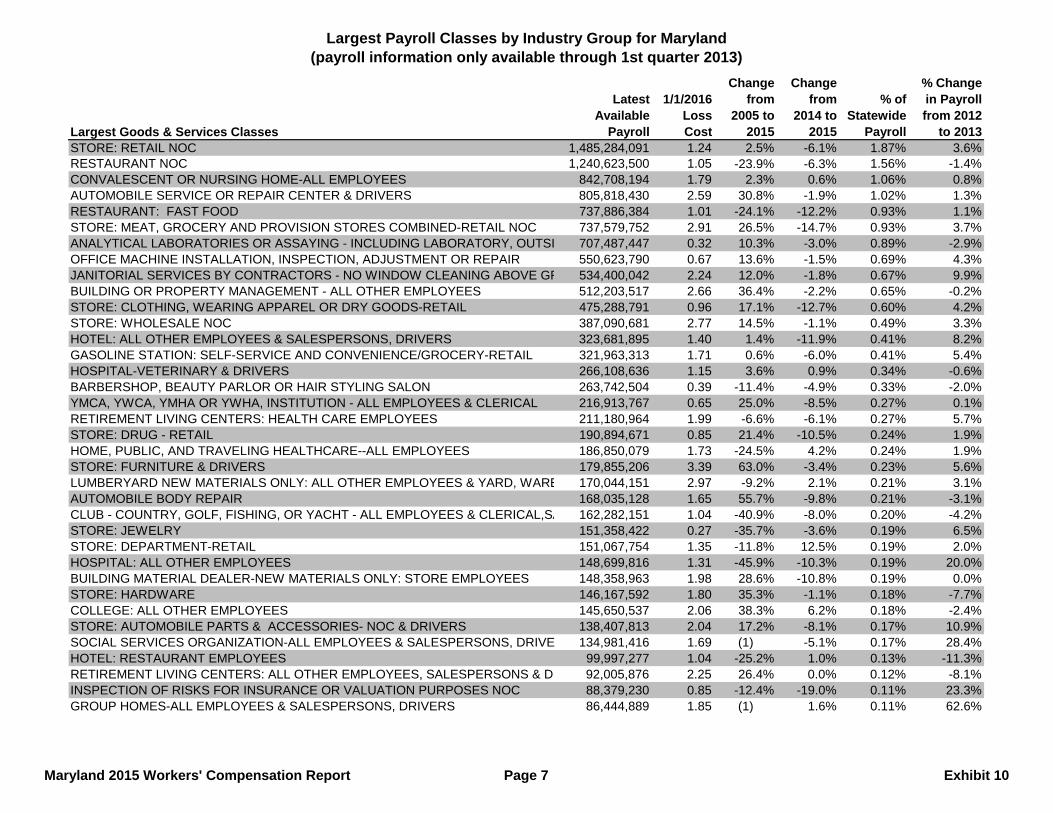
Largest Payroll Classes by Industry Group for Maryland(payroll information only available through 1st quarter 2013)
Largest Goods & Services Classes
Latest Available
Payroll
1/1/2016 Loss Cost
Change from
2005 to 2015
Change from
2014 to 2015
% of Statewide
Payroll
% Change in Payroll from 2012
to 2013STORE: RETAIL NOC 1,485,284,091 1.24 2.5% -6.1% 1.87% 3.6%RESTAURANT NOC 1,240,623,500 1.05 -23.9% -6.3% 1.56% -1.4%CONVALESCENT OR NURSING HOME-ALL EMPLOYEES 842,708,194 1.79 2.3% 0.6% 1.06% 0.8%AUTOMOBILE SERVICE OR REPAIR CENTER & DRIVERS 805,818,430 2.59 30.8% -1.9% 1.02% 1.3%RESTAURANT: FAST FOOD 737,886,384 1.01 -24.1% -12.2% 0.93% 1.1%STORE: MEAT, GROCERY AND PROVISION STORES COMBINED-RETAIL NOC 737,579,752 2.91 26.5% -14.7% 0.93% 3.7%ANALYTICAL LABORATORIES OR ASSAYING - INCLUDING LABORATORY, OUTSI 707,487,447 0.32 10.3% -3.0% 0.89% -2.9%OFFICE MACHINE INSTALLATION, INSPECTION, ADJUSTMENT OR REPAIR 550,623,790 0.67 13.6% -1.5% 0.69% 4.3%JANITORIAL SERVICES BY CONTRACTORS - NO WINDOW CLEANING ABOVE GR 534,400,042 2.24 12.0% -1.8% 0.67% 9.9%BUILDING OR PROPERTY MANAGEMENT - ALL OTHER EMPLOYEES 512,203,517 2.66 36.4% -2.2% 0.65% -0.2%STORE: CLOTHING, WEARING APPAREL OR DRY GOODS-RETAIL 475,288,791 0.96 17.1% -12.7% 0.60% 4.2%STORE: WHOLESALE NOC 387,090,681 2.77 14.5% -1.1% 0.49% 3.3%HOTEL: ALL OTHER EMPLOYEES & SALESPERSONS, DRIVERS 323,681,895 1.40 1.4% -11.9% 0.41% 8.2%GASOLINE STATION: SELF-SERVICE AND CONVENIENCE/GROCERY-RETAIL 321,963,313 1.71 0.6% -6.0% 0.41% 5.4%HOSPITAL-VETERINARY & DRIVERS 266,108,636 1.15 3.6% 0.9% 0.34% -0.6%BARBERSHOP, BEAUTY PARLOR OR HAIR STYLING SALON 263,742,504 0.39 -11.4% -4.9% 0.33% -2.0%YMCA, YWCA, YMHA OR YWHA, INSTITUTION - ALL EMPLOYEES & CLERICAL 216,913,767 0.65 25.0% -8.5% 0.27% 0.1%RETIREMENT LIVING CENTERS: HEALTH CARE EMPLOYEES 211,180,964 1.99 -6.6% -6.1% 0.27% 5.7%STORE: DRUG - RETAIL 190,894,671 0.85 21.4% -10.5% 0.24% 1.9%HOME, PUBLIC, AND TRAVELING HEALTHCARE--ALL EMPLOYEES 186,850,079 1.73 -24.5% 4.2% 0.24% 1.9%STORE: FURNITURE & DRIVERS 179,855,206 3.39 63.0% -3.4% 0.23% 5.6%LUMBERYARD NEW MATERIALS ONLY: ALL OTHER EMPLOYEES & YARD, WARE 170,044,151 2.97 -9.2% 2.1% 0.21% 3.1%AUTOMOBILE BODY REPAIR 168,035,128 1.65 55.7% -9.8% 0.21% -3.1%CLUB - COUNTRY, GOLF, FISHING, OR YACHT - ALL EMPLOYEES & CLERICAL,SA 162,282,151 1.04 -40.9% -8.0% 0.20% -4.2%STORE: JEWELRY 151,358,422 0.27 -35.7% -3.6% 0.19% 6.5%STORE: DEPARTMENT-RETAIL 151,067,754 1.35 -11.8% 12.5% 0.19% 2.0%HOSPITAL: ALL OTHER EMPLOYEES 148,699,816 1.31 -45.9% -10.3% 0.19% 20.0%BUILDING MATERIAL DEALER-NEW MATERIALS ONLY: STORE EMPLOYEES 148,358,963 1.98 28.6% -10.8% 0.19% 0.0%STORE: HARDWARE 146,167,592 1.80 35.3% -1.1% 0.18% -7.7%COLLEGE: ALL OTHER EMPLOYEES 145,650,537 2.06 38.3% 6.2% 0.18% -2.4%STORE: AUTOMOBILE PARTS & ACCESSORIES- NOC & DRIVERS 138,407,813 2.04 17.2% -8.1% 0.17% 10.9%SOCIAL SERVICES ORGANIZATION-ALL EMPLOYEES & SALESPERSONS, DRIVE 134,981,416 1.69 (1) -5.1% 0.17% 28.4%HOTEL: RESTAURANT EMPLOYEES 99,997,277 1.04 -25.2% 1.0% 0.13% -11.3%RETIREMENT LIVING CENTERS: ALL OTHER EMPLOYEES, SALESPERSONS & D 92,005,876 2.25 26.4% 0.0% 0.12% -8.1%INSPECTION OF RISKS FOR INSURANCE OR VALUATION PURPOSES NOC 88,379,230 0.85 -12.4% -19.0% 0.11% 23.3%GROUP HOMES-ALL EMPLOYEES & SALESPERSONS, DRIVERS 86,444,889 1.85 (1) 1.6% 0.11% 62.6%
Maryland 2015 Workers' Compensation Report Page 7 Exhibit 10
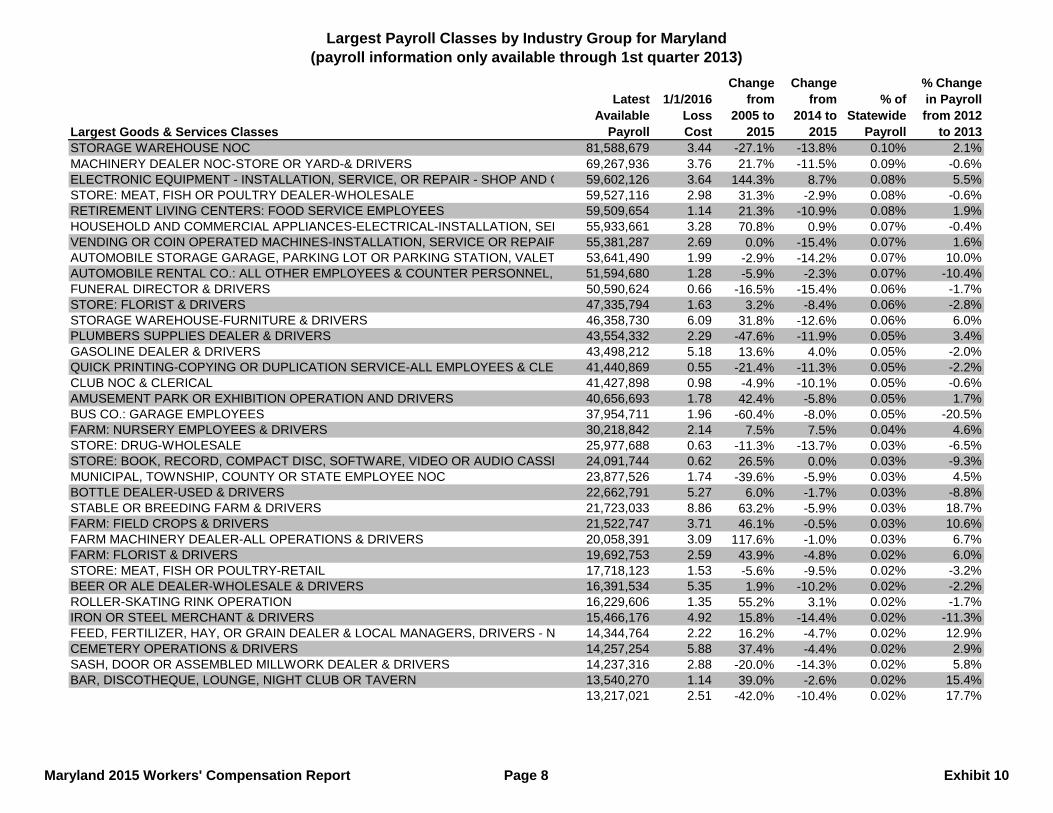
Largest Payroll Classes by Industry Group for Maryland(payroll information only available through 1st quarter 2013)
Largest Goods & Services Classes
Latest Available
Payroll
1/1/2016 Loss Cost
Change from
2005 to 2015
Change from
2014 to 2015
% of Statewide
Payroll
% Change in Payroll from 2012
to 2013STORAGE WAREHOUSE NOC 81,588,679 3.44 -27.1% -13.8% 0.10% 2.1%MACHINERY DEALER NOC-STORE OR YARD-& DRIVERS 69,267,936 3.76 21.7% -11.5% 0.09% -0.6%ELECTRONIC EQUIPMENT - INSTALLATION, SERVICE, OR REPAIR - SHOP AND O 59,602,126 3.64 144.3% 8.7% 0.08% 5.5%STORE: MEAT, FISH OR POULTRY DEALER-WHOLESALE 59,527,116 2.98 31.3% -2.9% 0.08% -0.6%RETIREMENT LIVING CENTERS: FOOD SERVICE EMPLOYEES 59,509,654 1.14 21.3% -10.9% 0.08% 1.9%HOUSEHOLD AND COMMERCIAL APPLIANCES-ELECTRICAL-INSTALLATION, SER 55,933,661 3.28 70.8% 0.9% 0.07% -0.4%VENDING OR COIN OPERATED MACHINES-INSTALLATION, SERVICE OR REPAIR 55,381,287 2.69 0.0% -15.4% 0.07% 1.6%AUTOMOBILE STORAGE GARAGE, PARKING LOT OR PARKING STATION, VALET 53,641,490 1.99 -2.9% -14.2% 0.07% 10.0%AUTOMOBILE RENTAL CO.: ALL OTHER EMPLOYEES & COUNTER PERSONNEL, 51,594,680 1.28 -5.9% -2.3% 0.07% -10.4%FUNERAL DIRECTOR & DRIVERS 50,590,624 0.66 -16.5% -15.4% 0.06% -1.7%STORE: FLORIST & DRIVERS 47,335,794 1.63 3.2% -8.4% 0.06% -2.8%STORAGE WAREHOUSE-FURNITURE & DRIVERS 46,358,730 6.09 31.8% -12.6% 0.06% 6.0%PLUMBERS SUPPLIES DEALER & DRIVERS 43,554,332 2.29 -47.6% -11.9% 0.05% 3.4%GASOLINE DEALER & DRIVERS 43,498,212 5.18 13.6% 4.0% 0.05% -2.0%QUICK PRINTING-COPYING OR DUPLICATION SERVICE-ALL EMPLOYEES & CLE 41,440,869 0.55 -21.4% -11.3% 0.05% -2.2%CLUB NOC & CLERICAL 41,427,898 0.98 -4.9% -10.1% 0.05% -0.6%AMUSEMENT PARK OR EXHIBITION OPERATION AND DRIVERS 40,656,693 1.78 42.4% -5.8% 0.05% 1.7%BUS CO.: GARAGE EMPLOYEES 37,954,711 1.96 -60.4% -8.0% 0.05% -20.5%FARM: NURSERY EMPLOYEES & DRIVERS 30,218,842 2.14 7.5% 7.5% 0.04% 4.6%STORE: DRUG-WHOLESALE 25,977,688 0.63 -11.3% -13.7% 0.03% -6.5%STORE: BOOK, RECORD, COMPACT DISC, SOFTWARE, VIDEO OR AUDIO CASSE 24,091,744 0.62 26.5% 0.0% 0.03% -9.3%MUNICIPAL, TOWNSHIP, COUNTY OR STATE EMPLOYEE NOC 23,877,526 1.74 -39.6% -5.9% 0.03% 4.5%BOTTLE DEALER-USED & DRIVERS 22,662,791 5.27 6.0% -1.7% 0.03% -8.8%STABLE OR BREEDING FARM & DRIVERS 21,723,033 8.86 63.2% -5.9% 0.03% 18.7%FARM: FIELD CROPS & DRIVERS 21,522,747 3.71 46.1% -0.5% 0.03% 10.6%FARM MACHINERY DEALER-ALL OPERATIONS & DRIVERS 20,058,391 3.09 117.6% -1.0% 0.03% 6.7%FARM: FLORIST & DRIVERS 19,692,753 2.59 43.9% -4.8% 0.02% 6.0%STORE: MEAT, FISH OR POULTRY-RETAIL 17,718,123 1.53 -5.6% -9.5% 0.02% -3.2%BEER OR ALE DEALER-WHOLESALE & DRIVERS 16,391,534 5.35 1.9% -10.2% 0.02% -2.2%ROLLER-SKATING RINK OPERATION 16,229,606 1.35 55.2% 3.1% 0.02% -1.7%IRON OR STEEL MERCHANT & DRIVERS 15,466,176 4.92 15.8% -14.4% 0.02% -11.3%FEED, FERTILIZER, HAY, OR GRAIN DEALER & LOCAL MANAGERS, DRIVERS - N 14,344,764 2.22 16.2% -4.7% 0.02% 12.9%CEMETERY OPERATIONS & DRIVERS 14,257,254 5.88 37.4% -4.4% 0.02% 2.9%SASH, DOOR OR ASSEMBLED MILLWORK DEALER & DRIVERS 14,237,316 2.88 -20.0% -14.3% 0.02% 5.8%BAR, DISCOTHEQUE, LOUNGE, NIGHT CLUB OR TAVERN 13,540,270 1.14 39.0% -2.6% 0.02% 15.4% 13,217,021 2.51 -42.0% -10.4% 0.02% 17.7%
Maryland 2015 Workers' Compensation Report Page 8 Exhibit 10
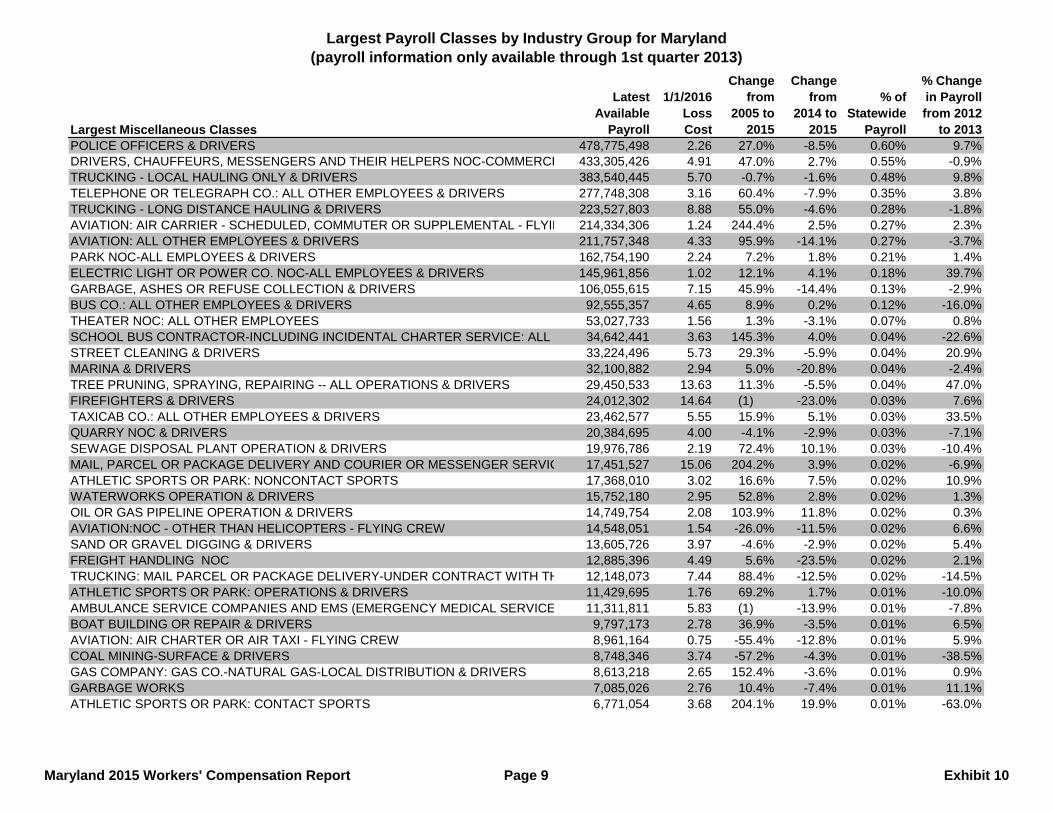
Largest Payroll Classes by Industry Group for Maryland(payroll information only available through 1st quarter 2013)
Largest Miscellaneous Classes
Latest Available
Payroll
1/1/2016 Loss Cost
Change from
2005 to 2015
Change from
2014 to 2015
% of Statewide
Payroll
% Change in Payroll from 2012
to 2013POLICE OFFICERS & DRIVERS 478,775,498 2.26 27.0% -8.5% 0.60% 9.7%DRIVERS, CHAUFFEURS, MESSENGERS AND THEIR HELPERS NOC-COMMERCI 433,305,426 4.91 47.0% 2.7% 0.55% -0.9%TRUCKING - LOCAL HAULING ONLY & DRIVERS 383,540,445 5.70 -0.7% -1.6% 0.48% 9.8%TELEPHONE OR TELEGRAPH CO.: ALL OTHER EMPLOYEES & DRIVERS 277,748,308 3.16 60.4% -7.9% 0.35% 3.8%TRUCKING - LONG DISTANCE HAULING & DRIVERS 223,527,803 8.88 55.0% -4.6% 0.28% -1.8%AVIATION: AIR CARRIER - SCHEDULED, COMMUTER OR SUPPLEMENTAL - FLYIN 214,334,306 1.24 244.4% 2.5% 0.27% 2.3%AVIATION: ALL OTHER EMPLOYEES & DRIVERS 211,757,348 4.33 95.9% -14.1% 0.27% -3.7%PARK NOC-ALL EMPLOYEES & DRIVERS 162,754,190 2.24 7.2% 1.8% 0.21% 1.4%ELECTRIC LIGHT OR POWER CO. NOC-ALL EMPLOYEES & DRIVERS 145,961,856 1.02 12.1% 4.1% 0.18% 39.7%GARBAGE, ASHES OR REFUSE COLLECTION & DRIVERS 106,055,615 7.15 45.9% -14.4% 0.13% -2.9%BUS CO.: ALL OTHER EMPLOYEES & DRIVERS 92,555,357 4.65 8.9% 0.2% 0.12% -16.0%THEATER NOC: ALL OTHER EMPLOYEES 53,027,733 1.56 1.3% -3.1% 0.07% 0.8%SCHOOL BUS CONTRACTOR-INCLUDING INCIDENTAL CHARTER SERVICE: ALL O 34,642,441 3.63 145.3% 4.0% 0.04% -22.6%STREET CLEANING & DRIVERS 33,224,496 5.73 29.3% -5.9% 0.04% 20.9%MARINA & DRIVERS 32,100,882 2.94 5.0% -20.8% 0.04% -2.4%TREE PRUNING, SPRAYING, REPAIRING -- ALL OPERATIONS & DRIVERS 29,450,533 13.63 11.3% -5.5% 0.04% 47.0%FIREFIGHTERS & DRIVERS 24,012,302 14.64 (1) -23.0% 0.03% 7.6%TAXICAB CO.: ALL OTHER EMPLOYEES & DRIVERS 23,462,577 5.55 15.9% 5.1% 0.03% 33.5%QUARRY NOC & DRIVERS 20,384,695 4.00 -4.1% -2.9% 0.03% -7.1%SEWAGE DISPOSAL PLANT OPERATION & DRIVERS 19,976,786 2.19 72.4% 10.1% 0.03% -10.4%MAIL, PARCEL OR PACKAGE DELIVERY AND COURIER OR MESSENGER SERVIC 17,451,527 15.06 204.2% 3.9% 0.02% -6.9%ATHLETIC SPORTS OR PARK: NONCONTACT SPORTS 17,368,010 3.02 16.6% 7.5% 0.02% 10.9%WATERWORKS OPERATION & DRIVERS 15,752,180 2.95 52.8% 2.8% 0.02% 1.3%OIL OR GAS PIPELINE OPERATION & DRIVERS 14,749,754 2.08 103.9% 11.8% 0.02% 0.3%AVIATION:NOC - OTHER THAN HELICOPTERS - FLYING CREW 14,548,051 1.54 -26.0% -11.5% 0.02% 6.6%SAND OR GRAVEL DIGGING & DRIVERS 13,605,726 3.97 -4.6% -2.9% 0.02% 5.4%FREIGHT HANDLING NOC 12,885,396 4.49 5.6% -23.5% 0.02% 2.1%TRUCKING: MAIL PARCEL OR PACKAGE DELIVERY-UNDER CONTRACT WITH TH 12,148,073 7.44 88.4% -12.5% 0.02% -14.5%ATHLETIC SPORTS OR PARK: OPERATIONS & DRIVERS 11,429,695 1.76 69.2% 1.7% 0.01% -10.0%AMBULANCE SERVICE COMPANIES AND EMS (EMERGENCY MEDICAL SERVICE 11,311,811 5.83 (1) -13.9% 0.01% -7.8%BOAT BUILDING OR REPAIR & DRIVERS 9,797,173 2.78 36.9% -3.5% 0.01% 6.5%AVIATION: AIR CHARTER OR AIR TAXI - FLYING CREW 8,961,164 0.75 -55.4% -12.8% 0.01% 5.9%COAL MINING-SURFACE & DRIVERS 8,748,346 3.74 -57.2% -4.3% 0.01% -38.5%GAS COMPANY: GAS CO.-NATURAL GAS-LOCAL DISTRIBUTION & DRIVERS 8,613,218 2.65 152.4% -3.6% 0.01% 0.9%GARBAGE WORKS 7,085,026 2.76 10.4% -7.4% 0.01% 11.1%ATHLETIC SPORTS OR PARK: CONTACT SPORTS 6,771,054 3.68 204.1% 19.9% 0.01% -63.0%
Maryland 2015 Workers' Compensation Report Page 9 Exhibit 10
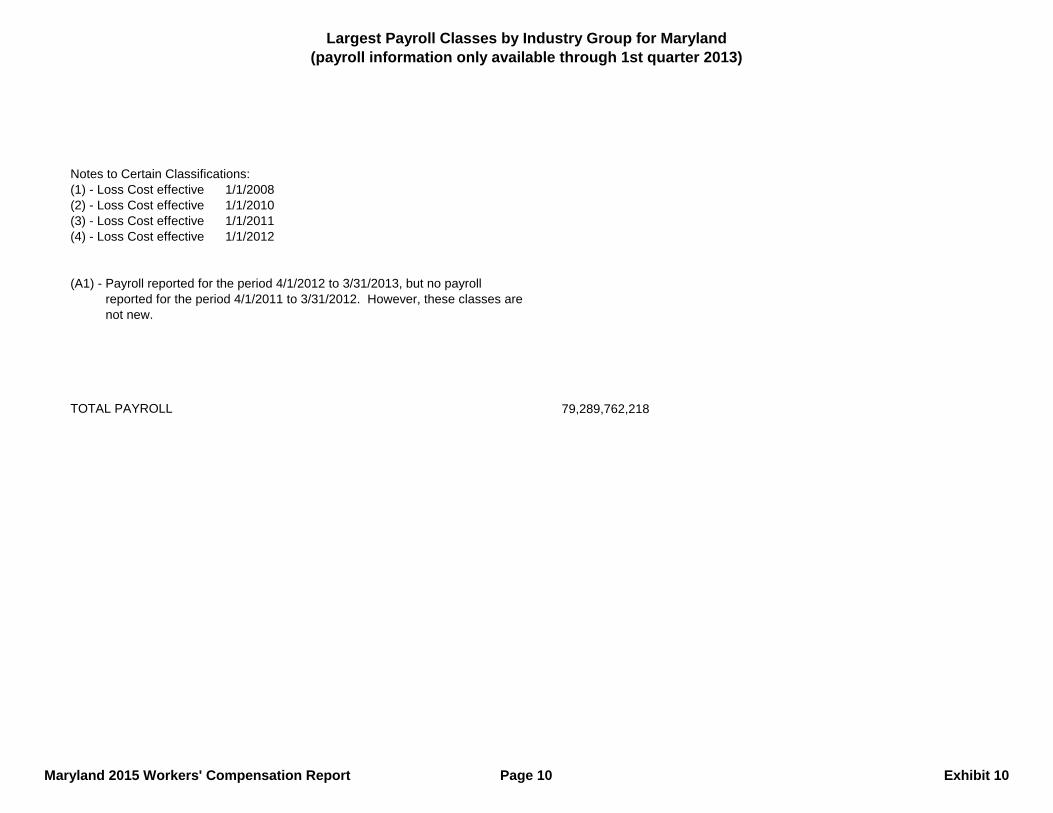
Largest Payroll Classes by Industry Group for Maryland(payroll information only available through 1st quarter 2013)
Notes to Certain Classifications:(1) - Loss Cost effective 1/1/2008(2) - Loss Cost effective 1/1/2010 (3) - Loss Cost effective 1/1/2011(4) - Loss Cost effective 1/1/2012
(A1) - Payroll reported for the period 4/1/2012 to 3/31/2013, but no payroll reported for the period 4/1/2011 to 3/31/2012. However, these classes are not new.
TOTAL PAYROLL 79,289,762,218
Maryland 2015 Workers' Compensation Report Page 10 Exhibit 10
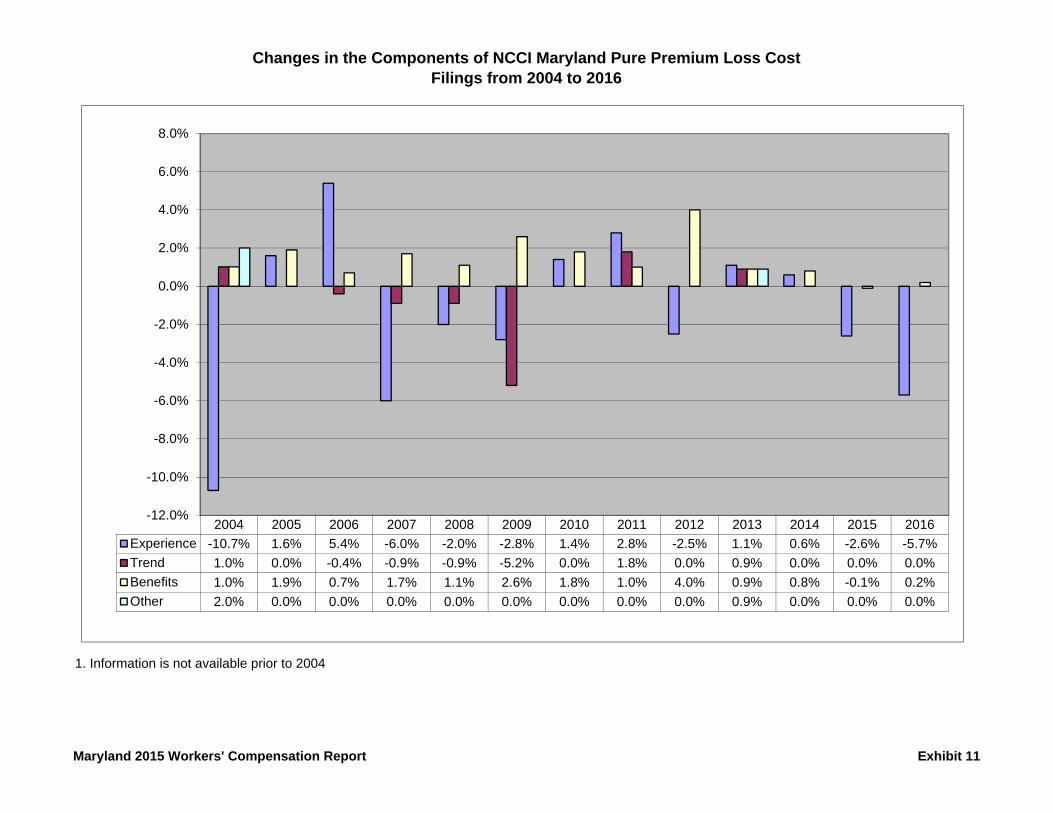
Changes in the Components of NCCI Maryland Pure Premium Loss CostFilings from 2004 to 2016
1. Information is not available prior to 2004
2004 2005 2006 2007 2008 2009 2010 2011 2012 2013 2014 2015 2016Experience -10.7% 1.6% 5.4% -6.0% -2.0% -2.8% 1.4% 2.8% -2.5% 1.1% 0.6% -2.6% -5.7%Trend 1.0% 0.0% -0.4% -0.9% -0.9% -5.2% 0.0% 1.8% 0.0% 0.9% 0.0% 0.0% 0.0%Benefits 1.0% 1.9% 0.7% 1.7% 1.1% 2.6% 1.8% 1.0% 4.0% 0.9% 0.8% -0.1% 0.2%Other 2.0% 0.0% 0.0% 0.0% 0.0% 0.0% 0.0% 0.0% 0.0% 0.9% 0.0% 0.0% 0.0%
-12.0%
-10.0%
-8.0%
-6.0%
-4.0%
-2.0%
0.0%
2.0%
4.0%
6.0%
8.0%
Maryland 2015 Workers' Compensation Report Exhibit 11
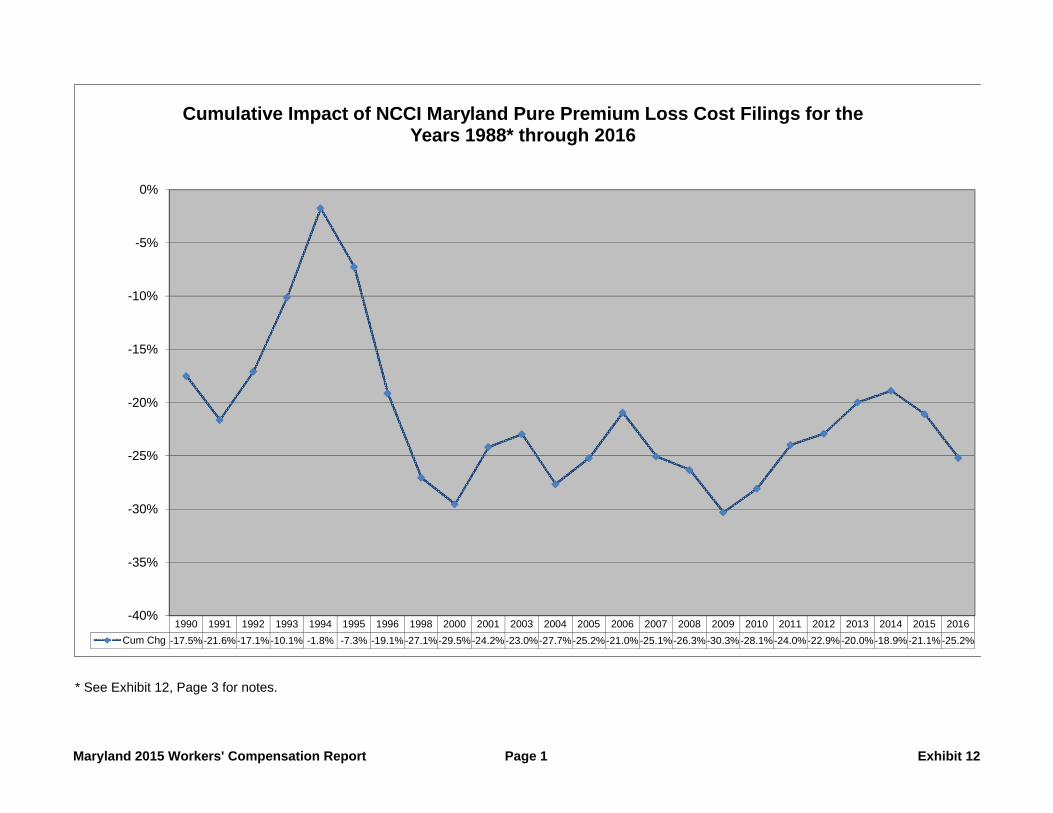
* See Exhibit 12, Page 3 for notes.
1990 1991 1992 1993 1994 1995 1996 1998 2000 2001 2003 2004 2005 2006 2007 2008 2009 2010 2011 2012 2013 2014 2015 2016Cum Chg -17.5%-21.6%-17.1%-10.1% -1.8% -7.3% -19.1%-27.1%-29.5%-24.2%-23.0%-27.7%-25.2%-21.0%-25.1%-26.3%-30.3%-28.1%-24.0%-22.9%-20.0%-18.9%-21.1%-25.2%
-40%
-35%
-30%
-25%
-20%
-15%
-10%
-5%
0%
Cumulative Impact of NCCI Maryland Pure Premium Loss Cost Filings for the Years 1988* through 2016
Maryland 2015 Workers' Compensation Report Page 1 Exhibit 12
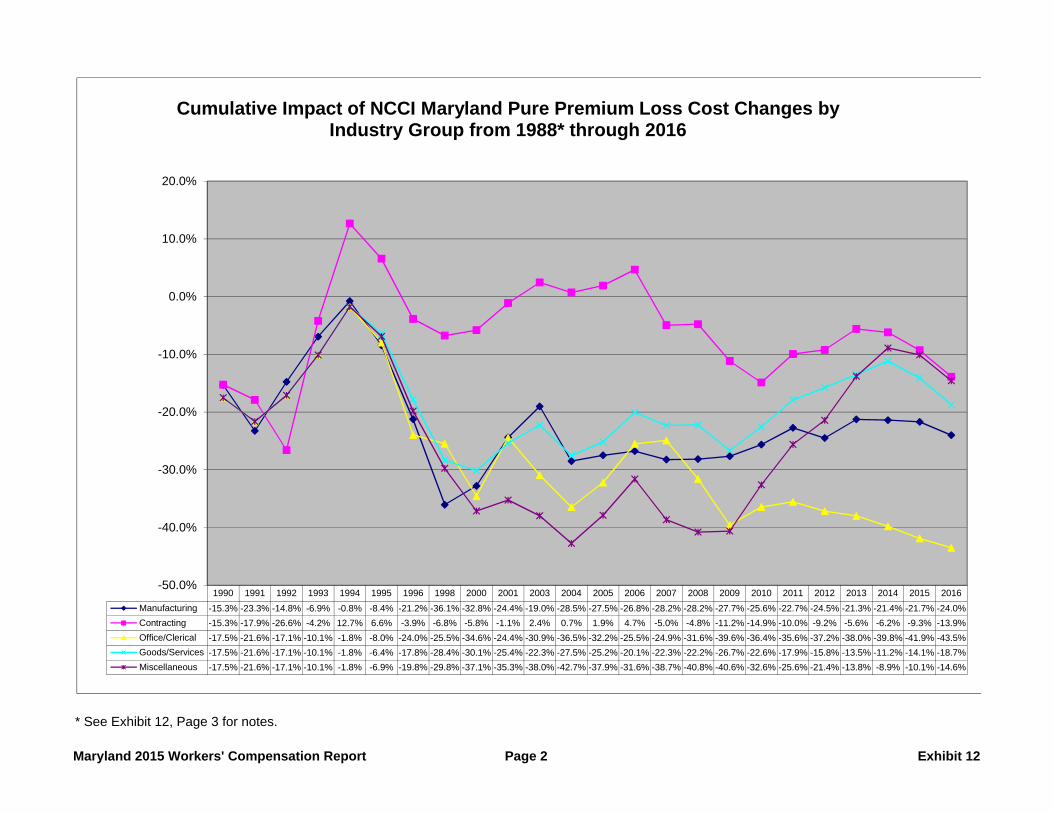
* See Exhibit 12, Page 3 for notes.
1990 1991 1992 1993 1994 1995 1996 1998 2000 2001 2003 2004 2005 2006 2007 2008 2009 2010 2011 2012 2013 2014 2015 2016Manufacturing -15.3% -23.3% -14.8% -6.9% -0.8% -8.4% -21.2% -36.1% -32.8% -24.4% -19.0% -28.5% -27.5% -26.8% -28.2% -28.2% -27.7% -25.6% -22.7% -24.5% -21.3% -21.4% -21.7% -24.0%Contracting -15.3% -17.9% -26.6% -4.2% 12.7% 6.6% -3.9% -6.8% -5.8% -1.1% 2.4% 0.7% 1.9% 4.7% -5.0% -4.8% -11.2% -14.9% -10.0% -9.2% -5.6% -6.2% -9.3% -13.9%Office/Clerical -17.5% -21.6% -17.1% -10.1% -1.8% -8.0% -24.0% -25.5% -34.6% -24.4% -30.9% -36.5% -32.2% -25.5% -24.9% -31.6% -39.6% -36.4% -35.6% -37.2% -38.0% -39.8% -41.9% -43.5%Goods/Services -17.5% -21.6% -17.1% -10.1% -1.8% -6.4% -17.8% -28.4% -30.1% -25.4% -22.3% -27.5% -25.2% -20.1% -22.3% -22.2% -26.7% -22.6% -17.9% -15.8% -13.5% -11.2% -14.1% -18.7%Miscellaneous -17.5% -21.6% -17.1% -10.1% -1.8% -6.9% -19.8% -29.8% -37.1% -35.3% -38.0% -42.7% -37.9% -31.6% -38.7% -40.8% -40.6% -32.6% -25.6% -21.4% -13.8% -8.9% -10.1% -14.6%
-50.0%
-40.0%
-30.0%
-20.0%
-10.0%
0.0%
10.0%
20.0%
Cumulative Impact of NCCI Maryland Pure Premium Loss Cost Changes by Industry Group from 1988* through 2016
Maryland 2015 Workers' Compensation Report Page 2 Exhibit 12
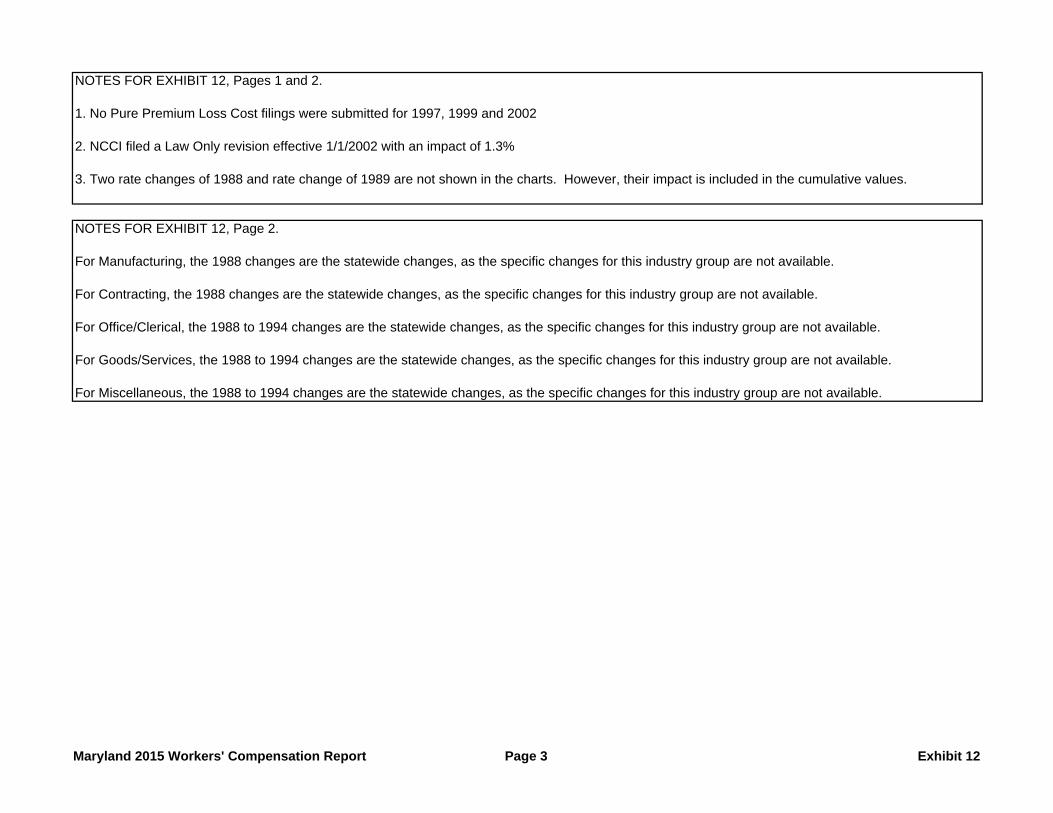
NOTES FOR EXHIBIT 12, Pages 1 and 2.
1. No Pure Premium Loss Cost filings were submitted for 1997, 1999 and 2002
2. NCCI filed a Law Only revision effective 1/1/2002 with an impact of 1.3%
3. Two rate changes of 1988 and rate change of 1989 are not shown in the charts. However, their impact is included in the cumulative values.
NOTES FOR EXHIBIT 12, Page 2.
For Manufacturing, the 1988 changes are the statewide changes, as the specific changes for this industry group are not available.
For Contracting, the 1988 changes are the statewide changes, as the specific changes for this industry group are not available.
For Office/Clerical, the 1988 to 1994 changes are the statewide changes, as the specific changes for this industry group are not available.
For Goods/Services, the 1988 to 1994 changes are the statewide changes, as the specific changes for this industry group are not available.
For Miscellaneous, the 1988 to 1994 changes are the statewide changes, as the specific changes for this industry group are not available.
Maryland 2015 Workers' Compensation Report Page 3 Exhibit 12