2015 q4 pii earnings pres 1 26-16 f5
28
Fourth Quarter & Full Year 2015 Earnings Results January 26, 2016 POLARIS INDUSTRIES INC.
-
Upload
investorpolaris -
Category
Investor Relations
-
view
2.678 -
download
2
Transcript of 2015 q4 pii earnings pres 1 26-16 f5
Fourth Quarter & Full Year 2015 Earnings Results
January 26, 2016
POLARIS INDUSTRIES INC.
Safe HarborExcept for historical information contained herein, the matters set forth in this document, including but not limited to management’s expectations regarding 2016 sales, shipments, margins, currencies, net income and cash flow, the opportunities for expansion and diversification of the Company’s business and the Company’s guidance on earnings per share are forward-looking statements that involve certain risks and uncertainties that could cause actual results to differ materially from those forward-looking statements. Potential risks and uncertainties include such factors as product offerings, promotional activities and pricing strategies by competitors; manufacturing operation expansion initiatives; acquisition integration costs; warranty expenses; foreign currency exchange rate fluctuations; environmental and product safety regulatory activity; effects of weather; commodity costs; uninsured product liability claims; uncertainty in the retail and wholesale credit markets; performance of affiliate partners; changes in tax policy and overall economic conditions, including inflation, consumer confidence and spending and relationships with dealers and suppliers. Investors are also directed to consider other risks and uncertainties discussed in our 2014 annual report and Form 10-K filed by the Company with the Securities and Exchange Commission. The Company does not undertake any duty to any person to provide updates to its forward-looking statements.
The data source for retail sales figures included in this presentation is registration information provided by Polaris dealers in North America and compiled by the Company or Company estimates. The Company must rely on information that its dealers supply concerning retail sales, and other retail sales data sources and this information is subject to revision.
Q4 1-26-16 2

Scott W. WineChairman & CEO
Fourth Quarter & Full Year 2015 Earnings ResultsJanuary 26, 2016
POLARIS INDUSTRIES INC.
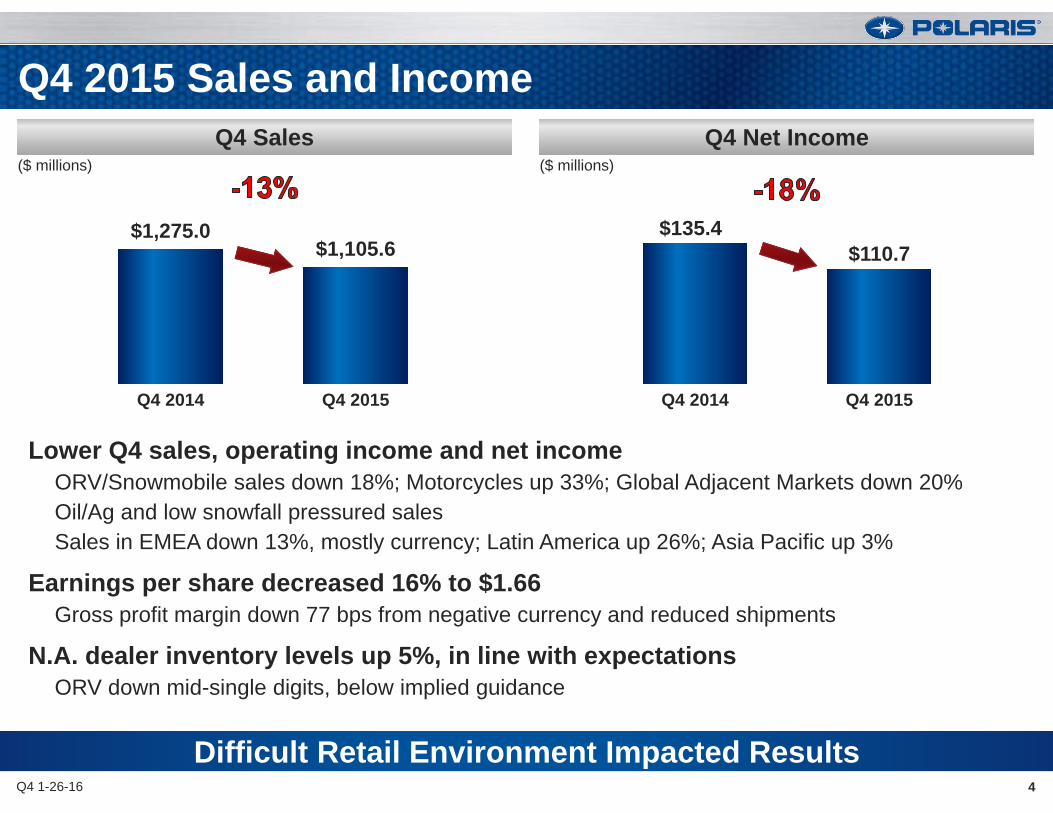
Q4 2015 Sales and Income
Lower Q4 sales, operating income and net income ORV/Snowmobile sales down 18%; Motorcycles up 33%; Global Adjacent Markets down 20%Oil/Ag and low snowfall pressured salesSales in EMEA down 13%, mostly currency; Latin America up 26%; Asia Pacific up 3%
Earnings per share decreased 16% to $1.66Gross profit margin down 77 bps from negative currency and reduced shipments
N.A. dealer inventory levels up 5%, in line with expectationsORV down mid-single digits, below implied guidance
4Q4 1-26-16
Difficult Retail Environment Impacted Results
Q4 Net IncomeQ4 Sales
$1,275.0$1,105.6
Q4 2014 Q4 2015
$135.4$110.7
Q4 2014 Q4 2015
($ millions) ($ millions)

$454.0 $455.4
FY 2014 FY 2015
2015 Sales and Net Income
Grew Full Year Sales 5%; Net income flatAll businesses gained market share in 2015International sales down 5% (up 10% excluding currency)
Constant Currency: EMEA +2%; Latin America +66%; Asia Pacific +21%; Pretax Income included ~$70 million of negative currency
Earnings per share up 2% to $6.75Repurchased 2.2 million shares for $294 millionNet income margin down 49 bps from 2014
$4,479.6 $4,719.3
FY 2014 FY 2015
Grew Market Share in All Businesses Despite Tough Economic Headwinds
Net IncomeTotal Company Sales
Q4 1-26-16 5
78% 15%
7%
Motorcycles
Adjacent Markets
FY 2015 Sales by Reporting Segments
(includes respective PG&A)
($ millions) ($ millions)
ORV / Snowmobiles

Polaris Strategic Objectives
Vision & StrategyVISION STRATEGYFuel the passion of riders, workers and outdoor enthusiasts around the world by delivering innovative, high quality vehicles, products, services and experiences that enrich their lives.
Polaris will be a highly profitable, customer centric, $8B global enterprise by 2020. We will make the best off-road and on-road vehicles and products for recreation, transportation and work supporting consumer, commercial and military applications. Our winning advantage is our innovative culture, operational speed and flexibility, and passion to make quality products that deliver value to our customers.
Strategic Objectives Best in Powersports PLUS Global Market Leadership Strong Financial
Performance
Growth Through Adjacencies LEAN Enterprise is Competitive Advantage
5-8% annual organic growth >33% of Polaris revenue
>$2B from acquisitions & new markets Significant Quality, Delivery & Cost Improvement
Sustainable, profitable growthNet Income Margin >10%
Guiding Principles
Performance Priorities
Best People, Best Team
Safety & Ethics Always
Customer Loyalty
Growth
Margin Expansion
Product & Quality Leadership
LEAN Enterprise
GROW SALES >$8 Billion by 2020 12% CAGR INCREASE NET INCOME >10% of Sales by 2020 13% CAGR
Q4 1-26-16 6
2020 Strategic Objectives Remain Acheivable

MATT HOMANPresident – Off-Road Vehicles
(January 2016)
Side-by-Side and ATV Off-Road Vehicles: RANGER®, RZR®, Polaris GENERAL®, Polaris ACE®, and Sportsman®
13+ years with PolarisMost recently President – Global Adjacent MarketsFormerly V.P. – ORV from 2008 to 2011
Leadership to Meet Demands of an Evolving Market7
Organizational Changes
Q4 1-26-16
DAVID LONGRENS.V.P. – Enterprise Cost
(January 2016)
Accelerate Lean TransformationAlign Engineering, Operations and functional groups for cost-down
13+ years with PolarisMost recently President – Off-Road Vehicles
Strategic Objectives Best in Powersports PLUS Global Market Leadership Strong Financial
Performance
Growth through Adjacencies LEAN Enterprise is Competitive Advantage
5-8% annual organic growth >33% of Polaris revenue
>$2B from acquisitions & new markets Significant Quality, Delivery & Cost Improvement
Sustainable, profitable growthNet Income Margin >10%
Performance Priorities
Growth
Margin Expansion
Product & Quality Leadership
LEAN Enterprise

Bennett MorganPresident & COOPOLARIS INDUSTRIES INC.
Fourth Quarter & Full Year 2015 Earnings ResultsJanuary 26, 2016
Polaris Industry 2014 2015
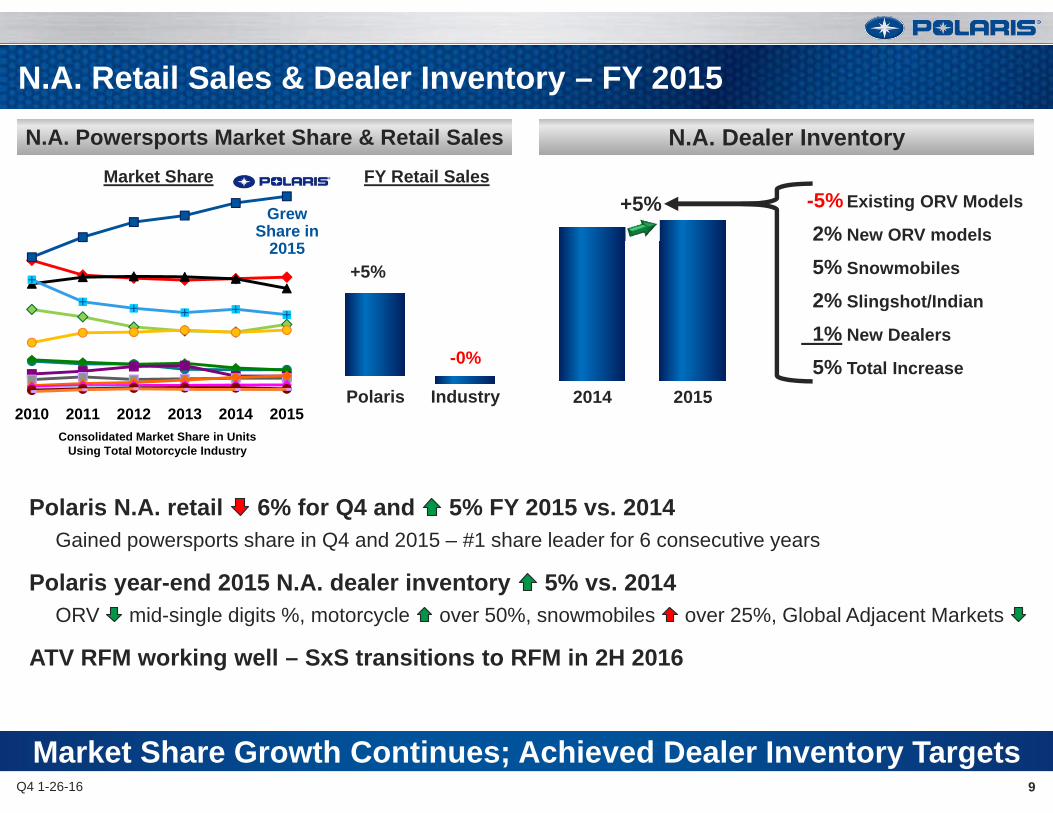
N.A. Retail Sales & Dealer Inventory – FY 2015
Market Share Growth Continues; Achieved Dealer Inventory Targets
N.A. Dealer InventoryN.A. Powersports Market Share & Retail Sales
Polaris N.A. retail 6% for Q4 and 5% FY 2015 vs. 2014Gained powersports share in Q4 and 2015 – #1 share leader for 6 consecutive years
Polaris year-end 2015 N.A. dealer inventory 5% vs. 2014ORV mid-single digits %, motorcycle over 50%, snowmobiles over 25%, Global Adjacent Markets
ATV RFM working well – SxS transitions to RFM in 2H 2016
2010 2011 2012 2013 2014 2015
-0%
+5%
Q4 1-26-16 9
Consolidated Market Share in UnitsUsing Total Motorcycle Industry
FY Retail SalesMarket Share-5% Existing ORV Models
2% New ORV models
5% Snowmobiles
2% Slingshot/Indian
1% New Dealers
5% Total Increase
+5%Grew Share in
2015

Q4 2015Actual
FY 2015Actual
Off-Road Vehicles (ORV)
10Q4 1-26-16
Maintain #1 Market Share Position
Every ORV product line grew retail sales in 2015Polaris ORV Q4 2015 retail sales were low-
single digitsSxS mid-single digits %ATV and ACE® low-single digits %
Oil region retail 10% in 2015; upper-teens % in Q4
ORV remains #1 and gaining market share MY‘16 products successful against aggressive
competitionRecently entered rec/utility category with the new
Polaris GENERAL™
Promotions and competitive pressures ongoing
SummaryPolaris ORV Vehicle Sales($ millions)
-2%$2,747.7
-20%$590.7

Snowmobiles
11Q4 1-26-16
Gaining Share Season-to-Date in Down Market
Q4 2015Actual
FY 2015Actual
N.A. Industry season-to-date (STD) retail over 20% – poor snow conditions
Polaris N.A. retail STD mid-teens % - largest share gainer STD
N.A. Dealer inventory for Polaris and Industry about 25%
New MY’16 RMK® sleds with AXYS® chassis selling well
#1 STD in mountains
Early Q1 2016 snow conditions have improved
SummaryPolaris Snowmobile Vehicle Sales
~Flat$322.8
-25%$103.5
($ millions)

Q4 2015Actual
FY 2015Actual
Motorcycles
12Q4 1-26-16
Motorcycle Growth Continues; Product Availability Improving
Polaris N.A. motorcycle Q4 retail sales low-single digits %, tough comps
Indian® ; retail, share, and dealer expansionVictory® ; low product availabilityMid to heavyweight Industry upper-single digits %Slingshot® over difficult Q4’14 comps
Scout Sixty™ introduced, the 2nd mid-sized Indian®
Appealing entry price point at $8,999
Aggressive 1H 2016 investment planned for Slingshot®
“Modern American Muscle” “Legendary” “Building an Icon”
Moto-Roadster
Acquired 2011 Est. 2014
+43%$147.9
+74%$607.9
Est. 1998
SummaryPolaris Motorcycle Vehicle Sales($ millions)

$67.0
$259.8
Q4 2015Actual
FY 2015Actual
Global Adjacent Markets (GAM)
13Q4 1-26-16
Growing Market Share & Continuous Quality Improvement
-21%$67.0
-4%$259.8
Axiam® sales in Q4 and 2015
#1 - gained share for 2015
National Accounts sales
Launched completely redesigned GEM®
Better ergonomics, lower costs, refreshed style
Military due to government spending delays
SummaryGlobal Adjacent Markets Vehicle Sales($ millions)

Q4 2015Actual
FY 2015Actual
82%
11%7%
FY 2015 by Reporting Segments
Parts, Garments & Accessories (PG&A)
14Q4 1-26-16
Favorable U.S. Results Offset by Canada & Int’l Due to Currency
+5% $781.1
Beginning in 2016, PG&A sales guidance is included within each reporting segment
PG&A Sales – All Businesses
53%
39%8%
Accessories
ApparelParts
FY 2015 Sales by Geography & Segment
+3%
+30% +4%
ORV/Snow
Motor-cycles
AdjacentMarkets
Reporting Segments
+10%
-17% +1%
U.S. Canada Int'l
Geography
FY 2015 Sales by Category
-7%$196.5
Motorcycles
Adjacent Markets
ORV/Snowmobiles
($ millions)
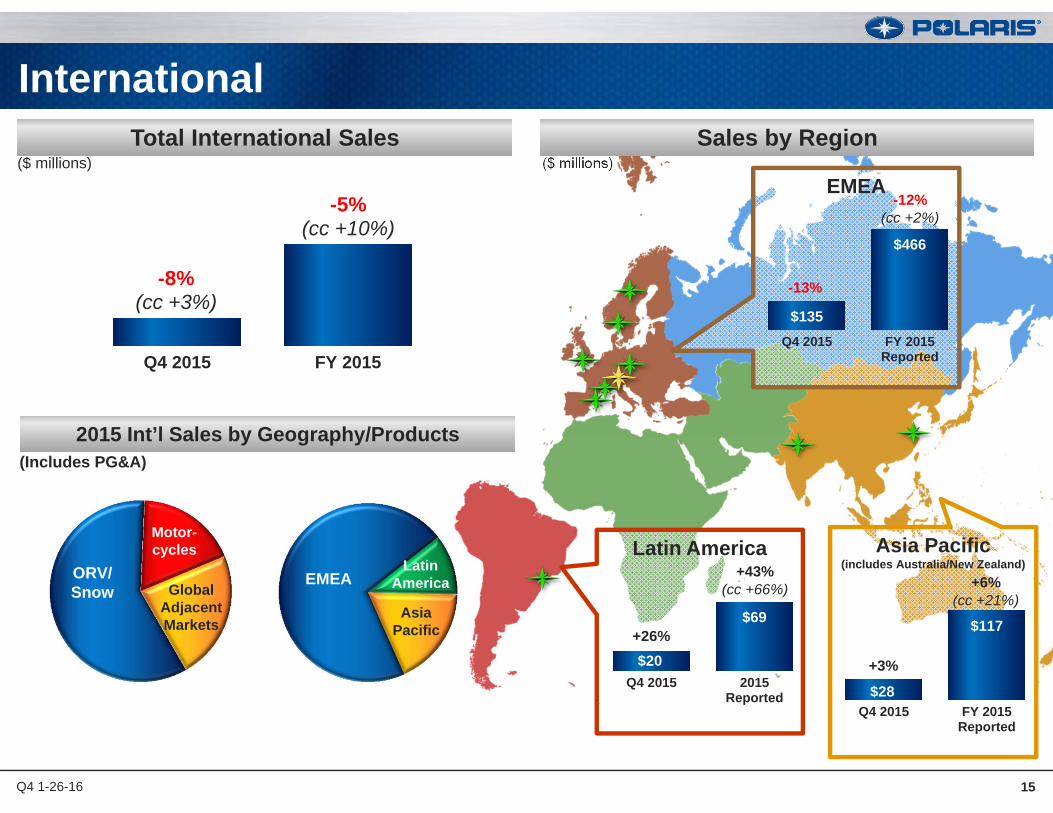
International
15Q4 1-26-16
($ millions)
Latin America
$20
$69
Q4 2015 2015Reported
Asia Pacific(includes Australia/New Zealand)
$28
$117
Q4 2015 FY 2015Reported
EMEA
$135
$466
Q4 2015 FY 2015Reported
-12%(cc +2%)
Q4 2015 FY 2015
-5%(cc +10%)
EMEA
Motor-cycles
ORV/Snow
Latin AmericaGlobal
AdjacentMarkets
Asia Pacific
Sales by RegionTotal International Sales
2015 Int’l Sales by Geography/Products
($ millions)
-8%(cc +3%)
-13%
+26%
+3%
+43%(cc +66%) +6%
(cc +21%)
(Includes PG&A)

Ken PucelE.V.P. Operations, Engineering & Lean
POLARIS INDUSTRIES INC.
Fourth Quarter & Full Year 2015 Earnings ResultsJanuary 26, 2016

Motorcycle – Spirit Lake Paint Update
17Q4 1-26-16
Motorcycle Paint Capacity Meets DemandSpirit Lake Paint Facility Upgrades
Upgrades to Spirit Lake Paint Systems
Spearfish and outsourcing to optimize mix
Organizational upgrades in Spirit Lake
Capacity planning and MES upgrades
Slingshot MY’17 moving to Huntsville
2016 Capacity Actions Spearfish Paint Facility On-Line
Paint Capacity Recovered and Ramping for 2016
1H 2015 2H 2015 1H 2016 2H 2016
Outsource
Spearfish
Spirit Lake
Demand

Huntsville Enables Lean and Facilitates Growth
18Q4 1-26-16
Huntsville Important Strategic Enabler in Plant Network
Improved Service Levels to Dealers
Accelerates Lean Progress reduced complexity in Plant network
Advanced TechnologiesCloser to our Customers
Gross Profit Improvement
Huntsville
Distribution Plant Network
Supply Chain
Dealers
$
Retail Flow Management
Slingshot in HuntsvilleEnables Slingshot & Motorcycles growth
Required Surge Capacity
Mike SpeetzenE.V.P. Finance & CFOPOLARIS INDUSTRIES INC.
Fourth Quarter & Full Year 2015 Earnings ResultsJanuary 26, 2016
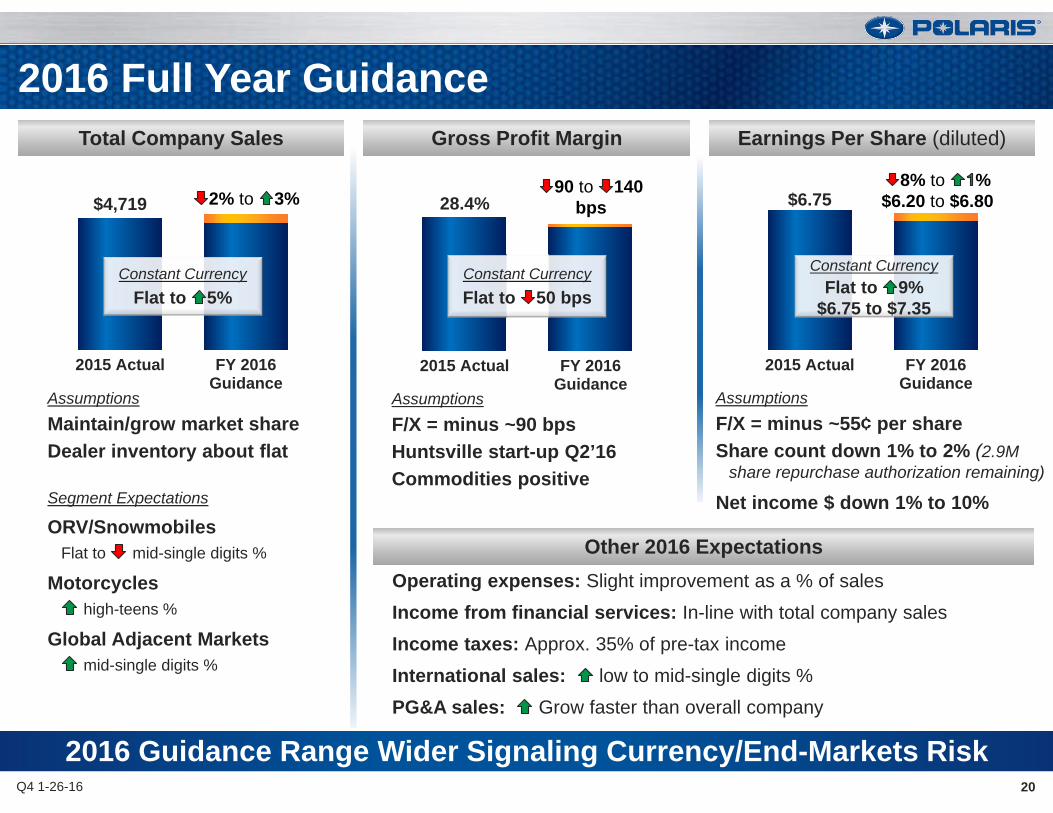
Earnings Per Share (diluted)Gross Profit Margin
20Q4 1-26-16
Total Company Sales
$4,719
2015 Actual FY 2016Guidance
28.4%
2015 Actual FY 2016Guidance
2016 Guidance Range Wider Signaling Currency/End-Markets Risk
$6.75
2015 Actual FY 2016Guidance
AssumptionsMaintain/grow market shareDealer inventory about flat
Segment Expectations
ORV/SnowmobilesFlat to mid-single digits %
Motorcycleshigh-teens %
Global Adjacent Marketsmid-single digits %
AssumptionsF/X = minus ~90 bpsHuntsville start-up Q2’16Commodities positive
AssumptionsF/X = minus ~55¢ per shareShare count down 1% to 2% (2.9M
share repurchase authorization remaining)
Net income $ down 1% to 10%
2016 Full Year Guidance
2% to 3%
Constant CurrencyFlat to 5%
Constant CurrencyFlat to 50 bps
Constant CurrencyFlat to 9%
$6.75 to $7.35
8% to %$6.20 to $6.80
90 to 140 bps
Other 2016 ExpectationsOperating expenses: Slight improvement as a % of sales
Income from financial services: In-line with total company sales
Income taxes: Approx. 35% of pre-tax income
International sales: low to mid-single digits %
PG&A sales: Grow faster than overall company

2015(Reclassified)
2016Guidance
Global Adjacent MarketsMotorcyclesORV / Snowmobiles
2015(Reclassified)
2016Guidance
Remain Optimistic for Modest Sales Growth & Market Share Gains
2016 Sales Guidance by Reporting Segments
+67%$698.3
UpHigh-teens %
IndianVictory
Slingshot
IndianVictory
Slingshot
PG&A
PG&A
2015(Reclassified)
2016Guidance
PG&A PG&A
Work & Transportation
Defense
Work & Transportation
Defense
Up mid-single digits %
Flat to down mid-single
digits %
ORV ORV
PG&A PG&A
Snowmobiles Snowmobiles
-1%$3,708.9
-3%$312.1
($ millions)
Q4 1-26-16 21
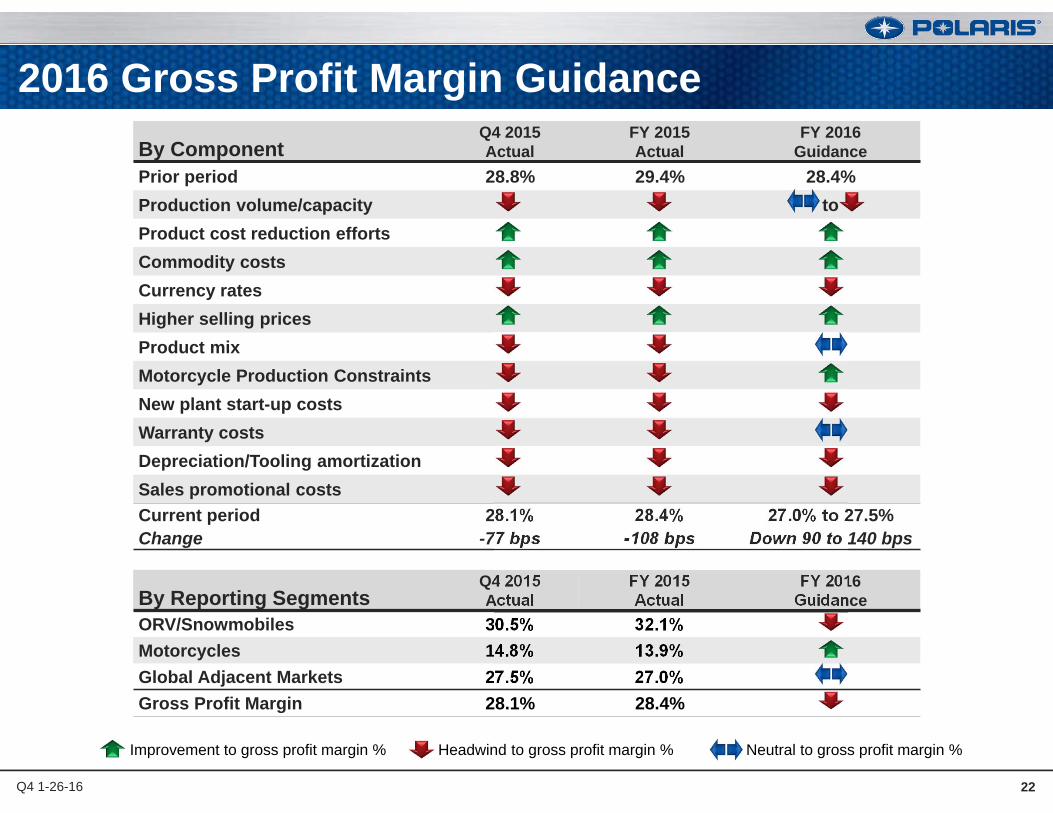
By ComponentQ4 2015Actual
FY 2015Actual
FY 2016Guidance
Prior period 28.8% 29.4% 28.4%Production volume/capacity toProduct cost reduction effortsCommodity costsCurrency ratesHigher selling pricesProduct mixMotorcycle Production ConstraintsNew plant start-up costsWarranty costsDepreciation/Tooling amortizationSales promotional costsCurrent period 28.1% 28.4% 27.0% to 27.5%Change -77 bps -108 bps Down 90 to 140 bps
By Reporting SegmentsQ4 2015Actual
FY 2015Actual
FY 2016Guidance
ORV/Snowmobiles 30.5% 32.1%Motorcycles 14.8% 13.9%Global Adjacent Markets 27.5% 27.0%Gross Profit Margin 28.1% 28.4%
2016 Gross Profit Margin Guidance
Improvement to gross profit margin % Headwind to gross profit margin % Neutral to gross profit margin %
Q4 1-26-16 22
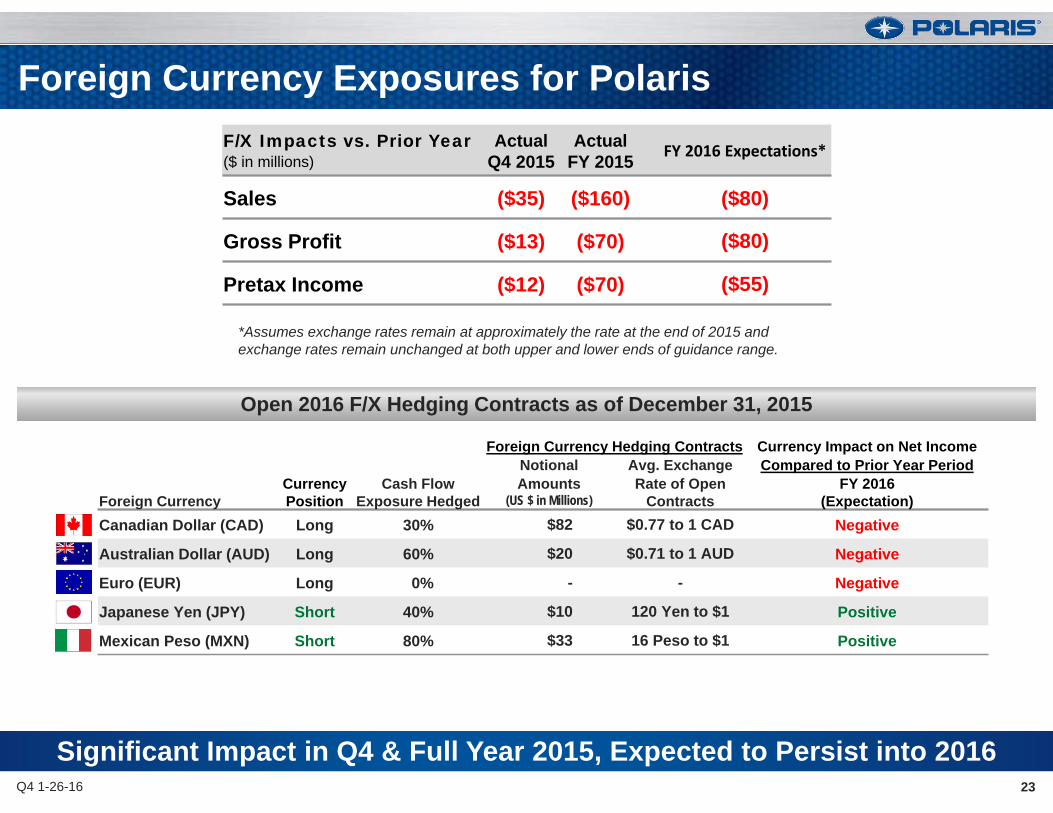
Significant Impact in Q4 & Full Year 2015, Expected to Persist into 201623
Foreign Currency Exposures for Polaris
Q4 1-26-16
Foreign Currency Hedging Contracts Currency Impact on Net IncomeNotional Avg. Exchange Compared to Prior Year Period
Foreign CurrencyCurrencyPosition
Cash FlowExposure Hedged
Amounts(US $ in Millions)
Rate of OpenContracts
FY 2016(Expectation)
Canadian Dollar (CAD) Long 30% $82 $0.77 to 1 CAD Negative
Australian Dollar (AUD) Long 60% $20 $0.71 to 1 AUD Negative
Euro (EUR) Long 0% - - Negative
Japanese Yen (JPY) Short 40% $10 120 Yen to $1 Positive
Mexican Peso (MXN) Short 80% $33 16 Peso to $1 Positive
F/X Impacts vs. Prior Year($ in millions)
ActualQ4 2015
ActualFY 2015 FY 2016 Expectations*
Sales ($35) ($160) ($80)
Gross Profit ($13) ($70) ($80)
Pretax Income ($12) ($70) ($55)
*Assumes exchange rates remain at approximately the rate at the end of 2015 and exchange rates remain unchanged at both upper and lower ends of guidance range.
Open 2016 F/X Hedging Contracts as of December 31, 2015

Polaris Financial Position
24Q4 1-26-16
Capital Summary Dec. 2015Cash DriversFav/(Unfav)Dec. 2015
Cash $ 155.3 +13%
Debt /Capital Lease Obligations $ 463.3 (105%)
Shareholders’ Equity $ 981.5 14%
Total Capital $1,444.8 33%
Debt to Total Capital 32% (11%)
2015
Operating cash flow 17%; factory inventory +144M vs. 2014
Increased share repurchases given current stock price
2016
Cap Ex expected to be slightly higher than 2015Reflects Huntsville, Spirit Lake Investments
Cash Flow significantly due to factory inventory
Operating Cash Flow
Strong Balance Sheet and Cash Flow Generation
ROIC*
CashYE 2014
OperatingActivities
Dividends Capex NetBorrow-
ings
ShareRepur-chase
Other CashQ3 2015
$138
$440 $139$249 $246 $294
$13 $155
$529$440
FY 2014 FY 2015 2016
38% 32%
FY 2014 FY 2015
*Defined as trailing 12 months net income divided by average total assets, minus average current liabilities
UpSignificantly
($ millions) ($ millions)
($ millions)
Expectations
-17%
2015 Summary
2016 Expectations
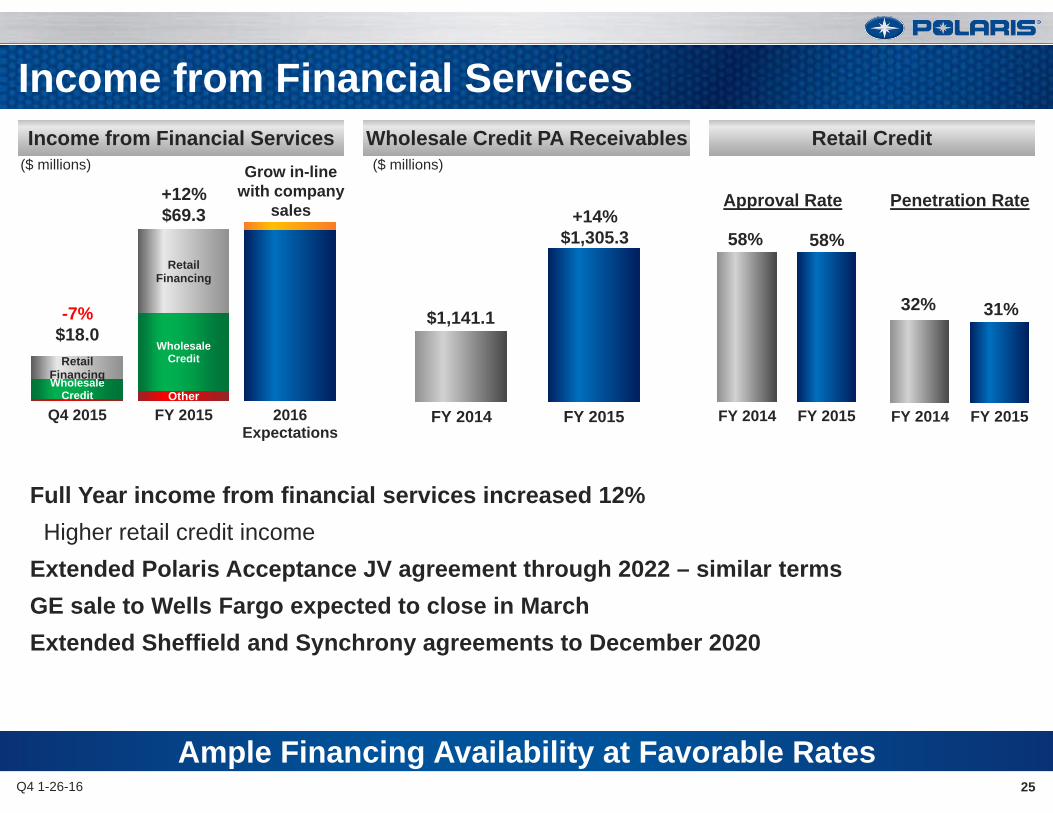
32% 31%
FY 2014 FY 2015
Retail CreditWholesale Credit PA Receivables
25Q4 1-26-16
Income from Financial Services
OtherWholesale
Credit
WholesaleCreditRetail
Financing
RetailFinancing
Q4 2015 FY 2015 2016Expectations
FY 2014 FY 2015
Ample Financing Availability at Favorable Rates
Income from Financial Services
Full Year income from financial services increased 12%Higher retail credit income
Extended Polaris Acceptance JV agreement through 2022 – similar termsGE sale to Wells Fargo expected to close in MarchExtended Sheffield and Synchrony agreements to December 2020
Approval Rate Penetration RateGrow in-line
with company sales
-7%$18.0
+12%$69.3 +14%
$1,305.3
$1,141.1
58% 58%
FY 2014 FY 2015
($ millions) ($ millions)

Scott W. WineChairman & CEO
Fourth Quarter & Full Year 2015 Earnings ResultsJanuary 26, 2016
POLARIS INDUSTRIES INC.
27
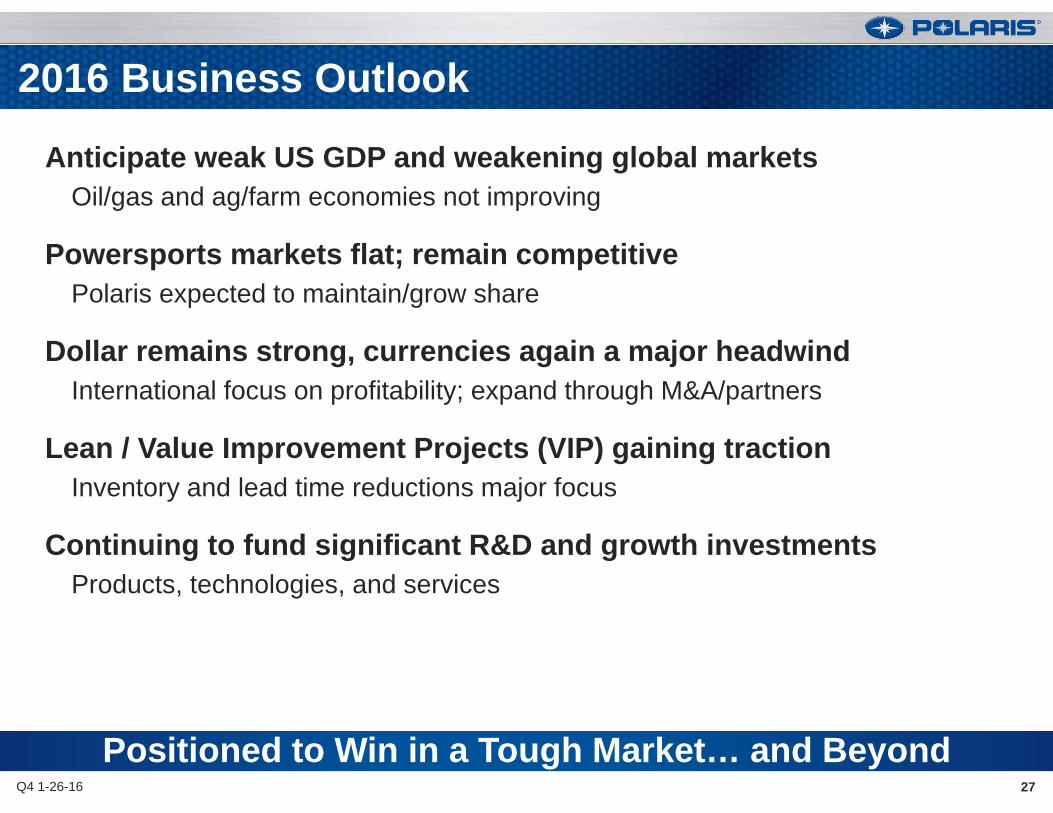
2016 Business Outlook
Q4 1-26-16
Anticipate weak US GDP and weakening global marketsOil/gas and ag/farm economies not improving
Powersports markets flat; remain competitivePolaris expected to maintain/grow share
Dollar remains strong, currencies again a major headwindInternational focus on profitability; expand through M&A/partners
Lean / Value Improvement Projects (VIP) gaining tractionInventory and lead time reductions major focus
Continuing to fund significant R&D and growth investmentsProducts, technologies, and services
Positioned to Win in a Tough Market… and Beyond


![Simulation of arctic low-level clouds observed during the ... › SHEBA › papers › artfire_R2.pdf · ∂T ++ + p εes = + -----[]PCC PCI PII PID PRES++ +– –PREC. 9 where u,](https://static.fdocuments.in/doc/165x107/5f1dfc362eb79013ce4285ab/simulation-of-arctic-low-level-clouds-observed-during-the-a-sheba-a-papers.jpg)