2015 Plan Update - WordPress.com · Fruithurst, Heflin, Ranburne, Heflin Water and Sewer Board and...
223
2 Cleburne County Hazard Mitigation Plan 2015 Plan Update
Transcript of 2015 Plan Update - WordPress.com · Fruithurst, Heflin, Ranburne, Heflin Water and Sewer Board and...

2
Cleburne County Hazard Mitigation Plan
2015 Plan Update

3
This page left intentionally blank

4
Prepared under the direction of the Hazard Mitigation Planning Committee, the Local Emergency
Planning Committee, and the Cleburne County Emergency Management Agency by:
236 Town Mart
Clanton, AL 35045
Office (205) 280-3027, Fax (205) 280-0543
www.leehelmsllc.com

5
This page left intentionally blank

6
Cleburne County Hazard Mitigation Plan
Table of Contents Introduction 11 Section One Planning Process 13
Plan Update Process 13
Continued Public Participation 13
Hazard Mitigation Planning Committee 14
Participation Guidelines 15
Committee and Public Meeting Schedule and Participation 16
Interagency and Intergovernmental Coordination 26
Integration with Existing Plans 27
Plan Adoption 27
Section Two General Characteristics 31
Growth Trends 32
General Geology 34
Section Three Cleburne County Risk Assessment 39
Hazard Profiles 54
I. Thunderstorms 54
II. Lightning 55
III. Hail 58
IV. Tornados 60
V. Floods/Flash Floods 66
VI. Droughts/Extreme Heat 72
VII. Winter Storms/Frost Freezes/Heavy Snow/Ice Storms/
Winter Weather/Extreme Cold 78
VIII. Hurricanes/Tropical Storms/Tropical Depressions/High Winds/
Strong Winds 80
IX. Sinkholes/Expansive Soils 85
X. Landslides 88
XI. Earthquake 90

7
XII. Wildfire 99
XIII. Dam Failure 101
Section Four Vulnerability Assessment 105
Socially Vulnerable Populations 112
Vulnerable Structures 116
Critical Facility Inventory 118
Development Trends 120
Methods of Warning 120
Vulnerability Summary 124
Estimated Loss Projections 124
Mitigating Potential Losses 128
Section Five Jurisdiction Assessments 131
Town of Edwardsville 133
Town of Fruithurst 147
City of Heflin 161
Town of Ranburne 177
Heflin Water and Sewer Board 191
Cleburne County Water Board 195
Section Six Mitigation Plan Maintenance 199
Incorporation into Existing Planning Mechanisms 202

8
Appendices
Appendix I Adopting Resolutions 203
Cleburne County EMA 205
Cleburne County 207
Town of Edwardsville 209
Town of Fruithurst 211
City of Heflin 213
Town of Ranburne 215
Heflin Water and Sewer Board 217
Cleburne County Water Board 219
LIST OF MAPS, FIGURES, & TABLES
Maps Page
2-1 Cleburne County General Location & Population Density 33

9
Figures
2-1 Geology of Alabama 37
3-1 Generalized Tornado Paths 63
3-2 Wind Zones in the United States 63
3-3 Sinkholes and Sinkhole Density Across Alabama 86
3-4 General Soils of Alabama 87
3-5 Landslide Incidence & Susceptibility in Cleburne County 89
3-6 National Seismic Hazard Mapping Project 96
3-7 Seismic Zones of the Southeastern United States 97
Tables
1-1 Cleburne County Existing Plans by Jurisdiction 29
2-1 Growth Trends in 1190-2013 Population 32
3-1 Cleburne County Hazard Probability of Future Occurrence 42
3-2 Cleburne County Hazard Identification by Jurisdiction 43
3-3 Cleburne County Prioritized Occurrence Threat by Jurisdiction
Based on Past Events 44
3-4 Cleburne County Mitigation Actions Prioritization 45
3-5 Cleburne County Hazard Events 46
3-6 Estimating Hail Size 59
3-7 Fujita Tornado Scales 65
3-8 Flood Probability Terms 68
3-9 Cleburne County NFIP Status by Jurisdiction 71
3-10 Heat Index/Heat Disorders 77
3-11 Saffir-Simpson Hurricane Wind Scale 82
3-12 Earthquake PGA, Magnitude, and Intensity Comparison 92
3-13 Wildfires in Cleburne County 2010-2013 99

10
3-14 Cleburne County Dams Risk Categories 103
3-15 Cleburne County Dam Inventory 104
4-1 Cleburne County Population Characteristics 113
4-2 Cleburne County Income Data 115
4-3 Cleburne County Housing Characteristics 116
4-4 Cleburne County Building Stock by General Occupancy 117
4-5 Cleburne County Building Exposure 117
4-6 Cleburne County Building Contents Exposure 117
4-7 Cleburne County Critical Facilities 119
4-8 Cleburne County Population Projections 120
4-9 Cleburne County Outdoor Warning Sirens 122
4-10 2014 Values Used for Monetary Conversion of Tornado Injuries and Deaths 125
4-11 Cleburne County Vulnerability Summary 126
4-12 Cleburne County Estimated Losses from Specified Hazards 127
4-13 Cleburne County Mitigation Actions 130
5-1 City of Edwardsville Risk & Vulnerability Overview 135
5-2 City of Edwardsville Hazard Events 136
5-3 City of Edwardsville Hazard Probability Assessment 142
5-4 City of Edwardsville Critical Facilities Inventory 143
5-5 City of Edwardsville Estimated Loss Projections from Specified Hazards 144
5-6 City of Edwardsville Mitigation Actions 145
5-7 Town of Fruithurst Risk & Vulnerability Overview 149
5-8 Town of Fruithurst Hazard Events 150
5-9 Town of Fruithurst Hazard Probability Assessment 156
5-10 Town of Fruithurst Critical Facilities 157
5-11 Town of Fruithurst Estimated Loss Projections from Specified Hazards 158
5-12 Town of Fruithurst Mitigation Actions 159
5-13 Town of Heflin Risk & Vulnerability Overview 163
5-14 Town of Heflin Hazard Events 164
5-15 Town of Heflin Hazard Probability Assessment 171
5-16 Town of Heflin Critical Facilities 172

11
5-17 Town of Heflin Estimated Loss Projections from Specified Hazards 173
5-18 Town of Heflin Mitigation Actions 174
5-19 Town of Ranburne Risk & Vulnerability Overview 179
5-20 Town of Ranburne Hazard Events 180
5-21 Town of Ranburne Hazard Probability Assessment 186
5-22 Town of Ranburne Critical Facilities 187
5-23 Town of Ranburne Estimated Loss Projections from Specified Hazards 188
5-24 Town of Ranburne Mitigation Actions 189
5-25 Heflin Water and Sewer Board Mitigation Actions 193
5-26 Cleburne County Water Board Mitigation Actions 197

12
Introduction
Cleburne County Hazard Mitigation Plan
The Cleburne County Hazard Mitigation Plan is a multi-jurisdictional, multi-hazard
mitigation plan. This plan fulfills the requirements set forth by the Federal Disaster Mitigation
Act of 2000 (DMA 2000). It meets all eligibility requirements set forth by the Federal
Emergency Management Agency (FEMA) for grant assistance. To date, assistance is available
from the following grant programs: the Hazard Mitigation Grant Program (HMGP), Flood
Mitigation Assistance Program (FMA), and Pre-Disaster Mitigation Program (PDM). The
Biggert-Waters Flood Insurance Reform Act of 2012 eliminated the Repetitive Flood Claims
Grant Program (RFC) and Severe Repetitive Loss Program (SRL) and incorporated these
elements into the FMA Program. The FMA Program now allows for up to 100% federal cost
share for severe repetitive loss properties; 90% federal cost share for repetitive loss properties;
and 75% federal cost share for repetitive loss properties.
This plan covers the entire county including all unincorporated areas, Edwardsville,
Fruithurst, Heflin, Ranburne, Heflin Water and Sewer Board and Cleburne County Water Board.
On October 30, 2000, the United States Congress passed the Disaster Mitigation Act of
2000, also known as DMA2K. Among its other features, DMA2K established a requirement that
in order to remain eligible for federal disaster assistance and grant funds, localities must develop
and adopt hazard mitigation plans as a condition of receiving mitigation project grants under the
Pre-Disaster Mitigation (PDM) Program and the Post-Disaster Hazard Mitigation Program
(HMGP). On February 26, 2002 (updated October 1, 2002 and October 28, 2003), the Federal
Emergency Management Agency (FEMA) published an Interim Final Rule (IFR) updated to the
Final Rule (FR) on October 1, 2013 that provides the guidance and regulations under which such
plans must be developed. The Final Rule (FR) provides detailed descriptions of both the planning
process that localities are required to observe, as well as the contents of the plan that emerges.
Cleburne County will continue to comply with all applicable federal and state statutes and
regulations related to hazard mitigation planning. In addition, Cleburne County will amend its
plan whenever necessary to reflect changes in countywide hazard mitigation.

13
Authority
Section 409 of the Robert T. Stafford Disaster Relief and Emergency Assistance Act
(Public Law 93-228, as amended), Title 44 Code of Federal Regulations, as amended by Section
201 of the Disaster Mitigation Act of 2000 requires that all state and local governments develop a
Hazard Mitigation Plan as a condition of receiving federal disaster assistance.
Funding
Funding for this plan update was made available through the Hazard Mitigation Grant
Program (HMGP). The grant’s Period of Performance is November 18, 2013 through November
18, 2014; however, an extension was granted to this POP making resulting in the expiration of
the grant being May 29, 2015. Cleburne County entered into an agreement with Lee Helms
Associates L.L.C. (LHA) to update the 2010 plan that was revised by the East Alabama Regional
Planning and Development Commission (EARPDC) and expires on November 23, 2015.
Scope
The Cleburne County Hazard Mitigation Plan includes all incorporated and
unincorporated areas in Cleburne County. The plan addresses all natural hazards identified by the
Federal Emergency Management Agency. All hazards that may affect Cleburne County and its
residents are identified. Hazard mitigation strategies are discussed in terms of goals, objectives
and mitigation actions. Responsibility for implementation of strategies is discussed and possible
funding sources are identified.
Purpose
“Mitigation is the cornerstone of emergency management. It's the ongoing effort to lessen
the impact disasters have on people's lives and property through damage prevention and flood
insurance” (http://www.fema.gov/fima/). The Cleburne County Hazard Mitigation Plan is an
effort to identify mitigation strategies that address the hazards to which Cleburne County is the
most vulnerable. This plan is only one of many means Cleburne County will take to achieve a
safer, more hazard-resistant environment for its residents.

14
Section One: Planning Process
Plan Update Process
The hazard mitigation planning update process began in June of 2014 after the Cleburne
County Emergency Management Agency (CCEMA) was awarded a planning grant from the
Alabama Emergency Management Agency (AEMA). The CCEMA received 75 percent funding
from the Federal Emergency Management Agency (FEMA). The remaining 25 percent was
provided locally through in-kind services. The 2015 plan update reflects the same basic structure
as the 2010 plan.
The Cleburne County mitigation plan is the representation of the county’s commitment to
reduce risks from natural hazards. In doing this, the number, location, extent and probability of
natural disasters occurring within the area were assessed. Previous 2010 plan information was
provided to each jurisdiction/local government Hazard Mitigation Planning Committee members
participating in the plan update. This information, which included updating of each jurisdiction’s
data tables, critical facilities and mitigation strategies, were the basis for the plan. Next, actions
that would reduce the loss of life or property in the area were considered. In doing this, all
jurisdictions, local governments, private-non-profits, first responders (police, fire and medical),
neighboring counties, and the general public were invited and encouraged to participate.
Jurisdictions, planning committee members, the public, and neighboring communities actively
participated by attending meetings and/or providing input by phone, fax, email, postal mail and
one-on-one contacts made by the EMA Director/Hazard Mitigation Planning Commission
Chairman. Three meetings will be held prior to plan approval by FEMA, all of which provide
the public an opportunity to participate in the planning process and provide public feedback to be
incorporated into the plan’s revision. Citizen input forms are also available at these meetings and
at the EMA Office for those who cannot attend the meetings, but wish to participate and provide
input into the plan.
Continued Public Participation
The plan will be available for the public to view at the Cleburne County Emergency
Operations Center, all City and Town Halls and the Cleburne County Courthouse.
After the initial plan was completed in 2005, it was made available for ongoing public
view and comment at the Cleburne County Emergency Operations Center, all City and Town

15
Halls, and the Cleburne County Courthouse. Each local government was instructed that
amendments or additions could be made to that plan at any time. Additional opportunities for
comment were provided at annual meetings held by the Cleburne County EMA. No meeting
notes or sign-in sheets were created and saved for these past meetings; however, they will be a
future requirement and placed in the next plan revision.
In the future, the County EMA will strive to gain more public participation in the
maintenance and updates of the county’s hazard mitigation plan by encouraging Parent Teacher
Organizations, Senior Citizens Clubs, Chamber of Commerce, Kiwanis Club, etc. by mail,
telephone, and personal contacts. In addition, the County EMA will encourage the county and
municipalities with websites and/or Facebook pages to place the 2015 plan on their site and offer
the public a place to comment on the plan.
Hazard Mitigation Planning Committee
Before beginning the plan update process, LHA staff coordinated with Mr. Steve
Swafford, Cleburne County EMA Director, to review the hazard mitigation planning committee.
All but four existing members were confirmed to continue service. Replacements were made and
new members were added to represent local governments participating in the plan for the first
time. Mr. Swafford, the Cleburne County EMA Director assumed the responsibility as Chairman
of the Hazard Mitigation Planning Committee. The Hazard Mitigation Planning Committee
(HMPC) consisted of the following members:
Cleburne County
Steve Swafford, County Administrator and EMA Director
Ryan Robertson, Cleburne County Commission, Ex-Officio Chairman
Crystal Cavender, Cleburne County EMA/911, Human Resource Officer
Kurt Turner, Cleburne County 911, Senior Communications Officer
Ted Beam, Department of Human Resources, Financial Worker
Sharon B. Clegg, Department of Human Resources, Finance Officer
Kelly Prescott, Department of Human Resources, Administrative Support Assistant
Shannon W. Robbins, Cleburne County Highway Department, County Engineer

16
Lee Helms, Lee Helms Associates, L. L. C./Contractor, Owner
Town of Edwardsville
Billy Driggers, Mayor (participated by emails, telephone calls and one-on-one visits)
City of Fruithurst
James Owens, Mayor (participated by emails, telephone calls and one-on-one visits)
City of Heflin
Shane Smith, City of Heflin, City Clerk
Town of Ranburne
Owen Lowrey, Mayor (participated by emails, telephone calls and one-on-one visits)
Heflin Water and Sewer Board
Donald Dewberry, Manager
Cleburne County Water Board
Mike Copeland, Manager
Participation Guidelines
The Chairman of the Hazard Mitigation Planning Committee set forth a list of
participation guidelines for the Hazard Mitigation Planning Committee:
1. At least one appointed representative from each participating local government should attend
all committee meetings. In the event of extenuating circumstances, the local government may
send a non-appointed representative. If a committee member cannot attend the meetings, he
or she will be contacted in person, by phone, by email, or by mail in order to obtain the
jurisdiction’s participation in the plan revision. The Towns of Edwardsville, Fruithurst and
Ranburne were not able to attend the committee meetings; however, they actively participated
by emails, telephone calls and one-on-one visits. Committee members are also encouraged to
attend neighboring communities’ HMPC meetings and participate in their plan updates.

17
2. Each local government should submit requested information to Cleburne County EMA or
LHA in a timely manner. Local governments should meet time frames and deadlines
established by the committee. In the event of extenuating circumstances, the Hazard
Mitigation Planning Committee Chairman may approve late submissions.
3. Committee members should fully cooperate with LHA and the Cleburne County EMA during
the update and finalization of the Cleburne County Hazard Mitigation Plan by providing the
best available information necessary to complete the plan.
4. Each participating jurisdiction must review mitigation strategies from the 2010 plan for
which they were responsible and provide new actions they wish to pursue in the future. The
local government must provide mitigation measures and the method used to prioritize the
actions. The selected actions must identify the hazard(s) being mitigated.
Committee and Public Meeting Schedule and Participation
Each jurisdiction, public and private nonprofits, general public, and neighboring
communities of Cherokee (Beverly Daniels, EMA Director, 256-927-3367), Calhoun (Jonathan
Gaddy, EMA Director, 256-435-0540), Talladega (Travis McGrady, EMA Director, 256-761-
2125), Clay (Theresa Daugherty, EMA Director, 256-396-5886), and Randolph (Donnie Knight,
EMA Director, 256-357-0014) in Alabama were invited and encouraged to participate in each of
the committee meetings. In the event they were unable to attend the meetings they were provided
meeting materials from the Cleburne County EMA or LHA prior to or immediately following the
missed meeting. Meeting materials were completed and returned via mail, fax, email, or by
scheduling an individual meeting with the Cleburne County EMA and/or LHA to be counted as
an active participant in the planning process. Neighboring communities were invited by phone
or email and encouraged to attend all committee meetings and provide input. None of these
communities attended any of the meetings; however during contacts made, all expressed their
willingness to help in the event of a disaster. Public meeting notices were published in the
Cleburne News at least seven days prior to the meeting date and included contact information for
assistance. Attendees at the meetings were asked to group themselves by jurisdiction in order to
review and complete meeting materials that required collaboration and provide other needed data.
Some individuals participated with and contributed to more than one jurisdiction as deemed

18
appropriate. A “Citizen Input on Hazard Mitigation Plan” form (sample found in this section)
was available at all meetings for general public citizens to complete. Committee representatives
were asked to take these forms and have their concerned citizens to complete. Zero forms were
completed during the planning process and are included in this section.
TO: Cleburne County Hazard Mitigation Planning Committee Beverly Daniel, Cherokee County EMA Jonathan Gaddy, Calhoun County EMA Travis McGrady, Talladega County EMA Theresa Daugherty, Clay County EMA Donnie Knight, Randolph County EMA FROM: Lee Helms, Lee Helms Associates, L. L. C. Steve Swafford, Cleburne County EMA SUBJECT: Cleburne County Hazard Mitigation Planning Committee Meeting Thursday, February 12, 2015 at 10 a.m. The Cleburne County Hazard Mitigation Planning Committee (HMPC) is in the process of revising the current Cleburne County Hazard Mitigation Plan. You are invited and encouraged to attend this meeting as you have been identified and have served as your entity’s point of contact for completion of hazard mitigation planning for the county. The mission of this meeting is to update the 2010 plan information, discuss in-kind contributions for the local match to this planning grant, and provide the public an opportunity to comment on the plan. You are welcome to bring any entity specific information that you would like to include in this plan update; otherwise, needed information will be discussed at this meeting. In order to comply with federal and state regulations involving funding that might be available to Cleburne County for natural hazards mitigation, the Cleburne County EMA will hold a public meeting of the HMPC at 10 a.m. on Thursday, February 12, 2015. The meeting will be held at the Cleburne County EMA Office located at the Cleburne County Mountain Center, 6751 Highway 78, Heflin, AL 36264. Mr. Lee Helms of Lee Helms Associates, L. L. C. (LHA) of Clanton, Alabama will be conducting this meeting, as well as all other meetings regarding the update of the Cleburne

19
County Hazard Mitigation Plan. LHA will ensure all federal and state requirements are met. The Cleburne County HMPC Meeting will not last longer than one hour. Your attendance and input is required for your department/agency/municipality to be eligible to receive future funding for any mitigation projects. If you have any questions, please contact the LHA Office at 205-280-3027, email [email protected], or fax 205-280-0543.

20
INITIAL MEETING AGENDA
2015 CLEBURNE COUNTY HAZARD MITIGATION PLAN UPDATE
Thursday, February 12, 2015 @ 10 a.m. Cleburne County EMA, 6751 Highway 78, Heflin, AL 36264
1. Introductions
• Sign-in sheets – please print and make sure your email is on the form 2. Project Background
• 2010 plan update was prepared by the East Alabama Regional Planning and Development Commission under the direction of the Hazard Mitigation Planning Committee and the Cleburne County Emergency Management Agency and adopted by:
o Cleburne County – Unincorporated o Edwardsville - Town o Fruithurst - City o Heflin - City o Ranburne – Town
• 2015 plan update will be prepared by Lee Helms Associates, L. L. C. under the direction of the Hazard Mitigation Planning Committee and the Cleburne County Emergency Management Agency
3. Project Participation
• Identify opportunities for public input into the 2015 plan update • Identify potential plan meeting participates that are not present today (municipalities, school
boards, engineers, hospitals, surrounding county EMAs, fire departments, etc.) o PNP’s are their own applicant
4. Project Schedule
• 2010 plan update expires November 23, 2015 • Period of Performance for the grant is November 18, 2013 – November 18, 2014; however, an
extension has been approved until May 29, 2015. • AEMA/Local Review = 30 days; Local response to a request for information (RFI) = 30 days;
AEMA review of local response to RFI = 30 days; FEMA Review = 45 days (allow 135 days at the least for plan approval)
• There will be an initial, mid-term, and final meeting. Committee members will be made aware of the meetings via email unless other means is requested. Information may be sent to LHA by fax 205-280-0543 or email to [email protected]. If you have any questions or need assistance, call LHA at 205-280-3027.
5. Project Tasks for this Meeting
• All general public attendees are to complete the form titled: “Citizen Input on Hazard Mitigation Planning” and leave completed form with LHA representative
• Update 2010 plan information – see handouts • Discuss in-kind contributions for local match to this planning grant • Set date and location for next meeting

21
Thursday, February 12, 2015 at 10 a.m. Cleburne County EMA, 6751 Highway 78, Heflin, AL 36264
Cleburne County Hazard Mitigation Planning Meeting 1
In the absence of the Chairman of the Hazard Mitigation Planning Committee, Mr. Steve
Swafford, Crystal Cavender opened the meeting. Lee Helms Associates, L. L. C. reviewed the
original plan with committee members and attendees and explained the update process.
Attendees were given worksheets and other materials related to the agenda topics in order to
review and provide data for the update. A total of 11 committee members or designees attended
the meeting, along with one LHA representative. No members of the general public were in
attendance.
• Lee Helms, LHA, Contractor
• Donald Dewberry, Heflin Water & Sewer Board, Manager
• Crystal Cavender, Cleburne County EMA/911, Human Resource Officer
• Ted Beam, Dept. of Human Resources, Financial Worker
• Shane Smith, City of Heflin, City Clerk
• Ryan Robertson, Cleburne County Commission, Ex-Officio Chairman
• Sharon B. Clegg, Dept. of Human Resources, Finance Officer
• Shannon W. Robbins, Cleburne County Highway Dept., County Engineer
• Kurt Turner, Cleburne County 911, Senior Communications Officer
• Kelly Prescott, Dept. of Human Resources, Administrative Support Assistant

22

23

24

25
SECOND MEETING AGENDA
2015 CLEBURNE COUNTY HAZARD MITIGATION PLAN UPDATE
Monday, June 29, 2015 @ 2 p.m.
Cleburne County EMA, 6751 Highway 78, Heflin, AL 36264
1. Introductions
• Sign-in sheets – please print and make sure your email is on the form.
2. Project Schedule Reminder
• 2010 plan update expires November 23, 2015
• Period of Performance for the grant is November 18, 2013 – November 18, 2014 (extended to November
27, 2015)
o AEMA/Local Review = 30 days; Local response to a request for information (RFI) = 30 days; AEMA
review of local response to RFI = 30 days; FEMA Review = 45 days (allowing 135 days at the least for
plan approval)
• There will be an initial, mid-term, and final meeting. Committee members will be made aware of the
meetings via email unless other means is requested. Information may be sent to LHA by fax 205-280-
0543 or email to [email protected]. If you have any questions or need assistance, call LHA at 205-
280-3027.
3. Project Tasks for this Meeting
• All general public attendees are to complete the form titled: “Citizen Input on Hazard Mitigation
Planning” and leave completed form with LHA representative
• Local EMA Director is to provide LHA with a copy of the media release for this meeting
• Update 2010 plan information and review 2015 plan information – see handouts
• Discuss in-kind contributions for local match to this planning grant

26
Monday, June 29, 2015 @ 2 p.m. Cleburne County EMA, 6751 Highway 78, Heflin, AL 36264
Cleburne County Hazard Mitigation Planning Meeting 2
The Chairman of the Hazard Mitigation Planning Committee, Mr. Steve Swafford,
opened the meeting. Lee Helms Associates, L. L. C. reminded the committee members and
attendees of the project schedule. Attendees were given worksheets and other materials related to
the agenda topics in order to review and provide data for the update. These worksheets were
previously emailed to participants with instructions on what information needs updating. A total
of 3 committee members or designees attended the meeting, along with one LHA representative.
• Steve Swafford, County Administrator and EMA Director
• Lee Helms, LHA, Contractor
• Crystal Cavender, Cleburne County EMA/911, Human Resource Officer
• Shane Smith, City of Heflin, City Clerk

27

28
Interagency and Intergovernmental Coordination
Interagency and intergovernmental coordination also played a vital part in the
development of this plan. Each of the agencies listed below were contacted via mail, email, fax,
or telephone requesting the best available data that they could contribute to the 2015 plan update.
All information provided was beneficial in completing risk and vulnerability assessments.
Federal Agencies
• National Weather Service provided storm event data
• United States Geological Survey provided information on general geology, earthquakes,
sinkholes, land subsidence, and landslides
• U.S. Army Corp of Engineers and HAZUS-MH 2.1 provided information on dams
• Federal Emergency Management Agency provided information throughout the plan,
including the National Flood Insurance Program information
• U.S. Department of Transportation’s Hazardous Material Information System provided
event data
• U.S. Department of Agriculture – Census of Agriculture provided land value per acre
• HAZUS-MH 2.1 provided estimation information on potential damage, economic loss,
and social impacts from natural disasters
State Agencies
• Alabama Emergency Management Agency provided hazard information throughout the
plan
• Geological Survey of Alabama provided information on general geology, earthquakes,
sinkholes, and landslides
• Alabama Department of Economic and Community Affairs provided the Alabama
Drought Management Plan, National Flood Insurance Program information and FEMA
flood map update information
• Forestry Commission provided information regarding wildfires

29
Regional Agencies
• East Alabama Regional Planning and Development Commission provided area planning
and development and transportation planning information, as well as maps pertaining to
plan information
Local Agencies
• Cleburne County Emergency Management Agency provided assistance in gathering data
Academia
• University of Alabama - Department of Geology
Integration with Existing Plans
Careful attention was taken when updating the plan so that it would not contradict or
conflict with any existing local subdivision regulations, zoning ordinances, comprehensive plans,
or standard building codes. Table 1-1 provides a list of the existing plans by jurisdiction.
Wherever appropriate, the East Alabama Regional Planning and Development Commission
economic development planning efforts have been integrated into this plan revision.
Local planning mechanisms by jurisdictions are listed in Table 1-1. Hazard mitigation
information and actions in this plan may be incorporated into these local planning mechanisms.
The mitigation action tables for each jurisdiction identifies who is responsible for the actions,
funding mechanisms and other resources available that will be pursued, prioritization of the
actions, and completion dates for each action. During the past five years, the jurisdictions
incorporated the previous hazard mitigation information into other planning mechanisms such
as emergency operations plans, comprehensive plans, community outreach events, strategic
plans, capital improvement plans, zoning ordinances, building codes, elevation certificates,
drainage ordinances and existing land use plans.
In order to expand on and improve these existing policies and plans, each participating
jurisdiction is committed to increasing hazard mitigation planning and action capability by being
involved and incorporating, where appropriate, mitigation planning and actions into local
planning initiatives and into public works and emergency management functions. While no
specific actions are planned for the immediate future for any participating jurisdiction, the next
comprehensive plan update may detail these actions further.

30
Plan Adoption
All jurisdictions in Cleburne County actively participated in the planning process.
Representatives from each local government attended each of the meetings and provided
information vital to the update of this plan. Upon completion of the plan each of the four
municipalities (Edwardsville, Fruithurst, Heflin and Ranburne) along with the Cleburne County
Commission, Heflin Water and Sewer Board and Cleburne County Water Board passed a formal
resolution adopting the plan. By adopting this multi-jurisdictional hazard mitigation plan the
listed participants will be eligible applicants for mitigation grant funds through the Pre-Disaster
Mitigation Program, Hazard Mitigation Grant Program, and Flood Mitigation Assistance
Program. Adopting Resolutions can be found in Appendix I.

31
Table 1-1: Cleburne County Existing Plans by Jurisdiction
PLAN/ POLICY
Edw
ards
ville
Frui
thur
st
Hef
lin
Ran
burn
e
Uni
ncor
pora
ted
Cou
nty
Comprehensive Plan N N Y N N
Strategic Plan N N Y N Y
Growth Management Plan N N N N N
Capital Improvement Plan N N Y N N
Zoning Ordinance N N Y N N
Building Code N N Y N N
Floodplain Management Plan N N N N N
Elevation Certificates N N Y N N
Drainage Ordinance N N Y N N
Emergency Operations Plan
Y
Y
Y
Y
Y
Critical Facilities Map N N N N N
Existing Land Use Map N N Y N N
State Plan
N
N
N
N
Y
Hazard Mitigation
Y
Y
Y
Y
Y
Strategic National Stockpile Plan Y Y Y Y
Y
Other N N N N N
Source: Participating Jurisdictions, 2015
32
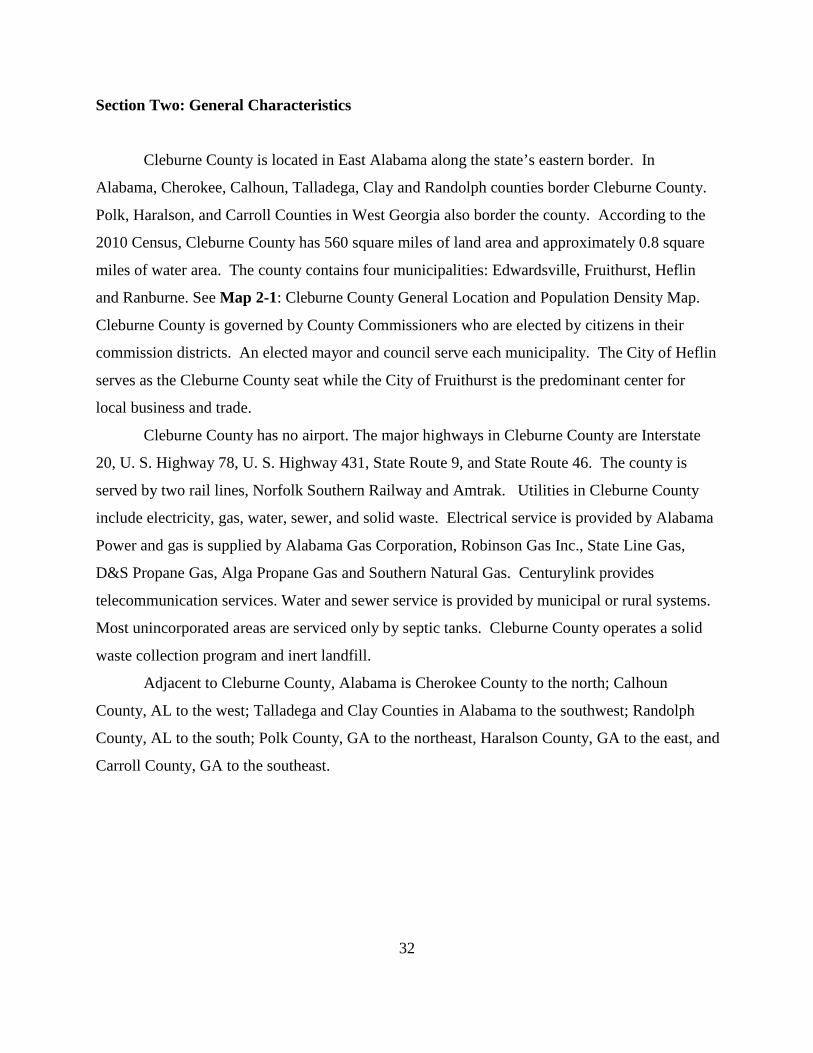
Section Two: General Characteristics
Cleburne County is located in East Alabama along the state’s eastern border. In
Alabama, Cherokee, Calhoun, Talladega, Clay and Randolph counties border Cleburne County.
Polk, Haralson, and Carroll Counties in West Georgia also border the county. According to the
2010 Census, Cleburne County has 560 square miles of land area and approximately 0.8 square
miles of water area. The county contains four municipalities: Edwardsville, Fruithurst, Heflin
and Ranburne. See Map 2-1: Cleburne County General Location and Population Density Map.
Cleburne County is governed by County Commissioners who are elected by citizens in their
commission districts. An elected mayor and council serve each municipality. The City of Heflin
serves as the Cleburne County seat while the City of Fruithurst is the predominant center for
local business and trade.
Cleburne County has no airport. The major highways in Cleburne County are Interstate
20, U. S. Highway 78, U. S. Highway 431, State Route 9, and State Route 46. The county is
served by two rail lines, Norfolk Southern Railway and Amtrak. Utilities in Cleburne County
include electricity, gas, water, sewer, and solid waste. Electrical service is provided by Alabama
Power and gas is supplied by Alabama Gas Corporation, Robinson Gas Inc., State Line Gas,
D&S Propane Gas, Alga Propane Gas and Southern Natural Gas. Centurylink provides
telecommunication services. Water and sewer service is provided by municipal or rural systems.
Most unincorporated areas are serviced only by septic tanks. Cleburne County operates a solid
waste collection program and inert landfill.
Adjacent to Cleburne County, Alabama is Cherokee County to the north; Calhoun
County, AL to the west; Talladega and Clay Counties in Alabama to the southwest; Randolph
County, AL to the south; Polk County, GA to the northeast, Haralson County, GA to the east, and
Carroll County, GA to the southeast.

33
Growth Trends
Cleburne County’s population increased during the years 1990-2019. All municipalities
experienced growth in population, with the exception of the Town of Edwardsville. Map 2-1:
Cleburne County General Location and Population Density Map depict the newest 2010 Census
Tracts and population concentrations in Cleburne County. Table 2-1 below shows the growth
trends for the county and its municipalities compared to the State of Alabama.
Table 2-1: Growth Trends 1990-2019
Change
1990-2019
Source: 2010 U.S. Bureau of Census; Calculations by LHA, 2015
4/1/1990 4/1/2000 4/1/2010 1/1/2014 1/1/2019 Number Percent
Edwardsville 276 189 202 200 201 -75 -73%
Fruithurst 214 254 284 288 290 76 36%
Heflin 2,848 3,222 3,480 3,465 3,488 640 23% Ranburne 332 370 409 409 413 81 24%
Cleburne County 12,733 14,124 14,972 15,014 15,126 2,393 19%
Alabama 4,041,281 4,447,032 4,779,736 4,852,988 4,960,057 918,776 23%

34
Map Update 2015

35
General Geology (Source: U. S. Department of the Interior/U. S. Geological Survey)
Geologic maps and their subsequent derivative products have immense economic and
societal value, and when these maps are current, digital, and Internet accessible, they are
particularly useful. Having knowledge of local geological units helps a community to locate and
develop mineral and water resources; assess and protect groundwater quality; safely site solid
and hazardous waste disposal facilities; construct, restore, maintain, and protect sensitive
ecosystems; and identify and prepare for such natural hazards as earthquakes, volcanic eruptions,
landslides, and land subsidence. Geologic maps can also show how the physical environment has
been impacted by human activity. Geologic maps enhance our ability to identify health hazards;
to site and build the community’s infrastructure of roads and highways, railroads, pipelines,
utilities, dams and locks, buildings, and foundations; and to make more informed land‐use and
planning decisions. . Geologic maps are fundamental elements for informing the policy decisions
of federal, state, and local agencies. Geologic units in Cleburne County, Alabama include the
following:
Phyllite undifferentiated (Precambrian - Paleozoic) – at surface, covers 0.1% of the area -
Phyllite undifferentiated. Lithology: slate.
Chickamauga Group; Middle Ordovician rocks; Rockmart Slate (Middle Ordovician) - at
surface, covers 0.1 % of the area. Lithology: beach sand; alluvium.
Newala Limestone (Ordovician) - at surface, covers 0.1 % of the area. Lithology:
limestone.
Knox Group undifferentiated (Ordovician-Cambrian) - at surface, covers 0.1 % of the
area. Lithology: dolostone (dolomite); limestone.
Frog Mountain (Devonian) - at surface, covers 0.1 % of the area. Lithology: sandstone.
Talladega Group; Cheaha Quartzite Member of Lay Dam Formation (Silurian-Devonian)
at surface, covers 0.1 % of this area – is white to light-gray medium to coarse-grained arkosic
quartzite and metaconglomerate. Lithology: quartzite; meta-conglomerate.
Poe Bridge Mountain Group; Garnet quartzite (garnetite) and garnitiferous altered mafic
rock (Precambrian to Paleozoic) - at surface, covers 0.1 % of the area – Rocks in the area of
Turkey Heaven Mountain in Cleburne and Randolph Counties that are here assigned to the Poe

36
Bridge Mountain Group also have been interpreted as part of the Wedowee Group. Lithology:
quartzite; mafic metavolcanic rock.
Poe Bridge Mountain Group; Roscoelite-graphite quartz schist and graphitic quartzite
(Precambrian to Paleozoic) at surface, covers < 0.1 % of this area - Poe Bridge Mountain
Group; Roscoelite-graphite quartz schist and graphitic quartzite. Rocks in the area of Turkey
Heaven Mountain in Cleburne and Randolph Counties that are here assigned to the Poe Bridge
Mountain Group also have been interpreted as part of the Wedowee Group. Lithology: schist;
quartzite
Poe Bridge Mountain Group (Precambrian to Paleozoic) at surface, covers < 0.1 % of
this area - Poe Bridge Mountain Group - coarse to fine-grained feldspathic graphite schist, +/-
staurolite +/- kyanite +/- sillimanite-muscovite-biotite schist, and garnet-biotite-muscovite schist,
and gneiss; locally common pegmatites. Rocks in the area of Turkey Heaven Mountain in
Cleburne and Randolph Counties that are here assigned to the Poe Bridge Mountain Group also
have been interpreted as part of the Wedowee Group. Lithology: mica schist; gneiss; pegmatite
Knox Group undifferentiated (Ordovician-Cambrian) at surface, covers < 0.1 % of this
area - Knox Group undifferentiated - Light-gray to light-brown locally sandy dolomite,
dolomitic limestone, and limestone; characterized by abundant light-colored chert. Lithology:
dolostone (dolomite); limestone; chert
Mad Indian Group (Precambrian to Paleozoic) at surface, covers < 0.1 % of this area -
Mad Indian Group - fine-grained feldspathic biotite gneiss; medium to coarse-grained
muscovite-biotite-garnet schist; locally kyanite and sillimanite. Many of the schists have been
retrograded to chlorite-garnet-quartz-sericite schist. Both mi and migr extensively cut by
feldspathic dikes and pegmatites. Lithology: felsic gneiss; schist; pegmatite
Ketchepedrakee Amphibolite (Precambrian to Paleozoic) at surface, covers < 0.1 % of
this area - Ketchepedrakee Amphibolite - dark-green to black fine to coarse-grained, layered to
massive amphibolite mixed with zones of chlorite actinolite schist, includes all amphibolite
associated with the Poe Bridge Mountain Group. Lithology: amphibolite; schist
Hillabee Greenstone (Paleozoic) at surface, covers < 0.1 % of this area - Hillabee
Greenstone - pale-green to light-olive-brown massive, fine-grained greenstone interbedded
locally with well-foliated mafic phyllite. Lithology: greenstone; phyllite

37
Talladega Group; No name on map (Silurian?-Devonian) at surface, covers < 0.1 % of
this area - No name on map - fossiliferous chert facies in vicinity of Jemison, Chilton County,
contains marine invertabrate fossils of early to Middle Devonian age. Lithology: chert
Weisner and Wilson Ridge Formations undifferentiated (Cambrian) at surface, covers <
0.1 % of this area - Weisner and Wilson Ridge Formations undifferentiated -- interbedded
quartzose to slightly feldspathic sandstone and laterally continous conglomerate in ledge-forming
units separated by greenish-gray silty mudstone. Lithology: sandstone; conglomerate; mudstone
Shady Dolomite (Cambrian) at surface, covers < 0.1 % of this area - Shady Dolomite -
bluish-gray or pale-yellowish-gray thick-bedded siliceous dolomite; characterized by coarsely
crystalline porous chert. Lithology: dolostone (dolomite); chert
Nichols Formation (Cambrian) at surface, covers < 0.1 % of this area - Nichols
Formation - massive to laminated greenish-gray and black micaceous mudstone containing
minor interbeds of siltstone and very fine-grained sandstone. Lithology: mudstone; siltstone;
sandstone
Cochran Formation (Cambrian) at surface, covers < 0.1 % of this area - Cochran
Formation - poorly sorted arkosic sandstone and conglomerate containing interbedded greenish-
gray siltstone and mudstone. The Cochran Formation is exposed only in northeastern Calhoun
and northwestern Cleburne Counties. Lithology: arkose; conglomerate; siltstone; mudstone
Chilhowee Group undifferentiated (Cambrian) at surface, covers < 0.1 % of this area -
Chilhowee Group undifferentiated - light to medium-gray arkose, arkosic conglomerate, and
discontinous mudstone overlain by greenish-gray mudstone with minor siltstone and sandstone;
dominantly light-gray pebbly quartzose sandstone in upper part. Lithology: conglomerate;
mudstone; siltstone; sandstone
Beaverdam Amphibolite (Precambrian to Paleozoic) at surface, covers < 0.1 % of this
area - Beaverdam Amphibolite - dark-green to dark-gray hornblende amphibolite, extensively
sheared and folded, and locally retrograded to actinolite-tremolite-chlorite schist. Includes all
amphibolite associated with the Wedowee Group. Lithology: amphibolite; schist

38
2014
Figure 2-1: Geology of Alabama (Source: University of AL – Geology Department)
Cleburne County →

39
This page left intentionally blank

40
Section Three: Risk Assessment
The risk assessment process is necessary to identify those natural hazards that pose a
threat to Cleburne County and its municipal jurisdictions. This process used information provided
by members of the Cleburne County Hazard Mitigation Planning Committee to identify these
hazards.
The county’s Hazard Probability Assessment Summary is shown in Table 3-1. A zero or
unknown denotes no data is available to determine the probability or affected area. Each
jurisdiction has an individual hazard probability assessment shown in Section Five of the plan.
Table 3-2 shows the hazards that pose a threat to each jurisdiction. Each jurisdiction was
responsible for identifying the hazards that pose a threat to their community.
Table 3-3 provides the prioritized occurrence threat by jurisdiction based on past events.
Occurrence prioritizations were based on the National Oceanic and Atmospheric Administration
(NOAA)-National Climatic Data Center (NCDC) reports of occurrences. Hazards are prioritized
as high, medium, or low threat designating the hazard with the most threat of occurrence as high.
Table 3-4 provides the mitigation actions prioritization by jurisdiction. Each jurisdiction
was responsible for prioritizing their proposed mitigation actions for the next five years. The
jurisdictions took into consideration the impacts of hazards they had experienced over the past
five years, as well as the mitigation actions available to help protect their jurisdictions and
citizens.
Tables 3-5 is the cornerstone for the hazard profiles that follow in this section. This table
contains data from the NOAA NCDC for a defined ten-year study period of January 1, 2003 –
December 31, 2013. The table shows events for all hazard types and provides the location, date,
type, magnitude, deaths and injuries, dollar amounts for property and crop damages, and total
damages.
As FEMA guidelines request that detailed event data be provided, the Hazard Mitigation
Committee agreed upon the new ten-year study period as a means of establishing a corrected
historical reference that utilized verifiable sources.
Event locations in the table labeled as “countywide” refer to an event that affected the
entire county, including all municipalities within. If there is an associated amount of damages,
they are assumed to be countywide. Countywide events are also listed in each municipality’s

41
event table in the individual Jurisdiction Assessment located in Section Five. There are events
labeled for specific unincorporated areas of the county that were identified as affected. Such
events will not be repeated in the individual jurisdiction tables since the location was site specific
and did not affect an incorporated jurisdiction.
Some events provided by the NOAA/NCDC are reported as statewide occurrences.
Hurricanes, droughts, and winter storms often have this type of far-reaching impact. In cases
such as this, the event is shown as a countywide event that affected all municipalities. The
county’s extent and probability of a hazard will be listed under each event description.
The extent of the hazard provides the range of magnitude or severity that could be
experienced by the county if such an event occurred. The hazard is classified using terms of
major, minor, and minimum based on the probability of future damage estimates providing
information on the range of magnitude or severity the county can anticipate from potential
hazardous events. A major ranking requires continuous action and participation from the entire
community and has a 100% or greater chance of an annual occurrence. A minor ranking involves
fewer people, effort, and area of community and has a 50% - 99% chance of an annual
occurrence. A minimum ranking involves a small number of people and plans for a specific
action and has a 49% or less chance of an annual occurrence.
Probability is the likelihood that events of particular severities will occur. The ability of
scientists and engineers to calculate probability varies considerably depending on the hazard in
question. In many areas, flood studies of various kinds can provide reasonably accurate estimates
of how often water will reach particular places and elevations. On the other hand, tornadoes and
earthquakes are nearly impossible to predict, except in the most general sense. The probability
(frequency) of the various hazards is drawn from a combination of sources, expertise, and the
NCDC Storm Event Database for Alabama.
For the 2015 plan update, the probability (%) that an identified hazard will occur on an
annual basis was determined using the following formula:
Number of historical or reported events in a time period divided by the number of years
the incidents occurred within = Probability of Future Annual Event Occurrences
Example: 13 Extreme Temperature events experienced divided by a 6 year
period; 13 divided 6 = >100%

42
A similar formula was used to determine an estimate of the expected damages from each
event:
Total amount of damages (in dollars) for each historical or reported event divided by the
number of damage causing events within the time period = Estimate of expected future
damages
Example: $172,000 total reported hail damage from 2003-2013 with 21 of those
being reported as damage causing; $172,000/21=$8,190

43
Table 3-1: Cleburne County
Hazard Probability of Future Occurrence
Natural Hazards Number of
Occurrences Between
2003-2013
Probability of Future
Occurrence Area Affected
Thunderstorm 38 >100% Countywide
Lightning 2 20% Countywide
Hail 23 >100% Countywide Tornado 4 40% Countywide Flood/Flash Flood 6 60% Countywide
Droughts/Extreme Heat 36 >100% Countywide
Winter Storm/Frost Freeze/Heavy Snow/Ice Storm/Winter Weather/ Extreme Cold
12 >100% Countywide
Hurricane/Tropical Storm/Tropical Depression/High Wind/ Strong Wind
8 80% Countywide
Sinkhole/Expansive Soil 2 20% Unincorporated County
Landslide Unknown Unknown N/A Earthquake 3 30% Countywide Dam/Levee Failure Unknown Unknown N/A
Wildfires: 2010 - 2013 155 >100% Countywide
Source: Participating Jurisdictions, 2015
Methodology: Probability of Future Occurrences was expressed by dividing the total number of occurrences by the ten-year study period, with the exception of wildfire being a 3-year study period. Zero or unknown denotes no data available to determine the probability of future occurrence or areas affected.

44
Table 3-2: Cleburne County Hazard Identification by Jurisdiction
Natural Hazards
Edw
ards
ville
Fr
uith
urst
H
eflin
R
anbu
rne
C
lebu
rne
Cou
nty
Thunderstorm
X
X
X
X
X
Lightning
X
X
X
X
X
Hail
X
X
X
X
X
Tornado
X
X
X
X
X
Flood/Flash Flood
X
X
X
X
X
Drought/Extreme Heat
X
X
X
X
X
Winter Storm/Frost Freeze/Heavy Snow/ Ice Storm/Winter Weather/Extreme Cold
X X X X X
Hurricane/Tropical Storm/Tropical Depression/High Wind/Strong Wind
X X X X X
Sinkhole/Expansive Soil
X X X X X
Landslide X X X X X
Earthquake
X
X
X
X
X
Wildfire
X
X
X
X
X
Dam/Levee Failure X X X X X
Source: Participating Jurisdictions 2015

45
Table 3-3: Cleburne County Prioritized Occurrence Threat by Jurisdiction Based on Past Events
Natural Hazards
E
dwar
dsvi
lle
Frui
thur
st
Hef
lin
Ran
burn
e
Cle
burn
e C
ount
y
Thunderstorm 6 6 4 6 2 Lightning 8 9 8 6 10 Hail 5 5 6 6 4 Tornado 6 9 8 7 8 Flood/Flash Flood 7 8 7 6 7 Drought/Extreme Heat 2 2 2 2 3 Winter Weather/Frost Freeze/Heavy Snow/Ice Storm/Winter Weather/ Extreme Cold
3 3 3 3 5
Hurricane/Tropical Storm/Tropical Depression/High Wind/Strong Wind 4 4 5 4 6
Sinkhole/Expansive Soil 7 8 7 6 11 Landslide 8 8 9 7 12 Earthquake 5 7 7 5 9 Wildfire – 2010-2013 1 1 1 1 1
Dam/Levee Failure 8 9 9 7 12 NOAA NCDC Storm Events Database; Alabama Forestry Commission; National Forestry Service; Alabama Geological Survey, 2015
Hazards are prioritized with the highest threat of occurrence assigned number one based on hazardous events that have occurred within each jurisdiction over the past ten years, with the exception of wildfires that were based on events that have occurred over the past three years. Some natural hazards have equal threats to a jurisdiction; therefore, their threat number will be the same. These prioritized threats may or may not be the same as the mitigation actions prioritization.

46
Table 3-4: Cleburne County Mitigation Actions Prioritization
Natural Hazards
Edw
ards
ville
Frui
thur
st
Hef
lin
Ran
burn
e
Cle
burn
e C
ount
y
Thunderstorm 1 1 1 1 1
Lightning 2 2 2 3 2
Hail 2 2 2 3 2
Tornado 1 1 1 1 1
Flood/Flash Flood 2 2 1 2 1
Drought/Extreme Heat 2 2 2 3 2
Winter Storm/Frost Freeze/Heavy Snow/ Ice Storm/Winter Weather/Extreme Cold
2 2 2 3 2
Hurricane/Tropical Storm/Tropical Depression/High Wind/Strong Wind
1 1 1 1 1
Sinkhole/Expansive Soil 2 2 2 3 2
Landslide 2 2 2 3 2
Earthquake 2 2 2 3 2
Wildfire 2 2 2 3 2
Dam/Levee Failure 2 2 2 3 2
Source: Participating Jurisdictions, 2014
Hazards are prioritized by jurisdictions based on past hazard experiences, vulnerabilities, and available mitigation actions with the hazard having highest priority of mitigation assigned number one. The mitigation actions prioritization may or may not be the same as the prioritized occurrence threats.

47
TABLE 3-5: CLEBURNE COUNTY HAZARD EVENTS
38 Thunderstorm Events – 01/01/2003 thru 12/31/2013 (4018 days) (Source: NOAA NCDC Storm Events Database)
Location County/Zone St. Date Time T.Z. Type Mag Dth Inj PrD CrD
COUNTYWIDE CLEBURNE CO. AL 05/02/2003 17:22 CST Thunderstorm Wind 55 kts. EG 0 0 12.00K 0.00K
HOLLIS XRDS CLEBURNE CO. AL 05/07/2003 14:15 CST Thunderstorm Wind 55 kts. EG 0 0 60.00K 0.00K
BORDEN SPGS CLEBURNE CO. AL 07/21/2003 16:45 CST Thunderstorm Wind 50 kts. EG 0 0 6.00K 0.00K
FRUITHURST CLEBURNE CO. AL 07/21/2003 16:50 CST Thunderstorm Wind 50 kts. EG 0 0 6.00K 0.00K
EDWARDSVILLE CLEBURNE CO. AL 05/09/2004 14:30 CST Thunderstorm Wind 50 kts. EG 0 0 1.00K 0.00K
COUNTYWIDE CLEBURNE CO. AL 06/22/2004 18:25 CST Thunderstorm Wind 60 kts. EG 0 0 10.00K 0.00K
HOLLIS XRDS CLEBURNE CO. AL 07/14/2004 16:30 CST Thunderstorm Wind 52 kts. EG 0 0 2.00K 0.00K
HEFLIN CLEBURNE CO. AL 11/24/2004 07:49 CST Thunderstorm Wind 50 kts. EG 0 0 17.00K 0.00K
HEFLIN CLEBURNE CO. AL 03/13/2005 20:52 CST Thunderstorm Wind 52 kts. EG 0 0 14.00K 0.00K
COUNTYWIDE CLEBURNE CO. AL 04/30/2005 04:31 CST Thunderstorm Wind 52 kts. EG 0 0 2.00K 0.00K
HEFLIN CLEBURNE CO. AL 06/02/2005 17:35 CST Thunderstorm Wind 55 kts. EG 0 0 19.00K 0.00K
HOLLIS XRDS CLEBURNE CO. AL 07/01/2005 15:15 CST Thunderstorm Wind 50 kts. EG 0 0 10.00K 0.00K
HEFLIN CLEBURNE CO. AL 07/04/2005 17:09 CST Thunderstorm Wind 52 kts. EG 0 0 37.00K 0.00K
RANBURNE CLEBURNE CO. AL 06/20/2006 16:05 CST Thunderstorm Wind 50 kts. EG 0 0 3.00K 0.00K
BORDEN SPGS CLEBURNE CO. AL 06/22/2006 16:00 CST Thunderstorm Wind 50 kts. EG 0 0 3.00K 0.00K
BELLTOWN CLEBURNE CO. AL 07/01/2007 16:05 CST-6 Thunderstorm Wind 60 kts. EG 0 0 10.00K 0.00K
FRUITHURST CLEBURNE CO. AL 07/20/2007 11:00 CST-6 Thunderstorm Wind 50 kts. EG 0 0 100.00K 0.00K
HEFLIN CLEBURNE CO. AL 02/26/2008 04:35 CST-6 Thunderstorm Wind 70 kts. EG 0 0 200.00K 0.00K
BEASONS MILL CLEBURNE CO. AL 06/11/2008 16:50 CST-6 Thunderstorm Wind 45 kts. EG 0 0 0.10K 0.00K
EDWARDSVILLE CLEBURNE CO. AL 06/11/2008 16:50 CST-6 Thunderstorm Wind 50 kts. EG 0 0 1.00K 0.00K
FRUITHURST CLEBURNE CO. AL 06/29/2008 16:18 CST-6 Thunderstorm Wind 50 kts. EG 0 0 2.00K 0.00K

48
CHULAFINNEE CLEBURNE CO. AL 07/22/2008 15:52 CST-6 Thunderstorm Wind 50 kts. EG 0 0 10.00K 0.00K
BELLTOWN CLEBURNE CO. AL 02/18/2009 15:55 CST-6 Thunderstorm Wind 50 kts. EG 0 0 1.00K 0.00K
HEFLIN CLEBURNE CO. AL 11/30/2010 10:41 CST-6 Thunderstorm Wind 50 kts. EG 0 0 4.00K 0.00K
HEFLIN CLEBURNE CO. AL 11/30/2010 10:41 CST-6 Thunderstorm Wind 50 kts. EG 0 0 3.00K 0.00K
ABEL CLEBURNE CO. AL 02/25/2011 01:22 CST-6 Thunderstorm Wind 50 kts. EG 0 0 1.00K 0.00K
HEFLIN CLEBURNE CO. AL 02/25/2011 01:22 CST-6 Thunderstorm Wind 50 kts. EG 0 0 2.00K 0.00K
HEFLIN CLEBURNE CO. AL 04/04/2011 20:08 CST-6 Thunderstorm Wind 50 kts. EG 0 0 0.00K 0.00K
UNION HILL CLEBURNE CO. AL 04/11/2011 20:24 CST-6 Thunderstorm Wind 60 kts. EG 0 0 10.00K 0.00K
MT PLEASANT CLEBURNE CO. AL 04/20/2011 23:33 CST-6 Thunderstorm Wind 50 kts. EG 0 0 1.00K 0.00K
HEFLIN CLEBURNE CO. AL 06/24/2011 17:07 CST-6 Thunderstorm Wind 45 kts. EG 0 0 1.00K 0.00K
BELLTOWN CLEBURNE CO. AL 06/24/2011 17:25 CST-6 Thunderstorm Wind 50 kts. EG 0 0 2.00K 0.00K
COLD WATER CLEBURNE CO. AL 03/02/2012 18:55 CST-6 Thunderstorm Wind 61 kts. EG 0 0 0.00K 0.00K
COLD WATER CLEBURNE CO. AL 03/02/2012 23:50 CST-6 Thunderstorm Wind 50 kts. EG 0 0 0.00K 0.00K
FRUITHURST CLEBURNE CO. AL 03/18/2013 15:27 CST-6 Thunderstorm Wind 55 kts. EG 0 0 0.00K 0.00K
MUSCADINE CLEBURNE CO. AL 03/18/2013 15:28 CST-6 Thunderstorm Wind 50 kts. EG 0 0 0.00K 0.00K
HIGH TOWER CLEBURNE CO. AL 04/11/2013 16:00 CST-6 Thunderstorm Wind 50 kts. EG 0 0 0.00K 0.00K
HOPEWELL CLEBURNE CO. AL 04/11/2013 16:15 CST-6 Thunderstorm Wind 55 kts. EG 0 0 0.00K 0.00K
Totals:
0 0 550.10K 0.00K
2 Lightning Events – 01/01/2003 thru 12/31/2013 (4018 days) (Source: NOAA NCDC Storm Events Database)
Location County/Zone St. Date Time T.Z. Type Mag Dth Inj PrD CrD
RANBURNE CLEBURNE CO. AL 05/07/2003 14:22 CST Lightning
0 0 70.00K 0.00K
HEFLIN CLEBURNE CO. AL 05/08/2003 15:00 CST Lightning
0 0 48.00K 0.00K
Totals:
0 0 118.00K 0.00K

49
23 Hail Events – 01/01/2003 thru 12/31/2013 (4018 days) (Source: NOAA NCDC Storm Events Database)
Location County/Zone St. Date Time T.Z. Type Mag Dth Inj PrD CrD
FRUITHURST CLEBURNE CO. AL 03/19/2003 16:23 CST Hail 0.75 in. 0 0 0.00K 0.00K
BORDEN SPGS CLEBURNE CO. AL 05/02/2003 15:25 CST Hail 0.75 in. 0 0 0.00K 0.00K
OAK LEVEL CLEBURNE CO. AL 05/02/2003 15:56 CST Hail 0.75 in. 0 0 0.00K 0.00K
ABEL CLEBURNE CO. AL 05/07/2003 14:00 CST Hail 1.00 in. 0 0 0.00K 0.00K
CHULAFINNEE CLEBURNE CO. AL 05/07/2003 14:05 CST Hail 0.75 in. 0 0 0.00K 0.00K
MICAVILLE CLEBURNE CO. AL 05/07/2003 14:24 CST Hail 1.00 in. 0 0 0.00K 0.00K
EDWARDSVILLE CLEBURNE CO. AL 05/07/2003 14:24 CST Hail 1.00 in. 0 0 0.00K 0.00K
RANBURNE CLEBURNE CO. AL 05/07/2003 14:30 CST Hail 1.00 in. 0 0 0.00K 0.00K
HEFLIN CLEBURNE CO. AL 02/21/2005 20:48 CST Hail 1.00 in. 0 0 0.00K 0.00K
HEFLIN CLEBURNE CO. AL 04/22/2005 20:14 CST Hail 0.88 in. 0 0 1.00K 0.00K
FRUITHURST CLEBURNE CO. AL 05/10/2005 18:58 CST Hail 0.75 in. 0 0 0.00K 0.00K
EDWARDSVILLE CLEBURNE CO. AL 12/28/2005 13:50 CST Hail 0.75 in. 0 0 0.00K 0.00K
FRUITHURST CLEBURNE CO. AL 04/08/2006 01:24 CST Hail 0.75 in. 0 0 0.00K 0.00K
HEFLIN CLEBURNE CO. AL 06/22/2006 15:20 CST Hail 0.75 in. 0 0 0.00K 0.00K
HOLLIS XRDS CLEBURNE CO. AL 02/17/2008 14:11 CST-6 Hail 0.75 in. 0 0 0.00K 0.00K
FRUITHURST CLEBURNE CO. AL 04/04/2008 15:08 CST-6 Hail 0.88 in. 0 0 0.00K 0.00K
BELLTOWN CLEBURNE CO. AL 05/20/2008 18:04 CST-6 Hail 1.00 in. 0 0 0.00K 0.00K
FRUITHURST CLEBURNE CO. AL 06/09/2008 15:38 CST-6 Hail 0.75 in. 0 0 0.00K 0.00K
HEFLIN CLEBURNE CO. AL 06/09/2008 16:45 CST-6 Hail 0.75 in. 0 0 0.00K 0.00K
BELLTOWN CLEBURNE CO. AL 02/18/2009 15:55 CST-6 Hail 1.75 in. 0 0 0.00K 0.00K
TRIKEM CLEBURNE CO. AL 02/18/2009 16:13 CST-6 Hail 4.25 in. 0 0 0.00K 0.00K
EDWARDSVILLE CLEBURNE CO. AL 02/18/2009 17:10 CST-6 Hail 0.88 in. 0 0 0.00K 0.00K
MICAVILLE CLEBURNE CO. AL 03/26/2011 22:05 CST-6 Hail 1.00 in. 0 0 0.00K 0.00K

50
Totals:
0 0 1.00K 0.00K
4 Tornado Events – 01/01/2003 thru 12/31/2013 (4018 days) (Source: NOAA NCDC Storm Events Database)
Location County/Zone St. Date Time T.Z. Type Mag Dth Inj PrD CrD
EDWARDSVILLE CLEBURNE CO. AL 03/06/2003 02:51 CST Tornado F1 0 0 0.00K 12.00K
HEFLIN CLEBURNE CO. AL 05/11/2008 01:36 CST-6 Tornado EF1 0 0 1.750M 0.00K
EDWARDSVILLE CLEBURNE CO. AL 05/11/2008 01:47 CST-6 Tornado EF1 0 0 50.00K 0.00K
CHULAFINNEE CLEBURNE CO. AL 08/25/2008 11:06 CST-6 Tornado EF2 0 0 100.00K 0.00K
Totals:
0 0 1.900M 12.00K
6 Flood/Flash Flood Events – 01/01/2003 thru 12/31/2013 (4018 days) (Source: NOAA NCDC Storm Events Database)
Location County/Zone St. Date Time T.Z. Type Mag Dth Inj PrD CrD
COUNTYWIDE CLEBURNE CO. AL 05/07/2003 16:00 CST Flash Flood
0 0 250.00K 0.00K
HEFLIN CLEBURNE CO. AL 05/08/2003 15:30 CST Flash Flood
0 1 8.00K 0.00K
COUNTYWIDE CLEBURNE CO. AL 09/16/2004 10:45 CST Flash Flood
0 0 50.00K 0.00K
COUNTYWIDE CLEBURNE CO. AL 11/24/2004 08:25 CST Flash Flood
0 0 6.00K 0.00K
HEFLIN CLEBURNE CO. AL 07/10/2005 19:00 CST Flash Flood
0 0 7.00K 0.00K
HEFLIN CLEBURNE CO. AL 01/30/2013 11:38 CST-6 Flash Flood
0 0 0.00K 0.00K
Totals:
0 1 321.00K 0.00K

51
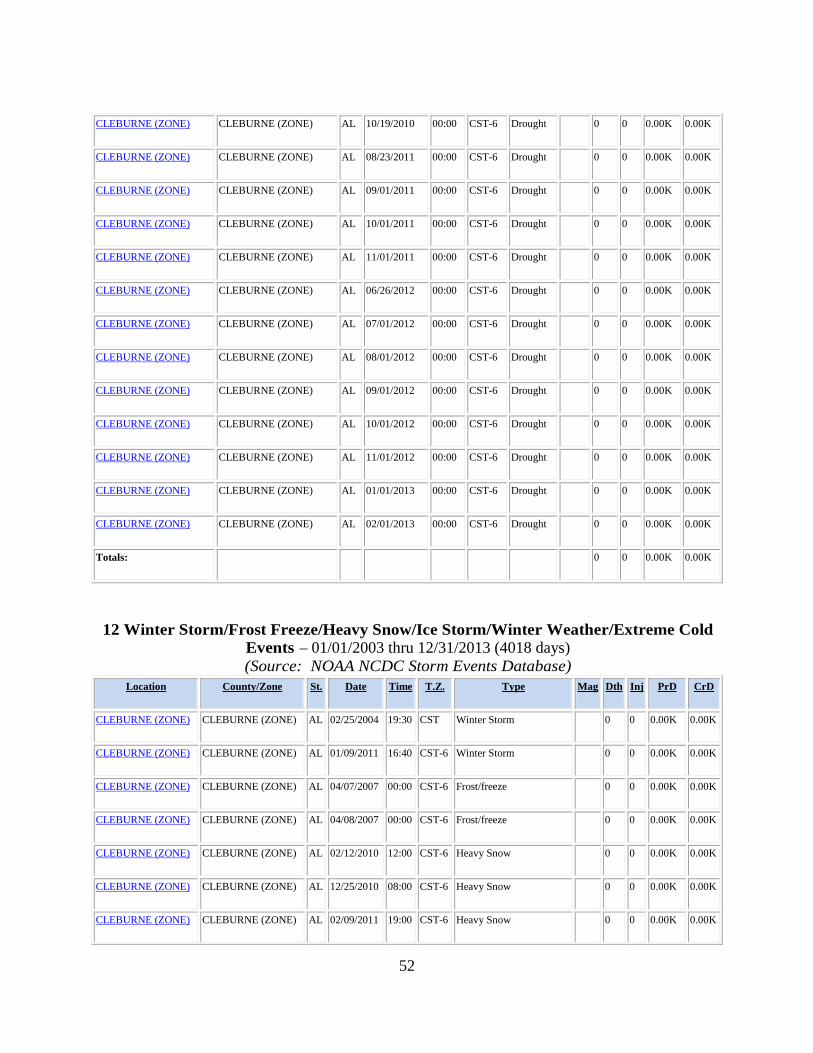
36 Drought/Extreme Heat Events – 01/01/2003 thru 12/31/2013 (4018 days) (Source: NOAA NCDC Storm Events Database)
Location County/Zone St. Date Time T.Z. Type Mag Dth Inj PrD CrD
CLEBURNE (ZONE) CLEBURNE (ZONE) AL 07/18/2006 07:00 CST Drought
0 0 0.00K 0.00K
CLEBURNE (ZONE) CLEBURNE (ZONE) AL 08/01/2006 00:00 CST Drought
0 0 0.00K 0.00K
CLEBURNE (ZONE) CLEBURNE (ZONE) AL 09/01/2006 00:00 CST Drought
0 0 0.00K 0.00K
CLEBURNE (ZONE) CLEBURNE (ZONE) AL 05/01/2007 00:00 CST-6 Drought
0 0 0.00K 0.00K
CLEBURNE (ZONE) CLEBURNE (ZONE) AL 06/01/2007 00:00 CST-6 Drought
0 0 0.00K 0.00K
CLEBURNE (ZONE) CLEBURNE (ZONE) AL 07/01/2007 00:00 CST-6 Drought
0 0 0.00K 0.00K
CLEBURNE (ZONE) CLEBURNE (ZONE) AL 08/01/2007 00:00 CST-6 Drought
0 0 0.00K 0.00K
CLEBURNE (ZONE) CLEBURNE (ZONE) AL 09/01/2007 00:00 CST-6 Drought
0 0 0.00K 0.00K
CLEBURNE (ZONE) CLEBURNE (ZONE) AL 10/01/2007 00:00 CST-6 Drought
0 0 0.00K 0.00K
CLEBURNE (ZONE) CLEBURNE (ZONE) AL 11/01/2007 00:00 CST-6 Drought
0 0 0.00K 0.00K
CLEBURNE (ZONE) CLEBURNE (ZONE) AL 12/01/2007 00:00 CST-6 Drought
0 0 0.00K 0.00K
CLEBURNE (ZONE) CLEBURNE (ZONE) AL 01/01/2008 00:00 CST-6 Drought
0 0 0.00K 0.00K
CLEBURNE (ZONE) CLEBURNE (ZONE) AL 02/01/2008 00:00 CST-6 Drought
0 0 0.00K 0.00K
CLEBURNE (ZONE) CLEBURNE (ZONE) AL 03/01/2008 00:00 CST-6 Drought
0 0 0.00K 0.00K
CLEBURNE (ZONE) CLEBURNE (ZONE) AL 04/01/2008 00:00 CST-6 Drought
0 0 0.00K 0.00K
CLEBURNE (ZONE) CLEBURNE (ZONE) AL 05/01/2008 00:00 CST-6 Drought
0 0 0.00K 0.00K
CLEBURNE (ZONE) CLEBURNE (ZONE) AL 06/01/2008 00:00 CST-6 Drought
0 0 0.00K 0.00K
CLEBURNE (ZONE) CLEBURNE (ZONE) AL 07/01/2008 00:00 CST-6 Drought
0 0 0.00K 0.00K
CLEBURNE (ZONE) CLEBURNE (ZONE) AL 08/01/2008 00:00 CST-6 Drought
0 0 0.00K 0.00K
CLEBURNE (ZONE) CLEBURNE (ZONE) AL 09/30/2008 06:00 CST-6 Drought
0 0 0.00K 0.00K
CLEBURNE (ZONE) CLEBURNE (ZONE) AL 10/01/2008 00:00 CST-6 Drought
0 0 0.00K 0.00K
CLEBURNE (ZONE) CLEBURNE (ZONE) AL 11/01/2008 00:00 CST-6 Drought
0 0 0.00K 0.00K
CLEBURNE (ZONE) CLEBURNE (ZONE) AL 12/01/2008 00:00 CST-6 Drought
0 0 0.00K 0.00K
52
CLEBURNE (ZONE) CLEBURNE (ZONE) AL 10/19/2010 00:00 CST-6 Drought
0 0 0.00K 0.00K
CLEBURNE (ZONE) CLEBURNE (ZONE) AL 08/23/2011 00:00 CST-6 Drought
0 0 0.00K 0.00K
CLEBURNE (ZONE) CLEBURNE (ZONE) AL 09/01/2011 00:00 CST-6 Drought
0 0 0.00K 0.00K
CLEBURNE (ZONE) CLEBURNE (ZONE) AL 10/01/2011 00:00 CST-6 Drought
0 0 0.00K 0.00K
CLEBURNE (ZONE) CLEBURNE (ZONE) AL 11/01/2011 00:00 CST-6 Drought
0 0 0.00K 0.00K
CLEBURNE (ZONE) CLEBURNE (ZONE) AL 06/26/2012 00:00 CST-6 Drought
0 0 0.00K 0.00K
CLEBURNE (ZONE) CLEBURNE (ZONE) AL 07/01/2012 00:00 CST-6 Drought
0 0 0.00K 0.00K
CLEBURNE (ZONE) CLEBURNE (ZONE) AL 08/01/2012 00:00 CST-6 Drought
0 0 0.00K 0.00K
CLEBURNE (ZONE) CLEBURNE (ZONE) AL 09/01/2012 00:00 CST-6 Drought
0 0 0.00K 0.00K
CLEBURNE (ZONE) CLEBURNE (ZONE) AL 10/01/2012 00:00 CST-6 Drought
0 0 0.00K 0.00K
CLEBURNE (ZONE) CLEBURNE (ZONE) AL 11/01/2012 00:00 CST-6 Drought
0 0 0.00K 0.00K
CLEBURNE (ZONE) CLEBURNE (ZONE) AL 01/01/2013 00:00 CST-6 Drought
0 0 0.00K 0.00K
CLEBURNE (ZONE) CLEBURNE (ZONE) AL 02/01/2013 00:00 CST-6 Drought
0 0 0.00K 0.00K
Totals:
0 0 0.00K 0.00K
12 Winter Storm/Frost Freeze/Heavy Snow/Ice Storm/Winter Weather/Extreme Cold Events – 01/01/2003 thru 12/31/2013 (4018 days) (Source: NOAA NCDC Storm Events Database)
Location County/Zone St. Date Time T.Z. Type Mag Dth Inj PrD CrD
CLEBURNE (ZONE) CLEBURNE (ZONE) AL 02/25/2004 19:30 CST Winter Storm
0 0 0.00K 0.00K
CLEBURNE (ZONE) CLEBURNE (ZONE) AL 01/09/2011 16:40 CST-6 Winter Storm
0 0 0.00K 0.00K
CLEBURNE (ZONE) CLEBURNE (ZONE) AL 04/07/2007 00:00 CST-6 Frost/freeze
0 0 0.00K 0.00K
CLEBURNE (ZONE) CLEBURNE (ZONE) AL 04/08/2007 00:00 CST-6 Frost/freeze
0 0 0.00K 0.00K
CLEBURNE (ZONE) CLEBURNE (ZONE) AL 02/12/2010 12:00 CST-6 Heavy Snow
0 0 0.00K 0.00K
CLEBURNE (ZONE) CLEBURNE (ZONE) AL 12/25/2010 08:00 CST-6 Heavy Snow
0 0 0.00K 0.00K
CLEBURNE (ZONE) CLEBURNE (ZONE) AL 02/09/2011 19:00 CST-6 Heavy Snow
0 0 0.00K 0.00K

53
CLEBURNE (ZONE) CLEBURNE (ZONE) AL 01/17/2013 14:00 CST-6 Heavy Snow
0 0 0.00K 0.00K
CLEBURNE (ZONE) CLEBURNE (ZONE) AL 01/28/2005 20:45 CST Ice Storm
0 0 40.00K 0.00K
CLEBURNE (ZONE) CLEBURNE (ZONE) AL 01/19/2008 06:00 CST-6 Winter Weather
0 0 0.00K 0.00K
CLEBURNE (ZONE) CLEBURNE (ZONE) AL 12/26/2010 03:00 CST-6 Winter Weather
0 0 0.00K 0.00K
CLEBURNE (ZONE) CLEBURNE (ZONE) AL 01/24/2003 00:00 CST Extreme Cold/wind Chill
0 0 0.00K 0.00K
Totals:
0 0 40.00K 0.00K
8 Hurricane/Tropical Storm/Tropical Depression/High Wind/Strong Wind Events – 01/01/2003 thru 12/31/2013 (4018 days)
(Source: NOAA NCDC Storm Events Database) Location County/Zone St. Date Time T.Z. Type Mag Dth Inj PrD CrD
CLEBURNE (ZONE) CLEBURNE (ZONE) AL 07/10/2005 18:00 CST Tropical Storm
0 0 24.00K 0.00K
CLEBURNE (ZONE) CLEBURNE (ZONE) AL 08/29/2005 23:30 CST Tropical Storm
0 0 25.00K 0.00K
CLEBURNE (ZONE) CLEBURNE (ZONE) AL 08/23/2008 12:00 CST-6 Tropical Depression
0 0 5.00K 0.00K
CLEBURNE (ZONE) CLEBURNE (ZONE) AL 11/09/2009 14:00 CST-6 Tropical Depression
0 0 2.00K 0.00K
CLEBURNE (ZONE) CLEBURNE (ZONE) AL 09/16/2004 09:00 CST High Wind 50 kts. EG 0 0 500.00K 0.00K
CLEBURNE (ZONE) CLEBURNE (ZONE) AL 09/07/2004 00:15 CST Strong Wind 33 kts. ES 0 0 1.00K 0.00K
CLEBURNE (ZONE) CLEBURNE (ZONE) AL 03/09/2006 18:00 CST Strong Wind 40 kts. EG 0 0 2.00K 0.00K
CLEBURNE (ZONE) CLEBURNE (ZONE) AL 12/20/2007 18:00 CST-6 Strong Wind 30 kts. EG 0 0 10.00K 0.00K
Totals:
0 0 569.00K 0.00K
2 Sinkhole Events – 01/01/2003 thru 12/31/2013 (4018 days)
(Source: U.S. Geological Survey) 2 sinkhole events occurred or were reported during 01/01/2003 thru 12/31/2013.
0 Landslide Events – 01/01/2003 thru 12/31/2013 (4018 days)
(Source: NOAA NCDC Storm Events Database/U.S. Geological Survey) No/unknown landslide events occurred or were reported during 01/01/2003 thru 12/31/2013.
54
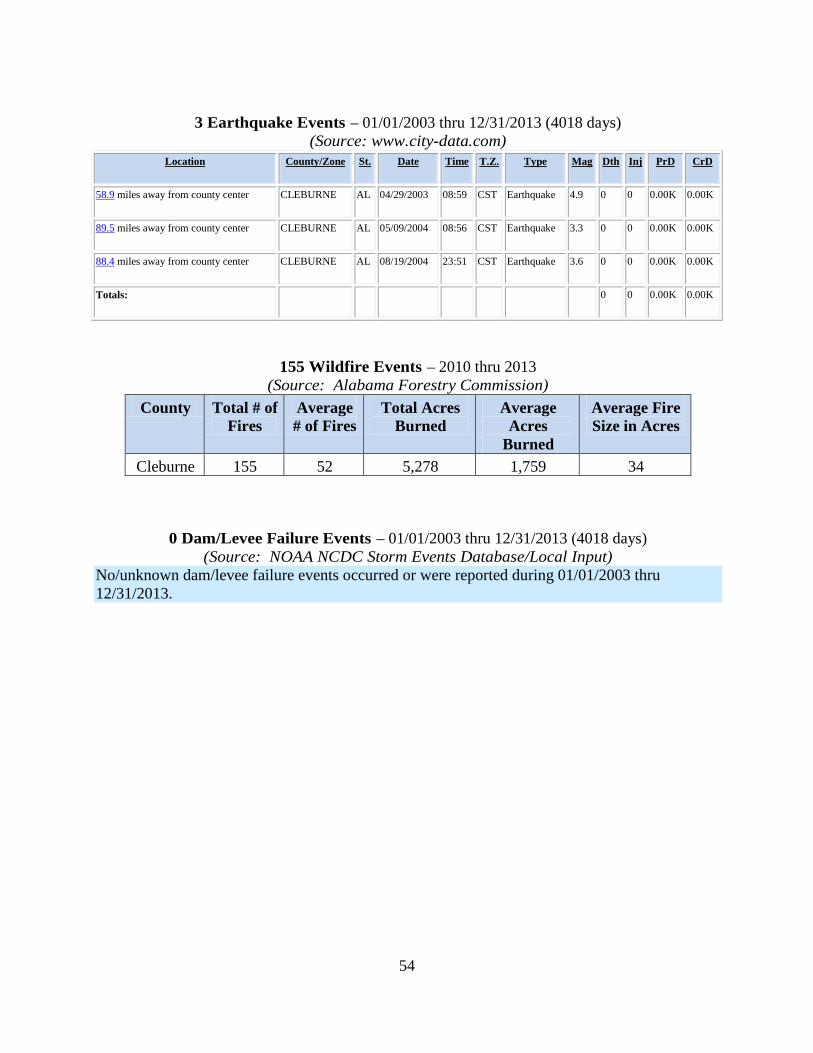
3 Earthquake Events – 01/01/2003 thru 12/31/2013 (4018 days) (Source: www.city-data.com)
Location County/Zone St. Date Time T.Z. Type Mag Dth Inj PrD CrD
58.9 miles away from county center CLEBURNE AL 04/29/2003 08:59 CST Earthquake 4.9 0 0 0.00K 0.00K
89.5 miles away from county center CLEBURNE AL 05/09/2004 08:56 CST Earthquake 3.3 0 0 0.00K 0.00K
88.4 miles away from county center CLEBURNE AL 08/19/2004 23:51 CST Earthquake 3.6 0 0 0.00K 0.00K
Totals:
0 0 0.00K 0.00K
155 Wildfire Events – 2010 thru 2013 (Source: Alabama Forestry Commission)
County Total # of Fires
Average # of Fires
Total Acres Burned
Average Acres
Burned
Average Fire Size in Acres
Cleburne 155 52 5,278 1,759 34
0 Dam/Levee Failure Events – 01/01/2003 thru 12/31/2013 (4018 days) (Source: NOAA NCDC Storm Events Database/Local Input)
No/unknown dam/levee failure events occurred or were reported during 01/01/2003 thru 12/31/2013.

55
Hazard Profiles
I. Thunderstorms
A thunderstorm is a convective cloud that often produces heavy rain, wind gusts, thunder,
lightning, and hail. Cleburne County experiences many thunderstorms each year. The county is
most susceptible to thunderstorms during the spring, summer, and late fall. Most of the damage
caused by thunderstorms results from straight-line winds, lightning, flash flooding, and hail.
Occasionally, thunderstorms will spawn tornados.
Primary effects from thunderstorms in Cleburne County would include:
1. High Winds, Straight-line Winds
2. Lightning
3. Flooding
4. Hail
5. Spawning Tornados
Hazardous results from significant thunderstorms in Cleburne County would include:
1. High winds can cause downed trees and electrical lines resulting in loss of power.
2. Severe storms are capable of producing intense lightning that poses many threats
to people and infrastructure and can ignite fires.
3. Heavy rains can produce severe storm water run-off in developed areas and cause
bodies of water to breach their banks.
4. Large hail can injure people and livestock and damage crops.
5. Severe thunderstorms can produce tornados that destroy anything in its path,
resulting in loss of power, shelter, and potential loss of life.
Table 3-5 shows the historical occurrences of thunderstorms during the study period.
Each jurisdiction is at risk for thunderstorm events. Of the 38 thunderstorms reported, 3 affected
the entire county, 18 occurred in an unincorporated county area, and the remaining 17 affected
only specific municipalities.
On February 26, 2008, an advancing cold front moving through Alabama caused
widespread wind damage across Heflin and a few tornadoes across Central Alabama, especially
in the eastern half of the state. Numerous trees and power lines were blown down across the
northern portion of the county. At least 10 buildings had roof damage due to downed trees, and at

56
least 3 buildings had roofs completely blown off. Several mobile homes in a mobile home park
suffered varying degrees of damage to underpinning, roofs, and structure. No injuries, deaths or
crop damages occurred. Property damages of $200,000 occurred.
On July 20, 2007, thunderstorms resulted in several trees and power lines being blown
down across East Central Cleburne County. A few homes suffered significant damage due to
fallen trees. No injuries, deaths, or crop damages occurred. Property damages of $100,000
resulted from this event.
Cleburne County experienced 38 thunderstorm events in a 10 year period resulting in a
greater than 100% (3.80) probability that a thunderstorm event will occur on an annual basis.
The total amount of damages for the 38 thunderstorm events was $550,100 with 31 thunderstorm
events causing damage resulting in an estimated $17,745 average property loss per event. The
referenced thunderstorm event(s) are the ones that resulted in the most damages, deaths, and
injuries during the past ten year period. The extent/range of magnitude or severity that could be
experienced by Cleburne County due to a thunderstorm event; the ranking is minor to major. The
highest winds produced by a thunderstorm was 80 miles per hour.
II. Lightning
Lightning is a natural phenomenon associated with all thunderstorms but can occur in the
absence of a storm. Lightning typically occurs as a by-product of a thunderstorm. Lightning is a
giant spark of electricity in the atmosphere or between the atmosphere and the ground. In the
initial stages of development, air acts as an insulator between the positive and negative charges
in the cloud and between the cloud and the ground; however, when the differences in charges
becomes too great, this insulating capacity of the air breaks down and there is a rapid discharge
of electricity that we know as lightning. Lightning can occur between opposite charges within
the thunderstorm cloud (Intra Cloud Lightning) or between opposite charges in the cloud and on
the ground (Cloud-To-Ground Lightning). Cloud-to-ground lightning is divided two different
types of flashes depending on the charge in the cloud where the lightning originates. Thunder is
the sound made by a flash of lightning. As lightning passes through the air it heats the air
quickly. This causes the air to expand rapidly and creates the sound wave we hear as thunder.
Normally, you can hear thunder about 10 miles from a lightning strike. Since lightning can strike
outward 10 miles from a thunderstorm, if you hear thunder, you are likely within striking
57
distance from the storm. The months of June through September are the deadliest as far as
lightning is concerned. In an average year, three people will be struck and killed by lightning in
Alabama and at least six will be injured. (Source: National Weather Service/Lightning Safety
Accessed 11/16/14). Each jurisdiction is equally at risk for lightning events. Lightning strikes
can cause power outages, fires, electrocution, and disruptions to communication systems. The
NOAA NCDC reported no lightning events during the ten-year study period of 2003-2013. Since
no lightning events were reported, no property damages, crop damages, injuries, or deaths were
reported as results of lightning events. Table 3-5 shows the historical occurrences of lightning
during the study period. The entire planning area of the county is equally at risk for a lightning
event. While the State of Alabama experienced 11-20 deaths as a result of lightning strikes
during 2003 – 2013, none of the deaths occurred in Cleburne County.
The action of rising and descending air in a thunderstorm separates positive and negative
charges, with lightning the result of the buildup and discharge of energy between positive and
negative charge areas.
Water and ice particles may also affect the distribution of the electrical charge. In only a
few millionths of a second, the air near a lightning strike is heated to 50,000°F, a temperature
hotter than the surface of the sun. Thunder is the result of the very rapid heating and cooling of
air near the lightning that causes a shock wave.
The hazard posed by lightning is significantly underrated. High winds, rainfall, and a
darkening cloud cover are the warning signs for possible cloud-to-ground lightning strikes. While
many lightning casualties happen at the beginning of an approaching storm, more than half of
lightning deaths occur after a thunderstorm has passed. The lightning threat diminishes after the
last sound of thunder, but may persist for more than 30 minutes. When thunderstorms are in the
area, but not overhead, the lightning threat can exist when skies are clear. Lightning has been
known to strike more than 10 miles from the storm in an area with clear sky above.
According to the National Oceanic and Atmospheric Administration (NOAA), an average
of 20 million cloud-to-ground flashes has been detected every year in the continental United
States. About half of all flashes have more than one ground strike point, so at least 30 million
points on the ground is struck on the average each year. In addition, there are roughly 5 to 10
times as many cloud-to-cloud flashes as there are to cloud-to-ground flashes (NOAA, July 7,

58
2003). During the years 2003-2013, Alabama experienced 11 deaths due to lightning (NOAA,
December 18, 2014). The months of June through September are the deadliest as far as lightning
is concerned. In an average year, three people will be struck and killed by lightning in Alabama
and at least six will be injured. (Source: NOAA, December 18, 2014).
Cloud-to-ground lightning can kill or injure people by either direct or indirect means. The
lightning current can branch off to strike a person from a tree, fence, pole, or other tall object. It
is not known if all people are killed who are directly struck by the flash itself. In addition,
electrical current may be conducted through the ground to a person after lightning strikes a
nearby tree, antenna, or other tall object. The current also may travel through power lines,
telephone lines, or plumbing pipes to a person who is in contact with an electric appliance,
telephone, or plumbing fixture. Lightning may use similar processes to damage property or
cause fires.
On May 7, 2003, lightning struck a home on Webb Drive in Ranburne that resulted in a
fire that damaged 50% of the home. Another lightning strike caused minor damage to a home on
SR 46. Property damages of $70,000 occurred.
On May 8, 2003, lightning was believed responsible for fires at three houses in and east
of Helfin. Property damages of $48,000 occurred. Cleburne County experienced 2 lightning
events in a 10 year period resulting in a 20% (0.20) probability that a lightning event will occur
on an annual basis. The total amount of damages for the 2 lightning events was $118,000 with 2
lightning events causing damage resulting in an estimated $59,000 of expected annual damages
from future events. The extent/range of magnitude or severity that could be experienced by
Cleburne County due to a lightning event is based on the Vaisala’s National Lightning Detection
Network (NLDN) at NOAA.gov and is 6-8 average flash density fl/sq mi/yr cloud-to-ground
lightning incidences
Primary effects from lightning in Cleburne County would include:
1. Power Outages
2. Wild Fires
3. Electrocution
4. Disruption of Communication Waves

59
Hazardous results from significant lightning in Cleburne County would include:
1. Power outages result in tremendous losses for food distributors and individuals due
to loss of refrigeration as well as disruptions to routine business operations.
2. Fires destroy most everything it comes in contact with and also can be detrimental
to the health of any living organism due to the massive smoke cloud it produces.
3. Electrocution of electronic device such as water and sewer pumps can cause
disruption in service leading to unsanitary conditions and lack of potable water.
4. Disrupted communications from electrical storms can result in inability to
communicate with other agencies, making preparation or recovery from a storm
nearly impossible.
III. Hail
Hail is frequently associated with severe thunderstorms. Hail is an outgrowth of severe
thunderstorms and develops within a low-pressure front as warm air rises rapidly in to the upper
atmosphere and is subsequently cooled, leading to the formation of ice crystals. These are
bounced about by high-velocity updraft winds and accumulate into frozen droplets, falling as
precipitation after developing enough weight (FEMA, 1997).
The National Weather Service (NWS) defines severe thunderstorms as those with
downdraft winds in excess of 58 miles an hour and/or hail at least 3/4 inches in diameter. While
only about 10 percent of thunderstorms are classified as severe, all thunderstorms are dangerous
because they produce numerous dangerous conditions, including one or more of the following:
hail, strong winds, lightning, tornadoes, and flash flooding (National Weather Service –
Flagstaff). The size of hailstones varies and is related to the severity and size of the thunderstorm
that produced it. The higher the temperatures at the Earth’s surface, the greater the strength of the
updrafts, and the greater the amount of time the hailstones are suspended, giving the hailstones
more time to increase in size. Hailstones vary widely in size, as shown in Table 3-6. Note that
penny size (3/4 inches in diameter) or larger hail is considered severe.

60
Table 3-6: Estimating Hail Size
Size Inches in Diameter Pea ¼ inch Marble/mothball ½ inch Dime/Penny ¾ inch Nickel 7/8 inch Quarter 1 inch Ping-Pong Ball 1 ½ inch Golf Ball 1 ¾ inch Tennis Ball 2 ½ inch Baseball 2 ¾ inch Tea Cup 3 inches Grapefruit 4 inches Softball 4 ½ inches Source: NWS, January 10, 2003
Hailstorms occur most frequently during the late spring and early summer, when the jet
stream moves northward across the Great Plains. During this period, extreme temperature
changes occur from the surface up to the jet stream, resulting in the strong updrafts required for
hail formation.
The NOAA NCDC reported 23 hail events during the ten-year study period of 2003-2013.
An estimated $1,000 in property damage resulted from these events. No crop damage, injuries, or
deaths were reported during these hail events. Table 3-5 shows the historical occurrences of hail
events during the study period. Each jurisdiction is at risk for hail. Of the events reported, zero
affected the entire county, 10 occurred in an unincorporated county area, and the remaining 13
affected only specific municipalities.
On April 22, 2005, Heflin experienced hail magnitude of 0.88 inches (nickel size).
Property damages of $1,000 resulted.
On February 18, 2009, a hail event from a powerful low pressure system and associated
cold front pushed through the Trikem area, and helped trigger numerous thunderstorms. Some

61
became supercells that produced long swaths of large hail, areas of damaging winds, and at least
one tornado. Cleburne County experienced hail magnitude of 4.25 inches (softball size) on
Interstate 20 between mile markers 196 and 199, resulting in no property damage across the area.
No injuries, deaths, property or crop damages occurred.
Cleburne County experienced 23 hail events in a 10 year period resulting in a greater than
100% (2.30) probability that a hail event will occur on an annual basis. The total amount of
damages for the 23 hail events was $1,000 with 1 hail event causing damage resulting in an
unknown amount of expected annual damages from future events. The referenced hail event(s)
are the ones that resulted in the most damages, deaths, and injuries during the past ten year
period and serves as the extent/range of magnitude or severity that could be experienced by
Cleburne County due to a hail event; the ranking is minor to major. The largest size hail
Cleburne County experienced was 4.25 inches (softball size).
Primary Effects from Hail in Cleburne County would include:
1. Property Damage
2. Crop Damage
3. Communication equipment damage
4. Livestock loss and injury
Hazardous results from significant Hail in Cleburne County would include:
1. Any size hail can damage exposed real and personal property. Hail is a major
problem for car dealerships, as the unprotected lots of cars receive major damage.
2. Heavy hail is capable of destroying entire crop yields. Farmers of above ground
crops are especially concerned with hail as it is extremely detrimental to the crop.
3. Communication equipment, such as receivers, is susceptible to large hail. These
instruments can be seriously damaged or destroyed by large hail.
4. Large hail is a danger to livestock of all sorts and is a threat farmers must
consider. Hundreds of thousands of dollars are invested in these animals which
may be injured or killed in a hailstorm.

62
IV. Tornados
Tornados are rotating columns of air extending downward to the ground with recorded
winds in excess of 300 miles per hour. Most tornadoes last less than 30 minutes, but can exist for
more than an hour. In Alabama the typical tornado season extends from March through early
June, with April and June being peak months for tornado activity. Additionally, Alabama
experiences a secondary tornado season from November through December. Figure 3-1 shows
the general paths of tornados across the United States.
Figure 3-2 shows the FEMA designated wind zones in the United States. Cleburne
County is located in Zone IV which warrants profiling. Zone IV has witnessed a higher
frequency of tornados than any other zone. Zone IV has also witnessed some of the deadliest
tornados in history.
A total of four tornados occurred in Cleburne County according to NOAA NCDC during
2003 - 2013. An estimated $1.9 million in property damage, $12,000 in crop damage, and no
injuries or deaths occurred as a result of the reported tornados.
A tornado event resulting in $12,000 crop damages occurred in the Edwardsville
Community on March 6, 2003 with a F1 tornado, 5.9 miles in length and 250 yards wide.
The most significant event during the study period occurred in the area of Heflin on May
11, 2008 with an EF1 tornado, 3.78 miles in length and 1,000 yards wide. The tornado touched
down along the Talladega Scenic Drive, just south of US Highway 78. It then moved along a
slightly curved path until it crossed CR-79. Next, it tracked almost due east as it produced its
most concentrated damage near SR-9. The tornado lifted near the end of Brockford Road in the
vicinity of Shadow Lane, on the east side of the City of Heflin. Hundreds of trees were either
snapped off or uprooted along the path. Eight homes were destroyed and more than 40 others
received significant damage. Property damages of $1.75 million occurred.
A tornado event occurred in the area of Chulafinnee on August 25, 2008 with an EF2
tornado, .36 miles in length and 400 yards wide. This tornado event was a result of Tropical
Storm Fay and its remnants after landfall. The tornado touched down on US-431, about a half
mile south of the intersection with AL-281. It then moved northwestward, along and just east of
US-431, and lifted just before reaching AL-281. One gas station/convenience store and one auto
body shop were significantly damaged. Approximately 100 to 200 trees were snapped off or were
63
uprooted along the damage path. Property damages of $100,000 occurred.
The location of Cleburne County in Wind Zone IV, past occurrences of tornados, and the
potential for future occurrences to cause damage, death, and injuries leaves Cleburne County
vulnerable to and at risk for tornados.
Cleburne County experienced four tornado events in a 10 year period resulting in a
greater than 40% (.40) probability that a tornado event will occur on an annual basis. The total
amount of damages for the four tornado events was $1.9 million with 4 tornado events causing
damage resulting in an estimated $475,000 of expected annual damages from future events. The
referenced tornado event(s) are the ones that resulted in the most damages, deaths, and injuries
during the past ten year period and serves as the extent/range of magnitude or severity that could
be experienced by Cleburne County due to a tornado event; the ranking is major. According to
the Fujita Tornado Scale, Cleburne County’s extent is EF2, considerable damage.
Primary effects from Tornados in Cleburne County would include:
1. Loss of life
2. Property damage
3. Infrastructure destruction and damage
4. Sanitation and water delivery interruption
Hazardous results from significant Tornados in Cleburne County would include:
1. Collapse of structures can leave people homeless.
2. Roadways may become blocked by debris. Damage may destroy automobiles,
creating additional hardships to individuals and families and business operations.
3. High wind speeds associated with a tornado can destroy anything in its path.
Power poles topple, communication receivers are destroyed, and water sanitation
and treatment plants are offline.
4. Due to destruction, sanitation crews are unable to remove massive amounts of
waste, and water delivery is disrupted. This can lead to an increase in disease-
carrying insects and lack of potable water.

64
Figure 3-1: Generalized Tornado Paths
Figure 3-2: Wind Zones in the United States

65
Source: www.fema.gov, 2014
Tornados are now measured using the new Enhanced Fujita Tornado Scale by examining
the damage caused by the tornado after it passes over man-made structures and vegetation. The
new scale was put into use in February of 2007. Due to the study period of the plan, this goes
from 2003-2013, events shown in Table 3-5 express the magnitude of tornados using the original
Fujita scale and the enhanced Fujita scale. Below is a table comparing the estimated winds in
the original F-scale and the operational EF-scale that is currently in use by the National Weather
Service, as well as damage descriptions of each category. Like the original Fujita scale, there are
six categories from zero to five that represent damage in increasing degrees. The new scale
incorporates the use of 28 Damage Indicators and 8 Degrees of Damage to assign a rating.

66
Table 3-7: Fujita Tornado Scales
Fujita Tornado Scale
Category Wind Speed Description of Damage
F0 40-72 mph Light damage. Some damage to chimneys; break branches off trees; push over shallow-rooted trees; damage to sign boards.
F1 73-112 mph Moderate damage. The lower limit is the beginning of hurricane speed. Roof surfaces peeled off; mobile homes pushed off foundations or overturned; moving autos pushed off roads.
F2 113-157 mph Considerable damage. Roofs torn off frame houses; mobile homes demolished; boxcars pushed over; large trees snapped or uprooted; light-object missiles generated.
F3 158-206 mph Severe damage. Roofs and some walls torn off well-constructed houses; trains overturned; most trees in forest uprooted; cars lifted off ground and thrown.
F4 207-260 mph Devastating damage. Well-constructed houses leveled; structures with weak foundations blown off some distance; cars thrown and large missiles generated.
F5 261-318 mph Incredible damage. Strong frame houses lifted off foundations and carried considerable distance to disintegrate; automobile-sized missiles fly through the air in excess of 100-yards; trees debarked.
Enhanced Fujita Tornado Scale
Category Wind Speed Description of Damage
EF0 65-85 mph Light damage. Peels surface off some roofs; some damage to gutters or siding; branches broken off trees; shallow-rooted trees pushed over.
EF1 86-110 mph Moderate damage. Roofs severely stripped; mobile homes overturned or badly damaged; loss of exterior doors; windows and other glass broken.
EF2 111-135 mph Considerable damage. Roofs torn off well-constructed houses; foundations of frame homes shifted; mobile homes completely destroyed; large trees snapped or uprooted; light-object missiles generated; cars lifted off ground.
EF3 136-165 mph Severe damage. Entire stories of well-constructed houses destroyed; severe damage to large buildings such as shopping malls; trains overturned; trees debarked; heavy cars lifted off the ground and thrown; structures with weak foundations blown away some distance.
EF4 166-200 mph Devastating damage. Well-constructed houses and whole frame houses completely leveled; cars thrown and small missiles generated.
EF5 >200 mph Incredible damage. Strong frame houses leveled off foundations and swept away; automobile-sized missiles fly through the air in excess of 100 m (109 yd); high-rise buildings have significant structural deformation; incredible phenomena will occur. So far only one EF5 tornado has been recorded since the Enhanced Fujita Scale was introduced on February 1, 2007.
Source: NOAA, NWS, Storm Prediction Center, 2007.

67
V. Floods/Flash Floods
There are three types of flooding that affect Cleburne County: (1) general flooding, (2)
storm water runoff, and (3) flash flooding. General flooding occurs in areas where development
has encroached into flood-prone areas. Storm water runoff causes flooding in areas that have
inadequate drainage systems. Flash flooding is caused when a large amount of rain falls within a
short period of time. Table 3-5 shows flash flooding events in Cleburne County recorded by
NOAA NCDC. Between 2003 and 2013 there were 6 occurrences of flash flooding and no
floods in the county. Damages from these flash flood events totaled $321,000 in property
damage, no crop damage, no deaths, and one injury.
Flash floods involve a rapid rise in water level, high velocity, and large amounts of
debris, which can lead to significant damage that includes the tearing out of trees, undermining of
buildings and bridges, and scouring new channels. The intensity of flash flooding is a function of
the intensity and duration of rainfall, steepness of the watershed, stream gradients, watershed
vegetation, natural and artificial flood storage areas, and configuration of the streambed and
floodplain. Dam failure and ice jams may also lead to flash flooding.
Dam-break floods may occur due to structural failures (e.g., progressive erosion),
overtopping or breach from flooding, or earthquakes. Dam failures are potentially the worst
flood events. Dam safety has been an ongoing hazard mitigation issue in the State of Alabama
for the past decade, especially for small dams that are privately owned and poorly maintained.
No state law currently exists to regulate any private dams or the construction of new private
dams, nor do private dams require federal licenses or inspections. There have been several
attempts in the State of Alabama to pass legislation that would require inspection of dams on
bodies of water over 50 acre-feet or dams higher than 25 feet. Enactment has been hampered by
the opposition of agricultural interest groups and insurance companies. Approximately 1,700
privately owned dams would fit into the category proposed by the law.
According to HAZUS MH 2.1, Cleburne County has 35 High Density Polyethylene
(HPDE - Earth) Dams, one Rock Filled Dam (HPDR), and four miscellaneous dams (HPDZ)
including six high hazard dams. No historical records are available of dam/levee failures in
Cleburne County. When a dam fails, a large quantity of water is suddenly released downstream,
destroying anything in its path. The area impacted by the water emitted by dam failure would

68
encounter the same risks as those in a flood zone during periods of flooding. The area directly
affected by the water released during a dam failure is not county wide.
The probability of future occurrences of dam/levee failure events cannot be characterized
on a countywide basis because of the lack of information available. The qualitative probability is
rated low because the overall area affected is low and impacts are localized. This rating is
intended only for general comparison to other hazards that are being considered.
Local drainage floods may occur outside of recognized drainage channels or delineated
flood plains for a variety of reasons, including concentrated local precipitation, a lack of
infiltration, inadequate facilities for drainage and storm water conveyance, and/or increased
surface runoff. Such events often occur in flat areas, particularly during winter and spring in
areas with frozen ground, and also in urbanized areas with large impermeable surfaces. High
groundwater flooding is a seasonal occurrence in some areas, but may occur in other areas after
prolonged periods of above-average precipitation.
Floods are described in terms of their extent (including the horizontal area affected and
the vertical depth of floodwaters) and the related probability of occurrence. Flood studies use
historical records to determine the probability of occurrence for different extents of flooding. The
probability of occurrence is expressed in percentages as the chance of a flood of a specific extent
occurring in any given year. It is also often referred to as the “100-year flood” since its
probability of occurrence suggests it should only occur once every 100 years. This expression is,
however, merely a simple and general way to express the statistical likelihood of a flood; actual
recurrence periods are variable from place to place. Smaller floods occur more often than larger
(deeper and more widespread) floods. Thus, a “10-year” flood has a greater likelihood of
occurring than a “100-year” flood. Table 3-8 shows a range of flood recurrence intervals and
their probabilities of occurrence.

69
Table 3-8: Flood Probability Terms
Flood Recurrence Intervals
Percent Chance of Annual Occurrence
10-Year 10.0%
50-Year 2.0%
100-Year 1.0%
500-Year 0.2%
(Source: FEMA, 2014)
On May 7, 2003, a countywide flash flood occurred, causing thirty to forty roads to
become flooded and impassable for at least 10 hours. The hardest hit areas were along the
Cleburne and Randolph County line in extreme southern Cleburne County. A mudslide occurred
on SR 9 near Heflin. No injuries, deaths, or crop damages occurred or were reported from this
event. Property damages of $250,000 resulted. The following day, May 8, 2003, Cleburne
County Emergency Medical Service personnel along with volunteer firemen from Hollis, Heflin,
and Micaville and an Alabama State Trooper worked to rescue an unidentified male after the car
he attempted to drive trough floodwaters was washed into a ditch and almost submerged. The
man attempted to drive through floodwaters from the Tallapoosa River covering a portion of CR
36 when the swift current pushed the car into a ditch where it caught on some trees. One injury
and $8,000 of property damage resulted from the flash flood on this date.
On September 16, 2004, a flash flood event in association with Ivan occurred, causing
hundreds of trees and power lines to be blown down across the county. At least 10 homes
suffered moderate damage with much more reporting minor roof damage. The debris removal
took two weeks in some locations. Power was restored to most of the county in 24 hours.
Maximum wind gust were estimated between 55 and 65 miles an hour. Several roadways and
creeks were flooded due to the torrential rain. One creek bridge suffered damage. Doppler radar
and ground observations indicate as much as 6 inches of rain fell. No injuries, deaths, or crop
damages occurred or were reported from this event. Property damages of $50,000 were reported.
Cleburne County experienced 6 flood/flash flood events in a 10 year period resulting in a

70
greater than 60% (.60) probability that a flood/flash flood event will occur on an annual basis.
The total amount of damages for the 6 flood/flash flood events was $321,000 with 5 flood/flash
flood events causing damage resulting in an estimated $64,200 of expected annual damages from
future events. The referenced flood/flash flood event(s) are the ones that resulted in the most
damages, deaths, and injuries during the past ten year period and serves as the extent/range of
magnitude or severity that could be experienced by Cleburne County due to a flood/flash flood
event; the ranking is minor to major. The extent of flooding for Cleburne County is
approximately six inches of water over roadways making them impassible.
Primary Effects from Floods in Cleburne County would include:
1. Loss of life
2. Property damage
3. Crop damage
4. Dam and levee failure
Hazardous results from significant flood in Cleburne County would include:
1. Rising water levels can quickly sweep people along in its path.
2. Rapidly moving water destroys anything in its path and also leaves hazardous
mold and breed insects.
3. Periods of standing water kill inadaptable plants, and flowing water removes
sediment and nutrients from the soil.
4. Breached dams and levees allow water to flood into the surrounding floodplain
resulting in destruction of crops and property.
Dam failures may result from one or more the following:
1. Prolonged periods of rainfall and flooding (the cause of most failures)
2. Inadequate spillway capacity which causes excess overtopping flows
3. Internal erosion erosions due to embankment or foundation leakage or piping
4. Improper maintenance
5. Improper design
6. Negligent operation
7. Failure of upstream dams
8. Landslides into reservoirs

71
9. High winds
10. Earthquakes
Flood Assessment Tools
Programs
Cleburne County does not participate in the National Flood Insurance Program (NFIP).
The NFIP allows property owners to purchase federally sponsored flood insurance. The NFIP
maps communities in order to establish Flood Risk Zones or Special Flood Hazards Areas. These
hazard areas are then mapped on the Flood Insurance Rate Maps (FIRMS). FIRMS are used to
assess the risks of floods and aid in proper floodplain management. An update of the flood maps
of Cleburne County was completed in 2010. Currently the county, the Town of Edwardsville, the
Town of Fruithurst, and the Town of Ranburne are not participating in the NFIP; while the City
of Heflin is the only jurisdiction considered to be a participant in the NFIP. The Town of
Fruithurst has had no flood areas identified. The National Flood Insurance Program (NFIP)
requires local participation. The Cleburne County Commission and the Mayors of the Towns of
Edwardsville and Rayburne choose not to participate in the NFIP. They are in process of
meeting with local developers on this issue and have not reached an agreement on the NFIP
among all the officials involved; however, these three jurisdictions encourage floodplain
regulations and conduct outreach events in the communities to educate and promote floodplain
practices. The City of Heflin is a NFIP participate in good standing and enforces floodplain
regulations, as well as educates and promotes floodplain practices through community outreach
events. Table 3-9 shows the current NFIP status of each jurisdiction. Flood Mitigation
Assistance Program (FMA) - This program now allows for additional cost share flexibility: up to
100% federal cost share for severe repetitive loss properties; up to 90% federal costs share for
repetitive loss properties; and 75% federal cost share for NFIP insured properties.
The Repetitive Flood Claims (RFC) and Severe Repetitive Loss (SRL) Grant Programs
were eliminated by the Biggert-Waters Flood Insurance Reform Act of 2012. Elements of these
flood grant programs have been incorporated into FMA.
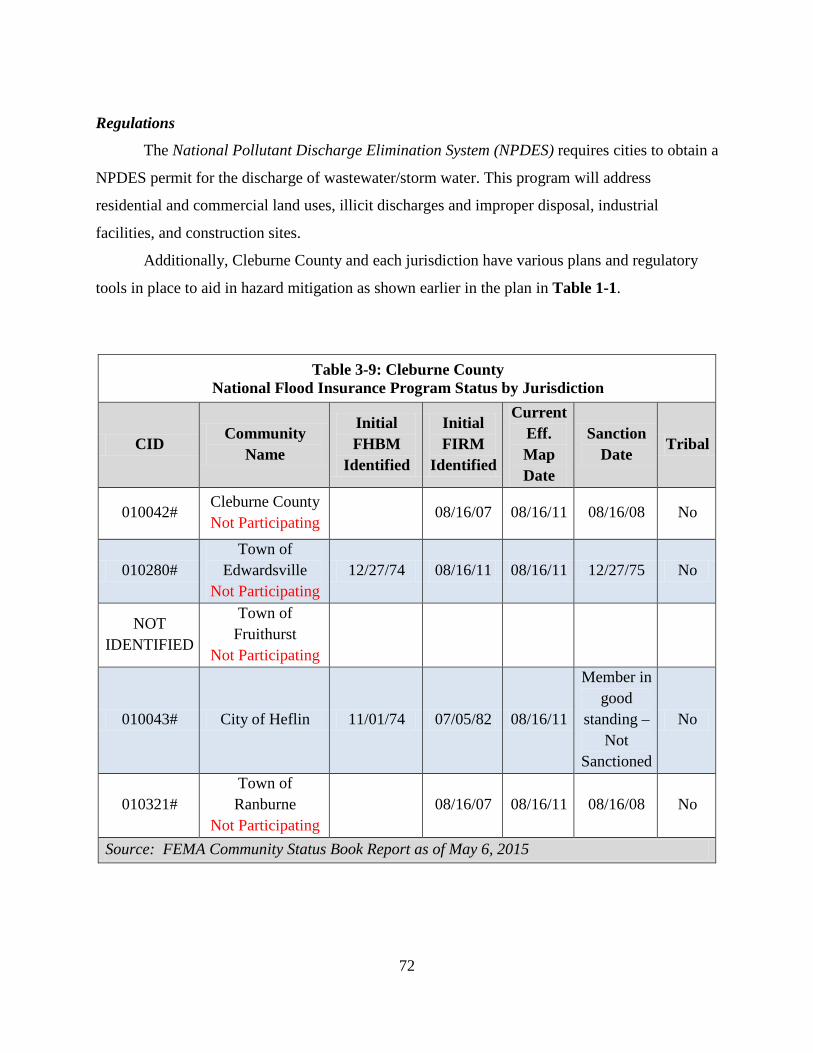
72
Regulations
The National Pollutant Discharge Elimination System (NPDES) requires cities to obtain a
NPDES permit for the discharge of wastewater/storm water. This program will address
residential and commercial land uses, illicit discharges and improper disposal, industrial
facilities, and construction sites.
Additionally, Cleburne County and each jurisdiction have various plans and regulatory
tools in place to aid in hazard mitigation as shown earlier in the plan in Table 1-1.
Table 3-9: Cleburne County National Flood Insurance Program Status by Jurisdiction
CID Community Name
Initial FHBM
Identified
Initial FIRM
Identified
Current Eff. Map Date
Sanction Date Tribal
010042# Cleburne County Not Participating
08/16/07 08/16/11 08/16/08 No
010280# Town of
Edwardsville Not Participating
12/27/74 08/16/11 08/16/11 12/27/75 No
NOT IDENTIFIED
Town of Fruithurst
Not Participating
010043# City of Heflin 11/01/74 07/05/82 08/16/11
Member in good
standing – Not
Sanctioned
No
010321# Town of Ranburne
Not Participating 08/16/07 08/16/11 08/16/08 No
Source: FEMA Community Status Book Report as of May 6, 2015

73
Severe Repetitive Loss Properties and Repetitive Loss Properties
FEMA defines repetitive loss properties as those having two or more claims of $1,000 or
more in the past 10-year period. FEMA defines severe repetitive loss properties as those
properties claiming at least four claims over $5,000, which amount to more than $20,000 total; or
properties with two claim payments cumulatively greater than the market value of the building –
both of which must take place within a 10-year period and not less than 10 days apart.
Even though there are repetitive flooding issues in the county, there are no Severe
Repetitive Loss or Repetitive Loss properties in Cleburne County at this time. The City of Heflin
is the only jurisdiction participating in the NFIP. The City of Heflin enforces floodplain
regulations and practices, as well as conducts community outreach events for education and
promotion of the NFIP, and plan to continue doing so as a NFIP member in the future. Since the
last plan update, Cleburne County, Edwardsville, and Ranburne were mapped with special flood
hazard areas on August 16, 2011. The Town of Fruithurst has no flood areas identified. In
general, flooding does not affect residential properties in Cleburne County. The majority of
flooding issues in the county are with infrastructure, particularly roads and bridges.
The most prevalent areas of flooding within the county are in the southern one-fourth
of the county, along the Tallapoosa River. The majority of vulnerability in this area is that of
flooded roadways and water overtopping bridges. These events create a strain on the
county’s financial and human resources.
The Towns of Ranburne and Edwardsville both experience flash flooding on a small
scale. Minimal damages have been reported from these municipalities with regard to
flooding. Flooding events usually consist of roadways underwater for short periods of time,
which also causes stress to the towns’ financial and human resources. Fruithurst has reported no
major flooding issues.
VI. Drought/Extreme Heat
Drought occurs when there is a deficiency of precipitation over an extended period of
time. Climatic factors, such as high temperature, high winds, and low relative humidity, can
contribute to the severity of a drought. No society is immune to the social, economic, and
environmental impacts of a drought. There are two primary types of drought: meteorological and

74
hydrological droughts. These events can result in agricultural and socioeconomic droughts.
Meteorological droughts are defined as the degree of dryness as compared to the normal
precipitation for the area over the duration of the dry season. This type of drought is specific to a
given region since atmospheric conditions and precipitation vary from one region to the next.
Hydrological droughts are associated with the effects of precipitation deficiencies on
surface or groundwater supplies. Hydrological droughts do not occur as often as meteorological
or agricultural droughts. It takes longer for precipitation deficiencies to show up in soil moisture,
stream flow, groundwater levels, and reservoir levels. Hydrological droughts have an immediate
impact on crop production, but reservoirs may not be affected for several months. Climate,
changes in land use, land degradation, and the construction of dams can have adverse effects on
the hydrological system especially in drought conditions.
Agricultural droughts occur when the moisture in the soil no longer meets the needs of
the crops.
Socioeconomic droughts occur when physical water shortage begins to affect people and
their quality of life.
A drought’s severity depends on numerous factors, including duration, intensity, and
geographic extent as well as regional water supply demands by humans and vegetation. Due to its
multidimensional nature, drought is difficult to define in exact terms and also poses difficulties in
terms of comprehensive risk assessments.
Drought differs from other natural hazards in three ways. First, the onset and end of a
drought are difficult to determine due to the slow accumulation and lingering of effects of an
event after its apparent end. Second, the lack of an exact and universally accepted definition adds
to the confusion of its existence and severity. Third, in contrast with other natural hazards, the
impact of drought is less obvious and may be spread over a larger geographic area. These
characteristics have hindered the preparation of drought contingency or mitigation plans by many
governments.
Droughts may cause a shortage of water for human and industrial consumption,
hydroelectric power, recreation, and navigation. Water quality may also decline and the number
and severity of wildfires may increase. Severe droughts may result in the loss of agricultural
crops and forest products, undernourished wildlife and livestock, lower land values, and higher
75
unemployment.
Extreme summer heat is the combination of very high temperatures and exceptionally
humid conditions. If such conditions persist for an extended period of time, it is called a heat
wave (FEMA, 1997). Heat stress can be indexed by combining the effects of temperature and
humidity, as shown in Table 3-10. The index estimates the relationship between dry bulb
temperatures (at different humidity) and the skin’s resistance to heat and moisture transfer - the
higher the temperature or humidity, the higher the apparent temperature.
In addition to affecting people, severe heat places significant stress on plants and animals.
The effects of severe heat on agricultural products, such as cotton, may include reduced yields
and even loss of crops (Brown and Zeiher, 1997). Similarly, cows may become overheated,
leading to reduced milk production and other problems. (Garcia, September 2002).
Drought is a natural event that, unlike floods or tornadoes, does not occur in a violent
burst but gradually happens; furthermore, the duration and extent of drought conditions are
unknown because rainfall is unpredictable in amount, duration and location. Drought events can
potentially affect the entire county.
The Draft Alabama Drought Management Plan (DMP), developed by the Alabama
Department of Economic and Community Affairs – Office of Water Resources (ADECA-OWR),
defines drought in terms of several indices that describe the relative amounts of surface water
flow, groundwater levels, and recent precipitation as compared to localized norms. Because
drought is defined in relative terms, it can be stated that all areas of the county are susceptible to
drought.
The National Weather Service uses two indexes to categorize drought. The most accurate
index of short-term drought is the Crop Moisture Index (CMI). This index is effective in
determining short-term dryness or wetness affecting agriculture. The most accurate index of
long-term drought is the Palmer Index (PI). It has become the semi-official index of drought.
During the past ten years, Cleburne County experienced D2 Severe to D3 Extreme
Drought in 2006, D1 Moderate to D4 Exceptional Drought in 2007, D1 Moderate to D4
Exceptional Drought in 2008, D2 Severe to D3 Extreme Drought in 2011, D3 Extreme Drought
in 2012, and D2 Severe to D3 Extreme Drought in 2013. No deaths, injuries, property or crop
damages were reported. The categories of drought are defined as follows (Source

76
http://droughtmonitor.unl.edu) Accessed 11/16/14: Abnormally Dry (D0) - Going into drought:
short-term dryness slowing planting, growth of crops or pastures; fire risk above average.
Coming out of drought: some lingering water deficits; pastures or crops not fully recovered.
Moderate Drought (D1) - Some damage to crops, pastures; fire risk high; streams, reservoirs, or
wells low, some water shortages developing or imminent, voluntary water use restrictions
requested. Severe Drought (D2) - Crop or pasture losses likely; fire risk very high; water
shortages common; water restrictions imposed. Extreme Drought (D3) - Major crop/pasture
losses; extreme fire danger; widespread water shortages or restrictions. Exceptional Drought
(D4) - Exceptional and widespread crop/pasture losses; exceptional fire risk; shortages of water
in reservoirs, streams, and wells, creating water emergencies.
Cleburne County experienced 36 drought/extreme heat events in a 10 year period
resulting in a greater than 100% (3.60) probability that a drought/extreme heat event will occur
on an annual basis. The total amount of damages for the 36 drought/extreme heat events was $0
(unknown) with no drought/extreme heat events causing damage resulting in an estimated $0 or
unknown amount of expected annual damages from future events. The referenced drought
event(s) are the ones that resulted in the most damages, deaths, and injuries during the past ten
year period and serves as the extent/range of magnitude or severity that could be experienced by
Cleburne County due to a drought event; the ranking is minimum to minor.
Primary effects from Drought and Excessive Heat in Cleburne County would include:
1. Crop and other agricultural damage
2. Water supply shortage - water wells, creeks, rivers, and lakes dry up
3. Increase vulnerability to forest fires and sinkholes
4. Heat exhaustion; heat stroke; heat syncope; and heat cramps
Hazardous results from significant Drought and Excessive Heat in Cleburne County
would include:
1. Agricultural damage from drought will result in economic losses of crops and
livestock.
2. A water supply shortage will result in the necessity for water to be trucked into the
area, damage to the sewer system and lack of hydroelectric power.
3. Forest fires can devastate vast acreages and burn homes and businesses.

77
4. Heat exhaustion can be debilitating and result in a hospital stay. Heat stroke can
cause death.
5. Energy prices will inflate due to loss of hydro-power
Temperatures that hover 10 degrees or more above the average high temperature for the
region and last for several weeks are defined as extreme heat. Humid or muggy conditions occur
when a “dome” of high atmospheric pressure traps hazy, damp air near the ground. The
combination of high temperatures and humid conditions increase the level of discomfort and the
potential for danger to humans. A sibling to the heat wave is the drought. Droughts occur when a
long period passes without any substantial rainfall. A heat wave combined with a drought is a
very dangerous situation.
The human risks associated with extreme heat include heatstroke, heat exhaustion, heat
syncope, heat cramps. A description of each of these conditions follows:
• Heatstroke is considered a medical emergency and is often fatal. It exists when rectal
temperature rises above 105°F as a result of environmental temperatures. Patients may
be delirious, stuporous, or comatose. The death to care ratio in reported cases
averages about 15%.
• Heat Exhaustion is much less severe than heatstroke. The body temperature may be
normal or slightly elevated. A person suffering from heat exhaustion may complain of
dizziness, weakness or fatigue. The primary cause of heat exhaustion is fluid and
electrolyte imbalance. The normalization of fluids will typically alleviate the
situation.
• Heat Syncope is typically associated with exercise by people who are not acclimated
to exercise. The symptom is a sudden loss of consciousness. Consciousness returns
promptly when the person lies down. The cause is primarily associated with
circulatory instability as a result of heat. The condition typically causes little or no
harm to the individual.
• Heat Cramps are typically a problem for individuals who exercise outdoors but are
unaccustomed to heat. Similar to heat exhaustion it is thought to be a result of a mild
imbalance of fluids and electrolytes.
In 1979 R. G. Steadman, a meteorologist, developed the heat index, which is a

78
relationship between dry bulb temperatures (at different humidity) and the skin’s resistance to
heat and moisture transfer. Utilizing Steadman’s heat index, the following table was developed to
show the risk associated with ranges in apparent temperature or heat index.
Table 3-10: Heat Index/Heat Disorders
Danger Category Heat Disorder Apparent Temperature (°F)
IV Extreme Danger Heatstroke or sunstroke imminent.
>130
III Danger
Sunstroke, heat cramps, or heat exhaustion likely, heat stroke possible with prolonged exposure and physical activity.
105-130
II Extreme Caution
Sunstroke, heat cramps, and heat exhaustion possible with prolonged exposure and physical activity.
90-105
I Caution Fatigue possible with prolonged exposure and physical activity.
80-90
(Source: National Weather Service, 2014)
Droughts and heat waves have a county-wide impact. The future incidence of drought is
highly unpredictable, conditions may be localized or widespread, and not much historical data is
available making it difficult to determine the future probability of drought conditions with any
accuracy. The qualitative probability rating for drought is high.
Table 3-5 reflects that the NOAA NCDC reported 36 instances of drought for Cleburne
County from 2003-2013. No crop or property damages were reported. There were no reports
of extreme heat events during this ten year period.

79
VII. Winter Storm/Frost Freeze/Heavy Snow/Ice Storm/Winter Weather/Extreme Cold
Cleburne County is vulnerable to extreme winter weather conditions such as extreme cold
temperatures, snow, and ice. Table 3-5 shows the winter storm/extreme cold/frost freeze/heavy
snow/ice storm/winter weather events that have affected Cleburne County from 2003 - 2013.
The most common impacts of severe winter weather are power failure due to downed
power lines and traffic hazards. Winter storm occurrences tend to be very disruptive to
transportation and commerce as the county and it citizens are unaccustomed to them. Trees, cars,
roads, and other surfaces develop a coating or glaze of ice, making even small accumulations of
ice extremely hazardous to motorists and pedestrians. The most prevalent impacts of heavy
accumulations of ice are slippery roads and walkways that lead to vehicle and pedestrian
accidents; collapsed roofs from fallen trees and limbs and heavy ice and snow loads; and fallen
trees, telephone poles and lines, electrical wires, and communication towers. As a result of severe
ice storms, telecommunications and power can be disrupted for days. Also many homes and
buildings, especially in rural areas, lack proper insulation or heating, leading to risk of
hypothermia. Extremely cold temperatures accompanied by strong winds can result in wind
chills that cause bodily injury such as frostbite and death.
On February 25, 2004, a winter storm event resulting in a combination of snow and sleet
across Cleburne County accumulating one to three inches across the northern and western
mountains. Numerous roads were ice covered. January 9, 2011, Cleburne County experienced a
winter storm having snow accumulations ranging from 2 to 5 inches. No injuries, deaths, crop,
or property damages were reported from these winter storm events.
On April 7-8, 2007, two frost freezes occurred from an unusually cold springtime air
mass settled across Central Alabama, bringing record cold temperatures to the entire region of
Cleburne County. Sub-freezing temperatures were recorded. No injuries, deaths, crop, or
property damages were reported from these frost freeze events.
On December 25, 2010, a heavy snow event resulted in an average snowfall accumulation
of 2.5 inches occurred across the county with isolated amounts of 4.0 inches near Muscadine and
on Mount Cheaha. In addition, several roads were closed and numerous accidents occurred due to
slick and icy conditions. February 12, 2010, a heavy snow event resulted in an average of 3 to 4
inches of snow falling across the entire county. Many bridges and other elevated surfaces

80
became icy and hazardous. January 17, 2013, heavy snow accumulated up to 3 inches in the
higher elevations of Mt. Cheaha in Cleburne County. No injuries, deaths, crop, or property
damages occurred from these heavy snow events.
An ice storm event occurred on January 28, 2005 from cold air combining with an
approaching storm system. At least 15 additional vehicles slid off the roadways under the icy
conditions. Exposed surfaces had ice accumulation to at least one half of an inch with a few
locations reporting ice accumulations of around one inch. Numerous trees, tree limbs, and power
lines were knocked down and many of the fallen trees temporarily blocked roadways. Several
homes and vehicles were damaged by the fallen trees. Several area bridges became totally iced
over and were very hazardous for travel. Many roads were temporarily closed due to icing. Power
outages were widespread during the early morning hours with up to 30,000 homes and businesses
without power. The rain changed over to freezing rain just after sunset on January 28. Icing
conditions started in the early evening hours and tampered off to no additional significant
accumulations early on January 29. No injuries, deaths, or crop damages occurred. Property
damages of $40,000 resulted.
On December 26, 2010, a winter weather event resulting in light snowfall caused
roadways to remain icy, making travel hazardous. No injuries, deaths, or property, or crop
damages occurred.
On January 24, 2003, an extreme cold event brought the coldest temperatures in seven
years across Central Alabama and lasted for two days. Early morning temperatures ranged from
2 to 10 degrees. The coldest temperatures were measured in outlying areas. Although no new
records were established, these temperatures were very cold for the Deep South. Many area
residents reported frozen and broken water pipes as a result of the extended cold. Several lawn
sprinkler systems also froze and broke making many areas very icy. No injuries, deaths, or
property, or crop damages occurred.
Cleburne County experienced 12 winter storm/extreme cold/frost freeze/heavy snow/ice
storm/winter weather events in a 10 year period resulting in a less than 100% (1.20) probability
that a winter storm/extreme cold/frost freeze/heavy snow/ice storm/winter weather event will
occur on an annual basis. The total amount of damages for the 12 winter storm/extreme
cold/frost freeze/heavy snow/ice storm/winter weather events was $40,000 with one winter

81
storm/extreme cold/frost freeze/heavy snow/ice storm/winter weather event causing damage
resulting in an estimated $40,000 of expected annual damages from future events. The
referenced winter storm/extreme cold/frost freeze/heavy snow/ice storm/winter weather events
are the ones that resulted in the most damages, deaths, and injuries during the past ten year
period and serves as the extent/range of magnitude or severity that could be experienced by
Cleburne County due to a winter storm/extreme cold/frost freeze/heavy snow/ice storm/winter
weather event; the ranking is minor to major.
Primary effects from winter storms in Cleburne County would include:
1. Injury and damage from downed trees and utility lines due to the snow and ice
load
2. Widespread impassable roads and bridges
3. Disruption of services and response capabilities
4. Crop and other agricultural damage
Hazardous results from winter storms in Cleburne County would include:
1. Loss of power, communications, and fires are common results of severe winter
storms. Widespread power outages close down businesses and impact medical
facilities, nursing homes, and adult and child care facilities serving special needs
populations.
2. Loss of transportation ability will affect emergency response, recovery and supply
of food and materials.
3. Numerous vehicle accidents in a winter storm can stretch thin the resources of fire
rescue and law enforcement.
4. Stranded motorists and the homeless can create a food and housing shortage
within the community.
5. The widespread nature of winter storms usually creates a strain on police, fire and
medical providers due to the volume of calls for service.
VIII. Hurricane/Tropical Storm/Tropical Depression/High Wind/Strong Wind
Hurricane season in the northern Atlantic Ocean, which affects the United States, begins
on June 1 and ends on November 31. These months accompany warmer sea surface temperatures
which is a required element to produce the necessary environment for tropical cyclone/hurricane

82
development.
According to data from the National Oceanic and Atmospheric Administration’s National
Hurricane Center, there are three classification levels of storms based on wind speed. The first, a
tropical depression, is “an organized system of clouds and thunderstorms with a defined surface
cyclonic closed circulation and maximum sustained winds of 38 mph or less.” A tropical storm is
the second level and is described as “an organized system of strong thunderstorms with a defined
surface circulation and maximum sustained winds of 39-73 mph.” A “hurricane,” which is the
third classification level, is “an intense tropical weather system of strong thunderstorms with a
well-defined surface circulation and maximum sustained winds of 74 mph or higher.” Individual
hurricanes vary in intensity and are categorized using the Saffir-Simpson Hurricane Scale.
NOAA measures wind speeds for thunderstorm/wind and hurricane events in knots (kts)
while the Saffir-Simpson scale, shown later in the Hurricane profile, measures wind speed in
miles per hour. Both knots and miles per hour is a speed measured by a number of units of
distance covered in certain amount of time. Here is how knots compare to MPH:
• 1 knot = 1 nautical mile per hour = 6076.12 feet per hour
• 1 MPH = 1 mile per hour = 5280 feet per hour
To convert knots into miles per hour, multiply the number of knots by 1.151.
Saffir-Simpson Hurricane Wind Scale
Once a tropical storm reaches the level of a hurricane, it is then classified by the storm’s
intensity. Intensity levels, or categories, are used to assign a number (e.g., Category 1) to a
hurricane based on the storm’s intensity at the current time. The Saffir-Simpson Hurricane Wind
Scale, Table 3-11, is a 1 to 5 rating based on a hurricane's sustained wind speed. This scale
estimates potential property damage. Hurricanes reaching Category 3 and higher are considered
major hurricanes because of their potential for significant loss of life and damage. With the scale
in place, people within the hurricane’s tract can better estimate the type of damage they should
expect (i.e., wind, storm surge, and/or flooding impacts) due to the intensity of the oncoming
hurricane.

83
Table 3-11: Saffir-Simpson Hurricane Wind Scale
Category Sustained Winds Types of Damage Due to Hurricane Winds
1 74-95 mph
64-82 kt 119-153 km/h
Very dangerous winds will produce some damage: Well-constructed frame homes could have damage to roof, shingles, vinyl siding and gutters. Large branches of trees will snap and shallowly rooted trees may be toppled. Extensive damage to power lines and poles likely will result in power outages that could last a few to several days.
2 96-110 mph
83-95 kt 154-177 km/h
Extremely dangerous winds will cause extensive damage: Well-constructed frame homes could sustain major roof and siding damage. Many shallowly rooted trees will be snapped or uprooted and block numerous roads. Near-total power loss is expected with outages that could last from several days to weeks.
3 (major)
111-129 mph 96-112 kt
178-208 km/h
Devastating damage will occur: Well-built framed homes may incur major damage or removal of roof decking and gable ends. Many trees will be snapped or uprooted, blocking numerous roads. Electricity and water will be unavailable for several days to weeks after the storm passes.
4 (major)
130-156 mph 113-136 kt
209-251 km/h
Catastrophic damage will occur: Well-built framed homes can sustain severe damage with loss of most of the roof structure and/or some exterior walls. Most trees will be snapped or uprooted and power poles downed. Fallen trees and power poles will isolate residential areas. Power outages will last weeks to possibly months. Most of the area will be uninhabitable for weeks or months.
5 (major)
157 mph or higher 137 kt or higher
252 km/h or higher
Catastrophic damage will occur: A high percentage of framed homes will be destroyed, with total roof failure and wall collapse. Fallen trees and power poles will isolate residential areas. Power outages will last for weeks to possibly months. Most of the area will be uninhabitable for weeks or months.
(Source: National Hurricane Center – NOAA, 2014)
Threats Related to Hurricanes
Hurricanes impact regions in a variety of ways. The intensity of the storm, the speed of
the winds, whether the storm moves through a region quickly or whether it stalls over one area all
are variables toward the physical damage the storm will cause. Storm surges, high winds, and
heavy rains are the three primary elements of hurricanes, while tornados and inland flooding are
potential secondary elements caused in the wake of the storm. Cleburne County is not directly
affected by storm surges; therefore, no additional analysis will be completed on the topic.
On July 10-11, 2005, numerous trees and power lines were knocked down as Tropical
Storm Dennis moved across Cleburne County. No injuries, deaths, or crop damages occurred.
Property damages of $24,000 resulted from this event.

84
On August 23-25, 2008, Tropical Depression Fay brought high winds, heavy rain, and
numerous tornadoes to the Cleburne County area. No injuries, deaths, or crop damages occurred.
Property damages of $5,000 resulted.
On November 9, 2009, Tropical Depression Ida brought heavy rains and sustained winds
to Central Alabama. Winds maxed out between 20-30 mph, with peak wind gusts generally
between 30 and 40 mph. These winds blew down a few trees, especially shallow rooted trees
where the saturated soil likely played a significant role. No injuries, deaths, or crop damages
occurred. Property damages of $2,000 resulted.
On September 16, 2004, a high wind event (in association with Ivan) resulted in hundreds
of trees and power lines being blown down across the county. At least 10 homes suffered
moderate damage with much more reporting minor roof damage. The debris removal took two
weeks in some locations. Power was restored to most of the county in 24 hours. Maximum wind
gust were estimated between 55 and 65 miles an hour. Several roadways and creeks were flooded
due to the torrential rain. One creek bridge suffered damage. Doppler radar and ground
observations indicate as much as 6 inches of rain fell.
On September 7, 2004, a strong wind (38 mph) event occurred as remnants of Hurricane
Frances moved northward mainly across the eastern counties of Central Alabama. Strong winds
of 30 to 40 mph along with saturated ground conditions allowed several trees and power lines to
be blown down. No injuries, deaths, or crop damages occurred. Property damages of $1,000
resulted.
On March 9, 2006, a strong wind event resulted in 46 mph winds causing sporadic tree
damage. No injuries, deaths, or crop damages occurred. Property damages of $2,000 resulted.
On December 20, 2007, a strong wind event resulted in 35 mph winds causing tree and
power line damage. Numerous power outages were reported. No injuries, deaths, or crop
damages occurred. Property damages of $10,000 resulted.
Cleburne County experienced 8 hurricane/tropical storm/tropical depression/high
wind/strong wind events in a 10 year period resulting in an 80% (.80) probability that a
hurricane/tropical storm/tropical depression/high wind/strong wind event will occur on an annual
basis. The total amount of damages for the 8 hurricane/tropical storm/tropical depression/high
wind/strong wind events was $569,000 with 8 hurricane/tropical storm/tropical depression/high

85
wind/strong wind events causing damage resulting in an estimated $71,125 of expected annual
damages from future events. The referenced hurricane/tropical storm/tropical depression/high
wind/strong wind events are the ones that resulted in the most damages, deaths, and injuries
during the past ten year period and serves as the extent/range of magnitude or severity that could
be experienced by Cleburne County due to a hurricane/tropical storm/tropical depression/high
wind/strong wind event; the ranking is minor to major.
Primary Effects of Hurricanes:
1. Wind
a. Secondary cause of deaths related to hurricanes
b. Continue causing destruction as storm travels miles inland
c. Able to completely destroy towns and structures that fall within storm path
d. Winds near perimeter of eye of storm are strongest and most intense
e. Oftentimes produce tornados
2. Heavy Rains
a. Rain levels during hurricanes can easily exceed 15 to 20 inches
b. Cause flooding beyond coastal regions
Secondary Effects of Hurricanes:
1. Tornados
a. Usually found in right-front quadrant of storm or embedded in rain bands
b. Some hurricanes capable of producing multiple twisters
c. Usually not accompanied by hail or numerous lightning strikes
d. Tornado production can occur for days after the hurricane makes landfall
e. Can develop at any time of the day or night during landfall of a hurricane
2. Inland Flooding
a. Statistically responsible for greatest number of fatalities over last 30 years
b. Stronger storms not necessarily cause of most flooding; weaker storms that
move slowly across the landscape can deposit large amounts of rain, causing
significant flooding
Cleburne County is at a low risk for a direct hit by a hurricane due to its position several
miles inland from the Alabama coastline. Although Cleburne County does not feel the effects of

86
storm surges, other effects including heavy rain, flooding, winds, and tornados often have
significant impacts on Cleburne County.
IX. Sinkhole/Expansive Soil
Sinkholes
Naturally occurring Sinkholes occur where soluble limestone, carbonate rock, salt beds,
or rocks can be dissolved by groundwater circulating through them. As the rock dissolves, spaces
and caverns develop underground. The land usually stays intact until the underground spaces
become too large to support the ground at the surface. When the ground loses its support it will
collapse, forming a sinkhole. Sinkholes can be small or so extreme they consume an automobile
or a house. The most damage from sinkholes tends to occur in Florida, Texas, Alabama,
Missouri, Kentucky, Tennessee, and Pennsylvania.
According to the Geological Survey of Alabama’s sinkhole data as of 2010, Cleburne
County has experienced sinkholes; however, the sinkhole density in Cleburne County is low.
Figure 3-3 shows sinkholes and sinkhole density in Cleburne County.
Cleburne County experienced 2 sinkholes in a 10 year period resulting in a 20% (.20)
probability that a sinkhole event will occur on an annual basis. The total amount of damages for
a sinkhole event is unknown, as well as the expected annual damages from future events. The
ranking is minimum to minor. The largest sinkhole was approximately 50 feet in diameter.
Expansive Soils
Expansive soils are soils that swell when they come in contact with water. The presence
of clay is generally the cause of such behavior. Figure 3-4 shows the general soil areas for the
state. Cleburne County has Limestone Valleys and Uplands and Piedmont Plateau soils. There
were no expansive soils reported from NOAA or local sources during the time frame covered by
the plan. Though these soils have shrink-swell potential, the committee does not feel a profile is
necessary.

87
Figure 3-3
Cleburne →

88
Figure 3-4: General Soils of Alabama Source: Cartographic Research Lab, University of Alabama, 2014
Cleburne →

89
X. Landslide
A landslide is defined by the United States Geological Survey as the movement of rock,
debris, or earth down a slope. Various natural and man-induced triggers can cause a landslide.
Naturally induced landslides occur as a result of weakened rock composition, heavy rain, changes
in groundwater levels, and seismic activity. Geologic formations in a given area are key factors
when determining landslide susceptibility. The three underlying geologic formations present
within the region are the Coker, Gordo, and Tuscaloosa groups. These groups are classified as
having low to moderate susceptibility to slope failure. A 1982 study performed by Karen F.
Rheams of the United States Geological Survey indicated 23 landslides had occurred in the
county but all of these were man-induced events attributed to roadway construction. Figure 3-5
shows the landslide incidence and indicates that Cleburne County is at a low to no risk of
incidence. The 2010 plan update did not address landslides as there were no reports of landslides
from any source. According to the Geological Survey of Alabama’s sinkhole data as of 2010,
Cleburne County has experienced landslides; however, the landslide probability in Cleburne
County is low.
Primary effects from landslide in Cleburne County would include:
1. Property damage 2. Impassable roads 3. Sediment erosion 4. Underground infrastructure damage
Hazardous results from landslide in Cleburne County would include:
1. Landslides move with tremendous force capable of destroying most structures in its path while carrying anything it comes in contact with.
2. Material from landslides can damage and destroy roads as well as block them with debris, resulting in disruption to business and other activity.
3. Removed sediment can leave the surrounding area bare and prone to erosion. 4. The flow of a landslide can rip underground pipes and wiring from an area as well
as bury them deeper under debris, creating a loss of services.
Cleburne County experienced 0 landslides in a 10 year period resulting in an unknown
probability that a landslide event will occur on an annual basis. The total amount of damages for
a landslide event is unknown, as well as the expected annual damages from future events. The
ranking is minimum to minor.

90
Figure 3-5: Landslide Incidence in Cleburne County
Source: Geological Survey of Alabama, 2015
Cleburne →

91
XI. Earthquakes
An earthquake is a sudden slip on a fault and the resulting ground shaking and radiated
seismic energy caused by an abrupt release of accumulated strain in the tectonic plates that
comprise the earth’s crust. These rigid plates, known as tectonic plates, are some 50 to 60 miles
in thickness and move slowly and continuously over the earth’s interior. The plates meet along
their edges, where they move away, past or under each other at rates varying from less than a
fraction of an inch up to five inches per year. While this sounds small, at a rate of two inches per
year, a distance of 30 miles would be covered in approximately one million years (FEMA, 1997).
The tectonic plates continually bump, slide, catch, and hold as they move past each other
which causes stress to accumulate along faults. When this stress exceeds the elastic limit of the
rock, an earthquake occurs, immediately causing sudden ground motion and seismic activity.
Secondary hazards may also occur, such as surface faulting, sinkholes, and landslides. While the
majority of earthquakes occur near the edges of the tectonic plates, earthquakes may also occur at
the interior of plates.
The vibration or shaking of the ground during an earthquake is described by ground
motion. The severity of ground motion generally increases with the amount of energy released
and decreases with distance from the fault or epicenter of the earthquake. Ground motion causes
waves in the earth’s interior, also known as seismic waves, and along the earth’s surface, known
as surface waves. The following are the two kinds of seismic waves:
P (primary) waves are longitudinal or compression waves similar in character to
sound waves that cause back-and-forth oscillation along the direction of travel
(vertical motion), with particle motion in the same direction as wave travel. They
move through the earth at approximately 15,000 MPH.
S (secondary) waves, also known as shear waves, are slower than P waves and cause
structures to vibrate from side-to-side (horizontal motion) due to particle motion at
right angles to the direction of wave travel. Unreinforced buildings are more easily
damaged by S waves. There are also two kinds of surface waves, Raleigh waves and
Love waves. These waves travel more slowly and typically are significantly less
damaging than seismic waves.
Seismic activity is commonly described in terms of magnitude and intensity. Magnitude

92
(M) describes the total energy released and intensity (I) subjectively describes the effects at a
particular location. Although an earthquake has only one magnitude, its intensity varies by
location.
Magnitude is the measure of the amplitude of the seismic wave and is expressed by the
Richter scale. The Richter scale is a logarithmic measurement, where an increase in the scale by
one whole number represents a tenfold increase in measured amplitude of the earthquake.
Intensity is a measure of the strength of the shock at a particular location and is expressed by the
Modified Mercalli Intensity (MMI) scale.
Another way of expressing an earthquake’s severity is to compare its acceleration to the
normal acceleration due to gravity. If an object is dropped while standing on the surface of the
earth (ignoring wind resistance), it will fall towards earth and accelerate faster and faster until
reaching terminal velocity. The acceleration due to gravity is often called “g” and is equal to 9.8
meters per second squared (980 cm/sec/sec). This means that every second something falls
towards earth, its velocity increases by 9.8 meters per second. Peak ground acceleration (PGA)
measures the rate of change of motion relative to the rate of acceleration due to gravity. For
example, acceleration of the ground surface of 244 cm/sec/sec equals a PGA of 25.0 percent. It is
possible to approximate the relationship between PGA, the Richter scale, and the MMI, as shown
in Table 3-12. The relationships are, at best, approximate, and also depend upon such specifics
as the distance from the epicenter and depth of the epicenter. An earthquake with 10.0 percent
PGA would roughly correspond to an MMI intensity of V or VI, described as being felt by
everyone, overturning unstable objects, or moving heavy furniture.

93
Table 3-12: Earthquake PGA, Magnitude and Intensity Comparison
PGA ( %g)
Magnitude (Richter)
Intensity (MMI)
Description (MMI)
<0.17 – 1.4 1.0 – 3.0 I Not felt except by a very few under especially favorable conditions.
0.17 – 1.4 3.0 – 3.9 II - III
II. Felt only by a few persons at rest, especially on upper floors of buildings. III. Felt quite noticeably by persons indoors, especially on upper floors of buildings. Many people do not recognize it as an earthquake. Standing motor cars may rock slightly. Vibrations similar to the passing of a truck. Duration estimated.
1.4 – 9.2 4.0 – 4.9 IV - V
IV. Felt indoors by many, outdoors by few during the day. At night, some awakened. Dishes, windows, doors disturbed; walls make cracking sound. Sensation like heavy truck striking building. Standing motor cars rock noticeably. V. Felt by nearly everyone; many awakened. Some dishes, windows broken. Unstable objects overturned. Pendulum clocks may stop.
9.2 - 34 5.0 – 5.9 VI – VII
VI. Felt by all, many frightened. Some heavy furniture moved; a few instances of fallen plaster. Damage slight. VII. Damage negligible in buildings of good design and construction; slight to moderate in well-built ordinary structures; considerable damage in poorly built or badly designed structures; some chimneys broken.
34 – 124 6.0 – 6.9 VIII - IX
VIII. Damage slight in specially designed structures; considerable damage in ordinary substantial buildings with partial collapse. Damage great in poorly built structures. Fall of chimneys, factory stacks, columns, monuments, walls. Heavy furniture overturned. IX. Damage considerable in specially designed structures; well-designed frame structures thrown out of plumb. Damage great in substantial buildings, with partial collapse. Buildings shifted off foundations.
>124 7.0 and higher VIII or Higher
X. Some well-built wooden structures destroyed; most masonry and frame structures destroyed with foundations. Rails bent. XI. Few, if any (masonry) structures remain standing. Bridges destroyed. Rails bent greatly. XII. Damage total. Lines of sight and level are distorted. Objects thrown into the air.
(Source: http://earthquake.usgs.gov, 2014)

94
Earthquake-related ground failure, due to liquefaction, is a common potential hazard from
strong earthquakes in the central and eastern United States. Liquefaction occurs when seismic
waves pass through saturated granular soil, distorting its granular structure, and causing some of
the empty spaces between granules to collapse. Pore-water pressure may also increase
sufficiently to cause the soil to behave like a fluid (rather than a soil) for a brief period and
causing deformations. Liquefaction causes lateral spreads (horizontal movement commonly 10-
15 feet, but up to 100 feet), flow failures (massive flows of soil, typically hundreds of feet, but up
to 12 miles), and loss of bearing strength (soil deformations causing structures to settle or tip).
Sands blows were common following major New Madrid earthquakes in the central United
States.
The hazards associated with earthquakes include anything that can affect the lives of
humans, including surface faulting, ground shaking, landslides, liquefaction, tectonic
deformation, tsunamis, and seiches. Earthquake risk is defined as the probability of damage and
loss that would result if an earthquake caused by a particular fault were to occur. Losses depend
on several factors including the nature of building construction, population density, topography
and soil conditions, and distance from the epicenter.
Interestingly, an earthquake’s magnitude can be a poor indicator of hazard impact because
the duration of ground shaking, and resulting increased damages, is not factored into the
magnitude concept. The majority of losses are due to collapsing houses and other structures, the
most vulnerable being those of unreinforced masonry and adobe. Structures built with more
flexible materials such as steel framing are preferred. Wood frame construction, which
constitutes a high percentage of homes in the United States, also tends to flex rather that collapse
but is more susceptible to fire. Building codes have historically been utilized to address
construction standards to mitigate damages for earthquakes and other hazards. However, older
structures, non-compliance, and incomplete knowledge of needed measures remain a problem. In
order to reduce losses to lives and property, wider adoption of improved construction methods for
both residential and important critical facilities such as hospitals, schools, dams, power, water,
and sewer utilities is needed.
Three zones of frequent earthquake activity affecting Alabama are the New Madrid
Seismic Zone (NMSZ), the Southern Appalachian Seismic Zone (SASZ) (also called the Eastern

95
Tennessee Seismic Zone), and the South Carolina Seismic Zone (SCSZ). The NMSZ lies within
the central Mississippi Valley, extending from northeast Arkansas through southeast Missouri,
western Tennessee, and western Kentucky, to southern Illinois. The SASZ extends from near
Roanoke in southwestern Virginia southwestward to central Alabama. Considered a zone of
moderate risk, the SASZ includes the Appalachian Mountains. Most of the earthquakes felt in
Alabama are centered in the SASZ. The hypocenters of earthquakes in this zone are on deeply
buried faults. The SCSZ is centered near Charleston South Carolina and encompasses nearly the
whole State. Cleburne County is at risk for earthquakes.
Earthquakes occurring in Cleburne County are predominantly low magnitude events.
However, there is growing concern that a high magnitude event is inevitable and earthquakes are
becoming a much larger concern to the county. GSA is currently working to better define seismic
hazards and impacts throughout the county. Figure 3-6 shows the Percent Ground Acceleration
(PGA) with two percent 50 year exceedance probability. There is insufficient data to predict the
future probability of an earthquake occurring in Cleburne County. The risk of a significant,
damage-causing earthquake in Cleburne County is low to moderate. The northeastern portion of
the county is at a slightly greater risk than other portions of the county.
Although many areas of the United States are better known for their susceptibility,
earthquakes do occur in Alabama. Figure 3-7 shows the seismic zones of the Southeastern
United States, which includes Alabama, as well as the epicenters of earthquakes recorded in the
state from 1886-2007 as provided by the Geological Survey of Alabama and noted in the
Alabama EMA Earthquake Book 2002. Cleburne County did not experience any major
earthquake events during the past ten years (January 1, 2003 – December 31, 2013) as noted in
Table 3-5.
Two zones of frequent earthquake activity that could potentially impact Cleburne County
are the New Madrid Seismic Zone and the Southern Appalachian Seismic Zone. Damage could
be significant in Cleburne County if a powerful earthquake were to occur because buildings in
this part of the country have not been constructed to withstand such a powerful force. In 1916 on
October 18, a strong earthquake occurred on an unnamed fault east of Birmingham. It was
apparently most strong at Easonville. Near the epicenter, chimneys were knocked down,
windows broken, and frame buildings were greatly shaken. It was noted by residents in seven

96
states and covered 100,000 square miles. The 1895 New Madrid earthquake registered a 6.8 on
the Richter scale and was moderately felt throughout the southeastern United States. The New
Madrid Fault line runs along the Mississippi River. Geologists agree that another major
earthquake along the New Madrid Fault line could cause chimneys to fall, glass to break, and
walls to crack in Cleburne County.

97
Figure 3-6
Cleburne County →

98
Figure 3-7: Seismic Zones of the Southeastern United States
Source: Geological Survey of Alabama, 2014

99
In the eastern United States strong earthquakes occur less frequently than other parts of
the country; however, this does not mean that the damage in this area would be any less
catastrophic should a powerful quake occur. There are two important reasons for this. The first
is that the type of rock present in the eastern part of the country transmits seismic waves more
effectively. This in turn creates better transmission of earthquake energy and results in higher
damage over a wider area. Second, because buildings and other structures in the eastern United
States have not been designed to withstand severe earth shaking, they will sustain more damage.
Cleburne County experienced three earthquake events in a 10 year period resulting in a
30% (0.30) probability that an earthquake event will occur on an annual basis. The total amount
of damages for an earthquake event is also unknown, as well as the expected annual damages
from future events. The ranking is minimum to minor.
Primary effects from earthquake in Cleburne County would include:
1. Property Damage
2. Underground infrastructure damage
3. Building collapse
4. Trigger for other natural disasters
Hazardous results from earthquake in Cleburne County would include:
1. Shaking can cause cracking of roads, bridges, or buildings, which may also lead to
collapse.
2. Pipes and wiring underground could be severely damaged due to the movement of
the earth. This would result in interruption of service and long periods of repair
before lines were serviceable again.
3. Buildings in Cleburne County are not built to meet the rigors of earthquakes;
collapsing structures could kill or injure occupants.
4. Earthquakes can create other disasters such as landslides, flooding, and sinkholes.
5. Shifting of underlying soil and breaching of dams are examples of possible results
from an earthquake.

100
XII. Wildfire
Wildfires are responsible for burning thousands of acres of land across the United States
each year. They are large, fast moving, disastrous fires that occur in the wilderness or rural areas.
These fires are uncontrolled and in dry conditions can spread rapidly through the surrounding
vegetation and structures.
The frequency and severity of wildfires is dependent on weather and on human activity.
Nearly all wildfires in Cleburne County are human caused (only a small percent are caused by
lightning), with arson and careless debris burning being the major causes of wildfires. If not
promptly controlled, wildfires may grow into an emergency or disaster. Even small fires can
threaten lives, damage forest resources and destroy structures. Table 3-13 shows the number of
fires and acres burned during the period 2010 to 2013, as recorded by the Alabama Forestry
Commission. Cleburne County had a total of 155 fires during this 3 year period, affecting a total
of 5,278 acres. Cleburne County is located in an area where the current fire danger conditions
are low to moderate, according to the U. S. Forestry Service.
The National Forest Service (NFS) maintains data nationwide and produces various maps
and forecasts daily under the Wildland Fire Assessment System (WFAS). A review of this data
showed Cleburne County has an 11-15 percent probability of a fire occurring because of a
lightning strike. The probability of ignition by lightning depends mainly on fuel moisture. Fuel
Model Maps help to determine susceptibility of vegetative cover to wildfires. Cleburne County
is covered by Fuel Models A and C. Areas covered by these models consist of light fuel
vegetation such as herbaceous plants and round woods that are less than one-quarter of an inch.
Table 3-13: Wildfires in Cleburne County 2010-2013
County Total # of
Fires 2010-2013
Average # of Fires Per
Year
Total Acres Burned
2010-2013
Average Acres
Burned Per Year
Average Fire Size in
Acres
Cleburne 155 52 5,278 1,759 34 Source: Alabama Forestry Commission, 2014

101
Cleburne County experienced 155 wildfire events in a 3 year period resulting in a greater
than 100% (51.66) probability that a wildfire event will occur on an annual basis. The total
amount of acres burned for the 155 wildfire events was 5,278 resulting in an estimated 34 acres
burned per wildfire event. The total amount of acres burned was 5,278 multiplied by $1,900 (the
average market value for an acre of land in Cleburne County) equals $10,028,200 damages for
the 155 wildfire events with 155 wildfire events causing damage resulting in an estimated
$64,698 multiplied by 1.09 (projected loss expresses an estimated damage amount per future
occurrence by converting the average loss figures from a midpoint of 2008 dollars to 2014
dollars - $1 in 2008 = $1.09 in 2014…a cumulative rate of inflation of 9%) equals a total of
$70,521 of expected annual damages from future events. No deaths or injuries were reported.
The ranking, extent/range of magnitude or severity that could be experienced by Cleburne
County due to a wildfire event is minimum to minor.
Primary effects from wildfire in Cleburne County would include:
1. Loss of property
2. Loss of livestock
3. Destruction of wilderness
4. Crop destruction
Hazardous results from significant wildfire in Cleburne County would include:
1. Widespread fire destroys everything flammable, leaving people homeless and
businesses destroyed.
2. Fenced in livestock have no way of escaping the path of a wildfire and most are
lost due to smoke inhalation.
3. Most wildfires actually help forests grow because they rid the forest of
underbrush, but exceptionally hot fires that have a long duration destroy entire
forests.
4. An entire year’s crop can be lost by burning through all vegetation.

102
XIII. Dam Failures
A dam is barriers constructed across a watercourse in order to store, control, or divert
water. Dams are usually constructed of earth, rock, concrete, or mine tailings. The water
impounded behind a dam is referred to as the reservoir and is measured in acre-feet, with one
acre-foot being the volume of water that covers one acre of land to a depth of one foot. Due to
topography, even a small dam may have a reservoir containing many acre-feet of water. A dam
failure is the collapse, breach, or other failure of a dam that causes downstream flooding. Dam
failures may result from natural events, human-caused events, or a combination thereof. Due to
the lack of advance warning, failures resulting from natural events, such as hurricanes,
earthquakes, or landslides, may be particularly severe. Prolonged rainfall that produces flooding
is the most common cause of dam failure (FEMA, 1997).
Dam failures usually occur when the spillway capacity is inadequate and water overtops
the dam or when internal erosion through the dam foundation occurs (also known as piping). If
internal erosion or overtopping cause a full structural breach, a high-velocity, debris-laden wall
of water is released and rushes downstream, damaging or destroying whatever is in its path.
Dam failures may result from one or more the following:
Prolonged periods of rainfall and flooding (the cause of most failures)
Inadequate spillway capacity which causes excess overtopping flows
Internal erosion erosions due to embankment or foundation leakage or piping
Improper maintenance
Improper design
Negligent operation
Failure of upstream dams
Landslides into reservoirs
High winds
Earthquakes
Dam failures are potentially the worst flood events. A dam failure is usually the result of
neglect, poor design, or structural damage caused by a major event such as an earthquake.
Historical records of dam/levee failures for Cleburne County are not available. When a dam
fails, a large quantity of water is suddenly released downstream, destroying anything in its path.

103
The area impacted by the water emitted by dam failure would encounter the same risks as those
in a flood zone during periods of flooding. The area directly affected by the water released during
a dam failure is not county wide. The risks associated with dam/levee failures are the same as
those risks associated with flooding. There have been no significant dam or levee failures
reported in Cleburne County during 2003 - 2013.
Dam safety has been an ongoing hazard mitigation issue in the State of Alabama,
especially for small dams that are privately owned and poorly maintained. No state law currently
exists to regulate any private dams or the construction of new private dams, nor do private dams
require federal licenses or inspections. There have been several attempts in the State of Alabama
to pass legislation that would require inspection of dams on bodies of water over 50 acre-feet or
dams higher than 25 feet. Enactment has been hampered by the opposition of agricultural interest
groups and insurance companies. Once established, the program will provide an up-to-date
inventory of dams in Cleburne County. A full inventory of dams will help to benefit public safety
and emergency response operations in the event of a natural or other disaster. It will also provide
for the inspection and permitting certification of certain dams in order to protect the citizens of
Alabama by reducing the risk of failure of such dams. According to HAZUS-MH 2.1 and NOAA,
Cleburne County has 31 High Density Polyethylene (HPDE - Earth) Dams including one high
hazard dam (failure or poor operation would likely result in the loss of human life), six
significant hazard dams (failure or poor operation would not likely result in the loss of human
life, but would result in economic loss, environmental damage, and disruption of lifeline
facilities), and 24 low hazard dams (failure or poor operations would not likely result in the loss
of human life, but would result in low economic and environmental damage). None of the dams
is located within a municipality. All dams are located in sparsely populated areas scattered
throughout the unincorporated jurisdiction. Table 3-14 shows risk categories of dams. Table 3-
15 provides an inventory listing of all the dams in Cleburne County and includes additional data
on each.
The probability of future occurrences cannot be characterized on a countywide basis
because of the lack of information available. The qualitative probability is rated low because the
overall area affected is low and impacts are localized. This rating is intended only for general
comparison to other hazards that are being considered.

104
Primary effects from Dam failure in Cleburne County would include:
1. Loss of life
2. Destruction of property
3. Unregulated water flow to surrounding areas
4. Increased amount of disease and disease-carrying animals in the area
Hazardous results from dam failure in Cleburne County would include:
1. Heavy flooding would be a direct result of a dam failure, causing many deaths by
injuring and trapping people in structures.
2. Large amounts of water would sweep with it property and severely damage any
property that remained in the area.
3. Chemical spills from local factories caused by rushing water would pollute the
area and destroy crops and other property.
4. The river would be able to flow naturally once the dam was breached - damaging
any structures in the path, as well as interrupting wildlife cycles and hydrologic
power supply.
5. There would be increased diseases as a result of the unsanitary conditions.
Table 3-14: Cleburne County Dams Risk Categories
Risk Categories Number of Dams
High - loss of one human life is likely if the dam fails 6
Significant - possible loss of human life and likely significant property or environmental destruction if the dam fails if the dam fails
4
Low 30
Total 40 (Source: HAZUS MH 2.1)

105
Dam Name
NID ID River
NID Height
NID Storage
Year Completed
Drainage Area
Hazard
Longitude
Latitude
1. Heflin AL00624 Town Creek 0 169 1955 0 H ‐85.583329 33.64167
2. Creighton No. 1 AL00634 Tr Chulafinnee 0 50 1950 0 H ‐85.651669 33.546669
3. Robinson No. 2 AL00632 Tr. Chulafinnee 0 70 1957 0 L ‐85.623859 Not in Hazus
4. Esterling AL00631 Tr. Jackson Creek 0 100 1952 0 L ‐85.715 33.604999
5. Huston AL00630 Tr. Chulafinnee 0 90 1961 0 L ‐85.638329 33.54167
6. Abel AL00629 Tr. Chulafinnee 0 140 1960 0 L ‐85.684999 33.54333
7. Allen and Phill AL00628 Little Hillabee 0 100 1960 0 L ‐85.729999 33.581669
8. Stricklin AL00636 Tr. Chulafinnee 0 90 1964 0 L ‐85.655 33.545
9. Lake Cleburne AL00626 Tr. Tallapoosa Creek 0 530 1966 0 L ‐85.54 33.608329
10 Edmonds Lake AL00637 Chulafinnee Creek 0 680 1950 0 L ‐66833 33.549999
11 Bell AL00623 Tr. Cane Creek 0 70 1973 0 L ‐85.556669 33.673329
12 Owens AL00622 TR. Henry Creek 0 200 1962 0 L ‐85.556669 33.69333
13 Aderhold AL00621 Tr. Cane Creek 0 90 1950 0 L ‐85.51 33.743329
14 Nelson AL00619 Tr. Muscadine Creek 0 85 1965 0 L ‐85.434999 33.745
15 Laminack AL00618 Tr. Muscadine Creek 0 110 1960 0 S ‐85.39333 33.73833
16 Snows AL00617 Little Terrapin 0 80 1960 0 L ‐85.399999 33.94
17 Robinson AL00627 Tr. Snake Creek 0 100 1957 0 L ‐85.636669 33.6
18 Creighton No. 2 AL00635 Tr. Chulafinnee 0 62 1950 0 H ‐85.655 33.546669
19 Bonner AL01813 Bobo Branch 0 115 1975 0 L ‐85.63333 33.626669
20 White No. 1 AL01814 Tr. Chulafinnee 0 50 1950 0 L ‐85.684999 33.575
21 White No.2 AL01815 Tr. Chulafinnee 0 80 1950 0 L ‐85.684999 33.571669
22 Terrapin Creek AL00605 Tr. Terrapin Creek 36 811 1964 3 S ‐85.47333 33.936669
23 Terrapin Creek AL00606 Mathis Branch 47 764 1964 2.7 L ‐85.479999 33.886669
24 Terrapin Creek AL00609 Little Terrapin 51 6161 1969 15.9 L ‐85.459999 33.886669
25 Terrapin Creek AL00607 Camp Creek 59 4926 1966 17.5 L ‐85.5 833329
26 Terrapin Creek AL00604 Terrapin Creek 68 9890 1972 29.0094 L ‐85.528329 33.833329
27 Terrapin Creek AL00608 Terrapin Creek 106 6772 1968 21.6 L ‐85.416939 33.916939
28 Boy Scout AL00005 Carr Creek 37 1337 1972 2.75 L ‐85.66667 33.52167
29 Lost Creek Wat L00612 Lost Creek 40 1932 1966 8.5203 L ‐85.33667 33.549999
30 Lost Creek Wat Al00613 Tr. Lost Creek 38 563 1966 1.9594 L ‐85.344999 33.549999
31 Lost Creek Wat Al00610 Tr. Lost Creek 31 385 1966 1.4797 L ‐85.368329 33.54
32 Lost Creek Wat AL00611 Little Lost Creek 32 457 1964 1.6594 L ‐85.356669 33.555
33 Cahulga Creek AL00616 Cahulga Creek 40 3940 1972 6.5406 H ‐85.6 33.64167
34 Dynne Creek Wa AL02288 Tr‐Dynne Creek 53 1068 1986 3.2094 S ‐85.511669 33.556669
35 Laminack AL02353 Tr. Muscadine Creek 15 115 1985 0.625 L ‐85.44333 33.805
36 Dynne Creek Wa AL02446 Tr‐Dynne Creek 29 1003 1987 2.5406 S ‐85.53333 33.56667
37 Site 7 AL00615 Shoal Creek 74 6610 1971 9 H ‐85.583329 33.741669
38 Site 24 AL00614 Shoal Creek 88 6926 1972 13 H ‐85.626669 33.716669
39 Coleman Lake AL00002 Coleman Creek 32 200 1965 2 L ‐85.549999 33.76667
40 Morgan Lake AL82401 Trib. Hillabee Creek 20 70 1945 1 L ‐85.833329 33.5
(Source: HAZUS-MH 2.1)
Table 3-15: Cleburne County Dam Inventory

106
Section Four: Vulnerability Assessment
In Section Three, the primary effects and hazardous results were considered for all
identified hazards. In this section each hazard was further reviewed to identify the impacts on the
county and its jurisdictions. Impact in terms of dollar value for past hazard occurrences are
shown for the county in Table 3-5 and for each jurisdiction in their individual Hazard Event table
in Section Five of this plan.
Vulnerability is the extent to which something is damaged by a hazard. Vulnerability is
very often measured using “damage functions.” These are based on studies of how buildings
perform when they are exposed to hazards. Similar functions are available for infrastructure and
other physical assets. Injury and mortality functions (how many people are injured or die during
events) are also sometimes used as indicators of vulnerability, but these are generally not as
reliable as functions for physical assets because there are many more variables.
Thunderstorms (Source: NCDC NOAA) Damage from thunderstorms can have a wide range of severity. All jurisdictions are
vulnerable to thunderstorm events. Two thunderstorm events resulting in the largest amount of
damages occurred in Cleburne County during 2003-2013. One event occurred in Heflin on
February 26, 2008 and resulted in property damages of $200,000. Numerous trees and power
lines were blown down across the northern portion of the county. At least 10 buildings had roof
damage due to downed trees, and at least 3 buildings had roofs completely blown off. Several
mobile homes in a mobile home park suffered varying degrees of damage to underpinning, roofs,
and structure. No injuries, deaths or crop damages occurred. Another event occurred in East
Central Cleburne County on July 20, 2007 that resulted in property damages of $100,000. A few
homes suffered significant damage due to fallen trees.
Lightning (Source: NCDC NOAA)
Lightning can cause substantial property damage and loss of human lives. All
jurisdictions are vulnerable to lightning events. Two lightning events resulting in the largest
amount of damages occurred in Cleburne County during 2003-2013. On May 7, 2003, lightning
struck a home on Webb Drive in Ranburne that resulted in a fire that damaged 50% of the home.
107
Another lightning strike caused minor damage to a home on SR 46. Property damages of
$70,000 occurred. On May 8, 2003, lightning was believed responsible for fires at three houses
in and east of Helfin. Property damages of $48,000 occurred.
Hail (Source: NCDC NOAA)
Severe thunderstorms have been known to produce hailstones 4.25 inch in diameter
(softball size) in Cleburne County. All jurisdictions are vulnerable to hail events. On February
18, 2009, a hail event from a powerful low pressure system and associated cold front pushed
through the Trikem Area, and helped trigger numerous thunderstorms. Some became supercells
that produced long swaths of large hail, areas of damaging winds, and at least one tornado.
Cleburne County experienced hail magnitude of 4.25 inches (softball size) on Interstate 20
between mile markers 196 and 199, resulting in no property damage across the area.
Tornado (Source: NCDC NOAA)
The impacts of tornados can be far-reaching. Life, property, and personal items are at risk.
Tornados do not follow a definite path; all jurisdictions are vulnerable to tornado events.
Property damage, injury, and death can result from the weakest tornados. Interruption of
electrical services, communications, and other utilities may occur. Transportation corridors may
be blocked or even destroyed. Debris removal can take time and can be costly. Residents may
suffer from post-traumatic stress disorder, depression, anxiety, and grief for lost loved ones.
Longer response times results from having limited emergency personnel.
Areas with higher population densities pose the greatest potential for property damage,
injury, and death. The City of Heflin is the most densely populated area in the county.
Communities with a high concentration of mobile homes are extremely vulnerable to tornados.
Mobile homes are not capable of withstanding the strong winds associated with tornados.
Cleburne County has a total of 1,952 mobile homes countywide, 29.11% of the total housing
stock. The greatest concentration of mobile homes in a municipality is in the City of Fruithurst
where 54.11% of the units are mobile homes. (Sources: U.S. Census Bureau, 2010-2012
American Community Survey and Easidemographics.com)
The most significant event during the study period occurred in the area of Heflin on May

108
11, 2008 with an EF1 tornado, 3.78 miles in length and 1,000 yards wide. The tornado touched
down along the Talladega Scenic Drive, just south of US Highway 78. It then moved along a
slightly curved path until it crossed CR-79. Next, it tracked almost due east as it produced its
most concentrated damage near SR-9. The tornado lifted near the end of Brockford Road in the
vicinity of Shadow Lane, on the east side of the City of Heflin. Hundreds of trees were either
snapped off or uprooted along the path. Eight homes were destroyed and more than 40 others
received significant damage. Property damages of $1.75 million occurred.
Flood/Flash Flood (Source: NCDC NOAA)
Flooding can occur along the banks of the creeks and streams that flow throughout the
county and where development has encroached in the floodplain. Flash flooding can occur
anywhere in the county due to inadequate or clogged drainage systems and excessive rainfall.
Unpaved dirt roads, common in the rural areas, are particularly vulnerable. Impacts in developed
areas such as the City of Heflin include street flooding and water backing up into homes and
buildings. In addition to damaging homes, flooding can adversely impact crops, water and sewer
systems, and dams and levees. All jurisdictions are vulnerable to flood events.
On May 7, 2003, a countywide flash flood occurred, causing thirty to forty roads to
become flooded and impassable for at least 10 hours. The hardest hit areas were along the
Cleburne and Randolph County line in extreme southern Cleburne County. A mudslide occurred
on SR 9 near Heflin. (Source: NOAA NCDC)
On September 16, 2004, a flash flood event in association with Ivan occurred, causing
hundreds of trees and power lines to be blown down across the county. At least 10 homes
suffered moderate damage with much more reporting minor roof damage. The debris removal
took two weeks in some locations. Power was restored to most of the county in 24 hours.
Maximum wind gust were estimated between 55 and 65 miles an hour. Several roadways and
creeks were flooded due to the torrential rain. One creek bridge suffered damage. Doppler radar
and ground observations indicate as much as 6 inches of rain fell. (Source: NOAA NCDC)
Drought/Extreme Heat (Source: NOAA NCDC)
All jurisdictions are vulnerable to occurrences of drought and extreme heat. Droughts
may cause a shortage of water for human and industrial consumption, hydroelectric power,

109
recreation, and navigation. Water quality may also decline and the number and severity of
wildfires may increase. Severe droughts may result in the loss of agricultural crops and forest
products, undernourished wildlife and livestock, lower land values, and higher unemployment.
During the past ten years, Cleburne County experienced D2 Severe to D3 Extreme
Drought in 2006, D1 Moderate to D4 Exceptional Drought in 2007, D1 Moderate to D4
Exceptional Drought in 2008, D2 Severe to D3 Extreme Drought in 2011, D3 Extreme Drought
in 2012, and D2 Severe to D3 Extreme Drought in 2013. (Source: NOAA NCDC)
The categories of drought are defined as follows (Source http://droughtmonitor.unl.edu)
Accessed 11/16/14: Abnormally Dry (D0) - Going into drought: short-term dryness slowing
planting, growth of crops or pastures; fire risk above average. Coming out of drought: some
lingering water deficits; pastures or crops not fully recovered. Moderate Drought (D1) - Some
damage to crops, pastures; fire risk high; streams, reservoirs, or wells low, some water shortages
developing or imminent, voluntary water use restrictions requested. Severe Drought (D2) -
Crop or pasture losses likely; fire risk very high; water shortages common; water restrictions
imposed. Extreme Drought (D3) - Major crop/pasture losses; extreme fire danger; widespread
water shortages or restrictions. Exceptional Drought (D4) - Exceptional and widespread
crop/pasture losses; exceptional fire risk; shortages of water in reservoirs, streams, and wells,
creating water emergencies.
Extreme summer heat is the combination of very high temperatures and exceptionally
humid conditions. If such conditions persist for an extended period of time, it is called a heat
wave (FEMA). Heat stress can be indexed by combining the effects of temperature and humidity.
The index estimates the relationship between dry bulb temperatures (at different humidity) and
the skin’s resistance to heat and moisture transfer - the higher the temperature or humidity, the
higher the apparent temperature. The human risks associated with extreme heat include
heatstroke, heat exhaustion, heat syncope, heat cramps.
Winter Storm/Frost Freeze/Heavy Snow/Ice Storm/Winter Weather/Extreme Cold
Cleburne County commonly has extreme cold and winter storm events in any given year.
These events impact the county in a variety of ways. Ice and small amounts of snow can cripple
the county. Drivers are not accustomed to driving in these conditions, therefore many accidents
occur. Snow and ice can weigh down tree limbs and power lines causing them to break, resulting
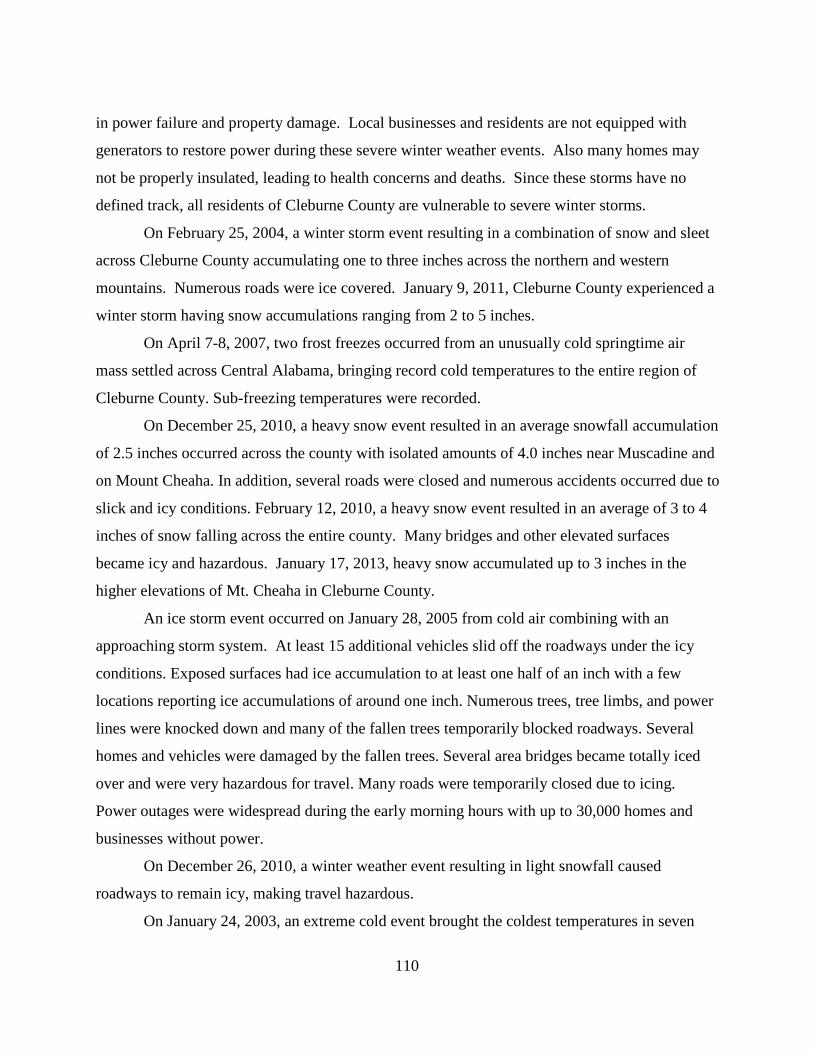
110
in power failure and property damage. Local businesses and residents are not equipped with
generators to restore power during these severe winter weather events. Also many homes may
not be properly insulated, leading to health concerns and deaths. Since these storms have no
defined track, all residents of Cleburne County are vulnerable to severe winter storms.
On February 25, 2004, a winter storm event resulting in a combination of snow and sleet
across Cleburne County accumulating one to three inches across the northern and western
mountains. Numerous roads were ice covered. January 9, 2011, Cleburne County experienced a
winter storm having snow accumulations ranging from 2 to 5 inches.
On April 7-8, 2007, two frost freezes occurred from an unusually cold springtime air
mass settled across Central Alabama, bringing record cold temperatures to the entire region of
Cleburne County. Sub-freezing temperatures were recorded.
On December 25, 2010, a heavy snow event resulted in an average snowfall accumulation
of 2.5 inches occurred across the county with isolated amounts of 4.0 inches near Muscadine and
on Mount Cheaha. In addition, several roads were closed and numerous accidents occurred due to
slick and icy conditions. February 12, 2010, a heavy snow event resulted in an average of 3 to 4
inches of snow falling across the entire county. Many bridges and other elevated surfaces
became icy and hazardous. January 17, 2013, heavy snow accumulated up to 3 inches in the
higher elevations of Mt. Cheaha in Cleburne County.
An ice storm event occurred on January 28, 2005 from cold air combining with an
approaching storm system. At least 15 additional vehicles slid off the roadways under the icy
conditions. Exposed surfaces had ice accumulation to at least one half of an inch with a few
locations reporting ice accumulations of around one inch. Numerous trees, tree limbs, and power
lines were knocked down and many of the fallen trees temporarily blocked roadways. Several
homes and vehicles were damaged by the fallen trees. Several area bridges became totally iced
over and were very hazardous for travel. Many roads were temporarily closed due to icing.
Power outages were widespread during the early morning hours with up to 30,000 homes and
businesses without power.
On December 26, 2010, a winter weather event resulting in light snowfall caused
roadways to remain icy, making travel hazardous.
On January 24, 2003, an extreme cold event brought the coldest temperatures in seven

111
years across Central Alabama and lasted for two days. Early morning temperatures ranged from 2
to 10 degrees. The coldest temperatures were measured in outlying areas. Although no new
records were established, these temperatures were very cold for the Deep South. Many area
residents reported frozen and broken water pipes as a result of the extended cold. Several lawn
sprinkler systems also froze and broke making many areas very icy.
Hurricanes/Tropical Storms/Tropical Depressions/Strong Winds/High Winds
Tropical Storms and Tropical Depressions such as Fay, Dennis, Ivan, Frances and Ida
have affected Cleburne County. The most significant impacts have been related to excessive
rainfall, damaging wind, and tornados. Residents suffer loss of power, damage to homes,
blocked roadways from associated storm debris, and loss of other crucial utilities. Mobile homes
are particularly vulnerable and are impacted more than conventionally built structures. Mobile
homes in the county represent 29.11% of the housing stock. Effects of these storms generally
impact the entire county and are not limited to a specific location. The fact that other
surrounding counties will have also been affected by the same event only adds to the burden, as
utility crews are often overwhelmed by the needs of an entire region or state.
On July 10-11, 2005, numerous trees and power lines were knocked down as Tropical
Storm Dennis moved across Cleburne County. No injuries, deaths, or crop damages occurred.
Property damages of $24,000 resulted from this event. (Source: NOAA NCDC)
On August 23-25, 2008, Tropical Depression Fay brought high winds, heavy rain, and
numerous tornadoes to the Cleburne County area. No injuries, deaths, or crop damages occurred.
Property damages of $5,000 resulted. (Source: NOAA NCDC)
On November 9, 2009, Tropical Depression Ida brought heavy rains and sustained winds
to Central Alabama. Winds maxed out between 20-30 mph, with peak wind gusts generally
between 30 and 40 mph. These winds blew down a few trees, especially shallow rooted trees
where the saturated soil likely played a significant role. No injuries, deaths, or crop damages
occurred. Property damages of $2,000 resulted. (Source: NOAA NCDC)
On September 16, 2004, a high wind event (in association with Ivan) resulted in
hundreds of trees and power lines being blown down across the county. At least 10 homes
suffered moderate damage with much more reporting minor roof damage. The debris removal

112
took two weeks in some locations. Power was restored to most of the county in 24 hours.
Maximum wind gust were estimated between 55 and 65 miles an hour. Several roadways and
creeks were flooded due to the torrential rain. One creek bridge suffered damage. Doppler radar
and ground observations indicate as much as 6 inches of rain fell. (Source: NOAA NCDC)
On September 7, 2004, a strong wind (38 mph) event occurred as remnants of Hurricane
Frances moved northward mainly across the eastern counties of Central Alabama. Strong winds
of 30 to 40 mph along with saturated ground conditions allowed several trees and power lines to
be blown down. No injuries, deaths, or crop damages occurred. Property damages of $1,000
resulted. (Source: NOAA NCDC)
On March 9, 2006, a strong wind event resulted in 46 mph winds causing sporadic tree
damages. No injuries, deaths, or crop damages occurred. Property damages of $2,000 resulted.
On December 20, 2007, a strong wind event resulted in 35 mph winds causing tree and
power line damage. Numerous power outages were reported. No injuries, deaths, or crop
damages occurred. Property damages of $10,000 resulted. (Source: NOAA NCDC)
Sinkholes/Expansive Soils
During the risk assessment, it was determined that Cleburne County has experienced 2
sinkholes; however, the sinkhole density in Cleburne County is low. No expansive soil issues
were reported from NOAA NCDC or the U. S. Geological Survey.
Landslides (Source: Local Input; Geological Survey of Alabama)
No landslide occurrences have been reported in Cleburne County.
Earthquakes (Sources: Alabama Geological Survey; USGS Database; NOAA NCDC;
www.homefacts.com/earthquakes/Alabama.html)
Cleburne County experienced three earthquake events in a 10 year period resulting in a
30% (0.30) probability that an earthquake event will occur on an annual basis. The total amount
of damages for an earthquake event is also unknown, as well as the expected annual damages
from future events. The ranking is minimum to minor.
A major earthquake in Cleburne County could result in great loss of life and property

113
damage in the billions of dollars. Adding to the danger is the fact that structures in the area were
not built to withstand earthquake shaking. Construction of many buildings on steep slopes
susceptible to landslides and in karst terrains susceptible to sinkholes will be a major
contributing factor to damage from future earthquakes in the county. Earthquakes can trigger
other natural disasters such as landslides and sinkholes. No earthquakes were reported by the
NOAA NCDC Storm Events Database; however, three earthquakes were reported by city-
data.com – a 4.9 magnitude earthquake occurred on April 29, 2003, 58.9 miles from the county’s
center; a 3.3 magnitude earthquake occurred on May 9, 2004, 80.5 miles from the county’s
center; and a 3.6 magnitude earthquake occurred on August 19, 2004, 88.4 miles from the
county’s center. Damages are unknown.
Wildfires (Source: Alabama Forestry Commission)
Cleburne County has a significant amount of acreage that is comprised of forestland and
is therefore vulnerable to wildfires, especially during times of drought. Both rural and urban
areas in all jurisdictions are impacted by wildfires and result in loss of wilderness, crops,
livestock and other property. Loss of human life, both residents and firefighters, is also possible.
Cleburne County experienced 155 wildfires from 2010-2013 resulting in 5,278 acres burned.
Dam/Levee Failures (Sources: HAZUS MH 2.1; Local Input)
Cleburne County has 35 High Density Polyethylene (HPDE - Earth) Dams, one Rock
Filled Dam (HPDR), and four miscellaneous dams (HPDZ) including six high hazard dams.
Potential impacts would include unregulated water flow, possible crop and property damage, and
an increase of waterborne disease. The risks associated with dam/levee failures are the same as
those risks associated with flooding. There have been no significant dam or levee failures
reported in Cleburne County during 2003 - 2013.
Socially Vulnerable Populations
Certain populations are generally more affected by hazard events. These populations can be
defined in terms of social, racial, and economic characteristics. Data provided in the section was
obtained from 2010 Census using breakouts for entire municipalities and census tracts.

114
According to the 2010 Census, Cleburne County has 560.10 square miles of land area and 26.69
persons per square mile.
Table 4-1 shows the county’s population characteristics by jurisdiction and by census tract.
The City of Heflin is the most populated jurisdiction, followed by the Towns of Ranburne,
Fruithurst, and Edwardsville. The county has four census tracts. In terms of vulnerability, the
larger the population of an area the more people and structures that could possibly be damaged or
destroyed. Tract 800 is the most populated tract and includes Muscadine, portions of Heflin, and
Ranburne. Tract 600 is the second most populated tract and includes portions of Heflin,
Fruithurst, and portions of Edwardsville. Tract 700 is the third most populated tract and includes
portions of Heflin, Hollis Crossroads, and Delta. Tract 500 is the least populated tract and
includes Piedmont, portions of Fruithurst, and portions of Edwardsville.
Table 4-1: Cleburne County Population Characteristics
Geographic Area
Cleburne County 14,972 14,079 498 395 3,957 8,654 2,361
Edwardsville 202 198 1 3 45 125 32
Fruithurst 284 279 0 5 85 164 35
Heflin 3,480 3,039 328 113 889 1,970 621
Ranburne 409 405 0 4 102 207 100
Census Tracts
500 2,684 2,618 7 59 733 1,579 372
600 4,202 3,750 333 119 1,085 2,405 712
700 3,419 3,114 153 152 861 2,002 556
800 4,667 4,597 5 65 1,278 2,668 721
(Source: 2010 Census)

115
Minority populations are generally considered to be more vulnerable to hazard events.
These populations may not have the resources necessary to recover as quickly or completely
from disasters. Minorities generally have higher percentages of inadequate medical insurance,
inadequate home insurance, and homes that may be deemed as substandard housing.
Populations over sixty-five years of age and those under eighteen years of age are more
vulnerable than other population groups. These groups are at higher risk for injury and medical
complications that may occur during or as a result of a disaster. These special needs populations
may require more attention during evacuation and may require special shelters.
In addition to the racial and age composition within the county, income levels are
important when identifying vulnerable populations. Lower income individuals may not have the
resources to prepare for or recover from disasters. Table 4-2 shows the median household
income, per capita income, and poverty level data for the jurisdictions and census tracts in
Cleburne County.
The median household income for the State of Alabama is $43,160. The median
household income for the United States is $53,046. No tracts exceed the state and national
averages. All municipalities have a median household income that is less than the state and
national averages. (Source: 2010 Census)
Per capita income is the average obtained by dividing aggregate income by the total
population of an area. The per capita income for the State of Alabama is $23,587. The per capita
income for the United States is $28,051. No tracts exceed the state and national averages. Only
one municipality, Ranburne, has a per capita income that exceeds the state average; however, is
less than the national average. All other municipalities have a per capita income that is less than
the state and national averages. (Source: 2010 Census)
The percent of persons below the poverty level in the State of Alabama is 18.1%. The
corresponding rate for the United States is 14.9%. Tracts 500, 600, and 800 are higher than the
state and national rates. Tract 700 is the only tract lower than the state and national averages.
Only the Town of Ranburne has a rate that is below the state and national rates. All other
municipalities have rates higher than the state and national rates. The Town of Edwardsville has
the highest poverty rate in the county at 41.64%. (Source: 2010 Census)

116
Table 4-2: Cleburne County Income Data
Geographic Area
Median Household Income
Per Capita Income
Persons Below Poverty Level
Percent Below Poverty Level
Cleburne County $37,244 $19,049 2,650 17.98%
Edwardsville $36,786 $21,042 142 41.64%
Fruithurst $41,250 $17,257 35 14.17%
Heflin $31,706 $17,706 834 25%
Ranburne $38,393 $26,487 55 12.39%
Census Tracts
500 $34,375 $18,555 460 21.76%
600 $32,396 $19,200 843 22.90%
700 $38,359 $18,263 383 9.78%
800 $42,692 $19,757 964 19.17%
(Sources: 2010 Census; www.usa.com,2015)

117
Vulnerable Structures Housing is an important consideration of mitigation planning. The concentration and the
type of housing are two primary factors. In Cleburne County there are a total of 6,706 housing
units. Table 4-3 shows the housing characteristics of the county by jurisdiction.
The City of Heflin has the greatest concentration of housing units, followed by the Towns
of Fruithurst, Edwardsville, and Ranburne. The City of Heflin has the highest number of mobile
home units within a municipality; while, the Town of Fruithurst has the highest percent of mobile
homes within a municipality. Mobile home units are historically very vulnerable to a variety of
hazards and prone to high amounts of damage and complete destruction.
Table 4-3: Cleburne County Housing Characteristics
Geographic Area Total Housing Units Mobile Home Units Mobile Home %
Cleburne County 6,706 1,952 29.11%
Edwardsville 168 57 33.93%
Fruithurst 146 79 54.11%
Heflin 1,478 243 16.44%
Ranburne 230 28 12.17%
(Source: 2010 Census)
Table 4-4 shows the building stock in Cleburne County by general occupancy. The data
provides the number of buildings by use and is shown by census tract. According to this data,
provided by HAZUS-MH 2.1 software, tract 700 has the highest number of structures in the
county. Complementing this information is Table 4-5 that provides the value totals for these
building types and Table 4-6 that provides the content value for these building types, each table
is shown by Census Tract. Tract 800 also has the highest total value for structures in the county.

118
Table 4-4: Cleburne County Building Stock by General Occupancy Tract
Residential
Commercial
Industrial
Agriculture
Religious
Government
Education
Building Count
500 1059 25 18 0 4 4 1 1111
600 2048 124 30 4 19 11 4 2240
700 1577 165 22 7 5 4 2 1782
800 1892 67 25 29 9 3 3 2028
TOTAL 6576 381 95 40 37 22 10 7161
(Source: HAZUS-MH 2.1)
Table 4-5: Cleburne County Building Exposure
(Numbers shown in thousands of dollars)
Tract Residential
Commercial
Industrial
Agriculture
Religious
Government
Education
Total Exposure
500 96433 4789 2940 0 2308 2126 749 109345
600 157304 34888 19222 811 9516 5809 5083 232633
700 144186 8476 13930 632 2056 2906 1605 173791
800 126880 15946 5890 3708 4643 888 2524 160479
TOTAL 524803 64099 41982 5151 18523 11729 9961 676248
(Source: HAZUS-MH 2.1)
Table 4-6: Cleburne County Building Contents Exposure (Numbers shown in thousands of dollars)
Tract
Residential
Commercial
Industrial
Agriculture
Religious
Government
Education
Total Exposure
500 48308 5036 3869 0 2308 3143 749 63413
600 78839 36560 27646 811 9516 6452 5083 164907
700 72192 8544 20222 632 2056 3975 1605 109226
800 63532 15946 8352 3708 4643 1306 2524 100011
TOTAL 262871 66086 60089 5151 18523 14876 9961 437557
(Source: HAZUS-MH 2.1)
119
Critical Facility Inventory
Critical facilities are crucial to the daily operation of Cleburne County. Critical facilities
help maintain a certain quality of life. Loss of operation could result in severe impacts on the
community. Each of the critical facilities listed in Table 4-7 is vulnerable to each of the hazards
identified in the risk assessment. Critical facilities include but are not limited to the following:
• Governmental
• Police and Fire Departments
• Public Works
• Educational
• Industrial
• Medical
HAZUS-MH 2.1 was also utilized for building and content values.

120
TABLE 4-7: Cleburne County Critical Facilities (Source: Local and HAZUS-MH 2.1)
Facility Location Area Use Value
Governmental Services County Courthouse 120 Vickery St. Heflin Governmental $8,000,000
County Jail/Sheriff’s Department 140 Lambert Dr. Heflin Law Enforcement $4,000,000
E911 Center Heflin Emergency Services $900,000
Piney Woods-Oak Level VFD 7890 Co. Rd. 65 Fruithurst Fire Protection
Muscadine VFD 156 County Road 446 Muscadine Fire Protection
Hollis VFD 9020 Highway 431 Heflin Fire Protection
Fruithurst VFD P.O. Box 146 Fruithurst Fire Protection
Micaville VFD 3384 Co. Rd. 10 Heflin Fire Protection
Abernathy VFD 14326 County Road 66 Heflin Fire Protection
Ranburne VFD 2975 Frank Ledbetter MD Ranburne Fire Protection
Borden Springs VFD 39155 County Road 49 Piedmont Fire Protection
Macedonia VFD 2314 County Road 48 Ranburne Fire Protection
Micaville VFD 3384 County Road 10 Heflin Fire Protection
Turkey Heaven VFD 13589 Highway 46 Heflin Fire Protection
Heflin VFD P.O. Box 128 Heflin Fire Protection
Crane Creek VFD 12106 Highway 78 Fruithurst Fire Protection
Library 935 Coleman St. Heflin Educational $250,000 Cleburne County Mountain Center 6751 Highway 78 Public Safety/E-911 Cleburne County Nursing Home 122 Brockford Road Nursing Home Cleburne County EMS 5902 Highway 46 EMS Public Works County Water System 90 Brockford Rd. Heflin Water $15,000,000
Streets Department/Engineering Office 302 Haley Rd. Heflin $1,000,000
Education
Cleburne Co. Elementary School 584 Evans Bridge Rd. Heflin Educational $5,038,750
Cleburne Co. High School 520 Evans Bridge Rd. Heflin Educational $12,234,750
Pleasant Grove Elementary School 9855 Highway 9 Heflin Educational $2,217,690
Cleburne Co. Career Technical School 11200 Highway 46 Fruithurst/Ranburne Educational $6,733,560
Fruithurst Elementary School 222 School Street Fruithurst Educational
Ranburne Elementary School 181 Young Drive Ranburne Educational
Ranburne High School 21045 Main Street Ranburne Educational
TOTAL $55,374,750St

121
Development Trends
The 2010 Census for Cleburne County, Alabama shows a countywide population of
14,972. Current population projection numbers show that the population in Cleburne County
will continue increasing within the next 20 years. There is a population change of 973 from 2010
to 2035, which is a 7% population increase. Table 4-8 provides the population projections for
Cleburne County.
Table 4-8: Cleburne County Population Projections
YEAR POPULATION PROJECTION
2015 15,354 2020 15,634 2025 15,817 2030 15,907 2035 15,945
(Sources: Center for Business and Economic Research, University of Alabama; Alabama Hazard Mitigation Plan, 2014)
The development trends in the county do not indicate any marked increase in
vulnerability to identified hazards.
Methods of Warning
Cleburne County Emergency Management Agency and the county's jurisdictions have
constructed a warning system that provides multiple ways to receive weather watches, warnings,
and other emergency messages.
NOAA Weather Radio
NOAA Weather Radio is a nationwide network of radio stations broadcasting weather
and other emergency information 24 hours a day. All National Weather Service-issued watches,

122
warnings, forecasts and other emergency messages are broadcast on one of seven frequencies.
National Weather Service personnel at offices in Birmingham record weather information
that plays in a cyclical pattern repeating every three to six minutes. Broadcasts generally include
local area five-day forecasts, current weather conditions, radar reports, weather summaries,
climatic data, river and lake stage readings, and other weather information. The broadcasts are
continuously updated to provide the listener with the latest information.
NOAA Weather Radio is useful any time for the latest weather information but becomes
even more important during severe or hazardous weather. During episodes of severe weather, the
normal broadcast cycle is interrupted and focus shifted to the local severe weather threat.
Watches, warnings, and statements are given the highest priority and are updated frequently as
conditions change.
In an emergency each transmitter is capable of transmitting a warning alarm tone signal
and the new Specific Area Message Encoding (SAME) signal, followed by information on the
emergency situation. These signals will activate specially designed receivers, either bringing up
the volume or producing a visual and/or audible alarm. Not all weather band receivers have this
capability, but all radios that receive NOAA Weather Radio transmissions can receive the
emergency broadcasts. The warning alarm device is tested the first Tuesday of each month at
four p.m., weather permitting.

123
TABLE 4-9: Cleburne County Outdoor Warning Sirens
Number
Jurisdiction
Address
Latitude
Longitude
1
County 38895 County Raod 49 33.650212 -85.409347
2
County 7890 County Road 65 33.802892 -85.43411
3 County
Coleman Lake Rd. 33.703521 -85.568249
4 County 16219 Highway 78 33.738935 -85.416827
5
County 4032 Tallapoosa Street 33.707557 -85.508697
6
County County Road 66 33.687066 -85.473676
7
County 5902 Highway 46 (EMS) 33.65463 -85.532059
8
County 52 Brandt Place 33.64778 -85.58975
9
County 579 County Road 158 33.57983 -85.672106
10 County 4087 Highway 9 33.59921 -85.606526
11
County County Road 42 33.576379 -85.517051
12
County 2343 County Road 48 33.580299 -85.343477
13
County 579 County Road 158 33.576983 -85.672106
14
County 1393 County Road 22 33.55575 -85.635719
15 County County Road 19 33.559924 -85.558208
16 County Highway 46 Crumley Chapels Church
33.559010 -85.399119
17 County 21375 Main Street 33.522798 -85.346488
18 County 4432 County 41 33.509896 -85.422338
19 County Cheaha State Park 33.477136 -85.808562

124
20 County County Road 5 (Micaville) 33.507673 -85.548436
21 County 9857 Highway 9 33.512476 -85.641191
22 County County Road 11 (Boy Scout Camp)
33.542830 -85.569613
23 County 3456 County Road 3 33.501594 -85.740422
*All sirens have a one mile audible radius
(Source: Participating Jurisdictions, 2014)
The entire countywide Outdoor Siren Warning System is periodically tested. Notification
of testing is usually posted in the newspapers to avoid confusion. The general public is advised to
not depend on hearing the sirens inside a building. The sirens are designed to be heard outdoors
only and are installed near recreational areas and shopping malls where there are large outdoor
populations. As a backup to the Outdoor Siren Warning System, police and fire units throughout
the county can be instructed to sound their sirens.
Broadcast Media
One of the key elements of the Countywide Warning System is broadcast media. Most of
the radio, television, and cable companies that serve Cleburne County residents are dedicated to
informing their audiences of impending emergencies. These broadcasters have partnered with
the Cleburne County Emergency Management Agency to bring their listeners and viewers fast,
accurate, and important severe weather and civil emergency information via EAS and traditional
newsgathering methods. Most of the television stations serving the Cleburne County market
(ABC 33/40, NBC 13, and Fox 6) feature live Doppler radar and certificated meteorologists.
Many of the radio stations provide continuous severe weather coverage. Local newspapers,
outdoor warning sirens, NOAA radios, and ALERT FM also assist in informing the public of
risks, threats, watches, warnings, evacuations, shelters, etc. The Cleburne County EMA has
printed and distributed materials with information concerning safe rooms, natural and man-made
hazards, and what to do during tornados.

125
Vulnerability Summary
Table 4-11 provides a summary of Cleburne County’s vulnerability to specified hazards
by jurisdiction. Each jurisdiction was tasked with considering how vulnerable they are to each
hazard by considering the percentage of potential damage and the frequency of occurrences.
Using information from the Risk Assessment in Section Three as well as the data in the earlier
parts of this section as a basis for evaluation, the committee members assigned either N/A: Not
Applicable, L: Low Risk, M: Medium Risk, and H: High Risk as defined in the Table Key.
Estimated Loss Projections
Table 4-10 shows the figures used for valuation of deaths and injuries are approximations
based on FEMA guidance used in benefit-cost analysis of hazard mitigation measures. Major and
minor injuries are combined in the NOAA data, so it was necessary to use a blended number in
the valuation.
Table 4-12 shows the estimated loss projections for each hazard. The average number of
occurrences per year is shown along with total number of deaths and injuries. The average
amount of loss per event was determined by combining crop and property loss damages for each
event type and then dividing by the corresponding total number of events reported during the ten-
year study period. This amount is shown under the column heading Average Crop and Property
Loss. There are instances where the Average Crop and Property Loss (per event) and Projected
Loss (per Event) for an identified hazard could not be determined due to the absence of historical
event data. This is a data limitation beyond the control of an affected jurisdiction.

126
Table 4-10: 2014 Values used for Monetary Conversion of Tornado Injuries and Deaths
Damage Category Value
Injury (blended major and minor) $23,175
Death $3,660,003
(Source: FEMA, 2014)
The Projected Loss is shown per event by hazard type. Due to the fluctuations in the value
of a dollar over the ten-year study period, the year 2008 was chosen as a midpoint year. The
Projected Loss was then calculated by adjusting the 2008 value of $1 up to $1.09, a 9 % increase
to reflect the value of the dollar in 2014. Average loss amounts were increased by 9% to achieve
a 2014 value for an estimated projected loss per event occurrence. (Source: U. S. Inflation
Calculator based on the U. S. Government Consumer Price Index Data)

127
Table 4-11: Cleburne County Vulnerability Summary Natural Hazards
Edw
ards
ville
Frut
ihur
st
Hef
lin
Ran
burn
e
Cle
burn
e C
ount
y
Thunderstorm H H H H H Lightning H H H H H Hail H H H H H Tornado H H H H H
Flood/Flash Flood M M M M M
Drought/ Extreme Heat H H H H H
Winter Storm/Frost Freeze/Heavy Snow/Ice Storm/ Winter Weather/Extreme Cold M M M M M
Hurricane/Tropical Storm/Tropical Depression/ High Wind/Strong Wind M M M M M
Sinkhole/ Expansive Soil L L L L L
Landslide L L L L L Earthquake L L L L L Wildfire H H H H H
Dam/Levee Failure L L L L L
KEY: NA – Not Applicable; not a hazard to the jurisdiction L – Low Risk; little damage potential (damage to less than 5% of the jurisdiction) M – Medium Risk; moderate damage potential (damage to 5-10% of jurisdiction, infrequent occurrence) H – High Risk; significant risk/major damage potential (damage to over 10% of jurisdiction, regular occurrence)
(Source: Participating Jurisdictions, 2015)

128
Table 4-12: Cleburne County Estimated Loss Projections from Specified Hazards
Natural Hazards
Average
Occurrences (per year)
Total
Deaths
Total
Injuries
Average Death and
Injury Loss (per event)
Average Crop and Property
Loss (per event)
Projected
Loss (per event)
Thunderstorm 3.8 0 0 Unknown $17,745 $19,342 Lightning 0.2 0 0 Unknown $59,000 $64,310 Hail 2.3 0 0 Unknown $1,000 $1,090 Tornado 0.4 0 0 Unknown $475,000 $517,750 Flood/Flash Flood 0.6 0 1 $3,863 $64,200 $74,189 Drought/Extreme Heat 3.6 0 0 Unknown Unknown Unknown Winter Storm/Frost Freeze/ Heavy Snow/Ice Storm/Winter Weather/ Extreme Cold
1.2 0 0 Unknown $40,000 $43,600
Hurricane/Tropical Storm/ Tropical Depression/High Wind/ Strong Wind
0.8 0 0 Unknown $71,125 $77,526
Sinkhole/Expansive Soil 0.2 0 0 Unknown Unknown Unknown Landslide Unknown 0 0 Unknown Unknown Unknown Earthquake 0.3 0 0 Unknown Unknown Unknown
Wildfire 52.0 0 0 Unknown $64,698 $70,521
Dam/Levee Failure 0 0 0 Unknown Unknown Unknown Sources: NOAA NCDC; U. S. Inflation Calculator/Consumer Price Index; Local Input; USDA Census of Agriculture; Alabama Forestry Commission and National Forestry Service; Alabama Geological Survey, 2015
Methodology: Average occurrences were expressed annually by dividing the total number of occurrences by the ten-year period. Deaths and injuries were taken from the hazard event data. Average losses were calculated by dividing the total amount of all damages by the total number of occurrences during the ten-year period with the exception of wildfire which is a 3-year period (# fires x # acres per fire x $1,900/acre average). Projected loss expresses an estimated damage amount per future occurrence by converting the average loss figures from a midpoint of 2008 dollars to 2014 dollars ($1 in 2008 = $1.09 in 2014…a cumulative rate of inflation of 9%). Zero denotes no data available to determine the average occurrences, average loss or projected loss per event.

129
Mitigating Potential Losses
The Hazard Mitigation Planning Committee set forth mitigation goals and objectives for
the county and its jurisdictions. Each jurisdiction sets forth its own mitigation action plan located
in Section Five. Ultimately, the goal of mitigation is to reduce or eliminate the long-term risk to
people and their property from hazards and their effects. The members of the Cleburne County
Hazard Mitigation Committee, as well as all jurisdictions participating in the mitigation plan
have identified the following goals for this mitigation plan:
• To protect human life and health,
• To protect natural resources and farmland,
• To minimize damage to public facilities and utilities such as water and gas mains,
electric, telephone and sewer lines, streets, and bridges,
• To increase public awareness of risk and mitigation,
• To minimize expenditure of public money for costly flood control projects,
• To minimize prolonged business interruptions,
• To help maintain a stable tax base by providing for the sound use and development of
flood prone areas,
• To do all these things in a manner that is equitable to all citizens of the County.
Mitigation Strategy
In the preparation of the mitigation strategy, the Hazard Mitigation Planning Committee
reviewed the goals and objectives of the 2010 plan revision. The committee agreed the goals and
objectives would remain the same for this plan revision.
Mitigation Actions
Mitigation ideas can be found on the FEMA.gov website. FEMA summarizes mitigation
actions into four types: Local Planning and Regulations, Structure and Infrastructure Projects,
Natural Systems Protection, Education and Awareness.
Jurisdictions sought and selected their own mitigation actions to support the goals and
objectives of the mitigation strategy. The identification of mitigation actions has been shaped by
the events that occurred over the past five years, vulnerabilities, and available mitigation actions.

130
Each significant event revealed strengths and weaknesses within the hazard mitigation program;
therefore, jurisdictions adjusted their mitigation actions to address these weaknesses accordingly.
Because of these events, the prioritization of actions has been re-evaluated and ranked as follows:
Actions identify the activity, what hazard(s) are addressed, whether the activity applies to
a new or existing asset, and an estimated cost. The action also identifies the planning
mechanism, possible funding sources, and a time frame for completion of the activity.
The committee agreed some routine actions are continuing; therefore, hazards including
drought, wildfire, earthquake, sinkholes, and landslides may or may not have specific actions
listed in the mitigation action charts. The following routine mitigation actions are implemented
by all participating jurisdictions where applicable and are not listed in the charts:
• Restricting the use of public water resources for non-essential usage during drought
emergencies.
• Encouraging citizens to take water-saving measures during drought emergencies.
• Adopting and enforcing building code provisions to reduce risk.
• Reduce risk through local planning, codes and ordinances.
• Regulating development in landslide and sinkhole hazard areas.
• Promoting conservation of open space or wildland-urban boundary zones to separate
developed areas from high-hazard areas.
• Setting guidelines for annexation and service extensions in high-risk areas.
• Addressing fire mitigation through access, signage, fire hydrants, water availability, and
vegetation management.
• Encouraging fire-resistant construction techniques.
• Educating citizens and increasing awareness on actions they can take to reduce their risks
and vulnerabilities of all hazards.
Action Priority and Cost Benefit Review
In the selection and prioritization of mitigation actions, each member was asked to
consider the following: funding options, political support, public support, legality, preservation of
the environment, and staff capability. The committee then looked at each strategy in terms of
costs and benefits. Not only were direct costs and benefits considered, but indirect costs and
benefits were also acknowledged. Indirect costs and/or benefits are often intangible attributes

131
such as social effects.
Priority mitigation actions will be implemented only if they are cost beneficial; maximum
benefits must outweigh the associated costs of the proposed actions. The committee performed a
general evaluation of each mitigation measure which might require FEMA funds. The committee
weighed the estimated costs for each mitigation measure against the projected benefits of the
action. A more detailed benefit-cost analysis will be required for each priority action to
determine economic feasibility during the project planning phase. Projects will also require a
more detailed evaluation for eligibility and feasibility including social impact, environmental
impact, technical feasibility, and other criteria that measure project effectiveness. This detailed
evaluation of projects will be performed in the pre-application phase of a grant request. Further,
implementation of actions will be subject to the availability of FEMA grants and other sources of
funding from year-to-year.
Mitigation Status
During the plan update mitigation actions were reviewed in order to identify completed,
deferred, or deleted actions from the previous plan and incorporate actions added during annual
updates. Table 4-13 shows Cleburne County’s updated mitigation actions for the 2015 plan
revision. During the plan update process new actions were identified and added to the plan. For
this plan revision, the committee decided to assign a new prioritization labeling as one project
may be equally as important as another project. As a result, projects will be labeled high,
medium, and low in priority. All actions will be addressed as soon as possible depending on
available funding and resources; however, actions labeled high in priority will be addressed first,
medium in priority will be addressed secondly, and low in priority will be addressed last. The
most important determination is funding, which greatly affects which projects can be completed.

132
Mitigation Strategy – Cleburne County
Table 4-13: Cleburne County Mitigation Actions, 2015 Mitigation Action - Completed Identification of flood hazard areas in communities that do not have flood studies
or flood insurance rate maps. Hazard(s) Addressed Flood Applies to new/existing asset Existing Local Planning Mechanism Cleburne County Commission and Engineers Time frame for Completion 5 years Estimated Cost TBD Funding Sources Local; Grants Priority High Milestones This action was completed on August 16, 2011; therefore, will be deleted from
future plans.
Mitigation Action Installation of outdoor alert and warning systems in areas currently not covered.
Hazard(s) Addressed Severe Weather Applies to new/existing asset Existing Local Planning Mechanism Cleburne County Commission and Municipal Leaders Time frame for Completion 2 years Estimated Cost $14,000 per unit Funding Sources Local; Grants Priority High Milestones Due to budgetary constraints this project is still awaiting completion. The county
would still like to follow through with the mitigation of flooding in these areas in the near future should funds become available within the county.
Mitigation Action Acquisition of repetitive flood loss properties.
Hazard(s) Addressed Flood Applies to new/existing asset Existing Local Planning Mechanism Cleburne County Commission and Engineers Time frame for Completion 5 years Estimated Cost TBD Funding Sources Local; Grants Priority High Milestones Due to budgetary constraints this project is still awaiting completion. The county
engineer would still like to follow through with the mitigation of flooding in these areas in the near future should funds become available within the county.
Mitigation Action County Road 10-Flooding of roadway during rains. Flagging or barricades by engineering department on a regular basis. There is a need to increase culvert size at four sites along this road to eliminate flooding.
Hazard(s) Addressed Flood Applies to new/existing asset Existing Local Planning Mechanism Cleburne County Commission and Engineers Time frame for Completion 5 years Estimated Cost $400,000 Funding Sources Local; Grants Priority High

133
Milestones Due to budgetary constraints this project is still awaiting completion. The county engineer would still like to follow through with the mitigation of flooding in these areas in the near future should funds become available within the county.
Mitigation Action County Road 4-Flash flooding caused by water to overtop bridge structure. There is a need to elevate/ reconstruct bridge.
Hazard(s) Addressed Flood Applies to new/existing asset Existing Local Planning Mechanism Cleburne County Commission and Engineers Time frame for Completion 5 years Estimated Cost $250,000 Funding Sources Local; Grants Priority High Milestones Budgetary constraints have prevented this project from being completed. It is still
in the interest of the county and engineer to complete this project should future funding come available.
Mitigation Action Install Community Safe Rooms in the county.
Hazard(s) Addressed Thunderstorm, Tornado, High Wind Applies to new/existing asset New Local Planning Mechanism Cleburne County Commission and EMA Time frame for Completion 3 years from funding Estimated Cost $150,000 each Funding Sources Local; Grants Priority High Milestones New Action Mitigation Action Provide emergency generators where needed throughout the county. Hazard(s) Addressed Thunderstorm, Tornado, High Wind Applies to new/existing asset Existing Local Planning Mechanism Cleburne County Commission and EMA Time frame for Completion 3 years from funding Estimated Cost $100,000 Funding Sources Local; Grants Priority High Milestones Budgetary constraints have prevented this project from being completed. It is still
in the interest of the county and engineer to complete this project should future Mitigation Action County Road 5 bridge over Lockchelooge Creek-Water leaves creek bed flooding
over bridge and roadway caused by flash flooding.
Hazard(s) Addressed Thunderstorm, Tornado, High Wind Applies to new/existing asset Existing Local Planning Mechanism Cleburne County Commission and EMA Time frame for Completion 3 years from funding Estimated Cost $100,000 Funding Sources Local; Grants Priority High Milestones Budgetary constraints have prevented this project from being completed. It is still
in the interest of the county and engineer to complete this project should future funding come available.

134
Mitigation Action County Road 126-Flash Flooding produces water over bridge structure.
Hazard(s) Addressed Flood Applies to new/existing asset Existing Local Planning Mechanism County Engineer and Commission Time frame for Completion 5 years Estimated Cost $200,000 Funding Sources Grants and Local Priority Medium Milestones Budgetary constraints have prevented this project from being completed. It is still
in the interest of the county and engineer to complete this project should future funding come available.
Mitigation Action County Road 428 – Water overtops bridge during rains. Flagging or barricades by Engineering department on a regular basis. To reduce the effects of flooding the bridge should be elevated.
Hazard(s) Addressed Flood Applies to new/existing asset Existing Local Planning Mechanism County Engineer and Commission Time frame for Completion 5 years Estimated Cost $250,000 Funding Sources Grants and Local Priority Medium Milestones Budgetary constraints have prevented this project from being completed. It is still
in the interest of the county and engineer to complete this project should future funding come available.
Mitigation Action Install severe weather community shelter in the Macedonia Community.
Hazard(s) Addressed Severe Weather Applies to new/existing asset New Local Planning Mechanism County Engineer and Commission Time frame for Completion 5 years Estimated Cost $45,000 Funding Sources Grants and Local Priority Medium Milestones DELETE ACTION- The County would like to install community safe rooms in
various locations in the county. Budgetary constraints have prevented this project from being completed. It is still in the interest of the county and engineer to complete this project should future funding come available.
Mitigation Action Cleburne County Water Authority – Purchase and install a backup generator for water.
Hazard(s) Addressed All Applies to new/existing asset New Local Planning Mechanism County Engineer and Commission Time frame for Completion 1 year Estimated Cost $25,000 Funding Sources Grants and Local Priority Medium

135
Milestones Budgetary constraints have prevented this project from being completed. It is still in the interest of the county and engineer to complete this project should future funding come available.
Mitigation Action Encourage individual citizens to install in-home tornado shelters. Hazard(s) Addressed Thunderstorms, Tornadoes, High Winds, Strong Winds Applies to new/existing asset New and Existing
Local Planning Mechanism EMA and Individuals
Time frame for Completion 2020
Estimated Cost $5,000 Funding Sources Citizens, Local, HMGP
Priority High
Milestones This action was submitted as a Limited Amendment to the 2010 hazard mitigation plan and remains relevant in this plan update.

136
Section Five:
Jurisdiction Assessments

137
This page left intentionally blank

138
TOWN OF EDWARDSVILLE

139
This page left intentionally blank
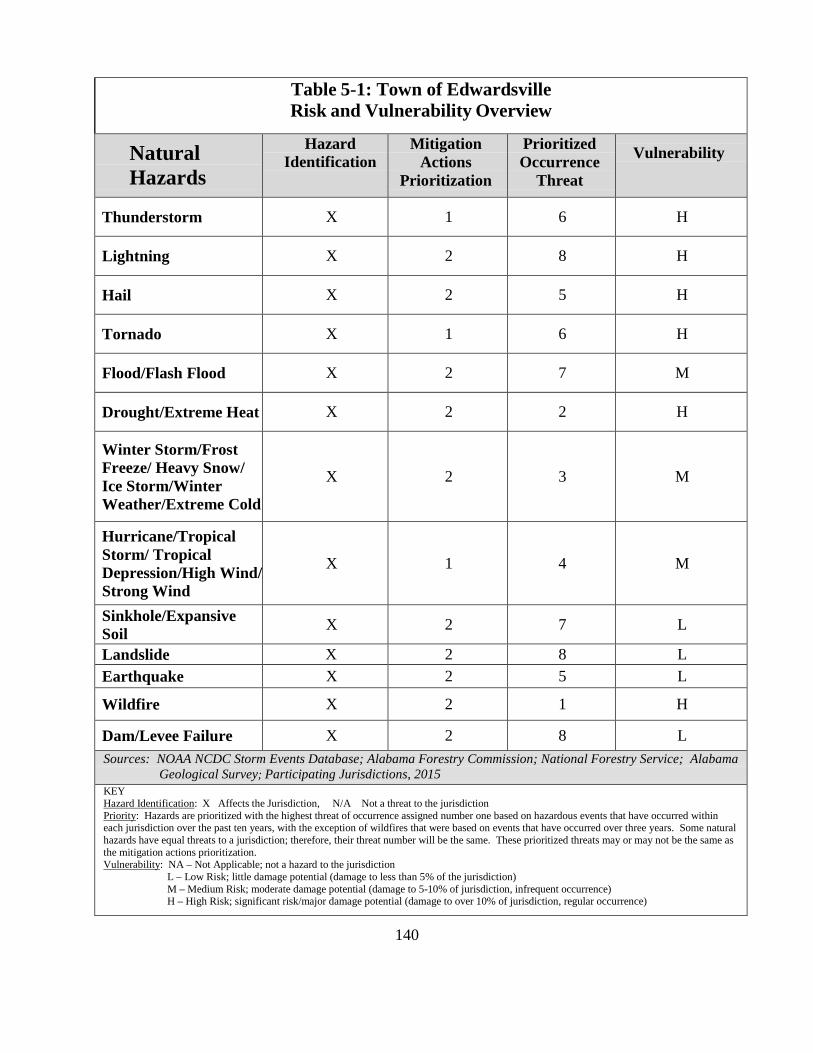
140
Table 5-1: Town of Edwardsville Risk and Vulnerability Overview
Natural Hazards
Hazard Identification
Mitigation Actions
Prioritization
Prioritized Occurrence
Threat
Vulnerability
Thunderstorm X 1 6 H
Lightning X 2 8 H
Hail X 2 5 H
Tornado X 1 6 H
Flood/Flash Flood X 2 7 M
Drought/Extreme Heat X 2 2 H
Winter Storm/Frost Freeze/ Heavy Snow/ Ice Storm/Winter Weather/Extreme Cold
X 2 3 M
Hurricane/Tropical Storm/ Tropical Depression/High Wind/ Strong Wind
X 1 4 M
Sinkhole/Expansive Soil X 2 7 L
Landslide X 2 8 L Earthquake X 2 5 L
Wildfire X 2 1 H
Dam/Levee Failure X 2 8 L Sources: NOAA NCDC Storm Events Database; Alabama Forestry Commission; National Forestry Service; Alabama
Geological Survey; Participating Jurisdictions, 2015 KEY Hazard Identification: X Affects the Jurisdiction, N/A Not a threat to the jurisdiction Priority: Hazards are prioritized with the highest threat of occurrence assigned number one based on hazardous events that have occurred within each jurisdiction over the past ten years, with the exception of wildfires that were based on events that have occurred over three years. Some natural hazards have equal threats to a jurisdiction; therefore, their threat number will be the same. These prioritized threats may or may not be the same as the mitigation actions prioritization. Vulnerability: NA – Not Applicable; not a hazard to the jurisdiction
L – Low Risk; little damage potential (damage to less than 5% of the jurisdiction) M – Medium Risk; moderate damage potential (damage to 5-10% of jurisdiction, infrequent occurrence) H – High Risk; significant risk/major damage potential (damage to over 10% of jurisdiction, regular occurrence)

141
TABLE 5-2: TOWN OF EDWARDSVILLE HAZARD EVENTS
5 Thunderstorms Events – 01/01/2003 thru 12/31/2013 (4018 days) (Source: NOAA NCDC Storm Events Database)
Location County/Zone St. Date Time T.Z. Type Mag Dth Inj PrD CrD
EDWARDSVILLE CLEBURNE CO. AL 05/09/2004 14:30 CST Thunderstorm Wind 50 kts. EG 0 0 1.00K 0.00K
COUNTYWIDE CLEBURNE CO. AL 06/22/2004 18:25 CST Thunderstorm Wind 60 kts. EG 0 0 10.00K 0.00K
COUNTYWIDE CLEBURNE CO. AL 04/30/2005 04:31 CST Thunderstorm Wind 52 kts. EG 0 0 2.00K 0.00K
EDWARDSVILLE CLEBURNE CO. AL 06/11/2008 16:50 CST‐6 Thunderstorm Wind 50 kts. EG 0 0 1.00K 0.00K
Totals:
0 0 26.0K 0.00K
0 Lightning Events – 01/01/2003 thru 12/31/2013 (4018 days) (Source: NOAA NCDC Storm Events Database and Local Input)
No lightning events occurred or were reported during 01/01/2003 thru 12/31/2013.
3 Hail Events – 01/01/2003 thru 12/31/2013 (4018 days) (Source: NOAA NCDC Storm Events Database)
Location County/Zone St. Date Time T.Z. Type Mag Dth Inj PrD CrD
EDWARDSVILLE CLEBURNE CO. AL 05/07/2003 14:24 CST Hail 1.00 in. 0 0 0.00K 0.00K
EDWARDSVILLE CLEBURNE CO. AL 12/28/2005 13:50 CST Hail 0.75 in. 0 0 0.00K 0.00K
EDWARDSVILLE CLEBURNE CO. AL 02/18/2009 17:10 CST‐6 Hail 0.88 in. 0 0 0.00K 0.00K
Totals:
0 0 0.00K 0.00K

142
2 Tornado Events – 01/01/2003 thru 12/31/2013 (4018 days) (Source: NOAA NCDC Storm Events Database)
Location County/Zone St. Date Time T.Z. Type Mag Dth Inj PrD CrD
EDWARDSVILLE CLEBURNE CO. AL 03/06/2003 02:51 CST Tornado F1 0 0 0.00K 12.00K
EDWARDSVILLE CLEBURNE CO. AL 05/11/2008 01:47 CST-6 Tornado EF1 0 0 50.00K 0.00K
Totals:
0 0 50.00K 12.00K
3 Flood Events – 01/01/2003 thru 12/31/2013 (4018 days) (Source: NOAA NCDC Storm Events Database)
Location County/Zone St. Date Time T.Z. Type Mag Dth Inj PrD CrD
COUNTYWIDE CLEBURNE CO. AL 05/07/2003 16:00 CST Flash Flood
0 0 250.00K 0.00K
COUNTYWIDE CLEBURNE CO. AL 09/16/2004 10:45 CST Flash Flood
0 0 50.00K 0.00K
COUNTYWIDE CLEBURNE CO. AL 11/24/2004 08:25 CST Flash Flood
0 0 6.00K 0.00K
Totals:
0 0 306.00K 0.00K
36 Drought/Extreme Heat Events – 01/01/2003 thru 12/31/2013 (4018 days) (Source: NOAA NCDC Storm Events Database)
Location County/Zone St. Date Time T.Z. Type Mag Dth Inj PrD CrD
CLEBURNE (ZONE) CLEBURNE (ZONE) AL 07/18/2006 07:00 CST Drought
0 0 0.00K 0.00K
CLEBURNE (ZONE) CLEBURNE (ZONE) AL 08/01/2006 00:00 CST Drought
0 0 0.00K 0.00K
CLEBURNE (ZONE) CLEBURNE (ZONE) AL 09/01/2006 00:00 CST Drought
0 0 0.00K 0.00K
CLEBURNE (ZONE) CLEBURNE (ZONE) AL 05/01/2007 00:00 CST-6 Drought
0 0 0.00K 0.00K
CLEBURNE (ZONE) CLEBURNE (ZONE) AL 06/01/2007 00:00 CST-6 Drought
0 0 0.00K 0.00K
CLEBURNE (ZONE) CLEBURNE (ZONE) AL 07/01/2007 00:00 CST-6 Drought
0 0 0.00K 0.00K
CLEBURNE (ZONE) CLEBURNE (ZONE) AL 08/01/2007 00:00 CST-6 Drought
0 0 0.00K 0.00K
CLEBURNE (ZONE) CLEBURNE (ZONE) AL 09/01/2007 00:00 CST-6 Drought
0 0 0.00K 0.00K

143
CLEBURNE (ZONE) CLEBURNE (ZONE) AL 10/01/2007 00:00 CST-6 Drought
0 0 0.00K 0.00K
CLEBURNE (ZONE) CLEBURNE (ZONE) AL 11/01/2007 00:00 CST-6 Drought
0 0 0.00K 0.00K
CLEBURNE (ZONE) CLEBURNE (ZONE) AL 12/01/2007 00:00 CST-6 Drought
0 0 0.00K 0.00K
CLEBURNE (ZONE) CLEBURNE (ZONE) AL 01/01/2008 00:00 CST-6 Drought
0 0 0.00K 0.00K
CLEBURNE (ZONE) CLEBURNE (ZONE) AL 02/01/2008 00:00 CST-6 Drought
0 0 0.00K 0.00K
CLEBURNE (ZONE) CLEBURNE (ZONE) AL 03/01/2008 00:00 CST-6 Drought
0 0 0.00K 0.00K
CLEBURNE (ZONE) CLEBURNE (ZONE) AL 04/01/2008 00:00 CST-6 Drought
0 0 0.00K 0.00K
CLEBURNE (ZONE) CLEBURNE (ZONE) AL 05/01/2008 00:00 CST-6 Drought
0 0 0.00K 0.00K
CLEBURNE (ZONE) CLEBURNE (ZONE) AL 06/01/2008 00:00 CST-6 Drought
0 0 0.00K 0.00K
CLEBURNE (ZONE) CLEBURNE (ZONE) AL 07/01/2008 00:00 CST-6 Drought
0 0 0.00K 0.00K
CLEBURNE (ZONE) CLEBURNE (ZONE) AL 08/01/2008 00:00 CST-6 Drought
0 0 0.00K 0.00K
CLEBURNE (ZONE) CLEBURNE (ZONE) AL 09/30/2008 06:00 CST-6 Drought
0 0 0.00K 0.00K
CLEBURNE (ZONE) CLEBURNE (ZONE) AL 10/01/2008 00:00 CST-6 Drought
0 0 0.00K 0.00K
CLEBURNE (ZONE) CLEBURNE (ZONE) AL 11/01/2008 00:00 CST-6 Drought
0 0 0.00K 0.00K
CLEBURNE (ZONE) CLEBURNE (ZONE) AL 12/01/2008 00:00 CST-6 Drought
0 0 0.00K 0.00K
CLEBURNE (ZONE) CLEBURNE (ZONE) AL 10/19/2010 00:00 CST-6 Drought
0 0 0.00K 0.00K
CLEBURNE (ZONE) CLEBURNE (ZONE) AL 08/23/2011 00:00 CST-6 Drought
0 0 0.00K 0.00K
CLEBURNE (ZONE) CLEBURNE (ZONE) AL 09/01/2011 00:00 CST-6 Drought
0 0 0.00K 0.00K
CLEBURNE (ZONE) CLEBURNE (ZONE) AL 10/01/2011 00:00 CST-6 Drought
0 0 0.00K 0.00K
CLEBURNE (ZONE) CLEBURNE (ZONE) AL 11/01/2011 00:00 CST-6 Drought
0 0 0.00K 0.00K
CLEBURNE (ZONE) CLEBURNE (ZONE) AL 06/26/2012 00:00 CST-6 Drought
0 0 0.00K 0.00K
CLEBURNE (ZONE) CLEBURNE (ZONE) AL 07/01/2012 00:00 CST-6 Drought
0 0 0.00K 0.00K
CLEBURNE (ZONE) CLEBURNE (ZONE) AL 08/01/2012 00:00 CST-6 Drought
0 0 0.00K 0.00K
CLEBURNE (ZONE) CLEBURNE (ZONE) AL 09/01/2012 00:00 CST-6 Drought
0 0 0.00K 0.00K

144
CLEBURNE (ZONE) CLEBURNE (ZONE) AL 10/01/2012 00:00 CST-6 Drought
0 0 0.00K 0.00K
CLEBURNE (ZONE) CLEBURNE (ZONE) AL 11/01/2012 00:00 CST-6 Drought
0 0 0.00K 0.00K
CLEBURNE (ZONE) CLEBURNE (ZONE) AL 01/01/2013 00:00 CST-6 Drought
0 0 0.00K 0.00K
CLEBURNE (ZONE) CLEBURNE (ZONE) AL 02/01/2013 00:00 CST-6 Drought
0 0 0.00K 0.00K
Totals:
0 0 0.00K 0.00K
12 Winter Storm/Frost Freeze/Heavy Snow/Ice Storm/Winter Weather/Extreme Cold
Events – 01/01/2003 thru 12/31/2013 (4018 days) (Source: NOAA NCDC Storm Events Database)
Location County/Zone St. Date Time T.Z. Type Mag Dth Inj PrD CrD
CLEBURNE (ZONE) CLEBURNE (ZONE) AL 02/25/2004 19:30 CST Winter Storm
0 0 0.00K 0.00K
CLEBURNE (ZONE) CLEBURNE (ZONE) AL 01/09/2011 16:40 CST-6 Winter Storm
0 0 0.00K 0.00K
CLEBURNE (ZONE) CLEBURNE (ZONE) AL 04/07/2007 00:00 CST-6 Frost/freeze
0 0 0.00K 0.00K
CLEBURNE (ZONE) CLEBURNE (ZONE) AL 04/08/2007 00:00 CST-6 Frost/freeze
0 0 0.00K 0.00K
CLEBURNE (ZONE) CLEBURNE (ZONE) AL 02/12/2010 12:00 CST-6 Heavy Snow
0 0 0.00K 0.00K
CLEBURNE (ZONE) CLEBURNE (ZONE) AL 12/25/2010 08:00 CST-6 Heavy Snow
0 0 0.00K 0.00K
CLEBURNE (ZONE) CLEBURNE (ZONE) AL 02/09/2011 19:00 CST-6 Heavy Snow
0 0 0.00K 0.00K
CLEBURNE (ZONE) CLEBURNE (ZONE) AL 01/17/2013 14:00 CST-6 Heavy Snow
0 0 0.00K 0.00K
CLEBURNE (ZONE) CLEBURNE (ZONE) AL 01/28/2005 20:45 CST Ice Storm
0 0 40.00K 0.00K
CLEBURNE (ZONE) CLEBURNE (ZONE) AL 01/19/2008 06:00 CST-6 Winter Weather
0 0 0.00K 0.00K
CLEBURNE (ZONE) CLEBURNE (ZONE) AL 12/26/2010 03:00 CST-6 Winter Weather
0 0 40.00K 0.00K
CLEBURNE (ZONE) CLEBURNE (ZONE) AL 01/24/2003 00:00 CST Extreme Cold/wind Chill
0 0 0.00K 0.00K
Totals:
0 0 40.00K 0.00K

145
8 Hurricane/Tropical Storm/Tropical Depression/High Wind/Strong Wind Events – 01/01/2003 thru 12/31/2013 (4018 days)
(Source: NOAA NCDC Storm Events Database) Location County/Zone St. Date Time T.Z. Type Mag Dth Inj PrD CrD
CLEBURNE (ZONE) CLEBURNE (ZONE) AL 07/10/2005 18:00 CST Tropical Storm
0 0 24.00K 0.00K
CLEBURNE (ZONE) CLEBURNE (ZONE) AL 08/29/2005 23:30 CST Tropical Storm
0 0 25.00K 0.00K
CLEBURNE (ZONE) CLEBURNE (ZONE) AL 08/23/2008 12:00 CST-6 Tropical Depression
0 0 5.00K 0.00K
CLEBURNE (ZONE) CLEBURNE (ZONE) AL 11/09/2009 14:00 CST-6 Tropical Depression
0 0 2.00K 0.00K
CLEBURNE (ZONE) CLEBURNE (ZONE) AL 09/16/2004 09:00 CST High Wind 50 kts. EG 0 0 500.00K 0.00K
CLEBURNE (ZONE) CLEBURNE (ZONE) AL 09/07/2004 00:15 CST Strong Wind 33 kts. ES 0 0 1.00K 0.00K
CLEBURNE (ZONE) CLEBURNE (ZONE) AL 03/09/2006 18:00 CST Strong Wind 40 kts. EG 0 0 2.00K 0.00K
CLEBURNE (ZONE) CLEBURNE (ZONE) AL 12/20/2007 18:00 CST-6 Strong Wind 30 kts. EG 0 0 10.00K 0.00K
Totals:
0 0 569.00K 0.00K
0 Sinkhole/Expansive Soil Events - 01/01/2003 thru 12/31/2013 (4018 days)
(Source: NOAA NCDC Storm Events Database/U.S. Geological Survey)
No events occurred or were reported during 01/01/2003 thru 12/31/2013.
0 Landslide Events - 01/01/2003 thru 12/31/2013 (4018 days) (Source: NOAA NCDC Storm Events Database/U.S. Geological Survey)
No events occurred or were reported during 01/01/2003 thru 12/31/2013.
3 Earthquake Events – 01/01/2003 thru 12/31/2013 (4018 days) (Source: www.city-data.com)
Location County/Zone St. Date Time T.Z. Type Mag Dth Inj PrD CrD
58.9 miles away from county center CLEBURNE AL 04/29/2003 08:59 CST Earthquake 4.9 0 0 0.00K 0.00K
89.5 miles away from county center CLEBURNE AL 05/09/2004 08:56 CST Earthquake 3.3 0 0 0.00K 0.00K
88.4 miles away from county center CLEBURNE AL 08/19/2004 23:51 CST Earthquake 3.6 0 0 0.00K 0.00K
Totals:
0 0 0.00K 0.00K

146
155 Wildfire Events – 2010 - 2013 (Source: Alabama Forestry Commission)
County Total # of Fires
Average # of Fires
Total Acres Burned
Average Acres
Burned
Average Fire Size in Acres
Cleburne 155 52 5,278 1,759 34
0 Dam/Levee Failure Events - 01/01/2003 thru 12/31/2013 (4018 days)
(Source: NOAA NCDC Storm Events Database)
No events occurred or were reported during 01/01/2003 thru 12/31/2013.

147
Table 5-3: Town of Edwardsville Hazard Probability Assessment
Natural Hazards
Number of Historical
Occurrences
Probability of Future
Occurrence
Extent
Area Affected
Thunderstorm 5 50% >10% Countywide Lightning Unknown Unknown >10% Town-wide
Hail 3 300% >10% Town-wide
Tornado 2 20% >10% Town-wide Flood/Flash Flood 3 30% 5-10% Countywide
Drought/Extreme Heat 36 >100% >10% Countywide Winter Storm/Frost Freeze/Heavy Snow/Ice Storm/Winter Weather/ Extreme Cold
12 >100% 5-10% Countywide
Hurricane/Tropical Storm/Tropical Depression/High Wind/ Strong Wind
8 80% 5-10% Countywide
Sinkhole/Expansive Soil Unknown Unknown <10% N/A
Landslide Unknown Unknown <10% N/A Earthquake 3 30% <10% N/A
Wildfire 155 >100% >10% Countywide
Dam/Levee Failure 0 Unknown <10% N/A Sources: NOAA NCDC; U. S. Inflation Calculator/Consumer Price Index; USGS ; Local Input; USDA Census of Agriculture; Alabama Forestry Commission; and National Forestry Service; Participating Jurisdictions, 2014
Methodology: Number of historical occurrences is those reported by NOAA NCDC during the 10 year study period, with the exception of wildfire that is a 3 year study period. Probability is expressed by dividing the total number of occurrences by the study period in years. Extent is expressed as the percentage assigned by the jurisdictions’ ranking in the vulnerability summary (Table 4-11). Zero denotes no data available to determine the probability, extent, or affected area.

148
TABLE 5-4: Town of Edwardsville Critical Facilities Facility Location Use Value Governmental Services Town Hall 4036 Tallapoosa St Government $75,000 Police Department Police Dispatch N/A Muscadine Volunteer Fire Department 1564 County Road 57 Fire and Rescue N/A Public Works Water System N/A Water Supply $300,000 Public Works 4036 Tallapoosa St $10,000 Miscellaneous Streets N/A Transportation $200,000 Senior Center/Recreation Facilities Recreation $5,000
(Source: Local Jurisdiction; HAZUS-MH 2.1) TOTAL $590,000

149
Table 5-5: Town of Edwardsville Estimated Loss Projections from Specified Hazards
Natural Hazards
Average
Occurrences (per year)
Total
Deaths
Total
Injuries Average
Death and Injury Loss
(per event)
Average Crop and Property
Loss (per event)
Projected
Loss (per event)
Thunderstorm 3.8 0 0 Unknown $17,745 $19,342
Lightning 0.2 0 0 Unknown $59,000 $64,310
Hail 2.3 0 0 Unknown $1,000 $1,090 Tornado 0.4 0 0 Unknown $475,000 $517,750 Flood/Flash Flood 0.6 0 1 $3,863 $64,200 $74,189 Drought/Extreme Heat 3.6 0 0 Unknown Unknown Unknown
Winter Storm/Frost Freeze/Heavy Snow/Ice Storm/Winter Weather/ Extreme Cold
1.2 0 0 Unknown $40,000 $43,600
Hurricane/Tropical Storm/Tropical Depression/High Wind/ Strong Wind
0.8 0 0 Unknown $71,125 $77,526
Sinkhole/Expansive Soils Unknown 0 0 Unknown Unknown Unknown
Landslide Unknown 0 0 Unknown Unknown Unknown Earthquake 0.3 0 0 Unknown Unknown Unknown Wildfire 52.0 0 0 Unknown $64,698 $70,521 Dam/Levee Failure Unknown 0 0 Unknown Unknown Unknown
Sources: NOAA NCDC; U.S. Inflation Calculator/Consumer Price Index; Local Input; USDA Census of Agriculture; Alabama Forestry Commission and National Forestry Service; Alabama Geological Survey, 2015
Methodology: Average occurrences were expressed annually by dividing the total number of occurrences by the ten-year period. Deaths and injuries were taken from the hazard event data. Average losses were calculated by dividing the total amount of all damages by the total number of occurrences during the ten-year period with the exception of wildfire. Projected loss expresses an estimated damage amount per future occurrence by converting the average loss figure from a midpoint of 2008 dollars to 2014 dollars ($1 in 2008 = $1.09 in 2014…a cumulative rate of inflation of 9%). Zero denotes no data available to determine the average occurrences, average loss or projected loss per event.

150
Town of Edwardsville Mitigation Action Plan
The Town of Edwardsville recognizes the importance of mitigation planning and will
incorporate mitigation planning in planning documents as they are revised or initiated.
Mitigation Status
During the plan update, mitigation actions were reviewed in order to identify completed,
deferred, or deleted actions from the previous plan and incorporate actions added during annual
updates. Table 5-6 shows the Town of Edwardsville’s updated mitigation actions. During the
plan update process new actions were identified and added to the plan. For this plan revision, the
committee decided to assign a new prioritization labeling as one project may be equally as
important as another project. As a result, projects will be labeled high, medium, and low in
priority.
Mitigation Strategy – Town of Edwardsville
Table 5-6: Town of Edwardsville Mitigation Actions 2015 Mitigation Action Install/Construct Community Safe Rooms for the public Hazard(s) Addressed Thunderstorm, Tornado, High Wind Applies to new/existing asset Town Council Local Planning Mechanism Town Council and County EMA Time frame for Completion 3 years Estimated Cost $100,000 Funding Sources Local and grants funds Priority High Status The town has continued interest in completing this project. Budgetary constraints
have prevented the implementation to date.
Mitigation Action New Install emergency generators in needed facilities Hazard(s) Addressed Thunderstorm, Tornado, High Wind Applies to new/existing asset Existing Local Planning Mechanism Town Council and County EMA Time frame for Completion 3 years Estimated Cost $80,000 Funding Sources Local and grants funds Priority High Status New Action

151
This page left intentionally blank

152
Town of Fruithurst

153
This page left intentionally blank

154
Table 5-7: Town of Fruithurst Risk and Vulnerability Overview
Natural Hazards Hazard Identification
Mitigation Actions Prioritization
Prioritized Occurrence
Threat
Vulnerability
Thunderstorm X 1 6 H
Lightning X 2 9 H
Hail X 2 5 H
Tornado X 1 9 H
Flood X 2 8 M
Drought/Extreme Heat X 2 2 H
Winter Storm/Frost Freeze/ Heavy Snow/Ice Storm/Winter Weather/Extreme Cold
X 2 3 M
Hurricane/Tropical Storm/ Tropical Depression/ High Wind/ Strong Wind
X 1 4 M
Sinkhole/Expansive Soil X 2 8 L
Landslide X 2 8 L
Earthquake X 2 7 L
Wildfire X 2 1 H
Dam/Levee Failure X 2 9 L
KEY: Hazard Identification – Identified by local jurisdictions Mitigation Actions Prioritization - Hazards are prioritized by jurisdictions based on past hazard experiences, vulnerabilities, and available mitigation actions with the hazard having highest priority of mitigation assigned number one. Prioritized Occurrence Threat - Hazards are prioritized with the highest threat of occurrence assigned number one based on hazardous events that have occurred within each jurisdiction over the past ten years, with the exception of wildfires that were based on events that have occurred over three years. Some natural hazards have equal threats to a jurisdiction; therefore, their threat number will be the same. These prioritized threats may or may not be the same as the mitigation actions prioritization. Vulnerability – Identified by local jurisdictions. NA – Not Applicable; not a hazard to the jurisdiction; L – Low Risk; little damage potential (damage to less than 5% of the jurisdiction); M – Medium Risk; moderate damage potential (damage to 5-10% of jurisdiction, infrequent occurrence); and H – High Risk; significant risk/major damage potential (damage to over 10% of jurisdiction, regular occurrence)
(Source: NOAA NCDC Storm Events Database; Alabama Forestry Commission; National Forestry Service; Alabama Geological Survey; Participating Jurisdictions, 2015)

155
TABLE 5-8: TOWN OF FRUITHURST HAZARD EVENTS
7 Thunderstorm Events – 01/01/2003 thru 12/31/2013 (4018 days) (Source: NOAA NCDC Storm Events Database)
Location County/Zone St. Date Time T.Z. Type Mag Dth Inj PrD CrD
COUNTYWIDE CLEBURNE CO. AL 05/02/2003 17:22 CST Thunderstorm Wind 55 kts. EG 0 0 12.00K 0.00K
FRUITHURST CLEBURNE CO. AL 07/21/2003 16:50 CST Thunderstorm Wind 50 kts. EG 0 0 6.00K 0.00K
COUNTYWIDE CLEBURNE CO. AL 06/22/2004 18:25 CST Thunderstorm Wind 60 kts. EG 0 0 10.00K 0.00K
COUNTYWIDE CLEBURNE CO. AL 04/30/2005 04:31 CST Thunderstorm Wind 52 kts. EG 0 0 2.00K 0.00K
FRUITHURST CLEBURNE CO. AL 07/20/2007 11:00 CST-6 Thunderstorm Wind 50 kts. EG 0 0 100.00K 0.00K
FRUITHURST CLEBURNE CO. AL 06/29/2008 16:18 CST-6 Thunderstorm Wind 50 kts. EG 0 0 2.00K 0.00K
FRUITHURST CLEBURNE CO. AL 03/18/2013 15:27 CST-6 Thunderstorm Wind 55 kts. EG 0 0 0.00K 0.00K
Totals:
0 0 550.10K 0.00K
0 Lightning Events – 01/01/2003 thru 12/31/2013 (4018 days) (Source: NOAA NCDC Storm Events Database)
No lightning events occurred or were reported during 01/01/2003 thru 12/31/2013.
4 Hail Events – 01/01/2003 thru 12/31/2013 (4018 days)
(Source: NOAA NCDC Storm Events Database) Location County/Zone St. Date Time T.Z. Type Mag Dth Inj PrD CrD
FRUITHURST CLEBURNE CO. AL 03/19/2003 16:23 CST Hail 0.75 in. 0 0 0.00K 0.00K
FRUITHURST CLEBURNE CO. AL 05/10/2005 18:58 CST Hail 0.75 in. 0 0 0.00K 0.00K
FRUITHURST CLEBURNE CO. AL 04/08/2006 01:24 CST Hail 0.75 in. 0 0 0.00K 0.00K
FRUITHURST CLEBURNE CO. AL 04/04/2008 15:08 CST-6 Hail 0.88 in. 0 0 0.00K 0.00K
FRUITHURST CLEBURNE CO. AL 06/09/2008 15:38 CST-6 Hail 0.75 in. 0 0 0.00K 0.00K
Totals:
0 0 0.00K 0.00K

156
0 Tornado Events – 01/01/2003 thru 12/31/2013 (4018 days) (Source: NOAA NCDC Storm Events Database)
No tornado events occurred or were reported during 01/01/2003 thru 12/31/2013.
3 Flood/Flash Flood Events – 01/01/2003 thru 12/31/2013 (4018 days)
(Source: NOAA NCDC Storm Events Database)
Location County/Zone St. Date Time T.Z. Type Mag Dth Inj PrD CrD
COUNTYWIDE CLEBURNE CO. AL 05/07/2003 16:00 CST Flash Flood
0 0 250.00K 0.00K
COUNTYWIDE CLEBURNE CO. AL 09/16/2004 10:45 CST Flash Flood
0 0 50.00K 0.00K
COUNTYWIDE CLEBURNE CO. AL 11/24/2004 08:25 CST Flash Flood
0 0 6.00K 0.00K
Totals:
0 1 321.00K 0.00K
36 Drought/Extreme Heat Events – 01/01/2003 thru 12/31/2013 (4018 days) (Source: NOAA NCDC Storm Events Database)
Location County/Zone St. Date Time T.Z. Type Mag Dth Inj PrD CrD
CLEBURNE (ZONE) CLEBURNE (ZONE) AL 07/18/2006 07:00 CST Drought
0 0 0.00K 0.00K
CLEBURNE (ZONE) CLEBURNE (ZONE) AL 08/01/2006 00:00 CST Drought
0 0 0.00K 0.00K
CLEBURNE (ZONE) CLEBURNE (ZONE) AL 09/01/2006 00:00 CST Drought
0 0 0.00K 0.00K
CLEBURNE (ZONE) CLEBURNE (ZONE) AL 05/01/2007 00:00 CST-6 Drought
0 0 0.00K 0.00K
CLEBURNE (ZONE) CLEBURNE (ZONE) AL 06/01/2007 00:00 CST-6 Drought
0 0 0.00K 0.00K
CLEBURNE (ZONE) CLEBURNE (ZONE) AL 07/01/2007 00:00 CST-6 Drought
0 0 0.00K 0.00K
CLEBURNE (ZONE) CLEBURNE (ZONE) AL 08/01/2007 00:00 CST-6 Drought
0 0 0.00K 0.00K
CLEBURNE (ZONE) CLEBURNE (ZONE) AL 09/01/2007 00:00 CST-6 Drought
0 0 0.00K 0.00K
CLEBURNE (ZONE) CLEBURNE (ZONE) AL 10/01/2007 00:00 CST-6 Drought
0 0 0.00K 0.00K
CLEBURNE (ZONE) CLEBURNE (ZONE) AL 11/01/2007 00:00 CST-6 Drought
0 0 0.00K 0.00K
CLEBURNE (ZONE) CLEBURNE (ZONE) AL 12/01/2007 00:00 CST-6 Drought
0 0 0.00K 0.00K
CLEBURNE (ZONE) CLEBURNE (ZONE) AL 01/01/2008 00:00 CST-6 Drought
0 0 0.00K 0.00K

157
CLEBURNE (ZONE) CLEBURNE (ZONE) AL 02/01/2008 00:00 CST-6 Drought
0 0 0.00K 0.00K
CLEBURNE (ZONE) CLEBURNE (ZONE) AL 03/01/2008 00:00 CST-6 Drought
0 0 0.00K 0.00K
CLEBURNE (ZONE) CLEBURNE (ZONE) AL 04/01/2008 00:00 CST-6 Drought
0 0 0.00K 0.00K
CLEBURNE (ZONE) CLEBURNE (ZONE) AL 05/01/2008 00:00 CST-6 Drought
0 0 0.00K 0.00K
CLEBURNE (ZONE) CLEBURNE (ZONE) AL 06/01/2008 00:00 CST-6 Drought
0 0 0.00K 0.00K
CLEBURNE (ZONE) CLEBURNE (ZONE) AL 07/01/2008 00:00 CST-6 Drought
0 0 0.00K 0.00K
CLEBURNE (ZONE) CLEBURNE (ZONE) AL 08/01/2008 00:00 CST-6 Drought
0 0 0.00K 0.00K
CLEBURNE (ZONE) CLEBURNE (ZONE) AL 09/30/2008 06:00 CST-6 Drought
0 0 0.00K 0.00K
CLEBURNE (ZONE) CLEBURNE (ZONE) AL 10/01/2008 00:00 CST-6 Drought
0 0 0.00K 0.00K
CLEBURNE (ZONE) CLEBURNE (ZONE) AL 11/01/2008 00:00 CST-6 Drought
0 0 0.00K 0.00K
CLEBURNE (ZONE) CLEBURNE (ZONE) AL 12/01/2008 00:00 CST-6 Drought
0 0 0.00K 0.00K
CLEBURNE (ZONE) CLEBURNE (ZONE) AL 10/19/2010 00:00 CST-6 Drought
0 0 0.00K 0.00K
CLEBURNE (ZONE) CLEBURNE (ZONE) AL 08/23/2011 00:00 CST-6 Drought
0 0 0.00K 0.00K
CLEBURNE (ZONE) CLEBURNE (ZONE) AL 09/01/2011 00:00 CST-6 Drought
0 0 0.00K 0.00K
CLEBURNE (ZONE) CLEBURNE (ZONE) AL 10/01/2011 00:00 CST-6 Drought
0 0 0.00K 0.00K
CLEBURNE (ZONE) CLEBURNE (ZONE) AL 11/01/2011 00:00 CST-6 Drought
0 0 0.00K 0.00K
CLEBURNE (ZONE) CLEBURNE (ZONE) AL 06/26/2012 00:00 CST-6 Drought
0 0 0.00K 0.00K
CLEBURNE (ZONE) CLEBURNE (ZONE) AL 07/01/2012 00:00 CST-6 Drought
0 0 0.00K 0.00K
CLEBURNE (ZONE) CLEBURNE (ZONE) AL 08/01/2012 00:00 CST-6 Drought
0 0 0.00K 0.00K
CLEBURNE (ZONE) CLEBURNE (ZONE) AL 09/01/2012 00:00 CST-6 Drought
0 0 0.00K 0.00K
CLEBURNE (ZONE) CLEBURNE (ZONE) AL 10/01/2012 00:00 CST-6 Drought
0 0 0.00K 0.00K
CLEBURNE (ZONE) CLEBURNE (ZONE) AL 11/01/2012 00:00 CST-6 Drought
0 0 0.00K 0.00K
CLEBURNE (ZONE) CLEBURNE (ZONE) AL 01/01/2013 00:00 CST-6 Drought
0 0 0.00K 0.00K
CLEBURNE (ZONE) CLEBURNE (ZONE) AL 02/01/2013 00:00 CST-6 Drought
0 0 0.00K 0.00K

158
Totals:
0 0 0.00K 0.00K
12 Winter Storm/Frost Freeze/Heavy Snow/Ice Storm/Winter Weather/Extreme Cold Events –
01/01/2003 thru 12/31/2013 (4018 days) (Source: NOAA NCDC Storm Events Database)
Location County/Zone St. Date Time T.Z. Type Mag Dth Inj PrD CrD
CLEBURNE (ZONE) CLEBURNE (ZONE) AL 02/25/2004 19:30 CST Winter Storm
0 0 0.00K 0.00K
CLEBURNE (ZONE) CLEBURNE (ZONE) AL 01/09/2011 16:40 CST-6 Winter Storm
0 0 0.00K 0.00K
CLEBURNE (ZONE) CLEBURNE (ZONE) AL 04/07/2007 00:00 CST-6 Frost/freeze
0 0 0.00K 0.00K
CLEBURNE (ZONE) CLEBURNE (ZONE) AL 04/08/2007 00:00 CST-6 Frost/freeze
0 0 0.00K 0.00K
CLEBURNE (ZONE) CLEBURNE (ZONE) AL 02/12/2010 12:00 CST-6 Heavy Snow
0 0 0.00K 0.00K
CLEBURNE (ZONE) CLEBURNE (ZONE) AL 12/25/2010 08:00 CST-6 Heavy Snow
0 0 0.00K 0.00K
CLEBURNE (ZONE) CLEBURNE (ZONE) AL 02/09/2011 19:00 CST-6 Heavy Snow
0 0 0.00K 0.00K
CLEBURNE (ZONE) CLEBURNE (ZONE) AL 01/17/2013 14:00 CST-6 Heavy Snow
0 0 0.00K 0.00K
CLEBURNE (ZONE) CLEBURNE (ZONE) AL 01/28/2005 20:45 CST Ice Storm
0 0 40.00K 0.00K
CLEBURNE (ZONE) CLEBURNE (ZONE) AL 01/19/2008 06:00 CST-6 Winter Weather
0 0 0.00K 0.00K
CLEBURNE (ZONE) CLEBURNE (ZONE) AL 12/26/2010 03:00 CST-6 Winter Weather
0 0 0.00K 0.00K
CLEBURNE (ZONE) CLEBURNE (ZONE) AL 01/24/2003 00:00 CST Extreme Cold/wind Chill
0 0 0.00K 0.00K
Totals:
0 0 40.00K 0.00K

159
8 Hurricane/Tropical Storm/Tropical Depression/High Wind/Strong Wind Events – 01/01/2003 thru 12/31/2013 (4018 days)
(Source: NOAA NCDC Storm Events Database)
Location County/Zone St. Date Time T.Z. Type Mag Dth Inj PrD CrD
CLEBURNE (ZONE) CLEBURNE (ZONE) AL 07/10/2005 18:00 CST Tropical Storm
0 0 24.00K 0.00K
CLEBURNE (ZONE) CLEBURNE (ZONE) AL 08/29/2005 23:30 CST Tropical Storm
0 0 25.00K 0.00K
CLEBURNE (ZONE) CLEBURNE (ZONE) AL 08/23/2008 12:00 CST-6 Tropical Depression
0 0 5.00K 0.00K
CLEBURNE (ZONE) CLEBURNE (ZONE) AL 11/09/2009 14:00 CST-6 Tropical Depression
0 0 2.00K 0.00K
CLEBURNE (ZONE) CLEBURNE (ZONE) AL 09/16/2004 09:00 CST High Wind 50 kts. EG 0 0 500.00K 0.00K
CLEBURNE (ZONE) CLEBURNE (ZONE) AL 09/07/2004 00:15 CST Strong Wind 33 kts. ES 0 0 1.00K 0.00K
CLEBURNE (ZONE) CLEBURNE (ZONE) AL 03/09/2006 18:00 CST Strong Wind 40 kts. EG 0 0 2.00K 0.00K
CLEBURNE (ZONE) CLEBURNE (ZONE) AL 12/20/2007 18:00 CST-6 Strong Wind 30 kts. EG 0 0 10.00K 0.00K
Totals:
0 0 569.00K 0.00K
0 Sinkhole Events – 01/01/2003 thru 12/31/2013 (4018 days) (Source: NOAA NCDC Storm Events Database/U.S. Geological Survey)
No sinkhole events occurred or were reported during 01/01/2003 thru 12/31/2013.
0 Landslide Events – 01/01/2003 thru 12/31/2013 (4018 days) (Source: NOAA NCDC Storm Events Database/U.S. Geological Survey)
No landslide events occurred or were reported during 01/01/2003 thru 12/31/2013.

160
3 Earthquake Events – 01/01/2003 thru 12/31/2013 (4018 days) (Source: www.city-data.com)
Location County/Zone St. Date Time T.Z. Type Mag Dth Inj PrD CrD
58.9 miles away from county center CLEBURNE AL 04/29/2003 08:59 CST Earthquake 4.9 0 0 0.00K 0.00K
89.5 miles away from county center CLEBURNE AL 05/09/2004 08:56 CST Earthquake 3.3 0 0 0.00K 0.00K
88.4 miles away from county center CLEBURNE AL 08/19/2004 23:51 CST Earthquake 3.6 0 0 0.00K 0.00K
Totals:
0 0 0.00K 0.00K
155 Wildfire Events – 2010 thru 2013 (Source: Alabama Forestry Commission)
County Total # of Fires
Average # of Fires
Total Acres Burned
Average Acres
Burned
Average Fire Size in Acres
Cleburne 155 52 5,278 1,759 34
0 Dam/Levee Failure Events – 01/01/2003 thru 12/31/2013 (4018 days) (Source: NOAA NCDC Storm Events Database/Local Input)
No dam/levee failure events occurred or were reported during 01/01/2003 thru 12/31/2013.
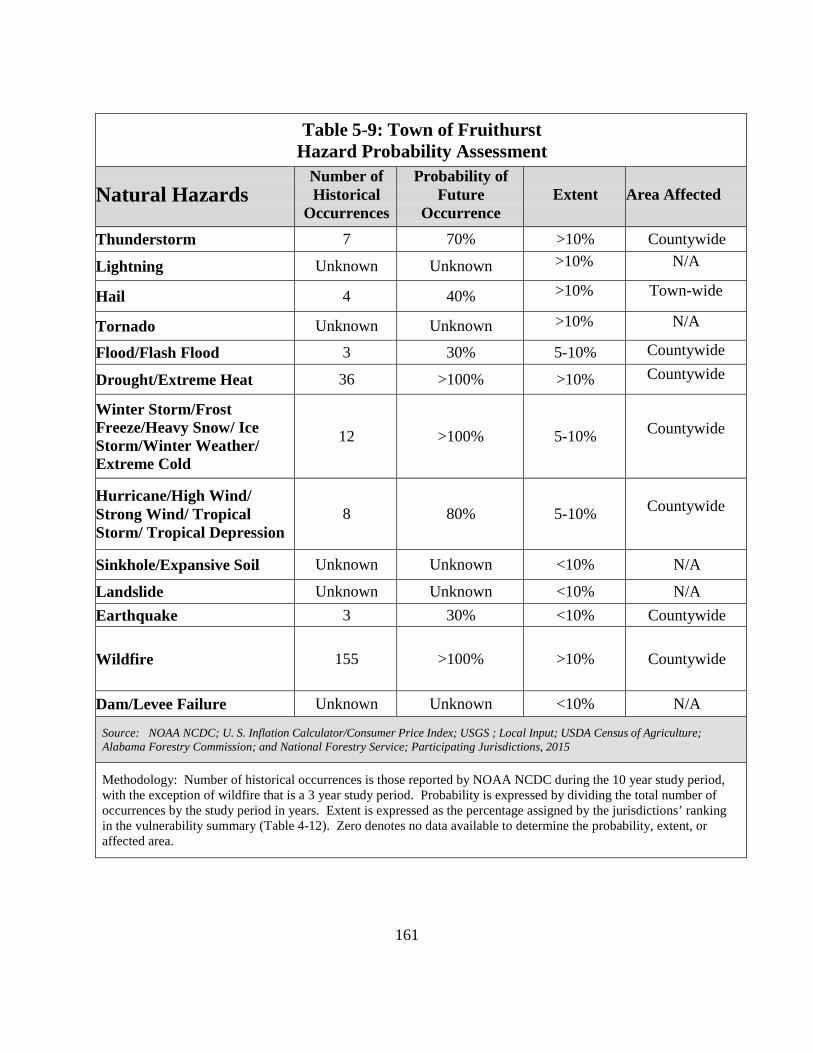
161
Table 5-9: Town of Fruithurst Hazard Probability Assessment
Natural Hazards
Number of Historical
Occurrences
Probability of Future
Occurrence
Extent
Area Affected
Thunderstorm 7 70% >10% Countywide
Lightning Unknown Unknown >10% N/A
Hail 4 40% >10% Town-wide
Tornado Unknown Unknown >10% N/A
Flood/Flash Flood 3 30% 5-10% Countywide
Drought/Extreme Heat 36 >100% >10% Countywide
Winter Storm/Frost Freeze/Heavy Snow/ Ice Storm/Winter Weather/ Extreme Cold
12 >100% 5-10% Countywide
Hurricane/High Wind/ Strong Wind/ Tropical Storm/ Tropical Depression
8 80% 5-10% Countywide
Sinkhole/Expansive Soil Unknown Unknown <10% N/A
Landslide Unknown Unknown <10% N/A Earthquake 3 30% <10% Countywide
Wildfire 155 >100% >10% Countywide
Dam/Levee Failure Unknown Unknown <10% N/A
Source: NOAA NCDC; U. S. Inflation Calculator/Consumer Price Index; USGS ; Local Input; USDA Census of Agriculture; Alabama Forestry Commission; and National Forestry Service; Participating Jurisdictions, 2015
Methodology: Number of historical occurrences is those reported by NOAA NCDC during the 10 year study period, with the exception of wildfire that is a 3 year study period. Probability is expressed by dividing the total number of occurrences by the study period in years. Extent is expressed as the percentage assigned by the jurisdictions’ ranking in the vulnerability summary (Table 4-12). Zero denotes no data available to determine the probability, extent, or affected area.

162
TABLE 5-10: Town of Fruithurst Critical Facilities, 2015
Facility Location Use Value
Government City Hall 16201 Highway 78 Government Education Fruithurst Elementary School 222 School Street Education Miscellaneous Fruithurst Group Home 15314 Highway 78 Foster Care Senior Center 16201 Highway 78 Recreaction Source: Local

163
Table 5-11: Town of Fruithurst Estimated Loss Projections from Specified Hazards
Natural Hazards
Average
Occurrences (per year)
Total
Deaths
Total
Injuries
Average Death and
Injury Loss (per event)
Average Crop and Property
Loss (per event)
Projected
Loss (per event)
Thunderstorm 3.8 0 0 Unknown $17,745 $19,342 Lightning 0.2 0 0 Unknown $59,000 $64,310 Hail 2.3 0 0 Unknown $1,000 $1,090 Tornado 0.4 0 0 Unknown $475,000 $517,750 Flood/Flash Flood 0.6 0 1 $3,863 $64,200 $74,189
Drought/Extreme Heat 3.6 0 0 Unknown Unknown Unknown
Winter Storm/Frost Freeze/ Heavy Snow/Ice Storm/Winter Weather/ Extreme Cold
1.2 0 0 Unknown $40,000 $43,600
Hurricane/Tropical Storm/ Tropical Depression/High Wind/ Strong Wind
0.8 0 0 Unknown $71,125 $77,526
Sinkhole/Expansive Soil Unknown 0 0 Unknown Unknown Unknown Landslide Unknown 0 0 Unknown Unknown Unknown Earthquake 0.3 0 0 Unknown Unknown Unknown
Wildfire 52.0 0 0 Unknown $64,698 $70,521
Dam/Levee Failure Unknown 0 0 Unknown Unknown Unknown
Sources: NOAA NCDC; U. S. Inflation Calculator/Consumer Price Index; Local Input; USDA Census of Agriculture; Alabama Forestry Commission and National Forestry Service; Alabama Geological Survey, 2015
Methodology: Average occurrences were expressed annually by dividing the total number of occurrences by the ten-year period. Deaths and injuries were taken from the hazard event data. Average losses were calculated by dividing the total amount of all damages by the total number of occurrences during the ten-year period with the exception of wildfire. Projected loss expresses an estimated damage amount per future occurrence by converting the average loss figures from a midpoint of 2008 dollars to 2014 dollars ($1 in 2008 = $1.09 in 2014…a cumulative rate of inflation of 9%). Zero denotes no data available to determine the average occurrences, average loss or projected loss per event.

164
Town of Fruithurst Mitigation Action Plan
The Town of Fruithurst recognizes the importance of mitigation planning and will
incorporate mitigation planning in planning documents as they are revised or initiated.
Mitigation Strategy – Town of Fruithurst
Table 5-12: Town of Fruithurst Mitigation Actions 2015 Mitigation Action Install/construct community safe rooms near the senior citizens center Hazard(s) Addressed Thunderstorm, Tornado, High Wind Applies to new/existing asset Existing Local Planning Mechanism Town Council Time frame for Completion 5 Years Estimated Cost $100,000 Funding Sources Local and Grant Funds Priority High Status The town is still interested in pursuing this project. Budgetary constraints have
prevented the town from completing this project. Mitigation Action New Install emergency generators in needed facilities Hazard(s) Addressed Thunderstorm, Tornado, High Wind Applies to new/existing asset Existing Local Planning Mechanism Town Council Time frame for Completion 5 Years Estimated Cost $80,000 Funding Sources Local and Grant Funds Priority High Status New Action

165
This page left intentionally blank

166
City of Heflin

167
This page left intentionally blank

168
Table 5-13: City of Heflin Risk and Vulnerability Overview
Natural Hazards Hazard Identification
Mitigation Actions Prioritization
Prioritized Occurrence
Threat
Vulnerability
Thunderstorm X 1 4 H Lightning X 2 8 H Hail X 2 6 H Tornado X 1 8 H Flood X 1 7 M Drought/Extreme Heat X 2 2 H Winter Storm/Frost Freeze/ Heavy Snow/Ice Storm/Winter Weather/Extreme Cold
X 2 3 M
Hurricane/Tropical Storm/ Tropical Depression/ High Wind/ Strong Wind
X 1 5 M
Sinkhole/Expansive Soil X 2 7 L Landslide X 2 9 L Earthquake X 2 7 L Wildfire X 2 1 H Dam/Levee Failure X 2 9 L
KEY: Hazard Identification – Identified by local jurisdictions Mitigation Actions Prioritization - Hazards are prioritized by jurisdictions based on past hazard experiences, vulnerabilities, and available mitigation actions with the hazard having highest priority of mitigation assigned number one. Prioritized Occurrence Threat - Hazards are prioritized with the highest threat of occurrence assigned number one based on hazardous events that have occurred within each jurisdiction over the past ten years, with the exception of wildfires that were based on events that have occurred over three years. Some natural hazards have equal threats to a jurisdiction; therefore, their threat number will be the same. These prioritized threats may or may not be the same as the mitigation actions prioritization. Vulnerability – Identified by local jurisdictions. NA – Not Applicable; not a hazard to the jurisdiction; L – Low Risk; little damage potential (damage to less than 5% of the jurisdiction); M – Medium Risk; moderate damage potential (damage to 5-10% of jurisdiction, infrequent occurrence); and H – High Risk; significant risk/major damage potential (damage to over 10% of jurisdiction, regular occurrence)
(Sources: NOAA NCDC Storm Events Database; Alabama Forestry Commission; National Forestry Service; Alabama Geological Survey; Participating Jurisdictions, 2015)

169
TABLE 5-14: CITY OF HEFLIN HAZARD EVENTS
13 Thunderstorm Events – 01/01/2003 thru 12/31/2013 (4018 days) (Source: NOAA NCDC Storm Events Database)
Location County/Zone St. Date Time T.Z. Type Mag Dth Inj PrD CrD
COUNTYWIDE CLEBURNE CO. AL 05/02/2003 17:22 CST Thunderstorm Wind 55 kts. EG 0 0 12.00K 0.00K
COUNTYWIDE CLEBURNE CO. AL 06/22/2004 18:25 CST Thunderstorm Wind 60 kts. EG 0 0 10.00K 0.00K
HEFLIN CLEBURNE CO. AL 11/24/2004 07:49 CST Thunderstorm Wind 50 kts. EG 0 0 17.00K 0.00K
HEFLIN CLEBURNE CO. AL 03/13/2005 20:52 CST Thunderstorm Wind 52 kts. EG 0 0 14.00K 0.00K
COUNTYWIDE CLEBURNE CO. AL 04/30/2005 04:31 CST Thunderstorm Wind 52 kts. EG 0 0 2.00K 0.00K
HEFLIN CLEBURNE CO. AL 06/02/2005 17:35 CST Thunderstorm Wind 55 kts. EG 0 0 19.00K 0.00K
HEFLIN CLEBURNE CO. AL 07/04/2005 17:09 CST Thunderstorm Wind 52 kts. EG 0 0 37.00K 0.00K
HEFLIN CLEBURNE CO. AL 02/26/2008 04:35 CST-6 Thunderstorm Wind 70 kts. EG 0 0 200.00K 0.00K
HEFLIN CLEBURNE CO. AL 11/30/2010 10:41 CST-6 Thunderstorm Wind 50 kts. EG 0 0 4.00K 0.00K
HEFLIN CLEBURNE CO. AL 11/30/2010 10:41 CST-6 Thunderstorm Wind 50 kts. EG 0 0 3.00K 0.00K
HEFLIN CLEBURNE CO. AL 02/25/2011 01:22 CST-6 Thunderstorm Wind 50 kts. EG 0 0 2.00K 0.00K
HEFLIN CLEBURNE CO. AL 04/04/2011 20:08 CST-6 Thunderstorm Wind 50 kts. EG 0 0 0.00K 0.00K
HEFLIN CLEBURNE CO. AL 06/24/2011 17:07 CST-6 Thunderstorm Wind 45 kts. EG 0 0 1.00K 0.00K
Totals:
0 0 321.00K 0.00K
1 Lightning Event – 01/01/2003 thru 12/31/2013 (4018 days) (Source: NOAA NCDC Storm Events Database)
Location County/Zone St. Date Time T.Z. Type Mag Dth Inj PrD CrD
HEFLIN CLEBURNE CO. AL 05/08/2003 15:00 CST Lightning
0 0 48.00K 0.00K
Totals:
0 0 48.00K 0.00K

170
4 Hail Events – 01/01/2003 thru 12/31/2013 (4018 days) (Source: NOAA NCDC Storm Events Database)
Location County/Zone St. Date Time T.Z. Type Mag Dth Inj PrD CrD
HEFLIN CLEBURNE CO. AL 02/21/2005 20:48 CST Hail 1.00 in. 0 0 0.00K 0.00K
HEFLIN CLEBURNE CO. AL 04/22/2005 20:14 CST Hail 0.88 in. 0 0 1.00K 0.00K
HEFLIN CLEBURNE CO. AL 06/22/2006 15:20 CST Hail 0.75 in. 0 0 0.00K 0.00K
HEFLIN CLEBURNE CO. AL 06/09/2008 16:45 CST-6 Hail 0.75 in. 0 0 0.00K 0.00K
Totals:
0 0 1.00K 0.00K
1 Tornado Event – 01/01/2003 thru 12/31/2013 (4018 days) (Source: NOAA NCDC Storm Events Database)
Location County/Zone St. Date Time T.Z. Type Mag Dth Inj PrD CrD
HEFLIN CLEBURNE CO. AL 05/11/2008 01:36 CST-6 Tornado EF1 0 0 1.750M 0.00K
Totals:
0 0 1.750M 0.00K
6 Flood/Flash Flood Events – 01/01/2003 thru 12/31/2013 (4018 days) (Source: NOAA NCDC Storm Events Database)
Location County/Zone St. Date Time T.Z. Type Mag Dth Inj PrD CrD
COUNTYWIDE CLEBURNE CO. AL 05/07/2003 16:00 CST Flash Flood
0 0 250.00K 0.00K
HEFLIN CLEBURNE CO. AL 05/08/2003 15:30 CST Flash Flood
0 1 8.00K 0.00K
COUNTYWIDE CLEBURNE CO. AL 09/16/2004 10:45 CST Flash Flood
0 0 50.00K 0.00K
COUNTYWIDE CLEBURNE CO. AL 11/24/2004 08:25 CST Flash Flood
0 0 6.00K 0.00K
HEFLIN CLEBURNE CO. AL 07/10/2005 19:00 CST Flash Flood
0 0 7.00K 0.00K
HEFLIN CLEBURNE CO. AL 01/30/2013 11:38 CST-6 Flash Flood
0 0 0.00K 0.00K
Totals:
0 1 321.00K 0.00K

171
36 Drought/Extreme Heat Events – 01/01/2003 thru 12/31/2013 (4018 days) (Source: NOAA NCDC Storm Events Database)
Location County/Zone St. Date Time T.Z. Type Mag Dth Inj PrD CrD
CLEBURNE (ZONE) CLEBURNE (ZONE) AL 07/18/2006 07:00 CST Drought
0 0 0.00K 0.00K
CLEBURNE (ZONE) CLEBURNE (ZONE) AL 08/01/2006 00:00 CST Drought
0 0 0.00K 0.00K
CLEBURNE (ZONE) CLEBURNE (ZONE) AL 09/01/2006 00:00 CST Drought
0 0 0.00K 0.00K
CLEBURNE (ZONE) CLEBURNE (ZONE) AL 05/01/2007 00:00 CST-6 Drought
0 0 0.00K 0.00K
CLEBURNE (ZONE) CLEBURNE (ZONE) AL 06/01/2007 00:00 CST-6 Drought
0 0 0.00K 0.00K
CLEBURNE (ZONE) CLEBURNE (ZONE) AL 07/01/2007 00:00 CST-6 Drought
0 0 0.00K 0.00K
CLEBURNE (ZONE) CLEBURNE (ZONE) AL 08/01/2007 00:00 CST-6 Drought
0 0 0.00K 0.00K
CLEBURNE (ZONE) CLEBURNE (ZONE) AL 09/01/2007 00:00 CST-6 Drought
0 0 0.00K 0.00K
CLEBURNE (ZONE) CLEBURNE (ZONE) AL 10/01/2007 00:00 CST-6 Drought
0 0 0.00K 0.00K
CLEBURNE (ZONE) CLEBURNE (ZONE) AL 11/01/2007 00:00 CST-6 Drought
0 0 0.00K 0.00K
CLEBURNE (ZONE) CLEBURNE (ZONE) AL 12/01/2007 00:00 CST-6 Drought
0 0 0.00K 0.00K
CLEBURNE (ZONE) CLEBURNE (ZONE) AL 01/01/2008 00:00 CST-6 Drought
0 0 0.00K 0.00K
CLEBURNE (ZONE) CLEBURNE (ZONE) AL 02/01/2008 00:00 CST-6 Drought
0 0 0.00K 0.00K
CLEBURNE (ZONE) CLEBURNE (ZONE) AL 03/01/2008 00:00 CST-6 Drought
0 0 0.00K 0.00K
CLEBURNE (ZONE) CLEBURNE (ZONE) AL 04/01/2008 00:00 CST-6 Drought
0 0 0.00K 0.00K
CLEBURNE (ZONE) CLEBURNE (ZONE) AL 05/01/2008 00:00 CST-6 Drought
0 0 0.00K 0.00K
CLEBURNE (ZONE) CLEBURNE (ZONE) AL 06/01/2008 00:00 CST-6 Drought
0 0 0.00K 0.00K
CLEBURNE (ZONE) CLEBURNE (ZONE) AL 07/01/2008 00:00 CST-6 Drought
0 0 0.00K 0.00K
CLEBURNE (ZONE) CLEBURNE (ZONE) AL 08/01/2008 00:00 CST-6 Drought
0 0 0.00K 0.00K
CLEBURNE (ZONE) CLEBURNE (ZONE) AL 09/30/2008 06:00 CST-6 Drought
0 0 0.00K 0.00K
CLEBURNE (ZONE) CLEBURNE (ZONE) AL 10/01/2008 00:00 CST-6 Drought
0 0 0.00K 0.00K
CLEBURNE (ZONE) CLEBURNE (ZONE) AL 11/01/2008 00:00 CST-6 Drought
0 0 0.00K 0.00K
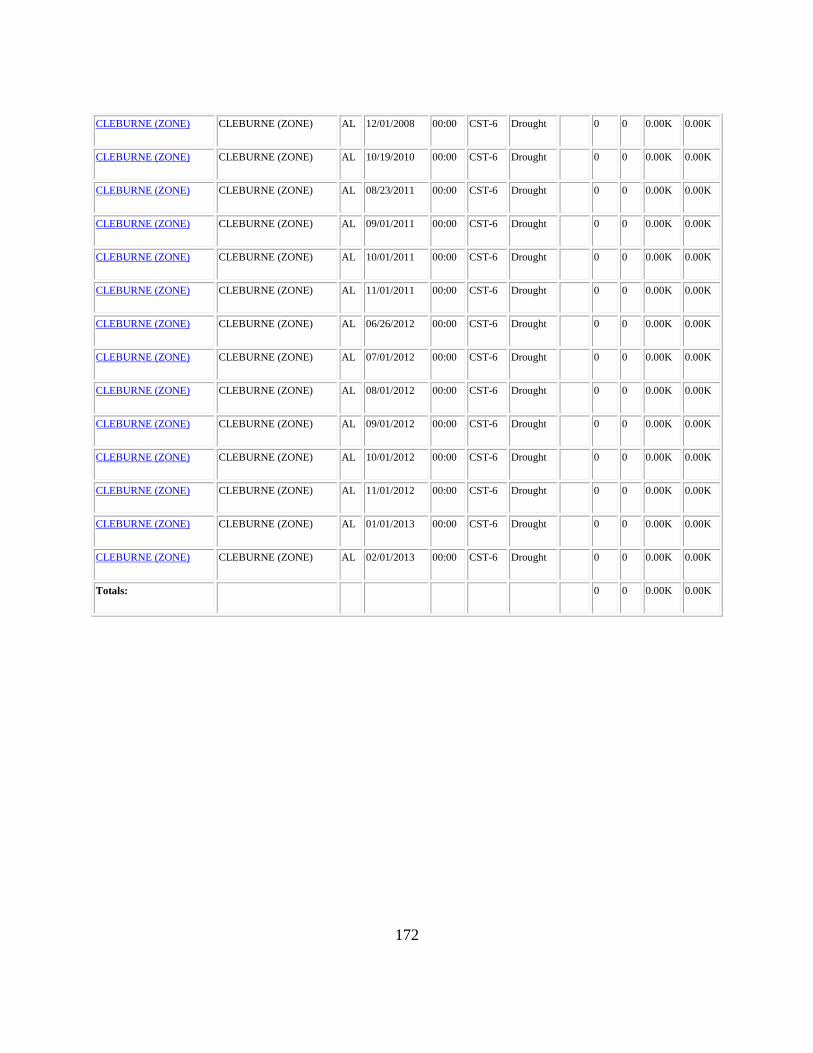
172
CLEBURNE (ZONE) CLEBURNE (ZONE) AL 12/01/2008 00:00 CST-6 Drought
0 0 0.00K 0.00K
CLEBURNE (ZONE) CLEBURNE (ZONE) AL 10/19/2010 00:00 CST-6 Drought
0 0 0.00K 0.00K
CLEBURNE (ZONE) CLEBURNE (ZONE) AL 08/23/2011 00:00 CST-6 Drought
0 0 0.00K 0.00K
CLEBURNE (ZONE) CLEBURNE (ZONE) AL 09/01/2011 00:00 CST-6 Drought
0 0 0.00K 0.00K
CLEBURNE (ZONE) CLEBURNE (ZONE) AL 10/01/2011 00:00 CST-6 Drought
0 0 0.00K 0.00K
CLEBURNE (ZONE) CLEBURNE (ZONE) AL 11/01/2011 00:00 CST-6 Drought
0 0 0.00K 0.00K
CLEBURNE (ZONE) CLEBURNE (ZONE) AL 06/26/2012 00:00 CST-6 Drought
0 0 0.00K 0.00K
CLEBURNE (ZONE) CLEBURNE (ZONE) AL 07/01/2012 00:00 CST-6 Drought
0 0 0.00K 0.00K
CLEBURNE (ZONE) CLEBURNE (ZONE) AL 08/01/2012 00:00 CST-6 Drought
0 0 0.00K 0.00K
CLEBURNE (ZONE) CLEBURNE (ZONE) AL 09/01/2012 00:00 CST-6 Drought
0 0 0.00K 0.00K
CLEBURNE (ZONE) CLEBURNE (ZONE) AL 10/01/2012 00:00 CST-6 Drought
0 0 0.00K 0.00K
CLEBURNE (ZONE) CLEBURNE (ZONE) AL 11/01/2012 00:00 CST-6 Drought
0 0 0.00K 0.00K
CLEBURNE (ZONE) CLEBURNE (ZONE) AL 01/01/2013 00:00 CST-6 Drought
0 0 0.00K 0.00K
CLEBURNE (ZONE) CLEBURNE (ZONE) AL 02/01/2013 00:00 CST-6 Drought
0 0 0.00K 0.00K
Totals:
0 0 0.00K 0.00K
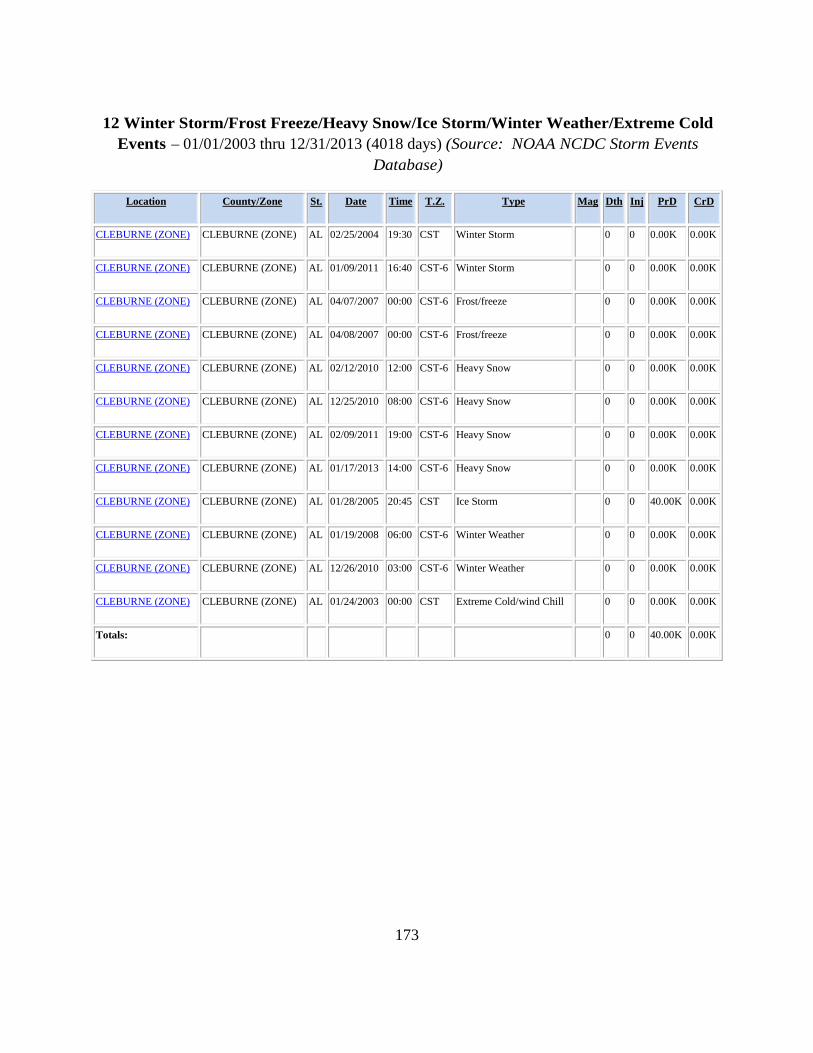
173
12 Winter Storm/Frost Freeze/Heavy Snow/Ice Storm/Winter Weather/Extreme Cold Events – 01/01/2003 thru 12/31/2013 (4018 days) (Source: NOAA NCDC Storm Events
Database)
Location County/Zone St. Date Time T.Z. Type Mag Dth Inj PrD CrD
CLEBURNE (ZONE) CLEBURNE (ZONE) AL 02/25/2004 19:30 CST Winter Storm
0 0 0.00K 0.00K
CLEBURNE (ZONE) CLEBURNE (ZONE) AL 01/09/2011 16:40 CST-6 Winter Storm
0 0 0.00K 0.00K
CLEBURNE (ZONE) CLEBURNE (ZONE) AL 04/07/2007 00:00 CST-6 Frost/freeze
0 0 0.00K 0.00K
CLEBURNE (ZONE) CLEBURNE (ZONE) AL 04/08/2007 00:00 CST-6 Frost/freeze
0 0 0.00K 0.00K
CLEBURNE (ZONE) CLEBURNE (ZONE) AL 02/12/2010 12:00 CST-6 Heavy Snow
0 0 0.00K 0.00K
CLEBURNE (ZONE) CLEBURNE (ZONE) AL 12/25/2010 08:00 CST-6 Heavy Snow
0 0 0.00K 0.00K
CLEBURNE (ZONE) CLEBURNE (ZONE) AL 02/09/2011 19:00 CST-6 Heavy Snow
0 0 0.00K 0.00K
CLEBURNE (ZONE) CLEBURNE (ZONE) AL 01/17/2013 14:00 CST-6 Heavy Snow
0 0 0.00K 0.00K
CLEBURNE (ZONE) CLEBURNE (ZONE) AL 01/28/2005 20:45 CST Ice Storm
0 0 40.00K 0.00K
CLEBURNE (ZONE) CLEBURNE (ZONE) AL 01/19/2008 06:00 CST-6 Winter Weather
0 0 0.00K 0.00K
CLEBURNE (ZONE) CLEBURNE (ZONE) AL 12/26/2010 03:00 CST-6 Winter Weather
0 0 0.00K 0.00K
CLEBURNE (ZONE) CLEBURNE (ZONE) AL 01/24/2003 00:00 CST Extreme Cold/wind Chill
0 0 0.00K 0.00K
Totals:
0 0 40.00K 0.00K

174
8 Hurricane/Tropical Storm/Tropical Depression/High Wind/Strong Wind Events – 01/01/2003 thru 12/31/2013 (4018 days)
(Source: NOAA NCDC Storm Events Database) Location County/Zone St. Date Time T.Z. Type Mag Dth Inj PrD CrD
CLEBURNE (ZONE) CLEBURNE (ZONE) AL 07/10/2005 18:00 CST Tropical Storm
0 0 24.00K 0.00K
CLEBURNE (ZONE) CLEBURNE (ZONE) AL 08/29/2005 23:30 CST Tropical Storm
0 0 25.00K 0.00K
CLEBURNE (ZONE) CLEBURNE (ZONE) AL 08/23/2008 12:00 CST-6 Tropical Depression
0 0 5.00K 0.00K
CLEBURNE (ZONE) CLEBURNE (ZONE) AL 11/09/2009 14:00 CST-6 Tropical Depression
0 0 2.00K 0.00K
CLEBURNE (ZONE) CLEBURNE (ZONE) AL 09/16/2004 09:00 CST High Wind 50 kts. EG 0 0 500.00K 0.00K
CLEBURNE (ZONE) CLEBURNE (ZONE) AL 09/07/2004 00:15 CST Strong Wind 33 kts. ES 0 0 1.00K 0.00K
CLEBURNE (ZONE) CLEBURNE (ZONE) AL 03/09/2006 18:00 CST Strong Wind 40 kts. EG 0 0 2.00K 0.00K
CLEBURNE (ZONE) CLEBURNE (ZONE) AL 12/20/2007 18:00 CST-6 Strong Wind 30 kts. EG 0 0 10.00K 0.00K
Totals:
0 0 569.00K 0.00K
0 Sinkhole/Expansive Soil Events - 01/01/2003 thru 12/31/2013 (4018 days) (Source: NOAA NCDC Storm Events Database/U.S. Geological Survey)
No events occurred or were reported during 01/01/2003 thru 12/31/2013.
0 Landslide Events - 01/01/2003 thru 12/31/2013 (4018 days) (Source: NOAA NCDC Storm Events Database/U.S. Geological Survey)
No events occurred or were reported during 01/01/2003 thru 12/31/2013.

175
3 Earthquake Events – 01/01/2003 thru 12/31/2013 (4018 days) (Source: www.city-data.com)
Location County/Zone St. Date Time T.Z. Type Mag Dth Inj PrD CrD
58.9 miles away from county center CLEBURNE AL 04/29/2003 08:59 CST Earthquake 4.9 0 0 0.00K 0.00K
89.5 miles away from county center CLEBURNE AL 05/09/2004 08:56 CST Earthquake 3.3 0 0 0.00K 0.00K
88.4 miles away from county center CLEBURNE AL 08/19/2004 23:51 CST Earthquake 3.6 0 0 0.00K 0.00K
Totals:
0 0 0.00K 0.00K
155 Wildfire Events – 2010 thru 2013 (Source: Alabama Forestry Commission)
County Total # of Fires
Average # of Fires
Total Acres Burned
Average Acres
Burned
Average Fire Size in Acres
Cleburne 155 52 5,278 1,759 34
0 Dam/Levee Failure Events – 01/01/2003 thru 12/31/2013 (4018 days) (Source: NOAA NCDC Storm Events Database/Local Input)
No dam/levee failure events occurred or were reported during 01/01/2003 thru 12/31/2013.

176
Table 5-15: City of Heflin Hazard Probability Assessment
Natural Hazards
Number of Historical
Occurrences
Probability of Future
Occurrence
Extent
Area Affected
Thunderstorm 13 >100% >10% Countywide
Lightning 1 10% >10% City-wide
Hail 4 40% >10% City-wide
Tornado 1 10% >10% Citywide
Flood/Flash Flood 6 60% 5-10% Countywide
Drought/Extreme Heat 36 >100% >10% Countywide
Winter Storm/Frost Freeze/ Heavy Snow/Ice Storm/ Winter Weather/ Extreme Cold
12 >100% 5-10% Countywide
Hurricane/Tropical Storm/ Tropical Depression/High Wind/Strong Wind
8 80% 5-10% Countywide
Sinkhole/Expansive Soil Unknown Unknown <10% N/A
Landslide Unknown Unknown <10% N/A
Earthquake 3 30% <10% Countywide
Wildfire 155 >100% >10% Countywide
Dam/Levee Failure Unknown Unknown <10% N/A Source: NOAA NCDC; U. S. Inflation Calculator/Consumer Price Index; USGS; Local Input; USDA Census of Agriculture; Alabama Forestry Commission; and National Forestry Service; Participating Jurisdictions, 2015
Methodology: Number of historical occurrences is those reported by NOAA NCDC during the 10 year study period, with the exception of wildfire that is a 3 year study period. Probability is expressed by dividing the total number of occurrences by the study period in years. Extent is expressed as the percentage assigned by the jurisdictions’ ranking in the vulnerability summary (Table 4-11). Zero or unknown denotes no data available to determine the probability, extent, or affected area.

177
TABLE 5-16: City of Heflin Critical Facilities Facility Location Use Value Governmental Services City Hall 850 Ross Street Government $300,000 Armory 110 Evans Street Government
Public Works Water System 850 Ross Street Water Supply $7,500,000 Sewer System 850 Ross Street Sewage $4,500,000 Street Department 850 Ross Street Transportation $175,000 Water Treatment 2724 Highway 78 Water Supply
Education Cleburne County High School 520 Evans Bridge Road Education Cleburne County Special Education 584 Evans Street Education Cleburne County Middle School 584 Evans Bridge Road Education Cleburne County Vocational School 11200 AL-46 Education
Miscellaneous
Senior Center/Recreational Facility
1228 Coleman Street Recreation $3,000,000 (Source: Local Jurisdiction, 2015) TOTAL $15,475,000

178
Table 5-17: City of Heflin Estimated Loss Projections from Specified Hazards
Natural Hazards
Average
Occurrences (per year)
Total
Deaths
Total
Injuries
Average Death and
Injury Loss (per event)
Average Crop and Property
Loss (per event)
Projected
Loss (per event)
Thunderstorm 3.8 0 0 Unknown $17,745 $19,342
Lightning 0.2 0 0 Unknown $59,000 $64,310 Hail 2.3 0 0 Unknown $1,000 $1,090 Tornado 0.4 0 0 Unknown $475,000 $517,750
Flood/Flood 0.6 0 1 $3,863 $64,200 $74,189
Drought/Extreme Heat 3.6 0 0 Unknown Unknown Unknown Winter Weather/Frost Freeze/Heavy Snow/Ice Storm/Winter Weather/ Extreme Cold
1.2 0 0 Unknown $40,000 $43,600
Hurricane/Tropical Storm/ Tropical Depression/High Wind/ Strong Wind
0.8 0 0 Unknown $71,125 $77,526
Sinkhole/Expansive Soil Unknown 0 0 Unknown Unknown Unknown
Landslide Unknown 0 0 Unknown Unknown Unknown
Earthquake 0.3 0 0 Unknown Unknown Unknown
Wildfire 52.0 0 0 Unknown $64,698 $70,521
Dam/Levee Failure Unknown 0 0 Unknown Unknown Unknown Sources: NOAA NCDC; U. S. Inflation Calculator/Consumer Price Index; Local Input; USDA Census of Agriculture; Alabama Forestry Commission and National Forestry Service; Alabama Geological Survey, 2015
Methodology: Average occurrences were expressed annually by dividing the total number of occurrences by the ten-year period. Deaths and injuries were taken from the hazard event data. Average losses were calculated by dividing the total amount of all damages by the total number of occurrences causing damage during the ten-year period with the exception of wildfire. Projected loss expresses an estimated damage amount per future occurrence by converting the average loss figures from a midpoint of 2008 dollars to 2014 dollars ($1 in 2008 = $1.09 in 2014…a cumulative rate of inflation of 9%). Zero denotes no data available to determine the average occurrences, average loss or projected loss per event.

179
City of Heflin Mitigation Action Plan
The City of Heflin recognizes the importance of mitigation planning and will incorporate
mitigation planning in planning documents as they are revised or initiated.
Mitigation Strategy – City of Heflin
Table 5-18: City of Heflin Mitigation Actions 2015
Mitigation Action Sugar Hill Road-Enlarge 18” pipe to 24” pipe that runs under roadway to eliminate flooding during heavy rains.
Hazard(s) Addressed Flooding Applies to new/existing asset Existing Local Planning Mechanism City Council and Street Superintendent Time frame for Completion 5 Years Estimated Cost $45,000 Funding Sources Local Funds Priority High Status The city has been unable to complete this project due to lack of funds. They plan to
continue in pursuing this action in the future. Mitigation Action Ross Street-Correcting an inadequate drainage system from previous resurfacing of
the street causing flooding into area storefronts. Hazard(s) Addressed Flooding Applies to new/existing asset Existing Local Planning Mechanism City Council and Street Superintendent Time frame for Completion 3 Years Estimated Cost Unknown Funding Sources Local Funds Priority High Status The city did not have adequate funding for this action to be completed. They plan
to explore options to complete and fund this action in the future. Mitigation Action Install Community Safe Rooms Hazard(s) Addressed Thunderstorm, Tornado, High Wind Applies to new/existing asset New Local Planning Mechanism City Council and County EMA Time frame for Completion 3 Years Estimated Cost $42,000 Funding Sources Local and Grant Funds Priority High Status The city has been unable to complete this action due to lack of funds. They plan to
pursue this action should grant funds become available. Mitigation Action Expand City Hall to include a community safe room Hazard(s) Addressed Thunderstorm, Tornado, High Wind Applies to new/existing asset Existing Local Planning Mechanism City Council and County EMA Time frame for Completion 7 Years

180
Estimated Cost $80,000 Funding Sources Local and Grant Funds Priority High Status The city has not completed this project due to funding. They plan to complete this
action in the future if funding is available. Mitigation Action Purchase emergency generators for the police department and water department.
Hazard(s) Addressed Thunderstorm, Tornado, High Wind Applies to new/existing asset Existing Local Planning Mechanism City Council, Police Department, Water Works and Sewer Board Time frame for Completion 1 Year Estimated Cost $42,000 Funding Sources Local and Grant Funds Priority High Status The city has not completed this project due to funding. They plan to complete this
action in the future as funding becomes available.
Mitigation Action Encourage individual citizens to install in-home tornado shelters. Hazard(s) Addressed Thunderstorms, Tornadoes, High Winds, Strong Winds Applies to new/existing asset New and Existing
Local Planning Mechanism EMA and Individuals
Time frame for Completion 2020
Estimated Cost $5,000 Funding Sources Citizens, Local, HMGP
Priority High
Milestones This action was submitted as a Limited Amendment to the 2010 hazard mitigation plan and remains relevant in this plan update.

181
This page left intentionally blank

182
Town of Ranburne

183
This page left intentionally blank

184
Table 5-19: Town of Ranburne
Risk and Vulnerability Overview
Natural Hazards Hazard Identification
Mitigation Actions
Prioritization
Prioritized Occurrence
Threat
Vulnerability
Thunderstorm X 1 6 H
Lightning X 3 6 H
Hail X 3 6 H Tornado X 1 7 H Flood X 2 6 M
Drought/Extreme Heat X 3 2 H
Winter Storm/Frost Freeze/Heavy Snow/Ice Storm/Winter Weather/ Extreme Cold
X 3 3 M
Hurricane/Tropical Storm/Tropical Depression/ High Wind/Strong Wind X 1 4 M
Sinkhole/Expansive Soil X 3 6 L
Landslide X 3 7 L
Earthquake X 3 5 L
Wildfire X 3 1 H
Dam/Levee Failure X 3 7 L
KEY: Hazard Identification – Identified by local jurisdictions Mitigation Actions Prioritization - Hazards are prioritized by jurisdictions based on past hazard experiences, vulnerabilities, and available mitigation actions with the hazard having highest priority of mitigation assigned number one. Prioritized Occurrence Threat - Hazards are prioritized with the highest threat of occurrence assigned number one based on hazardous events that have occurred within each jurisdiction over the past ten years, with the exception of wildfires that were based on events that have occurred over three years. Some natural hazards have equal threats to a jurisdiction; therefore, their threat number will be the same. These prioritized threats may or may not be the same as the mitigation actions prioritization. Vulnerability – Identified by local jurisdictions. NA – Not Applicable; not a hazard to the jurisdiction; L – Low Risk; little damage potential (damage to less than 5% of the jurisdiction); M – Medium Risk; moderate damage potential (damage to 5-10% of jurisdiction, infrequent occurrence); and H – High Risk; significant risk/major damage potential (damage to over 10% of jurisdiction, regular occurrence)
(Source: NOAA NCDC Storm Events Database; Alabama Forestry Commission; National Forestry Service; Alabama Geological Survey; Participating Jurisdictions, 2015)

185
TABLE 5-20: TOWN OF RANBURNE HAZARD EVENTS
4 Thunderstorms Events – 01/01/2003 thru 12/31/2013 (4018 days) (Source: NOAA NCDC Storm Events Database)
Location County/Zone St. Date Time T.Z. Type Mag Dth Inj PrD CrD
COUNTYWIDE CLEBURNE CO. AL 05/02/2003 17:22 CST Thunderstorm Wind 55 kts. EG 0 0 12.00K 0.00K
COUNTYWIDE CLEBURNE CO. AL 06/22/2004 18:25 CST Thunderstorm Wind 60 kts. EG 0 0 10.00K 0.00K
COUNTYWIDE CLEBURNE CO. AL 04/30/2005 04:31 CST Thunderstorm Wind 52 kts. EG 0 0 2.00K 0.00K
RANBURNE CLEBURNE CO. AL 06/20/2006 16:05 CST Thunderstorm Wind 50 kts. EG 0 0 3.00K 0.00K
Totals:
0 0 18.00K 0.00K
1 Lightning Event – 01/01/2003 thru 12/31/2013 (4018 days)
(Source: NOAA NCDC Storm Events Database) Location County/Zone St. Date Time T.Z. Type Mag Dth Inj PrD CrD
RANBURNE CLEBURNE CO. AL 05/07/2003 14:22 CST Lightning
0 0 70.00K 0.00K
Totals:
0 0 70.00K 0.00K
1 Hail Event – 01/01/2003 thru 12/31/2013 (4018 days)
(Source: NOAA NCDC Storm Events Database) Location County/Zone St. Date Time T.Z. Type Mag Dth Inj PrD CrD
RANBURNE CLEBURNE CO. AL 05/07/2003 14:30 CST Hail 1.00 in. 0 0 0.00K 0.00K
Totals:
0 0 0.00K 0.00K

186
0 Tornado Events – 01/01/2003 thru 12/31/2013 (4018 days) (Source: NOAA NCDC Storm Events Database)
No tornado events occurred or were reported during 01/01/2003 thru 12/31/2013.
3 Flood/Flash Flood Events – 01/01/2003 thru 12/31/2013 (4018 days) (Source: NOAA NCDC Storm Events Database)
Location County/Zone St. Date Time T.Z. Type Mag Dth Inj PrD CrD
COUNTYWIDE CLEBURNE CO. AL 05/07/2003 16:00 CST Flash Flood
0 0 250.00K 0.00K
COUNTYWIDE CLEBURNE CO. AL 09/16/2004 10:45 CST Flash Flood
0 0 50.00K 0.00K
COUNTYWIDE CLEBURNE CO. AL 11/24/2004 08:25 CST Flash Flood
0 0 6.00K 0.00K
Totals:
0 0 306.00K 0.00K
36 Drought/Extreme Heat Events – 01/01/2003 thru 12/31/2013 (4018 days) (Source: NOAA NCDC Storm Events Database)
Location County/Zone St. Date Time T.Z. Type Mag Dth Inj PrD CrD
CLEBURNE (ZONE) CLEBURNE (ZONE) AL 07/18/2006 07:00 CST Drought
0 0 0.00K 0.00K
CLEBURNE (ZONE) CLEBURNE (ZONE) AL 08/01/2006 00:00 CST Drought
0 0 0.00K 0.00K
CLEBURNE (ZONE) CLEBURNE (ZONE) AL 09/01/2006 00:00 CST Drought
0 0 0.00K 0.00K
CLEBURNE (ZONE) CLEBURNE (ZONE) AL 05/01/2007 00:00 CST-6 Drought
0 0 0.00K 0.00K
CLEBURNE (ZONE) CLEBURNE (ZONE) AL 06/01/2007 00:00 CST-6 Drought
0 0 0.00K 0.00K
CLEBURNE (ZONE) CLEBURNE (ZONE) AL 07/01/2007 00:00 CST-6 Drought
0 0 0.00K 0.00K
CLEBURNE (ZONE) CLEBURNE (ZONE) AL 08/01/2007 00:00 CST-6 Drought
0 0 0.00K 0.00K
CLEBURNE (ZONE) CLEBURNE (ZONE) AL 09/01/2007 00:00 CST-6 Drought
0 0 0.00K 0.00K
CLEBURNE (ZONE) CLEBURNE (ZONE) AL 10/01/2007 00:00 CST-6 Drought
0 0 0.00K 0.00K
CLEBURNE (ZONE) CLEBURNE (ZONE) AL 11/01/2007 00:00 CST-6 Drought
0 0 0.00K 0.00K
CLEBURNE (ZONE) CLEBURNE (ZONE) AL 12/01/2007 00:00 CST-6 Drought
0 0 0.00K 0.00K
CLEBURNE (ZONE) CLEBURNE (ZONE) AL 01/01/2008 00:00 CST-6 Drought
0 0 0.00K 0.00K

187
CLEBURNE (ZONE) CLEBURNE (ZONE) AL 02/01/2008 00:00 CST-6 Drought
0 0 0.00K 0.00K
CLEBURNE (ZONE) CLEBURNE (ZONE) AL 03/01/2008 00:00 CST-6 Drought
0 0 0.00K 0.00K
CLEBURNE (ZONE) CLEBURNE (ZONE) AL 04/01/2008 00:00 CST-6 Drought
0 0 0.00K 0.00K
CLEBURNE (ZONE) CLEBURNE (ZONE) AL 05/01/2008 00:00 CST-6 Drought
0 0 0.00K 0.00K
CLEBURNE (ZONE) CLEBURNE (ZONE) AL 06/01/2008 00:00 CST-6 Drought
0 0 0.00K 0.00K
CLEBURNE (ZONE) CLEBURNE (ZONE) AL 07/01/2008 00:00 CST-6 Drought
0 0 0.00K 0.00K
CLEBURNE (ZONE) CLEBURNE (ZONE) AL 08/01/2008 00:00 CST-6 Drought
0 0 0.00K 0.00K
CLEBURNE (ZONE) CLEBURNE (ZONE) AL 09/30/2008 06:00 CST-6 Drought
0 0 0.00K 0.00K
CLEBURNE (ZONE) CLEBURNE (ZONE) AL 10/01/2008 00:00 CST-6 Drought
0 0 0.00K 0.00K
CLEBURNE (ZONE) CLEBURNE (ZONE) AL 11/01/2008 00:00 CST-6 Drought
0 0 0.00K 0.00K
CLEBURNE (ZONE) CLEBURNE (ZONE) AL 12/01/2008 00:00 CST-6 Drought
0 0 0.00K 0.00K
CLEBURNE (ZONE) CLEBURNE (ZONE) AL 10/19/2010 00:00 CST-6 Drought
0 0 0.00K 0.00K
CLEBURNE (ZONE) CLEBURNE (ZONE) AL 08/23/2011 00:00 CST-6 Drought
0 0 0.00K 0.00K
CLEBURNE (ZONE) CLEBURNE (ZONE) AL 09/01/2011 00:00 CST-6 Drought
0 0 0.00K 0.00K
CLEBURNE (ZONE) CLEBURNE (ZONE) AL 10/01/2011 00:00 CST-6 Drought
0 0 0.00K 0.00K
CLEBURNE (ZONE) CLEBURNE (ZONE) AL 11/01/2011 00:00 CST-6 Drought
0 0 0.00K 0.00K
CLEBURNE (ZONE) CLEBURNE (ZONE) AL 06/26/2012 00:00 CST-6 Drought
0 0 0.00K 0.00K
CLEBURNE (ZONE) CLEBURNE (ZONE) AL 07/01/2012 00:00 CST-6 Drought
0 0 0.00K 0.00K
CLEBURNE (ZONE) CLEBURNE (ZONE) AL 08/01/2012 00:00 CST-6 Drought
0 0 0.00K 0.00K
CLEBURNE (ZONE) CLEBURNE (ZONE) AL 09/01/2012 00:00 CST-6 Drought
0 0 0.00K 0.00K
CLEBURNE (ZONE) CLEBURNE (ZONE) AL 10/01/2012 00:00 CST-6 Drought
0 0 0.00K 0.00K
CLEBURNE (ZONE) CLEBURNE (ZONE) AL 11/01/2012 00:00 CST-6 Drought
0 0 0.00K 0.00K
CLEBURNE (ZONE) CLEBURNE (ZONE) AL 01/01/2013 00:00 CST-6 Drought
0 0 0.00K 0.00K
CLEBURNE (ZONE) CLEBURNE (ZONE) AL 02/01/2013 00:00 CST-6 Drought
0 0 0.00K 0.00K

188
Totals:
0 0 0.00K 0.00K
12 Winter Storm/Frost Freeze/Heavy Snow/Ice Storm/Winter Weather/Extreme Cold Events – 01/01/2003 thru 12/31/2013 (4018 days) (Source: NOAA NCDC Storm Events Database)
Location County/Zone St. Date Time T.Z. Type Mag Dth Inj PrD CrD
CLEBURNE (ZONE) CLEBURNE (ZONE) AL 02/25/2004 19:30 CST Winter Storm
0 0 0.00K 0.00K
CLEBURNE (ZONE) CLEBURNE (ZONE) AL 01/09/2011 16:40 CST-6 Winter Storm
0 0 0.00K 0.00K
CLEBURNE (ZONE) CLEBURNE (ZONE) AL 04/07/2007 00:00 CST-6 Frost/freeze
0 0 0.00K 0.00K
CLEBURNE (ZONE) CLEBURNE (ZONE) AL 04/08/2007 00:00 CST-6 Frost/freeze
0 0 0.00K 0.00K
CLEBURNE (ZONE) CLEBURNE (ZONE) AL 02/12/2010 12:00 CST-6 Heavy Snow
0 0 0.00K 0.00K
CLEBURNE (ZONE) CLEBURNE (ZONE) AL 12/25/2010 08:00 CST-6 Heavy Snow
0 0 0.00K 0.00K
CLEBURNE (ZONE) CLEBURNE (ZONE) AL 02/09/2011 19:00 CST-6 Heavy Snow
0 0 0.00K 0.00K
CLEBURNE (ZONE) CLEBURNE (ZONE) AL 01/17/2013 14:00 CST-6 Heavy Snow
0 0 0.00K 0.00K
CLEBURNE (ZONE) CLEBURNE (ZONE) AL 01/28/2005 20:45 CST Ice Storm
0 0 40.00K 0.00K
CLEBURNE (ZONE) CLEBURNE (ZONE) AL 01/19/2008 06:00 CST-6 Winter Weather
0 0 0.00K 0.00K
CLEBURNE (ZONE) CLEBURNE (ZONE) AL 12/26/2010 03:00 CST-6 Winter Weather
0 0 0.00K 0.00K
CLEBURNE (ZONE) CLEBURNE (ZONE) AL 01/24/2003 00:00 CST Extreme Cold/wind Chill
0 0 0.00K 0.00K
Totals:
0 0 40.00K 0.00K
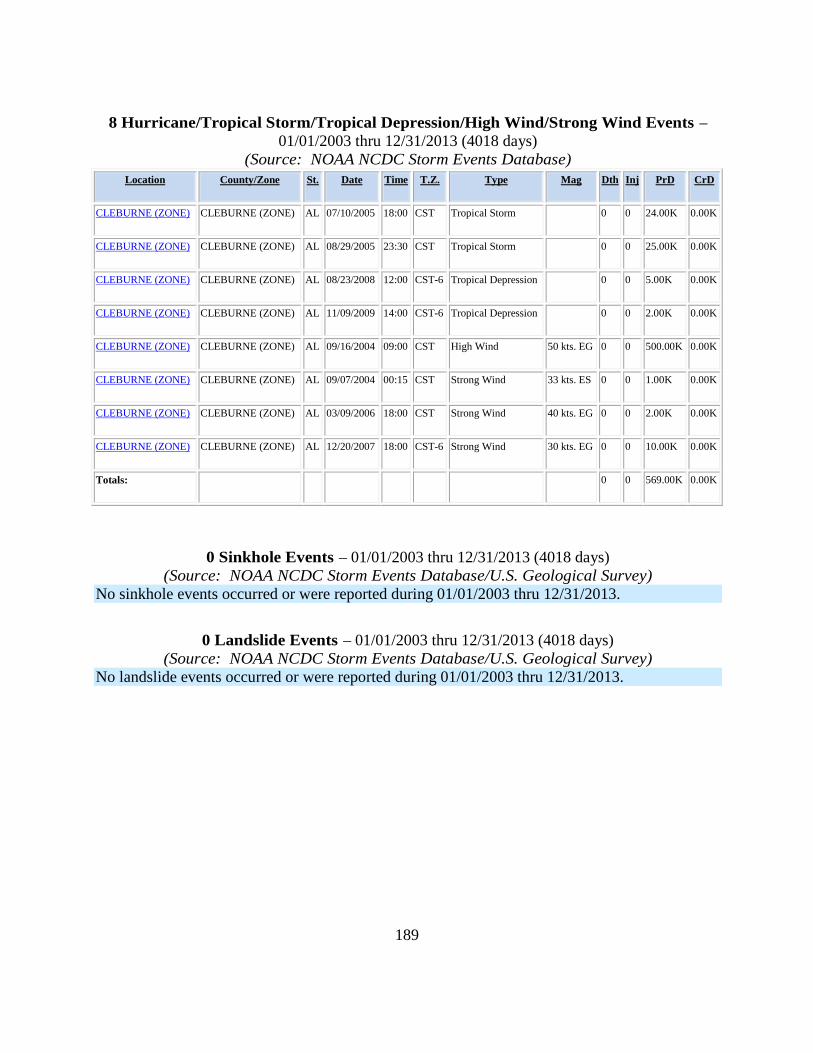
189
8 Hurricane/Tropical Storm/Tropical Depression/High Wind/Strong Wind Events – 01/01/2003 thru 12/31/2013 (4018 days)
(Source: NOAA NCDC Storm Events Database) Location County/Zone St. Date Time T.Z. Type Mag Dth Inj PrD CrD
CLEBURNE (ZONE) CLEBURNE (ZONE) AL 07/10/2005 18:00 CST Tropical Storm
0 0 24.00K 0.00K
CLEBURNE (ZONE) CLEBURNE (ZONE) AL 08/29/2005 23:30 CST Tropical Storm
0 0 25.00K 0.00K
CLEBURNE (ZONE) CLEBURNE (ZONE) AL 08/23/2008 12:00 CST-6 Tropical Depression
0 0 5.00K 0.00K
CLEBURNE (ZONE) CLEBURNE (ZONE) AL 11/09/2009 14:00 CST-6 Tropical Depression
0 0 2.00K 0.00K
CLEBURNE (ZONE) CLEBURNE (ZONE) AL 09/16/2004 09:00 CST High Wind 50 kts. EG 0 0 500.00K 0.00K
CLEBURNE (ZONE) CLEBURNE (ZONE) AL 09/07/2004 00:15 CST Strong Wind 33 kts. ES 0 0 1.00K 0.00K
CLEBURNE (ZONE) CLEBURNE (ZONE) AL 03/09/2006 18:00 CST Strong Wind 40 kts. EG 0 0 2.00K 0.00K
CLEBURNE (ZONE) CLEBURNE (ZONE) AL 12/20/2007 18:00 CST-6 Strong Wind 30 kts. EG 0 0 10.00K 0.00K
Totals:
0 0 569.00K 0.00K
0 Sinkhole Events – 01/01/2003 thru 12/31/2013 (4018 days) (Source: NOAA NCDC Storm Events Database/U.S. Geological Survey)
No sinkhole events occurred or were reported during 01/01/2003 thru 12/31/2013.
0 Landslide Events – 01/01/2003 thru 12/31/2013 (4018 days) (Source: NOAA NCDC Storm Events Database/U.S. Geological Survey)
No landslide events occurred or were reported during 01/01/2003 thru 12/31/2013.

190
3 Earthquake Events – 01/01/2003 thru 12/31/2013 (4018 days) (Source: www.city-data.com)
Location County/Zone St. Date Time T.Z. Type Mag Dth Inj PrD CrD
58.9 miles away from county center CLEBURNE AL 04/29/2003 08:59 CST Earthquake 4.9 0 0 0.00K 0.00K
89.5 miles away from county center CLEBURNE AL 05/09/2004 08:56 CST Earthquake 3.3 0 0 0.00K 0.00K
88.4 miles away from county center CLEBURNE AL 08/19/2004 23:51 CST Earthquake 3.6 0 0 0.00K 0.00K
Totals:
0 0 0.00K 0.00K
155 Wildfire Events – 2010 thru 2013 (Source: Alabama Forestry Commission)
County Total # of Fires
Average # of Fires
Total Acres Burned
Average Acres
Burned
Average Fire Size in Acres
Cleburne 155 52 5,278 1,759 34
0 Dam/Levee Failure Events – 01/01/2003 thru 12/31/2013 (4018 days) (Source: NOAA NCDC Storm Events Database/Local Input)
No dam/levee failure events occurred or were reported during 01/01/2003 thru 12/31/2013.

191
Table 5-21: Town of Ranburne Hazard Probability Assessment
Natural Hazards
Number of Historical
Occurrences
Probability of Future
Occurrence Extent Area Affected
Thunderstorm 4 40% >10% Countywide
Lightning 1 10% >10% Town-wide
Hail 1 10% >10% Town-wide
Tornado Unknown Unknown >10% Town-wide
Flood/Flash Flood 3 30% 5-10% Countywide
Drought/Extreme Heat 36 >100% >10% Countywide
Winter Storm/Frost Freeze/Heavy Snow/Ice Storm/Winter Weather/Extreme Cold
12 >100% 5-10% Countywide
Hurricane/Tropical Storm/Tropical Depression/High Wind/ Strong Wind
8 80% 5-10% Countywide
Sinkhole/Expansive Soil Unknown Unknown <10% Town wide
Landslide Unknown Unknown <10% Town wide
Earthquake 3 30% <10% Countywide
Wildfire 155 >100% >10% Countywide
Dam/Levee Failure Unknown Unknown <10% Town wide
Methodology: Number of historical occurrences is those reported by NOAA NCDC during the 10 year study period, with the exception of wildfire that is a 3 year study period. Probability is expressed by dividing the total number of occurrences by the study period in years. Extent is expressed as the percentage assigned by the jurisdictions’ ranking in the vulnerability summary (Table 4-11). Zero denotes no data available to determine the probability, extent, or affected area.

192
Source: NOAA NCDC; U. S. Inflation Calculator/Consumer Price Index; USGS; Local Input; USDA Census of Agriculture; Alabama Forestry Commission; and National Forestry Service; Participating Jurisdictions, 2015
TABLE 5-22: Town of Ranburne Critical Facilities Facility Location Use Value
Government City Hall 21383 Main Street Government
Education
Ranburne Elementary School 181 Young Dr. Education
Ranburne High School 21045 Main St Education
Source: Local Jurisdiction, 2015 TOTAL $
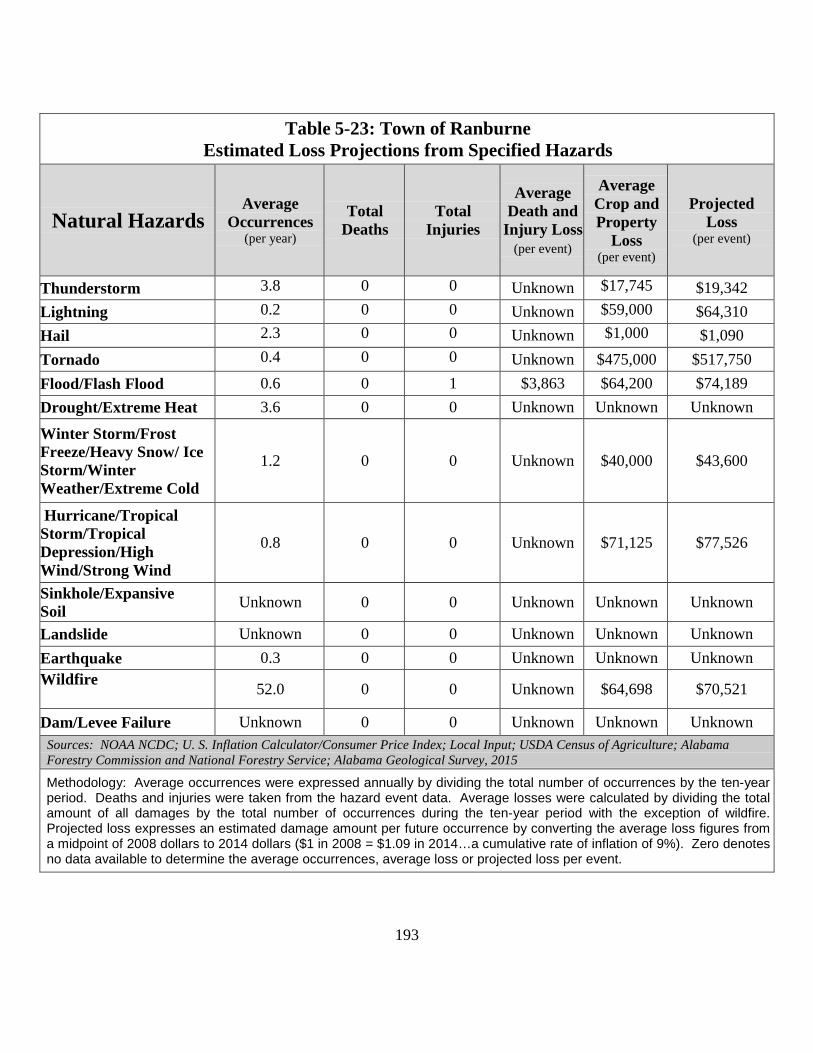
193
Table 5-23: Town of Ranburne Estimated Loss Projections from Specified Hazards
Natural Hazards Average
Occurrences (per year)
Total Deaths
Total Injuries
Average Death and
Injury Loss (per event)
Average Crop and Property
Loss (per event)
Projected Loss
(per event)
Thunderstorm 3.8 0 0 Unknown $17,745 $19,342 Lightning 0.2 0 0 Unknown $59,000 $64,310 Hail 2.3 0 0 Unknown $1,000 $1,090 Tornado 0.4 0 0 Unknown $475,000 $517,750 Flood/Flash Flood 0.6 0 1 $3,863 $64,200 $74,189 Drought/Extreme Heat 3.6 0 0 Unknown Unknown Unknown
Winter Storm/Frost Freeze/Heavy Snow/ Ice Storm/Winter Weather/Extreme Cold
1.2 0 0 Unknown $40,000 $43,600
Hurricane/Tropical Storm/Tropical Depression/High Wind/Strong Wind
0.8 0 0 Unknown $71,125 $77,526
Sinkhole/Expansive Soil Unknown 0 0 Unknown Unknown Unknown
Landslide Unknown 0 0 Unknown Unknown Unknown Earthquake 0.3 0 0 Unknown Unknown Unknown Wildfire 52.0 0 0 Unknown $64,698 $70,521
Dam/Levee Failure Unknown 0 0 Unknown Unknown Unknown Sources: NOAA NCDC; U. S. Inflation Calculator/Consumer Price Index; Local Input; USDA Census of Agriculture; Alabama Forestry Commission and National Forestry Service; Alabama Geological Survey, 2015
Methodology: Average occurrences were expressed annually by dividing the total number of occurrences by the ten-year period. Deaths and injuries were taken from the hazard event data. Average losses were calculated by dividing the total amount of all damages by the total number of occurrences during the ten-year period with the exception of wildfire. Projected loss expresses an estimated damage amount per future occurrence by converting the average loss figures from a midpoint of 2008 dollars to 2014 dollars ($1 in 2008 = $1.09 in 2014…a cumulative rate of inflation of 9%). Zero denotes no data available to determine the average occurrences, average loss or projected loss per event.

194
Town of Ranburne Mitigation Action Plan
The Town of Ranburne recognizes the importance of mitigation planning and will
incorporate mitigation planning in planning documents as they are revised or initiated. The town
has been very active with their mitigation projects, as noted below under benchmarking.
Town of Ranburne Mitigation Actions
Table 5-24:Town of Ranburne Mitigation Actions 2015 Mitigation Action Ranburne Public Park- Reduce flooding problem at park causing damage to nearby
property and roadways. Hazard(s) Addressed Flooding Applies to new/existing asset New Local Planning Mechanism City Council and Street Superintendent Time frame for Completion 3 Years Estimated Cost $25,000 Funding Sources Local and Grant Funds Priority High Status The City has not started on this action due to lack of funding. They plan to begin as
soon as funding becomes available.
Mitigation Action Construct/Install Community Safe Room at Ranburne Public Park Hazard(s) Addressed Thunderstorm, Tornado, High Wind Applies to new/existing asset New Local Planning Mechanism City Council and County EMA Time frame for Completion 5 Years Estimated Cost $50,000 Funding Sources Local and Grant Funds Priority High Status There was lack of funds which caused this project to be delayed. They city still plans
on completing this item as soon as funds become available.
Mitigation Action Purchase Emergency Generators for Town Hall and Police Department Hazard(s) Addressed Thunderstorm, Tornado, High Wind Applies to new/existing asset New Local Planning Mechanism City Council and Police Department Time frame for Completion 1 Year
Estimated Cost $37,000 Funding Sources Local and Grant Funds Priority High Status The city was unable to complete this action item due to budgetary constraints. They
plan to complete this action when funds become available.
Mitigation Action Georgia Avenue – Two (2) locations where culverts were washed leaving no road way on.

195
Hazard(s) Addressed Flood
Applies to new/existing asset Existing
Local Planning Mechanism City Council and Police Department
Time frame for Completion 5 years Estimated Cost $25,000
Funding Sources Local and Grant Funds
Priority High
Status The city was unable to complete this action item due to budgetary constraints. They plan to complete this action when funds become available.

196
HEFLIN WATER AND SEWER
BOARD

197
This page left intentionally blank

198
Heflin Water and Sewer Board’s Mitigation Action Plan
The Heflin Water and Sewer Board in Cleburne County has its own financial account;
therefore, serves as its own applicant for hazard mitigation grants. Representatives participated
in this plan update by attending meetings, personal contact, email, facsimile, and/or regular mail.
The Heflin Water and Sewer Board recognizes the importance of mitigation planning and will
incorporate mitigation planning in planning documents as they are revised or initiated.
Mitigation Strategy-Heflin Water and Sewer Board
Table 5-25: Heflin Water and Sewer Board’s Mitigation Actions 2015
Mitigation Action NEW Install freestanding community safe rooms in vulnerable locations.
Type Structural Projects Goal Reduce risk from natural hazards Hazard(s) Addressed Tornadoes, Thunderstorms, High Wind, Strong Wind Applies to new/existing asset(s) New Local Planning Mechanism Heflin Water and Sewer Board
Estimated Time Frame for Completion One year from funding availability Estimated Cost $100,000 - $125,000 each
Funding Sources HMGP; ADECA
Priority Low Status NEW ACTION Mitigation Action NEW Encourage the construction of storm shelters in new and existing
construction. Construct/install individual storm shelters as needed at water facilities.
Type Structural Projects Goal Reduce risk from natural hazards Hazard(s) Addressed Tornadoes, Thunderstorms, Hail, High Wind, Strong Wind Applies to new/existing asset(s) New and Existing Local Planning Mechanism Heflin Water and Sewer Board Estimated Time Frame for Completion One year from funding availability Estimated Cost $5,000 each Funding Sources HMGP; ADECA Priority High Status NEW ACTION Mitigation Action NEW Purchase emergency generators for post- disaster mitigation and
conduct routine tests on backup generators for all critical facilities, to include lift stations.
Type Emergency Services Protection Goal Reduce the water and sewer authorities’ vulnerability to natural
hazards

199
Hazard(s) Addressed All Applies to new/existing asset(s) Existing Local Planning Mechanism Heflin Water and Sewer Board Estimated Time Frame for Completion One year from available funding Estimated Cost $5,000 - $30,000 each Funding Sources HMGP; ADECA Priority High Status New Action

200
CLEBURNE COUNTY WATER
BOARD

201
This page left intentionally blank

202
Cleburne County Water Board’s Mitigation Action Plan
The Cleburne County Water Board has its own financial account; therefore, serves as its
own applicant for hazard mitigation grants. Representatives participated in this plan update by
attending meetings, personal contact, email, facsimile, and/or regular mail. The Cleburne
County Water Board recognizes the importance of mitigation planning and will incorporate
mitigation planning in planning documents as they are revised or initiated.
Mitigation Strategy-Cleburne County Water Board
Table 5-26: Cleburne County Water Board’s Mitigation Actions 2015 Mitigation Action NEW Install freestanding community safe rooms in vulnerable
locations. Type Structural Projects Goal Reduce risk from natural hazards Hazard(s) Addressed Tornadoes, Thunderstorms, Hail, High Wind, Strong Wind Applies to new/existing asset(s) New Local Planning Mechanism Water Board
Estimated Time Frame for Completion One year from funding availability Estimated Cost $100,000 - $125,000 each Funding Sources HMGP; ADECA
Priority Low Status NEW ACTION
Mitigation Action NEW Encourage the construction of storm shelters in new and existing construction. Construct/install individual storm shelters as needed at water facilities.
Type Structural Projects Goal Reduce risk from natural hazards Hazard(s) Addressed Tornadoes, Thunderstorms, Hail, High Wind, Strong Wind Applies to new/existing asset(s) New and Existing Local Planning Mechanism Water Board Estimated Time Frame for Completion One year from funding availability Estimated Cost $5,000 each Funding Sources HMGP; ADECA Priority High Status NEW ACTION Mitigation Action NEW Purchase emergency generators for post- disaster mitigation and
conduct routine tests on backup generators for all critical facilities, to include lift stations.
Type Emergency Services Protection Goal Reduce the water and sewer authorities’ vulnerability to natural
hazards. Hazard(s) Addressed All

203
Applies to new/existing asset(s) Existing Local Planning Mechanism Water Board Estimated Time Frame for Completion One year from available funding Estimated Cost $5,000 - $30,000 each Funding Sources HMGP; ADECA Priority High Status New Action

204
Section Six: Mitigation Plan Maintenance
The plan may be reviewed at any time at the request of any local government, by the
Chairman (Cleburne County EMA Director) of the Hazard Mitigation Planning Committee, or at the
EMA Director’s discretion. Local governments may submit a formal letter to the Cleburne County
EMA Director/Chairman of the Cleburne County Hazard Mitigation Planning Committee requesting
a review of the plan. The public may also request review of the plan by submitting a formal letter to
the Cleburne County EMA Director/Chairman of the Cleburne County Hazard Mitigation Planning
Committee requesting a review of the plan. In the future, the County EMA will strive to get
jurisdictions with websites to post the Hazard Mitigation Plan and provide a way for the public to
comment online. Citizen Input on Hazard Mitigation Planning forms will be placed in public places,
to include on the courthouse bulletin board, in the local government buildings, and in the library to
provide the public a chance to provide feedback during the plan’s implementation, monitoring,
update, and evaluation process.
The Hazard Mitigation Planning Committee may re-evaluate the plan after a disaster has
occurred to make sure that mitigation of the hazard was addressed properly. At the minimum, the
Hazard Mitigation Planning Committee will annually monitor, evaluate, and amend this plan.
Public participation is encouraged to allow the public an opportunity to participate in the process.
Efforts will be made to have the annual survey form placed on all jurisdictional websites for the
public to complete and return. The Hazard Mitigation Planning Committee will review a variety
of resources and examine conditions, which may affect mitigation activities for natural hazards.
The committee will review existing plans, policies, maps, and other documentation such as, but
not limited to:
• NFIP flood panels
• Post-disaster redevelopment models
• Critical facilities lists and maps
• Existing land-use maps
• Future land-use maps
• Current zoning maps
• Land development codes

205
• Governing body codes and resolutions
• Comprehensive plans, including drainage studies
• Emergency Operations Plan
• Standard Operating Guidelines
• Various other plans and/or studies related to hazard mitigation
For monitoring, evaluating, and updating this plan, Director of the Cleburne County
EMA/Chairman of the HMPC will serve as the point of contact for all amendments to the plan
and will coordinate all additions, deletions or amendments of actions to the plan, as needed. The
EMA Director/Chairman of the HMPC will be responsible for informing the local governing
bodies of any amendments made to the plan. Any local government seeking to add an action to
the plan will be responsible for providing support for the action in the form of a resolution if, and
only if, the funding source(s) requires so. The entire plan will be updated on a five-year planning
cycle with the Cleburne County EMA Director being the responsible person for reconvening the
committee. The five-year plan update will begin at least six months prior to current plan’s
expiration.
During the past five years, the Cleburne County EMA/Chairman of the HMPC kept no
records of the annual plan reviews; therefore, regular plan monitoring will be conducted
differently in the next five years. Regular plan monitoring will be achieved through the County
EMA’s efforts to track mitigation activities. The Director of the Cleburne County
EMA/Chairman of the HMPC is the responsible person for the review of the plan to include
monitoring, evaluating, and updating of the plan, reconvening the committee only if additional
information is available or the EMA Director/HMPC Chairman requires assistance. The annual
review of the plan will take place in June of each year. Although the entire plan’s progress will
be monitored, evaluated, and updated on a continuous basis throughout the five-year timeframe,
the annual review will begin by the EMA Director/HMPC Chairman emailing a survey form to
the HMPC members asking them for their input and giving them a two-week deadline on
returning the information to the EMA Director/HMPC Chairman. Following the two-week
deadline, the EMA Director/HMPC Chairman will consolidate the survey forms and act upon the
findings as needed and in the methods described below. Again, efforts will be made to have the
206
annual survey form placed on all jurisdictional websites for the public to complete and return.
The County EMA will conduct an annual evaluation of the plan, reconvening the
committee only if additional information is available or the EMA Director/HMPC Chairman
requires assistance. The EMA Director/HMPC Chairman will document the annual evaluation
and note the findings. The evaluation will consider several basic factors including:
1. Changes in the level of risk to the county and its citizens
2. Changes in laws, policies, or regulations at the local or state level
3. Changes in state or local agencies or their procedures that will affect how mitigation
programs or funds are administered
4. Significant changes in funding sources or capabilities
5. Changes in the composition of the Hazard Mitigation Committee
6. Progress on mitigation actions (including project closeouts) and new mitigation actions
that the county is considering
7. Major changes to the multi-jurisdictional hazard mitigation plan
Additionally, the County EMA Director/HMPC Chairman will contact local agencies
(and other individuals and organizations as appropriate) to determine if updates have been made
to certain elements of the local plans as part of the annual review process. The purpose of this
effort is to ensure that local information about risk, goals, projects, and mitigation strategies
included in the plan remains current.
In the event modifications to the plan are warranted as a result of the annual review or
other conditions, the HMPC will oversee and approve all revisions to the plan. Conditions which
might warrant revisions to this plan would include, but not be limited to, special opportunities for
funding, a response to a natural disaster, and changes in jurisdictions’ capabilities to implement
the plan. Before any revisions are submitted to the jurisdictions for adoption, a notice may be
placed in the local newspaper or posted in public facilities, allowing an opportunity for the public
to review the proposed amendments at the EMA, submit written comments, and/or present
comments at a public meeting. The HMPC will then submit all revisions for adoption by
jurisdictions affected by the changes. A copy of the plan revisions will be submitted to all
holders of the original plan in a timely manner.

207
Incorporation into Existing Planning Mechanisms
The Cleburne County Hazard Mitigation Plan is a stand-alone plan; however, will be
placed alongside the current Cleburne County Emergency Operations Plan that is administered
by the Cleburne County Emergency Management Agency.
Incorporation of the hazard mitigation plan will vary for each jurisdiction based an
existing planning methods and processes. Jurisdictions with planning commissions and
respective zoning ordinances and building codes will incorporate mitigation plan elements as
appropriate into their review of new developments.
Many jurisdictions have no zoning or existing plans of any type other than this mitigation
plan (see Table 1-1) and do not have the resources or funding to prepare them. In these cases,
where applicable, the mitigation plan elements will be incorporated into local development
decisions by the appropriate local coordinating body in order to determine funding, prioritization,
and review of new development activities. At such time as the jurisdictions do adopt zoning and
building codes they will reflect the goals and objectives set forth in this plan. Further, any
jurisdiction preparing or updating a comprehensive plan will reflect their hazard mitigation goals
and objectives in their plan. These updates will occur as budget and time allow.
The jurisdictions are funded through their local budgets and utilize grants that allow them
to expand on and improve existing policies and programs. The EMA distributes educational
material and reaches out to the citizens and businesses in the county. Table 1-1 provides a list of
plans, policies, and ordinances available to each jurisdiction. These plans, policies, and
ordinances, along, with an engineer, planners, GIS staff, a building inspector, emergency
managers, and grant writers help to expand on and improve the jurisdictions’ capabilities.

208
APPENDIX I Adopting Resolutions

209
This page left intentionally blank

210
APPROVAL & IMPLEMENTATION
The purpose of hazard mitigation is to implement action that eliminate the risk from
hazards, or reduce the severity of the effects of hazards on people and property. Mitigation
actions are both short-term and long-term activities that reduce the cause or occurrence of
hazards; reduce exposure to hazards; or reduce effects of hazards through various means to
include preparedness, response and recovery measures.
This plan update applies to all local agencies, boards, commissions, and departments
assigned mitigation responsibilities, and to others as designated by the Cleburne County
Commission or Director of the Cleburne County Emergency Management Agency.
The Cleburne County Hazard Mitigation Plan Update was prepared in compliance with
Public Law 106-390, Disaster Mitigation Act of 2000, as amended. This plan update implements
hazard mitigation measures intended to eliminate or reduce the effects of future disasters
throughout Cleburne County, and was developed in a joint and cooperative venture by members
of the Cleburne County Hazard Mitigation Planning.
Cleburne County will comply with all applicable state and federal statutes and regulations
in effect with respect to the periods for which it receives grant funding, in compliance with 44
Code of Federal Regulations (CFR) 13.11c. Cleburne County will amend its plan whenever
necessary to reflect changes in local/state and/or federal laws and statutes as required in 44 CFR,
13.11d. At a minimum, the Cleburne County EMA will review and if necessary, update the plan
every five years from the date of approval in accordance with 44 CFR, 201.6 (5) (d) (3) in order
to continue program eligibility.
As the Director of the Cleburne County Emergency Management Agency, I hereby adopt
this plan update in accordance to the powers delegated to me and accept this plan update for
implementation in order to protect the lives and property of the citizens of Cleburne County,
Alabama.
_______________ ____________________ Date Steve Swafford, Director
Cleburne County Emergency Management Agency

211
This page left intentionally blank

212
County of Cleburne
2015 Cleburne County Hazard Mitigation Plan Update
Resolution of Adoption
WHEREAS, the Cleburne County Hazard Mitigation Plan has been updated in
accordance with FEMA requirements at 44 C.F.R. 201.6; and
WHEREAS, the County of Cleburne participated in the updating of a multi-
jurisdictional plan, the Cleburne County Hazard Mitigation Plan; and
WHEREAS, the County of Cleburne is a local unit of government that has
afforded the citizens an opportunity to comment and provide input in the plan and the actions in
the plan; and
WHEREAS, the County of Cleburne has reviewed the plan and affirms that the
plan will be updated no less than every five years.
NOW THEREFORE, BE IT RESOLVED by the County Commission that the
County of Cleburne adopts the 2015 Cleburne County Hazard Mitigation Plan update, and
resolves to execute the actions in the plan.
ADOPTED, this _______ day of _____________, 2015 at the meeting of the
County Commission.
__________________________________ Chairman, Cleburne County Commission

213
This page left intentionally blank

214
Town of Edwardsville
2015 Cleburne County Hazard Mitigation Plan Update
Resolution of Adoption
WHEREAS, the Cleburne County Hazard Mitigation Plan has been updated in
accordance with FEMA requirements at 44 C.F.R. 201.6; and
WHEREAS, the Town of Edwardsville participated in the updating of a multi-
jurisdictional plan, Cleburne County Hazard Mitigation Plan; and
WHEREAS, the Town of Edwardsville is a local unit of government that has
afforded the citizens an opportunity to comment and provide input in the plan and the actions in
the plan; and
WHEREAS, the Town of Edwardsville has reviewed the plan and affirms that the
plan will be updated no less than every five years.
NOW THEREFORE, BE IT RESOLVED by the Town Council that the Town
of Edwardsville adopts the 2015 Cleburne County Hazard Mitigation Plan Update, and resolves
to execute the actions in the plan.
ADOPTED, this _______ day of _____________, 2015 at the meeting of the
Town Council.
__________________________________ Mayor, Town of Edwardsville

215
This page left intentionally blank

216
Town of Fruithurst
2015 Cleburne County Hazard Mitigation Plan Update
Resolution of Adoption
WHEREAS, the Cleburne County Hazard Mitigation Plan has been updated in
accordance with FEMA requirements at 44 C.F.R. 201.6; and
WHEREAS, the Town of Fruithurst participated in the updating of a multi-
jurisdictional plan, Cleburne County Hazard Mitigation Plan; and
WHEREAS, the Town of Fruithurst is a local unit of government that has
afforded the citizens an opportunity to comment and provide input in the plan and the actions in
the plan; and
WHEREAS, the Town of Fruithurst has reviewed the plan and affirms that the
plan will be updated no less than every five years.
NOW THEREFORE, BE IT RESOLVED by the Town Council that the Town
of Fruithurst adopts the 2015 Cleburne County Hazard Mitigation Plan Update, and resolves to
execute the actions in the plan.
ADOPTED, this _______ day of _____________, 2015 at the meeting of the
Town Council.
__________________________________ Mayor, Town of Fruithurst

217
This page left intentionally blank

218
City of Heflin
2015 Cleburne County Hazard Mitigation Plan Update
Resolution of Adoption
WHEREAS, the Cleburne County Hazard Mitigation Plan has been updated in
accordance with FEMA requirements at 44 C.F.R. 201.6; and
WHEREAS, the City of Heflin participated in the updating of a multi-
jurisdictional plan, the Cleburne County Hazard Mitigation Plan; and
WHEREAS, the City of Heflin is a local unit of government that has afforded the
citizens an opportunity to comment and provide input in the plan and the actions in the plan; and
WHEREAS, the City of Heflin has reviewed the plan and affirms that the plan
will be updated no less than every five years.
NOW THEREFORE, BE IT RESOLVED by the City Council that the City of
Heflin adopts the 2015 Cleburne County Hazard Mitigation Plan update, and resolves to execute
the actions in the plan.
ADOPTED, this _______ day of _____________, 2015 at the meeting of the City
Council.
__________________________________ Mayor, City of Heflin

219
This page left intentionally blank

220
Town of Ranburne
2015 Cleburne County Hazard Mitigation Plan Update
Resolution of Adoption
WHEREAS, the Cleburne County Hazard Mitigation Plan has been updated in
accordance with FEMA requirements at 44 C.F.R. 201.6; and
WHEREAS, the Town of Ranburne participated in the updating of a multi-
jurisdictional plan, Cleburne County Hazard Mitigation Plan; and
WHEREAS, the Town of Ranburne is a local unit of government that has
afforded the citizens an opportunity to comment and provide input in the plan and the actions in
the plan; and
WHEREAS, the Town of Ranburne has reviewed the plan and affirms that the
plan will be updated no less than every five years.
NOW THEREFORE, BE IT RESOLVED by the Town Council that the Town
of Ranburne adopts the 2015 Cleburne County Hazard Mitigation Plan Update, and resolves to
execute the actions in the plan.
ADOPTED, this _______ day of _____________, 2015 at the meeting of the
Town Council.
__________________________________ Mayor, Town of Randburne

221
This page left intentionally blank

222
Heflin Water and Sewer Board
2015 Cleburne County Hazard Mitigation Plan Update
Resolution of Adoption
WHEREAS, the Cleburne County Hazard Mitigation Plan has been updated in
accordance with FEMA requirements at 44 C.F.R. 201.6; and
WHEREAS, Heflin Water and Sewer Board participated in the updating of a
multi-jurisdictional plan, Cleburne County Hazard Mitigation Plan; and
WHEREAS, Heflin Water and Sewer Board is a local special district that has
afforded the citizens an opportunity to comment and provide input in the plan and the actions in
the plan; and
WHEREAS, Heflin Water and Sewer Board has reviewed the plan and affirms
that the plan will be updated no less than every five years.
NOW THEREFORE, BE IT RESOLVED by the Board that the Heflin Water
and Sewer Board adopts the 2015 Cleburne County Hazard Mitigation Plan Update, and resolves
to execute the actions in the plan.
ADOPTED, this _______ day of _____________, 2015 at the meeting of the
Heflin Water and Sewer Board.
______________________________ Chairman, Heflin Water and Sewer Board

223
This page left intentionally blank

224
Cleburne County Water Board
2015 Cleburne County Hazard Mitigation Plan Update
Resolution of Adoption
WHEREAS, the Cleburne County Hazard Mitigation Plan has been updated in
accordance with FEMA requirements at 44 C.F.R. 201.6; and
WHEREAS, Cleburne County Water Board participated in the updating of a
multi-jurisdictional plan, Cleburne County Hazard Mitigation Plan; and
WHEREAS, Cleburne County Water Board is a local special district that has
afforded the citizens an opportunity to comment and provide input in the plan and the actions in
the plan; and
WHEREAS, Cleburne County Water Board has reviewed the plan and affirms
that the plan will be updated no less than every five years.
NOW THEREFORE, BE IT RESOLVED by the Board that the Cleburne
County Water Board adopts the 2015 Cleburne County Hazard Mitigation Plan Update, and
resolves to execute the actions in the plan.
ADOPTED, this _______ day of _____________, 2015 at the meeting of the
Cleburne County Water Board.
______________________________ Chairman, Cleburne County Water Board