2015 Performance Management Report - Zonebourse.com Liquide... · 2015 PERFORMANCE The Group...
34
Air Liquide - 2015 Results Page 1 / 34 2015 PERFORMANCE 2 2015 Key Figures .................................................................................................................................................. 2 2015 Highlights ..................................................................................................................................................... 3 2015 Income Statement........................................................................................................................................ 6 2015 Cash Flow and Balance Sheet .................................................................................................................. 15 INVESTMENT CYCLE AND FINANCING STRATEGY 18 Investments......................................................................................................................................................... 18 Financing Strategy .............................................................................................................................................. 20 OUTLOOK 24 APPENDICES 25 4 th Quarter 2015 Revenue ................................................................................................................................... 25 Currency, energy and significant scope impacts ................................................................................................ 26 Segment Information .......................................................................................................................................... 27 Consolidated Income Statement ........................................................................................................................ 28 Consolidated Balance Sheet .............................................................................................................................. 29 Consolidated Cash Flow Statement ................................................................................................................... 30 Restated data ..................................................................................................................................................... 32 2015 Performance Management Report
Transcript of 2015 Performance Management Report - Zonebourse.com Liquide... · 2015 PERFORMANCE The Group...
Air Liquide - 2015 Results
Page 1 / 34
2015 PERFORMANCE 2
2015 Key Figures .................................................................................................................................................. 2
2015 Highlights ..................................................................................................................................................... 3
2015 Income Statement ........................................................................................................................................ 6
2015 Cash Flow and Balance Sheet .................................................................................................................. 15
INVESTMENT CYCLE AND FINANCING STRATEGY 18
Investments......................................................................................................................................................... 18
Financing Strategy .............................................................................................................................................. 20
OUTLOOK 24
APPENDICES 25
4thQuarter 2015 Revenue ................................................................................................................................... 25
Currency, energy and significant scope impacts ................................................................................................ 26
Segment Information .......................................................................................................................................... 27
Consolidated Income Statement ........................................................................................................................ 28
Consolidated Balance Sheet .............................................................................................................................. 29
Consolidated Cash Flow Statement ................................................................................................................... 30
Restated data ..................................................................................................................................................... 32
2015 Performance Management Report
Air Liquide - 2015 Results
Page 2 / 34
2015 PERFORMANCE The Group achieved a solid performance, delivering once again an increase in revenue, operating margin and net profit, in the context of slower global growth in 2015. The Group sales for 2015 reached 16,380 million euros, demonstrating a published growth of +6.7% in comparison to 2014, benefiting from a positive +6.0% currency impact, particularly strong in the beginning of the year, and penalized by a negative energy effect of -2.6%. On a comparable basis, the progress was +3.3%, superior to the growth of the market. The growth of the activity in 2015 was principally sustained by dynamic Healthcare, the strong development of Electronics, the ramp-ups of production units in Large Industries notably during the 2nd half of the year, the developing economies and a progressive resumption of growth in Europe. The accrued efforts on costs and efficiencies, which reached a total of 298 million euros, contributed to the increase in the operating margin at 17.6%, representing +10 basis points excluding the energy effect. Net profit (Group level) rose to 1,756 million euros, an increase of +5.5%. Cash flow from operating activities before changes in working capital requirements increased by +7.0% in comparison to 2014 and reached 19.2% of sales. At the same time, the Group pursued its growth initiatives with investment decisions of 2.4 billion euros, a reinforced innovation strategy materialized by the creation of the activity Global Markets & Technologies and the signature of the merger agreement to acquire Airgas in the United States. Once complete, this acquisition will constitute a major step in the development of the Group. The Board of Directors proposed a nominal dividend to be submitted to the combined Annual General Meeting of 12 May 2016 at 2.60 euros per share. This dividend represents an increase of +2.0% for the shareholder and the pay-out ratio is estimated at 52.4%.
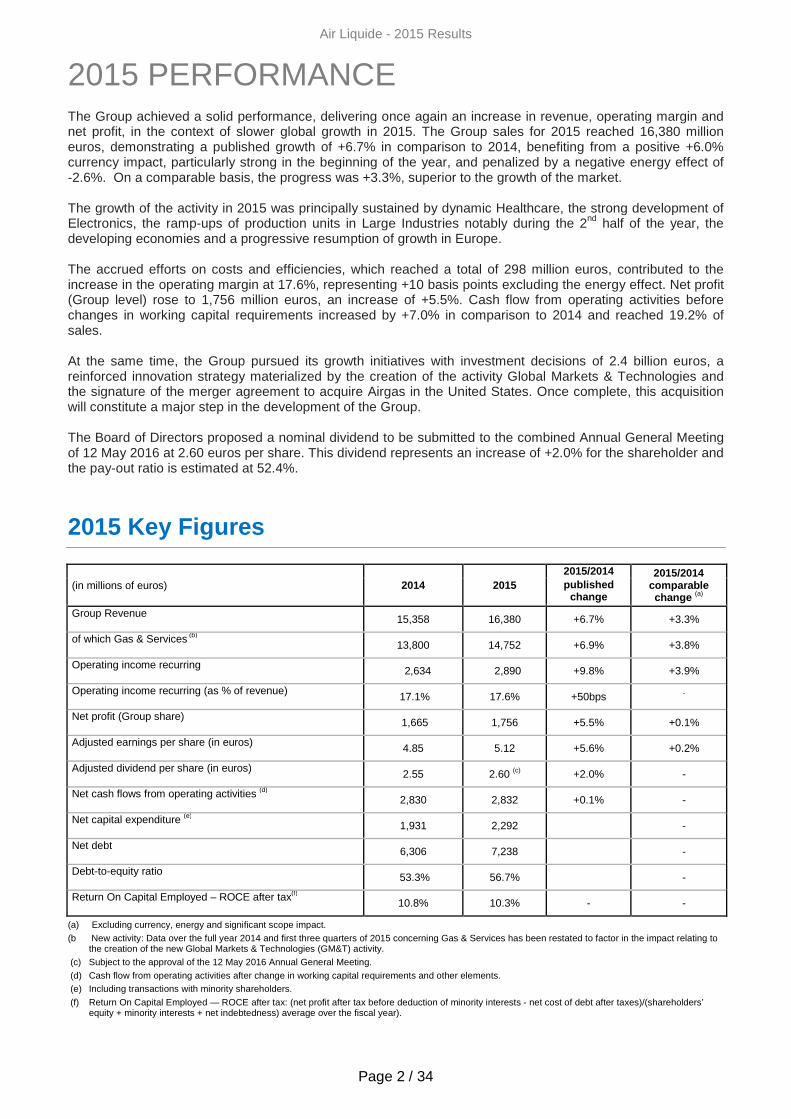
2015 Key Figures
(in millions of euros) 2014 2015 2015/2014 2015/2014
comparable change (a)
published change
Group Revenue 15,358 16,380 +6.7% +3.3%
of which Gas & Services (b)
13,800 14,752 +6.9% +3.8%
Operating income recurring
2,634 2,890 +9.8% +3.9%
Operating income recurring (as % of revenue) 17.1% 17.6% +50bps -
Net profit (Group share) 1,665 1,756 +5.5% +0.1%
Adjusted earnings per share (in euros)
4.85 5.12 +5.6% +0.2%
Adjusted dividend per share (in euros) 2.55 2.60 (c) +2.0% -
Net cash flows from operating activities (d)
2,830 2,832 +0.1% -
Net capital expenditure (e)
1,931 2,292
-
Net debt 6,306 7,238 -
Debt-to-equity ratio 53.3% 56.7% -
Return On Capital Employed – ROCE after tax(f)
10.8% 10.3% - -
(a) Excluding currency, energy and significant scope impact.
(b New activity: Data over the full year 2014 and first three quarters of 2015 concerning Gas & Services has been restated to factor in the impact relating to the creation of the new Global Markets & Technologies (GM&T) activity.
(c) Subject to the approval of the 12 May 2016 Annual General Meeting.
(d) Cash flow from operating activities after change in working capital requirements and other elements. (e) Including transactions with minority shareholders.
(f) Return On Capital Employed — ROCE after tax: (net profit after tax before deduction of minority interests - net cost of debt after taxes)/(shareholders’ equity + minority interests + net indebtedness) average over the fiscal year).

Air Liquide - 2015 Results
Page 3 / 34
Highlights of 2015
DEVELOPMENT OF INDUSTRIAL ACTIVITY
During the course of 2015, new contracts were signed in Large Industries, in developing economies as well as in advanced economies.
• In the United States, in Louisiana, Air Liquide launched the construction of a new Air Separation Unit (ASU) for Yuhuang Chemical. Representing an investment of 170 million US dollars, the unit will be able to produce 2,400 tons of oxygen per day. This ASU will be connected to the Group's extensive pipeline system, providing enhanced reliability of supply. Air Liquide will also license its leading MegaMethanol® technology. This agreement illustrates the value for the customer of a complementary offer combining Group proprietary technologies with long-term oxygen supply.
• Air Liquide signed a long-term contract with Sasol, an international integrated energy and chemicals company, for the supply of industrial gases to the Secunda site in South Africa. Air Liquide will invest around 200 million euros for the construction of the largest Air Separation Unit (ASU) ever built, with a total capacity of 5,000 tons of oxygen per day, a milestone in the history of industrial gas production. The start-up is expected for the end of 2017. It is the first time Sasol will outsource its oxygen needs to a specialist of industrial gas production at its Secunda site.
• In Australia, Air Liquide has launched the construction of an air separation unit (ASU) for Nyrstar, an integrated mining and metals recyling company. Representing an investment of 60 million euros, the unit will produce 1,400 tons of gas per day and its start-up is expected in 2016. The gases supplied will enable Nyrstar to increase its production capabilities, enhance efficiency and reduce the environmental footprint of the site.
• In China, Air Liquide signed new long-term contracts in various industrial sectors:
o with Shandong Fangyuan, China’s leading privately-owned copper smelter and one of the world’s largest copper producers. The Group will invest approximately 60 million euros in an Air Separation Unit (ASU) with a capacity of 2,000 tons of oxygen per day, expected to be commissioned in 2017. The oxygen supplied will boost productivity of the smelter while reducing overall CO2 emissions and maintenance costs.
o with Yan’an Energy and Chemical Co., a subsidiary of Yanchang Petroleum Group, one of the four largest Chinese companies for oil and natural gas exploration and production. The Group will invest approximately 80 million euros in two state-of-the-art Air Separation Units (ASU) with a total capacity of 2,800 tons of oxygen per day, expected to begin operations at the beginning of 2018.
Air Liquide saw some major start-ups in Large Industries during 2015:
• in Saudi Arabia, in Yanbu, its largest industrial site ever. The site has two large-scale hydrogen production units (SMR) and one purification unit for has a total hydrogen capacity of 340,000 Nm³/hour. This investment of more than 350 million euros supplies hydrogen to the new YASREF refinery (a joint venture between Saudi Aramco and Sinopec) under a long-term contract. Hydrogen is used to reduce the sulfur content of the fuel production; and
• in Germany, in Dormagen near Cologne, a new hydrogen and carbon monoxide production unit (SMR). The Group invested approximately 100 million euros in this state-of-the-art production unit with an annual production capacity of 22,000 tons of hydrogen and 120,000 tons of carbon monoxide. It will supply Covestro's new TDI (toluene diisocyanate) production plant. It will also provide other customers on the Rhine-Ruhr pipeline network with hydrogen.
During 2015, new offers were developed by the Industrial Merchant teams:
• For example, a digital portal was put into service in the Nordic countries, dedicated to the small ALbee™ cylinders for the "Craftsmen and Network" market . This on-line sales platform facilitates the everyday life of the end clients who can consult the pricing offer and order their cylinders from the closest distributor.

Air Liquide - 2015 Results
Page 4 / 34
• Another example in the glass industry, integrated in the "Materials and Energy" market where the use of pure oxygen in place of air in the glass melting furnaces allows for the reduction in energy consumption and reduces polluting emissions. During COP21 in 2015, the Group won the Innovative Product Award of the French-China Committee for its high temperature oxy-combustion technology. Compared to air combustion, this new process “Heatox” provides up to 50% energy savings and up to 50% CO2 emissions reduction.
In 2015, in Electronics, Air Liquide signed several long-term contracts with major semi-conductor manufacturers in Japan, Singapore and Taiwan. The Group will invest more than 100 million euros to supply ultra-pure carrier gases to customer plants (fabs) which manufacture integrated circuits and memory for consumer electronics and mobile devices. This market continues to expand, driven notably by the rise of the Internet of Things and “Big Data”.
ACQUISITIONS AND INITIATIVES IN HEALTHCARE
In 2015, Air Liquide continued with its strategy of densification in geographic zones where the Group is already present with additional acquisitions in Home Healthcare.
• In Germany, the Group strengthened its position with the acquisition of Optimal Medical Therapies (OMT). This company provides home healthcare services for around 5,000 patients and is recognized for its expertise in home infusion services which include immunotherapy, pain management, and treatment of pulmonary arterial hypertension and Parkinson’s disease.
• Air Liquide expanded its activity in Ireland with the acquisition of Baywater Healthcare Ireland Limited, a major player specializing in treating and monitoring of respiratory diseases in patients’ homes (oxygen therapy, continuous positive airway pressure and non-invasive ventilation).
Schülke, the Group's Healthcare entity specializing in Hygiene, expanded its presence through two acquisitions this year:
• in the Asia-Pacific zone, Healthcare Antisepsis Solutions (HAS), the skin disinfection and hygiene business unit of Advanced Sterilization Products, a Division of Ethicon, Inc.
• in the Czech Republic, the hygiene division of Bochemie, extending Schülke's presence in Eastern Europe and widening its offer with a range of additional products.
Air Liquide also launched several new Healthcare initiatives in 2015.
• On the occasion of the Annual International Seminar of ERS (European Respiratory Society), Air Liquide Healthcare launched a website entirely dedicated to sleep apnea. As an important player in the treatment of sleep apnea disorder, the Group seeks to better inform patients and help them understand the proposed solutions.
• VitalAire, a Home Healthcare subsidiary of Air Liquide, opened Vital'City, a new patient center, in Paris. With Vital’City, VitalAire is emphasizing its close connections with its patients by offering a new approach to caring for patients, who will now have the option of meeting with VitalAire healthcare workers on site.
NEW PROJECTS IN INNOVATION AND TECHNOLOGIES
The Group continued its developments in Hydrogen mobility.
• Air Liquide was chosen by FM Logistic, an international logistics and supply chain group, to provide support for its projected deployment of hydrogen-powered forklift trucks at their sites. At its logistics platform near Orléans in France, the Group installed a hydrogen-charging station which will service forklifts equipped with hydrogen fuel cell batteries.
• In addition, various investment projects were launched to install new hydrogen charging stations in Belgium, Denmark, France, Germany, the United States and Japan. On the occasion of COP21, Air Liquide installed the first hydrogen-charging station in Paris. This station will enable the deployment of "hype" in Paris, the first fleet of hydrogen-powered electric taxis.
Air Liquide, a major player in energy transition, announced that it had acquired a 5% stake in the capital of Fonroche Biogaz, a subsidiary of the Fonroche Group, a key player in the production of renewable energies. In connection with this acquisition, the two groups plan to pool their skills to develop projects involving the purification and valorization of biogas for the French market.

Air Liquide - 2015 Results
Page 5 / 34
Strengthening Air Liquide's leadership in extreme cryogenics for major scientific projects, the Group announced the signing of a new contract with ITER-India for the design and manufacturing of 19 cryogenic lines. This signature completes two contracts already signed in 2012 and 2013, bringing the total amount signed by Air Liquide for the ITER project to roughly 250 million euros. The latter targets development of an experimental reactor to demonstrate the scientific and technological feasibility of fusion as a new source of energy.
Air Liquide inaugurated Cryocap™ in France, a unique industrial installation which enables the capture of CO2
released during hydrogen production via a cryogenic process. After being purified, the captured CO2 can be used to meet a variety of industrial needs for carbonic gas supply. This innovation is part of Air Liquide’s Blue Hydrogena approach which targets gradual decarbonization of the Group’s production of hydrogen dedicated to energy applications related to mobility.
CONVERTIBLE BOND
To refinance the bonds reaching maturity and fund its development while benefiting from very attractive market conditions, Air Liquide issued bonds for a total amount of 988 million euros as of the date of the issues. Two fixed-rate issues cover maturities between 7 and 10 years and two variable-rates ones between 2 to 3 years. The major issue was made under the EMTN program for an amount of 500 million euros with a 10-year maturity and a coupon of 1.25% p.a.
In addition, one of the issues allowed Air Liquide Finance to innovate again with the issue of its first Chinese renminbi-denominated bond on the Taiwanese market (“Formosa Bond”) for a total of 500 million Chinese renminbi, equivalent to 68 million euros at the date of the issue. Thus, Air Liquide is the first non-Taiwanese corporate to issue bonds in Chinese renminbi on this market.
MAJOR ACQUISITION PROJECT AND GEOGRAPHIC DEVELOPMEN TS
On 17 November 2015, the Group announced the signing of a merger agreement under which Air Liquide will acquire the American company Airgas. This game-changing combination will strengthen Air Liquide’s global leadership, offer new opportunities to Airgas customers and will ideally position the Group for future growth with a stronger presence in the American market, the largest industrial gases market in the world.
The transaction is subject to Airgas shareholders’ approval during a special meeting scheduled on 23 February 2016, receipt of necessary antitrust and other regulatory approvals as well as other customary conditions and provisions. The two parties wish to proceed swiftly.
In addition, during the course of 2015, Air Liquide continued to expand in new regions:
• in Turkey, Air Liquide completed the acquisition of the local subsidiary of the Messer Group. The company, which provides industrial, medical and specialty gases to various industries, counts close to 70 employees. It owns and operates an Air Separation Unit (ASU) for the production of liquid oxygen, nitrogen, and argon, and 3 cylinder-filling centers. Air Liquide is now present in the three most important industrial areas of the country: Ankara, Istanbul and Izmir.
• Air Liquide has expanded its business to Colombia. Through a contract with Coca-Cola FEMSA, the largest bottler of Coca-Cola products in the world and the largest beverage company in Latin America, Air Liquide will build and operate a new facility consisting of a carbon dioxide production unit and a cogeneration unit. This investment of around 40 million euros marks Air Liquide’s entry into the Colombian industrial gas market.
a Blue Hydrogen is an initiative of Air Liquide which aims to gradually lower the carbon content of its hydrogen production dedicated to energy applications related to mobility. Currently, 95% of the hydrogen that the Group produces comes from natural gas. Air Liquide is committed to increasing, by 2020, the percentage of hydrogen produced from carbon-free processes, i.e. sources that emit no CO2, related for these energy applications to mobility.

Air Liquide - 2015 Results
Page 6 / 34
2015 Income Statement
Comparable data: excluding the impact of currency, energy (natural gas and electricity) and significan t scope impact
In addition to the comparison of published figures, financial information is given excluding currency, natural gas and electricity price fluctuations and significant scope impact.
- Since industrial and medical gases are rarely exported, the impact of currency fluctuations on activity levels and results is limited to euro translation impacts with respect to the financial statements of subsidiaries located outside the euro zone.
- In addition, the Group passes on variations in the cost of energy (natural gas and electricity) to its customers via indexed invoicing integrated into medium and long-term contracts. This indexing can lead to significant variations in sales (mainly in the Large Industries Business Line) from one period to another depending on fluctuations in prices on the energy market.
An energy impact is calculated based on the sales of each of the main subsidiaries in Large Industries. Their consolidation allows the determination of the energy impact for the Group as a whole. The foreign exchange rate used is the average annual exchange rate for the year N-1.
Thus, at the subsidiary level, the following formula provides the energy impact, calculated for natural gas and electricity respectively:
Energy impact = Share of sales indexed to energy year (N-1) x (Price of energy year (N) - Price of energy year (N-1))
Offsetting the impact of variations in energy prices against sales allows the Group to analyze changes in revenue on a comparable basis.
- The significant scope effect corresponds to the impact on sales of all acquisitions or disposals of a significant size for the Group.
The main impact on revenue in 2015 was:
(a) Excluding currency, energy, and significant scope impacts.
New activity : Over the full year 2014 and the first three quarters of 2015, data concerning Gas & Services, Industrial Merchant and Engineering and Construction, has been restated to factor in the impact relating to the creation of the new Global Markets & Technologies (GM&T) activity.
Geography : Middle-East and Africa now includes India, previously part of Asia-Pacific. Data over the full year 2014 and the first three quarters of 2015 has been restated accordingly.
(in millions of euros) Group Gas & Services
2015 revenue 16,380 14,752
2015/2014 published change (in %) +6.7% +6,9%
Currency impact 915 830
Natural gas impact -362 -362
Electricity impact -44 -44
Significant scope impact 0 0
2015/2014 comparable change (a) (in %) +3.3% +3.8%

Air Liquide - 2015 Results
Page 7 / 34
REVENUE
Revenue (in millions of euros)
2014 2015 2015/2014 change
2015/2014 comparable change (a)
Gas & Services 13,800 14,752 +6.9% +3.8%
Engineering & Construction 723 775 +7.1% -0.7%
Global Markets &Technologies 256 292 +14.0% +11.4%
Other activities 579 561 -3.1% -6.7%
TOTAL REVENUE 15,358 16,380 +6.7% +3.3%
(a) Excluding currency, energy and significant scope impacts.
New activity: Over the full year 2014 and the first three quarters of 2015, data concerning Gas & Services and Engineering & Construction has been restated to factor in the impact relating to the creation of the new Global Markets & Technologies (GM&T) activity.
Group
In 2015, Group revenue totaled 16,380 million euros , with published growth of +6.7% as compared to 2014, boosted by a +6.0% positive currency impact, particularly strong at the beginning of the year and penalized by a negative -2.6% energy impact. Revenue, on a comparable basis (excluding currency, energy prices and significant scope impacts), increased by +3.3%. There was no significant scope impact in 2015.
The Group created a new activity, Global Markets & Technologies (GM&T) at the end of 2015. It includes innovative activities which leverage on Group's technologies and require a global approach. Certain activities aim at developing existing markets (space, aeronautics, maritime, extreme cryogenics, etc.) and others at opening new markets (hydrogen energy, clean transportation through Bio-NGVs, etc.). GM&T will initially serve as an incubator for these new global activities, as an extension of Air Liquide's current business. In a second step, GM&T will accompany the sales development of these activities based on the Group's global presence.
Revenue by quarter (in millions of euros)
Q1 2015 Q2 2015 Q3 2015 Q4 2015
Gas & Services 3,614 3,688 3,682 3,768
Engineering & Construction 177 205 219 174
Global Markets & Technologies 58 74 67 93
Other activities 144 154 129 134
TOTAL REVENUE 3,993 4,121 4,097 4,169
2015/2014 Group published change +7.0% +9.3% +7.8% +2.9%
2015/2014 Group comparable change (a) +3.0% +3.4% +4.6% +2.4%
2015/2014 Gas & Services comparable change (a) +2.4% +3.5% +4.5% +4.8%
(a) Excluding currency, energy and significant scope impacts.
New activity: Over the full year 2014 and the first three quarters of 2015, data concerning Gas & Services and Engineering & Construction has been restated to factor in the impact relating to the creation of the new Global Markets & Technologies (GM&T) activity.

Air Liquide - 2015 Results
Page 8 / 34
Gas & Services
Unless otherwise stated, all the changes in revenue outlined below are on a comparable basis: excluding currency, energy (natural gas and electricity) and significant scope impacts.
Gas & Services revenue totaled 14,752 million euros , up +3.8% on a comparable basis. Quarterly sales growth improved during the year. Revenue was up +6.9% in published data , supported by a positive currency impact of +6.0%, but penalized by a negative energy impact of -2.9%.
Revenue (in millions of euros)
2014 2015 2015/2014 change
2015/2014 comparable change
(a)
Europe 6,604 6,749 +2.2% +3.4%
Americas 3,384 3,595 +6.2% +0.3%
Asia-Pacific 3,402 3,850 +13.2% +5.7%
Middle-East and Africa 410 558 +36.1% +24.2%
GAS & SERVICES 13,800 14,752 +6.9% +3.8%
Large Industries 4,980 5,201 +4.4% +5.2%
Industrial Merchant 5,016 5,229 +4.3% -1.3%
Healthcare 2,570 2,799 +8.9% +7.5%
Electronics 1,234 1,523 +23.5% +11.5%
(a) Excluding currency, energy and significant scope impacts. New activity: Over the full year 2014 and the first three quarters of 2015, data concerning Gas & Services and Industrial Merchant has been restated to factor in the impact relating to the creation of the new Global Markets & Technologies (GM&T) activity. Geography: Middle-East and Africa now includes India, previously part of Asia-Pacific. Data for full year 2014 and first three quarters of 2015 has been restated accordingly.
Europe
Revenue in Europe totaled 6,749 million euros , progressing +3.4% year-on-year . This growth increased in the 2nd half at +4.8%, in particular driven by Large Industries which benefited from new start-ups. The Industrial Merchant activity posted positive growth in the 2nd half with a slight increase in liquid gas volumes, but a slight decrease in cylinder activity. Healthcare posted dynamic growth.
Europe Gas & Services 2015 Revenue
• Large Industries sales were up +1.9% year-on-year. Growth in the 2nd half was stronger, close to +5%, driven by the ramp-up of the Dormagen CO unit in Germany and new hydrogen units in Benelux. Eastern Europe continued to expand, particularly in Russia and Poland.
• Industrial Merchant revenue, down -0.4% year-on-year, improved steadily and posted positive growth during the 2nd half. Performance remained contrasted, with sales up in Iberia, Benelux and the Nordic countries, and activity down slightly in France and Germany in particular where liquid volumes were up but the cylinder activity remained

Air Liquide - 2015 Results
Page 9 / 34
challenging. Sales continued to improve in developing economies driven by strong growth in liquid volumes, notably in Russia and Poland. The price impact was -0.6% for the year against a backdrop of weak inflation and a drop in prices for clients whose contracts were indexed to energy costs.
• Healthcare continued its dynamic growth, up +8.4%, driven by an increase in the number of patients treated in Home Healthcare and by acquisitions carried out during the year in Germany, France, Ireland and the Czech Republic. Pricing pressure continued to affect sales in the Medical gases for hospitals and Home Healthcare. The Hygiene activity progressed by +17.1%, the strong organic growth being assisted by acquisitions.
• Electronics revenue increased by +11.5% year-on-year, resulting from sales of equipment and installation, specialty gases and advanced materials.
Americas
Gas & Services revenue in the Americas amounted to 3,595 million euros , an increase of +0.3%. While sales declined slightly in advanced economies, they continued to grow in South America +11.7%. Large Industries sales were up +2.6%. This growth accelerated in the 2nd half reaching +4.7%. This increase was partially offset by a weak Industrial Merchant business, impacted by the slowdown in the oil well services sector and related industries. Electronics sales growth was not as strong as in 2014 (high comparable basis, particularly in equipment and installation). Healthcare sales posted dynamic growth, in particular in Home Healthcare.
Americas Gas & Services 2015 Revenue
• Despite temporary turnarounds at customer sites during the first quarter, Large Industries sales improved by +2.6% over the year. In South America, activity continued to grow with the ramp-ups of units which started-up in 2014, notably in Brazil.
• Industrial Merchant activity declined -3.6%. In North America, liquid volumes, nitrogen in particular, continued to be affected by the slowdown in the oil well services sector and related industries. Cylinder activity, serving mainly craftsmen and small customers, was also impacted, notably in Canada. Business slowed in Brazil, where the environment was challenging. The price impact in the zone was +4.0% year-on-year.
• Healthcare revenue increased by +7.1%. The activity was particularly strong in Canada which benefited from the integration of several acquisitions in Home Healthcare. In South America, the number of Home Healthcare patients and volumes for Medical gases for hospitals rose sharply.
• Electronics sales were up +2.6% in 2015. Growth was strong in carrier gases, specialty gases, and services and remained very dynamic in advanced materials. Equipment and installation sales were fairly weak compared with the very high level seen in 2014.
Air Liquide - 2015 Results
Page 10 / 34
Asia-Pacific
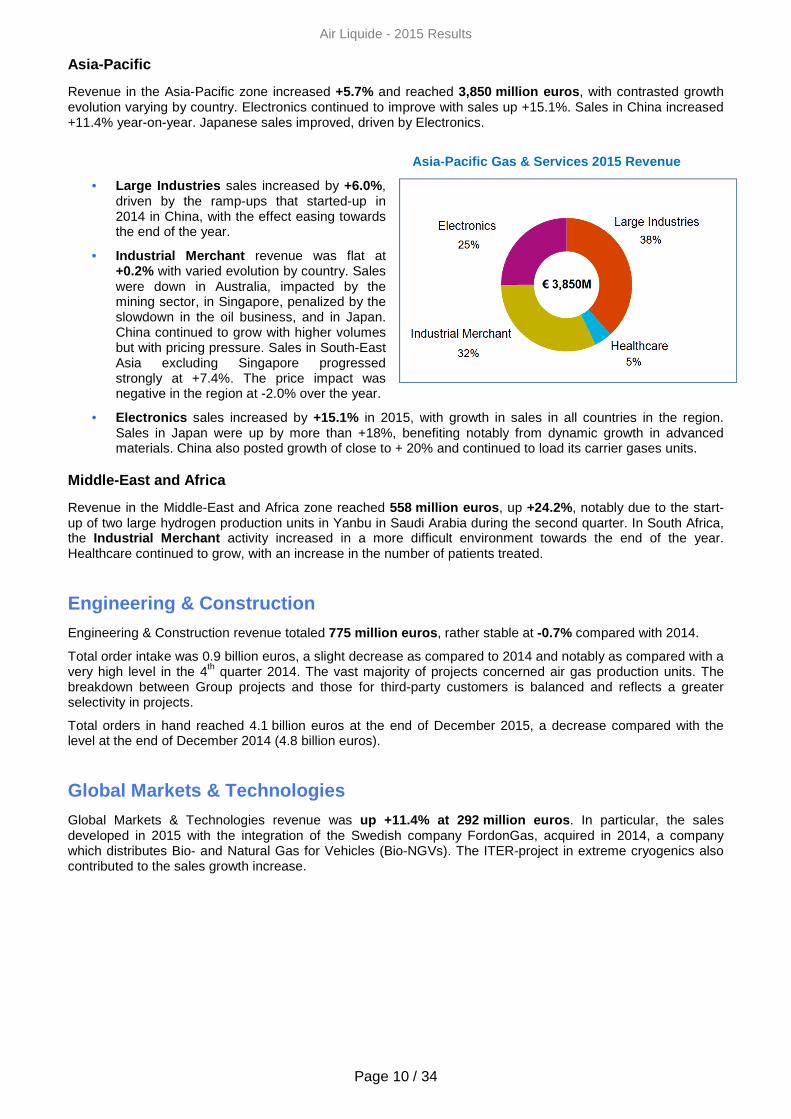
Revenue in the Asia-Pacific zone increased +5.7% and reached 3,850 million euros , with contrasted growth evolution varying by country. Electronics continued to improve with sales up +15.1%. Sales in China increased +11.4% year-on-year. Japanese sales improved, driven by Electronics.
Asia-Pacific Gas & Services 2015 Revenue
• Large Industries sales increased by +6.0%, driven by the ramp-ups that started-up in 2014 in China, with the effect easing towards the end of the year.
• Industrial Merchant revenue was flat at +0.2% with varied evolution by country. Sales were down in Australia, impacted by the mining sector, in Singapore, penalized by the slowdown in the oil business, and in Japan. China continued to grow with higher volumes but with pricing pressure. Sales in South-East Asia excluding Singapore progressed strongly at +7.4%. The price impact was negative in the region at -2.0% over the year.
• Electronics sales increased by +15.1% in 2015, with growth in sales in all countries in the region. Sales in Japan were up by more than +18%, benefiting notably from dynamic growth in advanced materials. China also posted growth of close to + 20% and continued to load its carrier gases units.
Middle-East and Africa
Revenue in the Middle-East and Africa zone reached 558 million euros , up +24.2%, notably due to the start-up of two large hydrogen production units in Yanbu in Saudi Arabia during the second quarter. In South Africa, the Industrial Merchant activity increased in a more difficult environment towards the end of the year. Healthcare continued to grow, with an increase in the number of patients treated.
Engineering & Construction Engineering & Construction revenue totaled 775 million euros , rather stable at -0.7% compared with 2014.
Total order intake was 0.9 billion euros, a slight decrease as compared to 2014 and notably as compared with a very high level in the 4th quarter 2014. The vast majority of projects concerned air gas production units. The breakdown between Group projects and those for third-party customers is balanced and reflects a greater selectivity in projects.
Total orders in hand reached 4.1 billion euros at the end of December 2015, a decrease compared with the level at the end of December 2014 (4.8 billion euros).
Global Markets & Technologies Global Markets & Technologies revenue was up +11.4% at 292 million euros . In particular, the sales developed in 2015 with the integration of the Swedish company FordonGas, acquired in 2014, a company which distributes Bio- and Natural Gas for Vehicles (Bio-NGVs). The ITER-project in extreme cryogenics also contributed to the sales growth increase.

Air Liquide - 2015 Results
Page 11 / 34
Other activities
Revenue (in millions of euros)
2014 2015 2015/2014 change 2015/2014 comparable change (a)
Welding 392 363 -7.5% -8.5%
Diving 187 198 +6.3% -2.9%
TOTAL 579 561 -3.1% -6.7%
(a) Excluding currency, energy and significant scope impacts.
Other Activities revenue declined by -6.7% to 561 million euros in 2015.
Welding revenue decreased by -8.5%, still impacted by a difficult environment.
Diving (Aqua LungTM), with strong growth on a published basis, recorded a drop of -2.9% in sales on a comparable basis due to the disposal of a non-strategic activity at the end of 2014. Excluding this disposal, sales were up.

Air Liquide - 2015 Results
Page 12 / 34
OPERATING INCOME RECURRING
Operating income recurring before depreciation and amortization totaled 4,262 million euros, up +10.1% as published and up +4.0% excluding the currency impact. It benefited from a globally positive pricing effect over the period, at +0.3%, and from a high level of efficiencies.
For the year, efficiencies amounted to 298 million euros , exceeding the annual target of more than 250 million euros. These efficiencies represent a cost savings of 2.4%. Half of this amount corresponds to the logistics and industrial gains: particularly in terms of optimization of the operation of production units connected to the pipeline networks, improvement of plant reliability, and review of the supply deliveries within the context of lower consumption for Industrial Merchant customers. Purchasing efficiencies represent a third of the overall total efficiencies. For example, the start-up of the hydrogen/CO production unit in Dormagen allowed for the pipeline network to be supplied with hydrogen, replacing external purchases. The valuation of the gains on energy purchasing was weaker in 2015 due to low energy prices. The remaining efficiencies include the effects of the realignment plans decided in 2013 and 2014 and which contributed 43 million euros of additional gains in 2015 and 181 million euros of cumulative gains, thus a return on investment of approximately two years.
Depreciation and amortization totaled 1,372 million euros , up +4.1% excluding the currency impact (+10.7% as published), reflecting the additional growth of the start-up of major production units during the year.
Group operating income recurring (OIR) reached 2,890 million euros in 2015 , an increase of +9.8% over 2014, or +3.9% excluding the currency impact, showing a positive leverage to revenues. Operating margin (OIR to revenue) was up +50 basis points to 17.6% benefiting from a high level of efficiencies and a positive energy impact. Excluding the energy impact, the operating margin was up +10 basis points .
Gas & Services
Operating income recurring in the Gas & Services activity amounted to 2,960 million euros , an increase of +9.7% compared with the 2014 Gas & Services results restated for the creation of the new activity GM&T. The OIR margin stood at 20.1%, compared to 19.5% in 2014. Excluding the energy impact, the operating margin remained stable .
Increase in costs, excluding energy, was +3.1% in 2015. Prices continue to rise by +0.3% in a context of low inflation, due to continuing efforts in Industrial Merchant (+0.6 %) and despite continuing pricing pressure in Healthcare (-1.3%). Furthermore, efficiencies totaled 266 million euros. A portion was absorbed to offset the difference between cost inflation and rising prices. The remaining efficiencies, i.e. retention, helped improve the margin. The retention rate was 11% for the year.
Gas & Services 2015 operating income recurring
Gas & Services Operating margin (a) 2014 2015
Europe 19.9% 19.6%
Americas 22.6% 23.5%
Asia-Pacific 16.3% 18.2%
Middle-East and Africa 15.0% 15.9%
TOTAL 19.5% 20.1%
(a) Operating income recurring/revenue, as published.
New activity: Data over the full year 2014 and the first three quarters of 2015 concerning Gas & Services has been restated to factor in the impact relating to the creation of the new Global Markets & Technologies (GM&T) activity. Geography: Middle-East and Africa now includes India, previously part of Asia-Pacific. Data over the full year 2014 and the first three quarters of 2015 has been restated accordingly.

Air Liquide - 2015 Results
Page 13 / 34
Operating income recurring in Europe reached 1,326 million euros , an increase of +0.8% compared with 2014. Excluding the energy impact, the operating margin was down -50 basis points at 19.4%. It benefited from efficiencies generated from all the activities and also from the contribution of the realignment plans decided in 2013. However, it was negatively impacted by the Healthcare pricing pressures and by the impact of an unfavorable comparison linked to the reduction in exceptional charges in 2014 following regulatory changes in pension plans in France and the Netherlands.
Operating income recurring in the Americas amounted to 843 million euros , up +10.1%. The operating margin, excluding the energy impact and despite a decrease of -50 basis points , remained nonetheless at a high level of 22.1%. It was affected by the low volumes in Industrial Merchant, and only partially offset by the increase in price and the realized efficiencies.
Operating income recurring in the Asia-Pacific zone of 702 million euros increased a significant +26.6%. The operating margin, excluding the energy effect, was up +130 basis points. In particular, it benefited from ramp-ups, the development of the Industrial Merchant business in China and from the Electronics business in the region, as well as from the realized efficiencies.
Operating income recurring for Middle-East and Africa amounted to 89 million euros , a significant growth of +44.2%. The operating margin, excluding the energy impact, was up +90 basis points, driven by the start-up of two major hydrogen production units in Yanbu, Saudi Arabia during the 2nd quarter.
Engineering & Construction
Operating income recurring for Engineering & Construction was 68 million euros and 8.7% as a percentage of revenue, remaining in line with the Group’s target range of between 5% and 10%.
Global Markets & Technologies Operating income recurring for Global Markets & Technologies was 36 million euros and the operating margin was 12.5%, down from previous year as 2014 had included an exceptional gain.
Other activities
The Group's Other activities posted operating income recurring of 34 million euros, a decrease of -3.4% and the operating margin remained stable at 6.1%. The negative impact on the margin from the volume reductions in the Welding business was offset by the efficiencies generated, particularly by the contribution of the realignment plans over the last three years.
Research & Development and corporate costs
Research & Development (R&D) and corporate costs included consolidation adjustments and reached a total of 207 million euros , a decrease of -13.8%. The expenses of R&D and corporate costs are globally stable; the consolidation adjustments explain the 2015 variation. The development costs of the GM&T and E&C activities have been integrated in the R&D expenses in 2015 and the retreated amounts for 2014.

Air Liquide - 2015 Results
Page 14 / 34
NET PROFIT
Other operating income and expenses showed a negative balance of -132 million euros compared to a positive balance of +16 million euros in 2014. This amount includes -124 million euros of exceptional impact from an Engineering & Construction project in Canada and -13 million euros of Airgas acquisition costs.
The financial expenses of -268 million euros were +6.9% higher than the expenses of -251 million euros in 2014.
The cost of net indebtedness , down slightly by -0.8%, reflects a combination of the average cost of net debt down 30 basis points at 3.7% and an increased level of average net debt over the year, notably due to an acceleration in bolt-on acquisitions.
Other financial income and expenses increased to -40.9 million compared with -21.7 million in 2014. The amount for 2014 includes the impact of an exceptional item relating to the partial disposal of a financial stake in a start-up.
Taxes totaled 666 million euros, down -1.8%. The effective tax rate was 26.8%, lower than the 2014 rate (28.3%). This rate is due notably to a tax gain resulting from the favorable evolution of tax audits.
The share of profit of associates contributed 14.7 million euros , a sharp increase compared with 4.0 million euros in 2014. The progression of the results was due to the increase in profit at several entities. Minority interests also rose by +37.6% to reach 82.3 million euros , mainly due to the ramp-up of the large hydrogen units in Yanbu, Saudi Arabia.
Overall, net profit (Group share) amounted to 1,756 million euros in 2015, up +5.5% , and +10.7% restated with the exceptional impact on an Engineering & Construction project in Canada.
Net earnings per share were 5.12 euros, up +5.6% compared with 4.85 euros per share in 2014. The average number of outstanding shares used for the calculation of net earnings per share as of December 31, 2015 was 342,816,961.
Change in the number of shares
2014 2015
Average number of outstanding shares (a) 343,214,086 342,816,961
(a) Used to calculate earnings per share and adjusted for free share attribution on 2 June 2014.
Number of shares as of 31 December 2014 344,872,883
Options exercised during the year 790,118
Cancellation of treasury shares (1,500,000)
NUMBER OF SHARES AS OF 31 DECEMBER 2015 344,163,001
DIVIDEND
At the Annual General Meeting on 12 May 2016, the payment of a dividend of 2.60 euros per share will be proposed to shareholders for fiscal year 2015, which represents an increase of +2.0%. Total estimated pay-out taking into account share buybacks and cancellations will amount to 920 million euros, representing a pay-out ratio of 52.4%.
The ex-dividend date is scheduled for 23 May 2016 and the payment is scheduled for 25 May 2016.

Air Liquide - 2015 Results
Page 15 / 34
2015 Cash Flow and Balance Sheet
(in millions of euros) 2014 2015
Cash flow from operating activities before change i n working capital 2,943 3,149
Change in working capital requirements 74 (258)
Other items (187) (59)
Net cash flow from operating activities 2,830 2,832
Dividends (885) (975)
Purchases of property, plant and equipment and intangible assets, net of disposals (a) (1,931) (2,292)
Increase in share capital 60 86
Purchase of treasury shares (116) (178)
Other (202) (405)
Change in net indebtedness (244) (932)
Net indebtedness as of December 31 (6,306) (7,239)
Debt-to-equity ratio as of December 31 53% 57%
(a) Including transactions with minority shareholders.
NET CASH FLOW FROM OPERATING ACTIVITIES
Cash flow from operating activities before changes in working capital requirements amounted to 3,149 million euros, up +7.0% compared with the previous year.
Net cash from operating activities after changes in working capital requirements amounted to 2,832 million euros, and was stable (+0.1%) as compared with 2,830 million in 2014.
CHANGES IN WORKING CAPITAL REQUIREMENTS
The working capital requirements (WCR) increased by 258 million euros in 2015. This performance was penalized by a currency impact of 39 million euros. The majority of the increase of the WCR is due to higher tax receivables of 138 million euros. The progression of operating WCR was limited to 120 million euros, primarily due to the temporary increase in receivables in North America due to the implementation of a new ERP.
The working capital requirements stood at 7.7% of revenue, 7.5% excluding the currency impact, an increase compared with the ratio of 6.8% in 2014.
Air Liquide - 2015 Results
Page 16 / 34
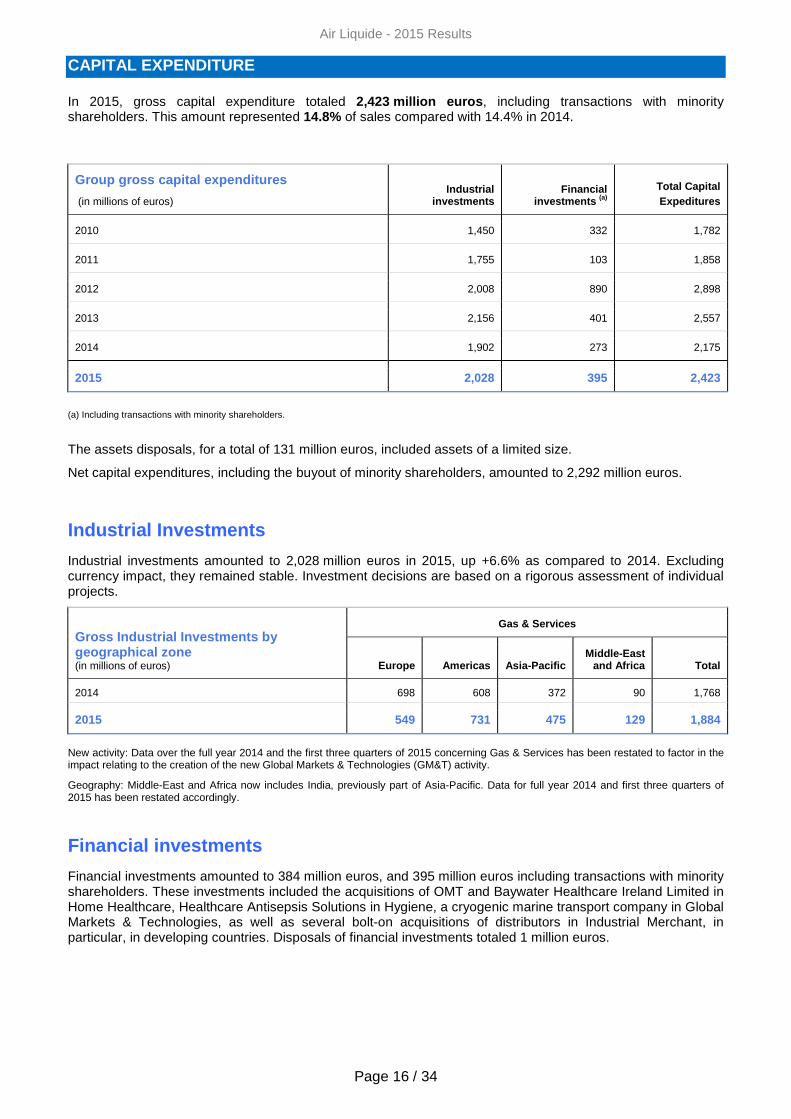
CAPITAL EXPENDITURE
In 2015, gross capital expenditure totaled 2,423 million euros , including transactions with minority shareholders. This amount represented 14.8% of sales compared with 14.4% in 2014.
Group gross capital expenditure s
(in millions of euros) Industrial
investments Financial
investments (a) Total Capital Expeditures
2010 1,450 332 1,782
2011 1,755 103 1,858
2012 2,008 890 2,898
2013 2,156 401 2,557
2014 1,902 273 2,175
2015 2,028 395 2,423
(a) Including transactions with minority shareholders.
The assets disposals, for a total of 131 million euros, included assets of a limited size.
Net capital expenditures, including the buyout of minority shareholders, amounted to 2,292 million euros.
Industrial Investments
Industrial investments amounted to 2,028 million euros in 2015, up +6.6% as compared to 2014. Excluding currency impact, they remained stable. Investment decisions are based on a rigorous assessment of individual projects.
Gross Industrial Investments by geographical zone (in millions of euros)
Gas & Services
Europe Americas Asia-Pacific Middle-East
and Africa Total
2014 698 608 372 90 1,768
2015 549 731 475 129 1,884
New activity: Data over the full year 2014 and the first three quarters of 2015 concerning Gas & Services has been restated to factor in the impact relating to the creation of the new Global Markets & Technologies (GM&T) activity.
Geography: Middle-East and Africa now includes India, previously part of Asia-Pacific. Data for full year 2014 and first three quarters of 2015 has been restated accordingly.
Financial investments
Financial investments amounted to 384 million euros, and 395 million euros including transactions with minority shareholders. These investments included the acquisitions of OMT and Baywater Healthcare Ireland Limited in Home Healthcare, Healthcare Antisepsis Solutions in Hygiene, a cryogenic marine transport company in Global Markets & Technologies, as well as several bolt-on acquisitions of distributors in Industrial Merchant, in particular, in developing countries. Disposals of financial investments totaled 1 million euros.
Air Liquide - 2015 Results
Page 17 / 34
NET INDEBTEDNESS
Net indebtedness at 31 December 2015 stood at 7,239 million euros , up 933 million euros compared with the end of 2014, penalized by a negative currency impact of 306 million euros. The variation compared with 2014 is also due to an increase in change in working capital requirements, higher financial acquisitions net of disposals and an exceptional impact linked to an Engineering & Construction project in Canada.
The debt-to-equity ratio remained moderate at 57%.
ROCE
The return on capital employed after tax was 10.3% versus 10.8% at the end of 2014, negatively affected by the exceptional impact on an Engineering & Construction project in Canada. Excluding this impact, adjusted ROCE was stable at 10.8%.
In addition, value creation , reflected by the difference between return on capital employed and the average cost of capital, reached 500 basis points at the end of 2015.

Air Liquide - 2015 Results
Page 18 / 34
INVESTMENT CYCLE AND FINANCING STRATEGY The Group’s steady long-term growth is largely due to its ability to invest in new projects each year. Industrial gas investment projects are widespread throughout the world, highly capital intensive and supported by long-term contracts, notably for Large Industries. Air Liquide has thus tailored its financing strategy to the nature of its projects, based on the diversification of funding sources, the prudent management of the balance sheet and innovative financing sourcing. This financing strategy is fundamental for the Group’s continued development.
Investments INVESTMENT OPPORTUNITIES
As of 31 December, 2015, the 12-month portfolio of opportunities totaled 2.6 billion euros , down 600 million euros compared to year end 2014. This evolution is due to a high level of new investment decisions in 2015 which exited the portfolio of opportunities. Other exits, such as abandoned or delayed projects, are currently in line with the usual changes observed. The number of new opportunities is slightly down.
Developing economies represented 54% of the portfolio, a decline compared with the breakdown as of 31 December 2014. The projects were spread over the Group's four geographic regions. The share of projects in Asia remained the highest, even if it declined notably following decisions taken in the 4th quarter. The share of projects in North America and Europe were equal.
The portfolio of opportunities now includes a majority of investments inferior to 50 million euros.
INVESTMENT DECISIONS AND INVESTMENT BACKLOG
Investment decisions
(in billions of euros)
Industrial investment
decisions Financial investment
decisions (acquisitions) Total investment
decisions
2011 1.9 0.1 2.0
2012 2.0 0.9 2.9
2013 2.2 0.5 2.7
2014 1.9 0.2 2.1
2015 1.9 0.5 2.4
In 2015, industrial and financial investment decisions taken by the Group reached 2.4 billion euros. Three-quarters of these decisions relate to growth projects.
Industrial investment decisions in 2015 were stable compared with 2014. Large Industries represented approximately one-third of investment decisions, with Industrial Merchant accounting for a quarter and Healthcare for approximately one-fifth. Electronics, Global Markets & Technologies and Other activities accounted for the remainder.
Industrial decisions were spread across all regions. The share of decisions in Middle-East and Africa increased, in particular due to the signing of the Sasol project in South Africa.
Financial investment decisions reached some 500 million euros in 2015, an increase of 300 million euros as compared with 2014. These are in line with financial capital expenditure and include the acquisitions of OMT and Baywater Healthcare Ireland Limited in Home Healthcare, Healthcare Antisepsis Solutions in Hygiene, a cryogenic marine transport company in Global Markets & Technologies, as well as several bolt-on acquisitions of distributors in Industrial Merchant in particular in developing countries.

Air Liquide - 2015 Results
Page 19 / 34
The total investment backlog amounted to 2.3 billion euros, a decrease compared with the end of 2014. This reduction is due, in part, to the impact of major start-ups during the year with the large hydrogen production units in Yanbu, Saudi Arabia and Dormagen, Germany. The investment backlog should lead to a future contribution to revenue of approximately 1 billion euros per year after full ramp-ups.
START-UPS
In 2015, 19 units were commissioned, a similar level to that seen in 2014. The year saw in particular the start-up of the largest hydrogen production site in Yanbu, Saudi Arabia, increasing the Group's hydrogen production capacity by +25%.
The start-ups of 2015 were mainly located in developing economies (Saudi Arabia, China). Many of the start-ups were air gas production units for the chemicals and energy conversion markets. Several of the start-ups in the Asia-Pacific zone were units for the Electronics activity.

Air Liquide - 2015 Results
Page 20 / 34
Financing Strategy
The Group’s financing strategy is regularly reviewed to provide support to the Group’s development and take into account changes in financial market conditions, while respecting a credit profile aligned with Standard & Poor’s long term-minimum “A” rating and two short term "A2/P2" ratings. This credit profile depends on key ratios such as net debt to equity and cash flow from operations before change in working capital requirements to net debt.
Air Liquide's "A+" rating was placed on negative watch by Standard & Poor's on 20 November 2015, following the announcement of the signing of the merger agreement with US company Airgas. In its press release, Standard & Poor's expects, as the most likely scenario, to downgrade the long-term rating to "A-".
In 2015, the existing principles of prudence were maintained:
- diversifying financing sources and debt maturities in order to minimize refinancing risk;
- backing commercial paper issues with confirmed credit facilities;
- hedging interest rate risk to ensure visibility of funding costs, in line with long-term investment decisions;
- funding investments in the currency of the operating cash flows, to ensure a natural currency hedging;
- a permanent centralization of funding and excess cash through Air Liquide Finance, a wholly owned entity of L’Air Liquide S.A.
DIVERSIFYING FUNDING SOURCES
Air Liquide diversifies its financing sources by accessing various debt markets: commercial paper, bonds and banks, and asset securitization.
Air Liquide uses the short-term commercial paper market: in France, through two French Commercial Paper programs allows up to an outstanding maximum of 3 billion euros; and in the United States through a US Commercial Paper program (USCP) allows up to an outstanding maximum of 1.5 billion US dollars.
Air Liquide also has a Euro Medium Term Notes (EMTN) program to issue long-term bonds of up to an outstanding maximum amount of 9 billion euros. At the end of 2015, outstanding bonds issued under this program amounted to 5.1 billion euros (nominal amount). The Group’s EMTN program allows, in particular, for bonds to be issued in the primary currencies (euro, US dollar, Japanese yen) as well as in other currencies (Chinese renminbi, Swiss franc, pound sterling and ruble).
Thus, in 2015, the Group conducted four bond issues under its EMTN program – two public issues for a total amount of 571 million euros and two through private placement issues for a total of 420 million euros, in order to finance its investments.
As of 31 December 2015, the funding via capital markets accounts for more than 80% of the Group’s total gross debt, with an amount of bonds outstanding of 6.1 billion euros across all programs and 0.9 billion euros of commercial paper.
The Group also raises funds through bank debt (loans and credit facilities).
To avoid liquidity risk relating to the renewal of funding at maturity, and in accordance with the Group’s internal policy, the Group aims to limit its short-term debt maturities to 2.6 billion euros, an amount which is covered by committed credit facilities. At 31 December 2015, the amount of debt maturing in 2016 was equal to 1.9 billion euros.
In addition, the Group has a 1.3 billion euro syndicated credit facility reaching maturity in November 2020 after the exercise of both one-year extension options.
At 31 December 2015 the total amount of undrawn committed syndicated and bilateral credit facilities was 2.57 billion euros.
In December 2015, following the merger agreement with Airgas, Air Liquide signed a bridge loan of 12 billion US dollars, and intends to refinance through a capital increase of between 3 and 4 billion euros, with retention of preferential subscription rights, and long-term bond issues in US dollars and euros.

Air Liquide - 2015 Results
Page 21 / 34
Net indebtedness by currency
2014 2015
Euro 25 % 24 %
US dollar 40 % 44 %
Japanese yen 11 % 9 %
Chinese renminbi 14 % 12 %
Other 10 % 11 %
TOTAL 100 % 100 %
Investments are essentially funded in the currency in which the cash flows are generated, creating a natural currency hedge. Thus, Air Liquide’s debt is mainly in euro, US dollar, Japanese yen and Chinese renminbi, which reflects the significant weight of these currencies in the Group’s investments and cash flow.
The breakdown of debt by currency was impacted by the depreciation of the euro, at the end of the year, and the increase in debt. The share of the Group net indebtedness denominated in US dollars increased markedly due to the combined effect of the currency impact and the funding of industrial investments in the dollar area. Indebtedness denominated in Japanese yen and Chinese renminbi was stable, and the share denominated in euro decreased.
CENTRALIZATION OF FUNDING AND EXCESS CASH
To benefit from economies of scale and facilitate capital markets financing (bonds and commercial paper), the Group uses a dedicated subsidiary, Air Liquide Finance. At 31 December 2015, this subsidiary centralized the vast majority of the Group’s financing transactions. This centralization continued in 2015, notably for the financing of investments in the Asia-Pacific and the Americas zones. It also hedges currency, interest rate and energy risk for the Group’s subsidiaries in those countries where it is permitted by law.
In the countries where it is permitted by law, Air Liquide Finance also centralizes cash flow balances through direct or indirect daily cashpooling of these outstandings or through term loans. When this is not possible, there are nonetheless domestic cashpoolings, allowing periodic intercompany loans to Air Liquide Finance. In 2015, Air Liquide became the first French company to include the Chinese renminbi in its daily cashpooling in Europe.
As of 31 December 2015, Air Liquide Finance had granted, directly or indirectly, the equivalent of 10.2 billion euros in loans and received 4.2 billion euros in excess cash as deposits. These transactions were denominated in 24 currencies (primarily the euro, US dollar, Japanese yen, Chinese renminbi, pound sterling, Swiss franc, Singaporean dollar and Brazilian real) and extended to approximately 240 subsidiaries.
The matching by currency within Air Liquide Finance, resulting from the currency hedging of intra-group loans and borrowings, do not generate foreign exchange risk for the Group.
Furthermore, the purpose of the European Market Infrastructure Regulation (EMIR) covering OTC (“Over the Counter”) derivatives is to improve the transparency of OTC markets and reduce the systemic risk of financial markets. It applies to all derivative transactions carried out by European Union entities.
Pursuant to this regulation which came into force in August 2012, Air Liquide Finance S.A., the Group’s centralizing entity for financial transactions continues to be classified as a non-financial counterparty (NFC-), since the transactions were still below the clearing thresholds at the year-end 2015. Its obligations consist thus too apply risk mitigation measures and report all its derivative transactions to the chosen trade repository, "DTCC", in accordance with the technical standards published by ESMA. The mandatory reporting arising from the 2010 Dodd Frank Act of the US is also centralized via the "DTCC".
Furthermore, in certain specific cases (e.g. regulatory constraints, high country risk, joint ventures), the Group limits its risk by setting up specific finance in the local banking market, and by using credit-risk insurance.

Air Liquide - 2015 Results
Page 22 / 34
DEBT MATURITY AND SCHEDULE
To minimize the refinancing risk related to debt maturity schedules, the Group diversifies financing sources and spreads maturities over several years. This refinancing risk is also reduced by the regularity of the cash flow generated from Group activities.
The average of the Group’s debt maturity is 5.0 years, at 31 December 2015.
The following chart represents the Group’s debt maturity schedule. The single largest annual maturity represents approximately 23% of gross debt.
Debt maturity schedule (in millions of euros)
CHANGE IN NET INDEBTEDNESS
Net indebtedness at 31 December 2015 stood at 7,239 million euros, up 933 million euros compared with the end of 2014, affected by a negative currency impact of 306 million euros. The variation compared with 2014 is also due to an increase in change in working capital requirements, higher financial acquisitions net of disposals and an exceptional impact on an Engineering & Construction project in Canada.
Net indebtedness as of December 31
The net debt-to-equity ratio remained moderate at 57% at the end of 2015 (compared with 53% at the end of 2014). This evolution is due to continued Group investments to ensure its future growth, the increase in working capital requirements generated by a temporary rise in taxes and receivables in North America following the implementation of a new ERP. Finally, the currency impact was also unfavorable. The equivalent ratio calculated using the US method: net indebtedness/(net indebtedness + shareholder’s equity) reached 36% at the end of 2015, compared to 35% at the end of 2014. The financial expenses coverage ratio (operating income + share of profit of associates)/(net finance costs) stood at 12.2 in 2015 compared with 11.6 in 2014.
The average cost of gross indebtedness was down in 2015, due to the reduction in financial expenses on long-term bond issues and the increasing use of funding by commercial paper.
553.0
762.4
736.0
557.4
498.3
500.7
563.3
306.3
668.1
477.2
464.8
476.4
193.3
131.4
109.2
68.6
47.9
45.9
37.7
36.7
27.3
0.7
443.0 434.8
0 200 400 600 800 1 000 1 200 1 400 1 600 1 800 2 000
2016
2017
2018
2019
2020
2021
2022
2023
2024
2025
>2025
Bonds and private placements Bank debt and finance leases Commercial paper US Commercial paper
4.89
1
5.03
9
5.24
8
6.10
3 6.06
2
6.30
6 7.23
9
63% 55%53%
58%56% 53%
57%
0%
20%
40%
60%
80%
100%
0
1 000
2 000
3 000
4 000
5 000
6 000
7 000
8 000
2009 2010 2011 2012 2013 2014 2015
Net indebtness (M€) Net indebtness/equity ratio (in%)

Air Liquide - 2015 Results
Page 23 / 34
The average cost of net indebtedness was 3.7% in 2015, also down compared with 2014 (4.0%). Cost of net indebtedness is calculated by dividing net finance costs for the fiscal year (290.0 million euros in 2015, excluding capitalized interest) by the year’s average outstanding net indebtedness.
BANK GUARANTEES
In connection with its Engineering & Construction activity, the subsidiaries of the Group sometimes grant bank guarantees to customers, during the tender period (bid bond), and after contract award, during contract execution until the end of the warranty period (advance payment bond, retention bond, performance bond, and warranty bond).
The most common bank guarantees extended to customers to secure the contractual performance are advance payment guarantees and performance guarantees.
The projects, for which these guarantees are granted, are regularly reviewed by Management and, accordingly, when guarantee payment calls become probable, the necessary provisions are recorded in the consolidated financial statements.

Air Liquide - 2015 Results
Page 24 / 34
OUTLOOK The Group achieved a solid performance, delivering once again an increase in revenue, operating margin and net profit, in the context of slower global growth in 2015. Growth in Gas & Services sales improved quarter after quarter.
Business growth was driven by momentum in Healthcare and Electronics, and in Large Industries by higher volumes from new contracts. From a geographic perspective, it was driven by Europe’s progressive recovery and by the developing economies.
Europe benefited from the good development in Healthcare and an improvement in certain industrial sectors in the 2nd half of the year. In North America, the year was marked by a slowdown in sectors related to oil and gas production and metal fabrication. The progression in activity observed in Asia-Pacific was driven by Japan’s resilience and the persistence of sustained growth in China.
Globally, the Group delivered growth above that of its market, in a context of favorable exchange rates, which positive effect slowed down during the year, and decreased energy prices.
Over the year, as a result of efficiencies close to € 300 million and investment decisions totaling € 2.4 billion, the Group improved its competitiveness and sustained its future growth. At the same time, the signature of the merger agreement to acquire Airgas in the United States and the rollout of an innovation strategy, reinforced by the creation of the Global Markets & Technologies activity, mark major steps in the Group’s development and transformation.
Excluding the impact of Airgas acquisition and financing, and assuming a comparable environment, Air Liquide is confident in its ability to deliver another year of net profit growth in 2016.

Air Liquide - 2015 Results
Page 25 / 34
4th Quarter 2015 Revenue
By Geography
By World Business Line
Revenue In millions of euros
Q4 2014 Q4 2015 Published Change
Comparable change (a)
Large Industries 1,270 1,324 +4.2% +9.3%
Industrial Merchant 1,305 1,314 +0.7% -2.1%
Electronics 348 405 +16.5% +7.5%
Healthcare 669 725 +8.3% +8.3%
Gas and Services Revenue 3,592 3,768 +4.9% +4.8%
(a) Excluding currency, energy and significant scope impacts.
New activity: Data concerning full year 2014 and first three quarters of 2015 for Gas & Services, Industrial Merchant and Engineering & Construction has been restated to factor in the impact relating to the creation of the new Global Markets & Technologies (GM&T) activity.
Geography: Middle East and Africa now includes India, previously part of Asia-Pacific. Data concerning full year 2014 and first three quarters of 2015 has been restated accordingly.
Revenue In millions of euros Q4 2014 Q4 2015 Published
Change Comparable
change (a)
Europe 1,681 1,713 +1.9% +4.6%
Americas 894 899 +0.5% +0.0%
Asia-Pacific 905 995 +10.0% +6.0%
Middle-East and Africa 112 161 +43.1% +35.0%
Gas and Services Revenues 3,592 3,768 +4.9% +4.8%
Engineering & Construction 224 174 -22.8% -27.4%
Global Markets & Technologies 92 93 +1.7% -0.5%
Other activities 143 134 -6.3% -8.5%
Group revenue 4,051 4,169 +2.9% +2.4%
Appendices

Air Liquide - 2015 Results
Page 26 / 34
Currency, energy and significant scope impacts
In addition to the comparison of published figures, financial information for 4th quarter 2015 is provided before currency, energy price fluctuations and significant scope impacts. As of 1 January 2015, the energy impact includes impacts of natural gas and electricity. In the future, it may also include other energy Large Industries feedstocks.
Since gases for industry and health are rarely exported, the impact of currency fluctuations on activity levels and results is limited to euro translation impacts with respect to the financial statements of subsidiaries located outside the Euro zone. Fluctuations in natural gas and electricity prices are passed on to customers through price indexation clauses.
Consolidated 2015 4th quarter revenue includes the following impact:
In millions of euros
Revenue
Q4 2015
Q4
2015/2014 change
Currency Natural gas Electricity Significant
scope
Q4 2015/2014 comparable
change (a)
Group 4,169 +2.9% 137.5 (113.8) (3.9) 0 +2.4%
Gas &
Services 3,768 +4.9% 121.9 (113.8) (3.9) 0 +4.8%
(a) Excluding currency, energy (natural gas and electricity) and significant scope impacts.
New activity: Data concerning full year 2014 and first three quarters of 2015 for Gas & Services has been restated to factor in the impact relating to the creation of the new Global Markets & Technologies (GM&T) activity.
For the Group,
� The currency impact was +3.4%.
� The impact of natural gas price fluctuations was -2.8%.
� The impact of electricity price fluctuations was -0.1%.
� There was no significant scope impact.
For Gas & Services,
� The currency impact was +3.4%.
� The impact of natural gas price fluctuations was -3.2%.
� The impact of electricity price fluctuations was -0.1%.
� There was no significant scope impact.

Air Liquide - 2015 Results
Page 27 / 34
Segment information
2014 2015
(in millions of euros and %)
Revenue Operating income
recurring
OIR margin
Revenue Operating income
recurring
OIR margin
Europe 6,604.3 1,315.2 19.9% 6,749.4 1,325.9 19.6%
Americas 3,384.5 765.5 22.6% 3,595.3 843.1 23.5%
Asia-Pacific 3,401.4 554.3 16.3% 3,849.6 701.6 18.2%
Middle-East and Africa 409.9 61.7 15.0% 558.0 88.9 15.9%
Gas and Services 13,800.1 2,696.7 19.5% 14,752.3 2, 959.5 20.1%
Engineering & Construction 723.1 85.8 11.9% 774.7 67.5 8.7%
Global Markets & Technologies 256.0 56.3 22.0% 291.5 36.4 12.5%
Other activities 579.1 35.6 6.1% 561.3 34.4 6.1%
Reconciliation - (240,6) - - (207.3) -
Total Group 15,358.3 2,633.8 17.1% 16,379.8 2,890.6 17.6%
New activity: Data concerning full year 2014 and first three quarters of 2015 for Gas & Services and Engineering & Construction has been restated to factor in the impact relating to the creation of the new Global Markets & Technologies (GM&T) activity.
Geography: Middle-East and Africa now includes India, previously part of Asia-Pacific. Data concerning full year 2014 and first three quarters of 2015 has been restated accordingly.

Air Liquide - 2015 Results
Page 28 / 34
Consolidated Income Statement
(in millions of euros) 2014 2015 Change
15/14
Revenue 15,358.3 16,379.8 +6.7%
Other income 228.2 193.5 -15.2%
Purchases (6,007.2) (6 164.0) +2.6%
Personnel expenses (2,653.1) (3 069.4) +15.7%
Other expenses (3,053.3) (3 077.7) +0.8%
Operating income recurring before depreciation and amortization 3,872.9 4,262.2 +10.1%
Depreciation and amortization expense (1,239.1) (1 371.6) +10.7%
Operating income recurring 2,633.8 2,890.6 +9.8%
Other non-recurring operating income 68.9 38.4
-44.3%
Other non-recurring operating expenses (52.9) (170.6) +222.5%
Operating income 2,649.8 2,758.4 +4.1%
Net finance costs (228.9) (227.1) - 0.8%
Other financial income 32.8 14.7
Other financial expenses (54.5) (55.6)
Income taxes (678.4) (666.4) Share of profit of associates 4.0 14.7 Profit for the period 1,724.8 1,838.7 +6.6%
- Minority interests 59.8 82.3
- Net profit (Group share) 1,665.0 1,756.4 +5.5%
Basic earnings per share (in euros) 4.85 5.12
+5.6%
Diluted earnings per share (in euros) 4.83 5.10
+5.6%
Air Liquide - 2015 Results
Page 29 / 34
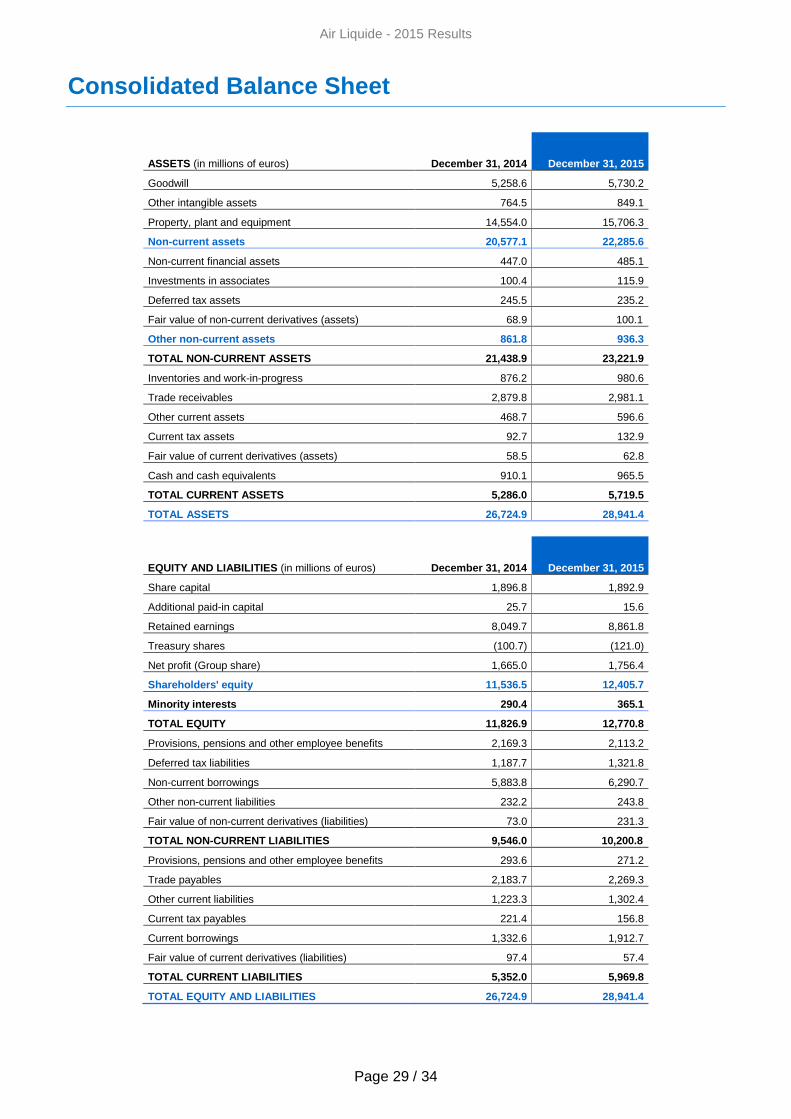
Consolidated Balance Sheet
ASSETS (in millions of euros) December 31, 2014 December 31, 2015
Goodwill 5,258.6 5,730.2
Other intangible assets 764.5 849.1
Property, plant and equipment 14,554.0 15,706.3
Non-current assets 20,577.1 22,285.6
Non-current financial assets 447.0 485.1
Investments in associates 100.4 115.9
Deferred tax assets 245.5 235.2
Fair value of non-current derivatives (assets) 68.9 100.1
Other non-current assets 861.8 936.3
TOTAL NON-CURRENT ASSETS 21,4 38.9 23,221.9
Inventories and work-in-progress 876.2 980.6
Trade receivables 2,879.8 2,981.1
Other current assets 468.7 596.6
Current tax assets 92.7 132.9
Fair value of current derivatives (assets) 58.5 62.8
Cash and cash equivalents 910.1 965.5
TOTAL CURRENT ASSETS 5,286. 0 5,719.5
TOTAL ASSETS 26,724.9 28,941.4
EQUITY AND LIABILITIES (in millions of euros) December 31, 2014 December 31, 2015
Share capital 1,896.8 1,892.9
Additional paid-in capital 25.7 15.6
Retained earnings 8,049.7 8,861.8
Treasury shares (100.7) (121.0)
Net profit (Group share) 1,665.0 1,756.4
Shareholders' equity 11,536.5 12,405.7
Minority interests 290.4 365.1
TOTAL EQUITY 11,826.9 12,770.8
Provisions, pensions and other employee benefits 2,169.3 2,113.2
Deferred tax liabilities 1,187.7 1,321.8
Non-current borrowings 5,883.8 6,290.7
Other non-current liabilities 232.2 243.8
Fair value of non-current derivatives (liabilities) 73.0 231.3
TOTAL NON-CURRENT LIABILITIES 9,546.0 10,200.8
Provisions, pensions and other employee benefits 293.6 271.2
Trade payables 2,183.7 2,269.3
Other current liabilities 1,223.3 1,302.4
Current tax payables 221.4 156.8
Current borrowings 1,332.6 1,912.7
Fair value of current derivatives (liabilities) 97.4 57.4
TOTAL CURRENT LIABILITIES 5 ,352.0 5,969.8
TOTAL EQUITY AND LIABILITIES 2 6,724.9 28,941.4

Air Liquide - 2015 Results
Page 30 / 34
Consolidated Cash Flow Statement
(in millions of euros) 2014 2015
Operating activities
Net profit (Group share) 1,665.0 1,756.4
Minority interests 59.8 82.3
Adjustments:
• Depreciation and amortization 1,239.1 1,371.6
• Changes in deferred taxes 84.9 107.3
• Increase (decrease) in provisions 5.7 (64.2)
• Share of profit of associates (less dividends received) 4.7 (3.3)
• Profit/loss on disposal of assets (116.5) (100.6)
Cash flow from operating activities before changes in working capital 2,942.7 3,149.5
Changes in working capital requirements 73.5 (258.4)
Other (186.6) (58.7)
Net cash flow from operating activities 2,829.6 2,832.4
Investing activities
Purchase of property. plant and equipment and intangible assets
(1,901.7) (2,027.7)
Acquisition of subsidiaries and financial assets (179.0) (384.4)
Proceeds from sale of property. plant and equipment and intangible assets 228.6 129.6
Proceeds from sale of financial assets 15.8 1.4
Net cash flow used in investing activities (1,836.3) (2,281.1)
Financing activities
Dividends paid
• L'Air Liquide, S.A. (838.5) (924.3)
• Minority interests (46.0) (50.8)
Proceeds from issues of share capital 59.5 85.8
Purchase of treasury shares (116.4) (178.3)
Increase (decrease) in borrowings 76.1 651.4
Transactions with minority shareholders (94.5) (11.1)
Net cash flow from (used in) financing activities ( 959.8) (427.3)
Effect of exchange rate changes and change in scope of consolidation (31.6) (103.5)
Net increase (decrease) in net cash and cash equiva lents 1.9 20.5
NET CASH AND CASH EQUIVALENTS AT THE BEGINNING OF THE PERIOD 853.0 854.9
NET CASH AND CASH EQUIVALENTS AT THE END OF THE PERIOD 854.9 875.4

Air Liquide - 2015 Results
Page 31 / 34
The analysis of net cash and cash equivalents at th e end of period as follows:
(in millions of euros) 2014 2015
Cash and cash equivalents 910.1 965.9
Bank overdrafts (included in current borrowings) (55.2) (90.1)
Net cash and cash equivalents 854.9 875.4
Net indebtedness calculation
(in millions of euros) 2014 2015
Non-current borrowings (long-term debt) (5,883.8) (6,290.7)
Current borrowings (short-term debt) (1,332.6) (1,912.7)
TOTAL GROSS INDEBTEDNESS (7,216.4) (8,203.4)
Cash and cash equivalents 910.1 965.5
TOTAL NET INDEBTEDNESS AT THE END OF THE PERIOD (6, 306.3) (0.8)
(7,238.7)
Statement of changes in net indebtedness
(in millions of euros) 2014 2015
Net indebtedness at the beginning of the period (6, 061.9) (6,306.3)
Net cash flow from operating activities 2,829.6 2 832.4
Net cash flow used in investing activities (1,836.3) (2,281.1)
Net cash flow used in financing activities excluding increase (decrease) in borrowings
(1,035.9) (1,078.7)
Total net cash flow (42.6) (527.4)
Effect of exchange rate changes, opening net indebtedness of newly acquired companies and others (201.8) (405.0)
Change in net indebtedness (244.4) (932.4)
NET INDEBTEDNESS AT THE END OF THE PERIOD (6,306.3) (7,238.7)

Air Liquide - 2015 Results
Page 32 / 34
Restated data
To factor in the impact relating to the creation of the new activity Global Markets & Technologies (GM&T), data over 2014 and the first three quarters of 2015 have been:
- restated for Gas & Services (specifically, Industrial Merchant and the 4 regions)
- published separately for Engineering & Construction (previously included in Engineering & Technology)
Middle-East and Africa now includes India, previously part of Asia-Pacific. Data concerning full year 2014 and first three quarters of 2015 have been restated accordingly.
Published in October 2015 Published in February 2016 Sales
(in millions of euros) 2014 Q1 15 Q2 15 Q3 15 2014 Q1 15 Q2 15 Q3 15
By Business Line :
Industrial Merchant 5,083 1,327 1,333 1,312 5,016 1,309 1,313 1,293
By Geography :
Europe 6,640 1,696 1,694 1,681 6,604 1,684 1,682 1,670
Americas 3 416 895 918 906 3,384 888 911 897
Asia-Pacific 3 444 946 968 972 3,402 936 956 963
Middle-East and Africa 367 95 128 142 410 106 139 152
Gas & Services 13,867 3,632 3,708 3,701 13,800 3,614 3,688 3,682
Engineering & Technology 912 217 259 267
Engineering & Construction 723 177 205 219
Global Markets & Technologies 256 58 73 67
Other Activities 579 144 154 129 579 144 154 129
TOTAL Group 15,358 3,993 4,121 4 ,097 15,358 3,993 4,121 4,097
Published in October 2015 Published in February 2016 Comparable growth
2014 Q1 15 Q2 15 Q3 15 2014 Q1 15 Q2 15 Q3 15
By Business Line :
Industrial Merchant +3.0% +0.3% -1.6% -1.2% +2.6% -0.2% -1.7% -1.3%
By Geography :
Europe -1.1% +1.3% +3.3% +5.1% -1.4% +1.0% +3.1% +5.0%
Americas +7.9% +1.1% +0.4% -0.6% +8.0% +1.0% +0.6% -0.4%
Asia-Pacific +11.6% +6.9% +5.0% +4.5% +11.5% +7.0% +5.1% +4.8%
Middle-East and Africa +4.6% +1.4% +23.7% +42.5% +6.0% +1.4% +21.3% +36.1%
Gas & Services +4.1% +2.6% +3.5% +4.5% +3.9% +2.4% +3.5% +4.5%
Engineering & Technology +15.6% +16.4% +6.0% +16.8%
Engineering & Construction
Global Markets & Technologies
Other Activities -1.0% -3.6% -3.0% -11.8% -1.0% -3.6% -3.0% -11.8%
TOTAL Group +4.5% +3.0% +3.4% +4.6% +4.5% +3.0% +3.4% +4.6%

Air Liquide - 2015 Results
Page 33 / 34
2014 data published in February 2015 2014 data published in February 2016
(in millions of euros and %)
Revenue Operating income
recurring
OIR margin
Revenue Operating income
recurring
OIR margin
Europe 6,639.7 1,345.5 20.3% 6,604.3 1,315.2 19.9%
Americas 3,415.9 776.0 22.7% 3,384.5 765.5 22.6%
Asia-Pacific 3,444.6 551.5 16.0% 3,401.4 554.3 16.3%
Middle-East and Africa 366.7 64.5 17.6% 409.9 61.7 15.0%
Gas & Services 13,866.9 2,737.5 19.7% 13,800.1 2,69 6.7 19.5%
Engineering & Technology 912.3 75.8 8.3%
Engineering & Construction 723.1 85.8 11.9%
Global Markets & Technologies 256.0 56.3 22.0%
Other Activities 579.1 35.6 6.1% 579.1 35.6 6.1%
Reconciliation - (215.1) - - (240.6) -
Total Group 15,358.3 2,633.8 17.1% 15,358.3 2,633.8 17.1%
Published in July 2015 Published in February 2016
Gas & Services H1 2014 H2 2014 FY 2014 H1 2015 H1 2014 H2 2014 FY 2014 H1 2015
OIR Margin 19.0% 20.4% 19.7% 19.5% 18.8% 20.3% 19.5% 19.4%

Air Liquide - 2015 Results
Page 34 / 34
CAUTIONARY NOTE REGARDING FORWARD-LOOKING STATEMENTS This document contains certain statements that are “forward-looking statements” within the meaning of Section 27A of the Securities Act of 1933 and Section 21E of the Securities Exchange Act of 1934, as amended. L’Air Liquide S.A. (“Air Liquide”) has identified some of these forward-looking statements with words like “believe,” “may,” “could,” “would,” “might,” “possible,” “will,” “should,” “expect,” “intend,” “plan,” “anticipate,” or “continue,” the negative of these words, other terms of similar meaning or the use of future dates. Forward-looking statements in this document include without limitation statements regarding the expected timing of the completion of the transactions described in this document, Air Liquide’s operation of the business of Airgas, Inc. (“Airgas”) following completion of the contemplated transactions, and statements regarding the future operation, direction and success of Airgas’ businesses. Such statements are qualified by the inherent risks and uncertainties surrounding future expectations generally, and actual results could differ materially from those currently anticipated due to a number of risks and uncertainties. Risks and uncertainties that could cause results to differ from expectations include: uncertainties as to the timing of the contemplated transactions; uncertainties as to the approval of Airgas’ stockholders required in connection with the contemplated transactions; the possibility that a competing proposal will be made; the possibility that the closing conditions to the contemplated transactions may not be satisfied or waived, including that a governmental entity may prohibit, delay or refuse to grant a necessary regulatory approval; the effects of disruption caused by the announcement of the contemplated transactions making it more difficult to maintain relationships with employees, customers, vendors and other business partners; the risk that stockholder litigation in connection with the contemplated transactions may affect the timing or occurrence of the contemplated transactions or result in significant costs of defense, indemnification and liability; other business effects, including the effects of industry, economic or political conditions outside of the control of the parties to the contemplated transactions; transactions costs; actual or contingent liabilities; and other risks and uncertainties discussed in Airgas’ filings with the U.S. Securities and Exchange Commission (the “SEC”), including the “Risk Factors” sections of Airgas’ most recent annual report on Form 10-K. You can obtain copies of Airgas’ filings with the SEC for free at the SEC’s website (www.sec.gov). Air Liquide does not undertake any obligation to update any forward-looking statements as a result of new information, future developments or otherwise, except as expressly required by law. All forward-looking statements in this announcement are qualified in their entirety by this cautionary statement.
Additional Information and Where to Find it In connection with the proposed acquisition of Airgas by Air Liquide, Airgas has filed with the SEC and mailed or otherwise provided to its stockholders a definitive proxy statement regarding the proposed transaction. BEFORE MAKING ANY VOTING DECISION, AIRGAS STOCKHOLDERS ARE URGED TO CAREFULLY READ THE DEFINITIVE PROXY STATEMENT IN ITS ENTIRETY AND ANY OTHER DOCUMENTS FILED WITH THE SEC IN CONNECTION WITH THE PROPOSED TRANSACTION OR INCORPORATED BY REFERENCE THEREIN BECAUSE THEY WILL CONTAIN IMPORTANT INFORMATION ABOUT THE PROPOSED TRANSACTION AND THE PARTIES TO THE PROPOSED TRANSACTION. Investors and security holders may obtain a free copy of the proxy statement and other documents that Airgas files with the SEC (when available) from the SEC’s website at www.sec.gov and Airgas’ website at http://investor.shareholder.com/arg/. In addition, the proxy statement and other documents filed by Airgas with the SEC (when available) may be obtained from Airgas free of charge by directing a request to Joseph Marczely, Manager, Investor Relations, Airgas, Inc., 259 N. Radnor-Chester Road, Radnor, PA 19087-5283, Phone: 610-263-8277.
Certain Information Concerning Participants Airgas and its directors, executive officers and employees may be deemed, under SEC rules, to be participants in the solicitation of proxies from Airgas stockholders with respect to the proposed acquisition of Airgas. Security holders may obtain information regarding the names, affiliations and interests of such individuals in Airgas’ Annual Report on Form 10-K for the fiscal year ended March 31, 2015 and proxy statement for its 2015 annual meeting of stockholders. Additional information regarding the interests of such individuals in the proposed acquisition of Airgas is in the proxy statement relating to such acquisition. These documents may be obtained free of charge from the SEC’s website at www.sec.gov and Airgas’ website at http://investor.shareholder.com/arg/.