2015 Pediatric Dermatology Compensation & Productivity...
32
2015 Pediatric Dermatology Compensation & Productivity Survey www.pedsderm.net 2016 Society for Pediatric Dermatology Page | 1 The Society for Pediatric Dermatology in partnership with The Medical College of Wisconsin 2015 Pediatric Dermatology Compensation & Productivity Report The report features compensation and productivity information on pediatric dermatology medical physicians drawn from responses from 143 SPD members and is detailed by factors such as location, type of practice, gross revenue, academic rank and years of experience. In addition to salary and productivity data, the report contains prevalence data on various topics related to pediatric dermatology practice. ©2015 Society for Pediatric Dermatology 8365 Keystone Crossing, Suite 107 Indianapolis, IN 46240 | (317) 202-0224 www.pedsderm.net
-
Upload
phungnguyet -
Category
Documents
-
view
219 -
download
1
Transcript of 2015 Pediatric Dermatology Compensation & Productivity...
2015 Pediatric Dermatology Compensation & Productivity Survey
www.pedsderm.net 2016 Society for Pediatric Dermatology P a g e | 1
The Society for Pediatric Dermatology in partnership with The Medical College of Wisconsin
2015 Pediatric Dermatology Compensation & Productivity Report
The report features compensation and productivity information on pediatric dermatology medical physicians drawn from responses from 143 SPD members and is detailed by factors such as location, type of practice, gross revenue, academic rank and years of experience. In addition to salary and productivity data, the report contains prevalence data on various topics related to pediatric dermatology practice.
©2015 Society for Pediatric Dermatology 8365 Keystone Crossing, Suite 107 Indianapolis, IN 46240 | (317) 202-0224 www.pedsderm.net
2015 Pediatric Dermatology Compensation & Productivity Survey
www.pedsderm.net 2016 Society for Pediatric Dermatology P a g e | 2
2015 Pediatric Dermatology Compensation & Productivity Survey
Introduction……………………………………………………………………………………………………………………. 3-‐4
Executive Summary………………………………………………………………………………………………………… 5-‐6
Background and Methodology……………………………………………………………………………………….. 7-‐10
Survey Results………………………………………………………………………………………………………………… 11-‐29
Compensation……………………………………………………………………………………………………. 11-‐12
Productivity………………………………………………………………………………………………………… 12-‐13
Compensation & Productivity Correlation………………………………………………………….. 14-‐16
Survey of Current Practices………………………………………………………………………………… 17-‐30
Appendix…………………………………………………………………………………………………………………………. 30-‐31
Survey Questions………………………………………………………………………………………………... 31-‐32
Methodology……………………………………………………………………………………………………… 32
2015 Pediatric Dermatology Compensation & Productivity Survey
www.pedsderm.net 2016 Society for Pediatric Dermatology P a g e | 3
IntroductionThe mission of the Society for Pediatric Dermatology (SPD) is to advance education and research related to skin disorders in children, develop new means of treatment, provide advocacy to support pediatric patients with skin disorders, and advance the specialty of pediatric dermatology.
In keeping with this mission, the SPD’s Practice Management Committee prioritized collection of relevant and accurate practice data that can support advancement of the specialty. The aim of this survey is to provide SPD members with relevant information and fiscal trends in the field.
This is the third SPD Compensation and Productivity Survey. It provides detailed total compensation and productivity data on pediatric dermatologists by practice type and across the five major census regions of the U.S. A number of questions related to pediatric dermatology practice are listed. The information in this report can enable practitioners to evaluate compensation levels both within and across peer groups and organizational characteristics. Data was collected by surveying active SPD members and the following results are intended for use by SPD members only. Summary data will be available to all SPD members and detailed data will be available to those SPD members that participated in the survey by self-reporting their data.
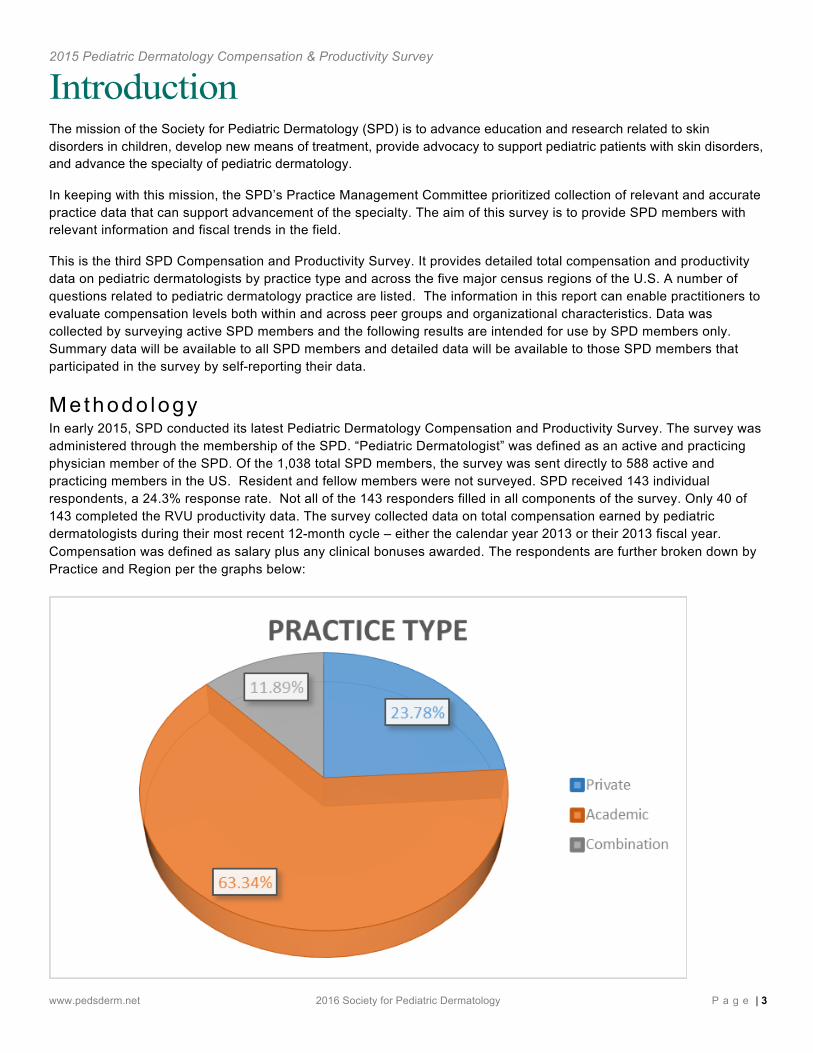
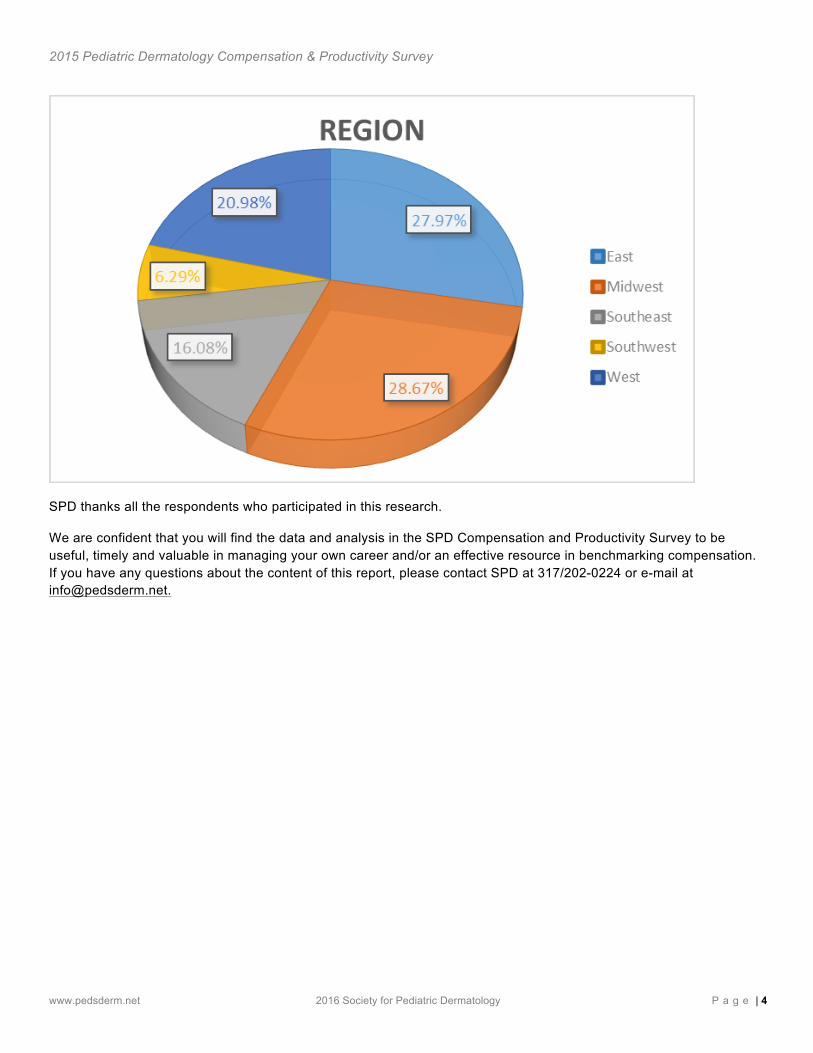
Me thodo logy In early 2015, SPD conducted its latest Pediatric Dermatology Compensation and Productivity Survey. The survey was administered through the membership of the SPD. “Pediatric Dermatologist” was defined as an active and practicing physician member of the SPD. Of the 1,038 total SPD members, the survey was sent directly to 588 active and practicing members in the US. Resident and fellow members were not surveyed. SPD received 143 individual respondents, a 24.3% response rate. Not all of the 143 responders filled in all components of the survey. Only 40 of 143 completed the RVU productivity data. The survey collected data on total compensation earned by pediatric dermatologists during their most recent 12-month cycle – either the calendar year 2013 or their 2013 fiscal year. Compensation was defined as salary plus any clinical bonuses awarded. The respondents are further broken down by Practice and Region per the graphs below:
2015 Pediatric Dermatology Compensation & Productivity Survey
www.pedsderm.net 2016 Society for Pediatric Dermatology P a g e | 4
SPD thanks all the respondents who participated in this research.
We are confident that you will find the data and analysis in the SPD Compensation and Productivity Survey to be useful, timely and valuable in managing your own career and/or an effective resource in benchmarking compensation. If you have any questions about the content of this report, please contact SPD at 317/202-0224 or e-mail at [email protected].
2015 Pediatric Dermatology Compensation & Productivity Survey
www.pedsderm.net 2016 Society for Pediatric Dermatology P a g e | 5
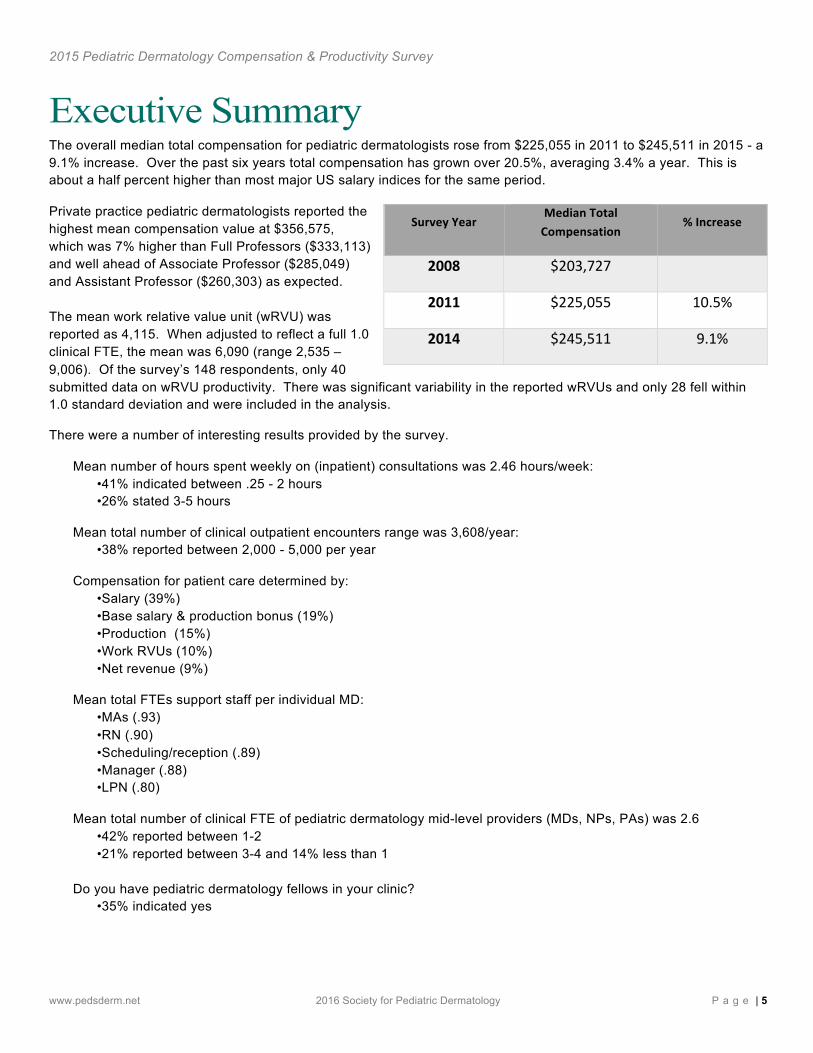
Executive Summary The overall median total compensation for pediatric dermatologists rose from $225,055 in 2011 to $245,511 in 2015 - a 9.1% increase. Over the past six years total compensation has grown over 20.5%, averaging 3.4% a year. This is about a half percent higher than most major US salary indices for the same period.
Private practice pediatric dermatologists reported the highest mean compensation value at $356,575, which was 7% higher than Full Professors ($333,113) and well ahead of Associate Professor ($285,049) and Assistant Professor ($260,303) as expected. The mean work relative value unit (wRVU) was reported as 4,115. When adjusted to reflect a full 1.0 clinical FTE, the mean was 6,090 (range 2,535 – 9,006). Of the survey’s 148 respondents, only 40 submitted data on wRVU productivity. There was significant variability in the reported wRVUs and only 28 fell within 1.0 standard deviation and were included in the analysis.
There were a number of interesting results provided by the survey.
Mean number of hours spent weekly on (inpatient) consultations was 2.46 hours/week: •41% indicated between .25 - 2 hours •26% stated 3-5 hours
Mean total number of clinical outpatient encounters range was 3,608/year: •38% reported between 2,000 - 5,000 per year
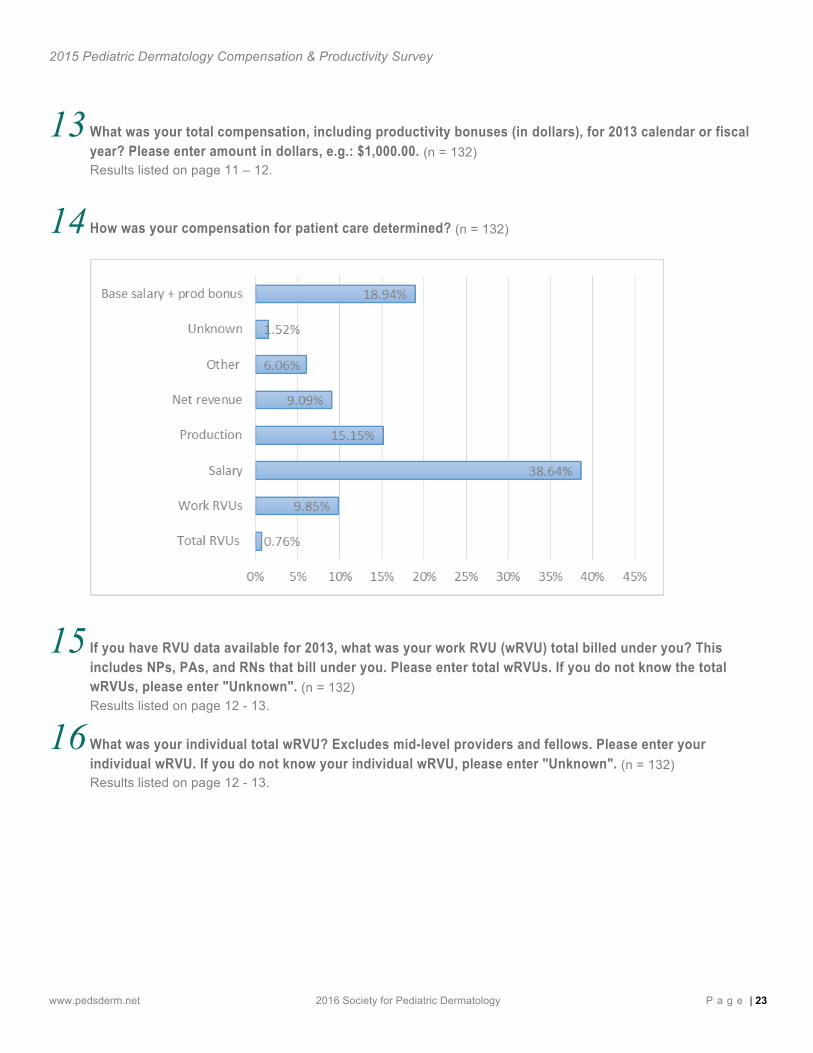
Compensation for patient care determined by: •Salary (39%) •Base salary & production bonus (19%) •Production (15%) •Work RVUs (10%) •Net revenue (9%)
Mean total FTEs support staff per individual MD: •MAs (.93) •RN (.90) •Scheduling/reception (.89) •Manager (.88) •LPN (.80)
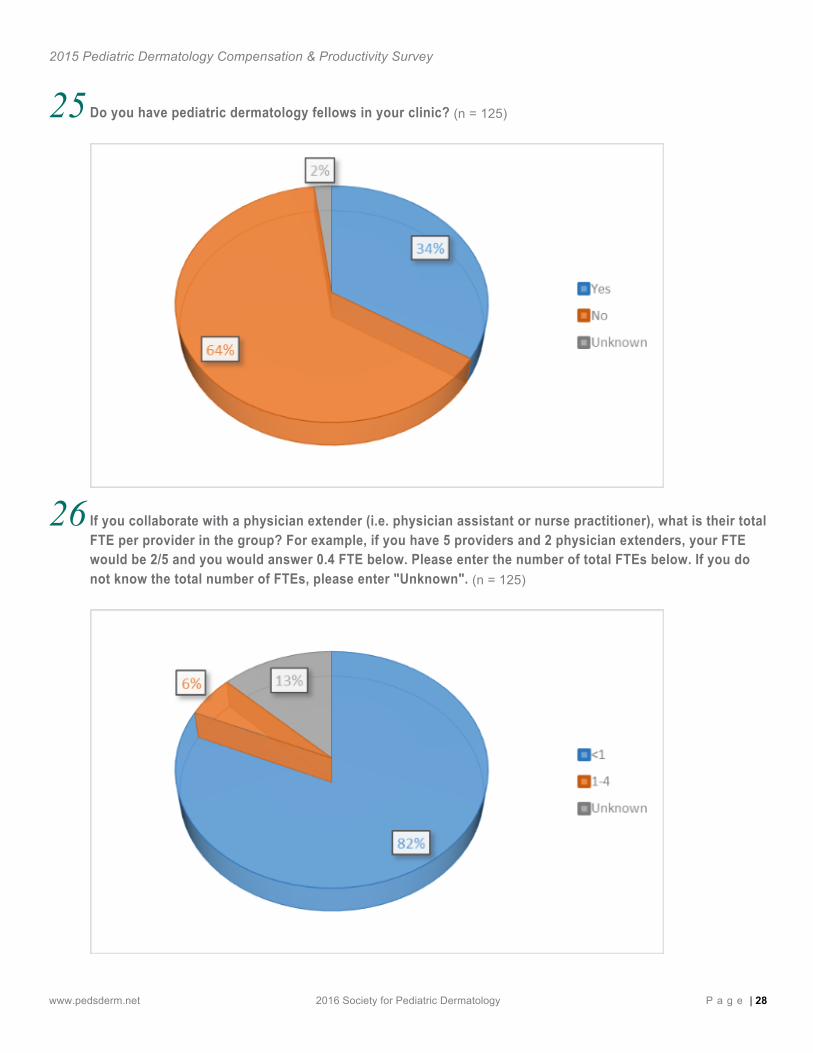
Mean total number of clinical FTE of pediatric dermatology mid-level providers (MDs, NPs, PAs) was 2.6 •42% reported between 1-2 •21% reported between 3-4 and 14% less than 1 Do you have pediatric dermatology fellows in your clinic? •35% indicated yes
Survey Year Median Total Compensation
% Increase
2008 $203,727
2011 $225,055 10.5%
2014 $245,511 9.1%
2015 Pediatric Dermatology Compensation & Productivity Survey
www.pedsderm.net 2016 Society for Pediatric Dermatology P a g e | 6
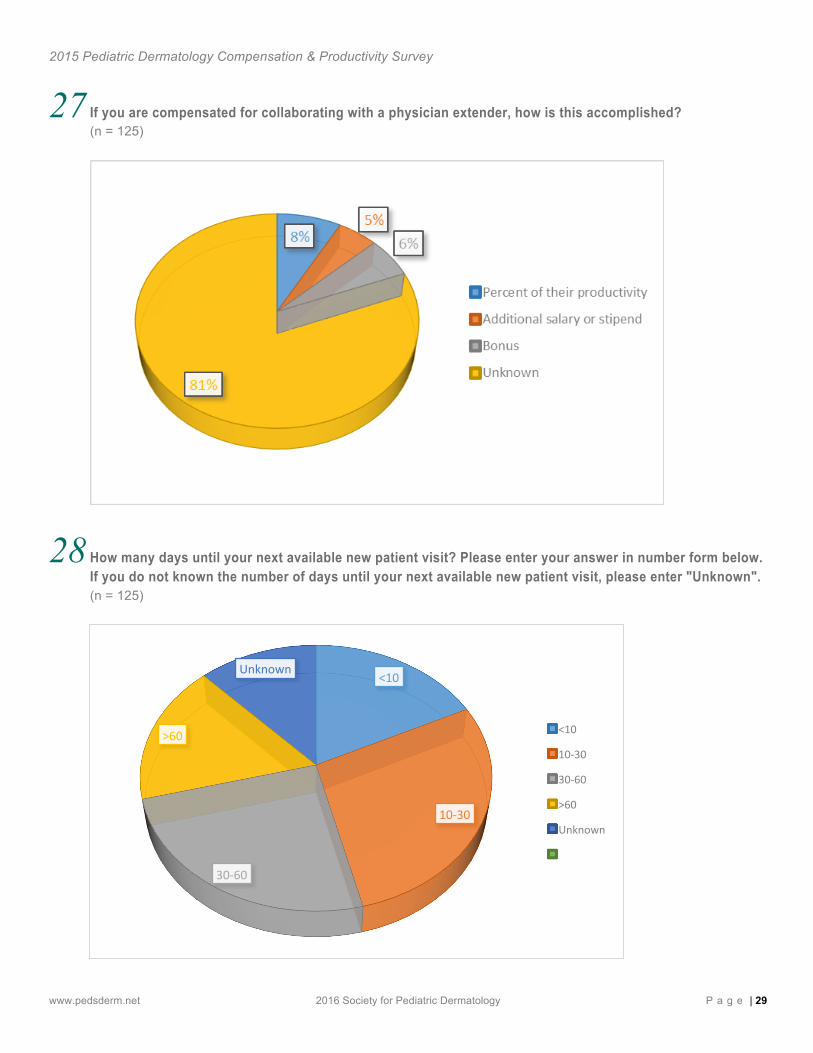
Number of days until their next available new patient visit: •10-30 days (28%) •30-60 days (25%) •Less than 10 days (18%) •More than 60 days (17%)
The mean number of days until next available appointment is 34.4 days (range 1 day - 200 days). On page 14, a scatterplot looks at the degree of alignment between individually reported compensation and productivity values. There is little correlation between levels of compensation and reported wRVU productivity data in this year’s responses. Broader healthcare data (not specific to pediatric dermatology) would suggest a greater correlation than is seen in this year’s sample. SPD will review survey questions and definitions for future surveys.
2015 Pediatric Dermatology Compensation & Productivity Survey
www.pedsderm.net 2016 Society for Pediatric Dermatology P a g e | 7
Background and Methodology for Compensation and Productivity Benchmarks To assist members in interpreting the survey results, this section briefly discusses some background to compensation surveys in general and the productivity measures used. The variance in the member responses to some survey questions suggested it would be helpful to provide definitions of key terms used in the survey results.
Pe rcen t i l es The 25th percentile value is the point below which lie 25 percent of the sample values. The 75th percentile value is the point below which lie 75 percent of the sample values. By looking at the dispersion of data, the 25th and 75th percentiles indicate how well the average and median describe the sample. Percentiles in the report are based on member provided statistics.
Ave rage and Med ian S ta t i s t i cs The median statistic measures the central tendency of the data reported. The median is the center value (50th percentile) of the distribution or the value in the middle of an odd numbered array of data when the values are ordered by magnitude. Half of the values in the sample fall above this number and half fall below it. For example, if 13 incumbents were reported, the median would be the seventh highest value. When the array contains an even number of values, the median is midway between the central values. The advantage of the median as a measure of central tendency is that it is unaffected by individual extreme values (low or high).
Da ta Rev iew In accordance with our objective to publish the most representative information possible, all data have been thoroughly reviewed by compensation and productivity professionals using data diagnostic programs and statistical modeling techniques. Participants are not contacted to confirm submissions or resolve omissions, inconsistencies, or other questionable input. In these cases the data were removed.
Da ta Con f iden t ia l i t y Where there are limited samples, the descriptive statistics displayed will also be limited. To ensure confidentiality, statistics will only be displayed if there are five or more date points to report.
Compensa t ion Su rvey Backg round The Sherman Anti-Trust Act of 1890, passed by Congress and signed into law by President Benjamin Harrison, is the foundation for how compensation survey data are governed. This act, along with supporting legislation of 1904, ensured a competitive business environment by discouraging the formation of monopolies. The act also has been used to ensure competitive wage levels through the elimination of anti-competitive price fixing. The Sherman Act and its effect on the way compensation data are now reported in surveys was brought to light and clarified through significant court cases and continues to be the standard regulating modern day compensation survey publishing. The guidelines stipulated in this legislation are commonly referred to as Survey Safe Harbor Guidelines. These guidelines are as follows:
• Survey data must be conducted by an independent third party • Reported data must be at least three months old • Each disseminated statistic must have at least a sample of five • No individual information can represent more than 25 percent of each disseminated statistic
2015 Pediatric Dermatology Compensation & Productivity Survey
www.pedsderm.net 2016 Society for Pediatric Dermatology P a g e | 8
P rac t i ce Type Private Practice or Group Practice Group often represent single- and multi-specialty practices and make up the majority of physician practice settings. As the name implies, the environment is characterized by sharing of patient care duties and physical space. Group practice is generally viewed as less volatile than solo practice and more likely to afford a controlled lifestyle.
Academic Practices typically represent care practiced in an academic medical system associated with a medical institution of higher learning or Health Sciences University, etc. Often a distinguishing characteristic is that physicians hold faculty appointments, and allocate effort to multiple missions such as teaching, research, and community engagement in addition to their clinical effort.
Fu l l t ime Equ iva len t Full-time equivalent (FTE) is a standard measurement unit that indicates the workload of an employed person in a way that makes workloads or class loads comparable across various contexts. FTE calculated as total annual hours of 2,080 (52 weeks multiplied by 40 hours a week) divided by the number of hours actually worked. FTE for one employee is never more than 1.0, even though many professionals work more than 2,080 hours a year.
P roduc t i v i t y Measu res There are a number of ways of calculating physician productivity. In the past these have been volume-based metrics attached to the number of patient encounters a physicians will see over a given time period or the amount of revenue a provider will bill for or collect over a given time period . These measures were flawed as some specialties had more complicated patients or procedural based practices with relatively low patient volumes. In addition, collections are largely based on commercial payment rates, a factor often out of the control of the physician.
Today, physician productivity and compensation are moving toward models based on Relative Value Units (RVUs). The “work relative value unit” (commonly known as a wRVU) was developed to account for the above variables and is the most widely accepted benchmark for clinical productivity in published survey sources. Established definitions for quality and population health productivity benchmarks may be better tools; however, such models have not yet emerged as industry standards. RVUs are designed to reflect the relative level of time, skill, training and intensity required of a physician to provide a given service. RVUs therefore are a method for calculating the volume of “work” or “effort” expended by a physician in caring for patients. Given this relative scale, a physician seeing two or three complex patients per day could accumulate more RVUs than a physician seeing ten or more low acuity patients per day. “Work,” rather than number of patients or billings, is the behavior being measured and rewarded. The wRVU has been defined as:
A wRVU shall include those procedures which may be properly and compliantly billed to and collected from a managed care company, insurance company, HMO, governmental payer or other third party payer.
The compensation and wRVU benchmarks are meant to provide member derived guideposts to assess clinical practice and individual compensation and productivity levels.
2015 Pediatric Dermatology Compensation & Productivity Survey
www.pedsderm.net 2016 Society for Pediatric Dermatology P a g e | 9
P roduc t i v i t y Measu res – Impor tan t Fac to rs to Cons ide r
• Advance Practice Providers-Physician assistants and Nurse Practitioners-some may bill independently not increasing physician productivity directly, while others may bill under physicians. If and advance practice provider bills independently they may extract simple diagnosis from the practice as a whole resulting in a more medically complex physician practice, therefore potentially increasing the physician work load without increasing productivity measures. Conversely, if the advanced practice provider is billing under the physician name the productivity measures for the physician will be significantly greater.
• Level of clinical support staff-includes administrative, medical assistants, and nursing assistance • Degree of fellow assistance • Degree of resident assistance • Institutional method for calculating clinical FTE-as this varies significantly among institutions and each
physician should know how their clinical FTE is calculated.
De f in i t i on o f C l i n i ca l Fu l l t ime Equ iva len t These wRVU metrics are relatively straight-forward for private practice, but become more complicated in an academic setting in which physicians may have additional research, administrative, or educational responsibilities. For these wRVU metrics to be valid institutions must define clinical effort, in other words how much of the physician’s time is spent directly caring for patients. There is not a concise national definition for how clinical effort is defined. Each major clinical productivity benchmark survey has its own methodology to determine annualized wRVU benchmarks and many physician practices use varying methodologies. Clinical FTE may be determined by the number of clinic sessions a physician completes, the number of direct patient contact hours, the number of patients cared for or the number of wRVUs.
De f in i t i on o f Fa i r Marke t Va lue (FMV) The term “fair market value” is generally defined as the price, expressed in terms of cash equivalents, at which property would change hands between a hypothetical willing and able buyer and a hypothetical willing and able seller, acting at arm’s length in an open and unrestricted market, when neither is under compulsion to buy or sell and when both have reasonable knowledge of the relevant facts.
Revenue B i l l ed The professional fee charges are based on the charge master of the particular practice, usually based on CPT or procedure code. Depending on the practice and the commercial contracts, the actual charge may have little to no relationship to what is actually paid by the payer. Most practices bill the same charge per service to all payers and the contractual adjustment is the difference between the charge and the “allowable fee” based on the contracted rate for the services.
Revenue Co l lec ted – Impor tan t Fac to rs to Cons ide r : The payment that is collected for the professional services is impacted by many factors including:
• Payer mix (government payers for example typically reimburse at a lower rate than commercial payers)
• Procedural mix (surgical and laser procedures typically get reimbursed greater than office visits care for example)
• Contracted rates with commercial carriers will impact the revenue, market factors influence this.
• Specific benefit plan of the patient (may impact what is the out of pocket responsibility from the patient, which takes longer to collect and has a higher bad debt rate)
2015 Pediatric Dermatology Compensation & Productivity Survey
www.pedsderm.net 2016 Society for Pediatric Dermatology P a g e | 10
• Physical location of the care may impact payment, such as hospital-based clinic vs. office-based clinic. This
affects both the amount collected and overhead rates.
• Who provides the service can impact payment - for example APP’s for Medicare services are paid at a lower rate than physician provided services. There may be a fiscal advantage for practices to have APPs bill under physicians.
• Relative value unit for a procedure for payers whose fee schedule is based on RVUs, such as Medicare, and many commercial payers
• Modifiers are allowed for certain services/procedures under certain circumstances that can increase or decrease the payment
2015 Pediatric Dermatology Compensation & Productivity Survey
www.pedsderm.net 2016 Society for Pediatric Dermatology P a g e | 11
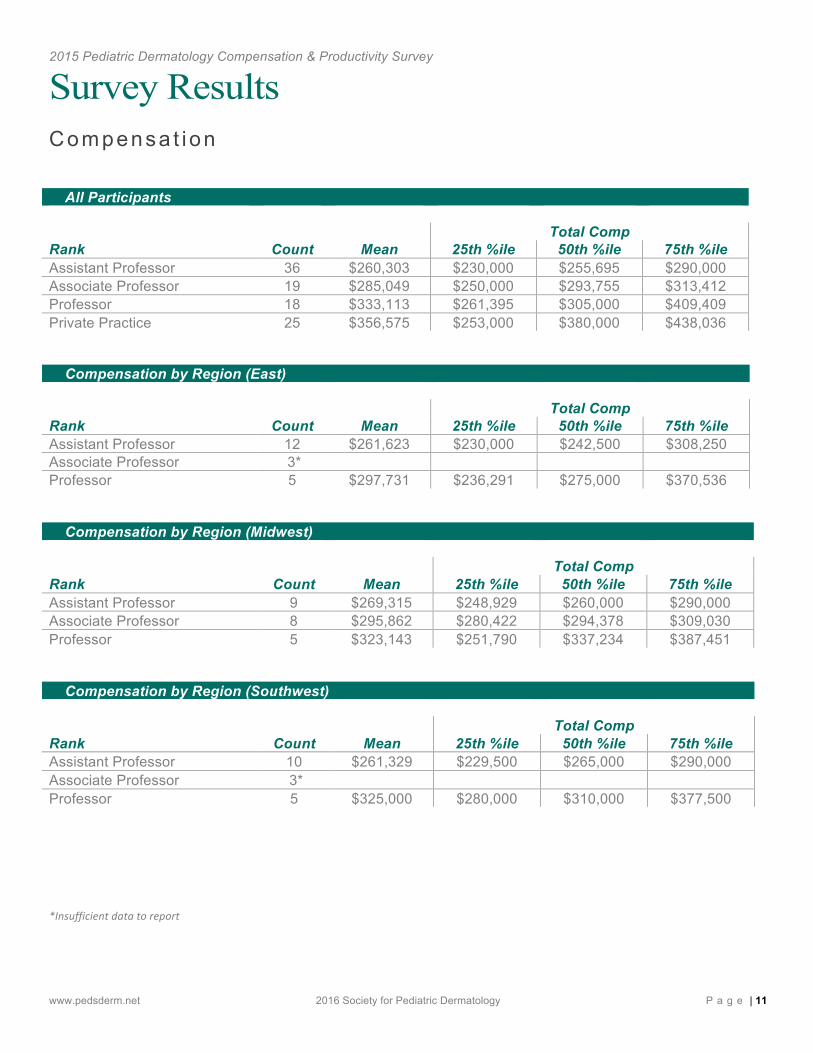
Survey Results Compensa t ion
All Participants Total Comp Rank Count Mean 25th %ile 50th %ile 75th %ile Assistant Professor 36 $260,303 $230,000 $255,695 $290,000 Associate Professor 19 $285,049 $250,000 $293,755 $313,412 Professor 18 $333,113 $261,395 $305,000 $409,409 Private Practice 25 $356,575 $253,000 $380,000 $438,036
Compensation by Region (East) Total Comp Rank Count Mean 25th %ile 50th %ile 75th %ile Assistant Professor 12 $261,623 $230,000 $242,500 $308,250 Associate Professor 3*
Professor 5 $297,731 $236,291 $275,000 $370,536
Compensation by Region (Midwest) Total Comp Rank Count Mean 25th %ile 50th %ile 75th %ile Assistant Professor 9 $269,315 $248,929 $260,000 $290,000 Associate Professor 8 $295,862 $280,422 $294,378 $309,030 Professor 5 $323,143 $251,790 $337,234 $387,451
Compensation by Region (Southwest) Total Comp Rank Count Mean 25th %ile 50th %ile 75th %ile Assistant Professor 10 $261,329 $229,500 $265,000 $290,000 Associate Professor 3*
Professor 5 $325,000 $280,000 $310,000 $377,500
*Insufficient data to report
2015 Pediatric Dermatology Compensation & Productivity Survey
www.pedsderm.net 2016 Society for Pediatric Dermatology P a g e | 12
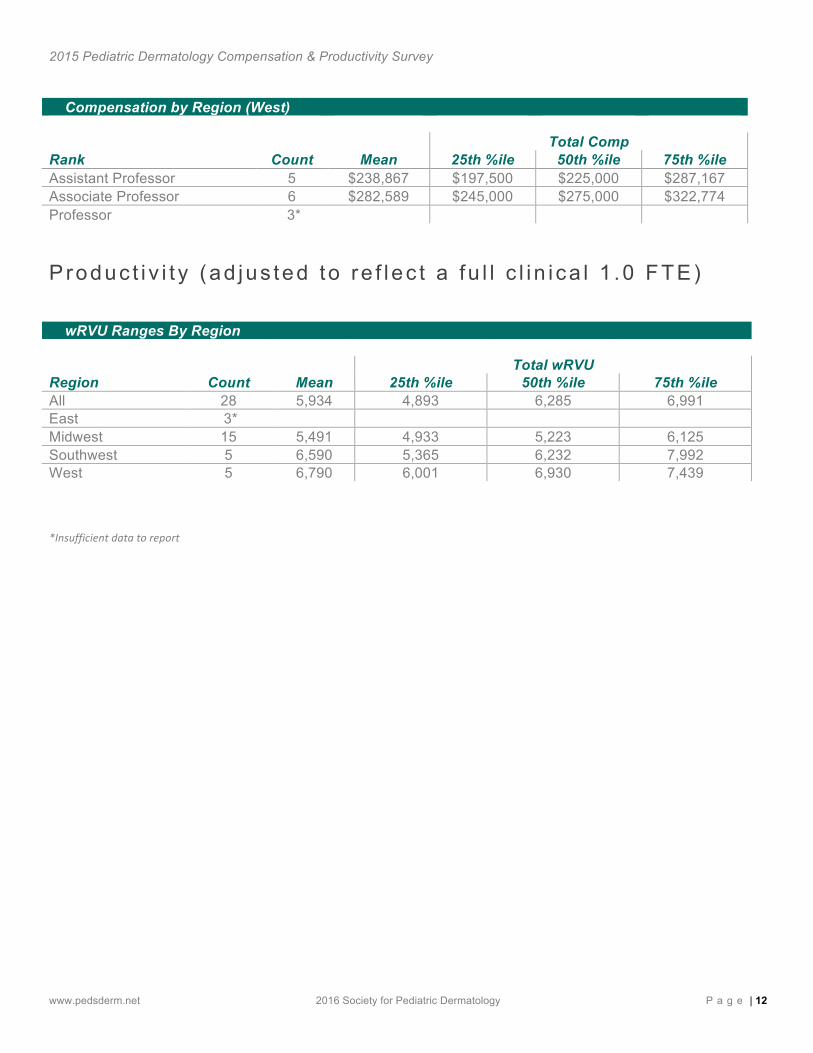
Compensation by Region (West) Total Comp Rank Count Mean 25th %ile 50th %ile 75th %ile Assistant Professor 5 $238,867 $197,500 $225,000 $287,167 Associate Professor 6 $282,589 $245,000 $275,000 $322,774 Professor 3*
Produc t i v i t y (ad jus ted to re f l ec t a fu l l c l i n i ca l 1 .0 FTE)
wRVU Ranges By Region Total wRVU Region Count Mean 25th %ile 50th %ile 75th %ile All 28 5,934 4,893 6,285 6,991 East 3*
Midwest 15 5,491 4,933 5,223 6,125 Southwest 5 6,590 5,365 6,232 7,992 West 5 6,790 6,001 6,930 7,439
*Insufficient data to report
2015 Pediatric Dermatology Compensation & Productivity Survey
www.pedsderm.net 2016 Society for Pediatric Dermatology P a g e | 13
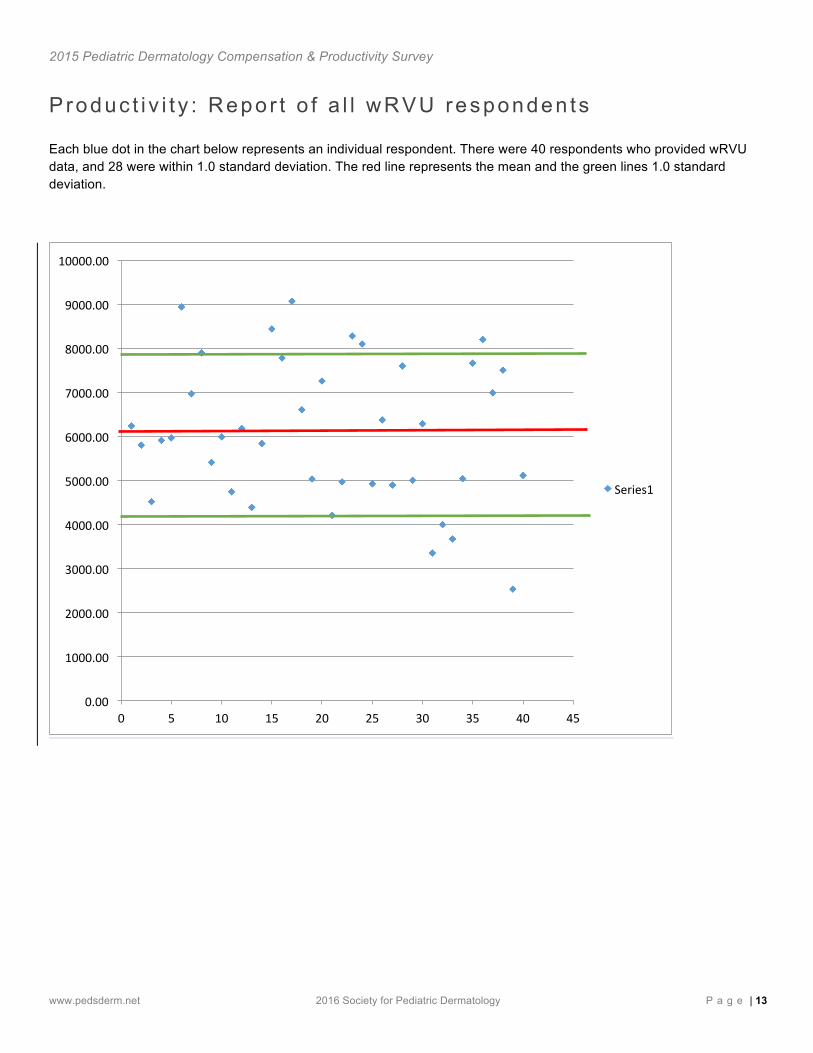
P roduc t i v i t y : Repor t o f a l l wRVU responden ts Each blue dot in the chart below represents an individual respondent. There were 40 respondents who provided wRVU data, and 28 were within 1.0 standard deviation. The red line represents the mean and the green lines 1.0 standard deviation.
0.00
1000.00
2000.00
3000.00
4000.00
5000.00
6000.00
7000.00
8000.00
9000.00
10000.00
0 5 10 15 20 25 30 35 40 45
Series1
2015 Pediatric Dermatology Compensation & Productivity Survey
www.pedsderm.net 2016 Society for Pediatric Dermatology P a g e | 14
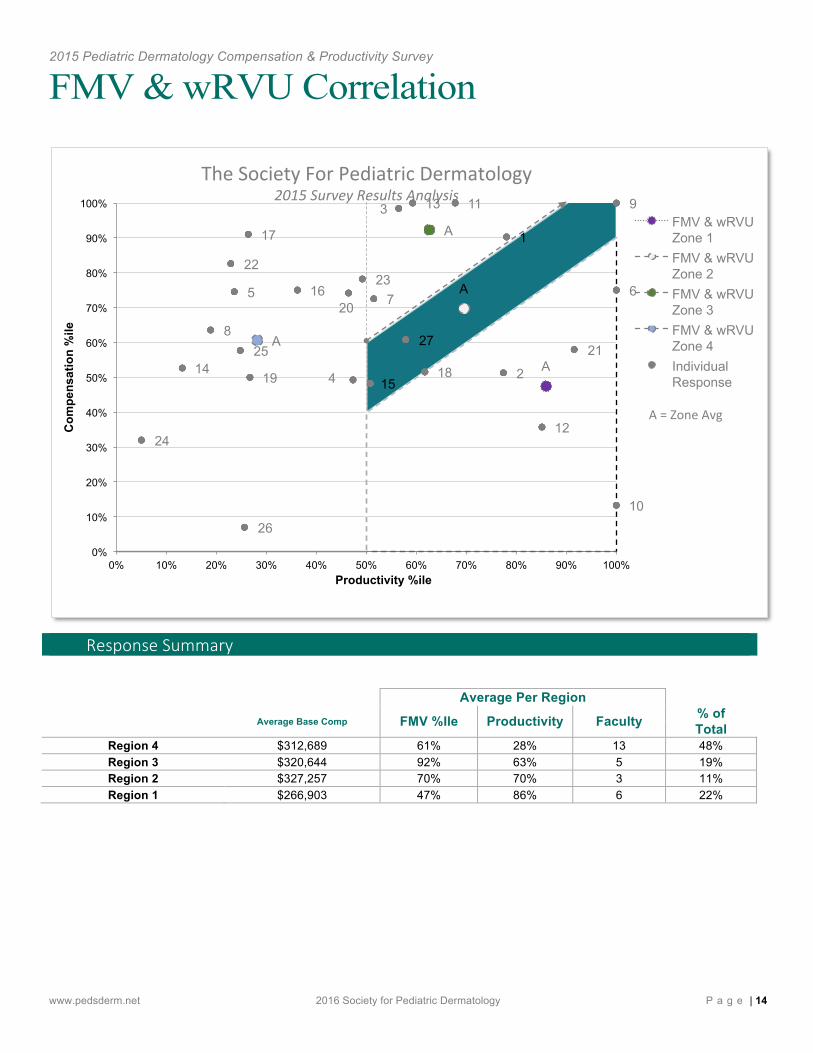
FMV & wRVU Correlation
Response Summary
Average Per Region
Average Base Comp FMV %Ile Productivity Faculty % of Total
Region 4 $312,689 61% 28% 13 48% Region 3 $320,644 92% 63% 5 19% Region 2 $327,257 70% 70% 3 11% Region 1 $266,903 47% 86% 6 22%
A
A
A
A
1
2
3
4
5 6 7
8
9
10
11
12
13
14 15
16
17
18 19
20
21
22 23
24
25
26
27
0%
10%
20%
30%
40%
50%
60%
70%
80%
90%
100%
0% 10% 20% 30% 40% 50% 60% 70% 80% 90% 100%
Com
pens
atio
n %
ile
Productivity %ile
FMV & wRVU Zone 1 FMV & wRVU Zone 2 FMV & wRVU Zone 3 FMV & wRVU Zone 4 Individual Response
A = Zone Avg
The Society For Pediatric Dermatology 2015 Survey Results Analysis
2015 Pediatric Dermatology Compensation & Productivity Survey
www.pedsderm.net 2016 Society for Pediatric Dermatology P a g e | 15
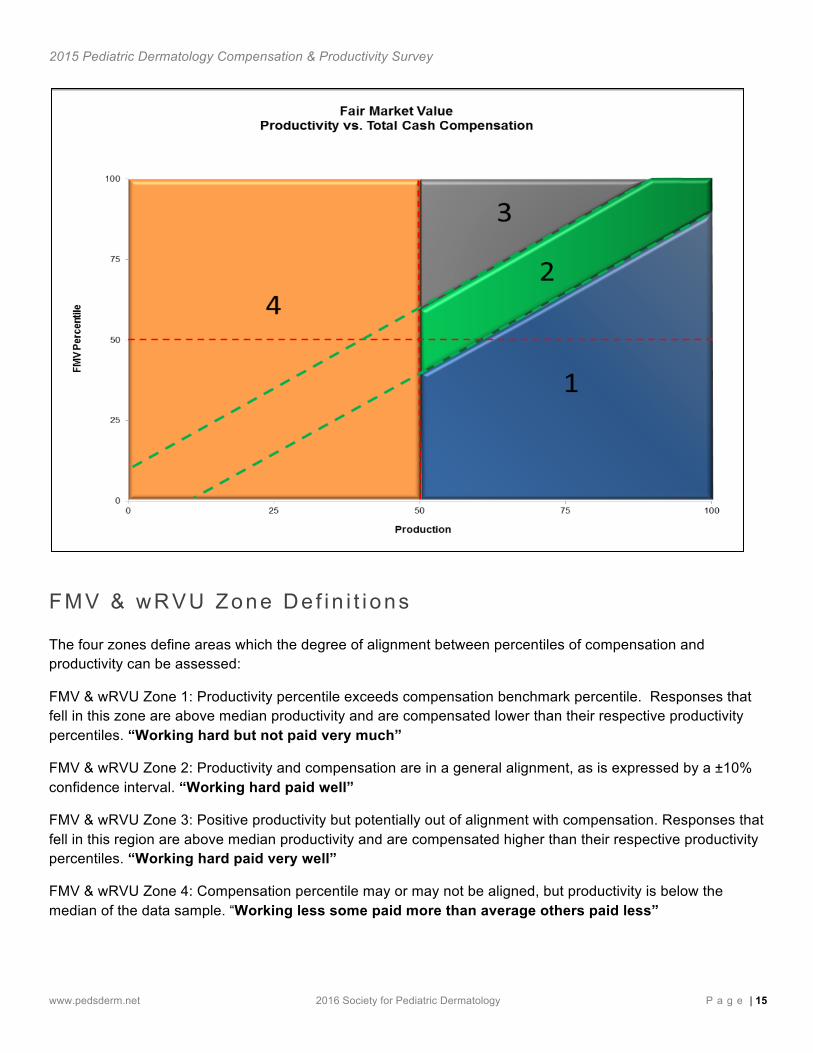
FMV & wRVU Zone De f in i t i ons The four zones define areas which the degree of alignment between percentiles of compensation and productivity can be assessed:
FMV & wRVU Zone 1: Productivity percentile exceeds compensation benchmark percentile. Responses that fell in this zone are above median productivity and are compensated lower than their respective productivity percentiles. “Working hard but not paid very much”
FMV & wRVU Zone 2: Productivity and compensation are in a general alignment, as is expressed by a ±10% confidence interval. “Working hard paid well”
FMV & wRVU Zone 3: Positive productivity but potentially out of alignment with compensation. Responses that fell in this region are above median productivity and are compensated higher than their respective productivity percentiles. “Working hard paid very well”
FMV & wRVU Zone 4: Compensation percentile may or may not be aligned, but productivity is below the median of the data sample. “Working less some paid more than average others paid less”

2015 Pediatric Dermatology Compensation & Productivity Survey
www.pedsderm.net 2016 Society for Pediatric Dermatology P a g e | 16
Obse rva t ions The correlations between compensation and productivity are based on the self-contained values of the responses provided in the survey. Of the 143 participants, 27 responses included both compensation and productivity values that fit within the below methodology requirements, and were used to develop the above compensation and productivity ranges.
2015 Pediatric Dermatology Compensation & Productivity Survey
www.pedsderm.net 2016 Society for Pediatric Dermatology P a g e | 17
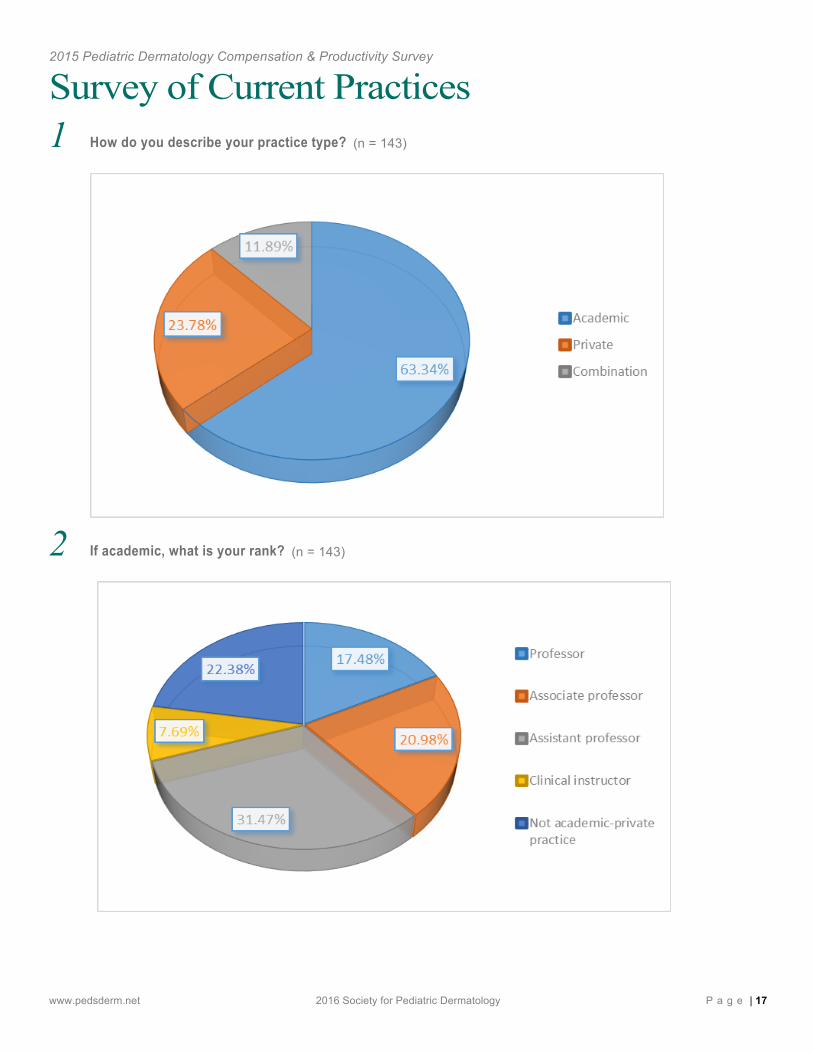
Survey of Current Practices 1 How do you describe your practice type? (n = 143)
2 If academic, what is your rank? (n = 143)
2015 Pediatric Dermatology Compensation & Productivity Survey
www.pedsderm.net 2016 Society for Pediatric Dermatology P a g e | 18
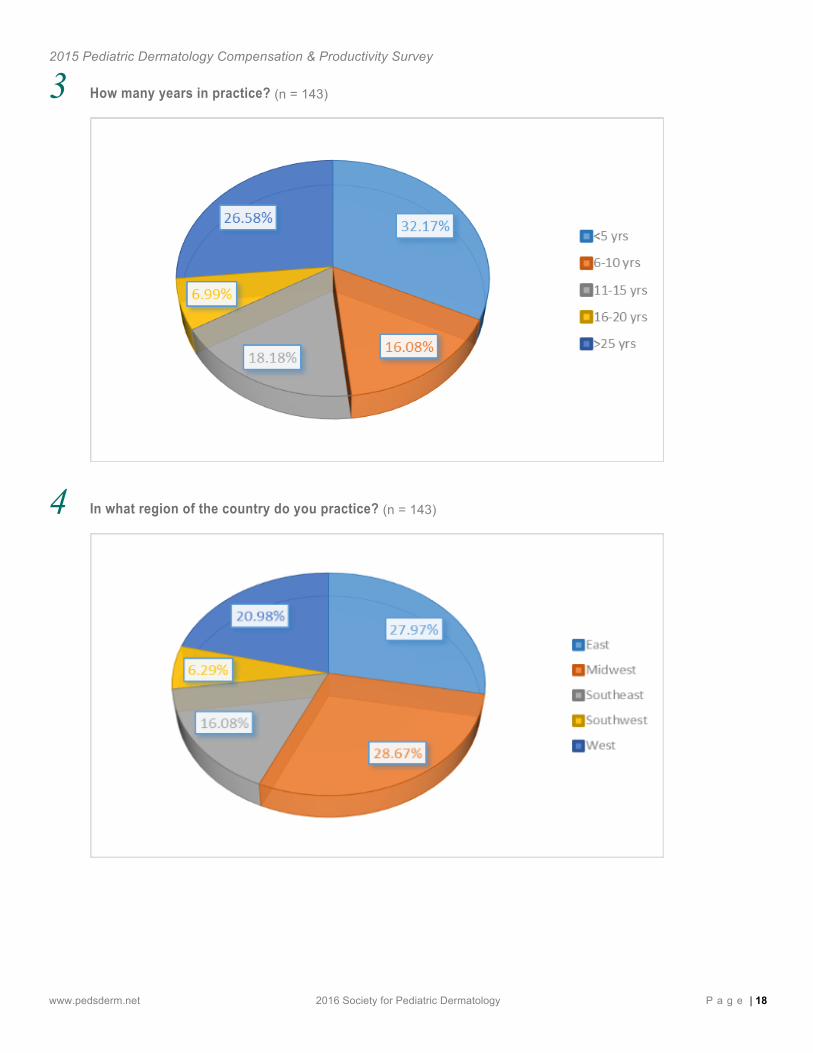
3 How many years in practice? (n = 143)
4 In what region of the country do you practice? (n = 143)
2015 Pediatric Dermatology Compensation & Productivity Survey
www.pedsderm.net 2016 Society for Pediatric Dermatology P a g e | 19
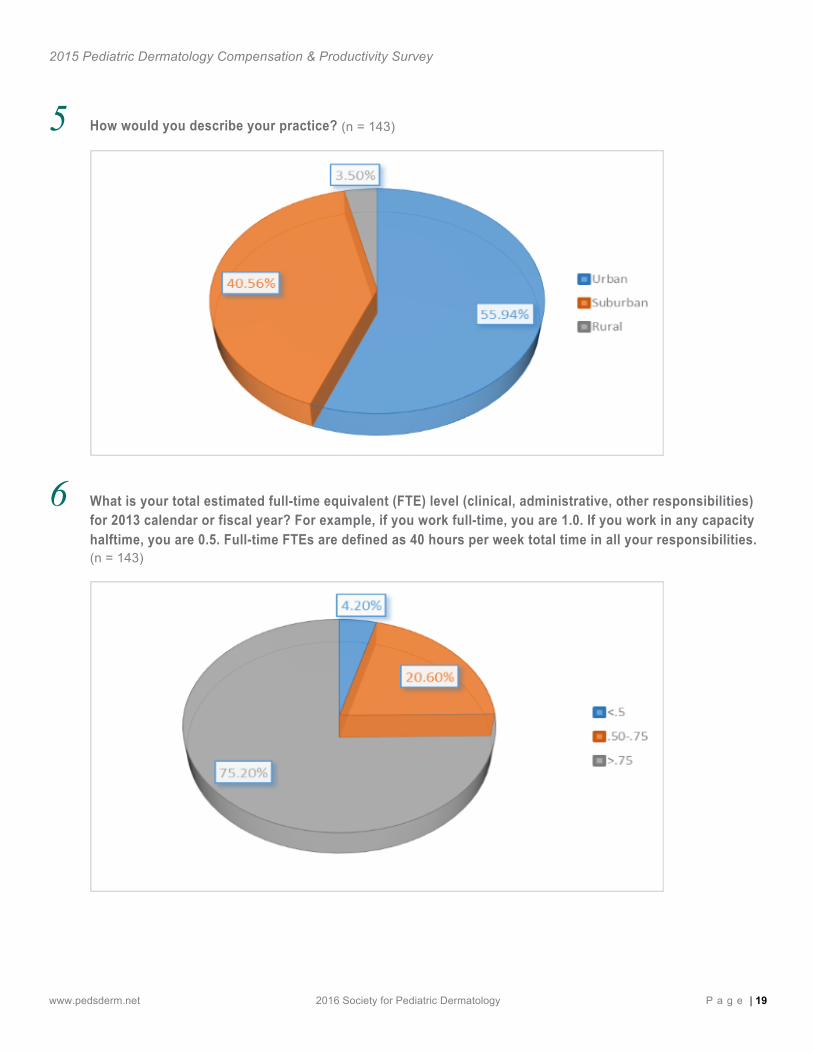
5 How would you describe your practice? (n = 143)
6 What is your total estimated full-time equivalent (FTE) level (clinical, administrative, other responsibilities) for 2013 calendar or fiscal year? For example, if you work full-time, you are 1.0. If you work in any capacity halftime, you are 0.5. Full-time FTEs are defined as 40 hours per week total time in all your responsibilities. (n = 143)
2015 Pediatric Dermatology Compensation & Productivity Survey
www.pedsderm.net 2016 Society for Pediatric Dermatology P a g e | 20
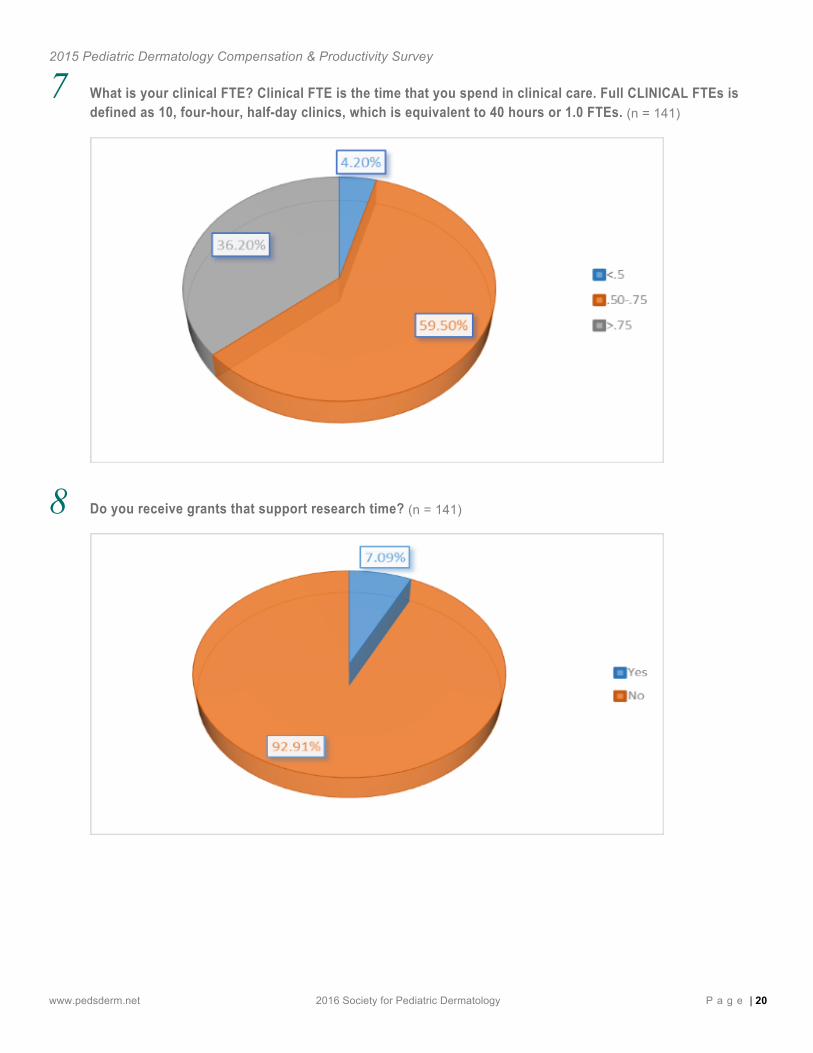
7 What is your clinical FTE? Clinical FTE is the time that you spend in clinical care. Full CLINICAL FTEs is defined as 10, four-hour, half-day clinics, which is equivalent to 40 hours or 1.0 FTEs. (n = 141)
8 Do you receive grants that support research time? (n = 141)
2015 Pediatric Dermatology Compensation & Productivity Survey
www.pedsderm.net 2016 Society for Pediatric Dermatology P a g e | 21
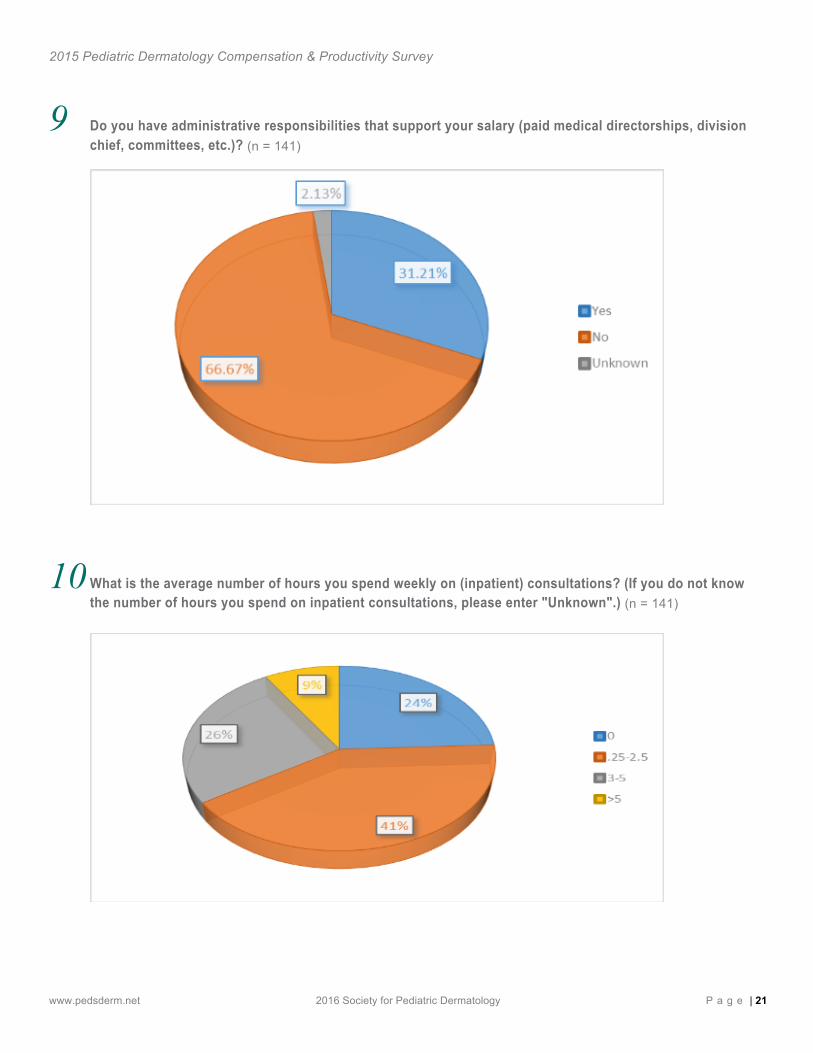
9 Do you have administrative responsibilities that support your salary (paid medical directorships, division chief, committees, etc.)? (n = 141)
10 What is the average number of hours you spend weekly on (inpatient) consultations? (If you do not know the number of hours you spend on inpatient consultations, please enter "Unknown".) (n = 141)
2015 Pediatric Dermatology Compensation & Productivity Survey
www.pedsderm.net 2016 Society for Pediatric Dermatology P a g e | 22
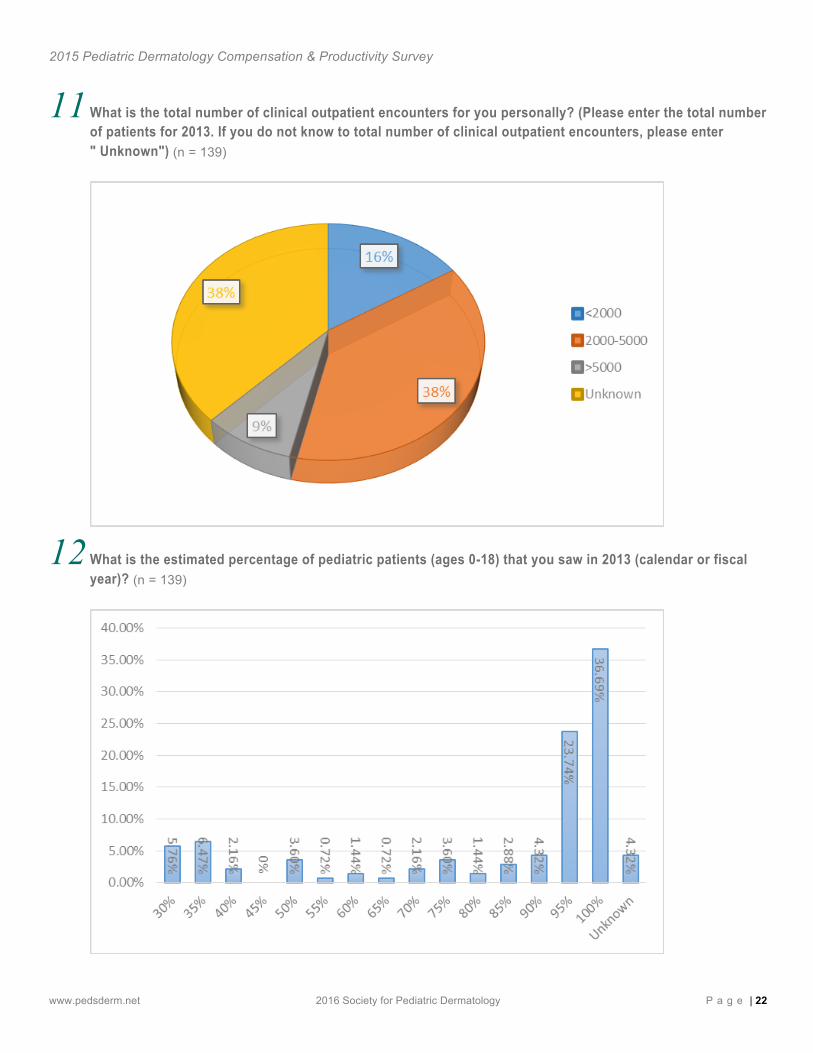
11 What is the total number of clinical outpatient encounters for you personally? (Please enter the total number of patients for 2013. If you do not know to total number of clinical outpatient encounters, please enter " Unknown") (n = 139)
12 What is the estimated percentage of pediatric patients (ages 0-18) that you saw in 2013 (calendar or fiscal year)? (n = 139)
2015 Pediatric Dermatology Compensation & Productivity Survey
www.pedsderm.net 2016 Society for Pediatric Dermatology P a g e | 23
13 What was your total compensation, including productivity bonuses (in dollars), for 2013 calendar or fiscal year? Please enter amount in dollars, e.g.: $1,000.00. (n = 132) Results listed on page 11 – 12.
14 How was your compensation for patient care determined? (n = 132)
15 If you have RVU data available for 2013, what was your work RVU (wRVU) total billed under you? This includes NPs, PAs, and RNs that bill under you. Please enter total wRVUs. If you do not know the total wRVUs, please enter "Unknown". (n = 132) Results listed on page 12 - 13.
16 What was your individual total wRVU? Excludes mid-level providers and fellows. Please enter your individual wRVU. If you do not know your individual wRVU, please enter "Unknown". (n = 132) Results listed on page 12 - 13.
2015 Pediatric Dermatology Compensation & Productivity Survey
www.pedsderm.net 2016 Society for Pediatric Dermatology P a g e | 24
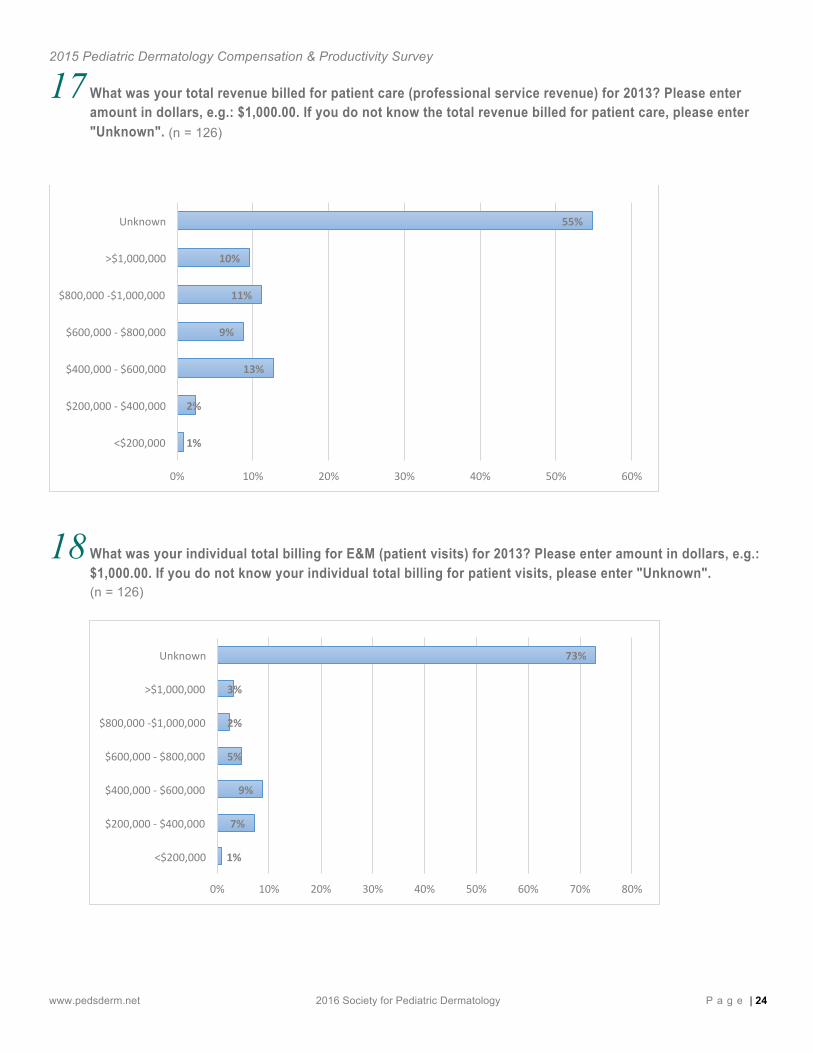
17 What was your total revenue billed for patient care (professional service revenue) for 2013? Please enter amount in dollars, e.g.: $1,000.00. If you do not know the total revenue billed for patient care, please enter "Unknown". (n = 126)
18 What was your individual total billing for E&M (patient visits) for 2013? Please enter amount in dollars, e.g.: $1,000.00. If you do not know your individual total billing for patient visits, please enter "Unknown". (n = 126)
1%
2%
13%
9%
11%
10%
55%
0% 10% 20% 30% 40% 50% 60%
<$200,000
$200,000 -‐ $400,000
$400,000 -‐ $600,000
$600,000 -‐ $800,000
$800,000 -‐$1,000,000
>$1,000,000
Unknown
1%
7%
9%
5%
2%
3%
73%
0% 10% 20% 30% 40% 50% 60% 70% 80%
<$200,000
$200,000 -‐ $400,000
$400,000 -‐ $600,000
$600,000 -‐ $800,000
$800,000 -‐$1,000,000
>$1,000,000
Unknown
2015 Pediatric Dermatology Compensation & Productivity Survey
www.pedsderm.net 2016 Society for Pediatric Dermatology P a g e | 25
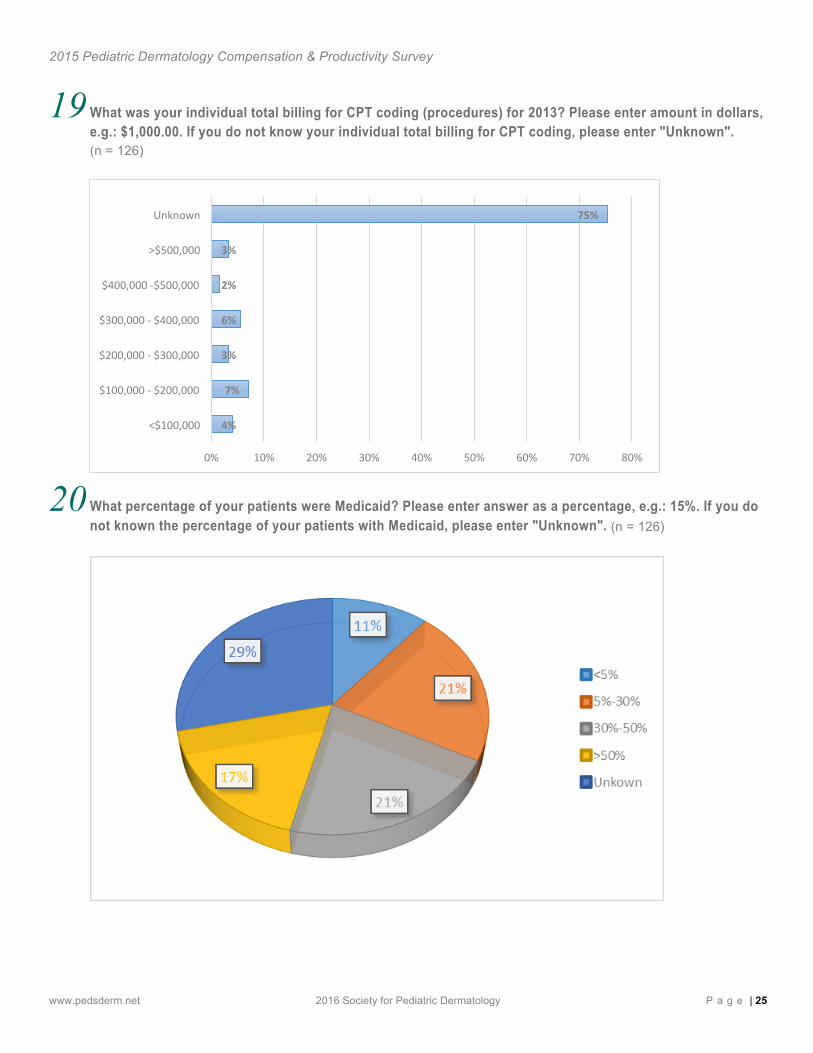
19 What was your individual total billing for CPT coding (procedures) for 2013? Please enter amount in dollars, e.g.: $1,000.00. If you do not know your individual total billing for CPT coding, please enter "Unknown". (n = 126)
20 What percentage of your patients were Medicaid? Please enter answer as a percentage, e.g.: 15%. If you do not known the percentage of your patients with Medicaid, please enter "Unknown". (n = 126)
4%
7%
3%
6%
2%
3%
75%
0% 10% 20% 30% 40% 50% 60% 70% 80%
<$100,000
$100,000 -‐ $200,000
$200,000 -‐ $300,000
$300,000 -‐ $400,000
$400,000 -‐$500,000
>$500,000
Unknown
2015 Pediatric Dermatology Compensation & Productivity Survey
www.pedsderm.net 2016 Society for Pediatric Dermatology P a g e | 26
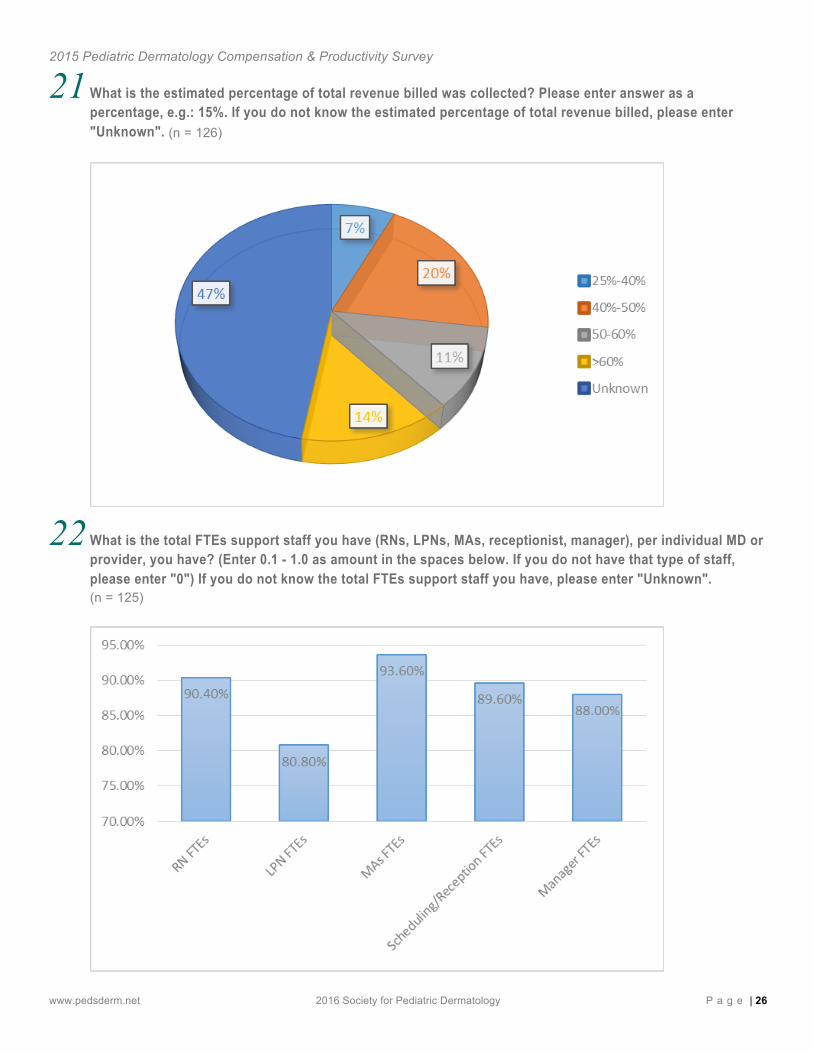
21 What is the estimated percentage of total revenue billed was collected? Please enter answer as a percentage, e.g.: 15%. If you do not know the estimated percentage of total revenue billed, please enter "Unknown". (n = 126)
22 What is the total FTEs support staff you have (RNs, LPNs, MAs, receptionist, manager), per individual MD or provider, you have? (Enter 0.1 - 1.0 as amount in the spaces below. If you do not have that type of staff, please enter "0") If you do not know the total FTEs support staff you have, please enter "Unknown". (n = 125)
2015 Pediatric Dermatology Compensation & Productivity Survey
www.pedsderm.net 2016 Society for Pediatric Dermatology P a g e | 27
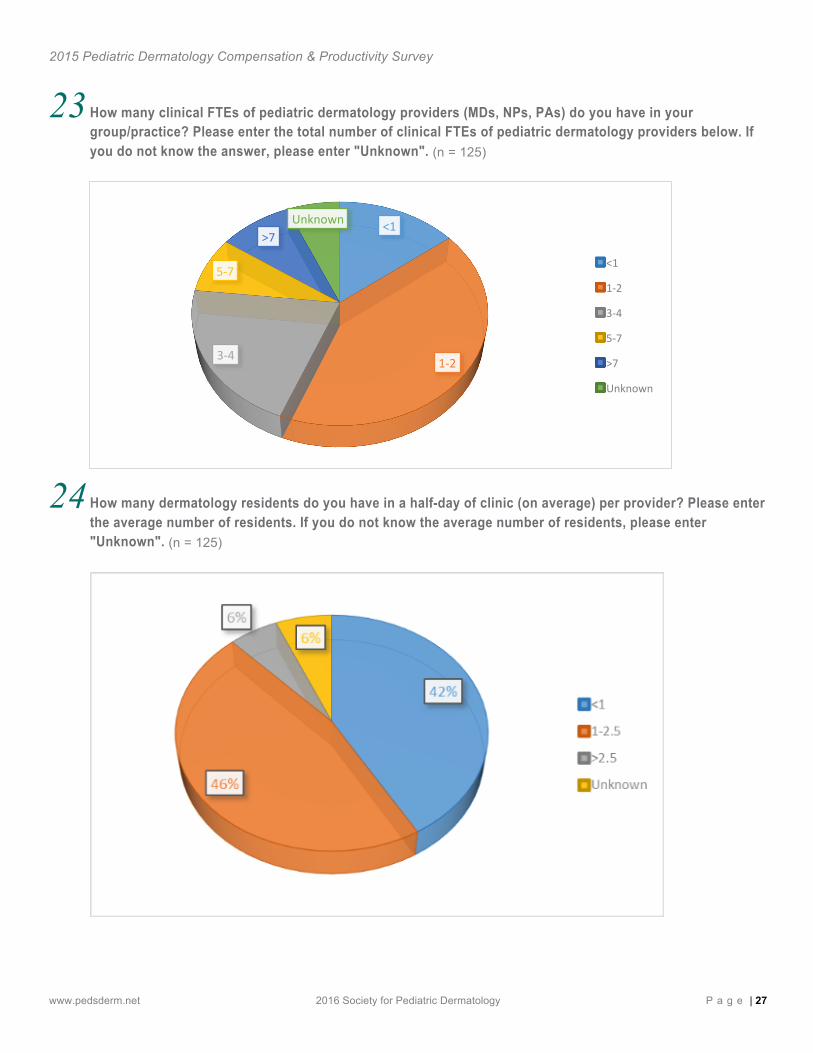
23 How many clinical FTEs of pediatric dermatology providers (MDs, NPs, PAs) do you have in your group/practice? Please enter the total number of clinical FTEs of pediatric dermatology providers below. If you do not know the answer, please enter "Unknown". (n = 125)
24 How many dermatology residents do you have in a half-day of clinic (on average) per provider? Please enter the average number of residents. If you do not know the average number of residents, please enter "Unknown". (n = 125)
<1
1-‐2 3-‐4
5-‐7
>7 Unknown
<1
1-‐2
3-‐4
5-‐7
>7
Unknown
2015 Pediatric Dermatology Compensation & Productivity Survey
www.pedsderm.net 2016 Society for Pediatric Dermatology P a g e | 28
25 Do you have pediatric dermatology fellows in your clinic? (n = 125)
26 If you collaborate with a physician extender (i.e. physician assistant or nurse practitioner), what is their total FTE per provider in the group? For example, if you have 5 providers and 2 physician extenders, your FTE would be 2/5 and you would answer 0.4 FTE below. Please enter the number of total FTEs below. If you do not know the total number of FTEs, please enter "Unknown". (n = 125)
2015 Pediatric Dermatology Compensation & Productivity Survey
www.pedsderm.net 2016 Society for Pediatric Dermatology P a g e | 29
27 If you are compensated for collaborating with a physician extender, how is this accomplished? (n = 125)
28 How many days until your next available new patient visit? Please enter your answer in number form below. If you do not known the number of days until your next available new patient visit, please enter "Unknown". (n = 125)
<10
10-‐30
30-‐60
>60
Unknown
<10
10-‐30
30-‐60
>60
Unknown
2015 Pediatric Dermatology Compensation & Productivity Survey
www.pedsderm.net 2016 Society for Pediatric Dermatology P a g e | 30
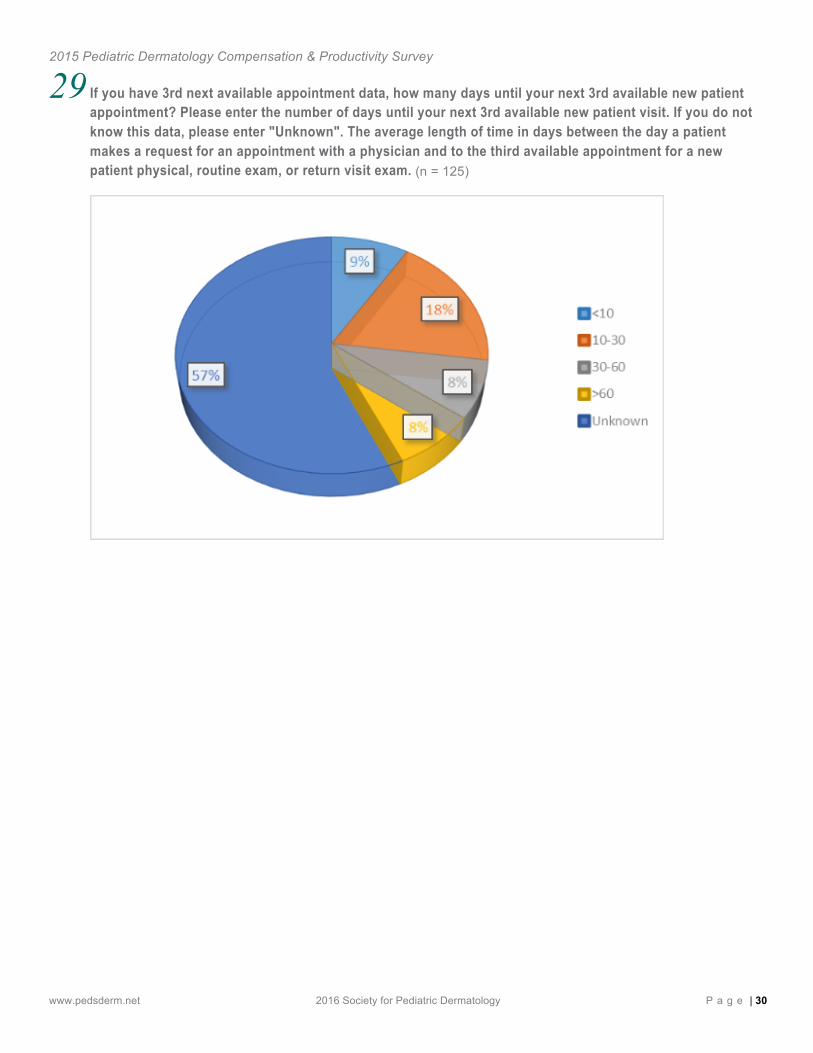
29 If you have 3rd next available appointment data, how many days until your next 3rd available new patient appointment? Please enter the number of days until your next 3rd available new patient visit. If you do not know this data, please enter "Unknown". The average length of time in days between the day a patient makes a request for an appointment with a physician and to the third available appointment for a new patient physical, routine exam, or return visit exam. (n = 125)
2015 Pediatric Dermatology Compensation & Productivity Survey
www.pedsderm.net 2016 Society for Pediatric Dermatology P a g e | 31
Appendix Or ig ina l Su rvey Ques t ions W i thou t Responses
1. How do you describe your practice type? 2. If academic, what is your rank? 3. How many years in practice? 4. In what region of the country do you practice? 5. How would you describe your practice: 6. What is your total estimated full-time equivalent (FTE) level (clinical, administrative, other responsibilities) for
2013 calendar or fiscal year? For example, if you work full-time, you are 1.0. If you work in any capacity halftime, you are 0.5. Full-time FTEs are defined as 40 hours per week total time in all your responsibilities.
7. What is your clinical FTE? Clinical FTE is the time that you spend in clinical care. Full CLINICAL FTEs is defined as 10, four-hour, half-day clinics, which is equivalent to 40 hours or 1.0 FTEs.
8. Do you receive grants that support research time? 9. Do you have administrative responsibilities that support your salary (paid medical directorships, division chief,
committees, etc.)? 10. What is the average number of hours you spend weekly on (inpatient) consultations? (If you do not know the
number of hours you spend on inpatient consultations, please enter "Unknown".) 11. What is the total number of clinical outpatient encounters for you personally? (Please enter the total number of
patients for 2013. If you do not know to total number of clinical outpatient encounters, please enter " Unknown") 12. What is the estimated percentage of pediatric patients (ages 0-18) that you saw in 2013 (calendar or fiscal
year)? 13. What was your total compensation, including productivity bonuses (in dollars), for 2013 calendar or fiscal year?
Please enter amount in dollars, e.g.: $1,000.00. 14. How was your compensation for patient care determined? 15. If you have RVU data available for 2013, what was your work RVU (wRVU) total billed under you? This includes
NPs, PAs, and RNs that bill under you. Please enter total wRVUs. If you do not know the total wRVUs, please enter "Unknown".
16. What was your individual total wRVU? Excludes mid-level providers and fellows. Please enter your individual wRVU. If you do not know your individual wRVU, please enter "Unknown".
17. What was your total revenue billed for patient care (professional service revenue) for 2013? Please enter amount in dollars, e.g.: $1,000.00. If you do not know the total revenue billed for patient care, please enter "Unknown".
18. What was your individual total billing for E&M (patient visits) for 2013? Please enter amount in dollars, e.g.: $1,000.00. If you do not know your individual total billing for patient visits, please enter "Unknown
19. What was your individual total billing for CPT coding (procedures) for 2013? Please enter amount in dollars, e.g.: $1,000.00. If you do not know your individual total billing for CPT coding, please enter "Unknown".
20. What percentage of your patients were Medicaid? Please enter answer as a percentage, e.g.: 15%. If you do not known the percentage of your patients with Medicaid, please enter "Unknown".
21. What is the estimated percentage of total revenue billed was collected? Please enter answer as a percentage, e.g.: 15%. If you do not know the estimated percentage of total revenue billed, please enter "Unknown".
22. What is the total FTEs support staff you have (RNs, LPNs, MAs, receptionist, manager), per individual MD or provider, you have? (Enter 0.1 - 1.0 as amount in the spaces below. If you do not have that type of staff, please enter "0") If you do not know the total FTEs support staff you have, please enter "Unknown".
2015 Pediatric Dermatology Compensation & Productivity Survey
www.pedsderm.net 2016 Society for Pediatric Dermatology P a g e | 32
23. How many clinical FTEs of pediatric dermatology providers (MDs, NPs, PAs) do you have in your
group/practice? Please enter the total number of clinical FTEs of pediatric dermatology providers below. If you do not know the answer, please enter "Unknown".
24. How many dermatology residents do you have in a half-day of clinic (on average) per provider? Please enter the average number of residents. If you do not know the average number of residents, please enter "Unknown".
25. Do you have pediatric dermatology fellows in your clinic? 26. If you collaborate with a physician extender (i.e. physician assistant or nurse practitioner), what is their total FTE
per provider in the group? For example, if you have 5 providers and 2 physician extenders, your FTE would be 2/5 and you would answer 0.4 FTE below. Please enter the number of total FTEs below. If you do not know the total number of FTEs, please enter "Unknown".
27. If you are compensated for collaborating with a physician extender, how is this accomplished? 28. How many days until your next available new patient visit? Please enter your answer in number form below. If
you do not known the number of days until your next available new patient visit, please enter "Unknown". 29. If you have 3rd next available appointment data, how many days until your next 3rd available new patient
appointment? Please enter the number of days until your next 3rd available new patient visit. If you do not know this data, please enter "Unknown". The average length of time in days between the day a patient makes a request for an appointment with a physician and to the third available appointment for a new patient physical, routine exam, or return visit exam.
Me thodo logy The questions for the Compensation and Productivity survey were put together under the direction of Dr. Joe Conlon, chair of the SPD's Practice Management Committee with significant input from Dr. Beth Drolet, SPD's 2014-2015 president, Dr. Leslie Lawley, SPD's VP of Membership and Practice Management and SPD staff.
The survey was circulated to all actively practicing SPD members in the United States via mail (print survey) and email (electronic survey) in early 2015. The SPD requested individual member information from the member's 2013 calendar year or their 2013 fiscal year - 1 complete 12 month cycle. Initial area of focus was compensation (salary, production, bonuses, other), work volume (patients seen per unit of time, total patients), and productivity (RVUs, total revenue billed, total collections).
The raw data received from survey responses was sorted into appropriate data sets and a confidence interval was calculated based on each sample’s standard deviation (SD). Those data falling within the SD confidence interval provided the basis for the reported 25th, 50th, and 75th %ile for each data set.