2015 NPS National Transit Inventory and … National Transit Inventory and Performance Report. 2015...
55
NPS National Transit Inventory and Performance Report, 2015 National Park Service Washington Support Office
-
Upload
truonghanh -
Category
Documents
-
view
218 -
download
1
Transcript of 2015 NPS National Transit Inventory and … National Transit Inventory and Performance Report. 2015...

NPS National Transit Inventory and Performance Report, 2015
National Park ServiceWashington Support Office
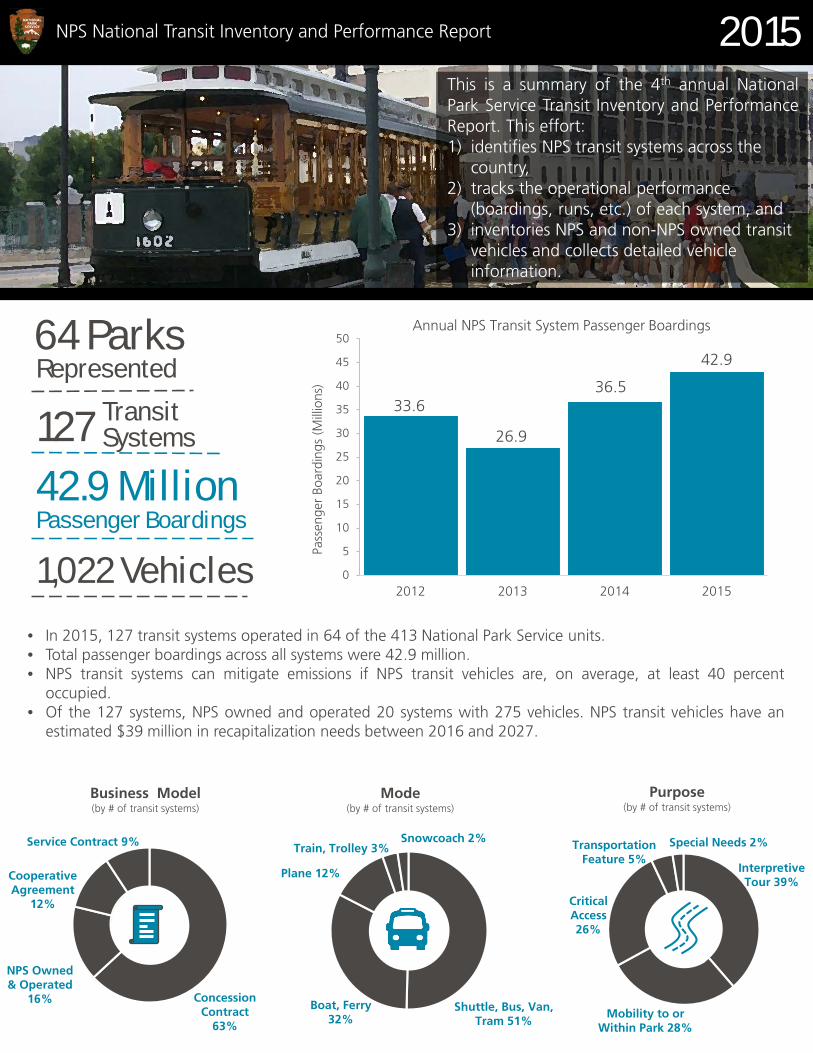
64 ParksRepresented
12742.9 MillionPassenger Boardings
1,022 Vehicles
33.6
26.9
36.5
42.9
0
5
10
15
20
25
30
35
40
45
50
2012 2013 2014 2015
Pass
enge
r Bo
ardi
ngs
(Mill
ions
)
• In 2015, 127 transit systems operated in 64 of the 413 National Park Service units.• Total passenger boardings across all systems were 42.9 million.• NPS transit systems can mitigate emissions if NPS transit vehicles are, on average, at least 40 percent
occupied.• Of the 127 systems, NPS owned and operated 20 systems with 275 vehicles. NPS transit vehicles have an
estimated $39 million in recapitalization needs between 2016 and 2027.
Concession Contract
63%
NPS Owned & Operated
16%
Cooperative Agreement
12%
Service Contract 9%
NPS National Transit Inventory and Performance Report 2015 This is a summary of the 4th annual NationalPark Service Transit Inventory and PerformanceReport. This effort:1) identifies NPS transit systems across the
country, 2) tracks the operational performance
(boardings, runs, etc.) of each system, and 3) inventories NPS and non-NPS owned transit
vehicles and collects detailed vehicle information.
Shuttle, Bus, Van, Tram 51%
Boat, Ferry32%
Plane 12%
Train, Trolley 3%Snowcoach 2%
Interpretive Tour 39%
Mobility to or Within Park 28%
Critical Access26%
Transportation Feature 5%
Special Needs 2%
Annual NPS Transit System Passenger Boardings
TransitSystems
Business Model(by # of transit systems)
Mode(by # of transit systems)
Purpose(by # of transit systems)
NPS National Transit Inventory and Performance Report 2015
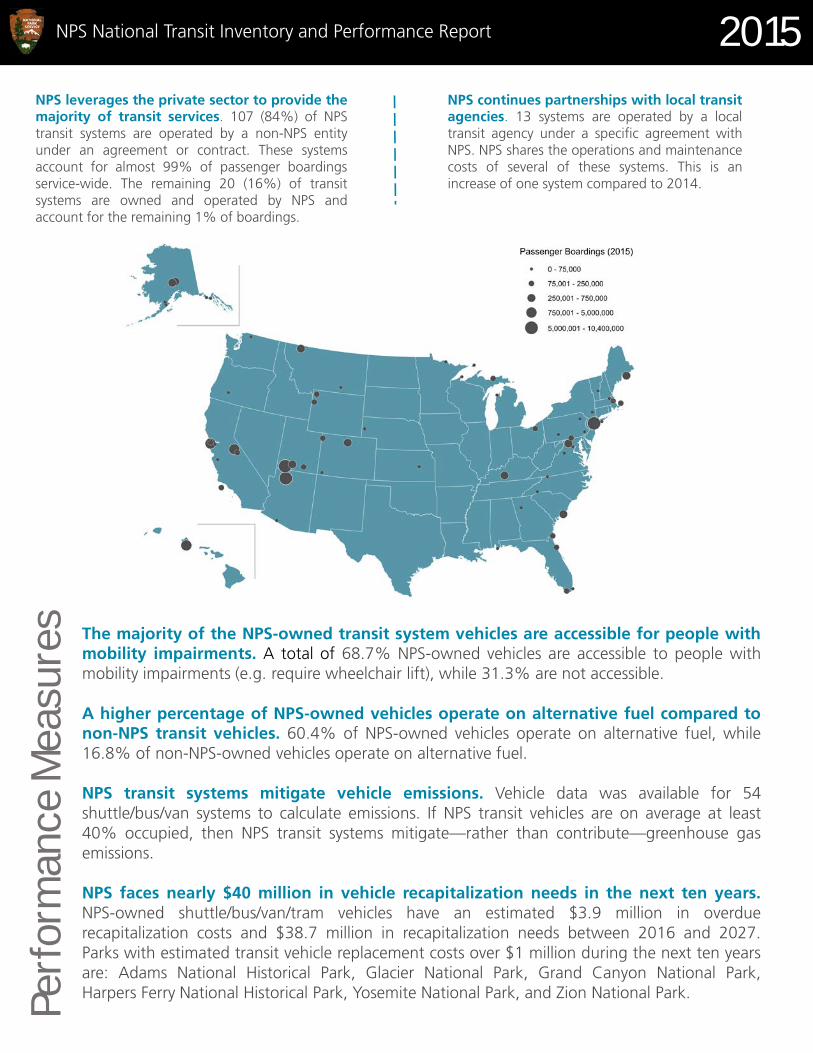
The majority of the NPS-owned transit system vehicles are accessible for people withmobility impairments. A total of 68.7% NPS-owned vehicles are accessible to people withmobility impairments (e.g. require wheelchair lift), while 31.3% are not accessible.
A higher percentage of NPS-owned vehicles operate on alternative fuel compared tonon-NPS transit vehicles. 60.4% of NPS-owned vehicles operate on alternative fuel, while16.8% of non-NPS-owned vehicles operate on alternative fuel.
NPS transit systems mitigate vehicle emissions. Vehicle data was available for 54shuttle/bus/van systems to calculate emissions. If NPS transit vehicles are on average at least40% occupied, then NPS transit systems mitigate—rather than contribute—greenhouse gasemissions.
NPS faces nearly $40 million in vehicle recapitalization needs in the next ten years.NPS-owned shuttle/bus/van/tram vehicles have an estimated $3.9 million in overduerecapitalization costs and $38.7 million in recapitalization needs between 2016 and 2027.Parks with estimated transit vehicle replacement costs over $1 million during the next ten yearsare: Adams National Historical Park, Glacier National Park, Grand Canyon National Park,Harpers Ferry National Historical Park, Yosemite National Park, and Zion National Park.
NPS leverages the private sector to provide themajority of transit services. 107 (84%) of NPStransit systems are operated by a non-NPS entityunder an agreement or contract. These systemsaccount for almost 99% of passenger boardingsservice-wide. The remaining 20 (16%) of transitsystems are owned and operated by NPS andaccount for the remaining 1% of boardings.
Perfo
rman
ce M
easu
res
NPS continues partnerships with local transitagencies. 13 systems are operated by a localtransit agency under a specific agreement withNPS. NPS shares the operations and maintenancecosts of several of these systems. This is anincrease of one system compared to 2014.
NPS National Transit Inventory and Performance Report, 2015 ii
Table of Contents
List of Figures ....................................................................................................... iii
List of Tables ......................................................................................................... iii
Acronyms .............................................................................................................. iv
Introduction ........................................................................................................... 5
Data Collection and Methodology .................................................................................... 5
Inventory Results ................................................................................................... 7
Inventory Base-Data ......................................................................................................... 7 System Characteristics ...................................................................................................... 9 Passenger Boardings ...................................................................................................... 11 Vehicles ......................................................................................................................... 19
Performance Measures ........................................................................................ 23
Visitor Experience .......................................................................................................... 23 Operations .................................................................................................................... 24 Environmental Impact .................................................................................................... 25 Asset Management ........................................................................................................ 27
Next Steps ............................................................................................................ 30
Appendix .............................................................................................................. 31
Appendix A – Acknowledgments .................................................................................... 31 Appendix B – Definition of Transit .................................................................................. 34 Appendix C – NPS Alternative Transportation Program Goals and Objectives .................... 37 Appendix D – 2015 NPS National Inventory System List ................................................... 39 Appendix E – Estimated CO2 Emissions Methodology ...................................................... 47 Appendix F – Vehicle Replacement Assumptions ............................................................. 49
NPS National Transit Inventory and Performance Report, 2015 iii
List of Figures Figure 1: Systems by primary purpose ......................................................................................................... 9 Figure 2: Systems by mode .......................................................................................................................... 10 Figure 3: Systems by business model .......................................................................................................... 11 Figure 4: System locations and passenger boardings ............................................................................... 14 Figure 5: Passenger boardings by NPS region........................................................................................... 15 Figure 6: Systems by passenger boardings ................................................................................................. 16 Figure 7: Passenger boardings by mode ..................................................................................................... 17 Figure 8: Passenger boardings by business model .................................................................................... 18 Figure 9: Fleet ownership by business model ........................................................................................... 19 Figure 10: Fleet: conventional vs. alternative fuel vehicles by ownership ............................................ 20 Figure 11: Number of vehicles by fuel type ............................................................................................... 21 Figure 12: Number of systems by fleet size ............................................................................................... 21 Figure 13: All vehicles by age class (years) ................................................................................................. 22 Figure 14: NPS-owned vehicle accessibility .............................................................................................. 23 Figure 15: Percent change in boardings from 2012 to 2015 .................................................................... 24 Figure 16: Estimated net CO2 emissions at various occupancy levels ................................................... 26
List of Tables Table 1: NPS transit systems changes between 2012 and 2015 inventories ............................................ 7 Table 2: Count methodology ...................................................................................................................... 12 Table 3: Passenger boardings for the 10 highest use transit systems ..................................................... 12 Table 4: Distribution of miles and CO2 emissions (metric tons) by vehicle ownership ...................... 25 Table 5: Estimated net CO2 emissions (metric tons) by vehicle ownership .......................................... 26 Table 6: Vehicle age for NPS transit vehicle types ................................................................................... 27 Table 7: Estimated NPS-owned shuttle/bus/tram/van overdue recapitalization needs, up to 2015 . 28 Table 8: Estimated NPS-owned shuttle/bus/tram/van rolling stock capital needs, 2016-2027 ......... 29
NPS National Transit Inventory and Performance Report, 2015 iv
Acronyms The following acronyms are used in this report: AKR Alaska Region ATP Alternative Transportation Program ATSLAM Alternative Transportation Systems Lifecycle Asset Management BISC Biscayne National Park BOHA Boston Harbor Islands National Recreation Area CHIS Channel Islands National Park CO2 Carbon Dioxide EVER Everglades National Park FBMS Financial and Business Management System GLAC Glacier Bay National Park GLCA Glen Canyon National Recreation Area IMR Intermountain Region MABI Marsh-Billings-Rockefeller National Historic Park MAP-21 Moving Ahead for Progress in the 21st Century MWR Midwest Region NAMA National Mall and Memorial Parks NCR National Capital Region NER Northeast Region NPS National Park Service PWR Pacific West Region SER Southeast Region SOCC Sustainable Operations and Climate Change TAPR Tall Grass Prairie National Preserve TRIP Paul S. Sarbanes Transit in Parks Program VALR Valor in the Pacific National Monument VMT Vehicle Miles Traveled YOSE Yosemite National Park

NPS National Transit Inventory and Performance Report, 2015 5
Introduction The fourth annual National Park Service (NPS) Transit Inventory and Performance Report communicates the service-wide outcomes and status of NPS transit systems (see Appendix A for acknowledgements). The 2012 inventory1 was the first comprehensive listing of these systems since 1998, covering surface, waterborne, and air systems. The 2012 inventory established a working definition of NPS transit systems for the purpose of this document; helped NPS comply with 23 U.S Code 203(c),2 which requires “a comprehensive national inventory of public Federal lands transportation facilities;” and, fulfilled other internal needs.
The 2015 inventory is meant to assist the NPS:
Advance NPS transit performance measurement; Capture asset management and operational information not captured by current NPS systems of
record; Supports the Green Parks Plan, the National Long Range Transportation Plan, Regional Long
Range Transportation Plans, A Call to Action, and the Capital Investment Strategy by providing key transit statistics, which can also be used to track progress towards goals;
Integrate transit data with NPS systems of record, including asset management data in the Facility and Business Management System for NPS-owned vehicles;
Comply with Executive Order 13514, which requires federal agencies to measure, manage, and reduce greenhouse gas emissions; and
Communicate program information and projected vehicle (but not infrastructure) recapitalization needs internally and externally.
Data Collection and Methodology The NPS has used the same objective definition of NPS transit systems for the transit inventory since 2012 to ensure consistent data collection across the nation and over time. Only units with systems that meet each of the following three criteria are included in this effort (see Appendix B for more information):
1. Moves people by motorized vehicle on a regularly scheduled service;3 2. Operates under one of the following business models: concessions contract; service contract;
partner agreement including memorandum of understanding, memorandum of agreement, or cooperative agreement (commercial use authorizations are not included); or NPS-owned and operated;4 and
3. All routes and services at a given unit that are operated under the same business model by the same operator are considered a single NPS transit system.
1 NPS National Transit Inventory, 2012. http://ntl.bts.gov/lib/47000/47800/47871/NPS_WASO_2013_Transit_Inventory.pdf
2 23 U.S. Code 203 Federal lands transportation program: https://www.gpo.gov/fdsys/pkg/USCODE-2014-title23/pdf/USCODE-2014-title23-chap2-sec203.pdf
3 Services with a posted schedule that have standard operating seasons/days of week/hours. Services which do not operate on a fixed route, or exist for the sole purpose of providing access to persons with disabilities, are not included.
4 For the purposes of the NPS transit inventories, no distinction is drawn between memorandum of understanding, memorandum of agreement, and cooperative agreement. All are recorded as “cooperative agreement.”

NPS National Transit Inventory and Performance Report, 2015 6
The 2015 NPS Transit Inventory is limited to systems in which the NPS either has a direct financial stake or has committed resources to develop a formal contract or agreement.
The majority of systems tend to collect information on a calendar year cycle (January through December), therefore the following information was collected for the 2015 calendar year:
Transit system name and description; Passenger boardings; Business model; System purpose; System type/mode; Vehicle information including fuel type, capacity, service miles, accessibility, and age (individual
vehicle information for NPS-owned vehicles and system-level information for non-NPS vehicles); Vehicle information that is mandatory in the NPS’s Financial and Business Management System
(FBMS); Owner and operator type (NPS or non-NPS) and contact information; and Participation of a local transit agency in the service.
The following steps were taken to update the inventory:
Using the 2014 National NPS Transit Inventory as a starting point, regional transportation program coordinators identified new, closed, or consolidated systems, and updated unit contact information.
64 park units were contacted to collect information, primarily using an online form, or through email or phone. Some parks reported incomplete information because they do not track the requested service information or they could not provide the information before the end of the data call. All units responded except for two,5 although some units did not report data for all of their systems.6
Data collection efforts were coordinated with known data sources, such as FBMS and the 15 Transportation Fee Parks, to avoid duplicate data calls for park staff.
Appendix D includes a full list of surveyed transit systems by region.
5 Wolf Trap National Park for the Performing Arts did not provide data for the Fairfax Connectors Wolf Trap Express. Glacier Bay National Park (GLBA) did not report data for the airport shuttle or day boat tour.
6 Several units provided data for some systems at their park, but not all. These non-reporting systems include: Sailors Haven Ferry at Fire Island National Sea Shore and the Yellowstone National Park snow coach system operated by Gary Fales Outfitting Inc.

NPS National Transit Inventory and Performance Report, 2015 7
Inventory Results Detailed findings of the 2015 inventory are presented in the following sections:
Inventory Base-Data System Characteristics Passenger Boardings Vehicle Data Performance Measures
Inventory Base-Data Table 1 summarizes the differences in key findings of the NPS National Transit Inventory and Performance Report results from 2012 through 2015.
Table 1: NPS transit systems changes between 2012 and 2015 inventories Source: 2012 - 2015 NPS National Transit Inventory data
Key Findings 2012 2013 2014 2015
Number of Systems 147 131 121 127
Number of Parks Represented 68 66 63 64
Passenger Boardings 33.2 million 26.9 million 36.5 million 42.9 million
Excluding 10 highest ridership systems 6.1 million 5.9 million 5.6 million 7.2 million
Number of Vehicles 890 927 982 1,022
NPS-Owned 323 278 274 275
Non-NPS 567 651 708 747
Systems operated by Local Transit Agency 12 12 12 13
Three systems were not active or discontinued in 2015. The Biscayne (BISC) National Underwater Park Tour was not active due to contracting issues, and may commence service in 2017 under a new concessions contract. The Yosemite National Park (YOSE) Big Trees Tram Tour (Mariposa Grove Tram) was discontinued at the end of 2014 due to the rehabilitation of the Mariposa Grove. The Marsh-Billings-Rockefeller National Historical Park (MABI) Full Circle Trolley was a pilot project and was discontinued at the end of 2014.
Two new systems were added to the inventory in 2015, the DC Circulator at the National Mall and Memorial Parks (NAMA), and the Key West Sea Plane Adventures at Everglades National Park (EVER). Three systems resumed service in 2015: the Boston Lighthouse Tour at the Boston Harbor Islands National Recreation Area (BOHA); the Antelope Point ferry at the Glen Canyon National Recreation Area (GLCA); and the Tall Grass Prairie National Preserve (TAPR) shuttle bus. Additionally, existing systems at Yellowstone (YELL) were reclassified, accounting for four additional systems in 2015.
There was an approximately 17.5 percent increase in passenger boardings between 2014 and 2015. This increase was led by boarding increases on the Zion National Park Canyon Shuttle (1.3 million additional boardings) and on the Word War II Valor in the Pacific National Monument’s (VALR) USS Arizona
NPS National Transit Inventory and Performance Report, 2015 8
Memorial Tour (1.6 million additional boardings). It is important to note that more accurate passenger boarding data may have contributed to the increase as well.7
Five systems did not provide updated 2015 data. Those systems are excluded from any operations-related information presented (e.g. passenger boardings, service miles), but are included in general inventory data, since the vehicle type, system purpose, and business model did not change.
7 Due to a discrepancy, Channel Islands National Park (CHIS) underreported its 2014 passenger boarding data.

NPS National Transit Inventory and Performance Report, 2015 9
System Characteristics The 2015 inventory identified 127 discrete transit systems throughout 64 of the total 413 NPS units. Figure 1, Figure 2, and Figure 3 place these systems in the context of primary system purpose, mode, and business model. Results for system characteristics in 2015 are similar to the results reported previously in 2014.
System Purpose & Mode There are five purposes identified for transit systems and unit staff identified which one was the primary purpose for each system. Although transit systems often provide multiple purposes, unit staff identified the primary purpose of each system. System purposes are described below and depicted in Figure 1.
49 systems are guided interpretive tours;8 36 systems provide mobility to or within a park as a supplement to private automobile access; 33 systems provide critical access to an NPS unit or site that is not readily accessible to the public
due to geographic constraints, park resource management decisions, or parking lot congestion; 6 systems are considered a transportation feature (a primary attraction of the park unit); and, 3 systems meet the accessibility needs of visitors with special needs.
Figure 1: Systems by primary purpose (N=127 systems) Source: 2015 NPS National Transit Inventory data
8 In 2016, the definition of interpretative tours will be further refined to determine if all systems fit within the definition of transit used for the report.
Interpretive Tour49
39%
Mobility to or Within Park
3628%
Critical Access33
26%
Transportation Feature
65%
Special Needs3
2%
NPS National Transit Inventory and Performance Report, 2015 10
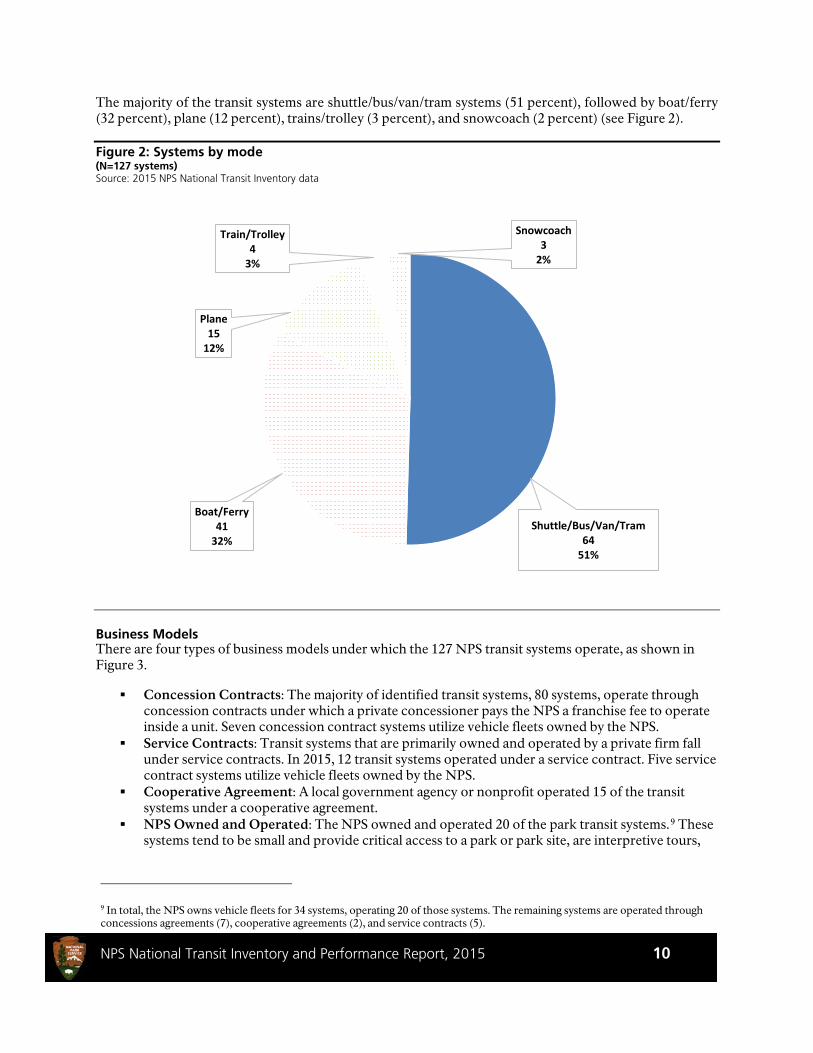
The majority of the transit systems are shuttle/bus/van/tram systems (51 percent), followed by boat/ferry (32 percent), plane (12 percent), trains/trolley (3 percent), and snowcoach (2 percent) (see Figure 2).
Figure 2: Systems by mode (N=127 systems) Source: 2015 NPS National Transit Inventory data
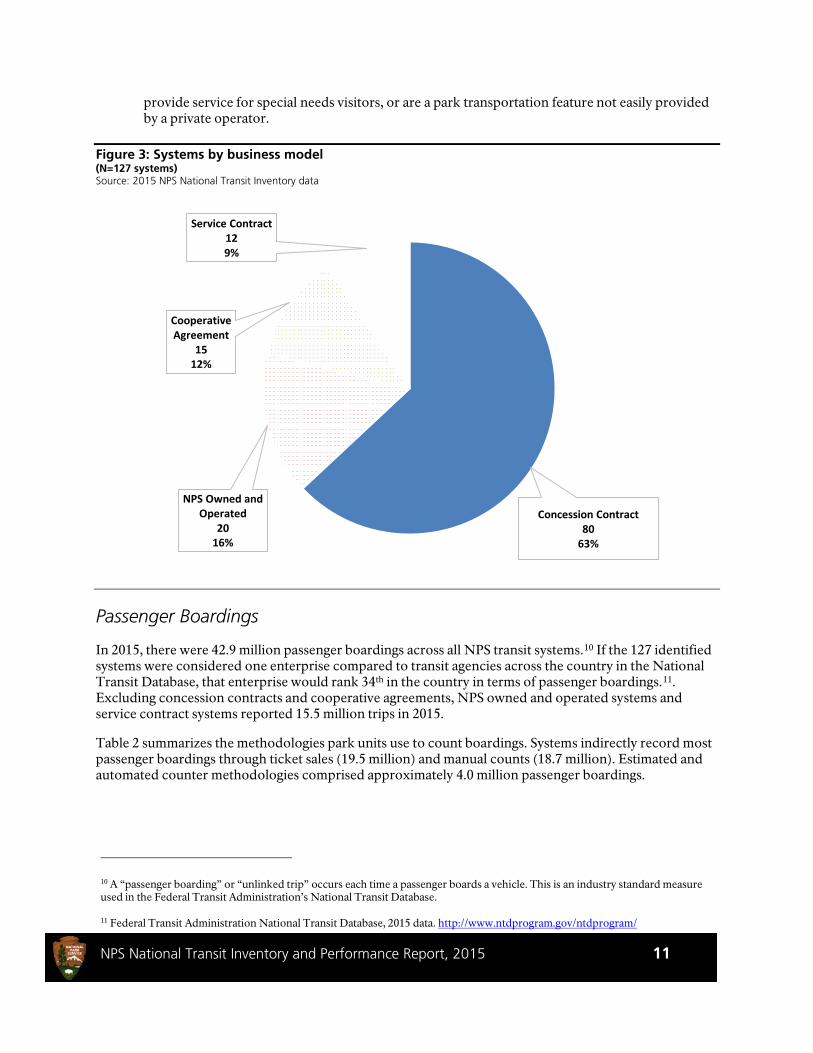
Business Models There are four types of business models under which the 127 NPS transit systems operate, as shown in Figure 3.
Concession Contracts: The majority of identified transit systems, 80 systems, operate through concession contracts under which a private concessioner pays the NPS a franchise fee to operate inside a unit. Seven concession contract systems utilize vehicle fleets owned by the NPS.
Service Contracts: Transit systems that are primarily owned and operated by a private firm fall under service contracts. In 2015, 12 transit systems operated under a service contract. Five service contract systems utilize vehicle fleets owned by the NPS.
Cooperative Agreement: A local government agency or nonprofit operated 15 of the transit systems under a cooperative agreement.
NPS Owned and Operated: The NPS owned and operated 20 of the park transit systems.9 These systems tend to be small and provide critical access to a park or park site, are interpretive tours,
9 In total, the NPS owns vehicle fleets for 34 systems, operating 20 of those systems. The remaining systems are operated through concessions agreements (7), cooperative agreements (2), and service contracts (5).
Shuttle/Bus/Van/Tram64
51%
Boat/Ferry41
32%
Plane15
12%
Train/Trolley4
3%
Snowcoach3
2%
NPS National Transit Inventory and Performance Report, 2015 11
provide service for special needs visitors, or are a park transportation feature not easily provided by a private operator.
Figure 3: Systems by business model (N=127 systems) Source: 2015 NPS National Transit Inventory data
Passenger Boardings In 2015, there were 42.9 million passenger boardings across all NPS transit systems.10 If the 127 identified systems were considered one enterprise compared to transit agencies across the country in the National Transit Database, that enterprise would rank 34th in the country in terms of passenger boardings.11. Excluding concession contracts and cooperative agreements, NPS owned and operated systems and service contract systems reported 15.5 million trips in 2015.
Table 2 summarizes the methodologies park units use to count boardings. Systems indirectly record most passenger boardings through ticket sales (19.5 million) and manual counts (18.7 million). Estimated and automated counter methodologies comprised approximately 4.0 million passenger boardings.
10 A “passenger boarding” or “unlinked trip” occurs each time a passenger boards a vehicle. This is an industry standard measure used in the Federal Transit Administration’s National Transit Database.
11 Federal Transit Administration National Transit Database, 2015 data. http://www.ntdprogram.gov/ntdprogram/
Concession Contract80
63%
NPS Owned and Operated
2016%
Cooperative Agreement
1512%
Service Contract129%

NPS National Transit Inventory and Performance Report, 2015 12
Table 2: Count methodology (N = 122 systems12) Source: 2015 NPS National Transit Inventory data
Count Methodology Number of Systems Passenger Boardings (Millions)
Ticket Sales 50 19.5
Manual Counts 58 18.7
Estimated 6 3.9
Automated Counter 2 0.1
Other 6 0.7
Approximately 83.3 percent (35.7 million) of boardings on NPS transit systems in 2015 are attributable to the 10 highest use transit systems (by boardings). Table 3 summarizes these systems and shows passenger boardings for 2015. Passenger boardings increased in 2015 for all of the top 10 systems. Table 3: Passenger boardings for the 10 highest use transit systems Source: 2015 NPS National Transit Inventory data
Rank Park System Name 2015 Boardings Business Model
System Purpose
1 STLI/ELIS Statue of Liberty Ferries 10,343,634 Concession Contract
Critical Access
2 GRCA South Rim Shuttle Service 7,419,961 Service Contract
Mobility to or within park
3 ZION Zion Canyon Shuttle 5,297,860 Service Contract
Critical Access
4 YOSE Yosemite Valley Shuttle 3,620,623 Concession Contract
Mobility to or Within Park
5 GOGA/ALCA Alcatraz Cruises ferry 3,390,850 Concession Contract
Critical Access
6 VALR USS Arizona Memorial Tour 2,673,896 Cooperative Agreement
Critical Access
7 NAMA Big Bus Tours Washington DC13 1,092,049 Concession Contract
Interpretative Tour
8 SAJU San Juan Trolley 739,891 Cooperative Agreement
Mobility to or Within Park
9 ROMO Bear Lake & Moraine Park shuttle, Hiker Shuttle to Estes Park 577,029 Service
Contract Critical Access
10 VALR Ford Island Tour 552,433 Service Contract
Interpretive Tour
12 An N of 122 is used to exclude the five systems that did not provide boarding information for 2015
13 In 2014, the Volpe Center completed a study on passenger boardings for NAMA Big Bus Tours Washington, DC. Using the multiplier found in the study, the corrected 2014 boardings are 1,292,372. The multiplier was used to calculate 2015 boardings.

NPS National Transit Inventory and Performance Report, 2015 13
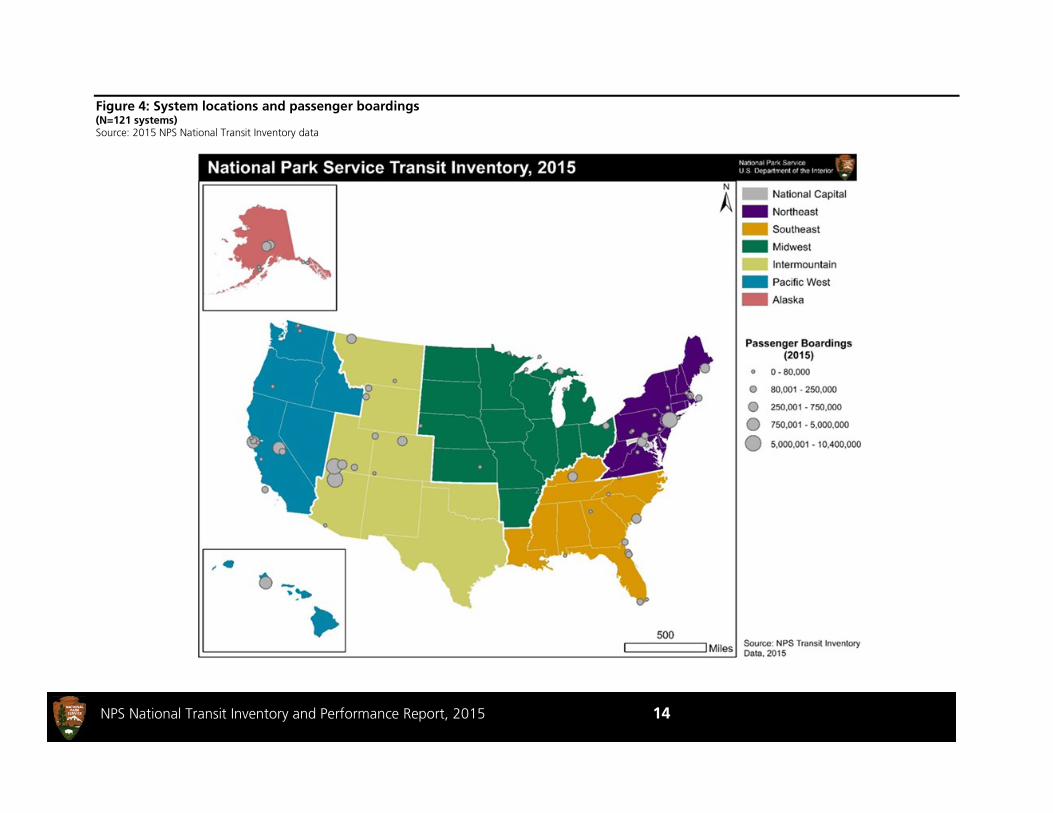
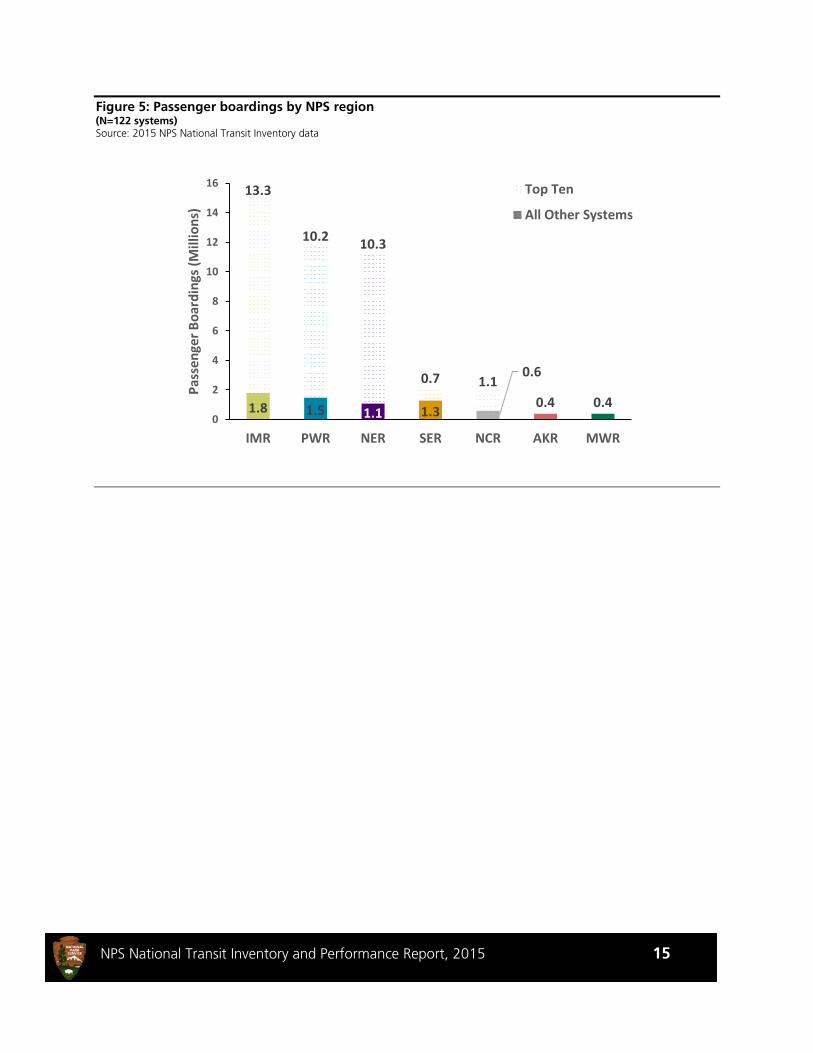
High-ridership shuttle systems are primarily provided via service contracts, while a greater proportion of the high-ridership water-based systems are provided through concession contracts. This likely reflects a greater business case for bidding out specialized water-based systems to concessioners. In many cases, these systems provide critical access to parks and park sites. High-ridership systems are located primarily in the NPS Intermountain, Northeast, and Pacific West Regions. The number of cooperative agreements with local transit agencies increased from 12 systems in 2014 to 13 systems in 2015 with the introduction of DC Circulator service to the National Mall. Those partnerships accounted for 5.7 million passenger boardings in 2015. Passenger boardings among NPS owned and operated systems (20 systems) accounted for approximately 636,000 passenger boardings. Most of these systems either provide critical access to a unit/site or an interpretive experience for visitors. The Intermountain and Northeast NPS regions each reported slightly more than 13 million passenger boardings in 2015, far exceeding other regions; however, if one were to remove the ten highest use systems from consideration, each region ranged from 400,000 to 1.8 million passenger boardings in 2015
Figure 4 shows the geographic distribution of the systems, along with the passenger boardings, and Figure 5 shows passenger boardings by region.
NPS National Transit Inventory and Performance Report, 2015 14
Figure 4: System locations and passenger boardings (N=121 systems) Source: 2015 NPS National Transit Inventory data
NPS National Transit Inventory and Performance Report, 2015 15
Figure 5: Passenger boardings by NPS region (N=122 systems) Source: 2015 NPS National Transit Inventory data
1.8 1.5 1.1 1.3
0.6
0.4 0.4
13.3
10.2 10.3
0.7 1.1
0
2
4
6
8
10
12
14
16
IMR PWR NER SER NCR AKR MWR
Pass
enge
r Boa
rdin
gs (M
illio
ns)
Top Ten
All Other Systems

NPS National Transit Inventory and Performance Report, 2015 16
Figure 6 depicts the number of systems and the cumulative total number of passenger boardings at different ranges of passenger boardings. The chart illustrates that while only 12 transit systems have over 500,000 passenger boardings, these systems comprise the largest increase in the cumulative total number of passenger boardings. Furthermore, 88 of the NPS transit systems had fewer than 100,000 passenger boardings, comprising 1.6 million of the total passenger boardings in 2015.
Figure 6: Systems by passenger boardings (N=127 systems) Source: 2015 NPS National Transit Inventory data
5
88
15
2 4 1
121.6 3.8
4.3 5.66.1
42.9
0
5
10
15
20
25
30
35
40
45
0
10
20
30
40
50
60
70
80
90
Unknown 0-100 100-200 200-300 300-400 400-500 Morethan 500
Pass
enge
r Boa
rdin
gs (M
illio
ns)
Num
ber o
f Sys
tem
s
Passenger Boardings (Thousands)
Number of Systems
Passenger Boardings

NPS National Transit Inventory and Performance Report, 2015 17
Over half of passenger boardings were on shuttles/buses/vans/trams systems (56 percent) and just under half were on boats/ferries (42 percent). Trains/trollies, planes, and snowcoaches accounted for only about two percent of all passenger boardings (see Figure 7).
Figure 7: Passenger boardings by mode (N=122 systems) Source: 2015 NPS National Transit Inventory data
5M (11.7%) 2M
(4.7%) 601K (1.4%)
44K (0.1%)
8K (0.01%)
19M (44.3%)
16M (37.3%)
0
5
10
15
20
25
30
Pass
enge
r Boa
rdin
gs (M
illio
ns)
Top Ten
All Other Systems
NPS National Transit Inventory and Performance Report, 2015 18
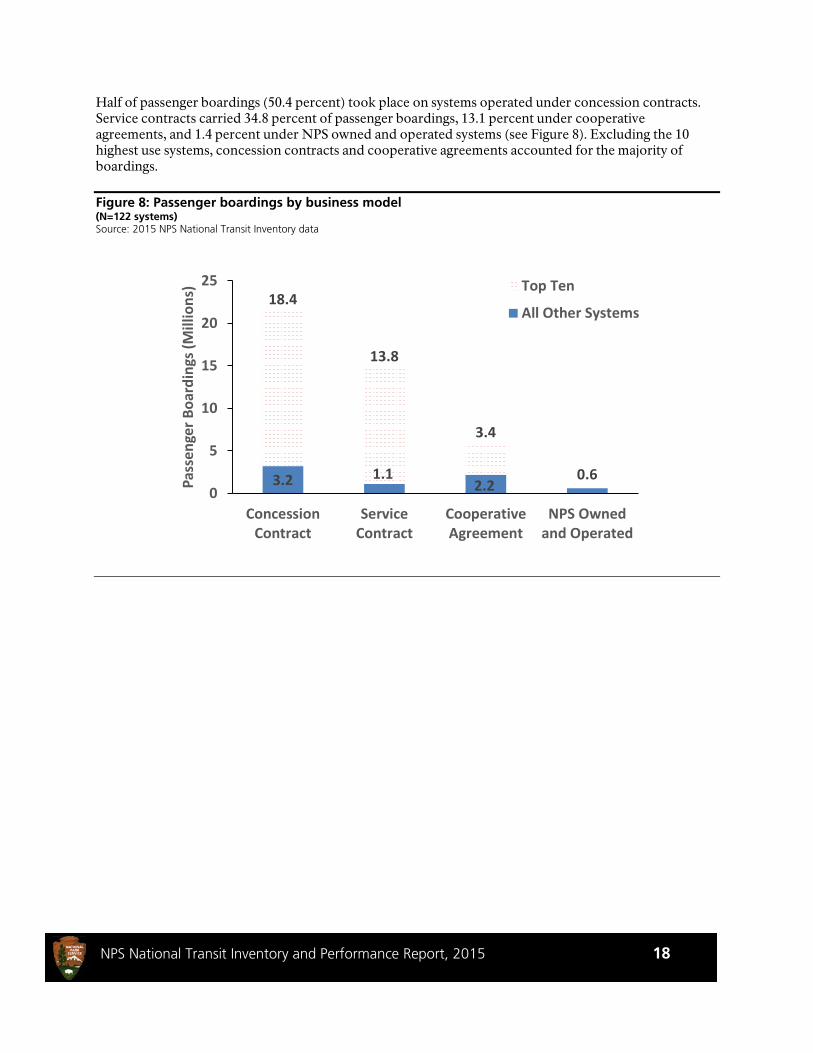
Half of passenger boardings (50.4 percent) took place on systems operated under concession contracts. Service contracts carried 34.8 percent of passenger boardings, 13.1 percent under cooperative agreements, and 1.4 percent under NPS owned and operated systems (see Figure 8). Excluding the 10 highest use systems, concession contracts and cooperative agreements accounted for the majority of boardings. Figure 8: Passenger boardings by business model (N=122 systems) Source: 2015 NPS National Transit Inventory data
3.2 1.12.2
0.6
18.4
13.8
3.4
0
5
10
15
20
25
ConcessionContract
ServiceContract
CooperativeAgreement
NPS Ownedand Operated
Pass
enge
r Boa
rdin
gs (M
illio
ns) Top Ten
All Other Systems

NPS National Transit Inventory and Performance Report, 2015 19
Vehicles
Vehicle Fleets Over half of the identified transit systems (80 systems, or 63 percent) operate under concession contracts, of which seven systems utilize vehicle fleets owned exclusively by the NPS.14 These seven fleets are among the 34 total fleets owned by the NPS. The NPS owned and operated 20 of the transit systems (16 percent). These systems tend to be small and provide critical access to a park or park site, are interpretive tours, provide service for special needs visitors, or are a park transportation feature not easily provided by a private operator. Transit systems managed through cooperative agreements account for 15 of the systems (12 percent), of which two of these systems utilize vehicle fleets owned exclusively by the NPS. The remaining 12 transit systems (9 percent) are operated under service contracts, of which five15 of these systems utilize vehicle fleets owned by the NPS.
Figure 9: Fleet ownership by business model (N=127 systems) Source: 2015 NPS National Transit Inventory data
14 The seven systems operating NPS-owned vehicles under a concession contract are: Glacier Red Bus Tours, North Cascades Rainbow Falls Tours, Yellowstone Historic Yellow Bus Tours, Yosemite Badger Pass Winter Shuttle, Yosemite Mariposa Grove Shuttle, Yosemite Tuolumne Shuttle, and the Yosemite Valley Shuttle.
15 The five systems operating NPS-owned vehicles under a service contract are: Adams Trolley, Grand Canyon South Rim Shuttle, Harper’s Ferry shuttle, Kennesaw Mountain shuttle, and the Zion Canyon shuttle.
720 2 5
6713 7
6
0102030405060708090
ConcessionContract
NPS Ownedand Operated
CooperativeAgreement
ServiceContract
Num
ber o
f Sys
tem
s
NPS/Non-NPS
Non-NPS
NPS
NPS National Transit Inventory and Performance Report, 2015 20
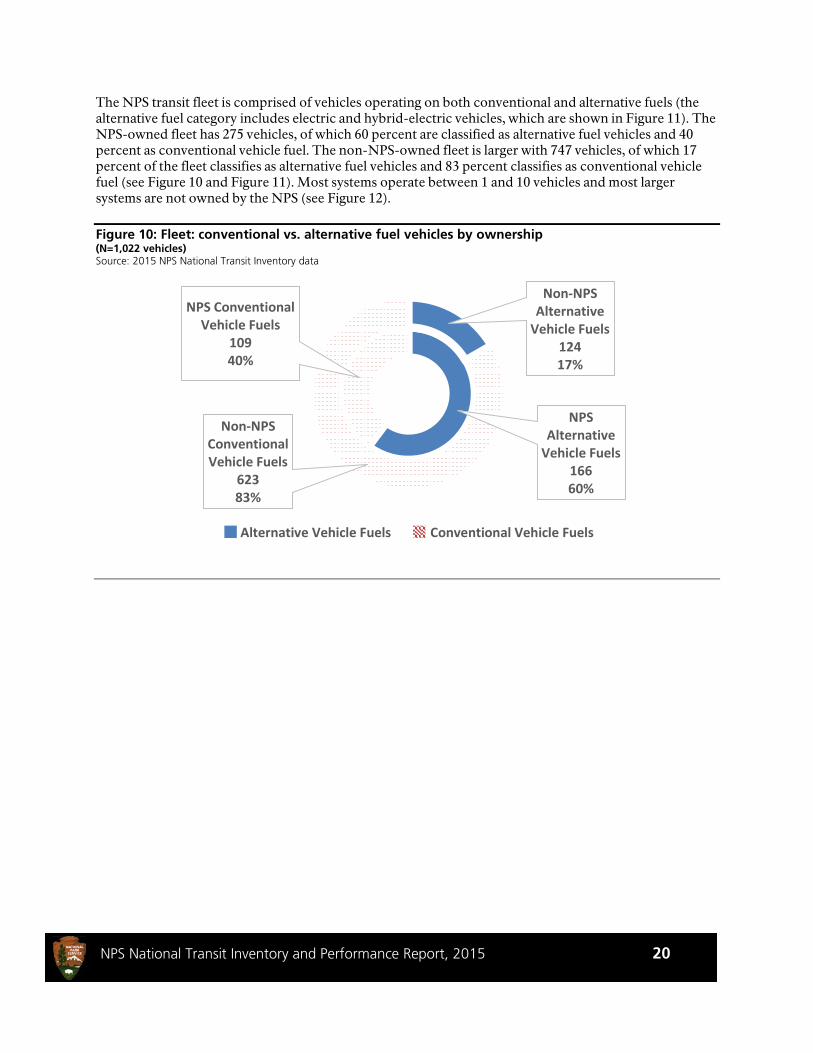
The NPS transit fleet is comprised of vehicles operating on both conventional and alternative fuels (the alternative fuel category includes electric and hybrid-electric vehicles, which are shown in Figure 11). The NPS-owned fleet has 275 vehicles, of which 60 percent are classified as alternative fuel vehicles and 40 percent as conventional vehicle fuel. The non-NPS-owned fleet is larger with 747 vehicles, of which 17 percent of the fleet classifies as alternative fuel vehicles and 83 percent classifies as conventional vehicle fuel (see Figure 10 and Figure 11). Most systems operate between 1 and 10 vehicles and most larger systems are not owned by the NPS (see Figure 12). Figure 10: Fleet: conventional vs. alternative fuel vehicles by ownership (N=1,022 vehicles) Source: 2015 NPS National Transit Inventory data
NPS Alternative
Vehicle Fuels16660%
NPS Conventional Vehicle Fuels
10940%
Non-NPS Alternative
Vehicle Fuels12417%
Non-NPS Conventional Vehicle Fuels
62383%
Alternative Vehicle Fuels Conventional Vehicle Fuels

NPS National Transit Inventory and Performance Report, 2015 21
Figure 11: Number of vehicles by fuel type (N=1,022 vehicles) Source: 2015 NPS National Transit Inventory data
Figure 12: Number of systems by fleet size (N = 127 systems) Source: 2015 NPS National Transit Inventory data
Diesel Gasoline Other Propane CNG HybridElectric Biodiesel Electric
Non-NPS Owned Vehicles 380 243 48 32 18 11 13 2NPS Owned Vehicles 65 44 39 43 35 24 18 7
0
50
100
150
200
250
300
350
400
450
500
Num
ber o
f Veh
icle
s
29 1 4
75
113 3
10
20
40
60
80
100
120
1 to 10 11 to 20 21 to 30 31 to 40 More than 40
Num
ber o
f sys
tem
s
Fleet Size
Non-NPS
NPS

NPS National Transit Inventory and Performance Report, 2015 22
Average Age of Vehicles by Vehicle Type The majority of vehicles in park transit systems are between 5-9 years old, or 15 years old and greater. A large portion of the vehicles in the 15 years and greater age bracket are owned by non-NPS entities, which could indicate that private sector partners may face significant recapitalization needs in the coming years (see Figure 13). In some cases, this could have implications for a contractor’s financial ability to rebid a contract.
Figure 13: All vehicles by age class (years) (N = 935 vehicles) Source: 2015 NPS National Transit Inventory data
4095
4295
138
269
45
211
050
100150200250300350400450
0 to 4 5 to 9 10 to 14 15 and greater
Num
ber o
f Veh
icle
s
Vehicle Age
Non-NPS Owned
NPS Owned
NPS National Transit Inventory and Performance Report, 2015 23
Performance Measures A program goal for the NPS Alternative Transportation Program (ATP) is to manage the transportation program based on meaningful, reliable data. The objective is to use measurable, applicable, and achievable performance measures and metrics to guide and support decision-making and management of transit systems in the NPS. The previous NPS transit inventories (2012-2014) reported performance-oriented findings for CO2
emissions and fleet recapitalization needs and costs, and the 2015 transit inventory includes these measures and builds upon them. The performance measures below are split into the following sections which correspond to ATP goals and the Draft NPS National Long Range Transportation Plan: visitor experience; operations; environmental impact; and, asset management. The ATP program goals are included in Appendix C.
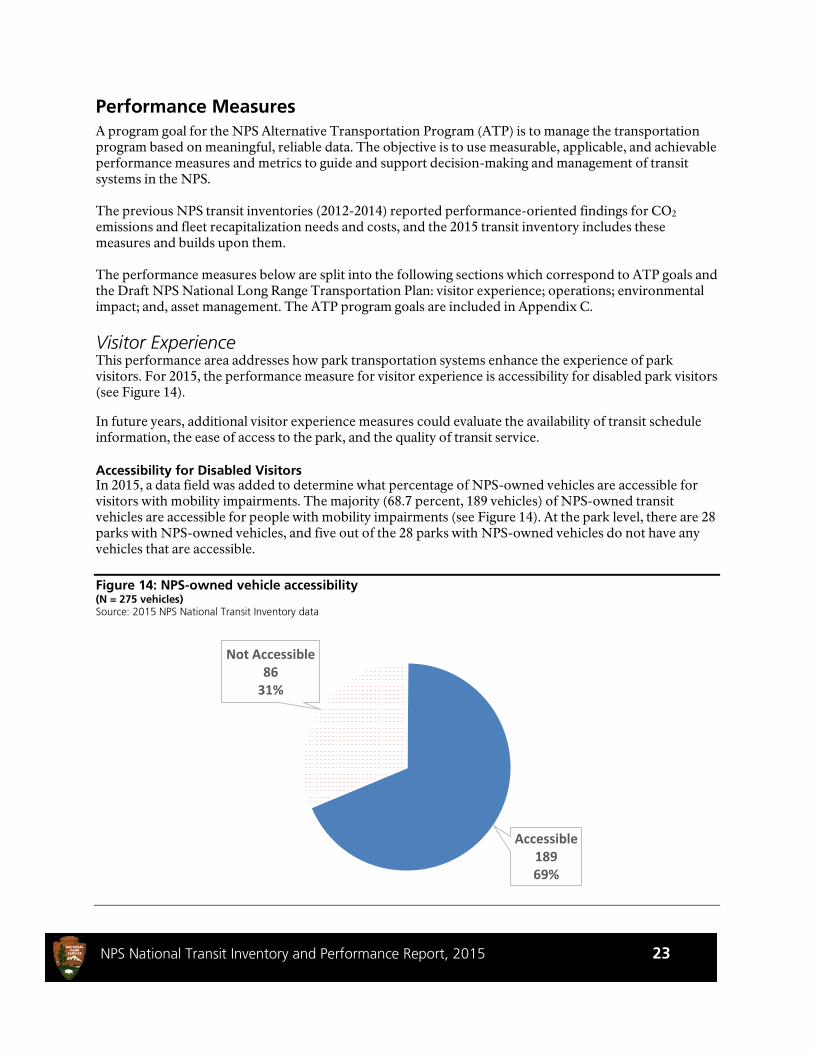
Visitor Experience This performance area addresses how park transportation systems enhance the experience of park visitors. For 2015, the performance measure for visitor experience is accessibility for disabled park visitors (see Figure 14).
In future years, additional visitor experience measures could evaluate the availability of transit schedule information, the ease of access to the park, and the quality of transit service.
Accessibility for Disabled Visitors In 2015, a data field was added to determine what percentage of NPS-owned vehicles are accessible for visitors with mobility impairments. The majority (68.7 percent, 189 vehicles) of NPS-owned transit vehicles are accessible for people with mobility impairments (see Figure 14). At the park level, there are 28 parks with NPS-owned vehicles, and five out of the 28 parks with NPS-owned vehicles do not have any vehicles that are accessible. Figure 14: NPS-owned vehicle accessibility (N = 275 vehicles) Source: 2015 NPS National Transit Inventory data
Accessible18969%
Not Accessible86
31%

NPS National Transit Inventory and Performance Report, 2015 24
Operations The measure in this area evaluates the operational performance of the NPS transit systems by measuring the percent change in boardings from 2012-2015.
Year-to-Year Trends in Boardings The graph below shows the percent change in boardings from 2012-2015. From 2012 to 2015, the total boardings across NPS transit systems were 33.2 million, 26.9 million, 36.5 million, and 42.9 million. Boardings decreased in 2013 due to damage from Hurricane Sandy and the government shutdown.16 Although boardings increased from 2013 to 2015, the percent increase was greatest from 2013 to 2014. Figure 15: Percent change in boardings from 2012 to 2015 Source: NPS National Transit Inventory data
16 See the 2013 NPS Inventory Report: http://ntl.bts.gov/lib/52000/52400/52470/NPS_WASO_2014_National_Transit_Inventory.pdf
-19.9%
35.7%
17.5%
-30%
-20%
-10%
0%
10%
20%
30%
40%
2012-2013 2013-2014 2014-2015
Perc
ent C
hang
e in
Boa
rdin
gs, Y
ear t
o Ye
ar
NPS National Transit Inventory and Performance Report, 2015 25
Environmental Impact The 2015 environmental impact measures include estimated annual CO2 emissions of the bus/shuttle/van/tram systems and the corresponding estimated emissions avoided by visitors using these systems instead of personal automobiles. Additionally, it includes the percentage of NPS transit vehicles that are electric or use alternative fuels.
Annual CO2 Emissions It was estimated that 54 shuttle/bus/van/tram systems emitted 12,775 metric tons of CO2 in 2015. To put this into perspective, the Federal Highway Administration reports that in 2014 the average driver in the U.S. drove 11,048 miles,17 burning on average 476 gallons of gasoline and emitting 3.8 metric tons of CO2. It would take 3,345 such drivers to generate the equivalent of the reported shuttle/bus/van/tram system emissions.
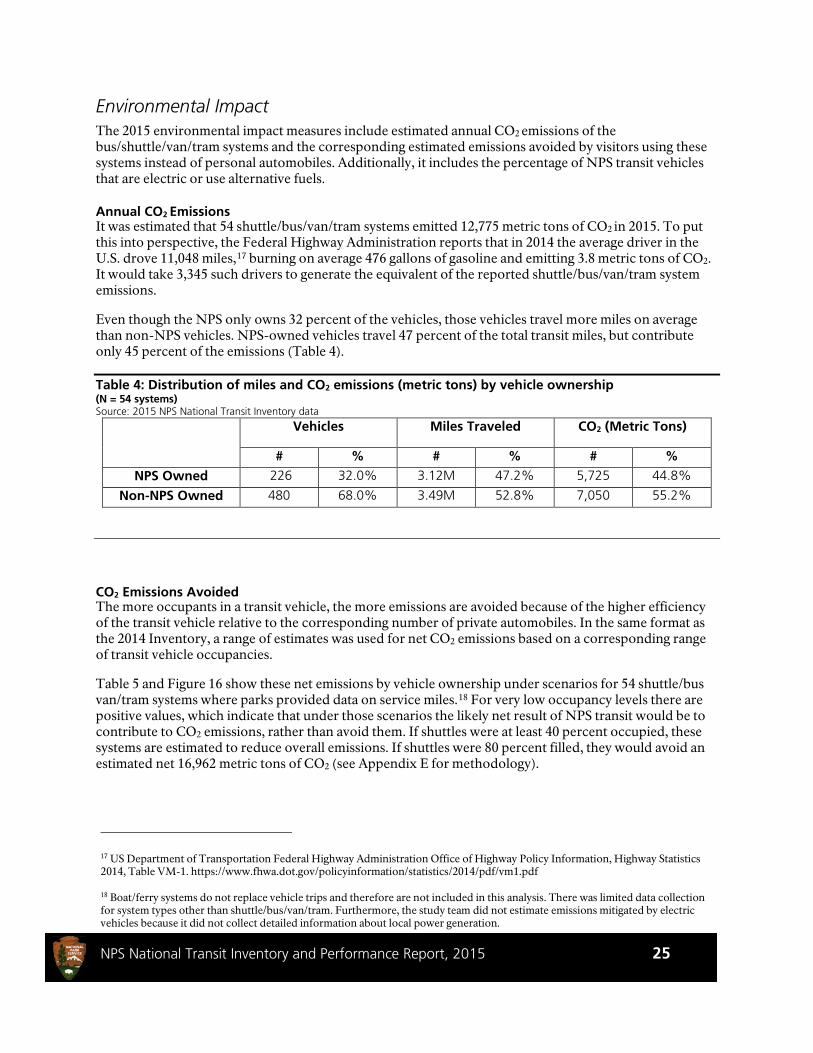
Even though the NPS only owns 32 percent of the vehicles, those vehicles travel more miles on average than non-NPS vehicles. NPS-owned vehicles travel 47 percent of the total transit miles, but contribute only 45 percent of the emissions (Table 4).
Table 4: Distribution of miles and CO2 emissions (metric tons) by vehicle ownership (N = 54 systems) Source: 2015 NPS National Transit Inventory data
Vehicles Miles Traveled CO2 (Metric Tons)
# % # % # %
NPS Owned 226 32.0% 3.12M 47.2% 5,725 44.8%
Non-NPS Owned 480 68.0% 3.49M 52.8% 7,050 55.2%
CO2 Emissions Avoided The more occupants in a transit vehicle, the more emissions are avoided because of the higher efficiency of the transit vehicle relative to the corresponding number of private automobiles. In the same format as the 2014 Inventory, a range of estimates was used for net CO2 emissions based on a corresponding range of transit vehicle occupancies.
Table 5 and Figure 16 show these net emissions by vehicle ownership under scenarios for 54 shuttle/bus van/tram systems where parks provided data on service miles.18 For very low occupancy levels there are positive values, which indicate that under those scenarios the likely net result of NPS transit would be to contribute to CO2 emissions, rather than avoid them. If shuttles were at least 40 percent occupied, these systems are estimated to reduce overall emissions. If shuttles were 80 percent filled, they would avoid an estimated net 16,962 metric tons of CO2 (see Appendix E for methodology).
17 US Department of Transportation Federal Highway Administration Office of Highway Policy Information, Highway Statistics 2014, Table VM-1. https://www.fhwa.dot.gov/policyinformation/statistics/2014/pdf/vm1.pdf
18 Boat/ferry systems do not replace vehicle trips and therefore are not included in this analysis. There was limited data collection for system types other than shuttle/bus/van/tram. Furthermore, the study team did not estimate emissions mitigated by electric vehicles because it did not collect detailed information about local power generation.

NPS National Transit Inventory and Performance Report, 2015 26
Table 5: Estimated net CO2 emissions (metric tons) by vehicle ownership (N = 54 systems) Source: 2015 NPS National Transit Inventory data
Assumed Transit Vehicle
Occupancy
Non-NPS-Owned Systems
NPS-Owned System Total
0% 7,050 5,725 12,775
20% 3,150 2,191 5,341
40% -750 -1,344 -2,094
60% -4,650 -4,878 -9,528
80% -8,550 -8,412 -16,962
100% -12,450 -11,946 -24,396
Figure 16: Estimated net CO2 emissions at various occupancy levels (N = 54 systems) Source: 2015 NPS National Transit Inventory data
-30
-25
-20
-15
-10
-5
0
5
10
15
0% 20% 40% 60% 80% 100%
Net
Met
ric T
ons o
f CO
2 Em
issi
ons
(Tho
usan
ds)
NPS Non-NPS

NPS National Transit Inventory and Performance Report, 2015 27
Alternative Fuel and Electric Vehicles In 2015, 60 percent of the NPS fleet was electric, hybrid-electric, or used alternative fuels, while 40 percent used conventional fuel. For non-NPS owned vehicles, 17 percent of transit vehicles were classified as using alternative fuels, or as electric/ hybrid-electric (see Figure 10).
Asset Management Performance measures in this area will help support the long-term financial viability of the NPS transit systems through tracking the age of NPS vehicle fleets, and projected fleet recapitalization costs.
Average Age of NPS Vehicles Table 6 reports the aggregate average age for NPS-owned transit vehicles service-wide. The average age for some vehicle types may be an indicator of the end of vehicles’ service lives.
Table 6: Vehicle age for NPS transit vehicle types (N=272 vehicles) Source: 2015 NPS National Transit Inventory data
Vehicle Type Average Age
Service Life (Years)
Number of Vehicles
6-12 pax Electric Tram 4.8 11 4
Passenger Van 4.7 10 7
Light-Duty Shuttle 8 15 41
Medium-Duty Shuttle 6 15 27
Heavy-Duty Shuttle19 8 15 86
Medium-Duty Transit 14.6 18 29
Heavy-Duty Transit 12.8 18 47
Ferry/Boat 20.7 N/A 13
Train/Streetcar 37 N/A 4 Snow Coach 46 N/A 12 School Bus 6 18 2
19 The GLAC 33 Red Bus Tours vehicles were excluded from this category, as they are approximately 80 years old.

NPS National Transit Inventory and Performance Report, 2015 28
Projected Recapitalization Costs Using vehicle ages reported by NPS transit systems and standard replacement costs and service life assumptions shown in Appendix E,20 it is estimated that the overdue vehicle recapitalization costs for NPS-owned shuttle/bus/van/tram rolling stock is $3.9 million (see Table 7). Each park unit is responsible for determining when a vehicle needs to be replaced, which also depends on funding availability. Service life is highly dependent upon utilization, not only vehicle age; therefore, more detailed information is needed.
Table 7: Estimated NPS-owned shuttle/bus/tram/van overdue recapitalization needs, up to 2015 (N = 238 vehicles) Source: 2015 NPS National Transit Inventory data
Year Overdue Recapitalization
Number of Vehicles Requiring Replacement (by Type)
Units Heavy-Duty
Shuttle Heavy-Duty
Transit Up to 2015
$3,870,000 5 7 GRCA, YELL
Assuming each NPS-owned shuttle/bus/tram/van vehicle is recapitalized in-kind at the end of its expected service life, the agency faces an estimated $38.8 million in rolling stock capital costs between 2016 and 2027. The projected costs are calculated in nominal dollars and vary widely from year to year as vehicles from different systems are due to be replaced. Over the next five years (2016-2020), major recapitalization needs are projected at ADAM and ZION (see Table 8).
20 The service life assumptions used to estimate the recapitalization needs and costs were updated in 2015 to reflect more current cost estimates for the transit vehicles, and to reflect the way NPS transit vehicles are utilized.

NPS National Transit Inventory and Performance Report, 2015 29
Table 8: Estimated NPS-owned shuttle/bus/tram/van rolling stock capital needs, 2016-2027 (N = 238 vehicles) Source: 2015 NPS National Transit Inventory data
Year
Estimated Capital
Replacement Costs
Estimated Number of Vehicles Requiring Replacement (by Type) Units (Bold and Italics for units
requiring > $1 million)21
Passenger Van
Light-Duty
Shuttle
Medium-Duty
Shuttle
Heavy-Duty
Shuttle
Medium-Duty
Transit
Heavy-Duty
Transit
School Bus
Electric Tram
2016 & 2017 $568,000 1 5
CACO, PINN, YELL
2018 $7,425,000 27 ZION
2019 $1,019,000 2 3 4 GLAC, GRCA,
ORPI
2020 $1,882,000 1 1 1 1 3 1 ADAM,
CACO, SHEN, ZION
2021 $1,865,000 1 13 2 1 1 CUIS, GLAC, HAFE, ZION
2022 $1,176,000 1 7 2 PINN, YELL
2023 $18,534,000 2 7 1 26 24
CUIS, GLAC, GRCA, HAFE,
JOFL/ALPO, SHEN, YOSE,
EUON
2024 $2,927,000 4 13 4 GLAC, HAFE, NOCA/LACH,
ZION
2025 $842,000 1 5 EUON, MEVE,
SCBL, CUIS
2026 $2,254,000 5 4 6 CACO, GRCA, KEMO, YOSE,
CUIS
2027 $286,000 1 2 YELL, TAPR
Grand Total
$38,778,000
21 In order to estimate a service-wide transit vehicle replacement cost, replacement years and costs for individual systems are estimated using service-wide assumptions. Year of replacement for individual transit systems is an estimate only and should not be used in place of better information and judgment of park staff making transit system-specific decisions.

NPS National Transit Inventory and Performance Report, 2015 30
Next Steps
The following lessons will be incorporated to improve future transit data calls:
Create new and/or refine existing data elements. The NPS ATP should continue to coordinate with NPS stakeholders to refine the number of fields in the data call and the way in which questions are asked. Potential NPS stakeholders include:
Alternative Transportation Systems Lifecycle Asset Management (ATSLAM) Development Group
Park Facility Management Division Sustainable Operations and Climate Change (SOCC) Branch Financial and Business Management System Group Commercial Services Program Visitor Use Statistics Office
Improve the data collection online tool. While the website was an improvement from previous years, the online data collection tool needs additional improvements to make it more user-friendly for park staff, and for the analysis of the transit data.
Consider tiered data collection, based on system characteristics: As noted throughout this report, NPS transit systems cover a wide variety of vehicles and service types, some of which operate in similar ways to transit systems in urban areas. These systems with high boardings, that run the service frequently, likely have a larger impact on emissions and recapitalization needs, and the NPS ATP is exploring refinements to data collection for these systems to better understand their impact. Going forward, a tiered data collection based on the number of vehicles and operational characteristics of transit systems in the NPS may help focus data collection and analysis efforts on the systems with the greatest overall impacts.
Refine emissions analysis. The emissions analysis can continue to be refined for units that have the necessary data available. For larger transit systems, additional data collection may enable the NPS ATP to estimate vehicle occupancies, instead of using capacity bucket estimates (see Appendix E). The NPS ATP should consider coordinating with the SOCC Branch to understand ways in which this reporting will be most useful, including looking into effective ways to communicate the emissions savings of NPS transit systems to visitors.
Continue to refine service life and replacement costs analysis. Although the service life and replacement analysis was improved this year with updated assumptions, there are opportunities to incorporate more vehicle and operations data into the analysis. As the NPS ATP considers a tiered data collection, the analysis may be refined based the resulting tiers.
Expand performance measures analysis: The NPS ATP is moving towards quantifying additional performance measures to track progress over time of NPS transit systems, and it may make sense to align a possible tiered data collection approach to the performance measures analysis.
Revisit Transit Definition (see page Appendix B) to reflect new laws and regulations.

NPS National Transit Inventory and Performance Report, 2015 31
Appendix
Appendix A – Acknowledgments The National Park Service Alternative Transportation Program would like to thank the numerous NPS transit system contacts who graciously provided their time, knowledge, and guidance in the development of this inventory.
Washington Support Office Nathan Tatum Alternative Transportation Program Joni Gallegos Alternative Transportation Program
Alaska Region Paul Schrooten Alaska Region Melanie Berg Glacier Bay National Park Billie Woodcock Katmai National Park Jim LeBel Denali National Park
Intermountain Region Debra Frye Intermountain Region Jack Burns Zion National Park Daniel Cloud Bryce Canyon National Park Kelly Kager Glen Canyon National Recreation Area Pamela Edwards Grand Canyon National Park Jean Talbert Glacier National Park John Hannon Rocky Mountain National Park
Allan Loy Mesa Verde National Park Dan Johnson Dinosaur National Monument Christina Mills Yellowstone National Park Donna Sisson Grand Teton National Park Stephen Smith Glacier National Park Sue Walter Organ Pipe Cactus National Monument Ken Woody Little Bighorn Battlefield National Monument
Midwest Region Bob Kammel Midwest Region Phil Akers Sleeping Bear Dunes National Lakeshore Heather Brown Tallgrass Prairie National Preserve Coral Conway Isle Royale National Park Jennifer McMahon Cuyahoga Valley National Park John Patmore Pictured Rocks National Lakeshore Chuck Remus Voyageurs National Park Chris E.Smith Apostle Islands National Lakeshore
NPS National Transit Inventory and Performance Report, 2015 32
National Capital Region Makayah Royal National Capital Region Dennis Ebersole Harpers Ferry National Historical Park Duane Erwin Wolf Trap National Park for the Performing Arts Dick Swihart National Mall & Memorial Parks Northeast Region Mark Alexander Northeast Region Deborah Conway Steamtown National Historic Site Christine Bruins Lowell National Historical Park John Kelly Acadia National Park Graham Delinger Valley Forge National Historical Park Ben Hanslin Statue of Liberty National Monument John Joyce Eisenhower National Historic Site Karst Hoogeboom Cape Cod National Park Caroline Keinath Adams National Historical Park John Mahoney Fire Island National Seashore Christina Marts Marsh-Billings-Rockefeller National Historic Park Keith Newlin Johnstown Flood National Memorial and Allegheny Portage Railroad National Historic Site Giles Parker Boston Harbor Islands National Recreation Area
Scott Rector Home of Franklin D. Roosevelt, Eleanor Roosevelt, and Vanderbilt Mansion National Historic Sites Tim Taglauer Shenandoah National Park
Pacific West Region Dianne Croal Pacific West Region Justin DeSantis Pacific West Region Travis Poulson Channel Islands National Park Jennifer Evans Crater Lake National Park Stefanie Martin Golden Gate National Recreation Area John Dell’Osso Point Reyes National Seashore Paul DePrey World War II Valor in the Pacific National Monument Deanna Dulen Devils Postpile National Monument Darren Brown Golden Gate National Recreation Area and Muir Woods National Monument Tom Leatherman Eugene O’Neill National Historic Site Annelise Lesmeister North Cascades National Park Jim Donovan Yosemite National Park Sheri Odgen Yosemite National Park Mark Rich Mammoth Cave National Park Dawn Ryan Sequoia National Park

NPS National Transit Inventory and Performance Report, 2015 33
Debbie Simmons Pinnacles National Monument David Stransky World War II Valor in the Pacific National Monument
Southeast Region
Kent Cochran Southeast Region Lee Edwards Southeast Region Julia Treu-Fowler San Juan National Historic Site Anthony Paladino Fort Sumter National Monument Susan Duke Buck Island Reef National Monument
William Gordon Everglades and Dry Tortugas National Parks Dawn Leonard Blue Ridge Parkway Sarah Perschall Carl Sandburg Home National Historic Site Andrew Rich Fort Matanzas and Castillo de San Marcos National Monuments Jill Hamilton Cumberland Island National Seashore Nancy Walther Kennesaw Mountain National Battlefield Park Lindsey Phillips Gulf Islands National Seashore
NPS National Transit Inventory and Performance Report, 2015 34
Appendix B – Definition of Transit The NPS Alternative Transportation Program (ATP) developed a definition for an “NPS transit system” prior to conducting the 2012 transit inventory. Only units with systems that met each of these three criteria were considered for the inventory:
1. Moves people by motorized vehicle on a regularly scheduled service;22 2. Operates under one of the following business models: concessions contract; service contract; partner
agreement including memorandum of understanding, memorandum of agreement, or cooperative agreement (commercial use authorizations are not included); or NPS-owned and operated; and23
3. All routes and services at a given unit that are operated under the same business model by the same operator are considered a single NPS transit system.
This definition was based on a review of past efforts, analysis of the existing transit portfolio, and individual and group conversations with the Regional Transportation Program coordinators and the Federal Lands Highway Program Service-wide Maintenance Advisory Committee (FLHP-SMAC). In response to challenges encountered during the course of the inventory, made small changes to the original draft definition to improve clarity. The definition was uniformly applied to all potential systems to determine whether or not each should be included in the inventory.
The NPS ATP investigated several potential criteria that stemmed from existing ATP documents, Transit in Parks Program (TRIP) documents and applications, and conversations with ATP stakeholders, as presented below.
Provides transit service: An “NPS transit system” should provide transit service. In the glossary of the National Transit Database, the Federal Transit Administration defines transit as synonymous with public transportation and public transportation is defined as follows in the Federal Transit Act, "transportation by a conveyance that provides regular and continuing general or special transportation to the public, but does not include school bus, charter, or intercity bus transportation or intercity passenger rail transportation provided by [Amtrak]."Conversations with NPS regional transportation coordinators further specified transit service should be limited to motorized conveyances. Based on this, the NPS ATP proposed the following criterion: “moves people by motorized vehicle on a regularly scheduled service.”
Is important to the NPS mission: The importance of transit systems to fulfilling the NPS mission is a core tenet of the ATP, as established in previous program plans and extensively discussed at program meetings. However, the simple question “Is this system important to the NPS mission?” is subjective and would return inconsistent results. For many systems, particularly those for which the NPS has a financial stake or has a formal contract or agreement in place, the answer seems clear: because the NPS has made an effort to provide the service, the service is assumed to be important to the mission. Other services, particularly those which are operated under commercial use authorization (CUA), are not as clearly essential to the mission. Thus, the NPS ATP proposed the following criterion: “operates under one of the following business models: concessions contract; service contract; partner agreement including memorandum of understanding, memorandum of agreement, or cooperative agreement (commercial use authorizations are
22 Services with a posted schedule that have standard operating seasons/days of week/hours. Services which do not operate on a fixed route, are charter services for individual groups, or exist for the sole purpose of providing access to persons with disabilities, are not included.
23 For the purposes of this inventory, no distinction was drawn between memorandum of understanding, memorandum of agreement, and cooperative agreement. All were recorded as “cooperative agreement.”

NPS National Transit Inventory and Performance Report, 2015 35
not included); or NPS owned and operated systems.” The NPS ATP used “cooperative agreement” as a general term, encompassing all qualifying partner agreements (memorandum of understanding, memorandum of agreement, and cooperative agreement).
Concession contracts were included because they require resources and desire by the NPS to initiate. Also, after the bid and award process, concession contracts limit competition with other private operators and thus generally result in close working relationships with the NPS. Commercial use authorizations are not included because prospective CUA operators request permission from NPS to operate. These agreements are not initiated by the NPS and the resulting services are inherently not “NPS” systems.
CUAs were not included because these services are owned and operated by private operators, and the NPS only provides oversight to ensure that the services are operated in accordance with NPS policies and requirements. There are hundreds of CUAs service-wide that provide visitors tours and transportation. Collecting and reporting information on all of these systems could be burdensome to units and regions. If information were to be collected and reported on CUA services at all, an objective measure of importance would need to be identified and two key questions would need to be addressed. First, how does one objectively determine whether a service operated under a CUA is important versus non-essential to the NPS mission? This effort found only one sub-category of CUA that could be considered objective: services that provide sole access to an NPS resource. Second, should NPS represent as its own services for which it has no role in the acquisition, operations, or maintenance activities? Even for CUAs which provide sole access, this effort suggests not. This determination is not to suggest that the service is not important to the NPS, but rather to acknowledge that the service is not the responsibility of NPS – in other words, it is not an “NPS transit system.” These systems could be tracked separately but would not be included in the inventory.
Reduces Vehicle Miles Traveled (VMT): Reduced VMT was a key factor in TRIP applications because, in theory, reducing VMT reduces emissions. However, the simple question of “Does a system reduce VMT?” was tested on candidate NPS transit systems, and answers tended to be complex and debatable. The NPS ATP determined that “reduces VMT” is not an objective criterion. Although reducing VMT can be a goal of NPS transit systems, it should not be a defining characteristic.
Provides critical access: Both TRIP and Category III have traditionally funded systems which provide sole access via alternative transportation. The question “Does a system provide critical access?” was tested on candidate NPS transit systems. However, not all NPS transit systems provide critical access, and not all systems which provide critical access meet other likely criteria of a definition, such as NPS having a financial stake. Thus, this would not contribute toward a simple, clear definition.
Tours versus transportation: The TRIP program made a distinction between interpretive tours and transportation, the former being a recreational activity itself, and the latter being the conveyance of a passenger to or between activities. Whether a system is a tour or provides transportation was tested on candidate NPS transit systems. The distinction was often ambiguous. Many “transportation services” also provide interpretation or offer an experience on board. Many “tours” transport people to activities, allow people to get on and off, and/or take passengers to places in national parks that they could not access in their cars (for example, to a point on a body of water). Furthermore, both tours and transportation services further the visitor experience component of the NPS mission, and the NPS ATP sought not to prioritize one over the other. Although in daily life a transportation trip (often thought to be mandatory, for instance, to the grocery store) might be more important than a tour trip (often thought to be discretionary, for

NPS National Transit Inventory and Performance Report, 2015 36
instance, a historical tour of a battlefield), in a recreational setting such as national park both types of trips may be vital to providing high quality visitor experiences.
Is part of a connected, multimodal network: Several stakeholders suggested this criterion. However, it is vague, and requires further definition of the term “connected, multimodal network.”
Identifying unique systems: In order to be consistent service-wide in counting the number of transit systems, the NPS ATP investigated methods for defining where one transit system stops and another starts and tested these with candidate NPS transit systems, particularly at units thought to have more than one system. Based on this, the NPS ATP proposed a final criterion: “all routes and services operated by the same operator under the same business model at a given unit are considered a single transit system.”
Once developed, the pilot definition was shared individually with the Transportation Program Coordinators from each of the seven NPS regions. Feedback from each region was generally supportive. The definition was also presented at the May 2012 Federal Lands Highway Program Service-wide Maintenance Committee. Again, reaction by meeting participants was generally supportive. The Associate Director, Park Planning, Facilities, and Lands, formalized the draft definition in August 2012 in a memo titled: “National Park Service Transit Inventory Definition and Next Steps.
NPS National Transit Inventory and Performance Report, 2015 37
Appendix C – NPS Alternative Transportation Program Goals and Objectives GOAL: Cultivate improvements in transportation connectivity, convenience, and safety for visitors and workforce.
OUTCOME: Access to, from, and within national park units is convenient, safe, and well-connected via appropriate and integrated transportation solutions.
Develop transportation options that meet the diverse needs of park visitors and NPS workforce.
Connect and enhance existing transportation options. (Undecided as to whether this one should remain – as it might inhibit creative solutions that can replace existing that do not function or cost too much money)
Minimize injuries, fatalities, and crashes associated with all modes of transportation. Participate in local, regional, and statewide transportation planning processes to ensure
appropriate integration of NPS transportation infrastructure, systems, and services.
GOAL: Provide quality transportation experiences that enhance park visits.
OUTCOME: NPS transportation systems contribute to the positive experience of park visitors.
Improve visitor access to appropriate destinations. Use transportation to educate and inform visitors about park resources and services. Reduce disruptions to the visitor experience related to vehicle traffic congestion. Design and adapt transportation systems to complement each park’s unique context and
mission.
GOAL: Demonstrate leadership in environmentally-responsible transportation.
OUTCOME: NPS is recognized as a leader in environmentally-responsible transportation.
Prioritize investments and operations that reduce vehicle emissions, noise and light pollution, traffic congestion, and unendorsed parking.
Educate park visitors and workforce about the environmental benefits of transportation options within and beyond park boundaries.
Contribute to NPS and park unit greenhouse gas emissions reduction goals. Implement proven green transportation innovations and best practices where appropriate.
GOAL: Ensure the long-term financial viability of NPS transportation infrastructure, systems, and services.
OUTCOME: Funding is adequate to maintain transportation infrastructure, operate transportation systems, and manage transportation services now and into the foreseeable future
Consider the full range of business models and associated lifecycle costs (direct and indirect) before making investments.
Increase the flexibility of funding mechanisms to better support transportation options. Right-size and maintain needed transportation assets and services in a state of good repair.
NPS National Transit Inventory and Performance Report, 2015 38
Develop transportation options with reciprocal benefits for NPS and gateway communities which can be collaboratively funded and/or operated.
Seek to enhance or develop partnerships with public, private, and philanthropic organizations that are aligned with the NPS mission.
GOAL: Manage the transportation program based on meaningful, reliable data.
OUTCOME: NPS demonstrates accountability in the management of transportation resources.
Use measurable, applicable, and achievable performance measures and metrics to guide and support decision-making and management of the transportation program.
Invest in and maintain data that supports performance measures aligned with program goals.
Continually evaluate transportation options to ensure they meet program goals, and adjust operations to optimize system performance.
NPS National Transit Inventory and Performance Report, 2015 39
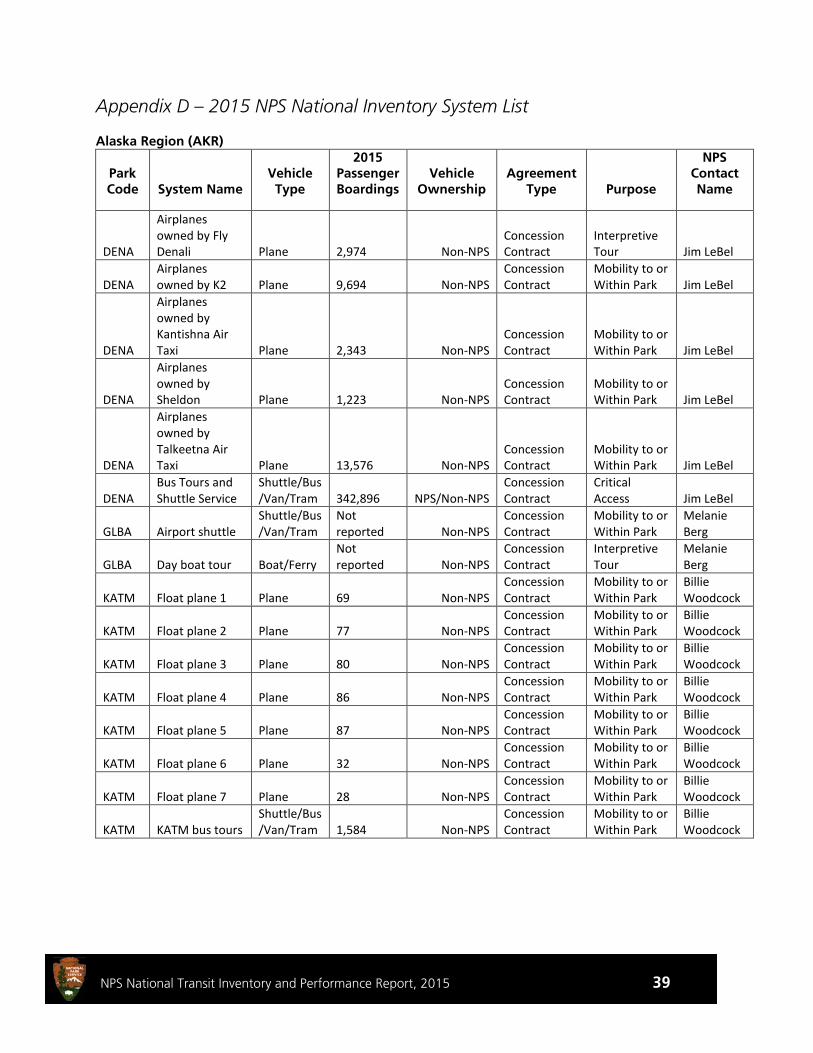
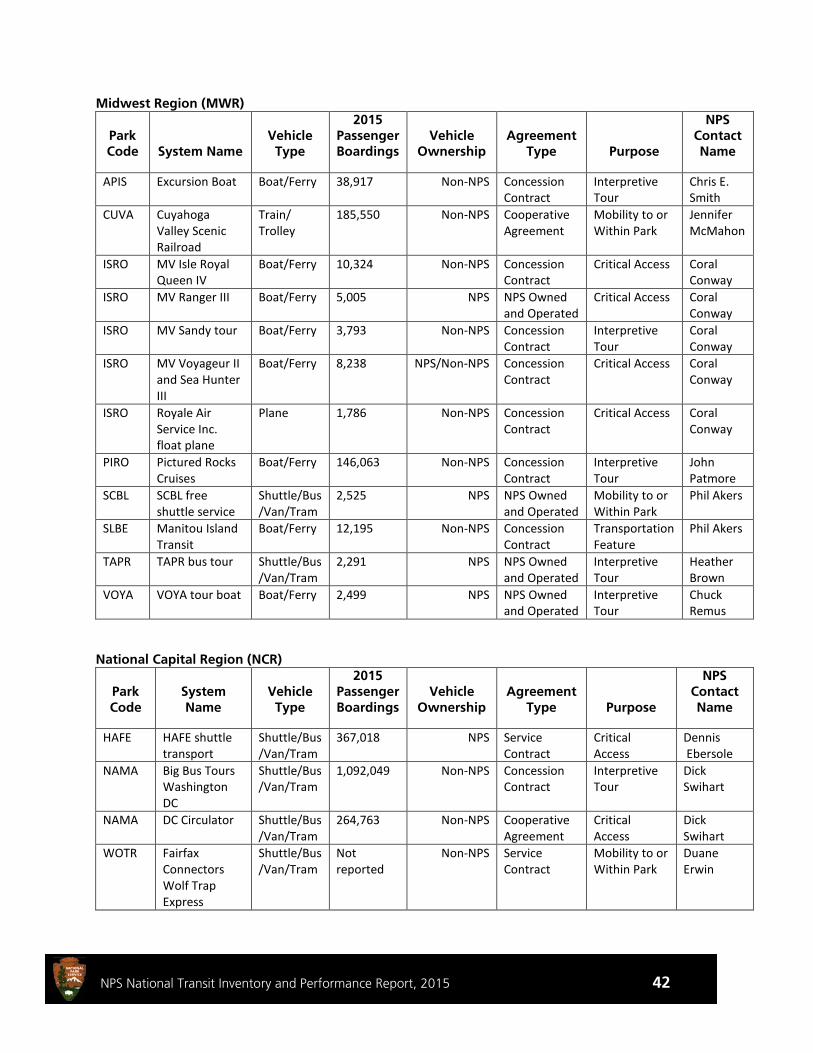
Appendix D – 2015 NPS National Inventory System List
Alaska Region (AKR)
Park Code System Name
Vehicle Type
2015 Passenger Boardings
Vehicle Ownership
Agreement Type Purpose
NPS Contact Name
DENA
Airplanes owned by Fly Denali Plane 2,974 Non-NPS
Concession Contract
Interpretive Tour Jim LeBel
DENA Airplanes owned by K2 Plane 9,694 Non-NPS
Concession Contract
Mobility to or Within Park Jim LeBel
DENA
Airplanes owned by Kantishna Air Taxi Plane 2,343 Non-NPS
Concession Contract
Mobility to or Within Park Jim LeBel
DENA
Airplanes owned by Sheldon Plane 1,223 Non-NPS
Concession Contract
Mobility to or Within Park Jim LeBel
DENA
Airplanes owned by Talkeetna Air Taxi Plane 13,576 Non-NPS
Concession Contract
Mobility to or Within Park Jim LeBel
DENA Bus Tours and Shuttle Service
Shuttle/Bus/Van/Tram 342,896 NPS/Non-NPS
Concession Contract
Critical Access Jim LeBel
GLBA Airport shuttle Shuttle/Bus/Van/Tram
Not reported Non-NPS
Concession Contract
Mobility to or Within Park
Melanie Berg
GLBA Day boat tour Boat/Ferry Not reported Non-NPS
Concession Contract
Interpretive Tour
Melanie Berg
KATM Float plane 1 Plane 69 Non-NPS Concession Contract
Mobility to or Within Park
Billie Woodcock
KATM Float plane 2 Plane 77 Non-NPS Concession Contract
Mobility to or Within Park
Billie Woodcock
KATM Float plane 3 Plane 80 Non-NPS Concession Contract
Mobility to or Within Park
Billie Woodcock
KATM Float plane 4 Plane 86 Non-NPS Concession Contract
Mobility to or Within Park
Billie Woodcock
KATM Float plane 5 Plane 87 Non-NPS Concession Contract
Mobility to or Within Park
Billie Woodcock
KATM Float plane 6 Plane 32 Non-NPS Concession Contract
Mobility to or Within Park
Billie Woodcock
KATM Float plane 7 Plane 28 Non-NPS Concession Contract
Mobility to or Within Park
Billie Woodcock
KATM KATM bus tours Shuttle/Bus/Van/Tram 1,584 Non-NPS
Concession Contract
Mobility to or Within Park
Billie Woodcock
NPS National Transit Inventory and Performance Report, 2015 40
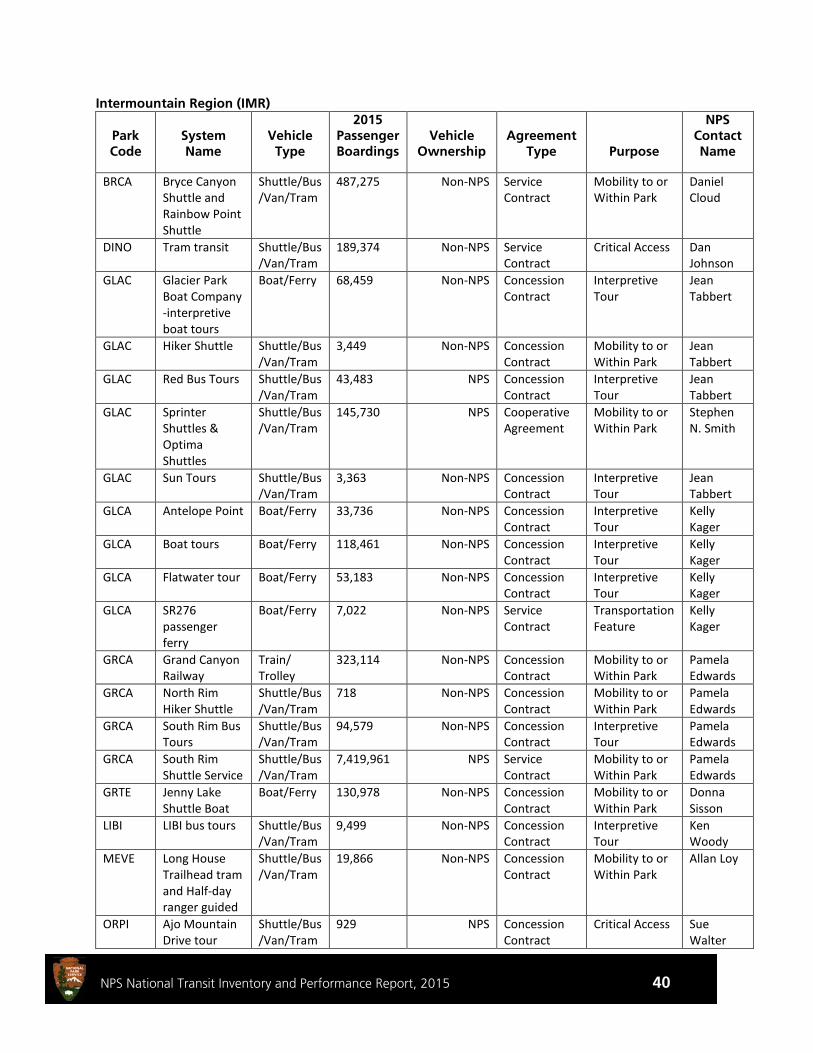
Intermountain Region (IMR)
Park Code
System Name
Vehicle Type
2015 Passenger Boardings
Vehicle Ownership
Agreement Type Purpose
NPS Contact Name
BRCA Bryce Canyon Shuttle and Rainbow Point Shuttle
Shuttle/Bus/Van/Tram
487,275 Non-NPS Service Contract
Mobility to or Within Park
Daniel Cloud
DINO Tram transit Shuttle/Bus/Van/Tram
189,374 Non-NPS Service Contract
Critical Access Dan Johnson
GLAC Glacier Park Boat Company -interpretive boat tours
Boat/Ferry 68,459 Non-NPS Concession Contract
Interpretive Tour
Jean Tabbert
GLAC Hiker Shuttle Shuttle/Bus/Van/Tram
3,449 Non-NPS Concession Contract
Mobility to or Within Park
Jean Tabbert
GLAC Red Bus Tours Shuttle/Bus/Van/Tram
43,483 NPS Concession Contract
Interpretive Tour
Jean Tabbert
GLAC Sprinter Shuttles & Optima Shuttles
Shuttle/Bus/Van/Tram
145,730 NPS Cooperative Agreement
Mobility to or Within Park
Stephen N. Smith
GLAC Sun Tours Shuttle/Bus/Van/Tram
3,363 Non-NPS Concession Contract
Interpretive Tour
Jean Tabbert
GLCA Antelope Point Boat/Ferry 33,736 Non-NPS Concession Contract
Interpretive Tour
Kelly Kager
GLCA Boat tours Boat/Ferry 118,461 Non-NPS Concession Contract
Interpretive Tour
Kelly Kager
GLCA Flatwater tour Boat/Ferry 53,183 Non-NPS Concession Contract
Interpretive Tour
Kelly Kager
GLCA SR276 passenger ferry
Boat/Ferry 7,022 Non-NPS Service Contract
Transportation Feature
Kelly Kager
GRCA Grand Canyon Railway
Train/ Trolley
323,114 Non-NPS Concession Contract
Mobility to or Within Park
Pamela Edwards
GRCA North Rim Hiker Shuttle
Shuttle/Bus/Van/Tram
718 Non-NPS Concession Contract
Mobility to or Within Park
Pamela Edwards
GRCA South Rim Bus Tours
Shuttle/Bus/Van/Tram
94,579 Non-NPS Concession Contract
Interpretive Tour
Pamela Edwards
GRCA South Rim Shuttle Service
Shuttle/Bus/Van/Tram
7,419,961 NPS Service Contract
Mobility to or Within Park
Pamela Edwards
GRTE Jenny Lake Shuttle Boat
Boat/Ferry 130,978 Non-NPS Concession Contract
Mobility to or Within Park
Donna Sisson
LIBI LIBI bus tours Shuttle/Bus/Van/Tram
9,499 Non-NPS Concession Contract
Interpretive Tour
Ken Woody
MEVE Long House Trailhead tram and Half-day ranger guided
Shuttle/Bus/Van/Tram
19,866 Non-NPS Concession Contract
Mobility to or Within Park
Allan Loy
ORPI Ajo Mountain Drive tour
Shuttle/Bus/Van/Tram
929 NPS Concession Contract
Critical Access Sue Walter

NPS National Transit Inventory and Performance Report, 2015 41
Park Code
System Name
Vehicle Type
2015 Passenger Boardings
Vehicle Ownership
Agreement Type Purpose
NPS Contact Name
ROMO Bear Lake & Moraine Park shuttle, Hiker Shuttle to Estes Park
Shuttle/Bus/Van/Tram
577,029 Non-NPS Service Contract
Critical Access John Hannon
YELL Backcountry Adventures (YELL 504)
Shuttle/Bus/Van/Tram
1,238 Non-NPS Concession Contract
Interpretive Tour
Christina Mills
YELL Buffalo Bus Touring (YELL 506,509,510) Summer
Shuttle/Bus/Van/Tram
8,997 Non-NPS Concession Contract
Interpretive Tour
Christina Mills
YELL Buffalo Bus Touring (YELL 506,509,510) Winter
Shuttle/Bus/Van/Tram
8,197 Non-NPS Concession Contract
Interpretive Tour
Christina Mills
YELL Gary Fales Outfitting Inc
Snowcoach Not reported
Non-NPS Concession Contract
Interpretive Tour
Christina Mills
YELL Historic Yellow Bus tours
Shuttle/Bus/Van/Tram
11,785 NPS Concession Contract
Interpretive Tour
Christina Mills
YELL Scenic Safaris (YELL 512,513,514,515,516,517,518)
Shuttle/Bus/Van/Tram
3,900 Non-NPS Concession Contract
Interpretive Tour
Christina Mills
YELL See Yellowstone Alpen Guides (YELL 501,502)
Mixed 12,525 Non-NPS Concession Contract
Interpretive Tour
Christina Mills
YELL Xanterra Parks & Resorts interpretive bus tours
Shuttle/Bus/Van/Tram
19,129 NPS/Non-NPS Concession Contract
Interpretive Tour
Christina Mills
YELL Xanterra Parks & Resorts interpretive snowcoaches tours
Shuttle/Bus/Van/Tram
6,638 Non-NPS Concession Contract
Interpretive Tour
Christina Mills
YELL YELL boat Boat/Ferry 6,384 Non-NPS Concession Contract
Interpretive Tour
Christina Mills
YELL YELL snow coaches
Snowcoach 6,288 NPS/Non-NPS Concession Contract
Interpretive Tour
Christina Mills
YELL Yellowstone Expeditions (YELL 300)
Mixed 2,183 Non-NPS Concession Contract
Interpretive Tour
Christina Mills
ZION Zion Canyon Shuttle
Shuttle/Bus/Van/Tram
5,297,860 NPS Service Contract
Critical Access Jack Burns
NPS National Transit Inventory and Performance Report, 2015 42
Midwest Region (MWR)
Park Code System Name
Vehicle Type
2015 Passenger Boardings
Vehicle Ownership
Agreement Type Purpose
NPS Contact Name
APIS Excursion Boat Boat/Ferry 38,917 Non-NPS Concession Contract
Interpretive Tour
Chris E. Smith
CUVA Cuyahoga Valley Scenic Railroad
Train/ Trolley
185,550 Non-NPS Cooperative Agreement
Mobility to or Within Park
Jennifer McMahon
ISRO MV Isle Royal Queen IV
Boat/Ferry 10,324 Non-NPS Concession Contract
Critical Access Coral Conway
ISRO MV Ranger III Boat/Ferry 5,005 NPS NPS Owned and Operated
Critical Access Coral Conway
ISRO MV Sandy tour Boat/Ferry 3,793 Non-NPS Concession Contract
Interpretive Tour
Coral Conway
ISRO MV Voyageur II and Sea Hunter III
Boat/Ferry 8,238 NPS/Non-NPS Concession Contract
Critical Access Coral Conway
ISRO Royale Air Service Inc. float plane
Plane 1,786 Non-NPS Concession Contract
Critical Access Coral Conway
PIRO Pictured Rocks Cruises
Boat/Ferry 146,063 Non-NPS Concession Contract
Interpretive Tour
John Patmore
SCBL SCBL free shuttle service
Shuttle/Bus/Van/Tram
2,525 NPS NPS Owned and Operated
Mobility to or Within Park
Phil Akers
SLBE Manitou Island Transit
Boat/Ferry 12,195 Non-NPS Concession Contract
Transportation Feature
Phil Akers
TAPR TAPR bus tour Shuttle/Bus/Van/Tram
2,291 NPS NPS Owned and Operated
Interpretive Tour
Heather Brown
VOYA VOYA tour boat Boat/Ferry 2,499 NPS NPS Owned and Operated
Interpretive Tour
Chuck Remus
National Capital Region (NCR)
Park Code
System Name
Vehicle Type
2015 Passenger Boardings
Vehicle Ownership
Agreement Type Purpose
NPS Contact Name
HAFE HAFE shuttle transport
Shuttle/Bus/Van/Tram
367,018 NPS Service Contract
Critical Access
Dennis Ebersole
NAMA Big Bus Tours Washington DC
Shuttle/Bus/Van/Tram
1,092,049 Non-NPS Concession Contract
Interpretive Tour
Dick Swihart
NAMA DC Circulator Shuttle/Bus/Van/Tram
264,763 Non-NPS Cooperative Agreement
Critical Access
Dick Swihart
WOTR Fairfax Connectors Wolf Trap Express
Shuttle/Bus/Van/Tram
Not reported
Non-NPS Service Contract
Mobility to or Within Park
Duane Erwin

NPS National Transit Inventory and Performance Report, 2015 43
Northeast Region (NER)
Park Code
System Name
Vehicle Type
2015 Passenger Boardings
Vehicle Ownership
Agreement Type Purpose
NPS Contact Name
ACAD Island Explorer & Bicycle Express
Shuttle/Bus/Van/Tram
533,359 Non-NPS Cooperative Agreement
Mobility to or Within Park
John Kelly
ADAM Adams trolley Shuttle/Bus/Van/Tram
62,679 NPS Service Contract
Critical Access
Caroline Keinath
BOHA BOHA Ferries Boat/Ferry 109,661 Non-NPS Cooperative Agreement
Critical Access
Giles Parker
BOHA Boston Light Tour
Boat/Ferry 2,292 Non-NPS Cooperative Agreement
Critical Access
Giles Parker
BOHA Thompson Island Ferry
Boat/Ferry 30,836 Non-NPS Cooperative Agreement
Critical Access
Giles Parker
CACO Coastguard Beach Shuttle
Mixed 99,788 NPS Concession Contract
Critical Access
Karst Hoogeboom
EISE EISE shuttle Shuttle/Bus/Van/Tram
94,922 Non-NPS Concession Contract
Critical Access
John Joyce
FIIS Sailors Haven Ferry
Boat/Ferry Not reported
Non-NPS Concession Contract
Critical Access
John Mahoney
FIIS Watch Hill Ferry
Boat/Ferry 36,000 Non-NPS Concession Contract
Critical Access
John Mahoney
HOFR/ELRO/VAMA
FDR Tram Shuttle/Bus/Van/Tram
20,089 NPS NPS Owned and Operated
Special Needs Scott Rector
HOFR/ELRO/VAMA
Roosevelt Ride Shuttle/Bus/Van/Tram
24,972 NPS NPS Owned and Operated
Mobility to or Within Park
Scott Rector
HOFR/ELRO/VAMA
Val-Kill Tram Shuttle/Bus/Van/Tram
14,923 NPS NPS Owned and Operated
Special Needs Scott Rector
JOFL/ ALPO
Lakebed Tours Shuttle/Bus/Van/Tram
1,383 NPS Cooperative Agreement
Interpretive Tour
Keith Newlin
LOWE Canal Tours Boat/Ferry 7,654 NPS Cooperative Agreement
Interpretive Tour
Christine Bruins
LOWE LOWE Historic Trolley
Train/ Trolley
63,803 NPS Cooperative Agreement
Mobility to or Within Park
Christine Bruins
SHEN Rapidan Camp bus
Shuttle/Bus/Van/Tram
1,679 NPS NPS Owned and Operated
Interpretive Tour
Tim Taglauer
STEA Scranton Limited & Live Steam Excursions
Train/ Trolley
28,086 NPS NPS Owned and Operated
Interpretive Tour
Deborah Conway
STLI/ ELIS
Statue of Liberty Ferries
Boat/Ferry 10,343,634 Non-NPS Concession Contract
Critical Access
Ben Hanslin
VAFO History of Valley Forge Trolley Tour
Shuttle/Bus/Van/Tram
11,732 Non-NPS Cooperative Agreement
Interpretive Tour
Graham Delinger
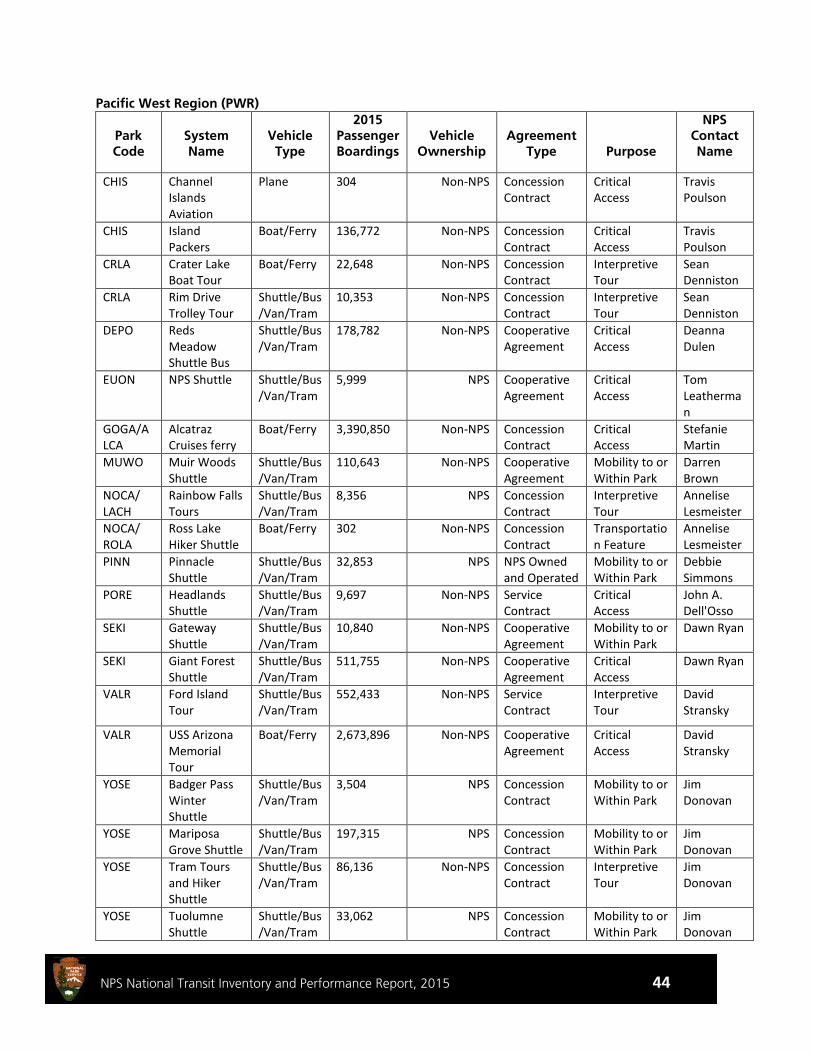
NPS National Transit Inventory and Performance Report, 2015 44
Pacific West Region (PWR)
Park Code
System Name
Vehicle Type
2015 Passenger Boardings
Vehicle Ownership
Agreement Type Purpose
NPS Contact Name
CHIS Channel Islands Aviation
Plane 304 Non-NPS Concession Contract
Critical Access
Travis Poulson
CHIS Island Packers
Boat/Ferry 136,772 Non-NPS Concession Contract
Critical Access
Travis Poulson
CRLA Crater Lake Boat Tour
Boat/Ferry 22,648 Non-NPS Concession Contract
Interpretive Tour
Sean Denniston
CRLA Rim Drive Trolley Tour
Shuttle/Bus/Van/Tram
10,353 Non-NPS Concession Contract
Interpretive Tour
Sean Denniston
DEPO Reds Meadow Shuttle Bus
Shuttle/Bus/Van/Tram
178,782 Non-NPS Cooperative Agreement
Critical Access
Deanna Dulen
EUON NPS Shuttle Shuttle/Bus/Van/Tram
5,999 NPS Cooperative Agreement
Critical Access
Tom Leatherman
GOGA/ALCA
Alcatraz Cruises ferry
Boat/Ferry 3,390,850 Non-NPS Concession Contract
Critical Access
Stefanie Martin
MUWO Muir Woods Shuttle
Shuttle/Bus/Van/Tram
110,643 Non-NPS Cooperative Agreement
Mobility to or Within Park
Darren Brown
NOCA/ LACH
Rainbow Falls Tours
Shuttle/Bus/Van/Tram
8,356 NPS Concession Contract
Interpretive Tour
Annelise Lesmeister
NOCA/ ROLA
Ross Lake Hiker Shuttle
Boat/Ferry 302 Non-NPS Concession Contract
Transportation Feature
Annelise Lesmeister
PINN Pinnacle Shuttle
Shuttle/Bus/Van/Tram
32,853 NPS NPS Owned and Operated
Mobility to or Within Park
Debbie Simmons
PORE Headlands Shuttle
Shuttle/Bus/Van/Tram
9,697 Non-NPS Service Contract
Critical Access
John A. Dell'Osso
SEKI Gateway Shuttle
Shuttle/Bus/Van/Tram
10,840 Non-NPS Cooperative Agreement
Mobility to or Within Park
Dawn Ryan
SEKI Giant Forest Shuttle
Shuttle/Bus/Van/Tram
511,755 Non-NPS Cooperative Agreement
Critical Access
Dawn Ryan
VALR Ford Island Tour
Shuttle/Bus/Van/Tram
552,433 Non-NPS Service Contract
Interpretive Tour
David Stransky
VALR USS Arizona Memorial Tour
Boat/Ferry 2,673,896 Non-NPS Cooperative Agreement
Critical Access
David Stransky
YOSE Badger Pass Winter Shuttle
Shuttle/Bus/Van/Tram
3,504 NPS Concession Contract
Mobility to or Within Park
Jim Donovan
YOSE Mariposa Grove Shuttle
Shuttle/Bus/Van/Tram
197,315 NPS Concession Contract
Mobility to or Within Park
Jim Donovan
YOSE Tram Tours and Hiker Shuttle
Shuttle/Bus/Van/Tram
86,136 Non-NPS Concession Contract
Interpretive Tour
Jim Donovan
YOSE Tuolumne Shuttle
Shuttle/Bus/Van/Tram
33,062 NPS Concession Contract
Mobility to or Within Park
Jim Donovan
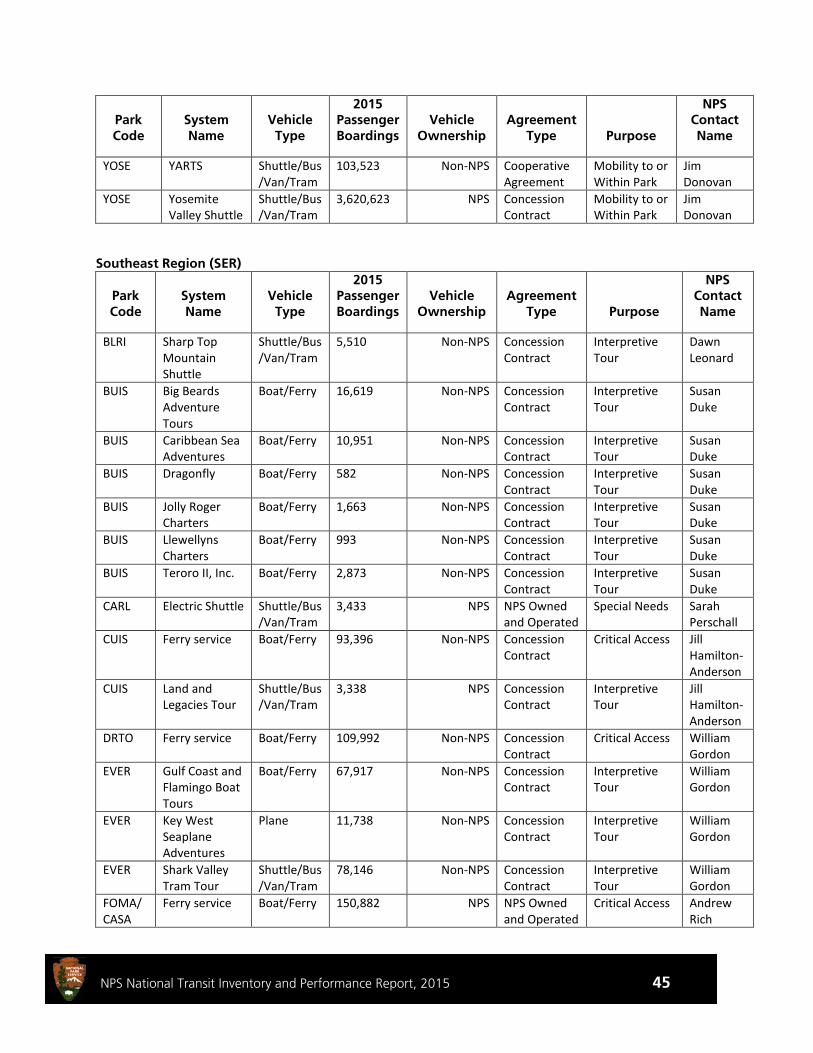
NPS National Transit Inventory and Performance Report, 2015 45
Park Code
System Name
Vehicle Type
2015 Passenger Boardings
Vehicle Ownership
Agreement Type Purpose
NPS Contact Name
YOSE YARTS Shuttle/Bus/Van/Tram
103,523 Non-NPS Cooperative Agreement
Mobility to or Within Park
Jim Donovan
YOSE Yosemite Valley Shuttle
Shuttle/Bus/Van/Tram
3,620,623 NPS Concession Contract
Mobility to or Within Park
Jim Donovan
Southeast Region (SER)
Park Code
System Name
Vehicle Type
2015 Passenger Boardings
Vehicle Ownership
Agreement Type Purpose
NPS Contact Name
BLRI Sharp Top Mountain Shuttle
Shuttle/Bus/Van/Tram
5,510 Non-NPS Concession Contract
Interpretive Tour
Dawn Leonard
BUIS Big Beards Adventure Tours
Boat/Ferry 16,619 Non-NPS Concession Contract
Interpretive Tour
Susan Duke
BUIS Caribbean Sea Adventures
Boat/Ferry 10,951 Non-NPS Concession Contract
Interpretive Tour
Susan Duke
BUIS Dragonfly Boat/Ferry 582 Non-NPS Concession Contract
Interpretive Tour
Susan Duke
BUIS Jolly Roger Charters
Boat/Ferry 1,663 Non-NPS Concession Contract
Interpretive Tour
Susan Duke
BUIS Llewellyns Charters
Boat/Ferry 993 Non-NPS Concession Contract
Interpretive Tour
Susan Duke
BUIS Teroro II, Inc. Boat/Ferry 2,873 Non-NPS Concession Contract
Interpretive Tour
Susan Duke
CARL Electric Shuttle Shuttle/Bus/Van/Tram
3,433 NPS NPS Owned and Operated
Special Needs Sarah Perschall
CUIS Ferry service Boat/Ferry 93,396 Non-NPS Concession Contract
Critical Access Jill Hamilton-Anderson
CUIS Land and Legacies Tour
Shuttle/Bus/Van/Tram
3,338 NPS Concession Contract
Interpretive Tour
Jill Hamilton-Anderson
DRTO Ferry service Boat/Ferry 109,992 Non-NPS Concession Contract
Critical Access William Gordon
EVER Gulf Coast and Flamingo Boat Tours
Boat/Ferry 67,917 Non-NPS Concession Contract
Interpretive Tour
William Gordon
EVER Key West Seaplane Adventures
Plane 11,738 Non-NPS Concession Contract
Interpretive Tour
William Gordon
EVER Shark Valley Tram Tour
Shuttle/Bus/Van/Tram
78,146 Non-NPS Concession Contract
Interpretive Tour
William Gordon
FOMA/CASA
Ferry service Boat/Ferry 150,882 NPS NPS Owned and Operated
Critical Access Andrew Rich
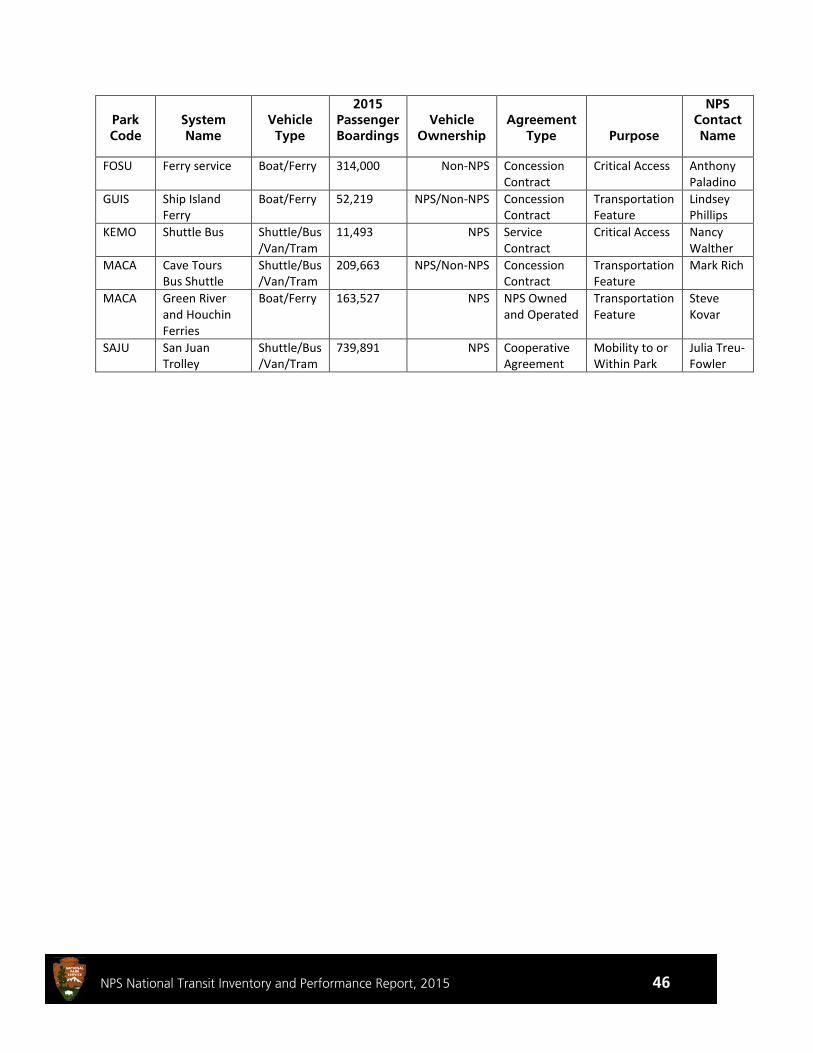
NPS National Transit Inventory and Performance Report, 2015 46
Park Code
System Name
Vehicle Type
2015 Passenger Boardings
Vehicle Ownership
Agreement Type Purpose
NPS Contact Name
FOSU Ferry service Boat/Ferry 314,000 Non-NPS Concession Contract
Critical Access Anthony Paladino
GUIS Ship Island Ferry
Boat/Ferry 52,219 NPS/Non-NPS Concession Contract
Transportation Feature
Lindsey Phillips
KEMO Shuttle Bus Shuttle/Bus/Van/Tram
11,493 NPS Service Contract
Critical Access Nancy Walther
MACA Cave Tours Bus Shuttle
Shuttle/Bus/Van/Tram
209,663 NPS/Non-NPS Concession Contract
Transportation Feature
Mark Rich
MACA Green River and Houchin Ferries
Boat/Ferry 163,527 NPS NPS Owned and Operated
Transportation Feature
Steve Kovar
SAJU San Juan Trolley
Shuttle/Bus/Van/Tram
739,891 NPS Cooperative Agreement
Mobility to or Within Park
Julia Treu-Fowler

NPS National Transit Inventory and Performance Report, 2015 47
Appendix E – Estimated CO2 Emissions Methodology To calculate annual CO2 emissions avoided, a range of vehicle occupancy scenarios for non-electric shuttle systems was used (0, 20, 40, 60, 80, and 100 percent) where the park provided service miles and vehicle capacity. 54 of 60 systems met these criteria.
Under each of the vehicle occupancy scenarios, the transit vehicle occupancy was divided by the NPS average visitor vehicle occupancy of 2.6 to estimate passenger vehicle trips avoided.
𝑇𝑇𝑇𝑇𝑇𝑇𝑇𝑇𝑇𝑇𝑇𝑇𝑇𝑇 𝑉𝑉𝑉𝑉ℎ𝑇𝑇𝑖𝑖𝑖𝑖𝑉𝑉 𝑂𝑂𝑖𝑖𝑖𝑖𝑂𝑂𝑂𝑂𝑇𝑇𝑇𝑇𝑖𝑖𝑂𝑂𝐴𝐴𝐴𝐴𝑉𝑉𝑇𝑇𝑇𝑇𝐴𝐴𝑉𝑉 𝑉𝑉𝑇𝑇𝑇𝑇𝑇𝑇𝑇𝑇𝑉𝑉𝑇𝑇 𝑉𝑉𝑉𝑉ℎ𝑇𝑇𝑖𝑖𝑖𝑖𝑉𝑉 𝑂𝑂𝑖𝑖𝑖𝑖𝑂𝑂𝑂𝑂𝑇𝑇𝑇𝑇𝑖𝑖𝑂𝑂
= 𝑃𝑃𝑇𝑇𝑇𝑇𝑇𝑇𝑉𝑉𝑇𝑇𝐴𝐴𝑉𝑉𝑇𝑇 𝑉𝑉𝑉𝑉ℎ𝑇𝑇𝑖𝑖𝑖𝑖𝑉𝑉 𝑇𝑇𝑇𝑇𝑇𝑇𝑂𝑂𝑇𝑇 𝐴𝐴𝐴𝐴𝑉𝑉𝑇𝑇𝐴𝐴𝑉𝑉𝐴𝐴
Passenger vehicle trips avoided were multiplied by the number of service miles for each shuttle system, to estimate avoided passenger mileage.
𝑃𝑃𝑇𝑇𝑇𝑇𝑇𝑇𝑉𝑉𝑇𝑇𝐴𝐴𝑉𝑉𝑇𝑇 𝑉𝑉𝑉𝑉ℎ𝑇𝑇𝑖𝑖𝑖𝑖𝑉𝑉 𝑇𝑇𝑇𝑇𝑇𝑇𝑂𝑂𝑇𝑇 𝐴𝐴𝐴𝐴𝑉𝑉𝑇𝑇𝐴𝐴𝑉𝑉𝐴𝐴 × 𝑆𝑆𝑉𝑉𝑇𝑇𝐴𝐴𝑇𝑇𝑖𝑖𝑉𝑉 𝑀𝑀𝑇𝑇𝑖𝑖𝑉𝑉𝑇𝑇 = 𝐴𝐴𝐴𝐴𝑉𝑉𝑇𝑇𝐴𝐴𝑉𝑉𝐴𝐴 𝑃𝑃𝑇𝑇𝑇𝑇𝑇𝑇𝑉𝑉𝑇𝑇𝐴𝐴𝑉𝑉𝑇𝑇 𝑀𝑀𝑇𝑇𝑖𝑖𝑉𝑉𝑇𝑇𝐴𝐴𝑉𝑉
Fuel consumption by transit vehicles were calculated using the following assumptions:
Fuel Economy24 Pre-2014 Vehicle Class 2014 Vehicle Class MPG 12-pass., full-size van None 14 15-pass., full-size van Van 14 28-pass. bus Light-duty Shuttle 5 Light-duty hybrid-elec. bus Light-duty Shuttle Hybrid 8 30-pass., 20-40 ft., heavy-duty bus Medium-duty Shuttle 5 Med. duty hybrid-elec. bus Medium-duty Shuttle Hybrid 7 40-pass., 30 ft., heavy-duty bus Heavy-duty Shuttle 4 Heavy-duty hybrid-elec. bus Heavy-duty Shuttle Hybrid 6 CNG heavy-duty transit bus Heavy-duty Shuttle CNG 3 54-passenger school bus 54-passenger School Bus 7
CO2 Emissions by Fuel Type25
Fuel Type Emissions (grams/gallon) Propane 5,740 Gasoline (E10) 8,020 Natural Gas 7,905 Diesel 10,150 Biodiesel (B20) 8,120
The following formula was used to calculate transit vehicle fuel consumption:
𝑇𝑇𝑇𝑇𝑇𝑇𝑇𝑇𝑇𝑇𝑇𝑇𝑇𝑇 𝑉𝑉𝑉𝑉ℎ𝑇𝑇𝑖𝑖𝑖𝑖𝑉𝑉 𝑆𝑆𝑉𝑉𝑇𝑇𝐴𝐴𝑇𝑇𝑖𝑖𝑉𝑉 𝑀𝑀𝑇𝑇𝑖𝑖𝑉𝑉𝑇𝑇𝐸𝐸𝑇𝑇𝑇𝑇𝑇𝑇𝐸𝐸𝑇𝑇𝑇𝑇𝑉𝑉𝐴𝐴 𝐹𝐹𝑂𝑂𝑉𝑉𝑖𝑖 𝐸𝐸𝑖𝑖𝑉𝑉𝑇𝑇𝑉𝑉𝐸𝐸𝑂𝑂
= 𝑇𝑇𝑇𝑇𝑇𝑇𝑇𝑇𝑇𝑇𝑇𝑇𝑇𝑇 𝑉𝑉𝑉𝑉ℎ𝑇𝑇𝑖𝑖𝑖𝑖𝑉𝑉 𝐹𝐹𝑂𝑂𝑉𝑉𝑖𝑖 𝐶𝐶𝑉𝑉𝑇𝑇𝑇𝑇𝑂𝑂𝐸𝐸𝑂𝑂𝑇𝑇𝑇𝑇𝑉𝑉𝑇𝑇
24 Department of the Interior – Bus Lifecycle Cost Modeling. http://www.volpe.dot.gov/transportation-planning/public-lands/department-interior-bus-and-ferry-lifecycle-cost-modeling
25 http://www.eia.gov/oiaf/1605/coefficients.html
NPS National Transit Inventory and Performance Report, 2015 48
The avoided fuel consumption was calculated using the average on-road fuel economy for passenger vehicles in the U.S. (23.2 miles per gallon).26
𝐴𝐴𝐴𝐴𝑉𝑉𝑇𝑇𝐴𝐴𝑉𝑉𝐴𝐴 𝑃𝑃𝑇𝑇𝑇𝑇𝑇𝑇𝑉𝑉𝑇𝑇𝐴𝐴𝑉𝑉𝑇𝑇 𝑀𝑀𝑇𝑇𝑖𝑖𝑉𝑉𝑇𝑇𝐴𝐴𝑉𝑉𝐸𝐸𝑇𝑇𝑇𝑇𝑇𝑇𝐸𝐸𝑇𝑇𝑇𝑇𝑉𝑉𝐴𝐴 𝐹𝐹𝑂𝑂𝑉𝑉𝑖𝑖 𝐸𝐸𝑖𝑖𝑉𝑉𝑇𝑇𝑉𝑉𝐸𝐸𝑂𝑂
= 𝐴𝐴𝐴𝐴𝑉𝑉𝑇𝑇𝐴𝐴𝑉𝑉𝐴𝐴 𝐹𝐹𝑂𝑂𝑉𝑉𝑖𝑖 𝐶𝐶𝑉𝑉𝑇𝑇𝑇𝑇𝑂𝑂𝐸𝐸𝑂𝑂𝑇𝑇𝑇𝑇𝑉𝑉𝑇𝑇 𝑓𝑓𝑇𝑇𝑉𝑉𝐸𝐸 𝑃𝑃𝑇𝑇𝑇𝑇𝐴𝐴𝑇𝑇𝑇𝑇𝑉𝑉 𝑉𝑉𝑉𝑉ℎ𝑇𝑇𝑖𝑖𝑖𝑖𝑉𝑉𝑇𝑇
The fuel consumption figures were then multiplied by the CO2 emissions coefficients provided by the U.S. Energy Information Administration and subtracted transit emissions from avoided private emissions to arrive at an estimate for net CO2 emissions avoided.
𝑇𝑇𝑇𝑇𝑇𝑇𝑇𝑇𝑇𝑇𝑇𝑇𝑇𝑇 𝑉𝑉𝑉𝑉ℎ𝑇𝑇𝑖𝑖𝑖𝑖𝑉𝑉 𝐹𝐹𝑂𝑂𝑉𝑉𝑖𝑖 𝐶𝐶𝑉𝑉𝑇𝑇𝑇𝑇𝑂𝑂𝐸𝐸𝑂𝑂𝑇𝑇𝑇𝑇𝑉𝑉𝑇𝑇 × 𝐸𝐸𝐸𝐸𝑇𝑇𝑇𝑇𝑇𝑇𝑇𝑇𝑉𝑉𝑇𝑇𝑇𝑇 𝐶𝐶𝑉𝑉𝑉𝑉𝑓𝑓𝑓𝑓𝑇𝑇𝑖𝑖𝑇𝑇𝑉𝑉𝑇𝑇𝑇𝑇 = 𝐸𝐸𝑇𝑇𝑇𝑇𝑇𝑇𝐸𝐸𝑇𝑇𝑇𝑇𝑉𝑉𝐴𝐴 𝑇𝑇𝑇𝑇𝑇𝑇𝑇𝑇𝑇𝑇𝑇𝑇𝑇𝑇 𝐸𝐸𝐸𝐸𝑇𝑇𝑇𝑇𝑇𝑇𝑇𝑇𝑉𝑉𝑇𝑇𝑇𝑇
𝐴𝐴𝐴𝐴𝑉𝑉𝑇𝑇𝐴𝐴𝑉𝑉𝐴𝐴 𝐹𝐹𝑂𝑂𝑉𝑉𝑖𝑖 𝐶𝐶𝑉𝑉𝑇𝑇𝑇𝑇𝑂𝑂𝐸𝐸𝑂𝑂𝑇𝑇𝑇𝑇𝑉𝑉𝑇𝑇 𝑓𝑓𝑇𝑇𝑉𝑉𝐸𝐸 𝑃𝑃𝑇𝑇𝑇𝑇𝐴𝐴𝑇𝑇𝑇𝑇𝑉𝑉 𝑉𝑉𝑉𝑉ℎ𝑇𝑇𝑖𝑖𝑖𝑖𝑉𝑉𝑇𝑇 × 𝐸𝐸𝐸𝐸𝑇𝑇𝑇𝑇𝑇𝑇𝑇𝑇𝑉𝑉𝑇𝑇𝑇𝑇 𝐶𝐶𝑉𝑉𝑉𝑉𝑓𝑓𝑓𝑓𝑇𝑇𝑖𝑖𝑇𝑇𝑉𝑉𝑇𝑇𝑇𝑇= 𝐺𝐺𝑇𝑇𝑉𝑉𝑇𝑇𝑇𝑇 𝐸𝐸𝐸𝐸𝑇𝑇𝑇𝑇𝑇𝑇𝑇𝑇𝑉𝑉𝑇𝑇𝑇𝑇 𝐴𝐴𝐴𝐴𝑉𝑉𝑇𝑇𝐴𝐴𝑉𝑉𝐴𝐴
𝐺𝐺𝑇𝑇𝑉𝑉𝑇𝑇𝑇𝑇 𝐸𝐸𝐸𝐸𝑇𝑇𝑇𝑇𝑇𝑇𝑇𝑇𝑉𝑉𝑇𝑇𝑇𝑇 𝐴𝐴𝐴𝐴𝑉𝑉𝑇𝑇𝐴𝐴𝑉𝑉𝐴𝐴 − 𝐸𝐸𝑇𝑇𝑇𝑇𝑇𝑇𝐸𝐸𝑇𝑇𝑇𝑇𝑉𝑉 𝑇𝑇𝑇𝑇𝑇𝑇𝑇𝑇𝑇𝑇𝑇𝑇𝑇𝑇 𝐸𝐸𝐸𝐸𝑇𝑇𝑇𝑇𝑇𝑇𝑇𝑇𝑉𝑉𝑇𝑇𝑇𝑇 = 𝐸𝐸𝑇𝑇𝑇𝑇𝑇𝑇𝐸𝐸𝑇𝑇𝑇𝑇𝑉𝑉𝐴𝐴 𝑁𝑁𝑉𝑉𝑇𝑇 𝐸𝐸𝐸𝐸𝑇𝑇𝑇𝑇𝑇𝑇𝑇𝑇𝑉𝑉𝑇𝑇𝑇𝑇 𝐴𝐴𝐴𝐴𝑉𝑉𝑇𝑇𝐴𝐴𝑉𝑉𝐴𝐴
26 United States Department of Transportation Bureau of Transportation Statistics, Average Fuel Efficiency of U.S. Light Duty Vehicles (Light duty vehicle, short wheel base), 2014. http://www.rita.dot.gov/bts/sites/rita.dot.gov.bts/files/publications/national_transportation_statistics/html/table_04_23.html

NPS National Transit Inventory and Performance Report, 2015 49
Appendix F – Vehicle Replacement Assumptions Uniform vehicle replacement costs and expected service lives were used to provide service-wide consistency in estimates of vehicle age, remaining service life, and recapitalization costs. For 2015, the assumptions were updated from previous inventories27 to reflect the usage and operating characteristics of NPS vehicles. NPS vehicles are not utilized in the same way that city transit vehicles are; they are typically not used for the entire year, nor are they used as intensively as transit vehicles in an urban environment. Vehicle cost estimates were mostly taken from the General Service Administration’s AutoChoice Database.
Assumptions Gas/Diesel/Biodiesel/Propane CNG
Vehicle Type Replacement Cost Expected
Life Replacement
Cost Expected
Life
Passenger Van $33,000 10 N/A N/A
Light-duty Shuttle $107,000 15 $120,500 10
Medium-Duty Shuttle $147,000 15 $154,000 10
Heavy-Duty Shuttle $147,000 15 $158,000 10
Medium-Duty Transit $275,000 18 $330,000 20
Heavy-Duty Transit $440,000 18 $478,000 20
School Bus $126,500 18 N/A N/A
6-12 pax Electric Tram N/A 11 N/A 11
27 The 2014 Inventory used Replacement costs and expected life assumptions based on the Federal Transit Administration: Useful Life of Transit Buses and Vans – April 2007 (http://www.fta.dot.gov/documents/Useful_Life_of_Buses_Final_Report_4-26-07_rv1.pdf).
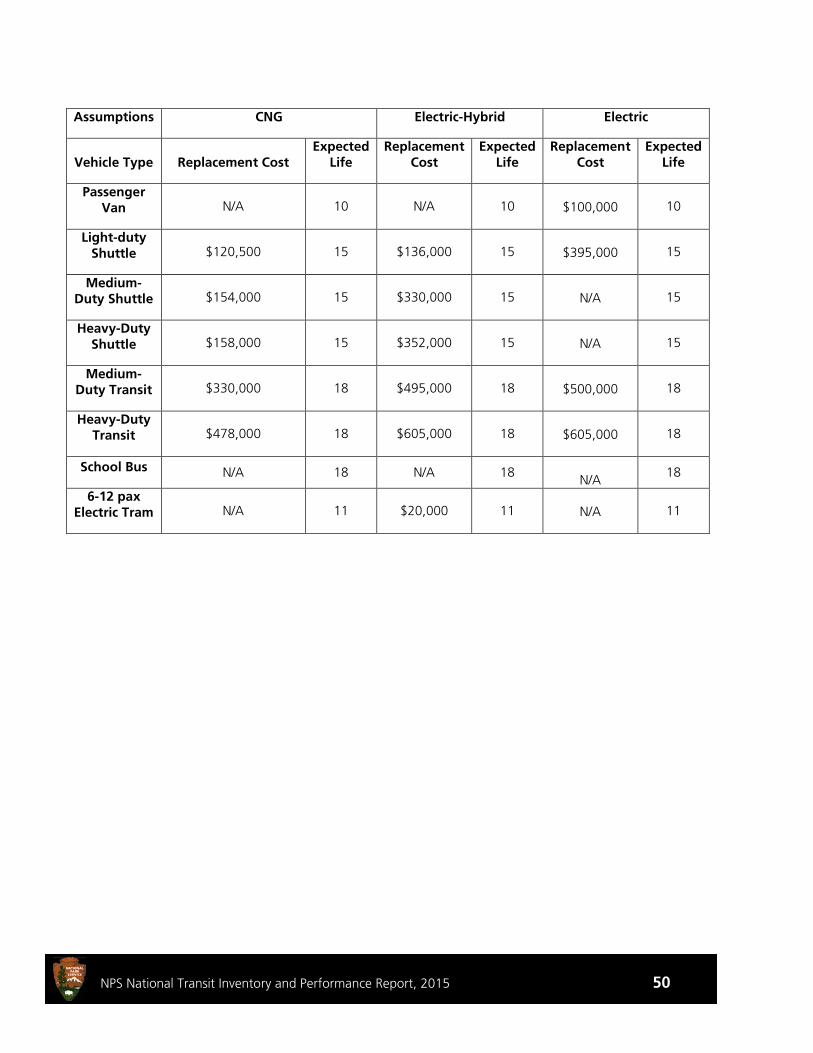
NPS National Transit Inventory and Performance Report, 2015 50
Assumptions CNG Electric-Hybrid Electric
Vehicle Type Replacement Cost Expected
Life Replacement
Cost Expected
Life Replacement
Cost Expected
Life
Passenger Van N/A 10 N/A 10 $100,000 10
Light-duty Shuttle $120,500 15 $136,000 15 $395,000 15
Medium-Duty Shuttle $154,000 15 $330,000 15 N/A 15
Heavy-Duty Shuttle $158,000 15 $352,000 15 N/A 15
Medium-Duty Transit $330,000 18 $495,000 18 $500,000 18
Heavy-Duty Transit $478,000 18 $605,000 18 $605,000 18
School Bus N/A 18 N/A 18 N/A 18
6-12 pax Electric Tram N/A 11 $20,000 11 N/A 11


REPORT DOCUMENTATION PAGE Form Approved OMB No. 0704-0188
Public reporting burden for this collection of information is estimated to average 1 hour per response, including the time for reviewing instructions, searching existing data sources, gathering and maintaining the data needed, and completing and reviewing the collection of information. Send comments regarding this burden estimate or any other aspect of this collection of information, including suggestions for reducing this burden, to Washington Headquarters Services, Directorate for Information Operations and Reports, 1215 Jefferson Davis Highway, Suite 1204, Arlington, VA 22202-4302, and to the Office of Management and Budget, Paperwork Reduction Project (0704-0188), Washington, DC 20503.
1. AGENCY USE ONLY (Leave blank) 2. REPORT DATE February 2017
3. REPORT TYPE AND DATES COVERED Final Report
4. TITLE AND SUBTITLE NPS National Transit Inventory and Performance Report, 2015
5a. FUNDING NUMBERS VU11/QB334
6. AUTHOR(S)
Jessica Baas, David Daddio, Alexandra McNally, Adam Perruzzi, Eric Burkman, Heather Richardson
5b. CONTRACT NUMBER
7. PERFORMING ORGANIZATION NAME(S) AND ADDRESS(ES) U.S. Department of Transportation John A. Volpe National Transportation Systems CenterTransportation Planning Division55 BroadwayCambridge, MA 02142-1093
8. PERFORMING ORGANIZATION REPORT
DOT-VNTSC-NPS-17-02
9. SPONSORING/MONITORING AGENCY NAME(S) AND ADDRESS(ES) Nathan Tatum and Joni GallegosNational Park Service PFMD/Transportation Branch 1201 Eye Street, NW Tenth Floor Washington, DC 20005
10. SPONSORING/MONITORING AGENCY REPORT NUMBER
999/136171
11. SUPPLEMENTARY NOTES
12a. DISTRIBUTION/AVAILABILITY STATEMENT
Public distribution/availability
12b. DISTRIBUTION CODE
13. ABSTRACT
This document summarizes key highlights and performance measures relating to the National Park Service (NPS) 2015 National Transit Inventory, by presenting data for NPS transit systems and vehicles nationwide. These highlights and performance measures include ridership, business model, service life, and emissions information, along with business models and funding sources. Key findings include: - 127 transit systems operated in 64 of the 413 NPS units - 42.9 million total passenger boardings in 2015 - 63% of NPS transit systems operate under concession contracts - 60% of NPS-owned transit vehicles operate on alternative fuel
This inventory is and will continue to be repeated annually.
14. SUBJECT TERMS
National Park Service, Alternative Transportation Program, transit system, motorized vehicle, shuttle, alternative fuel, business model, performance measure, vehicle inventory, recapitalization
15. NUMBER OF PAGES
55
16. PRICE CODE
17. SECURITY CLASSIFICATION OF REPORT
Unclassified
18. SECURITY CLASSIFICATION OF THIS PAGE
Unclassified
19. SECURITY CLASSIFICATION OF ABSTRACT
Unclassified
20. LIMITATION OF ABSTRACTUnlimited
NSN 7540-01-280-5500 Standard Form 298 (Rev. 2-89)
Prescribed by ANSI Std. 239-18
298-102
As the nation’s principal conservation agency, the Department of the Interior has the responsibility for most of our nationally owned public lands and natural resources. This includes fostering sound use of our land and water resources; protecting our fish, wildlife, and biological diversity; preserving the environmental and cultural values of our parks and historic places; and providing for the enjoyment of life through outdoor recreation. The department assesses our energy and mineral resources and works to ensure that their development is in the best interests of all our people by encouraging stewardship and citizen participation in their care. The department also has a major responsibility for American Indian reservation communities and for people who live in island territories under U.S. administration.
999/136171 / February 2017