2015 Municipal Budget Overview Borough of Montvale April 14, 2015.
26
2015 Municipal Budget Overview Borough of Montvale April 14, 2015
-
Upload
britney-powers -
Category
Documents
-
view
219 -
download
0
Transcript of 2015 Municipal Budget Overview Borough of Montvale April 14, 2015.

2015 Municipal Budget Overview
Borough of Montvale
April 14, 2015
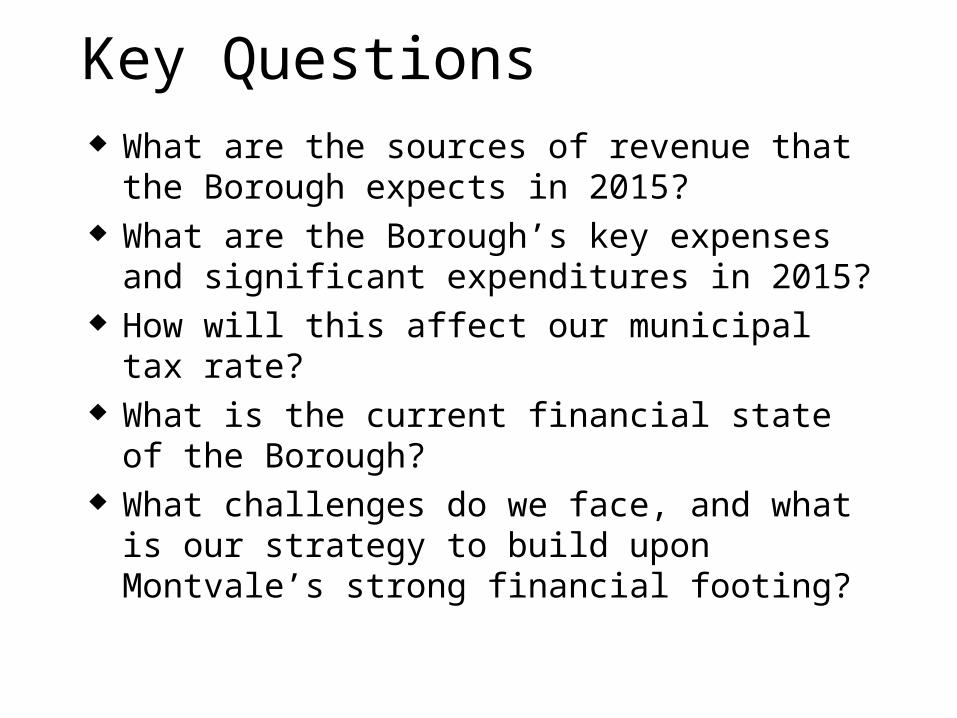
Key Questions What are the sources of revenue that the Borough
expects in 2015? What are the Borough’s key expenses and
significant expenditures in 2015? How will this affect our municipal tax rate? What is the current financial state of the Borough? What challenges do we face, and what is our
strategy to build upon Montvale’s strong financial footing?

2015 Budget Summary
Revenues
Budget Year
(2015)
Proposed
Prior
Year (2014)
Adopted
Change Percent
Surplus Anticipated (Utilized) 4,750,000
2,800,000
1,950,000
69.64%
Local 486,450 478,450 8,000 1.67%
State Aid 1,262,378 1,262,378 0 0%
Construction Code 210,000 225,000 <15,000> <6.67>%
Interlocal Agreements 166,427 166,381 46 0.03%
Public & Private Revenue 685,600 18,577 667,023 3590.59%
Special Items 329,305 300,744 28,561 9.50%
Delinquent Tax 210,000 215,000 <5,000> <2.33>%
Municipal Tax 11,839,107
11,499,918
339,189 2.95%
TOTALS 19,939,267 16,966,448 2,972,819 17.52%

2015 Budget Summary Appropriations
Budget Year (2015)
Proposed
Prior Year
(2014)
AdoptedChange Percent
Salary and Wages 4,445,012 4,245,485 199,527 4.70%
Deferred Charges & Statutory Expenditures
992,956 952,199 40,757
4.28%
Other Appropriations
7,931,257 7,640,232 291,025 3.81%
Debt Service 1,824,105 1,823,305 800 .04%
Capital Improvements
3,166,958 786,100 2,380,858 302.87%
Reserve for Uncollected Taxes
1,578,979 1,519,127 59,852 3.94%
TOTALS 19,939,267 16,966,448 2,972,819 17.52%

Significant Expenditures
Road Resurfacing Fire Engine Replacement Sewer Line Project at Pascack Brook Planning, Design, & Engineering Costs for
replacement of Montvale Firehouse
While capital expenditures, the Borough is paying for these projects and items with current funds, not additional debt.

Property Tax Levies2015
(Projected)
2014 2013 2012
Municipal 11,839,107 11,499,918 11,181,960 10,767,930
Open Space 102,808 100,465 100,623 118,762
Regional School 12,196,368 11,841,134 11,270,846 10,919,352
Local School 15,523,031 15,070,904 14,645,752 14,217,867
County 5,449,701 5,290,972 4,960,331 4,961,331
Total Levy 45,111,015 43,803,393 42,159,512 40,985,242

2015 Projected Tax Levy
24.61%
1.63%
34.41%
27.04%
12.08%
0.23%Percent
Borough
Library
Local School
Regional School
County
Open Space

Tax Rate Comparison2015
(Projected)
2014 Change Percent
County .265 .264 .001 .38%
Regional School .593 .590 .003 .51%
Local School .755 .750 .005 .67%
Open Space .005 .005 0 0%
Library .036 .038 <.002> <5.26>%
Municipal .540 .534 .006 1.12%
Total Municipal
.576 .572 .004 .70%
Total 2.194 2.181 .013 .60%
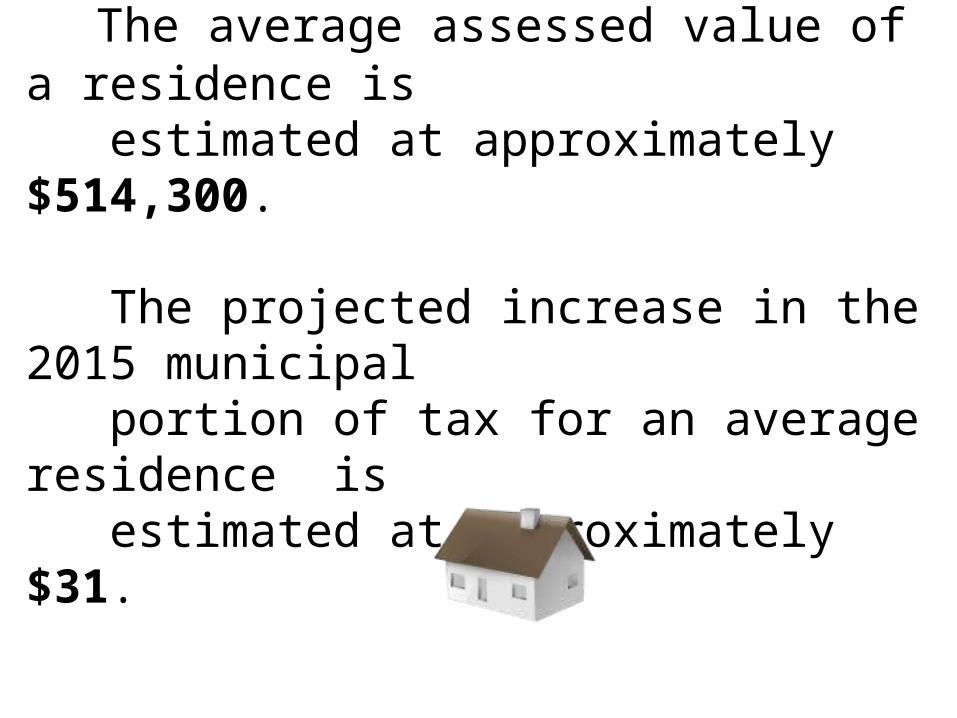
The average assessed value of a residence is estimated at approximately $514,300.
The projected increase in the 2015 municipal portion of tax for an average residence is estimated at approximately $31.

Montvale Surplus Overview
Surplus plays two important roles for the town: 1) it serves as a cushion against the impact of negative financial events; and
2) it provides liquidity for cash flow.
Year Utilized in Budget Balance at Year End
2008 $2,325,000 $3,058,780
2009 $1,800,000 $2,190,087
2010 $1,800,000 $2,955,738
2011 $1,800,000 $3,672,643
2012 $1,800,000 $4,448,600
2013 $2,100,000 $5,686,888
2014 $2,800,000 $6,707,625
2015 (proposed) $4,750,000 $4,572,090

Municipal DebtYear Bonds Notes
Authorized But Not Issued
Total
2010 10,198,000
1,900.000
46,616
12,144,616
2011 12,663,000
0
1,528
12,644,528
2012 11,175,000 0
0
11,175,000
2013 9,685,000
0
0
9,685,000
2014 8,155,000
0
0
8,155,000

Debt Service: Current Schedule
Combined Existing Outstanding DebtYear Principal Interest Total At End of Year
2015 $ 1,575,000 $ 249,100 $ 1,824,100 $ 6,580,0002016 1,595,000 200,950 1,795,950 4,985,0002017 1,630,000 152,450 1,782,450 3,355,0002018 1,625,000 105,900 1,730,900 1,730,0002019 875,000 47,563 922,563 855,0002020 425,000 21,375 446,375 430,0002021 430,000 10,750 440,750 0

Municipal Debt
The Borough’s bond rating is a AAA with a stable outlook.
The following factors (among others) were considered
in determining the rating:
- Surplus and the ability to replenish
- Outstanding debt and the ability to pay
- Tax Base
- Strong financial management practices and a stable financial position

Surplus vs. Municipal Debt
If Montvale has a significant Surplus, why don’t we just pay off our Municipal Debt?•Our current debt is at advantageous rates that might be difficult to replicate in the future•We are careful about economic changes that may place a call on our surplus•In a sense, we are holding down additional debt by paying for capital items with surplus this year•Also: the “fairness” issue…

Long-term Investments: Who Should Pay?
For major projects that will serve Montvale for 50+ years, like the new firehouse, financing a large part of it through debt shares the financial burden of paying for it between today’s taxpayers and future Montvale residents.

Challenges Ahead
Upcoming Infrastructure Investments– Firehouse Replacement
– Road Maintenance; Aging Sanitary Sewer System
– Fieldstone Turf Replacement
Changing Corporate Real Estate Environment– Are Large Corporate HQs Going to Continue?
– Will Tax Appeals Increase in Frequency and Size?
Employee Pension and Health Benefit Liabilities– Much of this Driven by Trenton & Overall Economy
– Continue Offering Services While Managing Salaries and Benefits
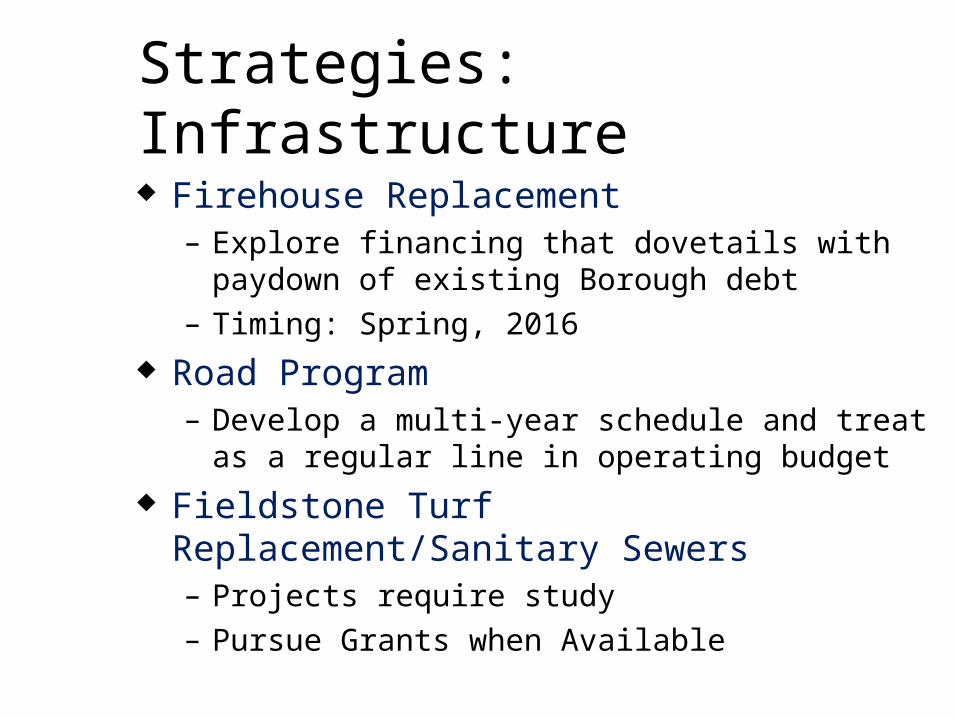
Strategies: Infrastructure
Firehouse Replacement– Explore financing that dovetails with paydown of
existing Borough debt
– Timing: Spring, 2016
Road Program– Develop a multi-year schedule and treat as a regular
line in operating budget
Fieldstone Turf Replacement/Sanitary Sewers– Projects require study
– Pursue Grants when Available

Strategies: Corporate Real Estate
Evaluate Current Zoning– Review Master Plan
Continue Outreach to New Corporate Tenants– Expand Scope to Nontraditional Tenants
– Target Entities with Strong Ties to Specific Location Infrastructure
Establish Increased Reserve for Tax Appeals
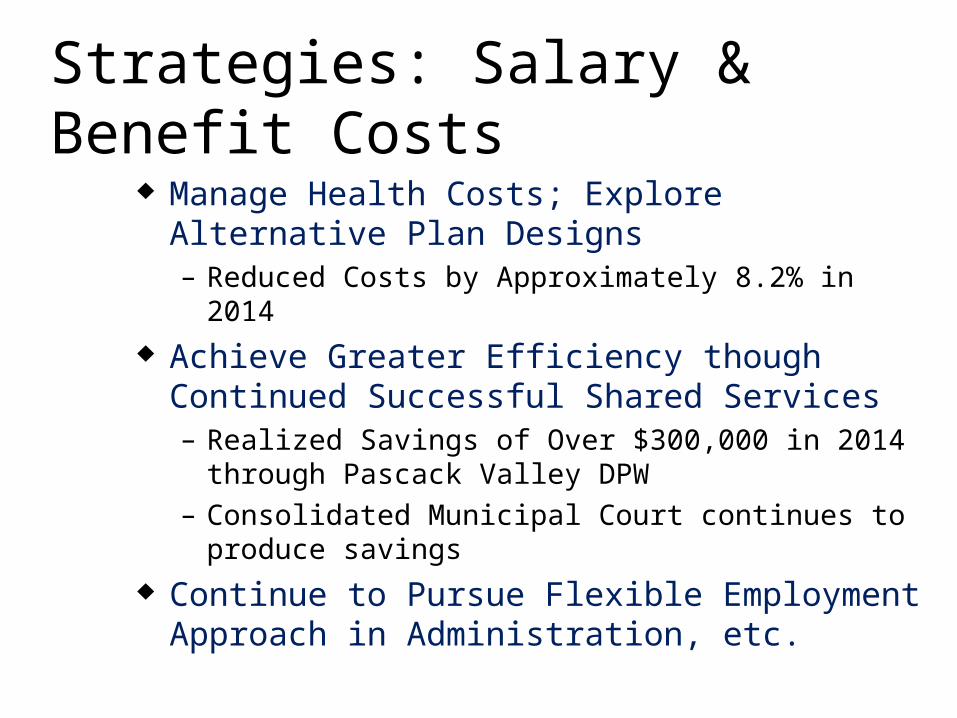
Strategies: Salary & Benefit Costs
Manage Health Costs; Explore Alternative Plan Designs– Reduced Costs by Approximately 8.2% in 2014
Achieve Greater Efficiency though Continued Successful Shared Services– Realized Savings of Over $300,000 in 2014 through
Pascack Valley DPW
– Consolidated Municipal Court continues to produce savings
Continue to Pursue Flexible Employment Approach in Administration, etc.

Questions?

APPENDIX & EXHIBITS

Grants Received
Clean Communities– 2012 $13,601.29– 2013 $15,976.00– 2014 $14,984.21
Recycling Tonnage Grant– 2012 $6,892.00– 2013 $12,143.68– 2014 $10,627.30

Medical Benefits Comparison of Health Insurance Costs
for 2014 and 2013
Difference
Actual Cost Increase
Group Insurance 2014 2013 (Decrease)
Medical 631,079 690,014 (58,935)
Prescription 217,357 229,447 (12,090)
Dental 43,312 52,100 (8,788)
Total 891,748 971,561 (79,813)
% Decrease 8.20%

SHARED SERVICE ANALYSISBUDGET BUDGET (INCREASE)/2013 2014 DECREASE
ROAD REPAIRS AND MAINTENANCE: SALARIES AND WAGES $599,735 $0 $599,735 OTHER EXPENSES $306,525 $10,000 $296,525
PUBLIC BUILDINGS AND GROUNDS: SALARIES AND WAGES $101,426 $25,000 $76,426 OTHER EXPENSES $121,567 $40,000 $81,567
SEWER SYSTEM: OTHER EXPENSES $60,000 $10,000 $50,000
RECYCLING: SALARIES AND WAGES $8,550 $0 $8,550 OTHER EXPENSES $120,000 $5,000 $115,000
MAINTENANCE OF ALL VEHICLES: OTHER EXPENSES $123,000 $34,000 $89,000
OPEN SPACE: SALARIES AND WAGES $31,000 $0 $31,000 OTHER EXPENSES $23,899 $0 $23,899
OTHER EXPENSES - OTHER: FICA $56,664 $1,913 $54,752 WORKERS COMPENSATION $33,399 $1,051 $32,348 PENSION $70,377 $2,730 $67,647 HEALTH $217,104 $0 $217,104 VISION $4,500 $0 $4,500 LIFE $535 $0 $535
CAPITAL IMPROVEMENTS $60,000 $0 $60,000
SHARED SERVICE AGREEMENT: RIVERVALE $0 $1,503,000 ($1,503,000)
$1,938,281 $1,632,694 $305,587

BOROUGH OF MONTVALECURRENT FUND
ANALYSIS OF REVENUES AND EXPENDITURES
2011-2016
2011 2012 2013 2014 2015 2016AUDITED AUDITED AUDITED UNAUDITED PROPOSED/PROJECTED PROJECTED
REVENUES
SURPLUS $1,800,000 $1,800,000 $2,100,000 $2,800,000 $4,750,000 $2,750,000 LOCAL REVENUES $535,317 $531,209 $569,432 $584,621 $550,250 $486,450 STATE AID $1,262,378 $1,262,378 $1,262,378 $1,262,378 $1,262,378 $1,262,378 UNIFORM CONSTRUCTION $404,853 $376,931 $310,703 $235,186 $225,000 $210,000 INTERLOCAL SERVICE $81,165 $156,071 $150,321 $157,538 $155,000 $167,710 PUBLIC AND PRIVATE $47,322 $379,888 $194,189 $271,394 $685,600 $0 OTHER SPECIAL ITEMS $359,545 $433,126 $444,506 $368,976 $386,397 $320,000 DELINQUENT TAX $289,677 $247,685 $587,019 $364,103 $250,000 $210,000 AMOUNT TO BE RAISED $11,632,913 0.444 $11,593,201 0.453 $12,310,558 0.555 $13,700,747 0.572 $12,939,107 0.576 $12,243,938 0.596 EXCESS REVENUES $1,250,000 MRNA $623,008 $593,843 $782,510 $537,452 $500,000 $500,000 RESERVES LAPSED $518,774 $808,966 $797,608 $743,307 $850,000 $750,000 OTHER $4,005 $9,945 $10,415 $26,401
$17,558,957 $18,193,243 $19,519,639 $21,052,105 $22,553,732 $20,150,476
EXPENDITURES
OPERATIONS: SALARIES $4,204,649 $4,460,047 $4,734,276 $4,245,485 $4,445,012 $4,533,200 OTHER EXPENSE $6,465,775 $7,038,105 $6,532,074 $5,804,571 $6,057,830 $6,168,729 INTERLOCAL SERVICE $330,219 $1,850,881 $1,873,427 $1,922,710 CAPITAL $25,000 $25,000 $350,000 $1,023,698 $3,166,958 $560,000 DEBT SERVICE $1,855,175 $1,820,788 $1,825,290 $1,823,305 $1,824,105 $1,795,955 DEFEERED/STATUTORY $1,090,674 $943,978 $918,864 $952,199 $992,956 $1,042,000 RESERVE FOR UNCOLLECTED $1,399,648 $1,435,562 $1,479,943 $1,519,127 $1,578,979 $1,627,882 OTHER $1,131 $3,806 $10,685 $12,102
$15,042,052 $15,727,286 $16,181,351 $17,231,368 $19,939,267 $17,650,476
$2,516,905 $2,465,957 $3,338,288 $3,820,737 $2,614,465 $2,500,000
ADJUSTMENTS $110,000
$2,516,905 $2,575,957 $3,338,288 $3,820,737 $2,614,465 $2,500,000SURPLUS 1/1 $2,955,738 $3,672,643 $4,448,600 $5,686,888 $6,707,625 $4,572,090
$5,472,643 $6,248,600 $7,786,888 $9,507,625 $9,322,090 $7,072,090SURPLUS ANTICIPATED $1,800,000 $1,800,000 $2,100,000 $2,800,000 $4,750,000 $2,750,000
SURPLUS 12/31 $3,672,643 $4,448,600 $5,686,888 $6,707,625 $4,572,090 $4,322,090

BOROUGH OF MONTVALEANALYSIS OF BUDGET REVENUES
FIVE YEAR
CUMULATIVEINCREASE/ INCREASE/ INCREASE/ INCREASE/ INCREASE/<DECREASE> <DECREASE> <DECREASE> PROPOSED <DECREASE> <DECREASE>
CATEGORY 2011 2012 PERCENT 2012 2013 PERCENT 2013 2014 PERCENT 2014 2015 PERCENT PERCENT
SURPLUS 1,800,000 1,800,000 0 1,800,000 2,100,000 300,000 2,100,000 2,800,000 700,000 2,800,000 4,750,000 1,950,000 2,950,0000.00% 16.67% 33.33% 69.64% 163.89%
LOCAL REVENUE 469,500 467,100 (2,400) 467,100 468,450 1,350 468,450 478,450 10,000 478,450 486,450 8,000 16,950-0.51% 0.29% 2.13% 1.67% 3.61%
STATE AID 1,262,378 1,262,378 0 1,262,378 1,262,378 0 1,262,378 1,262,378 0 1,262,378 1,262,378 0 00.00% 0.00% 0.00% 0.00% 0.00%
UNIFORM CONSTRUCTION CODE 225,000 225,000 0 225,000 225,000 0 225,000 225,000 0 225,000 210,000 (15,000) (15,000)0.00% 0.00% 0.00% -6.67% -6.67%
INTERLOCAL SERVICE AGREEMENTS 134,375 161,606 27,231 161,606 156,719 (4,887) 156,719 166,381 9,662 166,381 166,427 46 32,0520.00% 0.00% 0.00% 0.03% 100.00%
PUBLIC AND PRIVATE (GRANTS) 29,069 28,992 (77) 28,992 24,359 (4,633) 24,359 18,577 (5,782) 18,577 685,600 667,023 656,531-0.26% -15.98% -23.74% 3590.59% 2258.53%
OTHER SPECIAL ITEMS 288,422 366,155 77,733 366,155 376,970 10,815 376,970 300,744 (76,226) 300,744 329,305 28,561 40,88326.95% 2.95% -20.22% 9.50% 14.17%
DELINQUENT TAXES 250,000 205,000 (45,000) 205,000 205,000 0 205,000 215,000 10,000 215,000 210,000 (5,000) (40,000)-18.00% 0.00% 4.88% -2.33% -16.00%
AMOUNT TO BE RAISED 10,563,924 10,767,930 204,006 10,767,930 11,181,960 414,030 11,181,960 11,499,918 317,958 11,499,918 11,839,107 339,189 1,275,1831.93% 3.85% 2.84% 2.95% 12.07%
15,022,668 15,284,161 15,284,161 16,000,836 16,000,836 16,966,448 16,966,448 19,939,267