2015 Metropolitan Council Performance Evaluation …... saved $4 million in 2015 energy purchases...
60
2015 PERFORMANCE EVALUATION REPORT REPORT TO THE MINNESOTA LEGISLATURE May 2016
Transcript of 2015 Metropolitan Council Performance Evaluation …... saved $4 million in 2015 energy purchases...

2015
PERFORMANCE
EVALUATION
REPORT
REPORT TO THE MINNESOTA LEGISLATURE
May 2016
maggiep
EDOCS
The Council’s mission is to foster efficient and economic growth for a prosperous metropolitan region.
Metropolitan Council Members
Adam Duininck-Chair
Katie Rodriguez-District 1
Lona Schreiber-District 2
Jennifer Munt-District 3
Deb Barber-District 4
Steve Elkins-District 5
Gail Dorfman-District 6
Gary L. Cunningham-District 7
Cara Letofsky-District 8
Edward Reynoso-District 9
Marie McCarthy-District 10
Sandy Rummel-District 11
Harry Melander-District 12
Richard Kramer-District 13
Jon Commers-District 14
Steven T. Chávez-District 15
Wendy Wulff-District 16
The Metropolitan Council is the regional planning
organization for the seven-county Twin Cities area.
The Council operates the regional bus and rail
system, collects and treats wastewater, coordinates
regional water resources, plans and helps fund
regional parks, and administers federal funds that
provide housing opportunities for low- and moderate-
income individuals and families. The 17-member
Council board is appointed by and serves at the
pleasure of the governor.
This publication is printed on recycled paper.
On request, this publication will be made available in alternative formats to people with disabilities. Call Metropolitan Council information at 651-602-1140 or TTY 651-291-0904.

Metropolitan Council 2015 Performance Evaluation Report
1
About This Report
The Metropolitan Council recognizes performance evaluation as a key tool to ensure that its
functions meet their objectives in a timely and cost-effective manner. The Council has
implemented a number of methods to strengthen its performance evaluation process.
This report is required by Minnesota Statutes, Section 473.13, Subdivision 1a, which calls for
the Council to submit annually to the Legislature a “…substantive assessment and evaluation
of the effectiveness of each significant program of the Council, with, to the extent possible,
quantitative information on the status, progress, costs, benefits and effects of each program.”
The report provides a record of the services provided and service levels achieved by the
Council in the context of historical trends, performance measures and budget compliance.
The report includes multi-year performance measures for all major operations and
summarizes significant accomplishments by division.
The report is organized into six sections. The introduction describes the Council’s authority,
organization, and major functions. The overview summarizes the Council’s major
accomplishments in 2015. The next three sections discuss division results and the
accomplishments of the individual units within each division. The last section is the appendix,
which includes maps showing Council Districts, participating communities in the Council’s
Livable Communities program, the Metro HRA service area, Regional Parks and Trails, transit
routes and service areas, the sewer service network and a 2015 Council budget summary.
Contents
Introduction .......................................................................................................................... 2
Overview of the Council’s Performance ............................................................................... 3
Community Development .................................................................................................... 8
Transportation Division ...................................................................................................... 15
Metropolitan Transportation Services ............................................................................. 17
Metro Transit – A Service of the Metropolitan Council .................................................... 26
Environmental Services Division ........................................................................................ 39
Appendix: Maps and Budget Summary .............................................................................. 46
Metropolitan Council 2015 Performance Evaluation Report
2
Introduction
The Twin Cities Region and the Metropolitan Council
The seven-county metropolitan area is a growing and economically vibrant region with a
population of 3 million. The regional economy is supported by diverse industries and has an
unemployment rate below the national average. The region’s population is projected to grow
to more than 3.6 million people by 2040.
The Metropolitan Council was created by the Minnesota Legislature in 1967 to plan and
coordinate the orderly growth and development of the seven-county area. It has authority to
plan for regional systems that include transportation, aviation, water resources, and regional
parks and open space. The Council’s core mission also includes the efficient operation of
transit, wastewater collection and treatment, and housing assistance programs for
households with low incomes.
The governor appoints a chair who serves at large and 16 Council members representing
districts, who together govern the Council. To carry out its responsibilities, the Council
established divisions for transportation, environment, and community development, along with
standing committees to deal with each of these areas. The Council has approximately 4,200
employees and annual operating expenditures of approximately $654 million, mostly for
regional transit service and wastewater treatment.
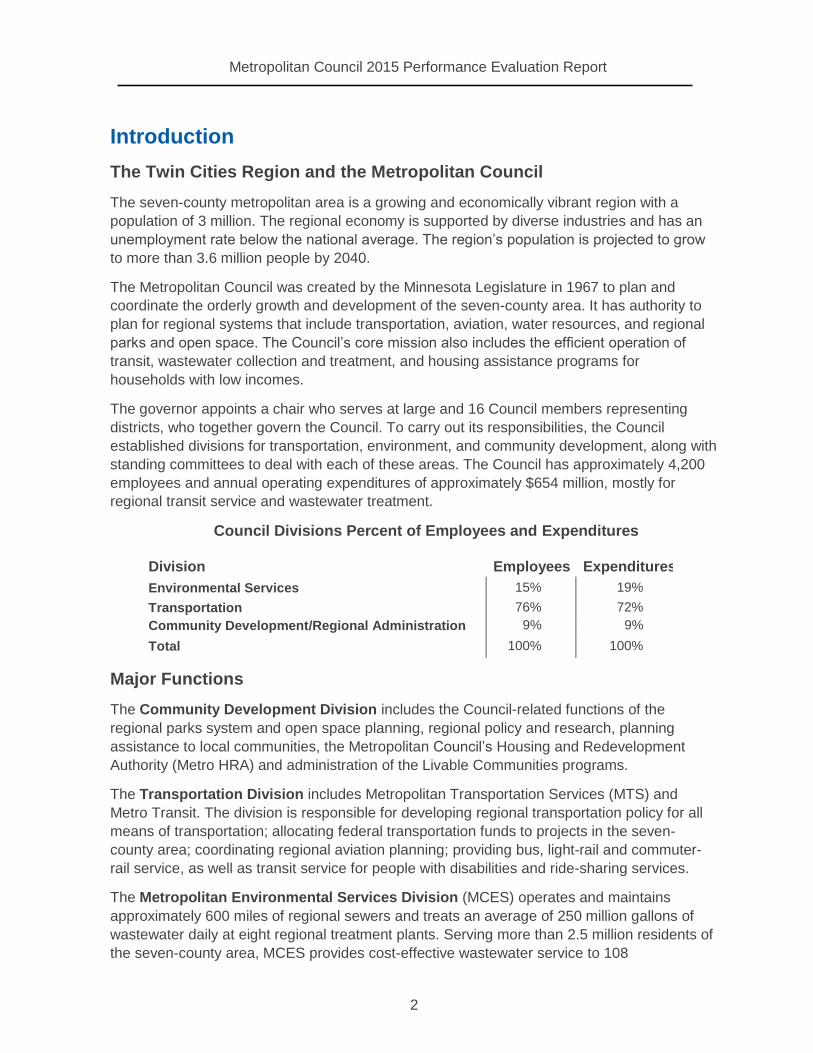
Council Divisions Percent of Employees and Expenditures
Division Employees Expenditures
Environmental Services 15% 19%
Transportation 76% 72%
Community Development/Regional Administration 9% 9%
Total 100% 100%
Major Functions
The Community Development Division includes the Council-related functions of the
regional parks system and open space planning, regional policy and research, planning
assistance to local communities, the Metropolitan Council’s Housing and Redevelopment
Authority (Metro HRA) and administration of the Livable Communities programs.
The Transportation Division includes Metropolitan Transportation Services (MTS) and
Metro Transit. The division is responsible for developing regional transportation policy for all
means of transportation; allocating federal transportation funds to projects in the seven-
county area; coordinating regional aviation planning; providing bus, light-rail and commuter-
rail service, as well as transit service for people with disabilities and ride-sharing services.
The Metropolitan Environmental Services Division (MCES) operates and maintains
approximately 600 miles of regional sewers and treats an average of 250 million gallons of
wastewater daily at eight regional treatment plants. Serving more than 2.5 million residents of
the seven-county area, MCES provides cost-effective wastewater service to 108
Metropolitan Council 2015 Performance Evaluation Report
3
communities. The MCES mission is to provide wastewater services and integrated planning to
ensure sustainable water quality and water supply for the region.
Overview of the Council’s Performance
Updated Transportation Policy Plan adopted
The 2040 Transportation Policy Plan, adopted by the Council in 2015, provides policy
direction and investment priorities for the region’s transportation system over the next 25
years, in line with the regional development plan –Thrive MSP 2040. The transportation plan
details existing conditions and future needs for the region’s system as a whole, as well as
expected investments in the regional highway and transit systems.
For the first time, the plan identifies a Regional Bicycle Transportation Network. It also
provides a stronger emphasis on the relationship between local development decisions and
transportation investment, particularly for transit.
Plan sets framework to strengthen, expand regional park system
The 2040 Regional Parks Policy Plan advances the Thrive MSP 2040 goals of stewardship,
prosperity, equity, livability, and sustainability. The plan provides for expanding the Regional
Parks System and providing regional park facilities that foster healthy living and enhances
quality of life in the region. It supports expanding multimodal access to regional park facilities
and strengthening equitable usage of regional parks and trails by all the region’s residents,
across age, race, ethnicity, income, national origin, and ability.
Plan paves way for solutions to water resources management
Working with partner agencies and the region’s communities, the Council updated and
adopted the 2040 Water Resources Policy Plan. The plan has two overarching themes –
taking an integrated approach to water supply, water quality and wastewater collection and
treatment, rather than addressing those issues separately; and doing so in collaboration with
local government and other partners. The plan includes policies and strategies to treat
wastewater to high water-quality standards, protect public health and the environment, and
protect and improve the quality of surface waters.
Council amends Housing Policy Plan
In 2015, the Council amended the 2040 Housing Policy Plan that it adopted in 2014 to include
an updated Allocation of Affordable Housing Need. The Allocation of Affordable Housing
Need helps local governments plan for their respective share of allocated need as they
amend and adopt their comprehensive plans. The Council also adopted a new set of
guidelines for Housing Policy Performance.
Ensuring the metro area has adequate water supplies
In 2015 the Metropolitan Area Water Supply Advisory Committee and the Council approved
an updated Metropolitan Area Master Water Supply Plan. The plan charts a path toward a
future of affordable, safe and abundant water needed for a prosperous and equitable region.
The plan stresses collaboration among communities and agencies, using data that helps map

Metropolitan Council 2015 Performance Evaluation Report
4
out water supply trends, and options for action as keys to a successful “water future” for the
metro area. The Council’s role includes providing information and planning tools to help
communities secure safe and plentiful drinking water, while protecting the region’s water
resources.
Seeking solutions to water supply issues
Through partnerships with local communities and government agencies, the Council’s water
supply studies and projects seek to ensure that regional water supplies can support current
and future generations. These projects will support community efforts to protect and manage
water supplies and prevent further degradation of water sources in the metropolitan area. The
Council’s water supply efforts will help identify high-priority areas for protecting groundwater,
will identify feasible options to address emerging water supply issues, and will support
communities’ efforts to preserve groundwater recharge areas.
Sustainability efforts include solar development
At the Blue Lake Wastewater Treatment Plant, a new public-private solar facility will provide
10% of the plant’s annual energy needs and reduce energy costs. The Council will pass on
the savings to residents and businesses throughout the metro area who pay for wastewater
treatment.
In addition, the Council approved a power-purchase agreement to bring rooftop solar panels
to six Metro Transit facilities in 2016. The panels will provide the equivalent of half the energy
used at their respective locations and are expected to save about $4 million in energy costs
over the next 25 years.
Savings achieved by Environmental Services in energy and money
The Council’s Environmental Services division (MCES) saved $4 million in 2015 energy
purchases for wastewater treatment compared to 2006. The savings result in lower
wastewater rates for city and industrial customers, as well as significant environmental
benefits. MCES is continuing its energy conservation and renewable energy projects that
generate energy to be used onsite. MCES made substantial progress toward its goal of
reducing 25% of its purchased energy by 2015, having reduced purchased energy 23% by
end of 2015.
Council ramps up workforce development
The Council continues to support programs that prepare its future workforce and help
employees gain the skills to support a changing customer base. Metro Transit launched a
new training program that will put job seekers on a path toward full-time employment as
mechanic-technicians. The program offers a combination of career and college readiness,
support toward earning a technical degree, and a paid internship.
The Metro Transit Police Department reached a complement of 109 full-time officers. Many of
the department’s newest members speak a second language, and among the new hires is the
state’s first full-time female Somali police officer. Today the department is roughly 35%
diverse, up from just 5% in 2012.

Metropolitan Council 2015 Performance Evaluation Report
5
Livable Communities Act grants encourage development
In the 2015 funding cycle, the Council awarded $18.5 million in Livable Communities grants to
support revitalization of brownfields for job creation, transit-oriented development, and
affordable housing. Since 1995, the Council has awarded grants totaling $325 million to build
or rehabilitate nearly 21,500 affordable housing units; clean 2,200 acres of polluted land,
creating or retaining 44,000 jobs; and support development of transit-oriented, connected land
uses. The grants have helped leveraged billions of dollars in other public and private
investments.
Park investments protect the environment, raise quality of life
The Council’s investment in our regional parks helps protect sensitive environmental areas,
expands regional parkland and miles of trails, promotes outdoor and environmental learning,
enhances park facilities, and creates jobs. In 2015, the Council approved approximately $24.1
million in grants to the regional park implementing agencies to build, expand or improve
planned park facilities; to acquire properties and trail easements within planned park and trail
boundaries for expanding the regional parks system; and to conduct outdoor recreation and
environmental education, recruit volunteer coordinators to organize outdoor activities, or
provide wayfinding systems for trail users.
Metro HRA earns highest possible ranking, supports homeless veterans
For the 11th straight year, the Council’s Housing and Redevelopment Authority earned the
highest ranking possible for program operation from the U.S. Department of Housing and
Urban Development. Through the federal Housing Choice Voucher program, Metro HRA
works with landlords and program participants to provide rent assistance to the maximum
number of households for the funds available.
Council creates mobility counseling program
The Metro HRA established Community Choice, a mobility counseling program designed to
assist families in finding housing in areas of opportunity. The program is based on a
commitment to provide residents with access to opportunity and the choice of living in
communities with possibilities for prosperity, quality of life, and success in new
neighborhoods.
System Statements issued to local governments for their planning
State law requires the Council to issue System Statements to local governments after it
updates its regional development plan (Thrive MSP 2040) and accompanying system and
policy plans. System statements explain the implications of the regional system plans for each
community in the metropolitan area and include additional information specific to each
community. Communities are obligated to review and, as necessary, amend their
comprehensive plans by the end of 2018.
Planning guidance, resources made available to local governments
To aid local governments in updating their local comprehensive plans, the Council prepared
an updated, web-based Local Planning Handbook. The handbook provides direction on the
required elements for local comprehensive plans; contains suggestions and resources to
Metropolitan Council 2015 Performance Evaluation Report
6
move beyond minimum requirements; connects communities with resources, grants, and
technical assistance; highlights local planning efforts across the region; and includes a new
section with checklists, maps, and resources specific to each community. In addition,
communities can submit their plans and plan amendments online.
Metro Mobility restructuring improves customer service and reduces
costs
Metro Mobility implemented a new service delivery model that provides better customer
service, reduces duplication and improves efficiency. The new delivery model reflects a
change from two core contracts and three small county contracts to three large service
contracts. The service areas were designed to honor past travel patterns.
One of the key effects of the change is to eliminate ride transfers. Previously, customers
traveling between a core contractor and a county contractor would likely have to transfer
vehicles and contractors. Now, all customers receive a “single seat” ride. Restructuring Metro
Mobility also saves the Metropolitan Council an estimated $630,000 annually.
Transit rail ridership climbs, sets records
The METRO Green Line enjoyed tremendous success in its first full-year of operation in 2015,
with nearly 12.4 million rides. Average weekday ridership was just under the ridership forecast
for 2030. More than 10.6 million rides were taken on the Blue Line, the highest annual
ridership since it opened in mid-2004. The Blue Line also celebrated an important milestone
in January, surpassing 100 million total rides since its 2004 opening. Northstar ridership
increased slightly, as on-time performance improved to 95%.
Metro Transit initiates major bus stop improvements
Efforts to improve the waiting experience at bus stops began taking shape across the region
through the Better Bus Stops program. Metro Transit installed shelters at 51 locations where
previously there were none. Many of these sites will include solar-powered lighting. Metro
Transit replaced another 60 shelters in Minneapolis, where Metro Transit assumed
responsibility for shelters previously under private management.
In addition, Metro Transit installed 2,300 new bus stop signs with route numbers, maps and
instructions that help customers access real-time departure information using a mobile
device. The was the first phase in a system-wide roll-out. Digital displays with real-time
departure information were also added at 15 busy bus-boarding locations..
Arterial Bus ”A” Line to start service June 2016
Station construction began on the state’s first arterial bus rapid transit line, the A Line. The A
Line will provide an improved bus experience, with faster and more frequent service,
specialized vehicles and train-like features, including off-board fare payment and stations with
more amenities and security features. The line will operate between the Rosedale Transit
Center in Roseville and the METRO Blue Line’s 46th Street Station in Minneapolis, serving
several employment, retail and residential destinations along Snelling Avenue, Ford Parkway
and 46th Street. The line will also provide a connection to the METRO Green Line’s Snelling
Avenue Station.
Metropolitan Council 2015 Performance Evaluation Report
7
Metro Transit improves fare payment
More than half of transit customers pay their fares with a pre-paid Go-To Card or unlimited-
ride pass, making boarding more efficient and more convenient for customers. Building on
this trend, Metro Transit partnered with HOURCAR to give customers of the car-sharing
service the ability to use their transit pass for vehicle entry. In addition, Go-To Card readers
were added to Northstar Link buses that provide connecting express bus service between the
Northstar Commuter Rail line’s Big Lake Station and St. Cloud.
In December, Metro Transit launched a pilot program for low-income fares that provides
households participating in the Council’s rent assistance program with fare passes that
automatically provide discounted $1 fares. A Student Pass pilot was launched in Saint Paul,
providing around 1,000 students with unlimited-ride transit passes.
Sewer rates kept competitive
The Council’s Environmental Services Division provides wastewater treatment services to 108
municipalities in the seven-county area at wholesale rates. In turn, those municipalities bill the
households and businesses within their boundaries for the wastewater treatment services
received, at an average annual rate of $264. This retail sewer rate compares favorably to an
average rate of $415 reported by 24 similarly sized wastewater treatment “peer” agencies in
the U.S., according to the most recent survey (2014) by the National Association of Clean
Water Agencies (NACWA).
Wastewater treatment protects public health and the environment
MCES collects and treats approximately 250 million gallons of wastewater from more than
2.5 million residents daily. This cleaned water is discharged to our rivers or used to recharge
the groundwater. Six MCES wastewater treatment plants earned national awards for five
years or more of perfect discharge permit compliance through 2014 and awarded in 2015:
Hastings (24 years); St. Croix Valley (23 years); Seneca (14 years); Blue Lake (9 years);
Eagles Point (9 years); and Empire (7 years). These compliance records are among the
highest in the nation.
Partnership results in rainwater reuse at new ballpark
When the City of Saint Paul and Saint Paul Saints opened the new CHS Field in May 2015,
the facility incorporated a sustainability feature that captures rainwater from the rooftop of the
adjacent Metro Transit operations and maintenance facility for the METRO Green Line. That
rainwater is used to irrigate the ball field and grounds, and as water for some of the ballpark’s
toilets. The Environmental Services Division helped with the planning and implementation of
the project, the first in Minnesota to recycle rainwater for human use indoors.
Council adopts Public Engagement Plan
The Council finalized its plan for public engagement that enables individuals, communities,
constituencies and organizations to help the Council generate ideas, better understand
issues, identify concerns and considerations, and help solve problems. The plan establishes
principles and processes for public engagement to inform Council decisions about the needs
of community stakeholders and to engage people in decision-making. The plan was created
collaboratively with members of a Community Engagement Steering Committee.

Metropolitan Council 2015 Performance Evaluation Report
8
Council creates Equity Advisory Committee
The Council created an Equity Advisory Committee that will advise the Council as it strives to
advance equity throughout the region and implements the equity commitments in the region’s
long-range plan, Thrive MSP 2040. Members will influence Council decisions related to
regional policies on transportation and transit, local planning, housing, environmental issues,
and more. This committee will bring new and more diverse voices to Council decision-making.
Metro Transit ridership keeps growing
Despite low gas prices, total annual Metro Transit ridership grew to 85.8 million in 2015, a 34-
year high. Ridership has grown for 11 of the last 12 years and each of the last six. Ridership
is at its highest level since 1981, when there were 90.5 million rides. Ridership in 2015 also
marks the first time in a generation that ridership has grown steadily for more than a decade,
with annual ridership up 23% since 2005.
Regional parks continue to be a top metro attraction
Twin Cities metro area residents love their parks. The number of annual visits to regional
parks grew 3.3% from 2013 to 2014 (the latest figure available), reaching 48.7 million. By
comparison, the Mall of America receives about 40 million annual visits.
Community Development
Overview
The mission of Community Development is to:
Understand current and future development patterns to inform local and regional policy
development.
Provide high-quality, coordinated planning, policy and program development to support
regional growth and reinvestment.
Identify and analyze regional issues.
Facilitate community collaboration.
Provide Livable Communities Act grants from three funding accounts to eligible
communities to assist them with cleaning up polluted sites, expanding housing choices, and
undertaking developments that use land and infrastructure more efficiently and connect
housing, jobs and services.
Deliver state and federally funded rent assistance to create and provide affordable housing
for low-income households in the region.
Partner with the 10 regional park implementing agencies (cities, counties, and park districts)
and the Metropolitan Parks and Open Space Commission to manage the many regional
parks, trails, and open spaces that make up the Twin Cities nationally renowned regional
park system.

Metropolitan Council 2015 Performance Evaluation Report
9
The Community Development Division includes:
UNIT CORE ACTIVITIES
Regional Parks and Natural Resources
Develop and implement the Regional Parks Policy Plan
through planning, research, and administration of the regional
parks system grant programs. Support the Metropolitan Parks
and Open Space Commission, which advises the Metropolitan
Council on regional parks policy, master plan reviews and
grant program coordination. Help coordinate the regional parks
legislative requests. Ensure protection of the region’s
investment in the regional parks system through the review of
local comprehensive plans and environmental studies.
Local Planning Assistance Implement the Metropolitan Land Planning Act through Thrive
MSP 2040 and its policy plans. Provide planning and technical
assistance and foster cooperative relationships with local
governments and other organizations to achieve local and
regional goals. Accomplish this responsibility through the
Sector Representative Program: technical assistance: and
review of local comprehensive plans, plan amendments, and
environmental reviews; and coordination of policy outreach
efforts through the Land Use Advisory Committee.
Regional Policy and Research Manage large regional policy initiatives, such as Thrive MSP
2040 and the 2040 Housing Policy Plan, and collect and
disseminate data and analysis about the demographics and
development patterns on the Twin Cities.
Livable Communities Implement the Livable Communities Act and its three funding
accounts to provide grants to participating communities.
Support the planning and development of affordable and
lifecycle housing in the region. Help fund transit-oriented
development.
Metropolitan Council Housing and Redevelopment Authority (Metro HRA)
Administer rent assistance programs for low-income seniors,
families, individuals and households with disabilities. Manage
the Family Affordable Housing Program.
Regional Parks and Natural Resources
The Regional Parks and Natural Resources unit is responsible for developing and
implementing the Regional Parks Policy Plan, with the advice of the Metropolitan Parks and
Open Space Commission. The Commission provides recommendations to the Metropolitan
Council regarding its reviews of park master plans, the capital improvement program for the
Regional Parks System, and the distribution of park grants.
The Regional Parks and Natural Resources unit also protects the Regional Parks System
through the review of local comprehensive plans and environmental studies for consistency
with the Regional Parks Policy Plan.

Metropolitan Council 2015 Performance Evaluation Report
10
In 2015, the Regional Parks and Natural Resources unit:
Developed the 2040 Regional Parks Policy Plan in collaboration with the Metropolitan Parks
and Open Space Commission, regional park implementing agencies, and other partners
and stakeholders. This process included conducting community engagement activities
throughout the region to inform the development of the plan.
Reviewed and evaluated local comprehensive plans for conformance to the Regional Parks
Policy Plan and worked with local communities to ensure that their local planning efforts
protect the integrity of the existing and planned Regional Parks System.
Estimated the annual visitation to the Regional Parks System and individual regional park
and trail facilities to produce the report Annual Use Estimate of the Metropolitan Regional
Parks System. The Regional Parks System draws more than 48 million annual visits.
Reviewed master plans or master plan amendments for the following regional parks and
trails:
− Above the Falls Regional Park (Minneapolis Park & Recreation Board)
− Baker-Carver Regional Trail (Three Rivers Park District)
− Coon Creek Regional Trail (Anoka County)
− East Anoka County Regional Trail (Anoka County)
− Highway 96 Regional Trail (Ramsey County)
− Lebanon Hills Regional Park (Dakota County)
− Nokomis-Hiawatha Regional Park (Minneapolis Park & Recreation Board)
− Theodore Wirth Regional Park (Minneapolis Park & Recreation Board)
Awarded grants to the 10 regional park implementing agencies for program and
development projects that distributed the FY 2016 Parks and Trails Legacy Fund
appropriation totaling $17,237,000. The Legacy appropriation is intended to supplement
traditional sources of funding, and in 2015 it initiated new program and development
projects.
− Ninety percent of the funds authorized 33 projects such as trail improvements, natural
resources restoration and management, volunteer programs, new trail and trailhead
construction, wayfinding, parking and park improvements at more than 15 regional park
and park reserve locations. A few of these locations include Anoka County Riverfront
Regional Park (Anoka County), Hyland Bush Anderson Lakes Regional Park Reserve
(Bloomington), Minnesota River Bluffs Regional Trail (Carver County), North Urban
Regional Trail (Dakota County), Phalen Keller Regional Park (Saint Paul) and Lake Elmo
Park Reserve (Washington County).
− Ten percent of these funds created park acquisition opportunities through the park
acquisition grant program. The Council matches every $3 of Legacy acquisition funds
with $2 of Metropolitan Council Bonds to acquire lands programmed for future acquisition
in Council-approved master plans.
Distributed state-appropriation of $8,540,000 for parks operations and maintenance funding
to the Metropolitan Regional Parks System for State Fiscal Year 2016 (July 1, 2015 to June
30, 2016).

Metropolitan Council 2015 Performance Evaluation Report
11
Local Planning Assistance
In 2015, the Local Planning Assistance unit:
Coordinated 250 reviews to determine their conformance to the regional systems,
consistency with Council policy, and compatibility with adjacent community plans, including:
− 80 reviews of comprehensive plans including amendments, and 49 environmental reviews such as environmental assessment worksheets (EAWs), environmental impact statements (EIS), environmental assessments (EAs), and alternative urban area-wide reviews (AUARs).
− Continued work with the small staff in the one remaining community needing to complete their 2030 comprehensive plan update.
− 121 reviews of NPDES Permits, U.S. Army Corps of Engineers #404 Permits, wastewater and surface water discharge permits, and other types of reviews.
Launched a significantly updated Local Planning Handbook, which guides local
governments regarding local comprehensive planning requirements and connects them to
additional resources. The Handbook is fully housed on a new online platform and includes a
new tool for submitting plans online, community-specific data and information needed for
planning, a new individualized online mapping tool, and an extensive resource library to
assist local governments in updating their comprehensive plans.
Issued decennial System Statements to all the communities in the Council’s jurisdiction. As
required by the Metropolitan Land Planning Act, the Council issues System Statements
after updating the plans for regional systems. Each System Statement is individualized to
show how each community is impacted by the regional plan. Issuing these System
Statements triggers an obligation for local communities to review and update their local
comprehensive plans in response to the new regional plan. Local comprehensive plans are
due to the Council for review by December 31, 2018.
Provided technical planning assistance and resources to local elected and appointed
officials and local planning staff through the Council’s Sector Representative Program.
Provided analysis and updated information on fiscal disparities, including tax-base values
and impacts of the tax-base sharing program, for the public and policymakers. Also used
this analysis to meet a statutory requirement to determine which communities are not
eligible to participate in the Twin Cities Fiscal Disparities program.
Planned and coordinated bimonthly meetings of the Land Use Advisory Committee, which
advised the Council on the development of planning-assistance grant criteria and assisted
in shaping new technical resources for the updated Local Planning Handbook and the
Transit-Oriented Development Guide.
Launched a new Reviews Database system that is integrated with the staff-workload
management software and online submittal tool for plan reviews that is available with the
Local Planning Handbook.
Reviewed and provided internal comments to Livable Communities unit staff in coordinating
grant requests for the Council’s Tax Base Revitalization Account and for the Livable
Communities Demonstration Account, including the LCA-TOD grant program.
Prepared an annual Plat Monitoring Report for 45 developing communities.
Prepared a report on the Metropolitan Agricultural Preserves program monitoring
enrollments in the region.
Metropolitan Council 2015 Performance Evaluation Report
12
Coordinated with Minnesota Department of Natural Resources staff on streamlining shared
review of Critical Area plans as part of the Critical Area rulemaking process.
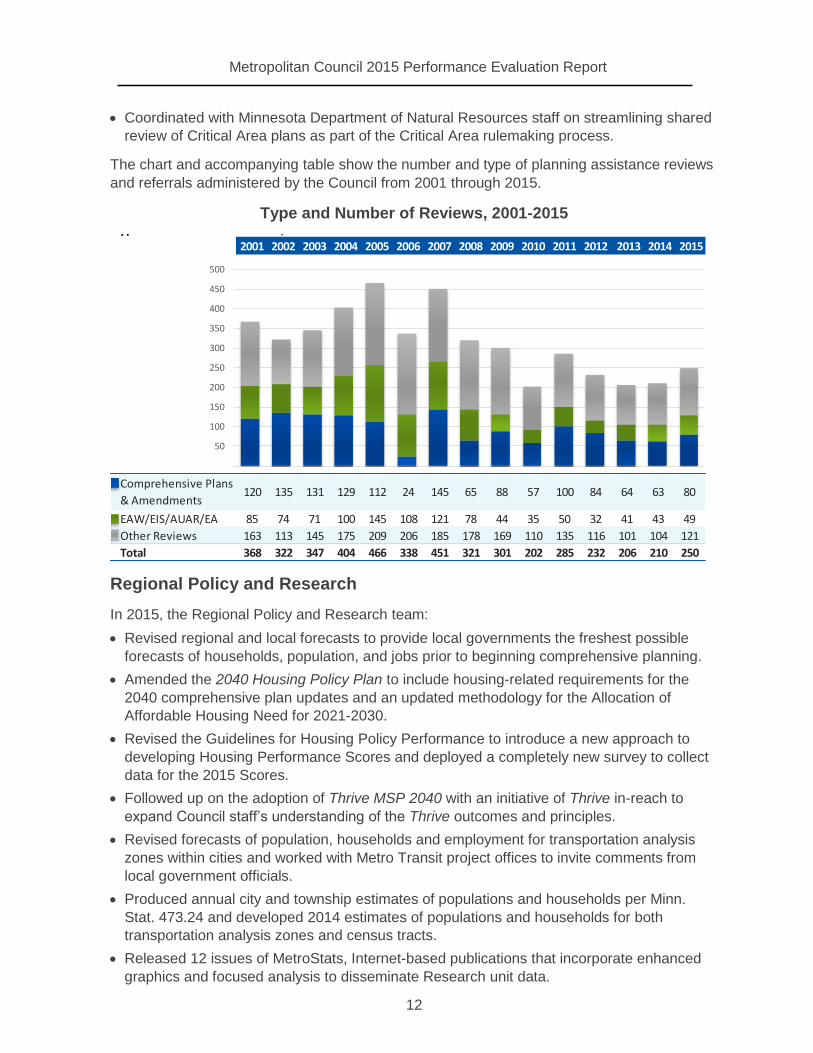
The chart and accompanying table show the number and type of planning assistance reviews
and referrals administered by the Council from 2001 through 2015.
Type and Number of Reviews, 2001-2015
Regional Policy and Research
In 2015, the Regional Policy and Research team:
Revised regional and local forecasts to provide local governments the freshest possible
forecasts of households, population, and jobs prior to beginning comprehensive planning.
Amended the 2040 Housing Policy Plan to include housing-related requirements for the
2040 comprehensive plan updates and an updated methodology for the Allocation of
Affordable Housing Need for 2021-2030.
Revised the Guidelines for Housing Policy Performance to introduce a new approach to
developing Housing Performance Scores and deployed a completely new survey to collect
data for the 2015 Scores.
Followed up on the adoption of Thrive MSP 2040 with an initiative of Thrive in-reach to
expand Council staff’s understanding of the Thrive outcomes and principles.
Revised forecasts of population, households and employment for transportation analysis
zones within cities and worked with Metro Transit project offices to invite comments from
local government officials.
Produced annual city and township estimates of populations and households per Minn.
Stat. 473.24 and developed 2014 estimates of populations and households for both
transportation analysis zones and census tracts.
Released 12 issues of MetroStats, Internet-based publications that incorporate enhanced
graphics and focused analysis to disseminate Research unit data.
Type and Number of Reviews, 2001-2015
2001 2002 2003 2004 2005 2006 2007 2008 2009 2010 2011 2012 2013 2014 2015
Comprehensive Plans
& Amendments120 135 131 129 112 24 145 65 88 57 100 84 64 63 80
EAW/EIS/AUAR/EA 85 74 71 100 145 108 121 78 44 35 50 32 41 43 49
Other Reviews 163 113 145 175 209 206 185 178 169 110 135 116 101 104 121
Total 368 322 347 404 466 338 451 321 301 202 285 232 206 210 250
50
100
150
200
250
300
350
400
450
500
Metropolitan Council 2015 Performance Evaluation Report
13
Disseminated data from two American Community Survey releases, including consistently
posting data on the Council’s website within 12 hours of new data availability and providing
a number of public presentations.
Provided analysis of or assistance with U.S. Census Bureau data to local government,
nonprofit partners, the media, and the public.
Conducted annual surveys on building permits (96% response rate), affordable housing
production (71% response rate), group quarters (77% response rate), and manufactured
home parks (80% response rate).
Maintained up-to-date data in the Council’s Data+Maps website, including tabular
geospatial data.
Provided extensive data to inform the Green Line Extension and Blue Line Extension
applications to the Federal Transit Administration (FTA) for New Starts funding and initiated
a project to institutionalize the collection, maintenance, and dissemination of data to both
monitor development and disseminate demographic data on station areas along transitways
to inform future applications to FTA for New Starts and Small Starts funding.
Livable Communities
In 2015, 95 metropolitan area communities participated in the Livable Communities program
(Minn. Stat. 473.25) to help expand and preserve affordable housing opportunities, recycle
polluted sites, revitalize older cities and suburbs, and create new neighborhoods in growing
communities.
Communities voluntarily participate in the program and negotiate housing goals with the
Council. They are then eligible to compete for funding from the three accounts in the Livable
Communities Fund, as well as pollution cleanup funds available from the Minnesota
Department of Employment and Economic Development.
The Livable Communities Fund includes grants from the following accounts:
Tax-Base Revitalization Account (TBRA) helps cities to pay for cleanup of polluted land and
buildings, facilitating redevelopment activities and thus restoring tax base, jobs and housing
in urban areas.
Livable Communities Demonstration Account (LCDA) funds development and
redevelopment projects that achieve connected development patterns linking housing, jobs
and services, and maximize the development potential of existing or planned infrastructure
and regional facilities.
Local Housing Incentives Account (LHIA) preserves and expands housing opportunities
through grants to eligible communities to meet negotiated affordable and lifecycle housing
goals.
In 2015, the Livable Communities Program unit:
Awarded 28 TBRA grants totaling over $6.9 million to help clean up polluted land in eight
communities: Brooklyn Center, Edina, Fridley, Hastings, Minneapolis, St. Louis Park, Saint
Paul, and White Bear Lake.
Awarded six LCDA grants totaling nearly $5 million to help projects in four communities:
Hastings, Minneapolis, St. Louis Park and Saint Paul. The funded projects will help acquire
and prepare sites for redevelopment that include a mix of housing, commercial, and other
Metropolitan Council 2015 Performance Evaluation Report
14
uses that support daily needs and community activities. Projects will also assist with the
construction of innovative storm water management solutions.
Awarded eight LHIA grants totaling $2.2 million to help preserve or build affordable housing
in seven cities: Blaine, Edina, Minneapolis, Minnetonka, Mound, Saint Paul, and Woodbury.
Awarded six Transit Oriented Development grants totaling nearly $4.4 million in four
communities, through the LCDA program: Edina, Minneapolis, St. Louis Park, and Saint
Paul. The funded projects will help promote higher-density projects within easy walking
distance of a major transit stop that will typically include a mix of uses oriented to the transit
stop.
Collectively, the 2015 Livable Communities grants are expected to:
− Create or retain 3,200 jobs
− Leverage nearly $320 million in private funds and over $55 million in other public funds
− Add or preserve more than 2,600 housing units, over 1,500 of which will be affordable at
80% of Area Median Income
− Clean up 64 acres of polluted property to prepare it for redevelopment
Reviewed 28 proposals for local housing revenue bond dollars to support affordable,
market-rate and senior housing.
Determined housing performance scores for cities and counties pursuant to the Council’s
Guidelines for Priority Funding for Housing Performance.
Metropolitan Council Housing and Redevelopment Authority
In 2015, about 7,000 low-income households in the metropolitan area benefited from rent
assistance through one of 10 programs administered by the Metro HRA unit. The rental
assistance programs, funded through federal and state funds, include the Housing Choice
Voucher, Project Based Voucher, Non-Elderly Disabled, Family Unification, Veteran’s Affairs
Supportive Housing, Bridges, Continuum of Care, Housing Opportunities for People with
AIDS, Rental Assistance for Anoka County, and Family Affordable Housing programs.
In 2015, the HRA unit:
Provided Housing Choice Vouchers to 6,490 very low income seniors, families, individuals
and households with disabilities, enabling households to rent private rental units affordable
to each household’s income.
Provided rent assistance to approximately 640 additional households through programs
designed to assist households meeting specific eligibility criteria, such as being disabled,
homeless, or working toward self-sufficiency.
Issued over $52 million in direct rent payments to private landlords.
Maximized use of Housing Choice Voucher funds by ensuring 98% of the available funding
was utilized.
Maintained the HUD ranking of High Performer in the Section Eight Management
Assessment Program (SEMAP).
Owned and managed 150 scattered-site Project Based Voucher units (Family Affordable
Housing Program), comprising single-family houses, duplexes and town homes located in
11 suburban communities.
Metropolitan Council 2015 Performance Evaluation Report
15
Implemented Community Choice, a mobility counseling program to assist families who hold
Housing Choice Vouchers to find housing in areas of opportunity. The program encourages
self-sufficiency and success in their new neighborhood.
Increased rental assistance opportunities available to homeless veterans through the
Veteran’s Affairs Supportive Housing (VASH) program.
Continued support to HousingLink for information and referral services to housing seekers
and landlords about affordable housing programs and housing vacancies.
Transportation Division
Overview
The Metropolitan Council adopts regional transportation policies and plans and coordinates all
transportation planning in the Twin Cities area. This includes highways, transit, airports,
waterways and rail, as well as travel-demand forecasting and air quality planning. In addition,
the Council administers and operates transit services in the Twin Cities through directly
provided services and contracted transit providers.
These programs are delivered by two divisions – Metropolitan Transportation Services (MTS)
and Metro Transit – based on the Council’s 2040 Transportation Policy Plan.
Transportation Policy Plan Focus and Implementation
The philosophy and focus of the Council’s Transportation Policy Plan is to implement the
legislatively mandated regional development framework called Thrive MSP 2040. Specifically:
Plan and invest in multi-modal transportation choices.
Focus highway investments on preserving, operating and managing the existing system,
and on slowing the growth of congestion.
Encourage growth and density along transitway corridors.
Encourage travel-demand management strategies.
Encourage local communities in the urbanized area to implement a system of fully
interconnected arterial and local streets, pedestrian pathways, and bikeways.
Promote the development and preservation of various freight modes.
Support investments in airport facilities.
Serve the region’s economic prosperity through investments that attract and retain
successful businesses and a talented workforce.
Connect residents of all races, ethnicities, income and abilities to opportunities.
To carry out these overall policies, the Metropolitan Council:
Develops and maintains transportation policy for the metropolitan area, which is
documented in the long-range Transportation Policy Plan.
Develops and updates the metropolitan area federal Transportation Improvement Program
(TIP), the short-range capital improvement program for all projects using federal
transportation funds.
Metropolitan Council 2015 Performance Evaluation Report
16
Carries out the region’s transportation planning program, the Unified Planning Work
Program (UPWP).
Implements transportation policy through the allocation of federal funds through
implementation of its own programs and through coordination with the federal, state, and
local governments.
Acts as the federally designated Metropolitan Planning Organization.
Provides or coordinates with transit programs throughout the region.
Operates Metro Transit, the region’s largest provider of large-bus, regular-route transit
service, light-rail transit service, and commuter-rail transit service.
Operates Metro Mobility, the region’s ADA transit service. This program provides group-
transit services (demand-response and arranged) as a legally mandated complement to the
regular-route system for persons with disabilities who are unable to use regular-route transit
service.
Operates contracted regular-route transit services, a network of routes operated by private
contractors. These routes comprise approximately 10% of regular-route transit in the Twin
Cities.
Operates Transit Link dial-a-ride, a shared-ride, curb-to-curb small bus service for the
general public operating in the seven counties for trips not available using regular-route bus
and rail transit. Transit Link connects riders to the regular-route system and to Metro
Mobility.
Partners with Suburban Transit Providers. Twelve communities, also known as “opt outs,”
have chosen to provide their own transit service. They provide service through contracts
primarily with private companies, although they also contract with nonprofit and other
governmental entities. Operating funding flows from the state to the STPs through the
Council. The Council coordinates regional support for fares, capital programs and other
activities with opt-out authorities.
Provides vanpools through Metro Vanpool. Started in 2001, Metro Vanpool subsidizes
commuter vanpools that serve work locations and times not effectively served by the
regular-route bus and rail network.
The region also has transit programs not affiliated with the Metropolitan Council. The
University of Minnesota operates all-day intercampus transit service for students, faculty,
employees, and the general public. The system is integrated with the regional regular-route
network and interchanges passengers with other transit programs.
Regional Transit Ridership
Regional transit ridership in 2015 was up 1.2% over the year before in the seven-county
metro area. Total transit ridership in the region in 2015 was 98.8 million rides. The region’s
largest provider, Metro Transit, experienced a 1.3% increase while Metro Mobility continued
its trend of the past several years with a 7% increase.
A variety of factors will affect future ridership growth, including funding levels, fuel prices, the
economy, employment levels, development patterns, income levels, service improvements,
and highway congestion levels.

Metropolitan Council 2015 Performance Evaluation Report
17
Metropolitan Transportation Services
Metropolitan Transportation Services has two major functions:
Conduct transportation planning for the metropolitan area as the region’s federally
designated Metropolitan Planning Organization.
Provide direct transit service contracts or partnerships with counties to deliver four major
programs: Metro Mobility/ADA, Transit Link dial-a-ride, contracted regular-route, and Metro
Vanpool.
Transportation Planning Activities
As the designated Metropolitan Planning Organization (MPO) for the Twin Cities metropolitan
area, the Council is federally required to provide a continuing, coordinated, comprehensive
transportation planning process that includes state and local units of government. In return,
the metropolitan region is eligible for federal transportation funds.
Transportation Policy Plan
Federal regulations require the Council to prepare a long-range transportation plan, which
must be updated every four years. The 2040 Transportation Policy Plan was prepared in
2013-14 and adopted in January 2015. After adoption, the Council prepared a Systems
Statement for every municipality and county in the region, detailing how the plan should be
reflected in each of their local plan updates by 2018. A transportation section of the Local
Plan Handbook was also written to provide planning technical assistance to communities.
Under MAP-21 and FAST Act federal guidelines, MPOs are required to have a performance-
based long-range transportation plan. Since the federal rulemaking for required measures
was not finalized when the 2040 Transportation Policy Plan was being completed, the policy
plan includes preliminary performance measures. In 2015, a more robust list of performance
measures was being identified. Five working groups, composed of transportation
stakeholders, identified proposed highest-priority measures for the respective transportation
-
20
40
60
80
100
120
2003 2004 2005 2006 2007 2008 2009 2010 2011 2012 2013 2014 2015
Mill
ion
s
Metro Transit Bus Metro Transit Rail Other Programs
Regional Transit Ridership, 2003-2015

Metropolitan Council 2015 Performance Evaluation Report
18
modes. After further input from policy makers and the public, the final measures will be used
to evaluate investments to be included in the next policy plan.
Transportation Improvement Program
The Council is responsible for preparing a short-range Transportation Improvement Program
and selecting projects for federal funding. This work is conducted through the Transportation
Advisory Board (TAB) and its Technical Advisory Committees, and includes broad citizen and
interest-group input.
In 2015, the 2016-2019 TIP was prepared and adopted by TAB and the Council. As required
by federal law, the TIP includes all federally funded surface transportation projects.
Highway Planning
The Council participates with MnDOT, cities and counties in highway planning activities to
ensure implementation of the policy direction established by the Council in its Thrive MSP
2040 and the 2040 Transportation Policy Plan.
During 2015, the Council coordinated with MnDOT’s Metro District on a number of highway
planning studies, especially several ongoing interagency corridor studies, including
I- 494/TH 62 Congestion Relief Study, Principal Arterial Intersection Conversion Study, TH
169 Managed Lane and Transitway Study, I-94 Project, TH 65 Access Study, I- 35W North
MnPASS, I-35E North MnPASS extension, and I-35W/Lake Street Access Project.
The Council administers the Right-of-Way Acquisition Loan Fund (RALF), which gives
communities no-interest loans to purchase right-of-way for principal arterials and other trunk
highways in advance of the time that MnDOT would be in a position to make the purchase.
In 2015 several RALF loans were repaid by Maple Grove after MnDOT purchased land
from the city for TH 610, which is now under construction.
Transit Planning Activities
The Council performs long-range transit planning activities to implement the policy direction
established in its Thrive MSP 2040 and the 2040 Transportation Policy Plan.
The Council began work on the transit work program items of the 2040 Transportation
Policy Plan related to regional streetcar policies and setting regional transitway priorities. A
consultant was hired to develop a series of memos related to these tasks, the first of which
was released in 2015. The Council also developed transit planning resources for local
communities in support of upcoming comprehensive plan updates.
The Council continued to participate with MnDOT, transit providers, cities, and county
regional railroad authorities during 2015 to conduct feasibility, alternatives analysis,
environmental, and engineering studies and implementation plans for several transitway
corridors. Cedar Avenue Bus Rapid Transit Implementation Plan Update and Robert Street
studies were completed in 2015, while Green Line Extension (Southwest) Light Rail Transit
(LRT), Blue Line Extension (Bottineau LRT), Red Rock Corridor, Gold Line (Gateway
Corridor), Orange Line (I-35W South), Nicollet-Central, Rush Line, Riverview, and West
Broadway are ongoing. New studies begun in 2015 include the TH 169 Managed Lane and
Transitway Study and the Dakota County East-West Transit Study.

Metropolitan Council 2015 Performance Evaluation Report
19
The Council also participated in intercity passenger rail studies, including Zip Rail, the
Minneapolis/Saint Paul–Milwaukee High-Speed Rail, and the Northern Lights Express
(NLX) – Duluth to Twin Cities.
Air Quality Planning
The Council conducts long-term planning required by federal law to ensure that planning for
congestion management, transportation, land use and air quality conforms to the
requirements of the 1990 Clean Air Act Amendment. In 2015, conformity analysis for the
2016-2019 Transportation Improvement Program (TIP) was completed to ensure the
construction of policy plan and TIP projects would not violate federal air quality standards.
In 2015:
Work continued to implement the 2010 Limited Maintenance Plan for Carbon Monoxide and
to finalize a Transportation Conformity State Implementation Plan for air quality with MPCA
and MnDOT.
Work continued with MnDOT and MPCA on responding to more stringent proposed federal
ozone standards. The Council participated in the state Climate Strategies and Economic
Opportunities work group and the Thrive work group on climate change and began work to
integrate climate change mitigation and adaptation planning into transportation planning.
Project Selection for Federal Funding
In its role as the federally designated Metropolitan Planning Organization for the region, the
Council concurs with the biennial selection of projects selected by its Transportation Advisory
Board (TAB) for federal transportation funding through adoption of the TIP. This includes
three programs: Surface Transportation Program (STP), Transportation Alternatives Program
(TAP) and Congestion Mitigation and Air Quality Improvement (CMAQ) Program.
A solicitation for projects was released in fall of 2014. In 2015, the Council’s TAB selected
projects to be funded with STP, CMAQ, and TAP money in 2018-2019. It also selected
projects to be funded with remaining 2017 STP and CMAQ funds. The selected projects were
then incorporated into the 2016-2019 TIP. At the conclusion of project selection, the TAB and
its technical committees began an evaluation of the solicitation process to determine any
changes needed prior to soliciting projects in 2016 for funding in 2020-2021.
Travel Forecasting
As the regional planning agency, the Council is charged with maintaining and applying travel
forecast models to support planning for the orderly development and operation of
transportation facilities. The Council maintains socioeconomic data and obtains traffic data
from MnDOT to monitor, revise, and update travel forecasts. Federal regulations require the
Council to provide projections of traffic demand and related air quality emissions. These
projections are used to evaluate regional transportation investments proposed in the short-
range TIP and the long-range Transportation Policy Plan.
In 2015:
Work continued on responding to requests for forecast travel-demand data and providing
assistance and model review to consultants, agencies and local governments. Council staff
also worked with consultants on several regional-scale highway and transit projects that
required forecasts, including the Blue Line Extension, Green Line Extension, Rush Line,

Metropolitan Council 2015 Performance Evaluation Report
20
Riverview, Red Line, Orange Line, Red Rock, and Gateway transitway corridors and the I-
94, I-35W, I-494/TH 62, and TH 169 MnPASS highway corridors.
2010 Travel Behavior Inventory (TBI) data and findings were presented to various
audiences. Data from the TBI was also used in developing and implementing a next-
generation activity-based travel demand model, which was released in late 2015. Work will
continue on refining the new model and providing technical assistance in its application.
Work continued on planning for the next Travel Behavior Inventory. A 10-year 2018-2027
TBI program has been developed that will involve more frequent and regular data collection
and model improvements. This program will be refined and funding identified in 2016. Work
on the 2016 transit on-board study began in 2015 with data collection and analysis to occur
in 2016 and early 2017.
Aviation Planning Activities
The Council prepares and maintains a plan for the regional aviation system. The Council
works closely with MnDOT Aeronautics, the Metropolitan Airports Commission (MAC), and
other airport owners to ensure that the region's airports provide state-of-the-art, secure and
affordable services for business and leisure travelers, freight transport and general aviation
activities. The Council coordinates aviation planning and community development with local,
state and federal governmental units, airport users and citizens.
2015 highlights include the following activities:
Coordination with the MAC on aviation issues, including environmental documentation for
proposed improvement projects at Minneapolis-Saint Paul International Airport (MSP), long-
term comprehensive plan updates for MAC airports, and noise and airspace issues,
including new Area Navigation (RNAV) airspace procedures proposed for MSP by the
Federal Aviation Administration.
Conducted presentations on aviation system planning and comprehensive planning to the
MAC’s Noise Oversight Committee.
Reviewed and approved the 2016-2022 Capital Improvement Program for MSP and MAC’s
reliever airports.
Participated in the advisory group for the Lake Elmo Regional Airport Master Plan Update,
which is expected to be adopted in 2016.
Transit Programs
The Contracted Transit Services unit provides transit service through service contracts for
Metro Mobility, Transit Link dial-a-ride, regular-route transit and Metro Vanpool.
Suburban Transit Providers
Twelve suburban communities manage their own transit services. Two of these – Plymouth
and Maple Grove – operate their own municipal programs.
Apple Valley, Burnsville, Eagan, Prior Lake, Savage. Shakopee and Rosemount created an
intergovernmental entity called Minnesota Valley Transit Authority (MVTA) to provide transit in
their communities. Chaska, Chanhassen and Eden Prairie created another intergovernmental
entity, Southwest Metro Transit.
Metropolitan Council 2015 Performance Evaluation Report
21
These communities contract with a variety of providers to deliver service. They also select
their own routes and levels of services. A significant share of the service provided by
suburban providers meets the needs of commuters traveling to and from downtown Saint
Paul and Minneapolis.
Contracted Regular Routes
Contracting regular-route service is most beneficial in situations where a smaller bus is
appropriate due to ridership, operational constraints, and neighborhood perception: where
performance does not meet regional standards when directly operated; and in certain
specially funded service arrangements. Metropolitan Transportation Services manages
contracts for approximately 10% of the region’s regular-route bus service.
Dial-a-Ride Service
Dial-a-ride service provides a public transit option in areas not served by the regular-route
transit network. The Metropolitan Council contracts with local governments and private
companies to provide general-public dial-a-ride service in these areas, called Transit Link.
Although Transit Link is available to the general public, typical users are the elderly, people
who do not own a car, people too young to drive, and persons with disabilities traveling
outside the Metro Mobility service area. Growth or reduction in these services will be
addressed as a consideration of the overall transit system and as demand warrants. The
expansion of the regular-route bus system may result in reduced demand for Transit Link as
more people have access to regular-route service.
Metro Vanpool
Commuter vanpools are made up of five or more people, including a volunteer driver,
commuting to and from work at destinations throughout the region on a regular basis. The
Metro Vanpool program provides financial assistance for vans serving locations or times not
well served by the regular-route transit network.
Metro Mobility Program Evaluation
This section responds to Minn. Stat. 473.13, which requires the Council’s program evaluation
report to include “an assessment of progress towards meeting transit goals for people with
disabilities… with required elements including, but not limited to: (1) a description of proposed
program enhancements; (2) an assessment of progress; (3) identification of the estimated
total number of potential and actual riders who are disabled; (4) an assessment of the level
and type of service required to meet unmet ridership needs; and (5) an analysis of costs and
revenue options, including a calculation of the amounts of surplus or insufficient funds
available for achieving paratransit needs.”
Metro Mobility
Under the Americans with Disabilities Act (ADA) every public entity operating a regular-route
system must provide complementary paratransit service to individuals with disabilities who
are unable to use the regular-route system. Federal law requires this paratransit service be
delivered at levels comparable to the regular-route system. This service must be provided
within three-quarters of a mile of any all-day, local regular route in the Twin Cities. In addition
Metropolitan Council 2015 Performance Evaluation Report
22
Minnesota statute requires the Metropolitan Council to provide door-through-door
transportation service within the Transit Taxing District as it existed on March 1, 2006.
Under the ADA there are a number of key provisions governing service delivery in the
federally mandated service area. Some of these provisions include:
No trip limits, restrictions or capacity constraints.
There can be no denials of service.
Service must be guaranteed at the time of the call.
Service must be provided during all hours when regular-route service is available.
Trips must be scheduled within one hour of the requested time.
There may not be a pattern or practice of limiting availability. This includes long telephone
hold times, substantial number of late pickups, missed trips, or excessively long trips.
The fare cannot exceed twice the non-discounted fare for a trip of similar length, at a similar
time on the regular-route system.
Eligibility determinations must be made within 21 days of receiving a complete application
for service.
The state further requires that the service must be provided from door through first door.
Metro Mobility serves as the complementary paratransit service in the seven-county metro
area. Metro Mobility is a service of the Metropolitan Council, managed by the Metro Mobility
Service Center and delivered by several contractors.
The 2015 Metro Mobility ridership was 2,109,392, a 6.8% increase with an additional 130,000
rides compared to 2014. Metro Mobility ridership continues to increase significantly each year
and has increased more than 67% in the past nine years. Efforts to manage the ADA budget
have been somewhat successful while ensuring that service is readily available as required
by both state and federal law and maintaining service quality.
Program Enhancements
To maintain high-quality service and improve efficiency, Metro Mobility implemented an
aggressive plan to upgrade the communications infrastructure. In 2015 Metro Mobility
finalized work on Phase III of the project to improve real-time communication for both drivers
and riders and offer electronic (Go-To) fare payment to customers.
Phase I of the project implemented mobile data computers (MDC) and automatic vehicle
location (AVL) on all Metro Mobility vehicles. The system provides real-time information to
dispatchers and managers, allowing staff to actively monitor and adjust routes as the day
progresses. This allows drivers to stay on schedule and improves service dependability. As a
result of this program, Metro Mobility saw improvements in on-time performance and
productivity. This phase was completed in 2013.
The AVL technology offers drivers turn-by-turn directions to each location. This improvement
has led to better retention of new drivers who may be unfamiliar with hard-to-find addresses
and locations. It also provides management staff a powerful tool in resolving both motorist
and passenger complaints.

Metropolitan Council 2015 Performance Evaluation Report
23
In 2014 Metro Mobility implemented Phase II of the project. In Phase II, real-time schedule
information became available to riders. An interactive voice response (IVR) system sends
riders reminder messages about trips scheduled for the following day, as well as imminent
arrival messages to alert riders when the vehicle is 10 minutes away from picking them up. In
addition, customers are able to get an email confirmation when their trips are scheduled or
cancelled. This program began on a voluntary basis in July 2014.
Phase III of the project implements the regional Go-To electronic fare-payment system. The
Go-To system allows Metro Mobility riders to move seamlessly between service modes within
the region and take advantage of the many fare features currently available to fixed-route
riders. The electronic fare readers were installed on all Metro Mobility vehicles. The system
will begin operation in January 2016 with a limited number of passengers. By March 2016 it
will be available to all Metro Mobility riders.
Program Redesign
In 2015 Metro Mobility implemented a new service delivery model. Since 1993 Metro Mobility
had used two large “core contractors” and smaller county-based programs to deliver rides
around the perimeter of the service area The two “core” contracts were competitively
procured while the smaller “county” contracts were either sole source or intergovernmental
agreements. In 2014 there were five different providers of Metro Mobility Service. This
included Anoka County Traveler (contracting with a private provider), SmartLink in Scott and
Carver Counties and DARTS in Dakota County. These three “county” contracts accounted for
approximately 10% of the Metro Mobility service.
The new service delivery model provides better customer service, reduces duplication and
improves efficiency. In mid-2015 Metro Mobility transitioned from two core contracts and three
small county contracts to three large service contracts. The service areas are designed to be
roughly the same geographic size and to honor past travel patterns. All three contracts were
competitively procured for implementation between June and August, 2015.
One of the key components of the new service model is the elimination of rides with a transfer
Under the previous model, a customer traveling between a core contractor and a county
contractor would likely have to transfer vehicles and contractors to complete their trip. Under
the new model, all customers receive a single-seat ride.
Assessment of Progress
Premium Same-Day Service
In 2004 Metro Mobility began offering Premium Same Day (PSD) service to customers who
want a same-day ride but are not able or chose not to place a ride with Metro Mobility. (ADA
regulations do not require same-day service availability.) In 2013 Metro Mobility expanded the
Premium Same Day program to include all same-day trip requests. The change was made to
ensure that drivers and dispatchers stay focused on delivering quality service to pre-scheduled
riders on Metro Mobility. In addition to expanding the Premium Same Day program, the cost
structure was altered slightly to provide a more cost-effective alternative for customers. The
Council changed the maximum subsidy for a taxi trip from $13 to $15. In addition, the Council
lowered the threshold at which the Council contributes to the ride. Previously the passenger
paid the first $7.00 in costs plus the cab fare charges above $20. Now the passenger must pay
the first $5.00 plus all costs over $20.

Metropolitan Council 2015 Performance Evaluation Report
24
Premium Same Day ridership continues to increase as customers demand flexibility of same-
day rides combined with the convenience of a single-seat ride. One of the advantages of the
Premium Same Day service is the relatively low cost per ride to the Council. Because the
customer and the Council share the cost of the ride, Premium Same Day Service is provided
at a low cost when compared to the Metro Mobility service. The average cost for each
Premium Same Day ride remains approximately $9.00 for each ride.
Premium Same-Day Ridership
Year Ridership
2012 9,916
2013 17,005
2014 27,790
2015 38,380
Metro Mobility Ridership Growth
The demand for Metro Mobility service has increased dramatically over the past decade.
Although age in and of itself is not a determining factor for Metro Mobility demand, there is a
strong correlation between age-related mobility limitations and eligibility for Metro Mobility. In
2015, 68% of the active riders were over the age of 55 and took approximately 50% of the
Metro Mobility trips. Given the strong correlation between age-related mobility limitations and
Metro Mobility eligibility, the aging of the baby-boomer population may present a unique
challenge for the Metro Mobility service in the next decade.
One of the primary factors for the increase in Metro Mobility ridership is the increase in
certified riders. Since 2012 Metro Mobility has seen a 19% increase in the number of people
applying for the service. In 2012 Metro Mobility had 8,136 applications compared to 9,964
applications in 2015. Nearly half of all applications are new customers who have not
previously used Metro Mobility. There has also been a corresponding increase in the number
of people who use Metro Mobility each year.
Active Metro Mobility Riders by Year
Year Active Riders
2012 15,321
2013 17,138
2014 18,973
2015 19,983
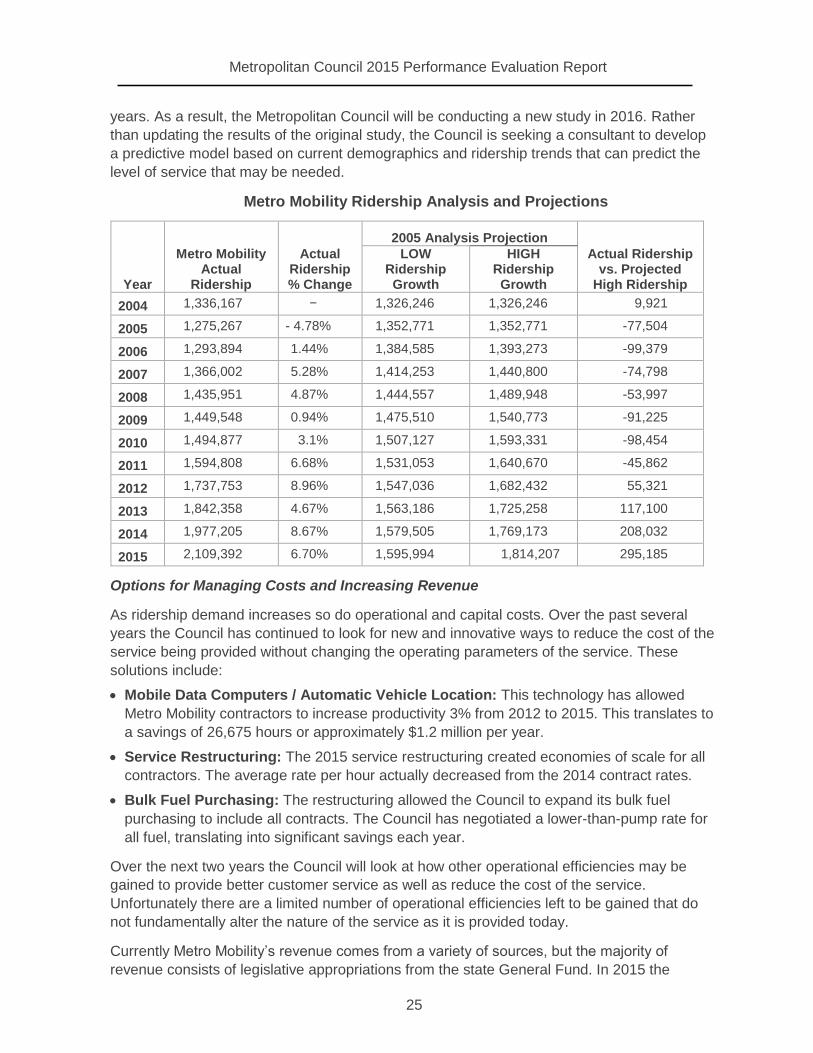
In 2005, the Metropolitan Council updated a 1999 study which projected ridership growth
through 2020. Through 2011 the study fairly accurately estimated the high ridership. Beyond
2012 the Council has exceeded even the high-end estimates of this study. Given the aging
population, it is probable that the growth in ridership could accelerate in the next 5 to 10
Metropolitan Council 2015 Performance Evaluation Report
25
years. As a result, the Metropolitan Council will be conducting a new study in 2016. Rather
than updating the results of the original study, the Council is seeking a consultant to develop
a predictive model based on current demographics and ridership trends that can predict the
level of service that may be needed.
Metro Mobility Ridership Analysis and Projections
Year
Metro Mobility Actual
Ridership
Actual Ridership % Change
2005 Analysis Projection
Actual Ridership vs. Projected
High Ridership
LOW Ridership Growth
HIGH Ridership Growth
2004 1,336,167 − 1,326,246 1,326,246 9,921
2005 1,275,267 - 4.78% 1,352,771 1,352,771 -77,504
2006 1,293,894 1.44% 1,384,585 1,393,273 -99,379
2007 1,366,002 5.28% 1,414,253 1,440,800 -74,798
2008 1,435,951 4.87% 1,444,557 1,489,948 -53,997
2009 1,449,548 0.94% 1,475,510 1,540,773 -91,225
2010 1,494,877 3.1% 1,507,127 1,593,331 -98,454
2011 1,594,808 6.68% 1,531,053 1,640,670 -45,862
2012 1,737,753 8.96% 1,547,036 1,682,432 55,321
2013 1,842,358 4.67% 1,563,186 1,725,258 117,100
2014 1,977,205 8.67% 1,579,505 1,769,173 208,032
2015 2,109,392 6.70% 1,595,994 1,814,207 295,185
Options for Managing Costs and Increasing Revenue
As ridership demand increases so do operational and capital costs. Over the past several
years the Council has continued to look for new and innovative ways to reduce the cost of the
service being provided without changing the operating parameters of the service. These
solutions include:
Mobile Data Computers / Automatic Vehicle Location: This technology has allowed
Metro Mobility contractors to increase productivity 3% from 2012 to 2015. This translates to
a savings of 26,675 hours or approximately $1.2 million per year.
Service Restructuring: The 2015 service restructuring created economies of scale for all
contractors. The average rate per hour actually decreased from the 2014 contract rates.
Bulk Fuel Purchasing: The restructuring allowed the Council to expand its bulk fuel
purchasing to include all contracts. The Council has negotiated a lower-than-pump rate for
all fuel, translating into significant savings each year.
Over the next two years the Council will look at how other operational efficiencies may be
gained to provide better customer service as well as reduce the cost of the service.
Unfortunately there are a limited number of operational efficiencies left to be gained that do
not fundamentally alter the nature of the service as it is provided today.
Currently Metro Mobility’s revenue comes from a variety of sources, but the majority of
revenue consists of legislative appropriations from the state General Fund. In 2015 the
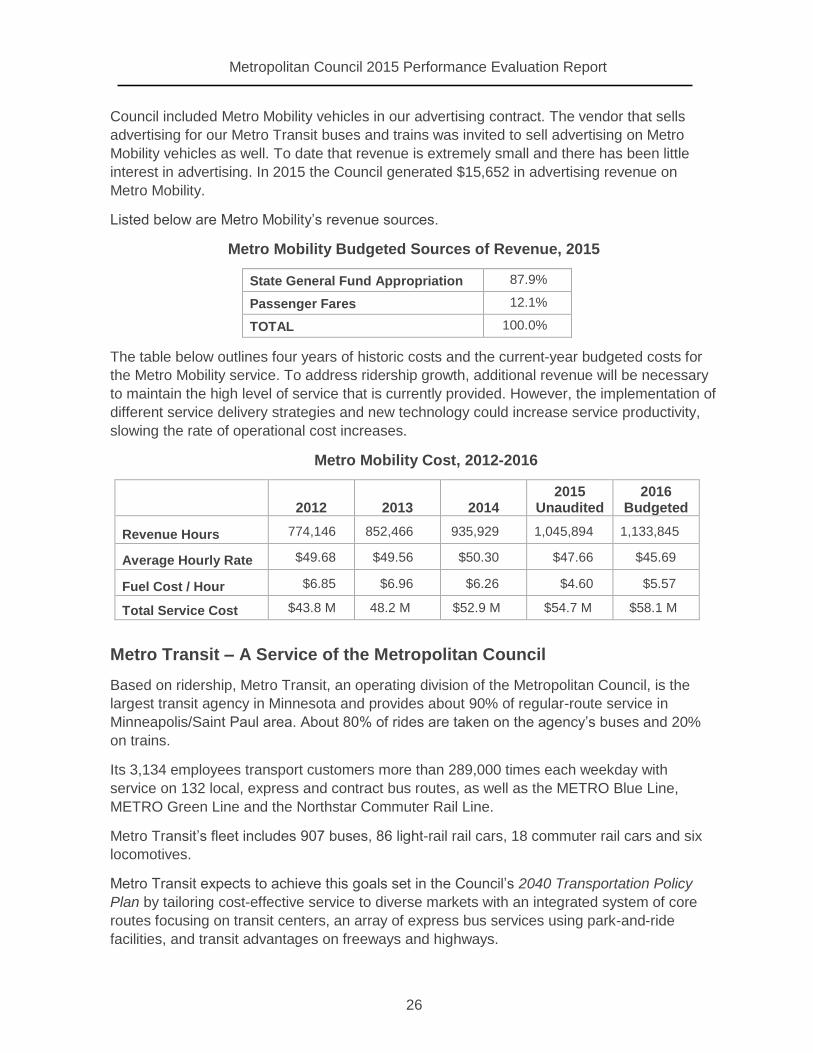
Metropolitan Council 2015 Performance Evaluation Report
26
Council included Metro Mobility vehicles in our advertising contract. The vendor that sells
advertising for our Metro Transit buses and trains was invited to sell advertising on Metro
Mobility vehicles as well. To date that revenue is extremely small and there has been little
interest in advertising. In 2015 the Council generated $15,652 in advertising revenue on
Metro Mobility.
Listed below are Metro Mobility’s revenue sources.
Metro Mobility Budgeted Sources of Revenue, 2015
State General Fund Appropriation 87.9%
Passenger Fares 12.1%
TOTAL 100.0%
The table below outlines four years of historic costs and the current-year budgeted costs for
the Metro Mobility service. To address ridership growth, additional revenue will be necessary
to maintain the high level of service that is currently provided. However, the implementation of
different service delivery strategies and new technology could increase service productivity,
slowing the rate of operational cost increases.
Metro Mobility Cost, 2012-2016
2012 2013 2014 2015
Unaudited 2016
Budgeted
Revenue Hours 774,146 852,466 935,929 1,045,894 1,133,845
Average Hourly Rate $49.68 $49.56 $50.30 $47.66 $45.69
Fuel Cost / Hour $6.85 $6.96 $6.26 $4.60 $5.57
Total Service Cost $43.8 M 48.2 M $52.9 M $54.7 M $58.1 M
Metro Transit – A Service of the Metropolitan Council
Based on ridership, Metro Transit, an operating division of the Metropolitan Council, is the
largest transit agency in Minnesota and provides about 90% of regular-route service in
Minneapolis/Saint Paul area. About 80% of rides are taken on the agency’s buses and 20%
on trains.
Its 3,134 employees transport customers more than 289,000 times each weekday with
service on 132 local, express and contract bus routes, as well as the METRO Blue Line,
METRO Green Line and the Northstar Commuter Rail Line.
Metro Transit’s fleet includes 907 buses, 86 light-rail rail cars, 18 commuter rail cars and six
locomotives.
Metro Transit expects to achieve this goals set in the Council’s 2040 Transportation Policy
Plan by tailoring cost-effective service to diverse markets with an integrated system of core
routes focusing on transit centers, an array of express bus services using park-and-ride
facilities, and transit advantages on freeways and highways.

Metropolitan Council 2015 Performance Evaluation Report
27
Significant ridership growth is expected through the thoughtful planning and implementation of
an expanded network of transitways. Metro Transit has aligned its business plans to coincide
with the growth objectives of the 2040 Transportation Policy Plan.
Mission
To implement the Transportation Policy Plan, Metro Transit is committed to the following
mission: Metro Transit delivers environmentally sustainable transportation choices that link
people, jobs and community conveniently, consistently and safely.
In pursuit of its mission, Metro Transit embraces to these guiding principles:
Service Excellence. We go beyond the expectations of our customers to deliver
convenient, comfortable and reliable service; we don’t accept today’s best as tomorrow’s
limitations.
Environmental Responsibility. We promote public transportation as an environmentally
friendly service and conduct our business in an environmentally responsible manner.
Innovation. We regularly question the status quo; we encourage creativity and innovation
in all things.
Safety. We provide a safe and secure environment for our customers, community and
employees through consistent training, enforcement and allocation of resources.
Teamwork. As employees, we seek shared success, treat one another with respect and
consider each other as customers.
Financial Responsibility. We continuously improve the cost-efficiency of our services; we
approach our financial relationships with integrity and transparency.
Community Orientation. We are an important part of the Twin Cities region. We engage
the community in our decision-making provide well-crafted communication and offer
opportunities for public involvement.
Ridership
Bolstered by the highly successful opening of the METRO Green Line along the University
Avenue Corridor, Metro Transit closed 2015 with more than 85.8 million rides, which
represents the highest number of rides given in more than three decades. It also represents
the sixth straight year of ridership growth.
Ridership highlights from 2015 include:
Metro Transit provided 85.8 million total rides in 2015, the highest total since 1981. There
were 62.1 million total bus rides, 23 million total light-rail rides and 722,637 total commuter
rail rides.
Metro Transit provided 276,408 on the average weekday in 2015.
Ridership growth can be attributed largely to the opening of the METRO Green Line,
connecting downtown Minneapolis and Saint Paul with service to the University of
Minnesota and the State Capitol.
− Average weekday ridership on the METRO Green Line was 37,548. Projected ridership
for 2030 is nearly 41,000.
Metropolitan Council 2015 Performance Evaluation Report
28
− Ridership on the METRO Green Line and the reduced-service local and express routes
along the Central Corridor increased by about 30% from 2014 to 2015, and has nearly
doubled since the corridor was served by buses alone.
Overall ridership also benefited from several large events, including a season of CHS Field
baseball games during the team’s inaugural season at its new home in downtown Saint Paul,
a concert at TCF Bank Stadium by the Rolling Stones and a National Football League playoff
game between the Minnesota Vikings and the Seattle Seahawks. In all, about 16% of those
heading to Target Field to see the Minnesota Twins play and 28% of fans took transit to TCF
Bank Stadium to see the Minnesota Vikings play.
The METRO Green Line
The 11-mile line that runs along University and Washington avenues between downtown
Saint Paul and downtown Minneapolis via the East and West Bank campuses of the
University of Minnesota opened to service on June 14, 2014. The METRO Green Line and its
operators provided more than 37,584 rides on the average weekday. That figure is just 3,400
rides shy of projected weekday ridership of nearly 41,000 by 2030.
The METRO Green Line has 23 stations, including five shared with the METRO Blue Line in
downtown Minneapolis. While ridership remained strong all along the METRO Green Line, it
was particularly robust on the University of Minnesota campus. East Bank Station, at the
heart of the U of M’s main campus, had 690,169 total boarding and an average of 3,871
boardings per weekday.
Not only were more people moving along the University Avenue Corridor, they did so more
efficiently. Previously, buses made 519 trips daily on routes 16, 50 and 94. Now with the
Green Line in service, there are fewer than about 230 daily Green Line trips and 220 bus trips
along routes 16 and 94 (bus route 50 was eliminated).
On the week of June 15, Metro Transit and the communities surrounding the METRO Green
Line came together to celebrate the transitway’s popularity. Riders wore commemorative
buttons, which also entitled them to promotions from several businesses along the corridor.
The line also continued a string of recognition, garnering awards including Top Project and
Progress Minnesota awards from Finance & Commerce and the Engineering Excellence
Award for ingenuity and sustainable design.
The METRO Blue Line
Formerly the Hiawatha Line, the region’s first light rail line was renamed METRO Blue Line in
May of 2013 with the rollout of the METRO system of light-rail and Bus Rapid Transit lines.
Ridership in 2015 hit a record high with more the 10.6 million rides given, topping the 2014
figure by more than a million rides and eclipsing the previous record set in 2010. Additionally,
for an eight-month stretch, more than 30,000 rides were given on the average weekday, far
exceeding ridership expectations more than five years out.
The light-rail system includes a fleet of 86 vehicles that are powered by an overhead catenary
system. When the trains are coupled three-in-a-row during especially busy times or during
special events, they have the ability to carry 600 passengers. They can operate on either the
Green or Blue Lines, but in general there are 39 trains in service on the Green Line and 33 on

Metropolitan Council 2015 Performance Evaluation Report
29
the Blue Line. The trains generally run on 10-minute schedules throughout most of the service
day.
Along the 12-miles that make up the Blue Line, there are 2,800 park-and-ride spaces and 19
stations, including the five shared with the Green Line. Blue Line service connects downtown
Minneapolis with the Mall of America in Bloomington and the two terminals at the
Minneapolis/Saint Paul International Airport.
Northstar Commuter Rail Line
The Northstar commuter rail line, which inaugurated service on Nov. 16, 2009, had a
successful fifth year, with riders boarding 722,637 times, an incremental gain from 2014. The
increase reversed a downward trend mainly due to on-time performance challenges related to
historically severe cold weather in the 2013-2014 winter and large-scale track maintenance to
address those challenges.
A Customer Service Guarantee program put in place in January and February worked to
prove to riders that any continued on-time performance issues from months past were history.
Meant to entice riders who had left to return and to bring the option to new potential riders, the
program proved successful with ridership numbers continuing to increase into 2016.
Northstar service to Twins and Vikings games downtown and other special events continued
to be well received by riders. Using a combination of regular-service and special-event trains,
Northstar served all home games.
Using existing freight tracks of BNSF Railways, the Northstar Line offers five morning trips
from Big Lake, Minn., to downtown Minneapolis and five return trips in the afternoon along a
40-mile corridor adjacent to congested Highways 10 and 47. Two reverse-commute
roundtrips are available on weekdays, one in the morning and one in the afternoon.
Additionally, three weekend roundtrips are offered on Saturdays and Sundays.
Each of six suburban stations – Big Lake, Elk River, Ramsey, Anoka, Coon Rapids/Riverdale
and Fridley – has adjacent park-and-ride facilities, and platforms are equipped with cameras,
emergency telephones, enclosed shelters, heating and other amenities. There are more than
3,000 free park-and-ride spaces at these lots. Connecting bus service is available at four
suburban stations, including Northstar Link coach buses, which provide service to commuters
between St. Cloud and the Northstar train station at Big Lake. Northstar Link also provides
service during Twins and Vikings home games.
Base weekday fares for Northstar commuter rail service range from $3 to $6 each way,
depending on the distance traveled. Fares are lower on weekends. Fares include free
transfers to the METRO Blue line, METRO Green line, and regional buses. The $317 million
Northstar rail project was delivered ahead of schedule and under budget through collaborative
efforts of the Metropolitan Council/Metro Transit, Northstar Corridor Development Authority
and Minnesota Department of Transportation. The Counties Transit Improvement Board and
Sherburne County assist with operating funds
METRO Green Line Extension (Southwest Light Rail Project)
The Southwest Corridor is an estimated $1.79 billion light-rail project that will serve the
communities of Minneapolis, St. Louis Park, Hopkins, Minnetonka and Eden Prairie. The

Metropolitan Council 2015 Performance Evaluation Report
30
planned METRO Green Line Extension will operate on a 14.5-mile route with 15 new stations.
The line would begin revenue service in 2020 and is expected to have 34,000 average
weekday by 2035.
Once trains reach Target Field Station in downtown Minneapolis, they will continue on
METRO Green Line light-rail tracks to downtown Saint Paul, providing continuous light-rail
service to the University of Minnesota, State Capitol and downtown Saint Paul.
Project accomplishment in 2015 included:
February: President Obama’s 2016 budget request included $150 million to start
construction, and gave the project a medium-high rating.
May: The SWLRT’s Supplemental Draft Environmental Impact Statement was published on
May 22, examining potential impacts on three segments of the route and stations in Eden
Prairie, the operations and maintenance facility in Hopkins, and co-locations of light rail and
freight in the Kenilworth Corridor in Minneapolis. Residents commented on the document at
public hearings and through written and electronic submissions.
The Metropolitan Council worked collaboratively with its project partners to revise the scope
for the line, leading to support from the Corridor Management Committee and the
Metropolitan Council. Favorable municipal consent votes were received from all five cities
along the line and Hennepin County.
May-July: The project office and Corridor Management Committee worked to trim the
project’s scope and adjust the cost estimate. This work was accomplished without any
change to CTIB’s funding commitment of $496 million.
August: The project office submitted an updated New Starts application to the Federal
Transit Administration (FTA).
October: A mixer and open house for construction contractors interested in the SWLRT
project was held in Minnetonka on Oct. 21, drawing a crowd of almost 200, including
subcontractors and participants in the state’s Disadvantaged Business Enterprise program.
The project office completed 60% design plans in October for civil construction, the OMF
and systems. Also, the project office submitted a Notice of Intent to apply for entry into the
engineering phase to the FTA.
Blue Line Extension (Bottineau light rail transit project)
The METRO Blue Line Extension is an estimated $1.496 billion light rail line that will serve the
communities of Minneapolis, Golden Valley, Robbinsdale, Crystal and Brooklyn Park. The
planned METRO Blue Line Extension will operate on a 13-mile route with 11 new stations.
The line would begin revenue service in 2021 and is expected to have 27,000 average
weekday riders by 2040. When complete, the Blue Line extension would offer a single-seat
ride from the Target North Campus in Brooklyn Park to the Mall of America.
Project highlights in 2015 included:
In January, the Metropolitan Council opened the Project Office in Crystal and formed Issue
Resolution teams made up of staff from the project office, Metro Transit, Hennepin County
and the five cities along the line. The Project Office started holding regular meetings with
project partners to discuss and resolve technical issues.

Metropolitan Council 2015 Performance Evaluation Report
31
The Blue Line Extension project staff and Hennepin County held more than 160 outreach-
related meetings with the public, including open houses and community meetings. Some of
the meetings drew up to 200 people each. The meetings provided opportunities to learn
about the project and provide input.
The Blue Line Extension Project Office formed advisory committees including the Project
Technical Advisory Committee, Business Advisory Committee, Community Advisory
Committee, and the Communication Steering Committee.
In late October, project staff presented a more refined scope and cost estimate for the
project. The $1.496 billion cost estimate includes stations at both Golden Valley Road and
Plymouth Avenue, and a proposed surface parking lot at the Golden Valley Road site. The
revised cost estimate followed extensive engineering work. New scope items include the
reconstruction of Hwy. 55 in Minneapolis; a station at Plymouth Avenue; a park-and-ride
facility at the Golden Valley Road station and reconstruction of a nearby intersection, and
improved trail connections; new LRT bridge structures in Robbinsdale to cross a pond; a
park-and-ride facility in downtown Robbinsdale; a park-and-ride lot at the Bass Lake Road
station in Crystal; an LRT bridge crossing above Bottineau Boulevard at 73rd Avenue
North, and a pedestrian bridge across freight rail at the 63rd Avenue station is planned.
In December, initiated the municipal review and consent process that will conclude in early
March 2016.
Bus Service
Metro Transit bus ridership remained the pillar of transit with more than 62.1 million rides and
a weekday average of 204,986 rides given in 2015. With growing popularity of rail service,
bus route schedules allow riders to time their transfers so the different modes can work
closely and seamlessly. In fact, about 40% of METRO Blue Line and 30% of METRO Green
Line customers transfer to or from a bus during their trip.
Bus service in 2015 offered riders a respite from driving in one of the busiest construction
seasons in recent memory. Street Operations coordinated more than 1,800 detours, including
an ongoing closure of Nicollet Mall in downtown Minneapolis that forced several routes to
move to Hennepin Avenue in downtown Minneapolis. Schedules of more than 170 routes
were adjusted during the year due to the detours. Despite the service disruptions, buses
operated within five minutes of their schedule more than 87% of the time.
2015 also brought continued focus on what has been called Metro Transit’s “front porch,” the
waiting areas for bus service. New shelters were installed at 51 locations and another 60
shelters were replaced in Minneapolis, where Metro Transit assumed responsibility for
shelters that had previously been under private ownership. Installed were 2,300 new bus stop
signs with route numbers, maps, and instruction that help customer access real-time NexTrip
departure information using a mobile device. Digital displays with real-time NexTrip signs
were installed at 16 high-traffic bus boarding locations in 2015.
Work continued in 2015 to bring the A Line (Snelling Avenue Bus Rapid Transit) to fruition,
with service set to begin on June 11, 2016. The route includes 20 planned stations connecting
the METRO Green and Blue line light rail trains with the Snelling Avenue commercial corridor
and popular destinations, including Hamline University, Macalester College, Highland Village,
Rosedale Shopping Center, Minnehaha Park and Midway Shopping Center.

Metropolitan Council 2015 Performance Evaluation Report
32
The A Line will bring bus service every 10 minutes, supplementing local service that will
continue every 30 minutes. It is expected that the A Line will provide an average of 8,700
weekday rides, allowing riders to reach destinations up to 25% faster. Riders’ experience
waiting for a bus is enhanced with heaters, NexTrip information and ticket machines that
enable riders to pay for rides before they board, increasing efficiency along the A Line
system. Finally, the A Line will provide Wi-Fi while riders are aboard the buses.
The Orange Line Bus Rapid Transit project moved forward in 2015, with design work
continuing along its 17-mile highway route that includes 12 stations. Planners are currently
working on a new at-grade transitway under Interstate Hwy. 494 that would connect the
American Boulevard and 76th Street Stations and a transit-only ramp into and out of
downtown Minneapolis. The project is scheduled to open in 2019, with an average weekday
ridership of 14,000.
Customer Service Technology
The demand for transit information continued to grow in 2015, with customers requesting real-
time departure information using NexTrip more than 84 million times – more than double the
number of requests made in 2012. Another 18,000 NexTrip requests were made through a
service that provides this information by text message. Around 6.3 million trips also were
planned using Metro Transit’s online Trip Planner.
In addition, approximately 8,500 people had signed up to receive text or e-mail Rider Alerts
about scheduled service disruptions by the end of 2015. While customers adapted to new
technologies, the Transit Information Center remained a vital resource, with TIC
representatives helping riders plan 1.2 million trips and answering calls with a record-low hold
time of 43 seconds.
Finally, Metro Transit neared completion of development of its own smart phone app,
scheduled to be released in 2016.
Transit Security
The Metro Transit Police Department continued its growth, swearing in 25 new officers in
2015. By year’s end, the department had 109 full-time officers and 89 part-time officers. The
department’s newest officers completed an expanded academy that includes community
outreach and cultural awareness training. Many of the department’s newest hires speak a
second language, and Spanish language courses were offered to help officers communicate
with non-English speakers. Transit Police also established new beats in North Minneapolis
and Saint Paul’s East Side, while continuing to concentrate on both downtown Saint Paul and
Minneapolis. In addition, a new juvenile unit was created to assist with cases involving first-
time youth offenders.
Transit Police responded to more than 46,000 calls for service – three times the number from
2013. There were an additional 34 requests for mutual aid or “Rescue Buses” that provide
shelter to emergency responders and residents during emergencies. Felony assaults on
operators reached an all-time low, while property crime decreased. Officers completed more
than 2.6 million fare inspections on light rail and Northstar.
Metropolitan Council 2015 Performance Evaluation Report
33
Chief John Harington was named the Minnesota Public Transit Association’s Transit
Professional of the Year. In 2015, Harrington traveled to Mogadishu to assist with police
training and later hosted law enforcement officials from that country. The department also
hired the country’s first Somali-born female officer.
In 2015, Metro Transit also advanced plans to expand its Heywood Campus, including the
construction of a new headquarters for the Metro Transit Police Department.
Transit-Oriented Development (TOD)
The Metro Council has long supported TOD through Livable Communities grants, growth and
transportation policies, Regional Transitway Guidelines and the Guide for Transit Oriented
Development. The Council and Metro Transit are being proactive and prioritizing TOD in
transit service decisions, regional planning, grant making, data collection, and technical
assistance.
In 2015, the TOD office served as a lead in pursuing private and public partnerships to
accelerate transit-oriented development. One of the more high-profile examples of this work
sits near the intersection of Saint Paul’s Snelling and University Avenues, one of the state’s
busiest intersections. In 2015, negotiations began in earnest on a proposed Major League
Soccer stadium and surrounding “Super Block,” including the Metro Council’s Snelling and
University property.
The TOD office is advised by developers, local government representatives and other
partners. It also convenes an internal working group on a regular basis to share information
and resources about TOD-related activities. Cross-departmental conversations foster
collaborative efforts that allow staff to work with a unified purpose and language regarding
TOD.
Finally, developments that either opened or continued development near transitways include
CHS Field in Saint Paul and Be The Match organization, which brought 900 employees in a
new seven-story, $60 million building across from Target Field Station.
Commitment to Equity
Metro Transit’s commitment to equity for the communities it serves was evidenced in 2015
by creating and developing the Community Outreach and Engagement Team. The team
focuses on building a community-centered, transparent process to achieve equitable
outcomes. The process will entail developing sustained relationships with transit riders,
people of color, low-income communities, people with disabilities, and other historically
underrepresented groups to strengthen their participation in decision-making.
Other Metro Transit 2014 Achievements
Metro Transit provided more than 575,000 rides to and from the 2015 Minnesota State Fair,
the highest express and regular-route ridership in the event’s history.
With fans traveling to the new CHS Field, TCF Bank Stadium and Target Field, single-day
light-rail ridership topped 100,000 for the first time ever on Thursday, Sept. 3.
Metro Transit’s Student Pass program grew with the addition of a Summer Student Pass
and a school-year pilot at Saint Paul’s Johnson High School. Student Pass ridership
Metropolitan Council 2015 Performance Evaluation Report
34
increased 12.5% from 2014, to almost 4 million rides. The program was also recognized by
the Minnesota Public Transit Association in earning the Management Innovation Award.
Among recognitions received:
− Gold Award, APTA AdWheel Awards, Special Events: Green Line opening day
campaign
− Award of Excellence, Minnesota Association of Government Communicators: “Switch
My Trip” Campaign.
− Award of Excellence, Minnesota Association of Government Communicators: State Fair
Campaign.
− Partner of the Year, “Visit Saint Paul”: For efforts to support and enhance the tourism
industry in Saint Paul.
− Employer of the Year, WTS Minnesota: For efforts to hire and promote women at Metro
Transit and the Metropolitan Council.
− Innovation in Tourism, “Meet Minneapolis”: For efforts to support and enhance the
tourism industry in Minneapolis.
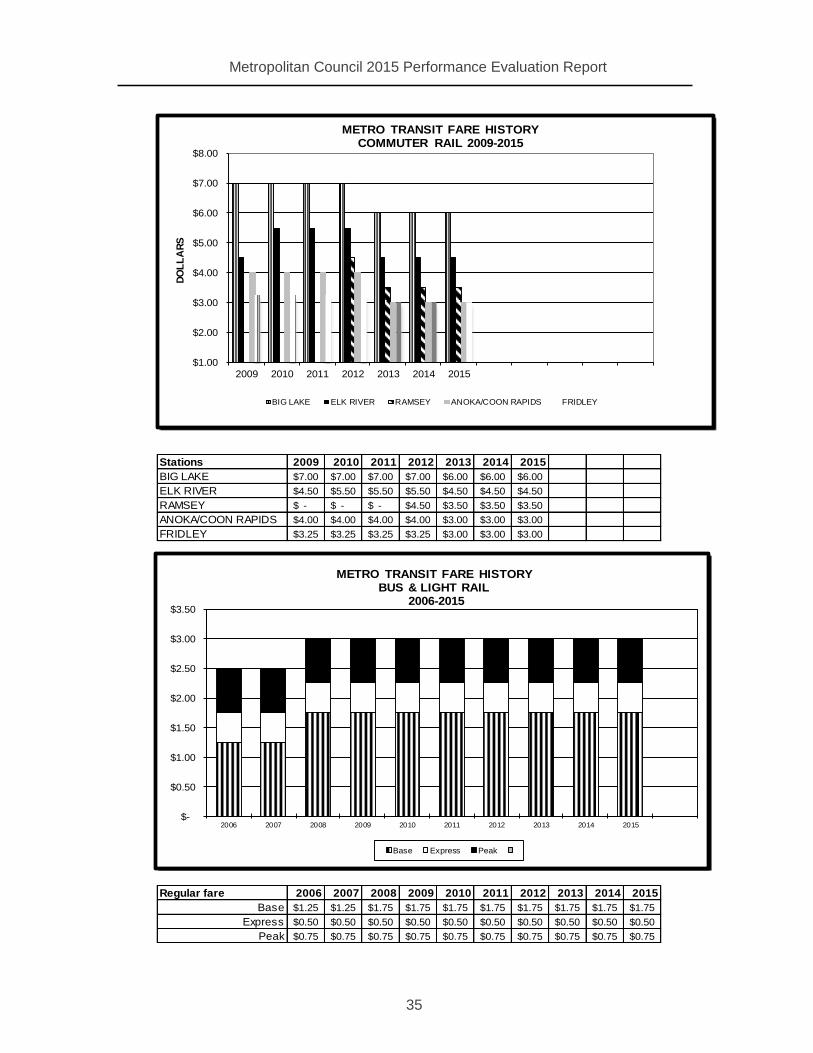
Metropolitan Council 2015 Performance Evaluation Report
35
Stations 2009 2010 2011 2012 2013 2014 2015
BIG LAKE 7.00$ 7.00$ 7.00$ 7.00$ 6.00$ 6.00$ 6.00$
ELK RIVER 4.50$ 5.50$ 5.50$ 5.50$ 4.50$ 4.50$ 4.50$
RAMSEY -$ -$ -$ 4.50$ 3.50$ 3.50$ 3.50$
ANOKA/COON RAPIDS 4.00$ 4.00$ 4.00$ 4.00$ 3.00$ 3.00$ 3.00$
FRIDLEY 3.25$ 3.25$ 3.25$ 3.25$ 3.00$ 3.00$ 3.00$
Regular fare 2006 2007 2008 2009 2010 2011 2012 2013 2014 2015
Base 1.25$ 1.25$ 1.75$ 1.75$ 1.75$ 1.75$ 1.75$ 1.75$ 1.75$ 1.75$
Express 0.50$ 0.50$ 0.50$ 0.50$ 0.50$ 0.50$ 0.50$ 0.50$ 0.50$ 0.50$
Peak 0.75$ 0.75$ 0.75$ 0.75$ 0.75$ 0.75$ 0.75$ 0.75$ 0.75$ 0.75$
$-
$0.50
$1.00
$1.50
$2.00
$2.50
$3.00
$3.50
2006 2007 2008 2009 2010 2011 2012 2013 2014 2015
METRO TRANSIT FARE HISTORYBUS & LIGHT RAIL
2006-2015
Base Express Peak
$1.00
$2.00
$3.00
$4.00
$5.00
$6.00
$7.00
$8.00
2009 2010 2011 2012 2013 2014 2015
DO
LL
AR
S
METRO TRANSIT FARE HISTORYCOMMUTER RAIL 2009-2015
BIG LAKE ELK RIVER RAMSEY ANOKA/COON RAPIDS FRIDLEY
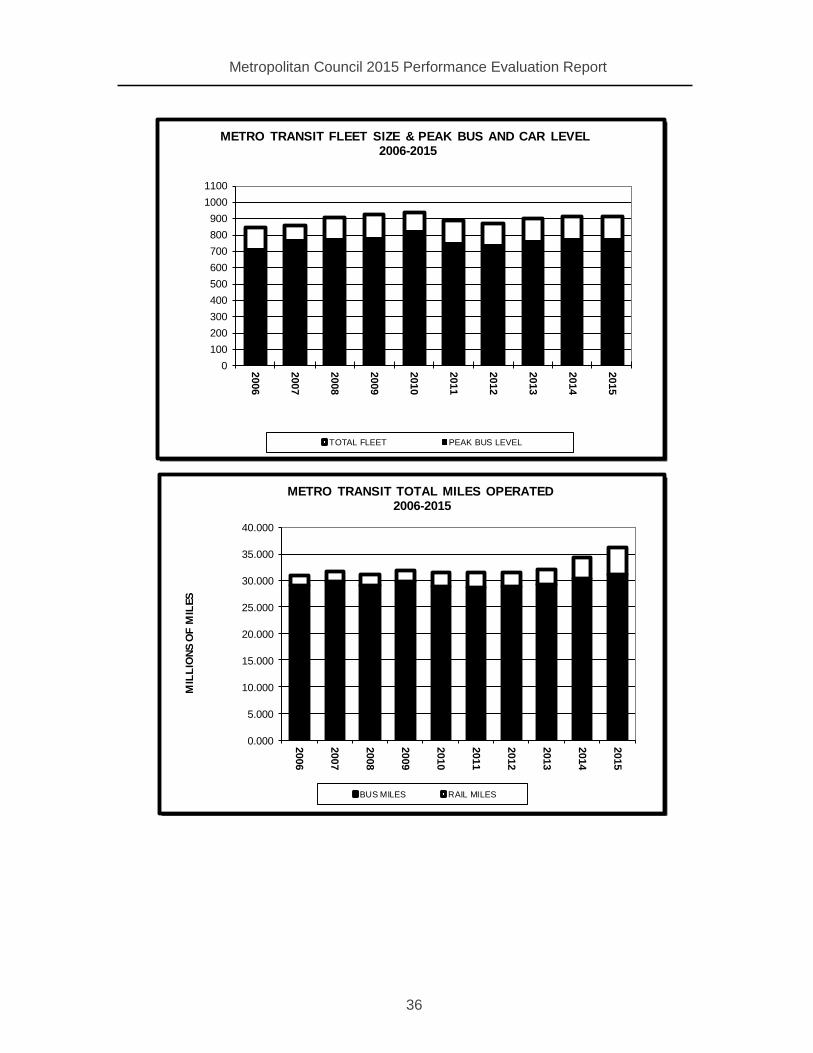
Metropolitan Council 2015 Performance Evaluation Report
36
0
100
200
300
400
500
600
700
800
900
1000
1100
2006
2007
2008
2009
2010
2011
2012
2013
2014
2015
METRO TRANSIT FLEET SIZE & PEAK BUS AND CAR LEVEL2006-2015
TOTAL FLEET PEAK BUS LEVEL
0.000
5.000
10.000
15.000
20.000
25.000
30.000
35.000
40.000
2006
2007
2008
2009
2010
2011
2012
2013
2014
2015
MIL
LIO
NS
OF M
ILES
METRO TRANSIT TOTAL MILES OPERATED 2006-2015
BUS MILES RAIL MILES
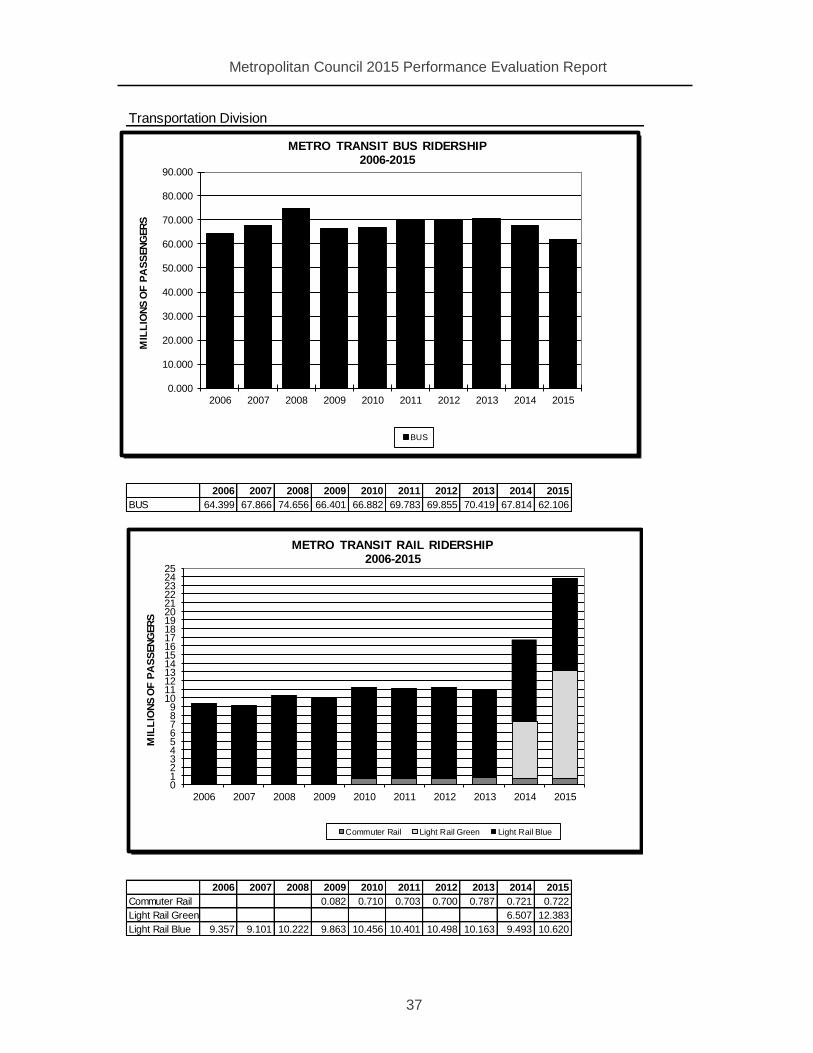
Metropolitan Council 2015 Performance Evaluation Report
37
Transportation Division
2006 2007 2008 2009 2010 2011 2012 2013 2014 2015
BUS 64.399 67.866 74.656 66.401 66.882 69.783 69.855 70.419 67.814 62.106
2006 2007 2008 2009 2010 2011 2012 2013 2014 2015
Commuter Rail 0.082 0.710 0.703 0.700 0.787 0.721 0.722
Light Rail Green 6.507 12.383
Light Rail Blue 9.357 9.101 10.222 9.863 10.456 10.401 10.498 10.163 9.493 10.620
0.000
10.000
20.000
30.000
40.000
50.000
60.000
70.000
80.000
90.000
2006 2007 2008 2009 2010 2011 2012 2013 2014 2015
MIL
LIO
NS
OF P
AS
SEN
GER
SMETRO TRANSIT BUS RIDERSHIP
2006-2015
BUS
0123456789
10111213141516171819202122232425
2006 2007 2008 2009 2010 2011 2012 2013 2014 2015
MIL
LIO
NS
OF P
AS
SEN
GER
S
METRO TRANSIT RAIL RIDERSHIP2006-2015
Commuter Rail Light Rail Green Light Rail Blue

Metropolitan Council 2015 Performance Evaluation Report
38
2006 2007 2008 2009 2010 2011 2012 2013 2014 2015
MECHANICAL FAILURES 4720 4536 5003 5468 5988 6128 7456 7310 7549 7510
ACCIDENTS 4.21 4.22 3.80 4.09 4.19 3.91 3.95 4.42 4.40 4.00
0
1000
2000
3000
4000
5000
6000
7000
8000
2006
2007
2008
2009
2010
2011
2012
2013
2014
2015
DEFINITION: THE DISTANCE TRAVELED IN SERVICE BETWEEN MECHANICAL FAILURES. HIGHER IS BETTER .
METRO TRANSIT MILES BETWEEN ROAD FAILURE 2006-2015
0.00
0.50
1.00
1.50
2.00
2.50
3.00
3.50
4.00
4.50
5.00
5.50
6.00
2006
2007
2008
2009
2010
2011
2012
2013
2014
2015
DEFINITION: THE AVERAGE NUMBER OF TRAFFIC AND PASSENGER ACCIDENTS PER 100,000 MILES OF BUS SERVICE.
METRO TRANSIT ACCIDENTS PER 100,000 MILES DRIVEN2006-2015

Metropolitan Council 2015 Performance Evaluation Report
39
Environmental Services Division
Overview Guided by the Metropolitan
Council’s long-range plan,
Thrive MSP 2040, and the
MCES 2040 Water Resources
Policy Plan, MCES:
Operates and maintains
approximately 600 miles of
regional sewers that collect
flows from more than 5,000
miles of sewers owned by
108 communities in the
seven-county Twin Cities
Region.
Collects and treats
approximately 250 million
gallons of wastewater a day.
Runs eight regional
wastewater treatment
plants: Seneca, St. Croix
Valley, Hastings,
Metropolitan, Eagles Point,
Empire, Blue Lake and East Bethel.
Continues to achieve near-perfect compliance with federal and state clean water
discharge standards.
Works collaboratively with state and federal agencies, local and county government,
watershed management organizations, interest groups and the public to protect the
region’s rich water resources as the region continues to grow.
Establishes user fees that pay 100% of wastewater operations and debt service costs,
which are below national averages.
Works with approximately 800 industrial permit holders to substantially reduce the
amount of pollution entering the wastewater collection system.
Ensures sufficient sewer capacity to serve planned development.
Makes capital investments to support growth, maintain infrastructure and improve water
quality.

Metropolitan Council 2015 Performance Evaluation Report
40
MCES Mission
Provide wastewater services and integrated planning to ensure sustainable water quality and
water supply for the region.
MCES Vision
Be a valued leader and partner in water sustainability.
Strategic Vision Process
MCES continued its strategic planning process that began in 2013, rolling out its new
Outcomes, Strategies and Goals. Strategic planning efforts will continue in 2016 to identify
additional goals which will be integrated into 2016 performance measurements.
MCES’s Strategic Outcomes for 2015 are divided into three categories:
1. Sustainable Communities
2. Sustainable Services
3. Sustainable Infrastructure
Sustainable Communities
MCES seeks to improve customer service, lead by example in environmental sustainability,
and partner with customers and stakeholders to achieve regional goals.
Wastewater Treatment
MCES treatment plants continued to perform at a high level in complying with clean water
discharge permits. System-wide, wastewater was treated to 100% NPDES compliance and all
air emissions permits and stack tests were successfully passed. The interceptor system had
no Notices of Violations.
Seven treatment plants earned Peak Performance Awards from the National Association of
Clean Water Agencies (NACWA). Six of the plants earned NACWA’s Platinum Award for five
or more consecutive years of perfect NPDES permit compliance through 2014 and awarded
in 2015: Hastings (24 years), St. Croix Valley (23 years), Seneca (14 years), Blue Lake (9
years), Eagles Point (9 years), and Empire (7 years).
Customer Service
MCES reaches out to new customers and works to maintain good relations with current
customers. In planning for the 2016 budget, MCES held meetings for customer communities
and industrial permit holders in late May and early June, 2015. The meetings included
information on proposed 2016 budget and rates and an opportunity for customer input and
questions.
Energy Reduction, Recovery, and Conservation
MCES’s energy goal is to reduce purchased fossil fuel energy by 10% by 2020, using 2015 as
the base year. By the end of 2020, MCES shall have advanced clean energy within the state
of Minnesota by participating in projects that support the expansion of renewable energy in an

Metropolitan Council 2015 Performance Evaluation Report
41
amount equivalent to at least 10% of MCES’s 2015 energy usage. MCES set a new goal of
reducing its fossil fuel-based energy purchases by 10% of its 2015 figure by 2020.
In addition to reducing its fossil fuel energy purchases, MCES also constructed a 1.25 MW
solar facility in 2015 at its Blue Lake Wastewater Treatment Plant, which will provide up to
10% of the plant’s energy needs. MCES has committed to advancing renewable energy in the
amount equivalent to at least 10% of its 2015 energy use.
Eagles Point Plant staff implemented projects that switched from using groundwater to
treatment plant effluent for some of their processes, resulting in an 80% reduction in the use
of groundwater. This represents over 4 million gallons of groundwater saved annually.
The Metro Plant Water Use Team has developed a plan to eliminate plant use of Prairie du
Chien groundwater (1 billion gallons annually) by 2020.
Water Resources Management
The Council’s 2040 Water Resources Policy Plan integrates water resources management
and protection with planning for the region’s growth. The policy plan, which was updated in
2014-2015, contains guidelines for developing and maintaining service systems that support
development and for which the Council has some statutory responsibility, including
wastewater service, surface water management, and regional water supply.
Among the initiatives being implemented under the Water Resources Policy Plan are the
following:
1. Chartered an Integrated Water Planning Team and Comprehensive Planning Sub-Team.
2. The Integrated Water Planning Team met monthly to discuss meetings, projects, and plan
reviews that cross MCES departments. The team completed an internal review and
development of input for the Water Resources Policy Plan, the Master Water Supply Plan,
and the Wastewater System Plan; the coordinated development of the local planning
handbook; and the coordinated approach to the water resources part of the system
statements.
3. Collaborated with the City of Eagan to evaluate potential reuse of treated wastewater and
tank underdrainage water. The latter appears technically feasible.
4. Developed preliminary wastewater reuse cost estimates for southeast and northeast
subregions.
5. Updated the region’s Master Water Supply Plan in collaboration with local stakeholders,
agencies and input from the Metropolitan Area Water Supply Advisory Committee and
Community Technical Work Group. The final plan was adopted by the Metropolitan
Council in 2015.
6. Continued collaboration with southeast and northeast subregions and Washington County
water coalition to investigate the feasibility of potential water supply alternatives available
for communities.
7. Collaborated with stakeholders to develop a water conservation grant program. Grants
were awarded to 19 communities, totaling $558,000.
8. Continued collaboration with the U.S. Geological Survey and local stakeholders to study
groundwater and surface water interaction in the northeast Twin Cities metro area.
Metropolitan Council 2015 Performance Evaluation Report
42
9. Established a Community Technical Work Group in response to requests from the
American Public Works Association and City Engineers Association of Minnesota to
provide input to MCES on technical, financial, and operational issues related to regional
water supply planning from the perspective of water supply providers. The group met five
times throughout the summer of 2015, resulting in the work group’s endorsement of the
draft plan released for public review.
10. Collaborated with Minnesota Department of Natural Resources to provide three training
workshops for local water suppliers to support the update of their local water supply plans.
11. Awarded targeted stormwater grants to the cities of Waconia and Hugo for reuse projects.
Both projects reuse stormwater for irrigation, reducing the need to pump groundwater for
that purpose. A grant was awarded to the Vermillion River Joint Powers Board to assist in
installing several stormwater practices at the Minnesota Zoo, and $1 million will be
available in 2016 to expand this program.
Sustainable Services
MCES seeks to manage and reward performances linked to mission, vision, values,
strategies and goals; recruit, develop and retain a high-performance workforce that has full
opportunity for engagement; and utilize technology and best practices to improve efficiency
and effectiveness.
Employees in the Workplace
The MCES workforce, 672 full-time equivalents (FTEs), meets the needs of a high-tech and
capital-intensive industry that operates 24 hours a day, 7 days a week, 365 days a year.
Employees work at multiple wastewater collection and treatment facilities throughout the Twin
Cities metro area. Positions include engineers, environmental scientists, machinists,
electricians, pipefitters, painters, plant operators, technicians, interceptor service workers and
administrative support personnel.
MCES Workforce Plan
More than 25% of MCES employees are currently eligible or will be eligible for retirement
within the next five years. Building on previous plans, the 2016-2020 Workforce Plan was
created to help address the challenges of succession planning and recruiting diverse
candidates.
Additionally:
MCES created a Workforce Planning Team that met throughout 2015 to develop and begin
implementation of the 2016-2020 Workforce Plan. At year-end, teams were formed to
address the seven strategic initiatives listed below. Three of the teams started work in
2015, and the remaining teams plan to begin in the first half of 2016.
1. Performance Management Tools/Leadership Development: To ensure that performance
management tools and resources are in place for all employees.
2. Behavioral Expectations: To support and enhance a positive work culture that builds
respect and a secure and civil work environment.
Metropolitan Council 2015 Performance Evaluation Report
43
3. Recognize/Celebrate Employees: To establish/enhance programs that recognize and
celebrate ES employees.
4. Build Diversity/Networking & Collaboration: To build diversity in MCES that more clearly
reflects the region.
5. Mentoring: To increase employee engagement, retention, and professional growth
through the use of mentoring.
6. Onboarding: To welcome and integrate new MCES employees through inclusive and
informative onboarding programs.
7. Defining Career Opportunities/Networking & Collaboration: To create a work culture that
allows for career opportunities to increase retention.
MCES strengthened its employee wellness programs. 2015 initiatives included:
1. Hiring a summer intern to expand stretching programs for treatment plant/interceptor
system employees and conducting an employee survey to provide a framework for
worksite wellness initiatives going forward. After the intern left, the stretching programs
continued with the assistance of the HealthPartners wellness coach.
2. Other initiatives in development include: onsite fitness rooms, a program to support
healthy sleep habits, and a “trade time for fitness” benefit.
To build diversity, MCES requested and received a Metropolitan Council Equity Grant to
hire a Changing Workforce Specialist. The specialist started in November 2015, and is
working on creating interest in water careers in economically disadvantaged schools in the
Twin Cities region, and will assist hiring managers with outreach efforts to increase the
diversity within their candidate pools.
Safety
Each of the 17 MCES work areas/safety committees worked to maintain and/or improve upon
their safety goals and leading-edge indicators in 2015:
MCES reduced the number of workplace accidents from 25 in 2014 to 23 in 2015.
All employees completed quarterly safety training via online or classroom, and all
employees completed fatigue-risk management training online.
11 work areas began completing job hazard analyses.
All 17 work areas completed monthly safety audits and have safety committees that meet
monthly.
The Weekly Safety Talk newsletter featuring workplace safety tips was emailed to all MCES
employees, every week (52 weeks).
All MCES facilities have safety posters and banners displayed in prominent locations.
Posters are updated monthly; banners are updated annually.
MCES started arc-flash analysis upgrades to comply with NFPA 70E 2015 requirements.
This was done in all eight applicable facilities in Technical Services and Interceptor
Operations.
Metropolitan Council 2015 Performance Evaluation Report
44
Sustainable Infrastructure
MCES seeks to improve asset management practices to increase value to our customers,
preserve sound financial practices for wastewater services and secure funding for our other
water services, and utilize infrastructure efficiently by addressing system inputs at the source.
Asset Management
Improvements in the asset management area included chartering an Asset Management
Steering Team, developing asset management principles, and developing a criticality (risk)
analysis plan for 2016 implementation.
Preserving and Building Infrastructure
MCES is preserving and building infrastructure to meet the wastewater collection and
treatment needs for the region using asset management principles. Approximately $133
million was spent on capital improvements in 2015.
Growth-related projects in 2015 included:
Adding regional sewer capacity to serve redevelopment in Golden Valley and St. Louis Park
(completion anticipated in mid-2016).
Construction of a lift station to serve northeast Woodbury and east and central Lake Elmo
(startup is planned for 2016).
Construction of a lift station to serve Chaska and Carver (completion anticipated in
November 2016).
Construction of the Elm Creek Interceptor extension to Corcoran and Rogers (completion
anticipated in July 2016).
Asset preservation projects in 2015 included:
The first phase of an arc-flash mitigation project (completion anticipated in spring 2016).
Rehabilitation of gravity sewers, based on condition assessment, with a long-term goal of
seven miles per year. Projects were completed in 2015 in Burnsville, Bloomington, Eagan,
Brooklyn Park, Blaine, Chanhassen, White Bear Lake, Newport, St. Paul Park, New
Brighton, Minneapolis, and Saint Paul. Projects were under construction in 2015 in
Burnsville, Fridley, Coon Rapids, Brooklyn Park, Champlin, Mounds View, Minneapolis,
Saint Paul, and Richfield.
Rehabilitation of force main sewers, based on risk assessment, with a long-term goal of
four miles per year. Projects were completed in 2015 in Excelsior, Wayzata, St. Louis Park,
Minneapolis, and Golden Valley. Projects were under construction in 2015 in Waconia and
Mound.
Lift station rehabilitation projects in Eagan and Mound (completion anticipated in December
2016).
Ongoing meter station rehabilitation; 10 planning meters have been installed in Saint Paul.
Treatment plant construction projects completed in 2015 include Metropolitan Plant fluid-
bed incinerators, F&I Building No. 1 demolition, and improvements to sludge pumps, water

Metropolitan Council 2015 Performance Evaluation Report
45
systems, HVAC systems, and the double-barrel interceptor sewer, as well as small projects
at the Blue Lake, Empire, Eagles Point, and St. Croix Valley Plants.
Treatment plant projects under construction include Metro Plant east pretreatment and
flotation thickening (completion anticipated in December 2016).
Finance
MCES management keeps the organization competitive as compared to other similarly sized
wastewater utilities across the country. Additionally, wastewater service charges
(approximately $22 per month) are lower than most other metro-area utility charges, such as
gas, electric and high-speed Internet. A process improvement team was formed and revised
the financial forecast tracking tool and process, with a goal of increased engagement and
accuracy of the forecast.
Budget
MCES staff completed 2015 operations and routine maintenance activities within the Annual
Operating Budget limits.
Inflow and Infiltration (I&I) Reduction Program
MCES set a goal of reducing excessive inflow and infiltration of clear water into the sanitary
sewers by 40% by 2020, in an effort to recover reserve capacity in the wastewater system to
serve growth. (June 29, 2014, is being used as the base wet-weather event.)
I&I outreach meetings were held with many cities to discuss specific community concerns, the
Municipal Wastewater Charge, water reuse, and capital projects. In 2015, MCES met with the
cities of Saint Paul, Mounds View, Mound, Hugo, Burnsville, Eagan, St. Anthony, Rosemount,
Apple Valley, and Robbinsdale.
Industrial Pretreatment Incentive Program
MCES is working to recover process capacity for wastewater treatment at the Metro, Blue
Lake, and Empire Plants by reducing high-strength waste loads from existing industrial
customers. Through the Industrial Pretreatment Incentive Program (IPIP) instituted in 2015,
MCES is encouraging high-strength industrial dischargers to reduce their chemical oxygen
demand (COD) by installing pretreatment equipment at their facilities.
MCES Industrial Waste and Pollution Prevention staff and Finance staff visited several
industries and held several meetings to explain this new program to potential applicants. Five
applications have been received. They are from diverse industries representing some of
MCES’s highest industrial discharge customers, including two food processors, a dairy, and
two tanneries. Technical and financial review of the applications will continue into 2016.
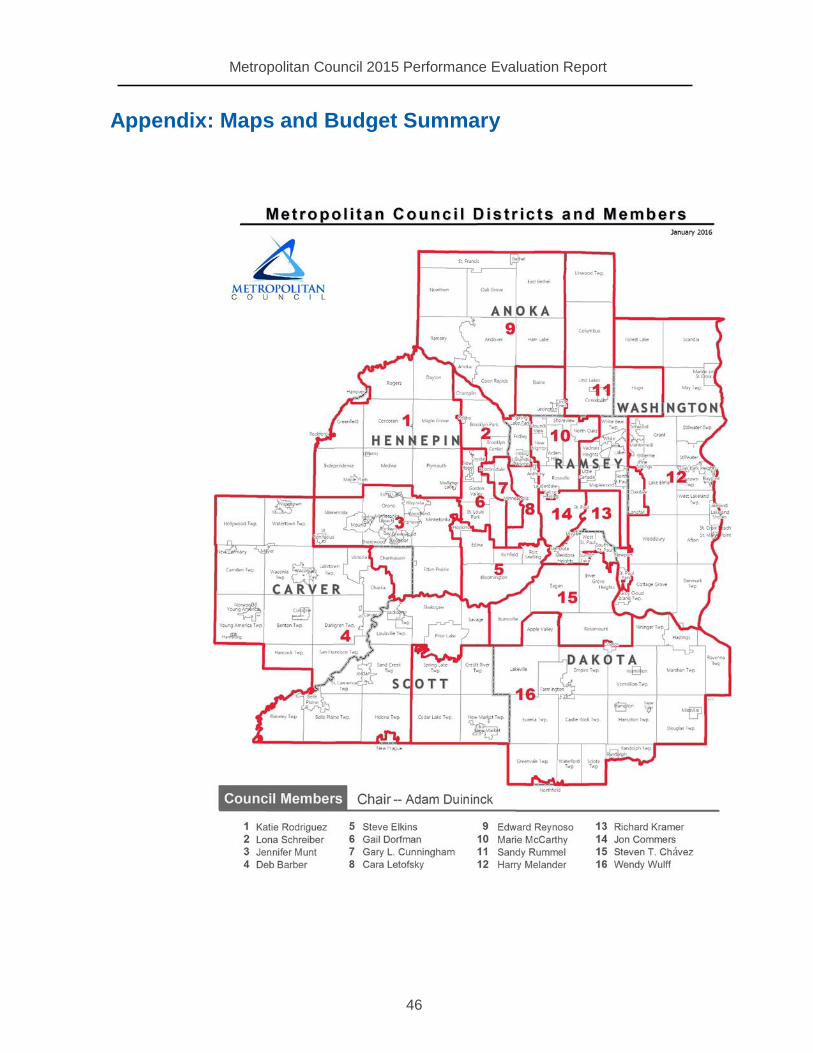
Metropolitan Council 2015 Performance Evaluation Report
46
Appendix: Maps and Budget Summary
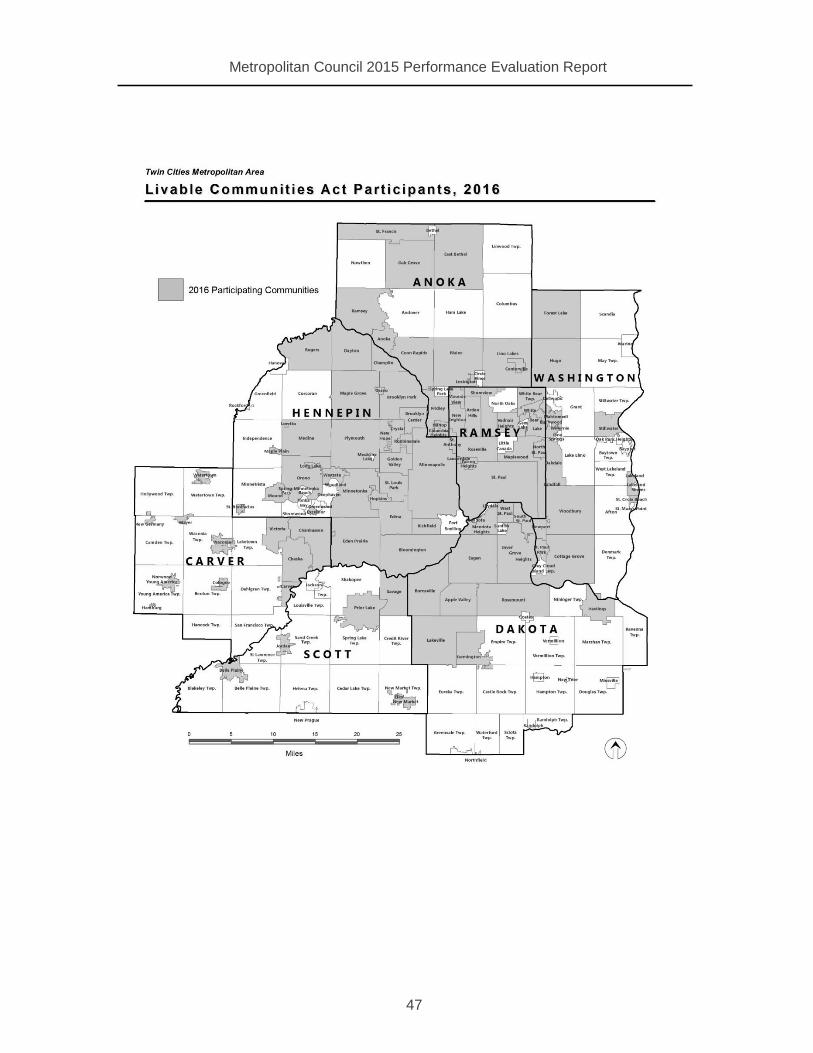
Metropolitan Council 2015 Performance Evaluation Report
47

Metropolitan Council 2015 Performance Evaluation Report
48
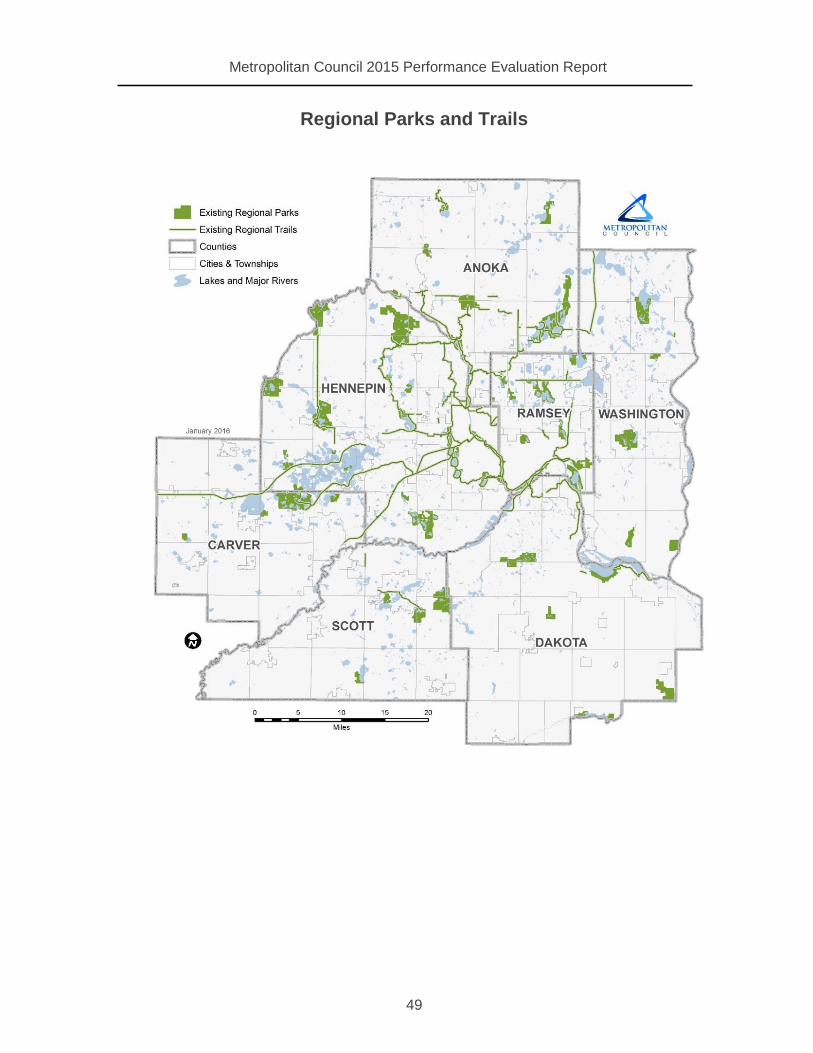
Metropolitan Council 2015 Performance Evaluation Report
49
Regional Parks and Trails

Metropolitan Council 2015 Performance Evaluation Report
50

Metropolitan Council 2015 Performance Evaluation Report
51

Metropolitan Council 2015 Performance Evaluation Report
52
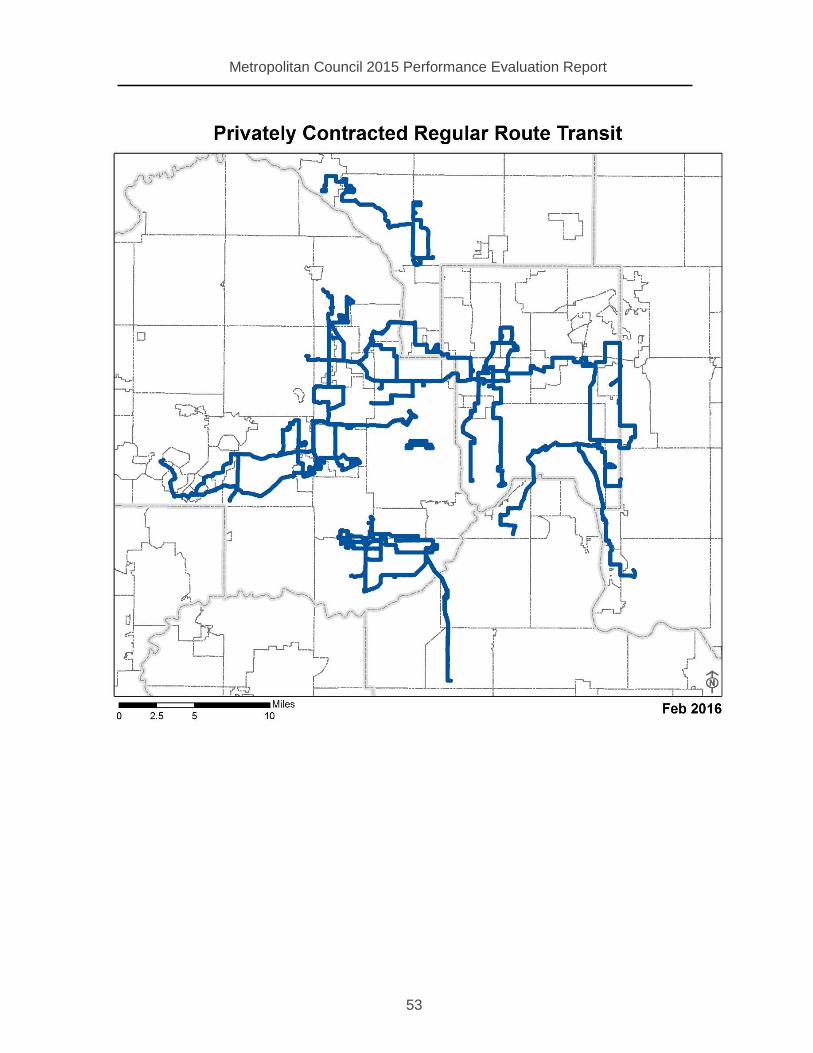
Metropolitan Council 2015 Performance Evaluation Report
53

Metropolitan Council 2015 Performance Evaluation Report
54

Metropolitan Council 2015 Performance Evaluation Report
55

Metropolitan Council 2015 Performance Evaluation Report
56

Metropolitan Council 2015 Performance Evaluation Report
57

390 Robert Street North
Saint Paul, MN 55101-1805
651.602.1000
TTY 651.291.0904
metrocouncil.org
Follow us on:
twitter.com/metcouncilnews
facebook.com/MetropolitanCouncil
youtube.com/MetropolitanCouncil