2015 LOUISIANA TEACHER PREPARATION PROGRAM FACT … · LOUISIANA TEACHER PREPARATION ... Number of...
55
2015 LOUISIANA TEACHER PREPARATION PROGRAM FACT BOOK Prepared by the Louisiana Board of Regents July 26, 2016
-
Upload
truongcong -
Category
Documents
-
view
213 -
download
0
Transcript of 2015 LOUISIANA TEACHER PREPARATION PROGRAM FACT … · LOUISIANA TEACHER PREPARATION ... Number of...
2015
LOUISIANA TEACHER
PREPARATION
PROGRAM FACT BOOK
Prepared by the
Louisiana Board of Regents
July 26, 2016

1
TABLE OF CONTENTS
Table of Contents ………………………………………………………………………………. 1
Introduction …………………………………………………………………………………. … 3
Listing of Teacher Preparation Programs and Web Sites …………………………………….... 4
State, Regional, and National Approval/Accreditation of Teacher Preparation Programs ……... 5
Percentage of Program Completers Passing Praxis Assessments For Teacher
Licensure – Undergraduate Programs (2012-13) ……………………………………... 6
Percentage of Program Completers Passing Praxis Assessments For Teacher
Licensure – Alternate Programs (2012-13) ……………………………………………. 7
Median Grade Point Average of Candidates Entering and Completing Teacher
Preparation Programs – Undergraduate Programs (2012-13) …………………………. 8
Median Grade Point Averages of Candidates Entering and Completing Teacher
Preparation Programs – Alternate Programs (2012-13) ……………………………….. 9
Number of Teacher Candidates Enrolled and Teacher Candidate Completers –
Undergraduate Programs (2012-13) …………………………………………………… 10
Number of Teacher Candidates Enrolled and Teacher Candidate Completers –
Alternate Programs (2012-13) ………………………………………………………... 11
Gender for Enrolled Teacher Candidates – Undergraduate and Alternate
Programs (2012-13) …………………………………………………………………… 12
Races for Enrolled Teacher Candidates – Undergraduate Programs (2012-13) ……………….. 13
Races for Enrolled Teacher Candidates – Alternate Programs (2012-13) ……………………… 14
Number of Hours for Clinical Experiences for Teacher Preparation Programs –
Undergraduate Programs (2012-13) …………………………………………………… 15
Number of Hours for Clinical Experiences for Teacher Preparation Programs – Alternate Programs (2012-13) ………………………………………………………… 16
Persistence in Teaching in Public Schools …………………………………………………….. 17
Number and Percentage of 2012-13 Completers Who Began Teaching in Public
Schools in Louisiana During 2013-14 ………………………………………………….. 20
Means and Effectiveness Levels for Compass Final Evaluation Scores By Undergraduate
Programs for First and Second Year Teachers in 2012-14 and 2013-14 ………………… 21
Means and Effectiveness Levels for Compass Final Evaluation Scores By Alternate
Programs for First and Second Year Teachers in 2012-13 and 2013-14 …………………. 25

2
TABLE OF CONTENTS (CONT’D.) Value-Added Evaluation of Louisiana Teacher Preparation Programs for Academic
Years 2008-09, 2009-10, 2010-11, 2011-12, and 2012-13 ……………………………….. 32
Percentage of Undergraduate Completers Obtaining Value-Added Scores in the Teacher
Effectiveness Levels During Their First and/or Second Year of Teaching ……………… 42
Percentage of Alternate Completers Obtaining Value-Added Scores in the Teacher Effectiveness Levels During Their First and/or Second Year of Teaching ……………… 46
Appendix A: Teacher Preparation Program 2020 Key Effectiveness Indicators ……………….. 51
Appendix B: Teacher Preparation Data Dashboard Template …………………………………... 53

3
2015 LOUISIANA TEACHER PREPARATION PROGRAM FACT BOOK
INTRODUCTION
Louisiana has been a state in which teacher preparation programs have been committed to preparing
effective new teachers whose students demonstrate gains in student learning. From 1999-2010, all
teacher preparation programs in Louisiana participated in a teacher preparation transformation which
involved the Board of Elementary and Secondary Education creating more rigorous teacher certification
requirements, all teacher preparation programs partnering with PK-12 school/district personnel to
redesign all teacher preparation programs, all programs being redesigned to address state and national
teacher and student content standards, all programs increasing the number of clock hours for candidates
to be engaged in clinical experiences, and all redesigned programs being evaluated by national experts.
All pre-redesign programs were terminated, and all redesigned programs that met the more rigorous
state requirements were approved for implementation by the Louisiana Board of Regents and Board of
Elementary and Secondary Education. Available data were collected, and it was determined that needs
originally identified in 1999-2000 were being addressed as a result of the redesign efforts.
Louisiana is now engaging in a new transformation that addresses new needs that extend beyond the work
that occurred for the first transformation. Several new needs involve the development of greater
collaboration between teacher preparation programs and schools/districts to ensure that candidates are
provided high quality clinical experiences while being supervised by highly effective teachers,
providing a teacher preparation curriculum that involves in-depth instruction to prepare new teachers’
students to successfully master college and career-ready standards, ensuring that candidates can address
competencies identified by the state to demonstrate that they are “learner-ready” when they start
teaching, and reporting accurate information about teacher preparation programs to the public.
The creation of the 2015 Teacher Preparation Data Dashboards and Teacher Preparation Program Fact
Book are two endeavors that are being voluntarily implemented to address the need to provide the
public with access to outcome data about teacher preparation programs in Louisiana. The Teacher
Preparation Data Dashboards provide a short summary of relevant data about individual teacher
preparation programs in Louisiana. The Teacher Preparation Program Fact Book provides listings of data
found in the individual data dashboards plus additional contextual data. All teacher preparation programs
discussed in the Teacher Preparation Program Fact Book have voluntarily signed data agreements with
the Louisiana Board of Regents and Louisiana Department of Education to share data about their
candidates and to have aggregate level data reported to the public in the Teacher Preparation Data
Dashboards.
Outcome data in the 2015 fact book pertains to cohorts of 2012-13 program completers or earlier
completers who taught in Louisiana’s schools during 2013-14 or previous years. New Teacher
Preparation Data Dashboards and fact books will be created in the future as new cohorts of teacher
candidates complete programs and teach in public schools in Louisiana.
Louisiana obtained permission from Teacher Preparation Analytics to use a structure called 2020 Key
Effectiveness Indicators (See Appendix A) developed by Michael Allen, Edward Crowe, and Charles
Coble, co-partners of Teacher Preparation Analytics to develop the Louisiana Teacher Preparation
Data Dashboards. (http://caepnet.org/accreditation/caep-accreditation/caep-accreditation-
resources/building-an-evidence-based-system) This work was commissioned by the Council for the
Accreditation of E d u c a t o r Preparation.
To access all individual Teacher Preparation Data Dashboards, please go to the following URL:
http://www.regents.la.gov/page/2014-teacher-preparation-data-dashboards. See Appendix B for a copy of
the data dashboard template.

4
LISTING OF TEACHER PREPARATION PROGRAMS AND WEB SITES
A listing has been provided of all teacher preparation programs in Louisiana that are identified in the
Teacher Preparation Program Fact Book and web sites for information about the programs.
Teacher Preparation Programs Teacher Preparation Programs
PUBLIC UNIVERSITIES
Louisiana State University System
Louisiana State University at
Alexandria
http://www.lsua.edu/academic/Departments/Education
Louisiana State University and A&M
College
http://www.lsu.edu/chse/education/
Louisiana State University at
Shreveport
http://www.lsus.edu/academics/college-of-business-education-
and-human-development/school-of-education
University of Louisiana System
Grambling State University http://www.gram.edu/academics/majors/education/
Louisiana Tech University http://education.latech.edu/
McNeese State University http://www.mcneese.edu/education
Nicholls State University http://www.nicholls.edu/education/
Northwestern State University http://education.nsula.edu/
Southeastern Louisiana University http://www.southeastern.edu/acad_research/colleges/edu_hd/inde
x.html
University of Louisiana at Lafayette http://coe.louisiana.edu/
University of Louisiana at Monroe http://ulm.edu/education/index.html
University of New Orleans http://www.uno.edu/coehd/index.aspx
Southern University System
Southern University and A&M
College
http://www.subr.edu/index.cfm/page/229
Southern University at New Orleans http://www.suno.edu/Default.aspx?PageID=16531753&A=S
earchResult&SearchID=13274662&ObjectID=16531753&O bjectType=1
PRIVATE UNIVERSITIES
Centenary College http://www.centenary.edu/education
Louisiana College http://www.lacollege.edu/academics/programs/division-teacher-
education
Loyola University New Orleans http://cas.loyno.edu/teacher-education
Tulane University http://tulane.edu/teacher/index.cfm
University of Holy Cross http://olhcc.edu/academics/calendars-catalogs-and-
Xavier University of Louisiana http://www.xula.edu/education/
PRIVATE PROVIDERS Louisiana Resource Center for
Educators
http://LRCEteach.org/
The New Teacher Project http://tntp.org
Louisiana has one university and five private providers who have not yet produced enough new teachers for
their results to be reported in the 2015 Teacher Preparation Data Dashboards. The university and private
providers include the following: Loyola University, iTEACH Louisiana, Relay Graduate School of Education,
Ascension Parish School Board, St. Bernard Parish School Board, and Caddo Parish School Board.

5
STATE, REGIONAL, AND NATIONAL APPROVAL/ACCREDITATION OF TEACHER
PREPARATION PROGRAMS
A listing has been provided of the approval/accreditation status of all teacher preparation programs in
Louisiana. All teacher preparation programs listed have obtained state approval from the Board of
Elementary and Secondary Education for candidates who complete the programs to be certified to teach
in Louisiana if they meet all state certification requirements. All public and private universities are
regionally accredited as degree-granting higher education institutions by the Southern Association of
Colleges and Schools Commission on Colleges (SACSCOC). All public universities have degrees that
have been approved by the Board of Regents (BoR). All public and private universities have obtained
national program accreditation from the National Council for Accreditation of Teacher Education
(NCATE), Teacher Education Accreditation Council (TEAC) or Council for the Accreditation of
Educator Preparation (CAEP). Private providers are only required to obtain approval from the Board of
Elementary and Secondary Education to operate teacher preparation programs in Louisiana.
Teacher Preparation Programs
Types of Approval and Accreditation
State
Approval by
BESE
State
Approval
by BoR
Regional
Accreditation
(SACSCOC)
Program
Accreditation
(NCATE/
TEAC/CAEP)
PUBLIC AND PRIVATE UNIVERSITIES
Grambling State University Approved Approved Accredited Accredited
Louisiana State University at
Alexandria
Approved
Approved
Accredited
Accredited
Louisiana State University and A&M
College
Approved
Approved
Accredited
Accredited
Louisiana State University at
Shreveport
Approved
Approved
Accredited
Accredited
Louisiana Tech University Approved Approved Accredited Accredited
McNeese State University Approved Approved Accredited Accredited
Nicholls State University Approved Approved Accredited Accredited
Northwestern State University Approved Approved Accredited Accredited
Southeastern Louisiana University Approved Approved Accredited Accredited
Southern University and A&M
College
Approved
Approved
Accredited
Accredited
Southern University at New Orleans Approved Approved Accredited Accredited
University of Louisiana at Lafayette Approved Approved Accredited Accredited
University of Louisiana at Monroe Approved Approved Accredited Accredited
University of New Orleans Approved Approved Accredited Accredited
PRIVATE UNIVERSITIES
Centenary College Approved N/A Accredited Accredited
Louisiana College Approved N/A Accredited Accredited
Tulane University Approved N/A Accredited Accredited
University of Holy Cross Approved N/A Accredited Accredited
Xavier University of Louisiana Approved N/A Accredited Accredited
PRIVATE PROVIDERS
Louisiana Resource Center for
Educators
Approved
N/A
N/A
N/A
The New Teacher Project Approved N/A N/A N/A

6
PERCENTAGE OF PROGRAM COMPLETERS PASSING PRAXIS ASSESSMENTS
FOR TEACHER LICENSURE
UNDERGRADUATE PROGRAMS (2012-13)
State law requires all undergraduate teacher candidates to pass an assessment approved by the State to be
admitted to a teacher preparation program. All teacher candidates must pass the Praxis I: Core Academic
Skills assessments to enter teacher preparation programs and must obtain the required Praxis I cut-off
scores that are required by the Board of Elementary and Secondary Education for new teachers to obtain a
license to teach in Louisiana. Teacher candidates may also obtain an ACT composite score of 22 or a
SAT combined verbal and math score of 1030 in lieu of the Praxis I assessments. State law also requires
undergraduate teacher candidates to take all remaining State licensure assessments (i.e., Praxis II:
Content Knowledge; Praxis Professional Knowledge) prior to graduation; however, the law does not
require teacher candidates to pass the assessments. Individual universities have created policies that
require all teacher candidates to meet all Louisiana teacher licensure requirements to obtain a degree in
teacher education. Some universities allow students to appeal the university policy. Assessment results
indicate that 100% of all new teachers who completed undergraduate teacher preparation programs
in 2012-13 in Louisiana passed all licensure assessments to become certified to teach in Louisiana.
Additional information about Praxis passage rates can be found in Section V within the 2015 Louisiana
Title II Higher Education Act Report at the following URL: https://title2.ed.gov/Public/Home.aspx
Undergraduate
Teacher Preparation
Programs
Percentage of Undergraduate Program Completers Who
Passed the Teacher Licensure Assessments (2012-13)
Praxis I:
Core
Academic
Skills
Praxis II:
Content
Knowledge
Praxis
Professional
Knowledge
All
Praxis
Assessments
PUBLIC AND PRIVATE UNIVERSITIES
Grambling State University 100% 100% 100% 100%
Louisiana State University
at Alexandria
100%
100%
100%
100%
Louisiana State University and
A&M College
100%
100%
100%
100%
Louisiana State University
at Shreveport
100%
100%
100%
100%
Louisiana Tech University 100% 100% 100% 100%
McNeese State University 100% 100% 100% 100%
Nicholls State University 100% 100% 100% 100%
Northwestern State University 100% 100% 100% 100%
Southeastern Louisiana University 100% 100% 100% 100%
Southern University and
A&M College
100%
100%
100%
100%
Southern University at New Orleans 100% 100% 100% 100%
University of Louisiana at Lafayette 100% 100% 100% 100%
University of Louisiana at Monroe 100% 100% 100% 100%
University of New Orleans 100% 100% 100% 100%
PRIVATE UNIVERSITIES
Louisiana College 100% 100% 100% 100%
University of Holy Cross 100% 100% 100% 100%
Xavier University of Louisiana 100% 100% 100% 100%
7
PERCENTAGE OF PROGRAM COMPLETERS PASSING PRAXIS ASSESSMENTS
FOR TEACHER LICENSURE
ALTERNATE PROGRAMS (2012-13)
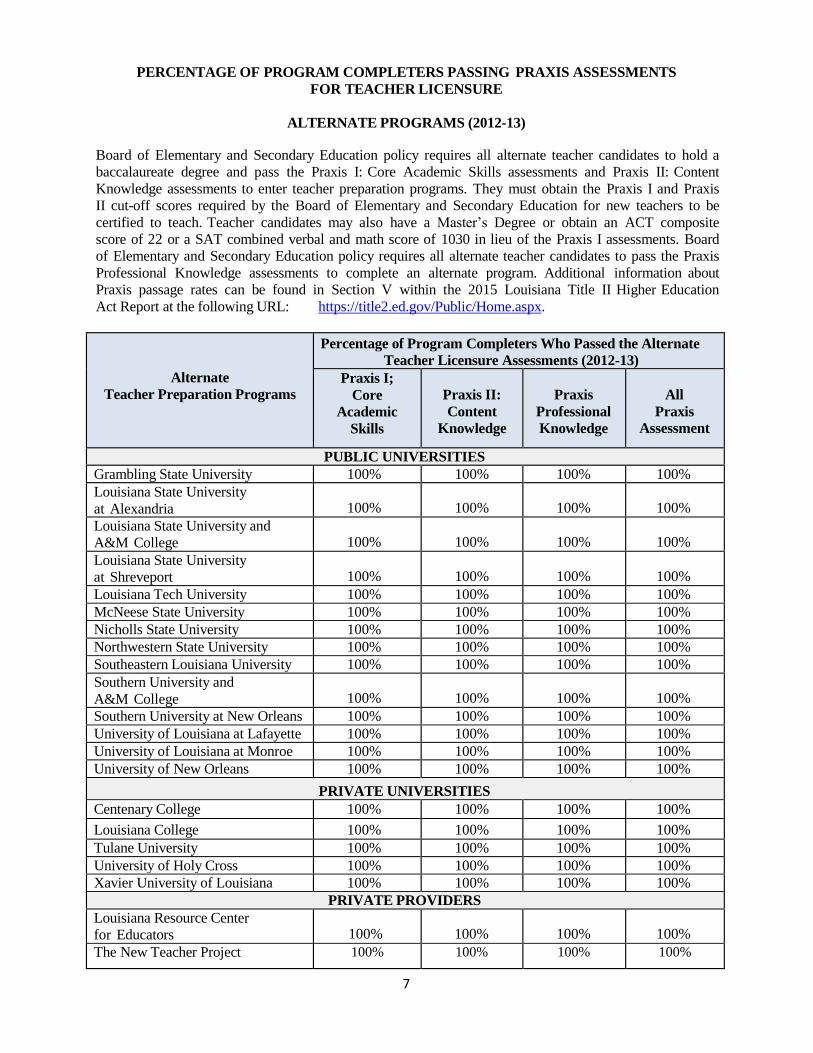
Board of Elementary and Secondary Education policy requires all alternate teacher candidates to hold a
baccalaureate degree and pass the Praxis I: Core Academic Skills assessments and Praxis II: Content
Knowledge assessments to enter teacher preparation programs. They must obtain the Praxis I and Praxis
II cut-off scores required by the Board of Elementary and Secondary Education for new teachers to be
certified to teach. Teacher candidates may also have a Master’s Degree or obtain an ACT composite
score of 22 or a SAT combined verbal and math score of 1030 in lieu of the Praxis I assessments. Board
of Elementary and Secondary Education policy requires all alternate teacher candidates to pass the Praxis
Professional Knowledge assessments to complete an alternate program. Additional information about
Praxis passage rates can be found in Section V within the 2015 Louisiana Title II Higher Education
Act Report at the following URL: https://title2.ed.gov/Public/Home.aspx.
Alternate
Teacher Preparation Programs
Percentage of Program Completers Who Passed the Alternate
Teacher Licensure Assessments (2012-13)
Praxis I;
Core
Academic
Skills
Praxis II:
Content
Knowledge
Praxis
Professional
Knowledge
All
Praxis Assessment
PUBLIC UNIVERSITIES
Grambling State University 100% 100% 100% 100%
Louisiana State University
at Alexandria
100%
100%
100%
100%
Louisiana State University and
A&M College
100%
100%
100%
100%
Louisiana State University
at Shreveport
100%
100%
100%
100%
Louisiana Tech University 100% 100% 100% 100%
McNeese State University 100% 100% 100% 100%
Nicholls State University 100% 100% 100% 100%
Northwestern State University 100% 100% 100% 100%
Southeastern Louisiana University 100% 100% 100% 100%
Southern University and
A&M College
100%
100%
100%
100%
Southern University at New Orleans 100% 100% 100% 100%
University of Louisiana at Lafayette 100% 100% 100% 100%
University of Louisiana at Monroe 100% 100% 100% 100%
University of New Orleans 100% 100% 100% 100%
PRIVATE UNIVERSITIES
Centenary College 100% 100% 100% 100%
Louisiana College 100% 100% 100% 100%
Tulane University 100% 100% 100% 100%
University of Holy Cross 100% 100% 100% 100%
Xavier University of Louisiana 100% 100% 100% 100%
PRIVATE PROVIDERS
Louisiana Resource Center
for Educators
100%
100%
100%
100%
The New Teacher Project 100% 100% 100% 100%

8
MEDIAN GRADE POINT AVERAGE OF CANDIDATES ENTERING AND COMPLETING
TEACHER PREPARATION PROGRAMS
UNDERGRADAUTE PROGRAMS (2012-13)
All undergraduate teacher preparation programs in Louisiana require a minimum Grade Point Average of
2.5 for candidates to be admitted to a teacher preparation program. The median Grade Point Average of
2012-13 program completers ranged from a low of 2.60 to a high of 3.75 when they entered their teacher
preparation programs. Candidates generally enter their teacher preparation programs during their
sophomore or junior years. The median Grade Point Average of 2012-13 program completers ranged
from a low of 2.80 to a high of 3.66 at the point when candidates completed their t e a c h e r
preparation programs. A 4.0 is the highest value for a Grade Point Average.
Undergraduate
Teacher Preparation Programs
Median Grade Point
Average of Candidates
Entering Teacher
Preparation Program
Median Grade Point
Average of Candidates
Completing Teacher
Preparation Program
PUBLIC UNIVERSITIES
Grambling State University 3.31 3.17
Louisiana State University at Alexandria 3.00 3.43
Louisiana State University and A&M College 3.11 3.32
Louisiana State University at Shreveport 3.18 3.24
Louisiana Tech University 3.20 3.30
McNeese State University 3.12 3.40
Nicholls State University 3.06 3.27
Northwestern State University 3.44 3.51
Southeastern Louisiana University 3.13 3.32
Southern University and A&M College 2.60 2.80
Southern University at New Orleans 3.08 3.37
University of Louisiana at Lafayette 3.18 3.19
University of Louisiana at Monroe 3.11 3.42
University of New Orleans 3.14 3.30
PRIVATE UNIVERSITIES
Louisiana College 3.45 3.20
University of Holy Cross 3.10 3.51
Xavier University of Louisiana 3.75 3.66
9
MEDIAN GRADE POINT AVERAGE OF CANDIDATES ENTERING AND
COMPLETING TEACHER PREPARATION PROGRAMS
ALTERNATE PROGRAMS (2012-13)
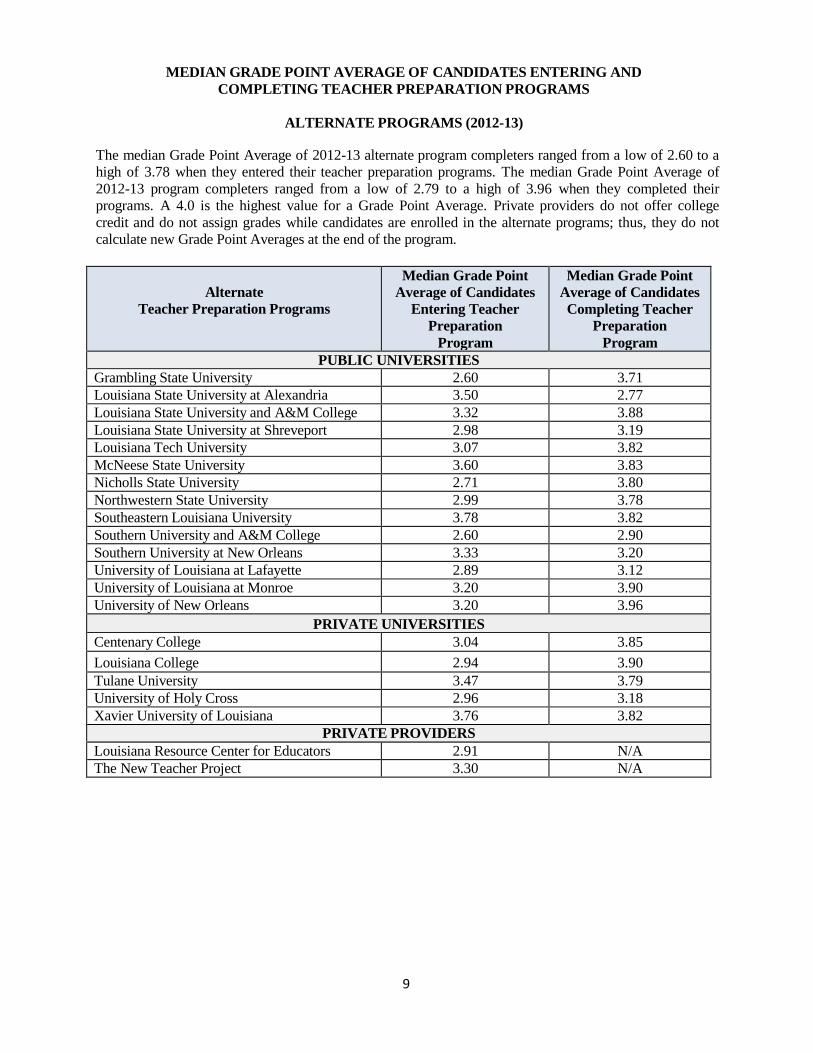
The median Grade Point Average of 2012-13 alternate program completers ranged from a low of 2.60 to a
high of 3.78 when they entered their teacher preparation programs. The median Grade Point Average of
2012-13 program completers ranged from a low of 2.79 to a high of 3.96 when they completed their
programs. A 4.0 is the highest value for a Grade Point Average. Private providers do not offer college
credit and do not assign grades while candidates are enrolled in the alternate programs; thus, they do not
calculate new Grade Point Averages at the end of the program.
Alternate
Teacher Preparation Programs
Median Grade Point
Average of Candidates
Entering Teacher
Preparation
Program
Median Grade Point
Average of Candidates
Completing Teacher
Preparation
Program
PUBLIC UNIVERSITIES
Grambling State University 2.60 3.71
Louisiana State University at Alexandria 3.50 2.77
Louisiana State University and A&M College 3.32 3.88
Louisiana State University at Shreveport 2.98 3.19
Louisiana Tech University 3.07 3.82
McNeese State University 3.60 3.83
Nicholls State University 2.71 3.80
Northwestern State University 2.99 3.78
Southeastern Louisiana University 3.78 3.82
Southern University and A&M College 2.60 2.90
Southern University at New Orleans 3.33 3.20
University of Louisiana at Lafayette 2.89 3.12
University of Louisiana at Monroe 3.20 3.90
University of New Orleans 3.20 3.96
PRIVATE UNIVERSITIES
Centenary College 3.04 3.85
Louisiana College 2.94 3.90
Tulane University 3.47 3.79
University of Holy Cross 2.96 3.18
Xavier University of Louisiana 3.76 3.82
PRIVATE PROVIDERS
Louisiana Resource Center for Educators 2.91 N/A
The New Teacher Project 3.30 N/A

10
NUMBER OF TEACHER CANDIDATES ENROLLED AND TEACHER
CANDIDATE COMPLETERS
UNDERGRADUATE PROGRAMS (2012-13)
Teacher candidates must meet criteria identified by the State and universities to be admitted and officially
enrolled in an undergraduate teacher preparation program. The criteria includes passage of the Praxis I
assessment, a 2.5 or higher GPA, and other entry requirements. Entry usually occurs during a student’s
sophomore or junior year. The following chart identifies the number of candidates who were officially
enrolled in undergraduate teacher preparation programs and the number of additional students who
completed undergraduate teacher preparation programs in 2012-13.
Undergraduate
Teacher Preparation Programs
Teacher
Candidates
Enrolled in
Program
Teacher
Candidates
Completed
Program
Total
PUBLIC UNIVERSITIES
Grambling State University 37 19 56 Louisiana State University at Alexandria 43 18 61 Louisiana State University and A&M College 833 240 1073 Louisiana State University at Shreveport 114 47 161 Louisiana Tech University 151 79 230 McNeese State University 140 116 256 Nicholls State University 310 101 411 Northwestern State University 140 69 209 Southeastern Louisiana University 503 230 733 Southern University and A&M College 35 20 55 Southern University at New Orleans 23 12 35 University of Louisiana at Lafayette 398 200 598 University of Louisiana at Monroe 83 66 149 University of New Orleans 165 45 210
PRIVATE UNIVERSITIES
Louisiana College 37 10 47
University of Holy Cross 9 22 31 Xavier University of Louisiana 12 3 15
11
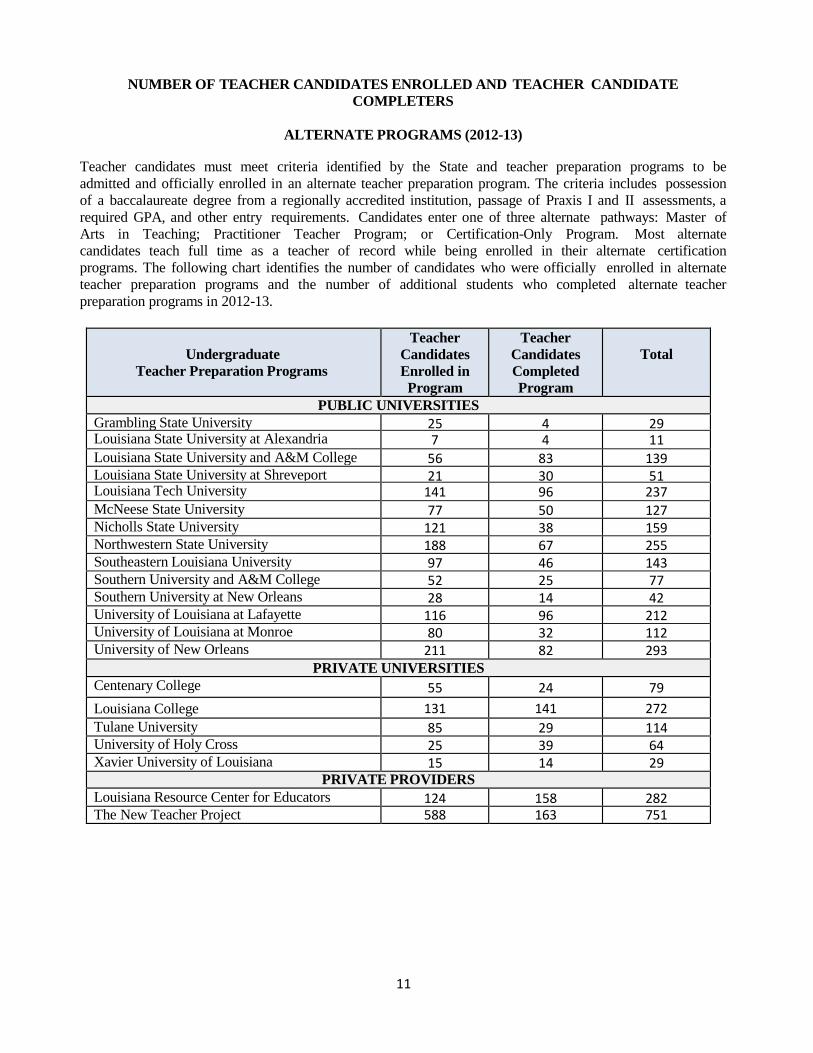
NUMBER OF TEACHER CANDIDATES ENROLLED AND TEACHER CANDIDATE
COMPLETERS
ALTERNATE PROGRAMS (2012-13)
Teacher candidates must meet criteria identified by the State and teacher preparation programs to be
admitted and officially enrolled in an alternate teacher preparation program. The criteria includes possession
of a baccalaureate degree from a regionally accredited institution, passage of Praxis I and II assessments, a
required GPA, and other entry requirements. Candidates enter one of three alternate pathways: Master of
Arts in Teaching; Practitioner Teacher Program; or Certification-Only Program. Most alternate
candidates teach full time as a teacher of record while being enrolled in their alternate certification
programs. The following chart identifies the number of candidates who were officially enrolled in alternate
teacher preparation programs and the number of additional students who completed alternate teacher
preparation programs in 2012-13.
Undergraduate
Teacher Preparation Programs
Teacher
Candidates
Enrolled in
Program
Teacher
Candidates
Completed
Program
Total
PUBLIC UNIVERSITIES
Grambling State University 25 4 29 Louisiana State University at Alexandria 7 4 11 Louisiana State University and A&M College 56 83 139 Louisiana State University at Shreveport 21 30 51 Louisiana Tech University 141 96 237 McNeese State University 77 50 127 Nicholls State University 121 38 159 Northwestern State University 188 67 255 Southeastern Louisiana University 97 46 143 Southern University and A&M College 52 25 77 Southern University at New Orleans 28 14 42 University of Louisiana at Lafayette 116 96 212 University of Louisiana at Monroe 80 32 112 University of New Orleans 211 82 293
PRIVATE UNIVERSITIES
Centenary College 55 24 79
Louisiana College 131 141 272
Tulane University 85 29 114 University of Holy Cross 25 39 64 Xavier University of Louisiana 15 14 29
PRIVATE PROVIDERS
Louisiana Resource Center for Educators 124 158 282 The New Teacher Project 588 163 751

12
GENDER FOR ENROLLED TEACHER CANDIDATES UNDERGRADUATE AND
ALTERNATE PROGRAMS (2012-13)
The number of males and females enrolled in undergraduate and alternate programs in 2012-13 is
provided below
Teacher Preparation Programs Undergraduate Enrolled
Students
Alternate
Enrolled Students
Males Females Males Females
PUBLIC UNIVERSITIES
Grambling State University 9 28 9 16 Louisiana State University at Alexandria 4 39 1 6 Louisiana State University and A&M College
135
698
12
44 Louisiana State University at Shreveport 11 103 6 15 Louisiana Tech University 32 119 43 98 McNeese State University 22 118 13 64 Nicholls State University 52 258 35 86 Northwestern State University 45 95 38 150 Southeastern Louisiana University 55 448 26 71 Southern University and A&M College 12 23 14 38 Southern University at New Orleans 3 20 4 24 University of Louisiana at Lafayette 51 347 21 95 University of Louisiana at Monroe 6 77 19 61 University of New Orleans 25 140 53 158
PRIVATE UNIVERSITIES
Centenary College 19 36 Louisiana College 5 32 49 82 Tulane University 25 60 University of Holy Cross 0 9 5 20
Xavier University of Louisiana 2 10 5 10 PRIVATE PROVIDERS
Louisiana Resource Center for Educators 31 95
The New Teacher Project 177 411
13
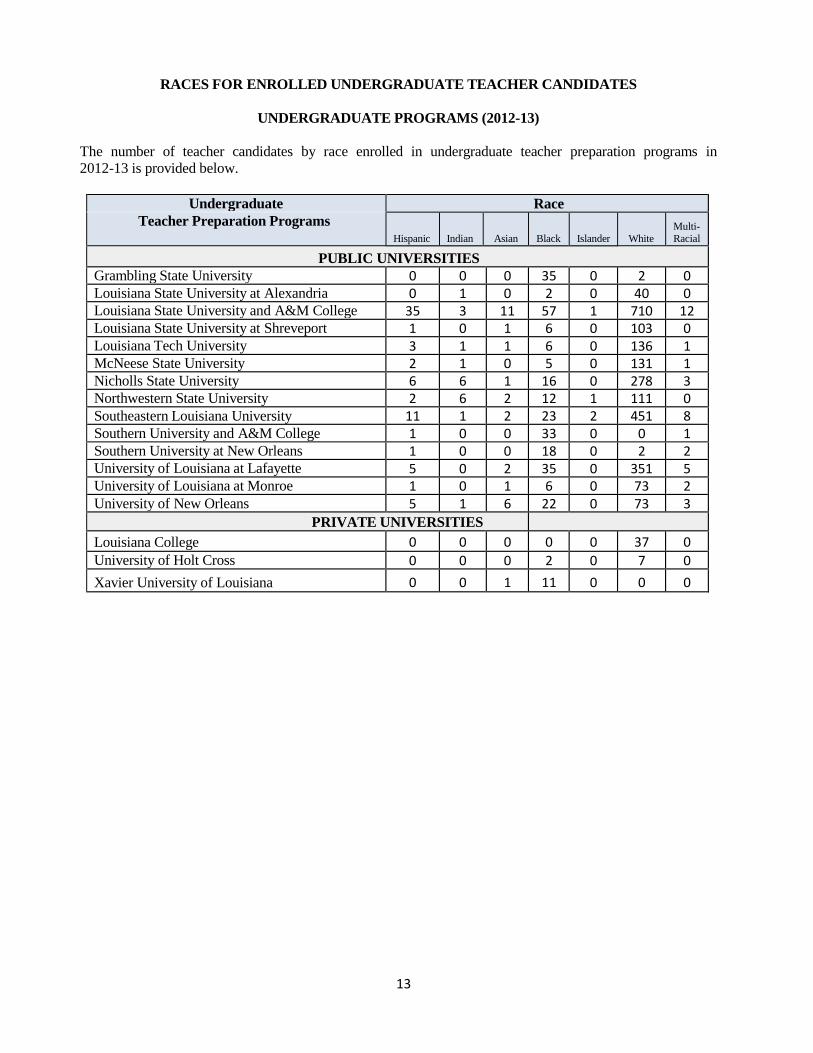
RACES FOR ENROLLED UNDERGRADUATE TEACHER CANDIDATES
UNDERGRADUATE PROGRAMS (2012-13)
The number of teacher candidates by race enrolled in undergraduate teacher preparation programs in
2012-13 is provided below.
Undergraduate Race
Teacher Preparation Programs
Hispanic
Indian
Asian
Black
Islander
White Multi- Racial
PUBLIC UNIVERSITIES
Grambling State University 0 0 0 35 0 2 0 Louisiana State University at Alexandria 0 1 0 2 0 40 0 Louisiana State University and A&M College 35 3 11 57 1 710 12 Louisiana State University at Shreveport 1 0 1 6 0 103 0 Louisiana Tech University 3 1 1 6 0 136 1 McNeese State University 2 1 0 5 0 131 1 Nicholls State University 6 6 1 16 0 278 3 Northwestern State University 2 6 2 12 1 111 0 Southeastern Louisiana University 11 1 2 23 2 451 8 Southern University and A&M College 1 0 0 33 0 0 1 Southern University at New Orleans 1 0 0 18 0 2 2 University of Louisiana at Lafayette 5 0 2 35 0 351 5 University of Louisiana at Monroe 1 0 1 6 0 73 2 University of New Orleans 5 1 6 22 0 73 3
PRIVATE UNIVERSITIES
Louisiana College 0 0 0 0 0 37 0 University of Holt Cross 0 0 0 2 0 7 0
Xavier University of Louisiana 0 0 1 11 0 0 0
14
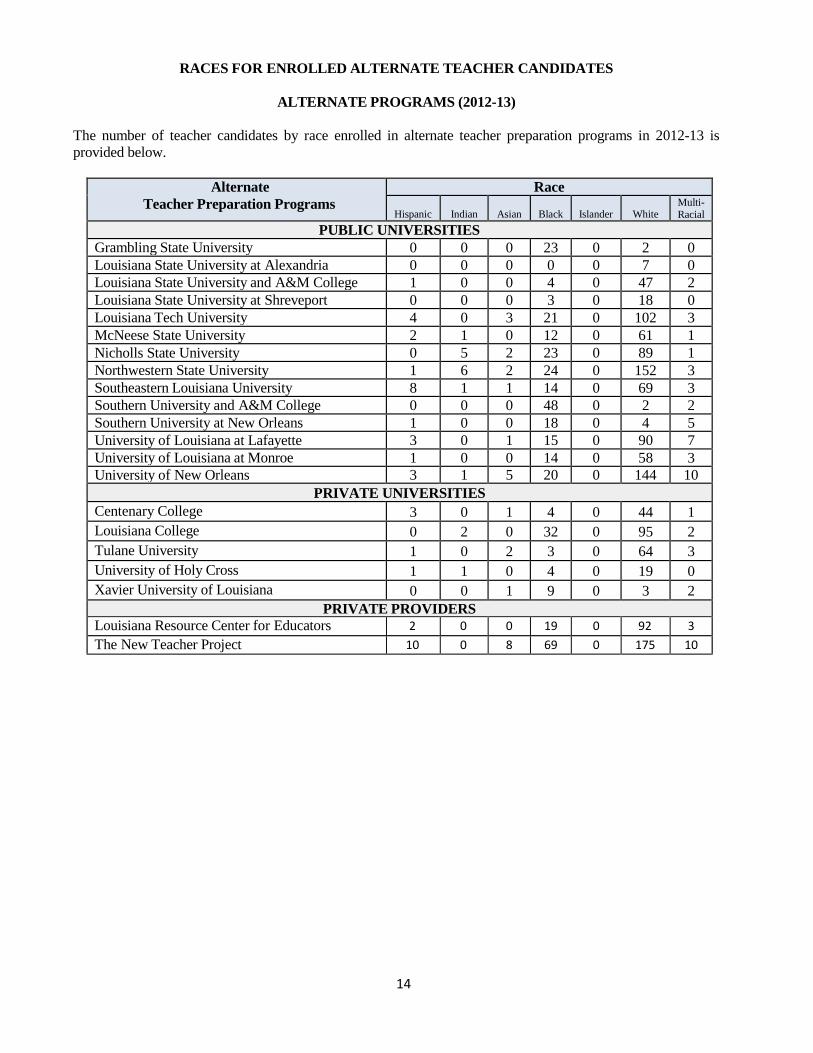
RACES FOR ENROLLED ALTERNATE TEACHER CANDIDATES
ALTERNATE PROGRAMS (2012-13)
The number of teacher candidates by race enrolled in alternate teacher preparation programs in 2012-13 is
provided below.
Alternate Race
Teacher Preparation Programs
Hispanic
Indian
Asian
Black
Islander
White Multi- Racial
PUBLIC UNIVERSITIES
Grambling State University 0 0 0 23 0 2 0
Louisiana State University at Alexandria 0 0 0 0 0 7 0
Louisiana State University and A&M College 1 0 0 4 0 47 2
Louisiana State University at Shreveport 0 0 0 3 0 18 0
Louisiana Tech University 4 0 3 21 0 102 3
McNeese State University 2 1 0 12 0 61 1
Nicholls State University 0 5 2 23 0 89 1
Northwestern State University 1 6 2 24 0 152 3
Southeastern Louisiana University 8 1 1 14 0 69 3
Southern University and A&M College 0 0 0 48 0 2 2
Southern University at New Orleans 1 0 0 18 0 4 5
University of Louisiana at Lafayette 3 0 1 15 0 90 7
University of Louisiana at Monroe 1 0 0 14 0 58 3
University of New Orleans 3 1 5 20 0 144 10
PRIVATE UNIVERSITIES
Centenary College 3 0 1 4 0 44 1
Louisiana College 0 2 0 32 0 95 2
Tulane University 1 0 2 3 0 64 3
University of Holy Cross 1 1 0 4 0 19 0
Xavier University of Louisiana 0 0 1 9 0 3 2
PRIVATE PROVIDERS Louisiana Resource Center for Educators 2 0 0 19 0 92 3
The New Teacher Project 10 0 8 69 0 175 10

15
NUMBER OF HOURS FOR CLINICAL EXPERIENCES FOR TEACHER
PREPARATION PROGRAMS
UNDERGRADUATE PROGRAMS (2012-13)
The Board of Elementary and Secondary Education (BESE) requires teacher candidates to spend a
minimum of 270 clock hours in student teaching, with at least 180 of such hours spent in actual teaching.
BESE requires that a substantial portion of the 180 hours be on an all-day basis. In addition to the student
teaching experience, BESE states that students should be provided actual teaching experience (in addition
to observations) in classroom settings during the sophomore, junior, and senior years within schools with
varied socioeconomic and cultural characteristics. It is recommended by BESE that pre-service teachers
be provided a minimum of 180 hours of direct teaching experience in field-based settings prior to student
teaching. Student teaching generally occurs during one semester with a student being supervised by an
experienced classroom teacher.
Information provided below identifies the actual number of clock hours required by each teacher
preparation program prior to student teaching and during student teaching. The actual clock hours
required by programs for student teaching ranges from 400 to 600 clock hours which exceeds the
number of clock hours required by BESE. The actual number of clock hours required by programs
prior to student teaching ranges from 180 to 330 which also exceed the number of clock hours identified
by BESE.
Undergraduate
Teacher Preparation Programs
Clock Hours
Prior to
Student
Teaching
Student Teaching
Number of
Weeks
Number of
Clock Hours
per Week
Total
Number of
Clock Hours
PUBLIC UNIVERSITIES
Grambling State University 180 14 35 490
Louisiana State University at
Alexandria
198
14
35
490
Louisiana State University and A&M
College
180
14
35
490
Louisiana State University at
Shreveport
180
15
30
450
Louisiana Tech University 330 10 40 400
McNeese State University 273 14 30 420
Nicholls State University 180 15 40 600
Northwestern State University 260 15 35 525
Southeastern Louisiana University 180 15 40 600
Southern University and A&M
College
180
14
35
490
Southern University at New Orleans 180 10 40 400
University of Louisiana at Lafayette 180 14 35 490
University of Louisiana at Monroe 180 15 35 525
University of New Orleans 180 15 35 525
PRIVATE UNIVERSITIES
Louisiana College 215 16 30 480
University of Holy Cross 240 14 35 490
Xavier University of Louisiana 180 15 35 525
16
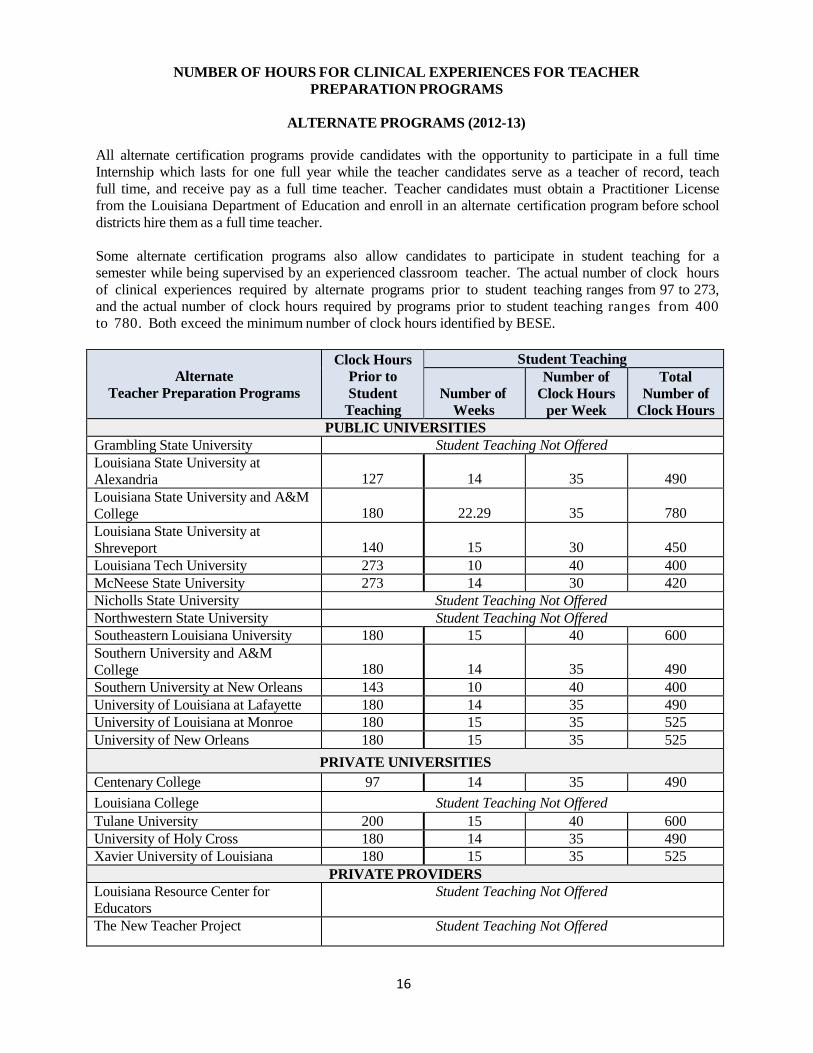
NUMBER OF HOURS FOR CLINICAL EXPERIENCES FOR TEACHER
PREPARATION PROGRAMS
ALTERNATE PROGRAMS (2012-13)
All alternate certification programs provide candidates with the opportunity to participate in a full time
Internship which lasts for one full year while the teacher candidates serve as a teacher of record, teach
full time, and receive pay as a full time teacher. Teacher candidates must obtain a Practitioner License
from the Louisiana Department of Education and enroll in an alternate certification program before school
districts hire them as a full time teacher.
Some alternate certification programs also allow candidates to participate in student teaching for a
semester while being supervised by an experienced classroom teacher. The actual number of clock hours
of clinical experiences required by alternate programs prior to student teaching ranges from 97 to 273,
and the actual number of clock hours required by programs prior to student teaching ranges from 400
to 780. Both exceed the minimum number of clock hours identified by BESE.
Alternate
Teacher Preparation Programs
Clock Hours
Prior to
Student
Teaching
Student Teaching
Number of
Weeks
Number of
Clock Hours
per Week
Total
Number of
Clock Hours
PUBLIC UNIVERSITIES
Grambling State University Student Teaching Not Offered
Louisiana State University at
Alexandria
127
14
35
490
Louisiana State University and A&M
College
180
22.29
35
780
Louisiana State University at
Shreveport
140
15
30
450
Louisiana Tech University 273 10 40 400
McNeese State University 273 14 30 420
Nicholls State University Student Teaching Not Offered
Northwestern State University Student Teaching Not Offered
Southeastern Louisiana University 180 15 40 600
Southern University and A&M
College
180
14
35
490
Southern University at New Orleans 143 10 40 400
University of Louisiana at Lafayette 180 14 35 490
University of Louisiana at Monroe 180 15 35 525
University of New Orleans 180 15 35 525
PRIVATE UNIVERSITIES
Centenary College 97 14 35 490
Louisiana College Student Teaching Not Offered
Tulane University 200 15 40 600
University of Holy Cross 180 14 35 490
Xavier University of Louisiana 180 15 35 525
PRIVATE PROVIDERS
Louisiana Resource Center for
Educators
Student Teaching Not Offered
The New Teacher Project Student Teaching Not Offered

17
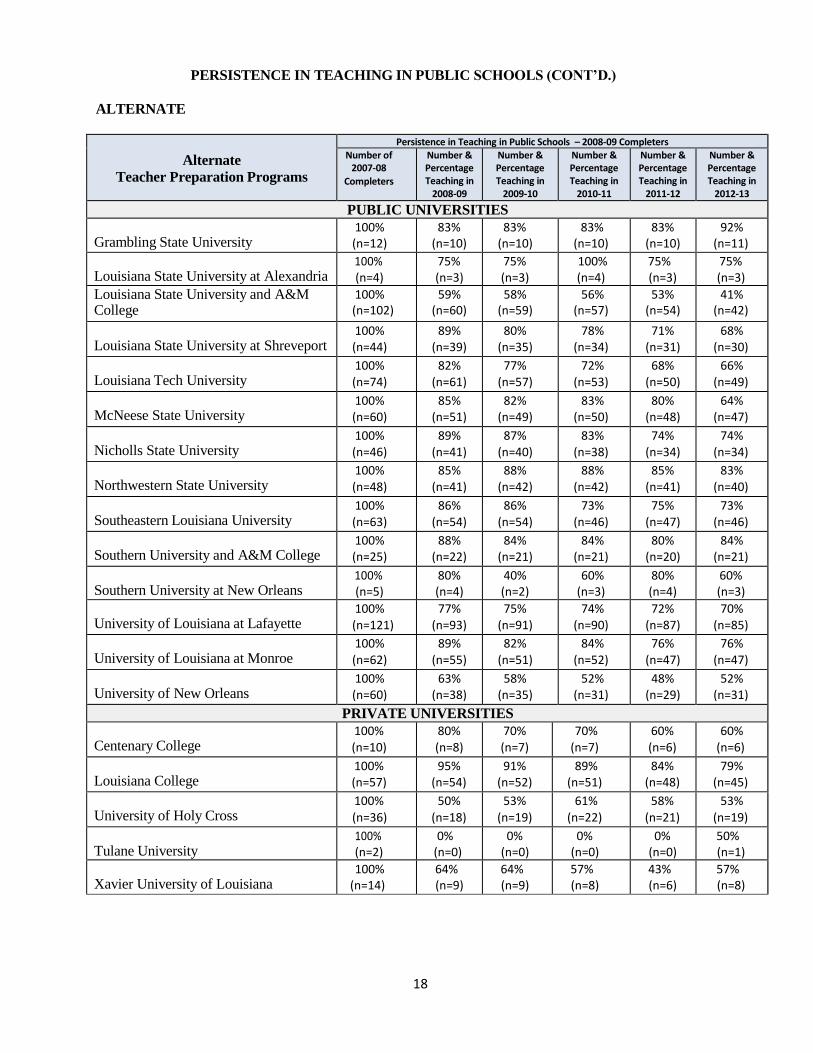
PERSISTENCE IN TEACHING IN PUBLIC SCHOOLS
Undergraduate and alternate program completers have the option of teaching in public schools in
Louisiana, private schools in Louisiana, or schools in other states. It is not possible to track the retention
of completers in private schools or out-of-state schools. The following two charts identify only the
number and percentage of a cohort of program completers in 2008-09 who started teaching in public
schools and who taught in public schools in Louisiana during the next five years. Completers not
reflected in the following chart may be teaching in private schools in Louisiana or teaching in other
states.
UNDERGRADUATE
Undergraduate
Teacher Preparation Programs
Persistence in Teaching in Public Schools – 2008-09 Completers
Number of 2008-09
Completers
Number & Percentage Teaching in
2009-10
Number & Percentage Teaching in
2010-11
Number & Percentage Teaching in
2011-12
Number & Percentage Teaching in
2012-13
Number & Percentage Teaching in
2013-14
PUBLIC UNIVERSITIES
Grambling State University 100% (n=18)
72% (n=13)
72% (n=13)
61% (n=11)
61% (n=11)
59% (n=10)
Louisiana State University at Alexandria 100% (n=21)
86% (n=18)
91% (n=19)
91% (n=19)
91% (n=19)
91% (n=19)
Louisiana State University and A&M College
100% (n=151)
52% (n=79)
50% (n=76)
47% (n=71)
46% (n=69)
49% (n=74)
Louisiana State University at Shreveport 100% (n=74)
85% (n=63)
82% (n=61)
76% (n=56)
74% (n=55)
70% (n=52)
Louisiana Tech University 100% (n=107)
61% (n=65)
67% (n=72)
64% (n=69)
64% (n=68)
55% (n=59)
McNeese State University 100% (n=108)
71% (n=77)
68% (n=73)
70% (n=76)
63% (n=68)
63% (n=68)
Nicholls State University 100% (n=86)
88% (n=76)
83% (n=71)
84% (n=72)
80% (n=69)
77% (n=66)
Northwestern State University 100% (n=64)
63% (n=40)
64% (n=41)
63% (n=40)
64% (n=41)
59% (n=38)
Southeastern Louisiana University 100%
(n=181) 67%
(n=122) 68%
(n=123) 69%
(n=125) 72%
(n=131) 73%
(n=133)
Southern University and A&M College 100% (n=34)
82% (n=28)
88% (n=30)
74% (n=25)
74% (n=25)
74% (n=25)
Southern University at New Orleans 100% (n=12)
33% (n=4)
50% (n=6)
50% (n=6)
50% (n=6)
50% (n=6)
University of Louisiana at Lafayette 100%
(n=194) 76%
(n=148) 72%
(n=139) 72%
(n=140) 72%
(n=140) 68%
(n=132)
University of Louisiana at Monroe 100% (n=63)
76% (n=48)
70% (n=44)
68% (n=43)
67% (n=42)
65% (n=41)
University of New Orleans 100% (n=44)
68% (n=30)
68% (n=30)
57% (n=25)
64% (n=28)
59% (n=26)
PRIVATE UNIVERSITIES
Louisiana College 100% (n=15)
60% (n=9)
60% (n=9)
53% (n=8)
47% (n=7)
47% (n=7)
University of Holy Cross 100% (n=20)
50% (n=10)
50% (n=10)
45% (n=9)
45% (n=9)
45% (n=9)
Xavier University of Louisiana 100% (n=6)
83% (n=5)
83% (n=5)
83% (n=5)
100% (n=6)
100% (n=6)
18
PERSISTENCE IN TEACHING IN PUBLIC SCHOOLS (CONT’D.)
ALTERNATE
Alternate
Teacher Preparation Programs
Persistence in Teaching in Public Schools – 2008-09 Completers Number of
2007-08
Completers
Number & Percentage Teaching in
2008-09
Number & Percentage Teaching in
2009-10
Number & Percentage Teaching in
2010-11
Number & Percentage Teaching in
2011-12
Number & Percentage Teaching in
2012-13
PUBLIC UNIVERSITIES
Grambling State University 100% (n=12)
83% (n=10)
83% (n=10)
83% (n=10)
83% (n=10)
92% (n=11)
Louisiana State University at Alexandria 100% (n=4)
75% (n=3)
75% (n=3)
100% (n=4)
75% (n=3)
75% (n=3)
Louisiana State University and A&M College
100% (n=102)
59% (n=60)
58% (n=59)
56% (n=57)
53% (n=54)
41% (n=42)
Louisiana State University at Shreveport 100% (n=44)
89% (n=39)
80% (n=35)
78% (n=34)
71% (n=31)
68% (n=30)
Louisiana Tech University 100% (n=74)
82% (n=61)
77% (n=57)
72% (n=53)
68% (n=50)
66% (n=49)
McNeese State University 100% (n=60)
85% (n=51)
82% (n=49)
83% (n=50)
80% (n=48)
64% (n=47)
Nicholls State University 100% (n=46)
89% (n=41)
87% (n=40)
83% (n=38)
74% (n=34)
74% (n=34)
Northwestern State University 100% (n=48)
85% (n=41)
88% (n=42)
88% (n=42)
85% (n=41)
83% (n=40)
Southeastern Louisiana University 100% (n=63)
86% (n=54)
86% (n=54)
73% (n=46)
75% (n=47)
73% (n=46)
Southern University and A&M College 100% (n=25)
88% (n=22)
84% (n=21)
84% (n=21)
80% (n=20)
84% (n=21)
Southern University at New Orleans 100% (n=5)
80% (n=4)
40% (n=2)
60% (n=3)
80% (n=4)
60% (n=3)
University of Louisiana at Lafayette 100% (n=121)
77% (n=93)
75% (n=91)
74% (n=90)
72% (n=87)
70% (n=85)
University of Louisiana at Monroe 100% (n=62)
89% (n=55)
82% (n=51)
84% (n=52)
76% (n=47)
76% (n=47)
University of New Orleans 100% (n=60)
63% (n=38)
58% (n=35)
52% (n=31)
48% (n=29)
52% (n=31)
PRIVATE UNIVERSITIES
Centenary College 100% (n=10)
80% (n=8)
70% (n=7)
70% (n=7)
60% (n=6)
60% (n=6)
Louisiana College 100% (n=57)
95% (n=54)
91% (n=52)
89% (n=51)
84% (n=48)
79% (n=45)
University of Holy Cross 100%
(n=36)
50%
(n=18)
53%
(n=19)
61%
(n=22)
58%
(n=21)
53%
(n=19)
Tulane University 100% (n=2)
0% (n=0)
0% (n=0)
0% (n=0)
0% (n=0)
50% (n=1)
Xavier University of Louisiana 100%
(n=14) 64% (n=9)
64% (n=9)
57% (n=8)
43% (n=6)
57% (n=8)

19
PERSISTENCE IN TEACHING IN PUBLIC SCHOOLS (CONT’D.)
ALTERNATE (CONT’D.)
Alternate
Teacher Preparation Programs
Persistence in Teaching in Public Schools – 2008-09 Completers
Number of 2007-08
Completers
Number & Percentage Teaching in
2008-09
Number & Percentage Teaching in
2009-10
Number & Percentage Teaching in
2010-11
Number & Percentage Teaching in
2011-12
Number & Percentage Teaching in
2012-13
PRIVATE PROVIDERS
Louisiana Resource Center for Educators 100%
(n=168) 74%
(n=125) 72%
(n=121) 67%
(n=112) 64%
(n=107) 61%
(n=102)
The New Teacher Project 100% (n=288)
93% (n=268)
56% (n=160)
41% (n=118)
32% (n=93)
31% (n=90)

20
NUMBER AND PERCENTAGE OF 2012-13 COMPLETERS WHO BEGAN TEACHING IN
PUBLIC SCHOOLS IN LOUISIANA DURING 2013-14
The numbers of undergraduate and alternate completers who completed in 2012-13 and began teaching in
public schools in Louisiana in 2013-14 are listed below. Teacher candidates completers who began
teaching in private schools in Louisiana or began teaching in other states during 2013-14 are not
listed below.
Teacher Preparation Programs
Undergraduate Completers Alternate Completers
Number &
Percentage
Completed in
2012-13
Number &
Percentage
Teaching in
Public Schools
in 2013-14
Number &
Percentage
Completed in
2012-13
Number &
Percentage
Teaching in
Public Schools
in 2013-14
PUBLIC UNIVERSITIES
Grambling State University 100% (n=19) 47% (n=9) 100% (n=4) 75% (n=3) Louisiana State University at Alexandria
100% (n=18)
78% (n=14)
100% (n=4)
100% (n=4) Louisiana State University and A&M College
100% (n=240)
50% (n=120)
100% (n=83)
60% (n=50) Louisiana State University at Shreveport
100% (n=47)
72% (n=34)
100% (n=30)
73% (n=22)
Louisiana Tech University 100% (n=79) 63% (n=50) 100% (n=96) 68% (n=65) McNeese State University 100% (n=116) 74% (n=86) 100% (n=50) 76% (n=38) Nicholls State University 100% (n=101) 88% (n=89) 100% (n=38) 79% (n=30) Northwestern State University 100% (n=69) 64% (n=44) 100% (n=67) 84%(n=56) Southeastern Louisiana University 100% (n=231) 72% (n=167) 100% (n=46) 76% (n=35) Southern University and A&M College
100% (n=20)
80% (n=16)
100% (n=25)
88% (n=22)
Southern University at New Orleans
100% (n=12)
92% (n=11)
100% (n=14)
71% (n=10) University of Louisiana at Lafayette
100% (n=200)
72% (n=143)
100% (n=96)
64% (n=61) University of Louisiana at Monroe 100% (n=66) 65% (n=43) 100% (n=32) 69% (n=22) University of New Orleans 100% (n=45) 62% (n=28) 100% (n=81) 73% (n=59)
PRIVATE UNIVERSITIES
Centenary College 100% (n=12) 75% (n=9) 100% (n=24) 67% (n=16) Louisiana College 100% (n=10) 80% (n=8) 100% (n=141) 82% (n=116) Tulane University 100% (n=29) 45% (n=13) University of Holy Cross 100% (n=22) 41% (n=9) 100% (n=39) 26% (n=10)
Xavier University of Louisiana 100% (n=3) 33% (n=1) 100% (n=14) 71% (n=10) PRIVATE PROVIDERS
Louisiana Resource Center for Educators
100% (n=157)
73% (n=115) The New Teacher Project 100% (n=163) 83% (n=135)

21
MEANS AND EFFECTIVENESS LEVELS FOR COMPASS FINAL EVALUATION SCORES BY
UNDERGRADUATE PROGRAMS FOR FIRST AND SECOND YEAR TEACHERS
IN 2012-13 AND 2013-14
The Louisiana Department of Education states that “Compass” is Louisiana’s educator support and
evaluation system designed to provide all educators with regular, meaningful feedback on their
performance (http://www.louisianabelieves.com/teaching/compass). Under this system, every teacher in
public schools in Louisiana is evaluated annually using a four-tiered rating – Highly Effective, Effective:
Proficient, Effective: Emerging, and Ineffective. Half of the evaluation is based on achievement of
student learning targets to generate the Compass Student Outcome score and half of the evaluation is
based on observations by teachers’ supervisors using the appropriate Compass rubric to generate a
Compass Professional Practice score. The two scores are combined to generate Compass Final
Evaluation Scores that range from 1.00 to 4.00.
The first chart on the next page identifies the mean Compass Final Evaluation scores of all first and
second year teachers who taught in 2012-13 and 2013-14 and completed undergraduate teacher
preparation programs during or before 2012-13. In addition, it identifies the percentage of first and
second year teachers who obtained Compass Final Evaluation scores in each of the four effectiveness
levels after completing their undergraduate teacher preparation programs.
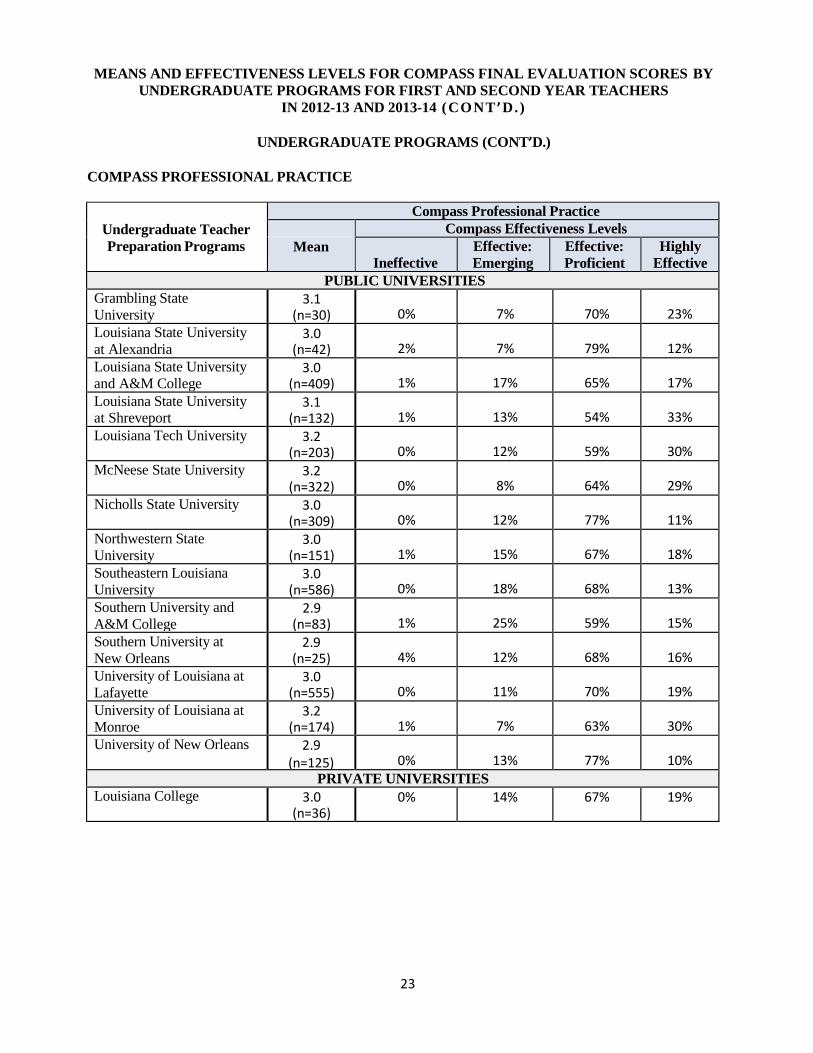
The next chart identifies the mean Compass Professional Practice scores of all first and second year
teachers who taught in 2012-13 a n d 2 0 1 3 - 14 and completed undergraduate teacher preparation
programs during or before 2012-13. In addition, it identifies the percentage of first and second year
teachers who obtained Compass Professional Practices scores in each of the four effectiveness levels
after completing their undergraduate teacher preparation programs.
The third chart identifies the mean Compass Student Growth scores of all first and second year teachers
who taught in 2012-13 and 2013-14 and completed undergraduate teacher preparation programs during or
before 2012-2013. In addition, it identifies the percentage of first and second year teachers who obtained
Compass Student Growth scores in each of the four effectiveness levels after completing their
undergraduate teacher preparation programs.
.

22
MEANS AND EFFECTIVENESS LEVELS FOR COMPASS FINAL EVALUATION SCORES BY
UNDERGRADUATE PROGRAMS FOR FIRST AND SECOND YEAR TEACHERS
IN 2012-13 AND 2013-14 (CONT ’D.)
UNDERGRADUATE PROGRAMS
COMPASS FINAL EVALUATION
Undergraduate Teacher
Preparation Programs
Compass Final Evaluation
Mean Compass Effectiveness Levels
Ineffective Effective:
Emerging
Effective:
Proficient
Highly
Effective
PUBLIC UNIVERSITIES
Grambling State
University 3.0
(n=30)
3%
10%
67%
20%
Louisiana State University
at Alexandria 2.9
(n=42)
10%
10%
62%
19%
Louisiana State University
and A&M College 3.0
(n=409)
3%
14%
60%
24%
Louisiana State University
at Shreveport 3.2
(n=132)
2%
14%
49%
35%
Louisiana Tech University 3.2 (n=203)
3%
9%
51%
37%
McNeese State University 3.2 (n=322)
3%
6%
54%
37%
Nicholls State University 3.1 (n=309)
3%
9%
68%
20%
Northwestern State
University 3.0
(n=151)
5%
11%
62%
23%
Southeastern Louisiana
University 3.0
(n=586)
4%
11%
65%
21%
Southern University and
A&M College 3.0
(n=83)
4%
17%
57%
23%
Southern University at
New Orleans 2.8
(n=25)
8%
16%
64%
12%
University of Louisiana at
Lafayette 3.1
(n=555)
5%
8%
61%
26%
University of Louisiana at
Monroe 3.2
(n=174)
4%
9%
56%
32%
University of New Orleans 3.0 (n=125)
2%
10%
78%
10%
PRIVATE UNIVERSITIES
Louisiana College 3.2 (n=36)
3% 6% 61% 31%
23
MEANS AND EFFECTIVENESS LEVELS FOR COMPASS FINAL EVALUATION SCORES BY
UNDERGRADUATE PROGRAMS FOR FIRST AND SECOND YEAR TEACHERS
IN 2012-13 AND 2013-14 (CONT ’D.)
UNDERGRADUATE PROGRAMS (CONT’D.)
COMPASS PROFESSIONAL PRACTICE
Undergraduate Teacher
Preparation Programs
Compass Professional Practice
Compass Effectiveness Levels
Mean
Ineffective Effective:
Emerging
Effective:
Proficient
Highly
Effective
PUBLIC UNIVERSITIES
Grambling State
University 3.1
(n=30)
0%
7%
70%
23%
Louisiana State University
at Alexandria 3.0
(n=42)
2%
7%
79%
12%
Louisiana State University
and A&M College 3.0
(n=409)
1%
17%
65%
17%
Louisiana State University at Shreveport
3.1 (n=132)
1%
13%
54%
33%
Louisiana Tech University 3.2 (n=203)
0%
12%
59%
30%
McNeese State University 3.2 (n=322)
0%
8%
64%
29%
Nicholls State University 3.0 (n=309)
0%
12%
77%
11%
Northwestern State
University 3.0
(n=151)
1%
15%
67%
18%
Southeastern Louisiana
University 3.0
(n=586)
0%
18%
68%
13%
Southern University and
A&M College 2.9
(n=83)
1%
25%
59%
15%
Southern University at
New Orleans 2.9
(n=25)
4%
12%
68%
16%
University of Louisiana at
Lafayette 3.0
(n=555)
0%
11%
70%
19%
University of Louisiana at
Monroe 3.2
(n=174)
1%
7%
63%
30% University of New Orleans 2.9
(n=125)
0%
13%
77%
10%
PRIVATE UNIVERSITIES
Louisiana College 3.0 (n=36)
0% 14% 67% 19%

24
MEANS AND EFFECTIVENESS LEVELS FOR COMPASS FINAL EVALUATION SCORES BY
UNDERGRADUATE PROGRAMS FOR FIRST AND SECOND YEAR TEACHERS
IN 2012-13 AND 2013-14 (CONT ’D.)
UNDERGRADUATE PROGRAMS (CONT’D.)
COMPASS STUDENT GROWTH
Undergraduate Teacher
Preparation Programs
Compass Student Growth
Compass Effectiveness Levels
Mean
Ineffective Effective:
Emerging
Effective:
Proficient
Highly
Effective
PUBLIC UNIVERSITIES
Grambling State
University 3.1
(n=30)
3%
10%
43%
43% Louisiana State University
at Alexandria 3.1
(n=42)
7%
12%
33%
48%
Louisiana State University
and A&M College 3.2
(n=409)
2%
14%
34%
50%
Louisiana State University
at Shreveport 3.2
(n=132)
2%
17%
28%
53%
Louisiana Tech University 3.3 (n=203)
3%
10%
28%
60%
McNeese State University 3.3 (n=322)
3%
7%
32%
58%
Nicholls State University 3.2 (n=309)
3%
14%
32%
51%
Northwestern State
University 3.2
(n=151)
4%
13%
32%
52%
Southeastern Louisiana
University 3.2
(n=586)
3%
13%
35%
49%
Southern University and
A&M College 3.1
(n=83)
2%
19%
31%
47%
Southern University at
New Orleans 2.8
(n=25)
8%
16%
44%
32%
University of Louisiana at
Lafayette 3.1
(n=555)
5%
13%
36%
46%
University of Louisiana at
Monroe 3.2
(n=174)
4%
14%
32%
51% University of New Orleans 3.1
(n=125)
2%
17%
39%
42% PRIVATE UNIVERSITIES
Louisiana College 3.3 (n=36)
3% 3% 39% 56%

25
MEANS AND EFFECTIVENESS LEVELS FOR COMPASS EVALUATION SCORES BY
ALTERNATE PROGRAMS FOR FIRST AND SECOND YEAR TEACHERS
IN 2012-13 AND 2013-14
The Louisiana Department of Education states that Compass is Louisiana’s educator support and
evaluation system designed to provide all educators with regular, meaningful feedback on their
performance (http://www.louisianabelieves.com/teaching/compass). Under this system, every teacher in
public schools in Louisiana is evaluated annually using a four-tiered rating – Highly Effective, Effective:
Proficient, Effective: Emerging, and Ineffective. Half of the evaluation is based on achievement of
student learning targets to generate the Compass Student Outcome score and half of the evaluation is
based on observations by their supervisor using the appropriate Compass rubric to generate a Compass
Professional Practice score. The two scores are averaged to generate a Compass Final Evaluation Scores
that ranges from 1.00 to 4.00.
The chart on the next page identifies the mean Compass Final Evaluation scores of all first and second
year teachers who taught in 2012-13 and 2013-14 and completed alternate teacher preparation programs
during or before 2012-13. In addition, it identifies the percentage of first and second year teachers who
obtained Compass Final Evaluation scores in each of the four effectiveness levels after completing their
alternate teacher preparation programs.
The next chart identifies the mean Compass Professional Practice scores of all first and second year teachers
who taught in 2012-13 and 2013 - 14 and completed alternate teacher preparation programs during or
before 2012-13. In addition, the following chart identifies the percentage of first and second year teachers
who obtained Compass Professional Practices scores in each of the four effectiveness levels after
completing their alternate teacher preparation programs.
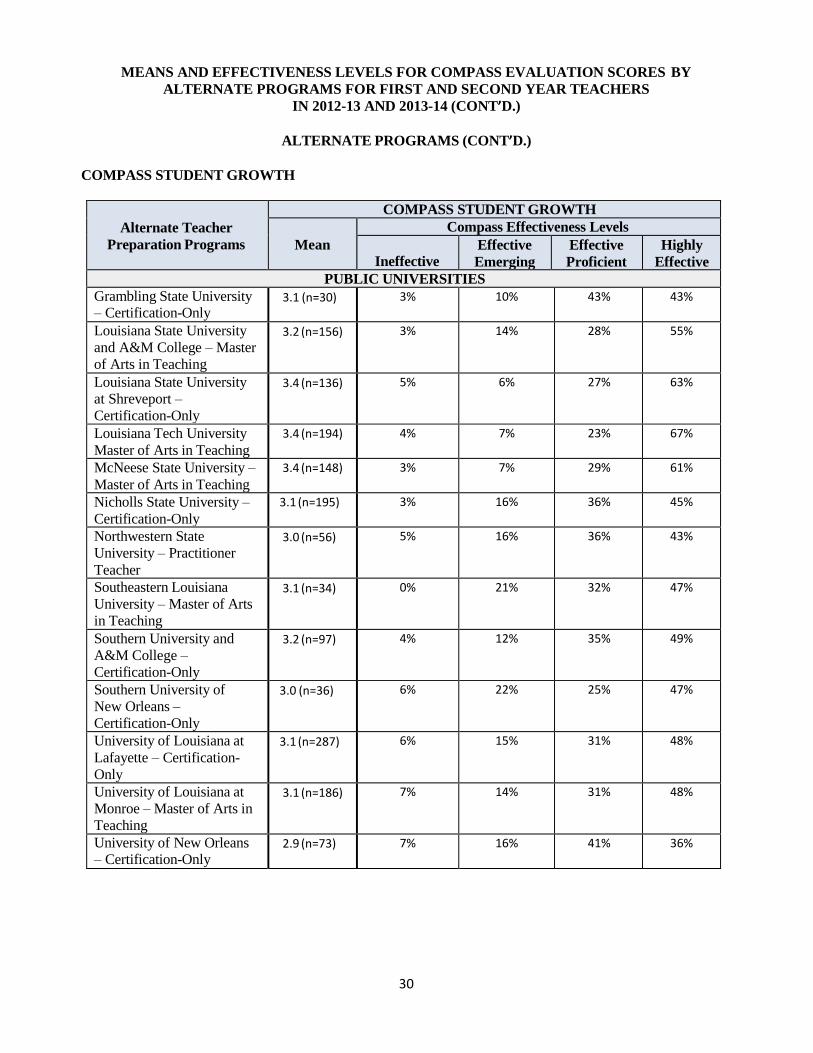
The last chart identifies the mean Compass Student Growth scores of all first and second year teachers
who taught in 2012-13 and 2013 -14 and completed alternate teacher preparation programs during or
before 2012-13. In addition, it identifies the percentage of first and second year teachers who obtained
Compass Student Growth scores in each of the four effectiveness levels after completing their alternate
teacher preparation programs.

26
MEANS AND EFFECTIVENESS LEVELS FOR COMPASS EVALUATION SCORES BY
ALTERNATE PROGRAMS FOR FIRST AND SECOND YEAR TEACHERS
IN 2012-13 AND 2013-14 (CONT’D.)
ALTERNATE PROGRAMS
COMPASS FINAL EVALUATION
COMPASS FINAL EVALUATION
Alternate Teacher
Preparation Programs
Mean
Compass Effectiveness Levels
Ineffective Effective
Emerging
Effective
Proficient
Highly
Effective
PUBLIC UNIVERSITIES
Louisiana State University
and A&M College – Master
of Arts in Teaching
3.2 (n=156) 4% 10% 54% 33%
Louisiana State University
at Shreveport –
Certification-Only
3.3 (n=136) 5% 4% 43% 48%
Louisiana Tech University
– Certification-Only 3.2 (n=67) 5% 8% 48% 40%
Louisiana Tech University - Master of Arts in
Teaching
3.4 (n=194) 4% 4% 41% 51%
McNeese State University –
Master of Arts in Teaching 3.3 (n=148) 3% 4% 50% 43%
Nicholls State University –
Certification-Only 3.0 (n=195) 3% 13% 62% 22%
Northwestern State
University – Practitioner
Teacher Program
3.0 (n=56) 7% 7% 64% 21%
Southeastern Louisiana
University – Master of Arts
in Teaching
3.2 (n=34) 0% 3% 74% 24%
Southern University and
A&M College –
Certification-Only
3.1 (n=97) 4% 8% 64% 24%
Southern University at
New Orleans –
Certification-Only
2.9 (n=36) 6% 17% 56% 22%
University of Louisiana at
Lafayette – Certification-
Only
3.1 (n=287) 6% 10% 58% 27%
University of Louisiana at
Monroe – Master of Arts in
Teaching
3.1 (n=186) 7% 6% 54% 33%
University of New Orleans – Certification-Only
3.0 (n=73) 8% 10% 60% 22%

27
MEANS AND EFFECTIVENESS LEVELS FOR COMPASS EVALUATION SCORES BY
ALTERNATE PROGRAMS FOR FIRST AND SECOND YEAR TEACHERS
IN 2012-13 AND 2013-14 (CONT’D.)
ALTERNATE PROGRAMS (CONT’D.)
COMPASS FINAL EVALUATION (CONT’D.)
COMPASS FINAL EVALUATION
Alternate Teacher
Preparation Programs
Mean
Compass Effectiveness Levels
Ineffective Effective
Emerging
Effective
Proficient
Highly
Effective
PRIVATE UNIVERSITIES
Centenary College
– Masters of Arts in
Teaching
3.3 (n=32) 0% 3% 63% 34%
Louisiana College -
Practitioner Teacher
3.2 (n=411) 2% 9% 53% 37%
Tulane University – Certification Only
3.0 (n=28) 4% 14% 61% 21%
University of Holy
Cross –Certification Only
3.0 (n=45) 4% 7% 76% 13%
Xavier University – Master of Arts in Teaching
2.8 (n=40) 5% 20% 65% 10%
PRIVATE PROVIDERS
Louisiana Resource Center
for Educators - Practitioner
Teacher
3.2 (n=373) 1% 8% 65% 26%
The New Teacher Project – Practitioner Teacher
Program
2.9 (n=429) 7% 12% 63% 18%

28
MEANS AND EFFECTIVENESS LEVELS FOR COMPASS EVALUATION SCORES BY
ALTERNATE PROGRAMS FOR FIRST AND SECOND YEAR TEACHERS
IN 2012-13 AND 2013-14 (CONT’D.)
ALTERNATE PROGRAMS (CONT’D.)
COMPASS PROFESSIONAL PRACTICE
Alternate Teacher
Preparation Program
COMPASS PROFESSIONAL PRACTICE
Mean Compass Effectiveness Levels
Ineffective Effective
Emerging
Effective
Proficient
Highly
Effective
PUBLIC UNIVERSITIES
Louisiana State University
and A&M College – Master
of Arts in Teaching
3.0 (n=156) 1% 13% 67% 20%
Louisiana State University
at Shreveport –
Certification-Only
3.4 (n=136) 0% 2% 52% 46%
Louisiana Tech University
– Certification-Only
3.3 (n=67) 0% 8% 52% 40%
Louisiana Tech University
Master of Arts in Teaching
3.3 (n=194) 0% 4% 58% 38%
McNeese State University –
Master of Arts in Teaching
3.3 (n=148) 0% 7% 53% 41%
Nicholls State University –
Certification-Only
3.0 (n=195) 0% 12% 72% 16%
Northwestern State
University – Practitioner
Teacher
3.1 (n=56) 2% 11% 65% 25%
Southeastern Louisiana
University – Master of Arts
in Teaching
3.1 (n=34) 0% 15% 65% 21%
Southern University and
A&M College –
Certification-Only
3.0 (n=97) 0% 118% 67% 16%
Southern University at
New Orleans 3.0 (n=36) 0% 8% 78% 14%
University of Louisiana at
Lafayette – Certification-
Only
3.0 (n=287) 1% 12% 70% 18%
University of Louisiana at
Monroe – Master of Arts in
Teaching
3.2 (n=186) 0% 5% 67% 29%
University of New Orleans – Certification-Only
3.0 (n=73) 1% 16% 69% 23%

29
MEANS AND EFFECTIVENESS LEVELS FOR COMPASS EVALUATION SCORES BY
ALTERNATE PROGRAMS FOR FIRST AND SECOND YEAR TEACHERS
IN 2012-13 AND 2013-14 (CONT’D.)
ALTERNATE PROGRAMS (CONT’D.)
COMPASS PROFESSIONAL PRACTICE (CONT’D.)
Alternate Teacher
Preparation Program
COMPASS PROFESSIONAL PRACTICE
Mean Compass Effectiveness Levels
Ineffective Effective
Emerging
Effective
Proficient
Highly
Effective
PRIVATE UNIVERSITIES
Centenary College
– Master of Arts in
Teaching
3.3 (n=32) 0% 6% 53% 41%
Louisiana College -
Practitioner Teacher
3..2 (n=411) 0% 9% 62% 29%
Tulane University 3.0 (n=28) 0% 18% 68% 14%
University of Holy
Cross – Certification-Only
3.1 (n=45) 2% 9% 67% 22%
Xavier University – Master of Arts in Teaching
3.0 (n=40) 0% 18% 73% 10%
PRIVATE PROVIDERS
Louisiana Resource Center
for Educators - Practitioner
Teacher
3.1 (n=373) 0% 12% 67% 21%
The New Teacher Project
– Practitioner Teacher
Program
3.0 (n=429) 0% 12% 73% 15%
30
MEANS AND EFFECTIVENESS LEVELS FOR COMPASS EVALUATION SCORES BY
ALTERNATE PROGRAMS FOR FIRST AND SECOND YEAR TEACHERS
IN 2012-13 AND 2013-14 (CONT’D.)
ALTERNATE PROGRAMS (CONT’D.)
COMPASS STUDENT GROWTH
Alternate Teacher
Preparation Programs
COMPASS STUDENT GROWTH
Mean Compass Effectiveness Levels
Ineffective Effective
Emerging
Effective
Proficient
Highly
Effective
PUBLIC UNIVERSITIES
Grambling State University – Certification-Only
3.1 (n=30) 3% 10% 43% 43%
Louisiana State University
and A&M College – Master
of Arts in Teaching
3.2 (n=156) 3% 14% 28% 55%
Louisiana State University
at Shreveport –
Certification-Only
3.4 (n=136) 5% 6% 27% 63%
Louisiana Tech University
Master of Arts in Teaching
3.4 (n=194) 4% 7% 23% 67%
McNeese State University –
Master of Arts in Teaching
3.4 (n=148) 3% 7% 29% 61%
Nicholls State University –
Certification-Only
3.1 (n=195) 3% 16% 36% 45%
Northwestern State
University – Practitioner
Teacher
3.0 (n=56) 5% 16% 36% 43%
Southeastern Louisiana
University – Master of Arts
in Teaching
3.1 (n=34) 0% 21% 32% 47%
Southern University and
A&M College –
Certification-Only
3.2 (n=97) 4% 12% 35% 49%
Southern University of
New Orleans –
Certification-Only
3.0 (n=36) 6% 22% 25% 47%
University of Louisiana at
Lafayette – Certification-
Only
3.1 (n=287) 6% 15% 31% 48%
University of Louisiana at
Monroe – Master of Arts in
Teaching
3.1 (n=186) 7% 14% 31% 48%
University of New Orleans – Certification-Only
2.9 (n=73) 7% 16% 41% 36%

31
MEANS AND EFFECTIVENESS LEVELS FOR COMPASS EVALUATION SCORES BY
ALTERNATE PROGRAMS FOR FIRST AND SECOND YEAR TEACHERS
IN 2012-13 AND 2013-14 (CONT’D.)
ALTERNATE PROGRAMS (CONT’D.)
COMPASS STUDENT GROWTH (CONT’D.)
Alternate Teacher
Preparation Programs
COMPASS STUDENT GROWTH
Mean Compass Effectiveness Levels
Ineffective Effective
Emerging
Effective
Proficient
Highly
Effective
PRIVATE UNIVERSITIES
Centenary College-
Master of Arts in
Teaching
3.2 (n=32) 0% 13% 41% 47%
Louisiana College –
Practitioner Teacher
3.20 (n=411) 2% 13% 34% 52%
Tulane University –
Certification Only
3.2 (n=28) 4% 18% 25% 54%
University of Holy
Cross
2.9 (n=45) 4% 24% 42% 29%
Xavier University 2.8 (n=40) 5% 23% 48% 25%
PRIVATE PROVIDERS
Louisiana Resource Center
for Educators – Practitioner
Teacher
3.2 (n=373) 1% 16% 36% 52%
The New Teacher Project –
Practitioner Teacher
Program
2.9 (n=429) 7% 18% 41% 34%

32
VALUE-ADDED EVALUATION OF LOUISIANA TEACHER PREPARATION PROGRAMS FOR
ACADEMIC YEARS 2009-2010, 2010-11, 2011-12, 2012-13, AND 2013-2014
Value-added scores have been calculated by the Louisiana Department of Education for all teachers
whose students are assessed for mathematics (grades 4-10), science (grades 4-8), social studies (grades
4-8), and English language arts (grades 4-8). Value-added scores have been identified for first and
second year teachers who have completed Elementary (Grades 1-5), Middle School (Grades 4-8), or
Secondary (Grades 6-12) teacher preparation programs and are teaching in the areas of certification that
they were prepared to teach. Data have only been provided if there are 25 or more value-added scores
for first and second year teachers for each content area. In some cases, the same teacher may have
value-added scores for different content areas. As an example, an elementary teacher is responsible for
teaching math, science, social studies, and language arts and the same teacher may have a value-added
score listed for each of those areas. Thus, 25 scores listed for math, 25 scores listed for science, 25 scores
listed for social studies, and 25 scores listed for English language arts may actually represent 25 elementary
teachers instead of 100 different teachers. In the case of a middle school teacher responsible for
teaching science, they will have a value-added score calculated for their students just in the area of
science and scores could represent different teachers.
The value-added score means were calculated using the Louisiana department of Education hierarchical
linear model which is described at the following URL: http://www.louisianabelieves.com/teaching/value-
added-model.
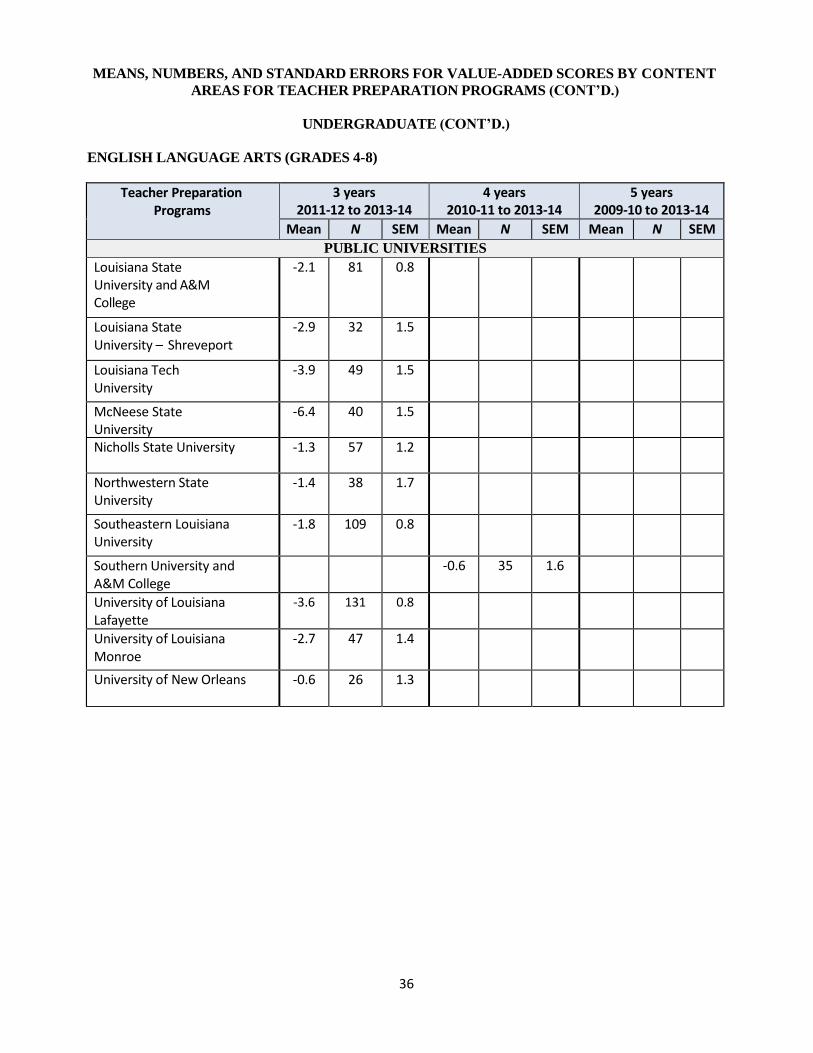
On the following pages, all means describe the performance of the teacher preparation programs listed in
the left column. The means, Ns, and standard errors of the mean appear in the same row for each group.
The value added score means were calculated using the Louisiana department of Education hierarchical
linear model which is described at the following URL: http://www.louisianabelieves.com/teaching/value-
added-model. The value-added scores are rounded to the nearest tenth of a point. The means for new
teachers are calculated for all teachers in a given content area who are teaching in their first or second
year. If a program had 25 or more new teachers with 3 years of data, the 3-year means are reported. If
four- or five-years of data were needed to generate a minimum of 25 scores for a content area, the means
represented the four- or five-years of data. Teachers from Louisiana teacher preparation programs are
only counted as new from a teacher preparation program if they entered as a first year teacher within five
years or less from their program completion date. Data are not reported if institutions have less than 25
new teachers in a content area.
The Louisiana Department of Education has prepared tables that identify the distribution of value-added
scores for all individual teachers for each academic year across the four teacher effectiveness levels for
the Compass teacher evaluation system. The distribution table for 2013-14 has been provided below. As
an example, if a teacher obtained a value-added score of 1.9 in Language Arts based upon the growth of
achievement of their students, the score would be in the Effective Proficient range. If they obtained a
value-added score of -11.6 in Language Arts, their value-added score would be in the Ineffective range.
Transitional Student Growth Data for All Individual Teachers (Compass) in Public Schools in Louisiana
Individual Teacher Labels For State Teacher Evaluation System
(Compass)
Distribution of Transitional Student Growth Data Scores for all Individual Teachers (2013-14)
Percentile Ranges of Transitional Student Growth
Language Arts Mathematics Science Social Studies Data Scores for all Individual Teachers
Highly Effective 7.5 and higher 12.5 & higher 6.5 & higher 6.5 & higher 80th percentile and above
Effective Proficient 0.5 to 7.4 -0.4 to 12.4 .-0.4 to 6.4 -0.4 to 6.4 50th to 79th percentile
Effective Emerging -11.4 to 0.4 -19.4 to -0.5 -9.4 to -0.5 -10.4 to -0.5 11th to 49th percentile
Ineffective -11.5 & Lower -19.5 & Lower -9.5 & lower -10.5 & Lower At or below 10th percentile

33
MEANS, NUMBERS, AND STANDARD ERRORS FOR VALUE-ADDED SCORES BY CONTENT
AREAS FOR TEACHER PREPARATION PROGRAMS (CONT’D.)
UNDERGRADUATE
MATHEMATICS (GRADES 4-10)
Teacher Preparation Programs
3 years 2011-12 to 2013-14
4 years 2010-11 to 2013-14
5 years 2009-10 to 2013-14
Mean N SEM Mean N SEM Mean N SEM
PUBLIC UNIVERSITIES
Louisiana State University and A&M College
1.1 77 1.6
Louisiana State University – Shreveport
-0.9 33 2.6
Louisiana Tech University
-4.0 52 1.8
McNeese State University
-9.9 41 1.7
Nicholls State University 0.1 40 1.8
Northwestern State University
-3.7 29 2.5
Southeastern Louisiana University
-4.0 75 1.5
Southern University and A&M College
3.3 25 2.5
University of Louisiana Lafayette
-4.1 123 1.3
University of Louisiana Monroe
-4.6 33 2.2
University of New Orleans 1.0 34 2.1

34
MEANS, NUMBERS, AND STANDARD ERRORS FOR VALUE-ADDED SCORES BY CONTENT
AREAS FOR TEACHER PREPARATION PROGRAMS (CONT’D.)
UNDERGRADUATE (CONT’D.)
SCIENCE (GRADES 4-8)
Teacher Preparation Programs
3 years 2011-12 to 2013-14
4 years 2010-11 to 2013-14
5 years 2009-10 to 2013-14
Mean N SEM Mean N SEM Mean N SEM
PUBLIC UNIVERSITIES
Louisiana State University and A&M College
0.0 57 0.9
Louisiana State University – Shreveport
0.3 34 1.5
Louisiana Tech University
-1.2 35 1.5
McNeese State University
-2.7 34 1.0
Nicholls State University -1.2 34 1.2
Northwestern State University
-0.4 31 1.3
Southeastern Louisiana University
-1.3 62 0.9
Southern University and A&M College
-1.6 34 1.7
University of Louisiana Lafayette
-2.2 92 0.8
University of Louisiana Monroe
-1.3 27 1.5
University of New Orleans 1.7 26 1.2

35
MEANS, NUMBERS, AND STANDARD ERRORS FOR VALUE-ADDED SCORES BY CONTENT
AREAS FOR TEACHER PREPARATION PROGRAMS (CONT’D.)
UNDERGRADUATE (CONT’D.)
SOCIAL STUDIES (GRADES 4-8)
Teacher Preparation Programs
3 years 2011-12 to 2013-14
4 years 2010-11 to 2013-14
5 years 2009-10 to 2013-14
Mean N SEM Mean N SEM Mean N SEM
PUBLIC UNIVERSITIES
Louisiana State University and A&M College
-0.3 57 1.0
Louisiana State University – Shreveport
-2.5 30 1.8
Louisiana Tech University
-3.4 32 1.4
McNeese State University
-2.6 31 1.3
Nicholls State University -3.1 47 1.4
Northwestern State University
0.3 31 1.5
Southeastern Louisiana University
-2.6 89 1.0
Southern University and A&M College
0.6 28 2.2
University of Louisiana Lafayette
-4.6 99 1.1
University of Louisiana Monroe
-3.1 27 2.0
University of New Orleans -0.9 27 1.4
36
MEANS, NUMBERS, AND STANDARD ERRORS FOR VALUE-ADDED SCORES BY CONTENT
AREAS FOR TEACHER PREPARATION PROGRAMS (CONT’D.)
UNDERGRADUATE (CONT’D.)
ENGLISH LANGUAGE ARTS (GRADES 4-8)
Teacher Preparation Programs
3 years 2011-12 to 2013-14
4 years 2010-11 to 2013-14
5 years 2009-10 to 2013-14
Mean N SEM Mean N SEM Mean N SEM
PUBLIC UNIVERSITIES
Louisiana State University and A&M College
-2.1 81 0.8
Louisiana State University – Shreveport
-2.9 32 1.5
Louisiana Tech University
-3.9 49 1.5
McNeese State University
-6.4 40 1.5
Nicholls State University -1.3 57 1.2
Northwestern State University
-1.4 38 1.7
Southeastern Louisiana University
-1.8 109 0.8
Southern University and A&M College
-0.6 35 1.6
University of Louisiana Lafayette
-3.6 131 0.8
University of Louisiana Monroe
-2.7 47 1.4
University of New Orleans -0.6 26 1.3

37
MEANS, NUMBERS, AND STANDARD ERRORS FOR VALUE-ADDED SCORES BY CONTENT
AREAS FOR TEACHER PREPARATION PROGRAMS
MATHEMATICS (GRADES 4-10)
ALTERNATE
Teacher Preparation Programs
3 years 2011-12 to 2013-14
4 years 2010-11 to 2013-14
5 years 2009-10 to 2013-14
Mean N SEM Mean N SEM Mean N SEM
PUBLIC UNIVERSITIES
Louisiana State University – Master of Arts in Teaching
4.8 39 2.6
Louisiana State University – Shreveport – Certification-Only
-3.5 26 2.4
Louisiana Tech University – Certification-Only
-6.4 25 2.4
Louisiana Tech University - Master of Arts in Teaching
-4.2 37 2.0
McNeese State University – Master of Arts in Teaching
-2.7 31 2.1
Nicholls State University – Certification-Only
-0.2 47 2.0
Northwestern State University – Practitioner Teacher Program
0.1 31 1.8
Southeastern Louisiana University – Master of Arts in Teaching
-1.6 33 2.4
Southern University and A&M College – Certification-Only
1.6 26 2.3
University of Louisiana – Lafayette – Certification-Only
-3.5 57 1.7
University of Louisiana - Monroe – Master of Arts in Teaching
-2.9 35 2.3
University of New Orleans – Certification-Only
3.2 25 2.0
PRIVATE UNIVERSITIES
Louisiana College – Practitioner Teacher Program
0.1 93 1.8
PRIVATE PROVIDERS
Louisiana Resource Center for Educators – Practitioner Teacher Program
1.5 95 1.3
The New Teacher Project – Practitioner Teacher Program
7.6 107 1.5

38
MEANS, NUMBERS, AND STANDARD ERRORS FOR VALUE-ADDED SCORES BY CONTENT
AREAS FOR TEACHER PREPARATION PROGRAMS (CONT’D.)
ALTERNATE PROGRAMS (CONT’D.)
SCIENCE (GRADES 4-8)
Teacher Preparation Programs
3 years 2011-12 to 2013-14
4 years 2010-11 to 2013-14
5 years 2009-10 to 2013-14
Mean N SEM Mean N SEM Mean N SEM
PUBLIC UNIVERSITIES
Louisiana State University – Master of Arts in Teaching
2.3 30 1.4
Louisiana State University – Shreveport – Certification-Only
-0.3 28 1.4
Louisiana Tech University – Certification-Only
-1.6 25 1.0
Louisiana Tech University - Master of Arts in Teaching
-2.3 28 1.8
McNeese State University – Master of Arts in Teaching
-2.0 31 1.4
Nicholls State University – Certification-Only
-2.4 35 1.0
Northwestern State University – Practitioner Teacher Program
1.1 30 1.5
University of Louisiana – Lafayette – Certification-Only
0.1 48 0.9
University of Louisiana - Monroe – Master of Arts in Teaching
-1.3 38 0.8
PRIVATE UNIVERSITIES
Louisiana College – Practitioner Teacher Program
-1.6 75 0.9
PRIVATE PROVIDERS
Louisiana Resource Center for Educators – Practitioner Teacher Program
1.7 62 0.9
The New Teacher Project – Practitioner Teacher Program
2.4 68 1.3

39
MEANS, NUMBERS, AND STANDARD ERRORS FOR VALUE-ADDED SCORES BY CONTENT
AREAS FOR TEACHER PREPARATION PROGRAMS (CONT’D.)
ALTERNATE (CONT’D.)
SOCIAL STUDIES (GRADES 4-8)
Teacher Preparation Programs
3 years 2011-12 to 2013-14
4 years 2010-11 to 2013-14
5 years 2009-10 to 2013-14
Mean N SEM Mean N SEM Mean N SEM
PUBLIC UNIVERSITIES
Louisiana State University – Master of Arts in Teaching
4.2 34 1.4
Louisiana State University – Shreveport – Certification-Only
1.3 34 1.7
Louisiana Tech University – Certification-Only
-5.6 25 2.0
Louisiana Tech University Master of Arts in Teaching
-4.8 31 1.7
McNeese State University – Master of Arts in Teaching
-1.7 31 1.9
Nicholls State University – Certification-Only
-4.3 31 1.7
Southern University and A&M College
3.4 25 1.5
University of Louisiana – Lafayette – Certification-Only
-2.1 66 1.2
University of Louisiana - Monroe – Master of Arts in Teaching
-4.6 26 1.8
PRIVATE UNIVERSITIES
Louisiana College – Practitioner Teacher Program
-0.2 76 1.2
PRIVATE PROVIDERS
Louisiana Resource Center for Educators – Practitioner Teacher Program
0.7 57 1.3
The New Teacher Project – Practitioner Teacher Program
9.7 55 1.8

40
MEANS, NUMBERS, AND STANDARD ERRORS FOR VALUE-ADDED SCORES BY CONTENT
AREAS FOR TEACHER PREPARATION PROGRAMS (CONT’D.)
ALTERNATE PROGRAMS (CONT’D.)
ENGLISH LANGUAGE ARTS (GRADES 4-8)
Teacher Preparation Programs
3 years 2011-12 to 2013-14
4 years 2010-11 to 2013-14
5 years 2009-10 to 2013-14
Mean N SEM Mean N SEM Mean N SEM
PUBLIC UNIVERSITIES
Louisiana State University – Master of Arts in Teaching
1.4 33 1.3
Louisiana State University – Shreveport – Certification-Only
0.3 39 1.6
Louisiana Tech University – Certification-Only
-2.2 32 1.4
Louisiana Tech University Master of Arts in Teaching
-1.9 35 1.6
McNeese State University – Master of Arts in Teaching
-3.7 32 1.6
Nicholls State University – Certification-Only
-1.4 52 1.1
Northwestern State University – Practitioner Teacher Program
-0.5 36 1.8
Southeastern Louisiana University – Master of Arts in Teaching
2.1 27 2.2
Southern University and A&M College
0.6 27 1.2
University of Holy Cross – Certification-Only
0.4 25 1.8
University of Louisiana – Lafayette – Certification-Only
-2.0 -81 0.9
University of Louisiana - Monroe – Master of Arts in Teaching
-1.5 33 1.3
University of New Orleans – Certification-Only
1.7 26 1.8
PRIVATE UNIVERSITIES
Louisiana College – Practitioner Teacher Program
-2.0 99 1.3
University of Holy Cross – Certification-Only
0.4 25 1.8

41
MEANS, NUMBERS, AND STANDARD ERRORS FOR VALUE-ADDED SCORES BY CONTENT
AREAS FOR TEACHER PREPARATION PROGRAMS (CONT’D.)
ALTERNATE PROGRAMS (CONT’D.)
ENGLISH LANGUAGE ARTS (GRADES 4-8) (CONT’D.)
Teacher Preparation Programs
3 years 2011-12 to 2013-14
4 years 2010-11 to 2013-14
5 years 2009-10 to 2013-14
Mean N SEM Mean N SEM Mean N SEM
PRIVATE PROVIDERS
Louisiana Resource Center for Educators – Practitioner Teacher Program
-0.7 82 0.9
The New Teacher Project – Practitioner Teacher
2.5 99 0.9
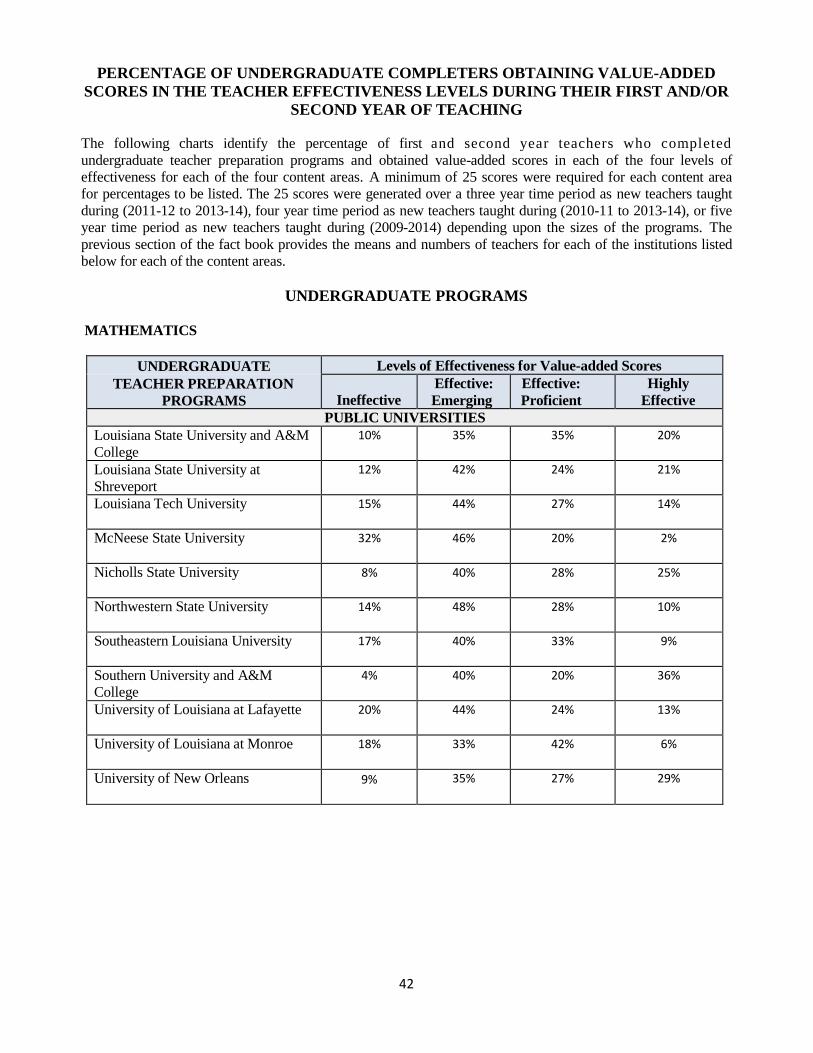
42
PERCENTAGE OF UNDERGRADUATE COMPLETERS OBTAINING VALUE-ADDED
SCORES IN THE TEACHER EFFECTIVENESS LEVELS DURING THEIR FIRST AND/OR
SECOND YEAR OF TEACHING
The following charts identify the percentage of first and second year teachers who completed
undergraduate teacher preparation programs and obtained value-added scores in each of the four levels of
effectiveness for each of the four content areas. A minimum of 25 scores were required for each content area
for percentages to be listed. The 25 scores were generated over a three year time period as new teachers taught
during (2011-12 to 2013-14), four year time period as new teachers taught during (2010-11 to 2013-14), or five
year time period as new teachers taught during (2009-2014) depending upon the sizes of the programs. The
previous section of the fact book provides the means and numbers of teachers for each of the institutions listed
below for each of the content areas.
UNDERGRADUATE PROGRAMS
MATHEMATICS
UNDERGRADUATE Levels of Effectiveness for Value-added Scores
TEACHER PREPARATION
PROGRAMS
Ineffective Effective:
Emerging
Effective:
Proficient
Highly
Effective
PUBLIC UNIVERSITIES
Louisiana State University and A&M
College
10% 35% 35% 20%
Louisiana State University at
Shreveport
12% 42% 24% 21%
Louisiana Tech University 15% 44% 27% 14%
McNeese State University 32% 46% 20% 2%
Nicholls State University 8% 40% 28% 25%
Northwestern State University 14% 48% 28% 10%
Southeastern Louisiana University 17% 40% 33% 9%
Southern University and A&M
College
4% 40% 20% 36%
University of Louisiana at Lafayette 20% 44% 24% 13%
University of Louisiana at Monroe 18% 33% 42% 6%
University of New Orleans 9% 35% 27% 29%

43
PERCENTAGE OF UNDERGRADUATE COMPLETERS OBTAINING VALUE-ADDED
SCORES IN THE TEACHER EFFECTIVENESS LEVELS DURING THEIR FIRST AND/OR
SECOND YEAR OF TEACHING (CONT’D.)
UNDERGRADUATE PROGRAMS (CONT’D.)
SCIENCE
UNDERGRADUATE Levels of Effectiveness for Value-added Scores
TEACHER PREPARATION
PROGRAMS
Ineffective Effective:
Emerging
Effective:
Proficient
Highly
Effective
PUBLIC UNIVERSITIES
Louisiana State University and A&M
College
11% 33% 37% 19%
Louisiana State University at
Shreveport
12% 24% 38% 27%
Louisiana Tech University 14% 40% 26% 20%
McNeese State University 12% 50% 35% 3%
Nicholls State University 6% 47% 38% 9%
Northwestern State University 10% 42% 23% 26%
Southeastern Louisiana University 8% 44% 40% 8%
Southern University and A&M
College
18% 38% 24% 21%
University of Louisiana at Lafayette 11% 48% 29% 12%
University of Louisiana at Monroe 11% 33% 41% 15%
University of New Orleans 0% 39% 46% 15%

44
PERCENTAGE OF UNDERGRADUATE COMPLETERS OBTAINING VALUE-ADDED
SCORES IN THE TEACHER EFFECTIVENESS LEVELS DURING THEIR FIRST AND/OR
SECOND YEAR OF TEACHING (CONT’D.)
UNDERGRADUATE PROGRAMS (CONT’D.)
SOCIAL STUDIES
UNDERGRADUATE Levels of Effectiveness for Value-added Scores
TEACHER PREPARATION
PROGRAMS
Ineffective Effective:
Emerging
Effective:
Proficient
Highly
Effective
PUBLIC UNIVERSITIES
Louisiana State University and A&M
College
4% 51% 33% 12%
Louisiana State University at
Shreveport
7% 57% 27% 10%
Louisiana Tech University 9% 59% 19% 13%
McNeese State University 7% 55% 26% 13%
Nicholls State University 15% 47% 21% 17%
Northwestern State University 0% 45% 39% 16%
Southeastern Louisiana University 15% 48% 26% 11%
Southern University and A&M
College
11% 36% 29% 25%
University of Louisiana at Lafayette 16% 47% 25% 12%
University of Louisiana at Monroe 7% 59% 15% 19%
University of New Orleans 7% 41% 44% 7%

45
PERCENTAGE OF UNDERGRADUATE COMPLETERS OBTAINING VALUE-ADDED
SCORES IN THE TEACHER EFFECTIVENESS LEVELS DURING THEIR FIRST AND/OR
SECOND YEAR OF TEACHING (CONT’D.)
UNDERGRADUATE PROGRAMS (CONT’D.)
ENGLISH LANGUAGE ARTS
UNDERGRADUATE Levels of Effectiveness for Value-added Scores
TEACHER PREPATION
PROGRAMS
Ineffective Effective:
Emerging
Effective:
Proficient
Highly
Effective
PUBLIC UNIVERSITIES
Louisiana State University and A&M
College
12% 53% 25% 10%
Louisiana State University at
Shreveport
13% 60% 13% 16%
Louisiana Tech University 14% 57% 12% 16%
McNeese State University 28% 48% 23% 3%
Nicholls State University 16% 37% 26% 21%
Northwestern State University 13% 40% 29% 18%
Southeastern Louisiana University 10% 50% 29% 11%
Southern University and A&M
College
9% 46% 20% 26%
University of Louisiana at Lafayette 18% 47% 23% 12%
University of Louisiana at Monroe 17% 47% 23% 13%
University of New Orleans 8% 39% 42% 12%

46
PERCENTAGE OF ALTERNATE COMPLETERS OBTAINING VALUE-ADDED SCORES
IN THE TEACHER EFFECTIVENESS LEVELS DURING THEIR FIRST AND/OR
SECOND YEAR OF TEACHING
The following charts identify the percentage of first and second year teachers who completed alternate
teacher preparation programs and obtained value-added scores in each of the four levels of effectiveness for
each of the four content areas. A minimum of 25 scores were required for each content area for percentages to
be listed. The 25 scores were generated over a three year time period as new teachers taught during (2011-12
to 2013-14), four year time period as new teachers taught during (2010-11 to 2013-14), or five year time
period as new teachers taught during (2009-10 to 2013-14) depending upon the sizes of the programs. The
previous section of the fact book provides the means and numbers of teachers for each of the institutions listed
below for each of the content areas.
ALTERNATE PROGRAMS
MATHEMATICS
ALTERNATE Levels of Effectiveness for Value-added Scores
TEACHER PREPARATION
PROGRAMS
Ineffective Effective:
Emerging
Effective:
Proficient
Highly
Effective
PUBLIC UNIVERSITIES
Louisiana State University and A&M
College – Master of Arts in Teaching
10% 23% 33% 33%
Louisiana State University at
Shreveport – Certification-
Only
23% 27% 35% 15%
Louisiana Tech University – Master of Arts in Teaching
11% 60% 19% 11%
Louisiana Tech University – Certification-Only
20% 44% 28% 8%
McNeese State University – Master of Arts in Teaching
13% 55% 16% 16%
Nicholls State University – Certification-Only
13% 34% 34% 19%
Northwestern State University – Practitioner Teacher Program
3% 52% 29% 16%
Southeastern Louisiana University – Master of Arts in Teaching
9% 49% 27% 15%
Southern University and A&M
College – Certification-Only
8% 39% 19% 35%
University of Louisiana at Lafayette – Certification-Only
14% 44% 26% 11%
University of Louisiana at Monroe – Master of Arts in Teaching
23% 34% 31% 11%
University of New Orleans – Certification-Only
0% 36% 44% 20%
PRIVATE UNIVERSITIES
Louisiana College - Practitioner Teacher Program
15% 40% 22% 24%
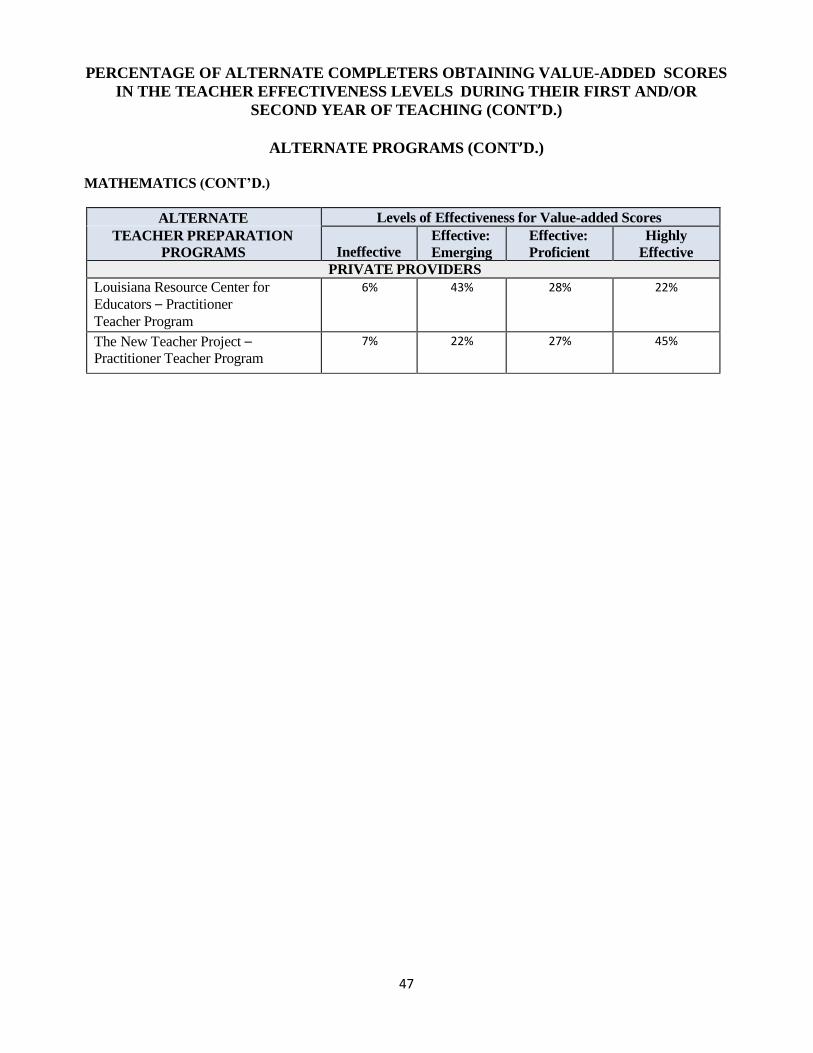
47
PERCENTAGE OF ALTERNATE COMPLETERS OBTAINING VALUE-ADDED SCORES
IN THE TEACHER EFFECTIVENESS LEVELS DURING THEIR FIRST AND/OR
SECOND YEAR OF TEACHING (CONT’D.)
ALTERNATE PROGRAMS (CONT’D.)
MATHEMATICS (CONT’D.)
ALTERNATE Levels of Effectiveness for Value-added Scores
TEACHER PREPARATION
PROGRAMS
Ineffective Effective:
Emerging
Effective:
Proficient
Highly
Effective
PRIVATE PROVIDERS
Louisiana Resource Center for
Educators – Practitioner
Teacher Program
6% 43% 28% 22%
The New Teacher Project – Practitioner Teacher Program
7% 22% 27% 45%
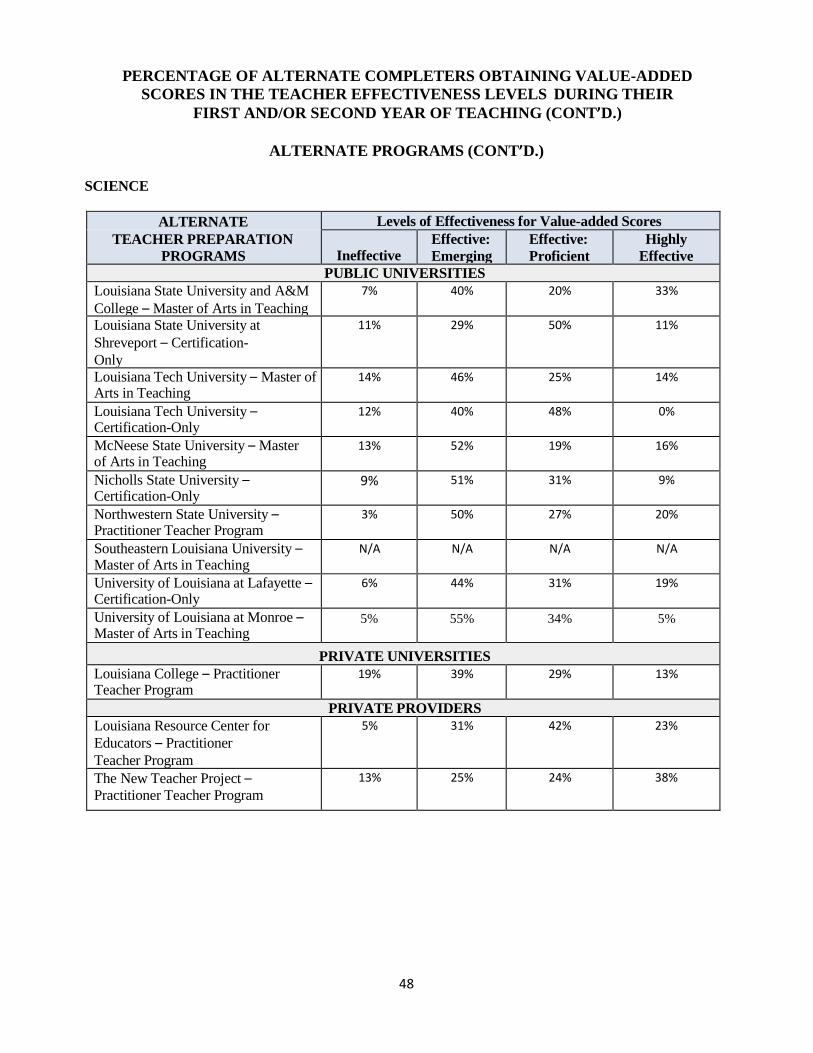
48
PERCENTAGE OF ALTERNATE COMPLETERS OBTAINING VALUE-ADDED
SCORES IN THE TEACHER EFFECTIVENESS LEVELS DURING THEIR
FIRST AND/OR SECOND YEAR OF TEACHING (CONT’D.)
ALTERNATE PROGRAMS (CONT’D.)
SCIENCE
ALTERNATE Levels of Effectiveness for Value-added Scores
TEACHER PREPARATION
PROGRAMS
Ineffective Effective:
Emerging
Effective:
Proficient
Highly
Effective
PUBLIC UNIVERSITIES
Louisiana State University and A&M
College – Master of Arts in Teaching
7% 40% 20% 33%
Louisiana State University at
Shreveport – Certification-
Only
11% 29% 50% 11%
Louisiana Tech University – Master of Arts in Teaching
14% 46% 25% 14%
Louisiana Tech University – Certification-Only
12% 40% 48% 0%
McNeese State University – Master of Arts in Teaching
13% 52% 19% 16%
Nicholls State University – Certification-Only
9% 51% 31% 9%
Northwestern State University – Practitioner Teacher Program
3% 50% 27% 20%
Southeastern Louisiana University – Master of Arts in Teaching
N/A N/A N/A N/A
University of Louisiana at Lafayette – Certification-Only
6% 44% 31% 19%
University of Louisiana at Monroe – Master of Arts in Teaching
5% 55% 34% 5%
PRIVATE UNIVERSITIES
Louisiana College – Practitioner Teacher Program
19% 39% 29% 13%
PRIVATE PROVIDERS
Louisiana Resource Center for
Educators – Practitioner
Teacher Program
5% 31% 42% 23%
The New Teacher Project – Practitioner Teacher Program
13% 25% 24% 38%
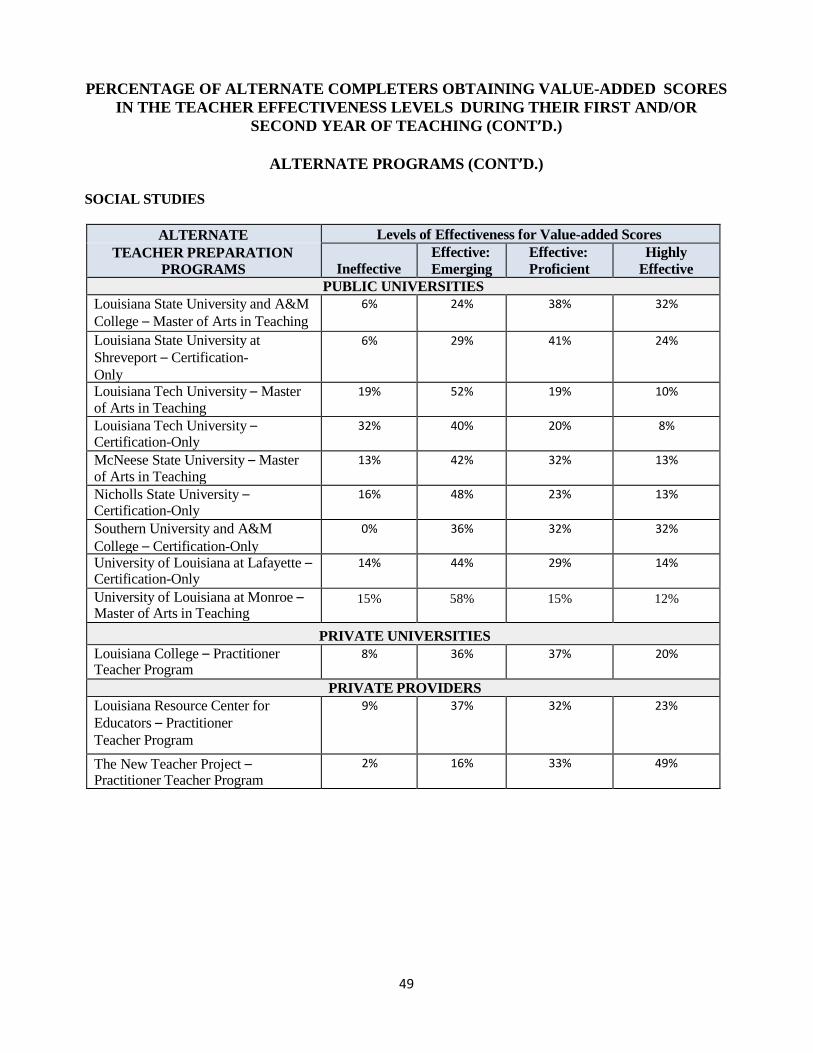
49
PERCENTAGE OF ALTERNATE COMPLETERS OBTAINING VALUE-ADDED SCORES
IN THE TEACHER EFFECTIVENESS LEVELS DURING THEIR FIRST AND/OR
SECOND YEAR OF TEACHING (CONT’D.)
ALTERNATE PROGRAMS (CONT’D.)
SOCIAL STUDIES
ALTERNATE Levels of Effectiveness for Value-added Scores
TEACHER PREPARATION
PROGRAMS
Ineffective Effective:
Emerging
Effective:
Proficient
Highly
Effective
PUBLIC UNIVERSITIES
Louisiana State University and A&M
College – Master of Arts in Teaching
6% 24% 38% 32%
Louisiana State University at
Shreveport – Certification-
Only
6% 29% 41% 24%
Louisiana Tech University – Master of Arts in Teaching
19% 52% 19% 10%
Louisiana Tech University – Certification-Only
32% 40% 20% 8%
McNeese State University – Master of Arts in Teaching
13% 42% 32% 13%
Nicholls State University – Certification-Only
16% 48% 23% 13%
Southern University and A&M
College – Certification-Only
0% 36% 32% 32%
University of Louisiana at Lafayette – Certification-Only
14% 44% 29% 14%
University of Louisiana at Monroe – Master of Arts in Teaching
15% 58% 15% 12%
PRIVATE UNIVERSITIES
Louisiana College – Practitioner Teacher Program
8% 36% 37% 20%
PRIVATE PROVIDERS
Louisiana Resource Center for
Educators – Practitioner
Teacher Program
9% 37% 32% 23%
The New Teacher Project – Practitioner Teacher Program
2% 16% 33% 49%

50
PERCENTAGE OF ALTERNATE COMPLETERS OBTAINING VALUE-ADDED SCORES IN
THE TEACHER EFFECTIVENESS LEVELS DURING THEIR FIRST AND/OR SECOND
YEAR OF TEACHING (CONT’D.)
ALTERNATE PROGRAMS (CONT’D.)
ENGLISH LANGUAGE ARTS
ALTERNATE Levels of Effectiveness for Value-added Scores
TEACHER PREPARATION
PROGRAMS
Ineffective Effective:
Emerging
Effective:
Proficient
Highly
Effective
PUBLIC AND PRIVATE UNIVERSITIES
Louisiana State University and A&M
College – Master of Arts in Teaching
0% 49% 30% 21%
Louisiana State University at
Shreveport – Certification-
Only
8% 44% 33% 15%
Louisiana Tech University – Master of Arts in Teaching
14% 46% 20% 20%
Louisiana Tech University – Certification-Only
16% 38% 38% 9%
McNeese State University – Certification-Only
22% 41% 25% 13%
Nicholls State University – Certification-Only
12% 50% 25% 14%
Northwestern State University – Practitioner Teacher Program
19% 17% 36% 28%
Southeastern Louisiana University – Master of Arts in Teaching
7% 37% 33% 22%
Southern University and A&M
College – Certification-Only
4% 44% 33% 19%
University of Louisiana at Lafayette – Certification-Only
15% 42% 32% 11%
University of Louisiana at Monroe – Master of Arts in Teaching
6% 58% 21% 15%
University of New Orleans 8% 31% 35% 27%
PRIVATE UNIVERSITIES
Louisiana College – Practitioner Teacher Program
19% 38% 25% 17%
University of Holy Cross – Certification-Only
12% 32% 32% 24%
PRIVATE PROVIDERS
Louisiana Resource Center for
Educators – Practitioner
Teacher Program
12% 35% 39% 13%
The New Teacher Project – Practitioner Teacher Program
9% 26% 34% 30%

51
APPENDIX A
Teacher Preparation Program 2020 Key Effectiveness Indicators Teacher Preparation Analytics v 6.10.14
Assessment Categories
Key Indicators Measures
Candidate Selection Profile
Academic Strength
PRIOR ACHIEVEMENT—(1) For Undergraduate Programs: Non-education course GPA required for program admission. Mean and range of high school GPA percentile (or class rank) for candidates admitted as freshmen. Mean and tercile distribution of candidates’ SAT/ACT scores. GPA in major and overall required for program completion. Average percentile rank of completers’ GPA in their major at the university, by cohort. —(2) For Post-Baccalaureate Programs: Mean and range of candidates’ college GPA percentile and mean and tercile distribution of GRE scores TEST PERFORMANCE—For All Programs: Mean and tercile distribution of admitted candidate scores on rigorous national test of college sophomore-level general knowledge and reasoning skills
Teaching Promise ATTITUDES, VALUES, AND BEHAVIORS SCREEN—Percent of accepted program candidates whose score on a rigorous and validated “fitness for teaching” assessment demonstrates a strong promise for teaching
Candidate/Completer Diversity
DISAGGREGATED COMPLETIONS COMPARED TO ADMISSIONS—Number & percent of completers in newest graduating cohort AND number and percent of candidates originally admitted in that same cohort: overall and by race/ethnicity, age, and gender
Knowledge and
Skills for Teaching
Content Knowledge
CONTENT KNOWLEDGE TEST—Program completer mean score, tercile distribution, and pass rate on rigorous and validated nationally normed assessment of college-level content knowledge used for initial licensure
Pedagogical Content Knowledge
PEDAGOGICAL CONTENT KNOWLEDGE TEST—Program completer mean score, tercile distribution, and pass rate on rigorous and validated nationally normed assessment of comprehensive pedagogical content knowledge used for initial licensure
Teaching Skill
TEACHING SKILL PERFORMANCE TEST—Program completer mean score, tercile distribution, and pass rate on rigorous and validated nationally normed assessment of demonstrated teaching skill used for initial licensure

52
Teacher Preparation Program 2020 Key Effectiveness Indicators (Cont’d.) Teacher Preparation Analytics v 6.10.14
Assessment Categories
Key Indicators Measures
Completer Rating of
Program
EXIT AND FIRST YEAR COMPLETER SURVEY ON PREPARATION—State- or nationally-developed program completer survey of teaching preparedness and program quality, by cohort, upon program (including alternate route) completion and at end of first year of full-time teaching
Performance as Classroom Teachers
Impact on K-12
Students
TEACHER ASSESSMENTS BASED ON STUDENT LEARNING—Assessment of program completers or alternate route candidates during their first three years of full-time teaching using valid and rigorous student-learning driven measures, including value-added and other statewide comparative evidence of K-12 student growth overall and in low-income and low-performing schools
Demonstrated Teaching Skill
ASSESSMENTS OF TEACHING SKILL—Annual assessment based on observations of program completers’ or alternate route candidates’ first three years of full-time classroom teaching, using valid, reliable, and rigorous statewide instruments and protocols
K-12 Student Perceptions
STUDENT SURVEYS ON TEACHING PRACTICE—K-12 student surveys about completers’ or alternate route candidates’ teaching practice during first three years of full-time teaching, using valid and reliable statewide instruments
Program
Productivity, Alignment to State Needs
Entry and Persistence in
Teaching
TEACHING EMPLOYMENT AND PERSISTENCE—(1) Percent of completers or alternate route candidates, by cohort and gender–race-ethnicity, employed and persisting in teaching years 1-5 after program completion or initial alternate route placement, in-state and out-of-state —(2) Percent of completers attaining a second stage teaching license in states with multi-tiered licensure
Placement/ Persistence in High-
Need Subjects/Schools
HIGH-NEED EMPLOYMENT AND PERSISTENCE—Number & percent of completers or alternate route candidates, by cohort, employed and persisting in teaching in low-performing, low-income, or remote rural schools or in high need subjects years 1-5 after program completion or initial alternate route placement, in-state and out-of-state

``
APPENDIX B 2014 LOUISIANA TEACHER PREPARATION DATA DASHBOARD
[Name of University) Prepared by Louisiana Board of Regents [Name of University System]
[Public/Private] University [Undergraduate/Alternate] Teacher Preparation Program
BASIC PROGRAM INFORMATION Program Web Site Approval/Accreditation Names of Agencies Status
State: Board of Elementary and Secondary Education (BESE) State: Board of Regents (BoR) Regional: Southern Association of Colleges and Schools Commission on Colleges (SACSCOC)
National: National Council for Accreditation of Teacher Education (NCATE); Teacher Education Accreditation Council (TEAC); or Council for the Accreditation of Educator Preparation (CAEP)
Type of Program Traditional (Undergraduate)
CANDIDATE SELECTION PROFILE Academic Strength Completer Passage Rate on Praxis Skills Assessment (2012-13)
Median GPA of Candidates Entering the Program (2012-13) Median GPA of Candidates Completing the Program (2012-13) Number of Candidates who Started but Did not Complete the Program Within 6 Years (by 2012-13)
Teaching Promise Data not yet available.
Candidates/ Completer Diversity
Candidates (2012-13)
Enrolled Completers Total
Enrolled Gender
Males Females
Enrolled Race
Hispanic Indian Asian Black Islander White Multi-Racial
KNOWLEDGE AND SKILLS FOR TEACHING OF COMPLETERS
Knowledge Content Completer Passage Rate on Praxis Content Assessments (2012-13) Pedagogical Completer Passage Rate on Praxis Professional Knowledge Assessments (2012-13) Overall Completer Passage Rate on all Assessments (2012-13)
Clinical Experiences Student Teaching
Clock Hours of Clinical Experiences Prior to Student Teaching Clock Hours of Clinical Experiences During Student Teaching
Number of Weeks
Number of Clock Hours per Week
Total Number of Clock Hours
Licensure Requirements Percentage of 2012-13 Completers That Meet State Licensing Requirements Completer Rating Data Not Yet Available
PROGRAM PRODUCTIVITY AND ALIGNMENT TO STATE NEEDS OF COMPLETERS Entry and Persistence in Teaching in Public Schools in Louisiana
(Please examine the 2015 Louisiana Teacher Preparation Data Fact Book to accurately interpret the meaning of these scores.)
Percentage & Number of 2012-13 Completers That Began Teaching in 2013-14 Percentage & Number of 2012-13 Completers That Obtained a License to Teach
2008-09 Completers Teaching in Public Schools in Louisiana in 2009-10, 2010-11, 2011-12, 2012-13, and 2013-14 Number of
2008-09 Completers
Number & Percentage Teaching in
2009-10
Number & Percentage Teaching in
2010-11
Number & Percentage Teaching in
2011-12
Number & Percentage Teaching in
2012-13
Number & Percentage Teaching in
2013-14
Placement/Persistence in High-Need Subjects/Schools
Data Not Yet Available
53

``
APPENDIX B (CONT’D.) 2014 LOUISIANA TEACHER PREPARATION DATA DASHBOARD
[Name of University) Prepared by Louisiana Board of Regents [Name of University System] [Public/Private] University
[Undergraduate/Alternate] Teacher Preparation Program
PERFORMANCE AS CLASSROOM TEACHERS (NEW TEACHERS WITH LESS THAN TWO YEARS OF TEACHING) Impact on K-12 Students
(Please examine the 2015 Louisiana Teacher Preparation Data Fact Book to accurately interpret the meaning of these scores.)
Mean Compass Student Outcome Score (2012-13 & 2013-14) and Number of Scores for All New Teachers with Less than Two Years of Teaching
Compass Student Outcome Mean & Number of Scores
Percentage and Number of 2012- 13 and 2013-14 Compass Student Outcome Scores for the New Teachers by LDOE Teacher Effectiveness Levels
Compass Teacher Effectiveness Levels for Student Outcome Scores
Ineffective Effective Emerging Effective Proficient Highly Effective
Demonstrated Teaching Skill
(Please examine the 2015 Louisiana Teacher Preparation Data Fact Book to accurately interpret the meaning of these scores.)
Mean Compass Professional Practice Score (2012-13 & 2013- 14) and Number of Scores for All New Teachers with Less than Two Years of Teaching
Compass Professional Practice Mean & Number of Scores
Percentage and Number of 2012- 13 & 2013-14 Compass Professional Practice Scores for the New Teachers by LDOE Teacher Effectiveness Levels
Compass Teacher Effectiveness Levels for Professional Practice Scores
Ineffective Effective Emerging Effective Proficient Highly Effective
Overall Impact and Demonstrated Teaching Skill
(Please examine the 2015 Louisiana Teacher Preparation Data Fact Book to accurately interpret the meaning of these scores.)
Mean Compass Final Evaluation Score (2012-13 & 2013-14) and Number of Scores for New Teachers with Less than Two Years of Teaching
Compass Final Evaluation Mean & Number of Scores
Percentage and Number of 2012- 13 & 2013-14 Compass Final Evaluation Scores for the New Teachers by LDOE Teacher Effectiveness Levels
Compass Teacher Effectiveness Levels for Final Evaluation Scores
Ineffective Effective Emerging Effective Proficient Highly Effective
State Value Added Scores for New Teachers in Grades 4-10 with Less than Two Years of Teaching by Content Areas (Twenty-five or More New Teachers)
(Please examine the 2015 Louisiana Teacher Preparation Data Fact Book to accurately interpret the meaning of these scores.)
Content Areas Mean, Number of Scores, & Effectiveness Levels for Value-Added Scores of Twenty-five or More New Teachers with Less Than Two Years of Teaching who
Taught during 2011-12, 2012-13, or 2013-14
Mathematics
Ineffective Effective Emerging Effective Proficient Highly Effective
Science
Ineffective Effective Emerging Effective Proficient Highly Effective
Social Studies
Ineffective Effective Emerging Effective Proficient Highly Effective
English/Language Arts/Reading
Ineffective Effective Emerging Effective Proficient Highly Effective
K-12 Student Perceptions Data Not Yet Available.
54