2015 Interchange Fee Revenue, Covered Issuer Costs, and ... · • In 2015, interchange fees across...
39
1 Board of Governors of the Federal Reserve System ____________________________________________________________________________________ 2015 Interchange Fee Revenue, Covered Issuer Costs, and Covered Issuer and Merchant Fraud Losses Related to Debit Card Transactions November 30, 2016
Transcript of 2015 Interchange Fee Revenue, Covered Issuer Costs, and ... · • In 2015, interchange fees across...
1
Board of Governors of the Federal Reserve System
____________________________________________________________________________________
2015 Interchange Fee Revenue, Covered Issuer Costs, and Covered Issuer and Merchant Fraud Losses Related to Debit Card Transactions
November 30, 2016
2
Errata
The Federal Reserve revised this report on December 8, 2016, to address incorrect issuer fraud loss data in Exhibit 22 and Table 14. That exhibit and that table had erroneously quoted total fraud losses (to issuers, merchants and cardholders) rather than issuer fraud losses. The correct issue fraud loss numbers were shown in Table 11, but these were inconsistent with Table 14 and Exhibit 22 because the data in Table 14 and Exhibit 22 were incorrect. The issuer fraud loss data in Table 14 and Exhibit 22 have been revised.
Accordingly, the second sentence on page 27, which discusses Exhibit 22, has been edited to state that per-transaction ACS costs constituted 33 percent of overall debit card costs, including issuer fraud losses, for an average issuer in 2015. Previously the sentence had stated that per-transaction ACS costs constituted 29 percent of overall debit card costs.
Additionally, a clarifying footnote has been added to Table 11, in which it is noted that data include responses from only those issuers who reported gross fraud losses (which includes merchant, cardholder and issuer losses).
The Federal Reserve further revised this report on January 12, 2017, to correct certain growth rate numbers in card transactions. In the “Highlights” section and page 11 of the text, the growth rate for the volume of prepaid card transactions from 2014 to 2015 and the average annual growth rates of prepaid card transactions from 2012 to 2014 and 2009 to 2014 were erroneously cited as 7.9 percent, 5.3 percent, and 22.8 percent, respectively. These three values have been corrected as 13.4 percent, 6.4 percent, and 23.2 percent. In addition, on page 11, the growth rate in the volume of non-prepaid card transactions from 2014 to 2015 has been corrected to 6.5 percent from 6.8 percent.
Highlights
Card Use • Payment card networks processed 60.6 billion debit and general-use prepaid card transactions
valued at $2.31 trillion in the United States during 2015. Dual-message networks, which typicallyprocess signature-authenticated transactions, accounted for 65.5 and 64.6 percent of the totalby volume and value, respectively. Single-message networks, which typically process PIN-authenticated transactions, accounted for the rest.
• Total transaction volume grew 6.8 percent from 2014 to 2015, which was similar to the averageannual growth over the previous three years.
• Dual-message networks experienced slightly slower transaction volume growth than single-message networks from 2014 to 2015, with growth rates of 6.8 and 7.0 percent, respectively.This is the first time since data collection began in 2009 that transaction growth for single-message networks has exceeded transaction growth for dual-message networks.
• Card-not-present transactions accounted for 14.5 percent of transaction volume in 2015, butcard-not-present volume continued to grow more than twice as fast as card-present volume,with growth rates from 2014 to 2015 of 13.1 and 5.9 percent, respectively. As in previous years,the average transaction value of card-not-present transactions, $70.76 in 2015, was more thantwice as high as that of card-present transactions.
• Issuers that are exempt from the interchange fee standard in Regulation II experienced slightlyslower transaction volume growth than covered issuers from 2014 to 2015, with growth rates of6.4 and 7.1 percent, respectively. This is the first time since Regulation II went into effect in2011 that covered issuer transaction growth has exceeded exempt issuer transaction growth.
• The growth in the volume of prepaid card transactions from 2014 to 2015 was 13.4 percent,faster than the average annual growth of 6.4 percent over the previous two years.
Interchange Fees, Network Fees, and Incentives • In 2015, interchange fees across all debit and general-use prepaid cards (exempt and covered)
totaled $18.41 billion.• The average interchange fee per covered transaction was $0.23 in 2015 and has not changed
materially since Regulation II took effect in the fourth quarter of 2011. Average interchange feesfor exempt transactions on dual-message networks have also not changed materially since thefourth quarter of 2011 and stood at $0.51 in 2015. However, among single-message networks,the average interchange fee per exempt transaction has been falling gradually since RegulationII took effect, from $0.32 in the fourth quarter of 2011 to $0.26 in 2015.
• The average network fee per transaction was $0.102 in 2015, little changed from 2013. Networkfees totaled $6.16 billion in 2015. Acquirers paid 58 percent of these fees; issuers paid the rest.These percentages have not changed significantly in recent years.
• Payments and incentives offered by networks grew 8.1 percent since 2014, totaling $1.37 billionin 2015. This growth is in contrast to the previous three years, when payments and incentiveschanged little from year to year. Issuers received 67 percent of payments and incentives in2015; acquirers and merchants received the rest.
3
Fraud • Across all debit and general-use prepaid card transactions, fraud losses to all parties are
estimated to have totaled $2.41 billion in 2015, which is a 44 percent increase over the estimatefor 2013.
• The estimated increase in total fraud losses is driven by two factors: a 28 percent increase inaverage fraud losses as a share of transaction value and a 12 percent increase in the value oftotal transactions from 2013 to 2015.
Issuer Costs • Average per-transaction authorization, clearing, and settlement (ACS) costs, excluding issuer
fraud losses, across issuers covered by the interchange fee standard in Regulation II fell to$0.042 in 2015. This is a decline of only $0.004 since 2013 but a cumulative decline of 45percent since data collection began in 2009.
• The base interchange fee standard in Regulation II of 21 cents plus 5 basis points times the valueof a transaction exceeded average per-transaction ACS costs, including issuer fraud losses, for66.0 percent of covered issuers in 2015, up from 64.1 percent in 2013, and 99.2 percent ofcovered transactions in 2015, roughly unchanged from 99.3 percent in 2013.
4

Background
The Electronic Fund Transfer Act requires the Federal Reserve Board (Board) to biennially publish data on costs incurred, and interchange fees charged or received, by debit card issuers and payment card networks.1 The Board conducted its first data collection in 2010, collecting data from payment card networks and issuers for calendar year 2009. The information from the first data collection assisted the Board in developing Regulation II and was included in a report published in June 2011.2 The second report, published in March 2013, summarized data for the calendar year 2011.3 The third report, published in September 2014, summarized data for the calendar year 2013. The present report is the fourth report in the series, and summarizes data for the calendar year 2015.
Regulation II establishes an interchange fee standard under which issuers with consolidated assets of $10 billion or more may not receive or charge an interchange fee for an electronic debit transaction greater than 21 cents plus 5 basis points times the value of that transaction. An issuer that is subject to the standard may be eligible to receive an additional 1 cent adjustment to the interchange fee it charges or receives if the issuer meets certain fraud-prevention standards. Government-administered payment programs and certain reloadable general-use prepaid cards are exempt from this interchange fee limitation.
The Board’s Data Collection Process
The Board conducts two surveys to collect information about the debit card industry. The Payment Card Network (PCN) survey is conducted every year and surveys payment card networks that process debit card transactions. The Debit Card Issuer (DCI) survey is conducted every two years and surveys issuers that are subject to the interchange fee standard in Regulation II.
The surveys distinguish between general-use prepaid cards and other debit cards. Prepaid cards are cards, other payment codes, or devices that are issued on a prepaid basis for a specified amount, whether or not that amount may be increased or reloaded, in exchange for payment. General-use prepaid cards, covered by the PCN and DCI surveys, can be redeemed upon presentation at multiple unaffiliated merchants.4 Although Regulation II defines prepaid cards as a subset of debit cards, for ease of exposition, this report uses the term “debit card” to mean cards excluding prepaid cards and uses the term “prepaid card” to mean general-use prepaid cards that are covered by the definition of debit card in Regulation II. The surveys exclude cards that can access only automated teller machine (ATM) networks and cannot be used to conduct point-of-sale transactions.
1 15 U.S.C. 1693o-2(a)(3)(B) (2014). 2 See 76 Fed. Reg. 43394 (Jul. 20, 2011). 3 The reports, survey instruments, and historical data are available on the Board’s public website at www.federalreserve.gov/paymentsystems/regii-data-collections.htm. 4 This feature contrasts with private-label prepaid cards, which can be used only at an individual merchant or a group of affiliated merchants.
5
The surveys also distinguish between dual-message and single-message networks. A dual-message network typically uses separate messages to authorize and clear a transaction. These networks normally process signature-authenticated transactions, although some transactions, such as small-value purchases, may not require any cardholder authentication. In some instances, a dual-message network may use a single message to authorize and clear a given transaction and may require the entry of a personal identification number (PIN) for cardholder authentication in that transaction. A single-message network typically uses a single message to authorize and clear a transaction. These networks normally process PIN-authenticated transactions, although some transactions, such as small-value purchases, may not require any authentication. In some instances, a single-message network may use two messages to conduct a transaction. Furthermore, some transactions over single-message networks may allow signature authentication. Indeed, the distinction between single-message and dual-message networks is becoming less clear over time, as both types of networks develop new functionalities. However, this report continues to categorize networks as single-message or dual-message, as this still proves to be a useful categorization.
Payment Card Network Survey
The latest iteration of the PCN survey was conducted by the Board in early 2016. All 14 network companies that process debit card transactions completed the survey, reporting data for calendar year 2015.5 In addition to using data from the PCN survey for this report, the Board used the data to calculate the information it published in July 2016 on the average interchange fees received by issuers across different payment card networks.6
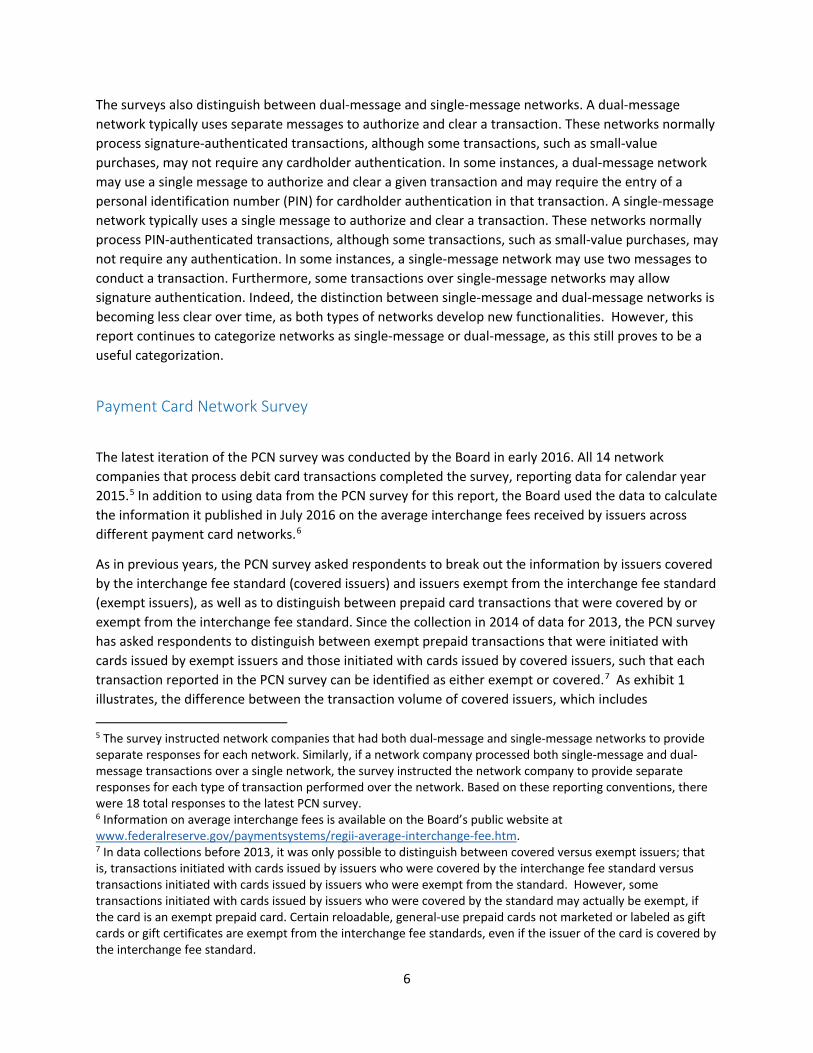
As in previous years, the PCN survey asked respondents to break out the information by issuers covered by the interchange fee standard (covered issuers) and issuers exempt from the interchange fee standard (exempt issuers), as well as to distinguish between prepaid card transactions that were covered by or exempt from the interchange fee standard. Since the collection in 2014 of data for 2013, the PCN survey has asked respondents to distinguish between exempt prepaid transactions that were initiated with cards issued by exempt issuers and those initiated with cards issued by covered issuers, such that each transaction reported in the PCN survey can be identified as either exempt or covered.7 As exhibit 1 illustrates, the difference between the transaction volume of covered issuers, which includes 5 The survey instructed network companies that had both dual-message and single-message networks to provide separate responses for each network. Similarly, if a network company processed both single-message and dual-message transactions over a single network, the survey instructed the network company to provide separate responses for each type of transaction performed over the network. Based on these reporting conventions, there were 18 total responses to the latest PCN survey. 6 Information on average interchange fees is available on the Board’s public website at www.federalreserve.gov/paymentsystems/regii-average-interchange-fee.htm. 7 In data collections before 2013, it was only possible to distinguish between covered versus exempt issuers; that is, transactions initiated with cards issued by issuers who were covered by the interchange fee standard versus transactions initiated with cards issued by issuers who were exempt from the standard. However, some transactions initiated with cards issued by issuers who were covered by the standard may actually be exempt, if the card is an exempt prepaid card. Certain reloadable, general-use prepaid cards not marketed or labeled as gift cards or gift certificates are exempt from the interchange fee standards, even if the issuer of the card is covered by the interchange fee standard.
6
transactions initiated with exempt prepaid cards issued by covered issuers, and the volume of covered transactions, which excludes those transactions, was less than 3 percent of transaction volume in 2015. This report discusses both measures.
Exhibit 1: Composition of transaction volume in 2015
Debit Card Issuer Survey
The latest iteration of the DCI survey was conducted by the Board in early 2016, asking covered issuers to report data for calendar year 2015.8 Respondents ranged from the largest debit card issuers in the country to issuers with sizable assets but very small debit card programs. The DCI survey asked for information related to the volume and value of debit and prepaid card transactions, the incidence of and
8 The Board distributed surveys to holding companies of covered financial institutions. These financial institutions included bank and thrift holding companies with consolidated assets of at least $10 billion; independent commercial banks, thrifts, and credit unions with assets of at least $10 billion; and U.S. branches and agencies of foreign banking organizations with worldwide assets of at least $10 billion. Assets were computed using the Consolidated Financial Statements for Bank Holding Companies (FR Y-9C; OMB No. 7100-0128), the Consolidated Reports of Condition and Income (Call Reports) for independent commercial banks (FFIEC 031 & 041; OMB No. 7100-0036) and for U.S. branches and agencies of foreign banks (FFIEC 002; OMB No. 7100-0032), the Thrift Financial Reports (OTS 1313; OMB No. 1550-0023) for thrift holding companies and thrift institutions, and the Credit Union Reports of Condition and Income (NCUA 5300/5300S; OMB No. 3133-0004) for credit unions. The ownership structure of banking organizations was established using the Federal Financial Institutions Examination Council’s National Information Center structure database. Participation was mandatory for institutions that had debit card programs in 2015. Institutions that indicated that they did not have a debit card program in 2015 were not required to complete a survey. These institutions were typically either foreign banking organizations or other financial institutions with large nonbank affiliates that do not provide retail banking services.
7

losses related to debit and prepaid card fraud, authorization, clearing, and settlement costs as well as other costs associated with a particular debit card transaction, fraud-prevention and data security costs, and interchange fee revenue. The DCI survey instructed respondents to provide the requested information separately for debit card transactions processed over dual-message networks, debit card transactions processed over single-message networks, and, for issuers with prepaid card programs, prepaid card transactions.9
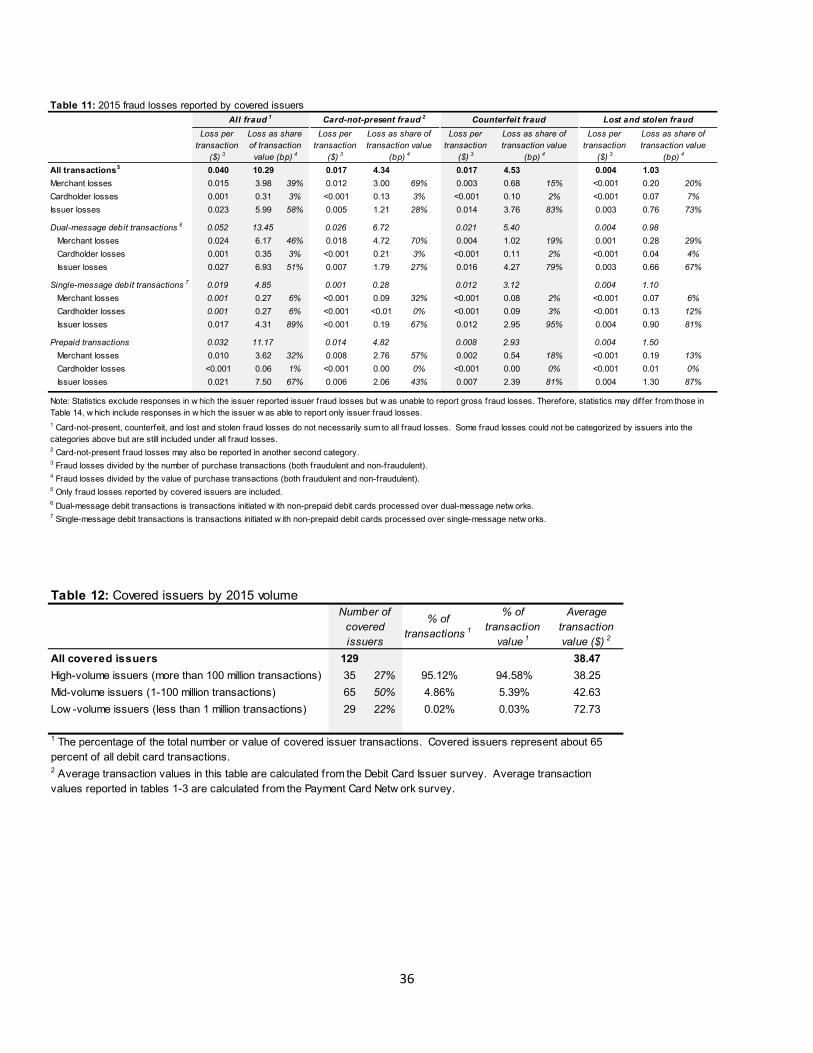
A total of 129 covered issuers responded to the 2015 DCI survey, whereas 131 responded in 2013. Exhibit 2 illustrates the composition of responses: 27 percent of the respondents processed more than 100 million debit card transactions in 2015 (high-volume issuers), while 22 percent processed fewer than 1 million debit card transactions in 2015 (low-volume issuers). The remaining 50 percent of respondents processed between 1 million and 100 million transactions in 2015 (mid-volume issuers). The composition of respondents by transaction volume changed slightly since 2013. Relative to 2013, 2 more issuers were classified as high-volume, and 2 more issuers were classified as mid-volume. Also, 6 fewer respondents were classified as low-volume than in 2013; this led to some changes in aggregate cost statistics for low-volume issuers, which will be discussed later. In 2015, high-volume issuers accounted for 95 percent of transactions by both volume and value, mid-volume issuers accounted for another 5 percent by both volume and value, and low-volume issuers accounted for less than 0.1 percent of transactions by volume and value. These breakdowns were largely unchanged from 2013.
Exhibit 2: Composition of covered issuers and transaction volume/value of covered issuers in 2015
9 Unlike the PCN survey, the DCI survey does not distinguish between general-use prepaid cards that were covered by the interchange fee standard and those that were exempt.
8
Discussion
Card Use10
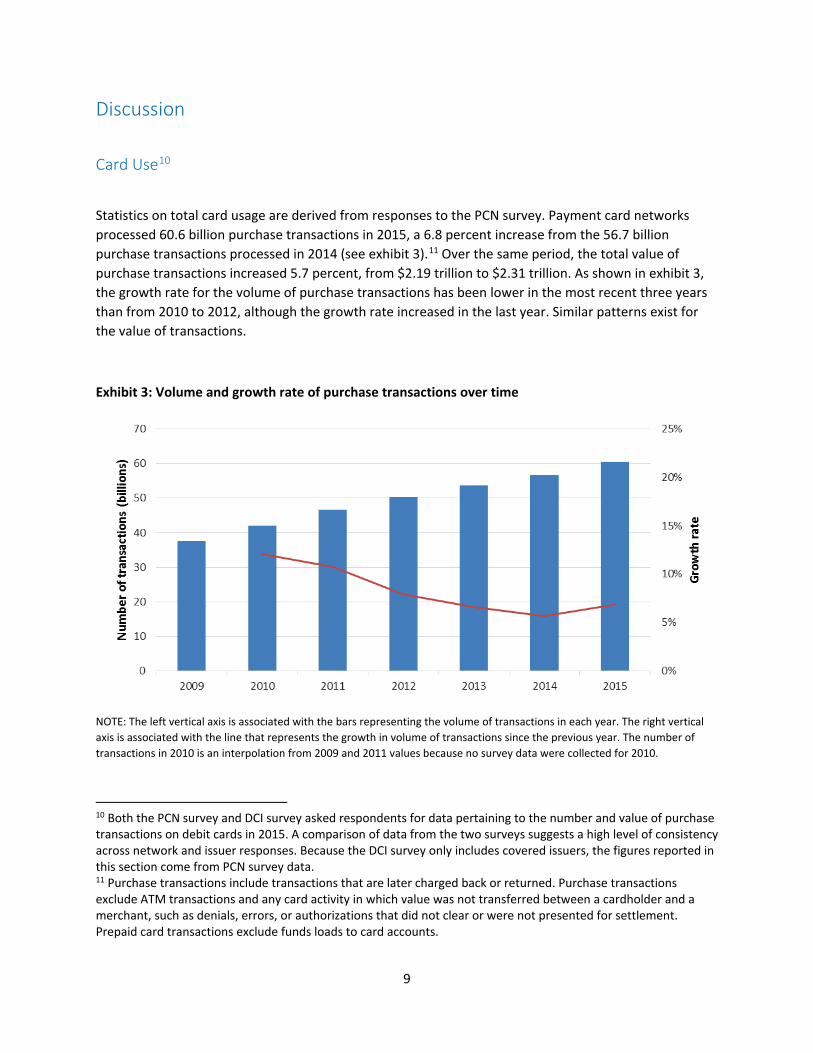
Statistics on total card usage are derived from responses to the PCN survey. Payment card networks processed 60.6 billion purchase transactions in 2015, a 6.8 percent increase from the 56.7 billion purchase transactions processed in 2014 (see exhibit 3).11 Over the same period, the total value of purchase transactions increased 5.7 percent, from $2.19 trillion to $2.31 trillion. As shown in exhibit 3, the growth rate for the volume of purchase transactions has been lower in the most recent three years than from 2010 to 2012, although the growth rate increased in the last year. Similar patterns exist for the value of transactions.
Exhibit 3: Volume and growth rate of purchase transactions over time
NOTE: The left vertical axis is associated with the bars representing the volume of transactions in each year. The right vertical axis is associated with the line that represents the growth in volume of transactions since the previous year. The number of transactions in 2010 is an interpolation from 2009 and 2011 values because no survey data were collected for 2010.
10 Both the PCN survey and DCI survey asked respondents for data pertaining to the number and value of purchase transactions on debit cards in 2015. A comparison of data from the two surveys suggests a high level of consistency across network and issuer responses. Because the DCI survey only includes covered issuers, the figures reported in this section come from PCN survey data. 11 Purchase transactions include transactions that are later charged back or returned. Purchase transactions exclude ATM transactions and any card activity in which value was not transferred between a cardholder and a merchant, such as denials, errors, or authorizations that did not clear or were not presented for settlement. Prepaid card transactions exclude funds loads to card accounts.
9
A small fraction of purchase transactions resulted in chargebacks and returns.12 In 2015, chargebacks came to 0.02 percent of transactions, and returns about 0.79 percent of transactions. Together, chargebacks and returns totaled 0.5 billion transactions ($0.03 trillion in value); purchase transactions net of chargebacks and returns totaled 60.1 billion ($2.28 trillion in value).
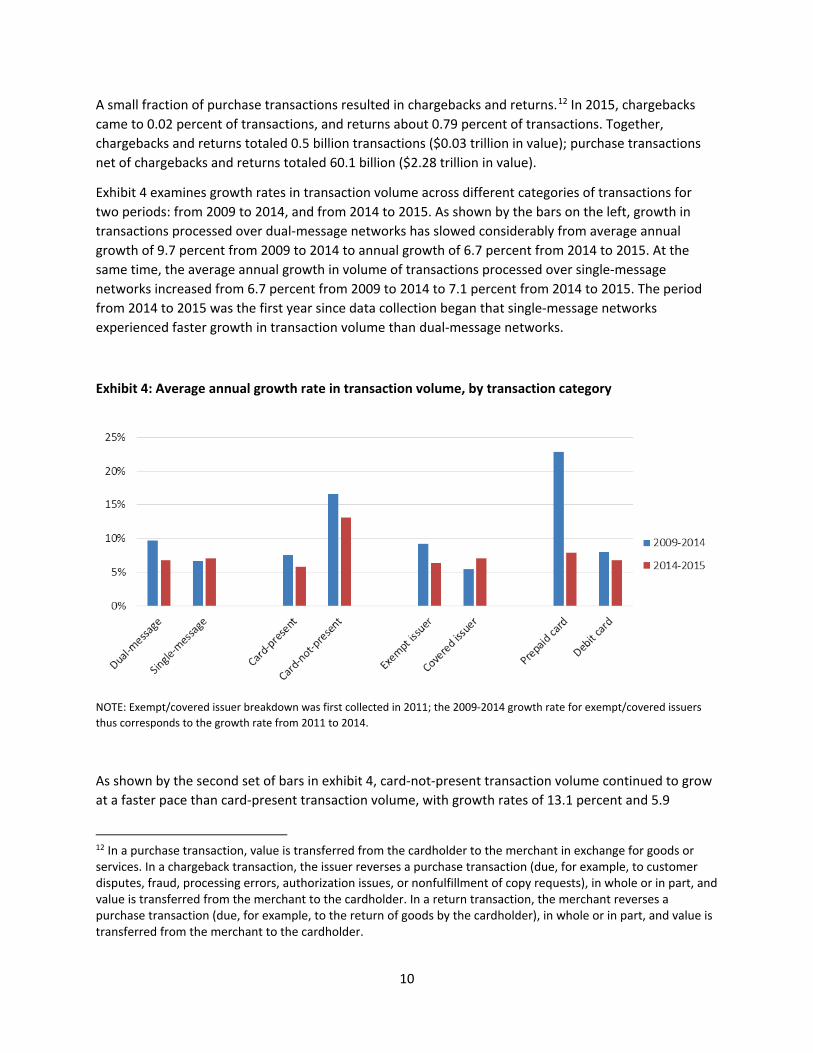
Exhibit 4 examines growth rates in transaction volume across different categories of transactions for two periods: from 2009 to 2014, and from 2014 to 2015. As shown by the bars on the left, growth in transactions processed over dual-message networks has slowed considerably from average annual growth of 9.7 percent from 2009 to 2014 to annual growth of 6.7 percent from 2014 to 2015. At the same time, the average annual growth in volume of transactions processed over single-message networks increased from 6.7 percent from 2009 to 2014 to 7.1 percent from 2014 to 2015. The period from 2014 to 2015 was the first year since data collection began that single-message networks experienced faster growth in transaction volume than dual-message networks.
Exhibit 4: Average annual growth rate in transaction volume, by transaction category
NOTE: Exempt/covered issuer breakdown was first collected in 2011; the 2009-2014 growth rate for exempt/covered issuers thus corresponds to the growth rate from 2011 to 2014.
As shown by the second set of bars in exhibit 4, card-not-present transaction volume continued to grow at a faster pace than card-present transaction volume, with growth rates of 13.1 percent and 5.9
12 In a purchase transaction, value is transferred from the cardholder to the merchant in exchange for goods or services. In a chargeback transaction, the issuer reverses a purchase transaction (due, for example, to customer disputes, fraud, processing errors, authorization issues, or nonfulfillment of copy requests), in whole or in part, and value is transferred from the merchant to the cardholder. In a return transaction, the merchant reverses a purchase transaction (due, for example, to the return of goods by the cardholder), in whole or in part, and value is transferred from the merchant to the cardholder.
10
percent, respectively, from 2014 to 2015.13 As shown by the third set of bars, growth in volume processed by exempt issuers has slowed considerably, from average annual growth of 9.3 percent from 2011 to 2014 to 6.4 percent from 2014 to 2015. At the same time, average annual growth in volume processed by covered issuers increased from 5.4 percent from 2011 to 2014 to 7.1 percent from 2014 to 2015. The period from 2014 to 2015 was the first year since data collection began that covered issuers experienced faster growth in volume than exempt issuers. As shown by the final set of bars in exhibit 4, average annual growth in volume of prepaid card transactions has slowed dramatically, from 23.2 percent from 2009 to 2014 to 13.4 percent from 2014 to 2015. Average annual growth in volume of non-prepaid debit card transactions slowed moderately, from 8.0 percent from 2009 to 2014 to 6.5 percent from 2014 to 2015.
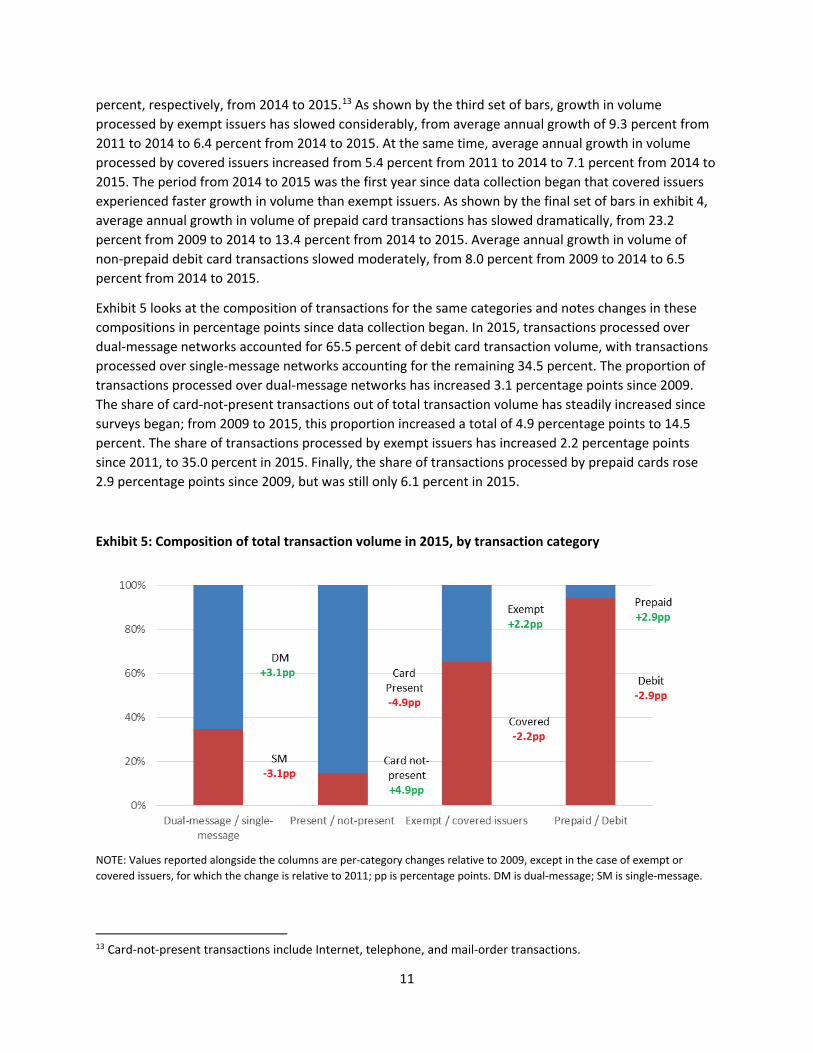
Exhibit 5 looks at the composition of transactions for the same categories and notes changes in these compositions in percentage points since data collection began. In 2015, transactions processed over dual-message networks accounted for 65.5 percent of debit card transaction volume, with transactions processed over single-message networks accounting for the remaining 34.5 percent. The proportion of transactions processed over dual-message networks has increased 3.1 percentage points since 2009. The share of card-not-present transactions out of total transaction volume has steadily increased since surveys began; from 2009 to 2015, this proportion increased a total of 4.9 percentage points to 14.5 percent. The share of transactions processed by exempt issuers has increased 2.2 percentage points since 2011, to 35.0 percent in 2015. Finally, the share of transactions processed by prepaid cards rose 2.9 percentage points since 2009, but was still only 6.1 percent in 2015.
Exhibit 5: Composition of total transaction volume in 2015, by transaction category
NOTE: Values reported alongside the columns are per-category changes relative to 2009, except in the case of exempt or covered issuers, for which the change is relative to 2011; pp is percentage points. DM is dual-message; SM is single-message.
13 Card-not-present transactions include Internet, telephone, and mail-order transactions.
11
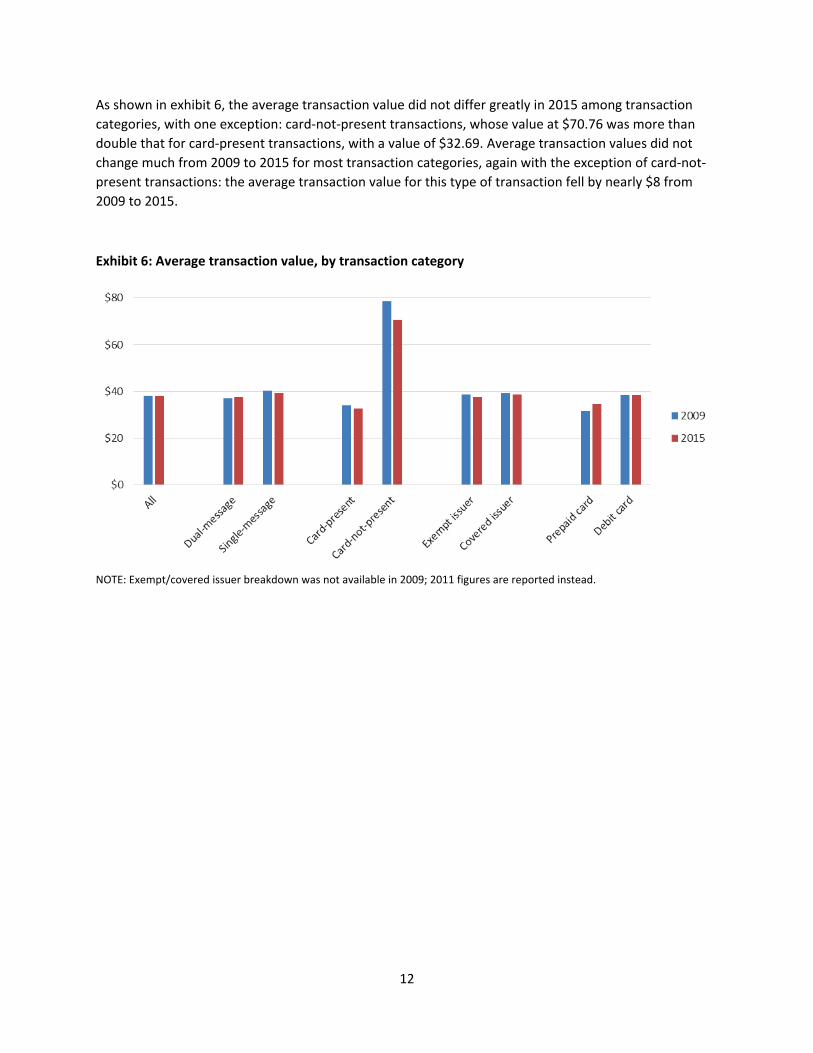
As shown in exhibit 6, the average transaction value did not differ greatly in 2015 among transaction categories, with one exception: card-not-present transactions, whose value at $70.76 was more than double that for card-present transactions, with a value of $32.69. Average transaction values did not change much from 2009 to 2015 for most transaction categories, again with the exception of card-not-present transactions: the average transaction value for this type of transaction fell by nearly $8 from 2009 to 2015.
Exhibit 6: Average transaction value, by transaction category
NOTE: Exempt/covered issuer breakdown was not available in 2009; 2011 figures are reported instead.
12
Interchange Fees, Network Fees, and Incentives
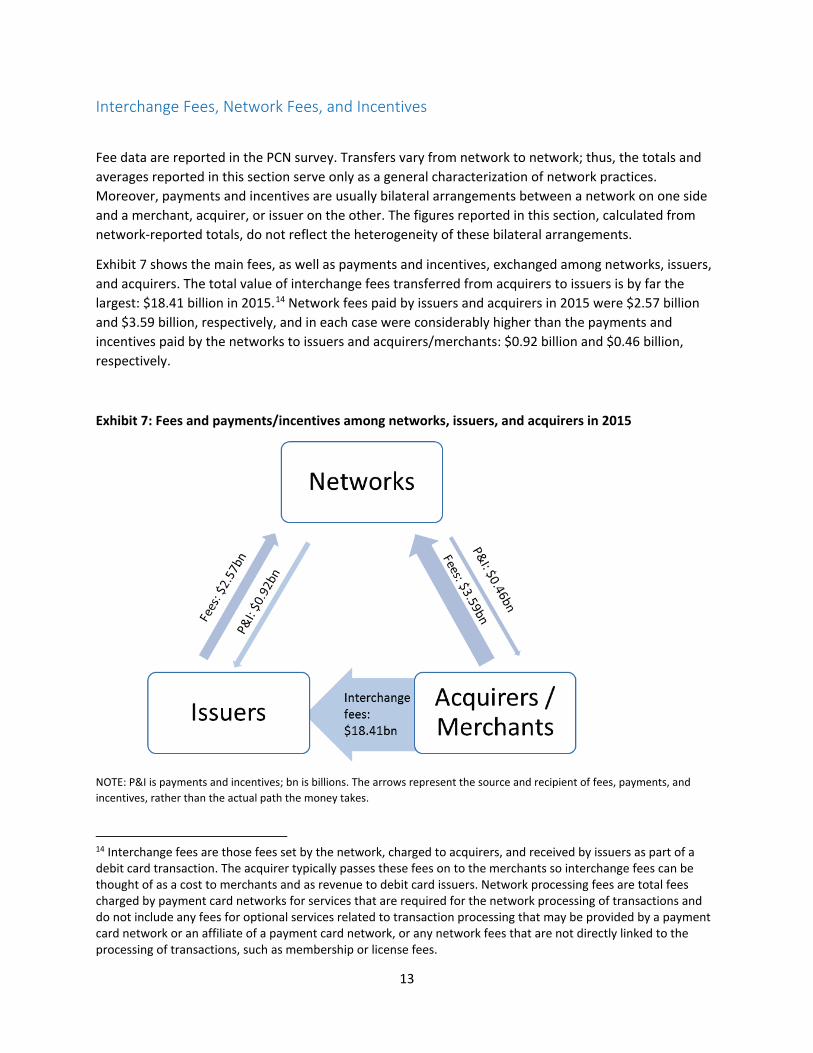
Fee data are reported in the PCN survey. Transfers vary from network to network; thus, the totals and averages reported in this section serve only as a general characterization of network practices. Moreover, payments and incentives are usually bilateral arrangements between a network on one side and a merchant, acquirer, or issuer on the other. The figures reported in this section, calculated from network-reported totals, do not reflect the heterogeneity of these bilateral arrangements.
Exhibit 7 shows the main fees, as well as payments and incentives, exchanged among networks, issuers, and acquirers. The total value of interchange fees transferred from acquirers to issuers is by far the largest: $18.41 billion in 2015.14 Network fees paid by issuers and acquirers in 2015 were $2.57 billion and $3.59 billion, respectively, and in each case were considerably higher than the payments and incentives paid by the networks to issuers and acquirers/merchants: $0.92 billion and $0.46 billion, respectively.
Exhibit 7: Fees and payments/incentives among networks, issuers, and acquirers in 2015
NOTE: P&I is payments and incentives; bn is billions. The arrows represent the source and recipient of fees, payments, and incentives, rather than the actual path the money takes.
14 Interchange fees are those fees set by the network, charged to acquirers, and received by issuers as part of a debit card transaction. The acquirer typically passes these fees on to the merchants so interchange fees can be thought of as a cost to merchants and as revenue to debit card issuers. Network processing fees are total fees charged by payment card networks for services that are required for the network processing of transactions and do not include any fees for optional services related to transaction processing that may be provided by a payment card network or an affiliate of a payment card network, or any network fees that are not directly linked to the processing of transactions, such as membership or license fees.
13
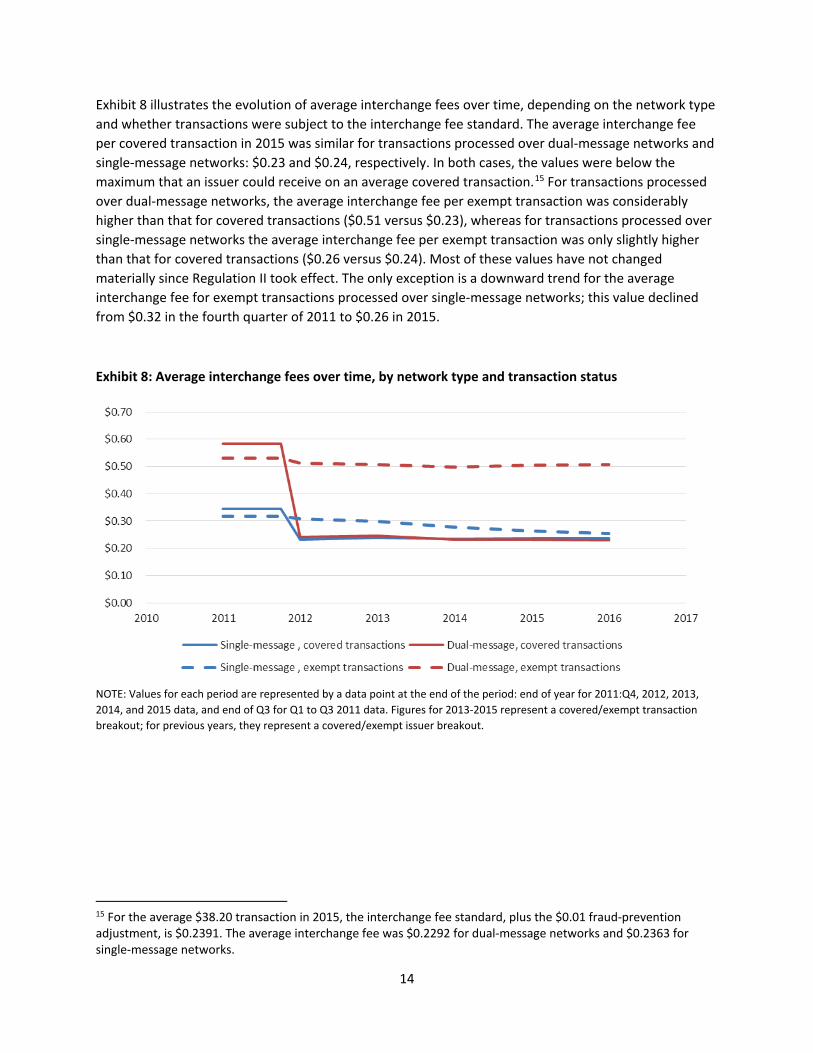
Exhibit 8 illustrates the evolution of average interchange fees over time, depending on the network type and whether transactions were subject to the interchange fee standard. The average interchange fee per covered transaction in 2015 was similar for transactions processed over dual-message networks and single-message networks: $0.23 and $0.24, respectively. In both cases, the values were below the maximum that an issuer could receive on an average covered transaction.15 For transactions processed over dual-message networks, the average interchange fee per exempt transaction was considerably higher than that for covered transactions ($0.51 versus $0.23), whereas for transactions processed over single-message networks the average interchange fee per exempt transaction was only slightly higher than that for covered transactions ($0.26 versus $0.24). Most of these values have not changed materially since Regulation II took effect. The only exception is a downward trend for the average interchange fee for exempt transactions processed over single-message networks; this value declined from $0.32 in the fourth quarter of 2011 to $0.26 in 2015.
Exhibit 8: Average interchange fees over time, by network type and transaction status
NOTE: Values for each period are represented by a data point at the end of the period: end of year for 2011:Q4, 2012, 2013, 2014, and 2015 data, and end of Q3 for Q1 to Q3 2011 data. Figures for 2013-2015 represent a covered/exempt transaction breakout; for previous years, they represent a covered/exempt issuer breakout.
15 For the average $38.20 transaction in 2015, the interchange fee standard, plus the $0.01 fraud-prevention adjustment, is $0.2391. The average interchange fee was $0.2292 for dual-message networks and $0.2363 for single-message networks.
14
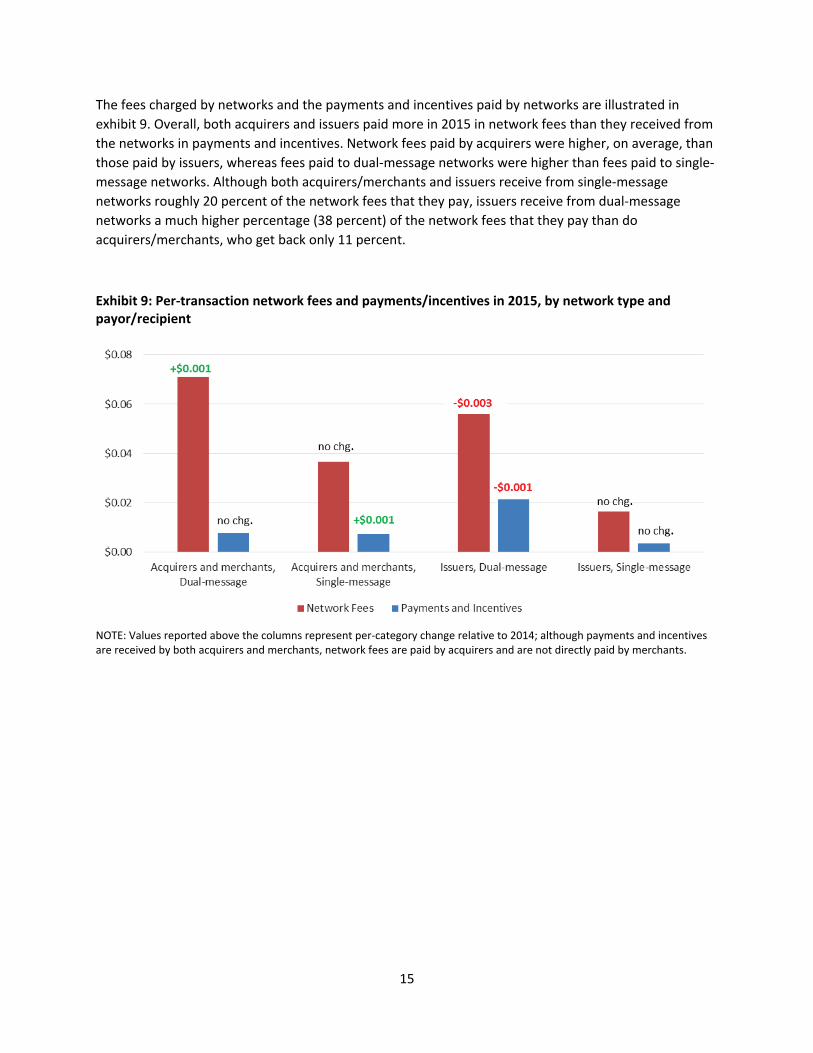
The fees charged by networks and the payments and incentives paid by networks are illustrated in exhibit 9. Overall, both acquirers and issuers paid more in 2015 in network fees than they received from the networks in payments and incentives. Network fees paid by acquirers were higher, on average, than those paid by issuers, whereas fees paid to dual-message networks were higher than fees paid to single-message networks. Although both acquirers/merchants and issuers receive from single-message networks roughly 20 percent of the network fees that they pay, issuers receive from dual-message networks a much higher percentage (38 percent) of the network fees that they pay than do acquirers/merchants, who get back only 11 percent.
Exhibit 9: Per-transaction network fees and payments/incentives in 2015, by network type and payor/recipient
NOTE: Values reported above the columns represent per-category change relative to 2014; although payments and incentives are received by both acquirers and merchants, network fees are paid by acquirers and are not directly paid by merchants.
15
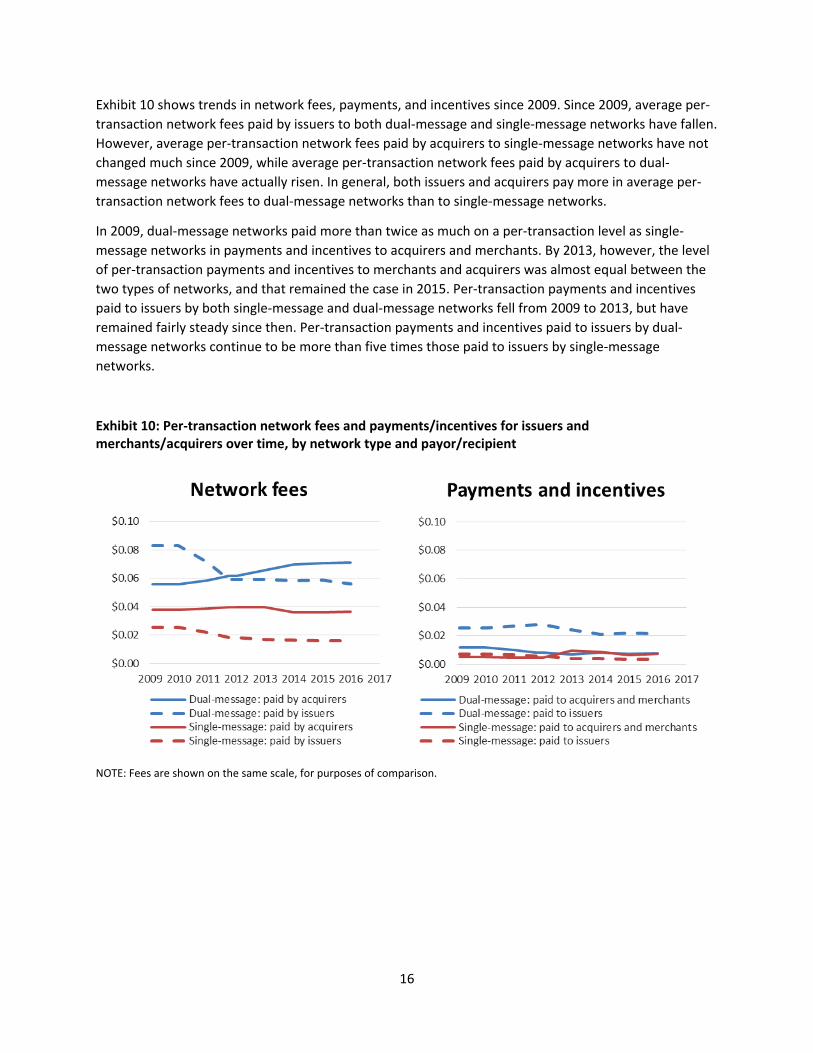
Exhibit 10 shows trends in network fees, payments, and incentives since 2009. Since 2009, average per-transaction network fees paid by issuers to both dual-message and single-message networks have fallen. However, average per-transaction network fees paid by acquirers to single-message networks have not changed much since 2009, while average per-transaction network fees paid by acquirers to dual-message networks have actually risen. In general, both issuers and acquirers pay more in average per-transaction network fees to dual-message networks than to single-message networks.
In 2009, dual-message networks paid more than twice as much on a per-transaction level as single-message networks in payments and incentives to acquirers and merchants. By 2013, however, the level of per-transaction payments and incentives to merchants and acquirers was almost equal between the two types of networks, and that remained the case in 2015. Per-transaction payments and incentives paid to issuers by both single-message and dual-message networks fell from 2009 to 2013, but have remained fairly steady since then. Per-transaction payments and incentives paid to issuers by dual-message networks continue to be more than five times those paid to issuers by single-message networks.
Exhibit 10: Per-transaction network fees and payments/incentives for issuers and merchants/acquirers over time, by network type and payor/recipient
NOTE: Fees are shown on the same scale, for purposes of comparison.
16
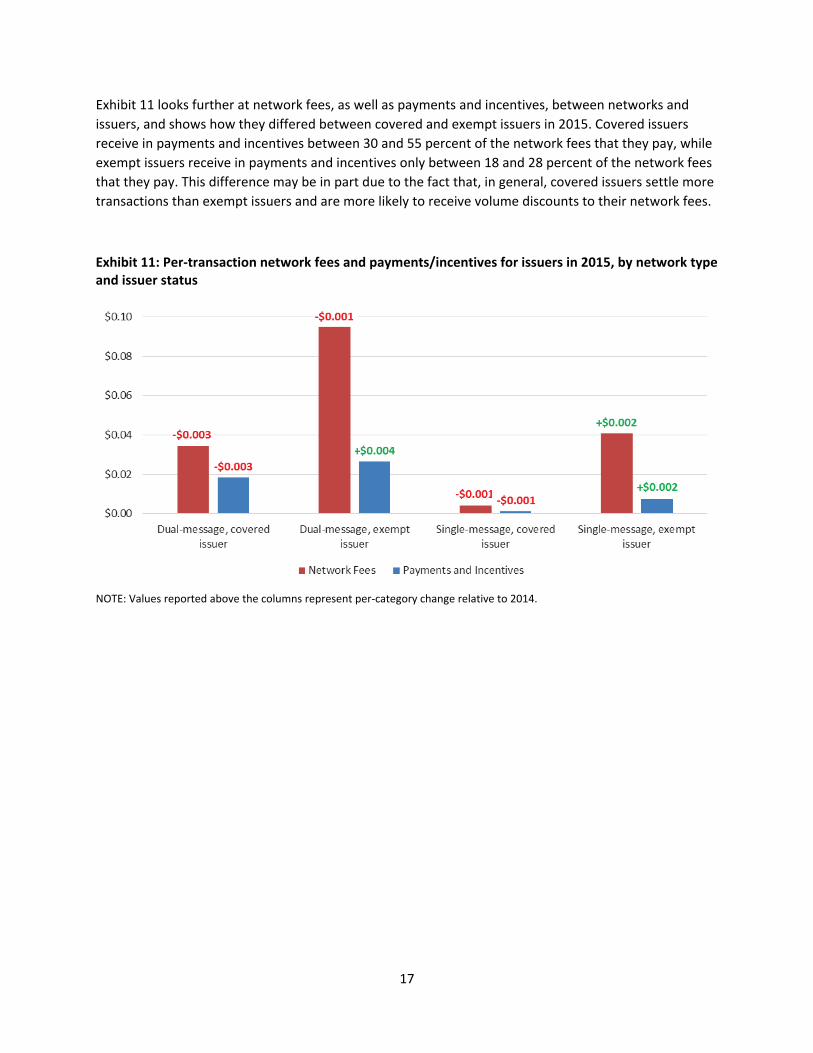
Exhibit 11 looks further at network fees, as well as payments and incentives, between networks and issuers, and shows how they differed between covered and exempt issuers in 2015. Covered issuers receive in payments and incentives between 30 and 55 percent of the network fees that they pay, while exempt issuers receive in payments and incentives only between 18 and 28 percent of the network fees that they pay. This difference may be in part due to the fact that, in general, covered issuers settle more transactions than exempt issuers and are more likely to receive volume discounts to their network fees.
Exhibit 11: Per-transaction network fees and payments/incentives for issuers in 2015, by network type and issuer status
NOTE: Values reported above the columns represent per-category change relative to 2014.
17

Exhibit 12 examines how network fees, as well as payments and incentives, for covered and exempt issuers have changed since 2011. Since the introduction of Regulation II, for both types of networks, the average network fee per transaction paid by covered issuers has been falling. However, for both types of networks, the average network fee per transaction paid by exempt issuers has been roughly flat in recent years (though for single-message networks, it initially rose after the introduction of Regulation II). Since the introduction of Regulation II, payments and incentives paid to exempt issuers have been increasing for both types of networks, while payments and incentives paid to covered issuers have been falling for both types of networks.
Exhibit 12: Per-transaction network fees and payments/incentives for issuers over time, by network type and issuer status
18
Fraud
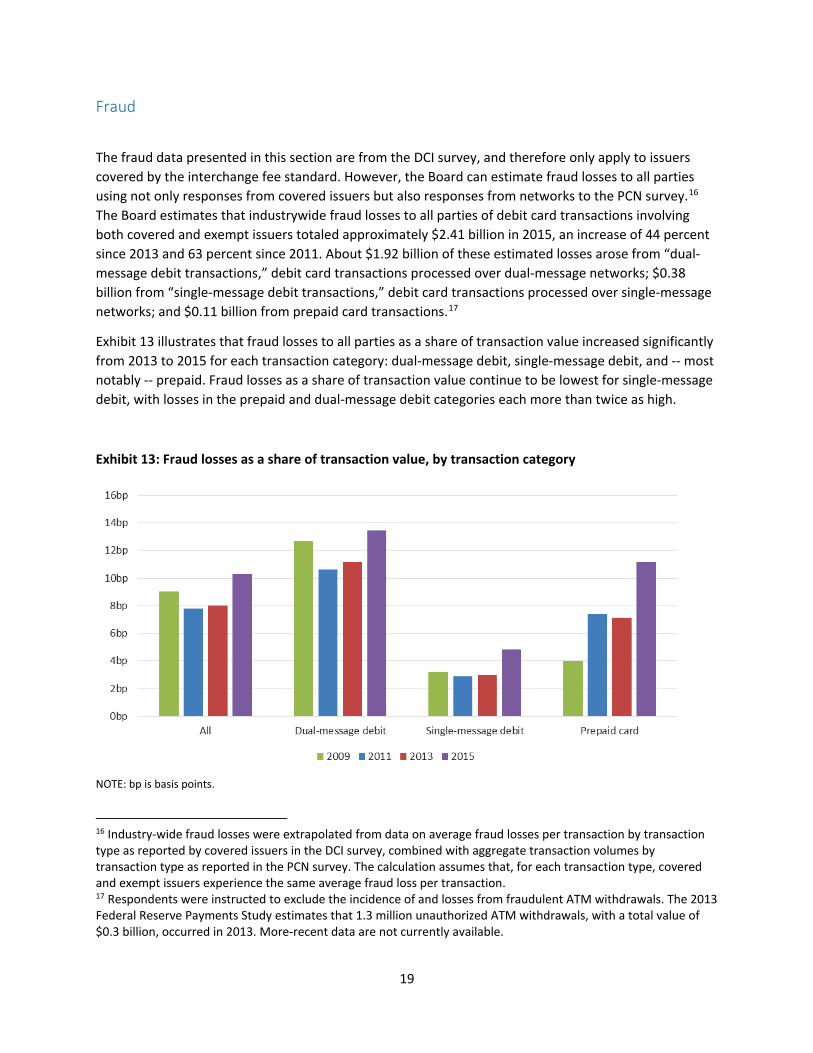
The fraud data presented in this section are from the DCI survey, and therefore only apply to issuers covered by the interchange fee standard. However, the Board can estimate fraud losses to all parties using not only responses from covered issuers but also responses from networks to the PCN survey.16 The Board estimates that industrywide fraud losses to all parties of debit card transactions involving both covered and exempt issuers totaled approximately $2.41 billion in 2015, an increase of 44 percent since 2013 and 63 percent since 2011. About $1.92 billion of these estimated losses arose from “dual-message debit transactions,” debit card transactions processed over dual-message networks; $0.38 billion from “single-message debit transactions,” debit card transactions processed over single-message networks; and $0.11 billion from prepaid card transactions.17
Exhibit 13 illustrates that fraud losses to all parties as a share of transaction value increased significantly from 2013 to 2015 for each transaction category: dual-message debit, single-message debit, and -- most notably -- prepaid. Fraud losses as a share of transaction value continue to be lowest for single-message debit, with losses in the prepaid and dual-message debit categories each more than twice as high.
Exhibit 13: Fraud losses as a share of transaction value, by transaction category
NOTE: bp is basis points.
16 Industry-wide fraud losses were extrapolated from data on average fraud losses per transaction by transaction type as reported by covered issuers in the DCI survey, combined with aggregate transaction volumes by transaction type as reported in the PCN survey. The calculation assumes that, for each transaction type, covered and exempt issuers experience the same average fraud loss per transaction. 17 Respondents were instructed to exclude the incidence of and losses from fraudulent ATM withdrawals. The 2013 Federal Reserve Payments Study estimates that 1.3 million unauthorized ATM withdrawals, with a total value of $0.3 billion, occurred in 2013. More-recent data are not currently available.
19
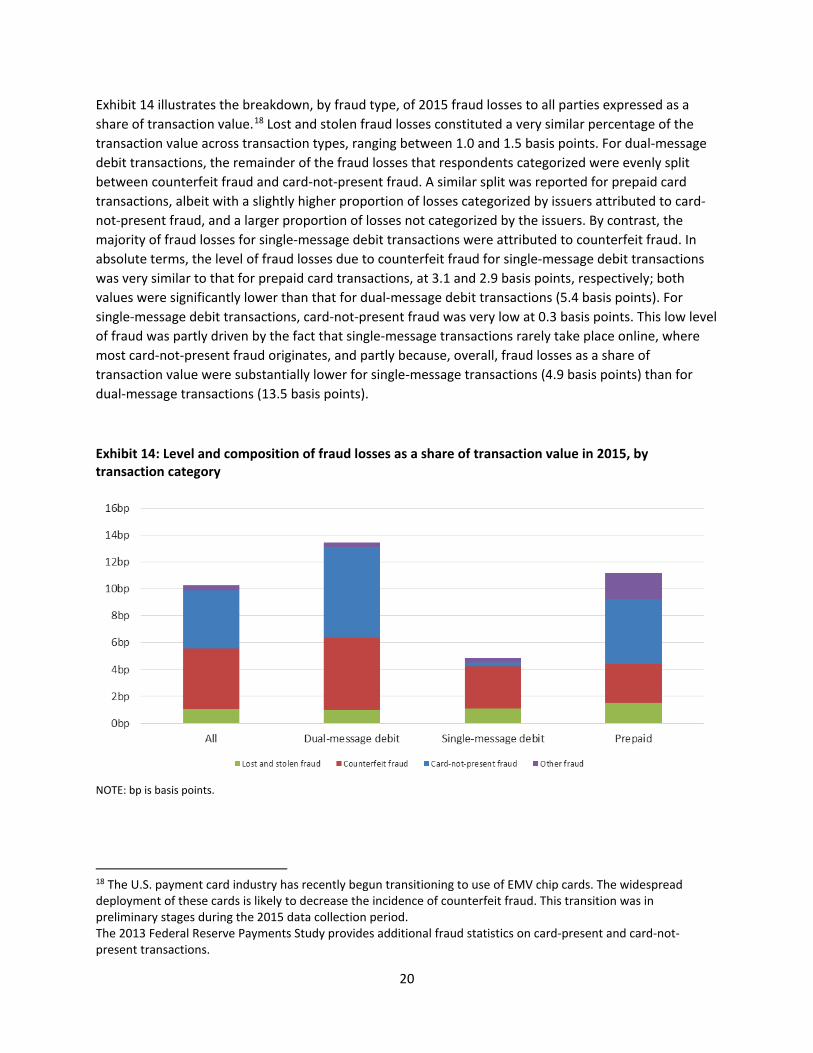
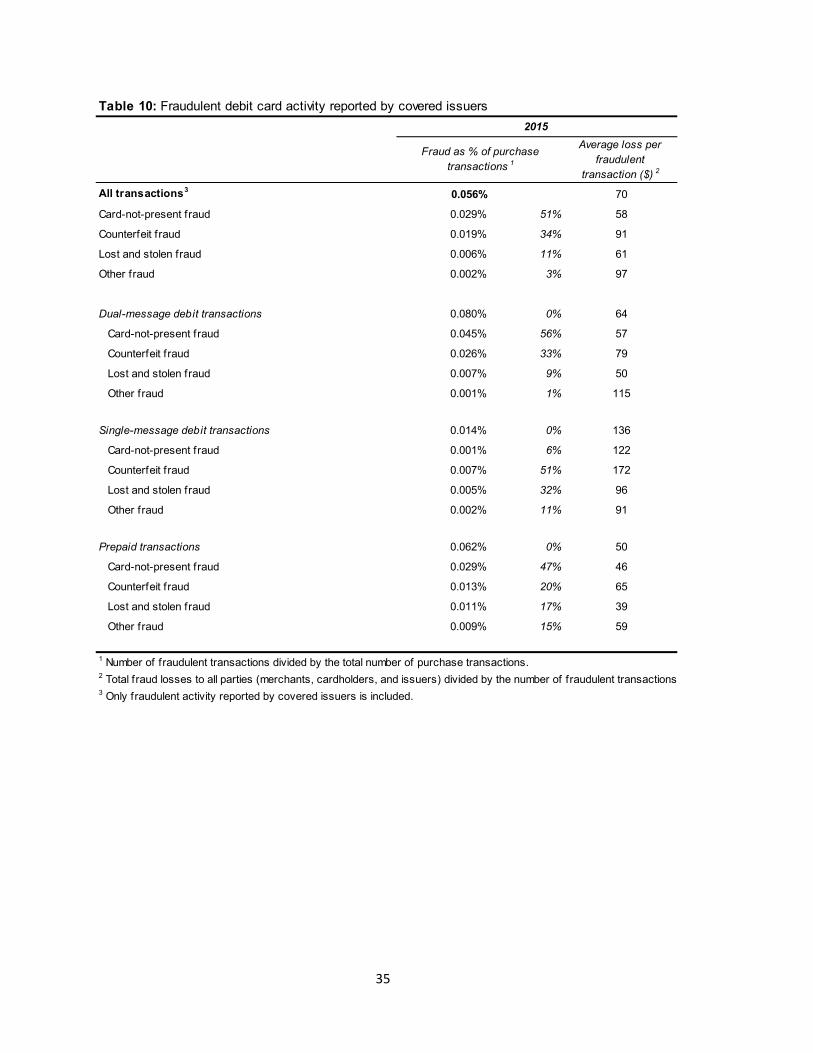
Exhibit 14 illustrates the breakdown, by fraud type, of 2015 fraud losses to all parties expressed as a share of transaction value.18 Lost and stolen fraud losses constituted a very similar percentage of the transaction value across transaction types, ranging between 1.0 and 1.5 basis points. For dual-message debit transactions, the remainder of the fraud losses that respondents categorized were evenly split between counterfeit fraud and card-not-present fraud. A similar split was reported for prepaid card transactions, albeit with a slightly higher proportion of losses categorized by issuers attributed to card-not-present fraud, and a larger proportion of losses not categorized by the issuers. By contrast, the majority of fraud losses for single-message debit transactions were attributed to counterfeit fraud. In absolute terms, the level of fraud losses due to counterfeit fraud for single-message debit transactions was very similar to that for prepaid card transactions, at 3.1 and 2.9 basis points, respectively; both values were significantly lower than that for dual-message debit transactions (5.4 basis points). For single-message debit transactions, card-not-present fraud was very low at 0.3 basis points. This low level of fraud was partly driven by the fact that single-message transactions rarely take place online, where most card-not-present fraud originates, and partly because, overall, fraud losses as a share of transaction value were substantially lower for single-message transactions (4.9 basis points) than for dual-message transactions (13.5 basis points).
Exhibit 14: Level and composition of fraud losses as a share of transaction value in 2015, by transaction category
NOTE: bp is basis points.
18 The U.S. payment card industry has recently begun transitioning to use of EMV chip cards. The widespread deployment of these cards is likely to decrease the incidence of counterfeit fraud. This transition was in preliminary stages during the 2015 data collection period. The 2013 Federal Reserve Payments Study provides additional fraud statistics on card-present and card-not-present transactions.
20
measures by category of transaction. Exhibit 15 shows that overall fraud incidence rose from 4.1 basis points in 2013 to 5.6 basis points in 2015. Fraud incidence increased substantially from 2013 to 2015 for each transaction category, and the increase is a continuation of the trend of rising fraud incidence that began in 2011 for dual-message debit and single-message debit and in 2009 for prepaid. Exhibit 16 shows that the average loss per fraudulent transaction did not change significantly from 2013 to 2015, following a substantial decrease from 2011 to 2013.
Exhibit 15: Incidence of fraudulent transactions as a percentage of total transactions, by transaction category
Exhibit 16: Average loss per fraudulent transaction, by transaction category
21
Overall fraud losses are a function of fraud incidence (the share of transactions that are fraudulent) as well as fraud loss per fraudulent transaction. The following two exhibits reveal trends in each of these
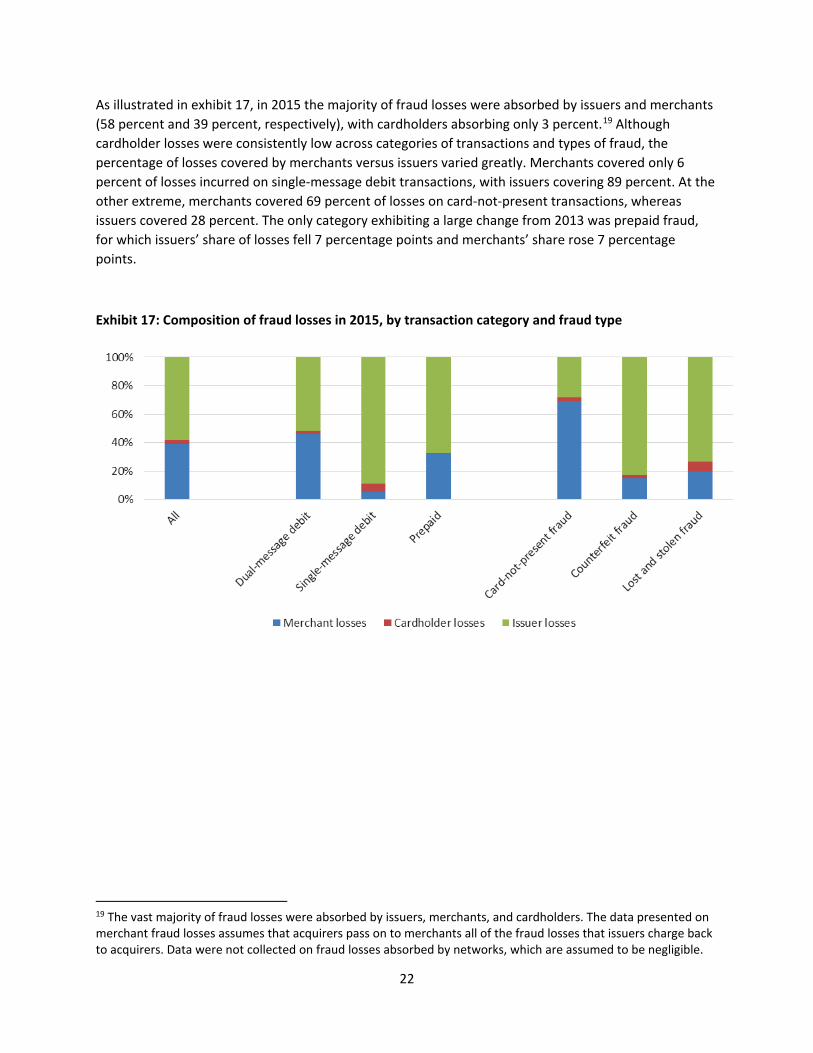
As illustrated in exhibit 17, in 2015 the majority of fraud losses were absorbed by issuers and merchants (58 percent and 39 percent, respectively), with cardholders absorbing only 3 percent.19 Although cardholder losses were consistently low across categories of transactions and types of fraud, the percentage of losses covered by merchants versus issuers varied greatly. Merchants covered only 6 percent of losses incurred on single-message debit transactions, with issuers covering 89 percent. At the other extreme, merchants covered 69 percent of losses on card-not-present transactions, whereas issuers covered 28 percent. The only category exhibiting a large change from 2013 was prepaid fraud, for which issuers’ share of losses fell 7 percentage points and merchants’ share rose 7 percentage points.
Exhibit 17: Composition of fraud losses in 2015, by transaction category and fraud type
19 The vast majority of fraud losses were absorbed by issuers, merchants, and cardholders. The data presented on merchant fraud losses assumes that acquirers pass on to merchants all of the fraud losses that issuers charge back to acquirers. Data were not collected on fraud losses absorbed by networks, which are assumed to be negligible.
22
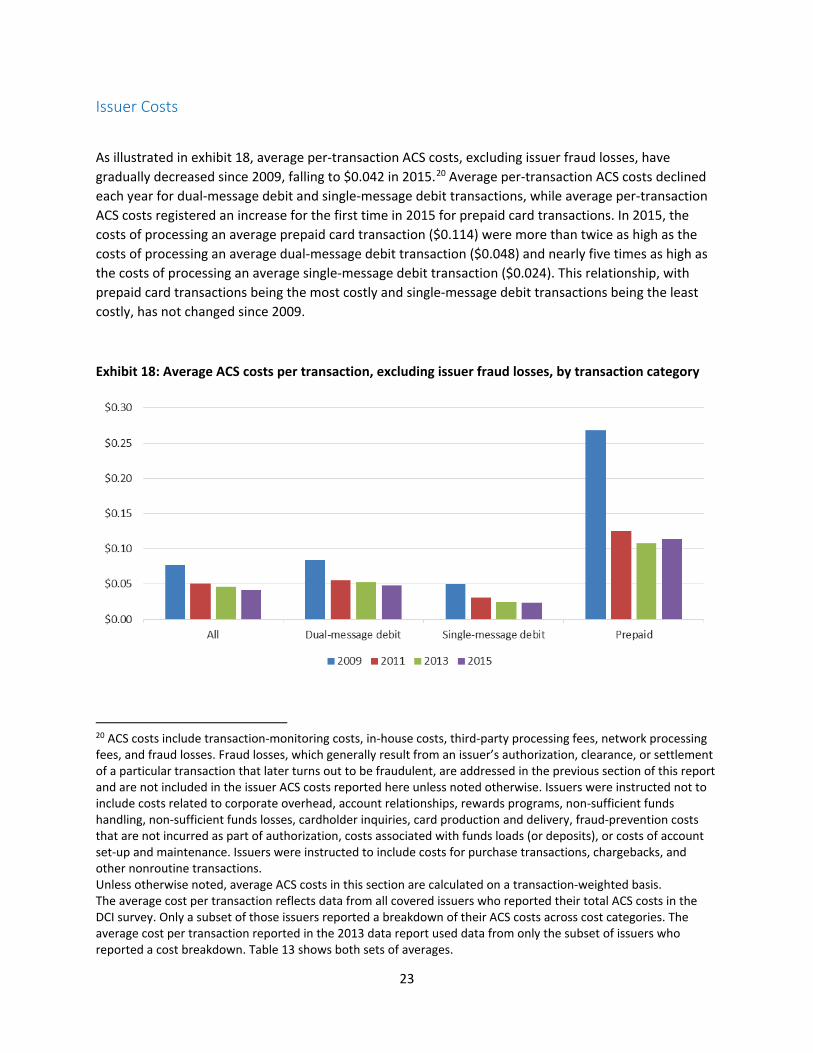
Issuer Costs
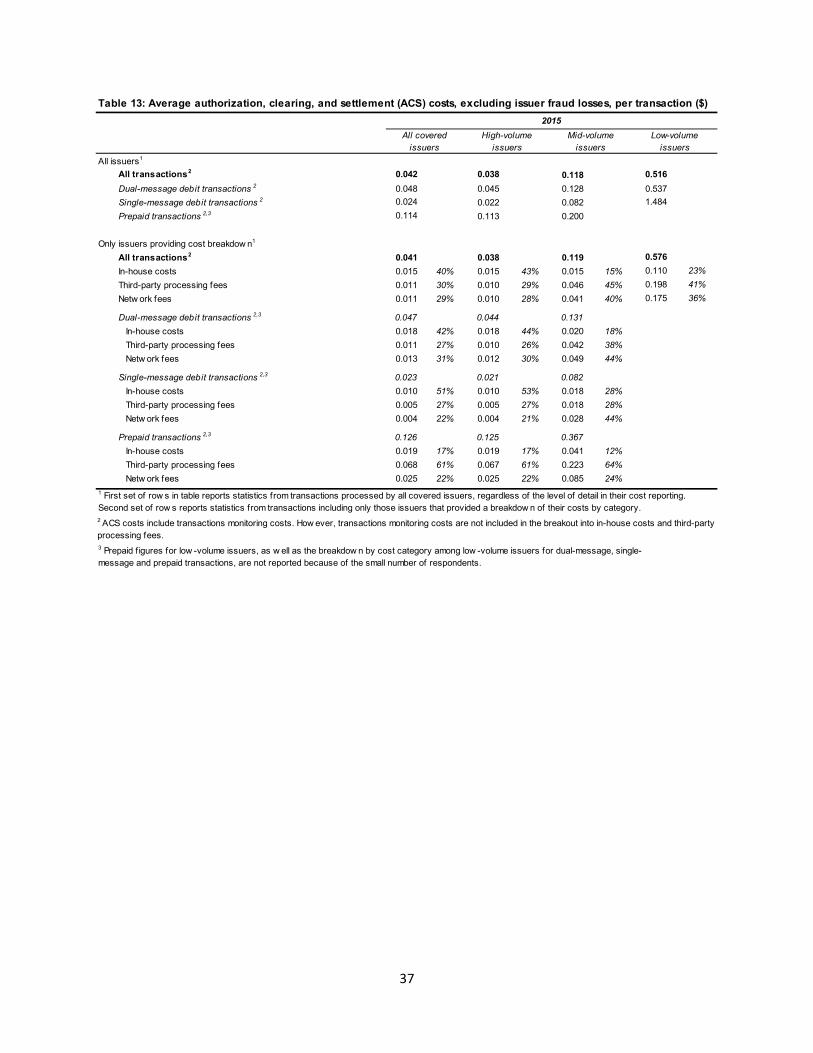
As illustrated in exhibit 18, average per-transaction ACS costs, excluding issuer fraud losses, have gradually decreased since 2009, falling to $0.042 in 2015.20 Average per-transaction ACS costs declined each year for dual-message debit and single-message debit transactions, while average per-transaction ACS costs registered an increase for the first time in 2015 for prepaid card transactions. In 2015, the costs of processing an average prepaid card transaction ($0.114) were more than twice as high as the costs of processing an average dual-message debit transaction ($0.048) and nearly five times as high as the costs of processing an average single-message debit transaction ($0.024). This relationship, with prepaid card transactions being the most costly and single-message debit transactions being the least costly, has not changed since 2009.
Exhibit 18: Average ACS costs per transaction, excluding issuer fraud losses, by transaction category
20 ACS costs include transaction-monitoring costs, in-house costs, third-party processing fees, network processing fees, and fraud losses. Fraud losses, which generally result from an issuer’s authorization, clearance, or settlement of a particular transaction that later turns out to be fraudulent, are addressed in the previous section of this report and are not included in the issuer ACS costs reported here unless noted otherwise. Issuers were instructed not to include costs related to corporate overhead, account relationships, rewards programs, non-sufficient funds handling, non-sufficient funds losses, cardholder inquiries, card production and delivery, fraud-prevention costs that are not incurred as part of authorization, costs associated with funds loads (or deposits), or costs of account set-up and maintenance. Issuers were instructed to include costs for purchase transactions, chargebacks, and other nonroutine transactions. Unless otherwise noted, average ACS costs in this section are calculated on a transaction-weighted basis. The average cost per transaction reflects data from all covered issuers who reported their total ACS costs in the DCI survey. Only a subset of those issuers reported a breakdown of their ACS costs across cost categories. The average cost per transaction reported in the 2013 data report used data from only the subset of issuers who reported a cost breakdown. Table 13 shows both sets of averages.
23
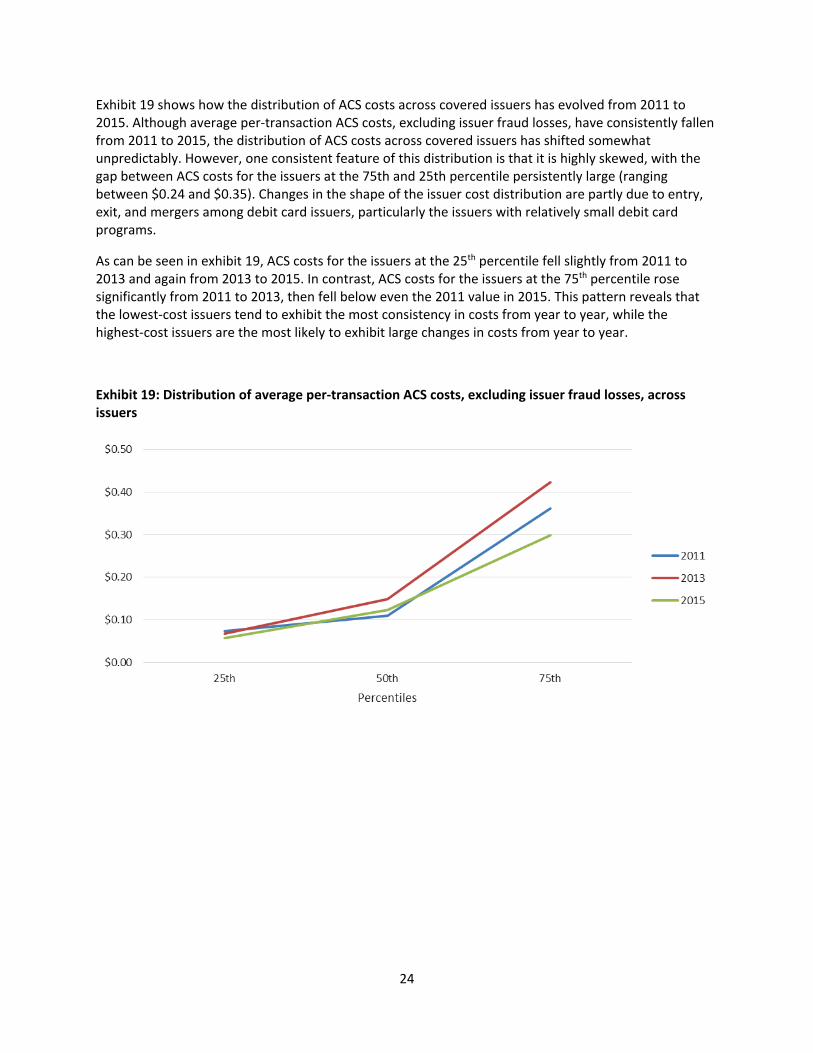
Exhibit 19 shows how the distribution of ACS costs across covered issuers has evolved from 2011 to 2015. Although average per-transaction ACS costs, excluding issuer fraud losses, have consistently fallen from 2011 to 2015, the distribution of ACS costs across covered issuers has shifted somewhat unpredictably. However, one consistent feature of this distribution is that it is highly skewed, with the gap between ACS costs for the issuers at the 75th and 25th percentile persistently large (ranging between $0.24 and $0.35). Changes in the shape of the issuer cost distribution are partly due to entry, exit, and mergers among debit card issuers, particularly the issuers with relatively small debit card programs.
As can be seen in exhibit 19, ACS costs for the issuers at the 25th percentile fell slightly from 2011 to 2013 and again from 2013 to 2015. In contrast, ACS costs for the issuers at the 75th percentile rose significantly from 2011 to 2013, then fell below even the 2011 value in 2015. This pattern reveals that the lowest-cost issuers tend to exhibit the most consistency in costs from year to year, while the highest-cost issuers are the most likely to exhibit large changes in costs from year to year.
Exhibit 19: Distribution of average per-transaction ACS costs, excluding issuer fraud losses, across issuers
24
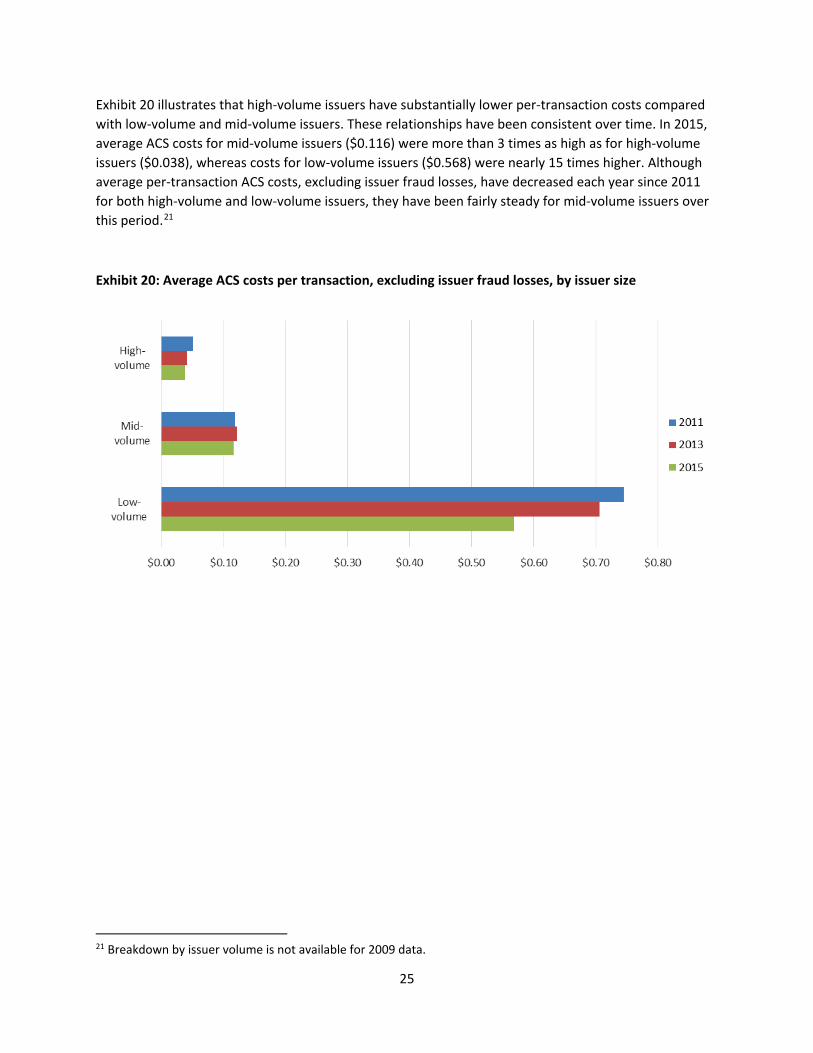
Exhibit 20 illustrates that high-volume issuers have substantially lower per-transaction costs compared with low-volume and mid-volume issuers. These relationships have been consistent over time. In 2015, average ACS costs for mid-volume issuers ($0.116) were more than 3 times as high as for high-volume issuers ($0.038), whereas costs for low-volume issuers ($0.568) were nearly 15 times higher. Although average per-transaction ACS costs, excluding issuer fraud losses, have decreased each year since 2011 for both high-volume and low-volume issuers, they have been fairly steady for mid-volume issuers over this period.21
Exhibit 20: Average ACS costs per transaction, excluding issuer fraud losses, by issuer size
21 Breakdown by issuer volume is not available for 2009 data.
25
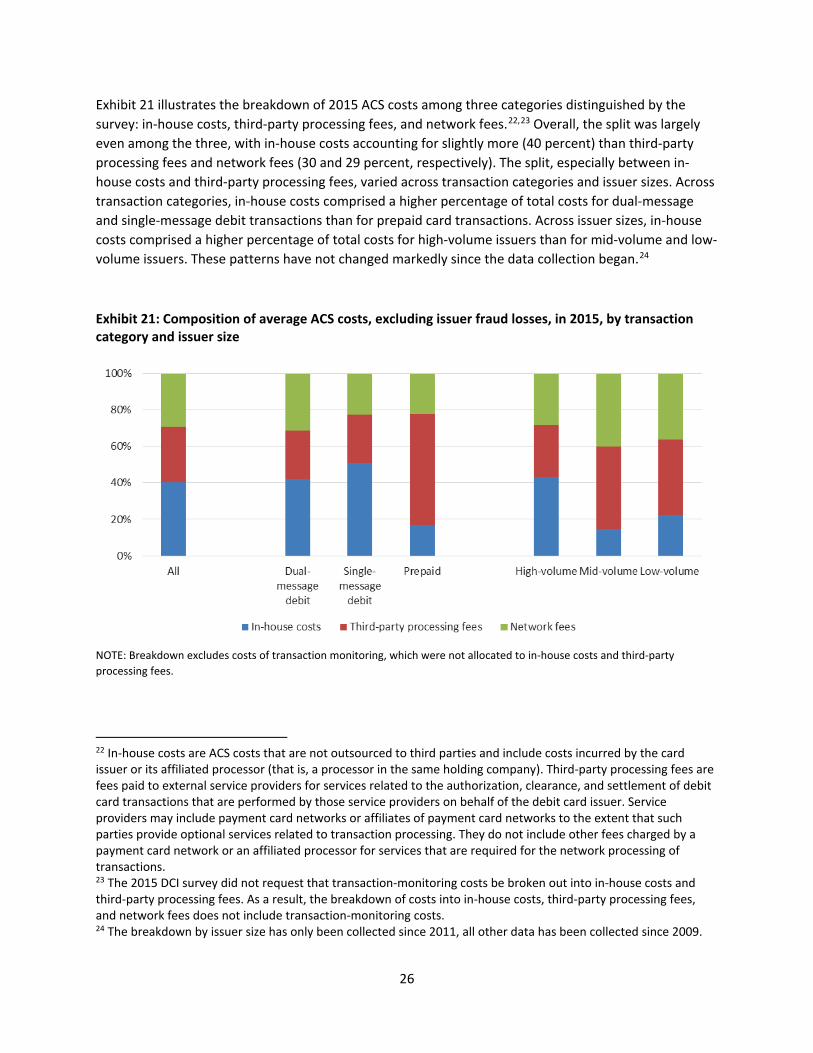
Exhibit 21 illustrates the breakdown of 2015 ACS costs among three categories distinguished by the survey: in-house costs, third-party processing fees, and network fees.22,23 Overall, the split was largely even among the three, with in-house costs accounting for slightly more (40 percent) than third-party processing fees and network fees (30 and 29 percent, respectively). The split, especially between in-house costs and third-party processing fees, varied across transaction categories and issuer sizes. Across transaction categories, in-house costs comprised a higher percentage of total costs for dual-message and single-message debit transactions than for prepaid card transactions. Across issuer sizes, in-house costs comprised a higher percentage of total costs for high-volume issuers than for mid-volume and low-volume issuers. These patterns have not changed markedly since the data collection began.24
Exhibit 21: Composition of average ACS costs, excluding issuer fraud losses, in 2015, by transaction category and issuer size
NOTE: Breakdown excludes costs of transaction monitoring, which were not allocated to in-house costs and third-party processing fees.
22 In-house costs are ACS costs that are not outsourced to third parties and include costs incurred by the card issuer or its affiliated processor (that is, a processor in the same holding company). Third-party processing fees are fees paid to external service providers for services related to the authorization, clearance, and settlement of debit card transactions that are performed by those service providers on behalf of the debit card issuer. Service providers may include payment card networks or affiliates of payment card networks to the extent that such parties provide optional services related to transaction processing. They do not include other fees charged by a payment card network or an affiliated processor for services that are required for the network processing of transactions. 23 The 2015 DCI survey did not request that transaction-monitoring costs be broken out into in-house costs and third-party processing fees. As a result, the breakdown of costs into in-house costs, third-party processing fees, and network fees does not include transaction-monitoring costs. 24 The breakdown by issuer size has only been collected since 2011, all other data has been collected since 2009.
26

Exhibit 22 illustrates how average per-transaction ACS costs, excluding issuer fraud losses, compared with other costs borne by issuers that are directly related to their debit card activities. Per-transaction ACS costs, which averaged $0.042 in 2015, constituted 33 percent of overall debit card costs, including issuer fraud losses, for an average issuer. At the same time, ACS costs were the most variable of the cost categories, as seen across transaction types and issuer volume. By comparison, non-sufficient funds handling, reward program, cardholder inquiry, and fraud-prevention costs did not vary substantially across transaction categories and issuer sizes.25,26
Exhibit 22: Average issuer costs per transaction in 2015, by transaction category and issuer size27
25 Costs associated with cardholder inquiries include costs associated with cardholder communication with a debit card issuer related to specific debit card transactions, such as inquiries about transactions details, errors, and potential fraudulent activity. These communications do not include inquiries that are not related to specific debit card transactions, such as inquiries related to account balances, rewards programs, credit card transactions, and ATM transactions. Rewards and other incentives costs are incentive payments given to cardholders as a result of particular debit card transactions. Costs associated with non-sufficient funds handling are the costs of handling events in which an account does not have enough funds to settle an authorized debit card transaction between the time of authorization of that transaction and the settlement of that transaction. 26 Fraud-prevention and data security costs are costs related to activities aimed at identifying and preventing debit card fraud; costs related to the monitoring of the incidence of, reimbursements received for, and losses incurred from debit card fraud; costs related to responding to suspected and realized debit card fraud in order to prevent or limit losses; costs incurred in securing the data processing and communications infrastructure of debit card operations; and costs incurred in the development or improvement of fraud-prevention technologies. 27 A substantial portion of low-volume issuers did not submit data on non-ACS costs. Thus, figures for this group of issuers should be analyzed with caution.
27
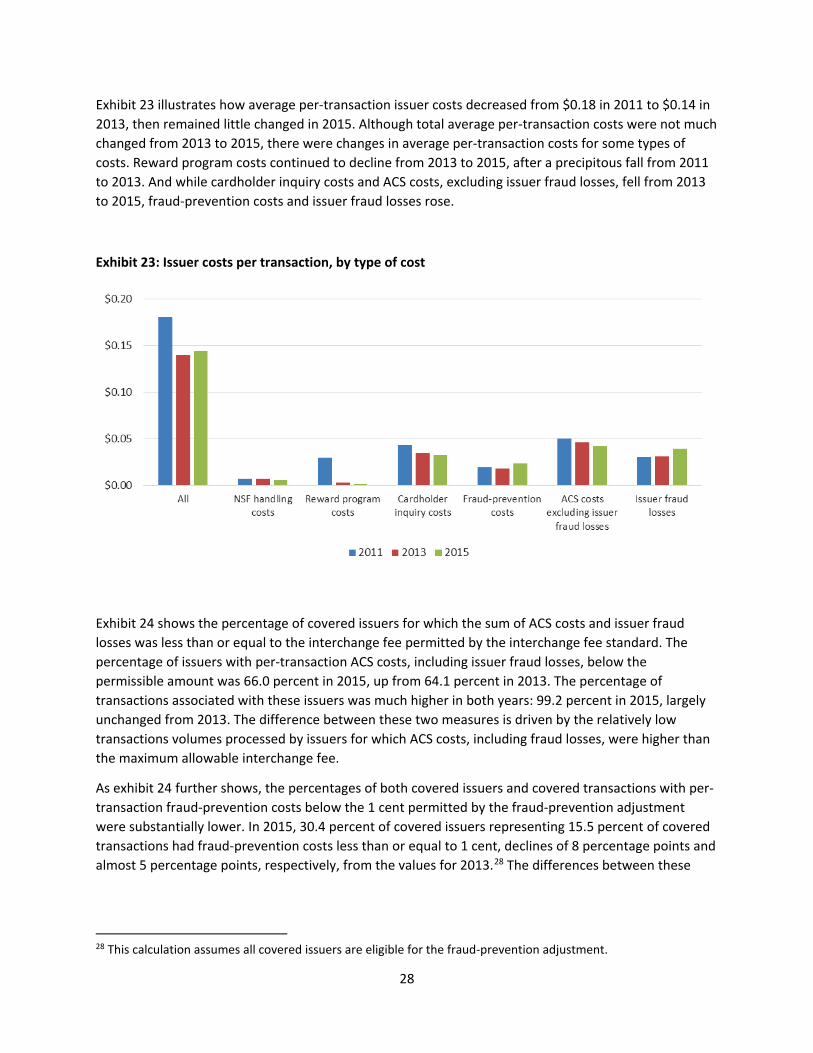
Exhibit 23 illustrates how average per-transaction issuer costs decreased from $0.18 in 2011 to $0.14 in 2013, then remained little changed in 2015. Although total average per-transaction costs were not much changed from 2013 to 2015, there were changes in average per-transaction costs for some types of costs. Reward program costs continued to decline from 2013 to 2015, after a precipitous fall from 2011 to 2013. And while cardholder inquiry costs and ACS costs, excluding issuer fraud losses, fell from 2013 to 2015, fraud-prevention costs and issuer fraud losses rose.
Exhibit 23: Issuer costs per transaction, by type of cost
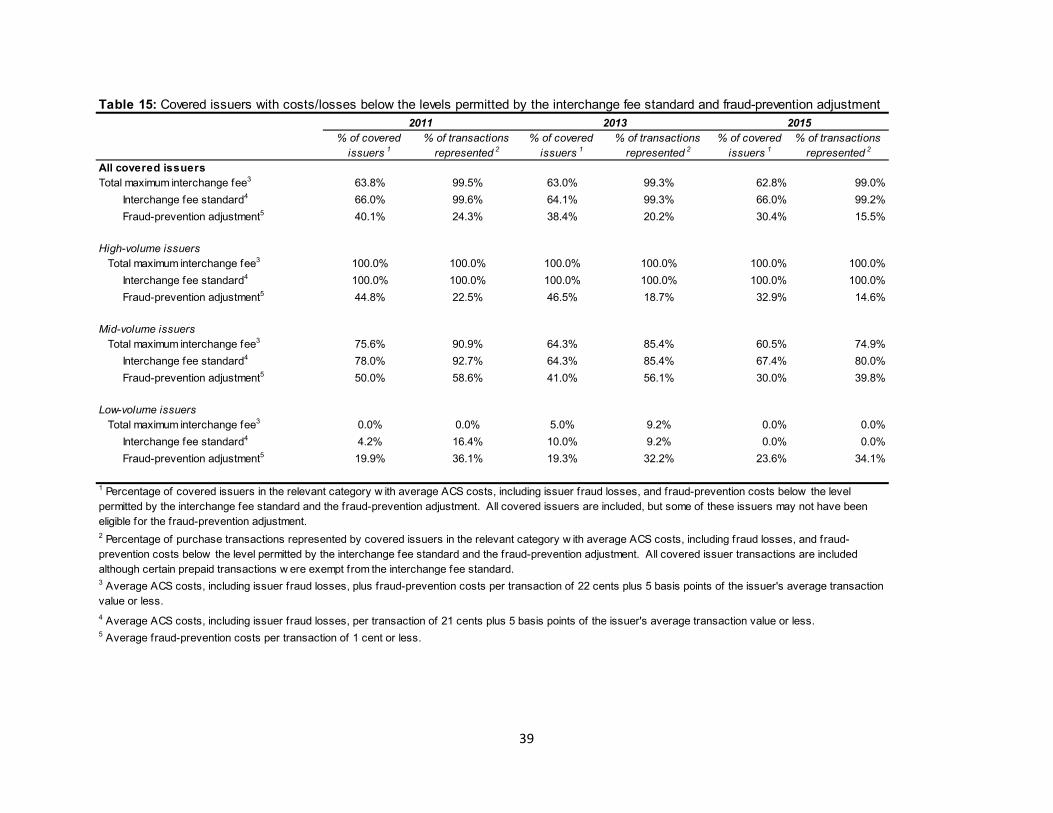
Exhibit 24 shows the percentage of covered issuers for which the sum of ACS costs and issuer fraud losses was less than or equal to the interchange fee permitted by the interchange fee standard. The percentage of issuers with per-transaction ACS costs, including issuer fraud losses, below the permissible amount was 66.0 percent in 2015, up from 64.1 percent in 2013. The percentage of transactions associated with these issuers was much higher in both years: 99.2 percent in 2015, largely unchanged from 2013. The difference between these two measures is driven by the relatively low transactions volumes processed by issuers for which ACS costs, including fraud losses, were higher than the maximum allowable interchange fee.
As exhibit 24 further shows, the percentages of both covered issuers and covered transactions with per-transaction fraud-prevention costs below the 1 cent permitted by the fraud-prevention adjustment were substantially lower. In 2015, 30.4 percent of covered issuers representing 15.5 percent of covered transactions had fraud-prevention costs less than or equal to 1 cent, declines of 8 percentage points and almost 5 percentage points, respectively, from the values for 2013.28 The differences between these
28 This calculation assumes all covered issuers are eligible for the fraud-prevention adjustment.
28
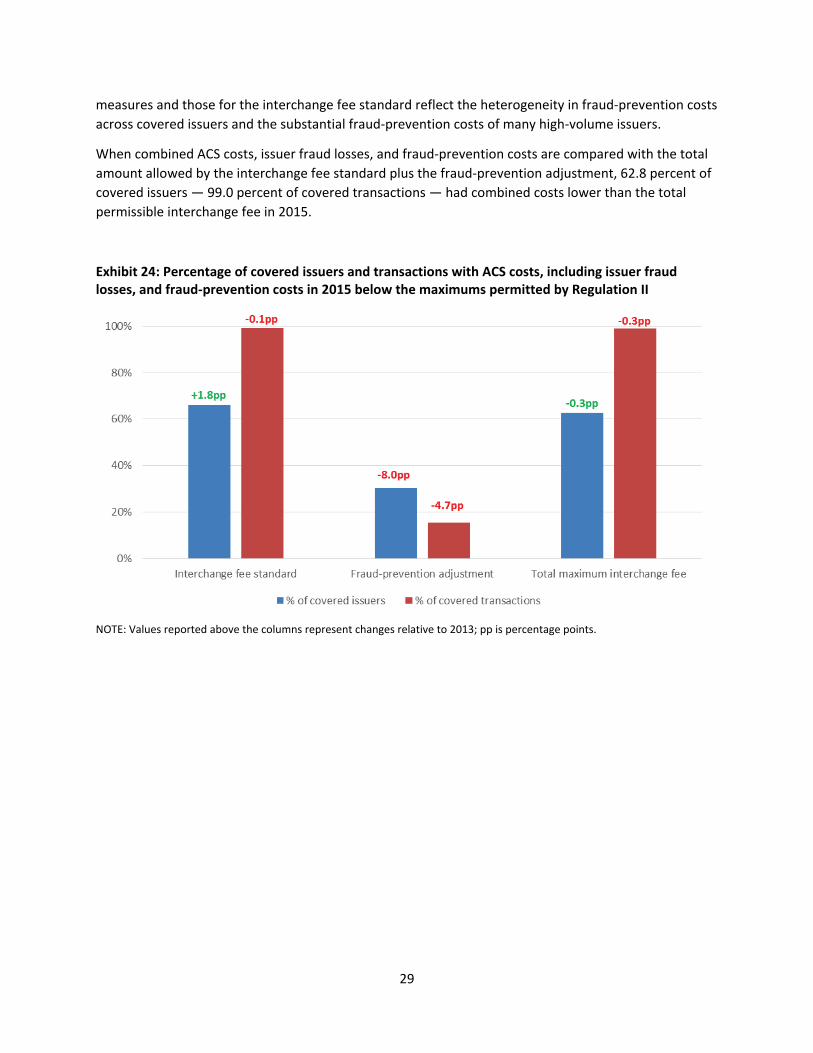
measures and those for the interchange fee standard reflect the heterogeneity in fraud-prevention costs across covered issuers and the substantial fraud-prevention costs of many high-volume issuers.
When combined ACS costs, issuer fraud losses, and fraud-prevention costs are compared with the total amount allowed by the interchange fee standard plus the fraud-prevention adjustment, 62.8 percent of covered issuers — 99.0 percent of covered transactions — had combined costs lower than the total permissible interchange fee in 2015.
Exhibit 24: Percentage of covered issuers and transactions with ACS costs, including issuer fraud losses, and fraud-prevention costs in 2015 below the maximums permitted by Regulation II
NOTE: Values reported above the columns represent changes relative to 2013; pp is percentage points.
29
Tables
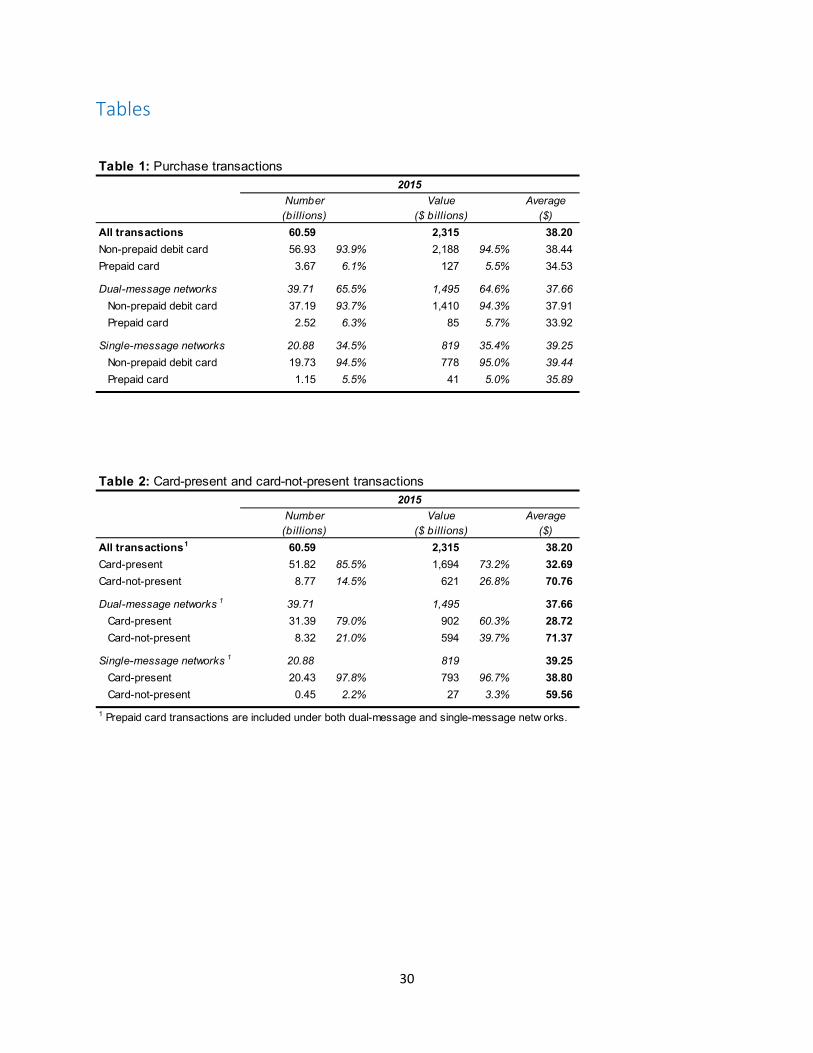
Table 1: Purchase transactions
Number2015
Value Average(billions) ($ billions) ($)
All transactions 60.59 2,315 38.20Non-prepaid debit card 56.93 93.9% 2,188 94.5% 38.44Prepaid card 3.67 6.1% 127 5.5% 34.53
Dual-message networks 39.71 65.5% 1,495 64.6% 37.66Non-prepaid debit card 37.19 93.7% 1,410 94.3% 37.91Prepaid card 2.52 6.3% 85 5.7% 33.92
Single-message networks 20.88 34.5% 819 35.4% 39.25Non-prepaid debit card 19.73 94.5% 778 95.0% 39.44Prepaid card 1.15 5.5% 41 5.0% 35.89
Table 2: Card-present and card-not-present transactions
Number2015
Value Average(billions) ($ billions) ($)
1All transactions 60.59 2,315 38.20Card-present 51.82 85.5% 1,694 73.2% 32.69Card-not-present 8.77 14.5% 621 26.8% 70.76
1Dual-message networks 39.71 1,495 37.66Card-present 31.39 79.0% 902 60.3% 28.72Card-not-present 8.32 21.0% 594 39.7% 71.37
Single-message networks 1 20.88 819 39.25Card-present 20.43 97.8% 793 96.7% 38.80Card-not-present 0.45 2.2% 27 3.3% 59.56
1 Prepaid card transactions are included under both dual-message and single-message netw orks.
30
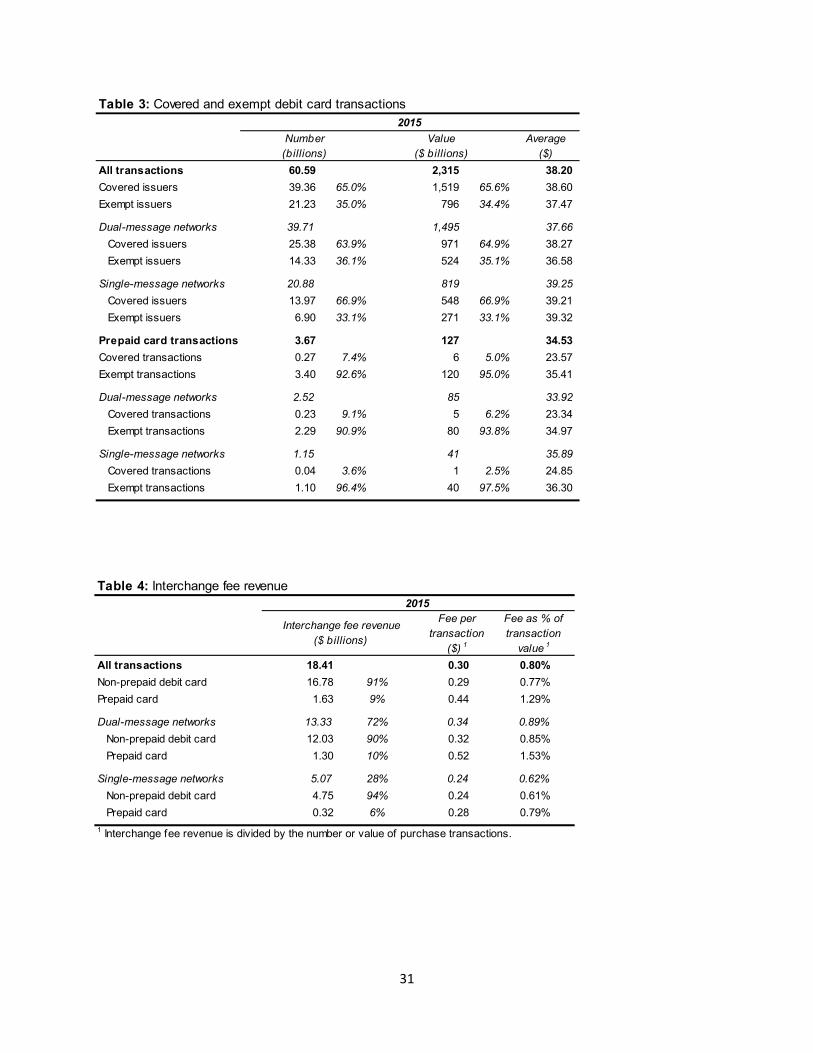
Table 3: Covered and exempt debit card transactions
Number2015
Value Average(billions) ($ billions) ($)
All transactions 60.59 2,315 38.20Covered issuers 39.36 65.0% 1,519 65.6% 38.60Exempt issuers 21.23 35.0% 796 34.4% 37.47
Dual-message networks 39.71 1,495 37.66Covered issuers 25.38 63.9% 971 64.9% 38.27Exempt issuers 14.33 36.1% 524 35.1% 36.58
Single-message networks 20.88 819 39.25Covered issuers 13.97 66.9% 548 66.9% 39.21Exempt issuers 6.90 33.1% 271 33.1% 39.32
Prepaid card transactions 3.67 127 34.53Covered transactions 0.27 7.4% 6 5.0% 23.57Exempt transactions 3.40 92.6% 120 95.0% 35.41
Dual-message networks 2.52 85 33.92Covered transactions 0.23 9.1% 5 6.2% 23.34Exempt transactions 2.29 90.9% 80 93.8% 34.97
Single-message networks 1.15 41 35.89Covered transactions 0.04 3.6% 1 2.5% 24.85Exempt transactions 1.10 96.4% 40 97.5% 36.30
31
Table 4: Interchange fee revenue
Interchange fee revenue($ billions)
2015Fee per
transaction($) 1
Fee as % of transaction
1valueAll transactions 18.41 0.30 0.80%Non-prepaid debit card 16.78 91% 0.29 0.77%Prepaid card 1.63 9% 0.44 1.29%
Dual-message networks 13.33 72% 0.34 0.89%Non-prepaid debit card 12.03 90% 0.32 0.85%Prepaid card 1.30 10% 0.52 1.53%
Single-message networks 5.07 28% 0.24 0.62%Non-prepaid debit card 4.75 94% 0.24 0.61%Prepaid card 0.32 6% 0.28 0.79%
1 Interchange fee revenue is divided by the number or value of purchase transactions.
All transactions
2015
Interchange fee revenue($ billions)
Fee per transaction
($) 1
Fee as % of transaction
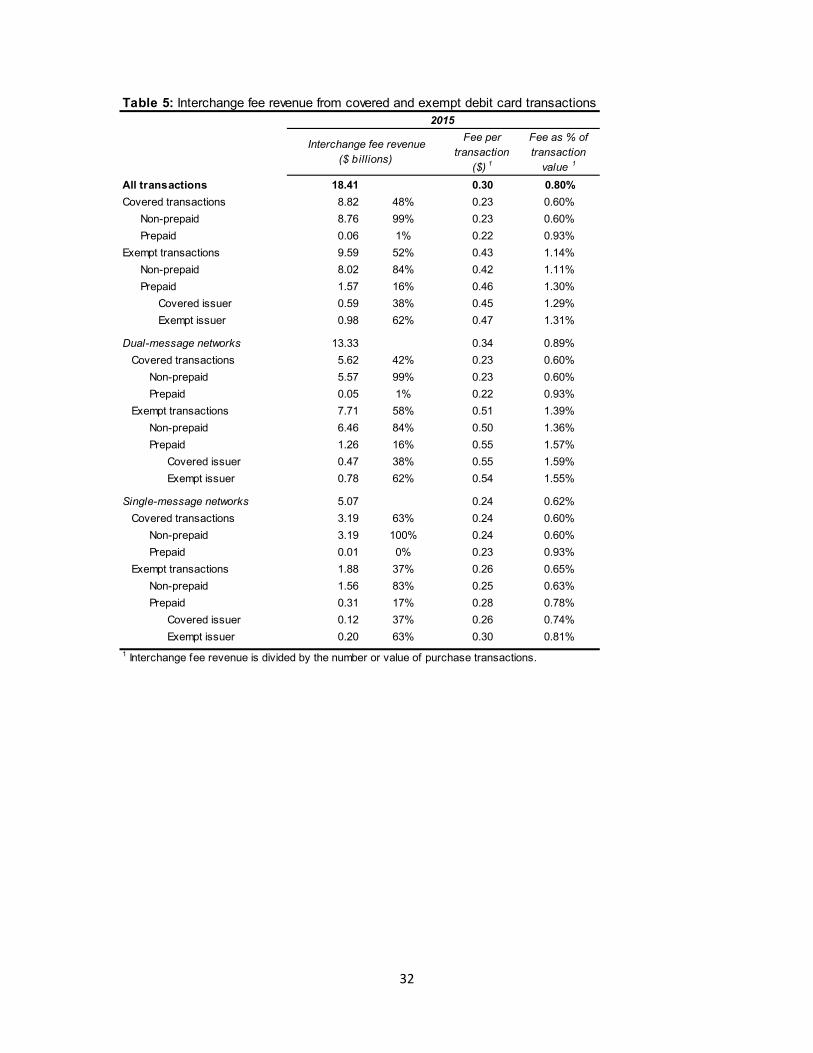
1value 18.41 0.30 0.80%
Covered transactions 8.82 48% 0.23 0.60%Non-prepaid 8.76 99% 0.23 0.60%Prepaid 0.06 1% 0.22 0.93%
Exempt transactions 9.59 52% 0.43 1.14%Non-prepaid 8.02 84% 0.42 1.11%Prepaid 1.57 16% 0.46 1.30%
Covered issuer 0.59 38% 0.45 1.29%Exempt issuer 0.98 62% - 0.47 1.31%
Dual-message networks 13.33 0.34 0.89%Covered transactions 5.62 42% 0.23 0.60%
Non-prepaid 5.57 99% 0.23 0.60%Prepaid 0.05 1% 0.22 0.93%
Exempt transactions 7.71 58% 0.51 1.39%Non-prepaid 6.46 84% 0.50 1.36%Prepaid 1.26 16% 0.55 1.57%
Covered issuer 0.47 38% 0.55 1.59%Exempt issuer 0.78 62% - 0.54 1.55%
Single-message networks 5.07 0.24 0.62%Covered transactions 3.19 63% 0.24 0.60%
Non-prepaid 3.19 100% 0.24 0.60%Prepaid 0.01 0% 0.23 0.93%
Exempt transactions 1.88 37% 0.26 0.65%Non-prepaid 1.56 83% 0.25 0.63%Prepaid 0.31 17% 0.28 0.78%
Covered issuer 0.12 37% 0.26 0.74%Exempt issuer 0.20 63% 0.30 0.81%
1 Interchange fee revenue is divided by the number or value of purchase transactions.
Table 5: Interchange fee revenue from covered and exempt debit card transactions
32
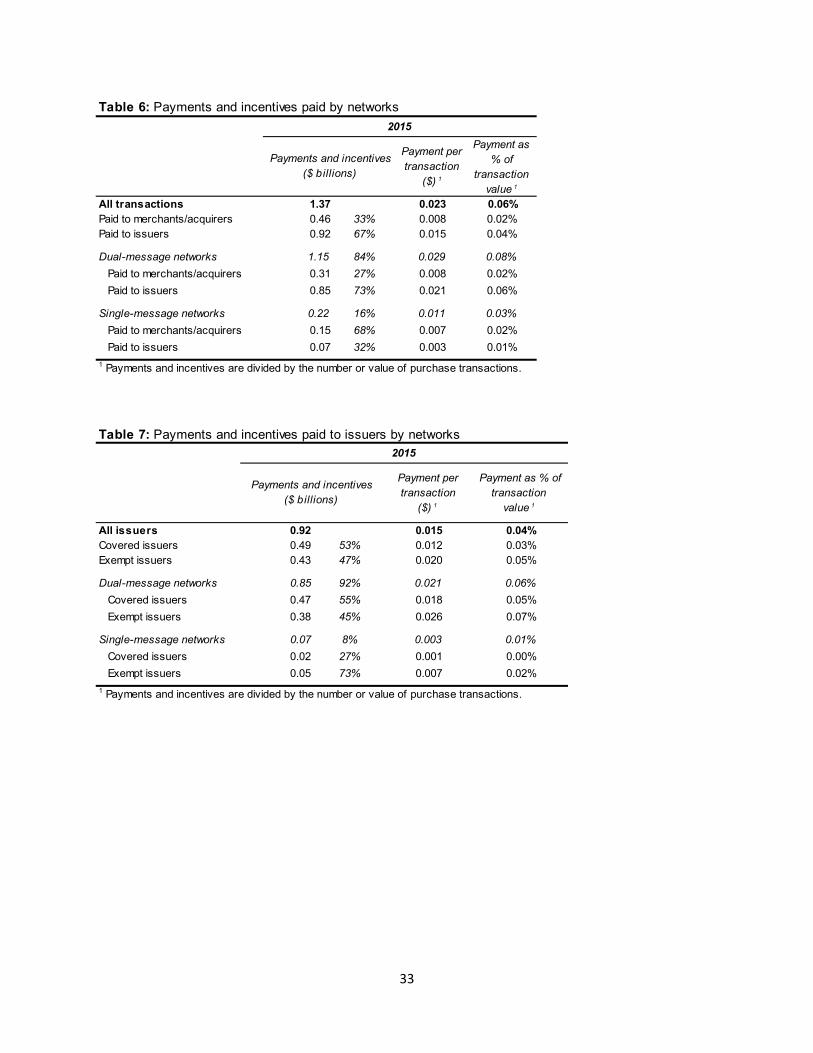
Table 6: Payments and incentives paid by networks2015
Payment per Payments and incentivestransaction($ billions)
($) 1
Payment as % of
transaction value 1
All transactions 1.37 0.023 0.06%Paid to merchants/acquirers 0.46 33% 0.008 0.02%Paid to issuers 0.92 67% 0.015 0.04%
Dual-message networks 1.15 84% 0.029 0.08%Paid to merchants/acquirers 0.31 27% 0.008 0.02%Paid to issuers 0.85 73% 0.021 0.06%
Single-message networks 0.22 16% 0.011 0.03%Paid to merchants/acquirers 0.15 68% 0.007 0.02%Paid to issuers 0.07 32% 0.003 0.01%
1 Payments and incentives are divided by the number or value of purchase transactions.
2015
Payments and incentives($ billions)
Payment per transaction
($) 1
Payment as % of transaction
value 1
All issuers 0.92 0.015 0.04%Covered issuers 0.49 53% 0.012 0.03%Exempt issuers 0.43 47% 0.020 0.05%
Dual-message networks 0.85 92% 0.021 0.06%Covered issuers 0.47 55% 0.018 0.05%Exempt issuers 0.38 45% 0.026 0.07%
Single-message networks 0.07 8% 0.003 0.01%Covered issuers 0.02 27% 0.001 0.00%Exempt issuers 0.05 73% 0.007 0.02%
1 Payments and incentives are divided by the number or value of purchase transactions.
Table 7: Payments and incentives paid to issuers by networks
33
Network fee payments($ billions)
2015Fee per
transaction($) 1
Fee as % of transaction
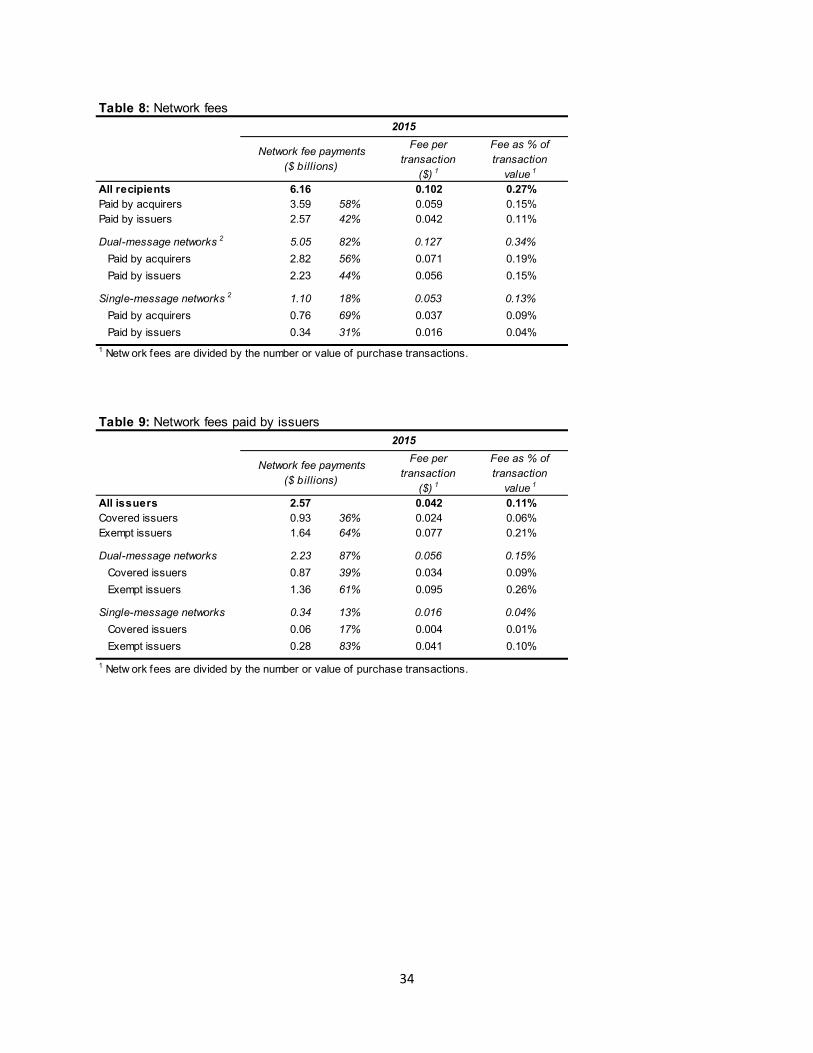
1valueAll recipients 6.16 0.102 0.27%Paid by acquirers 3.59 58% 0.059 0.15%Paid by issuers 2.57 42% 0.042 0.11%
2Dual-message networks 5.05 82% 0.127 0.34%Paid by acquirers 2.82 56% 0.071 0.19%Paid by issuers 2.23 44% 0.056 0.15%
Single-message networks 2 1.10 18% 0.053 0.13%Paid by acquirers 0.76 69% 0.037 0.09%Paid by issuers 0.34 31% 0.016 0.04%
Table 8: Network fees
1 Netw ork fees are divided by the number or value of purchase transactions.
Network fee payments($ billions)
2015Fee per
transaction($) 1
Fee as % of transaction
1valueAll issuers 2.57 0.042 0.11%Covered issuers 0.93 36% 0.024 0.06%Exempt issuers 1.64 64% 0.077 0.21%
Dual-message networks 2.23 87% 0.056 0.15%Covered issuers 0.87 39% 0.034 0.09%Exempt issuers 1.36 61% 0.095 0.26%
Single-message networks 0.34 13% 0.016 0.04%Covered issuers 0.06 17% 0.004 0.01%Exempt issuers 0.28 83% 0.041 0.10%
1 Netw ork fees are divided by the number or value of purchase transactions.
Table 9: Network fees paid by issuers
34
2015
Fraud as % of purchase 1transactions
Average loss per fraudulent
transaction ($) 2
3All transactions 0.056% 70
Card-not-present fraud 0.029% 51% 58
Counterfeit fraud 0.019% 34% 91
Lost and stolen fraud 0.006% 11% 61
Other fraud 0.002% 3% 97
Dual-message debit transactions 0.080% 0% 64
Card-not-present fraud 0.045% 56% 57
Counterfeit fraud 0.026% 33% 79
Lost and stolen fraud 0.007% 9% 50
Other fraud 0.001% 1% 115
Single-message debit transactions 0.014% 0% 136
Card-not-present fraud 0.001% 6% 122
Counterfeit fraud 0.007% 51% 172
Lost and stolen fraud 0.005% 32% 96
Other fraud 0.002% 11% 91
Prepaid transactions 0.062% 0% 50
Card-not-present fraud 0.029% 47% 46
Counterfeit fraud 0.013% 20% 65
Lost and stolen fraud 0.011% 17% 39
Other fraud 0.009% 15% 59
1 Number of fraudulent transactions divided by the total number of purchase transactions.2 Total fraud losses to all parties (merchants, cardholders, and issuers) divided by the number of fraudulent transactions3 Only fraudulent activity reported by covered issuers is included.
Table 10: Fraudulent debit card activity reported by covered issuers
35
All fraud 1 Card-not-present fraud 2 Counterfeit fraud Lost and stolen fraudLoss per Loss as share Loss per Loss as share of Loss per Loss as share of Loss per Loss as share of
transaction of transaction transaction transaction value transaction transaction value transaction transaction value ($) 3 value (bp) 4 ($) 3 (bp) 4 ($) 3 (bp) 4 ($) 3 (bp) 4
5All transactions 0.040 10.29 0.017 4.34 0.017 4.53 0.004 1.03Merchant losses 0.015 3.98 39% 0.012 3.00 69% 0.003 0.68 15% <0.001 0.20 20%Cardholder losses 0.001 0.31 3% <0.001 0.13 3% <0.001 0.10 2% <0.001 0.07 7%Issuer losses 0.023 5.99 58% 0.005 1.21 28% 0.014 3.76 83% 0.003 0.76 73%
Dual-message debit transactions 0.052 13.45 0.026 6.72 0.021 5.40 0.004 0.98Merchant losses 0.024 6.17 46% 0.018 4.72 70% 0.004 1.02 19% 0.001 0.28 29%Cardholder losses 0.001 0.35 3% <0.001 0.21 3% <0.001 0.11 2% <0.001 0.04 4%Issuer losses 0.027 6.93 51% 0.007 1.79 27% 0.016 4.27 79% 0.003 0.66 67%
Single-message debit transactions 0.019 4.85 0.001 0.28 0.012 3.12 0.004 1.10Merchant losses 0.001 0.27 6% <0.001 0.09 32% <0.001 0.08 2% <0.001 0.07 6%Cardholder losses 0.001 0.27 6% <0.001 <0.01 0% <0.001 0.09 3% <0.001 0.13 12%Issuer losses 0.017 4.31 89% <0.001 0.19 67% 0.012 2.95 95% 0.004 0.90 81%
Prepaid transactions 0.032 11.17 0.014 4.82 0.008 2.93 0.004 1.50Merchant losses 0.010 3.62 32% 0.008 2.76 57% 0.002 0.54 18% <0.001 0.19 13%Cardholder losses <0.001 0.06 1% <0.001 0.00 0% <0.001 0.00 0% <0.001 0.01 0%Issuer losses 0.021 7.50 67% 0.006 2.06 43% 0.007 2.39 81% 0.004 1.30 87%
1 Card-not-present, counterfeit, and lost and stolen fraud losses do not necessarily sum to all fraud losses. Some fraud losses could not be categorized by issuers into the categories above but are still included under all fraud losses.2 Card-not-present fraud losses may also be reported in another second category.3 Fraud losses divided by the number of purchase transactions (both fraudulent and non-fraudulent).4 Fraud losses divided by the value of purchase transactions (both fraudulent and non-fraudulent).5 Only fraud losses reported by covered issuers are included.
Table 11: 2015 fraud losses reported by covered issuers
Number of
covered issuers
% of transactions 1
% of transaction
1value
Average transaction value ($) 2
All covered issuers 129 38.47High-volume issuers (more than 100 million transactions) 35 27% 95.12% 94.58% 38.25Mid-volume issuers (1-100 million transactions) 65 50% 4.86% 5.39% 42.63Low -volume issuers (less than 1 million transactions) 29 22% 0.02% 0.03% 72.73
Table 12: Covered issuers by 2015 volume
1 The percentage of the total number or value of covered issuer transactions. Covered issuers represent about 65 percent of all debit card transactions.2 Average transaction values in this table are calculated from the Debit Card Issuer survey. Average transaction values reported in tables 1-3 are calculated from the Payment Card Netw ork survey.
36
6
7
Note: Statistics exclude responses in w hich the issuer reported issuer fraud losses but w as unable to report gross fraud losses. Therefore, statistics may differ from those in Table 14, w hich include responses in w hich the issuer w as able to report only issuer fraud losses.
6 Dual-message debit transactions is transactions initiated w ith non-prepaid debit cards processed over dual-message netw orks.7 Single-message debit transactions is transactions initiated w ith non-prepaid debit cards processed over single-message netw orks.
All covered 2015
High-volume Mid-volume Low-volume issuers issuers issuers issuers
1All issuers2All transactions 0.042 0.038 0.118
2Dual-message debit transactions 0.048 0.045 0.128 0.5372Single-message debit transactions 0.024 0.022 0.082
2,3Prepaid transactions 0.114 0.113 0.200
1Only issuers providing cost breakdow n2All transactions 0.041 0.038 0.119
In-house costs 0.015 40% 0.015 43% 0.015 15%Third-party processing fees 0.011 30% 0.010 29% 0.046 45%Netw ork fees 0.011 29% 0.010 28% 0.041 40%
2,3Dual-message debit transactions 0.047 0.044 0.131In-house costs 0.018 42% 0.018 44% 0.020 18%Third-party processing fees 0.011 27% 0.010 26% 0.042 38%Netw ork fees 0.013 31% 0.012 30% 0.049 44%
2,3Single-message debit transactions 0.023 0.021 0.082In-house costs 0.010 51% 0.010 53% 0.018 28%Third-party processing fees 0.005 27% 0.005 27% 0.018 28%Netw ork fees 0.004 22% 0.004 21% 0.028 44%
2,3Prepaid transactions 0.126 0.125 0.367In-house costs 0.019 17% 0.019 17% 0.041 12%Third-party processing fees 0.068 61% 0.067 61% 0.223 64%Netw ork fees 0.025 22% 0.025 22% 0.085 24%
1 First set of row s in table reports statistics from transactions processed by all covered issuers, regardless of the level of detail in their cost reporting. Second set of row s reports statistics from transactions including only those issuers that provided a breakdow n of their costs by category.2 ACS costs include transactions monitoring costs. How ever, transactions monitoring costs are not included in the breakout into in-house costs and third-party processing fees.3 Prepaid f igures for low -volume issuers, as w ell as the breakdow n by cost category among low -volume issuers for dual-message, single-message and prepaid transactions, are not reported because of the small number of respondents.
Table 13: Average authorization, clearing, and settlement (ACS) costs, excluding issuer fraud losses, per transaction ($)
37
0.516
1.484
0.5760.1100.1980.175
23%41%36%
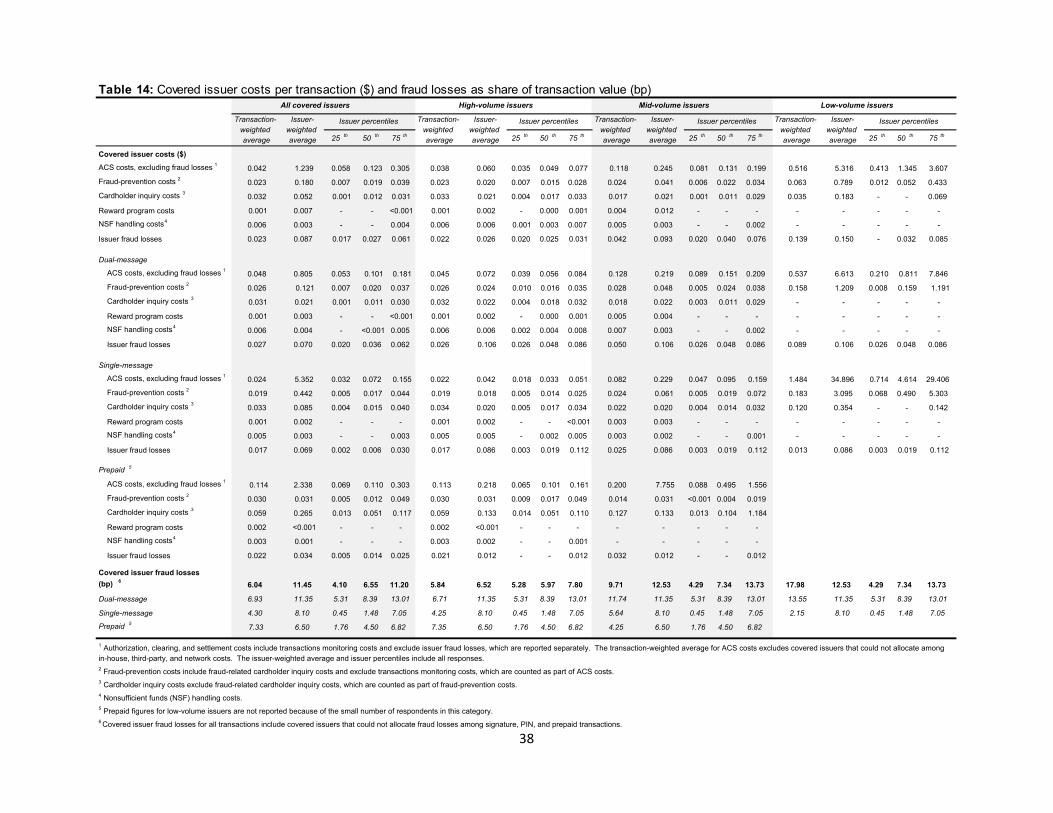
Table 14: Covered issuer costs per transaction ($) and fraud losses as share of transaction value (bp) All covered issuers High-volume issuers Mid-volume issuers Low-volume issuers
Transaction-weighted average
Issuer-weighted average 25 th 50 th 75 th
Issuer percentiles Transaction-weighted average
Issuer-weighted average 25 th 50 th 75 th
Issuer percentiles Transaction-weighted average
Issuer-weighted average 25 th 50 th 75 th
Issuer percentiles Transaction-weighted average
Issuer-weighted average 25 th 50 th 75 th
Issuer percentiles
Covered issuer costs ($) ACS costs, excluding fraud losses 1 0.042 1.239 0.058 0.123 0.305 0.038 0.060 0.035 0.049 0.077 0.118 0.245 0.081 0.131 0.199 0.516 5.316 0.413 1.345 3.607
Fraud-prevention costs 2 0.023 0.180 0.007 0.019 0.039 0.023 0.020 0.007 0.015 0.028 0.024 0.041 0.006 0.022 0.034 0.063 0.789 0.012 0.052 0.433
Cardholder inquiry costs 3 0.032 0.052 0.001 0.012 0.031 0.033 0.021 0.004 0.017 0.033 0.017 0.021 0.001 0.011 0.029 0.035 0.183 - - 0.069
Reward program costs 0.001 0.007 - - <0.001 0.001 0.002 - 0.000 0.001 0.004 0.012 - - - - - - - -
NSF handling costs4 0.006 0.003 - - 0.004 0.006 0.006 0.001 0.003 0.007 0.005 0.003 - - 0.002 - - - - -
Issuer fraud losses 0.023 0.087 0.017 0.027 0.061 0.022 0.026 0.020 0.025 0.031 0.042 0.093 0.020 0.040 0.076 0.139 0.150 - 0.032 0.085
Dual-message
ACS costs, excluding fraud losses 1 0.048 0.805 0.053 0.101 0.181 0.045 0.072 0.039 0.056 0.084 0.128 0.219 0.089 0.151 0.209 0.537 6.613 0.210 0.811 7.846
Fraud-prevention costs 2 0.026 0.121 0.007 0.020 0.037 0.026 0.024 0.010 0.016 0.035 0.028 0.048 0.005 0.024 0.038 0.158 1.209 0.008 0.159 1.191
Cardholder inquiry costs 3 0.031 0.021 0.001 0.011 0.030 0.032 0.022 0.004 0.018 0.032 0.018 0.022 0.003 0.011 0.029 - - - - -
Reward program costs 0.001 0.003 - - <0.001 0.001 0.002 - 0.000 0.001 0.005 0.004 - - - - - - - -
NSF handling costs4 0.006 0.004 - <0.001 0.005 0.006 0.006 0.002 0.004 0.008 0.007 0.003 - - 0.002 - - - - -
Issuer fraud losses 0.027 0.070 0.020 0.036 0.062 0.026 0.106 0.026 0.048 0.086 0.050 0.106 0.026 0.048 0.086 0.089 0.106 0.026 0.048 0.086
Single-message
ACS costs, excluding fraud losses 1 0.024 5.352 0.032 0.072 0.155 0.022 0.042 0.018 0.033 0.051 0.082 0.229 0.047 0.095 0.159 1.484 34.896 0.714 4.614 29.406
Fraud-prevention costs 2 0.019 0.442 0.005 0.017 0.044 0.019 0.018 0.005 0.014 0.025 0.024 0.061 0.005 0.019 0.072 0.183 3.095 0.068 0.490 5.303
Cardholder inquiry costs 3 0.033 0.085 0.004 0.015 0.040 0.034 0.020 0.005 0.017 0.034 0.022 0.020 0.004 0.014 0.032 0.120 0.354 - - 0.142
Reward program costs 0.001 0.002 - - - 0.001 0.002 - - <0.001 0.003 0.003 - - - - - - - -
NSF handling costs4 0.005 0.003 - - 0.003 0.005 0.005 - 0.002 0.005 0.003 0.002 - - 0.001 - - - - -
Issuer fraud losses 0.017 0.069 0.002 0.006 0.030 0.017 0.086 0.003 0.019 0.112 0.025 0.086 0.003 0.019 0.112 0.013 0.086 0.003 0.019 0.112
Prepaid 5
ACS costs, excluding fraud losses 1 0.114 2.338 0.069 0.110 0.303 0.113 0.218 0.065 0.101 0.161 0.200 7.755 0.088 0.495 1.556
Fraud-prevention costs 2 0.030 0.031 0.005 0.012 0.049 0.030 0.031 0.009 0.017 0.049 0.014 0.031 <0.001 0.004 0.019
Cardholder inquiry costs 3 0.059 0.265 0.013 0.051 0.117 0.059 0.133 0.014 0.051 0.110 0.127 0.133 0.013 0.104 1.184
Reward program costs 0.002 <0.001 - - - 0.002 <0.001 - - - - - - - -
NSF handling costs4 0.003 0.001 - - - 0.003 0.002 - - 0.001 - - - - -
Issuer fraud losses 0.022 0.034 0.005 0.014 0.025 0.021 0.012 - - 0.012 0.032 0.012 - - 0.012
Covered issuer fraud losses (bp) 6 6.04 11.45 4.10 6.55 11.20 5.84 6.52 5.28 5.97 7.80 9.71 12.53 4.29 7.34 13.73 17.98 12.53 4.29 7.34 13.73
Dual-message 6.93 11.35 5.31 8.39 13.01 6.71 11.35 5.31 8.39 13.01 11.74 11.35 5.31 8.39 13.01 13.55 11.35 5.31 8.39 13.01
Single-message 4.30 8.10 0.45 1.48 7.05 4.25 8.10 0.45 1.48 7.05 5.64 8.10 0.45 1.48 7.05 2.15 8.10 0.45 1.48 7.05
Prepaid 5 7.33 6.50 1.76 4.50 6.82 7.35 6.50 1.76 4.50 6.82 4.25 6.50 1.76 4.50 6.82
1 Authorization, clearing, and settlement costs include transactions monitoring costs and exclude issuer fraud losses, which are reported separately. The transaction-weighted average for ACS costs excludes covered issuers that could not allocate among in-house, third-party, and network costs. The issuer-weighted average and issuer percentiles include all responses. 2 Fraud-prevention costs include fraud-related cardholder inquiry costs and exclude transactions monitoring costs, which are counted as part of ACS costs. 3 Cardholder inquiry costs exclude fraud-related cardholder inquiry costs, which are counted as part of fraud-prevention costs. 4 Nonsufficient funds (NSF) handling costs. 5 Prepaid figures for low-volume issuers are not reported because of the small number of respondents in this category. 6 Covered issuer fraud losses for all transactions include covered issuers that could not allocate fraud losses among signature, PIN, and prepaid transactions.
38
% of covered 1issuers
2011 2013 2015% of transactions
represented 2% of covered
1issuers% of transactions
represented 2% of covered
1issuers% of transactions
represented 2
All covered issuers3Total maximum interchange fee 63.8% 99.5% 63.0% 99.3% 62.8% 99.0%
Interchange fee standard4 66.0% 99.6% 64.1% 99.3% 66.0% 99.2% Fraud-prevention adjustment5 40.1% 24.3% 38.4% 20.2% 30.4% 15.5%
High-volume issuers3Total maximum interchange fee 100.0% 100.0% 100.0% 100.0% 100.0% 100.0%
Interchange fee standard4 100.0% 100.0% 100.0% 100.0% 100.0% 100.0% Fraud-prevention adjustment5 44.8% 22.5% 46.5% 18.7% 32.9% 14.6%
Mid-volume issuers3Total maximum interchange fee 75.6% 90.9% 64.3% 85.4% 60.5% 74.9%
Interchange fee standard4 78.0% 92.7% 64.3% 85.4% 67.4% 80.0% Fraud-prevention adjustment5 50.0% 58.6% 41.0% 56.1% 30.0% 39.8%
Low-volume issuers3Total maximum interchange fee 0.0% 0.0% 5.0% 9.2% 0.0% 0.0%
Interchange fee standard4 4.2% 16.4% 10.0% 9.2% 0.0% 0.0% Fraud-prevention adjustment5 19.9% 36.1% 19.3% 32.2% 23.6% 34.1%
Table 15: Covered issuers with costs/losses below the levels permitted by the interchange fee standard and fraud-prevention adjustment
1 Percentage of covered issuers in the relevant category w ith average ACS costs, including issuer fraud losses, and fraud-prevention costs below the level permitted by the interchange fee standard and the fraud-prevention adjustment. All covered issuers are included, but some of these issuers may not have been eligible for the fraud-prevention adjustment.2 Percentage of purchase transactions represented by covered issuers in the relevant category w ith average ACS costs, including fraud losses, and fraud-prevention costs below the level permitted by the interchange fee standard and the fraud-prevention adjustment. All covered issuer transactions are included although certain prepaid transactions w ere exempt from the interchange fee standard.3 Average ACS costs, including issuer fraud losses, plus fraud-prevention costs per transaction of 22 cents plus 5 basis points of the issuer's average transaction value or less.4 Average ACS costs, including issuer fraud losses, per transaction of 21 cents plus 5 basis points of the issuer's average transaction value or less.5 Average fraud-prevention costs per transaction of 1 cent or less.
39


![6 [2008-06-08] Payment cards and interchange chapter - Final · 2019-12-13 · Chapter 6 Payment Cards and Interchange Banking Enquiry Report to the Competition Commissioner Contains](https://static.fdocuments.in/doc/165x107/5ebdb2ecf30bc30402292510/6-2008-06-08-payment-cards-and-interchange-chapter-2019-12-13-chapter-6-payment.jpg)