
2015 Integrated Resource Plan Joint Public Session Content/About TVA/Our... · 2015 Integrated...
28
2015 Integrated Resource Plan Joint Public Session TVA Regional Energy Resource Council and TVA Board April 20, 2015
Transcript of 2015 Integrated Resource Plan Joint Public Session Content/About TVA/Our... · 2015 Integrated...

2015 Integrated Resource PlanJoint Public Session
TVA Regional Energy Resource Council and TVA Board April 20, 2015


Safety First

| 4
TVA and the Valley’s Energy Future is Evolving
Image Source: EPRI
Supply Side Demand Side
Integrated Resource Plan
The IRP is a study of how TVA might meet energy and capacity needs in a variety of future environments.
| 5

TVA’s Mission Remains the Cornerstone
| 6
Energy
Environment
Economic
Development
IRP

Today’s Session
| 7
• Panel sessions with Q&A from the Board and the RERC • Renewables• Energy Efficiency• Utility Landscape
• Public listening session• Conclude by 4:45pm

IRP Preliminary Results
Scott SelfVice President, Enterprise Planning
TVA

TVA’s Mission is the Cornerstone
| 9
Energy
Environment
Economic
Development
IRP
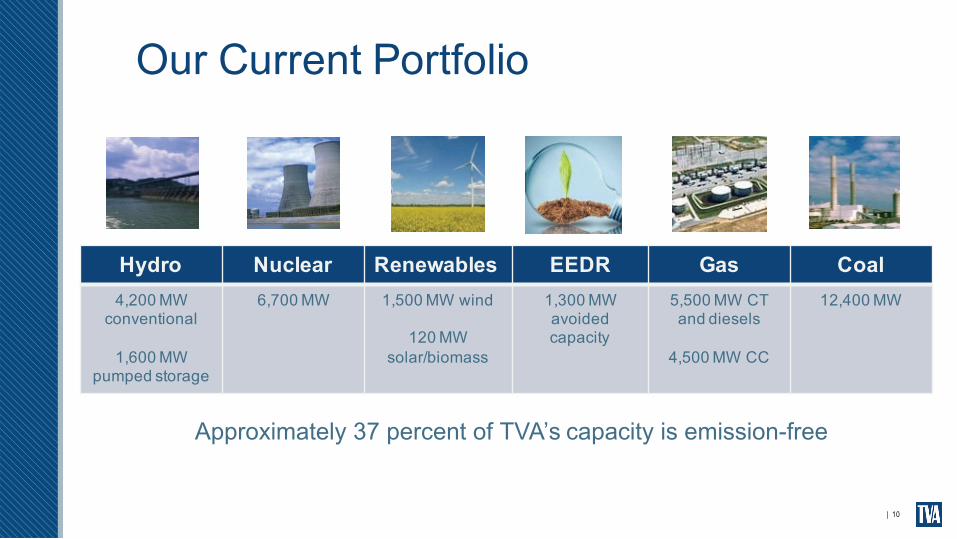
Our Current Portfolio
| 10
Hydro Nuclear Renewables EEDR Gas Coal4,200 MW conventional
1,600 MW pumped storage
6,700 MW 1,500 MW wind
120 MW solar/biomass
1,300 MW avoided capacity
5,500 MW CT and diesels
4,500 MW CC
12,400 MW
Approximately 37 percent of TVA’s capacity is emission-free

Selected Scenarios and Strategies
Scenarios
1 - Current Outlook
2 - Stagnant Economy
3 - Growth Economy
4 - De-Carbonized Future
5 - Distributed Marketplace
| 11
Strategies
A - The Reference Plan
B - Meet an Emissions Target
C - Focus on Long-Term,Market-Supplied Resources
D - Maximize Energy Efficiency
E - Maximize Renewables
External Factors Shaping the Environment TVA’s Response & Portfolio Goals

Key Criteria Used to EvaluateStrategy Performance
| 12
Cost
Financial Risk
Environmental Stewardship
ValleyEconomics
Flexibility
Identifies long-range and shorter term system costs
Measures the uncertainty around the cost of various plans
Captures multiple measures related to the environmental “footprint”
Measures per capita income & employment changes
Determines how easily the generation fleet can follow load swings

How Do the Strategies Compare?• COST: Long-term total costs are similar, but
emphasizing renewables or energy efficiency may lead to higher rates later
• FINANCIAL RISK: Scores are higher for strategies that emphasize particular resource choices
• ENVIRONMENTAL STEWARDSHIP: All strategies show improvement
• FLEXIBILITY: Generally good;; most limited if renewables are emphasized.
• VALLEY ECONOMICS: All strategies have a similar, but small, impact on overall economic health
| 13
Strategies
A - The Reference Plan
B - Meet an EmissionsTarget
C - Focus onLong-TermMarket Supplied Resources
D - Maximize Energy Efficiency
E - Maximize Renewables

The Generation Fleet
| 14
Potential Capacity Mix Under Current Planning Scenario2014
2033 – The Reference Plan
2033 – Maximize Energy Efficiency
2033 – Maximize Renewables
43 GW
35 GW Nuclear
Coal
Hydro
Natural Gas
Renewables
Energy Efficiency &Demand Response
Resource Types
2033 – Focus on Market Supplied Resources
2033 – Meet an Emissions Target

The Generation Fleet
| 15
Potential Capacity Mix Under Current Planning Scenario2014
2033 – The Reference Plan
2033 – Maximize Energy Efficiency
2033 – Maximize Renewables
43 GW
35 GW Nuclear
Coal
Hydro
Natural Gas
Renewables
Energy Efficiency &Demand Response
Resource Types
2033 – Focus on Market Supplied Resources
2033 – Meet an Emissions Target

The Generation Fleet Will Be Cleaner
| 16
Potential Capacity Mix Under Current Planning Scenario2014
2033 – The Reference Plan
2033 – Maximize Energy Efficiency
2033 – Maximize Renewables
43 GW
35 GW Nuclear
Coal
Hydro
Natural Gas
Renewables
Energy Efficiency &Demand Response
Resource Types
2033 – Focus on Market Supplied Resources
2033 – Meet an Emissions TargetNon-emitting sources account for 60% to 75% of the energy supply

The Future of Our Energy Supply• TVA power will still be reliable, affordable and sustainable
• We will rely more on cost-effective energy efficiency
• There will be more solar and wind power and less coal
• Natural gas plays an important role• TVA will continue to provide for economic growth in the Tennessee Valley
• Partnering for a better tomorrow| 17

Running The Business
| 18
• Plan Using Least Cost
• Watch Signposts
• Optimize Portfolio
• Adapt to Market Conditions
• Partner with Stakeholders
• Deliver Reliability
• Communicate


Panel Presentations

Panel 1: Looking Ahead in Renewables
| 21
• Neil Placer, TVA, Moderator• Mary Shaffer-Gill, TenneSEIA and Aries Energy
• Len Peters, Commonwealth of Kentucky
• Greg Williams, Appalachian Electric Cooperative
• Jack Simmons, Tennessee Valley Public Power Association

Break

Panel 2: Looking Ahead in Energy Efficiency
| 23
• Cindy Herron, TVA, Moderator• Clifford Stockton, Greater Memphis Chamber
• Curt Puckett, DNV GL • Michelle Walker, State of Tennessee• Becky Williamson, Memphis Light Gas and Water

Panel 3: The Changing Utility Landscape
| 24
• Joe Hoagland, TVA, Moderator• Van Wardlaw, TVA • Jay Stowe, Huntsville Utilities and Seven States Power Corporation
• Pete Mattheis, Tennessee Valley Industrial Committee
• Wayne Henson, East Mississippi Electric Power Association and Tennessee Valley Public Power Association

Break

Public Comment Session• Public participation is appreciated
• This is a listening session;; responses are typically not provided
• Comments are time limited
Closing Comments

Thank You
Please Travel Safely


