![Deliberation on IFRS IAS-16, IAS-17, IAS-20 by CA. D.S. … · Deliberation on IFRS IAS-16, IAS-17, IAS-20 by CA. D.S. Rawat Partner, Bansal & Co. Property Plant & Equipment [PPE]](https://static.fdocuments.in/doc/165x107/5b16e1ed7f8b9a726d8e6199/deliberation-on-ifrs-ias-16-ias-17-ias-20-by-ca-ds-deliberation-on-ifrs.jpg)
2015 IAS/IFRS Half Year Report - Tod's Group Spa€¦ · 2015 IAS/IFRS Half Year Report ......
53
2015 IAS/IFRS Half Year Report (Translation of the Half Year Report as of June 30th, 2015 approved in Italian, solely for the convenience of international readers) Group
Transcript of 2015 IAS/IFRS Half Year Report - Tod's Group Spa€¦ · 2015 IAS/IFRS Half Year Report ......

2015 IAS/IFRS Half Year Report(Translation of the Half Year Report as of June 30th, 2015
approved in Italian, solely for the convenience of
international readers)
Group

TOD’S Group 2015 Half Year Financial Report
06.30.2015
Table of contents
TABLE OF CONTENTS
Company’s data . . . . . . . . . . . . . . . . . . . . . . . . . . . . . . . . . . . . . . . . . . . . . . . . . . . . . . . . . . . . . . . . . . . . . . . . . . . . . . . . . . . . . . . . . . . . . . . . . . . 1 Corporate Governance bodies . . . . . . . . . . . . . . . . . . . . . . . . . . . . . . . . . . . . . . . . . . . . . . . . . . . . . . . . . . . . . . . . . . . . . . . . . . . . . . . . . . 2 TOD’S Group . . . . . . . . . . . . . . . . . . . . . . . . . . . . . . . . . . . . . . . . . . . . . . . . . . . . . . . . . . . . . . . . . . . . . . . . . . . . . . . . . . . . . . . . . . . . . . . . . . . . . . . 3 Group’s organizational chart . . . . . . . . . . . . . . . . . . . . . . . . . . . . . . . . . . . . . . . . . . . . . . . . . . . . . . . . . . . . . . . . . . . . . . . . . . . . . . . . . . . . 4 Distribution network as of June 30
t h, 2015 . . . . . . . . . . . . . . . . . . . . . . . . . . . . . . . . . . . . . . . . . . . . . . . . . . . . . . . . . . . . . . . . . . . 5
Key consolidated financial f igures . . . . . . . . . . . . . . . . . . . . . . . . . . . . . . . . . . . . . . . . . . . . . . . . . . . . . . . . . . . . . . . . . . . . . . . . . . . . . 6 Highlights of results . . . . . . . . . . . . . . . . . . . . . . . . . . . . . . . . . . . . . . . . . . . . . . . . . . . . . . . . . . . . . . . . . . . . . . . . . . . . . . . . . . . . . . . . . . . . . . 8
Interim Report ................................ ................................ ................................ ........ 9 Group’s activity ......................................................................................................... 10 Group’s brands .......................................................................................................... 11 Foreign currency markets .......................................................................................... 12 Main events and operations during the period .......................................................... 12 Group’s results in HY 2015 ......................................................................................... 14 Items or transactions resulting from unusual and/or exceptional transactions ............... 21 Significant events occurred after the reporting period .................................................. 21 Business Outlook ....................................................................................................... 21
Half-Year Condensed Financial Statements ................................ ................................23 Consolidated Income Statement ................................................................................ 24 Consolidated Statement of Comprehensive Income ................................................... 25 Consolidated Statement of Financial Position ............................................................ 26 Consolidated Statement of Cash Flows ...................................................................... 28 Consolidated Statement of Changes in Equity ............................................................ 29
Supplementary notes ................................................................ ..............................30 1. General notes . . . . . . . . . . . . . . . . . . . . . . . . . . . . . . . . . . . . . . . . . . . . . . . . . . . . . . . . . . . . . . . . . . . . . . . . . . . . . . . . . . . . . . . . . . . . . 31 2. Basis of preparation .. . . . . . . . . . . . . . . . . . . . . . . . . . . . . . . . . . . . . . . . . . . . . . . . . . . . . . . . . . . . . . . . . . . . . . . . . . . . . . . . . . . 31 3. Accounting standards .. . . . . . . . . . . . . . . . . . . . . . . . . . . . . . . . . . . . . . . . . . . . . . . . . . . . . . . . . . . . . . . . . . . . . . . . . . . . . . . . . 32 4. Seasonal or cyclical nature of interim transactions .. . . . . . . . . . . . . . . . . . . . . . . . . . . . . . . . . . . . . . . . 37 5. Alternative indicators of performances .. . . . . . . . . . . . . . . . . . . . . . . . . . . . . . . . . . . . . . . . . . . . . . . . . . . . . . . . 37 6. Scope of consolidation .. . . . . . . . . . . . . . . . . . . . . . . . . . . . . . . . . . . . . . . . . . . . . . . . . . . . . . . . . . . . . . . . . . . . . . . . . . . . . . . 37 7. Segment reporting .. . . . . . . . . . . . . . . . . . . . . . . . . . . . . . . . . . . . . . . . . . . . . . . . . . . . . . . . . . . . . . . . . . . . . . . . . . . . . . . . . . . . . 39 8. Management of f inancial risks . . . . . . . . . . . . . . . . . . . . . . . . . . . . . . . . . . . . . . . . . . . . . . . . . . . . . . . . . . . . . . . . . . . . . . 41 9. Intangible and Tangible fixed assets .. . . . . . . . . . . . . . . . . . . . . . . . . . . . . . . . . . . . . . . . . . . . . . . . . . . . . . . . . . . . . 43 10. Derivatives financial instruments . . . . . . . . . . . . . . . . . . . . . . . . . . . . . . . . . . . . . . . . . . . . . . . . . . . . . . . . . . . . . . . . . . 44 11. Net Financial Position .. . . . . . . . . . . . . . . . . . . . . . . . . . . . . . . . . . . . . . . . . . . . . . . . . . . . . . . . . . . . . . . . . . . . . . . . . . . . . . . . . 45 12. Share Capital . . . . . . . . . . . . . . . . . . . . . . . . . . . . . . . . . . . . . . . . . . . . . . . . . . . . . . . . . . . . . . . . . . . . . . . . . . . . . . . . . . . . . . . . . . . . . . 46 13. Earnings per share .. . . . . . . . . . . . . . . . . . . . . . . . . . . . . . . . . . . . . . . . . . . . . . . . . . . . . . . . . . . . . . . . . . . . . . . . . . . . . . . . . . . . . 46 14. Dividends .. . . . . . . . . . . . . . . . . . . . . . . . . . . . . . . . . . . . . . . . . . . . . . . . . . . . . . . . . . . . . . . . . . . . . . . . . . . . . . . . . . . . . . . . . . . . . . . . . . 47 15. Provisions . . . . . . . . . . . . . . . . . . . . . . . . . . . . . . . . . . . . . . . . . . . . . . . . . . . . . . . . . . . . . . . . . . . . . . . . . . . . . . . . . . . . . . . . . . . . . . . . . . 47 16. Employee benefits . . . . . . . . . . . . . . . . . . . . . . . . . . . . . . . . . . . . . . . . . . . . . . . . . . . . . . . . . . . . . . . . . . . . . . . . . . . . . . . . . . . . . . . 47 17. Transactions with related parties . . . . . . . . . . . . . . . . . . . . . . . . . . . . . . . . . . . . . . . . . . . . . . . . . . . . . . . . . . . . . . . . . 48 18. Significant non-recurring transactions and events . . . . . . . . . . . . . . . . . . . . . . . . . . . . . . . . . . . . . . . . . . 50 19. Significant events occurred after the reporting period .. . . . . . . . . . . . . . . . . . . . . . . . . . . . . . . . . . . 50
Attestation of the Half -Year condensed financial statements of TOD’S Group pursu ant article 154 bis of D.LGS. 58/98 and of article 81 -ter of Consob Regulation n. 11971 of May 14
th 1999 and further modifications and integrations. ................................ ................51

TOD’S Group 2015 Half Year Financial Report
06.30.2015
1 Company’s data
Company’s data
Registered office
TOD’S S.p.A.
Via Fil ippo Della Val le, 1
63811 Sant'Elpidio a Mare (Fermo) - Italy
Tel. +39 0734 8661
Legal data Parent company
Share capital resolved euro 61,218,802
Share capital subscribed and paid euro 61,218,802
Fiscal Code and registration number on Company Register of Court of Fermo : 01113570442
Registered with the Chamber of Commerce of Fermo under n. 114030 R.E.A.
Offices and Showrooms Munich – Domagkstrasse, 1/b, 2
Hong Kong – 35/F Lee Garden One, 33 Hysan Avenue, Causeway Bay
London – Wilder Walk, 1
Milan - Corso Venezia, 30
Milan - Via Savona, 56
Milan - Via Serbelloni, 1-4
New York - 450, West 15t h
Street
Paris – Rue de Faubourg Saint-Honore, 29
Paris – Rue du Général FOY, 22
Paris – Rue de L’Elysée, 22
Seoul – 11/F Pax Tower 609, Eonju-ro, Gangnam-gu
Shanghai - 1717 Nanjing West Road, Wheelock Square 45/F
Tokyo – Omotesando Building, 5-1-5 Jingumae
Production facilities Comunanza (AP) - Via Merloni, 7
Comunanza (AP) - Via S.Maria, 2-4-6
Sant'Elpidio a Mare (FM) - Via Fil ippo Della Valle, 1
Bagno a Ripoli, Loc. Vallina (FI) - Via del Roseto, 60
Bagno a Ripoli, Loc. Vallina (FI) - Via del Roseto, 50
Tolentino (MC) - Via Sacharov 41/43

TOD’S Group 2015 Half Year Financial Report
06.30.2015
2 Corporate Governance bodies
Corporate Governance bodies
Board of directors ( 1)
Diego Della Valle Chairman
Andrea Della Valle Vice - Chairman
Luigi Abete
Maurizio Boscarato
Luigi Cambri
Luca Cordero di Montezemolo
Sveva Dalmasso
Emanuele Della Valle
Romina Guglielmetti
Emilio Macellari
Vincenzo Manes
Cinzia Oglio
Pierfrancesco Saviotti
Michele Scannavini
Stefano Sincini
Executive Committee Diego Della Valle Chairman
Andrea Della Valle
Emilio Macellari
Stefano Sincini
Compensation Luigi Abete Chairman
Committee Sveva Dalmasso
Vincenzo Manes
Control and Risk Luigi Cambri Chairman
Committee Maurizio Boscarato
Romina Guglielmetti
Independent Directors Vincenzo Manes Chairman
Committee Romina Guglielmetti
Pierfrancesco Saviotti
Board of statutory ( 2 )
Giulia Pusterla Chairman
Auditors Enrico Colombo Acting stat. auditor
Fabrizio Redaelli Acting stat. auditor
Gilfredo Gaetani Substitute auditor
Myriam Amato Substitute auditor
Independent Auditors ( 3)
PricewaterhouseCoopers S.p.A.
Manager charged with preparing Rodolfo Ubaldi
a company’s financial report
( 1 ) Term of the off ice: 2015-2017 (resolut ion of the Sharehold ers ’ meeting as of Apri l 22n d , 2015)
( 2 ) Term of the off ice: 2013-2015 (resolut ion of the Shareholders ’ meeting as of Apri l 19 t h , 2013) ( 3 ) Term of the off ice: 2012 -2020 (resolut ion of the Shareholders ’ meeting as of Apri l 19 t h , 2012)

TOD’S Group 2015 Half Year Financial Report
06.30.2015
3 Gruppo TOD’S
TOD’S Group
TOD’S S.p.A. Parent Company, owner of TOD’S, HOGAN and FAY brands and l icensee of ROGER VIVIER brand Del.Com. S.r . l. Sub-holding for operation of national subsidiaries and DOS in Italy TOD’S International B.V. Sub-holding for operation of international subsidiaries and DOS in The Netherlands An.Del. Usa Inc. Sub-holding for operation of subsidiaries in the United States Del.Pav S.r. l. Company that operates DOS in Italy F ilangieri 29 S.r. l. Company that operates DOS in Italy Gen.del. SA Company that operates DOS in Switzerland TOD’S Belgique S.p.r. l. Company that operates DOS in Belgium TOD’S Deutschland Gmbh Company that distributes and promotes products in Germany and manages DOS in Germany TOD’S Espana SL Company that manages DOS in Spain TOD’S France Sas Company that distributes and promotes products in France and manages DOS in France TOD’S Luxembourg S.A. Company that operates DOS in Luxembourg TOD’S Japan KK Company that operates DOS in Japan TOD’S Macao Ltd Company that operates DOS in Macao
TOD’S Hong Kong Ltd Company that distributes and promotes products branded TOD’S and HOGAN in Far East and South Pacific and manages DOS branded TOD’S and HOGAN in Hong Kong. Sub-holding for operation of international subsidiaries in Asia TOD’S Korea Inc. Company that distributes and promotes products branded TOD’S in Korea and operates DOS branded TOD’S in Korea TOD’S Retail India Private Ltd Company that operates DOS in India TOD’S (Shanghai) Trading Co. Ltd Company that operates DOS branded TOD’S and HOGAN in China TOD’S Singapore Pte Ltd Company that operates DOS branded TOD’S in S ingapore TOD’S UK Ltd Company that distributes and promotes products in Great Britain and manages DOS in Great Britain Webcover Ltd Company that operates DOS in Great Britain Cal.Del. Usa Inc. Company that operates DOS in California (USA) Deva Inc. Company that distributes and promotes products in North America, and manag es DOS in the State of NY (USA) F lor. Del. Usa Inc. Company that operates DOS in Florida (USA) Hono. Del. Inc. Company that operates DOS in Hawaii (USA) I l . Del. Usa Inc. Company that operates DOS in I l l inois (USA) Neva. Del. Inc. Company that operates DOS in Nevada (USA) Or. Del. Usa Inc. Company that operates DOS in California (USA) TOD’S Tex. Del. Usa Inc. Company that operates DOS in Texas (USA) Holpaf B.V. Real estate company that operates one DOS in Japan
Alban.Del Sh.p.k. Production company Sandel SA Not operating company Un.Del. Kft Production company Re.Se.Del. S.r . l. Company for services TOD’S Brasil Ltda Company that operates DOS in Brazil Partecipazioni Internazionali S.r . l. Sub-holding for operation of international subsidiaries and DOS in Italy Roger Vivier Hong Kong Ltd Company that distributes and promotes products branded ROGER VIVIER in Far East and South Pacific and manages DOS in Hong Kong. Sub-holding for operation of subsidiaries in Asia Roger Vivier Singapore Pte Ltd Company that operates DOS in S ingapore Roger Vivier (Shanghai) Trading Co. Ltd Company that operates ROGER VIVIER DOS in China Roger Vivier UK Ltd Company that operates DOS in Gr eat Britain TOD’S Georgia Inc. Company that operates DOS in Georgia (USA) Roger Vivier France Sas Company that operates DOS in France Roger Vivier Korea Inc. Company that operates DOS in Korea and that distributes and promotes products branded ROGER VIVIER in Korea Roger Vivier Switzerland S.A. Company that operates DOS in Switzerland Roger Vivier Macau Ltd. Company that operates DOS in Macao Roger Vivier Japan KK Company that operates DOS in Japan TOD’S Danmark APS Company that operates DOS in Denmark TOD’S Austria GMBH Company that operates DOS in Austria TOD’S Washington Inc. Not operating company

TOD’S Group 2015 Half Year Financial Report
06.30.2015
4 Composition of the Group
Group’s organizational chart

TOD’S Group 2015 Half Year Financial Report
06.30.2015
5 Distr ibution network
Distribution network as of June 30t h
, 2015
Denmark
Austria
Total
Greater China
China
Hong Kong
Macau
Taiwan
Total
Rest of the World
Saudi Arabia
Bahrain
U.A.E.
Kuwait
(D)=DOS (F)=FRANCHISED STORES
Europe (D) (F)
Italy 45 2
Belgium 1
France 22 1
Germany 12 2
Great Britain 5
Greece 5
Netherlands 2
Portugal 1
Russia 3
Spain 5 1
Switzerland 4
Turkey 3
Czech Republic 1
Denmark 1
Austria 1
Total 98 19
Greater China (D) (F)
China 68 2
Hong Kong 11 1
Macau 2 2
Taiwan 19
Total 81 24
Rest of the World (D) (F)
Saudi Arabia 2
Bahrain 2
U.A.E. 9
Kuwait 2
Lebanon 3
Qatar 1
Japan 30 1
Korea 19 8
Philippines 2
India 2
Indonesia 5
Malaysia 3
Singapore 3 2
Thailand 4
Guam 1
Azerbaijan 1
Australia 1
Total 54 47
Americas (D) (F)
U.S.A. 16 2
Brazil 2
Panama 1
Total 18 3
DOS, 2015 new openings I taly Monza ( I taly) Forte dei Marmi ( I taly)
Europe Paris (France) Paris (France) Paris (France) Copenhagen (Denmark) Geneve (Switzer land) Monaco (Germany) Parndorf (Austr ia)
Greater China Chongqing (China) Chongqing (China) Zhengzhou (China) Shanghai (China) Macao (Macao)
Americas Atlanta (USA) Houston (USA) Rest of the World Gimpo (Korea) Seoul (Korea) Seoul (Korea) Mumbai ( India)
Franchised stores, 2015 new openings
Greater China Sanya Haitang Bay (China) Europe Mannheim (Germany )
Americas Panama (Panama)
For a complete l ist of retail outlets operated by the DOS and franchising network, reference should be made to the corporate web site: www.todsgroup.com
TOD’S Group 2015 Half Year Financial Report
06.30.2015
6 Key financial f igures
Key consolidated financial figures
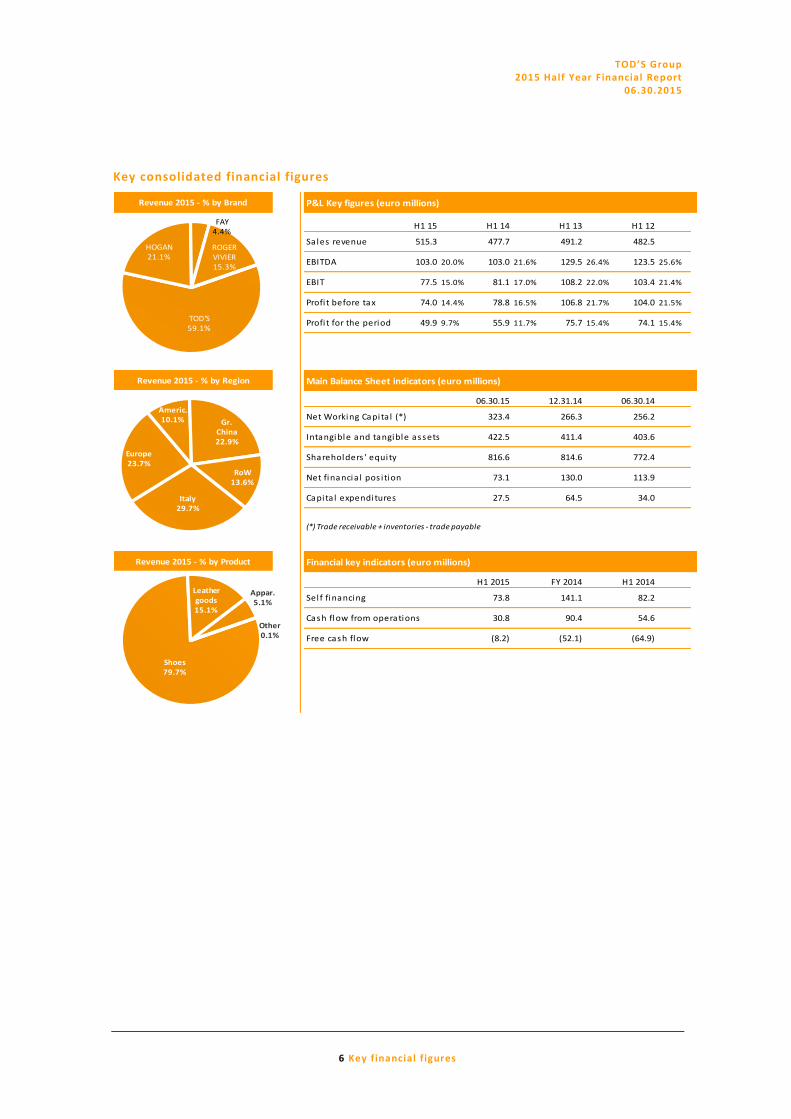
P&L Key figures (euro millions)
H1 15 H1 14 H1 13 H1 12
Sales revenue 515.3 477.7 491.2 482.5
EBITDA 103.0 20.0% 103.0 21.6% 129.5 26.4% 123.5 25.6%
EBIT 77.5 15.0% 81.1 17.0% 108.2 22.0% 103.4 21.4%
Profi t before tax 74.0 14.4% 78.8 16.5% 106.8 21.7% 104.0 21.5%
Profi t for the period 49.9 9.7% 55.9 11.7% 75.7 15.4% 74.1 15.4%
Main Balance Sheet indicators (euro millions)
06.30.15 12.31.14 06.30.14
Net Working Capita l (*) 323.4 266.3 256.2
Intangible and tangible assets 422.5 411.4 403.6
Shareholders ' equity 816.6 814.6 772.4
Net financia l pos i tion 73.1 130.0 113.9
Capita l expenditures 27.5 64.5 34.0
(*) Trade receivable + inventories - trade payable
Financial key indicators (euro millions)
H1 2015 FY 2014 H1 2014
Sel f financing 73.8 141.1 82.2
Cash flow from operations 30.8 90.4 54.6
Free cash flow (8.2) (52.1) (64.9)
Revenue 2015 - % by Brand
Revenue 2015 - % by Region
Revenue 2015 - % by Product
TOD'S59.1%
HOGAN21.1%
FAY4.4%
ROGER VIVIER15.3%
Altro0.1%
Italy29.7%
Europe23.7%
Americ.10.1% Gr.
China22.9%
RoW13.6%
Shoes79.7%
Leather goods15.1%
Appar.5.1%
Other0.1%

TOD’S Group 2015 Half Year Financial Report
06.30.2015
7 Key financial f igures
The Group's employees
06.30.15 12.31.14 06.30.14 06.30.13
Year to date 4,504 4,297 4,254 3,991
Key:
EX = executives
WHC = white collar employees
BLC = blue collar employees
Employees 2015: composition
EX
1%
WHC71%
BLC
28%
Main stock Market indicators (euro)
Share's price
Officia l price at 02.01.2015 72.36
Officia l price at 30.06.2015 84.95
Minimum price (January - June) 68.75
Maximum price (January - June) 97.65
Market Capitalisation
Market capita l i zation at 02.01.2015 2,214,770,146
Market capita l i zation at 06.30.2015 2,600,327,691
Dividend per share
Dividend per share 2014 2.00
Dividend per share 2013 2.70
Ordinary shares
Number of outstanding shares 30,609,401
Stock performanceEarning per share (euro)
1.65
1.83
2.47 2.43
H1 15 H1 14 H1 13 H1 12

TOD’S Group 2015 Half Year Financial Report
06.30.2015
8 Highlights of results
Highlights of results
Revenues: revenues totalled 515.3 mill ion euros
during the period (the average change in fore ign
exchange rates had a positive impact of 29.2
mill ion euros). Sales by the DOS network
totalled 327.1 mill ion euros.
EBITDA: gross operating profit amounts to 1 0 3
mill ion euros, (103 mill ion euros at June 30t h
,
2014) and it was equivalent to 20% of sales. It
amounts to 90.2 mill ion euros on a comparable
exchange rate basis .
EBIT: net operating profit totalled 7 7 . 5 mill ion
euros, (81.1 mill ion euros at June 30t h
, 2014).
When measured on a comparable exchange rate
basis, EBIT totalled 6 6 . 4 mill ion euros.
Net financial position (NFP): the Group had
159.4 mill ion euros in l iquid assets at June 30t h
,
2015. Its net f inancial position was 73.1 mill ion
euros at the same date.
Capital expenditures: 27.5 mill ion euros in
capital expenditures were made in H1 2015, in
H1 2014 amounted to 34 mill ion euros.
Distribution network: at June 30
t h, 2015 the
single brand distribution network comprised
251 DOS and 93 Franchised stores.
Net financial position (euro mn)
Revenue (euro mn)
EBITDA (euro mn)
EBIT (euro mn)
486.1515.3
477.7 491.2 482.5
H1 15 comp.ex. rate basis
H1 15 H1 14 H1 13 H1 12
90.2
103.0 103.0
129.5123.5
H1 15 comp.ex. rate basis
H1 15 H1 14 H1 13 H1 12
66.4
77.581.1
108.2103.4
H1 15 comp.ex. rate basis
H1 15 H1 14 H1 13 H1 12
73.1
113.9118.2
79.4
06.30.15 06.30.14 06.30.13 06.30.12

Interim Report
Group

TOD’S Group 2015 Half Year Financial Report
06.30.2015
10 Interim report
Group’s activity
TOD’S Group operates in the luxury sector under its proprietary brands (TOD’S, HOGAN, and FAY)
and licensed brands (ROGER VIVIER). It actively creates, produces and distributes shoes, leather
goods and accessories, and apparel. The mission is to offer global customers top -quality products
that satisfy their functional requirements and aspirations.
Organizational structure of the Group. Group’s organisational configuration rotates around
TOD’S S.p.A. that is at the hea rt of Group’s organisation, its parent company that owns TOD’S,
HOGAN and FAY brands, holds the licenses to the ROGER VIVIER, and manages Group’s production
and distribution. Through a series of sub -holdings, the organisation is rounded out by a series of
commercial companies that are delegated complete responsibility for retail distribution through
the DOS network. Certain of them, strategically located on international markets, are assigned
major roles in product distribution, marketing and promotion, and public relations processes
along the “value chain”, while simultaneously guaranteeing the uniform image that Group brands
must have worldwide.
Development of production. Group’s production structure is based on complete control of the
production process, from creation of the collections to production and then distribution of the
products. This approach is considered key to assuring the prestige of its brands.
Shoes and leather goods are produced in Group -owned plants, with partial outsourcing to
specialized workshops. All of these outsourcers are located in areas with a strong tradition of
shoe and leather good production. This preference reflects the fact that an extremely high
standard of professional quality is required to make these items, with a si gnificantly high level of
added value contributed to the final product by manual work.
The Group relies exclusively on selected specialized outsourcers, which enables it to exploit their
respective specializations in crafting the individual products sold a s part of the apparel l ine.
Distribution structure. The prestige of Group’s brands and the high degree of specialization
necessary to offer the respective products to customers entails distribution through a network of
similarly specialized stores. Accordingly, the Group relies principally on three channels: DOS
(directly operated stores), franchised retail outlets, and a series of selected, independent
multibrand stores.
Group’s strategy is focused on development of the DOS and franchising networks, gi ven that
these channels offer greater control and more faithful transmission of the individual brands. It is
also clear that, in particular market situations, distribution through independent multibrand
stores is more efficient. This channel is of key im portance to the Group.

TOD’S Group 2015 Half Year Financial Report
06.30.2015
11 Interim report
Group’s brands
The TOD’S brand is known for shoes and luxury leather goods, with styles that have became icons
of modern living; TOD’S is known in the luxury goods sector as a symbol of the perfect
combination of tradition, quality and modernity. Each product is hand-crafted with highly-skil led
techniques, intended, after laborious reworking, to become an exclusive, recognisable, modern
and practical object. Some styles, l ike the Driv ing Shoe and the D bag, are cherished by
celebrities and ordinary people worldwide, and have become icons and forerunners of a new
concept of elegance, for both women and men.
Begun in the 80s with shoe collections for women, men a nd children, the HOGAN brand now also
crafts various leather goods items. The HOGAN brand is distinctive for high quality, functionality
and design. Every product stems from a highly skil led design technique and is created using
quality materials with a particular passion for details and a search for perfection. HOGAN
products are the highest expression of a “new luxury” lifestyle. HOGAN is meant for someone
who cherishes the type of luxury associated with product excellence, innovative original design
and consummate practicali ty. The Traditional and the Interactive shoe styles endure as
continuing “best sellers”.
FAY is a brand created in the mid 80s with a product range of high quality casual wear. The brand
is known for its quality craftsmanship, for the excellence of its materials, a meticulous attention
to craft details and its high functionality without sacrif icing style and quality. FAY products are
wearable everywhere: from the stadium to the office, in urban areas and in t he countryside. The
l ine, which has seasonal men’s, women’s and junior’s collections, focuses on classic evergreen
styles, continuously modified and refreshed with innovative and recognisably eye -catching
design.

TOD’S Group 2015 Half Year Financial Report
06.30.2015
12 Interim report
The Fabergé of shoes, and creator of the first stiletto heel in the 1950's, ROGER VIVIER designed
extravagant and luxuriously decorated shoes that he described as being “sculptures.” The artistic
heritage and excellent traditional roots of the VIVIER fashion house have been revived. Under the
management of Creative Director Bruno Frisoni, VIVIER’s work and vision endure and n ew
chapters are added to this unique life story every year, which goes beyond expertise in the craft
of shoe making to include handbags, small leather goods, jewellery and su nglasses.
Foreign currency markets
Average exchange rates for the first half of 2015, compared to figures for the same period of the
previous year, show a broadly and significant weakness of the euro currency in respect to the
currencies with which the Group operates; in particular versus the Hong Kong dollar (HKD), the US
dollar (USD) and Chinese Renminbi (RMB) which showed a revaluation in respect to the euro currency
of 18.7%, 18.6% and 17.9% respectively.
13.6
10.9
18.7
4.5
14.7
17.9
12.9
18.6
0
5
10
15
20
25
CHF GBP HKD JPY KRW RMB SGD USD
Average exchange rateH1 2015 vs H1 2014(change %)
Main events and operations during the perio d
The market scenario in which the Group operates was characterized by the volatil ity of the global
luxury goods market again in the first half of 2015. This had been a feature of the entire year
2014. The appreciation of some currencies against the euro considerably impacted growth rates,
thus leading to profound imbalances between European and extra -European markets and
affecting consumption in some markets, especially the market in Greater China, where a sharp
decline in domestic consumption continues to be evident. This phenomenon had already affected
the results of all the main brands in the sector in the previous financial year.

TOD’S Group 2015 Half Year Financial Report
06.30.2015
13 Interim report
In this scenario, the Group recorded very good performances in the first half of 2015, which were
driven, in particular, by increased sales in the second quarter, also thanks to the positive impact
of the currency trends. Sales recorded double digit f igures, compared to the first half of 2014, in
all the international markets in which the Group operates, except for Greater Chin a only, which,
as has been said, was stil l affected by a general and continuing consumption decline. However,
this market recorded, once again, excellent performances for the ROGER VIVIER brand, the
revenues of which showed, at current exchange rates, an increase of 17.1%. More in general, the
current half-year also confirmed this brand’s great appeal to international customers: sales of
ROGER VIVIER brand increased by 31.3% (almost 20% at constant rates) compared to the first half
of 2014.
As regards the brands, HOGAN continued to grow in international markets, to which the Group
expansion strategy is addressed at present: in the foreign markets in which the brand is present,
sales recorded double-digit growth rates as a whole compared to the first half of 2014.
As regards business development, the TOD’S Group continued, in the half -year, to carry out its
strategy of expanding its DOS network, a fundamental requirement for the pursuit of medium -
term growth targets, opening 20 new DOS. Among these we mentio n the inauguration of the first
directly-operated store in Denmark inside a prestigious Copenhagen shopping centre and the
openings of new TOD’S boutiques in Houston and At lanta, which are major cities for the US
market, in which the Group has not been pre sent up to now. As regards investments, the
construction of a new building is being completed in the area in which the Group’s headquarters
are located, which will be mainly dedicated to host some important industrial activities.
On the other hand, in order to support the present and future development of investments
connected with the Group’s growth, in the first half of 2015, the parent company TOD’S S.p.A.
entered into two 4-year term loan agreements with two major banks, for a total amount of euro
50 mill ion, thus seizing the opportunity of extremely low interest rates and particularly
favourable credit access conditions for the Company.
Again with a view to business development, in the half -year the Group continued to expand its e -
commerce channel. In implementing the development plan agreed with the industrial partner
that had been selected for the online marketing of all the brands , the Group also started to
distribute its products, at the same time as the 2015 -2016 autumn-winter collection, on the
important market of mainland China, in addition to the already active markets in Italy, the United
States and the main European countries.

TOD’S Group 2015 Half Year Financial Report
06.30.2015
14 Interim report
This significant expansion of the e -commerce channel is also expected to positively boost the
“traditional” market of directly-operated stores in mainland China, through the strengthening of
the brand awareness of the brands involved in the e -commerce project, also thanks to the
simultaneous enhanced presence in terms of digital communication in the market.
Finally, it should be noted that the Group will be able to further boost its e -commerce channel
thanks to the collaboration with Net -A-Porter and Mr. Porter, the major reference boutiques for
online purchases dedicated to women’s and men’s fashion, which was started in the month of
July of the current year. This partnership provides for these important o nline players to start
selling the TOD’S Ready To Wear collections, which have been present until now in some
international brand boutiques only, from the end of July .
As regards social responsibility, the Group continued its Welfare project which, as part of the
initiatives to provide economic support to the families of the Group's Italian employees, saw the
extension, also for the current financial year, of both the annual contribution of euro 1,400 and
the full refund of the cost incurred by its employees’ families to buy school books, together with
the renewal of a significant health care protection to the benefit of its employees and their
families.
Again as regards social responsibility, the Shareholders' Meeting of the parent company TOD’S
S.p.A. held on April 22n d
, 2015 renewed its support and resolved, as in the previous financial
year, to allocate 1% of the net profit achieved by the Group in the 2014 financial year, equal to
about euro 1.0 mill ion, to a specific reserve to be used to pursue local solidarity projects .
Group’s results in HY 2015
Consolidated sales were 515.3 million euros in the first half of 2015, increased by 7.9% from H1
2014. It was positive the effect deriving from variation in exchange rates: by using H1 2014 average
exchange rates, sales would have been 486.1 million euros, 1.8% up compared with H1 2014 when
sales were 477.7 million euros.
EBITDA and EBIT amounted to 103 and 77.5 mill ion euros respectively, and represent 20% and
15% of consolidated revenues. By using H1 2014 average exchange rates, they would have been
90.2 and 66.4 million euros respectively, representing 18.6% and 13.7% of consolidated revenues.

TOD’S Group 2015 Half Year Financial Report
06.30.2015
15 Interim report
euro 000's
FY 14 Main economic indicators H1 2015 H1 2014 Change %
965,532 Sales revenue 515,310 477,747 37,563 7.9
193,547 EBITDA 103,045 102,969 76 0.1
(45,368) Amortiz., deprec. and write-downs (25,533) (21,866) (3,668) 16.8
148,179 EBIT 77,512 81,103 (3,592) (4.4)
144,380 Profit before taxes 74,048 78,830 (4,783) (6.1)
96,761 Profit for the period 49,870 55,854 (5,983) (10.7)
Foreign exchange impact on revenues (29,183)
Adjusted Sales revenues 486,127 477,747 8,380 1.8
Foreign exchange impact on operating costs 16,369
Adjusted EBITDA 90,231 102,969 (12,738) (12.4)
Foreign exchange impact on deprec.&amort. 1,738
Adjusted EBIT 66,436 81,103 (14,668) (18.1)
EBITDA % 20.0 21.6
EBIT % 15.0 17.0
Adjusted EBITDA % 18.6 21.6
Adjusted EBIT % 13.7 17.0
Tax Rate % 32.6 29.1
euro 000's
06.30.14 Main Balance Sheet indicators 06.30.15 12.31.14 Change
256,155 Net Working Capital (*) 323,394 266,310 57,084
403,628 Non-current assets 422,506 411,379 11,127
(1,307) Other current assets/liabilities (2,363) 6,907 (9,270)
658,476 Invested capital 743,537 684,596 58,941
113,913 Net financial position 73,079 130,013 (56,933)
772,389 Shareholders' equity 816,616 814,609 2,007
34,031 Capital expenditures 27,521 64,457 (36,936)
54,553 Cash flow from operations 30,841 90,411 (59,570)
(64,917) Free cash flow (8,151) (52,140) 43,989
(*) Trade receivable + inventories - trade payable
Revenue. Consolidated sales were 515.3 mill ion euros in the first half of 2015, up 7.9% from H1
2014, showing a visible acceleration in the second quarter of the year (+15% in Q2 as compared
to +1.5%), across all the geographical areas and product categories. As expected, the impact of
currencies fluctuations was positive: at constant exchange rates, meaning by using the average
exchange rates of H1 2014, including the related effects of hedging contracts, sales would have
been 486.1 mill ion euros, up 1.8% from H1 2014. Sales through DOS totalled 327.1 mill ion euros,
up 8.6% from H1 2014; the 14.3% growth registered in Q2 was driven by the organic growth and
by the widening of the retail network.

TOD’S Group 2015 Half Year Financial Report
06.30.2015
16 Interim report
The Same Store Sales
Growth (SSSG) rate,
calculated as the
worldwide average
of sales growth rates
at constant exchange
rates registered by
the DOS already
existing as of
January 1s t
, 2014, is
-5.6% in the first 31
(euro mn) H1 2015 % H1 2014 % % current
exch. rates
% constant
exch. rates
DOS 327.1 63.5 301.1 63.0 8.6 0.5
Third Parties (WS) 188.2 36.5 176.6 37.0 6.6 4.0
Total 515.3 100.0 477.7 100.0 7.9 1.8
DOS63.5%
Third Parties
(WS)36.5%
DOS DOS
Third Parties (WS) Third
Parties (WS)
0
50
100
150
200
250
300
350
400
450
500
550
H1 2015 H1 2014
weeks of the year (from January 1s t
to August 2n d
, 2015). This f igure shows a significant
improvement as compared with the first three months of the year ( it was -10.6% as of the end of
March). The SSSG would be definitely positive at reported rates. As of June 30t h
, 2015 the
Group’s distribution network was composed by 251 DOS and 93 franchised stores, compared to
229 DOS and 87 franchised stores as of the end of June 2014. Revenues to third parties globally
amounted to 188.2 mill ion euros, up 6.6% from H1 2014; also the performance of this channel
registered an acceleration in the second quarter, only partially due to t he different timing of
deliveries.
The TOD ’S brand totalled 304.4 mill ion euros in sales, up 4.9% from H1 2014 and registered a
significant acceleration in the second quarter (+9.9%); positive results in all markets where the
brand is distributed, with the exception of China, which continues to be affected by the overall
weakness in
consumer spending.
HOGAN revenues
were 108.8 mill ion
euros, up 4.2% from
H1 2014. Positive
results in all regions;
double-digit growth
in Europe and in
Asia. The FAY brand
registered sales of
22.9 mill ion euros,
with a sl ight
(euro mn) H1 2015 % H1 2014 % % current
exch. rates
% constant
exch. rates
TOD'S 304.4 59.1 290.2 60.7 4.9 (2.1)
HOGAN 108.8 21.1 104.5 21.9 4.2 2.7
FAY 22.9 4.4 22.8 4.8 0.5 0.3
ROGER VIVIER 78.6 15.2 59.8 12.5 31.3 19.2
Other 0.6 0.1 0.4 0.1 n.s. n.s.
Total 515.3 100.0 477.7 100.0 7.9 1.8
TOD'S59.1%
HOGAN21.1%
FAY4.4%
ROGER VIVIER15.2%
Other0.1%
TOD'S TOD'S
HOGAN HOGAN
FAYFAY
RVRV
0
50
100
150
200
250
300
350
400
450
500
550
H1 2015 H1 2014

TOD’S Group
2015 Half Year Financial Report 06.30.2015
17 Interim report
increase compared to the first half of 2014, also thanks to the contribution of foreign markets.
The brand is in fact launching its international expansion process. Finally, ROGER VIVIER revenues
were 78.6 mill ion euros, up 31.3% from H1 2014; double -digit growth in all regions, despite the
strategy of selective expansion, aimed at maintaining the unique positioning of the brand .
Sales from shoes continued their growth, confirming the Grou p’s leadership in this category.
Revenues were 410.7
mill ion euros (up
+9.9% from H1 2014;
+16.1% only in Q2).
Sales from leather
goods and
accessories totalled
77.6 mill ion euros ,
up 0.7% from H1
2014. As expected,
revenues grew in
double digits in the
second quarter;
(euro mn) H1 2015 % H1 2014 % % current
exch. rates
% constant
exch. rates
Shoes 410.7 79.7 373.7 78.2 9.9 3.5
Leather goods 77.6 15.1 77.1 16.1 0.7 (5.9)
Apparel 26.4 5.1 26.5 5.6 (0.6) (1.4)
Other 0.6 0.1 0.4 0.1 n.s. n.s.
Total 515.3 100.0 477.7 100.0 7.9 1.8
Shoes79.7%
Leather goods15.1%
Appar.5.1%
Other0.1%
ShoesShoes
Leather goods Leather
goods
ApparelApparel
0
50
100
150
200
250
300
350
400
450
500
550
H1 2015 H1 2014
we believe that this improvement will continue during the year, also based on the excellent
feedback of the winter col lections of some families of TOD'S handbags. Finally, sales from apparel
were 26.4 mill ion euros, broadly stable compared to H1 2014.
In the first half of 2015, domestic sales were 152.9 million euros, up 3% from H1 2014, which
implies a visible
acceleration in Q2
(+6.2%). In the rest
of Europe, the
Group’s revenues
totalled 122.2
mill ion euros, up
13.1% from H1 2014;
also in this region,
the performance
improved in Q2. In
the Americas, sales
were 51.9 mill ion
(euro mn) H1 2015 % H1 2014 % % current
exch. rates
% constant
exch. rates
Italy 152.9 29.7 148.5 31.1 3.0 3.0
Europe 122.2 23.7 108.0 22.6 13.1 10.5
Americas 51.9 10.1 42.3 8.9 22.7 6.1
Greater China 118.2 22.9 117.8 24.6 0.3 (12.6)
Rest of World 70.1 13.6 61.1 12.8 14.8 8.1
Total 515.3 100.0 477.7 100.0 7.9 1.8
Italy29.7%
Europe23.7%
Americas10.1%
Gr. China22.9%
RoW13.6%
Italy Italy
Europe Europe
AmericasAmericas
Greater China Greater
China
Rest of World
Rest of World
0
50
100
150
200
250
300
350
400
450
500
550
H1 2015 H1 2014

TOD’S Group 2015 Half Year Financial Report
06.30.2015
18 Interim report
euros, up 22.7% from H1 2014; the visible acceleration registered in the last few months of the
period was also due to the more favourable weather conditions on the Eastern Coast (+32.4%
sales growth in Q2). In Greater China the Group’s sales totalled 118.2 million euros, equal to
22.9% of consolidated turnover. Mainland China, which represents approx. half of this region,
registered positive resul ts (at reported rates), while the performance in Hong Kong was stil l
negative, due to the general reduction in traffic and consumption. Finally, in the area “Rest of
the World” the Group’s revenues were 70.1 million euros, up 14.8% from H1 2014 (+30.2% in Q2),
mainly driven by the outstanding results of Japan and Korea .
O p e r a t i n g r e s u l t s . EBITDA in H1 2015 totalled 103 mill ion euros, unchanged in respect to the
amount reported in H1 2014. Gross operating profit was thus equivalent to 20% of consolidated
revenue (H1 2014: 21.6%). EBITDA at constant exchange rate amounted to 90.2 mill ion euros,
representing 18.6% of consolidated revenues.
Profits at the gross margin level were
consolidated, as confirmation of the excellent
positions of the Group’s brands a t the high end
of the luxury brands sector and of the ability
to generate revenues in the products segments
and in the geographical areas with higher
margins. This result absorbed the main impact
of rising operating costs l inked to the
expansion strategy of the DOS network (the
increase in the number of DOS recorded in the
period from July 2014 to June 2015 was equal
EBITDA (euro mn)
90.2
103.0 103.0
H1 15 comp. ex.rate basis
H1 15 H1 14
to 22). Lease and rental expenses ( leases of locations and royalties for use of l icensed brands)
totalled 63.1 mill ion euros at June 30t h
, 2015, up 9.9 mill ion euros from H1 2014, mainly due to
the expansion of distribution network; they represented 12.2% of revenue at June 30t h
, 2015
against 11.1% at June 30t h
, 2014. Increased even the personnel costs which totalled 91.4 mill ion
euros in the first half of year 2015, compared with 79.6 mill ion euros in the first six months of
the previous year. The change is mainly connected with the increase in headcount (mainly due to
the expansion of the direct distribution network), with a total of 4, 504 employees at June 30t h
,
2015, or 207 and 250 persons more than at December 31s t
and June 30t h
, 2014, respectively. At
June 30t h
, 2015, employee costs equalled 17.7% of Group revenue, as compared with 1 6.7% in the
first six months of 2014.
Increased the costs for depreciation, amortization and impairment, amounting to 23.5 in H1 2015,
against 20.8 mill ion euros in H12014; the ratio on revenue is 4.6% (substantially in l ine with

TOD’S Group 2015 Half Year Financial Report
06.30.2015
19 Interim report
the first half of 2014 when it was 4.4%). Net of
additional operating provisions of 2 mill ion
euros, EBIT in H1 2015 totalled 77.5 mill ion
euros (81.1 mill ion euros at June 30t h
, 2014),
representing 15% of consolidated revenues (17%
at June 30t h
, 2014). At June 30t h
, 2015,
consolidated net profit was equal to 49.9 mill ion
euros, against 55.9 mill ion euros at June 30t h
of
the previous year. At June 30t h
net profit
represents the 9.7% of revenues (11.7% for the
first six months of 2014). The result is net of
income taxes for the period ( including the
EBIT (euro mn)
66.4
77.581.1
H1 15 comp. ex.rate basis
H1 15 H1 14
effects of deferred taxes) totalling 24.2 mill ion euros, for a tax rate of 32.6%, increased in
respect to the first half 2014 (when it was 29.1%), mainly due to a different geographical mix of
results.
Capital expenditures. Capital expenditure in H1 2015 totalled 27.5 mill ion euros, while they were
34 mill ion euros at June 30th
, 2014.
27.5
34.0
64.5
51.4 49.9
HY2015 HY2014 FY2014 FY2013 FY2012
Property Plant and Equipment & Intangible assetsCapital Expenditures(euro mn)
Capital expenditures during the period for the DOS network totalled about 15. 6 mill ion euro (15.7
mill ion euros in the first half 2014) , primarily used for both new DOS openings , among which the
most relevant are Houston and Atlanta stores, and for renovation activities of the existing stores.

TOD’S Group 2015 Half Year Financial Report
06.30.2015
20 Interim report
The remaining investment quota in the period
regarded not only the normal processes of
modernising the structures and industrial
equipment (mainly lasts and moulds) but also the
continuation of construction activities for the
building located inside the perimeter of TOD’S
Group headquarter, which was started last year,
and to the development of the company
management software.
INVESTMENTS BY ALLOCATION
DOS57%
Prod.38%
Other5%
Net financial posit ion (NFP). At June 30t h
, 2015, net f inancial position was positive and equal to
73.1 mill ion euros (130 mill ion euros and 113.9 mill ion euros at December 31s t
and June 30t h
,
2014 respectively), including liquid assets (cash and bank deposits) for 159.4 million euros, and
liabilities for 86.3 mill ion euros, of which 63.9 mill ion euros for long-term exposures.
06.30.14 06.30.15 12.31.14 Change
Current financial assets
155,295 Cash and cash equivalents 159,434 165,949 (6,515)
155,295 Cash 159,434 165,949 (6,515)
Current financial liabilities
(13,111) Current account overdrafts (12,592) (10,988) (1,603)
(5,494) Current share of medium-long term financing (9,872) (4,650) (5,223)
(18,605) Current financial liabilities (22,464) (15,638) (6,826)
136,690 Current net financial position 136,970 150,311 (13,341)
Non-current financial liabilities
(22,777) Financing (63,891) (20,298) (43,593)
(22,777) Non-current financial liabilities (63,891) (20,298) (43,593)
113,913 Net financial position 73,079 130,013 (56,933)
Net financial position (euro 000's)
Gross of dividends paid, net f inancial position would be equal to 134.4 mill ion euros (+4.4 mill ion
in respect to December 31s t
, 2014).
TOD’S Group 2015 Half Year Financial Report
06.30.2015
21 Interim report
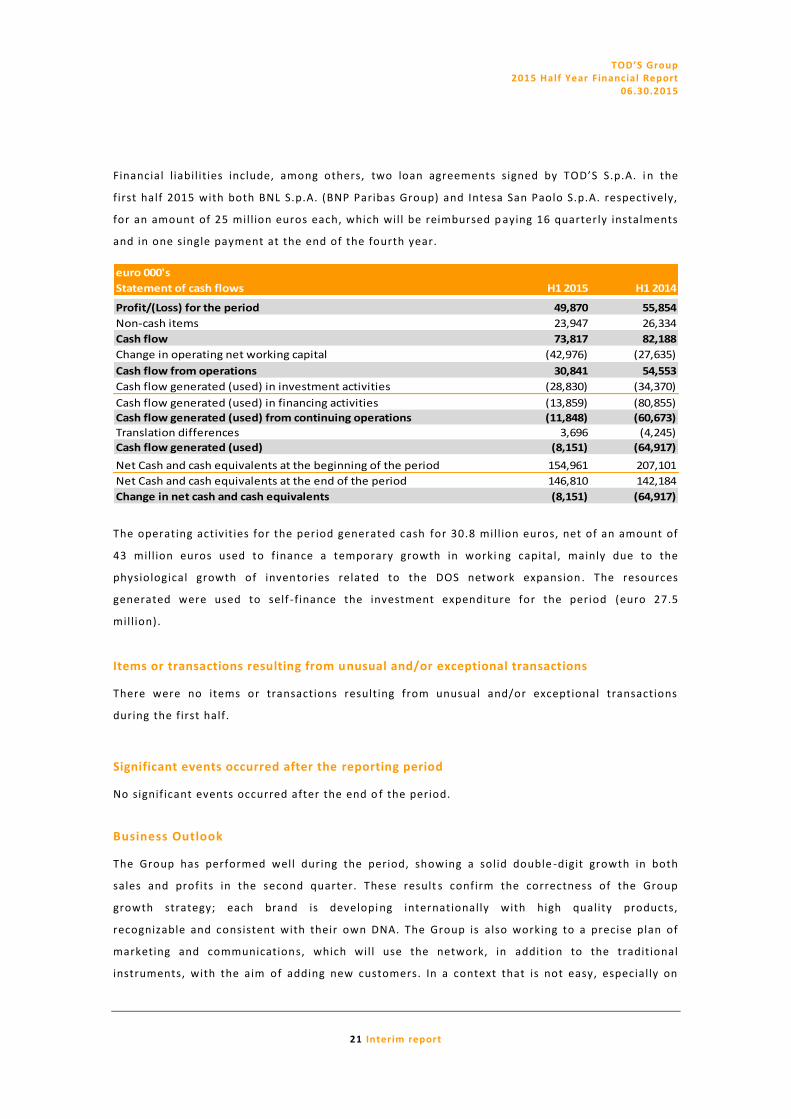
Financial l iabilities include, among others, two loan agreements signed by TOD’S S.p.A. i n the
first half 2015 with both BNL S.p.A. (BNP Paribas Group) and Intesa San Paolo S.p.A. respectively,
for an amount of 25 mill ion euros each, which will be reimbursed p aying 16 quarterly instalments
and in one single payment at the end of the fourth year.
euro 000's
Statement of cash flows H1 2015 H1 2014
Profit/(Loss) for the period 49,870 55,854
Non-cash items 23,947 26,334
Cash flow 73,817 82,188
Change in operating net working capital (42,976) (27,635)
Cash flow from operations 30,841 54,553
Cash flow generated (used) in investment activities (28,830) (34,370)
Cash flow generated (used) in financing activities (13,859) (80,855)
Cash flow generated (used) from continuing operations (11,848) (60,673)
Translation differences 3,696 (4,245)
Cash flow generated (used) (8,151) (64,917)
Net Cash and cash equivalents at the beginning of the period 154,961 207,101
Net Cash and cash equivalents at the end of the period 146,810 142,184
Change in net cash and cash equivalents (8,151) (64,917)
The operating activities for the period generated cash for 30.8 mill ion euros, net of an amount of
43 mill ion euros used to f inance a temporary growth in worki ng capital, mainly due to the
physiological growth of inventories related to the DOS network expansion . The resources
generated were used to self -f inance the investment expenditure for the period (euro 27.5
mill ion).
Items or transactions resulting from unusual and/or exceptional transactions
There were no items or transactions resulting from unusual and/or exceptional transactions
during the first half.
Significant events occurred after the reporting period
No significant events occurred after the end o f the period.
Business Outlook
The Group has performed well during the period, showing a solid double -digit growth in both
sales and profits in the second quarter. These result s confirm the correctness of the Group
growth strategy; each brand is developi ng internationally with high quality products,
recognizable and consistent with their own DNA. The Group is also working to a precise plan of
marketing and communications, which will use the network, in addition to the traditional
instruments, with the aim of adding new customers. In a context that is not easy, especially on

TOD’S Group 2015 Half Year Financial Report
06.30.2015
22 Interim report
some important markets for luxury goods, such as China, considering the positive feedback
received by the winter collections and the continuous strong focus on cost control, the Group will
achieve good results also in the second half of the year .
Sant’Elpidio a Mare, August 6t h
, 2015
The Chairman of the Board of Directors
Diego Della Valle

Half-year Interim Report Financial Statements
Group

TOD’S Group 2015 Half Year Financial Report
06.30.2015
2 4 Financial Statements
Consolidated Income Statement
euro 000's
H1 15 H1 14 FY 14
Revenue
Sales revenue 515,310 477,747 965,532
Other income 4,959 4,909 10,476
Total revenue and income 520,269 482,656 976,008
Operating Costs
Change in inventories of work in progress and finished goods 30,987 15,533 31,944
Cost of raw materials, supplies and materials for consumption (151,026) (134,448) (278,912)
Costs for services (125,545) (111,174) (231,436)
Costs of use of third party assets (63,106) (53,196) (109,665)
Personnel costs (91,422) (79,584) (160,386)
Other operating charges (17,112) (16,818) (34,005)
Total operating costs (417,224) (379,687) (782,461)
EBITDA 103,045 102,969 193,547
Amortisation, depreciation and write-downs
Amortisation of intangible assets (4,271) (4,377) (8,792)
Depreciation of tangible assets (19,060) (16,444) (32,791)
Other adjustment (204) (2,339)
Total amortisation, depreciation and write-downs (23,535) (20,821) (43,922)
Provisions (1,998) (1,045) (1,447)
EBIT 77,512 81,103 148,179
Financial income and expenses
Financial income 19,920 6,979 23,403
Financial expenses (23,384) (9,252) (27,202)
Total financial income (expenses) (3,464) (2,273) (3,799)
Income (losses) from equity investments 0
Profit before taxes 74,048 78,830 144,380
Income taxes (24,177) (22,976) (47,619)
Profit/(loss) for the period 49,870 55,854 96,761
Non-controlling interests 508 300 353
Profit/(loss) of the Group 50,379 56,154 97,114
EPS in (euro) 1.65 1.83 3.17
EPS diluted in (euro) 1.65 1.83 3.17

TOD’S Group 2015 Half Year Financial Report
06.30.2015
2 5 Financial Statements
Consolidated Statement of Comprehensive Income
euro 000's
H1 15 H1 14
Profit (loss) for the period (A) 49,870 55,854
Other comprehensive income that will be reclassified subsequently to profit and loss:
Gain/(Losses) on derivative financial instruments (cash flow hedge) 3,161 1,233
Gain/(Losses) on currency translation of foreign subsidiaries 10,291 (2,900)
Total other comprehensive income that will be reclassified subsequently to profit and
loss (B) 13,452 (1,667)
Other comprehensive income that will not be reclassified subsequently to profit and
loss:
Cumulated actuarial gains/(losses) on defined benefit plans
Total other comprehensive income that will not be reclassified subsequently to profit
and loss (C)
Total Comprehensive Income (A) + (B) + (C) 63,323 54,187
Of which:
Attributable to Shareholders of the Parent company 63,753 54,447
Attributable to non-controlling interests (430) (260)

TOD’S Group 2015 Half Year Financial Report
06.30.2015
2 6 Financial Statements
Consolidated Statement of Financial Position
euro 000's
Note 06.30.15 12.31.14 06.30.14
Non current assets
Intangible fixed assets
Assets with indefinite useful l ife 9 149,466 149,466 149,466
Key money 9 15,941 16,676 17,249
Other intangible assets 9 26,470 27,411 27,414
Total Intangible fixed asset 191,878 193,553 194,129
Tangible fixed assets
Buildings and land 9 107,546 95,111 98,198
Plant and machinery 9 12,509 8,550 8,484
Equipment 9 15,362 16,082 16,581
Leasehold improvement 9 46,765 43,361 40,386
Others 9 48,446 54,722 45,850
Total Tangible fixed assets 230,628 217,826 209,499
Other assets
Investment properties 30 32 34
Equity investments 20 20 20
Deferred tax assets 53,032 48,237 52,971
Others 20,718 18,535 16,372
Total others assets 73,800 66,824 69,397
Total non current assets 496,306 478,203 473,025
Current assets
Inventories 357,346 327,085 304,000
Trade receivables 112,569 99,445 98,871
Tax receivables 23,227 30,698 11,939
Derivative financial instruments 10 925 1,751 429
Others 39,505 37,229 39,111
Cash and cash equivalents 11 159,434 165,949 155,295
Total current assets 693,006 662,159 609,645
Total assets 1,189,312 1,140,362 1,082,670
To be continued

TOD’S Group 2015 Half Year Financial Report
06.30.2015
2 7 Financial Statements
euro 000's
(continuing) Note 06.30.15 12.31.14 06.30.14
Equity
Share capital 13 61,219 61,219 61,219
Capital reserves 214,055 214,055 214,055
Hedging and traslation 4,627 (8,747) (12,609)
Retained earnings 481,787 445,889 448,431
Profit/(loss) attributable to the Group 50,379 97,114 56,154
Total Equity attributable to the Group 812,068 809,531 767,250
Non-controlling interest
Share capital and reserves 5,057 5,431 5,439
Profit/(loss) attributable to non-controlling interests (508) (353) (300)
Total Equity attributable to non-controlling interests 4,549 5,078 5,139
Total Equity 816,616 814,609 772,389
Non-current liabilities
Provisions for risks 15 4,552 3,417 3,454
Deferred tax liabilities 29,249 29,360 36,565
Employee benefits 16 12,687 12,582 11,406
Bank borrowings 11 63,891 20,298 22,777
Others 16,508 16,619 19,637
Total non-current liabilities 126,887 82,276 93,839
Current liabilities
Trade payables 146,521 160,220 146,716
Tax payables 15,314 9,015 8,658
Derivative financial instruments 10 15,936 17,258 1,619
Others 45,574 41,345 40,844
Bank 11 22,464 15,638 18,605
Total current liabilities 245,809 243,477 216,442
Total Equity and liabilities 1,189,312 1,140,362 1,082,670

TOD’S Group 2015 Half Year Financial Report
06.30.2015
2 8 Financial Statements
Consolidated Statement of Cash Flows
euro 000's
Note Jan. - Jun. 15 Jan. - Jun. 14
Profit/(Loss) for the period 49,870 55,854
Non-cash adjustments:
Amortizat., deprec., revaluat., and write-downs 24,947 23,374
Change in employee benefits 106 272
Change in deferred tax/liabilities (4,906) (2,092)
Other non monetary expenses/(income) 3,800 4,780
Cash flow (A) 73,817 82,188
Change in current assets and liabilities:
Trade receivables (13,291) (4,286)
Other current assets (2,276) (4,317)
Inventories (31,709) (24,464)
Tax receivables 7,471 4,920
Trade payables (13,700) (5,903)
Other current l iabilities 4,229 5,566
Tax payables 6,299 849
Change in operating working capital (B) (42,976) (27,635)
Cash flow from operations (C) = (A)+(B) 30,841 54,553
Net investments in intangible and tangible assets 9 (26,647) (33,360)
(Increase) decrease of equity investments
Other changes in fixed assets
Reduction (increase) of other non-current assets (2,183) (1,010)
Cash flow generated (used) in investing activities (D) (28,830) (34,370)
Dividends paid 14 (61,319) (82,895)
Others change in Equity 2 (8)
Changes in long term loans/other non-current l iabilities 47,457 2,048
Capital increase
Changes in non controlling-interests
Cash flow generated (used) in financing (E) (13,859) (80,855)
Translation differences (F) 3,696 (4,245)
Cash flow from continuing operations (G)=(C)+(D)+(E)+(F) (8,151) (64,917)
Cash flow from assets held for sale (H)
Cash flow generated (used) (I)=(G)+(H) (8,151) (64,917)
Net cash and cash equivalents at the beginning of the period 154,961 207,101
Net cash and cash equivalents at the end of the period 146,810 142,184
Change in net cash and cash equivalents (8,151) (64,917)

TOD’S Group 2015 Half Year Financial Report
06.30.2015
2 9 Financial Statements
Consolidated Statement of Changes in Equity
January - June 2015 euro 000'sShare
capital
Capital
reserves
Hedging and
reserve for
translation
Retained
earnings Group interests
Non-
controlling
interests Total
Balances as of 01.01.15 61,219 214,055 (8,747) 543,003 809,531 5,078 814,609
Profit & Loss account 50,379 50,379 (508) 49,870
Direct in Equity 13,374 13,374 78 13,452
Total Comprehensive Income 13,374 50,379 63,753 (430) 63,323
Dividend paid (61,219) (61,219) (100) (61,319)
Other 2 2 2
Capital increase
Share based payments
Balances as of 06.30.15 61,219 214,055 4,627 532,166 812,068 4,549 816,616
January - June 2014 euro 000's Share
capital
Capital
reserves
Hedging and
reserve for
translation
Retained
earnings Group interests
Non-
controlling
interests Total
Balances as of 01.01.14 61,219 214,055 (10,902) 531,084 795,456 5,648 801,104
Profit & Loss account 56,154 56,154 (300) 55,854
Direct in Equity (1,707) (1,707) 40 (1,667)
Total Comprehensive Income (1,707) 56,154 54,447 (260) 54,187
Dividend paid (82,645) (82,645) (250) (82,895)
Other (8) (8) (8)
Capital increase
Share based payments
Balances as of 06.30.14 61,219 214,055 (12,609) 504,584 767,250 5,139 772,389

Half-year Interim Report Supplementary notes
Group

TOD’S Group 2015 Half Year Financial Report
06.30.2015
31 Supplementary notes
1. General notes
TOD’S Group operates in the luxury sector under its proprietary brands (TOD’S, HOGAN, and FAY)
and licensed brands (ROGER VIVIER). It actively c reates, produces and distributes shoes, leather
goods and accessories, and apparel. The mission is to offer global customers top -quality products
that satisfy their functional requirements and aspirations.
The parent company TOD’S S.p.A., with legal resid ence in Sant’Elpidio a Mare (Fermo) in via
Filippo Della Valle 1, is l isted in the Mercato telematico Azionario (MTA market) of Borsa Italiana
S.p.A.
At June 30t h
, 2015 the 54.37% of share capital of TOD’S S.p.A. is owned by DI.VI. FINANZIARIA DI
DIEGO DELLA VALLE & C. S.r. l.
The half-year condensed financial statements at June 30t h
, 2015 was approved by the Board of
Directors of TOD’S S.p.A. on August 6t h
, 2015, when its publication was authorized. It was audited
(limited review) by the independent audito r PricewaterhouseCoopers S.p.A.
2. Basis of preparation
The half-year Financial Report, which includes the half -year condensed financial statements of
TOD’S Group at June 30t h
, 2015, has been prepared in accordance with Article 154 ter (2, 3 and 4)
of the Consolidated Law on Financial Intermediation (“TUF”), introduced by Legislative Decree
195/2007 in implementation of Directive 2004/109/EC (the “Transparency” directive). The half -
year condensed financial statements complies with IAS 34 – Interim Financial Reporting, adopted
according to the procedure envisaged in Article 6 of EC Regulation no. 1606/2002. Consequently,
it does not include all the information required for the annual report and must be read together
with the annual report prepared for the fina ncial year at December 31s t
, 2014.
The half-year condensed financial statements include the half -year condensed financial
statements of TOD’S S.p.A. and its Italian and foreign subsidiaries, together identified as TOD’S
Group, drafted with the reference date of June 30t h
, 2015 (January 1st – June 30th).
The half-year condensed financial statements (profit and loss account, comprehensive income,
Consolidated Statement of Financial position, Consolidated Statement of Cash Flows, and
Consolidated statement of changes in equity) were drafted in the long form and are the same as
those used for the consolidated financial statements at December 31s t
, 2014.
As envisaged in IAS 34, the notes to the financial statements were drafted in summary form and
refer only to the components of the profit and loss account, Statement of Financial position, and
Statement of Cash Flows, whose composition or change in amount or nature was significant.
Thus, they il lustrate additional information for accurate comprehension of Group ’s f inancial
position at June 30t h
, 2015.

TOD’S Group 2015 Half Year Financial Report
06.30.2015
32 Supplementary notes
Following art. 3 of Consob resolution n.18079 dated 20 January 2012 we inform you that the
Company adopt the waiver provided by art. 70 (8) and art. 71 (1 -bis) of Consob regulation n.
11971/99 (and following modifications and integrations) in regard to the documents made
available to the public at the registered office and concerning mergers, demergers, capital
increases, acquisitions and disposals . If it proves necessary or appropriate to amend items in the
half-year Financial Report as a result of the application of a new accounting standard, a change in
the nature of a transaction or an accounts review, in order to provide reliable and more relevant
information for the users of the half-year Financial Report , the comparative data will be
reclassif ied accordingly in order to improve the comparability of the information between one
financial year and another. In this case, if the changes are significant, they will be suitably
disclosed in the notes to the half-year Financial Report.
3. Accounting standards
The accounting standards and principles of consolidation applied to the preparation of these
Condensed Consolidated Half -year Financial Statements are consistent with those applied to the
preparation of the Consolidated Financial Statements at 31 December 201 4, except for the new
standards or interpretations endorsed by the European Union and applicable from 1 January
2015.
Accounting standards, amendments and interpretations endorsed by the European Union, which
will be applicable from 1 January 2015 and which were first adopted in the TOD’S Group’s
Condensed Consolidated Half -Year Financial Statements at 30 June 2015 .
• IFRIC 21 – Levies. This interpretation was published on 20 May 2013 and provides guidance on
when to recognise a l iability for a levy imposed by a government, both for levies that are
accounted for in accordance with IAS 37 - Provisions, Contingent Liabilities and Contingent Assets
and those where the timing and amount of the levy is certain. Specifi cally, this interpretation
states that a l iability must be recognised at the time of the occurrence of the event, which is
normally specified in the legislation introducing a new duty/tax generating the obligation, even if
the obligation is measured on past performances. The interpretation should have been applied
retrospectively, subject to prior endorsement, for periods beginning on 1 January 2014. The
process for endorsement that was completed with the publication in the Official Journal on 14
June 2014 delayed its appl ication on the part of the European Union and has been applicable for
periods beginning on or after 17 June 2014 (for the TOD’S Group, from 1 January 2015). The new
standard has had no impact on the Group.
TOD’S Group 2015 Half Year Financial Report
06.30.2015
33 Supplementary notes
• “Annual Improvements to IFRSs: 2011-2013 Cycle” – This document, which was published in
December 2013, was aimed at adopting the proposed amendments to the standards within the
annual improvements process. The main amendments involve the IAS/IFRS and the issues
reported below: IFRS 1 F irst-time Adoption of International Financial Reporting Standards –
Meaning of “effective IFRSs; IFRS 3 – Business Combinations - Scope exception for joint ventures;
IFRS 13 Fair Value Measurement - Scope of portfolio exception; IAS 40 Investment Property -
Interrelationship between IFRS 3 and IAS 40. The process for endorsement by the European Union
was completed with the publication in the Official Journal on 19 December 2014. The
amendments will be applicable for periods beginning on or after 1 July 201 4 (for the TOD’S
Group, from 1 January 2015). The new standard has had no impact on the Group.
• “Annual Improvements to IFRSs: 2010 -2012 Cycle” - This document, which was published on
December 2013, was aimed at adopting the proposed amendments to the s tandards within the
annual improvements process. The main amendments involve the IAS/IFRS and the issues
reported below: IFRS 2 Share-based Payment - Definition of vesting conditions; IFRS 3 Business
Combinations – Accounting for contingent consideration; IFRS 8 Operating Segments -
Aggregation of operating segments; IFRS 8 Operating Segments - Reconciliation of the total of the
reportable segments’ assets to the entity’s assets; IFRS 13 Fair Value Measurement - Short-term
receivables and payables; IAS 16 Property, Plant and Equipment and IAS 38 Intangible Assets -
Revaluation method: proportionate restatement of accumulated depreciation; IAS 24 Related
Party Disclosures - Key management personnel. The process for endorsement by the European
Union was completed with the publication in the Official Journal on 9 January 2015. The
amendments will be applicable for periods beginning on or after 1 July 2014 (for the TOD’S
Group, from 1 January 2015). The new standard has had no impact on the Group.
• Amendments to IAS 19 – Employee contributions to defined benefit plans. On 21 November
2013, the IASB published some minor amendments to IAS 19 – Employee benefits, concerning the
accounting for contributions to defined benefit plans from employees or third parties in specific
cases, to be recognised as a reduction in the service cost for the period. The process for
endorsement by the European Union was completed with the publication in the Official Journal
on 9 January 2015. These amendments will be applicable retro spectively for periods beginning on
or after 1 July 2014 (for the TOD’S Group, from 1 January 2015). The new standard has had no
impact on the Group.

TOD’S Group 2015 Half Year Financial Report
06.30.2015
34 Supplementary notes
Accounting standards, amendments and interpretations published by the IASB but not yet
endorsed by the European Union and not adopted in the preparation of these financial
statements.
• IFRS 14 – Regulatory Deferral Accounts . On 30 January 2014 the IASB published the document
as the first step in the wider rate -regulated activities project, which was start ed by the IASB in
September 2012. IFRS 14 allows entities, but only those which are first -time adopters of IFRS, to
continue to recognise the amounts of assets/liabilities subject to rate regulation according to the
accounting standards previously adopted. In order to enhance comparability with entities that
already apply IFRS and do not recognise these amounts separately, the standard requires the
effect of rate-regulated activities to be presented separately from other items in the statement
of f inancial position, the income statement and the statement of comprehensive income. The
IASB expects to adopt it from 2016.
• Amendments to IFRS 11: Accounting for Acquisitions of Interests in Joint Operations ( issued on
6 May 2014). The IASB expects to adopt it f rom 2016.
• IFRS 15 – Revenue from Contracts with Customers . On 28 May 2014 the IASB published a
document which requires an entity to recognise revenue at the time the control of goods or
services is transferred to the customer in an amount that reflects the consideration to which the
entity expects to be entitled in exchange for these goods or services. The new revenue
recognition model sets out a process in f ive steps. The new standard also requires additional
disclosures regarding the nature, amount, t iming and uncertainty of the revenue and cash flows
arising from these contracts with customers. The IASB expects to adopt it from 2017.
• Amendments to IAS 16 and IAS 38: Clarif ication of Acceptable Methods of Depreciation and
Amortisation ( issued on 12 May 2014). The IASB expects to adopt it from 2016.
• Amendments to IAS 16 and IAS 41: Bearer Plants ( issued on 30 June 2014). The IASB expects to
adopt it from 2016.
• IFRS 9 – Financial Instruments. On 24 July 2014 the IASB published the final docume nt
constituting the conclusion of the process, divided into three phases: Classif ication and
Measurement, Impairment and General Hedge Accounting , entirely revising IAS 39. The document
introduces new requirements for classifying and measuring financial as sets and liabilities.
Specifically, as regards financial assets, the new standard adopts a single approach based on how
the financial instruments are managed and on the contractual cash flow characteristics of the

TOD’S Group 2015 Half Year Financial Report
06.30.2015
35 Supplementary notes
f inancial assets themselves in order to de termine the related valuation method, aiming at
eventually replacing the various rules laid down under IAS 39. As regards financial l iabilities, the
main amendment concerns the method of accounting for fair value changes in a f inancial l iability
designated as at fair value through profit or loss, which are due to own credit of the financial
l iability itself. According to the new standard, these changes must be recognised in other
comprehensive income, without affecting profit or loss. The main development r elating to hedge
accounting are:
- Changes in the type of transactions that qualify for hedge accounting; specifically, a more
extensive range of risks has been introduced for non -financial assets/liabilities that qualify for
hedge accounting;
- A change in the method of accounting for forward contracts and options included in a hedge
accounting relationship, in order to reduce profit or loss volatil ity;
- Changes in the effectiveness test by replacing the current methods based on the 80 -125% range
with the principle of the “economic relationship” between the hedged item and the hedging
instrument; furthermore, entities are no longer required to perform an assessment of the
retrospective effectiveness of the hedging relationship;
- A greater f lexibility of the accounting methods is offset by improved disclosures on the risk
management activities carried out by entities.
The new document includes a single model for the impairment of f inancial assets based on
expected losses.
The IASB expects to adopt it fro m 2018.
• Amendments to IAS 27: Equity Method in Separate Financial Statements ( issued on 12 August
2014). The IASB expects to adopt it in 2016.
• Amendments to IFRS 10 and IAS 28: Sale or Contribution of Asset between an Investor and its
Associate or Joint Venture (issued on 11 September 2014). The IASB expects to adopt it in 2016.
• Annual Improvements to IFRSs: 2012 -2014 Cycle ( issued on 25 September 2014). The IASB
expects to adopt it in 2016.
• Amendments to IAS 1: Disclosure Initiative ( issued on 18 December 2014). The IASB expects to
adopt it in 2016.
• Amendments to IFRS 10, IFRS 12 and IAS 28: Investment Entities: Applying the Consolidation
Exception (issued on 18 December 2014). The IASB expects to adopt it in 2016.

TOD’S Group 2015 Half Year Financial Report
06.30.2015
36 Supplementary notes
The standards listed above are not applicable as they have not been endorsed by the European
Union, which, during the process of endorsement, could adopt these standards only partially or
could not adopt them at all. On the other hand, from a first preliminary review it resul ts that a
future adoption of the new standards should have no significant impact on the Group’s
consolidated financial statements.
Estimates and assumptions. Preparation of the financial f igures reported on the half-year
condensed financial statements entails making estimates and assumptions based on the
management’s best valuation. Estimates and assumptions are reviewed regularly. If these
estimates and assumptions should change in future from the actual circumstances, they will
obviously be modified for the period in which those circumstances changed.
Specifically with regard to determination of eventual impairment losses affecting fixed assets,
complete tests are performed only when the annual report is prepared, when all information as
might be necessary are available, unless there are indications that require immediate valuation
of eventual impairment losses or the occurrence of events that required reiteration of the
procedure. The analyses carried out at this reporting date have not revealed any im pairment
indicators.
Presentation of financial statements drafted in for eign currency. The rates applied for
translation of the financial statements of subsidiaries using a functional currency other than the
currency used for consolidation, are il lustrat ed in the following table and compared with those
used in the previous period:
Exch. rates as
of end of
period
Average exch.
rate
Exch. rates as
of end of
period
Average exch.
rate
U.S. dollar 1.119 1.115 1.366 1.370
British pound 0.711 0.732 0.802 0.821
Swiss franc 1.041 1.055 1.216 1.221
Hong Kong dollar 8.674 8.644 10.586 10.629
Japanese yen 137.010 134.046 138.440 140.378
Hungarian forint 314.930 307.307 309.300 306.950
Singapor dollar 1.507 1.505 1.705 1.728
Korean won 1,251.270 1,225.897 1,382.040 1,437.571
Macao pataca 8.935 8.904 10.904 10.948
Chinese renminbi 6.937 6.935 8.472 8.449
Indian rupee 71.187 70.055 82.202 83.258
Albanian lek 140.106 140.373 140.301 140.209
Brazilian real 3.470 3.299 3.000 3.146
Jan. - Jun. 2015 Jan. - Jun. 2014

TOD’S Group 2015 Half Year Financial Report
06.30.2015
37 Supplementary notes
4. Seasonal or cyclical nature of interim transactions
TOD’S Group engages in a business that, despite the effects related to monthly differences in the
f lows of revenues and co sts generated by its industrial activity over the course of the year, it
does not manifest significant seasonal or cyclical changes in overall annual sales.
5. Alternative indicators of performances
In order to strip the effects of changes in exchange rates from the average values of the first six
months of 2015 from the results for the six months of 20 14, the typical economic indicators
(Revenues, EBITDA, EBIT) have been recalculated by applying the average exchange rates for the
six months of 2014, thereby rendering them fully comparable with those of the previous period.
These criteria for measuring business performance must not be considered alternative to those
established by IFRS.
Furthermore – as it has already been mentioned in the preceding paragraph, the Group’s cash
f low is uneven from quarter to quarter, largely on account of its industrial activity. Consequently,
the analysis of interim results and financial statement indicators (EBITDA, EBIT, f inancial position
and working capital) cannot be considered fully representative, and it would thus be improper to
consider the indicators for the reference period to be in proportion to the results for the entire
financial year.
6. Scope of consolidation
The scope of consolidation at June 30t h
, 2015 changed in respect to June 30t h
, 2014 mainly due to
the project of Group reorganisation, started in 2013, which will ultimately result in the ROGER
VIVIER brand having its own, autonomous corporate organization of distribution activities . To
execute this reorganisat ion, the following companies were formed: Roger Vivier Switzerland S.A.
incorporated on June 17t h
, 2014 and 100% owned by Partecipazioni Internazionali S.r. l. , Roger
Vivier Japan KK incorporated on October 1s t
, 2014 and 100% owned by TOD’S International BV
and Roger Vivier Macau Lda incorporated on November 14t h
, 2014 and 90% owned by
Partecipazioni Internazionali S.r. l. and 10% owned by Roger Vivier Hong Kong. In addition, the
following companies have been incorporated : on November 25t h
, 2014 TOD’S Danmark APS has
been incorporated and it is 100% owned by TOD’S S.p.A., on February 20th
, 2015 TOD’S
Washington Inc. has been incorporated and it is 100% owned by An.Del Inc. and on March 5t h
,
2015 TOD’S Austria Gmbh has been incorporated and it is 100% owned by TOD’S S.p.A. The
company TOD’S Washington Inc. is not operating at June 30t h
, 2015.
In respect to December 31s t
, 2014 the scope of consolidation changed due to the incorporation of
TOD’S Washington Inc. and TOD’S Austria Gmbh .

TOD’S Group 2015 Half Year Financial Report
06.30.2015
38 Supplementary notes
It is assumed that the Gro up controls those companies in which it does not own more than 50%
of the capital, and thus disposes of the same percentage of voting power at the Shareholders’
Meeting, where the Group is exposed, or has rights, to variable returns from its involvement wi th
the investee and has the ability to affect those returns throug h its power over the investee, as
defined by IFRS 10 – Consolidated Financial Statements .
The following list i l lustrates the entire consolidation scope at June 30t h
, 2015:
Parent Company TOD’S S.p.A. S .E lp id io a Mare - I ta ly Share Capital (S.C.) - euro 61,218,802
Direct Subsidiaries TOD’S Deutsch. Gmbh TOD’S France Sas An.Del. USA Inc. TOD’S International BV Dusseldorf - Germany Paris - France New York - U.S.A Amsterdam – Netherland S.C. - euro 153,387.56 S.C. - euro 780,000 S.C. - Usd 3,700,000 S .C. - euro 2,600,200 % held: 100% % held: 100% % held: 100% % held: 100% Del.Com S.r. l. Holpaf B.V. TOD’S Brasil Ltda Partec ipaz ioni Int . S. r . l . S.Elpidio a Mare - I taly Amsterdam – Netherlands San Paolo – Brasil S .E lp id io a Mare – I ta ly S.C. - euro 31,200 S.C. - euro 5,000,000 S.C. – Real 14,000,000 S .C . – euro 957,486 % held: 100% % held: 100% % held: 100% % held: 100% TOD’S Danmark APS TOD’S Austr ia Gmbh Copenhagen - Denmark V ienna - Austr ia S .C . – Dkk 500,000 S .C . – euro 50,000 % held: 100% % held: 100%
Indirect subsidiaries Cal.Del. USA Inc. TOD’S Tex Del USA Inc. Deva Inc. Flor.Del. USA Inc. Beverly Hil ls, Ca - U.S.A. Dallas, Tx - U.S.A Wilmington, De – U.S.A. Tallahassee, F l - U.S.A. S.C. - Usd 10,000 S.C. - Usd 10,000 S.C. - Usd 500,000 S.C. - Usd 10,000 % held: 100% % held: 100% % held: 100% % held: 100% Hono.Del. Inc. I l .Del. USA Inc . Neva.Del. Inc. Or.Del. USA Inc. Honolulu, Hi - U.S.A. Springfield, I l - U.S.A. Carson City, Nv - U.S.A. Sacramento, Ca - U.S.A. S.C. - Usd 10,000 S.C. - Usd 10,000 S.C. - Usd 10,000 S.C. - Usd 10,000 % held: 100% % held: 100% % held: 100% % held: 100% Gen.Del SA Sandel SA TOD’S Belgique S.p.r. l. TOD’S Washington Inc. Zurich - Switzerland San Marino Bruxelles – Belgium Tumwater, WA – USA S .C. - Chf 200,000 S.C. - euro 258,000 S.C. - euro 300,000 S .C . – Usd 10,000 % held: 100% % held: 100% % held: 100% % held: 100% TOD’S Espana SL TOD’S Hong Kong Ltd TOD’S Japan KK Alban.Del Sh.p.k. Madrid - Spain Hong Kong Tokyo - Japan Tirana - Albania S.C. - euro 468,539.77 S.C. - Usd 16,550,000 S.C. - Jpy 100,000,000 S.C. - euro 720,000 % held: 100% % held: 100% % held: 100% % held: 100% TOD’S Singapore Pte Ltd Un.Del Kft TOD’S UK Ltd Webcover Ltd Singapore Tata - Hungary London - Great Britain London - Great Britain S.C. - Sgd 300,000 S.C. - Huf 42,900,000 S.C. - Gbp 350,000 S.C.- Gbp 2 % held: 100% % held: 100% % held: 100% % held: 50%

TOD’S Group 2015 Half Year Financial Report
06.30.2015
39 Supplementary notes
Indirect subsidiaries TOD ’S Luxembourg SA TOD’S Korea Inc. TOD’S Macao Ltd TOD’S (Shan.) Tr. Co. Luxembourg Seoul - Korea Macao Shanghai - China S.C. - euro 31,000 S.C. - Won 1,600,000,000 S.C. - Mop 20,000,000 S.C. - Usd 32,000,000 % held: 50% % held: 100% % held: 100% % held: 100% TOD’S India Retail Pte Ltd Re.Se.Del. S.r . l. Del.Pav. S.r. l. F ilangieri 29 S.r. l. Mumbai - India S.Elpidio a Mare - I taly S.Elpidio a Mare - I taly S.Elpidio a Mare - I taly S.C. - Inr 193,900,000 S.C. - euro 25,000 S.C. - euro 50,000 S.C. - euro 100,000 % held: 51% % held: 100% % held: 50% % held: 50% Roger Vivier Hong Roger Vivier Sing. Roger Vivier (Shan.) Roger Vivier UK Ltd Kong Ltd PTE Ltd Tr.Co. Hong Kong S ingapore Shanghai – China London – Great Britain S .C . – Hkd 1,000,000 S .C . – Sgd 200,000 S .C . – Rmb 75,000,000 S .C . – Gbp 50,000 % held: 100%% % held: 100% % held: 100% % held: 100% TOD’S Georgia Inc. Roger Vivier France SaS Roger Vivier Korea Inc. Roger Vivier Switz. S.A. Norcross, GA – USA Par is – F rance Seoul – Korea Lugano – Switzerland S .C . – Usd 10,000 S .C . – euro 3 ,507,500 S .C . – Won 1,200,000, 000 S .C . – Chf 1,500,000 % held: 100% % held: 100% % held: 100% % held: 100% Roger V iv ier Macau Lda Roger V iv ier Japan KK Macao Tokyo – Japan S .C . – Mop 500, 000 S .C . – Jpy 10,000,000 % held: 100% % held: 100% 7. Segment reporting
The search for higher levels of operating efficiency has identified as key element for maximising
profitability via the condivision of a significant portion of service activities (f irst and foremost
production), both at the central and peripheral levels; on the contrary, aggressive segmentation
of the business appears uneconomical, under current circumstances.
At the operating level, the Group’s organisation is based on an articulated matrix structure
according to the different functions/activities in the value chain, alternatively according to
brand, product, channel and geographical area. The overall organisation envisages a unified
strategic vision of the business.
This type of organisation is reflected in the ways in which management monitors and strategically
focuses the Group’s activities .
The economic disclosure set out in the Interim Report i ncludes operating information, including a
break-down of consolidated revenues by BRAND, CHANNEL, PRODUCT TYPE and REGION . Below
are provided some further details for completion:

TOD’S Group 2015 Half Year Financial Report
06.30.2015
40 Supplementary notes
2015 Capital expenditures
By Region (euro mn)By investment allocation (euro mn)
0.8
14.8
10.6
1.3
15.714.9
3.4
Key money DOS Prod. Other
H1 15 H1 14
14.3
4.33.6
2.7 2.7
19.2
3.0
5.24.6
2.1
Italy Europe Americas Gr. China Rest of World
H1 15 H1 14
Distribution network
TOD'S GROUP - Distribution channel
06.30.15 06.30.14Italy DOS 45 43
FRANCHISED STORES 2 3
Europe DOS 53 46
FRANCHISED STORES 17 13
Americas DOS 18 15
FRANCHISED STORES 3 2
Greater China DOS 81 75
FRANCHISED STORES 24 24
RoW DOS 54 50
FRANCHISED STORES 47 45
Total DOS 251 229
Totale Franchised stores 93 87
TOD'S HOGAN
145
79
138
74
DOS Franchising
H1 15 H1 14
29
9
26
9
DOS Franchising
H1 15 H1 14

TOD’S Group 2015 Half Year Financial Report
06.30.2015
41 Supplementary notes
FAYROGER
VIVIER
5
1
4
0DOS Franchising
H1 15 H1 14
28
4
21
3
DOS Franchising
H1 15 H1 14
8. Management of financial risks
Consistently with the provisions of the Code of Self -discipline of Listed Companies, TOD’S Group
has set up a system for monitoring the financial risks to which it is exposed. These can be
identified as follows:
i. Credit risk. This represents the exposure of TOD’S Group to potenti al losses stemming from
default on the obligations assumed by commercial counterparties.
i i. Liquidity risk. This represents the risk stemming from the unavailability of f inancial resources
as necessary to meet the short -term commitments assumed by the Group a nd its own
financial requirements. The main factors that determine the Group’s degree of l iquidity are
the resources generated or used by operating and investment activities and, on the other
hand, the due dates or renewal dates of its payables or the liqu idity of its f inancial
investments and market conditions.
It is noted that the parent company TOD’S S.p.A., during the half year 2015, catching the
opportunity of extremely low interest rates and banking conditions particularly favorable for
the Company, it entered into two loan agreements, with two leading banks, for a total amount
of 50 mill ion euros (Note 11) with a duration of 4 years, which were aimed to finance the
construction, already started last year, of a new production plant in the area in whic h the
Group’s headquarter is situated, and more generally , to support the future investments
related to the Group development.
The Group’s profitability, together with its current and historic capacity to generate cash and
considering the exposure to the banking system, these are factors that lead to the conclusion
that it faces no liquidity risk over the foreseeable future.
Finally, it should be noted that on July 23rd
, 2014 the parent company TOD’S S.p.A. entered
into a loan agreement with two leading ba nks, which was aimed at setting aside funds for a
maximum amount of 400 mill ion euros intended to support the Group’s future development.
At June 30t h
, 2015, the Company did not request any sum .

TOD’S Group 2015 Half Year Financial Report
06.30.2015
42 Supplementary notes
i i i. Market risk. This type of risk includes those risks that are directly or indirectly tied with the
fluctuation of physical and financial market prices to which a company is exposed:
– exchange rate risk;
– interest rate risk;
– commodity risk, which is tied to the volatil ity of prices for the raw materials used in t he
production process.
The policy adopted for management of the aforementioned risks, provides that the Group
constantly monitors the financial risks connected with its operations, so that it can assess their
potential negative effects in advance and take the necessary actions to mitigate them.
Particularly in regard to exchange rate risk, the Group , due to its commercial operations, is
exposed to fluctuations in the exchange rates for currencies in which some of its commercial
transactions are denominated (particularly USD, GBP, CHF and Far East countries), against a cost
structure that is concentrated principally in the euro zone. Changes in the exchange rate between
the euro and the aforementioned currencies can impact the Group’s results . Moreover, due to
the geographical composition of the Group structure, which is formed by subsidiaries with
different currencies, the Group is exposed to exchange rate risk related to intercompany financial
f lows (mainly dividends, loans, transactions on share capital). The Group’s risk management
policy, in connection to the exchange rate risk on commercial transactions, pursues the objective
of guaranteeing that the value in euro of the receipts from wholesale sales in foreign currency of
each collection (Spring-Summer and Fall-Winter) is equal or better on average to what would be
obtained by applying the set target exchange rates. The foregoing purposes are pursued by
executing forward contracts for each individual curren cy in which the Group operates , in order to
hedge a specific percentage of revenue volumes (and costs) expected in the individual currencies
other than the functional currency, without any speculative or trading purpose, consistently with
the strategic policies adopted for prudential management of cash flows. This might involve
foregoing opportunities, but also avoids incurring speculative risks.
In connection with the exchange rate risk on financial intercompany transactions, t he Group
monitors the risk underlying outstanding liabilities ( loans) and fo recast l iabilities (dividends and
capital increases), in view of guaranteeing that no material operating and financial impact for the
entities involved results from these transactions in relation to fluctuations in exchange rates.
These goals are pursued b y the Group through monitoring the foreign exchange rate trends
related to outstanding or expected capital transactions and entering into forward contracts if
they will have material contingent effects. These forward contracts are made to hedge the
individual transactions, and not for speculation or trading. This is consistent with the strategic
policies focused on prudent management of cash flows .
In addition, TOD’S Group is exposed to interest rate fluctuations, l imited to its variable -rate debt
instruments. Interest rate risk is managed in conformity to long -established practice with the aim

TOD’S Group 2015 Half Year Financial Report
06.30.2015
43 Supplementary notes
of cutting down the risk of interest rate volatil ity, at the same time pursuing the goal of reducing
the financial costs involved to a minimum.
At June 30t h
, 2015 there were two derivative contracts in being ( interest rate swaps - IRSs), which
were entered into on July 23rd
, 2014, to hedge the risk of possible changes in the interest rates
on the financing transaction aimed at setting aside funds for a maximum amount of 400 mill ion
euros. These derivatives protect the Group from the risk of a generalis ed rise in interest rates,
swapping the variable rate on the loan for a contractually f ixed rate. Considering that no
amounts had yet been drawn as at June 30t h
, 2015 in relation to the loan underlying the
abovementioned hedging transactions, it should be noted that the effects arising from the IRSs in
2015 have been recognized under an equity reserve for cash flow hedge , net of tax effects.
9. Intangible and Tangible fixed assets
Intangible assets with undefined useful l ife includes the values of the Group own brands, for
about 137 mill ion euros, and value of goodwill, for about 12 mill ion euros , related to acquisitions
of controlled companies and they have been determined in accordance with the acquisition
method (IFRS 3).
Key money include the amounts paid for this purpose by the Group to take over certain leases of
commercial spaces where some DOS operate.
Other intangible assets with definite useful l ife include long -term amounts to protect the brands
owned by the Group, software and other intangible assets. This item include the net book value
related to the agreement signed by the holding TOD’S S.p.A. for f inancing the restoration work on
the Coliseum, amounting to 10.4 mill ion euros.
Capital expenditure in H1 2015 totalled 27.5 mill ion euros, of which 2.5 mill ion euros of
intangible assets and 25 mill ion euros of tangible assets . The capital expenditures of the DOS
network totalled about 15.6 mill ion euros. This amount was used primarily for both new DOS
openings, among which the most relevant are Houston and Atlanta stores, and for renovation
activities of the existing stores. The remaining investment quota in the period regarded not only
the normal processes of modernising the structures and industrial equipment (mainly lasts and
moulds) but also the continuation of construction activities for the building located inside the
perimeter of TOD’S Group headquarter , which was started last year, and to the development of
the company management software.

TOD’S Group 2015 Half Year Financial Report
06.30.2015
44 Supplementary notes
10. Derivatives financial instruments
At the closing date of the half-year condensed financial statements , the notional amount of the
currency futures agreements (sale and purchase) entered into by the Group are summar ized as
follows:
Currency 000's
Notional in
currency
Notional in
euro
Notional in
currency
Notional in
euro
U.S. dol lar 35,300 31,549 1,000 894
Hong Kong dol lar 763,000 87,964 40,000 4,611
Japanese yen 1,704,000 12,437 4,800,000 35,034
Bri tish pound 19,000 26,708
Swiss franc 9,500 9,123
Chinese renmimbi 483,000 69,631
Singapore dol lar 3,730 2,475 375 249
Euro 14,090 14,090 20,890 20,890
Canadian dol lar 5,020 3,627
Brazi l ian rea l 1,810 522
Austra l ian dol lar 2,080 1,430
Total 259,556 61,678
Sales Purchases
At each reporting date, the hedge accounting method is applied. This requires recognition of the
derivatives in equity at their fair value and recognition of the changes in fair value, which varies
according to the type of hedge at the valuation date. The fair value of derivative financial
instruments existing at June 30t h
, 2015 is classif ied as Level 2 and has been determined using
exchange rate that are quoted in active markets .
At June 30t h
, 2015 the net fair value of derivatives used to hedge exchange risks reported is
negative, on the whole, of 10,248 thousand euros, i.e. the balance of assets of 925 thousand euros
(compared to 1,751 thousand euros at December 31s t
, 2014) and liabilities of 11,173 thousand
euros (compared to 11,422 thousand euros at December 31s t
, 2014).
The cash flow hedge reserve related to hedging instruments used to hedge forecast transactions,
net of related tax effects, is negative for 2,552 thousand euros ( it was negative for 4,935
thousand euros at December 31s t
, 2014). Such reserve include even a portion related to
intercompany transactions of the period, of which the related hedging instruments are closed at
June 30t h
, 2015, and it will be reversed to the income statements when sales to third parties
customers will be realized.
As regards the latter hedging contracts related to commercial transactions , which were closed in
the period from January to June 2015, the transfer of the effect of the hedging transactions to

TOD’S Group 2015 Half Year Financial Report
06.30.2015
45 Supplementary notes
the income statement was equal to 11,399 thousand euros, of which 11,043 thousand euros were
entered as a reduction in revenues and 356 thousand euros as an increase in costs.
At June 30t h
, 2015 two derivative contracts ( interest rate swaps - IRSs) were also in place, which
were entered into on July 23rd
, 2014 to hedge the risk associated with fluctuations in the interest
rates on a variable rate loan transaction that was completed on the same date in order to set
aside funds to a maximum amount of 400 mill ion euros (Note 11). These derivative contracts,
having an overall notional amount equal to the maximum value of the amounts made available to
TOD’S S.p.A. (of which an amount of 200 mill ion euros was raised from Crédit Agricole and an
amount of 200 mill ion euros was raised from Mediobanca), protect the Group from the risk of a
generalised rise in interest rates, swapping the variable rate on the loan for a contractually f ixed
rate. Considering that no amounts had yet been requested by the Company as at June 30t h
, 2015
in relation to the loan underlying the abovementioned hedging transactions, the fair value of
these derivatives, which was negative for 4,763 thousand euros at June 30t h
, 2015, was fully
recognized under the equity reserve for cash flow hedge, net of the related tax effect .
11. Net Financial Position
06.30.14 06.30.15 12.31.14 Change
Current financial assets
155,295 Cash and cash equivalents 159,434 165,949 (6,515)
155,295 Cash 159,434 165,949 (6,515)
Current financial liabilities
(13,111) Current account overdrafts (12,592) (10,988) (1,603)
(5,494) Current share of medium-long term financing (9,872) (4,650) (5,223)
(18,605) Current financial liabilities (22,464) (15,638) (6,826)
136,690 Current net financial position 136,970 150,311 (13,341)
Non-current financial liabilities
(22,777) Financing (63,891) (20,298) (43,593)
(22,777) Non-current financial liabilities (63,891) (20,298) (43,593)
113,913 Net financial position 73,079 130,013 (56,933)
Net financial position (euro 000's)
At June 30t h
, 2015, net f inancial position was positive and equal to 73.1 mill ion euros (130 mill ion
euros at December 31s t
, 2014). Gross of dividends paid, net f inancial position would be equal to
134.4 mill ion euros (+4.4 mill ion in respect to December 31s t
, 2014).
In the first half 2015 the parent company TOD’S S.p.A. entered into two loan agreements with
BNL S.p.A. (BNP Paribas Group) and Intesa San Paolo S.p.A. respectively, for an amount of 25
mill ion euros each. The agreement w ith BNL S.p.A. provides that the reimbursement of 25 mill ion
euros, borrowed on May 4t h
, 2015, will be in four years with a payment of 16 instalments at the
end of every quarter including interests calculated applying a variable interest rate equal to the
EURIBOR 3m plus a spread. The agreement with Intesa San Paolo S.p.A. provides that the

TOD’S Group 2015 Half Year Financial Report
06.30.2015
46 Supplementary notes
reimbursement of 25 mill ion euros, borrowed on May 11t h
, 2015, will be in one single payment at
the expiry date April 27t h
, 2019. Such agreement provides that interests will be paid quarterly
applying a variable interest rate equal to the EURIBOR 3m plus a spread .
12. Share Capital
At June 30t h
, 2015, the company share capital totalled 61,218,802 euros, and was divided into
30,609,401 shares having a par value of 2 eur os each, fully subscribed and paid in. No variations
occurred in the current period, not even in the previous. The Group did not own treasury shares
in the parent TOD’S S.p.A., and it did not execute any transactions on those shares during the
period. No stock option plans are currently in place .
13. Earnings per share
The calculation of base and diluted earnings per share is based on the followings:
i . R e f e r e n c e p r o f i t
euro 000's
For continuing and discontinued operations H1 2015 H1 2014
Profit used to determine basic earning per share 50,379 56,154
Dilution effects
Profit used to determine diluted earning per share 50,379 56,154
euro 000's
For continuing operations H1 2015 H1 2014Profit for the period 50,379 56,154
Income (Loss) from discontinued operations
Profit used to determine basic earning per share 50,379 56,154
Dilution effects
Profit used to determine diluted earning per share 50,379 56,154 In both periods, f irst half 2015 and 2014, there were no dilutions of net consolidated earnings,
partly as a result of activities that were discontinued during the periods in question .
i i . R e f e r e n c e n u m b e r o f s h a r e s
H1 2015 H1 2014
Weighted average number of shares to determine basic earning per share 30.609.401 30.609.401
Share Options
Weighted average number of shares to determine diluted earning per share 30.609.401 30.609.401

TOD’S Group 2015 Half Year Financial Report
06.30.2015
47 Supplementary notes
14. Dividends
Pursuant to a resolution by the Shareholders’ Meeting of April 22n d
, 2015, the parent company
TOD’S S.p.A. paid its shareholders dividends in May for the net profit realised in FY 201 4. The
aggregate value of dividends paid totals 61,218,802 euros, at the rate of 2 euros for each of the
30,609,401 shares comprising share capital at the ex dividend date (May 18t h
, 2015). Moreover,
other Group companies paid 100 thousand euros in dividends to their own minority shareholders .
15. Provisions
They include the prudent estimate of l iabilities that the Group might incur on pending lawsui ts.
Provisions for the period amounted t o 1,285 thousand euros (545 thousand euros the provision
of the first half of 2014), while the fund has been reversed for 150 thousand euros (748 thousand
euros in the first half 2014) against the settlement of some litigations previously accrued. During
the period the parent company TOD’S S.p.A. was subject to a tax inspection (assessment) by the
tax authorities (“Agenzia delle Entrate”) for the fiscal year 2010, 2011 and 2012 which was
concluded in July 2015 when it was issued a tax report (“Processo Verb ale di Constatazione”). The
Company is stil l evaluating both the remarks arose from the tax report and the possible actions
to be undertaken. Based on the first estimates on the validity of the requests made by the tax
authorities no provision for risks has been recognized in the half -year condensed financial
statements at June 30t h
, 2015. Moreover, it is noted that in case contingent l iabi lities will arise
from the tax inspection they would be not significant.
16. Employee benefits
This item mainly consists of post-employment benefits, measured by using the actuarial method
of measuring the unit projection of the receivable applied by independent actuaries on the basis
of IAS 19, and is mainly represented by the provisions for staff leaving indemnities (TFR)
recognised by the Italian companies. The charge for the financial year was recognised under
personnel expense.
The main actuarial assumptions used for the valuation at December 31s t
, 2014, unchanged for HY
20215, are summarized below:
Discounting rate: 1 .49% it is related to the average yield curve from IBOXX Eurozone
Corporates AA of December 2014.
Inflation rate: 0.6% for the year 2015, 1.2% for the year 2016, 1.50% for the year 2017
and 2018, 2% for the year 2019 on;
TFR incremental rate: 1.950% for the year 2015, 2.4% for the year 2016, 2.625% for the
year 2017 and 2018, 3% for the year 2019 on.

TOD’S Group 2015 Half Year Financial Report
06.30.2015
48 Supplementary notes
17. Transactions with related parties
The Group's related parties transactions were executed in compliance with the procedural
sequence and implementing procedures set out in the Related Parties Transactions Procedure
approved by the TOD'S S.p.A. Board of Directors in implementation of the Related Parties
Regulation adopted by CONSOB with Resolution no. 17221 of March 12t h
, 2010, as amended by
Resolution no. 17389 of June 23rd
, 2010. In accordance with market best practices, significant
related party transactions are subject to an in-depth review involving, inter alia: ( i) complete,
prompt transmission of material information to the delegated Board of Directors c ommittees (the
Control and Risk Committee and the Independent Directors Committee, each within the ambit of
their delegated responsibili ties, where the majority and all members of these committees are
independent directors), who in the performance of their functions also avail themselves of the
assistance of independent experts; ( i i) the issuance of an opinion (either binding or non -binding,
as applicable) before approval of the transaction by the Board of Directors (or, if appropriate, by
the body delegated to resolve on the transaction).
Without prejudice to the principles of procedural fairness cited hereinabove, no unusual or
atypical related party transactions, or other related party transactions that might compromise
corporate assets or the completeness and fairness of Group accounting and other information
were executed during the period.
Transactions concluded during the period.
During the first half of 2015, no related party transaction has been carried out by the Group.
In continuation of contrac tual relationships already existing in 201 4 , TOD’S Group continued to
maintain a series of contractual relationship with related parties (directors/controlling or
significant shareholders) in the first half of 201 5. The main object of the transactions was the
sale of products, lease of sales spaces, show rooms and offices, use of the ROGER VIVIER brand
license and the provision of advertising services.

TOD’S Group 2015 Half Year Financial Report
06.30.2015
49 Supplementary notes
i Commercial transactions with related parties – Revenue
euro 000's
30 June 2015
Parent Company (*) 7,568
Directors
Other related parties
Total 7,568 - - - -
30 June 2014
Parent Company (*) 5,954 25
Directors
Other related parties
Total 5,954 25 - - -
Sales of
Product
Rendering
of services Royalties
Operating
lease
Other
operations
i i Commercial transactions with r elated parties – Costs euro 000's
30 June 2015
Parent Company (*) 945 27 6,383 2,231 1
Directors
Other related parties
Total 945 27 6,383 2,231 1
30 June 2014
Parent Company (*) 408 157 4,692 2,118 5
Directors
Other related parties
Total 408 157 4,692 2,118 5
Other
operations
Costs of
product
Rendering
of services Royalties
Operating
lease
i i i Commercial transactions with related parties – Receivables and payables
Receivables and payables
euro 000's Receivables Payables Receivables Payables
Parent Company (*) 3,426 6,965 2,126 5,791
Directors
Other related parties
Total 3,426 6,965 2,126 5,791
06.30.15 06.30.14
.
(*) Companies directly or indirectly controlled by Chairman of the Board of Directors Diego Della Valle. .005 2.132Crdebiti 30.06.10 30.06.09
Given the insignificance of these amounts, they have not been separately l isted on the face of
the financial statements, in accordance with CONSOB resolution n. 15519 of July 27t h
, 2006.
Transactions between Group companies included in the scope of consol idation have been

TOD’S Group 2015 Half Year Financial Report
06.30.2015
50 Supplementary notes
eliminated from the half-year condensed financial statements . Consequently, they have not been
highlighted in these notes.
Compensation of Directors, Statutory Auditors and General Managers
Compensation of Directors and Executives with strategic responsibilities of TOD’s S.p.A. have
been determined in accordance with the Compensation Policy adopted by TOD’S S.p.A. Board of
Directors resolution at November 11s t
, 2011 as amended on November 12n d
, 2014. For the first
half of 2015 (including compensation for the activities performed at subsidiaries) compensation
amount to respectively 2 mill ion euros and 0.3 mill ion euros.
Compensation for Statutory Auditors of TOD’S S.p.A. at June 30t h
, 2015 amount to 0.2 mill ion of
euro.
18. Significant non-recurring transactions and events
The Group did not carry out any significant non -recurring operations in the first half of year
2015.
19. Significant events occurred after the reporting period
No significant events occurred after the end of the reporting peri od.

TOD’S Group 2015 Half Year Financial Report
06.30.2015
5 1 Attestation
Attestation of the Half-Year condensed financial statements of TOD’S Group pursuant
article 154 bis of D.LGS. 58/98 and of article 81 -ter of Consob Regulation n. 11971 of
May 14t h
1999 and further modifications and integrations.
1. The undersigned Stefano Sincini, Chief Executive Officer of TOD’S S.p.A., and Rodolfo Ubaldi,
manager responsible for the drawing up of the financial reports of TOD’S S.p.A., certify, in
accordance with the provisions of Article 154 -bis, subsections 3 and 4, of Legislativ e Decree no.
58 of February 24t h
, 1998:
• the adequacy in terms of the company’s characteristics and
• effective application
of administrative and accounting procedures for preparation of the 201 5 Half Year condensed
financial statements during the period January 1s t
, 2015 to June 30t h
, 2015.
2. They also certify that Half -Year condensed financial statements:
a) have been prepared in accordance with International Financial Reporting Standards, as
endorsed by the European Union through Regulation (EC) 1606/2 002 of the European
Parliament and Counsel, dated 19t h
July 2002;
b ) correspond with the account book and ledger entries;
c) give a true and fair view of the assets, l iabilities, income and financial position of the
issuer and entities included in the sc ope of consolidation.
3. Interim report provides a reliable analysis of the significant events for the first six months of
the current fiscal year and the impact of such events on the Half year condensed financial
statements as well as a description of th e main risks and uncertainties for the second half of the
year in addition to a reliable analysis of the information on the significant related party
transactions.
Sant’Elpidio a Mare, August 6t h
, 2015
Manager responsible for drawing Chief Executive Officer up of the financial report
Stefano Sincini Rodolfo Ubaldi