2015 Halifax Index Presentation
35
-
Upload
halifax-partnership -
Category
Economy & Finance
-
view
402 -
download
1
Transcript of 2015 Halifax Index Presentation


Economic Progress


PEOPLE

STRONG POPULATION GROWTH IN 2014

…AND STRONGER THAN THOUGHT IN 2013
20022003
20042005
20062007
20082009
20102011
20122013
2014-1,000
0
1,000
2,000
3,000
4,000
5,000
6,000
1,799
1,418
4,424
Halifax Population Growth (people)
Population Growth 2015 Revision Annual average

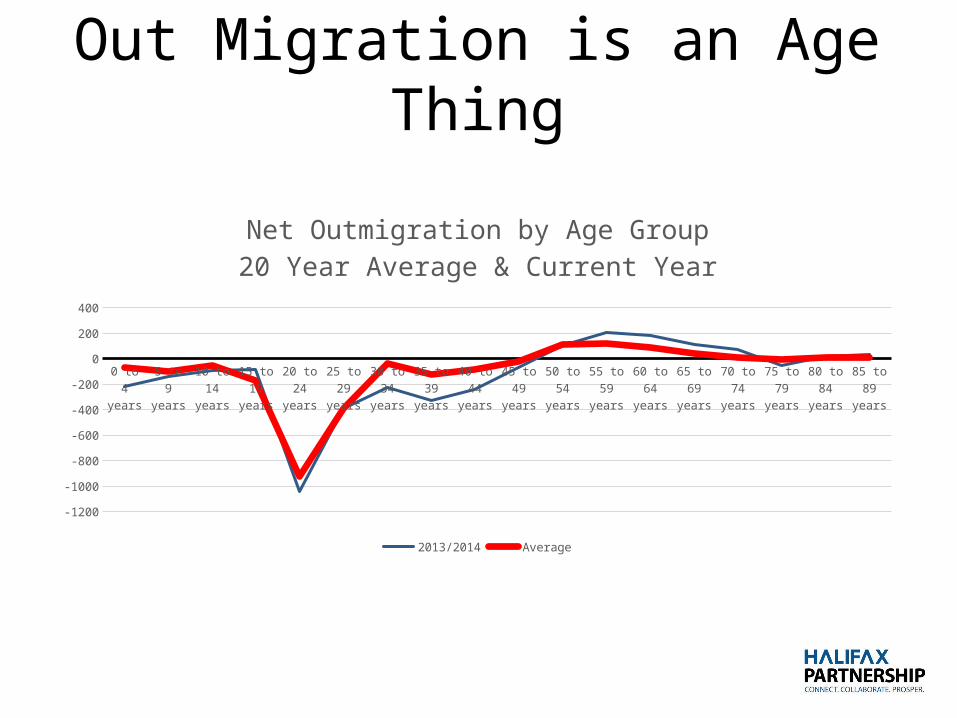
Out Migration is an Age Thing
0 to 4 years
5 to 9 years
10 to 14 years
15 to 19 years
20 to 24 years
25 to 29 years
30 to 34 years
35 to 39 years
40 to 44 years
45 to 49 years
50 to 54 years
55 to 59 years
60 to 64 years
65 to 69 years
70 to 74 years
75 to 79 years
80 to 84 years
85 to 89 years
-1200
-1000
-800
-600
-400
-200
0
200
400
Net Outmigration by Age Group20 Year Average & Current Year
2013/2014 Average

THE IMPACT OF NET OUTMIGRATION ON NOVA SCOTIA
• 1300 PEOPLE A YEAR (NET)• $80,000 in net taxes if they have a bachelors
degree or higher, for each person• $47 million in lifetime net taxes, every year• $1.2 billion in lifetime income, every year• A focus on retaining new grads…over $1 billion in
provincial revenue over the last 10 years

RAPID GROWTH IN INTERNATIONAL STUDENTS

HALIFAX: A STARTUP CAPITAL

IT’S ABOUT IT.

NOVA SCOTIA’S START UP SPACE

ECONOMY
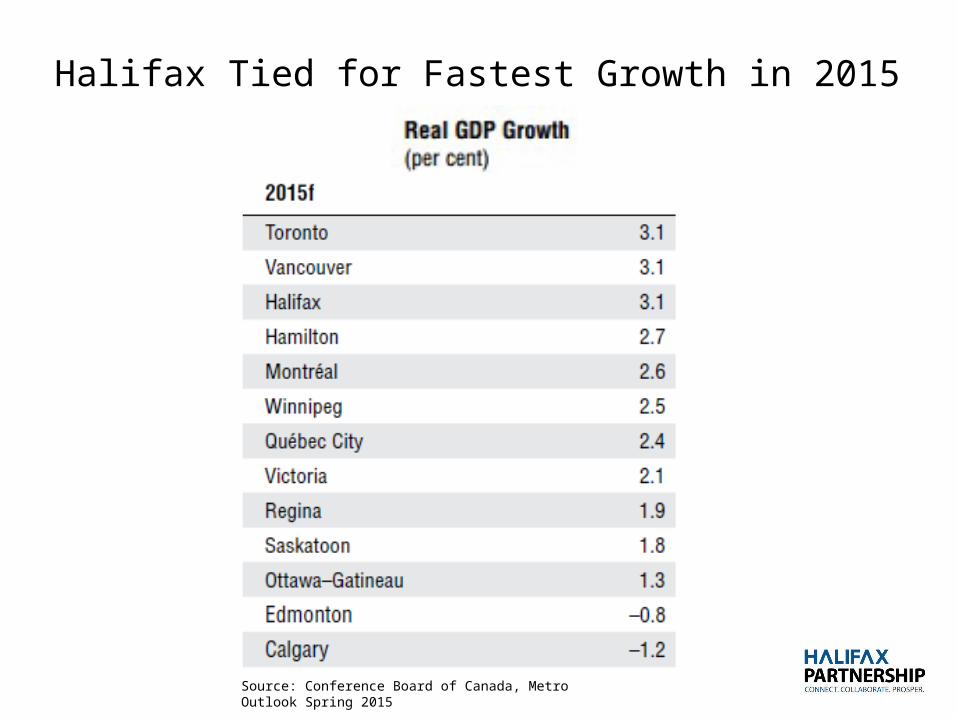
Halifax Tied for Fastest Growth in 2015
Source: Conference Board of Canada, Metro Outlook Spring 2015


Ocean Tech Cluster Continues to Grow

Offshore Investments

Offshore Investments


SUSTAINABILITY

HALIGONIANS LESS DEPENDENT ON CARS

SHIFT TO APARTMENT STARTS GROWING THE CORE
QUALITY OF PLACE

CONTINUED IMPROVEMENT IN CRIME RATES

CONTINUED IMPROVEMENT IN WORKPLACE SAFETY

OUR SENSE OF COMMUNITY IS MIDDLE OF THE PACK

PLACE MAKING: AESTHETICS


PLACE MAKING: SOCIAL OFFERINGS

PLACE MAKING: OPENNESS
Share Thanksgiving

Economic Progress

34