2015 Haldor Topsoe Catalytic Forum · PDF file2015 Haldor Topsoe Catalytic Forum ... CUMENE...
58
2015 Haldor Topsoe Catalytic Forum Refining and Petrochemicals: Challenges and Solutions August 2015 1 Rafael Larraz
Transcript of 2015 Haldor Topsoe Catalytic Forum · PDF file2015 Haldor Topsoe Catalytic Forum ... CUMENE...

2015 Haldor Topsoe Catalytic Forum
Refining and Petrochemicals: Challenges and Solutions
August 2015
1
Rafael Larraz

2Haldor Topsoe Catalytic Forum, 2015
1. CEPSA Overview
2. Refining and Petrochemical Market Outlook
3. Refinery Petrochemical Integration
4. Refinery Petrochemical Integration. Future trends
5. Conclusions
DISCLAIMER: The information included in this presentation has been collected from public sources and does notrepresent neither CEPSA strategy nor CEPSA position on these topics.

1. CEPSA Overview
3Haldor Topsoe Catalytic Forum, 2015

THE COMPANY
Cepsa is an integrated company which operates in all the stages of the oil and gas value chain
Cepsa Today
Cepsa | Global Energy | 2015
• More than 80 years in the oil business
• More than 10,800 professionals
• Strong commitment with R&D activities

IPIC - OUR SHAREHOLDER
Since August 2011, Cepsa's sole shareholder is International Petroleum InvestmentCompany (IPIC), an investment group established in 1984 by the Government ofAbu Dhabi, which has had a stake in the Company for the past 26 years.
For Cepsa, integration in IPIC represents a great opportunity for growth andinternational expansion, a major business challenge.
Cepsa Today
Cepsa | Global Energy | 2015

OUR ACTIVITIES
EXPLORATION AND PRODUCTION
REFINING DISTRIBUTION AND MARKETING
PETROCHEMICALS GAS AND ELECTRICITY
Cepsa Today
Cepsa | Global Energy | 2015

CEPSA Research Centre
Haldor Topsoe Catalytic Forum, 2015 7
• Founded in 1975
• New facilities inaugurated 2008
• Located in Alcalá de Henares (Spain)
• 9000 m2 laboratories
• More than 30 pilot plants. CEPSA Technology
• Budget 2015 10 M€
• R&D activities for CEPSA Group• Upstream• Downstream• Petrochemicals• Innovation

Haldor Topsoe Catalytic Forum, 2015
Refinery Petrochemical Integration: 12,7%
CEPSA Oil Refining
TENERIFE4.5 million t/yr.
1930Nelson Index:5.3
LA RÁBIDA10 million t/yr.
1967Nelson Index: 9.7
GIBRALTAR-SAN ROQUE12 million t/yr.1969Nelson Index:12.3
ASESA50% (asphalt refinery)0.73 million tonnes per year
CEPSA
Other Companies
8

BENZENE
LAB
PHENOL
PTA/PIAXYLENES
CEPSA Petrochemistry
TOLUENE
PROPYLENE
PET
CUMENE
ACETONE
Haldor Topsoe Catalytic Forum, 2015 9CICLOHEXANE

Petrochemistry
LAB plantBécancour, QuebecCanada120,000 t/yr. LAB
LAB plantSalvador de BahíaBrazil220,000 t/yr. LAB80,000 t/yr. LABSA
Phenol PlantPalos de la Frontera800,000 t/yr. Cumene600,000 t/yr. Phenol370,000 t/yr. Acetone24,000 t/yr. AMS15,000 t/yr. Methyl amines7,000 t/yr. Derivatives
PTA plantGuadarranque650,000 t/yr. PTA220,000 t/yr. PIA175,000 t/yr. PET
LAB plantPuente Mayorga
220,000 t/yr. LAB80,000 t/yr. LABSA
400,000 t/yr. Paraffins
Phenol and acetone plantShanghai (China)
360,000 t/yr. Cumene250,000 t/yr. Phenol
150,000 t/yr. Acetone$200 million investment
Haldor Topsoe Catalytic Forum, 2015 10
CEPSA Phenol & Acetone Plant, Shanghai China –CEPSA’s chemical plant in Shanghai was inaugurated inApril and has been one of the biggest projects inCEPSA´s international growth and expansion strategy.
WRA Petrochemical Plant of the year , May 2015

2. Refining and Petrochemical Market Outlook
11Haldor Topsoe Catalytic Forum, 2015

Haldor Topsoe Catalytic Forum, 2015 12
World GDP Outlook
GDP GROWTH BY REGION
(Annual percent change)
2005 2010 2011 2012 2013 2014
North America 3,33 2,61 1,73 2,28 2,20 2,41
Latin America 4,35 5,97 4,14 2,57 2,64 0,93
Europe 2,41 2,29 2,04 (0,17) 0,30 1,35
CIS 6,59 4,89 4,70 3,44 2,00 0,72
Africa 5,47 5,02 0,92 5,17 3,93 3,46
Middle East 5,67 5,50 5,50 2,28 2,47 3,06
Asia Pacific 5,26 7,37 4,64 4,65 4,60 4,24
Total World 3,81 4,33 3,03 2,41 2,47 2,56
Source: WB, 2015
World GDP mainly to growth in Africa, Middle East and Asia.
Petrochemical linked to GDP growth, specially in the emergent areas.
Source: Nexant, 2014
3,85
3,9
3,95
4
4,05
4,1
4,15
4,2
4,25
0
10
20
30
40
50
60
70
80
90
1995 2000 2005 2010 2015 2020 2025 2030 2035
kg P
etCh
em/$
m G
DP
Kg P
etCh
em p
er c
apita
Petrochemicals and GDP
Consumption per capita Consumption per GDP
Haldor Topsoe Catalytic Forum, 2015 13
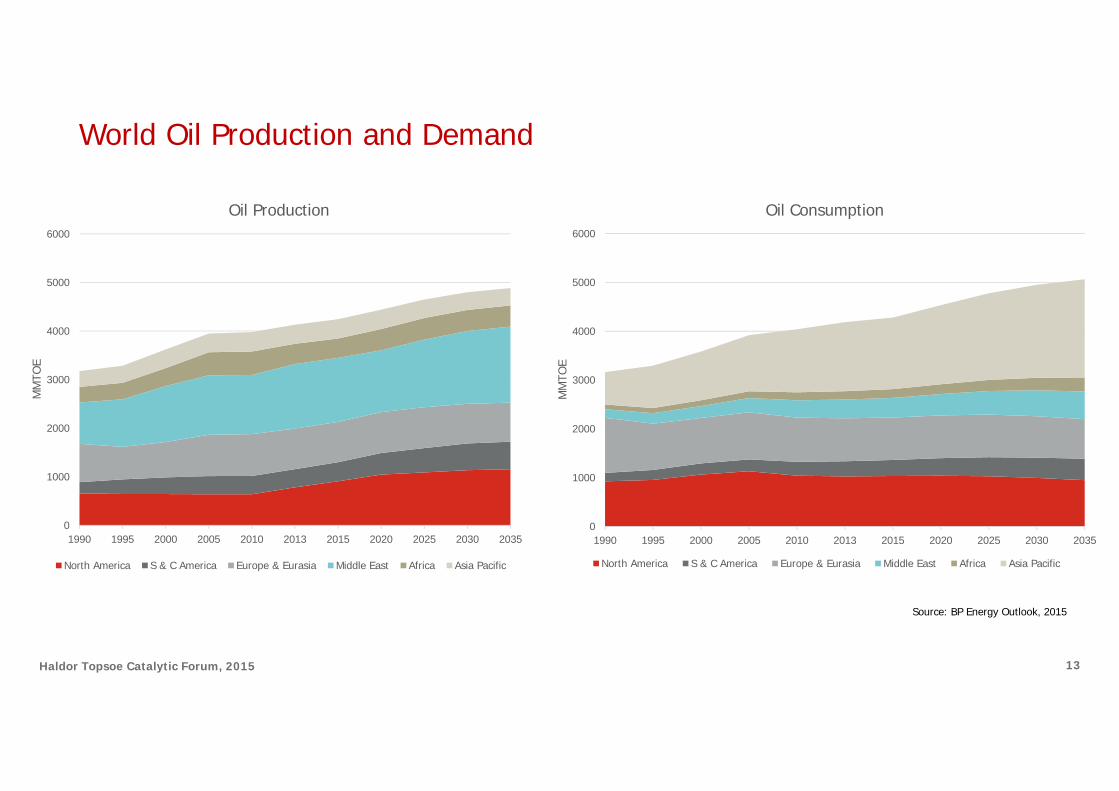
World Oil Production and Demand
0
1000
2000
3000
4000
5000
6000
1990 1995 2000 2005 2010 2013 2015 2020 2025 2030 2035
MM
TOE
Oil Production
North America S & C America Europe & Eurasia Middle East Africa Asia Pacific
Source: BP Energy Outlook, 2015
0
1000
2000
3000
4000
5000
6000
1990 1995 2000 2005 2010 2013 2015 2020 2025 2030 2035
MM
TOE
Oil Consumption
North America S & C America Europe & Eurasia Middle East Africa Asia Pacific

Haldor Topsoe Catalytic Forum, 2015 14
World Natural Gas Production and Demand
Source: BP Energy Outlook, 2015
0
1000
2000
3000
4000
5000
6000
1990 1995 2000 2005 2010 2013 2015 2020 2025 2030 2035
MM
TOE
Natural Gas Consumption
North America S & C America Europe & Eurasia Middle East Africa Asia Pacific
0
1000
2000
3000
4000
5000
6000
1990 1995 2000 2005 2010 2013 2015 2020 2025 2030 2035
MM
TOE
Natural Gas Production
North America S & C America Europe & Eurasia Middle East Africa Asia Pacific

Haldor Topsoe Catalytic Forum, 2015 15
World Oil Demand by sector
CAGR
-3,7%
1,2%
1,5%
0,5%
Refineries should improve its complexity in order to address the demand in petrochemicals and fuels
47,5
54,9
3,5 1,02,9
2013 Diesel Gasoline Others 2025
World Oil Demand Growth Drivers
Transport, MBb/d
10,7
12,5
0,50,5
0,8
2013 Ethane LPG Naphtha 2025
Petrochemical Feedstock, MBb/d
5,3
47,510,7
23,5
3,4
54,912,5
24,9Power generation
Transport
Petrochemicals
Others (*)
201389 MBb/d
202598 MBb/d
(*) Other Industry, Buildings, Agriculture, …
Sources: EIA AEO 2013; WTO , World Trade Report 2013

Haldor Topsoe Catalytic Forum, 2015 16
Crude Oil Cost Curve
25
4048
53 54 55 5762
88
0
10
20
30
40
50
60
70
80
90
100
0 20 40 60 80 100 120
US$
/Bbl
MBoe/d
Source: Oil&Gas Journal Financial, 2015
OnShore Middle East
OffShore Shelf
Extra Heavy Oil
Deepwater
Onshore Russia
OnShore Row
UltraDeepwater
NAM Shale
Oil Sands
Brent Price- May 2014
Brent Price- August 2015
EIA World Oil Demand92 million Bbl/d

Haldor Topsoe Catalytic Forum, 2015 17
Shale Gas and Oil
Directional drilling and hydraulic fracturing maketight oil and gas possible.
Recovery factor for the tight oil and gas formation is extremly low, around 10%.
Fields production periods are low in comparisonwith conventional oil and gas reservoirs.
Those facts make tight formation productionmuch more expensive than Middle East fields.

Haldor Topsoe Catalytic Forum, 201518
Shale Gas and Oil
0
100
200
300
400
500
600
700
800
900
1000
1994
1995
1996
1997
1998
1999
2000
2001
2002
2003
2004
2005
2006
2007
2008
2009
2010
2011
2012
2013
2014
MM
T
Shale Gas US
0
100
200
300
400
500
600
700
800
900
1000
1994
1995
1996
1997
1998
1999
2000
2001
2002
2003
2004
2005
2006
2007
2008
2009
2010
2011
2012
2013
2014
MM
T
Shale Oil US
% Vol.Marcellus
ShaleBarnettShale
Methane 82,1 91,8
Ethane 14 4,4
Propane 3,5 0,4
Carbon Dioxide 0,1 2,3
Nitrogen 0,3 1,1
Crude Country API º
Eagle Ford USA 44,7
Bakken USA 40,8
Source: BP Statistical Review 2015

Haldor Topsoe Catalytic Forum, 2015 19
Coal Production And China
0%
10%
20%
30%
40%
50%
60%
70%
80%
90%
100%
MM
T
Coal Production
China World
China produces 3874 MT of Coal outof a World production of 8165 MT.
China has huge coal reserves, much of which is used for power generation.
Coal reserves in western China are lowquality and remote from consumptioncentres.
Source: BP Statistical Review 2015

Haldor Topsoe Catalytic Forum, 2015 20
Oil&Gas(106 MT)
Upstream(105 MT)
Intermediate(104MT)
DownstreamConversionIndustries
E&P
Oil Refinery
Gas Separation
Olefins:
Ethylene
Propylene
Aromatics:
Benzene
Toluene
Xylene´s
Olefins:
EDC/VCM
EO/EG
Oxoalcohols
Acrylonitrile
Aromatics:
EthylBenzene
Styrene
Ciclohexane
Caprolactam
Cumene/Fenol
LAB
PTA/PIA
Plastic Resins:
PE, PP, PVC, PS, EPS, PET
PC, POM, PBT, Nylon 6,6, PMMA
Synthetic Fibers:
Polyester
Nylon 6
Polypropylene
Acrylic
Synthetic Rubber Elastomers:
BR, SBR, EPDM
PTA/PIA/PET
Synthetic Coating Adhesives:
PVA, Silicone
Petrochemical Value Chain
PriceVolume

Haldor Topsoe Catalytic Forum, 201521
Petrochemical Derivatives

Haldor Topsoe Catalytic Forum, 2015 22
Petrochemical Business Cycle
Over investment in thesector
Manufacturers start losingpricing power
Supplies slowly startexceeding demand
Era of competitivedevaluation
Beginning of consolidationand closures
Manufacturers startregaining pricing power
Demand starts exceedingsupply
Demand excedes supply
Beginning of investmentin the sector
Era of high margin and expansion
Start of theCycle
ExcessCapacityEnd Of cycle
Product LTGREthylene 1-1,5 x GDP
Propylene 2 x GDP
Benzene 1 x GDP
P-Xylene 1,5 x GDP
HDPE 1,5 x GDP
LDPE 2 x GDP
PP 1-1,5 x GDP
Deutsche Bank, 2013

Haldor Topsoe Catalytic Forum, 2015 23
Petrochemical Production Process
Steam Cracking
Produce olefins and some aromatics.Processing feedstocks include ethane, LPG and naphta.Aromatics yields are low when natural gas is used as feedstock.
Fluidized Catalytic Cracking
Produces Propylene as a by productAfter some years of low margins, propylene production might turn it into a key process for refinery petrochemical integration.
Catalytic Reforming
Produces Aromatics as a by product.New catalyst generations focused on xylenes
Refiner has to consider petrochemicals as a high priced alternative option, but for a smallmarket.

Haldor Topsoe Catalytic Forum, 2015 24
Petrochemical Feedstocks
Most Petrochemicals are made from ethane, propaneor naphta, that come from oil refineries and gas processing.
Regions with surplus, low priced ethane are atractivefor steam cracking
Olefins (ethylene, propylene, butadiene) and aromatics(benzene, toluene and xylenes) make up 90% of thepetrochemical production, and are building blocks foralmost all other petrochemicals and polymers
These petrochemicals are commodities and its marketis cost driven and very price sensitive.
Naphtha Reforming
29%
GasOil5%
Methanol1%
Ethane12%
LPG9%
Naphtha Steam Cracking
44%
Petrochemical Feedstock Consumption
Source: Nexant, 2015

Haldor Topsoe Catalytic Forum, 2015 25
Petrochemical Feedstocks Prices
* Source: 1984-1990 German Federal Statistical Office 1991-2014 German Federal Office of Economics and Export Control (BAFA).
† Source: ICIS Heren Energy Ltd.‡ Source: Energy Intelligence Group, Natural Gas Week.BP Statistical Review, 2015
0
2
4
6
8
10
12
14
16
18
20
US$
/MM
Btu
LNG Japan LNG German import NBP Henry Hub † Canada Brent‡ *

Haldor Topsoe Catalytic Forum, 2015 26
Petrochemical Products Prices
Credit Suisse. Benchmark Prices, 2015
0
200
400
600
800
1000
1200
1400
1600
2009 2010 2011 2012 2013 2014 2015 2016
US$
/Ton
Naphtha Ethylene Propylene Brent
0
200
400
600
800
1000
1200
1400
1600
2,00 2,50 3,00 3,50 4,00 4,50
US$
/Ton
Henry Hub, US$/MMBtu
Ethylene Propylene
400
600
800
1000
1200
1400
1600
50 60 70 80 90 100 110 120
US$
/Ton
Brent, US$/Bbl
Ethylene Propylene

Haldor Topsoe Catalytic Forum, 2015 27
Petrochemical Products Prices
Credit Suisse. Benchmark Prices, 2015
0
200
400
600
800
1000
1200
1400
2009 2010 2011 2012 2013 2014 2015 2016
US$
/Ton
Naphtha Benzene Toluene Xylene Brent
0
200
400
600
800
1000
1200
1400
2,00 2,50 3,00 3,50 4,00 4,50
US$
/Ton
Henry Hub, US$/MMBtu
Benzene Toluene Xylene
400
600
800
1000
1200
1400
50 60 70 80 90 100 110 120
US$/Ton
Brent, US$/Bbl
Benzene Toluene Xylene

Haldor Topsoe Catalytic Forum, 201528
Basic Petrochemical Market and Trends
World Petrochemical market value estimationis 1300 US$ billion.
Basic Petrochemical Market size is around423 MMT and 530 US$ billion value.
World Oil Consumption in 2014 4211 MMT
Aromatics (BTX) represents 119 MMT and 130 US$ billion value. Paraxylene market represents 38 MMT
Deloitte, 2014IHS, 2015ICIS, 2015OGJ, 2015
Additional Ethylene capacity expansions (2015-17) represents 15 MT mainly is USA and ME.
On purpose propylene capacity will increase from 17 MMT to 42 MMT by 2020.
Additional world BTX demand (2015-2020) is around 17 MMT, of which 85% of new BTX supply is dominated by Asia (63%) and ME (22%).
Ethylene; 139
Propylene; 90Butadiene; 11
Benzene; 46
Toluene; 29
Xylene; 44
Methanol; 64,9
Base Petrochemicals Demand, MMT

Haldor Topsoe Catalytic Forum, 201529
Petrochemical Trends by Geographic Region
North America, Shale gas boost petrochemicals, mainlyethylene. Propylene and aromatics a possible issue. Today ethaneaccounts for 55% of the olefin slate and propane 20%. Shale gasis bringing cheap feed stocks and more ethane cracking.
Western Europe, Petrochemicals threatened by lack of cheapfeedstocks. Refinery naphtha is the main cracker feed. Naphthaand condensates provided about 75% of the feed to the Europeanethylene crackers. 12.5% came from ethane, propane and butaneand the balance from gasoil and other sources.
Middle East, Feedstock availability, expansion projects in refiningand petrochemicals. Ethane is the primary cracker feedstock.Some countries has promoted, through incentive pricing, LPGcracking. ME has been leading the petrochemical expansion due tothe rich hydrocarbon availability in the region
Asia, China is the main player. Coal an alternative feedstock.Refinery naphtha is the main cracker feed. This area is driving theglobal petrochemicals demand.

3. Refinery Petrochemical Integration
30Haldor Topsoe Catalytic Forum, 2015

Haldor Topsoe Catalytic Forum, 201531
Oil Refining Business
* Año 2002
0
10
20
30
40
50
60
70
80
90
100
MarketDemand 2015
SAHARAN BLEND ARABIAN LIGHT SAFANIYAH BOSCAN
GAS 3,3
GASOLINE30.2
DISTILLATES
56,4
FUELS10,3
DENSITY
º API
SULFUR % P
0,806 0,855 0,893 0,995
44 34 27 10,7
0,2 1,7 2,8 5,27
% W
eigh
t

Haldor Topsoe Catalytic Forum, 2015 32
Oil Refining Trends
0%
10%
20%
30%
40%
50%
60%
70%
80%
90%
100%
2000 2001 2002 2003 2004 2005 2006 2007 2008 2009 2010 2011 2012 2013 2014
% W
orld
Cap
acity
North America S & C America Europe & Eurasia Middle East Africa Asia Pacific
World Refining Capacity 96 MBbl/d World Oil refined Products Demand
Source: BP Satistical Review 2015
0
10.000
20.000
30.000
40.000
50.000
60.000
70.000
80.000
90.000
2005 2010 2015 2020 2025 2030 2035 2040
kBbl
/d
Gasoline Naphtha Jet Fuel Diesel/Gasoil Fuel Oil
Haldor Topsoe Catalytic Forum, 2015 33
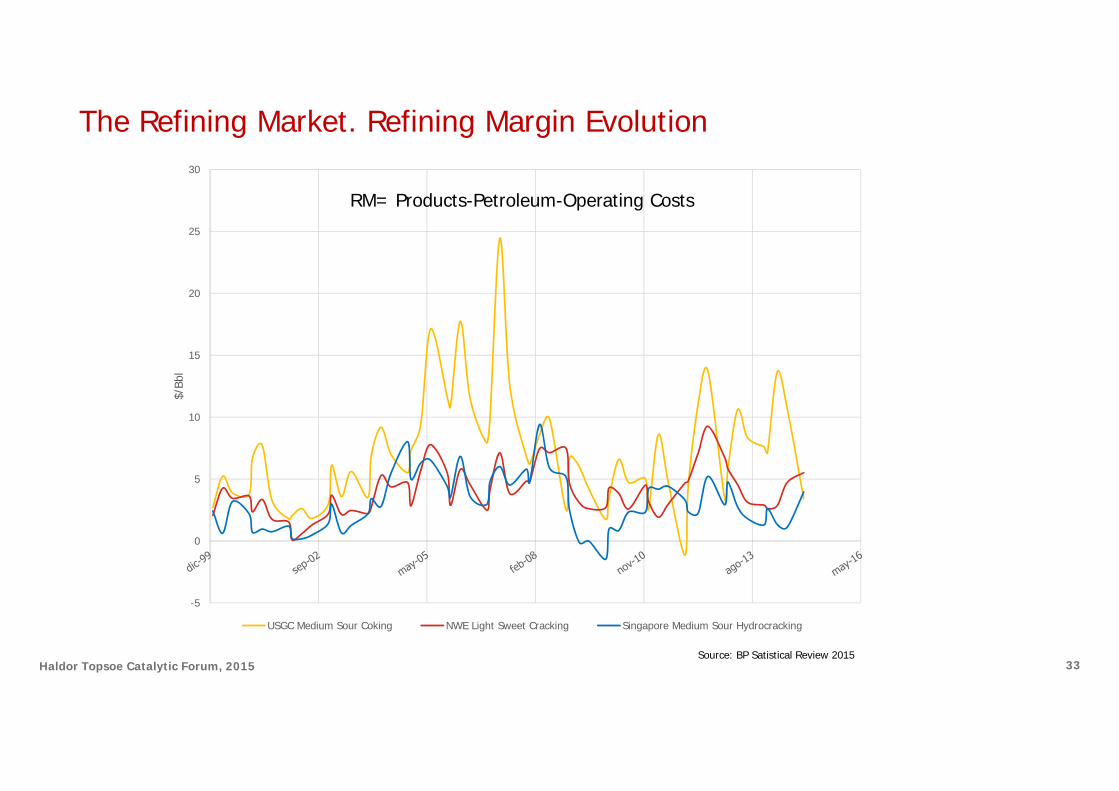
The Refining Market. Refining Margin Evolution
-5
0
5
10
15
20
25
30$/
Bbl
USGC Medium Sour Coking NWE Light Sweet Cracking Singapore Medium Sour Hydrocracking
Source: BP Satistical Review 2015
RM= Products-Petroleum-Operating Costs

Haldor Topsoe Catalytic Forum, 2015 34
Oil Refining Cost Curve
0
2
4
6
8
10
12
14
16
0 20 40 60 80 100
US$
/Bbl
MBbl/d
2008 Marginal Refinery Configuration Curve
0
2
4
6
8
10
12
14
0 20 40 60 80 100US$/Bbl
MBbl/d
2013 Marginal Refinery Configuration Curve
VB
Source: BCG, 2014
Source: BCG, 2014
HSK
0
2
4
6
8
10
12
14
0 50 100 150 200 250 300
US$
/Bbl
KBbl/d
Distillation. Topping.
Residue Conversion Units. VB,Coker, RFCC, RHCK Refinery
VGO Conversion Units. FCC/HCX Refinery
Catalytic Reformer. Hydroskimming

Haldor Topsoe Catalytic Forum, 2015 35
Reported Refineries in trouble are those with:
- Capacity < 200 kBPSD and Nelson Complexity < 8
- Difficult acces to crude supply, i.e. inland refineries
Oil Refining in Europe. Refinery closures
35
Only complex refineries will capture the market opportunities and remain competitive.
2000 2012
Net margins of individual EU28 refineries against EU28 average
European refining sector to close around1,5 – 2,5 MBbl/d capacity equivalent to aproximately ten refineries.
Source: EU Commision
02468
10121416
0 100 200 300 400
Nel
son
Inde
x
kBbl/dAsia America Europe Australia
Credit Suisse. Benchmark Prices, 2015

Haldor Topsoe Catalytic Forum, 2015 36
Oil Refining in Europe. Homogeneous Specifications to come.
Gasoline
Diesel(*)
3010
43545
1010
18017
875175
19540
50020
1510
87040
1010
40025
3350400
32545
113050
Expected Sulphur Content by Region (ppm)
2013
2025Further Investments in qualityimprovements will be needed.
MARPOL’s Sulphur Emission Limits (%wt)
2010 2015 2020 2025 2030
GLOBAL
ECAs
3,5%
0,5%0,1%
Pending on feasibilityreview in 20184,5%.
.
..
-Refiners to produce low sulphur bunker fuel
-Ships sulphur emmisions to be abated by on boardSOx scrubbers
-Natural Gas engines (*) On-road Diesel
Sources: OPEC World Oil Outlook 2013; DNV, Shipping 2020
Export Oriented Refineries will have to deal with complex logistics derived from the differentspecifications to handle

Haldor Topsoe Catalytic Forum, 2015 37
Oil Refining in Europe. Oil Refining Fitness Check
Economic impact on refinery sector of directives analysed in Fitness Check
Has EU legislation contributed to increased refining energy costs?
EU ETS increases costs of purchased electricity
Increased energy consumption due to FQD
Switch to low-sulphur crude oil for refinery energy due to pollution legislation (IED/LCPD/IPPCD)
Demand impacts (RED, ETD, IED) reduce utilization rate, which can negatively affect refineries' energy efficiency
Source: EU Commision

Haldor Topsoe Catalytic Forum, 201538
Refinery Petrochemical Integration Drivers
0
200
400
600
800
1000
1200
1400
1600
1800
Brent Naphta Ethylene HDPE LDPE LLDPE PP
US$
/Ton
No transportation costs. Specially for olefins
Resilient Value Chain Market demand and prices flexibility
Regional clusters
Feedstock and product flexibility
Feedstock Availability
By Products streams
Hydrogen balance management
Maximise the potential value of hydrocarbon streams, upgrading from fuel value to higher value transport fuels or petrochemical feedstock.
Capital, OPEX and Resource Optimization
Shared Infrastructure, Storage & Utilities
Lower Logistic & Energy cost
Minimize overhead and waste
Trained workforce and contractors
Credit Suisse. Benchmark Prices, 2015

Haldor Topsoe Catalytic Forum, 2015
Refinery Petrochemical Integration Scheme
Natural Gas
Crude Oil Refinery
AromaticsRecovery
Steam Cracker
(O, P, M)-Xylene
Toluene
Benzene
CondensateSplitter
FCCComplex
Reformate
Condensates
Ethylene
Propylene
Butadiene
Py Gas
VGO / ResiduePropylene
HCN
Hydrogen
Gasoline Blend
ETBE
Gasoline Blend
Diesel Blend
Naphtha
Ethane
NGL
Methane
39

Haldor Topsoe Catalytic Forum, 2015 40
Refinery Petrochemical Integration. Steam Cracker
Steam Cracking yields strongly rely on the kind of feedstock
NaphthaIs the most common feedstock for crackersProduces a broad range of productsFor each ton of ethylene produced, 3,3 tons of naphta are needed
%Weight Ethane Propane Butane Naphtha GasOil
Hydrogen&Methane 13 28 24 26 18
Ethylene 80 45 37 30 25
Propylene 2 15 18 13 14
Butadiene 1 2 2 5 5
Mixed Butenes 2 1 6 8 6
C5+ 2 9 13 8 7
Benzene 5 5
Toluene 4 3
Fuel Oil 2 18
EthanePresent a very high selectivity to ethyleneNegligible aromatics and propylene productionFor each ton of ethylene produced, 1,2 tons of ethane are needed
Source: Chemistry of Petrochemical Processes. Matar, Hatch, 2005
0
200
400
600
800
1000
1200
1400
1600
1800
0 20 40 60 80 100 120 140 160
US$/Ton
MMT/y BCG, 2015
Ethane, ME
Ethane, US
Naphtha RPI, Asia
Naphtha/LPG, Europe

Haldor Topsoe Catalytic Forum, 2015 41
High propylene world demand.
Propylene Gap, more than 10 MMT/y.
Steam Cracker. The increase in US ethane cracking has led to a drop in propylene production.
On purpose production: Propane DehydrogenationOlefin MetathesisMethanol to Propylene
Petrochemical FCC
Refinery Petrochemical Integration. Propylene Gap
Source: Booz&Allen, 2012
0
200
400
600
800
1000
1200
1400
1600
0 20 40 60 80 100 120
US$
/Ton
MMT/y
Steam Cracking and FCC
Met
athe
sis
PDH
Propylene Cost curve

Haldor Topsoe Catalytic Forum, 2015 42
On purpose Propylene. Propane Dehydrogenation
0
200
400
600
800
1000
1200
1400
1600
2009 2010 2011 2012 2013 2014 2015 2016
US$
/Ton
Propane Propylene Spread
Credit Suisse. Benchmark Prices, 2015
PropaneTerminal PDH Petrochemical
Use
H2
PropylenePropane Feed
Propane dehydrogenation produces propylene with rather high selectivity.
The economics of dehydrogenation of propane to propylene depends on thedifferential among propane and propylene.
Most of today’s activity in dehydrogenation is centered in the US, Middle East and China

Haldor Topsoe Catalytic Forum, 2015 43
China is using its low value coal reserves to feed Coal to Liquids and Methanol to Olefin (MTO) technologiesto produce ethylene and propylene.
In China metanol consumption for olefins productionramps up to more than 8 MMT/y. China is thebiggest metanol producer in the world with a share of 50%.
At low oil prices economics of MTO are weak.
No economic direct routes for converting methane to propylene.
Methane from Natural Gas must first be converted to methanol (or DME), and then it can be converted to ethylene and propylene.
High capital intensity for such Methane (or Methanol) to Olefins (MTO) processes
0123456789
2006 2008 2010 2012 2014 2016M
MT
Methanol to Olefins consumption in China
On purpose Propylene. Propylene in China
Nexant, 2014
Coal
Gasification Synthesis Gas
Methanol
Power
F-T Liquids
Steam, H2
Chemicals
Natural Gas

Haldor Topsoe Catalytic Forum, 2015 44
Ethylene
Gua
rdBe
d
Met
athe
sis
Reac
tor
C2=
Tow
er
Power
F-T Liquids
Steam, H2
Chemicals
C4=
C3=
Tow
er
Lights
Propylene
C4+Purge
On purpose Propylene. Olefin Metathesis
Source: J. Mol, 2004
Metathesis is the reaction of ethylene with 2-butene to form propylene, the reaction is equilibrium limited.
Feasibility depending on ethylene vs. propylene prices (typical historical value for the P/E price ratio has ranged from 0,7 – 0,8)
Propylene Gap make this unit competitive under some specific scenarios
Grass roots steam crackers, which incorporate metathesis as a method to increase propylene production must over-produceethylene feed to unit, increasing the overall capital expenditure.

Haldor Topsoe Catalytic Forum, 201545
OligomerizationUnit
AlkylationUnit
PropyleneSplitter
Refinery
IsobutanePropyleneRefinery grade 60%
NaphthaVGO/ Resid
C4=ETBE
BioEthanol
Gasoline Blending
PropylenePolymer Grade 99,5%Chemical Grade 94,5%
C4=
FCC EtherificationUnit
Alkylates
Propane
SHT Unit
C4=, C5= Diesel Blending
Naphtha
HDT/S Unit
LCO
HCO
Diesel blending

Haldor Topsoe Catalytic Forum, 2015
46
Refinery Petrochemical Integration. The Petrochemical FCC
Shift FCC operation to olefin production:
ZSM5 addition convert C7-C10 molecules to olefinic LPG.
Send Light Naphtha to a dedicated FCC riser orto the steam cracker. Depending on the energyvs. yield balance.
High severity FCC, propylene from 4% to 25% yield. Naphtha Aromatics content to increase.
Significant changes to the gas and lighter product recovery sections are necessary
Residue FCC
LCO
Vacuum Residue
Heavy Naphtha
FuelGas
HCO
VGO
MainFractionator
Propylene
Butylene
Light Naphtha
Air
Catalyst Addition
Flue Gas
HDS
Gas Plant
FCC Loop
VacuumColumn

Haldor Topsoe Catalytic Forum, 2015
CatalyticReforming
Steam CrackerPy Gas
Adsorption
AromaticsExtracton
BenzeneTow
er
Raffinate
TolueneDisproportionation/
Transalkylation
O-Xylene
Benzene
A10+
Paraxylene
TolueneTow
er
XyleneTow
er
O-XyleneTow
er
A9Tow
er
Isomerization
Refinery Petrochemical Integration. Aromatics Complex
Toluene
47
HT Naphta
Naphtha/Ethane/ LPG
Production / Demand / Isomer23% 18% o-Xylene53% 2% m-Xylene24% 80% p-Xylene
Naphtha Petrochemical Use 41%Naphta Gasoline Use 59%
World Naphtha demand 817 MMT
29
368
% Aromatics Source
Reforming Coke Oven Lt. Oil Py GasolineICIS, 2015

Haldor Topsoe Catalytic Forum, 2015
48
ProductElectricity
(GJ/ t product)Feedstock*(GJ/t product)
Fuel(GJ/t product)
Steam(GJ/ t product)
Benzene (SC) 0,3 0 13,1 -1,4
Benzene (AE) 0,1 45 2
Ethylene 0,3 45 13,1 -1,4
Propylene (SC) 0,3 45 13,1 -1,4
Propylene (FCC) 0,1 45 2 0,1
Toluene (AE) 0,1 22,5 2
Xylene 0,1 45 2
P-Xylene 0,2 0 6,3 0,8
Source: IEA OECD, 2009
0
1
2
3
4
5
6
7
0 5 10 15
GJ/
t Fe
edst
ock
Nelson Index
High Efficiency Low Efficiency
Refinery Petrochemical Integration Energy
Ocic, 2005 Typical Steam Cracking energy consumption varies from12 GJ/t to 18 GJ/t
*Feedstock consumption is accounted for by means of the calorific value of the basic chemicalsfollowing the first conversion of fossil fuels to chemicals

Haldor Topsoe Catalytic Forum, 2015 49
The “Antifragile“ Refinery
Capacity:A minimum size to reach economy of scales
Complexity:Ability to deliver high value light products
Flexibility on feedstocks:Ability to process different slates of crudes thanks to an efficient trading unit and an adapted logistics system
High distillate yield:Adapted to the European market with a strong demand for diesel
Energy efficiency:Integration of the different units with efficient energy use
Petrochemical Integration:Combined optimization of the feedstock streams, sharing units and transfers of products between refining and petrochemicals.
Source: BP Satistical Review 2015, Credit Suisse, 2015
0
0,1
0,2
0,3
0,4
0,5
0,6
0,7
(-2-4) (0-2) <0 0-2 2-4 4-6 6-8 8-10 10-12 12-14 14-16 16-18
P(RM
)
US$/Bbl
Refining Margin Distribution
Hydroskimming FCC Hydrocracker Petrochemical
0
10
20
30
40
50
0 5 10 15 20 25
IInv
estm
ent
Cost
, k$/
Bbl
Gross Margin, $/Bbl
Oil Refining Profitability
Jacobs, 2009
Hydroskimming
FCC Conversion
Deep Conversion
Petrochemical Integration

4. Refinery Petrochemical Integration. Future trends
50Haldor Topsoe Catalytic Forum, 2015

Haldor Topsoe Catalytic Forum, 2015
Refinery Petrochemical Integration. FCC and Aromatics Complex
SteamCrackerPy gas
CatalyticReforming
Adsorption
AromaticsExtracton
BenzeneTow
er
Raffinate
TolueneDisproportionation/
Transalkylation
O-Xylene
VGO/Resid
A10+
ParaxyleneTolueneTow
er
Xylene
Tower
O-X
yleneTow
er
A9
Tower
Isomerization
Toluene
HDT
HDTFCC
Hydrocracker
AromaticsExtracton
Benzene
VGO/Resid HDT (*)
(*) Optional
Naphtha/LPG
Raffinate
Aromatics
Source: Jechura, 2011
Naphtha
Aromatization
LCO
Maximum aromatics recovery. Significant technology challenges.
51
Paraffinic Naphta

Haldor Topsoe Catalytic Forum, 2015 52
Refinery Petrochemical Integration. Oxidative Methane Coupling

Haldor Topsoe Catalytic Forum, 2015 53
Refinery Petrochemical Integration. Crude Cracking
ExxonMobil, 2010

Haldor Topsoe Catalytic Forum, 2015 54
Vege
tabl
e O
il
IsoB
uten
esEtherification Bio-ETBE
Technology Development StatusResearch Industrial Commercial
On hold due to current lack of commercial viabilityIsomerizationDeoxy-
genationBio-kerosene
TransEsterification
(ExternalSupply)
FAME (7%Max).
Die
sel
Deoxy-genation
HVO
Bio
Eth
anol
Met
hano
lGasoline
Diesel
Diesel
Refinery Petrochemicals Integration.Biofuels and Biochemicals
Biofuels accounts for 1,4 MBboe/d % the 1,5% of the world demand. 10% by 2020

Haldor Topsoe Catalytic Forum, 2015 55
Dehydration BioEthylene
Technology Development StatusResearch Industrial Commercial
FCC
Deoxy-genation
Bio-Naphtha
Hydrocracking
BioEthanol
BioPropanol
BioButanol
BioPropylene
BioButylene
Vegetable Oil
Sugars
Deoxy-genation
Lignocellulosics FurfuralFurfural
Derivatives
Bio-Chemicals
Glycerine Bio-Hydrogen
Refinery Petrochemicals Integration.Biofuels and Biochemicals

5. Conclusions
56Haldor Topsoe Catalytic Forum, 2015

57
CONCLUSIONS
• Petrochemicals is a cyclical market of high value products. Petrochemicals market size is 10% of the whole oil market.
• Petrochemicals strongly rely on feedstocks cost and availability. Shale gas boom and present oil glut, strongly affect the marketdynamics.
• USA, ME and Asia are the most favored locations forpetrochemicals production due to feedstock costs and productdemand.
• Petrochemicals integration improves refinery´s economics despitethe required investments are significant.The FCC seems to be themost promising unit for petrochemical integration.
• Petrochemical strongly contribute to improve refinery economicperformace on a disparate set of economic environments
Haldor Topsoe Catalytic Forum, 2015

Thank you for your attention
To provide the energy that every reality
needs
SafetySustainabilityLeadershipContinuous
ImprovementSolidarity
To be a global energy
company of choice
VISIONMISSION VALUES