2015 FULL YEAR RESULTS - ASX2015/08/27 · • 9.7% TTV growth to $17.6b = $1.55b annual growth •...
62
2015 FULL YEAR RESULTS PRESENTATION 27 AUGUST 2015 For personal use only
Transcript of 2015 FULL YEAR RESULTS - ASX2015/08/27 · • 9.7% TTV growth to $17.6b = $1.55b annual growth •...

2015 FULL YEAR RESULTS
PRESENTATION 27 AUGUST 2015
For
per
sona
l use
onl
y

PRESENTATION OVERVIEW
• Introduction by Haydn Long
• Financial Highlights and Result Drivers by Andrew Flannery
• Global Overview by Graham Turner
• Strategic Update by Melanie Waters-Ryan
• Outlook by Graham Turner
• Questions • Appendices
For
per
sona
l use
onl
y

INTRODUCTION • Record Sales
- New TTV milestones achieved in all 10 countries • Dip in Underlying Profits
- Statutory profits at record levels, but underlying results down about 3% • Offshore Earnings Growth
- Combined overseas EBIT topped $100million for first time • Building for the Future - Global network growth, investment in people and in key strategies • Balance Sheet Strengthened
- $100m improvement in already strong positive net debt position For
per
sona
l use
onl
y

FINANCIAL HIGHLIGHTS
For
per
sona
l use
onl
y

RESULT OVERVIEW
• 9.7% TTV growth to $17.6b = $1.55b annual growth • 19th year-on-year TTV increase in 20 years since ASX listing • 6.8% revenue growth to $2.4b • Record statutory profits – PBT up 13.1% and NPAT up 24% • Underlying profits slightly below FY14 records
For
per
sona
l use
onl
y

IMPACT OF ADJUSTED ITEMS $’ million JUNE 2015 JUNE 2014 %
Statutory Profit Before Tax $366.3m $323.8m 13.1% Topdeck Tours ($2.6m) - -
Write-downs to goodwill & brand names - $61.3m -
ACCC Fine - $11.0m -
One-off gain within FCGP business - ($19.6m) -
Underlying Profit Before Tax $363.7m $376.5m (3.4%)
Current Year Prior Year
• $2.6m contribution from Topdeck Tours (acquired August 2014).
• $61.3m non-cash goodwill and brand names write-downs
• $11m in ACCC fines (appeal upheld)
• $19.6m gain within the Global Product business
For
per
sona
l use
onl
y

MARGIN AND COSTS
• 13.6% income margin – lower than prior year but above longer term average
• 2.07% underlying net margin (PCP: 2.35%) • Invested about 1% of TTV in sales & marketing • Rent costs up as expected given network growth • Increased wage costs – new front-end wage system introduced but
lower earnings for KMP
For
per
sona
l use
onl
y

CASH AND CASHFLOW
• General cash up 18.6% to record $564.7m – 23% CAGR since GFC • $1.45b global cash and investment portfolio • Only $32.8m in debt – down from $178.1m in 2010 • $531.9m positive net debt position at year-end (equates to 15% of
FLT’s current market cap) • $362.5m operating cash inflow over full year (FY14: $227.1m) • Timing of airline payments (BSP cycle) typically major cause of cash
flow swings
For
per
sona
l use
onl
y
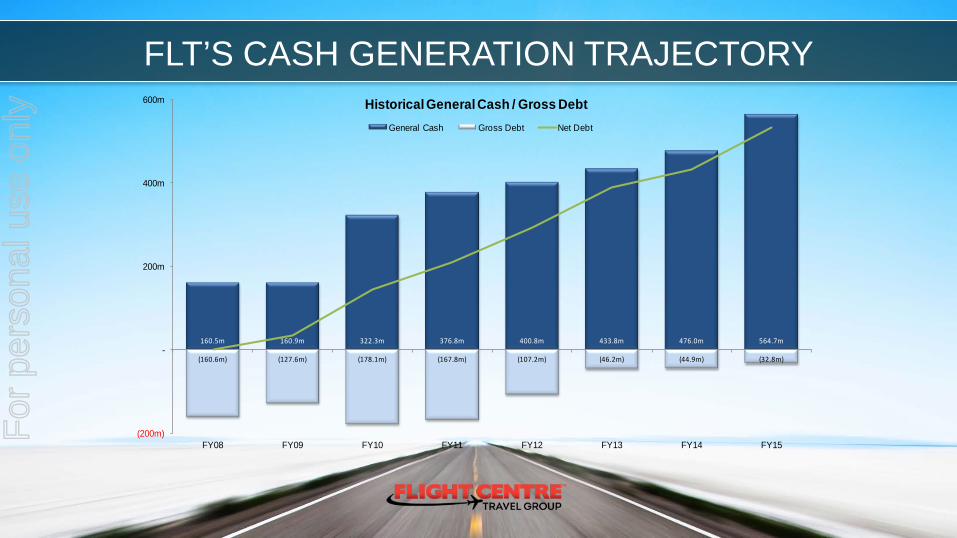
FLT’S CASH GENERATION TRAJECTORY
160.5m 160.9m 322.3m 376.8m 400.8m 433.8m 476.0m 564.7m
(160.6m) (127.6m) (178.1m) (167.8m) (107.2m) (46.2m) (44.9m) (32.8m)
(200m)
-
200m
400m
600m
FY08 FY09 FY10 FY11 FY12 FY13 FY14 FY15
Historical General Cash / Gross Debt General Cash Gross Debt Net Debt
For
per
sona
l use
onl
y
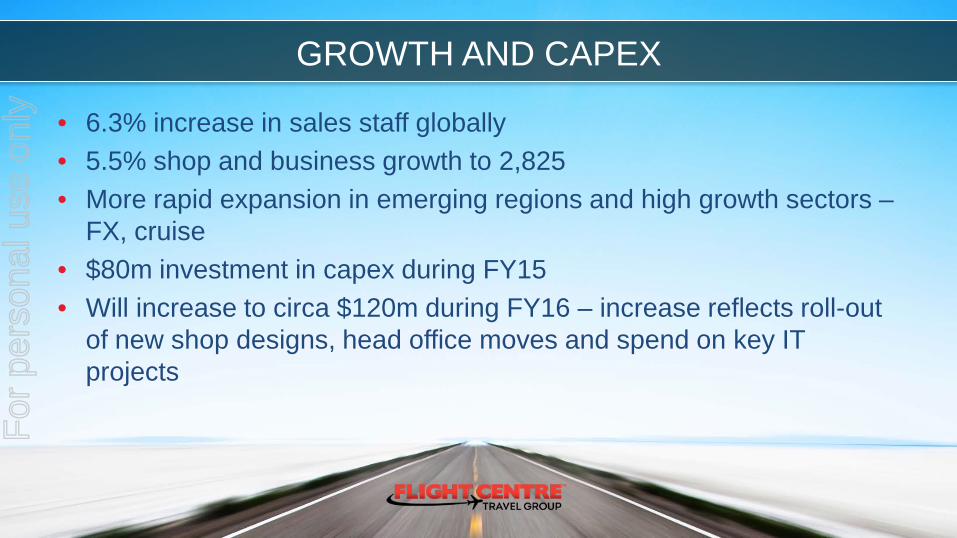
GROWTH AND CAPEX
• 6.3% increase in sales staff globally • 5.5% shop and business growth to 2,825 • More rapid expansion in emerging regions and high growth sectors –
FX, cruise • $80m investment in capex during FY15 • Will increase to circa $120m during FY16 – increase reflects roll-out
of new shop designs, head office moves and spend on key IT projects
For
per
sona
l use
onl
y

FY16 CAPEX BREAKDOWN
• Shops - Up to $70m on shop refurbishments and new store fit-outs - Roll out of new shop design across network
• Head office moves - $20m spend on upcoming head office moves and fit-outs in Australia,
the USA and Singapore. • IT hardware and software
- $30m investment includes roll-out of Microsoft Dynamics as the company's new mid and back-office finance platform
For
per
sona
l use
onl
y

SHAREHOLDER RETURNS
• Underlying EPS of $2.54 (FY14: $2.62) • Fully franked $0.97 per share final dividend declared • Brings total dividends for FY15 to $1.52 per share – in line with FY14 • $153m return to shareholders – 60% of underlying NPAT • 4.9% dividend yield (fully franked) based on current share price
For
per
sona
l use
onl
y
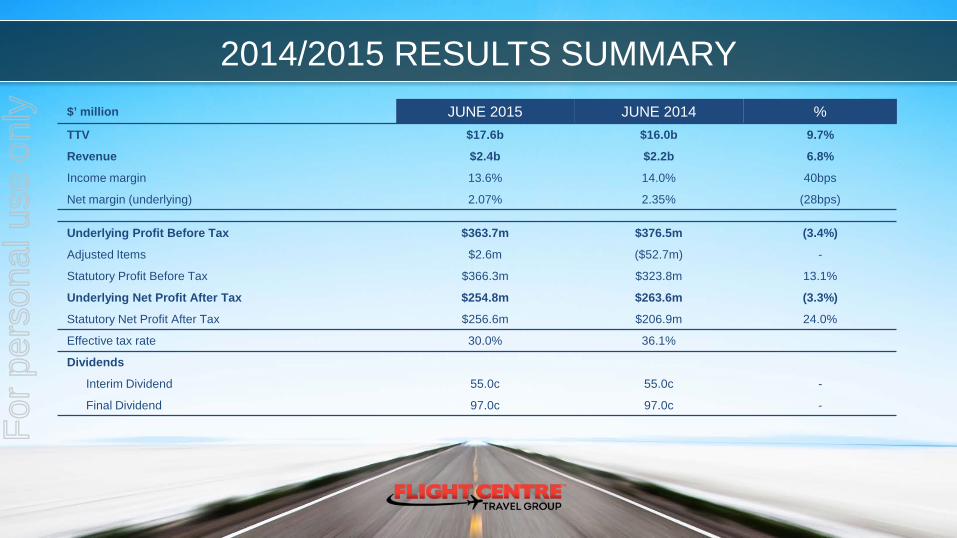
2014/2015 RESULTS SUMMARY $’ million JUNE 2015 JUNE 2014 % TTV $17.6b $16.0b 9.7%
Revenue $2.4b $2.2b 6.8%
Income margin 13.6% 14.0% 40bps
Net margin (underlying) 2.07% 2.35% (28bps)
Underlying Profit Before Tax $363.7m $376.5m (3.4%)
Adjusted Items $2.6m ($52.7m) -
Statutory Profit Before Tax $366.3m $323.8m 13.1%
Underlying Net Profit After Tax $254.8m $263.6m (3.3%)
Statutory Net Profit After Tax $256.6m $206.9m 24.0%
Effective tax rate 30.0% 36.1%
Dividends
Interim Dividend 55.0c 55.0c -
Final Dividend 97.0c 97.0c -
For
per
sona
l use
onl
y

GLOBAL OVERVIEW
For
per
sona
l use
onl
y
OPERATIONAL HIGHLIGHTS
• Record TTV in all 10 countries/regions and every month during FY15 • Combined overseas EBIT reached a record $103.2m • EBIT milestones in UK, USA, South Africa and Singapore • Strong corporate travel growth – turnover up 16.3% globally to $5.7b
without significant acquisitions • FLT has now achieved a 16.5% CAGR in TTV and a 16.9% CAGR in
PBT during past 20 years
For
per
sona
l use
onl
y
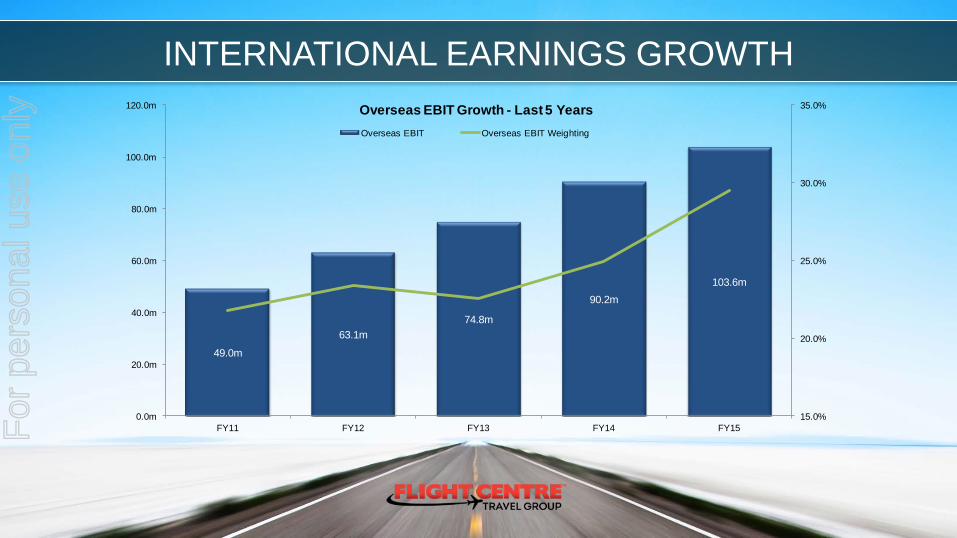
INTERNATIONAL EARNINGS GROWTH
49.0m
63.1m74.8m
90.2m103.6m
15.0%
20.0%
25.0%
30.0%
35.0%
0.0m
20.0m
40.0m
60.0m
80.0m
100.0m
120.0m
FY11 FY12 FY13 FY14 FY15
Overseas EBIT Growth - Last 5 YearsOverseas EBIT Overseas EBIT Weighting
For
per
sona
l use
onl
y

AUSTRALIA
• Record TTV of $9.6b, despite soft trading conditions • Diversity – 10 individual brands turned over more than $100m • EBIT exceeded $250m for third consecutive year - down compared
to FY14 but broadly in line with FY13 • Affected by cost growth (front-end wage change, investments) and
margin volatility during1H • Slower overall market growth – outbound travel up 2.9% (FY14: 7%) • Expo and Event program performing well – turnover topped $300m
and attracted almost 200,000 people
For
per
sona
l use
onl
y

AUSTRALIA (Leisure)
• Record TTV but modest growth on FY14 • Lower gross margins linked to consultant discounting to stimulate
demand among cautious customers during 1H • Has now stabilised in most brands – Flight Centre brand has
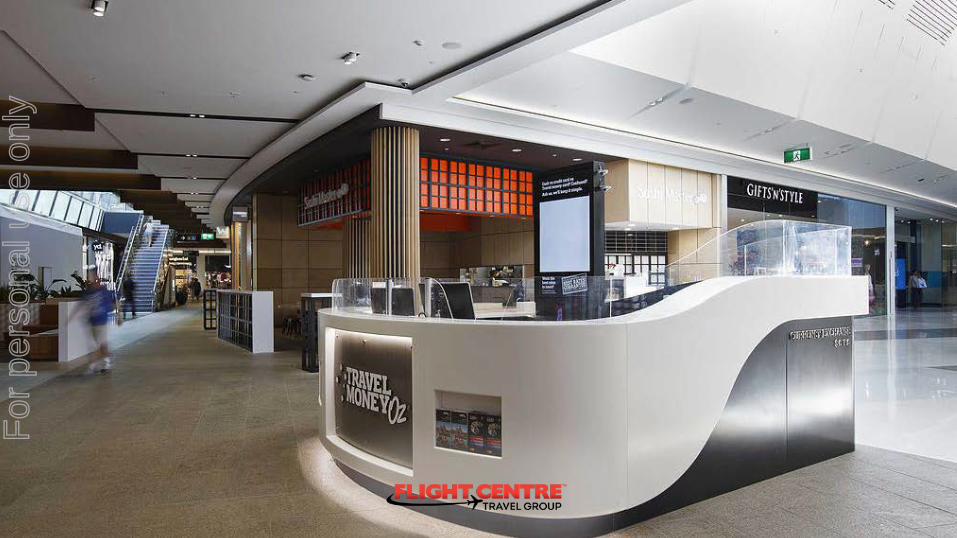
returned to historic levels • Travel Money performing strongly and growing rapidly – now FLT’s
5th largest business in Australia by sales • Niche domination - Cruiseabout, Student Flights and TMOZ now
largest businesses of their kind in Australia
For
per
sona
l use
onl
y
AUSTRALIA (FCB)
• Generally performing well in key sectors – ocean and river cruising, complex and premium air, packages, touring
• Opportunity to grow in some low or no margin areas that haven’t been priorities – LCCs, domestic point-to-point flights etc
• Next generation shop design rolled out • Developing and launching new products – Widest Choice of Airfares,
Escapes, Journeys • Unique International Airfare Packages gaining traction and driving
margin recovery – about 40% attachment after five months • Blended enhancements – “You’re never on your own when you book
with us”
For
per
sona
l use
onl
y
AUSTRALIA (Corporate)
• Record turnover of $2.3b from corporate brands (excludes FCBT) • Record wins in FCm – high profile new additions to customer base • System and product enhancements – RapidBook (sector’s fastest OBT) • Expansion of Corporate Traveller “Smart Suite” • Stage & Screen performing strongly – wins include SANZAR, Cricket
Australia and Football Federation of Australia • Campus Travel now handling 20 of 43 universities in Australia • cievents growing steadily and expanding overseas
For
per
sona
l use
onl
y

UK & IRELAND
• Record EBIT of $AUD49.5m • TTV topped GBP1b for 1st time • Strong corporate performance – highlighted by account wins • New leisure product ranges launched – Journeys, Escapes • Travel Concierges and Travel Butlers to enhance the holiday
experience • New hyperstores to open in FY16 in Dublin (Dawson Street) and
Chester
For
per
sona
l use
onl
y

USA
• Record EBIT of $21.4m • TTV topped $AUD2.5b, up 18% • Continued strong corporate performance in world’s largest business
travel market • Corporate turnover increased 30% in AUD to $1.2b • New offices opened in Austin and Silicon Valley – Raleigh and
Minneapolis planned for FY16 • Campus Travel launched July 1, 2015
For
per
sona
l use
onl
y

USA (continued)
• New hyperstores opened in LA and Philadelphia • Chicago hyperstore and Manhattan megastore planned for FY16 • Travel Money FX business to be launched • Aiming to grow European sales – EuroGURU, EURObreaks,
Escapes, Journeys • GOGO Travel Agents First and GOGO Care campaigns launched to
help drive wholesale sales to external agency groups
For
per
sona
l use
onl
y
CANADA & MEXICO
• Now part of broader “Americas” business • Koch Overseas acquisition (Mexico City) formally completed July
2015 • Provides FLT with platform for further corporate growth throughout
the Americas • Losses in Canada during FY15 • New leadership team in place and strategies implemented to improve
performance, particularly in leisure travel
For
per
sona
l use
onl
y

NEW ZEALAND & SOUTH AFRICA
• Record results achieved in South Africa • Unique product ranges launched in leisure travel • Corporate now generating about 30% of turnover • Record TTV in NZ • Blended model enhanced – local 24/7 service, new booking engine,
responsive websites, consultant allocation model
For
per
sona
l use
onl
y

INDUASIA
• Region includes India, Dubai (UAE), Greater China and Singapore • Generated $AUD870m of TTV during FY15 • Record Singapore results – FLT’s fastest growing country by TTV • Greater China business expanding – new brands, shops and
websites plus landmark domestic ticketing licence obtained
For
per
sona
l use
onl
y

• India expansion – new corporate businesses in Noida and Vadodora • FX business launched • Promising results from new leisure hyperstores in Mumbai and New
Delhi • Sixth consecutive full year profit in UAE – new leisure shops in Yas
Mall (Abu Dhabi) and Dubai
INDUASIA (continued) F
or p
erso
nal u
se o
nly

DIVERSITY OF REVENUE STREAMS • Corporate: Generated 33.6% of group turnover during 2014/15 • Accommodation: 4.5million room nights sold by Australian business
alone during FY15 • Tour operations: Back-Roads, Top Deck and Buffalo will go close to
$200m in turnover this year • Bikes: Pedal Group JV generated about $56m in sales and $3.2m in
EBIT during FY15 • Emerging leisure brands: Student Flights, Cruiseabout and Travel
Money now largest businesses of their kind in Australia (about $1.2b in combined turnover during FY15)
For
per
sona
l use
onl
y

2014/2015 RESULTS BY COUNTRY CANADA
TTV: $1.2b, up 10% in AUD (up 9% in lc) EBIT: ($3.9m)
BUSINESSES: 245
USA
TTV: $2.5b, up 18% in AUD (up 6% in lc) EBIT: $21.4m
BUSINESSES: 314
SOUTH AFRICA
TTV: $473m, up 5% in AUD (up 5% in lc) EBIT: $11.3m
BUSINESSES: 172
UK & IRELAND
TTV: $1.9b, up 24% in AUD (17% in lc) EBIT: $49.5m
BUSINESSES: 279
INDIA
TTV: $386m, up 15% in AUD (up 6% in lc) EBIT: $3.5m
BUSINESSES: 45
DUBAI
TTV:$85m, up 23% in AUD (up 11% in lc) EBIT: $1.7m
BUSINESSES: 14
GREATER CHINA
TTV: $232m, up 18% in AUD (up 9% in lc) EBIT: $2.3m
BUSINESSES: 40
AUSTRALIA
TTV: $9.6b, up 4% in AUD EBIT: $256.7m
BUSINESSES: 1511
NEW ZEALAND
TTV: $883m, up 7% in AUD (up 5% in lc) EBIT: $15.1m
BUSINESSES: 179
SINGAPORE
TTV: $167m, up 44% in AUD (up 36% in lc) EBIT: $2.8m
BUSINESSES: 23
For
per
sona
l use
onl
y

STRATEGIC UPDATE
For
per
sona
l use
onl
y

STRATEGIC UPDATE
JOURNEY WHERE WE ARE AT
DESTINATION
For
per
sona
l use
onl
y

OUR JOURNEY FROM TRAVEL AGENT TO
WORLD’S BEST RETAILER
For
per
sona
l use
onl
y

OUR JOURNEY FROM TRAVEL AGENT TO F
or p
erso
nal u
se o
nly

GOLDEN ERA OF TRAVEL F
or p
erso
nal u
se o
nly

CORPORATE BRANDS
LEISURE / WHOLESALE
BRAND AND SPECIALISATION F
or p
erso
nal u
se o
nly

CVP INNOVATIVE DIFFERENT
MIND SHARE
CLEAR THOUGHT LEADERS IN THE
SPECIALISED SEGMENT
FAMOUS SPECIALISED BRANDS F
or p
erso
nal u
se o
nly

RED LABEL WATERTIGHT
DEALS PACK N RELAX
TRAVEL SERVICE
TECHNICAL
MANUFACTURED PRODUCT F
or p
erso
nal u
se o
nly
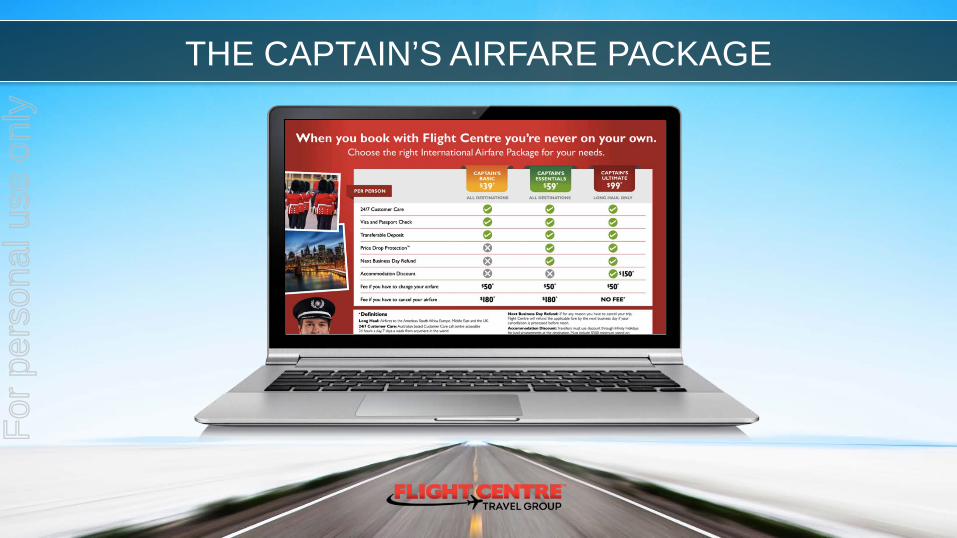
THE CAPTAIN’S AIRFARE PACKAGE F
or p
erso
nal u
se o
nly

BRAND PRODUCT RANGES F
or p
erso
nal u
se o
nly

ESCAPES RANGE F
or p
erso
nal u
se o
nly
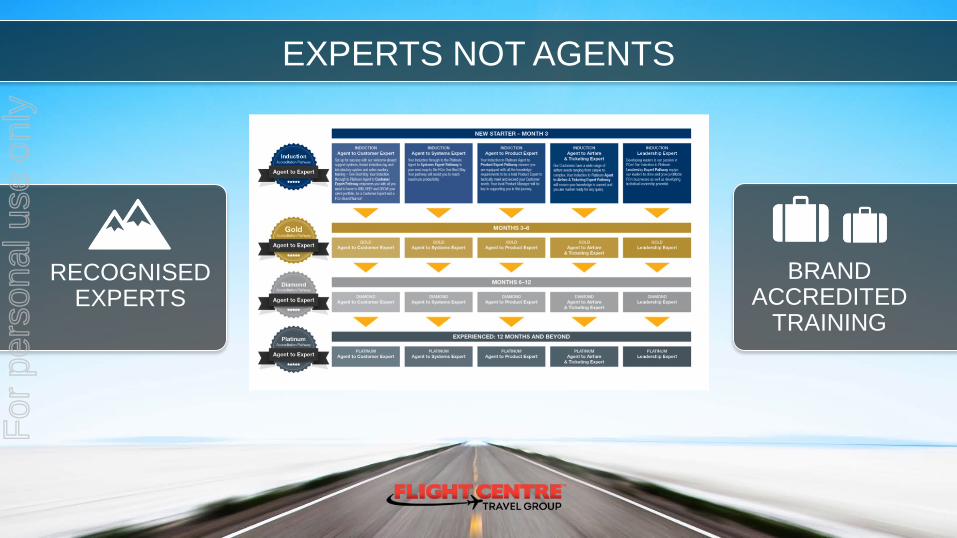
BRAND ACCREDITED
TRAINING
RECOGNISED EXPERTS
EXPERTS NOT AGENTS F
or p
erso
nal u
se o
nly

NEW FCB SHOP OF THE FUTURE
ESCAPE TRAVEL LIBRARY
CORPORATE HUBS
A CUSTOMER SPACE
A TRAVEL EXPERIENCE SPACE
A SALES SPACE
BRANDED BUSINESS F
or p
erso
nal u
se o
nly
For
per
sona
l use
onl
y

For
per
sona
l use
onl
y

For
per
sona
l use
onl
y

For
per
sona
l use
onl
y

BLENDED TRAVEL F
or p
erso
nal u
se o
nly

YOU ARE NEVER ON YOUR OWN WHEN
YOU BOOK WITH US
For
per
sona
l use
onl
y

INFORMATION IS POWER F
or p
erso
nal u
se o
nly

SALES AND MARKETING MACHINE F
or p
erso
nal u
se o
nly

SALES AND MARKETING MACHINE F
or p
erso
nal u
se o
nly

OUR PRODUCT JOURNEY
OUR SHOP
JOURNEY
OUR SALES
JOURNEY
OUR BUSINESS JOURNEY
OUR PEOPLE
JOURNEY
OUR JOURNEY F
or p
erso
nal u
se o
nly

WINNING THE MIND SHARE BATTLE 23.6%
10.9%10.0%
9.4%
7.2% 6.7% 6.4%5.8% 5.5%
4.6%3.7% 3.2% 3.1% 2.9% 2.8%
-
5.0%
10.0%
15.0%
20.0%
25.0%
Top 15 travel agents/tour operators people would consider using for next holiday or leisure tripSource: Roy Morgan Holiday Tracking Survey (Australia), April 2014 – March 2015
For
per
sona
l use
onl
y

... AND PLEASE COME AGAIN
76.0%
75.0% 75.0%
74.0% 74.0%
73.0%
69.0%
67.0%
66.0% 66.0%
60.0%
62.0%
64.0%
66.0%
68.0%
70.0%
72.0%
74.0%
76.0%
78.0%
Flight Centre Agoda Expedia.com.au Wotif.com Booking.com STA Travel Hotels.com Escape Travel Webjet.com.au Zuji
Travellers who’d consider using the same travel agent for their next trip that they have used in the last 12 monthsSource: Roy Morgan Single Source (Australia), July 2013-June 2014
For
per
sona
l use
onl
y

OUTLOOK
For
per
sona
l use
onl
y

2015/16 GUIDANCE
• Solid global growth prospects • $380m - $395m underlying PBT target • Excludes significant unforseen items and $11m gain (ACCC test
case) • Targeted range represents 4%- 8% growth on statutory FY15 result • Currently tracking in line with this range
For
per
sona
l use
onl
y

MARKET CONDITIONS
• Reasonable conditions globally • Subdued consumer confidence in Australia but positive momentum in
leisure travel – good enquiry, margin recovery, sales growth • No step change in costs in Australia this year following last year’s
wage change • Corporate businesses generally performing well globally
For
per
sona
l use
onl
y

GROWTH DRIVERS
• Australian profit and sales growth • Greater contributions from off-shore as businesses gain scale • Market growth – “Golden Era of Travel” • Full year contribution from Top Deck (acquired after peak profit
period in FY15) and Koch • Network expansion – targeting 6-8% growth globally
For
per
sona
l use
onl
y
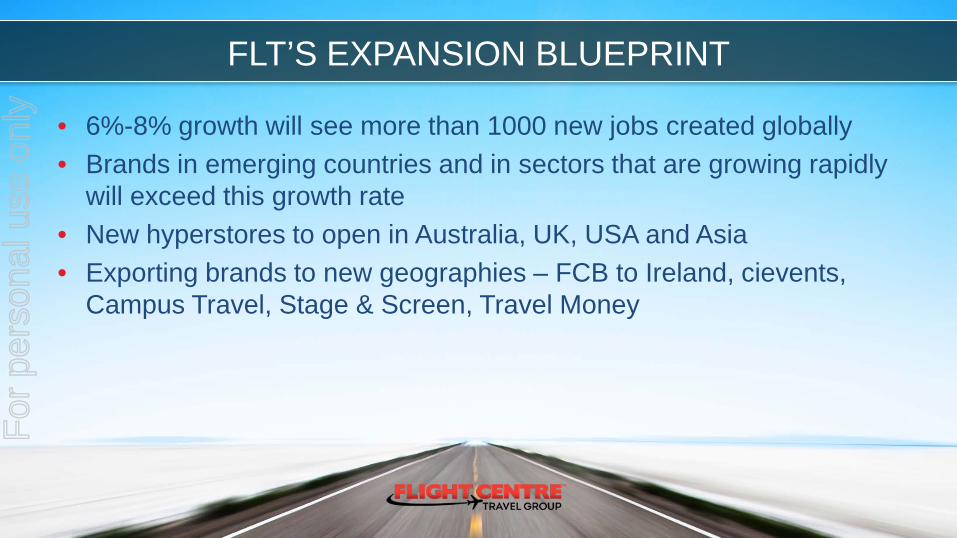
FLT’S EXPANSION BLUEPRINT
• 6%-8% growth will see more than 1000 new jobs created globally • Brands in emerging countries and in sectors that are growing rapidly
will exceed this growth rate • New hyperstores to open in Australia, UK, USA and Asia • Exporting brands to new geographies – FCB to Ireland, cievents,
Campus Travel, Stage & Screen, Travel Money
For
per
sona
l use
onl
y

ACQUISITION & ONLINE OPPORTUNITIES
• Pursuing further M&A opportunities • Targeting businesses that operate in new sectors, enhance scale or
offer low cost models in growth areas • Opportunity to grow online presence – blended travel and standalone
businesses (where financially viable)
For
per
sona
l use
onl
y

QUESTIONS?
For
per
sona
l use
onl
y
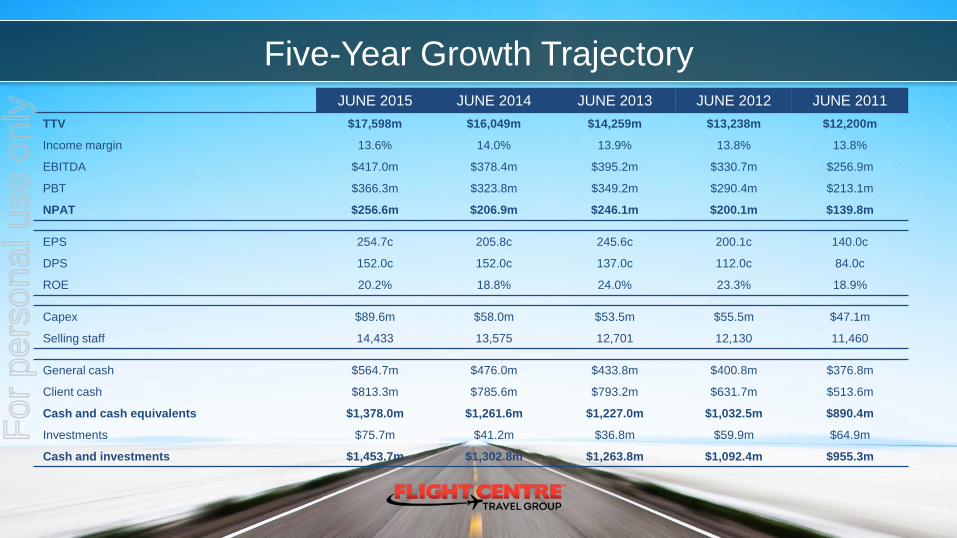
JUNE 2015 JUNE 2014 JUNE 2013 JUNE 2012 JUNE 2011 TTV $17,598m $16,049m $14,259m $13,238m $12,200m
Income margin 13.6% 14.0% 13.9% 13.8% 13.8%
EBITDA $417.0m $378.4m $395.2m $330.7m $256.9m
PBT $366.3m $323.8m $349.2m $290.4m $213.1m
NPAT $256.6m $206.9m $246.1m $200.1m $139.8m
EPS 254.7c 205.8c 245.6c 200.1c 140.0c
DPS 152.0c 152.0c 137.0c 112.0c 84.0c
ROE 20.2% 18.8% 24.0% 23.3% 18.9%
Capex $89.6m $58.0m $53.5m $55.5m $47.1m
Selling staff 14,433 13,575 12,701 12,130 11,460
General cash $564.7m $476.0m $433.8m $400.8m $376.8m
Client cash $813.3m $785.6m $793.2m $631.7m $513.6m
Cash and cash equivalents $1,378.0m $1,261.6m $1,227.0m $1,032.5m $890.4m
Investments $75.7m $41.2m $36.8m $59.9m $64.9m
Cash and investments $1,453.7m $1,302.8m $1,263.8m $1,092.4m $955.3m
Five-Year Growth Trajectory F
or p
erso
nal u
se o
nly