2015 - Federal Communications Commission · Universal Service Monitoring Report 2015 ......
93
UNIVERSAL SERVICE MONITORING REPORT CC Docket No. 96-45 WC Docket No. 02-6 WC Docket No. 02-60 WC Docket No. 06-122 WC Docket No. 10-90 WC Docket No. 11-42 WC Docket No. 13-184 WC Docket No. 14-58 2015 (Data Received Through September 2015) Prepared by Federal and State Staff for the Federal-State Joint Board on Universal Service This report is available for reference in the FCC's Reference Information Center, Courtyard Level, 445 12th Street, SW, Washington, DC. Copies may be purchased by contacting Best Copy and Printing, Inc., 445 12th Street, SW, Room CY-B402, Washington, DC 20554, telephone (800) 378-3160, or via their website at www.bcpiweb.com. The report can also be downloaded from the FCC’s Federal-State Joint Board Monitoring Reports website at http://www.fcc.gov/encyclopedia/federal-state-joint-board-monitoring-reports.
Transcript of 2015 - Federal Communications Commission · Universal Service Monitoring Report 2015 ......

UNIVERSAL SERVICE MONITORING REPORT
CC Docket No. 96-45 WC Docket No. 02-6 WC Docket No. 02-60 WC Docket No. 06-122 WC Docket No. 10-90 WC Docket No. 11-42 WC Docket No. 13-184 WC Docket No. 14-58
2015
(Data Received Through September 2015)
Prepared by Federal and State Staff for the Federal-State Joint Board on Universal Service
This report is available for reference in the FCC's Reference Information Center, Courtyard Level, 445 12th Street, SW, Washington, DC. Copies may be purchased by contacting Best Copy and Printing, Inc., 445 12th Street, SW, Room CY-B402, Washington, DC 20554, telephone (800) 378-3160, or via their website at www.bcpiweb.com. The report can also be downloaded from the FCC’s Federal-State Joint Board Monitoring Reports website at http://www.fcc.gov/encyclopedia/federal-state-joint-board-monitoring-reports.

Table of Contents Introduction and Summary ............................................................................................................ 4 to 5 2015 Monitoring Report Supplementary Material ................................................................ 6 1. Revenues and Contributions .................................................................................................... 7 to 21 2. Lifeline (Low Income) .............................................................................................................. 22 to 30 3. Connect America Fund (High Cost) ........................................................................................ 31 to 37 4. E-rate (Schools and Libraries) .................................................................................................. 38 to 40 5. Rural Health Care ..................................................................................................................... 41 to 43 6. Subscribership & Penetration ................................................................................................... 44 to 56 7. Price Indices .............................................................................................................................. 57 to 60 Appendix: Additional Information Regarding Universal Service High-Cost Support ............... A-1 to A-32
1
Report Tables Table 1.1 Filer Revenues by Service Type: 2004 - 2014 ........................................................... 8 Table 1.2 Filer Revenues, Wholesale vs. Retail: 2004 - 2014 .................................................. 10 Table 1.3 2014 Filer Revenues by Service Type: Top 5 Affiliated Entities vs. Other Companies ...................................................................................................... 12 Table 1.4 Telecommunications Revenue Reported on FCC Form 499-Q: 2013 - 2015 ............................................................................................................... 13 Table 1.5 USF Contribution Base by Year: 2004 - 2014 .......................................................... 14 Table 1.6 Universal Service Fund Contribution Factor ............................................................ 15 Table 1.7 Billed Interstate and International Retail Telecommunications Revenues by Top 5 Affiliated Entities vs. Other Companies: 2012 - First Half of 2015 ............ 16 Table 1.8 End User Telecommunications Revenues by State: 2013 ........................................ 17 Table 1.9 Universal Service Support Mechanism by State: 2014 ............................................ 18 Table 1.10 Universal Service Disbursements 2001 - 2014 ....................................................... 19 Table 1.11 Universal Service Program Requirements and Contribution Factors for 2015 ..... 20 Table 1.12 Universal Service Contributions Divided by Number of Households ................... 21 Table 2.1 Lifeline Subscribers and Link Up Beneficiaries ....................................................... 23 Table 2.2 Low-Income Claims ................................................................................................... 24 Table 2.3 Low-Income Claims by State: 2014 .......................................................................... 25 Table 2.4 Low-Income Claims Received by ILECs and CETCs ............................................. 26 Table 2.5 Low-Income Claims by Program and by Affiliated Entities: 2014 ......................... 27 Table 2.6 Total Monthly Lifeline Subscribers Since January 2012 ......................................... 28 Table 2.7 Lifeline De-Enrollment or Scheduled to be De-Enrolled by State in 2014 ............. 29 Table 2.8 Non-Facilities Based Low-Income Subscribers by State in 2014 ............................ 30 Table 3.1 High-Cost Support Fund Claim History .................................................................... 32 Table 3.2 High-Cost Support Fund Claim History – ILECs and CETCs ................................ 33 Table 3.3 High-Cost Support Fund Claim History – Price Cap and Rate of Return ILECs ... 34 Table 3.4 High-Cost Support Fund Claims – by Mechanism and State: 2014 ........................ 35 Table 3.5 Annual High-Cost Claims by Year-End 2014 Affiliate Structure: 2012 - 2014 ..... 36 Table 3.6 High-Cost Support Fund Claims by Affiliate: 2014 ................................................. 37 Table 4.1 Schools and Libraries Funding Commitments and Disbursements by Applicant Type and Year ........................................................................................................... 39 Table 4.2 Schools and Libraries Funding Commitments and Disbursements from Program Inception through June 30, 2015 by State and Applicant Type .............................. 40 Table 5.1 Rural Health Care Funding Commitments and Disbursements by Program and Year ........................................................................................................................... 42 Table 5.2 Rural Health Care Funding Commitments and Disbursements from Program Inception through June 30, 2015 by State and Program ......................................... 43
2

Table 6.1 Household Voice Subscribership in the United States, 1983 - 2015 ....................... 46 Table 6.2 Household Voice Penetration by Income, 1997 - 2015 ............................................ 47 Table 6.3 Nominal Dollar Equivalents by Year ........................................................................ 47 Table 6.4 Historical Voice Penetration Estimates ..................................................................... 48 Table 6.5 Voice Penetration by Selected Demographic Characteristics, 2012 - 2015 (Percentage of Households with Voice Service) ..................................................... 49 Table 6.6 Voice Penetration by State, 2010 - 2014 (Percentage of Occupied Housing Units with Voice Service) ................................ 50 Table 6.7 Voice Penetration by State, Selected Years (Percentage of Households with a Telephone in Unit) ........................................... 51 Table 6.8 Household Voice Penetration by State and Income, 2015 ....................................... 52 Table 6.9 Internet Use by Selected Characteristics, 2014 ......................................................... 53 Table 6.10 High-Speed Internet Penetration for Households by State ..................................... 54 Table 6.11 Residential Fixed Connections per Household by Speed Tier as of December 31, 2014 ................................................................................................... 55 Table 6.12 Telephone and Internet Subscribership in Low-Income Households .................... 56 Table 7.1 Long-Term Changes for Various Price Indices ........................................................ 58 Table 7.2 Annual Changes in CPI Telephone Service and All Items Indices .......................... 59 Table 7.3 Monthly Consumer Price Indices .............................................................................. 60
3

Universal Service Monitoring Report
2015
Introduction and Summary
This is the eighteenth report in a series prepared by federal and state staff members for the Federal-State Joint Board on Universal Service (Universal Service Joint Board).1 This report is generally based on information available to us as of September 2015. These reports contain information designed to monitor the impact of various universal service support mechanisms and the method used to finance them. These reports are part of a monitoring program created by the Federal Communications Commission in 1997 in CC Docket No. 96-45 to replace a similar program in CC Docket No. 87-339 that previously resulted in a series of nineteen Monitoring Reports.2
The Monitoring Report incorporates data from several sources, including the National Exchange Carrier Association (NECA) and Universal Service Administrative Company (USAC). USAC collects information from both contributors and beneficiaries of the Universal Service Fund, including incumbent local exchange carriers (ILECs), competitive eligible telecommunications carriers (CETCs), schools, libraries and health care providers. NECA, at the direction of the Commission, provides information to USAC that is utilized in administering certain aspects of the high-cost program.
The following is the organization of this report: Section 1 provides an update on industry revenues, universal service program funding requirements, and contribution factors. Sections 2 through 5 provide the latest data on the low-income, high-cost, schools and libraries, and rural health care support mechanisms. Section 6 presents recent Census data on voice telephony subscribership from the Current Population Survey and the American Community Survey as well as data on telephone penetration by income by state. It also includes data on residential Internet subscribership. Section 7 includes updated Consumer Price Index data. An Appendix provides additional information regarding the high-cost program.
This entire report is available electronically in page image (.pdf) format through the FCC’s Federal-State Joint Board Monitoring Reports website, located at http://www.fcc.gov/encyclopedia/federal-state-joint-board-monitoring-reports. The tables of the report are available separately as spreadsheet files in a single compressed (.zip) format file at this site also. The Monitoring Report is published once a year. Information received well in advance of the next Monitoring Report will be made available on an interim basis in separate staff reports or in raw data files (such as most NECA filings used in the Monitoring Report) on the Wireline Competition Bureau Statistical Reports Internet site.
Supplementary material is available in a single compressed (.zip) format file at http://www.fcc.gov/encyclopedia/federal-state-joint-board-monitoring-reports. The supplementary material includes tables too extensive to be practical for a printed report. A table listing the files available when this file is unzipped is provided at the end of this introduction.
1 The last report was released in December 2014. Universal Service Monitoring Report, 2014 (Data Received Through September 2014).
2 In 1997, the Commission adopted rules to implement section 254 largely based on the recommendations of the Universal Service Joint Board and delegated to the Common Carrier Bureau (the predecessor to the Wireline Competition Bureau), in consultation with the state staff, the creation of a new monitoring program. Federal-State Joint Board on Universal Service, CC Docket No. 96-45, Report and Order, 12 FCC Rcd 8776, 9218, para. 869 (1997) (Universal Service First Report and Order). See 47 C.F.R. § 54.702(i).
4

We continue to look for ways to present universal service data in a way that is useful for the public. Former Tables 2.5 and 2.6 from last year’s report have been combined into a single Table 2.5 presenting low-income claims by program and by affiliated entities. Table 6.10 now presents high-speed internet penetration by household instead of individual. A new Table 6.12 presents telephone and internet subscribership in low-income households. Figures 4 and 5 presenting accepted offers of Connect America Phase II model-based support by state and carrier respectively have been added to the high-cost appendix. Figure 6 presents information regarding the authorizations of rural broadband experiment support. Figures 15 and 17 presenting fixed connection deployment and fixed connections for Incumbent Local Exchange Carriers of at least 10 Mbps downstream and 768 kbps upstream have also been added to the high-cost appendix. In the 2015 report, we also have eliminated certain tables.3 New files have been added to the supplementary material including “Broadband Penetration by County and Congressional District” and “HC Penalties” (which lists default penalties from failure to meet build-out requirements for the Mobility Fund).
We invite questions or comments on this report via email at [email protected] with subject: December 2015 Monitoring Report.
3 The following tables have been deleted: former Figures 6 and 10 presenting respectively study areas from the benchmarking ruling and a summary of voice results of the Urban Rates Survey.
5

2015 Monitoring Report Supplementary Material
This list provides the names of files provided in the 2015 Monitoring Report Supplementary Material zip file available at http://www.fcc.gov/encyclopedia/federal-state-joint-board-monitoring-reports. Underlined names are folders containing those files after unzipping the file.
Revenues and Contributions Contribution Base Revenues by Program Estimating End-User Revenue by State - 2013 Tables Estimating End-User Revenue by State - 2013 Technical Appendix Revenue Details - 2014 Low Income ETCs Receiving Lifeline Support 2014 LI Subscribers and Beneficiaries - by State LI Support - by State LI Support - by Study Area High Cost Claims 2015 Rate Floor Report HC Claims - by State HC Claims - by Study Area HC Rate Floor Reductions – by Study Area HC RoR Claims per Line - by Study Area HC Support Study Areas - 2014 HCL Benchmarks – by Study Area Max Subject to Rate Floor – by PC Study Area Support Reduction Waiver Requests Disbursements HC Disbursements - by State HC Disbursements - by Study Area
HC Penalties HC RoR Disbursements per Line - by Study Area
Schools and Libraries SL Cumulative Funds - by Service Type and State SL Disbursements - by Service Provider Type SL Funds - by Applicant Type, State, and Funding Year SL Funds - by Service Type, State, and Funding Year SL Funds per Student - by State Rural Health Care RHC Disbursements - by Speed, Year, and HCP Type RHC Disbursements - by Speed, Year, and State RHC Disbursements per Person - by State RHC Funds - by HCP Type, Program, and Year RHC Funds - by State, Program, and Year Subscribership, Penetration, and Broadband Penetration by County and Congressional District Minutes of Use ILEC Interstate Switched Access Minutes of Use - by State ILEC Interstate Switched Access Minutes of Use - by Study Area ILEC Interstate Switched Access Minutes of Use - by Tier NECA Pool Results
6

Section 1 - Revenues and Contributions
Overview – Revenues and Contributions
In response to the Telecommunications Act of 1996, the Commission established several universal service mechanisms to help ensure that all Americans have access to affordable telecommunications service. Congress mandated that these programs be supported by contributions from every telecommunications carrier that provides interstate telecommunications, and other providers of telecommunications if the Commission finds contributions from such providers to be in the public interest. The tables in this section provide a general overview of the revenues of the U.S. telecommunications industry and the contributions to the universal service support mechanisms that are based on these revenues. The tables are based on information filed with the Commission in FCC Forms 499-A and 499-Q. To the extent that certain telecommunications industry revenues are not subject to contributions, such revenues may not be fully captured in these tables. Additional information about the revenues collected to support universal service can be found on the Commission’s website at http://www.fcc.gov/encyclopedia/contribution-methodology-administrative-filings and on USAC’s website at http://www.usac.org/cont/default.aspx. Please note that that the information provided in this report is based upon Commission rules in effect in 2014.
7
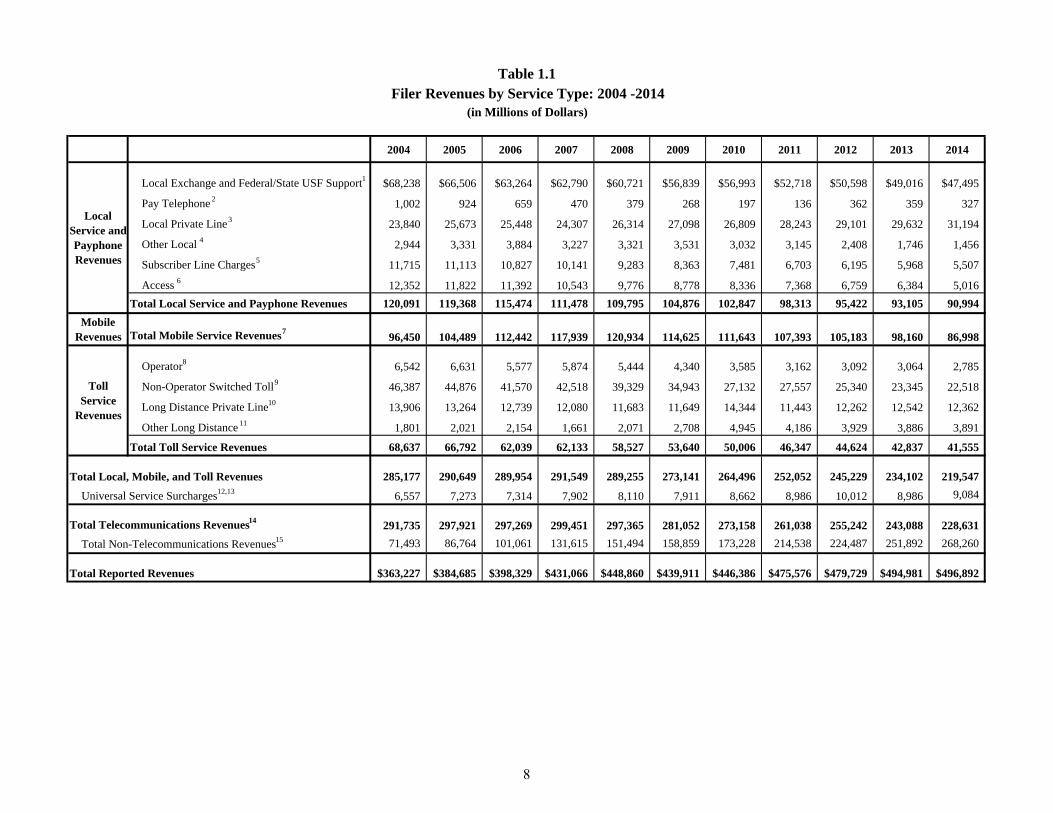
2004 2005 2006 2007 2008 2009 2010 2011 2012 2013 2014
Local Exchange and Federal/State USF Support 1 $68,238 $66,506 $63,264 $62,790 $60,721 $56,839 $56,993 $52,718 $50,598 $49,016 $47,495
Pay Telephone 2 1,002 924 659 470 379 268 197 136 362 359 327
Local Private Line 3 23,840 25,673 25,448 24,307 26,314 27,098 26,809 28,243 29,101 29,632 31,194
Other Local 4 2,944 3,331 3,884 3,227 3,321 3,531 3,032 3,145 2,408 1,746 1,456
Subscriber Line Charges 5 11,715 11,113 10,827 10,141 9,283 8,363 7,481 6,703 6,195 5,968 5,507
Access 6 12,352 11,822 11,392 10,543 9,776 8,778 8,336 7,368 6,759 6,384 5,016
Total Local Service and Payphone Revenues 120,091 119,368 115,474 111,478 109,795 104,876 102,847 98,313 95,422 93,105 90,994
Total Mobile Service Revenues 7 96,450 104,489 112,442 117,939 120,934 114,625 111,643 107,393 105,183 98,160 86,998
Operator8 6,542 6,631 5,577 5,874 5,444 4,340 3,585 3,162 3,092 3,064 2,785
Non-Operator Switched Toll 9 46,387 44,876 41,570 42,518 39,329 34,943 27,132 27,557 25,340 23,345 22,518
Long Distance Private Line 10 13,906 13,264 12,739 12,080 11,683 11,649 14,344 11,443 12,262 12,542 12,362
Other Long Distance 11 1,801 2,021 2,154 1,661 2,071 2,708 4,945 4,186 3,929 3,886 3,891
Total Toll Service Revenues 68,637 66,792 62,039 62,133 58,527 53,640 50,006 46,347 44,624 42,837 41,555
Total Local, Mobile, and Toll Revenues 285,177 290,649 289,954 291,549 289,255 273,141 264,496 252,052 245,229 234,102 219,547
6,557 7,273 7,314 7,902 8,110 7,911 8,662 8,986 10,012 8,986 9,084
Total Telecommunications Revenues 14291,735 297,921 297,269 299,451 297,365 281,052 273,158 261,038 255,242 243,088 228,631
71,493 86,764 101,061 131,615 151,494 158,859 173,228 214,538 224,487 251,892 268,260
Total Reported Revenues $363,227 $384,685 $398,329 $431,066 $448,860 $439,911 $446,386 $475,576 $479,729 $494,981 $496,892
Universal Service Surcharges 12,13
Total Non-Telecommunications Revenues 15
Table 1.1Filer Revenues by Service Type: 2004 -2014
(in Millions of Dollars)
Local Service and Payphone Revenues
Mobile Revenues
Toll Service
Revenues
8

1 Dollar amounts are calculated using the sum of Lines 303a, 308a (Federal and State USF Support Revenues), and 404a from Form 499-A.2 Dollar amounts are calculated using the sum of Lines 306a and 407a from Form 499-A.3 Dollar amounts are calculated using the sum of Lines 305a and 406a from Form 499-A.4 Dollar amounts are calculated using the sum of Lines 307a and 408a from Form 499-A.5 Dollar amounts are calculated using Line 405a from Form 499-A. As of 2012, includes Access Recovery Charge (ARC).6 Dollar amounts are calculated using Line 304a from Form 499-A.7 Dollar amounts are calculated using the sum of Lines 309a, 409a, and 410a from Form 499-A.8 Dollar amounts are calculated using the sum of Lines 310a, 411a, 412a, and 413a from Form 499-A.9 Dollar amounts are calculated using the sum of Lines 311a and 414a from Form 499-A.10 Dollar amounts are calculated using the sum of Lines 312a and 415a from Form 499-A.11 Dollar amounts are calculated using the sum of Lines 313a, 314a, 416a, and 417a from Form 499-A.
13 Dollar amounts are calculated using Line 403a from Form 499-A.14 Subtotal includes surcharge.15 Dollar amounts are calculated using Line 418a from Form 499-A.
Source: FCC Form 499-A based on filings as of June 3, 2015.
Note: Detail may not add to totals due to rounding.
Footnotes to Table 1.1
12 The surcharge figure indicates only surcharges that have been explicitly reported as such in Form 499-A and does not account for implicit surcharge revenues where carriers collect the surcharge through higher prices.
9

2004 2005 2006 2007 2008 2009 2010 2011 2012 2013 2014
Local Service 3,4$38,546 $39,213 $39,392 $38,383 $39,200 $38,285 $37,955 $39,807 $39,783 $39,101 $37,974
Mobile Service 5 4,164 6,334 5,187 5,360 5,630 4,284 5,006 5,512 5,587 5,384 5,334
Toll Service 6 15,703 16,892 15,101 16,093 13,843 13,003 15,549 11,921 11,425 10,911 10,472
Total Wholesale Revenues 58,413 62,439 59,679 59,836 58,672 55,571 58,510 57,240 56,796 55,396 53,780
Intrastate 7 25,852 27,486 24,848 22,566 21,836 20,173 22,484 20,379 18,860 17,236 16,182
Interstate and International 8,932,561 34,953 34,831 37,270 36,837 35,399 36,026 36,861 37,936 38,160 37,598
56% 56% 58% 62% 63% 64% 62% 64% 67% 69% 70%
Local Service 3,10$81,545 $80,155 $76,082 $73,095 $70,598 $66,591 $64,892 $58,506 $55,639 $54,004 $53,020
Mobile Service 1192,286 98,156 107,255 112,579 115,304 110,341 106,637 101,881 99,596 92,776 81,664
Toll Service 1252,934 49,900 46,938 46,040 44,681 40,637 34,457 34,426 33,198 31,927 31,083
Universal Service Surcharges 136,557 7,272 7,314 7,902 8,110 7,911 8,662 8,986 10,012 8,986 9,084
Total Retail Revenues $233,322 $235,482 $237,589 $239,615 $238,693 $225,481 $214,648 $203,798 $198,446 $187,693 $174,851
Intrastate 14153,265 154,310 157,653 158,380 157,737 149,493 142,356 133,475 128,409 119,294 107,909
Interstate and International 1,8, 15 80,057 81,173 79,937 81,235 80,956 75,988 72,292 70,323 70,037 68,399 66,942
34% 34% 34% 34% 34% 34% 34% 35% 35% 36% 38%
Local Service 3 $120,091 $119,368 $115,474 $111,478 $109,798 $104,876 $102,847 $98,313 $95,422 $93,105 $90,994
Mobile Service 96,450 104,489 112,442 117,939 120,934 114,625 111,643 107,393 105,183 98,160 86,998
Toll Service 68,637 66,792 62,039 62,133 58,523 53,640 50,006 46,347 44,624 42,837 41,555
Universal Service Surcharges 6,557 7,272 7,314 7,902 8,110 7,911 8,662 8,986 10,012 8,986 9,084
Total Telecommunications Revenues $291,734 $297,921 $297,268 $299,451 $297,365 $281,052 $273,158 $261,038 $255,242 $243,088 $228,631
Intrastate 179,117 181,796 182,501 180,946 179,573 169,666 164,840 153,854 147,269 136,530 124,091
Interstate and International 8112,617 116,125 114,768 118,505 117,793 111,387 108,318 107,184 107,972 106,559 104,540
39% 39% 39% 40% 40% 40% 40% 41% 42% 44% 46%
$71,493 $86,764 $101,061 $131,615 $151,494 $158,859 $173,228 $214,538 $224,487 $251,892 $268,260
$363,227 $384,685 $398,329 $431,066 $448,859 $439,911 $446,386 $475,576 $479,729 $494,981 $496,892
Total Non-Telecommunications Revenues
Total Reported Revenues
Total Telecommunications
Revenues (Wholesale + Retail)
Table 1.2Filer Revenues1, Wholesale vs. Retail: 2004-2014
(in Millions of Dollars)
Wholesale (Carrier's Carrier)
Telecommunications
Revenues 2
Retail (End User) Telecommunications
Revenues
Percentage Interstate/International
Percentage Interstate/International
Percentage Interstate/International
10
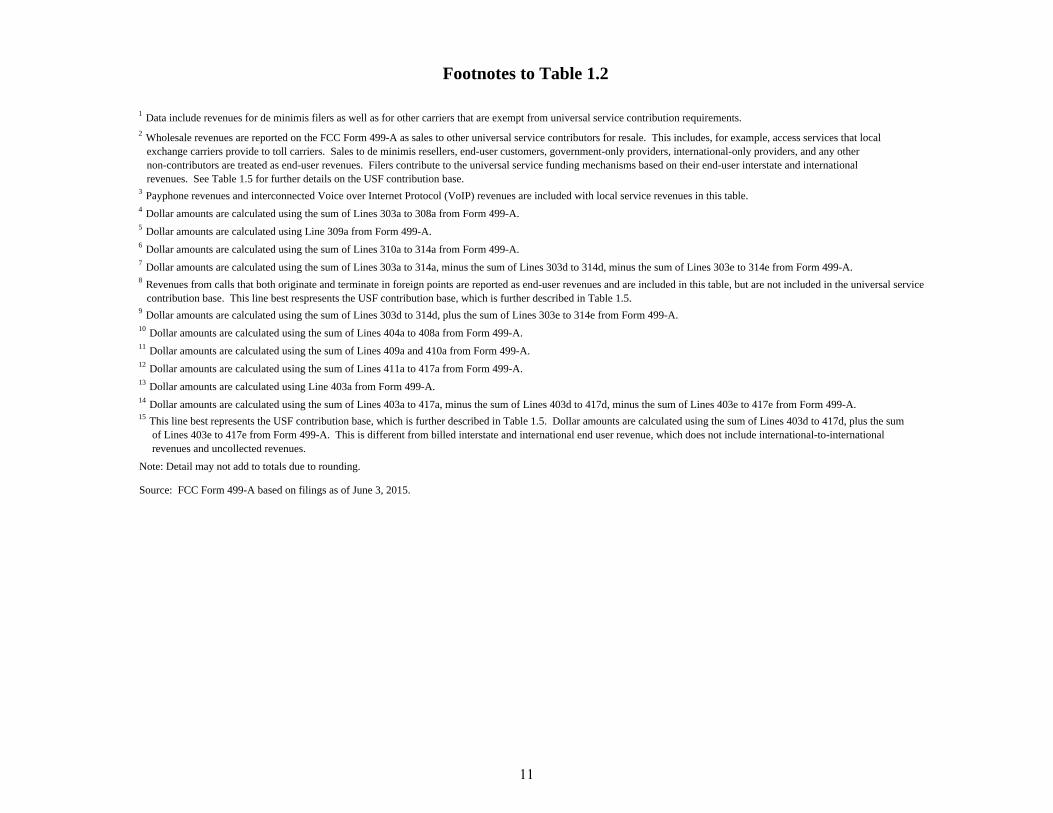
1 Data include revenues for de minimis filers as well as for other carriers that are exempt from universal service contribution requirements.
3 Payphone revenues and interconnected Voice over Internet Protocol (VoIP) revenues are included with local service revenues in this table. 4 Dollar amounts are calculated using the sum of Lines 303a to 308a from Form 499-A.5 Dollar amounts are calculated using Line 309a from Form 499-A.6 Dollar amounts are calculated using the sum of Lines 310a to 314a from Form 499-A.7 Dollar amounts are calculated using the sum of Lines 303a to 314a, minus the sum of Lines 303d to 314d, minus the sum of Lines 303e to 314e from Form 499-A.
9 Dollar amounts are calculated using the sum of Lines 303d to 314d, plus the sum of Lines 303e to 314e from Form 499-A.10 Dollar amounts are calculated using the sum of Lines 404a to 408a from Form 499-A.11 Dollar amounts are calculated using the sum of Lines 409a and 410a from Form 499-A.12 Dollar amounts are calculated using the sum of Lines 411a to 417a from Form 499-A.13 Dollar amounts are calculated using Line 403a from Form 499-A.14 Dollar amounts are calculated using the sum of Lines 403a to 417a, minus the sum of Lines 403d to 417d, minus the sum of Lines 403e to 417e from Form 499-A.
Note: Detail may not add to totals due to rounding.
Footnotes to Table 1.2
2 Wholesale revenues are reported on the FCC Form 499-A as sales to other universal service contributors for resale. This includes, for example, access services that local exchange carriers provide to toll carriers. Sales to de minimis resellers, end-user customers, government-only providers, international-only providers, and any other non-contributors are treated as end-user revenues. Filers contribute to the universal service funding mechanisms based on their end-user interstate and international revenues. See Table 1.5 for further details on the USF contribution base.
8 Revenues from calls that both originate and terminate in foreign points are reported as end-user revenues and are included in this table, but are not included in the universal service contribution base. This line best respresents the USF contribution base, which is further described in Table 1.5.
Source: FCC Form 499-A based on filings as of June 3, 2015.
15 This line best represents the USF contribution base, which is further described in Table 1.5. Dollar amounts are calculated using the sum of Lines 403d to 417d, plus the sum of Lines 403e to 417e from Form 499-A. This is different from billed interstate and international end user revenue, which does not include international-to-international revenues and uncollected revenues.
11
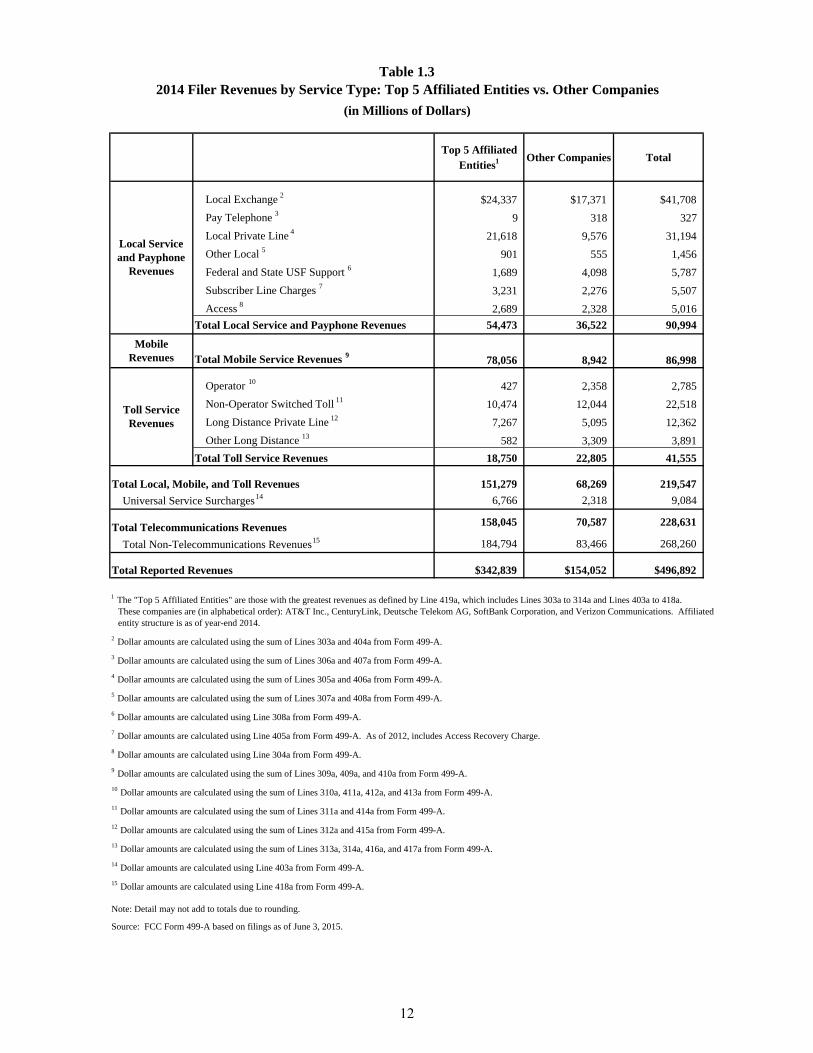
Top 5 Affiliated Entities1 Other Companies Total
Local Exchange 2 $24,337 $17,371 $41,708
Pay Telephone 3 9 318 327
Local Private Line 4 21,618 9,576 31,194
Other Local 5 901 555 1,456
Federal and State USF Support 6 1,689 4,098 5,787
Subscriber Line Charges 7 3,231 2,276 5,507
Access 8 2,689 2,328 5,016
Total Local Service and Payphone Revenues 54,473 36,522 90,994
Total Mobile Service Revenues 978,056 8,942 86,998
Operator 10 427 2,358 2,785
Non-Operator Switched Toll 11 10,474 12,044 22,518
Long Distance Private Line 12 7,267 5,095 12,362
Other Long Distance 13 582 3,309 3,891
Total Toll Service Revenues 18,750 22,805 41,555
Total Local, Mobile, and Toll Revenues 151,279 68,269 219,547
Universal Service Surcharges 14 6,766 2,318 9,084
Total Telecommunications Revenues 158,045 70,587 228,631
Total Non-Telecommunications Revenues 15 184,794 83,466 268,260
Total Reported Revenues $342,839 $154,052 $496,892
2 Dollar amounts are calculated using the sum of Lines 303a and 404a from Form 499-A.
3 Dollar amounts are calculated using the sum of Lines 306a and 407a from Form 499-A.
4 Dollar amounts are calculated using the sum of Lines 305a and 406a from Form 499-A.
5 Dollar amounts are calculated using the sum of Lines 307a and 408a from Form 499-A.
6 Dollar amounts are calculated using Line 308a from Form 499-A.
7 Dollar amounts are calculated using Line 405a from Form 499-A. As of 2012, includes Access Recovery Charge.
8 Dollar amounts are calculated using Line 304a from Form 499-A.
9 Dollar amounts are calculated using the sum of Lines 309a, 409a, and 410a from Form 499-A.
10 Dollar amounts are calculated using the sum of Lines 310a, 411a, 412a, and 413a from Form 499-A.
11 Dollar amounts are calculated using the sum of Lines 311a and 414a from Form 499-A.
12 Dollar amounts are calculated using the sum of Lines 312a and 415a from Form 499-A.
13 Dollar amounts are calculated using the sum of Lines 313a, 314a, 416a, and 417a from Form 499-A.
14 Dollar amounts are calculated using Line 403a from Form 499-A.
15 Dollar amounts are calculated using Line 418a from Form 499-A.
Table 1.32014 Filer Revenues by Service Type: Top 5 Affiliated Entities vs. Other Companies
(in Millions of Dollars)
Source: FCC Form 499-A based on filings as of June 3, 2015.
Local Service and Payphone
Revenues
Mobile Revenues
Toll Service Revenues
1 The "Top 5 Affiliated Entities" are those with the greatest revenues as defined by Line 419a, which includes Lines 303a to 314a and Lines 403a to 418a. These companies are (in alphabetical order): AT&T Inc., CenturyLink, Deutsche Telekom AG, SoftBank Corporation, and Verizon Communications. Affiliated entity structure is as of year-end 2014.
Note: Detail may not add to totals due to rounding.
12
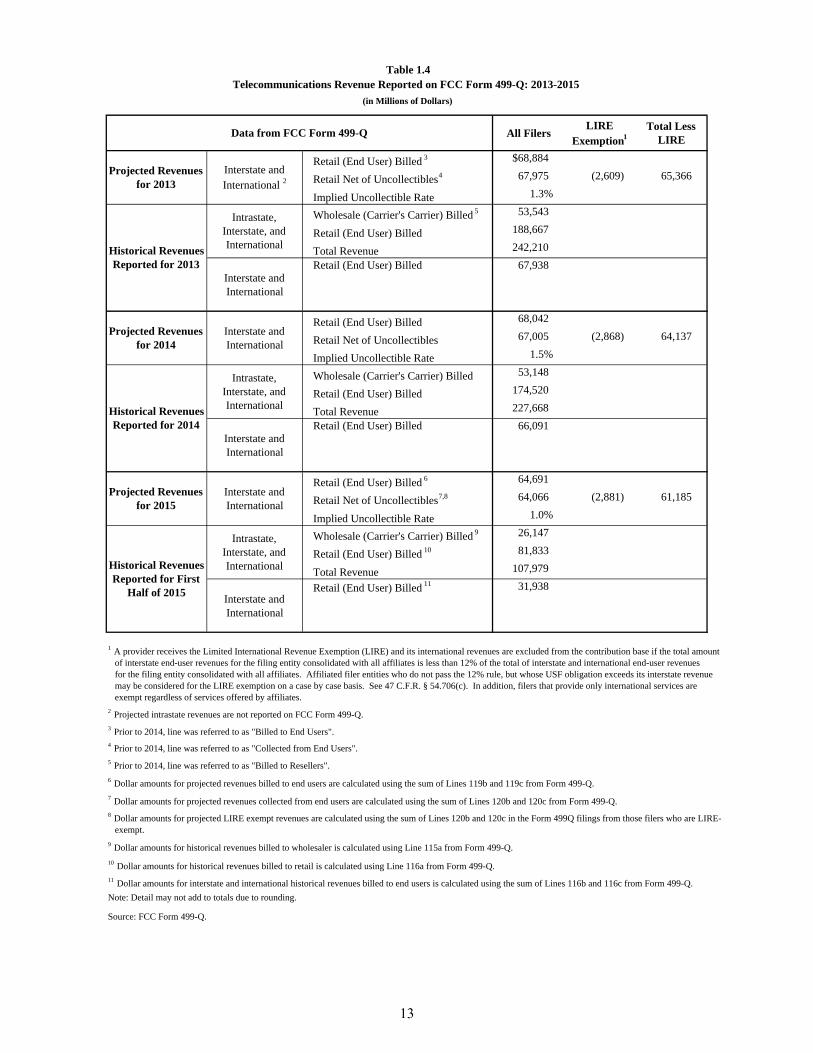
All FilersLIRE
Exemption1Total Less
LIRE
Retail (End User) Billed 3 $68,884
Retail Net of Uncollectibles 4 67,975 (2,609) 65,366
Implied Uncollectible Rate 1.3%
Wholesale (Carrier's Carrier) Billed 5 53,543
Retail (End User) Billed 188,667
Total Revenue 242,210
Interstate and International
Retail (End User) Billed 67,938
Retail (End User) Billed 68,042
Retail Net of Uncollectibles 67,005 (2,868) 64,137
Implied Uncollectible Rate 1.5%
Wholesale (Carrier's Carrier) Billed 53,148
Retail (End User) Billed 174,520
Total Revenue 227,668
Interstate and International
Retail (End User) Billed 66,091
Retail (End User) Billed 6 64,691
Retail Net of Uncollectibles 7,8 64,066 (2,881) 61,185
Implied Uncollectible Rate 1.0%
Wholesale (Carrier's Carrier) Billed 9 26,147
Retail (End User) Billed 10 81,833
Total Revenue 107,979
Interstate and International
Retail (End User) Billed 11 31,938
6 Dollar amounts for projected revenues billed to end users are calculated using the sum of Lines 119b and 119c from Form 499-Q.
9 Dollar amounts for historical revenues billed to wholesaler is calculated using Line 115a from Form 499-Q.
10 Dollar amounts for historical revenues billed to retail is calculated using Line 116a from Form 499-Q.
Note: Detail may not add to totals due to rounding.
Source: FCC Form 499-Q.
11 Dollar amounts for interstate and international historical revenues billed to end users is calculated using the sum of Lines 116b and 116c from Form 499-Q.
8 Dollar amounts for projected LIRE exempt revenues are calculated using the sum of Lines 120b and 120c in the Form 499Q filings from those filers who are LIRE- exempt.
Projected Revenues for 2015
Interstate and International
Historical Revenues Reported for First
Half of 2015
Intrastate, Interstate, and International
7 Dollar amounts for projected revenues collected from end users are calculated using the sum of Lines 120b and 120c from Form 499-Q.
1 A provider receives the Limited International Revenue Exemption (LIRE) and its international revenues are excluded from the contribution base if the total amount of interstate end-user revenues for the filing entity consolidated with all affiliates is less than 12% of the total of interstate and international end-user revenues for the filing entity consolidated with all affiliates. Affiliated filer entities who do not pass the 12% rule, but whose USF obligation exceeds its interstate revenue may be considered for the LIRE exemption on a case by case basis. See 47 C.F.R. § 54.706(c). In addition, filers that provide only international services are exempt regardless of services offered by affiliates.
3 Prior to 2014, line was referred to as "Billed to End Users".4 Prior to 2014, line was referred to as "Collected from End Users".5 Prior to 2014, line was referred to as "Billed to Resellers".
2 Projected intrastate revenues are not reported on FCC Form 499-Q.
Historical Revenues Reported for 2013
Intrastate, Interstate, and International
Projected Revenues for 2014
Interstate and International
Historical Revenues Reported for 2014
Intrastate, Interstate, and International
Table 1.4Telecommunications Revenue Reported on FCC Form 499-Q: 2013-2015
(in Millions of Dollars)
Data from FCC Form 499-Q
Projected Revenues for 2013
Interstate and International 2
13

2004 2005 2006 2007 2008 2009 2010 2011 2012 2013 2014Revenues Subject to USF Contribution
Billed interstate and international retail (end-user) revenues (includes Universal Service Surcharge) [Line 403 to Line 417, parts (d) and (e)] $80,057 $81,173 $79,937 $81,235 $80,956 $75,988 $72,292 $70,323 $70,037 $68,399 $66,942
lessrevenues for international-to-international services [ Line 412(e) ] 644 873 708 886 862 576 469 452 444 589 673
less
international revenues of international-only filers and international revenues that were excluded because of the LIRE
Exemption2 3,118 3,742 3,598 3,978 4,148 3,393 3,326 3,079 2,653 3,086 2,827
less
interstate and other international revenues for filers who are de minimis or otherwise exempt from universal service support requirements 66 54 57 50 51 49 34 31 28 31 31
less
uncollectible contribution base revenues [
Line 422(d) + Line 422(e) ]3 1,574 1,231 1,073 1,301 1,131 1,075 960 787 709 610 527 equals $74,654 $75,272 $74,499 $75,020 $74,764 $70,895 $67,503 $65,971 $66,203 $64,083 $62,884
Note: Detail may not add to totals due to rounding. Revisions have been made for 2007.
Source: FCC Form 499-A based on filings as of June 3, 2015.
Table 1.5
USF Contribution Base by Year1: 2004-2014 (in Millions of Dollars)
1 This table shows the contribution base for the Universal Service Fund (USF), but the actual amounts used for determining contributions may differ due to the following factors. Adjustments are made by the Administrator to account for additional and corrected filings received. Exempt amounts were based on revenues and the filer type (i.e., principal business activity) information contained in the FCC Form 499-A filings. The Administrator may use carrier type, revenue type, Line 603 exemption certifications, and additional information requested from filers to determine which filers are required to contribute. The Administrator bills delinquent filers based on estimated revenues and may, in some instances, include estimated revenue amounts in contribution base amounts. The universal service contribution factors are set quarterly based on FCC Form 499-Q filings. FCC Form 499-A data are used for true-up and auditing purposes. As a result of these factors, actual contribution bases have been based on different amounts than those shown.2 A provider receives the Limited International Revenue Exemption (LIRE) and its international revenues are excluded from the contribution base if the total amount of interstate end-user revenues for the filing entity consolidated with all affiliates is less than 12% of the total of interstate and international end-user revenues for the filing entity consolidated with all affiliates. Affiliated filer entities who do not pass the 12% rule, but whose USF obligation exceeds its interstate revenue may request to be considered for the LIRE exemption on a case by case basis. See 47 C.F.R. § 54.706(c). In addition, filers that provide only international services are exempt regardless of services offered by affiliates.3 Does not include uncollectible amounts associated with filers who are de minimis or LIRE exempt.
14

Year2004 First Quarter 8.7
Second Quarter 8.7 Third Quarter 8.9 Fourth Quarter 8.9
2005 First Quarter 10.7 Second Quarter 11.1 Third Quarter 10.2 Fourth Quarter 10.2
2006 First Quarter 10.2 Second Quarter 10.9 Third Quarter 10.5 Fourth Quarter 9.1
2007 First Quarter 9.7 Second Quarter 11.7 Third Quarter 11.3 Fourth Quarter 11.0
2008 First Quarter 10.2 Second Quarter 11.3 Third Quarter 11.4 Fourth Quarter 11.4
2009 First Quarter 9.5 Second Quarter 11.3 Third Quarter 12.9 Fourth Quarter 12.3
2010 First Quarter 14.1 Second Quarter 15.3 Third Quarter 13.6 Fourth Quarter 12.9
2011 First Quarter 15.5 Second Quarter 14.9 Third Quarter 14.4 Fourth Quarter 15.3
2012 First Quarter 17.9 Second Quarter 17.4 Third Quarter 15.7 Fourth Quarter 17.4
2013 First Quarter 16.1 Second Quarter 15.5 Third Quarter 15.1 Fourth Quarter 15.6
2014 First Quarter 16.4 Second Quarter 16.6 Third Quarter 15.7 Fourth Quarter 16.1
2015 First Quarter 16.8 Second Quarter 17.4 Third Quarter 17.1 Fourth Quarter 16.7
Source: Quarterly Public Notices on universal service contribution factors are in CC Docket 96-45. See http://www.fcc.gov/encyclopedia/contribution-factor-quarterly-filings-universal-service-fund-usf-management-support.
Table 1.6
Universal Service Fund Contribution Factor 1
Quarter Factor
1 Carriers contribute based on projected, collected, end-user interstate and international telecommunications revenues.
15

Preliminary3
2012 2013 2014 First Half 2015
Top 5 Affiliated Entities2 $49,795 $48,530 $46,870 $21,994
Other Companies 20,242 19,870 20,072 9,944
Total $70,037 $68,399 $66,942 $31,938
Note: Detail may not add to totals due to rounding. Figures include VoIP revenues.
Source: Data for 2012 are based on filings as of April 8, 2014. Data for 2013 are based on filings as of May 5, 2014. Data for 2014 are based on filings as of June 3, 2015. Data for 2015 are based on FCC Form 499-Q.
2 The "Top 5 Affiliated Entities" are the five affiliated entities with the greatest revenues as defined by Line 419a, which is the sum of Lines 303a to 314a and Lines 403a to 418a, and is determined as of each year-end affiliate structure. These companies for 2012 are (in alphabetical order): AT&T Inc., CenturyLink, Deutsche Telekom AG, Sprint Nextel Corporation, and Verizon Communications. These companies for 2013 - 2015 are (in alphabetical order): AT&T Inc., CenturyLink, Deutsche Telekom AG, SoftBank Corporation (which acquired Sprint Nextel Corporation in June 2013), and Verizon Communications.
3 Preliminary revenues are calculated using Line 116b plus Line 116c for each quarter in FCC Form 499-Q.
Table 1.7
Billed Interstate and International Retail Telecommunications Revenues1 by Top 5 Affiliated Entities vs. Other Companies: 2012 - First Half 2015
(in Millions of Dollars)
1 Revenues for 2012-2014 are calculated as the sum of Lines 403d to 417d (interstate end user revenue) and 403e to 417e (international end user revenue). The method for calculating revenue figures has been adjusted from previous years.
16

Corrected on March 15, 2016
Intrastate
Interstate and
International Total % Intrastate
% Interstate
and
International % Total
Alabama $1,709 $995 $2,704 1.43% 1.45% 1.44
Alaska 277 173 450 0.23 0.25 0.24
American Samoa 10 6 16 0.01 0.01 0.01
Arizona 2,195 1,349 3,543 1.84 1.97 1.89
Arkansas 1,031 591 1,622 0.86 0.86 0.86
California 14,478 7,376 21,854 12.14 10.78 11.64
Colorado 1,922 1,256 3,178 1.61 1.84 1.69
Connecticut 1,456 920 2,376 1.22 1.35 1.27
Delaware 378 239 617 0.32 0.35 0.33
District of Columbia 643 365 1,008 0.54 0.53 0.54
Florida 7,280 4,340 11,620 6.10 6.34 6.19
Georgia 3,755 2,203 5,958 3.15 3.22 3.17
Guam 54 34 88 0.05 0.05 0.05
Hawaii 513 367 880 0.43 0.54 0.47
Idaho 513 325 837 0.43 0.47 0.45
Illinois 4,929 2,862 7,791 4.13 4.18 4.15
Indiana 2,244 1,241 3,485 1.88 1.81 1.86
Iowa 1,073 654 1,727 0.90 0.96 0.92
Kansas 1,015 574 1,589 0.85 0.84 0.85
Kentucky 1,517 882 2,398 1.27 1.29 1.28
Louisiana 1,733 944 2,676 1.45 1.38 1.43
Maine 511 309 820 0.43 0.45 0.44
Maryland 2,475 1,466 3,940 2.07 2.14 2.10
Massachusetts 2,784 1,599 4,383 2.33 2.34 2.34
Michigan 3,595 1,958 5,553 3.01 2.86 2.96
Minnesota 2,069 1,204 3,272 1.73 1.76 1.74
Mississippi 948 550 1,498 0.79 0.80 0.80
Missouri 2,167 1,288 3,455 1.82 1.88 1.84
Montana 365 230 596 0.31 0.34 0.32
Nebraska 671 468 1,139 0.56 0.68 0.61
Nevada 1,017 595 1,612 0.85 0.87 0.86
New Hampshire 501 303 804 0.42 0.44 0.43
New Jersey 3,761 2,185 5,946 3.15 3.19 3.17
New Mexico 669 409 1,078 0.56 0.60 0.57
New York 8,205 4,678 12,883 6.88 6.84 6.86
North Carolina 3,548 2,099 5,647 2.97 3.07 3.01
North Dakota 275 170 445 0.23 0.25 0.24
N. Mariana Islands 14 8 22 0.01 0.01 0.01
Ohio 4,345 2,387 6,732 3.64 3.49 3.59
Oklahoma 1,397 761 2,158 1.17 1.11 1.15
Oregon 1,349 799 2,147 1.13 1.17 1.14
Pennsylvania 5,140 2,953 8,093 4.31 4.32 4.31
Puerto Rico 1,012 711 1,723 0.85 1.04 0.92
Rhode Island 407 231 638 0.34 0.34 0.34
South Carolina 1,692 1,010 2,702 1.42 1.48 1.44
South Dakota 312 189 502 0.26 0.28 0.27
Tennessee 2,418 1,370 3,788 2.03 2.00 2.02
Texas 9,037 4,799 13,836 7.58 7.02 7.37
Utah 899 565 1,464 0.75 0.83 0.78
Vermont 247 164 411 0.21 0.24 0.22
Virgin Islands 54 53 107 0.04 0.08 0.06
Virginia 3,278 1,973 5,251 2.75 2.88 2.80
Washington 2,478 1,426 3,904 2.08 2.09 2.08
West Virginia 666 462 1,127 0.56 0.68 0.60
Wisconsin 2,053 1,199 3,252 1.72 1.75 1.73
Wyoming 211 135 346 0.18 0.20 0.18
Total $119,294 $68,399 $187,693 100.00% 100.00% 100.00%
Note: Figures may not add to totals due to rounding.
End User Telecommunications Revenue by State: 2013
Table 1.8
(in Millions of Dollars)
Source: FCC/WCB staff estimates. For methodology end-user revenue per state, see the the Technical Appendix at
http://www.fcc.gov/encyclopedia/federal-state-joint-board-monitoring-reports.

Corrected on March 15, 2016Table 1.9
High-Cost
Support
Low-Income
Support
Schools &
Libraries
Rural Health
Care 2
Amount % of Total Amount % of Total
Alabama $92,015 $23,978 $47,347 $1,119 $164,459 2.09% $115,966 1.45% $48,493
Alaska 184,225 16,014 52,387 62,286 314,912 4.01% 20,212 0.25% 294,700
American Samoa 2,749 46 1,132 347 4,274 0.05% 684 0.01% 3,590
Arizona 65,858 60,847 64,611 2,816 194,132 2.47% 157,261 1.97% 36,870
Arkansas 84,227 14,959 25,323 4,087 128,596 1.64% 68,858 0.86% 59,738
California 91,526 134,761 340,582 14,316 581,185 7.40% 859,936 10.78% -278,751
Colorado 68,093 12,120 21,731 2,845 104,790 1.33% 146,398 1.84% -41,608
Connecticut 464 11,560 18,611 22 30,658 0.39% 107,274 1.35% -76,616
Delaware 228 3,734 5,430 0 9,391 0.12% 27,815 0.35% -18,424
District of Columbia 0 5,273 8,387 0 13,660 0.17% 42,591 0.53% -28,931
Florida 63,601 106,617 81,541 185 251,944 3.21% 505,968 6.34% -254,024
Georgia 108,097 59,379 96,278 4,879 268,633 3.42% 256,876 3.22% 11,756
Guam 10,694 209 589 122 11,614 0.15% 3,934 0.05% 7,679
Hawaii 23,307 5,780 5,614 264 34,965 0.45% 42,818 0.54% -7,853
Idaho 42,059 2,465 7,537 463 52,524 0.67% 37,872 0.47% 14,652
Illinois 73,212 69,021 118,537 5,193 265,963 3.39% 333,694 4.18% -67,731
Indiana 80,002 27,388 47,715 2,722 157,827 2.01% 144,648 1.81% 13,180
Iowa 126,297 7,004 17,639 1,063 152,004 1.94% 76,236 0.96% 75,768
Kansas 147,033 9,613 19,576 734 176,957 2.25% 66,887 0.84% 110,070
Kentucky 120,269 28,880 36,560 2,351 188,060 2.39% 102,782 1.29% 85,278
Louisiana 80,099 33,693 50,403 821 165,016 2.10% 110,009 1.38% 55,007
Maine 22,721 6,732 8,305 6,720 44,479 0.57% 36,002 0.45% 8,477
Maryland 3,596 27,612 24,657 26 55,891 0.71% 170,863 2.14% -114,972
Massachusetts 2,216 34,011 32,689 135 69,051 0.88% 186,417 2.34% -117,367
Michigan 32,753 74,176 47,635 8,402 162,965 2.07% 228,258 2.86% -65,293
Minnesota 104,053 12,673 28,543 4,700 149,969 1.91% 140,355 1.76% 9,614
Mississippi 188,602 15,290 29,993 3,371 237,256 3.02% 64,164 0.80% 173,092
Missouri 100,969 23,160 30,470 1,891 156,490 1.99% 150,105 1.88% 6,385
Montana 89,422 1,939 5,425 5,129 101,915 1.30% 26,849 0.34% 75,066
Nebraska 74,676 1,316 10,937 1,496 88,426 1.13% 54,563 0.68% 33,863
Nevada 23,922 19,998 9,475 324 53,719 0.68% 69,318 0.87% -15,600
New Hampshire 9,775 2,238 3,499 62 15,573 0.20% 35,330 0.44% -19,757
New Jersey 929 29,172 64,758 0 94,859 1.21% 254,685 3.19% -159,826
New Mexico 72,617 17,345 26,058 3,102 119,122 1.52% 47,683 0.60% 71,439
New York 40,934 130,901 103,462 3,207 278,503 3.55% 545,373 6.84% -266,870
North Carolina 85,824 44,470 81,973 3,971 216,238 2.75% 244,741 3.07% -28,503
North Dakota 95,513 2,540 3,648 1,404 103,105 1.31% 19,804 0.25% 83,301
N. Mariana Islands 1,265 204 723 12 2,204 0.03% 876 0.01% 1,327
Ohio 40,708 74,472 71,353 1,189 187,723 2.39% 278,297 3.49% -90,574
Oklahoma 127,040 132,104 60,066 6,377 325,587 4.14% 88,670 1.11% 236,917
Oregon 71,413 10,285 14,107 4,009 99,814 1.27% 93,100 1.17% 6,713
Pennsylvania 77,519 66,435 68,894 1,090 213,938 2.72% 344,327 4.32% -130,389
Puerto Rico 115,237 44,316 13,423 0 172,976 2.20% 82,873 1.04% 90,103
Rhode Island 30 6,533 7,200 0 13,764 0.18% 26,961 0.34% -13,197
South Carolina 99,591 34,872 39,291 1,461 175,214 2.23% 117,778 1.48% 57,437
South Dakota 76,349 895 6,906 1,097 85,247 1.09% 22,088 0.28% 63,159
Tennessee 69,669 42,555 38,671 1,510 152,406 1.94% 159,774 2.00% -7,368
Texas 222,993 82,306 218,274 8,474 532,047 6.77% 559,478 7.02% -27,432
Utah 24,253 5,598 18,837 1,447 50,136 0.64% 65,892 0.83% -15,756
Vermont 17,740 1,662 3,103 77 22,582 0.29% 19,101 0.24% 3,481
Virgin Islands 16,428 326 3,988 15 20,757 0.26% 6,211 0.08% 14,546
Virginia 83,349 22,657 35,788 2,419 144,213 1.84% 230,057 2.88% -85,844
Washington 68,568 25,543 35,715 334 130,160 1.66% 166,282 2.09% -36,122
West Virginia 44,244 8,573 21,930 1,736 76,483 0.97% 53,860 0.68% 22,624
Wisconsin 121,984 23,481 28,551 10,603 184,620 2.35% 139,769 1.75% 44,850
Wyoming 42,241 134 3,529 553 46,457 0.59% 15,746 0.20% 30,711TOTAL 3,750,392 1,604,629 2,269,407 192,977 7,817,405 #N/A
Total $3,733,198 $1,659,869 $2,269,407 $192,977 $7,855,451 100.00% $7,974,372 100.00% -$118,921
4 Net dollar flow is positive when payments from USF to carriers exceed contributions to USF. Total is negative because of administrative expenses.
3 Contributions include administrative cost of approximately $119 million, as shown in USAC's Annual Report. Allocation of contributions among states is an
FCC estimate. See the Technical Appendix at http://www.fcc.gov/encyclopedia/federal-state-joint-board-monitoring-reports.
Notes: Figures may not add due to rounding. USF is an abbreviation for the Universal Service Fund.
1 Data are from USAC.
2 Includes both the primary and pilot programs.
Universal Service Support Mechanisms by State: 2014
(Annual Payments and Contributions in Thousands of Dollars)
Payments from USF to Service Providers 1
Total Estimated Contributions 3
Estimated Net
Dollar Flow 4

YearHigh-Cost Support
Low-Income Support
Rural Health Care
Schools and Libraries Total
2001 $2,602 $584 $8 $1,464 $4,659 2002 2,978 673 16 1,683 5,351 2003 3,273 713 3 1,644 5,633 2004 3,488 759 1 1,076 5,324 2005 3,824 809 26 1,862 6,520 2006 4,096 820 41 1,669 6,626 2007 4,287 823 37 1,808 6,955 2008 4,478 819 49 1,760 7,106 2009 4,292 1,025 72 1,878 7,268 2010 4,268 1,316 110 2,282 7,976 2011 4,031 1,751 141 2,233 8,156 2012 4,147 2,189 155 2,218 8,710 2013 4,165 1,798 159 2,204 8,326 2014 3,733 1,660 193 2,269 7,855
Table 1.10Universal Service Disbursements 2001-2014
(in Millions of Dollars)
Notes: Figures may not add due to rounding. The figures used in this table are for the calendar year and include disbursements that were committed over several years but paid out in the respective calendar year. In Sections 4 and 5, figures for the Schools and Libraries program and the Rural Health Care program are reported based on fiscal year rather than calendar year. Rural Health Care support includes both the primary and pilot programs.
Source: Universal Service Administration Company (USAC).
19

First Second Third Fourth Full
Quarter Quarter Quarter Quarter Year
All Support Mechanisms
Projections of demand and administrative expenses
at the time the contribution factors were adopted
High Cost
High Cost Loop Support $183.63 $185.34 $186.29 $186.62 $741.88
Interstate Common Line Support $224.32 $223.30 $231.95 $231.95 $911.52
Connect America Fund - Frozen Price Cap Carrier Support 1 $258.10 $260.11 $260.08 $260.34 $1,038.63
Frozen Competitive ETC Support 2 $150.59 $148.95 $148.81 $148.83 $597.18
Connect America Fund - Intercarrier Compensation Support $103.07 $102.80 $103.16 $103.16 $412.19
Connect America Fund Reserve Pursuant to FCC 11-1612 3 $205.29 $204.50 $194.71 $194.10 $798.60
Prior Period Adjustment 3 -$7.14 $4.85 $9.07 -$17.41 -$10.63
USAC Administrative Costs $7.69 $8.21 $8.22 $5.61 $29.73
Interest Income 4 -$1.94 -$2.82 -$2.98 -$2.74 -$10.48
Program Total $1,123.61 $1,135.24 $1,139.31 $1,110.46 $4,508.62
Low Income
Lifeline Assistance $408.89 $401.07 $363.48 $376.83 $1,550.27
Link-Up $0.21 $0.16 $0.11 $0.10 $0.58
Broadband Pilot $0.02 $0.01 $0.00 $0.00 $0.03
Prior Period Adjustment -$15.04 $6.52 -$25.83 -$52.05 -$86.40
USAC Administrative Costs $4.58 $6.76 $7.00 $1.68 $20.02
Interest Income 4 -$0.16 -$0.14 -$0.15 -$0.15 -$0.60
Program Total $398.50 $414.38 $344.61 $326.41 $1,483.90
Rural Health
Rural Health Care Support $59.81 $64.29 $65.17 $73.13 $262.40
Prior Period Adjustment -$1.72 $0.25 -$0.09 -$1.07 -$2.63
USAC Administrative Costs $2.99 $3.36 $3.44 $2.93 $12.72
Interest Income 4 -$0.37 -$0.52 -$0.50 -$0.43 -$1.82
Program Total $60.71 $67.38 $68.02 $74.56 $270.67
Schools & Libraries
Schools and Libraries Support $580.98 $580.33 $603.45 $603.45 $2,368.21
Prior Period True-ups -$0.29 $1.40 $0.19 -$8.88 -$7.58
Interest Income 4 -$5.08 -$6.68 -$6.67 -$5.76 -$24.19
Administrative expenses $22.47 $23.12 $21.95 $21.42 $88.96
Program Total $598.08 $598.17 $618.92 $610.23 $2,425.40
Grand Total $2,180.90 $2,215.17 $2,170.86 $2,121.66 $8,688.59
Applicable interstate and international end-user revenues
Reported contribution base revenues $15,305.30 $15,148.44 $15,046.10 $15,000.90
Circularity Adjustment
Amount carriers will contribute to USF in this quarter -2,180.90 -2,215.17 -2,170.86 -2,121.66
Subtotal $13,124.40 $12,933.27 $12,875.24 $12,879.24
Adjustment factor for uncollectibles 1.0% 1.0% 1.0% 1.0%
Contribution base at the time the factor was calculated $12,993.16 $12,803.94 $12,746.48 $12,750.45
Contribution factor 16.8% 17.4% 17.1% 16.7%
Contribution factor times contribution base $2,181.55 $2,227.89 $2,179.65 $2,129.32
4 Interest income is shown as negative because it is subtracted from expenses to yield the total.
Table 1.11Universal Service Program Requirements and Contribution Factors for 2015
(in Millions of Dollars)
Source: Support mechanism data are from USAC Appendix M02 from pertinent filings as shown at http://www.usac.org/about/tools/fcc/filings/default.aspx. Contribution factor information is available at https://www.fcc.gov/encyclopedia/contribution-factor-quarterly-filings-universal-service-fund-usf-management-support.
1 In the USF/ICC Transformation Order , the Commission converted support received by Price Cap carriers and their rate-of-return affiliates, including IAS, HCMS, ICLS, LSS, and HCLS, to Frozen High Cost Carrier Support. USF/ICC Transformation Order , paras. 128-57.
2 In the USF/ICC Transformation Order , the Commission froze support received by competitive ETCs, including IAS, HCMS, ICLS, LSS, and HCLS at 2011 levels, effective January 1, 2012, and began phasing the frozen support down effective July 1, 2012. USF/ICC Transformation Order, paras. 498-32.3 In the USF/ICC Transformation Order , the Commission created the Connect America reserve to be used to manage fluctuations in high-cost demand. Id ., paras. 547-56.
20
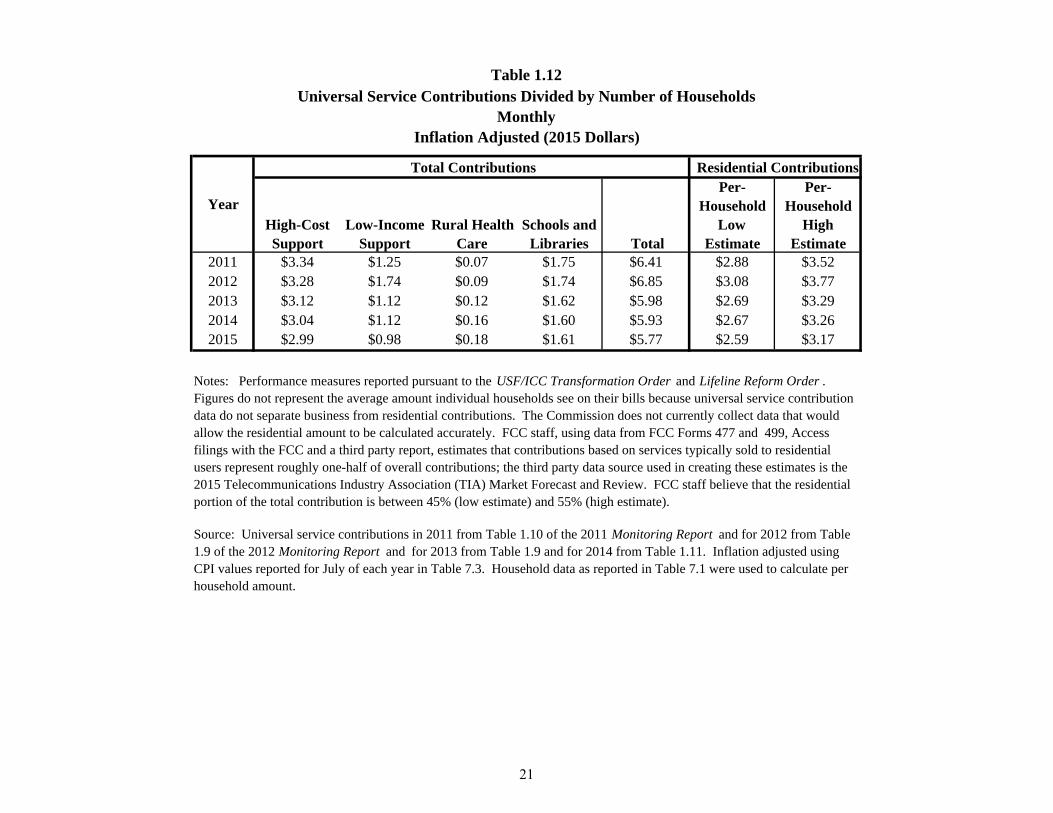
High-Cost Support
Low-Income Support
Rural Health Care
Schools and Libraries Total
Per-Household
Low Estimate
Per-Household
High Estimate
2011 $3.34 $1.25 $0.07 $1.75 $6.41 $2.88 $3.522012 $3.28 $1.74 $0.09 $1.74 $6.85 $3.08 $3.772013 $3.12 $1.12 $0.12 $1.62 $5.98 $2.69 $3.292014 $3.04 $1.12 $0.16 $1.60 $5.93 $2.67 $3.262015 $2.99 $0.98 $0.18 $1.61 $5.77 $2.59 $3.17
Notes: Performance measures reported pursuant to the USF/ICC Transformation Order and Lifeline Reform Order . Figures do not represent the average amount individual households see on their bills because universal service contribution data do not separate business from residential contributions. The Commission does not currently collect data that would allow the residential amount to be calculated accurately. FCC staff, using data from FCC Forms 477 and 499, Access filings with the FCC and a third party report, estimates that contributions based on services typically sold to residential users represent roughly one-half of overall contributions; the third party data source used in creating these estimates is the 2015 Telecommunications Industry Association (TIA) Market Forecast and Review. FCC staff believe that the residential portion of the total contribution is between 45% (low estimate) and 55% (high estimate).
Source: Universal service contributions in 2011 from Table 1.10 of the 2011 Monitoring Report and for 2012 from Table 1.9 of the 2012 Monitoring Report and for 2013 from Table 1.9 and for 2014 from Table 1.11. Inflation adjusted using CPI values reported for July of each year in Table 7.3. Household data as reported in Table 7.1 were used to calculate per household amount.
Table 1.12Universal Service Contributions Divided by Number of Households
MonthlyInflation Adjusted (2015 Dollars)
Year
Total Contributions Residential Contributions
21

Section 2 – Lifeline (Low Income)
Overview – Lifeline Program for Low-Income Consumers
Since 1985, the Universal Service Lifeline program has provided a discount on phone service for
qualifying low-income consumers to ensure that all Americans have the opportunities and security that phone service brings, including being able to connect to jobs, family and emergency services. In 2005, Lifeline discounts were made available to qualifying low-income consumers on pre-paid wireless service plans in addition to traditional landline service. More recently, the Commission has made ensuring the availability of broadband service for low-income Americans a goal of the Lifeline program. In 2015, the Commission built on existing reforms to prevent waste, fraud, and abuse in the program in addition to seeking comment on restructuring Lifeline to better support 21st Century technologies. The Lifeline program is available to eligible low-income consumers in every state, territory, commonwealth, and on Tribal lands. Consumers with proper proof of eligibility may be qualified to enroll. To participate in the program, consumers must have an income that is at or below 135% of the federal Poverty Guidelines or participate in a qualifying state, federal, or Tribal assistance program. The Lifeline program is administered by the Universal Service Administrative Company (USAC). Additional information about the Lifeline program can be found on the Commission’s website at http://www.fcc.gov/lifeline and on USAC’s website at http://www.usac.org/li/. Please note that the information provided in this report is based upon the program rules through September 15, 2015.
22
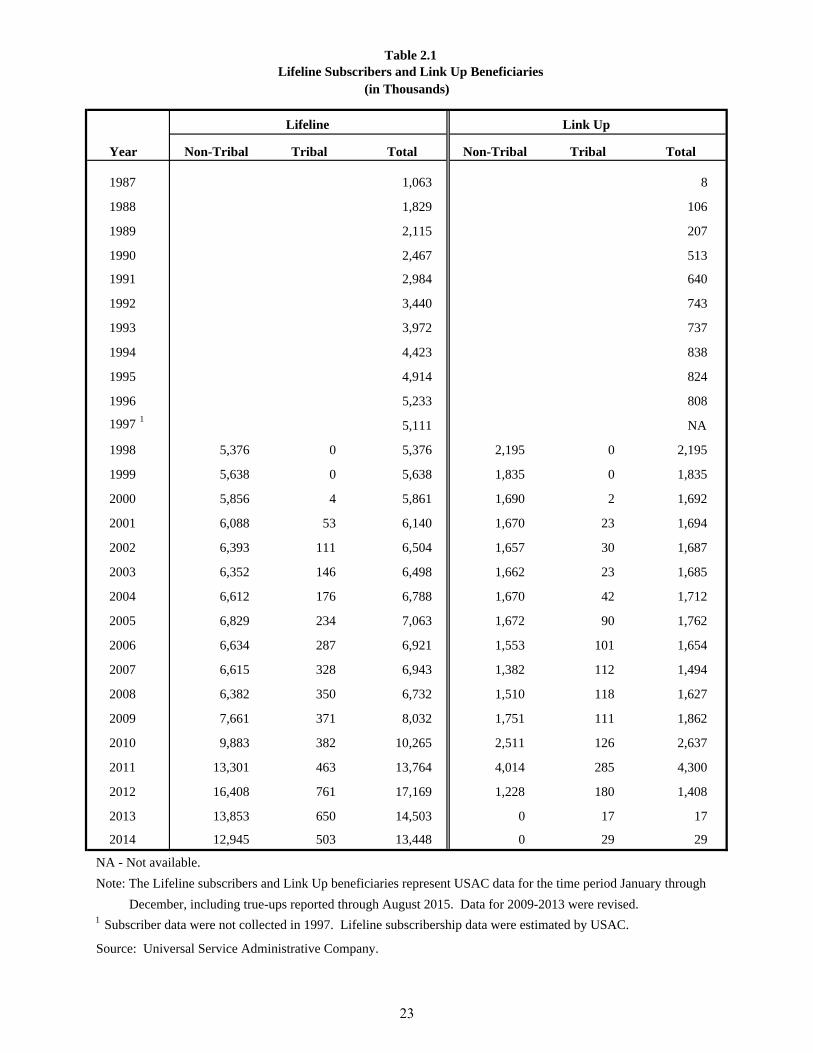
Table 2.1Lifeline Subscribers and Link Up Beneficiaries
Year Non-Tribal Tribal Total Non-Tribal Tribal Total
1987 1,063 8
1988 1,829 106
1989 2,115 207
1990 2,467 513
1991 2,984 640
1992 3,440 743
1993 3,972 737
1994 4,423 838
1995 4,914 824
1996 5,233 808
1997 15,111 NA
1998 5,376 0 5,376 2,195 0 2,195
1999 5,638 0 5,638 1,835 0 1,835
2000 5,856 4 5,861 1,690 2 1,692
2001 6,088 53 6,140 1,670 23 1,694
2002 6,393 111 6,504 1,657 30 1,687
2003 6,352 146 6,498 1,662 23 1,685
2004 6,612 176 6,788 1,670 42 1,712
2005 6,829 234 7,063 1,672 90 1,762
2006 6,634 287 6,921 1,553 101 1,654
2007 6,615 328 6,943 1,382 112 1,494
2008 6,382 350 6,732 1,510 118 1,627
2009 7,661 371 8,032 1,751 111 1,862
2010 9,883 382 10,265 2,511 126 2,637
2011 13,301 463 13,764 4,014 285 4,300
2012 16,408 761 17,169 1,228 180 1,408
2013 13,853 650 14,503 0 17 17
2014 12,945 503 13,448 0 29 29
NA - Not available.
Note: The Lifeline subscribers and Link Up beneficiaries represent USAC data for the time period January through
December, including true-ups reported through August 2015. Data for 2009-2013 were revised.1 Subscriber data were not collected in 1997. Lifeline subscribership data were estimated by USAC.
Source: Universal Service Administrative Company.
Lifeline Link Up
(in Thousands)
23

Table 2.2Low-Income Claims
(in Thousands of Dollars)
Total
Year General
Additional
Tribal 2 TLS 3 PICC 4 Total Non-Tribal Tribal Total
1988 $31,952 $0 $0 $0 $31,952 $1,991 $0 $1,991 $33,943
1989 50,878 0 0 0 50,878 4,480 0 4,480 55,358
1990 62,464 0 0 0 62,464 11,351 0 11,351 73,815
1991 79,104 0 0 0 79,104 13,705 0 13,705 92,809
1992 93,766 0 0 0 93,766 15,342 0 15,342 109,108
1993 109,083 0 0 0 109,083 17,019 0 17,019 126,102
1994 123,284 0 0 0 123,284 18,573 0 18,573 141,857
1995 137,277 0 0 0 137,277 18,392 0 18,392 155,670
1996 148,186 0 0 0 148,186 18,247 0 18,247 166,433
1997 147,579 0 0 0 147,579 13,711 0 13,711 161,290
1998 1 416,504 0 2,700 2,802 422,006 42,461 0 42,461 464,467
1999 438,578 0 3,134 4,450 446,162 33,988 0 33,988 480,150
2000 482,052 522 2,846 3,168 488,588 30,411 30 30,441 519,029
2001 548,419 6,960 3,195 0 558,574 30,314 475 30,788 589,362
2002 623,350 17,955 3,779 0 645,083 30,323 700 31,022 676,106
2003 657,095 24,167 4,425 0 685,687 30,170 515 30,686 716,373
2004 695,188 30,502 5,111 0 730,800 30,898 1,230 32,129 762,929
2005 716,133 45,124 6,215 0 767,472 31,715 2,788 34,503 801,975
2006 703,958 61,524 8,885 0 774,367 29,832 2,869 32,701 807,068
2007 710,180 73,145 8,514 0 791,839 27,816 3,575 31,391 823,230
2008 695,015 80,914 8,634 0 784,563 30,682 6,578 37,260 821,823
2009 867,541 88,061 8,959 0 964,561 40,807 7,485 48,291 1,012,852
2010 1,125,667 92,877 22,294 0 1,240,839 67,324 9,798 77,122 1,317,961
2011 1,522,195 118,119 11,085 0 1,651,399 108,860 21,528 130,388 1,781,787
2012 1,920,203 210,393 6,646 0 2,137,242 34,770 11,940 46,710 2,183,952
2013 1,609,389 179,894 2,693 0 1,791,981 0 567 567 1,792,548
2014 1,492,533 137,492 0 0 1,630,026 0 640 640 1,630,666
2 Tribal Lifeline subscribers also receive General support which is currently $9.25 per subscriber. This amount is not included in Additional Tribal support.3 TLS is an abbreviation for toll limitation service.4 Carriers no longer charge a residential Presubscribed Interexchange Carrier Charge (PICC) as of July 1, 2000.
Source: Universal Service Administrative Company.
Lifeline Link Up
1 Effective in 1998, the federal Lifeline support mechanism was expanded so that a basic level of assistance would be provided in all states. Further, the basic level of federal support was increased in 1998.
Note: Data for 2009-2013 were updated to account for true-ups.
24

State or Jurisdiction Lifeline Link Up
General Additional Tribal Non-Tribal Tribal
Alabama $24,122 $36 $0 $0 $0 $24,158 Alaska 4,538 11,016 0 32 0 15,587 American Samoa 34 0 0 0 0 34 Arizona 43,764 16,218 0 256 0 60,238 Arkansas 14,820 2 0 0 0 14,822 California 136,993 48 0 0 0 137,041 Colorado 11,482 16 0 0 0 11,498 Connecticut 13,127 0 0 0 0 13,127 Delaware 3,664 0 0 0 0 3,664 District of Columbia 4,979 0 0 0 0 4,979 Florida 103,974 0 0 0 0 103,974 Georgia 59,212 0 0 0 0 59,212 Guam 203 0 0 0 0 203 Hawaii 2,959 2,489 0 0 0 5,448 Idaho 2,125 166 0 0 0 2,291 Illinois 68,164 0 0 0 0 68,164 Indiana 26,654 0 0 0 0 26,654 Iowa 6,784 0 0 0 0 6,784 Kansas 9,609 16 0 0 0 9,625 Kentucky 28,119 0 0 0 0 28,119 Louisiana 32,891 0 0 0 0 32,891 Maine 6,456 18 0 0 0 6,474 Maryland 26,055 0 0 0 0 26,055 Massachusetts 32,595 0 0 0 0 32,595 Michigan 73,543 69 0 0 0 73,613 Minnesota 11,049 1,260 0 0 0 12,309 Mississippi 15,928 1 0 0 0 15,930 Missouri 23,469 2 0 0 0 23,471 Montana 821 1,087 0 18 0 1,927 Nebraska 1,213 51 0 0 0 1,264 Nevada 19,400 487 0 0 0 19,887 New Hampshire 2,163 0 0 0 0 2,163 New Jersey 27,926 0 0 0 0 27,926 New Mexico 10,051 6,863 0 164 0 17,079 New York 124,158 1 0 0 0 124,159 North Carolina 42,827 71 0 0 0 42,898 North Dakota 1,176 1,198 0 5 0 2,379 Northern Mariana Islands 241 0 0 0 0 241 Ohio 73,984 0 0 0 0 73,984 Oklahoma 37,893 92,932 0 151 0 130,975 Oregon 9,557 28 0 0 0 9,585 Pennsylvania 63,426 0 0 0 0 63,426 Puerto Rico 46,142 0 0 0 0 46,142 Rhode Island 6,389 0 0 0 0 6,389 South Carolina 34,006 65 0 1 0 34,072 South Dakota 658 222 0 1 0 881 Tennessee 41,276 0 0 0 0 41,276 Texas 79,921 0 0 0 0 79,922 Utah 5,055 282 0 9 0 5,346 Vermont 1,588 0 0 0 0 1,588 Virgin Islands 276 0 0 0 0 276 Virginia 21,771 0 0 0 0 21,771 Washington 22,092 2,186 0 0 0 24,277 West Virginia 8,505 0 0 0 0 8,505 Wisconsin 22,585 652 0 2 0 23,239 Wyoming 121 8 0 0 0 129
Total $1,492,533 $137,492 $0 $640 $0 $1,630,666
Source: Universal Service Administrative Company.
Notes: These dollars represent submitted claims to USAC for the time period January 2014 through December 2014, including true-ups reported through August 2015. Tribal Lifeline subscribers also receive General support which is currently $9.25 per subscriber. This amount is not included in Tribal support. For Link Up, the payments and subscribers for the two categories of recipients are kept separate.
(in Thousands of Dollars)
Table 2.3Low-Income Claims by State: 2014
TLS Total
25
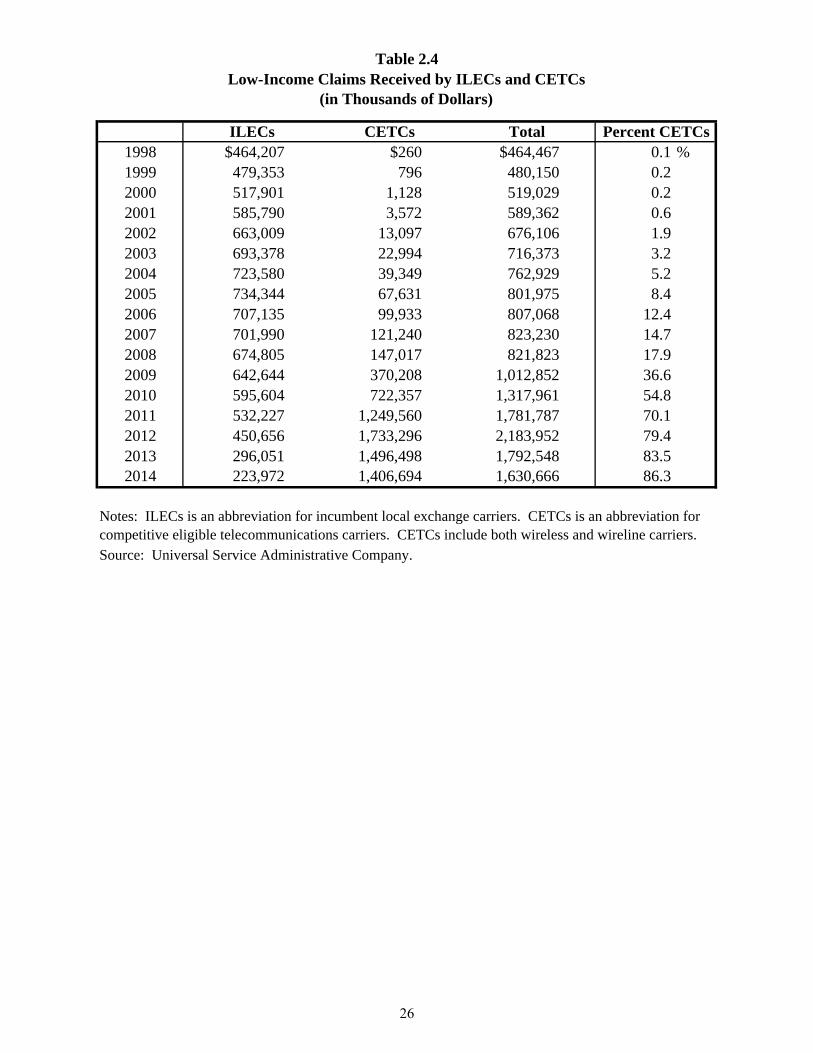
Table 2.4
ILECs CETCs Total1998 $464,207 $260 $464,467 0.1 %1999 479,353 796 480,150 0.22000 517,901 1,128 519,029 0.22001 585,790 3,572 589,362 0.62002 663,009 13,097 676,106 1.92003 693,378 22,994 716,373 3.22004 723,580 39,349 762,929 5.22005 734,344 67,631 801,975 8.42006 707,135 99,933 807,068 12.42007 701,990 121,240 823,230 14.72008 674,805 147,017 821,823 17.92009 642,644 370,208 1,012,852 36.62010 595,604 722,357 1,317,961 54.82011 532,227 1,249,560 1,781,787 70.12012 450,656 1,733,296 2,183,952 79.42013 296,051 1,496,498 1,792,548 83.52014 223,972 1,406,694 1,630,666 86.3
Low-Income Claims Received by ILECs and CETCs(in Thousands of Dollars)
Notes: ILECs is an abbreviation for incumbent local exchange carriers. CETCs is an abbreviation for competitive eligible telecommunications carriers. CETCs include both wireless and wireline carriers.
Percent CETCs
Source: Universal Service Administrative Company.
26

Rank Affiliated Entity Name 1Lifeline Support
Link Up Support
TotalLow-Income
SupportPercentof Total
Cumulative Percent of
Total
1 América Móvil 2 $436,487 $0 $436,487 26.8% 26.8%
2 SoftBank Corp. 3 272,437 0 272,437 16.7 43.5 3 AT&T Inc. 164,030 1 164,031 10.1 53.5 4 Budget Prepay Inc. 102,625 29 102,653 6.3 59.8 5 I-Wireless, LLC 94,200 0 94,200 5.8 65.6 6 Telrite Corporation 75,738 0 75,738 4.6 70.3 7 Verizon Communications Inc. 47,438 0 47,438 2.9 73.2 8 Nexus Communications, Inc. 41,141 0 41,141 2.5 75.7 9 Assist Wireless, LLC 36,405 0 36,405 2.2 77.9 10 TerraCom/YourTel America 27,811 0 27,811 1.7 79.6 11 KDDI America, Inc. 26,707 0 26,707 1.6 81.3 12 Smith Bagley, Inc. 23,722 412 24,134 1.5 82.7 13 CenturyLink, Inc. 21,836 0 21,836 1.3 84.1 14 Quadrant Holdings Group LLC 19,659 0 19,659 1.2 85.3 15 Easy Telephone Services Company 19,276 0 19,276 1.2 86.5 16 True Wireless, LLC 18,046 0 18,046 1.1 87.6 17 Blue Jay Wireless, LLC 16,282 0 16,282 1.0 88.6 18 Global Connection Inc. of America 12,326 0 12,326 0.8 89.3 19 Cox Communications, Inc. 12,282 0 12,282 0.8 90.1 20 Boomerang Wireless, LLC 11,076 0 11,076 0.7 90.8 21 General Communication, Inc. 11,050 2 11,053 0.7 91.4 22 TSC Acquisition Corporation 10,435 0 10,435 0.6 92.1 23 American Broadband and Telecommunications Company 9,697 0 9,697 0.6 92.7 24 Frontier Communications Corporation 9,643 2 9,646 0.6 93.3 25 PlatinumTel Communications LLC 8,420 0 8,420 0.5 93.8 26 Amvensys Telecom Holdings 8,198 0 8,198 0.5 94.3 27 Windstream Corporation 7,019 0 7,019 0.4 94.7 28 PR Wireless LLC 6,336 0 6,336 0.4 95.1 29 Air Voice Wireless 4,789 0 4,789 0.3 95.4 30 UTphone 4,781 0 4,781 0.3 95.7
Other Carriers 70,133 194 70,327 4.3 83.9 All Affiliated Entities $1,630,026 $640 $1,630,666 100.0% 100.0%
Table 2.5Low-Income Claims by Program and by Affiliated Entities: 2014
(in Thousands of Dollars)
Source: Universal Service Administrative Company.
2 América Móvil owns TracFone Wireless.3 SoftBank Corp. owns Virgin Mobile USA.
1 Affiliated entities include all commonly-controlled or commonly-owned affiliates as of year-end 2014.
27

Month Tribal Lifeline SubscribersNon-Tribal Lifeline
SubscribersTotal Lifeline Subscribers
January-12 549,258 15,908,572 16,457,830February-12 575,873 16,238,084 16,813,957March-12 662,135 16,534,059 17,196,194April-12 722,144 16,848,842 17,570,986May-12 782,131 17,317,870 18,100,001June-12 815,448 17,321,765 18,137,213July-12 846,735 16,866,507 17,713,242August-12 843,864 16,518,258 17,362,122September-12 842,986 16,238,775 17,081,761October-12 831,010 16,027,321 16,858,331November-12 858,420 15,789,941 16,648,361December-12 804,793 15,287,332 16,092,125January-13 687,500 13,314,341 14,001,841February-13 717,866 12,958,185 13,676,051March-13 740,955 13,122,244 13,863,199April-13 717,869 13,245,660 13,963,529May-13 708,103 13,618,668 14,326,771June-13 695,699 14,029,333 14,725,032July-13 628,293 14,238,952 14,867,245August-13 611,198 14,465,697 15,076,895September-13 576,375 14,545,107 15,121,482October-13 578,044 14,522,967 15,101,011November-13 577,602 14,319,659 14,897,261December-13 555,242 13,856,931 14,412,173January-14 534,304 13,473,884 14,008,188February-14 534,523 13,536,682 14,071,205March-14 521,065 13,490,951 14,012,016April-14 518,210 13,397,307 13,915,517May-14 496,137 13,237,563 13,733,700June-14 497,078 12,967,058 13,464,136July-14 500,884 12,749,459 13,250,343August-14 499,539 12,734,452 13,233,991September-14 493,073 12,825,363 13,318,436October-14 491,905 12,708,541 13,200,446November-14 483,224 12,320,122 12,803,346December-14 467,018 11,894,426 12,361,444January-15 430,135 11,038,685 11,468,820February-15 422,656 11,081,131 11,503,787March-15 420,674 11,223,480 11,644,154April-15 414,159 11,372,941 11,787,100May-15 405,074 11,637,717 12,042,791June-15 408,872 11,826,257 12,235,129
Source: Univeral Service Administration Company.
Table 2.6Total Monthly Lifeline Subscribers Since January 2012
28

State
Due to Non-Response or Customer
Reporting Ineligibility 1
Due to a Finding of Ineligibility by State Administrator, ETC Access to
Eligibility Data or USAC 2Total
Alabama 38 1 39
Alaska 13 1 14
American Samoa 0 1 1
Arizona 86 12 98
Arkansas 30 4 34
California 181 1,075 1,256
Colorado 29 0 29
Connecticut 26 0 26
Delaware 5 1 6
District of Columbia 9 1 10 Florida 142 92 235 Georgia 93 10 104 Guam 1 0 1 Hawaii 4 0 4 Idaho 6 10 16 Illinois 110 57 167 Indiana 56 4 60 Iowa 12 2 14 Kansas 20 2 22 Kentucky 55 14 69 Louisiana 60 7 67 Maine 11 0 11 Maryland 31 67 98 Massachusetts 72 29 101 Michigan 121 34 154 Minnesota 22 7 29 Mississippi 25 2 27 Missouri 47 1 48 Montana 3 1 3 Nebraska 1 7 8 Nevada 46 3 49 New Hampshire 3 0 3 New Jersey 64 36 100 New Mexico 22 1 23 New York 259 176 435 North Carolina 90 4 93 North Dakota 3 4 7 Northern Mariana Islands 1 0 1 Ohio 130 11 141 Oklahoma 91 21 112 Oregon 8 79 86 Pennsylvania 125 73 198 Puerto Rico 43 72 115 Rhode Island 16 9 24 South Carolina 74 7 81 South Dakota 1 1 2 Tennessee 68 13 81 Texas 77 274 352 Utah 9 9 18 Vermont 1 15 15 Virgin Islands 1 1 1 Virginia 40 3 42 Washington 33 74 107 West Virginia 15 5 20 Wisconsin 28 49 77 Wyoming 1 1 1 Total 2,555 2,379 4,934
Note: Zero indicates fewer than 500 de-enrollments.1 Column N of FCC Form 555.2 Column K of FCC Form 555.
Source: Universal Service Administrative Company.
Table 2.7Lifeline De-Enrollments or Scheduled to be De-Enrolled by State in 2014
(in Thousands)
29

State AllTotal Total Total
No Yes No Yes No Yes Alabama 139,989 68,313 217,185 113 17 130 140,102 68,329 217,314 Alaska 0 0 0 0 40,893 40,893 0 40,893 40,893 American Samoa 0 304 304 0 0 0 0 304 304 Arizona 237,169 100,239 337,408 12,154 42,414 56,857 249,323 142,653 394,265 Arkansas 103,502 25,636 133,486 0 28 28 103,502 25,664 133,513 California 246,265 982,592 1,233,891 0 278 278 246,265 982,869 1,234,168 Colorado 54,206 49,163 103,393 52 0 52 54,258 49,163 103,445 Connecticut 78,538 38,545 118,264 0 0 0 78,538 38,545 118,264 Delaware 21,806 11,202 33,007 0 0 0 21,806 11,202 33,007 District of Columbia 30,231 14,623 44,854 0 0 0 30,231 14,623 44,854 Florida 636,061 278,512 936,699 0 3 3 636,061 278,515 936,702 Georgia 436,105 82,324 533,438 0 0 0 436,105 82,324 533,438 Guam 0 1,826 1,833 0 0 0 0 1,826 1,833 Hawaii 14,628 3,711 18,338 8,143 176 8,319 22,770 3,887 26,657 Idaho 261 18,283 18,544 0 601 601 261 18,884 19,144 Illinois 551,753 49,728 614,091 0 0 0 551,753 49,728 614,091 Indiana 155,011 79,473 240,122 0 0 0 155,011 79,473 240,122 Iowa 29,429 31,635 61,114 0 0 0 29,429 31,635 61,114 Kansas 57,135 23,067 86,509 52 5 56 57,187 23,072 86,565 Kentucky 169,575 79,178 253,320 0 0 0 169,575 79,178 253,320 Louisiana 256,222 34,676 296,312 0 0 0 256,222 34,676 296,312 Maine 36,597 21,462 58,059 0 100 100 36,597 21,562 58,159 Maryland 185,683 49,058 234,745 0 0 0 185,683 49,058 234,745 Massachusetts 176,780 116,871 293,651 0 0 0 176,780 116,871 293,651 Michigan 556,126 90,956 662,197 105 214 352 556,231 91,170 662,549 Minnesota 49,108 45,961 95,068 3,949 518 4,467 53,056 46,479 99,535 Mississippi 98,919 35,261 143,495 0 4 4 98,919 35,265 143,499 Missouri 160,829 39,177 211,417 0 15 15 160,829 39,191 211,432 Montana 0 3,090 3,090 0 4,310 4,310 0 7,399 7,399 Nebraska 603 10,073 10,677 0 250 250 603 10,324 10,927 Nevada 136,228 33,876 172,989 1,079 671 1,784 137,307 34,548 174,773 New Hampshire 12,677 6,809 19,486 0 0 0 12,677 6,809 19,486 New Jersey 107,113 144,471 251,584 0 0 0 107,113 144,471 251,584 New Mexico 19,969 45,156 65,125 0 24,949 25,424 19,969 70,106 90,549 New York 544,537 573,999 1,118,537 0 7 7 544,537 574,006 1,118,543 North Carolina 198,452 179,774 385,443 0 387 387 198,452 180,160 385,829 North Dakota 205 5,374 5,751 2,731 2,114 4,845 2,936 7,488 10,596 Northern Mariana Isl. 0 2,172 2,172 0 0 0 0 2,172 2,172 Ohio 458,361 176,901 666,522 0 0 0 458,361 176,901 666,522 Oklahoma 132 179 1,467 243,844 87,313 341,272 243,975 87,492 342,739 Oregon 14,204 71,576 85,780 0 368 368 14,204 71,943 86,147 Pennsylvania 375,677 195,674 571,409 0 0 0 375,677 195,674 571,409 Puerto Rico 306,773 108,925 415,698 0 0 0 306,773 108,925 415,698 Rhode Island 36,005 21,549 57,554 0 0 0 36,005 21,549 57,554 South Carolina 227,100 69,350 306,088 202 71 273 227,302 69,421 306,361 South Dakota 564 3,964 4,528 0 1,402 1,402 564 5,366 5,930 Tennessee 221,813 140,424 371,856 0 0 0 221,813 140,424 371,856 Texas 366,612 352,854 720,089 0 3 3 366,612 352,857 720,092 Utah 25,671 18,867 44,538 0 956 1,002 25,671 19,823 45,539 Vermont 47 14,255 14,302 0 0 0 47 14,255 14,302 Virgin Islands 1 1,682 2,488 0 0 0 1 1,682 2,488 Virginia 106,354 89,751 196,135 0 0 0 106,354 89,751 196,135 Washington 68,495 123,183 191,678 4,036 3,314 7,350 72,531 126,497 199,028 West Virginia 60,647 15,949 76,623 0 0 0 60,647 15,949 76,623 Wisconsin 148,588 45,548 201,248 1,741 465 2,215 150,329 46,013 203,463 Wyoming 53 1,003 1,056 0 37 37 53 1,040 1,093 Total 7,918,803 4,828,203 12,944,651 278,200 211,880 503,080 8,197,004 5,040,084 13,447,731
Source: Universal Service Administrative Company.
Table 2.8
Non-Tribal Tribal
Non-facilities based carriers have either submitted a compliance plan with the FCC that they are not a facilities-based provider or have been approved to be a non-facilities-based provider by the FCC. Other carriers are assumed to be facilities-based.
Facilities-Based Facilities-Based Facilities-Based
Non-Facilities Based Low-Income Subscribers by State in 2014
30

Section 3 – Connect America Fund (High Cost)
Overview – Connect America Fund Program
The federal universal service Connect America Fund program (formerly High-Cost Support) is designed to ensure that consumers in rural, insular, and high-cost areas have access to modern communications networks capable of providing voice and broadband service, both fixed and mobile, at rates that are reasonably comparable to those in urban areas. The program fulfills this universal service goal by allowing eligible carriers who serve these areas to recover some of their costs from the federal Universal Service Fund (USF). As in the 2015 Report, all support dollar values in these tables are for claims1 as opposed to disbursements.2 Claim dollars are subject to true-ups. For example, claims for support in 2012 may be trued-up in 2014; such a true-up is reflected in the year supported (2012), not in the year the true-up was disbursed (2014). Additional information regarding the Connect America Fund program is available in the Appendix. Data on changes in local exchange carriers and High-Cost ILEC support data by study area are available at http://www.fcc.gov/encyclopedia/neca-usac-data-0. Please note that the information provided in this report is based upon the program rules through June 30, 2015.
1 A “claim” is the distribution of funds in support of a specified time period. These funds were distributed in that period and possibly a later time period. The disbursements in later time periods are the result of true-ups to resolve differences between initial payments and disbursements necessitated by revisions to supporting data made at that later date. Claims are positive values with the possible exceptions of CAF Intercarrier Compensation (CAF ICC) support and Connect America Cost Model (CACM) support. CAF ICC claims can be negative when a study area’s actual access recovery charge revenues in the prior two years substantially exceed the forecasted amount. Some CACM initial claims were negative as a result of true-ups when Frozen High Cost support exceeded CACM support. 2 A “disbursement” is the distribution of funds in a specified time period. These funds were distributed in support of high-cost mechanisms in that period and possibly in support of earlier time periods. The disbursements in support of earlier time periods are the result of true-ups to resolve differences between initial payments and disbursements necessitated by revisions to supporting data. It is possible for disbursements to be negative, thus requiring the recipient to return dollars to the high-cost fund. Some negative disbursements are penalties (see the file “HC Penalties” in the Supplementary Material). Penalties are not included in claims.
31

YearHigh-Cost
Loop Support
Safety Net Additive Support
Safety Valve
Support
High-Cost Model
Support
Interstate Common
Line Support
Interstate Access
Support
Local Switching Support
Frozen High-Cost
Support1
CAF Phase I Incremental
Support
CAF Intercarrier
Compensation Support
Mobility Fund Phase I Support
CAF Phase II Cost Model
Total Support
2009 $1,398 $51 $5 $329 $1,594 $566 $389 $0 $0 $0 $0 $0 $4,332
2010 1,320 77 7 311 1,631 549 383 0 0 0 0 0 4,278
2011 1,213 97 9 291 1,640 521 370 0 0 0 0 0 4,142
2012 824 49 6 0 881 0 121 1,926 114 213 0 0 4,134
2013 800 32 6 0 911 0 11 1,663 307 429 74 0 4,234
2014 778 29 5 0 923 0 12 1,560 17 425 4 0 3,752 2015* 743 21 5 0 926 0 12 1,531 0 412 14 248 3,911
1 Includes Phase I Frozen Support for price cap carriers and for competitive ETCs.
* Estimate for 2015 extrapolated from claims through June 2015. Claims for CAF Phase I Incremental Support and Mobility Fund Phase I Support were not extrapolated.
Source: Universal Service Administrative Company.
Table 3.1High-Cost Support Fund Claim History
(in Millions of Dollars)
Notes: Detail may not appear to add to totals due to rounding.
The 2012-2015 High Cost Loop, Interstate Common Line, Local Switching, and Safety Net Additive support includes CETC support that was frozen on a per-line basis in the USF/ICC Transformation Order. Further details are provided in Table 3.2.
32

Year Companies High-Cost Loop
Support
Safety Net Additive Support
Safety Valve Support
High-Cost Model
Support
Interstate Common
Line Support
Interstate Access
Support
Local Switching Support
Frozen High-Cost
Support
CAF Phase I Incremental
Support
CAF Intercarrier
Compensation Support
Mobility Fund Phase I Support
CAF Phase II Cost Model
Total Support
ILEC $1,007.3 $37.7 $4.9 $169.3 $1,069.4 $456.1 $288.4 $0.0 $0.0 $0.0 $0.0 $0.0 $3,033.0
2009 CETC 390.6 13.6 0.5 159.4 524.2 109.9 100.3 0.0 0.0 0.0 0.0 0.0 1,298.5
Total 1,397.9 51.4 5.3 328.6 1,593.6 565.9 388.7 0.0 0.0 0.0 0.0 0.0 4,331.5
ILEC 961.9 60.0 5.7 155.7 1,110.1 455.2 287.3 0.0 0.0 0.0 0.0 0.0 3,035.9
2010 CETC 358.2 17.1 1.2 155.0 521.1 94.2 95.4 0.0 0.0 0.0 0.0 0.0 1,242.1
Total 1,320.1 77.1 6.9 310.7 1,631.2 549.3 382.7 0.0 0.0 0.0 0.0 0.0 4,278.0
ILEC 905.8 76.2 6.5 144.6 1,131.4 440.7 280.5 0.0 0.0 0.0 0.0 0.0 2,985.8
2011 CETC 307.4 21.0 2.5 146.4 508.3 80.5 89.7 0.0 0.0 0.0 0.0 0.0 1,155.7
Total 1,213.2 97.2 8.9 291.0 1,639.8 521.2 370.2 0.0 0.0 0.0 0.0 0.0 4,141.5
ILEC 791.6 48.4 6.3 0.0 845.8 0.0 109.9 1,037.5 114.3 212.6 0.0 0.0 3,166.4
2012 CETC 32.1 0.5 0.0 0.0 34.7 0.0 11.1 888.9 0.0 0.0 0.0 0.0 967.4
Total 823.8 48.9 6.3 0.0 880.6 0.0 121.0 1,926.4 114.3 212.6 0.0 0.0 4,133.8
ILEC 767.3 31.4 6.1 0.0 876.8 0.0 0.0 1,033.8 307.2 429.0 0.0 0.0 3,451.6
2013 CETC 32.8 0.5 0.0 0.0 34.1 0.0 11.3 629.2 0.0 0.0 74.1 0.0 782.0
Total 800.0 31.9 6.1 0.0 910.9 0.0 11.3 1,663.0 307.2 429.0 74.1 0.0 4,233.7
ILEC 745.4 28.2 5.5 0.0 888.9 0.0 0.0 1,034.8 16.7 425.1 0.0 0.0 3,144.6
2014 CETC 32.4 0.5 0.0 0.0 34.0 0.0 11.7 525.4 0.0 0.0 3.6 0.0 607.5
Total 777.8 28.7 5.5 0.0 922.9 0.0 11.7 1,560.2 16.7 425.1 3.6 0.0 3,752.1
ILEC 711.0 20.4 4.8 0.0 891.7 0.0 0.0 1,014.5 0.0 412.1 0.0 247.9 3,302.5
2015* CETC 31.5 0.5 0.0 0.0 34.1 0.0 12.1 516.9 0.0 0.0 13.8 0.0 608.9Total 742.5 20.9 4.8 0.0 925.8 0.0 12.1 1,531.4 0.0 412.1 13.8 247.9 3,911.3
Notes: Details may not appear to add to totals due to rounding. ILECs are incumbent local exchange carriers.
CETCs are competitive eligible telecommunications carriers.
* Estimate for 2015 extrapolated from claims through June 2015. Claims for CAF Phase I Incremental Support and Mobility Fund Phase I Support were not extrapolated.
Source: Universal Service Administrative Company.
(in Millions of Dollars)
Table 3.2High-Cost Support Fund Claim History - ILECs and CETCs
The 2012-2015 CETC High Cost Loop, Interstate Common Line, Local Switching, and Safety Net Additive support is for 11 study areas in Alaska and one in North Dakota. In 2011, the Commission decided that carriers in these areas would have their support per line frozen. Consequently, the sum of CETC support for these mechanisms in each of the years 2012-2015 represents their per-line frozen high-cost support. Details on support for these areas may be found in the Supplementary Material file “High Cost Claims – by Study Area”.
33

Year Companies High-Cost Loop
Support
Safety Net Additive Support
Safety Valve Support
High-Cost Model
Support
Interstate Common
Line Support
Interstate Access
Support
Local Switching Support
Frozen High-Cost
Support
CAF Phase I Incremental
Support
CAF Intercarrier
Compensation Support
Mobility Fund Phase I Support
CAF Phase II Cost Model
Total Support
Price Cap $209.1 $8.4 $0.2 $169.3 $292.8 $456.1 $48.1 $0.0 $0.0 $0.0 $0.0 $0.0 $1,184.0
2009 Rate of Return 798.2 29.3 4.7 0.0 776.6 0.0 240.2 0.0 0.0 0.0 0.0 0.0 1,849.1
Total 1,007.3 37.7 4.9 169.3 1,069.4 456.1 288.4 0.0 0.0 0.0 0.0 0.0 3,033.0
Price Cap 145.1 10.0 0.0 155.7 283.0 455.2 59.5 0.0 0.0 0.0 0.0 0.0 1,108.4
2010 Rate of Return 816.8 50.0 5.7 0.0 827.1 0.0 227.8 0.0 0.0 0.0 0.0 0.0 1,927.4
Total 961.9 60.0 5.7 155.7 1,110.1 455.2 287.3 0.0 0.0 0.0 0.0 0.0 3,035.9
Price Cap 99.8 10.7 0.0 144.6 272.6 440.7 60.8 0.0 0.0 0.0 0.0 0.0 1,029.2
2011 Rate of Return 806.0 65.5 6.5 0.0 858.9 0.0 219.7 0.0 0.0 0.0 0.0 0.0 1,956.6
Total 905.8 76.2 6.5 144.6 1,131.4 440.7 280.5 0.0 0.0 0.0 0.0 0.0 2,985.8
Price Cap 0.0 0.0 0.0 0.0 3.0 0.0 0.0 1,037.5 114.3 44.2 0.0 0.0 1,199.0
2012 Rate of Return 791.6 48.4 6.3 0.0 842.9 0.0 109.9 0.0 0.0 168.4 0.0 0.0 1,967.4
Total 791.6 48.4 6.3 0.0 845.8 0.0 109.9 1,037.5 114.3 212.6 0.0 0.0 3,166.4
Price Cap 0.0 0.0 0.0 0.0 0.0 0.0 0.0 1,033.8 307.2 86.2 0.0 0.0 1,427.3
2013 Rate of Return 767.3 31.4 6.1 0.0 876.8 0.0 0.0 0.0 0.0 342.8 0.0 0.0 2,024.3
Total 767.3 31.4 6.1 0.0 876.8 0.0 0.0 1,033.8 307.2 429.0 0.0 0.0 3,451.6
Price Cap 0.0 0.0 0.0 0.0 0.0 0.0 0.0 1,034.8 16.7 68.1 0.0 0.0 1,119.6
2014 Rate of Return 745.4 28.2 5.5 0.0 888.9 0.0 0.0 0.0 0.0 356.9 0.0 0.0 2,024.9
Total 745.4 28.2 5.5 0.0 888.9 0.0 0.0 1,034.8 16.7 425.1 0.0 0.0 3,144.6
Price Cap 0.0 0.0 0.0 0.0 0.0 0.0 0.0 1,014.5 0.0 50.6 0.0 247.9 1,313.1
2015* Rate of Return 711.0 20.4 4.8 0.0 891.7 0.0 0.0 0.0 0.0 361.5 0.0 0.0 1,989.4
Total 711.0 20.4 4.8 0.0 891.7 0.0 0.0 1,014.5 0.0 412.1 0.0 247.9 3,302.5
Notes: Details may not appear to add to totals due to rounding. ILECs are incumbent local exchange carriers.
* Estimate for 2015 extrapolated from claims through June 2015. Claims for CAF Phase I Incremental Support and Mobility Fund Phase I Support were not extrapolated.
Source: Universal Service Administrative Company.
Table 3.3High-Cost Support Fund Claim History - Price Cap and Rate of Return ILECs
(in Millions of Dollars)
Price cap carriers include their rate of return affiliates. The designation of price cap versus rate of return carriers for 2009-2012 is based on their regulatory status in 2012.
34

State
High-Cost Loop
Support
Safety Net Additive Support
Safety Valve
Support
High-Cost Model
Support
Interstate Common
Line Support
Interstate Access
Support
Local Switching Support
Frozen High-Cost Support
CAF Phase I Incremental
Support
CAF Intercarrier
Compensation Support
Mobility Fund
Phase I Support
Total Support
Alabama $9,461 $550 $0 $0 $14,289 $0 $0 $50,416 $5,454 $12,055 $0 $92,225
Alaska*56,968 553 0 0 59,065 0 11,683 47,041 0 9,146 814 185,270
American Samoa 0 0 0 0 953 0 0 1,619 0 244 0 2,817
Arizona 22,982 384 0 0 14,802 0 0 20,668 0 6,173 1,036 66,046
Arkansas 16,258 429 0 0 14,347 0 0 41,799 826 10,959 0 84,617
California 24,663 165 0 0 21,282 0 0 43,016 0 2,814 0 91,941
Colorado 12,460 307 0 0 8,736 0 0 44,454 0 2,050 0 68,007
Connecticut 0 0 0 0 0 0 0 464 0 0 0 464
Delaware 0 0 0 0 0 0 0 228 0 0 0 228
District of Columbia 0 0 0 0 0 0 0 0 0 0 0 0
Florida 1,556 94 0 0 3,955 0 0 47,805 208 9,699 0 63,319
Georgia 19,473 2,061 0 0 29,459 0 0 35,712 2,563 18,106 0 107,374
Guam 0 0 0 0 5,183 0 0 5,405 0 85 0 10,673
Hawaii 7,019 61 0 0 4,064 0 0 7,132 0 5,233 0 23,509
Idaho 10,179 0 0 0 9,368 0 0 18,363 0 5,100 0 43,009
Illinois 15,076 829 0 0 19,328 0 0 27,204 0 9,455 0 71,893
Indiana 29,962 1,945 0 0 27,577 0 0 15,981 0 4,967 0 80,432
Iowa 27,887 3,538 133 0 40,596 0 0 38,848 528 17,503 0 129,033
Kansas 64,430 873 5,220 0 43,987 0 0 28,812 0 7,082 0 150,404
Kentucky 19,108 178 0 0 27,151 0 0 42,416 871 31,174 0 120,897
Louisiana 13,345 32 0 0 13,225 0 0 55,117 0 2,087 0 83,807
Maine 978 44 0 0 5,919 0 0 14,499 0 2,341 0 23,781
Maryland 0 0 0 0 968 0 0 2,303 0 302 0 3,573
Massachusetts 0 0 0 0 216 0 0 1,467 0 529 0 2,212
Michigan 4,486 264 0 0 10,737 0 0 13,204 0 4,453 0 33,144
Minnesota 25,005 2,441 0 0 43,745 0 0 14,740 0 18,311 0 104,242
Mississippi 5,746 33 0 0 6,719 0 0 170,677 288 6,095 0 189,559
Missouri 25,685 296 0 0 24,217 0 0 36,771 376 14,148 0 101,493
Montana 32,579 535 0 0 30,128 0 0 20,966 0 5,868 1,005 91,082
Nebraska 20,839 936 0 0 21,079 0 0 20,340 133 11,193 0 74,520
Nevada 3,978 648 0 0 5,031 0 0 11,477 0 2,287 0 23,420
New Hampshire 46 372 0 0 4,782 0 0 1,554 0 2,414 0 9,168
New Jersey 0 0 0 0 358 0 0 258 0 326 0 943
New Mexico 30,322 513 0 0 18,567 0 0 17,166 180 4,834 697 72,278
New York 1,614 0 0 0 10,317 0 0 22,591 377 6,445 0 41,345
North Carolina 4,340 728 0 0 22,479 0 0 36,596 1,446 19,721 0 85,310
North Dakota*23,759 1,350 100 0 33,507 0 8 26,112 0 10,237 0 95,074
Northern Mariana Islands 0 0 0 0 0 0 0 1,265 0 0 0 1,265
Ohio 4,878 104 0 0 10,283 0 0 12,664 278 12,604 0 40,810
Oklahoma 36,303 65 0 0 37,147 0 0 39,142 258 16,443 0 129,358
Oregon 15,473 432 0 0 16,080 0 0 30,995 0 9,035 0 72,014
Pennsylvania 276 45 0 0 7,002 0 0 55,106 795 14,250 0 77,474
Puerto Rico 0 0 0 0 0 0 0 115,237 0 0 0 115,237
Rhode Island 0 0 0 0 0 0 0 30 0 0 0 30
South Carolina 22,554 1,254 0 0 45,064 0 0 13,189 238 19,614 0 101,914
South Dakota 30,460 1,243 0 10 30,261 0 0 2,840 0 10,874 0 75,687
Tennessee 8,836 681 0 0 32,224 0 0 15,457 0 11,109 0 68,307
Texas 81,187 2,539 0 0 60,735 0 0 66,467 1,896 12,806 0 225,631
Utah 4,904 81 0 0 12,389 0 0 3,007 0 3,788 8 24,178
Vermont 505 26 0 0 5,722 0 0 8,597 0 4,666 0 19,514
Virgin Islands 0 0 0 0 0 0 0 16,428 0 0 0 16,428
Virginia 1,017 0 0 0 9,520 0 0 48,911 0 20,378 0 79,827
Washington 5,718 60 0 0 8,861 0 0 47,983 0 6,471 0 69,094
West Virginia 1,406 81 0 0 3,263 0 0 37,393 0 2,083 0 44,226
Wisconsin 24,318 1,872 0 0 38,158 0 0 43,554 0 13,998 0 121,900
Wyoming 9,758 94 0 0 10,019 0 0 18,720 0 3,517 0 42,108Total $777,798 $28,735 $5,453 $10 $922,867 $0 $11,691 $1,560,209 $16,714 $425,071 $3,561 $3,752,109
Source: Universal Service Administrative Company.
Table 3.4
(in Thousands of Dollars)High-Cost Support Fund Claims - by Mechanism and State: 2014
* The High Cost Loop, Interstate Common Line, Local Switching, and Safety Net Additive support for Alaska and North Dakota includes CETC support that was frozen on a per-line basis in the USF/ICC Transformation Order. Further details are provided in Table 3.2.
35

Rank Affiliate Name 1 2012 2013 2014 Total
CETC Share of
3 -Year Total 2
1 AT&T Inc. $429,750,354 $465,890,920 $347,000,821 $1,242,642,095 49.7 %
2 CenturyLink, Inc.4 392,344,920 399,214,150 347,934,216 1,139,493,286 0.0 3 Frontier Communications Corporation 235,408,860 230,598,032 162,232,614 628,239,506 0.0 4 Telephone and Data Systems, Inc. 232,123,590 212,869,300 181,971,058 626,963,948 57.7 5 Windstream Corporation 125,833,740 229,806,000 163,623,251 519,262,991 0.1
6 Verizon Communications Inc.3 213,197,783 140,517,106 133,800,516 487,515,405 31.1 7 América Móvil 76,588,848 99,151,420 63,077,184 238,817,452 41.5
8 Telapex, Inc.5 77,018,166 61,452,402 51,986,717 190,457,285 89.6 9 General Communication, Inc. 53,341,587 52,913,193 54,426,593 160,681,373 89.7 10 FairPoint Communications, Inc. 42,868,956 45,928,644 43,799,514 132,597,114 0.0 11 Alaska Communications Systems Holdings, Inc. 45,738,405 40,681,063 38,934,798 125,354,266 49.4 12 Rural Telephone Service/Golden Belt 44,342,070 38,221,761 31,652,563 114,216,394 36.3 13 Consolidated Communications, Inc. 37,560,303 36,677,742 39,587,297 113,825,342 0.0 14 Deutsche Telekom AG 33,114,348 34,902,469 21,473,088 89,489,905 100.0 15 Smithville Holding Company, Inc. 27,492,681 24,809,850 24,768,793 77,071,324 0.0
5 Telapex, Inc. owns C Spire Wireless.
Source: Universal Service Administrative Company.
3 Verizon Wireless and Sprint Nextel, in separate transactions in 2008, each committed to phase down their CETC high-cost universal service support in 20 percent increments over five years, beginning in 2009. These commitments were not implemented until the Commission released an Order on August 31, 2010 providing guidance to the Universal Service Administrative Company regarding the methodology to achieve those commitments. High-Cost Universal Service Support, Federal-State Joint Board on Universal Service, Request for Review of Decision of Universal Service Administrator by Corr Wireless Communications, LLC, WC Docket No. 05-337, CC Docket No. 96-45, Order and Notice of Proposed Rulemaking, 25 FCC Rcd 12854 (2010). To the extent that Verizon Wireless received support prior to the August 31, 2010 Order that should have been surrendered under its commitment, USAC reclaimed that support in 2010 and 2011. 4 CenturyLink merged with Qwest on April 1, 2011. See http://news.centurylink.com/index.php?s=43&item=2226.A12.
Table 3.5Annual High-Cost Claims by Year-End 2014 Affiliate Structure: 2012-2014
1 These responses refer to “affiliate name” rather than “holding company” so as to include all entities under common ownership or control, to the extent this information is readily available to the Commission. In most cases, the “affiliate name” is reported by the entity or entities in FCC Form 477. Carriers appear on this list if they are in the top 10 for any of the presented years.2 In the USF/ICC Transformation Order , the Commission eliminated the rule providing identical support to competitive ETCs, determining the rule did not provide an "appropriate level of support for the efficient deployment of mobile services in areas that do not support a private business case for mobile voice and broadband." Connect America Fund et al. , WC Docket No. 10-90 et al., Report and Order and Further Notice of Proposed Rulemaking, 26 FCC Rcd 17666, 17851-59, para. 502 (2011 aff’d In re: FCC 11-161 , 753 F.3d 1015 (10th Cir. 2014). The Commission, however, transitioned the elimination of that support over five years, beginning on July 1, 2012. See USF/ICC Transformation Order, 26 FCC Rcd at 17853, para. 513. This phase down of support for competitive ETCs was halted at 40 percent on June 30, 2014 under the terms adopted in the USF/ICC Transformation Order because the Mobility Fund Phase II is not operational. See id. at 17832, para. 519.
36

Rank Affiliate Name 1
High-Cost Loop
Support
Safety Net Additive Support
Safety Valve
Support
High-Cost Model
Support
Interstate Common Line
Support
Interstate Access
Support
Local Switching Support
CAF Intercarrier
Compensation Support
CAF Phase I Frozen Support
CAF Phase I Incremental
Support 2
CETC Frozen High-
Cost Support
Mobility Fund Phase I Support
Total Support
CETC Share of
Total
Support 3
1 CenturyLink, Inc. $0 $0 $0 $0 $0 $0 $0 $2,577 $345,357 $0 $0 $0 $347,934 0.0 %
2 AT&T Inc. 0 0 0 0 0 0 0 0 175,781 5,248 165,972 0 347,001 47.8
3 Telephone and Data Systems, Inc. 4,839 1,264 0 0 51,007 0 0 29,379 0 0 95,483 0 181,971 52.5
4 Windstream Corporation 0 0 0 0 0 0 0 51,909 100,163 11,466 85 0 163,623 0.1
5 Frontier Communications Corporation 0 0 0 0 0 0 0 6,605 155,627 0 0 0 162,233 0.0
6 Verizon Communications Inc. 0 0 0 0 0 0 0 0 111,894 0 21,907 0 133,801 16.4
7 América Móvil 0 0 0 0 0 0 0 0 36,054 0 27,023 0 63,077 42.8
8 General Communication, Inc. 15,272 199 0 0 21,159 0 7,406 2,324 0 0 7,304 763 54,427 88.1
9 Telapex, Inc. 2,064 0 0 0 2,304 0 0 1,713 0 0 45,906 0 51,987 88.3
10 FairPoint Communications, Inc. 0 0 0 0 0 0 0 4,533 39,267 0 0 0 43,800 0.0
11 Consolidated Communications, Inc. 135 0 0 0 2,470 0 0 5,809 31,173 0 0 0 39,587 0.0
12 Alaska Communications Systems Holdings, Inc. 6,443 98 0 0 7,579 0 1,142 0 19,690 0 3,983 0 38,935 49.4
13 Rural Telephone Service/Golden Belt 10,058 0 2,582 0 6,649 0 0 1,068 0 0 11,295 0 31,653 35.7
14 Smithville Holding Company, Inc. 13,425 1,474 0 0 9,049 0 0 821 0 0 0 0 24,769 0.0
15 Triangle Telephone Cooperative Assn., Inc. 12,459 425 0 0 8,963 0 0 959 0 0 0 217 23,022 0.9
16 Golden West Telecommunications Cooperative, Inc. 10,485 154 0 0 9,902 0 0 1,895 0 0 0 0 22,436 0.0
17 Valley Telephone Cooperative, Inc. 13,253 172 0 0 7,369 0 0 1,253 0 0 28 0 22,075 0.1
18 Deutsche Telekom AG 0 0 0 0 0 0 0 0 0 0 21,473 0 21,473 100.0
19 Copper Valley Telephone Cooperative 13,368 116 0 0 5,678 0 577 386 0 0 0 51 20,175 42.9
20 Comporium, Inc. 3,345 428 0 0 11,582 0 0 4,335 0 0 0 0 19,690 0.0
21 Nemont Telephone Cooperative, Inc. 7,223 0 0 0 7,075 0 0 1,234 0 0 4,114 0 19,646 20.9
22 Farmers Telephone Cooperative, Inc. (SC) 6,643 0 0 0 7,782 0 0 3,626 0 0 1,579 0 19,631 8.0
23 Lumos Networks Corp. 58 0 0 0 2,778 0 0 15,355 0 0 740 0 18,931 3.9
24 Tri County Telephone Association, Inc. 11,915 141 0 0 5,797 0 0 515 0 0 0 0 18,368 0.0
25 Hargray Communications Group, Inc. 5,519 0 0 0 8,563 0 0 3,936 0 0 0 0 18,018 0.0
Note: Detail may not appear to add to totals due to rounding.
Source: Universal Service Administrative Company.
1 These responses refer to “affiliate name” rather than “holding company” so as to include all entities under common ownership or control, to the extent this information is readily available to the Commission. In most cases, the “affiliate name” is reported by the entity or entities in FCC Form 477.2 Phase I incremental support provides a one-time injection of funding to spur the deployment of broadband-capable networks to areas that currently lack broadband service. The Phase I incremental support amounts are subject to recovery to the extent carriers do not deploy consistent with Phase I rules.3 In the USF/ICC Transformation Order , the Commission eliminated the rule providing identical support to competitive ETCs, determining the rule did not provide an "appropriate level of support for the efficient deployment of mobile services in areas that do not support a private business case for mobile voice and broadband." Connect America Fund et al. , WC Docket No. 10-90 et al., Report and Order and Further Notice of Proposed Rulemaking, 26 FCC Rcd 17666, 17851-59, para. 502 (2011 aff’d In re: FCC 11-161 , 753 F.3d 1015 (10th Cir. 2014). The Commission, however, transitioned the elimination of that support over five years, beginning on July 1, 2012. See USF/ICC Transformation Order, 26 FCC Rcd at 17853, para. 513. This phase down of support for competitive ETCs was halted at 40 percent on June 30, 2014 under the terms adopted in the USF/ICC Transformation Order because the Mobility Fund Phase II is not operational. See id. at 17832, para. 519.
Table 3.6High-Cost Support Fund Claims by Affiliate: 2014 (in Thousands of Dollars)
(in Thousands of Dollars)
37

Section 4 – E-rate (Schools and Libraries)
Overview – Schools and Libraries Program
The Schools and Libraries universal service support program, commonly known as the E-rate program, helps schools and libraries obtain affordable broadband Internet access, internal network connections, and telecommunications services. Eligible schools, school districts and libraries may apply individually or as part of a consortium. Funding may be requested under two categories of service: category one services to a school or library (telecommunications, telecommunications services and Internet access), and category two services that deliver Internet access within schools and libraries (internal connections, basic maintenance of internal connections, and managed internal broadband services). Discounts for support depend on the level of poverty and whether the school or library is located in an urban or rural area. The discounts range from 20 percent to 90 percent of the costs of eligible services. E-rate program funding is based on demand up to an annual Commission-established cap of about $3.9 billion. The E-rate program is administered by the Universal Service Administrative Company (USAC) under the direction of the FCC. Specifically, USAC is responsible for processing the applications for support, confirming eligibility, and reimbursing service providers and eligible schools and libraries for the discounted services. USAC also ensures that the applicants and service providers comply with the E-rate rules and procedures established by the Commission. Additional information about the Schools and Library program can be found on the Commission’s website at http://www.fcc.gov/encyclopedia/e-rate-schools-libraries-usf-program and on USAC’s website at http://www.usac.org/sl/.
38

Schools and Libraries Funding Commitments and Disbursements by Applicant Type and Year
(in Thousands of Dollars)
Total School Statewide Other Total School Statewide Other
Year Commitments Libraries Schools Districts Contract 1 Consortia Disbursements Libraries Schools Districts Contract 1 Consortia
1998 $1,699,125 $65,988 $110,701 $1,288,421 $0 $234,015 $1,399,070 $49,870 $83,343 $1,069,762 $0 $196,094 1999 2,147,891 66,172 180,632 1,598,385 0 302,701 1,650,144 47,457 140,255 1,265,909 0 196,523 2000 2,078,777 65,879 110,857 1,692,230 0 209,810 1,647,025 43,566 88,518 1,384,119 0 130,821 2001 2,176,523 57,824 164,598 1,739,612 0 214,490 1,695,761 41,940 117,489 1,400,665 0 135,668 2002 2,201,025 62,941 167,229 1,720,920 0 249,935 1,598,207 42,697 106,200 1,286,711 0 162,599 2003 2,638,690 63,310 200,601 2,112,878 0 261,902 1,940,232 44,325 136,108 1,587,322 0 172,477 2004 2,194,507 54,303 158,786 1,726,470 0 254,947 1,536,420 39,723 107,113 1,210,052 0 179,532 2005 2,134,442 54,434 153,425 1,711,601 0 214,983 1,625,594 48,598 111,162 1,287,868 0 177,965 2006 1,977,796 59,710 129,414 1,528,008 0 260,664 1,568,811 46,138 96,378 1,222,707 0 203,587 2007 2,439,576 60,627 174,816 1,960,810 0 243,324 1,955,527 47,964 135,913 1,563,382 0 208,267 2008 2,564,643 75,770 148,916 2,080,566 0 259,391 1,912,798 58,118 113,557 1,519,684 0 221,439 2009 2,879,798 84,709 193,604 2,331,475 0 270,010 2,293,002 68,630 151,455 1,846,422 0 226,496 2010 3,110,937 91,103 211,101 2,519,367 0 289,367 2,409,029 71,574 156,499 1,940,810 0 240,147 2011 2,671,438 95,075 216,029 2,040,038 0 320,296 2,096,577 73,394 159,544 1,614,943 0 248,695 2012 2,888,829 96,271 279,030 2,212,404 6,467 294,657 2,181,817 77,205 197,797 1,665,924 4,018 236,873 2013 2,163,417 91,124 133,922 1,639,412 14,007 284,952 1,677,572 74,609 93,502 1,279,550 5,945 223,966 2014 2,230,494 92,368 154,373 1,698,696 26,966 258,090 862,033 39,983 63,594 678,190 2,657 77,609
1 Starting January 2011, applicants could designate their consortium as a statewide entity if the application encompassed all public schools, private schools and/or all public libraries in the state. See http://hraunfoss.fcc.gov/edocs_public/attachmatch/DA-10-2218A1.pdf
Table 4.1
Note: Activity through June 30, 2015. Funding Year 2015 commitment and disbursement information have not been displayed because only a small fraction of commitments (and no disbursements) have been made for that funding year. A substantial amount of commitments and disbursements for funding year 2015 will be made. Also, because of the appeals process, funding commitments and disbursements can be made after the end of the program year. Disbursements may also continue beyond the end of the program year in the event of delayed internal connections installation. Other adjustments and corrections may also be made.
Source: Raw data provided by the Universal Service Administrative Company, rollups performed by Industry Analysis and Technology Division, Wireline Competition Bureau, FCC.
Funding Commitments Funding Disbursements
39

Table 4.2 Schools and Libraries Funding Commitments and Disbursements from Program Inception through June 30, 2015
by State and Applicant Type
Library/Library Consortium Schools School Districts Statewide Contracts Other Consortium Totals
Funds Funds Funds Funds Funds Funds Funds Funds Funds Funds Funds FundsState/Territory Committed Disbursed Committed Disbursed Committed Disbursed Committed Disbursed Committed Disbursed Committed Disbursed
Alabama $13,385 $10,648 $19,747 $14,542 $555,807 $460,430 $86 $1 $87,175 $66,256 $676,200 $551,877Alaska 9,574 6,414 3,995 3,002 447,815 369,658 0 0 13,759 9,946 475,143 389,019 American Samoa 0 0 0 0 0 0 0 0 36,744 29,851 36,744 29,851 Arizona 17,568 20,002 141,549 94,147 835,890 617,290 0 0 25,750 15,864 1,020,756 747,302 Arkansas 4,967 3,811 7,367 5,937 229,736 166,657 8,898 1,732 148,697 94,025 399,663 272,162 California 97,314 63,198 264,918 182,204 5,380,435 3,924,197 106 46 201,967 137,782 5,944,739 4,307,428 Colorado 12,971 9,063 19,829 14,347 327,918 253,067 0 0 21,554 15,128 382,272 291,606 Connecticut 4,990 3,543 47,509 33,628 257,396 204,078 0 0 110,524 91,902 420,419 333,151 Delaware 1,380 1,180 3,139 2,071 14,419 11,875 39 0 16,297 11,688 35,274 26,815 District of Columbia 7,106 4,324 25,466 15,921 164,835 107,390 0 0 17,916 8,589 215,322 136,223 Florida 55,040 40,406 151,810 113,962 1,040,030 829,511 0 0 98,403 81,128 1,345,283 1,065,006 Georgia 82,394 68,797 37,088 29,772 1,034,059 821,083 0 0 183,222 152,582 1,336,763 1,072,233 Guam 118 13 246 128 27,020 19,229 0 0 0 0 27,384 19,371 Hawaii 2,724 1,498 57,516 27,227 26,965 14,158 457 311 920 446 88,582 43,639 Idaho 4,096 3,121 7,231 4,689 88,158 66,331 0 0 23,193 13,811 122,678 87,952 Illinois 39,062 27,493 138,099 103,403 1,506,410 1,135,762 0 0 72,950 52,047 1,756,520 1,318,705 Indiana 50,369 35,537 35,559 24,580 419,742 308,400 0 0 93,859 42,079 599,529 410,596 Iowa 4,513 2,916 14,196 9,973 138,696 98,455 0 0 68,272 57,349 225,677 168,693 Kansas 11,279 8,246 9,837 6,924 243,871 186,845 0 0 23,842 19,169 288,829 221,183 Kentucky 14,940 10,655 6,166 3,725 523,005 373,249 0 0 105,062 75,565 649,173 463,194 Louisiana 59,535 48,472 51,671 36,917 691,970 559,525 0 0 32,275 23,951 835,451 668,866 Maine 1,494 1,038 15,475 11,254 58,690 40,238 0 0 56,760 45,934 132,419 98,464 Maryland 17,413 12,598 26,809 17,728 301,431 230,779 0 0 31,457 22,908 377,110 284,014 Massachusetts 42,073 28,932 56,588 40,688 413,869 322,288 11 0 49,186 25,146 561,727 417,054 Michigan 32,364 23,088 53,363 35,352 789,941 589,689 0 0 119,518 90,222 995,186 738,352 Minnesota 24,100 17,151 37,265 25,323 273,222 203,119 0 0 117,528 99,527 452,115 345,121 Mississippi 29,775 21,071 19,818 13,942 438,098 329,701 50 38 102,622 74,802 590,362 439,555 Missouri 19,581 15,559 44,407 32,000 464,657 362,184 0 0 163,611 117,942 692,256 527,684 Montana 1,579 1,085 4,635 3,445 70,982 56,621 0 0 593 431 77,789 61,582 Nebraska 4,155 3,127 7,454 5,769 111,619 92,701 0 0 30,802 27,952 154,030 129,549 Nevada 4,044 2,512 5,765 4,056 105,774 69,916 0 0 0 0 115,583 76,484 New Hampshire 385 211 7,220 4,997 34,180 23,674 0 0 1,269 919 43,055 29,802 New Jersey 26,855 17,916 128,973 91,903 832,424 594,735 0 0 15,282 10,478 1,003,534 715,032 New Mexico 5,773 3,516 78,201 52,298 488,054 367,162 0 0 84,577 31,929 656,604 454,906 New York 188,603 130,159 539,586 393,616 3,224,161 1,967,111 0 0 528,162 384,477 4,480,511 2,875,363 North Carolina 28,643 22,812 42,333 32,781 894,931 699,612 23,568 0 49,436 38,634 1,038,912 793,838 North Dakota 194 144 9,595 7,265 23,074 17,432 0 0 37,191 31,984 70,052 56,825 Northern Mariana Isl. 172 86 160 136 16,149 13,513 0 0 0 0 16,481 13,734 Ohio 47,524 38,002 125,117 89,235 1,057,507 788,104 0 0 83,377 66,884 1,313,525 982,226 Oklahoma 32,520 24,919 46,711 32,685 790,187 613,059 0 0 13,652 4,917 883,070 675,581 Oregon 5,490 3,264 11,465 8,152 200,081 159,961 0 0 37,574 22,584 254,610 193,962 Pennsylvania 42,392 34,108 157,746 104,751 970,030 788,783 0 0 130,888 111,996 1,301,056 1,039,638 Puerto Rico 63,203 34,194 84,852 55,293 154,090 120,773 0 0 113,484 56,653 415,629 266,913 Rhode Island 2,027 1,645 7,791 5,647 69,694 53,806 8 8 42,405 37,410 121,925 98,516 South Carolina 5,779 4,060 25,049 16,302 483,256 360,468 0 0 261,703 199,909 775,787 580,739 South Dakota 374 179 19,934 14,652 38,991 28,756 2,745 0 33,260 22,604 95,303 66,191 Tennessee 17,160 12,041 15,971 12,654 649,804 487,219 0 0 218,775 178,467 901,710 690,380 Texas 54,342 35,104 177,163 131,567 3,629,965 2,782,573 0 0 171,442 116,696 4,032,912 3,065,940 Utah 2,294 1,048 4,089 2,207 89,844 69,725 0 0 212,441 117,547 308,667 190,527 Vermont 1,059 618 13,030 8,113 24,629 17,134 0 0 1,671 1,190 40,388 27,055 Virgin Islands 255 107 13,724 10,345 10,665 9,412 0 0 59,985 53,687 84,629 73,551 Virginia 29,092 22,321 24,938 19,681 491,616 393,344 0 0 13,331 11,494 558,977 446,841 Washington 26,167 19,569 18,597 14,513 365,642 279,659 78 78 79,335 59,197 489,820 373,017 West Virginia 4,001 3,035 3,660 2,080 167,012 116,092 19,735 8,814 49,499 35,276 243,906 165,297 Wisconsin 14,967 10,800 40,440 27,823 312,287 230,413 0 0 155,903 115,993 523,597 385,029 Wyoming 654 437 4,329 3,076 24,325 17,075 3,432 1,591 29,409 23,809 62,149 45,988 Totals $1,269,826 $915,792 $2,915,188 $2,058,427 $32,025,054 $23,824,020 $59,212 $12,620 $4,478,506 $3,238,760 $40,747,786 $30,049,619
Source: Raw data provided by the Universal Service Administrative Company, rollups performed by Industry Analysis and Technology Division, Wireline Competition Bureau, FCC.
Note: Activity through June 30, 2015. Unlike in Table 4.1, all commitments and disbursements have been included, including those in funding year 2015. Because of the appeals process, funding commitments and disbursements can be made after the end of the program year. Also, disbursements may continue beyond the end of the program year in the event of delayed internal connections installation. Other adjustments and corrections may also be made.
(in Thousands of Dollars)
40

Section 5 – Rural Health Care
Overview – Rural Health Care Program
The Rural Health Care Program provides funding to eligible health care providers (HCPs) for broadband and telecommunications services necessary for the provision of health care. The goal of the program is to improve the quality of health care available to patients in rural communities by ensuring that eligible HCPs have access to broadband and telecommunications services. Funding for the Rural Health Care Program is capped at $400 million annually. During the time period reported upon in this report, the Rural Health Care Program provided funding through three programs: the Healthcare Connect Fund, the Rural Health Care Pilot Program, and the Telecommunications Program. In 2012, the Commission created the new Healthcare Connect Fund to reform, expand, and modernize the Rural Health Care Program. The Healthcare Connect Fund provides support for high-capacity broadband connectivity to eligible health care providers (HCPs), and encourages the formation of state and regional broadband HCP networks. The Commission established the Rural Health Care Pilot Program in September 2006 to provide funding for state or regional broadband networks designed to bring the benefits of telehealth and telemedicine services to areas of the country where the need for those benefits was most acute. Many of the lessons learned during the Pilot Program were used in establishing the Healthcare Connect Fund. While new participants are no longer accepted into the Pilot Program, there is some remaining funding already committed that existing participants are using. Established in 1997, the Telecommunications Program ensures that eligible rural HCPs pay no more than their urban counterparts for telecommunications services. The Rural Health Care Program is administered by USAC under the direction of the FCC. Additional information about the Rural Health Care Program can be found on the Commission’s website at http://www.fcc.gov/encyclopedia/rural-health-careand on USAC’s website at http://www.usac.org/rhc/.
41

Table 5.1Rural Health Care Funding Commitments and Disbursements by Program and Year
Funding Funds Funds Funds Funds Funds Funds Funds FundsYear Committed Disbursed Committed Disbursed Committed Disbursed Committed Disbursed1998 $3,388 $3,369 $0 $0 $0 $0 $3,388 $3,369 1999 4,653 4,291 0 0 0 0 4,653 4,291 2000 10,711 10,196 0 0 0 0 10,711 10,196 2001 19,582 18,477 0 0 0 0 19,582 18,477 2002 23,344 21,366 0 0 0 0 23,344 21,366 2003 27,908 25,726 0 0 0 0 27,908 25,726 2004 32,124 30,959 0 0 0 0 32,124 30,959 2005 41,347 39,999 0 0 0 0 41,347 39,999 2006 46,244 45,074 0 0 0 0 46,244 45,074 2007 56,210 54,820 467 467 0 0 56,677 55,287 2008 67,765 66,661 14,721 14,285 0 0 82,486 80,946 2009 72,379 71,309 351,066 254,572 0 0 423,444 325,881 2010 91,670 87,005 0 0 0 0 91,670 87,005 2011 103,845 100,812 0 0 0 0 103,845 100,812 2012 117,097 116,527 0 0 0 0 117,097 116,527 2013 133,057 121,347 0 0 49,147 23,794 182,203 145,141 2014 122,620 68,423 0 0 58,854 5,990 181,474 74,414
(in Thousands of Dollars)
Note: Activity through June 30, 2015. Funding Year 2015 commitment and disbursement information have not been displayed because only a small fraction of commitments (and no disbursements) have been made for that funding year. A substantial amount of commitments and disbursements for funding year 2015 will be made. Also, because of the appeals process, funding commitments and disbursements can be made after the end of the program year. Disbursements may also continue beyond the end of the program year in the event of delayed internal connections installation. Other adjustments and corrections may also be made.
Source: USAC data. Rollups performed by the Industry Analysis and Technology Division, Wireline Competition Bureau, FCC.
Telecommunications and Information
Assistance ProgramPilot Healthcare Connect Totals
42

Table 5.2Rural Health Care Funding Commitments and Disbursements from Program Inception through June 30, 2015
by State and Program
Funds Funds Funds Funds Funds Funds Funds FundsCommitted Disbursed Committed Disbursed Committed Disbursed Committed Disbursed
Alabama $6,083 $4,505 $2,749 $2,746 $1,798 $397 $10,629 $7,649 Alaska 519,534 465,672 1,882 209 293 35 521,709 465,916 American Samoa 1,512 1,419 0 0 0 0 1,512 1,419 Arizona 21,366 19,282 7,511 3,043 400 94 29,277 22,419 Arkansas 14,193 11,367 4,218 3,931 9,109 233 27,520 15,532 California 37,600 32,708 22,911 8,581 18,176 5,629 78,687 46,918 Colorado 3,251 2,760 10,884 10,702 8,373 3,746 22,508 17,208 Connecticut 12 12 0 0 33 18 46 30 Delaware 1 1 0 0 0 0 1 1 District of Columbia 18 0 0 0 0 0 18 0 Florida 4,785 4,088 82 34 134 60 5,001 4,182 Georgia 24,543 22,536 2,233 2,166 5,429 1,475 32,205 26,177 Guam 767 762 89 83 3 0 859 845 Hawaii 2,435 2,376 4,653 2,097 0 0 7,088 4,473 Idaho 4,223 3,821 0 0 618 133 4,840 3,954 Illinois 15,879 14,569 21,071 19,724 1,524 530 38,473 34,823 Indiana 6,933 6,511 15,458 11,284 1,545 514 23,936 18,309 Iowa 6,163 5,872 17,370 17,102 2,218 237 25,751 23,211 Kansas 7,110 6,619 0 0 1,344 428 8,454 7,047 Kentucky 10,172 9,297 2,945 727 2,037 759 15,154 10,783 Louisiana 3,398 2,947 15,570 375 800 324 19,769 3,646 Maine 571 451 13,821 10,951 61 13 14,453 11,416 Maryland 133 108 0 0 57 45 190 153 Massachusetts 929 923 87 0 1,080 274 2,096 1,197 Michigan 18,475 17,614 19,449 18,954 1,500 403 39,424 36,970 Minnesota 30,083 27,813 5,717 4,854 732 160 36,532 32,827 Mississippi 13,166 9,801 0 0 784 245 13,950 10,046 Missouri 8,138 6,915 2,538 2,079 3,167 946 13,843 9,941 Montana 9,943 9,400 15,413 14,361 304 94 25,660 23,855 Nebraska 18,869 17,890 18,010 18,010 234 30 37,113 35,930 Nevada 1,730 1,502 0 0 222 35 1,952 1,537 New Hampshire 218 202 5,569 5,306 135 74 5,922 5,583 New Jersey 0 0 0 0 0 0 0 0 New Mexico 9,038 7,678 11,737 6,979 1,257 244 22,032 14,901 New York 1,754 1,544 15,492 11,680 1,967 757 19,214 13,982 North Carolina 5,592 5,035 12,169 10,238 1,564 633 19,325 15,907 North Dakota 13,203 11,924 912 666 276 8 14,392 12,598 Northern Mariana Is. 43 21 46 44 0 0 89 65 Ohio 6,088 5,522 27,209 26,434 1,433 494 34,730 32,451 Oklahoma 20,290 16,491 0 0 8,006 1,058 28,296 17,550 Oregon 2,950 2,612 18,122 17,129 9,395 2,081 30,467 21,822 Pennsylvania 1,378 1,246 6,805 5,686 3,496 638 11,679 7,570 Puerto Rico 0 0 0 0 0 0 0 0 Rhode Island 0 0 0 0 0 0 0 0 South Carolina 556 520 8,826 8,282 4,294 1,558 13,676 10,360 South Dakota 10,222 9,574 4,586 4,482 2,304 1,484 17,112 15,540 Tennessee 4,744 4,273 6,834 0 602 211 12,180 4,484 Texas 38,608 26,307 15,503 0 3,016 930 57,127 27,237 Utah 8,232 7,871 8,815 7,090 2 0 17,049 14,961 Vermont 805 770 5,959 5,011 115 36 6,879 5,818 Virgin Islands 852 846 0 0 0 0 852 846 Virginia 14,923 12,076 2,709 291 811 354 18,443 12,722 Washington 2,017 1,687 118 117 653 207 2,788 2,011 West Virginia 2,386 2,158 7,070 4,792 728 321 10,184 7,271 Wisconsin 59,778 55,573 2,312 2,303 6,502 1,737 68,592 59,612 Wyoming 3,041 2,889 797 779 244 100 4,082 3,767 Totals 998,732 886,362 366,254 269,323 108,776 29,784 1,473,761 1,185,470
(in Thousands of Dollars)
Source: USAC data. Rollups performed by the Industry Analysis and Technology Division, Wireline Competition Bureau, FCC.
Note: Disbursements through June 30, 2015. Unlike in Table 5.1, all commitments and disbursements have been included, including those in funding year 2015. Because of the appeals process, funding commitments and disbursements may be made after the program year ended.
Telecommunications and Information Assistance
ProgramPilot Healthcare Connect Totals
State
43

Section 6 – Subscribership & Penetration
Overview – Subscribership & Penetration: Voice & Internet
Continuing analysis of telephone penetration statistics allows one to examine the aggregate effects of Commission actions and industry evolution on households’ decisions to maintain, acquire or drop telephone service. In addition to telephone penetration statistics, recent surveys by the Census Bureau now also provide information about the penetration of high-speed Internet services. This chapter presents comprehensive data on telephone penetration statistics collected by the Bureau of the Census primarily through the American Community Survey (ACS) and the Current Population Survey (CPS). The chapter also provides national and state-level estimates of high-speed Internet adoption based on the ACS. Along with telephone and high-speed Internet penetration statistics for the nation and each of the states, data are provided on penetration for various demographic characteristics. In particular for telephone service, attention is given to penetration rates for lower income households given the Commission’s various low income programs such as Lifeline. To provide regular, high-quality data on telephone penetration, the Commission requested that the Census Bureau include questions on telephone availability as part of its CPS, which monitors demographic trends between decennial censuses. The CPS is a staggered panel survey in which the people residing at particular addresses are included in the survey for four consecutive months in one year and the same four months in the following year. Use of the CPS has several advantages: it is conducted every month by an independent and expert agency, the sample is large, and the questions are consistent. Thus, changes in the results can be compared over time with a reasonable degree of confidence. In addition to the CPS, the ACS also provides data for calculating a measure of telephone penetration. The ACS has replaced the decennial census long form and thus also provides a wealth of data and large sample sizes, though on a less frequent basis than the CPS. Whereas the CPS reports household penetration, the ACS follows the design of past decennial censuses and reports telephone penetration for occupied housing units. In this chapter, penetration measures from the CPS, the ACS, and decennial censuses (prior to the ACS) are reported as complements to each other.1 While the ACS provides telephone penetration data, the ACS now also provides data for calculating high-speed Internet penetration rates. Specifically, the ACS for the first time in 2013 asked whether households have access to the Internet. The ACS asks, “At this house, apartment, or mobile home – do you or any member of this household access the Internet?” Statistics based on 2014 data from the ACS on high-speed Internet penetration has been incorporated into this report. Since the ACS is conducted throughout the year, a 1-year average is calculated using the data. The specific questions regarding telephone availability asked in the CPS are: “Does this house, apartment, or mobile home have telephone service from which you can both make and receive calls? Please include cell phones, regular phones, and any other type of telephone.” And, if the answer to the
1 Penetration statistics derived from the CPS cannot be directly compared with the penetration estimates based on the responses to the long forms of the 1990 and 2000 decennial censuses or the ACS. This is due to differences in sampling techniques and survey methodologies as well as differences in the context in which the questions are asked. For example, the 2013 ACS reported 97.7% of all occupied housing units in the United States had telephone service available, whereas the March 2013 CPS data showed a household penetration rate of 96.0%. This difference is statistically significant and may indicate that the CPS value is on the low side and the ACS value is on the high side, with the most probable value lying somewhere in between.
44

first question is “no,” this is followed up with: “Is there a telephone elsewhere on which people in this household can be called?” If the answer to the first question is “yes,” the household is counted as having a telephone “in unit.” If the answer to either the first or second question is “yes,” the household is counted as having a telephone “available.” In contrast to the CPS, the ACS simply asks: “Does this house, apartment, or mobile home have telephone service from which you can both make and receive calls? Include cell phones.” Thus, the ACS question is most similar to the CPS’s “in unit” rather than “available” penetration rate. Although the CPS is conducted every month, not all questions are asked every month. The telephone questions are asked once every four months, in the month that a household is first included in the sample and in the month that the household re-enters the sample a year later. Since the sample is staggered, the reported information for any given month actually reflects responses over the preceding four months. Aggregated summaries of the responses are reported to the Commission, based on the surveys conducted through March, July, and November of each year. The ACS provides annual telephone penetration statistics based on data collected monthly throughout the year. The CPS data are based on a nationwide sample of about 50 to 60 thousand households in the 50 states and the District of Columbia. The CPS does not cover outlying areas that are not states, such as Puerto Rico, Guam, American Samoa, the Virgin Islands, and the Northern Mariana Islands.2 The ACS form is sent to approximately 250 thousand addresses per month, for a total of about 3 million addresses per year. The ACS covers the states, the District of Columbia, and Puerto Rico.
2 Annual data for Puerto Rico have been available from the ACS starting with 2005. The latest available value for Puerto Rico from that survey is 93.8% for 2013, compared to a national average (for the 50 states and the District of Columbia) of 97.7% using the ACS.
45
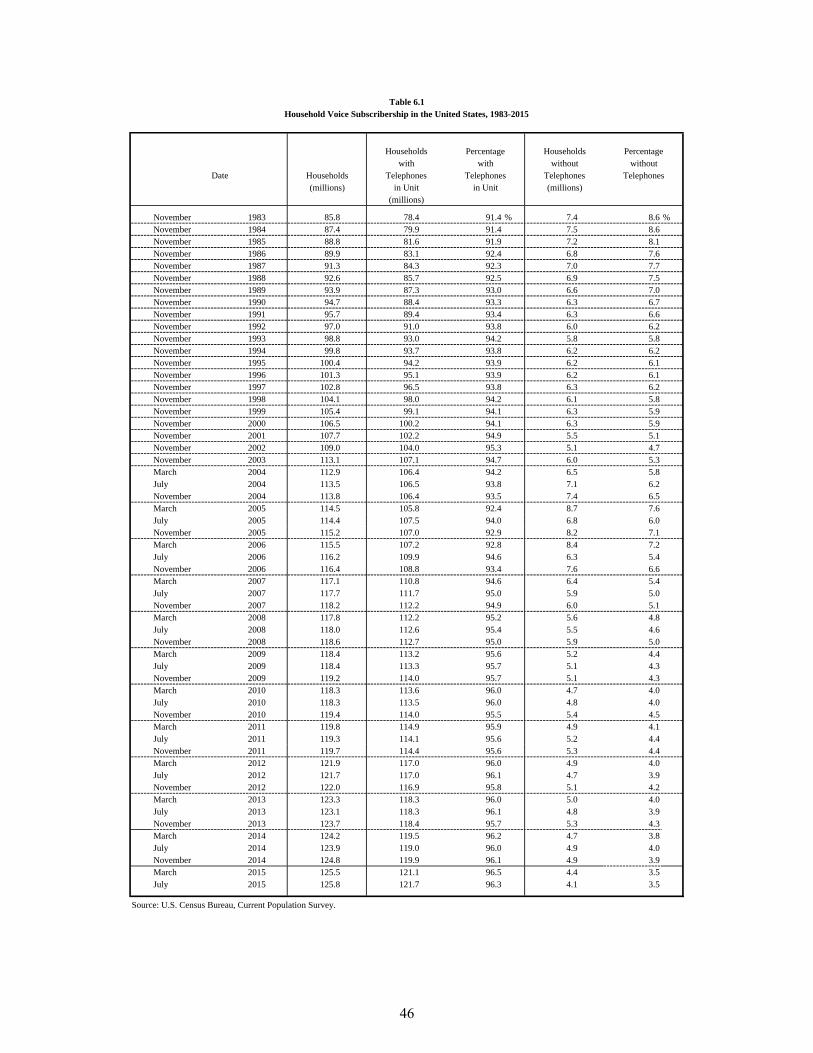
Households Percentage Households Percentagewith with without without
Households Telephones Telephones Telephones Telephones(millions) (millions)
November 1983 85.8 78.4 91.4 % 7.4 8.6 %November 1984 87.4 79.9 91.4 7.5 8.6November 1985 88.8 81.6 91.9 7.2 8.1November 1986 89.9 83.1 92.4 6.8 7.6November 1987 91.3 84.3 92.3 7.0 7.7November 1988 92.6 85.7 92.5 6.9 7.5November 1989 93.9 87.3 93.0 6.6 7.0November 1990 94.7 88.4 93.3 6.3 6.7November 1991 95.7 89.4 93.4 6.3 6.6November 1992 97.0 91.0 93.8 6.0 6.2November 1993 98.8 93.0 94.2 5.8 5.8November 1994 99.8 93.7 93.8 6.2 6.2November 1995 100.4 94.2 93.9 6.2 6.1November 1996 101.3 95.1 93.9 6.2 6.1November 1997 102.8 96.5 93.8 6.3 6.2November 1998 104.1 98.0 94.2 6.1 5.8November 1999 105.4 99.1 94.1 6.3 5.9November 2000 106.5 100.2 94.1 6.3 5.9November 2001 107.7 102.2 94.9 5.5 5.1November 2002 109.0 104.0 95.3 5.1 4.7November 2003 113.1 107.1 94.7 6.0 5.3March 2004 112.9 106.4 94.2 6.5 5.8July 2004 113.5 106.5 93.8 7.1 6.2November 2004 113.8 106.4 93.5 7.4 6.5March 2005 114.5 105.8 92.4 8.7 7.6July 2005 114.4 107.5 94.0 6.8 6.0November 2005 115.2 107.0 92.9 8.2 7.1March 2006 115.5 107.2 92.8 8.4 7.2July 2006 116.2 109.9 94.6 6.3 5.4November 2006 116.4 108.8 93.4 7.6 6.6March 2007 117.1 110.8 94.6 6.4 5.4July 2007 117.7 111.7 95.0 5.9 5.0November 2007 118.2 112.2 94.9 6.0 5.1March 2008 117.8 112.2 95.2 5.6 4.8July 2008 118.0 112.6 95.4 5.5 4.6November 2008 118.6 112.7 95.0 5.9 5.0March 2009 118.4 113.2 95.6 5.2 4.4July 2009 118.4 113.3 95.7 5.1 4.3November 2009 119.2 114.0 95.7 5.1 4.3March 2010 118.3 113.6 96.0 4.7 4.0July 2010 118.3 113.5 96.0 4.8 4.0November 2010 119.4 114.0 95.5 5.4 4.5March 2011 119.8 114.9 95.9 4.9 4.1July 2011 119.3 114.1 95.6 5.2 4.4November 2011 119.7 114.4 95.6 5.3 4.4March 2012 121.9 117.0 96.0 4.9 4.0July 2012 121.7 117.0 96.1 4.7 3.9November 2012 122.0 116.9 95.8 5.1 4.2March 2013 123.3 118.3 96.0 5.0 4.0July 2013 123.1 118.3 96.1 4.8 3.9November 2013 123.7 118.4 95.7 5.3 4.3March 2014 124.2 119.5 96.2 4.7 3.8July 2014 123.9 119.0 96.0 4.9 4.0November 2014 124.8 119.9 96.1 4.9 3.9March 2015 125.5 121.1 96.5 4.4 3.5July 2015 125.8 121.7 96.3 4.1 3.5
Table 6.1Household Voice Subscribership in the United States, 1983-2015
Date
Source: U.S. Census Bureau, Current Population Survey.
in Unitin Unit(millions)
46
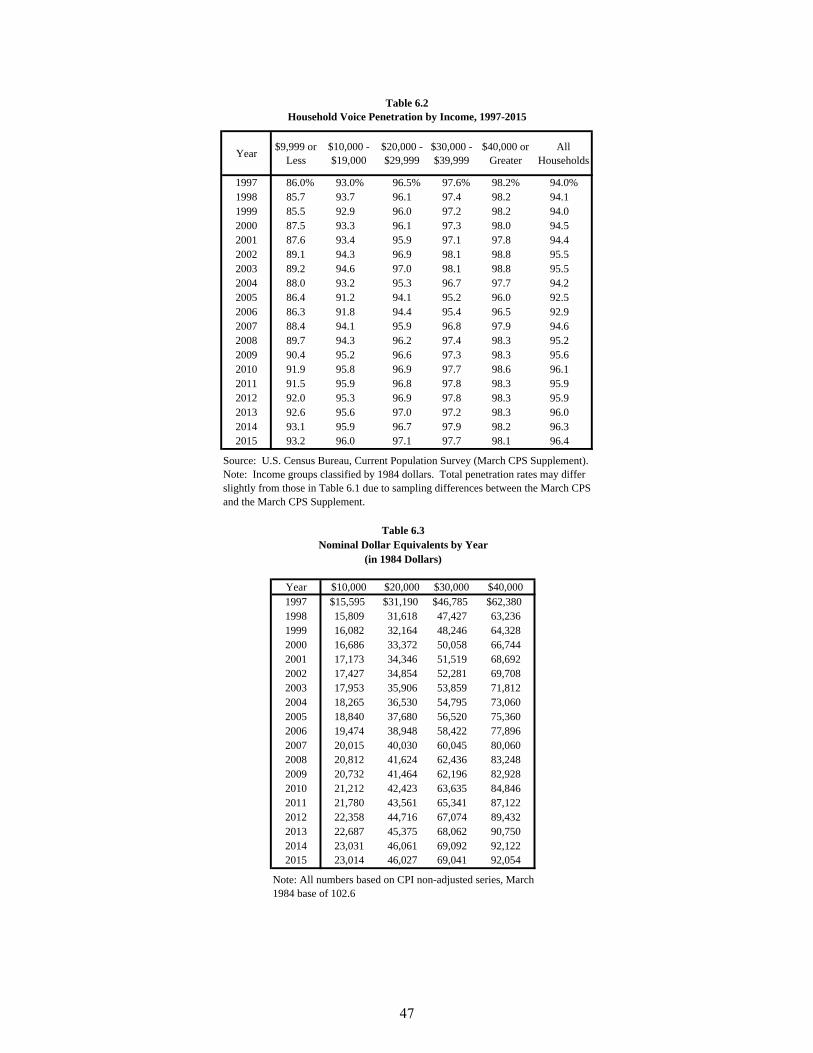
Year$9,999 or
Less$10,000 - $19,000
$20,000 - $29,999
$30,000 - $39,999
$40,000 or Greater
All Households
1997 86.0% 93.0% 96.5% 97.6% 98.2% 94.0%1998 85.7 93.7 96.1 97.4 98.2 94.11999 85.5 92.9 96.0 97.2 98.2 94.02000 87.5 93.3 96.1 97.3 98.0 94.52001 87.6 93.4 95.9 97.1 97.8 94.42002 89.1 94.3 96.9 98.1 98.8 95.52003 89.2 94.6 97.0 98.1 98.8 95.52004 88.0 93.2 95.3 96.7 97.7 94.22005 86.4 91.2 94.1 95.2 96.0 92.52006 86.3 91.8 94.4 95.4 96.5 92.92007 88.4 94.1 95.9 96.8 97.9 94.62008 89.7 94.3 96.2 97.4 98.3 95.22009 90.4 95.2 96.6 97.3 98.3 95.62010 91.9 95.8 96.9 97.7 98.6 96.12011 91.5 95.9 96.8 97.8 98.3 95.92012 92.0 95.3 96.9 97.8 98.3 95.92013 92.6 95.6 97.0 97.2 98.3 96.02014 93.1 95.9 96.7 97.9 98.2 96.32015 93.2 96.0 97.1 97.7 98.1 96.4
Year $10,000 $20,000 $30,000 $40,000 1997 $15,595 $31,190 $46,785 $62,3801998 15,809 31,618 47,427 63,2361999 16,082 32,164 48,246 64,3282000 16,686 33,372 50,058 66,7442001 17,173 34,346 51,519 68,6922002 17,427 34,854 52,281 69,7082003 17,953 35,906 53,859 71,8122004 18,265 36,530 54,795 73,0602005 18,840 37,680 56,520 75,3602006 19,474 38,948 58,422 77,8962007 20,015 40,030 60,045 80,0602008 20,812 41,624 62,436 83,2482009 20,732 41,464 62,196 82,9282010 21,212 42,423 63,635 84,8462011 21,780 43,561 65,341 87,1222012 22,358 44,716 67,074 89,4322013 22,687 45,375 68,062 90,7502014 23,031 46,061 69,092 92,1222015 23,014 46,027 69,041 92,054
Note: All numbers based on CPI non-adjusted series, March 1984 base of 102.6
Source: U.S. Census Bureau, Current Population Survey (March CPS Supplement). Note: Income groups classified by 1984 dollars. Total penetration rates may differ slightly from those in Table 6.1 due to sampling differences between the March CPS and the March CPS Supplement.
Table 6.2Household Voice Penetration by Income, 1997-2015
Table 6.3
(in 1984 Dollars)Nominal Dollar Equivalents by Year
47
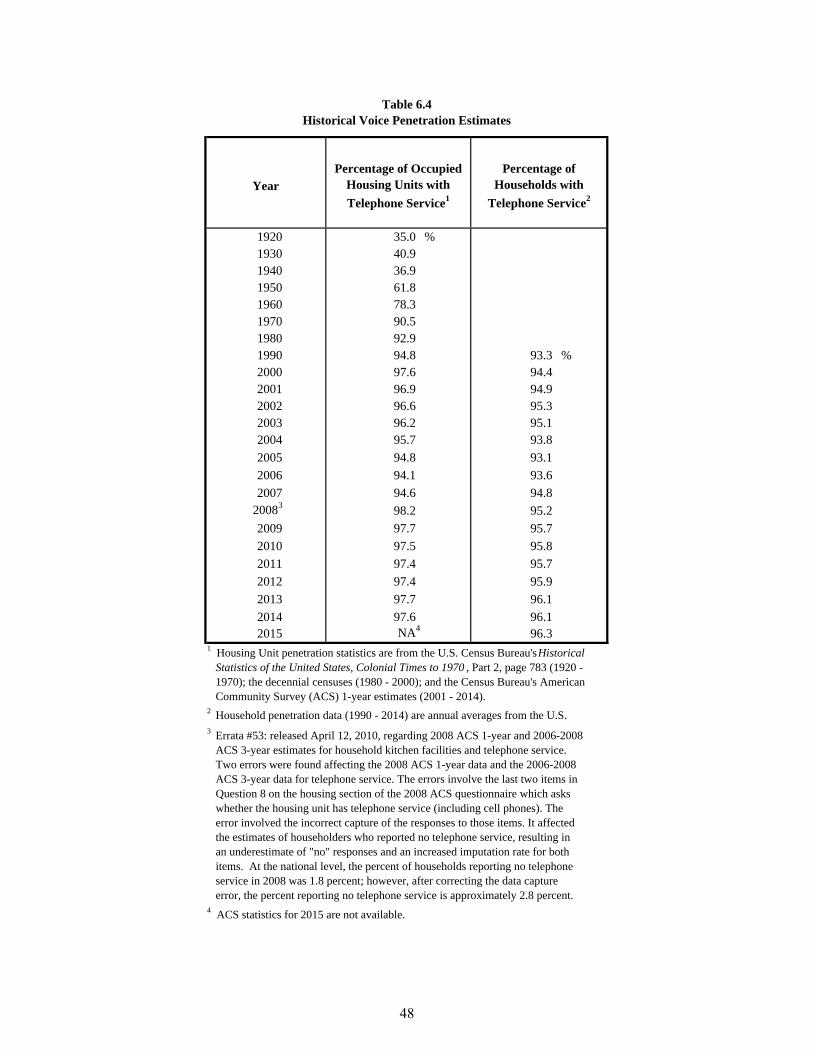
1920 %1930194019501960197019801990 %20002001200220032004
2005
2006
200720083
2009
2010
2011
2012
2013
20142015
Table 6.4Historical Voice Penetration Estimates
35.040.936.961.878.390.592.994.8 93.397.6 94.496.9 94.996.6 95.396.2 95.195.7 93.8
94.8 93.1
Percentage of Occupied Housing Units with
Telephone Service1
Percentage of Households with
Telephone Service2Year
95.8
95.7
1 Housing Unit penetration statistics are from the U.S. Census Bureau's Historical Statistics of the United States, Colonial Times to 1970 , Part 2, page 783 (1920 - 1970); the decennial censuses (1980 - 2000); and the Census Bureau's American Community Survey (ACS) 1-year estimates (2001 - 2014).
97.7 95.7
97.5
94.1 93.6
94.6 94.8
98.2 95.2
2 Household penetration data (1990 - 2014) are annual averages from the U.S.
4 ACS statistics for 2015 are not available.
3 Errata #53: released April 12, 2010, regarding 2008 ACS 1-year and 2006-2008 ACS 3-year estimates for household kitchen facilities and telephone service. Two errors were found affecting the 2008 ACS 1-year data and the 2006-2008 ACS 3-year data for telephone service. The errors involve the last two items in Question 8 on the housing section of the 2008 ACS questionnaire which asks whether the housing unit has telephone service (including cell phones). The error involved the incorrect capture of the responses to those items. It affected the estimates of householders who reported no telephone service, resulting in an underestimate of "no" responses and an increased imputation rate for both items. At the national level, the percent of households reporting no telephone service in 2008 was 1.8 percent; however, after correcting the data capture error, the percent reporting no telephone service is approximately 2.8 percent.
97.4
97.4 95.9
96.1
NA4 96.3
97.7
97.6 96.1
48
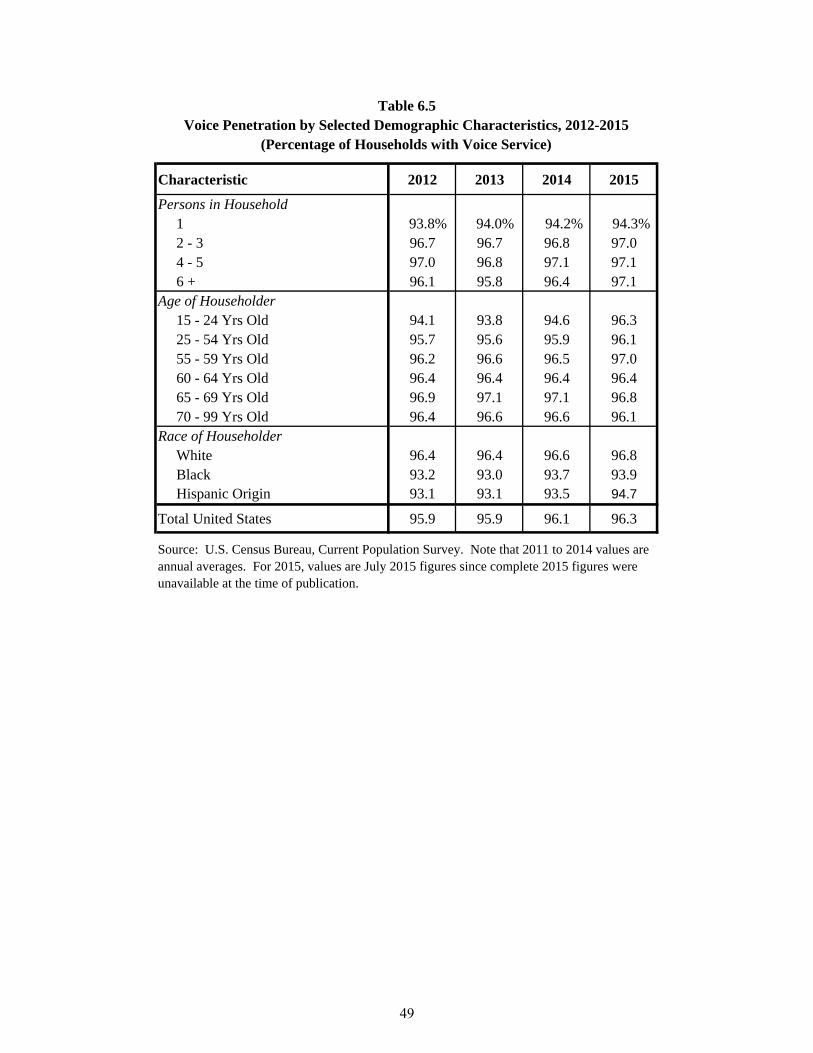
Characteristic 2012 2013 2014 2015
Persons in Household 1 93.8% 94.0% 94.2% 94.3% 2 - 3 96.7 96.7 96.8 97.0 4 - 5 97.0 96.8 97.1 97.1 6 + 96.1 95.8 96.4 97.1Age of Householder 15 - 24 Yrs Old 94.1 93.8 94.6 96.3 25 - 54 Yrs Old 95.7 95.6 95.9 96.1 55 - 59 Yrs Old 96.2 96.6 96.5 97.0 60 - 64 Yrs Old 96.4 96.4 96.4 96.4 65 - 69 Yrs Old 96.9 97.1 97.1 96.8 70 - 99 Yrs Old 96.4 96.6 96.6 96.1Race of Householder White 96.4 96.4 96.6 96.8 Black 93.2 93.0 93.7 93.9 Hispanic Origin 93.1 93.1 93.5 94.7
Total United States 95.9 95.9 96.1 96.3
Source: U.S. Census Bureau, Current Population Survey. Note that 2011 to 2014 values are annual averages. For 2015, values are July 2015 figures since complete 2015 figures were unavailable at the time of publication.
Table 6.5Voice Penetration by Selected Demographic Characteristics, 2012-2015
(Percentage of Households with Voice Service)
49

State 2010 2011 2012
Alabama 97.4 % 97.2 % 97.3 % 97.4 % 97.4 %Alaska 98.3 98.1 97.7 98.0 98.1Arizona 97.0 97.0 97.2 97.3 97.5Arkansas 96.9 96.6 96.2 97.2 97.3California 97.9 97.9 97.9 98.0 97.9Colorado 97.7 97.5 97.7 97.7 97.9Connecticut 98.3 98.5 98.5 98.6 98.5Delaware 98.2 98.2 97.8 98.1 97.9District of Columbia 96.7 96.7 97.0 97.2 97.6Florida 97.2 96.6 96.5 97.0 97.1Georgia 96.9 96.4 96.0 97.6 97.3Hawaii 97.5 97.4 97.4 97.7 97.7Idaho 97.4 96.5 97.1 97.1 97.3Illinois 97.7 97.7 97.7 97.7 97.4Indiana 97.1 96.6 96.7 97.4 97.5Iowa 97.4 96.9 97.4 97.9 97.6Kansas 97.5 97.6 97.3 97.4 97.4Kentucky 96.9 96.9 96.8 97.2 97.1Louisiana 96.8 97.2 97.4 97.3 97.0Maine 97.8 98.2 98.2 97.6 98.1Maryland 97.6 97.5 97.8 98.1 97.6Massachusetts 98.4 98.3 98.4 98.4 98.2Michigan 97.2 97.0 97.2 97.4 97.6Minnesota 98.2 98.0 98.0 98.1 97.9Mississippi 96.9 96.9 97.2 96.8 97.2Missouri 97.3 97.3 97.1 97.6 97.1Montana 97.0 97.1 97.4 96.9 97.0Nebraska 98.0 97.8 97.6 97.5 97.7Nevada 97.7 97.8 97.5 97.9 96.5New Hampshire 98.3 98.2 98.0 97.9 98.3New Jersey 97.9 97.6 98.2 98.5 98.5New Mexico 95.3 94.9 96.5 96.8 97.2New York 97.2 97.2 97.5 98.0 97.8North Carolina 97.6 97.5 97.6 97.8 97.7North Dakota 98.4 98.1 97.3 97.8 98.1Ohio 97.2 97.1 96.8 97.2 97.3Oklahoma 97.8 97.5 97.7 97.5 97.1Oregon 97.7 97.2 97.5 97.6 97.6Pennsylvania 98.0 97.8 98.0 98.0 98.2Rhode Island 97.2 97.5 97.9 98.3 97.8South Carolina 97.1 97.2 97.3 97.7 97.6South Dakota 98.0 97.3 97.2 97.5 97.2Tennessee 97.2 97.1 97.3 97.6 97.5Texas 97.4 97.2 97.4 97.7 97.7Utah 97.8 97.6 97.6 97.9 98.0Vermont 97.8 98.2 98.6 98.1 98.1Virginia 97.4 97.5 97.6 98.2 98.1Washington 97.8 97.9 97.4 97.9 97.6West Virginia 96.3 96.0 96.5 97.0 96.9Wisconsin 98.0 97.7 97.7 97.9 97.7Wyoming 97.7 97.8 97.7 98.1 97.9
Total United States 97.5 % 97.4 % 97.4 % 97.7 % 97.6 %
Puerto Rico 93.5 % 93.8 % 94.2 % 93.8 % 94.3 %
Source: U.S. Census Bureau, American Community Survey. U.S. Total does not include Puerto Rico.
2013
Table 6.6Voice Penetration by State, 2010-2014
(Percentage of Occupied Housing Units with Voice Service)
2014
50

Table 6.7Voice Penetration by State, Selected Years
(Percentage of Households with a Telephone in Unit)
State
Alabama 88.4 % 92.2 % 91.9 % 91.8 % 95.0 %Alaska 86.5 94.4 94.3 96.5 96.7Arizona 86.9 93.1 93.9 92.9 95.8Arkansas 86.6 86.9 88.6 92.0 95.2California 92.5 95.0 95.8 96.5 95.2Colorado 93.2 95.5 96.3 96.8 98.2Connecticut 95.5 97.5 96.4 96.6 97.9Delaware 94.3 96.1 96.3 94.9 94.1District of Columbia 94.9 93.0 93.2 91.6 96.2Florida 88.7 93.1 92.1 93.6 94.1Georgia 86.2 89.7 91.1 92.6 95.8Hawaii 93.5 94.8 94.7 96.0 95.7Idaho 90.7 92.9 93.9 96.4 96.6Illinois 94.2 93.0 91.5 94.1 95.9Indiana 91.6 93.7 94.5 90.4 95.7Iowa 96.2 96.6 96.2 97.0 98.4Kansas 94.3 93.9 94.8 96.2 98.7Kentucky 88.1 92.3 93.3 94.4 94.8Louisiana 89.7 91.1 92.6 94.9 96.2Maine 93.4 96.5 97.9 96.6 98.3Maryland 95.7 96.7 95.0 95.5 96.7Massachusetts 95.9 95.7 94.6 96.3 97.9Michigan 92.8 95.0 95.0 95.0 97.3Minnesota 95.8 97.1 97.4 97.9 98.9Mississippi 82.4 87.5 89.2 90.5 96.5Missouri 91.5 95.3 95.8 96.1 96.6Montana 91.0 94.3 94.6 95.4 96.0Nebraska 95.7 96.0 97.3 93.7 98.1Nevada 90.4 93.5 94.0 95.2 95.9New Hampshire 94.3 96.1 97.7 96.8 98.8New Jersey 94.8 93.6 94.6 95.7 94.3New Mexico 82.0 86.2 91.2 91.6 92.2New York 91.8 93.4 95.1 93.4 95.2North Carolina 88.3 93.5 93.9 94.5 95.9North Dakota 94.6 96.3 95.8 98.0 97.3Ohio 92.4 94.5 94.8 95.9 96.9Oklahoma 90.3 91.3 91.2 94.9 95.4Oregon 90.6 96.0 94.8 96.7 97.6Pennsylvania 94.9 96.9 96.6 97.0 97.9Rhode Island 93.6 95.7 94.9 95.3 96.6South Carolina 83.7 91.3 93.2 90.6 96.0South Dakota 93.2 93.3 94.3 97.2 97.7Tennessee 88.5 94.0 95.5 93.2 93.7Texas 88.4 91.0 93.5 93.5 96.2Utah 92.5 96.7 95.9 96.8 98.3Vermont 92.3 95.9 95.6 97.4 98.5Virginia 93.1 94.9 95.4 95.3 96.5Washington 93.0 94.5 94.9 96.8 98.0West Virginia 87.7 92.9 94.0 94.5 94.6Wisconsin 95.2 97.0 94.8 96.8 98.2Wyoming 89.9 95.0 94.7 96.1 96.4
Total United States 91.6 % 93.9 % 94.4 % 94.8 % 96.1 %
Source: U.S. Census Bureau, Current Population Survey.
20141984 1996 2000 2007
51

State$9,999 or
Less$10,000 to
$19,999$19,999 to
$29,999$30,000 to
$39,999$40,000 or
MoreAll
Households
Alabama 93.8 % 94.5 % 98.5 % 97.3 % 99.1 % 96.2 %Alaska 94.7 96.6 97.1 98.6 98.4 97.2Arizona 91.3 96.2 94.1 98.6 97.6 95.2Arkansas 91.4 92.5 97.6 95.4 98.1 94.5California 92.3 95.3 95.7 96.8 97.6 95.7Colorado 92.0 95.9 99.6 98.6 99.1 97.3Connecticut 95.2 97.8 99.6 99.3 99.6 98.5Delaware 93.1 94.4 95.6 95.1 97.5 95.4District of Columbia 93.5 95.3 95.9 98.4 98.6 96.6Florida 91.4 92.3 95.4 96.4 95.8 93.8Georgia 89.3 96.9 97.0 98.8 97.2 95.4Hawaii 89.2 93.3 97.7 96.0 96.5 94.9Idaho 94.6 96.2 97.6 99.4 99.5 97.4Illinois 92.1 96.1 96.6 97.5 97.5 95.9Indiana 91.8 94.2 95.0 95.9 98.0 94.9Iowa 98.0 98.3 98.3 99.1 99.6 98.7Kansas 94.5 96.5 98.5 100.0 96.8 96.9Kentucky 91.7 92.8 98.3 100.0 97.4 95.1Louisiana 94.2 98.3 96.9 99.6 99.3 97.2Maine 96.9 95.7 98.5 99.2 99.3 97.8Maryland 95.5 97.5 96.8 99.2 99.1 98.0Massachusetts 94.3 97.5 97.7 98.1 99.2 97.4Michigan 95.5 95.8 96.5 96.2 98.6 96.6Minnesota 97.5 98.9 100.0 99.1 99.2 99.0Mississippi 93.1 96.7 97.7 97.7 97.6 95.9Missouri 95.0 96.1 97.2 96.2 98.3 96.7Montana 92.6 97.3 99.1 97.3 99.1 97.1Nebraska 94.9 96.1 98.6 95.4 99.1 97.0Nevada 93.2 96.9 95.6 95.5 96.1 95.5New Hampshire 94.0 98.6 97.1 99.4 100.0 98.3New Jersey 87.5 92.9 94.9 98.7 96.6 94.3New Mexico 87.8 92.6 93.0 94.9 95.6 92.3New York 94.4 96.1 97.0 98.4 97.5 96.5North Carolina 94.7 96.3 95.7 97.8 98.7 96.5North Dakota 93.5 98.0 98.2 97.6 98.4 97.3Ohio 94.1 95.7 98.4 99.4 97.9 96.8Oklahoma 94.7 96.9 96.9 96.0 96.1 96.1Oregon 95.7 98.2 99.6 99.0 98.9 98.2Pennsylvania 97.1 98.8 99.1 99.1 99.5 98.8Rhode Island 91.3 98.0 99.6 96.1 98.1 96.7South Carolina 93.4 98.0 97.1 97.0 98.0 96.6South Dakota 97.9 99.3 97.7 100.0 99.2 98.7Tennessee 89.8 91.6 95.6 96.0 96.8 93.3Texas 95.3 96.8 98.1 96.9 98.1 97.1Utah 94.0 97.4 97.9 97.5 99.5 97.6Vermont 95.4 98.8 98.9 99.6 99.2 98.5Virginia 92.4 98.7 98.9 97.6 98.3 97.4Washington 94.0 98.1 97.4 99.7 99.4 97.9West Virginia 88.0 96.7 95.8 99.2 99.6 94.6Wisconsin 97.2 98.1 99.6 98.9 99.5 98.7Wyoming 86.8 96.3 97.5 100.0 97.7 95.6
Total United States 93.3 % 96.0 % 97.1 % 97.7 % 98.1 % 96.4 %
Note: Income categories use 1984 dollars. For a conversion to current-year dollars, consult Table 6.2. Source: U.S. Census Bureau, Current Population Survey (March CPS Supplement).
Table 6.8Household Voice Penetration by State and Income, 2015
52

All Households 75.8 % 75.1 %
Household IncomeLess than $20,000 47.6 % 46.8 %$20,000-$49,999 67.9 67.0$50,000-$75,000 83.1 82.3$75,000 or more 92.6 92.1
Metropolitan StatusMetropolitan area NA 75.9 %Nonmetropolitan area NA 61.9
All Individuals 79.9 % 79.3 %
AgeUnder 18 82.3 % 81.9 %18-64 82.3 81.865+ 65.8 64.5
Race and Hispanic OriginWhite alone, non-Hispanic 83.4 % 82.7 %Black alone, non-Hispanic 68.4 67.9Asian alone, non-Hispanic 90.7 90.2Hispanic (of any race) 72.6 72.0
American Indian 63.1 62.3
NA indicates that data are not available.
Table 6.9
Source: Results based on the 2014 American Community Survey 1-year estimates, data are available through the American Community Survey Fact-Finder Download Center
Internet Use by Selected Characteristics, 2014
With some Internet
subscription
With high-speed Internet
connection 1
1 High-speed service includes all internet service other than dial-up.
53

State PercentMargin of
ErrorPercent
Margin of Error
Alabama 63.5% +/-0.6 65.8% +/-0.5Alaska 79.0 +/-1.3 81.4 +/-1.0Arizona 73.9 +/-0.4 75.5 +/-0.4Arkansas 60.9 +/-0.7 63.5 +/-0.8California 77.9 +/-0.2 80.0 +/-0.2Colorado 79.4 +/-0.5 81.2 +/-0.4Connecticut 77.5 +/-0.6 80.5 +/-0.5Delaware 74.5 +/-1.1 75.5 +/-1.2District of Columbia 73.4 +/-1.4 73.4 +/-1.1Florida 74.3 +/-0.2 75.8 +/-0.3Georgia 72.2 +/-0.4 73.4 +/-0.3Hawaii 78.6 +/-1.0 80.6 +/-0.8Idaho 73.2 +/-1.0 73.6 +/-1.0Illinois 74.0 +/-0.3 75.5 +/-0.3Indiana 69.7 +/-0.4 71.4 +/-0.4Iowa 72.2 +/-0.6 74.2 +/-0.5Kansas 73.0 +/-0.6 74.5 +/-0.6Kentucky 68.5 +/-0.5 68.9 +/-0.5Louisiana 64.8 +/-0.6 66.6 +/-0.6Maine 72.9 +/-0.7 74.9 +/-0.8Maryland 78.9 +/-0.4 80.1 +/-0.4Massachusetts 79.6 +/-0.4 80.5 +/-0.3Michigan 70.7 +/-0.3 72.9 +/-0.3Minnesota 76.5 +/-0.4 78.3 +/-0.4Mississippi 57.4 +/-0.8 59.1 +/-0.8Missouri 69.8 +/-0.4 71.6 +/-0.4Montana 72.1 +/-1.0 72.9 +/-1.0Nebraska 72.9 +/-0.6 74.8 +/-0.7Nevada 75.6 +/-0.7 76.3 +/-0.7New Hampshire 80.9 +/-0.8 82.1 +/-0.8New Jersey 79.1 +/-0.4 80.9 +/-0.3New Mexico 64.4 +/-0.8 67.5 +/-0.7New York 75.3 +/-0.2 76.5 +/-0.2North Carolina 70.8 +/-0.4 72.4 +/-0.4North Dakota 72.5 +/-1.2 74.7 +/-1.2Ohio 71.2 +/-0.3 73.9 +/-0.3Oklahoma 66.7 +/-0.4 69.2 +/-0.4Oregon 77.5 +/-0.5 78.9 +/-0.6Pennsylvania 72.4 +/-0.3 73.9 +/-0.3Rhode Island 76.5 +/-1.0 76.5 +/-1.1South Carolina 66.6 +/-0.6 68.1 +/-0.6South Dakota 71.1 +/-0.9 71.6 +/-1.1Tennessee 67.0 +/-0.5 68.2 +/-0.5Texas 71.8 +/-0.3 73.0 +/-0.2Utah 79.6 +/-0.6 81.7 +/-0.6Vermont 75.3 +/-1.0 76.3 +/-1.1Virginia 75.8 +/-0.4 77.2 +/-0.4Washington 78.9 +/-0.5 81.9 +/-0.4West Virginia 64.9 +/-0.8 66.2 +/-0.8Wisconsin 73.0 +/-0.4 75.3 +/-0.4Wyoming 75.5 +/-1.5 76.1 +/-1.4
Total United States 73.4 +/-0.1 75.1 +/-0.1
Puerto Rico 45.2 +/-0.6 48.1 +/-0.6
1 High-speed internet service includes all internet service other than dial-up.
Table 6.10
2014
High-Speed Internet Penetration for Households by State 1
Source: Results based on the 2014 American Community Survey, available through the ACS FactFinder: http://factfinder.census.gov/faces/tableservices/jsf/pages/productview.xhtml?pid=ACS_13_1YR_GCT2801.US01PR&prodType=table
2013
54

Subscribers Ratio Subscribers Ratio Subscribers RatioAlabama 1,920 926 0.48 760 0.40 393 0.20 Alaska 269 149 0.55 119 0.44 6 0.02 American Samoa 9 0 0.00 0 0.00 0 0.00 Arizona 2,496 1,690 0.68 1,079 0.43 1,008 0.40 Arkansas 1,174 520 0.44 373 0.32 209 0.18 California 12,912 9,316 0.72 7,779 0.60 5,322 0.41 Colorado 2,054 1,539 0.75 1,039 0.51 979 0.48 Connecticut 1,387 985 0.71 885 0.64 587 0.42 Delaware 355 286 0.81 265 0.75 * *District of Col 276 206 0.74 176 0.64 * *Florida 7,733 5,633 0.73 4,767 0.62 2,681 0.35 Georgia 3,739 2,175 0.58 1,745 0.47 1,195 0.32 Guam 40 * * * * * *Hawaii 470 364 0.77 289 0.62 * *Idaho 605 330 0.55 181 0.30 128 0.21 Illinois 4,876 3,033 0.62 2,532 0.52 1,774 0.36 Indiana 2,542 1,365 0.54 1,113 0.44 635 0.25 Iowa 1,236 666 0.54 425 0.34 61 0.05 Kansas 1,130 657 0.58 485 0.43 249 0.22 Kentucky 1,753 855 0.49 639 0.36 125 0.07 Louisiana 1,744 895 0.51 724 0.42 515 0.30 Maine 561 369 0.66 265 0.47 65 0.12 Maryland 2,211 1,679 0.76 1,527 0.69 1,255 0.57 Massachusetts 2,575 2,099 0.82 1,903 0.74 1,717 0.67 Michigan 3,856 2,345 0.61 2,019 0.52 1,347 0.35 Minnesota 2,128 1,312 0.62 961 0.45 791 0.37 Mississippi 1,127 411 0.36 341 0.30 198 0.18 Missouri 2,413 1,306 0.54 1,017 0.42 522 0.22 Montana 420 225 0.53 151 0.36 * *Nebraska 734 461 0.63 297 0.40 211 0.29 Nevada 1,068 687 0.64 472 0.44 * *New Hampshire 525 411 0.78 347 0.66 276 0.52 New Jersey 3,250 2,703 0.83 2,523 0.78 1,845 0.57 New Mexico 818 421 0.51 224 0.27 199 0.24 New York 7,363 5,564 0.76 5,178 0.70 2,823 0.38 North Carolina 3,910 2,182 0.56 1,757 0.45 605 0.15 North Dakota 288 204 0.71 164 0.57 112 0.39 Northern Mariana Isl. 11 * * 0 0.00 0 0.00 Ohio 4,612 2,567 0.56 2,103 0.46 464 0.10 Oklahoma 1,497 752 0.50 550 0.37 375 0.25 Oregon 1,567 966 0.62 744 0.47 691 0.44 Pennsylvania 5,059 3,274 0.65 2,611 0.52 2,211 0.44 Puerto Rico 1,373 248 0.18 * * 1 0.00 Rhode Island 413 319 0.77 284 0.69 * *South Carolina 1,871 1,027 0.55 875 0.47 359 0.19 South Dakota 330 218 0.66 160 0.49 120 0.36 Tennessee 2,567 1,400 0.55 1,198 0.47 909 0.35 Texas 9,383 5,744 0.61 4,754 0.51 2,178 0.23 Utah 923 660 0.72 424 0.46 364 0.39 Vermont 257 191 0.74 135 0.52 109 0.42 Virgin Islands 41 5 0.12 * * * *Virginia 3,155 2,184 0.69 1,836 0.58 1,519 0.48 Washington 2,723 1,877 0.69 1,497 0.55 1,402 0.51 West Virginia 767 337 0.44 295 0.38 252 0.33 Wisconsin 2,314 1,343 0.58 1,104 0.48 484 0.21 Wyoming 235 130 0.55 99 0.42 85 0.36
Total 121,061 77,208 0.64 63,191 0.52 39,357 0.33
Mbps = megabits per second and kbps = kilobits per second. * = Data withheld to maintain firm confidentiality.
Note: Figures may not sum to totals due to rounding.
Sources: FCC Form 477; Geolytics 2013 Block-Level Estimates (Households for U.S. and District of Columbia);
Census 2010 (Housing Units for Puerto Rico, American Samoa, Guam, Northern Mariana Islands and U.S. Virgin Islands).
Table 6.11Residential Fixed Connections per Household by Speed Tier as of December 31, 2014
(Households and Subscribers in thousands)
State Households3 Mbps/768 kbps 10 Mbps/ 1 Mbps 25 Mbps/3 Mbps
55

Group Telephone Service (%) Internet Access (%)
1 95.7 58.8
2 97.4 68.6
Statistically Significant Difference? Yes Yes
Source: American Community Survey 2014 PUMS data
Notes: Group one contains occupied housing units where the household income is less than or equal to 135% of the 2014 Federal Poverty Guideline for the household. Group 2 contains occupied housing units where household income is greater than 135% of the Federal Poverty Guideline, but less than or equal to 200% of the Federal Poverty Guideline for that Household. The statistical significance of the difference between the percentages for Group 1 and Group 2 was determined using a Satterthwaite t-test for unequal variances.
Table 6.12Telephone Service and Internet Access in Low-Income Households, 2014
56

Section 7 – Price Indices
Overview – Price Indices
This section contains information on telephone price indices using data from the Consumer Price Index (CPI) maintained by the Bureau of Labor Statistics (BLS). The BLS collects information on telephone service as part of the CPI.1 Monthly CPI data can be found on the Internet at www.bls.gov/cpi/. The monthly price indices represent prices sampled in the middle of the month. The CPI for telephone services is based on a “market basket” intended to represent the telephone-related expenditures of a typical urban household. It includes both land-line telephone service and wireless telephone service. In January 2010, BLS discontinued collecting four land-line telephone indices, including local charges, long distance charges, interstate toll calls, and intrastate toll calls. These four indices were combined into a single land-line telephone service index, which began in December 2009. The Producer Price Index (PPI), also published by BLS, continues to release sub-indices for telephone services. We no longer include them in this report because they have become less meaningful as the bundling of telephone services has become more common in the land-line telephone industry.2
1 BLS publishes two sets of Consumer Price Indices. The CPI-U, used herein, is based on expenditures of all urban consumers. The CPI-W series is based on expenditures of urban wage earners and clerical workers.
2 PPI data are available on the BLS website at www.bls.gov/ppi/.
57

1969-2014 2004-2014
CPI All Items (SA0) 4.2 % 2.2 %CPI All Services (SAS) 5.0 2.5
CPI Telephone Services (SEED) 1.8 0.3
CPI Major Categories: - Food & Beverages (SAF) 4.3 2.7 - Housing (SAH) 4.5 2.1 - Apparel (SAA) 1.9 0.5 - Transportation (SAT) 4.2 3.0 - Medical Care (SAM) 6.0 3.5 - Recreation (SAR) * 0.7 - Other Goods & Services (SAG) 5.4 2.9
CPI Public Transportation (SETG) 5.2 2.6 CPI Utility (Piped) Gas Service (SEHF02) 5.7 1.7 CPI Electricity (SEHF01) 4.4 3.8
CPI Water & Sewerage Maint. (SEHG01) 6.2 5.8 CPI Postage (SEEC01) 4.8 3.3
Table 7.1
Long-Term Changes for Various Price Indices
(Average Annual Rates of Change)
* Series not established until after 1969.
Note: The CPI Telephone Services index was revised in December of 1997. To calculate values in this table, Series MUUR0000SE270A is used for periods prior to this revision and CUUR0000SEED is used for periods after the revision. After each row, the series ID is provided and should be preceeded by CUUR0000 when referencing the series. Source: Bureau of Labor Statistics.
58
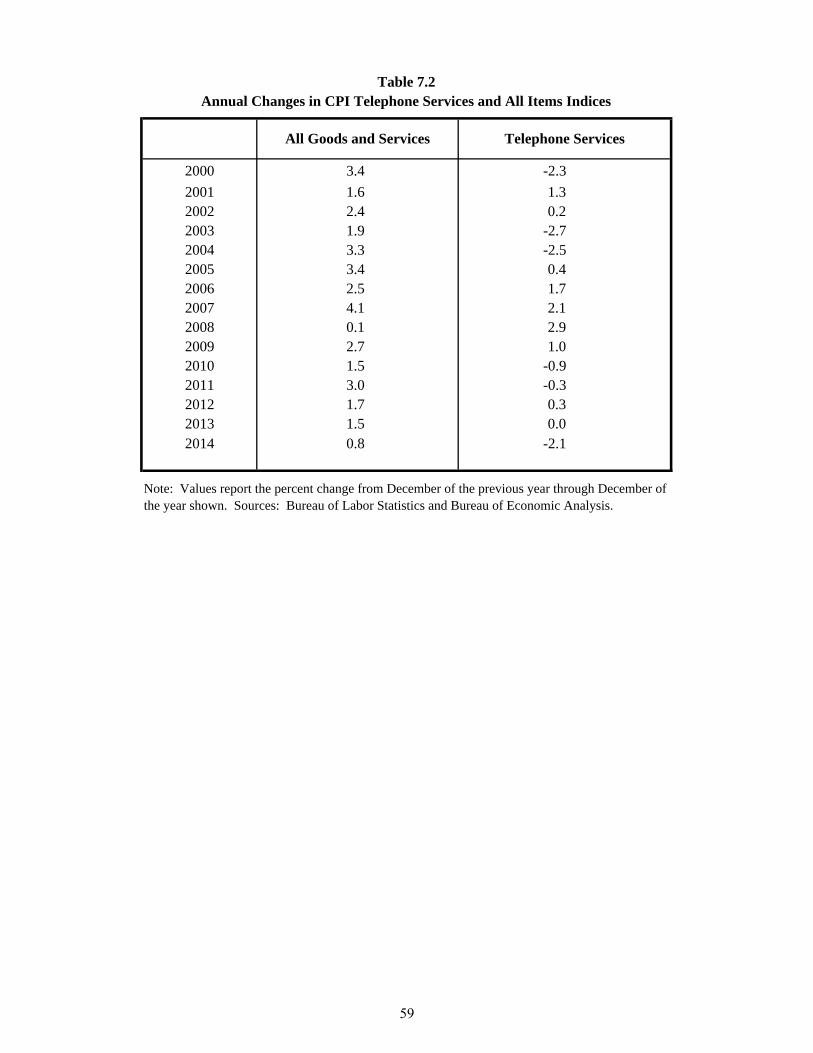
2000 3.4 -2.3
2001 1.6 1.32002 2.4 0.22003 1.9 -2.72004 3.3 -2.52005 3.4 0.42006 2.5 1.72007 4.1 2.12008 0.1 2.92009 2.7 1.02010 1.5 -0.92011 3.0 -0.32012 1.7 0.32013 1.5 0.02014 0.8 -2.1
Note: Values report the percent change from December of the previous year through December of the year shown. Sources: Bureau of Labor Statistics and Bureau of Economic Analysis.
Table 7.2Annual Changes in CPI Telephone Services and All Items Indices
All Goods and Services Telephone Services
59

All Goods and Services
Telephone ServicesLand-line
Telephone Services Wireless Telephone
Services
CUUR0000SA0 CUUR0000SEED CUUR0000SEED04 CUUR0000SEED032011 January 102.0 98.7 103.0 95.2
February 102.5 98.6 103.0 95.0March 103.5 98.6 103.1 94.8April 104.1 98.5 102.9 94.9May 104.6 98.5 102.9 94.8June 104.5 98.5 103.0 94.8July 104.6 98.3 103.3 94.1August 104.9 98.3 103.4 94.1September 105.1 98.4 103.6 94.1October 104.8 98.6 103.9 94.1November 104.8 98.6 103.9 94.1December 104.5 98.7 104.1 94.2
2012 January 105.0 99.0 104.9 94.2February 105.4 99.0 105.0 94.2March 106.2 99.1 105.2 94.2April 106.5 99.2 105.4 94.2May 106.4 99.3 105.5 94.3June 106.3 99.4 105.7 94.3July 106.1 98.9 105.6 93.6August 106.7 98.6 105.9 92.9September 107.2 98.7 105.7 93.2October 107.1 98.9 105.8 93.5November 106.6 99.0 106.1 93.4December 106.3 99.0 106.1 93.4
2013 January 106.6 99.3 107.1 93.3February 107.5 99.3 107.6 93.0March 107.8 99.2 107.6 92.9April 107.7 98.6 107.4 92.1May 107.9 98.6 107.6 92.1June 108.1 98.6 107.5 92.0July 108.2 98.7 108.2 91.8August 108.3 98.6 108.1 91.7September 108.4 98.8 108.8 91.7October 108.1 99.0 109.3 91.7November 107.9 98.9 109.2 91.6December 107.9 99.0 109.4 91.5
2014 January 108.3 99.3 111.1 91.4February 108.7 98.9 110.8 90.9March 109.4 98.9 110.8 90.8April 109.8 99.0 110.8 91.0May 110.2 98.9 111.1 90.7June 110.4 98.8 111.0 90.6July 110.3 98.8 111.1 90.6August 110.1 98.8 111.1 90.6September 110.2 98.8 111.2 90.5October 109.9 97.5 111.2 88.8November 109.4 97.1 111.0 88.3December 108.7 96.9 111.4 87.8
2015 January 108.2 96.8 112.3 87.4February 108.7 96.7 112.7 87.1March 109.3 96.3 113.1 86.4April 109.6 96.2 113.0 86.3May 110.1 95.9 113.3 85.7June 110.5 96.0 113.5 85.7July 110.5 96.2 113.6 86.0
Notes: Series values for All Goods and Services are converted from the 1982-1984 base index series reported by the Bureau of Labor Statistics (BLS). Series values for Telephone Services and Wireless Telephone Services are converted from the December 1997 base indexseries reported by BLS. Series are not seasonally adjusted. Series may be referenced via the BLS website with the Series ID listed at the top of each column.
Table 7.3Monthly Consumer Price Indices
(December 2009 = 100)
BLS Series ID
60

A - 1
Appendix: Additional Information Regarding Universal Service High-Cost Support
Table of Contents
Introduction ............................................................................................................................... A - 3
Connect America Phase I .......................................................................................................... A - 3
Figure 1: Phase I Election Results .............................................................................. A - 5
Figure 2: Planned Locations Connected Through Phase I by State ............................ A - 6
Figure 3: Planned Phase I Support by State ................................................................ A - 7
Connect America Phase II ........................................................................................................ A - 7
Figure 4: Accepted Price Cap CAF II Offers of Model Based Support by State ...... A - 11
Figure 5: Accepted Price Cap CAF II Offers of Model Based Support by Carrier ... A - 12
Rural Broadband Experiments ................................................................................................ A - 12
Figure 6: Authorized Rural Broadband Experiments ................................................ A - 14
Mobility Fund ......................................................................................................................... A - 14
Tribal Mobility Fund Phase I .................................................................................................. A - 15
Figure 7: Mobility and Tribal Mobility Phase I Authorized Support ........................ A - 16
Phase Out of Safety Net Additive ........................................................................................... A - 16
Figure 8: Safety Net Claims ...................................................................................... A - 17
Benchmarking Rule ................................................................................................................ A - 17
HCLS/ICLS ............................................................................................................................ A - 18
Figure 9: Rate-of-Return Carriers HCLS and ICLS Claims ..................................... A - 19
Elimination of Local Switching Support ................................................................................ A - 20
$250 per Line Cap ................................................................................................................... A - 20
Figure 10: Incumbent Study Areas with 2014 Annual High-Cost Support per Line Exceeding $3,000 ........................................................................................................ A - 21
Figure 11: High-Cost Support Reductions as Result of $250 per-month Cap .......... A - 22 Petitions for Waiver ................................................................................................................ A - 23
Alternative Connect America Model ...................................................................................... A - 23
Study Area Boundary Collection ............................................................................................ A - 24
Pricing of Services .................................................................................................................. A - 25
Figure 12: Reduction in High-Cost Loop Claims and Frozen Support Claims due to the Rate Floor ..................................................................................... A - 26
Figure 13: Summary of Broadband Results of Urban Rates Survey ........................ A - 28
Oversight and Accountability ................................................................................................. A - 28
Broadband Deployment and Adoption ................................................................................... A - 29

A - 2
Figure 14: Fixed Connection Deployment of at Least 3 Mbps/768 kbps ...................................................................................................... A - 30 Figure 15: Fixed Connection Deployment of at Least 10 Mbps/768 kbps .................................................................................................... A - 31 Figure 16: Fixed Connections at Least 3 Mbps Downstream and 768 kbps Upstream for Incumbent Local Exchange Carriers ..................................................................... A - 31 Figure 17: Fixed Connections at Least 10 Mbps Downstream and 768 kbps Upstream for Incumbent Local Exchange Carriers ..................................................................... A - 32 Figure 18: Switched Access Lines and Interconnected VoIP Subscribers for Incumbent Local Exchange Carriers ......................................................................................... A - 32
A - 3
Introduction. The Federal Communications Commission’s (Commission) 2011 USF/ICC Transformation Order comprehensively reformed and modernized the high-cost program within the universal service fund to support networks capable of providing voice and broadband services.1 Among other actions taken in that Order, the Commission adopted a framework, known as the Connect America Fund (CAF), to provide ongoing support to areas served by price cap carriers while maintaining existing support mechanisms for rate-of-return carriers, with some modifications. The Commission’s goals are to: “(1) preserve and advance universal availability of voice service; (2) ensure universal availability of modern networks capable of providing voice and broadband service to homes, businesses, and community anchor institutions; (3) ensure universal availability of modern networks capable of providing mobile voice and broadband service where Americans live, work, and travel; (4) ensure that rates are reasonably comparable in all regions of the nation, for voice as well as broadband services; and (5) minimize the universal service contribution burden on consumers and businesses.”2
This appendix of the Monitoring Report provides a summary of the actions taken through
December 11, 2015 to implement the high-cost program reforms and updates the data previously published in 2014 Universal Service Monitoring Report.3
Connect America Phase I. Phase I of the Connect America Fund implementation consisted
primarily of two parts. First, the Commission froze support under existing high-cost support mechanisms for price cap carriers and their rate-of-return affiliates and required that frozen support during Phase I be used to build and operate voice and broadband-capable networks used to offer the provider’s own retail broadband service in areas substantially unserved by an unsubsidized competitor.4 Second, to spur the deployment of voice and broadband-capable infrastructure to unserved locations while the Wireline Competition Bureau (Bureau) developed a forward-looking cost model to calculate the offer of Phase II support to price cap carriers, the Commission decided to offer additional, incremental support to price cap carriers.5
1 See Connect America Fund; A National Broadband Plan for Our Future; Establishing Just and Reasonable Rates for Local Exchange Carriers; High-Cost Universal Service Support; Developing a Unified Intercarrier Compensation Regime; Federal-State Joint Board on Universal Service; Lifeline and Link-Up; Universal Service Reform—Mobility Fund; WC Docket Nos. 10-90, 07-135, 05-337, 03-109, CC Docket Nos. 01-92, 96-45, GN Docket No. 09-51, WT Docket No. 10-208, Report and Order and Further Notice of Proposed Rulemaking, 26 FCC 17663 (2011) (USF/ICC Transformation Order and/or FNPRM), aff’d In re: FCC 11-161, 753 F.3d 1015 (10th Cir. 2014). 2 USF/ICC Transformation Order, 26 FCC Rcd at 17680, para. 48 (footnote omitted).
3 2014 Universal Service Monitoring Report Appendix, available athttps://apps.fcc.gov/edocs_public/attachmatch/DOC-330829A1.pdf.
4 Id. at 17712, para. 128; see also 47 C.F.R. § 54.313(c). A price cap carrier recipient of frozen support was required to certify that an increasing portion of its frozen support was used to build and operate broadband-capable networks used to offer the provider’s own retail broadband service in areas substantially unserved by an unsubsidized competitor. Recipients had to certify that 1/3 of frozen support received in 2013 was used for such purposes, increasing to 2/3 of frozen support in 2014, and all frozen support in 2015 and beyond. However, the use of frozen support is not limited to new capital investment occurring in 2013 and beyond. In calculating the amount of frozen support used to build and operate such networks, carriers are permitted to include the funds used to maintain and operate existing networks in areas substantially unserved by an unsubsidized competitor, as well as funds used to recover the costs of past network upgrades to extend broadband-capable networks in areas substantially unserved by an unsubsidized competitor. Connect America Fund et al., WC Docket No. 10-90 et al., Order, 28 FCC Rcd 14887, 14890, para. 10 (Wireline Comp. Bur. 2013).
5 USF/ICC Transformation Order, 26 FCC Rcd at 17715-17, paras. 133-38.

A - 4
In Round 1 of Connect America Phase I, support to extend broadband-capable infrastructure was made available for areas lacking Internet access with speeds of at least 768 kbps downstream/200 kbps upstream. In July 2012, price cap carriers elected nearly $115 million in Phase I incremental support, committing to bring broadband-capable infrastructure to nearly 400,000 previously unserved Americans by 2015.6 A map of states where carriers planned to use first round Phase I funding is available at http://www.fcc.gov/maps/connect-america-fund-caf-phase-i. The deadline for completion of deployment for the first round of Phase I incremental support was July 2015.
In May 2013, the Commission adopted rules for a second round of Connect America Phase I
incremental support.7 The Commission expanded the eligible locations to include areas lacking Internet access with 3 Mbps downstream and 768 kbps upstream8 and concluded that parties could challenge whether a location was in fact served by an existing provider and thus ineligible for support.9 On January 10, 2014, the Bureau issued an Order adjudicating challenges filed by over 80 interested parties.10
In Round 2 of Connect America Phase I, further support to extend broadband-capable
infrastructure was provided. By March 2014, the Bureau had authorized nearly $324 million in Phase I Round 2 support for deployment of broadband-capable infrastructure to over 1.2 million Americans.11 Included in this 1.2 million are 650,000 Americans who will receive access to broadband-capable infrastructure due to the Commission’s decision to expand the eligible areas to include areas lacking 3 Mbps downstream and 768 kbps upstream. A map of areas where carriers plan to use second round Phase I funding is available at http://www.fcc.gov/maps/connect-america-fund-phase-i-round-two.
6 Press Release, FCC, FCC Kicks-Off ‘Connect America Fund’ with Major Announcement: Nearly 400,000 Unserved Americans in Rural Communities in 37 States Will Gain Access to High-Speed Internet Within Three Years (July 25, 2012) (available at http://hraunfoss.fcc.gov/edocs_public/attachmatch/DOC-315413A1.pdf).
7 Connect America Fund, WC Docket No. 10-90, Report and Order, 28 FCC Rcd 7766 (2013) (Phase I Order).
8 Id. at 7771-72, paras. 15-16.
9 Id. at 7776-79, paras. 28-33.
10 Id.
11 Id.; Over $32 Million of Connect America Funding Authorized to Connect Unserved Homes and Businesses in Alaska, Hawaii, and Puerto Rico, WC Docket No. 10-90, Public Notice, 28 FCC Rcd 14896 (Wireline Comp. Bur 2013); Over $255 Million of Connect America Funding Authorized to Connect Unserved Homes and Businesses in 41 States, WC Docket No. 10-90, Public Notice, 28 FCC Rcd 16450 (Wireline Comp. Bur. 2013). Price cap carriers that made conditional elections were given the opportunity to modify their elections, specifying additional locations in already authorized Census blocks. Phase I Challenge Process Resolution Order, 29 FCC Rcd at 238, para. 299. Windstream and AT&T subsequently revised their elections in light of the resolution of the challenges. On March 14, 2014, the Bureau authorized an additional $16,713,875 in Phase I incremental support for a further 20,045 locations. See Additional $16.7 Million in Connect America Phase I Support Authorized, WC Docket No. 10-90, Public Notice, 29 FCC Rcd 2824 (Wireline Comp. Bur. rel. Mar. 14, 2014).

A - 5
Figure 1 Phase I Election Results
(Source: Carrier Phase I Round I and II elections available on the Electronic Comment Filing System as of March 14, 2014)
Round Persons
Served Locations
Served Funding States
Served
Round One (2012) 385,085 147,542 $114,343,753 37
Round Two (2013-14) 1,278,229 489,743 $323,948,319 43 plus PR
Total 1,663,314 637,285 $438,292,072 45 plus PR
The following chart shows the number of locations, by state, where price cap carriers have
indicated that they plan to deploy broadband-capable infrastructure using Connect America Phase I support.12
12 After providing the Commission with notice, carriers had the ability to alter deployment plans to other unserved Census blocks changing deployment to more or fewer locations in any given state. Phase I Order, 28 FCC Rcd at 7777, para. 31 n.60; Connect America Fund, WC Docket No. 10-90, Order on Reconsideration, 28 FCC Rcd 10488, 10489-91, paras. 4-7 (2013) (Phase I Sua Sponte Reconsideration). AT&T, HTI, PRTC and ACS filed updated deployment plans. See Wireline Competition Bureau Announces Deadline For Existing Providers to Notify AT&T That They Serve Census Blocks That AT&T Proposes to Serve With Connect America Phase I Incremental Support, WC Docket No. 10-90, Public Notice, 30 FCC Rcd 412 (2015); Wireline Competition Bureau Announces Deadline For Existing Providers to Notify Puerto Rico Telephone Company or Hawaiian Telecom, Inc. That They Serve Census Blocks That The Price Cap Carriers Propose to Serve With Connect America Phase I Incremental Support, WC Docket No. 10-90, Public Notice, 30 FCC Rcd 1862 (2015); Wireline Competition Bureau Announces Deadline For Existing Providers to Notify Alaska Communications Systems That They Serve Census Blocks That Alaska Communications Systems Proposes to Serve With Connect America Phase I Incremental Support, WC Docket No. 10-90, Public Notice, 30 FCC Rcd 2791 (2015).

A - 6
0 10,000 20,000 30,000 40,000 50,000 60,000 70,000
WY
WV
WI
WA
VT
VA
UT
TX
TN
SD
SC
RI
PR
PA
OR
OK
OH
NY
NV
NM
NJ
NH
NE
ND
NC
MT
MS
MO
MN
MI
ME
MD
MA
LA
KY
KS
IN
IL
ID
IA
HI
GA
FL
DE
DC
CT
CO
CA
AZ
AR
AL
AK
Figure 2Planned Locations Connected Through Phase I by State
(Source: Carrier Phase I Round I and II elections available on ECFS)
Round One Support
Round Two Support

A - 7
The table below shows dollars of funding, by state, where price cap carriers have committed to deploy broadband-capable infrastructure using Connect America Phase I support.13
Connect America Phase II. In the USF/ICC Transformation Order, the Commission determined
that it would provide support in Phase II through a combination of “a new forward-looking model of the 13 Id.
$- $10,000,000 $20,000,000 $30,000,000 $40,000,000 $50,000,000
WY
WV
WI
WA
VT
VA
UT
TX
TN
SD
SC
RI
PR
PA
OR
OK
OH
NY
NV
NM
NJ
NH
NE
ND
NC
MT
MS
MO
MN
MI
ME
MD
MA
LA
KY
KS
IN
IL
ID
IA
HI
GA
FL
DE
DC
CT
CO
CA
AZ
AR
AL
AK
Figure 3Planned Phase I Support by State
(Source: Carrier Phase I Round I and II elections available on ECF)
Round One Support
Round Two Support

A - 8
cost of constructing modern multi-purpose networks” and a competitive bidding process.14 Using the cost model to “estimate the support necessary to serve areas where costs are above a specified benchmark, but below a second ‘extremely high-cost’ benchmark,” the Commission concluded it would offer each price cap carrier “a model-derived support amount in exchange for a commitment to serve all locations in its service territory in a state that, based on the model, fall within the high-cost range and are not served by an competing, unsubsidized provider.”15
Subsequently, the Commission adopted rules that built on the framework established in the
USF/ICC Transformation Order, while proposing targeted adjustments necessary to ensure the funds that consumers and businesses pay into the universal service system are utilized effectively.16 Specifically, in the April 2014 Connect America Order and FNPRM, the Commission established a three-year phase-down period for carriers that chose model-based support that is less than the frozen high-cost support the carrier previously received in order to avoid flash cuts.17
Further, in the December 2014 Connect America Order, the Commission finalized the decisions
necessary to proceed with the offer of support to price cap carriers.18 In particular, the Commission revised the minimum speed requirement to 10 Mbps downstream.19 The Commission also increased the term of support to six years, adopted more evenly spaced interim deployment milestones, and concluded that, in limited circumstances, adjustments of up to five percent in the number of locations that must be served with corresponding support reductions are appropriate to ensure that deployment obligations recognize conditions in the real world.20 Additionally, the Commission forbore from the federal high-cost universal service obligation for price cap carriers to offer voice service in low-cost areas where they do not receive high-cost support, in areas served by an unsubsidized competitor, and in areas where the price cap carrier is replaced by another ETC.21 The Commission also addressed the eligibility of certain areas for Phase II support, both for the offer of model-based support to price cap carriers and the subsequent Phase II competitive bidding process.22 Finally, the Commission took several steps to strengthen the uniform national framework for accountability by codifying the broadband reasonable comparability rates certification requirement, requiring price cap carriers that accept model-based support to submit specific location information, by adjusting the framework for reduction in support for late-filed reports and certifications, and by adopting measures for addressing non-compliance.23 14 USF/ICC Transformation Order, 26 FCC Rcd at 17725, para. 156.
15 Id. The Commission concluded that for all states for which price cap carriers decline to make the service commitment, it would award ongoing support through a competitive process.
16 Connect America Fund, Universal Service Reform – Mobility Fund, ETC Annual Reports and Certifications, Establishing Just and Reasonable Rates for Local Exchange Carriers, Developing an Unified Intercarrier Compensation Regime, WC Docket Nos. 10-90, 10-208, 14-58, 07-135, CC Docket No. 01-92, 29 FCC Rcd 7051 (Wireline Comp. Bur. 2014) (April 2014 Connect America Order).
17 Id. at 7066-67, paras. 50-51.
18 Connect America Fund, ETC Annual Reports and Certifications, Petition of USTelecom for Forbearance Pursuant to 47 U.S.C. §160(c)from Obsolete ILEC Regulatory Obligations that Inhibit Deployment of Next-Generation Networks, WC Docket Nos. 10-90, 14-58, 14-192, Report and Order, 29 FCC Rcd 15644 (2014) (December 2014 Connect America Order).
19 December 2014 Connect America Order, 29 FCC Rcd at 15649, paras. 15-29.
20 Id. at 15656-61, paras. 31-44.
21 Id. at 15663-71, paras. 51-70.
22 Id. at 15671-74, paras. 73-81.
23 Id. at 15686-701, paras. 118-157.

A - 9
In the USF/ICC Transformation Order, the Commission delegated to the Bureau “the task of
selecting a specific engineering cost model and associated inputs that meet the criteria specified” by the Commission.24 The Commission also directed the Bureau to consider “whether the model ultimately adopted adequately accounts for the costs faced by carriers serving [areas outside of the United States].”25
In April 2013, the Bureau adopted a platform for the Connect America Cost Model (CACM or
CAM), which is the basic framework for the model consisting of key assumptions about the design of the network and network engineering, and also addressing certain framework issues relating to inputs.26 In April 2014, the Bureau released an order finalizing decisions regarding the engineering assumptions in the CAM and adopting the inputs necessary for the model to calculate the cost of serving Census blocks in price cap areas.27
In the USF/ICC Transformation Order, the Commission also specified that Phase II support
would not be provided in areas served by an unsubsidized competitor, and it delegated to the Bureau the responsibility of determining those areas.28 The Commission also specified that there be a process by which parties could challenge that initial determination of whether or not an area is unserved by an unsubsidized competitor. On June 30, 2014, the Bureau commenced the Phase II challenge process. 29 On September 26, 2014, the Bureau released a list of challenges that merited responses, giving parties 45 days to reply.30 Responses to the prima facie challenges were due November 10. On March 30, 2015, the Bureau released the Phase II Challenge Process Resolution Order.31 In that order the Bureau concluded the Connect America Phase II challenge process and made a final determination regarding over 95,000 census blocks. The Bureau announced the results of the review of the challenges and replies, and provided an accompanying listing of those census blocks that will be treated as served and those that will be treated as unserved for purposes of calculating the Phase II offer of model-based support to price cap carriers. The Bureau concluded, based on review of the challenges and replies, that 57,288 census blocks should be treated as unserved and that 36,700 census blocks should be treated as served.
24 USF/ICC Transformation Order, 26 FCC Rcd at 17725, para. 157; see also id. at 17737, para. 192.
25 Id. at 17737, para. 193. These “non-contiguous areas” are Alaska, Hawaii, Puerto Rico, the U.S. Virgin Islands, and the Northern Marianas Islands. See id.
26 See Connect America Fund; High-Cost Universal Service Support, WC Docket Nos. 10-90, 05-337, Report and Order, 28 FCC 5301 (Wireline Comp. Bur. 2013) (CAM Platform Order).
27 Connect America Fund et al., WC Docket No. 10-90 et al., Report and Order, 29 FCC Rcd 3964 (Wireline Comp. Bur. 2014) (CAM Inputs Order).
28 USF/ICC Transformation Order, 26 FCC Rcd at 17729, para. 170; see also Connect America Fund, WC Docket No. 10-90, Report and Order, 28 FCC Rcd 15060, 15076-80, paras. 39-47 (Wireline Comp. Bur. 2013) (Phase II Service Obligations Order); Connect America Fund, WC Docket No. 10-90, Report and Order, 28 FCC Rcd 7211 (Wireline Comp. Bur. 2013) (Phase II Challenge Process Order).
29 Wireline Competition Bureau Commences Connect America Phase II Challenges Process, WC Docket No. 14-93 et al., Public Notice, 29 FCC Rcd 7986 (Wireline Comp. Bur. 2014).
30 Replies Sought in Connect America Phase II Challenge Process, WC Docket Nos. 10-90, 14-93, 29 FCC Rcd 11497, Public Notice (Wireline Comp. Bur. rel. Sept. 26, 2014). The Bureau concluded that 24,225 challenges made a valid prima facie case that a Census block should be treated as served, while 70,868 challenges made a valid prima facie case that a Census block should be treated as unserved.
31 Connect America Phase II Challenge Process, WC Docket Nos. 10-90; 14-93, Order, 30 FCC Rcd 2718 (Wireline Comp. Bur. 2015) (Phase II Challenge Process Resolution Order).

A - 10
On April 29, 2015 the Bureau announced the offers of model-based Phase II Connect America support to price cap carriers to fund the deployment of voice and broadband-capable networks in their service territories, a total of $1.675 billion annually for six calendar years (2015-2020).32 The carriers had 120 days (until August 27, 2015) to decide whether to accept the offers on a state-by-state basis.
On August 27, 2015, the Bureau announced that ten telecommunications carriers accepted over
$1.5 billion in annual support for rural broadband deployment from the Connect America Fund to serve over 3.6 million homes and businesses by the end of 2020.33 This support, along with carrier investment, will expand broadband to nearly 7.3 million rural consumers in 45 states and one U.S. territory. In states where the carriers declined support, a competitive bidding process will be used to select entities that will be authorized to receive funding. The carriers accepting support include AT&T, Cincinnati Bell, CenturyLink, Consolidated Communications, Fairpoint Communications, Frontier Communications, Hawaiian Telecom, Micronesian Telecom, Verizon,34 and Windstream.35 Figures 4 and 5 show accepted support by state and by carrier, respectively.
32 Wireline Competition Bureau Announces Connect America Phase II Support Amounts Offered to Price Cap Carriers to Expand Rural Broadband, WC Docket No. 10-90, Public Notice, 30 FCC Rcd 3905 (Wireline Comp. Bur. 2015).
33 Carriers Accept Over $1.5Billion in Annual Support from Connect America Fund to Expand and Support Broadband for Nearly 7.3 Million Rural Consumers in 45 States and One Territory, Press Release, Doc-335082A1 (Wireline Comp. Bur 2015).
34 Verizon accepted $31,978,057 in annual support for California and $16,576,929 in annual support for Texas conditioned “upon issuance and acceptance of” regulatory approvals for Frontier Communications’ acquisition of Verizon’s subsidiaries in California and Texas. See Verizon Communications Inc. Conditionally Accepts Over $48.5 Million in Connect America Phase II Support in California and Texas, WC Docket No. 10-90, Public Notice, 30 FCC Rcd 8594 (Wireline Comp. Bur. 2015).
35 Id. The Bureau provided all non-contiguous carriers the option of choosing either to continue to receive frozen support amounts or to elect to receive the model-determined support amount. CAM Inputs Order, 29 FCC Rcd at 4019. ACS (Alaska), PRTC (Puerto Rico), and Vitelco (Virgin Islands) elected to receive frozen support. Later, the Commission proposed and sought comment on specific service obligations for non-contiguous carriers electing to continue to receive frozen support amounts. April 2014 Connect America FNPRM, 29 FCC Rcd at 7117-7121. The Commission has not yet specified the obligations for those three companies.

A - 11
Figure 4
Accepted Price Cap CAF II Offers of Model Based Support By State (Source: https://apps.fcc.gov/edocs_public/attachmatch/DOC-335269A5.xlsx)
State Homes & Businesses
Served Support Amount In
Dollars AL 126,497 $44,767,752 AR 129,812 $54,276,126 AZ 46,526 $23,370,158 CA 231,835 $98,330,096 CO 53,139 $26,509,143 CT 1,388 $435,139 FL 80,909 $26,836,154 GA 134,005 $50,858,551 HI 11,081 $4,424,319 IA 88,214 $53,200,244 ID 22,379 $11,502,990 IL 92,519 $50,128,844 IN 135,082 $51,128,227 KS 64,393 $35,443,694 KY 152,742 $54,573,721 LA 99,302 $37,378,605 MA 252 $63,258 ME 35,500 $13,289,220 MI 180,377 $60,512,568 MN 170,355 $85,622,871 MO 189,323 $93,728,312 MP 11,143 $2,627,177 MS 139,269 $51,506,992 MT 35,941 $16,310,111 NC 68,267 $19,055,517 ND 8,044 $5,656,741 NE 35,839 $23,215,615 NH 13,131 $4,376,606 NJ 1,881 $450,340 NM 32,340 $15,369,074 NV 5,235 $2,451,840 NY 59,627 $21,444,471 OH 166,967 $58,483,365 OK 17,391 $8,003,516 OR 50,327 $21,657,260 PA 76,777 $27,694,806 SC 49,358 $16,286,714 SD 15,071 $9,117,215 TN 93,422 $29,927,295 TX 212,492 $93,131,882 UT 9,506 $4,441,848 VA 52,433 $16,588,786 VT 28,399 $8,789,359 WA 81,865 $34,421,951 WI 230,451 $95,438,696 WV 89,190 $38,068,337

A - 12
Figure 5 Accepted Price Cap CAF II Offers of Model Based Support By Carrier
(Source: https://apps.fcc.gov/edocs_public/attachmatch/DOC-335269A5.xlsx)
Price Cap Carrier
States Served
Homes & Businesses
Served
Support Amount In
Dollars
AT&T AL, AR, CA, FL, GA, IL, IN, KS, KY, LA, MI, MS, NC, OH, SC, TN, TX, WI
1,117,806 $427,706,650
CINCINNATI BELL KY, OH 7,084 $2,229,130
CENTURYLINK
AL, AR, AZ, CO, FL, GA, IA, ID, IL, IN, KS, LA, MI, MN, MO, MT, NC, ND, NE, NJ, NM, NV, OH, OR, PA, SC, SD, TN, TX, UT, VA, WA, WI
1,174,142 $505,702,762
CONSOLIDATED COMMUNICATIONS
CA, IA, IL, MN, PA,TX 24,698 $13,922,480
FAIRPOINT COMMUNICATIONS
AL, FL, IL, MA, ME, MO, NH, NY, OH, OK, PA, VA, VT, WA
105,220 $37,430,669
FRONTIER COMMUNICATIONS
AL, AZ, CA, CT, FL, GA, IA, ID, IL, IN, MI, MN, MS, MT, NC, NE, NM, NV, NY, OH, OR, PA, SC, TN, UT, WA, WI, WV
659,587 $283,401,855
HAWAIIAN TELCOM INC
HI 11,081 $4,424,319
MICRONESIAN TELECOMM
MTC 11,143 $2,627,177
VERIZON CA, TX 114,610 $48,554,986WINDSTREAM COMMUNICATIONS
AL, AR, FL, GA, IA, KY, MN, MO, MS, NC, NE, NY, OH, OK, PA, SC, TX
404,625 $174,895,478
Rural Broadband Experiments. Taking further steps to implement the Connect America Fund, in
July 2014, the Commission adopted a $100 million budget for rural broadband experiments and established an objective methodology for selecting projects among formal applications from those carriers that would deploy new, robust broadband to consumers in price cap areas.36 The $100 million available for the experiments was divided into three groups as follows:
$75 million to test competitive interest in building networks that are capable of delivering 100 Mbps downstream and 25 Mbps upstream, with an initial requirement to offer 25 Mbps downstream/5 Mbps upstream;
$15 million to test interest in delivering service at 10 Mbps downstream/1 Mbps upstream speeds in high cost areas; and
$10 million for 10 Mbps downstream/1 Mbps upstream service in areas that are extremely costly to serve.
Applications were due on November 7, 2014. On December 5, 2014, the Bureau announced 37 bidders that were provisionally selected for funding in each category, subject to the post-selection
36 Connect America Fund, ETC Annual Reports and Certifications, Report and Order and Further Notice of Proposed Rulemaking, 29 FCC Rcd 8769 (2014).

A - 13
process.37 Collectively the bidders sought support to cover 26,867 census blocks in 25 states and Puerto Rico. Following this announcement, some winners indicated they were no longer interested and others defaulted on their bids. Still others sought waiver of the audited financial documents requirement and submitted other documentation instead. On December 23, 2014, the Bureau announced those bidders that defaulted and the availability of $716,000 in additional funding.38 Entities interested in being considered next-in-line were permitted to submit required documents until January 6, 2015. On February 3, 2015 the Bureau announced the next-in-line bidders.39 On March 4, 2015, the Bureau announced 12 additional provisionally selected bidders.40 On August 7, 2015, the Bureau authorized $11,273,764 in rural broadband experiment support for four bidders to provide broadband in 1,889 census blocks in five states.41 On September 11, 2015, the Bureau authorized $1,299,730.45 in rural broadband experiment support for two bidders to provide broadband in 202 census blocks in three states.42 On September 29, 2015, the Bureau authorized $2,821,652.85 in rural broadband experiment support for two bidders for 292 census blocks in two states.43 On November 12, the Bureau authorized $16,138,691.71 in rural broadband experiment support for four bidders for 2,451 census blocks in 5 states.44 On December 11, 2015, the Bureau authorized $5,196,652.85 in rural broadband experiment support for 3 bidders for 617 census blocks in three states.45 Figure 6 summarizes the entities that had been authorized as of December 11, 2015.46
37 Wireline Competition Bureau Announces Entities Provisionally Selected for Rural Broadband Experiments; Sets Deadlines For Submission of Additional Information, WC Docket No. 10-90, Public Notice, 29 FCC Rcd 14684 (Wireline Comp. Bur. rel. Dec. 5, 2014).
38 Wireline Competition Bureau Announces Availability of Additional Funding For Rural Broadband Experiments, WC Dockets No. 10-90; 14-259, Public Notice, 29 FCC Rcd 16243 (Wireline Comp. Bur 2014)
39 Wireline Competition Bureau Announces Entities Under Consideration As Next-In-Line Bidders for Rural Broadband Experiments, WC Docket Nos. 10-90; 14-259, Public Notice, 30 FCC Rcd 1045 (Wireline Comp. Bur 2015).
40 Wireline Competition Bureau Announces Additional Provisionally Selected Bidders For Rural Broadband Experiments, WC Docket Nos. 10-90; 14-259, Public Notice, 30 FCC Rcd 2045 (Wireline Comp. Bureau 2015).
41 Rural Broadband Experiment Support Authorized for Ten Winning Bids, et. al., WC Docket Nos. 10-90; 14-259, Public Notice, 30 FCC Rcd 8283 (Wireline Comp. Bur. 2015).
42 Rural Broadband Support Authorized for Five Winning Bids, et. al., WC Docket Nos. 10-90; 14-259, Public Notice, 30 FCC Rcd 9886 (Wireline Comp. Bur 2015).
43 Wireline Competition Bureau Announces Rural Broadband Experiments Support for 3 Provisionally Selected Bids Is Ready To Be Authorized, WC Docket Nos. 10-90; 14-259, Public Notice, DA 15-1092 (Wireline Comp. Bur rel. Sept. 29, 2015).
44 Rural Broadband Experiment Support Authorized for Winning Bids Submitted by Skybeam, LLC, Daktel Communications, LLC, Federated Telephone Cooperative, and Paul Bunyan Rural Telephone Cooperative, Public Notice, DA 15-1306 (Wireline Comp. Bur rel. Nov. 12, 2015).
45 Rural Broadband Experiment Support Authorized for Winning Bids Submitted by BARC Electric Cooperative, Douglas Services, Inc., and Northeast Rural Services, Inc., WC Docket Nos. 10-9-, 4-259, Public Notice, DA 15-1416 (Wireline Comp. Bur. rel. Dec. 11, 2015).
46 As of December 11, 2015, $77,614,949 in funding has been authorized or is still under consideration, some cases subject to pending appeals.

A - 14
Figure 6
Authorized Rural Broadband Experiments (Source https://www.fcc.gov/general/rural-broadband-experiments)
Authorized Bidder State Total Amount
Total Census Blocks (CBs)
Total price-cap
locations within CBs
Technology
Speeds Offered
(Up/Down Mbps)
Date Authorized
Allamakee-Clayton Elect. Coop., Inc. (Category 2)
IA $1,453,593.00 209 665 Hybrid fiber/ fixed wireless
10/1 8/7/2015
BARC Electric Cooperative (Category 1)
VA $239,918.00 64 801 Fiber
25/5; 35/10; 50/15; 75/25; 120/25; 250/35; 1,000/50
12/11/2015
Consolidated Commc’ns Networks, Inc. (Category 3)
ND $3,096,810.00 103 171 Fiber 10/1 8/7/2015
Daktel Commc’ns, LLC (Cateogry 1)
ND $875,000.00 109 508 Fiber 25/5; 50/5 11/12/2015
Delta Commc’ns LLC (Category 3)
IL $2,196,000.00 78 122 Fiber 10/1 8/7/2015
Douglas Services, Inc. (Category 1)
OR $2,375,000.00 325 2495 Fiber 50/100; 100/25; 250/25
12/11/2015
Federated Tel. Coop. (Category 1)
MN $1,455,961.71 95 344 Fiber
20/20; 50/50;
100/100; 300/300
11/12/2015
First Step Internet, LLC (Category 2)
ID, WA
$415,855.00 116 453 LTE Wireless
(3.65 GHz) 10/1 9/11/2015
Ne Rural Serv., Inc. (Category 1)
OK $3,465,610.30 314 2115 Fiber 25/5 (up to
1,000) 9/11/2015; 12/11/2015
Paul Bunyan Rural Tel. Coop. (Category 1)
MN $1,962,000.00 134 1839 Fiber
25/5; 250/250;
500/500 (up to 1,000)
11/12/2015
Skybeam, LLC (Category 1)
IA, NE, TX,
IL, KS
$16,373,091.00 3612 15957 Fixed Wireless 5/1; 10/2;
25/5 8/7/2015;
11/12/2015
Total 12 states
$33,908,839.01 5159 25470
Mobility Fund. For the first time, in the USF/ICC Transformation Order, the Commission
established a universal service support mechanism dedicated exclusively to mobile services – the Mobility Fund. Initial Mobility Fund Phase I support was awarded through a nationwide reverse auction, Auction 901, held in September 2012. This auction made available up to $300 million in one-time support to accelerate deployment of networks for mobile voice and broadband services in areas unserved by current generation or 3G networks. In this auction, there were a total of 33 winning bidders. The winning bidders are eligible to receive a total of $299,998,632 in one-time Mobility Fund Phase I universal service support to provide 3G or better mobile voice and broadband services covering up to approximately 83,000 road miles in 795 biddable geographic areas located in 31 states and 1 territory. Since April 2013, the Wireless Telecommunications and Wireline Competition Bureaus have authorized
A - 15
initial disbursements for over $270 million in winning bids, and announced over $27 million in auction defaults. Of the authorized winning bids, five winning bidders subsequently defaulted on their performance obligations for bids totaling over $55 million. A performance default by Allied Wireless Communications Corporation (Allied), accounted for over 86 percent of the total performance default amount and occurred because Allied’s parent company assigned to AT&T the licenses that Allied needed to meet its performance requirements. The Bureaus are actively processing the remaining application for support as well as second and final disbursements.
Tribal Mobility Fund Phase I. The Commission set aside $50 million in one-time (Phase I)
support to accelerate immediately deployment of networks for mobile voice and broadband services in unserved Tribal land areas to be awarded through a separate complementary one-time Tribal Mobility Fund Phase I auction. This auction, designated Auction 902, was completed on February 25, 2014. The five winning bidders are eligible to receive a total of up to $49,806,874 in one-time Tribal Mobility Fund Phase I universal service support to provide 3G or better mobile voice and broadband services covering a population of 56,932 in 80 biddable areas. These areas include 18 biddable areas on five Reservations or Tribal lands in Arizona, Montana, New Mexico, and Utah; and 62 biddable areas in 49 Alaska Native Village Statistical Areas and 13 bidding areas otherwise in Alaska Native Regions. The Bureaus have authorized $49,806,874 in support.
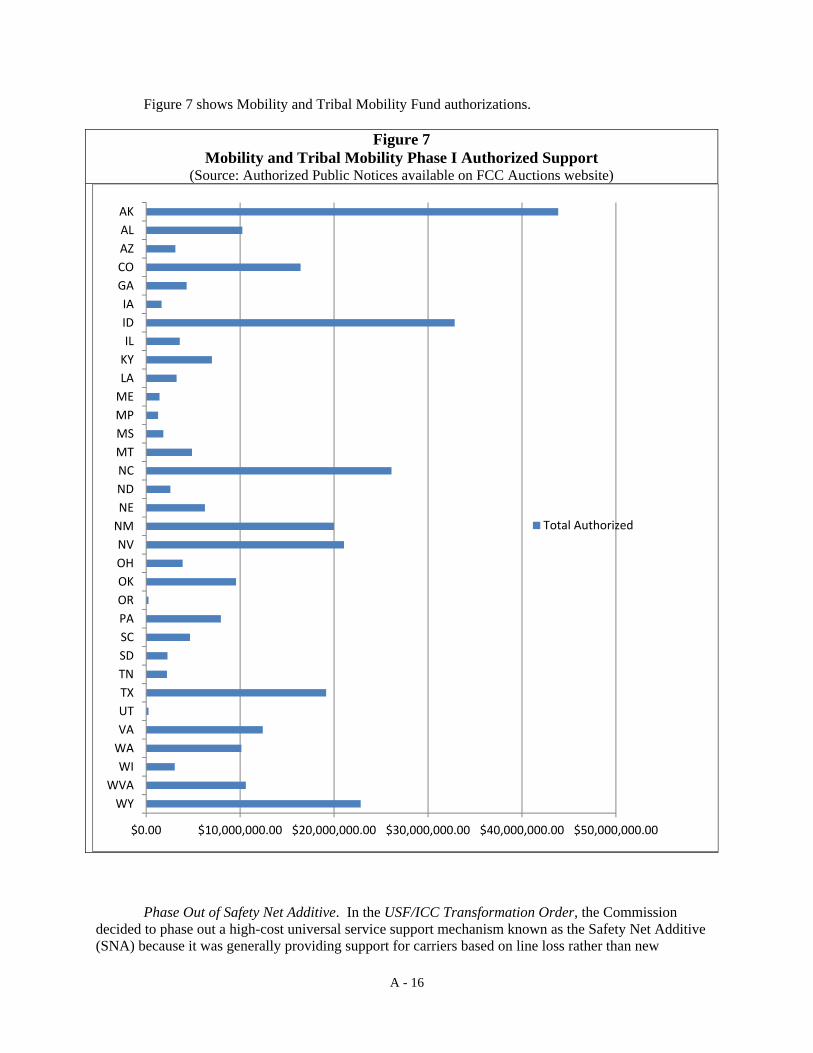
A - 16
Figure 7 shows Mobility and Tribal Mobility Fund authorizations.
Figure 7 Mobility and Tribal Mobility Phase I Authorized Support
(Source: Authorized Public Notices available on FCC Auctions website)
Phase Out of Safety Net Additive. In the USF/ICC Transformation Order, the Commission
decided to phase out a high-cost universal service support mechanism known as the Safety Net Additive (SNA) because it was generally providing support for carriers based on line loss rather than new
$0.00 $10,000,000.00 $20,000,000.00 $30,000,000.00 $40,000,000.00 $50,000,000.00
WY
WVA
WI
WA
VA
UT
TX
TN
SD
SC
PA
OR
OK
OH
NV
NM
NE
ND
NC
MT
MS
MP
ME
LA
KY
IL
ID
IA
GA
CO
AZ
AL
AK
Total Authorized

A - 17
investment.47 The Commission determined that carriers that qualified for SNA support due to a 14 percent or greater increase in investment over the prior year would continue to receive support, while carriers qualifying for SNA based on line loss would have their SNA support eliminated in 2013.48 In 2014, the Commission modified this decision to provide SNA support to carriers that would have qualified under the prior rules based on significant network investments made in 2010 and 2011.49
Figure 8 below demonstrates the change in total SNA support for price cap and rate-of-return
carriers following the reforms adopted in the USF/ICC Transformation Order.
Figure 8 Safety Net Claims
(in $millions) (Source: Table 3.3; *2015 is based on annualized January 2015-June 2015 data)
2011 2012 2013 2014 2015*
Rate-of-Return Carriers 65.5 48.4 31.4 28.2 20.4
Price Cap Carriers 10.7 - - - -
Total 76.2 48.4 31.4 28.2 20.4
Benchmarking Rule. In the USF/ICC Transformation Order, the Commission adopted a benchmarking rule to place limits on capital and operating expenses eligible for reimbursement through high-cost loop support (HCLS) and redistribute available HCLS to carriers that stay within these limits.50 The Bureau initially implemented this rule in April 2012.51 On February 27, 2013, the Commission reconsidered some aspects of the rule, directing the Bureau to develop a regression methodology to generate a single total loop cost cap for each study area beginning in 2014 and modify the phase-in of the benchmarks for
47 USF/ICC Transformation Order, 26 FCC Rcd at 17758, para. 252. In 2001, the Commission created SNA to provide further support to incumbent carriers that made significant investment in their infrastructure. The rule provided additional support for the qualifying year and four subsequent years. See Federal-State Joint Board on Universal Service; Multi-Association Group (MAG) Plan for Regulation of Interstate Services of Non-Price Cap Incumbent Local Exchange Carriers and Interexchange Carriers, Fourteenth Report and Order, Twenty-Second Order on Reconsideration, and Further Notice of Proposed Rulemaking in CC Docket No. 96-45, and Report and Order in CC Docket No. 00-256, 16 FCC Rcd 11244, 11276-81, paras. 77-90 (2001) (Rural Task Force Order).
48 USF/ICC Transformation Order, 26 FCC Rcd at 17758, para. 252.
49 Connect America Fund, et al., WC Docket Nos. 10-90, 10-208, 14-58, 07-135, 01-92, , Report and Order, Declaratory Ruling, Order, Memorandum Opinion and Order, Seventh Order on Reconsideration, and Further Notice of Proposed Rulemaking, 29 FCC Rcd 7051, 7088-90, paras. 109-115 (2014) (April 2014 Connect America Order).
50 Id. at 17741-47, paras. 210-26.
51 Connect America Fund; High-Cost Universal Service Support, WC Docket Nos. 10-90, 05-337, Order, 27 FCC Rcd 4235 (2012) (HCLS Benchmarks Implementation Order).

A - 18
2013 to provide carriers additional time to adjust to the changes.52 On July 26, 2013, the Bureau adopted an order maintaining the 2013 regression methodology for 2014 to provide predictability for carriers while the Bureau incorporated new geographic data and obtained public input on the development of the single cap.53 The order also exempted Alaska from the benchmark rule for 2014.54 In April 2014, the Commission eliminated the benchmarking rule, determining that the rule may have unintentionally encouraged carriers that were not subject to the benchmarks to believe that they needed to limit investment in broadband-capable networks, and stated that HCLS support would be distributed as it had been prior to the USF/ICC Transformation Order.55 This order became effective on August 1, 2014.
HCLS/ICLS. Support for rate-of-return carriers has been subject to the HCLS cap and rural growth factor for more than a decade, which were not altered in the USF/ICC Transformation Order.56 In 2001, the Commission modified the distribution of HCLS by re-basing the fund for rural telephone companies and retaining an indexed cap.57 Specifically, the Commission concluded that the total cap on HCLS would be adjusted annually by a rural growth factor equal to annual changes in gross domestic product (GDP) and the consumer price index (CPI) and changes in the total number of working loops.58 Given decreases in working loops in rate-of-return areas in recent years, the indexed cap has limited HCLS for many rate-of-return carriers.
Figure 9 displays information regarding the amounts of HCLS and interstate common line support (ICLS) disbursed to incumbent rate-of-return providers from 2012-2015.59
52 See Sixth Order on Reconsideration.
53 Connect America Fund; High-Cost Universal Service Support, WC Docket Nos. 10-90, 05-337, Order, 28 FCC Rcd 10999 (Wireline Comp. Bur. 2013).
54 Id. at para 1.
55 April 2014 Connect America Order, 29 FCC Rcd at 7097-99, paras. 130-136.
56 See RuralTaskForceOrder, 16 FCC Rcd 11244.
57 See id. at 11249, para. 12.
58 Id.
59 Prior to the USF/ICC Transformation Order, some price cap carriers received HCLS. Companies received support depending on whether they were classified as either “rural” or “non-rural” under the Commission’s rules (rural companies received high-cost loop support, while non-rural companies received high-cost model support) and how they were regulated at the interstate level (rate-of-return carriers received ICLS, while price cap carriers received interstate access support). See Connect America Fund; A National Broadband Plan for Our Future; Establishing Just and Reasonable Rates for Local Exchange Carriers; High-Cost Universal Service Support; Developing a Unified Intercarrier Compensation Regime; Federal-State Joint Board on Universal Service; Lifeline and Link-Up, WC Docket Nos. 10-90, 07-135, 05-337, 03-109, GN Docket No. 09-51, CC Docket Nos. 01-92, 96-45, Notice of Proposed Rulemaking and Further Notice of Proposed Rulemaking, 26 FCC Rcd 4554, 4610, para. 164 (2011). For example, if a price carrier was classified as a “rural” carrier, it would have been eligible to receive HCLS. Thus, one cannot directly compare the HCLS support amounts for the period pre-2012 to the amounts received by rate-of-return carriers post-2012.

A - 19
In the December 2014 Connect America Order, the Commission adopted its proposal to modify
the HCLS mechanism by first freezing the national average cost per loop (NACPL) and then decreasing HCLS proportionately among all HCLS recipients.60 Previously, rate-of-return carriers received reimbursement for a fixed percentage of their unseparated loop expenses to the extent that they exceeded a benchmark set in relation to the NACPL.61 These rules reimbursed 65 percent of the loop costs in excess of 115 percent, but less than 150 percent of the NACPL, and 75 percent of loop costs in excess of 150 percent of the NACPL.62 As noted above, HCLS for rate-of-return carriers is subject to an indexed cap.63 Until 2015, the indexed cap was enforced by raising the NACPL used in HCLS calculations until the amount of calculated support equaled the cap amount.64 The indexed cap on HCLS had seen steady reductions in recent years as a result of decreasing numbers of working loops and low inflation rates.65 As a result, carriers with costs close to the ever-rising NACPL risked losing all HCLS for prior
60 See December 2014 Connect America Order, 29 FCC Rcd at 15679-84, paras. 101-114).
61 See 47 C.F.R. § 54.1310. The Commission’s HCLS rules were formerly codified in Part 36, subpart F.
62 Id.
63 Id. § 54.1302.
64 Id. § 54.1309(c)(2).
65 See National Exchange Carrier Association, Inc. Overview and Analysis of 2013 USF Data Submission, filed September 30, 2014, at 2 (indexed cap on HCLS for 2015 calculated as $735.2 million); National Exchange Carrier Association, Inc. Overview and Analysis of 2004 USF Submission, filed September 30, 2005 at 3 (indexed cap on HCLS for 2006 calculated at $1,047.3 million) (both filings available at http://www.fcc.gov/encyclopedia/necas-overview-universal-service-fund). During this period, the cap has also been rebased on multiple occasions to reflect the ineligibility of price-cap carriers and their rate-of-return affiliates. See, e.g., USF-ICC Transformation Order, 26 FCC Rcd at 17760, paras. 258-59.
2012 2013 2014 2015*
HCLS 792 767 745 711
ICLS 843 877 889 892
650
700
750
800
850
900
Figure 9Rate-of-Return Carriers HCLS and ICLS Claims
(in $millions)(Source: Table 3.3; *2015 is based on annualized January 2015-June 2015 data)
HCLS
ICLS

A - 20
investments, while carriers with a higher cost per loop were sheltered from the impact of the HCLS cap.66 This created a “race to the top” such that carriers had an incentive to increase their costs to preserve their universal service support and caused some carriers to “fall off the cliff” so that they no longer received any HCLS.
To avoid this effect, in the December 2014 Connect America Order, the Commission adopted its proposal to reduce support proportionally among all HCLS recipients through decreased reimbursement percentages for all carriers instead of adjusting the NACPL.67 Specifically, the Commission froze the NACPL that is used to determine support and instead decreased HCLS proportionately among all HCLS recipients.68 This change went into effect on July 1, 2015.
Elimination of Local Switching Support. Local Switching Support (LSS) allowed rural
incumbent local exchange carriers (LECs) serving 50,000 access lines or fewer to allocate a larger percentage of their switching costs (including related overhead costs) to the interstate jurisdiction and recover those costs through the federal universal service fund.69 Effective July 1, 2012, the Commission eliminated LSS as a stand-alone support program.70 It also allowed for recovery of some of the costs previously covered by LSS through the Connect America Fund ICC recovery mechanism.71
$250 per Line Cap. In the USF/ICC Transformation Order, the Commission adopted a new rule
establishing a presumptive per-line cap of $250 per month on total high-cost universal service support, exclusive of Connect America Fund ICC support for all ETCs.72 The Commission concluded that support in excess of that amount should not be provided without further justification.73 Incumbent ETCs were subject to a phase-down to bring their support to the $250 cap between July 1, 2012 and June 30, 2014. The cap became fully effective on July 1, 2014.
Figure 10 shows total high-cost support per line for 2014 for the companies receiving the highest
amounts per line and which of those companies have requested a waiver of the presumptive cap. Some study areas still received legacy support above $3,000 per line annually because the $250 per-month, per-line cap on support was not fully implemented until July 1, 2014, while others, as noted, have been granted a waiver of this cap. In addition, some study areas with legacy support below $3,000 annually are included because the sum of legacy and Connect America Fund ICC support is in excess of $3,000 per year.
66 We note that a “higher cost” carrier does not necessarily serve an area that is more costly to serve than other areas. To the extent a carrier is experiencing access line loss, for whatever reason, its cost per loop will rise because the total costs for the study area are divided by a smaller number. Thus, two study areas with identical cost characteristics could have significantly different reported costs per loop, based on the extent to which customers are “cutting the cord” for their landline voice service. A study area where there are competitive alternatives in fact may have a higher cost per loop, all other things being equal.
67 December 2014 Connect America Order, 29 FCC Rcd at 15681, para. 104.
68 Id.
69 USF/ICC Transformation Order, 26 FCC Rcd at 17758, para. 253.
70 Id. at 17760, para. 257.
71 Id. at 17967, para. 867.
72 47 C.F.R. § 54.302.
73 USF/ICC Transformation Order, 26 FCC Rcd at 17765, para. 274.

A - 21
Figure 10
Incumbent Study Areas with 2014 Annual High-Cost Support per Line Exceeding $3,000 (Source: Supplementary Material in file named HC RoR Claims per Line - by Study Area.xlsx)
Study Area Name State Waiver Disposition
Legacy High
Cost Per Line
Total High Cost (Legacy + CAF/ICC
Support Per Line
Accipiter Comm. AZ
2012 – Granted, expired 2015; 2014 - Pending $3,158 $3,239
Adak Tel Utility AK
2015 – Denied (interim relief granted previously) $6,092 $7,525
Agate Mutual Tel Co CO $3,268 $3,582 Allband Communications Cooperative
MI 2012 – Granted; 2015 – Interim Extension Granted $7,669 $7,833
Baca Valley Tel Co NM $2,978 $3,102
Beaver Creek Telephone Company WA $2,756 $3,884
Beehive Tel Co - NV NV $3,292 $5,349
Beehive Tel Co - UT UT $2,856 $4,262
Border To Border TX Dismissed $4,633 $5,453
Cunningham Tel Co KS $3,043 $3,127
Dell Tel. Co-Op - TX TX Dismissed $3,318 $3,636
Elkhart Tel Co Inc KS $2,865 $3,036
Kanokla Tel Assn-OK OK $2,914 $3,036
La Harpe Tel Co Inc KS $3,138 $3,490
Lakeside Tel. Co. MS $2,762 $3,035
Leaco Rural Tel Coop NM $2,723 $3,046
Leaf River Tel Co IL $2,686 $3,105
Mutual Tel Co KS $3,084 $3,296
North State Tel Co. OR $3,104 $3,246
Oregon Tel Corp OR $2,421 $3,184
Oregon-Idaho Util. OR $3,015 $3,806
Pine Tel System Inc. OR $3,351 $4,192
Rice Belt Tel Co AR $2,652 $3,016
S. Central Tel - Ok OK $3,200 $3,307
Sandwich Isles Comm. HI Denied $3,332 $4,896
South Park Tel. Co. CO Withdrawn $3,242 $3,776
Southern Montana Tel MT $3,042 $3,307
St John Tel Co WA $2,892 $3,098
Summit Tel & Tel -AK AK $3,065 $3,433
Terral Tel Co OK $3,452 $4,297
Tri-County Tel Assn KS $3,011 $3,072 Westgate Communications LLC d/b/a Weavtel
WA $2,949 $5,578
Xit Rural Tel Co-Op TX $2,938 $3,099
Zenda Tel Company KS $2,858 $3,276

A - 22
Figure 11 shows total support reductions from 2012-2105 as a result of implementation of the
$250 per-month, per-line cap. The legacy support per-line figures in Figure 10 would have been higher without these reductions.
Figure 11 High-Cost Support Reductions As Result of $250 per-month Cap
(Source: USAC Claims Data; *2015 is based on annualized January 2015-June 2015 data)Study Area Name State 2012 2013 2014 2015* Accipiter Comm. AZ 360,162 0 0 125,916
Adak Tel Utility AK 207,984 545,280 1,002,750 1,113,954
Agate Mutual Tel Co CO 28,464 82,017 120,456 78,936
Baca Valley Tel Co NM 0 74,703 214,698 121,476
Beaver Creek Telephone Co WA 63,672 0 0 42,156
Beehive Tel Co - NV NV 3,690 34,962 219,892 303,312
Beehive Tel Co - UT UT 0 128,670 0 0
Big Bend Tel Co Inc TX 86,376 0 0 0
Blue Valley Tele-Com KS 58,806 0 0 0
Border To Border TX 185,058 493,098 763,372 833,076
Cunningham Tel Co KS 0 4,965 137,645 216,156
Dell Tel. Co-Op - TX TX 361,482 849,516 1,303,995 1,460,124
Elkhart Tel Co Inc KS 0 0 34,815 0
Farber Tel Co MO 0 0 23 98,640
Kanokla Tel Assn-OK OK 0 52,245 0 0
La Harpe Tel Co Inc KS 23,412 73,881 229,078 175,008
Lakeside Tel. Co. MS 0 3,516 0 32,940
Leaf River Tel Co IL 0 0 0 137,184
Mutual Tel Co IA 43,962 152,101 211,759 0
North State Tel Co. OR 56,364 129,009 281,323 334,224
Northeast Louisiana LA 0 0 0 14,448
Nunn Tel Co CO 0 0 31,275 11,748
Oregon-Idaho Util. OR 0 51,297 57,870 119,532
Pine Tel System Inc. OR 241,932 911,214 1,830,981 2,187,576
Rice Belt Tel Co AR 0 0 0 105,468
S. Central Tel - OK OK 108,090 254,067 456,691 543,744
Sacred Wind NM 210,018 260,025 0 0
Sandwich Isles Comm. HI 2,262,804 5,471,796 6,944,697 7,494,012
Shawnee Telephone Co IL 0 0 0 350,474
South Park Tel. Co. CO 64,698 154,713 218,992 190,176
Southern Montana Tel MT 0 64,515 190,069 0
St John Tel Co WA 8,832 7,086 0 0
Summit Tel & Tel -AK AK 27,876 60,541 100,929 238,212
Terral Tel Co OK 78,624 232,056 480,781 1,035,360
Tri-County Tel Assn KS 0 0 526,519 502,884

A - 23
Figure 11 High-Cost Support Reductions As Result of $250 per-month Cap
(Source: USAC Claims Data; *2015 is based on annualized January 2015-June 2015 data)Study Area Name State 2012 2013 2014 2015* Westgate Communications LLC d/b/a Weavtel
WA 52,014 136,185 231,600 193,620
Zenda Tel Company KS 0 0 98,333 214,788
Total 4,534,320 10,227,458 15,688,543 18,275,144
Petitions for Waiver. In the USF/ICC Transformation Order, the Commission stated that any
carrier negatively affected by the universal service reforms could file a petition for waiver to demonstrate that good cause exists for exempting the carrier from some or all of those reforms.74 In the Fifth Order on Reconsideration, the Commission clarified that it would consider the impact of reforms not only on voice service alone, but also on the continued operation of a broadband-capable network and on consumer rates.75
Since the USF/ICC Transformation Order, some rate-of-return carriers (including CETC
affiliates) have requested waivers of high-cost support reductions, including several who requested a waiver of the $250 per-line, per-month cap. The Bureau worked to gather information and act upon these USF/ICC Transformation Order waiver requests as expeditiously as possible. The supplementary material describes the disposition of all such waiver requests.76
Alternative Connect America Model. In the April 2014 Connect America Order and FNPRM, the Commission proposed a framework for a voluntary election by rate-of-return carriers to receive model-based support, and directed the Bureau to incorporate the results of the study area boundary data collection in the CAM and to make such other adjustments as appropriate for use of that model in rate-of-return territories.77 The Bureau has been actively working on refining the Alternative Connect America Cost Model (A-CAM) since the first version was released in December 2014.78 The Bureau released v.1.0.1 on March 16, 2015 updating the competitive coverage in light of the Commission’s decision to adopt 10/1 Mbps as the minimum standard for competitors.79 On April 10, 2015, the Bureau published an
74 Id. at 17840, para. 539.
75 It further stated that it envisioned granting relief only in those circumstances in which a carrier could demonstrate that consumers face a significant risk of losing access to a broadband-capable network that provides both voice as well as broadband, at reasonably comparable rates, in areas where there are no alternative providers of voice or broadband. Connect America Fund et al., WC Docket No. 10-90 et al., Fifth Order on Reconsideration, 27 FCC Rcd 14549, 14556-57, paras. 20-21 (2012) (Fifth Order on Reconsideration). 76 See Supplemental Material File “Petitions Seeking Waiver of Support Reductions.docs.”
77 Connect America Fund et al., WC Docket No. 10-90 et al., Report and Order et al., 29 FCC Rcd 7051, 7074, para. 70, 7139-40, para. 276, 7141-43, paras. 283-91 (2014) (April 2014 Connect America Order and/or FNPRM).
78 Wireline Competition Bureau Announces Availability of Version 4.2 of the Connect America Phase II Cost Model and the First Version of an Alternative Cost Model Being Developed for Potential Use in Rate-of-Return Areas, WC Docket No. 10-90, Public Notice, 29 FCC Rcd 16157, 16158 (Wireline Comp. Bur. 2014) (A-CAM v1.0 Public Notice).
79 Wireline Competition Bureau Releases Alternative Connect America Cost Model Version 1.01 and Illustrative Results for Potential Use in Rate-Of-Return Areas, WC Docket No. 10-90, Public Notice, 30 FCC Rcd 2067 (Wireline Comp. Bur. 2015) (A-CAM v1.0.1 Public Notice) (updating broadband coverage to use minimum speed standard of 10/1 Mbps in determining the presence of a cable or fixed wireless competitor).
A - 24
online, publicly accessible map based on the study area boundary and exchange data that were submitted to the Bureau by rate-of-return carriers and certain state utility commissions, summarized the process used to develop service areas for use in the model, and invited commenters to submit any proposed corrections to interior service area boundaries and central office (Node0) locations.80 On July 27, 2015, the Bureau invited parties to submit proposed corrections to plant mix input values for individual study areas.81 The Bureau released version 1.1 on August 31, 2015, updating competitive coverage using FCC Form 477 data.82 On October 8, 2015, the Bureau released A-CAM v2.0, which incorporates updated exterior study area boundaries, interior service area boundaries, and Node0 locations based on extensive input from rate-of-return carriers, and further updated the model in several respects.83 The Bureau also released results that illustrate how different per-location funding caps used in calculating support impact the potential support calculated for a particular study area.84
Study Area Boundary Collection. In November 2012, the Bureau adopted an order requiring
incumbent LECs to submit study area boundary data necessary to implement universal service reforms, including elimination of support where an unsubsidized competitor offers voice and broadband service that 100 percent overlaps an incumbent LEC’s study area.85 In December 2013, the Bureau published a study area boundary map and requested that carriers resolve overlaps and submit and certify revised boundary data no later than January 13, 2014.86 Shortly thereafter, an industry petition was filed
80 Wireline Competition Bureau Publishes Map of Study Areas for Use in Alternative Connect America Cost Model, WC Docket No. 10-90, Public Notice, 30 FCC Rcd 2944 (Wireline Comp. Bur. 2015) (A-CAM Map Public Notice). A-CAM Service Area Development Process, http://www.fcc.gov/wcb/ServiceAreaDevelopmentProcess.docx (A-CAM Service Area Documentation); see also Wireline Competition Bureau Revises A-CAM Study Area Map, WC Docket No. 10-90, 30 FCC Rcd 4610 (Wireline Comp. Bur. 2015) (updating a small number of potential Node0 locations); Wireline Competition Bureau Announces Upcoming Modifications to the Alternative Connect America Cost Model, WC Docket No. 10-90, Public Notice, DA 15-869 (Wireline Comp. Bur. July 29, 2015).
81 Wireline Competition Bureau Announces Upcoming Modifications to the Alternative Connect America Cost Model, WC Docket No. 10-90, Public Notice, 30 FCC Rcd 8191 (Wireline Comp. Bur. 2015) (announcing upcoming modifications to A-CAM and inviting commenters to submit proposed corrections to plant mix values for individual study areas). In response to the PN, rate-of-return carriers or their consultants submitted proposed plant mix input values for 528 study areas.
82 Wireline Competition Bureau Releases Alternative Connect America Cost Model Version 1.1 and Illustrative Results for Potential Use in Rate-Of-Return Areas, WC Docket No. 10-90, Public Notice, DA 15-980 (Wireline Comp. Bur. Aug. 31, 2015) (A-CAM v1.1 Public Notice) (updating coverage to reflect preliminary FCC Form 477 broadband deployment data as of December 31, 2014).
83 Wireline Competition Bureau Releases Alternative Connect America Cost Model Version 2.0 and Illustrative Results for Potential Use in Rate-Of-Return Areas, WC Docket No. 10-90, Public Notice, DA 15-1154 (Wireline Comp. Bur. Oct. 8, 2015) (updating, among other things, middle mile, and averaging costs at census block level) .
84 The illustrative results for A-CAM version 2.0 are available at https://transition.fcc.gov/wcb/ACAM_20_ILL_Rpt_Version3_0_FINAL_100615_Public.xlsx. The Bureau also released illustrative results for A-CAM v1.0.1 and A-CAM v1.1 illustrating how different assumptions and funding caps used in calculating support impact the potential support calculated for a particular study area. See A-CAM v1.0.1 Public Notice, A-CAM v1.1 Public Notice.
85 Connect America Fund; High-Cost Universal Service Support, WC Docket Nos. 10-90, 05-337, Report and Order, 27 FCC Rcd 13528, 13529, para. 2 (Wireline Comp. Bur. 2012).
86 See Wireline Competition Bureau Publishes Online Map of Submitted Study Area Boundaries, Announces Procedures for Filing Revised Data, WC Docket Nos. 10-90, 05-337, Public Notice, 28 FCC Rcd 16315 (Wireline Comp. Bur. 2013) (Study Area Boundaries Public Notice).
A - 25
requesting a stay, or in the alternative, a six-month extension of the January 2014 deadline.87 In response, the Bureau extended the deadline to March 17, 2014.88 The Bureau received study area boundary maps from all incumbent LECs and conducted a process to resolve and minimize overlaps among study areas. As noted above, these boundaries have been incorporated into the A-CAM.
Pricing of Services. Section 254(b) of the Act requires that “[c]onsumers in all regions of the
Nation . . . should have access to telecommunications and information services . . . that are available at rates that are reasonably comparable to rates charged for similar services in urban areas.”89 In the USF/ICC Transformation Order, the Commission adopted a rule to limit high-cost support where end-user rates do not meet an urban rate floor representing the national average of local rates plus state regulated fees.90 To the extent a carrier’s end-user rates for local service do not meet the rate floor, dollar-for-dollar reductions in HCLS or frozen support are made.91 The Commission determined it was inappropriate to use limited federal high-cost support to subsidize local rates beyond what is necessary to ensure reasonable comparability.92 The Commission’s rule phased in the rate floor in three steps, beginning with an initial rate floor of $10 for the period July 1, 2012 through June 30, 2013; $14 for the period July 1, 2013 through June 30, 2014; and an amount to be established through the annual rate survey for the years beginning July 1, 2014, and thereinafter.93
The USF/ICC Transformation Order defined the average urban rate to include local end-user
rates plus state regulated fees (specifically, state subscriber line charges (SLCs), state USF, and mandatory extended area service charges) and excluded the federal SLC.94 On April 3, 2013, the Bureau adopted the form and content for the survey of urban rates for fixed voice and fixed broadband residential services.95
The Bureau completed the surveys for 2014 and 2015 and is in the process of conducting the 2016 survey.96 Because the Bureau found that recurring monthly rates collected in the survey from non-incumbent LEC providers typically were higher than incumbent LEC reported recurring monthly rates (possibly because non-incumbent LEC providers charged rates similar to the incumbent LECs’ monthly charge plus the federal SLC), the Bureau calculated the average using only urban incumbent LEC rates. For 2015, the Bureau calculated that the average local end-user rates plus state regulated fees of the surveyed incumbent LECs in urban areas is $21.22.97
87 NTCA—The Rural Broadband Association, the United States Telecom Association, the Independent Telephone and Telecommunications Alliance, WTA, and the Eastern Rural Telecom Association, Petition for Stay, or in the Alternative for Extension of Time to Reconcile Study Area Boundaries, WC Docket Nos. 10-90, 05-337 (filed Dec. 17, 2013).
88 See Study Area Boundaries Public Notice, 28 FCC Rcd at 16315, para. 2.
89 47 U.S.C. § 254(b)(3).
90 USF/ICC Transformation Order, 26 FCC Rcd at 17749, 17751, paras. 235, 238; see also 47 C.F.R § 54.318.
91 USF/ICC Transformation Order, 26 FCC Rcd at 17752, para. 240.
92 Id. at 17751, para. 237.
93 Id. at para. 239.
94 USF/ICC Transformation Order, 26 FCC Rcd at 17751, para. 238.
95 Connect America Fund, WC Docket No. 10-90, Order, 28 FCC Rcd 4242 (Wireline Comp. Bur. and Wireless Telecom. Bur. 2013).
96 All information regarding the survey and survey results is available at https://www.fcc.gov/encyclopedia/urban-rate-survey-data.
97 Id.

A - 26
Because the survey average was more than four dollars higher than the Commission anticipated in
2011, in April 2014, the Commission adopted a phase-in of support reductions associated with the rate floor such that reductions cannot increase more than $2 annually.98 In addition, the Commission determined that there should be no support reductions associated with lines provided to customers enrolled in the Lifeline program.99 It postponed implementation of the support reductions associated with the 2014 rate floor until January 1, 2015. Accordingly, for calendar year 2014 and 2015, support reductions only occurred for those lines with rates below the appropriate phased-in limit, as shown in Figure 12 below.
Figure 12
Reduction in High-Cost Loop Claims and Frozen Support Claims due to the Rate Floor
(Source: Supplementary Material in file named HC Rate Floor Reductions - by Study Area.xlsx; *2015 is based on annualized January 2015-June 2015 data)
2015 figures for price cap carriers not calculated due to acceptance of Phase II support
Carrier 2012 2013 2014 2015* Price Cap $39,600 $1,525,044 $3,369,624 ---
Rate of Return $515,958 $1,277,538 $1,090,894 $2,455,674
Total $555,558 $2,802,582 $4,460,518 --- In the USF/ICC Transformation Order, the Commission also determined that “ETCs must offer
voice telephony service, including voice telephone service offered on a standalone basis, at rates that are reasonably comparable to urban rates”100 and adopted a presumption that “a voice rate is within a reasonable range if it falls within two standard deviations above the national average.”101 Based on the 2015 survey responses, the Bureau calculated the reasonable comparability benchmark for voice services to be $47.48 for 2015.102 For purposes of the reasonable comparability benchmark, the Bureau concluded that the rates of all local flat-rate providers (both incumbent LEC and non-incumbent LEC providers) should be included when computing the average, and, consistent with existing precedent, that federal SLCs should be included.103 In addition, each ETC, including competitive ETCs providing fixed voice
98 April 2014 Connect America Order, 29 FCC Rcd at 7077-80, paras. 77-81.
99 Id. at 7081-82, para. 86.
100 USF/ICC Transformation Order, 26 FCC Rcd at 17693, para. 81.
101 Id. at 17694, para. 88.
102 See Wireline Competition Bureau Announces Results of 2015 Urban Rate Survey for Fixed Voice and broadband Services and Posting of Survey Data and Explanatory Notes, WC Docket No. 10-90, Public Notice, 30 FCC Rcd 3687 (Wireline Comp. Bur. 2015). The USF/ICC Transformation Order defined the average urban rate to include local end-user rates plus state regulated fees (specifically, state subscriber line charges (SLCs), state universal service, and mandatory extended area service charges). USF/ICC Transformation Order, 26 FCC Rcd at 17751, para. 238.
103 Id.

A - 27
services,104 is required to certify in the FCC Form 481 that the pricing of its basic residential voice services was no more than the comparability benchmark.105
In the USF/ICC Transformation Order, the Commission also required that as a condition of receiving high-cost or Connect America Fund support, recipients must offer broadband services in supported areas at rates that are reasonably comparable to rates for similar services in urban areas.106 The Commission concluded that rural broadband rates would be deemed “reasonably comparable” to urban rates under section 254(b)(3) if they fell within a reasonable range of urban rates for reasonably comparable broadband service and directed the Wireline Competition Bureau and Wireless Telecommunications Bureau to develop a specific methodology for defining that reasonable range.107
In June 2014, the Wireline Competition Bureau solicited comment on a Staff Report discussing potential methodologies for determining the average urban rate for fixed broadband services.108 On October 29, 2014, the Bureau adopted a weighted linear regression method to obtain an average rate based on download speed, upload speed, and usage allowance.109 The benchmark for a service was calculated by adding twice the standard deviation to the average rate.110 Examples of the average rate and reasonable comparability benchmark for a range of broadband service offerings in 2015 are below.
104 The Bureau has adopted a benchmark only for fixed voice services because “the differences in rate plans and other attributes of fixed and mobile services would make it inordinately difficult to create a unified benchmark” that applied to both fixed and mobile services. See Connect America Fund, WC Docket No. 10-90, Order, 28 FCC Rcd 4242, para. 6 (Wireline Comp. Bur. 2014).
105 47 C.F.R. § 54.313(a)(10); see also USF/ICC Transformation Order at 18046-47, para. 1026. In the USF/ICC Transformation Order, the Commission required that as a condition of receiving high-cost support, ETCs must offer voice and broadband services in supported areas at rates that are reasonably comparable to rates for similar services in urban areas. USF/Transformation Order, 26 FCC at 17693, 17695, paras. 81, 86.
106 USF/ICC Transformation Order, 26 FCC at 17693, 17695, paras. 81, 86. See also 47 U.S.C. § 254(b).
107 Id. at 17704, para. 113.
108 Wireline Competition Bureau Announces Posting of Broadband Data from Urban Rate Survey and Seeks Comment on Calculation of Reasonable Comparability Benchmark for Broadband Services, WC Docket No. 10-90, Public Notice, 29 FCC Rcd 7992, Staff Report at 5-6 (Wireline Comp. Bur 2014).
109 Connect America Fund, Report and Order, WC Docket No. 10-90, DA 14-1569 (Wireline Comp. Bur. rel. Oct. 29, 2014).
110 Id. at 3.

A - 28
Figure 13 Summary of Broadband Results of the Urban Rates Survey
(Source: 2015 Urban Rates Survey data)
Download Speed (Mbps)
Upload Speed (Mbps) Usage Allowance (GB) Benchmark
10 1 100 $71.40
10 1 250 $75.99
10 1 Unlimited $77.80
25111 5 250 $95.08
25112 5 Unlimited $96.89
Oversight and Accountability. In the USF/ICC Transformation Order, the Commission established a uniform national framework for information that ETCs must report to their respective states and the Commission, while affirming that states will continue to play a critical role overseeing ETCs that they designate. 113 The Commission modified and extended existing federal reporting requirements to all ETCs, whether designated by a state or the Commission, to reflect the new public interest obligations.114 Specific changes include extending voice reporting requirements to all ETCs, adopting requirements to reflect new broadband obligations, and requiring all ETCs subject to new broadband obligations to file five-year plans.115
In 2013, ETCs began filing their annual reports on a standardized form – FCC Form 481 – with
the Commission, USAC, the relevant state commissions, relevant authority in a U.S. Territory, or Tribal governments, as appropriate.116 Based in part on those filings, state commissions and ETCs not subject to the jurisdiction of a state commission annually certify to the Commission that high-cost support received was used and will be used for the intended purposes.117
In October 2015, the Commission reminding ETCs that they may not include certain types of
expenses in their revenue requirement or recover them through high-cost support. Those expenses include the following: personal travel; entertainment; alcohol; food, including but not limited to meals to 111 The 25 Mbps/5 Mbps benchmarks are applicable to those entities authorized to receive funding for category one projects in the Commission’s rural broadband experiments. See Connect America Fund et al., WC Docket Nos. 10-90 et al., Report and Order and Further Notice of Proposed Rulemaking, 29 FCC Rcd 8769, 8779, para. 26 (2014).
112 Id.
113 Id. at 17854, para. 587.
114 See 47 C.F.R. § 54.313.
115 Id. In May 2013, the Bureau granted a limited waiver of its rule requiring rate-of-return carriers to submit a five-year plan in 2013 and instead allowed those plans to be filed at the same time as ETC 2014 annual reports. See Connect America Fund, WC Docket No. 10-90, Order, 28 FCC Rcd 7227, 7229, para. 8 (Wireline Comp. Bur. 2013). 116 Wireline Competition Bureau Announces Filing Deadline of October 15, 2013 for Eligible Telecommunications Carriers to File High-Cost and Low-Income Annual Reports, and Announces Filing Deadline of December 16, 2013 for States and ETCs to File Annual Use Certifications, WC Docket Nos. 10-90, 11-42, Public Notice, 28 FCC Rcd 11252 (Wireline Comp. Bur. 2013).
117 Id.; see also 47 C.F.R. § 54.314.

A - 29
celebrate personal events, such as weddings, births, or retirements; political contributions; charitable donations; scholarships; penalties or fines for statutory or regulatory violations; penalties or fees for any late payments on debt, loans, or other payments; membership fees and dues in clubs and organizations; sponsorships of conferences or community events; gifts to employees; and, personal expenses of employees, board members, family members of employees and board members, contractors, or any other individuals affiliated with the ETC, including but not limited to personal expenses for housing, such as rent or mortgages.118 The Commission also noted that it intends to take further action prevent excessive expenditures.119
Broadband Deployment and Adoption. Since adoption of the USF/ICC Transformation Order,
there has been steady progress in the extent of broadband deployment. As shown in the following charts, the extent of deployment of broadband of approximately 4 Mbps/1 Mbps and of approximately 10 Mbps/1 Mbps (10 Mbps/3 kbps) reported by rate-of-return carriers has increased substantially since 2012.120 Between December 2012 and December 2014, there was a 20 percent increase in the number of census blocks where the incumbent rate-of-return carrier reported offering fixed service with at least 4 Mbps/1 Mbps speeds. Similarly, there was a 44.8 percent increase in the number of census blocks where the incumbent rate-of-return carrier reported offering fixed service with at least 10 Mbps/1 Mbps speeds. Although there was a relatively small drop in price cap deployment of approximately 4 Mbps/1 Mbps in 2014, that change was primarily due to one carrier. This change may result from the fact that the 2014 data is from FCC Form 477, which is a mandatory collection that must be filed and certified to by carriers and has somewhat stricter standards for determining deployment than the State Broadband Initiative used for the 2012 and 2013 data.
118 All Universal Service High-Cost Support Recipients are Reminded that Support Must be Used for its Intended Purpose, WC Docket Nos. 10-90, 14-58, Public Notice, FCC 15-133 at 2 (Wireline Comp. Bur. 2015)
119 Id.
120 The analysis presented in Figure 14 utilizes 3 Mbps/768 kbps as a proxy for 4 Mbps/1 Mbps, and 10 Mbps/768 kbps as a proxy for 10 Mbps/1 Mbps.

A - 30
Figure 14 Fixed Connection Deployment of at Least 3 Mbps/768 kbps
(in thousands) (Source: 2013 Data – State Broadband Initiative (SBI) Data, 2014 Data – Form 477 Submissions)
Data do not include any increase in deployment within a Census block. Rate-of-Return Carriers
Number of
Deployed Census Blocks
Population in Deployed Census Blocks
Housing Units in Deployed Census
BlocksDecember 2012 733 8,644 4,093
December 2013 796 9,178 4,369
December 2014 883 10,199 4,880
Price Cap Carriers Number of
Deployed Census Blocks
Population in Deployed Census Blocks
Housing Units in Deployed Census
Blocks December 2012 4,191 231,602 98,148
December 2013 4,423 244,301 104,413
December 2014 4,041 245,001 104,761 Population and housing unit estimates were obtained from Geolytics Block-Level Estimates 2012-2013. These estimates were created by summing the population and housing units contained in the Census blocks reported through Form 477 or SBI. Note that a provider that reports deployment in a particular census block may not necessarily offer service to every person and housing unit in the census block.
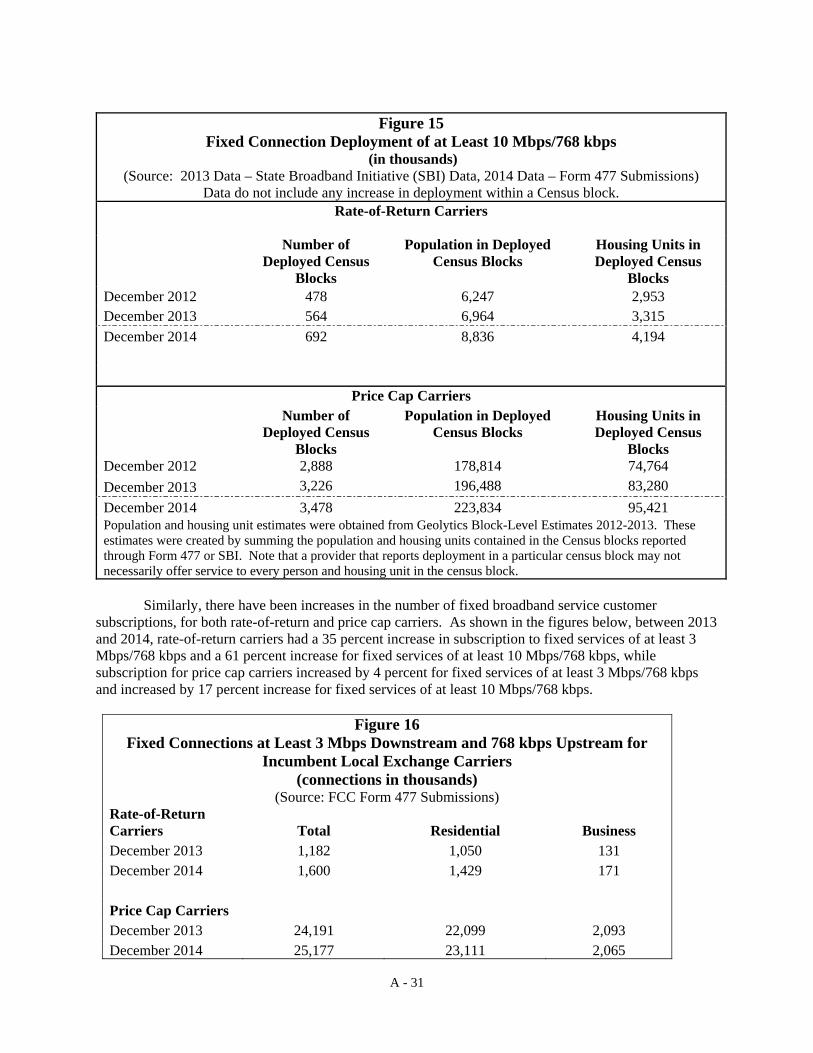
A - 31
Figure 15
Fixed Connection Deployment of at Least 10 Mbps/768 kbps (in thousands)
(Source: 2013 Data – State Broadband Initiative (SBI) Data, 2014 Data – Form 477 Submissions) Data do not include any increase in deployment within a Census block.
Rate-of-Return Carriers
Number of Deployed Census
Blocks
Population in Deployed Census Blocks
Housing Units in Deployed Census
Blocks December 2012 478 6,247 2,953 December 2013 564 6,964 3,315
December 2014 692 8,836 4,194
Price Cap Carriers Number of
Deployed Census Blocks
Population in Deployed Census Blocks
Housing Units in Deployed Census
Blocks December 2012 2,888 178,814 74,764
December 2013 3,226 196,488 83,280
December 2014 3,478 223,834 95,421 Population and housing unit estimates were obtained from Geolytics Block-Level Estimates 2012-2013. These estimates were created by summing the population and housing units contained in the Census blocks reported through Form 477 or SBI. Note that a provider that reports deployment in a particular census block may not necessarily offer service to every person and housing unit in the census block.
Similarly, there have been increases in the number of fixed broadband service customer
subscriptions, for both rate-of-return and price cap carriers. As shown in the figures below, between 2013 and 2014, rate-of-return carriers had a 35 percent increase in subscription to fixed services of at least 3 Mbps/768 kbps and a 61 percent increase for fixed services of at least 10 Mbps/768 kbps, while subscription for price cap carriers increased by 4 percent for fixed services of at least 3 Mbps/768 kbps and increased by 17 percent increase for fixed services of at least 10 Mbps/768 kbps.
Figure 16
Fixed Connections at Least 3 Mbps Downstream and 768 kbps Upstream for Incumbent Local Exchange Carriers
(connections in thousands) (Source: FCC Form 477 Submissions)
Rate-of-Return Carriers Total Residential Business December 2013 1,182 1,050 131 December 2014 1,600 1,429 171 Price Cap Carriers December 2013 24,191 22,099 2,093 December 2014 25,177 23,111 2,065
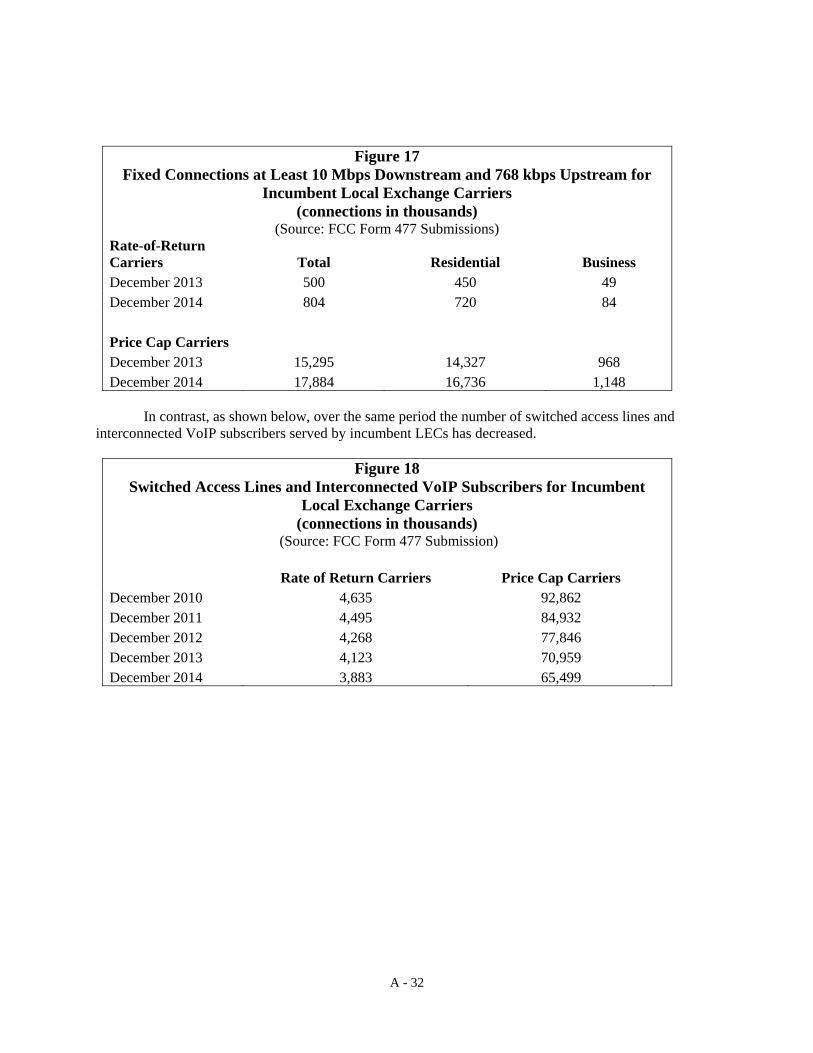
A - 32
Figure 17 Fixed Connections at Least 10 Mbps Downstream and 768 kbps Upstream for
Incumbent Local Exchange Carriers (connections in thousands)
(Source: FCC Form 477 Submissions) Rate-of-Return Carriers Total Residential Business December 2013 500 450 49 December 2014 804 720 84 Price Cap Carriers December 2013 15,295 14,327 968 December 2014 17,884 16,736 1,148
In contrast, as shown below, over the same period the number of switched access lines and
interconnected VoIP subscribers served by incumbent LECs has decreased.
Figure 18 Switched Access Lines and Interconnected VoIP Subscribers for Incumbent
Local Exchange Carriers (connections in thousands)
(Source: FCC Form 477 Submission)
Rate of Return Carriers Price Cap Carriers December 2010 4,635 92,862 December 2011 4,495 84,932 December 2012 4,268 77,846 December 2013 4,123 70,959 December 2014 3,883 65,499