2015 EYE BANKING STATISTICAL REPORT - restoresight.orgrestoresight.org › ... › 03 ›...
98
© 2016. EBAA. All rights reserved 2015 EYE BANKING STATISTICAL REPORT Eye Bank Association of America 1015 18th Street, N.W. Suite 1010 Washington, DC 20036 Phone (202) 775-4999 www.restoresight.org
Transcript of 2015 EYE BANKING STATISTICAL REPORT - restoresight.orgrestoresight.org › ... › 03 ›...

© 2016. EBAA. All rights reserved
2015 EYE BANKING STATISTICAL REPORT
Eye Bank Association of America 1015 18th Street, N.W.
Suite 1010 Washington, DC 20036 Phone (202) 775-4999 www.restoresight.org

2
Table of Contents
Statistical Report Analysis: Surgical Use and Indications for Corneal Transplant, 2014 3
Statistics from United States Eye Banks Referral Trends, Transplant and Conversion Rates 9 12 Donor Demographics 17 Eligibility and Suitability for Tissue Intended for Surgery 20 Reasons Released Tissues Were Not Transplanted 28 Outcomes of Tissue Recovered For Transplant 29 Use of Donated Tissue 31 Annual Comparison of the Number of Corneal Transplants Supplied by U.S. Banks 32 Domestic Surgery Use of Intermediate-Term Preserved Tissue 33 Annual Comparison of the Domestic Use of U.S. Supplied Intermediate-Term Preserved Tissue
37
International Use of Intermediate-Term Preserved Tissue 39 Long-Term Preserved Tissue Preservation and Distribution 43 Tissue Processing for Transplant 46 Forwarded Tissue 49 Indications for Corneal Transplant 50
Statistics from International Eye Banks Referral Trends, Transplant and Conversion Rates 58 Donor Demographics 62 Eligibility and Suitability for Tissue Intended for Surgery 65 Reasons Released Tissues Were Not Transplanted 72 Outcomes of Tissue Recovered For Transplant 73 Use of Donated Tissue 75 Domestic Surgery Use of Intermediate-Term Preserved Tissue 76 International Use of Intermediate-Term Preserved Tissue 80 Long-Term Preserved Tissue Preservation and Distribution 84 Tissue Processing for Transplant 87 Forwarded Tissue 90 Indications for Corneal Transplant 91
Eye Banks Submitting Data for the 2014 Statistical Report 97

3
Surgical Use and Indications for Corneal Transplant Statistical Report Analysis – 2015
Introduction: The 2015 Eye Banking Statistical Report from the Eye Bank Association of America (EBAA) includes information on all 71 U.S. and 10 international member eye banks reporting data for the calendar year 2015, and represents an essentially complete picture of eye banking activity of the eye banks in the United States. The total number of eye banks in the United States (U.S.) dropped from 76 to 71 in 2015 due to mergers and corporate eye bank groups reporting as a single entity.
Utilization of Tissue: The 71 domestic eye banks in 2015 reported 66,523 total donors (1.5% increase over 2014) and 130,987 total eyes/corneas donated (1.8% increase over 2014). Please see Table 1 below for additional details on donations and distribution. Intermediate-term preserved corneas, by far the largest category, included all refrigerated tissue stored in Optisol GS™, Life4°C™, or Eusol C™ used for full thickness and lamellar procedures.
Table 1: Total Donations and Distribution of Tissue in 2015
Donations 2015 2014 % Change Eye Banks Reported 71 76 (-6.6%) Total Whole Globes and Corneas Donated 130,987 128,675 1.8% Total Number of Donors 66,526 65,558 1.5% Distribution 2015 2014 % Change Intermediate-Term Preserved Corneas 74,623 72,013 3.6% Sclera 3,225 3,345 (-3.6%) Long-Term Preserved Corneas 11,672 7,223 61.6% Research 16,924 17,670 (-4.2%) Training 10,003 9,295 7.6%
Utilization of tissue supplied by U.S. eye banks is shown below in Table 2. This table includes all tissue supplied by domestic eye banks whether used domestically or internationally. Total grafts increased to 79,304 in 2015, up 3.8%. Penetrating keratoplasty (PK) increased 1.6% in 2015 to 39,554. Tissue used for endothelial keratoplasty (EK) in 2015 (30,710) increased 6% from 28,961 in 2014. There was a 12.7% increase in tissue used for lamellar keratoplasty (ALK) from 1,953 in 2014 to 2,201 in 2015. The number of corneas used for KLA increased 21.6% from 88 to 107 in 2015. Corneas used for keratoprosthesis increased 23.8% to 364 in 2015. Despite significant percentage increases, the number of corneas used for ALK, keratolimbal allografts and keratoprosthesis procedures remain relatively small: these three procedures combined made up just 3.4% of total grafts in 2015 (see below).

4
Table 2: Utilization of Tissue from U.S. Eye Banks
Distribution 2015 2014 2013 2012 2011 Corneal Grafts Total 79,304 76,431 72,736 68,681 67,590 Penetrating Keratoplasty 39,554 38,919 36,998 36,716 36,144 Anterior Lamellar Keratoplasty 2,201 1,953 2,009 1,855 1,778 Endothelial Keratoplasty 30,710 28,961 27,298 24,277 23,287 Keratolimbal Allograft 107 88 110 97 95 Keratoprosthesis (K-Pro) 364 294 255 263 358 Glaucoma Shunt Patch or other non-keratoplasty use
527 755 687 676 604
Other keratoplasty (experimental surgery) 19 17 17 44 14 Unknown or Unspecified 1,142 1,026 1,068 1,554 2,223 Sclera 3,225 3,345 3,693 3,497 5,507 Long-Term Preserved Corneas 11,672 7,223 4,840 5,095 4,409 Keratoplasty 737 938 499 305 276 Glaucoma Shunt Patching 10,843 6,212 4,040 4,435 3,802 Other Surgical Uses 92 73 301 335 331 Research 16,924 17,670 17,384 19,320 19,230 Training 10,003 9,295 7,451 6,850 6,940
The number of penetrating grafts performed in the U.S. declined 0.7% in 2015 to 19,160 (see Table 3 below). Table 3 shows a decrease each year in penetrating keratoplasty procedures performed in the U.S. over the past 11 years from 42,063 in 2005 to 19,160 in 2015, overall a 54.4% decrease from 2005 to 2015. The number of corneas used domestically for endothelial keratoplasty (27,208) increased 4.8% in 2015, following a 3.9% increase in 2014 and an 8.4% increase in 2013. Endothelial keratoplasty has been the most commonly performed keratoplasty procedure in the United States in the last four years and continues to increase (see figure 1 below). Last year, there was an increase in both ALK (22%) and keratolimbal allograft (21.2%) procedures in 2015, although the numbers were small.
Table 3: Domestic Use of Intermediate-Term Preserved Tissues
Annual Comparison 2005 – 2015
Domestic Surgery Use 2005 2006 2007 2008 2009 2010 2011 2012 2013 2014 2015
Penetrating Keratoplasty 42,063 37,776 34,806 32,524 23,269 21,970 21,620 21,422 20,954 19,294 19,160
Endothelial Keratoplasty 1,398 6,027 14,159 17,468 18,221 19,159 21,555 23,049 24,987 25,965 27,208
Anterior Lamellar Keratoplasty
641 806 950 1,072 774 1,041 932 883 951 914 1,115
Keratolimbal Allograft 175 138 207 173 120 130 69 80 91 80 97

5
Figure 1: Domestic PK vs. EK vs. ALK Surgery Trends
0
5,000
10,000
15,000
20,000
25,000
30,000
35,000
40,000
45,000
2005 2006 2007 2008 2009 2010 2011 2012 2013 2014 2015
Domestic Surgery Use of U.S. Supplied Intermediate-Term Preserved Tissue
PK EK ALK KLA
The relative frequency of PK, EK and ALK procedures performed in the U.S. over the last 10 years can be seen above in Figure 1: Domestic PK vs. EK vs. ALK Surgery Trends. The figures below track the number of DSEK and DMEK procedures on a monthly basis and show the increase in DMEK procedures starting in 2012. Figure 2: Domestic DSEK Trends shows relatively flat numbers for DSEK over the past five years. Figure 3: Domestic DMEK Trends shows an increase in DMEK numbers accounting for the continued upslope of endothelial keratoplasty in Figure 1 above. Table 4 below shows that while there was only a slight decrease in DSEK numbers, DMEK increased 63.8% in 2015, following an increase of 88.2% in 2014 and a 103.5% increase in 2013.
Figure 2: Domestic DSEK Trends Figure 3: Domestic DMEK Trends

6
Table 4: Domestic Endothelial Keratoplasty Numbers
Annual Comparison 2012 – 2015
Domestic Surgery Use 2015 2014 2013 2012
Total Endothelial Keratoplasty Procedures 27,208 25,965 24,987 23,049
DSEK, DSAEK, DLEK Procedures 22,514 23,100 23,465 22,301
DMEK or DMAEK Procedures 4,694 2,865 1,522 748
Tissue used for glaucoma shunt procedures is shown below in Figure 4. In 2011 sclera was the most commonly used tissue for glaucoma shunt patching, but corneas stored in long-term solution (where endothelial cell counts are not needed) increased substantially in 2015.
On April 1, 2015, CMS extended cornea tissue pass through status to corneas in long-term storage used for patch use, but this pass through allowance was terminated on January 1, 2016 and the effect of reimbursement uncertainty may alter the slope of this curve in the future.
Figure 4: Ocular Tissue used for Glaucoma Shunt Patching

7
Figure 5 shows different types of keratoplasty procedures performed both domestically and abroad using tissue from U.S. eye banks. 50% of tissue produced by U.S. eye banks is used for penetrating keratoplasty and 39% is used for endothelial keratoplasty. Penetrating keratoplasty is the most common procedure performed using corneas produced in the U.S.
Figure 5: 2015 Use of Released Corneas from U.S. Eye Banks
50%
39%
3%
0%
0% 1% 0% 1% 6%
2015 Use of Released Corneas - U.S. Eye Banks
PK EK ALK
KLA K-Pro Shunt Patch
Other Keratoplasty Unknown Long-term Preserved
Figure 6 shows domestic utilization of corneas provided by U.S. eye banks in 2015, and does not count corneas shipped abroad. EK comprises 46% of domestic keratoplasty procedures and PK comprises 40%. Endothelial keratoplasty is the most common keratoplasty procedure performed in the U.S. using intermediate-term corneas for the fourth straight year.
Figure 6: 2015 Domestic Uses of Intermediate-Term Corneas from U.S. Eye Banks

8
Table 5: Indications for Keratoplasty Reported by US Banks
Indications for Penetrating Keratoplasty 2015 2014 A. Post-cataract surgery edema 2,905 7.3% 3,378 8.7% B. Keratoconus 5,835 14.8% 6,224 16.0% C. Fuchs' Dystrophy 1,235 3.1% 1,196 3.1% D. Repeat Corneal Transplant 4,267 10.8% 4,399 11.3% E. Other degenerations or dystrophies 1,148 2.9% 1,209 3.1% F. Post-refractive surgery 55 0.1% 74 0.2% G. Microbial changes 689 1.7% 800 2.1% H. Mechanical or chemical trauma 1,180 3.0% 1,139 2.9% I. Congenital opacities 672 1.7% 816 2.1% J. Pterygium 15 0.0% 12 0.0% K. Non-infectious ulcerative keratitis or perforation 1,357 3.4% 1,197 3.1% L. Other causes of corneal dysfunction or distortion (non-endothelial) 2,633 6.7% 2,814 7.2%
M. Other causes of endothelial dysfunction 1,189 3.0% 1,423 3.7% Z. Unknown, unreported, or unspecified 16,373 41.4% 14,238 36.6% Total Indications for Penetrating Keratoplasty 39,554 38,919
Indications for Anterior Lamellar Keratoplasty 2015 2014 B. Keratoconus 844 38.3% 757 38.8% D. Repeat Corneal Transplant 50 2.3% 27 1.4% E. Other degenerations or dystrophies 89 4.0% 107 5.5% F. Post-refractive surgery 17 0.8% 8 0.4% G. Microbial changes 56 2.5% 32 1.6% H. Mechanical or chemical trauma 53 2.4% 47 2.4% I. Congenital opacities 41 1.9% 27 1.4% J. Pterygium 5 0.2% 6 0.3% K. Non-infectious ulcerative keratitis or perforation 82 3.7% 51 2.6% L. Other causes of corneal dysfunction or distortion 171 7.8% 140 7.2% Z. Unknown, unreported, or unspecified 793 36.0% 751 38.5% Total for Anterior Keratoplasty 2,201 1,953 Indications for Endothelial Keratoplasty 2015 2014 A. Post-Cataract Surgery Edema 5,385 17.5% 5,151 17.8% C. Fuchs’ Dystrophy 14,472 47.1% 13,817 47.7% D. Repeat Corneal Transplant 2,613 8.5% 2,385 8.2% M. Other Causes of Endothelial Dysfunction 3,208 10.4% 3,099 10.7% Z. Unknown, unreported, or unspecified 5,032 16.4% 4,509 15.6% Total for Endothelial Keratoplasty 30,710 28,961

9
Indications for Transplant: The indications for keratoplasty procedures utilizing 72,465 corneas provided by U.S. eye banks for PK, ALK and EK are shown in Table 5: “Indications for Corneal Transplant Reported by U.S. Banks”, on the preceding page. Unfortunately, since 2011 the most frequent indication for transplant noted on forms returned to eye banks has been “unknown”. The data for different procedures that are used for different diagnoses is potentially skewed since the diagnosis is unknown for over 30% of all grafts (41.4% of PKs, 36% of ALKs and 16.4% of EKs). Table 6 on the following page shows the data in Table 5 condensed into four basic categories that illustrate the main diagnoses for procedures performed: 1) endothelial cell failure, 2) stromal or full thickness (non-endothelial) disease, 3) regrafts and 4) unknown. Within the specific diagnosis categories, Fuchs’ dystrophy was the most common indication for keratoplasty again in 2015 (15,013, 21.5%). Post cataract surgery edema was second (8,529, 12.2%) and keratoconus (6,981, 10.1%) was third. Repeat transplants were fourth (6,811, 9.8%). The order of these four categories was essentially unchanged from 2013. The data in Table 6 are essentially unchanged from 2014 and 2013. 92% of patients with Fuchs’ dystrophy were treated with EK. The 8% who received a penetrating keratoplasty presumably had stromal haze that would have impaired visual acuity after endothelial cell replacement, could not tolerate the positional restrictions necessary for EK or did not have access to pre-cut tissue. 89% of patients with keratoconus were treated with penetrating keratoplasty, while 11% had ALK. The difficulty of ALK and uncertainty over reimbursement continue to hold this ratio essentially unchanged for the past four years. Endothelial keratoplasty numbers increased about the same amount as the increase in DMEK, suggesting that DSEK numbers remain fairly constant and the increase in EK is propelled by increasing numbers of DMEK. Endothelial keratoplasty as seen previously in Figure 1 was the most common type of keratoplasty procedure performed in 2015.
Endothelial cell failure is the leading indication as a group for keratoplasty from U.S. provided tissue. Nearly forty percent of all keratoplasty procedures were performed for endothelial failure (Fuchs, post cataract surgery edema and other causes of endothelial cell failure). Grafts for corneal edema were 23,065 EKs (81.2%) and 5,329 PKs (18.8%). 20.6% of all keratoplasty procedures were performed for stromal or full thickness disease; of these, 90.9% were PKs and 9.1% were ALK, (compared to 7.6% ALK last year). For keratoconus, the leading individual indication for keratoplasty, there were 5,835 (87.4%) PKs and 844 (12.6%) ALKs performed (compared to 10.8% ALK last year). The overall regraft rate was 9.6%, essentially unchanged from last year: regraft rates were 2.3% for ALK, 8.5% for EK and 10.8% for PK.
Note: Tables 1, 2, 5, and 6 and Figures 4 and 5 refer to corneas provided by U.S. eye banks for domestic and international use. Figures 1, 2, 3, and 6 and Tables 3 and 4 refer to corneas transplanted only in the U.S.

10
Table 6: Indications for Transplant 2015
Endothelial Cell Failure Surgical Diagnosis PK ALK EK TOTAL
A Post-cataract surgery edema
2,905 35% -- -- 5,385 65% 8,290
C Fuch's Dystrophy 1,235 7.9% -- -- 14,472 92.1% 15,707 M Other causes of
endothelial dysfunction
1,189 27% -- -- 3,208 73% 4,397
Subtotal 5,329 18.8% 0 0% 23,065 81.2% 28,394 13.5% of PK 75.1% EK 39.2% of grafts
Stromal or Full Thickness (non-endothelial) Disease
Surgical Diagnosis PK ALK EK TOTAL B Keratoconus 5,835 87.4% 844 12.6% -- -- 6,679 E Other Degenerations
of Dystrophies 1,148 92.8% 89 7.2% -- -- 1,237
F Post-refractive Surgery
55 76.4% 17 23.6% -- -- 72
G Microbial Changes 689 92.5% 56 7.5% -- -- 745 H Mechanical or
Chemical Trauma 1,180 95.7% 53 4.3% -- -- 1,233
I Congenital Opacities 672 94.2% 41 5.8% -- -- 713 J Pterygium 15 75% 5 25% -- -- 20 K Non-infectious
ulcerative keratitis or perforations
1,357 94.3% 82 5.7% -- -- 1,439
L Other causes of corneal dysfunction or distortion
2,633 93.9% 171 6.1% -- -- 2,804
Subtotal 13,584 90.9% 1,358 9.1% 0 0% 14,942 34.3% of PK 61.7% of ALK 20.6% of grafts
Regraft
Surgical Diagnosis PK ALK EK TOTAL D Repeat Corneal
Transplant 4,267 61.6% 50 0.7% 2,613 37.7% 6,930
10.8% of PK 2.3% of ALK 8.5% of EK 9.6% of grafts
Unknown / Unspecified Surgical Diagnosis PK ALK EK TOTAL
Z. Unknown, unreported, or unspecified
16,373 73.8% 793 3.6% 5,032 22.7% 22,198
41.4% of PK 36% of ALK 16.4% of EK 30.6% of grafts
PK ALK EK TOTAL Total for Each Procedure 39,554 54.6% 2,201 3.0% 30,710 42.4% 72,465

11
Still of concern is the 30.6% “unknown” diagnosis for keratoplasty procedures, up from 27.9% last year, which can skew the data in any number of directions and limit the significance of the conclusions that can be drawn from these data. The “unknowns” may be mostly internationally distributed tissue, which as a group may or may not have the profile of domestic tissue, for which the diagnosis has been noted.
Conclusions: 1) Endothelial keratoplasty was the most common domestic keratoplasty procedure in 2015 for the fourth year in a row (see Figure 1). 38.7% of U.S. donated tissue was used for EK. 2) 39.2% of all keratoplasty procedures were for endothelial disease in 2015 (Table 6). 3) The slight increase in domestic EK in 2015 was accounted for by the increase in DMEK a) DMEK increased 63.8% in 2015 (increased 88.2% in 2014 and 103.5% in 2013). b) DSEK decreased 2.5% in 2015 (1.6% decrease in 2014 and 5.2% increase in 2013). 4) The number of domestic penetrating keratoplasty procedures using tissue in intermediate-term storage solution decreased again in 2015 for the tenth consecutive year (from 42,063 in 2005 to 19,160 in 2015) (see Table 3). 5) Anterior lamellar keratoplasty, keratoprosthesis and keratolimbal allograft use of U.S donated tissues all increased in 2015, but the numbers of all three procedures remain small. 6) Corneas in long-term storage solution used for patching glaucoma tube shunt procedures increased substantially in 2015. 7) The number of keratoplasty procedures reported as “Unknown” continues to be a significant surgeon induced source of error in the statistical reporting process and may be improved by implementing a recipient graft registry. Woodford S. Van Meter, MD Professor of Ophthalmology University of Kentucky Medical Director, Lions Eye Bank of Lexington

12
2015 Eye Banking Statistics Reported by U.S. Banks: Death Referrals and Tissue Recoveries
Donations 2015 2014 2013 2012 2011 Number of Eye Banks Reporting 71 76 76 80 79 Total Whole Eyes and Corneas Donated 130,987 128,675 123,079 116,990 114,348 Total Number of Donors 66,526 65,558 62,274 59,221 57,835
Death Referrals 2015 2014 2013
Total Death Referrals 693,449 748,786 738,404
Death referrals determined eligible 174,349 166,849 168,977
Tissue Recoveries Total Donors 66,526 65,558 62,274 Donors recovered not found on donor registry or known to have first person consent 31,390 32,306 32,628 Donors recovered found on donor registry or known to have first person consent 35,136 33,252 29,646 Eyes or Corneas Recovered with Intent for Surgical Use 119,687 116,071 110,365 Eyes or Corneas Recovered for Other Uses 11,300 12,604 12,714

13
2015 U.S. Eye Banking Statistics Reported by U.S. Banks:
Comparison of Eye Bank Cornea Recovery Rates
Recovered Corneas 2011 2012 2013 2014 2015 Trends0 2 0 2 2 1
<100 2 2 3 4 2100-250 5 5 5 3 5251-500 13 18 16 13 12
501-1,000 15 15 14 17 121,001-2,000 29 20 22 23 192,001-3,000 5 6 8 6 83,001-4,000 5 3 1 2 14,001-5,000 2 2 2 3 25,001-6,000 1 1 1 1 26,001-7,000 1 0 0 0 17,001-8,000 1 0 0 0 08,001-9,000 0 1 0 0 09,001-10,000 0 0 1 0 0
>10,000 0 0 1 2 2Avg. Corneas
Recovered for Transplant
1253 1297 1452 1527 1711
U.S. Eye Banks

14
2015 Eye Banking Statistics Reported by U.S. Banks: Referral Trends, Transplant and Conversion Rates
U.S. Eye Banks
Month Transplant
Rate Conversion
Rate Death
Referrals
Transplant Eligible
Referrals Transplant Intended Corneas Recovered
Jan. 2015 64.0% 35.4% 69795 15780 11004 Feb. 2015 63.1% 35.1% 60634 13522 9279 Mar. 2015 65.6% 35.5% 64872 15051 10500 Apr. 2015 65.2% 33.1% 59307 14766 9621 May 2015 66.5% 33.9% 59002 14678 9781 Jun. 2015 67.7% 35.0% 55133 14001 9656 Jul. 2015 66.3% 35.8% 51380 14230 10051
Aug. 2015 65.5% 35.9% 52293 13992 9882 Sep. 2015 66.8% 36.7% 51299 13566 9812 Oct. 2015 68.5% 35.5% 55742 15372 10763 Nov. 2015 68.0% 33.7% 54216 14749 9793 Dec. 2015 68.0% 33.1% 59776 14642 9545
2011 Total 66.5% 30.1% 745405 170388 101533 2012 Total 66.2% 31.7% 770479 165688 103774 2013 Total 65.9% 33.0% 738404 168977 110365 2014 Total 65.9% 35.4% 748786 166849 116071 2015 Total 66.3% 34.9% 693449 174349 119687
2015 Avg. N/A N/A 57787 14529 9974 Std. Dev. 1.7% 1.2% 5621 693 519
*Transplant rate is the number of corneas used for transplant divided by the number recovered for transplant. Conversion rate is the number of transplant donors divided by the number of transplant eligible referrals.

15
2015 Eye Banking Statistics Reported by U.S. Banks: Referral Trends, Transplant and Conversion Rates

16
2015 Eye Banking Statistics Reported by U.S. Banks: Transplant and Conversion Rates

17
2015 U.S. Eye Banking Statistics Reported by U.S. Banks: Donors by Age Reported by U.S. Banks
U.S. Eye Banks - Age Profile
Year Age <1
Age 1-10
Age 11-20
Age 21-30
Age 31-40
Age 41-50
Age 51-60
Age 61-70
Age 71-80
Age >80
2011 12 405 1541 2700 3395 7370 14245 18521 7830 1816 2012 21 367 1468 2843 3451 7542 14679 19431 7603 1816 2013 21 346 1436 2732 3431 7099 14307 20213 9907 2782 2014 15 380 1392 2780 3531 7474 15907 21338 10413 2328 2015 15 359 1602 3035 3917 7657 16717 22586 9055 1583
Monthly Avg 1 30 134 253 326 638 1393 1882 755 132
Std. Dev. 1.0 6.7 17.7 31.8 33.0 35.9 59.6 132.6 91.3 21.1

18
2015 U.S. Eye Banking Statistics Reported by U.S. Banks: Donors by Gender Reported by U.S. Banks
U.S. Eye Banks - Sex Profile Year Male Female 2011 35491 22344 2012 36104 23117 2013 38221 24053 2014 39975 25583 2015 40990 25536
Monthly Avg. 3416 2128
Std. Dev. 181.5 111.7

19
2015 U.S. Eye Banking Statistics Reported by U.S. Banks: Cause of Death Reported by U.S. Banks
U.S. Eye Banks - Cause of Death Profile Year Heart Cancer CVA Respiratory Trauma Other 2011 19578 10680 5224 5785 6327 10241 2012 19889 11117 5342 5874 6730 10269 2013 20302 11581 5618 6557 6806 11410 2014 21969 11831 5884 7134 6893 11847 2015 21587 11722 5699 7052 7427 13039
Monthly Avg. 1799 977 475 588 619 1087
Std. Dev. 110.8 79.0 27.2 79.1 76.2 55.0

20
2015 Eye Banking Statistics Reported by U.S. Banks: Reasons Tissue Intended for Surgery Was Not Released
There are several reasons why tissue intended for surgery may not ultimately be used for surgery. These include positive serology results, defects noted at the time of evaluation (scars, infiltrates, low cell counts, etc.) and/or medical or social history information, all of which occur subsequent to initial screening and procurement.
Contraindications for Transplant1 2015 2014 Positive or Reactive Test for Communicable Disease Agent or Disease 9,903 29.5% 10,161 30.8%
Anti-HIV-1/2 220 0.7% 185 0.6% HIV-1 Nucleic Acid Test Positive 80 0.2% 70 0.2% Anti-HCV 2,025 6.0% 1,889 5.7% Hepatitis C Nucleic Acid Test Positive 700 2.1% 709 2.2% Hepatitis B Surface Antigen (HBsAg) Positive 1,070 3.2% 1,130 3.4% Hepatitis B Core (HBcAb) Positive 4,453 13.3% 4,889 14.8% Hepatitis B Nucleic Acid Test Positive 287 0.9% 379 1.1% Syphilis Positive 358 1.1% 390 1.2% HTLV Antibody (HTLV I/II Ab) 234 0.7% 206 0.6% West Nile Virus Nucleic Acid Test Positive 10 0.03% 4 0.01% Other Positive Serology 466 1.4% 342 1.0% Other Communicable Disease Testing Issue 368 1.1% 423 1.3% Medical Record or Autopsy Findings 7,754 23.1% 7,313 22.2% Dementia 827 2.5% 733 2.2% Sepsis 3,521 10.5% 3,510 10.6% Sepsis - (determined by positive blood cultures) 1,078 3.2% 1,067 3.2% Sepsis - (determined by other indicators) 2,443 7.3% 2,443 7.4% Plasma Dilution 381 1.1% 445 1.4% Unknown Cause of Death 326 1.0% 388 1.2% Medical Record or Autopsy Findings: Other 2,699 8.0% 2,237 6.8% Medical/Social Interview 2,745 8.2% 2,331 7.1% Travel Questions 467 1.4% 379 1.1% Dementia / Neurological Issues 180 0.5% 139 0.4% Medical/Social Interview: Other 2,098 6.2% 1,813 5.5% Body Exam 266 0.8% 235 0.7% Total eyes/corneas intended for transplant but not released for transplant 33,577 32,958
*Percentages read from this table should be read as "of the tissue not released for transplant"
1 Some tissues had multiple contraindications.

21
2015 Eye Banking Statistics Reported by U.S. Banks: Reasons Tissue Intended for Surgery Was Not Released
Contraindications for Transplant
(continued) 2015 2014
Tissue Suitability (e.g. slit lamp/spec eval) 15,341 45.7% 14,463 43.9% Epithelium 313 0.9% 403 1.2% Stroma 5,954 17.7% 6,111 18.5% Prior reactive surgery 512 1.5% 473 1.4% Scar 1,151 3.4% 1,628 4.9% Infiltrate 2,983 8.9% 2,755 8.4% Foreign Body 210 0.6% 187 0.6% Other 1,098 3.3% 1,068 3.2% Descemet’s membrane 520 1.5% 455 1.4% Endothelium 8,885 26.5% 7,494 22.7% Quality Issue 486 1.4% 434 1.3% Storage 135 0.4% 136 0.4% Labeling 9 0.0% 11 0.0% Processing 252 0.8% 232 0.7% Supply or Reagent 58 0.2% 24 0.1% Environmental Control 32 0.1% 31 0.1% Other Reason prior to Tissue Release 1,708 5.1% 2,065 6.3% Total eyes/corneas intended for transplant but not released for transplant 33,577 32,958
*Percentages read from this table should be read as "of the tissue not released for transplant"

22
2015 Eye Banking Statistics Reported by U.S. Banks: Reasons Tissue Intended for Surgery Was Not Released
Reasons Not Released 2011 2012 2013 2014 2015 Trends
Serology Tests 8299 9250 9656 10161 9903Testing Issue 246 307 375 423 368
Med. Rec./Autopsy
Finding 6756 6701 7138 7313 7754Med Soc Hx
Finding 1694 2158 2200 2331 2745Body Exam 205 273 189 235 266
Tissue Suitability 11168 12360 12384 14463 15341Quality Issue 476 378 416 434 486Other Reason 542 2296 2294 2065 1708

23
2015 Eye Banking Statistics Reported by U.S. Banks: Reasons Tissue Intended for Surgery Was Not Released
Not Released - Serology 2011 2012 2013 2014 2015 Trend
HIV 400 258 253 255 300HIV I/II Ab 164 173 169 185 220HIV NAT 236 85 84 70 80
HBV 4261 5268 5425 6366 5810HBsAg 723 876 786 1130 1070HBcAb 3538 4392 4639 4889 4453
HBV NAT 0 0 0 347 287HCV 2637 2623 2791 2598 2725
HCV Ab 1925 1957 2029 1889 2025HCV NAT 712 666 762 709 700Syphilis 347 348 397 390 358
HTLV 313 215 237 206 234WNV 0 0 0 4 10Other 341 538 553 342 466

24
2015 Eye Banking Statistics Reported by U.S. Banks: Reasons Tissue Intended for Surgery Was Not Released

25
2015 U.S. Eye Banking Statistics Reported by U.S. Banks: Reasons Tissues Were Not Released
Not Released - Med Record /
Autopsy2011 2012 2013 2014 2015 Trends
Dementia/Neuro 491 542 660 733 827Sepsis (Cultures) 925 880 958 1067 1078
Sepsis (Other) 2356 2511 2628 2443 2443Plasma Dilution 422 353 447 445 381Unknown COD 507 416 485 388 326
Other 2055 1999 1960 2237 2699
Not Released - Med Soc
2011 2012 2013 2014 2015 Trends
Travel 257 285 338 379 467Dementia/Neuro 146 174 198 139 180
Other 1291 1699 1664 1813 2098

26
2015 U.S. Eye Banking Statistics Reported by U.S. Banks: Tissue Suitability Reasons Tissues Were Not Released
Not Released - Tissue Suitability
2011 2012 2013 2014 2015 Trends
Epithelium 368 288 279 403 313Prior Refractive Surgery 345 298 390 473 512
Scar 989 1036 1329 1628 1151Infiltrate 2246 2455 2800 2755 2983
Foreign Body 218 200 188 187 210Other Stromal Finding 1034 1404 1095 1068 1098
Descemet's Membrane 403 438 346 455 520Endothelium 5565 6241 5957 7494 8554

27
2015 Eye Banking Statistics Reported by U.S. Banks: Quality Issues for Tissue Not Released
Not Released - Quality Issues / Other
2011 2012 2013 2014 2015 Trends
Storage Issue 173 123 101 136 135Labeling Issue 44 14 14 11 9
Processing Issue (not released) 148 181 225 232 252Supply / Reagent Issue 84 40 47 24 58
Environmental Control Issue 27 20 29 31 32Body Exam 205 273 189 235 266
Other Sero Testing Issue 246 307 375 423 368Other Issue 542 2296 2294 2065 1708

28
2015 Eye Banking Statistics Reported by U.S. Banks: Reasons Released Tissues Were Not Transplanted
Reasons Released Tissues Were Not
Transplanted 2015 2014
Transportation Issue 226 3.3% 169 2.5% Surgeon Issue 140 2.1% 150 2.2% Recipient Issue 35 0.5% 51 0.8% Returned and Unable to Place Again 511 7.5% 414 6.2% Donor Information Not Available at the Time of Tissue Release 50 0.7% 26 0.4%
Expired or Unable to Place Tissue 3,958 58.2% 4,265 63.8% Tissue Damaged During Processing 764 11.2% 596 8.9% Other Reason After Release of Tissue 1,359 20.0% 1,063 15.9% Total eyes/corneas released for transplant but not used for transplant 6,806 6,681
*Percentages read from this table should be read as "of the tissue not released for transplant"

29
2015 Eye Banking Statistics Reported by U.S. Banks: Outcomes of Tissue Recovered for Transplant
Donations 2015 2014 % Change Eye Banks Reported 71 76 (-6.6%) Total Whole Globes and Corneas Donated 130,987 128,675 1.8% Total Number of Donors 66,526 65,558 1.5% Distribution 2015 2014 % Change Intermediate-Term Preserved Corneas 74,623 72,013 3.6% Sclera 3,225 3,345 (-3.6%) Long-Term Preserved Corneas 11,672 7,223 61.6% Research 16,924 17,670 (-4.2%) Training 10,003 9,295 7.6%
Outcomes of Tissue Recovered for Transplant - U.S. Eye Banks
Month
Corneas Recovered
for Transplant
Corneas Segmented
Corneal Segments Produced
Not Released Released but
Not Transplanted
Whole Corneas and
Segments Transplanted
Preserved Long-Term
Jan. 2015 11004 0 0 3279 29.8% 684 6.2% 6708 61.0% 333 3.0% Feb. 2015 9279 1 2 2765 29.8% 659 7.1% 5615 60.5% 241 2.6% Mar. 2015 10500 0 0 2884 27.5% 732 7.0% 6563 62.5% 321 3.1% Apr. 2015 9621 0 0 2739 28.5% 605 6.3% 5897 61.3% 380 3.9% May 2015 9781 0 0 2804 28.7% 474 4.8% 6186 63.2% 317 3.2% Jun. 2015 9656 0 0 2700 28.0% 421 4.4% 6120 63.4% 415 4.3% Jul. 2015 10051 0 0 2808 27.9% 577 5.7% 6169 61.4% 497 4.9%
Aug. 2015 9882 0 0 2791 28.2% 622 6.3% 6101 61.7% 368 3.7% Sep. 2015 9812 0 0 2624 26.7% 630 6.4% 6122 62.4% 436 4.4% Oct. 2015 10763 0 0 2914 27.1% 479 4.5% 7000 65.0% 370 3.4% Nov. 2015 9793 0 0 2738 28.0% 396 4.0% 6196 63.3% 463 4.7% Dec. 2015 9545 0 0 2531 26.5% 527 5.5% 5947 62.3% 540 5.7%
2011 Total 101533 7 13 29407 29.0% 4536 4.5% 67520 66.5% 3017 3.0% 2012 Total 103774 4 7 30185 29.1% 4908 4.7% 68684 66.2% 2454 2.4% 2013 Total 110365 90 6 32456 29.4% 5182 4.7% 68442 62.1% 4294 3.9%
2014 Total 116071 2 4 32958 28.4% 6681 5.8% 72013 62.0% 4420 3.8%
2015 Total 119687 1 2 33577 28.1% 6806 5.7% 74624 62.3% 4681 3.9%
2015 Avg. 9974 0 0 2798 N/A 567 N/A 6219 N/A 390 N/A Std. Dev. 519 0.29 0.6 184 1.0% 107 1.0% 375 1.3% 85 0.9%
*Percentages read from this table should be read as "of the tissue recovered with transplant intent"

30
2015 Eye Banking Statistics Reported by U.S. Banks: Outcomes of Tissue Recovered for Transplant

31
2015 Eye Banking Statistics Reported by U.S. Banks: Use of Donated Tissues
Distribution 2015 2014 2013 2012 2011 Corneal Grafts Total 79,304 76,431 72,736 68,681 67,590 Penetrating Keratoplasty 39,554 38,919 36,998 36,716 36,144 Anterior Lamellar Keratoplasty 2,201 1,953 2,009 1,855 1,778 Endothelial Keratoplasty 30,710 28,961 27,298 24,277 23,287 Keratolimbal Allograft 107 88 110 97 95 Keratoprosthesis (K-Pro) 364 294 255 263 358 Glaucoma Shunt Patch or other non-keratoplasty use
527 755 687 676 604
Other keratoplasty (experimental surgery) 19 17 17 44 14 Unknown or Unspecified 1,142 1,026 1,068 1,554 2,223 Sclera 3,225 3,345 3,693 3,497 5,507 Long-Term Preserved Corneas 11,672 7,223 4,840 5,095 4,409 Keratoplasty 737 938 499 305 276 Glaucoma Shunt Patching 10,843 6,212 4,040 4,435 3,802 Other Surgical Uses 92 73 301 335 331 Research 16,924 17,670 17,384 19,320 19,230 Training 10,003 9,295 7,451 6,850 6,940

32
2015 U.S. Eye Banking Statistics Reported by U.S. Banks: Annual Number of Corneal Transplants Supplied by U.S. Banks
Year Total Provided by U.S.
Performed in U.S.
1991 39,515 35,831 1992 39,973 35,525 1993 40,215 35,173 1994 41,539 35,022 1995 42,740 35,300 1996 43,711 34,668 1997 43,492 35,209 1998 45,579 35,861 1999 45,765 33,020 2000 46,949 33,260 2001 46,532 33,035 2002 46,440 32,559 2003 46,436 32,240 2004 46,841 32,106 2005 44,329 31,952 2006 45,035 33,962 2007 50,122 39,391 2008 52,487 41,652 2009 59,784 42,606 2010 59,271 42,642 2011 67,590 46,196 2012 68,681 46,684 2013 72,736 48,229 2014 76,431 47,530 2015 79,304 48,792

33
2015 Eye Banking Statistics Reported by U.S. Banks: Domestic Surgery Use of Intermediate-Term Preserved Tissue
Intermediate-Term Tissue Domestic Distribution of Source Eye Bank Corneas 2015 2014 Intermediate-term preserved corneas processed into corneal segments 1 2 Number of intermediate-term preserved corneas segments produced 2 4 Intermediate-term preserved corneas, corneal segments or whole eyes transplanted in the U.S for: 48,792 47,530
PK 19,160 19,294 Optical or Elective PK 18,570 18,860 Emergency of Full Thickness 590 434 EK 27,208 25,965 DSEK, DSAEK, DLEK 22,514 23,100 DMEK or DMAEK 4,694 2,865 ALK 1,115 914 DALK (Deep Anterior Lamellar Keratoplasty) 1,018 832 SALK (Superficial Anterior Lamellar Keratoplasty) 26 20 Other ALK (e.g. peripheral, eccentric, etc.) 71 62 KLA 97 80 Keratoprosthesis (K-Pro) 323 260 Glaucoma shunt patch or other non-keratoplasty use 458 704
Other Keratoplasty (e.g. experimental surgery type) 12 13 Unknown or Unspecified 419 300

34
2015 Eye Banking Statistics Reported by U.S. Banks: Domestic Surgery Use of Intermediate-Term Preserved Tissue

35
2015 Eye Banking Statistics Reported by U.S. Banks: Domestic Surgery Use of Intermediate-Term Preserved Tissue

36
2015 Eye Banking Statistics Reported by U.S. Banks: Domestic Surgery Use of Intermediate-Term Preserved Tissue

37
Eye Banking Statistics Reported by U.S. Banks: Domestic Use of Intermediate-Term Preserved Tissues
Annual Comparison 2005 - 2015
Domestic Surgery Use 2005 2006 2007 2008 2009 2010 2011 2012 2013 2014 2015
Penetrating Keratoplasty 42,063 37,776 34,806 32,524 23,269 21,970 21,620 21,422 20,954 19,294 19,160
Endothelial Keratoplasty 1,398 6,027 14,159 17,468 18,221 19,159 21,555 23,049 24,987 25,965 27,208
Anterior Lamellar Keratoplasty
641 806 950 1,072 774 1,041 932 883 951 914 1,115
Keratolimbal Allograft 175 138 207 173 120 130 69 80 91 80 97

38
2015 Eye Banking Statistics Reported by U.S. Banks: Domestic Surgery Use of Intermediate-Term Preserved Tissue
U.S. Eye Banks
Month PK
(Optical, Elective)
PK (Emerg.)
EK (DSEK)
EK (DMEK)
ALK (DALK)
ALK (SALK)
ALK (Other) KLA K-
Pro Shunt Patch Other Unknown
Jan. 2015 39.3% 1.9% 46.8% 7.4% 1.7% 0.0% 0.1% 0.1% 0.7% 1.6% 0.0% 0.1% Feb. 2015 39.7% 0.8% 47.0% 7.6% 1.5% 0.0% 0.3% 0.2% 0.7% 0.7% 0.1% 1.3% Mar. 2015 39.0% 1.1% 45.3% 8.7% 2.4% 0.0% 0.3% 0.2% 0.7% 0.7% 0.1% 1.2% Apr. 2015 37.5% 0.9% 47.2% 9.0% 1.8% 0.0% 0.1% 0.1% 0.7% 1.2% 0.0% 1.5% May 2015 37.7% 1.1% 47.7% 9.5% 2.1% 0.1% 0.1% 0.1% 0.7% 0.8% 0.0% 0.1% Jun. 2015 38.2% 1.0% 46.6% 10.3% 2.0% 0.1% 0.1% 0.2% 0.5% 0.6% 0.0% 0.3% Jul.
2015 37.6% 0.9% 46.8% 9.9% 2.3% 0.1% 0.1% 0.3% 0.6% 1.2% 0.0% 0.2% Aug. 2015 36.7% 1.0% 47.3% 10.5% 2.4% 0.0% 0.1% 0.2% 0.7% 0.6% 0.0% 0.4% Sep. 2015 37.1% 1.5% 46.0% 10.2% 1.9% 0.0% 0.1% 0.2% 0.8% 0.9% 0.0% 1.1% Oct. 2015 36.6% 1.0% 45.9% 11.2% 2.2% 0.1% 0.1% 0.2% 0.5% 1.2% 0.0% 1.0% Nov. 2015 37.6% 1.4% 46.0% 10.1% 2.3% 0.0% 0.2% 0.1% 0.6% 0.7% 0.0% 1.0% Dec. 2015 40.3% 2.1% 40.9% 10.3% 2.1% 0.1% 0.1% 0.4% 0.6% 1.0% 0.0% 2.0%
20.7% 0.5% 20.8% 0.3% 0.6% 0.6% 0.6% 0.6% 0.6% 0.6% 0.6% 0.6% 2011 Avg. 45.7% 1.1% 45.9% 0.7% 1.4% 0.1% 0.5% 0.1% 0.7% 1.2% 0.0% 2.4% 2012 Avg. 45.1% 0.7% 47.8% 1.6% 1.6% 0.1% 0.2% 0.2% 0.5% 1.4% 0.1% 0.7% 2013 Avg. 42.8% 0.6% 48.7% 3.2% 1.8% 0.1% 0.1% 0.2% 0.5% 1.4% 0.0% 0.7% 2014 Avg. 39.7% 0.9% 48.6% 6.0% 1.8% 0.0% 0.1% 0.2% 0.5% 1.5% 0.0% 0.6% 2015 Avg. 38.1% 1.2% 46.1% 9.6% 2.1% 0.1% 0.1% 0.2% 0.7% 0.9% 0.0% 0.9%
Std. Dev. 1.2% 0.4% 1.8% 1.2% 0.3% 0.0% 0.1% 0.1% 0.1% 0.3% 0.0% 0.6%
*Percentages read from this table should be read as "of the tissue distributed for transplant use domestically"

39
2015 Eye Banking Statistics Reported by U.S. Banks: International Surgery Use of Intermediate-Term Preserved Tissue
Intermediate-Term Tissue International Distribution of Source Eye Bank Corneas
2015 2014 Intermediate-term preserved corneas, corneal segments or whole eyes transplanted internationally for: 25,832 24,483
PK 20,394 19,625 Optical or Elective PK 20,132 19,445 Emergency of Full Thickness 262 180 EK 3,502 2,996 DSEK, DSAEK, DLEK 2,786 2,640 DMEK or DMAEK 716 356 ALK 1,086 1,039 DALK (Deep Anterior Lamellar Keratoplasty) 956 835 SALK (Superficial Anterior Lamellar Keratoplasty) 15 8 Other ALK (e.g. peripheral, eccentric, etc.) 115 196 KLA 10 8 Keratoprosthesis (K-Pro) 41 34 Glaucoma shunt patch or other non-keratoplasty use 69 51
Other Keratoplasty (e.g. experimental surgery type) 7 4 Unknown or Unspecified 723 726 Total intermediate-term preserved corneas, corneal segments, and whole eyes used for KERATOPLASY 74,097 71,258
Total intermediate-term preserved corneas, corneal segments, and whole eyes used for TRANSPLANT 74,623 72,011

40
2015 Eye Banking Statistics Reported by U.S. Banks: International Surgery Use of Intermediate-Term Preserved Tissue

41
2015 Eye Banking Statistics Reported by U.S. Banks: International Surgery Use of Intermediate-Term Preserved Tissue

42
2015 Eye Banking Statistics Reported by U.S. Banks: International Surgery Use of Intermediate-Term Preserved Tissue
International Eye Banks
Month PK
(Optical, Elective)
PK (Emerg.)
EK (DSEK)
EK (DMEK)
ALK (DALK)
ALK (SALK)
ALK (Other) KLA K-
Pro Shunt Patch Other Unknown
Jan. 2015 36.4% 3.1% 37.6% 8.3% 8.0% 0.0% 0.0% 0.0% 0.0% 4.6% 0.0% 2.1% Feb. 2015 43.1% 4.1% 28.5% 10.2% 6.1% 0.0% 0.0% 0.0% 0.0% 4.5% 0.0% 3.7% Mar. 2015 48.3% 0.8% 25.4% 11.9% 6.4% 0.0% 0.0% 0.0% 0.4% 6.8% 0.0% 0.0% Apr. 2015 25.0% 1.7% 34.9% 17.2% 8.2% 0.0% 0.0% 0.0% 0.9% 10.8% 0.0% 1.3% May 2015 26.2% 2.3% 36.7% 12.5% 8.2% 0.0% 0.0% 2.3% 1.2% 10.2% 0.0% 0.4% Jun. 2015 34.1% 1.7% 37.1% 10.8% 3.0% 0.0% 0.9% 0.0% 1.3% 6.9% 0.0% 4.3% Jul.
2015 35.1% 4.4% 25.3% 15.1% 6.7% 0.0% 0.0% 0.0% 0.9% 8.4% 0.0% 4.0% Aug. 2015 29.6% 2.3% 41.2% 13.4% 3.2% 0.0% 0.0% 0.0% 0.9% 9.3% 0.0% 0.0% Sep. 2015 26.9% 2.6% 38.4% 11.4% 3.3% 0.0% 0.0% 0.0% 0.0% 10.7% 0.0% 6.6% Oct. 2015 27.3% 2.4% 40.2% 17.3% 4.4% 0.0% 0.0% 0.4% 0.0% 8.0% 0.0% 0.0% Nov. 2015 29.5% 4.2% 32.6% 16.3% 4.9% 0.0% 0.0% 0.3% 0.3% 11.5% 0.3% 0.0% Dec. 2015 36.7% 6.2% 31.1% 10.7% 9.6% 0.0% 0.0% 0.0% 0.6% 5.1% 0.0% 0.0%
20.7% 0.5% 20.8% 0.3% 0.6% 0.6% 0.6% 0.6% 0.6% 0.6% 0.6% 0.6% 2012 Avg. 20.7% 0.2% 21.1% 0.0% 1.1% 0.0% 0.0% 0.0% 1.3% 2.0% 0.0% 8.8% 2013 Avg. 35.3% 1.4% 43.1% 3.0% 4.7% 0.1% 0.1% 0.0% 0.4% 7.4% 0.0% 4.7% 2014 Avg. 36.5% 1.9% 38.2% 7.6% 4.3% 0.0% 0.2% 0.0% 0.6% 9.6% 0.0% 1.1% 2015 Avg. 33.1% 2.9% 34.3% 12.9% 6.0% 0.0% 0.1% 0.3% 0.5% 8.1% 0.0% 1.9%
Std. Dev. 7.2% 1.5% 5.5% 3.0% 2.2% 0.0% 0.2% 0.7% 0.5% 2.5% 0.1% 2.3%
*Percentages read from this table should be read as "of the tissue distributed for transplant use domestically"

43
2015 U.S. Eye Banking Statistics Reported by U.S. Banks: Long-Term Preserved Tissue Distribution
Long-Term Preserved Tissue Preservation and Distribution 2015 2014
Long-term preserved corneas or whole globes PRESERVED for transplant 4,681 4,420 Long-term preserved corneas, corneal segments, or whole globes DISTRIBUTED for: 11,672 7,223
Keratoplasty 737 938 Glaucoma Shunt patching 10,843 6,212 Other Surgical Uses 92 73
Long-term preserved corneas, corneal segments, or whole globes FORWARDED to another entity for final distribution 705 1,841
Sclera or sclera segments PRESERVED for transplantation 3,362 4,810 Sclera or sclera segments DISTRIBUTED for: 3,225 3,345
Prosthesis following enucleation 822 939 Glaucoma shunt patching 2,175 2,199 Other surgical uses 228 207
Sclera or sclera segments FORWARDED to another entity for final distribution 361 845

44
2015 Eye Banking Statistics Reported by U.S. Banks: Long-Term Preserved Tissue Distribution
U.S. Eye Banks
Month Long-Term Preserved Corneas
Long-Term Cornea Use - Keratoplasty
Long-Term Cornea Use - Glaucoma
Long-Term Cornea Use
- Other
Scleral Segments Preserved
Sclera Use -
Prosthesis
Sclera Use -
Glaucoma
Sclera Use - Other
Jan. 2015 333 47 389 20 335 73 217 20 Feb. 2015 241 32 286 0 203 68 208 10 Mar. 2015 321 69 448 0 330 67 207 11 Apr. 2015 380 69 512 0 193 68 148 9 May 2015 317 51 350 0 268 71 154 43 Jun. 2015 415 37 469 1 306 99 249 17 Jul. 2015 497 34 1349 29 401 52 135 14
Aug. 2015 368 54 1261 30 286 60 141 16 Sep. 2015 436 79 1389 11 297 66 200 34 Oct. 2015 370 64 1736 0 278 76 112 23 Nov. 2015 463 77 1179 0 283 65 238 20 Dec. 2015 540 124 1475 1 182 57 166 11
2011 Total 3017 276 3802 331 4489 714 4285 508 2012 Total 2454 305 4435 355 6913 777 2260 460 2013 Total 4294 499 4040 301 8452 978 2293 422 2014 Total 4420 938 6212 73 4810 939 2199 207 2015 Total 4681 737 10843 92 3362 822 2175 228
2015 Avg. 390 61 904 8 280 69 181 19 Std. Dev. 85 26 536 12 64 12 44 10

45
2015 Eye Banking Statistics Reported by U.S. Banks: Long-Term Preserved Tissue Distribution
46
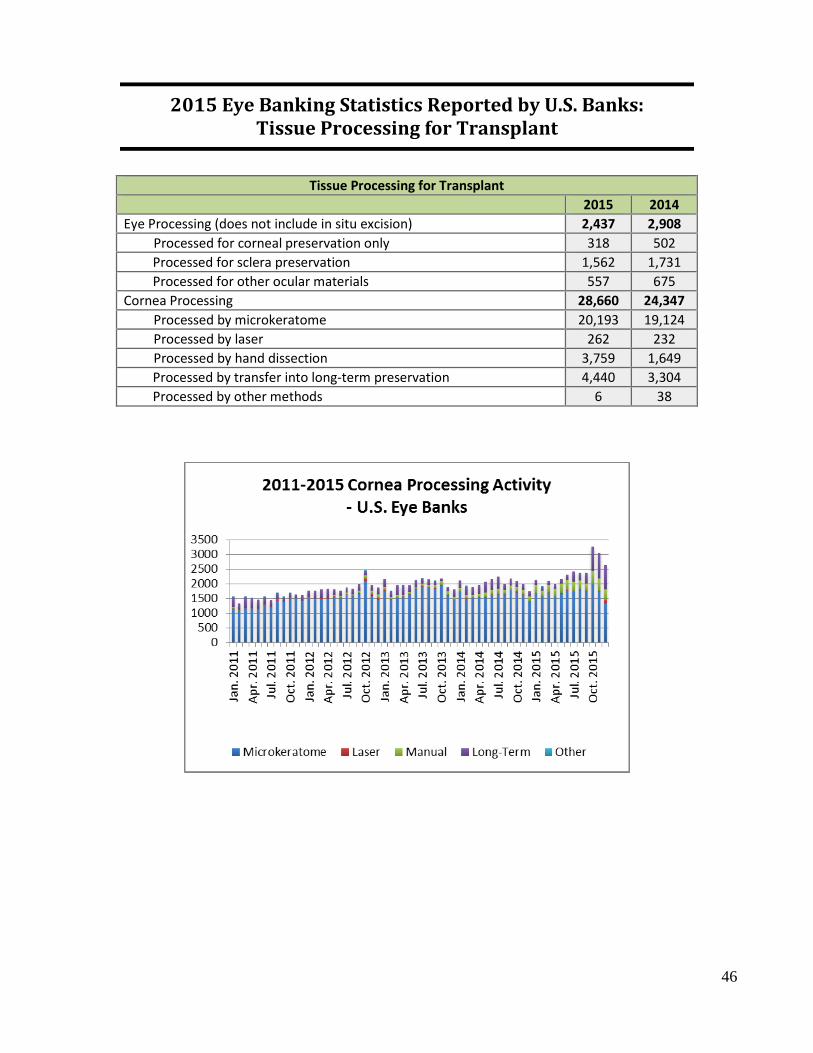
2015 Eye Banking Statistics Reported by U.S. Banks: Tissue Processing for Transplant
Tissue Processing for Transplant 2015 2014 Eye Processing (does not include in situ excision) 2,437 2,908 Processed for corneal preservation only 318 502
Processed for sclera preservation 1,562 1,731 Processed for other ocular materials 557 675
Cornea Processing 28,660 24,347 Processed by microkeratome 20,193 19,124 Processed by laser 262 232 Processed by hand dissection 3,759 1,649
Processed by transfer into long-term preservation 4,440 3,304 Processed by other methods 6 38

47
2015 Eye Banking Statistics Reported by U.S. Banks: Tissue Processing for Transplant
U.S. Eye Banks
Month Processing -
Microkeratome Processing
- Laser Processing - Manual
Processing - Long-Term
Preservation Processing
- Other Jan. 2015 1669 16 266 183 0 Feb. 2015 1567 9 187 135 6 Mar. 2015 1675 19 273 129 0 Apr. 2015 1560 15 249 148 0 May 2015 1663 12 318 167 0 Jun. 2015 1773 15 350 169 0 Jul. 2015 1731 15 318 360 0
Aug. 2015 1787 9 310 265 0 Sep. 2015 1735 18 244 371 0 Oct. 2015 1971 17 453 816 0 Nov. 2015 1729 18 424 874 0 Dec. 2015 1333 99 367 823 0
2011 Total 15227 259 164 2790 15 2012 Total 18900 447 658 2583 11 2013 Total 20267 247 1037 2582 35 2014 Total 19124 232 1649 3304 38 2015 Total 20193 262 3759 4440 6
2015 Avg. 1683 22 313 370 1 Std. Dev. 154 25 77 294 2
2011 2012 2013 2014 2015 TrendsProcessing Events 18455 22599 24168 24347 28660Failed Processing 431 621 726 828 1016
Failure Rate 2.3% 2.7% 3.0% 3.4% 3.5%

48
2015 Eye Banking Statistics Reported by U.S. Banks: Tissue Processing for Transplant

49
2015 Eye Banking Statistics Reported by U.S. Banks:
Forwarded Tissue
U.S. Eye Banks
Month Imported Tissue
Exported Tissue (to EBAA Accred.)
Exported Tissue (to non-EBAA Accred.)
Jan. 2015 364 951 283 Feb. 2015 353 818 268 Mar. 2015 392 828 325 Apr. 2015 281 724 292 May 2015 334 753 350 Jun. 2015 390 731 311 Jul. 2015 399 746 356
Aug. 2015 391 730 372 Sep. 2015 414 750 320 Oct. 2015 1211 925 352 Nov. 2015 1175 802 351 Dec. 2015 1076 749 287
2011 Total 5265 8330 6092 2012 Total 5523 10715 4003 2013 Total 10777 10189 4764 2014 Total 5386 11158 4543 2015 Total 6780 9507 3867
2015 Avg. 565 792 322 Std. Dev. 358 77 34

50
2015 U.S. Eye Banking Statistics Reported by U.S. Banks: Indications for Corneal Transplant Reported by U.S. Banks
Indications for Penetrating Keratoplasty 2015 2014 A. Post-cataract surgery edema 2,905 7.3% 3,378 8.7% B. Keratoconus 5,835 14.8% 6,224 16.0% C. Fuchs' Dystrophy 1,235 3.1% 1,196 3.1% D. Repeat Corneal Transplant 4,267 10.8% 4,399 11.3% E. Other degenerations or dystrophies 1,148 2.9% 1,209 3.1% F. Post-refractive surgery 55 0.1% 74 0.2% G. Microbial changes 689 1.7% 800 2.1% H. Mechanical or chemical trauma 1,180 3.0% 1,139 2.9% I. Congenital opacities 672 1.7% 816 2.1% J. Pterygium 15 0.0% 12 0.0% K. Non-infectious ulcerative keratitis or perforation 1,357 3.4% 1,197 3.1% L. Other causes of corneal dysfunction or distortion (non-endothelial) 2,633 6.7% 2,814 7.2%
M. Other causes of endothelial dysfunction 1,189 3.0% 1,423 3.7% Z. Unknown, unreported, or unspecified 16,373 41.4% 14,238 36.6% Total Indications for Penetrating Keratoplasty 39,554 38,919 Indications for Anterior Lamellar Keratoplasty 2015 2014 B. Keratoconus 844 38.3% 757 38.8% D. Repeat Corneal Transplant 50 2.3% 27 1.4% E. Other degenerations or dystrophies 89 4.0% 107 5.5% F. Post-refractive surgery 17 0.8% 8 0.4% G. Microbial changes 56 2.5% 32 1.6% H. Mechanical or chemical trauma 53 2.4% 47 2.4% I. Congenital opacities 41 1.9% 27 1.4% J. Pterygium 5 0.2% 6 0.3% K. Non-infectious ulcerative keratitis or perforation 82 3.7% 51 2.6% L. Other causes of corneal dysfunction or distortion 171 7.8% 140 7.2% Z. Unknown, unreported, or unspecified 793 36.0% 751 38.5% Total for Anterior Keratoplasty 2,201 1,953 Indications for Endothelial Keratoplasty 2015 2014 A. Post-Cataract Surgery Edema 5,385 17.5% 5,151 17.8% C. Fuchs’ Dystrophy 14,472 47.1% 13,817 47.7% D. Repeat Corneal Transplant 2,613 8.5% 2,385 8.2% M. Other Causes of Endothelial Dysfunction 3,208 10.4% 3,099 10.7% Z. Unknown, unreported, or unspecified 5,032 16.4% 4,509 15.6% Total for Endothelial Keratoplasty 30,710 28,961

51
2015 U.S. Eye Banking Statistics Reported by U.S. Banks:
Indications for Corneal Transplant Reported by U.S. Banks

52
2015 U.S. Eye Banking Statistics Reported by U.S. Banks: Indications for Corneal Transplant Reported by U.S. Banks
Indications for Penetrating Keratoplasty - U.S. Eye Banks Year A B C D E F G H I J K L M Z 2011 Avg. 10.3% 20.3% 3.9% 11.8% 6.8% 0.3% 2.3% 2.7% 1.6% 0.1% 2.9% 11.4% 2.9% 22.8% 2012 Avg. 10.0% 18.1% 3.8% 12.1% 4.7% 0.2% 2.5% 3.5% 1.8% 0.0% 3.3% 10.3% 3.1% 26.6% 2013 Avg. 9.2% 16.8% 3.3% 11.5% 4.9% 0.3% 2.1% 3.0% 1.9% 0.0% 2.9% 8.5% 3.3% 32.2% 2014 Avg. 8.7% 16.0% 3.1% 11.3% 3.1% 0.2% 2.1% 2.9% 2.1% 0.0% 3.1% 7.2% 3.7% 36.6% 2015 Avg. 7.3% 14.8% 3.1% 10.8% 2.9% 0.1% 1.7% 3.0% 1.7% 0.0% 3.4% 6.7% 3.0% 41.4%
Std. Dev. 0.9% 1.3% 0.9% 0.9% 0.4% 0.1% 0.3% 0.3% 0.3% 0.0% 0.4% 1.1% 0.7% 3.9% *Percentages read from this table should be read as "of the tissue used for PK"
Indications for Anterior Lamellar Keratoplasty - U.S. Eye Banks Year A B C D E F G H I J K L M Z 2011 Avg. 41.6% 2.6% 11.1% 0.7% 1.2% 3.3% 1.4% 0.3% 3.8% 9.6% 24.4% 2012 Avg. 43.4% 1.6% 6.2% 0.3% 1.9% 3.0% 1.5% 0.2% 4.2% 8.1% 29.6% 2013 Avg. 33.8% 1.9% 4.4% 0.6% 2.5% 3.5% 1.8% 0.2% 2.8% 6.9% 41.4% 2014 Avg. 38.8% 1.4% 5.5% 0.4% 1.6% 2.4% 1.4% 0.3% 2.6% 7.2% 38.5% 2015 Avg. 38.3% 2.3% 4.0% 0.8% 2.5% 2.4% 1.9% 0.2% 3.7% 7.8% 36.0%
Std. Dev. 4.6% 1.1% 1.5% 0.8% 1.9% 1.6% 1.1% 0.4% 2.1% 2.3% 8.6% *Percentages read from this table should be read as "of the tissue used for ALK"

53
2015 U.S. Eye Banking Statistics Reported by U.S. Banks: Indications for Corneal Transplant Reported by U.S. Banks

54
2015 U.S. Eye Banking Statistics Reported by U.S. Banks: Indications for Corneal Transplant Reported by U.S. Banks
Indications for Endothelial Keratoplasty - U.S. Eye Banks Year A B C D E F G H I J K L M Z 2011 Avg. 19.2% 47.7% 8.5% 12.3% 12.4% 2012 Avg. 19.1% 46.8% 8.3% 11.6% 14.2% 2013 Avg. 17.8% 47.3% 8.4% 10.6% 15.9% 2014 Avg. 17.8% 47.7% 8.2% 10.7% 15.6% 2015 Avg. 17.5% 47.1% 8.5% 10.4% 16.4%
Std. Dev. 0.9% 1.8% 0.5% 1.4% 2.3% *Percentages read from this table should be read as "of the tissue used for EK"

55
2015 U.S. Eye Banking Statistics Reported by U.S. Banks: Indications for Corneal Transplant Reported by U.S. Banks

56
2015 U.S. Eye Banking Statistics Reported by U.S. Banks: Indications for Corneal Transplant Reported by U.S. Banks
Surgical Indications for Keratoplasty - U.S. Eye Banks
A B C D E F G H I J K L M Z
PK 2905 5836 1235 4267 1148 55 689 1180 672 15 1357 2633 1189 16373
EK 5385 N/A ##### 2613 N/A N/A N/A N/A N/A N/A N/A N/A 3208 5032
ALK N/A 844 N/A 50 89 17 56 53 41 5 82 171 N/A 793
A - Post-Cataract Surgery Edema B - Ectasias/Thinnings C - Endothelial Dystrophies D - Repeat Corneal Transplant E - Other Degeneration or Dystrophies F - Refractive G - Microbial Keratitis H - Mechanical (Non-Surgical) or Chemical Trauma I - Congenital Opacities J - Pterygium K - Non-infectious Ulcerative Keratitis, Thinning, or Perforation L - Other Causes of Corneal Opacification or Distortion M - Other Causes of Endothelial Dysfunction Z - Unknown or Unreported

© 2016. EBAA. All rights reserved
2015 Eye Banking Statistics
From EBAA International Members

58
2015 International Eye Banking Statistics
Donations and Tissue Recoveries
Donations 2015 2014 2013 2012 2011 Number of Eye Banks Reporting 10 10 10 8 9 Total Whole Eyes and Corneas Donated 6,846 6,769 6,482 6,330 12,851 Total Number of Donors 3,466 3,398 3,305 3,177 6,433
Death Referrals 2015 2014 2013
Total Death Referrals 38,418 24,284 21,5161
Death referrals Determined Eligible 9,651 5,121 4,3141
Tissue Recoveries Total Donors 3,466 3,398 3,305 Donors recovered not found on donor registry or known to have first person consent 3,342 3,302 3,188
Donors recovered found on donor registry or known to have first person consent 124 96 117
Eyes or Corneas Recovered with Intent for Surgical Use 6,403 5,726 5,427 Eyes or Corneas Recovered for Other Uses 443 1,043 1,055
1Excludes Death Referral data from the Eye Bank of Canada, Ontario Division

59
2015 International Eye Banking Statistics Referral Trends, Transplant and Conversion Rates
Month Transplant Rate
Conversion Rate
Death Referrals
Transplant Eligible
Referrals
Transplant Intended Corneas Recovered
Jan. 2015 65.5% 69.9% 2035 402 559 Feb. 2015 66.0% 65.3% 1472 346 450 Mar. 2015 64.4% 60.0% 1752 383 458 Apr. 2015 59.1% 30.4% 3782 902 548 May 2015 64.6% 28.7% 3708 923 528 Jun. 2015 52.3% 33.0% 3511 883 579 Jul. 2015 64.1% 28.6% 2888 953 527
Aug. 2015 55.9% 28.0% 3615 925 499 Sep. 2015 63.8% 26.5% 3711 959 505 Oct. 2015 55.5% 29.1% 3961 994 573 Nov. 2015 53.1% 32.9% 3814 1017 651 Dec. 2015 52.9% 27.6% 4169 964 526
2012 Total 64.7% 43.3% 28391 5695 4910 2013 Total 64.8% 64.1% 21516 4314 5427 2014 Total 66.9% 56.1% 24284 5121 5726 2015 Total 59.5% 33.6% 38418 9651 6403
2015 Avg. N/A N/A 3202 804 534 Std. Dev. 5.5% 16.4% 932 261 55
*Transplant rate is the number of corneas used for transplant divided by the number recovered for transplant. Conversion rate is the number of transplant donors divided by the number of transplant eligible referrals.

60
2015 International Eye Banking Statistics Referral Trends, Transplant and Conversion Rates

61
2015 International Eye Banking Statistics Transplant and Conversion Rates

62
2015 International Eye Banking Statistics
Donor Profiles: Age
Year Age <1
Age 1-10
Age 11-20
Age 21-30
Age 31-40
Age 41-50
Age 51-60
Age 61-70
Age 71-80
Age >80
2012 0 9 54 78 69 289 654 1088 745 191 2013 0 7 46 61 92 245 680 1235 814 125 2014 0 11 50 55 83 284 736 1242 805 132 2015 0 8 45 59 104 244 715 1372 784 135
Monthly
Avg. 0 1 4 5 9 20 60 114 65 11 Std. Dev. 0.0 1.0 1.8 2.3 2.3 3.5 9.8 15.5 9.1 4.0

63
2015 International Eye Banking Statistics
Donor Profiles: Gender and Cause of Death
International Eye Banks - Sex Profile Year Male Female 2012 1870 1307 2013 1924 1381 2014 2009 1389 2015 2058 1408
Monthly Avg. 172 117
Std. Dev. 18.1 12.0

64
2015 International Eye Banking Statistics
Donor Profiles: Cause of Death
International Eye Banks - Cause of Death Profile Year Heart Cancer CVA Respiratory Trauma Other
2012 Total 657 1191 318 320 180 511 2013 Total 662 1339 334 332 176 462 2014 Total 671 1453 327 338 154 455 2015 Total 681 1588 325 310 130 432
Monthly Avg. 57 132 27 26 11 36
Std. Dev. 8.6 12.5 6.9 3.6 5.2 4.5

65
2015 International Eye Banking Statistics
Reasons Tissue Intended for Surgery Was Not Suitable For Transplant
Contraindications for Transplant1 2015 2014 Donor Eligibility 939 42.4% 643 44.6% Positive or reactive test for communicable disease agent or disease 394 17.8% 310 21.5% Other communicable disease testing issue 24 1.1% 16 1.1% Medical record or autopsy findings 323 14.6% 155 10.7% Medical/social history interview 182 8.2% 154 10.7% Body Exam 16 0.7% 8 0.6% Tissue Suitability 856 38.6% 743 51.5% Quality Issue 60 2.7% 55 3.8% Other reason prior to tissue release 775 35.0% 531 36.8% Total eyes/corneas intended for transplant but not released for transplant 2,217 1,443
*Percentages read from this table should be read as "of the tissue not released for transplant”
Reasons Tissue Not Released
2012 2013 2014 2015 Trends
Serology Tests 296 326 310 394
Testing Issue 31 8 16 24Med. Rec./
Autopsy Finding 260 219 155 323Med Soc Hx
Finding 186 197 154 182
Body Exam 12 18 8 16
Tissue Suitability 506 561 743 856
Quality Issue 38 61 55 60
Other Reason 260 360 531 775
1 Some tissues had multiple contraindications.

66
2015 International Eye Banking Statistics Reasons Tissue Intended for Surgery Was Not Released

67
2015 International Eye Banking Statistics
Reasons Tissue Intended for Surgery Was Not Suitable For Transplant
Not Released - Serology
2012 2013 2014 2015 Trend
HIV 10 18 22 37HIV I/II Ab 8 6 20 37HIV NAT 2 12 2 0
HBV 165 200 203 213HBsAg 6 20 33 26HBcAb 159 180 169 187
HBV NAT 0 0 1 0HCV 85 59 42 78
HCV Ab 75 43 34 63HCV NAT 10 16 8 15Syphilis 6 16 22 41
HTLV 12 11 14 5WNV 0 0 4 0Other 18 22 3 20

68
2015 International Eye Banking Statistics
Serologic Reasons Tissue Intended for Surgery Was Not Suitable For Transplant

69
2015 International Eye Banking Statistics Reasons Tissue Intended for Surgery Was Not Suitable
Not Released - Med Rec / Autopsy
2012 2013 2014 2015 Trends
Dementia/Neuro 16 20 20 48Sepsis (Cultures) 68 39 23 26
Sepsis (Other) 79 80 50 111Plasma Dilution 10 6 6 4Unknown COD 35 26 22 28
Other 52 48 34 106
Not Released - Med Soc
2012 2013 2014 2015 Trends
Travel 36 36 30 16Dementia/Neuro 2 24 30 40
Other 136 137 94 126

70
2015 International Eye Banking Statistics Tissue Suitability Reasons Tissue Was Not Released
Not Released - Tissue Suitability
2012 2013 2014 2015 Trends
Epithelium 31 55 65 45Prior Refractive Surgery 4 9 33 33
Scar 68 93 142 238Infiltrate 76 81 107 106
Foreign Body 7 3 28 21Other Stromal Finding 59 40 34 77
Descemet's Membrane 4 3 34 16Endothelium 257 277 300 320

71
2015 International Eye Banking Statistics
Quality Reasons Tissue Intended for Surgery Was Not Released
Not Released - Quality Issues / Other
2012 2013 2014 2015 Trends
Storage Issue 13 22 16 23Labeling Issue 0 5 11 9
Processing Issue (not released) 21 14 10 8Supply / Reagent Issue 2 14 8 5
Environmental Control Issue 2 6 10 15Body Exam 12 18 8 16
Other Sero Testing Issue 31 8 16 24Other Issue 260 360 531 775

72
2015 International Eye Banking Statistics
Reasons Released Tissues Were Not Transplanted
Reasons Released Tissues Were Not Transplanted 2015 2014
Transportation Issue 2 0.5% 26 5.7% Surgeon Issue 53 13.9% 20 4.4% Recipient Issue 6 1.6% 5 1.0% Returned and Unable to Place Again 24 6.3% 56 12.2% Donor Information Not Available at the Time of Tissue Release 2 0.5% 0 0.0%
Expired or Unable to Place Tissue 234 61.6% 316 68.8% Tissue Damaged During Processing 41 10.8% 54 11.8% Other Reason After Release of Tissue 24 6.3% 10 2.2% Total eyes/corneas released for transplant but not used for transplant 380 459
Released But Not Transplanted 2012 2013 2014 2015 Trends
Transport Issue 10 0 26 2Surgeon Issue 23 11 20 53
Recipient Issue 5 3 5 6Returned, Unable to Place Again 55 53 56 24
Donor Info Received After Release 0 0 0 2Expired, Unable to Place 246 198 316 234
Processing Damage After Release 32 41 54 41Other Reason After Release 12 9 10 24

73
2015 International Eye Banking Statistics
Outcomes of Tissue Recovered for Transplant
Donations 2015 2014 % Change Eye Banks Reported 10 10 0.0% Total Whole Globes and Corneas Donated 6,846 6,769 1.1% Total Number of Donors 3,466 3,398 2.0% Distribution 2015 2014 % Change Intermediate-Term Preserved Corneas 3,500 3,718 (-5.9%) Sclera 882 1,010 (-12.7%) Long-Term Preserved Corneas 108 113 (-4.4%) Research 402 238 68.9% Training 1,547 1,301 18.9%
Month
Corneas Recovered
for Transplant
Corneas Segmented
Corneal Segments Produced
Not Released Released but
Not Transplanted
Whole Corneas and
Segments Transplanted
Preserved Long-Term
Jan. 2015 559 1 2 158 28.3% 36 6.4% 348 62.1% 18 3.2% Feb. 2015 450 0 0 124 27.6% 29 6.4% 290 64.4% 7 1.6% Mar. 2015 458 6 6 129 28.2% 34 7.4% 279 60.9% 16 3.5% Apr. 2015 548 0 0 176 32.1% 48 8.8% 292 53.3% 32 5.8% May 2015 528 4 4 144 27.3% 43 8.1% 301 57.0% 40 7.6% Jun. 2015 579 1 1 233 40.2% 43 7.4% 281 48.5% 22 3.8% Jul. 2015 527 6 6 165 31.3% 24 4.6% 292 55.4% 46 8.7%
Aug. 2015 499 0 0 189 37.9% 31 6.2% 262 52.5% 17 3.4% Sep. 2015 505 4 4 165 32.7% 18 3.6% 297 58.8% 25 5.0% Oct. 2015 573 0 0 232 40.5% 23 4.0% 287 50.1% 31 5.4% Nov. 2015 651 2 2 275 42.2% 30 4.6% 328 50.4% 18 2.8% Dec. 2015 526 5 5 227 43.2% 21 4.0% 243 46.2% 35 6.7%
2012 Total 5058 0 0 1394 27.6% 394 7.8% 3270 64.7% 137 2.7% 2013 Total 5427 0 0 1588 29.3% 324 6.0% 3415 62.9% 100 1.8% 2014 Total 5726 6 10 1443 25.2% 459 8.0% 3718 64.9% 110 1.9% 2015 Total 6403 29 30 2217 34.6% 380 5.9% 3500 54.7% 307 4.8%
2015 Avg. 534 2 3 185 N/A 32 N/A 292 N/A 26 N/A Std. Dev. 55 2.43 2.4 47 6.1% 9 1.8% 27 5.8% 11 2.1%
*Percentages read from this table should be read as "of the tissue recovered with transplant intent"

74
2015 International Eye Banking Statistics
Outcomes of Tissues Recovered For Transplant

75
2015 International Eye Banking Statistics
Use of Donated Tissues
Distribution 2015 2014 2013 2012 2011 Corneal Grafts Total 3,806 3,824 3,515 3,270 5,813 Penetrating Keratoplasty 1,403 1,539 1,356 1,246 2,460 Anterior Lamellar Keratoplasty 192 150 160 122 169 Endothelial Keratoplasty 1,523 1,669 1,491 1,271 2,293 Keratolimbal Allograft 8 0 0 0 2 Keratoprosthesis (K-Pro) 15 20 14 18 43 Glaucoma Shunt Patch or other non-keratoplasty use 240 304 227 169 434
Other keratoplasty (experimental surgery) 1 0 0 1 0 Unknown or Unspecified 118 36 167 306 46 Sclera 882 1,010 943 996 1,496 Long-Term Preserved Corneas 108 113 112 141 31 Keratoplasty 5 12 1 11 2 Glaucoma Shunt Patching 102 101 110 119 30 Other Surgical Uses 1 0 1 11 0 Research 402 291 305 248 1,122 Training 1,547 1,301 1,462 1,445 2,596

76
2015 International Eye Banking Statistics
Intermediate-Term Tissue Distribution
Intermediate-Term Tissue Distribution of Source Eye Bank Corneas For Domestic Use
2015 2014 Intermediate-term preserved corneas, corneal segments or whole eyes transplanted domestically for: 3,084 3,167
PK 1,101 1,214 Optical or Elective PK 1,013 1,155 Emergency of Full Thickness 88 59 EK 1,478 1,453 DSEK, DSAEK, DLEK 1,097 1,211 DMEK or DMAEK 381 242 ALK 185 142 DALK (Deep Anterior Lamellar Keratoplasty) 183 136 SALK (Superficial Anterior Lamellar Keratoplasty) 0 0 Other ALK (e.g. peripheral, eccentric, etc.) 2 6 KLA 8 0 Keratoprosthesis (K-Pro) 15 19 Glaucoma shunt patch or other non-keratoplasty use 239 303
Other Keratoplasty (e.g. experimental surgery type) 1 0 Unknown or Unspecified 57 36 Total intermediate-term preserved corneas, corneal segments, and whole eyes used for KERATOPLASTY 3,260 3,414
Total intermediate-term preserved corneas, corneal segments, and whole eyes used for TRANSPLANT 3,499 3,714

77
2015 International Eye Banking Statistics Domestic Surgery Use of Intermediate-Term Preserved Tissue
International Eye Banks
Month PK
(Optical, Elective)
PK (Emerg.)
EK (DSEK)
EK (DMEK)
ALK (DALK)
ALK (SALK)
ALK (Other) KLA K-
Pro Shunt Patch Other Unknown
Jan. 2015 37.0% 3.0% 37.3% 8.4% 7.8% 0.0% 0.0% 0.0% 0.0% 4.5% 0.0% 2.1% Feb. 2015 41.4% 3.8% 31.6% 9.4% 6.4% 0.0% 0.0% 0.0% 0.0% 4.1% 0.0% 3.4% Mar. 2015 47.4% 0.8% 27.1% 11.3% 6.5% 0.0% 0.0% 0.0% 0.4% 6.5% 0.0% 0.0% Apr. 2015 25.6% 2.1% 34.7% 16.5% 8.7% 0.0% 0.0% 0.0% 0.8% 10.3% 0.0% 1.2% May 2015 25.8% 2.3% 37.7% 12.3% 8.1% 0.0% 0.0% 2.3% 1.2% 10.0% 0.0% 0.4% Jun. 2015 33.5% 1.7% 38.1% 10.6% 3.0% 0.0% 0.8% 0.0% 1.3% 6.8% 0.0% 4.2% Jul.
2015 34.4% 4.1% 29.1% 13.9% 6.1% 0.0% 0.0% 0.0% 0.8% 7.8% 0.0% 3.7% Aug. 2015 29.3% 2.3% 42.3% 13.1% 3.2% 0.0% 0.0% 0.0% 0.9% 9.0% 0.0% 0.0% Sep. 2015 27.1% 2.4% 40.3% 10.8% 3.1% 0.0% 0.0% 0.0% 0.0% 10.1% 0.0% 6.3% Oct. 2015 28.4% 2.3% 40.2% 16.5% 4.6% 0.0% 0.0% 0.4% 0.0% 7.7% 0.0% 0.0% Nov. 2015 29.3% 4.0% 34.3% 15.7% 4.7% 0.0% 0.0% 0.3% 0.3% 11.0% 0.3% 0.0% Dec. 2015 35.5% 6.0% 32.8% 10.4% 9.8% 0.0% 0.0% 0.0% 0.5% 4.9% 0.0% 0.0%
20.7% 0.5% 20.8% 0.3% 0.6% 0.6% 0.6% 0.6% 0.6% 0.6% 0.6% 0.6% 2012 Avg. 20.7% 0.2% 21.1% 0.0% 1.1% 0.0% 0.0% 0.0% 1.3% 2.0% 0.0% 8.8% 2013 Avg. 35.3% 1.4% 43.1% 3.0% 4.7% 0.1% 0.1% 0.0% 0.4% 7.4% 0.0% 4.7% 2014 Avg. 36.5% 1.9% 38.2% 7.6% 4.3% 0.0% 0.2% 0.0% 0.6% 9.6% 0.0% 1.1% 2015 Avg. 32.8% 2.9% 35.6% 12.4% 5.9% 0.0% 0.1% 0.3% 0.5% 7.7% 0.0% 1.8%
Std. Dev. 6.7% 1.4% 4.7% 2.8% 2.3% 0.0% 0.2% 0.7% 0.5% 2.4% 0.1% 2.1%
*Percentages read from this table should be read as "of the tissue distributed for transplant use domestically"

78
2015 International Eye Banking Statistics Trends of Domestic Use

79
2015 International Eye Banking Statistics Trends of Domestic Use

80
2015 International Eye Banking Statistics
International Surgery Use of Intermediate-Term Preserved Tissue
Intermediate-Term Tissue Distribution of Source Eye Bank Corneas For International Use
2015 2014 Intermediate-term preserved corneas, corneal segments or whole eyes transplanted for: 416 551
PK 302 325 Optical or Elective PK 298 325 Emergency of Full Thickness 4 0 EK 45 216 DSEK, DSAEK, DLEK 23 216 DMEK or DMAEK 22 0 ALK 7 8 DALK (Deep Anterior Lamellar Keratoplasty) 7 7 SALK (Superficial Anterior Lamellar Keratoplasty) 0 0 Other ALK (e.g. peripheral, eccentric, etc.) 0 1 KLA 0 0 Keratoprosthesis (K-Pro) 0 1 Glaucoma shunt patch or other non-keratoplasty use 1 1
Other Keratoplasty (e.g. experimental surgery type) 0 0 Unknown or Unspecified 61 0 Total intermediate-term preserved corneas, corneal segments, and whole eyes used for KERATOPLASTY 3,260 3,414
Total intermediate-term preserved corneas, corneal segments, and whole eyes used for TRANSPLANT 3,499 3,714

81
2015 International Eye Banking Statistics
International Surgery Use of Intermediate-Term Preserved Tissue
International Eye Banks
Month PK
(Optical, Elective)
PK (Emerg.)
EK (DSEK)
EK (DMEK)
ALK (DALK)
ALK (SALK)
ALK (Other) KLA K-
Pro Shunt Patch Other Unknown
Jan. 2015 76.9% 0.0% 23.1% 0.0% 0.0% 0.0% 0.0% 0.0% 0.0% 0.0% 0.0% 0.0% Feb. 2015 75.0% 0.0% 25.0% 0.0% 0.0% 0.0% 0.0% 0.0% 0.0% 0.0% 0.0% 0.0% Mar. 2015 56.3% 0.0% 3.1% 0.0% 0.0% 0.0% 0.0% 0.0% 0.0% 0.0% 0.0% 40.6% Apr. 2015 64.0% 6.0% 0.0% 0.0% 0.0% 0.0% 0.0% 0.0% 0.0% 0.0% 0.0% 30.0% May 2015 61.0% 0.0% 0.0% 2.4% 0.0% 0.0% 0.0% 0.0% 0.0% 0.0% 0.0% 36.6% Jun. 2015 86.7% 0.0% 2.2% 4.4% 0.0% 0.0% 0.0% 0.0% 0.0% 0.0% 0.0% 6.7% Jul.
2015 89.6% 0.0% 10.4% 0.0% 0.0% 0.0% 0.0% 0.0% 0.0% 0.0% 0.0% 0.0% Aug. 2015 65.0% 0.0% 0.0% 32.5% 2.5% 0.0% 0.0% 0.0% 0.0% 0.0% 0.0% 0.0% Sep. 2015 100.0% 0.0% 0.0% 0.0% 0.0% 0.0% 0.0% 0.0% 0.0% 0.0% 0.0% 0.0% Oct. 2015 69.2% 0.0% 0.0% 0.0% 0.0% 0.0% 0.0% 0.0% 0.0% 0.0% 0.0% 30.8% Nov. 2015 67.9% 3.6% 3.6% 7.1% 14.3% 0.0% 0.0% 0.0% 0.0% 3.6% 0.0% 0.0% Dec. 2015 68.3% 0.0% 10.0% 6.7% 3.3% 0.0% 0.0% 0.0% 0.0% 0.0% 0.0% 11.7%
20.7% 0.5% 20.8% 0.3% 0.6% 0.6% 0.6% 0.6% 0.6% 0.6% 0.6% 0.6% 2012 Avg. 41.2% 0.0% 49.2% 6.1% 2.2% 0.0% 0.0% 0.0% 0.6% 0.3% 0.3% 0.0% 2013 Avg. 61.6% 1.0% 11.2% 0.3% 4.0% 0.2% 1.0% 0.1% 0.2% 0.1% 0.1% 3.5% 2014 Avg. 59.0% 0.7% 10.8% 1.5% 3.4% 0.0% 0.8% 0.0% 0.1% 0.2% 0.0% 3.0% 2015 Avg. 71.6% 1.0% 10.8% 2.8% 3.7% 0.1% 0.4% 0.0% 0.2% 0.3% 0.0% 2.8%
Std. Dev. 12.9% 1.9% 9.0% 9.3% 4.1% 0.0% 0.0% 0.0% 0.0% 1.0% 0.0% 16.5% *Percentages read from this table should be read as "of the tissue distributed for transplant use internationally"

82
2015 International Eye Banking Statistics Trends of International Use

83
2015 International Eye Banking Statistics Trends of International Use

84
2015 International Eye Banking Statistics
Long-Term Tissue Distribution
Long-Term Preserved Tissue Preservation and Distribution
2015 2014 Long-term preserved corneas or whole globes PRESERVED for transplant 307 110 Long-term preserved corneas, corneal segments, or whole globes DISTRIBUTED for: 108 113
Keratoplasty 5 12 Glaucoma Shunt patching 102 101 Other Surgical Uses 1 0
Long-term preserved corneas, corneal segments, or whole globes FORWARDED to another entity for final distribution 59 9
Sclera or sclera segments PRESERVED for transplantation 1,269 1,261 Sclera or sclera segments DISTRIBUTED for: 882 1,010
Prosthesis following enucleation 18 40 Glaucoma shunt patching 611 679 Other surgical uses 253 291
Sclera or sclera segments FORWARDED to another entity for final distribution 2 11

85
2015 International Eye Banking Statistics Long-Term Tissue Trends
International Eye Banks
Month Long-Term Preserved Corneas
Long-Term Cornea Use
Keratoplasty
Long-Term Cornea Use - Glaucoma
Long-Term Cornea Use
- Other
Scleral Segments Preserved
Sclera Use Prosthesis
Sclera Use Glaucoma
Sclera Use - Other
Jan. 2015 18 2 5 0 84 1 92 15 Feb. 2015 7 1 5 0 83 2 52 29 Mar. 2015 16 0 8 0 68 3 85 13 Apr. 2015 32 0 6 0 118 0 23 19 May 2015 40 0 9 0 122 1 17 23 Jun. 2015 22 1 18 0 78 1 78 29 Jul. 2015 46 0 7 0 196 1 40 26
Aug. 2015 17 0 6 0 79 1 39 15 Sep. 2015 25 1 8 0 125 0 59 21 Oct. 2015 31 0 9 0 100 4 40 13 Nov. 2015 18 0 13 1 120 2 72 28 Dec. 2015 35 0 8 0 96 2 14 22
2012 Total 137 11 119 11 1210 65 609 322 2013 Total 100 1 110 1 1325 28 597 318 2014 Total 110 12 101 0 1261 40 679 291 2015 Total 307 5 102 1 1269 18 611 253
2015 Avg. 26 0 9 0 106 2 51 21 Std. Dev. 11 1 4 0 35 1 27 6
Ocular Tissue Used for Glaucoma Shunt Patching 2012 2013 2014 2015
Long-Term Cornea 119 110 101 102 Intermediate-Term Cornea 169 227 304 240
Sclera 609 597 679 611

86
2015 International Eye Banking Statistics Long-Term Tissue Trends

87
2015 International Eye Banking Statistics Tissue Processing
Tissue Processing for Transplant
2015 2014 Eye Processing (does not include in situ excision) 1,736 4,702 Processed for corneal preservation only 1,339 4,310 Processed for sclera preservation 319 325 Processed for other ocular materials 78 67 Cornea Processing 719 664 Processed by microkeratome 626 576 Processed by laser 0 0 Processed by hand dissection 41 28
Processed by transfer into long-term preservation 52 60 Processed by other methods 0 0

88
2015 International Eye Banking Statistics Tissue Processing
International Eye Banks
Month Processing - Microkeratome
Processing - Laser
Processing - Manual
Processing - Long-Term
Preservation
Processing - Other
Jan. 2015 61 0 18 1 0 Feb. 2015 34 0 3 5 0 Mar. 2015 28 0 3 8 0 Apr. 2015 45 0 0 7 0 May 2015 62 0 2 7 0 Jun. 2015 56 0 1 2 0 Jul. 2015 56 0 8 2 0
Aug. 2015 48 0 0 2 0 Sep. 2015 63 0 2 5 0 Oct. 2015 61 0 0 3 0 Nov. 2015 66 0 1 8 0 Dec. 2015 46 0 3 2 0
2012 Total 356 0 161 39 0 2013 Total 390 8 15 36 2 2014 Total 576 0 28 60 0 2015 Total 626 0 41 52 0
2015 Avg. 52 0 3 4 0 Std. Dev. 12 0 5 3 0
2012 2013 2014 2015 TrendsProcessing Events 556 451 664 719Failed Processing 53 55 64 49
Failure Rate 9.5% 12.2% 9.6% 6.8%

89
2015 International Eye Banking Statistics Tissue Processing

90
2015 International Eye Banking Statistics Forwarded Tissue
International Eye Banks
Month Imported Tissue
Exported Tissue (to EBAA Accred.)
Exported Tissue (to non-EBAA Accred.)
Jan. 2015 15 3 6 Feb. 2015 29 9 7 Mar. 2015 40 7 10 Apr. 2015 21 10 0 May 2015 19 8 2 Jun. 2015 26 10 7 Jul. 2015 28 10 4
Aug. 2015 29 6 2 Sep. 2015 9 5 1 Oct. 2015 31 8 1 Nov. 2015 26 11 9 Dec. 2015 12 1 0
2012 Total 244 211 275 2013 Total 242 135 165 2014 Total 366 249 201 2015 Total 285 88 49
2015 Avg. 24 7 4 Std. Dev. 9 3 4

91
2015 International Eye Banking Statistics Indications for Corneal Transplant
Indications for Penetrating Keratoplasty 2015 2014 A. Post-cataract surgery edema 152 10.8% 142 9.2% B. Keratoconus 279 19.9% 309 20.1% C. Fuchs' Dystrophy 61 4.3% 61 4.0% D. Repeat Corneal Transplant 245 17.5% 344 22.4% E. Other degenerations or dystrophies 33 2.4% 36 2.3% F. Post-refractive surgery 2 0.1% 6 0.4% G. Microbial changes 128 9.1% 139 9.0% H. Mechanical or chemical trauma 80 5.7% 125 8.1% I. Congenital opacities 24 1.7% 24 1.6% J. Pterygium 0 0.0% 0 0.0% K. Non-infectious ulcerative keratitis or perforation 55 3.9% 67 4.4% L. Other causes of corneal dysfunction or distortion (non-endothelial) 50 3.6% 53 3.4%
M. Other causes of endothelial dysfunction 101 7.2% 72 4.7% Z. Unknown, unreported, or unspecified 193 13.8% 161 10.5% Total Indications for Penetrating Keratoplasty 1,403 1,539 Indications for Anterior Lamellar Keratoplasty 2015 2014 B. Keratoconus 109 56.8% 73 48.7% D. Repeat Corneal Transplant 6 3.1% 10 6.7% E. Other degenerations or dystrophies 6 3.1% 6 4.0% F. Post-refractive surgery 1 0.5% 3 2.0% G. Microbial changes 17 8.9% 16 10.7% H. Mechanical or chemical trauma 10 5.2% 10 6.7% I. Congenital opacities 6 3.1% 7 4.7% J. Pterygium 0 0.0% 0 0.0% K. Non-infectious ulcerative keratitis or perforation 3 1.6% 6 4.0% L. Other causes of corneal dysfunction or distortion 3 1.6% 12 8.0% Z. Unknown, unreported, or unspecified 31 16.1% 7 4.7% Total for Anterior Keratoplasty 192 150
Indications for Endothelial Keratoplasty 2015 2014 A. Post-Cataract Surgery Edema 400 26.3% 509 30.5% C. Fuchs’ Dystrophy 774 50.8% 772 46.3% D. Repeat Corneal Transplant 199 13.1% 214 12.8% M. Other Causes of Endothelial Dysfunction 80 5.3% 81 4.9% Z. Unknown, unreported, or unspecified 70 4.6% 93 5.6% Total for Endothelial Keratoplasty 1,523 1,669

92
2015 International Eye Banking Statistics Indications for Corneal Transplant

93
2015 International Eye Banking Statistics Indications for Corneal Transplant
Indications for PK - International Eye Banks Year A B C D E F G H I J K L M Z 2012 Avg. 10.0% 18.1% 3.8% 12.1% 4.7% 0.2% 2.5% 3.5% 1.8% 0.0% 3.3% 10.3% 3.1% 26.6% 2013 Avg. 12.3% 20.9% 3.5% 21.2% 3.5% 0.2% 9.7% 6.0% 1.1% 0.0% 3.5% 3.5% 5.5% 9.1% 2014 Avg. 9.2% 20.1% 4.0% 22.4% 2.3% 0.4% 9.0% 8.1% 1.6% 0.0% 4.4% 3.4% 4.7% 10.5% 2015 Avg. 10.8% 19.9% 4.3% 17.5% 2.4% 0.1% 9.1% 5.7% 1.7% 0.0% 3.9% 3.6% 7.2% 13.8%
Std. Dev. 2.6% 4.2% 2.9% 4.1% 1.1% 0.3% 1.7% 2.5% 2.4% 0.0% 0.8% 1.9% 2.4% 5.0%
*Percentages read from this table should be read as "of the tissue used for PK"
Indications for ALK - International Eye Banks
Year A B C D E F G H I J K L M Z 2012 Avg. 56.6% 3.3% 4.9% 0.0% 4.9% 3.3% 4.1% 0.0% 1.6% 2.5% 18.9% 2013 Avg. 55.0% 1.9% 4.4% 0.6% 2.5% 3.5% 1.8% 0.2% 2.8% 6.9% 41.4% 2014 Avg. 48.7% 1.4% 5.5% 0.4% 1.6% 2.4% 1.4% 0.3% 2.6% 7.2% 38.5% 2015 Avg. 56.8% 2.3% 4.0% 0.8% 2.5% 2.4% 1.9% 0.2% 3.7% 7.8% 36.0%
Std. Dev. 22.2% 5.5% 4.8% 1.4% 9.1% 4.5% 3.9% 0.0% 3.6% 2.2% 21.3%
*Percentages read from this table should be read as "of the tissue used for ALK"
Indications for EK - International Eye Banks
Year A B C D E F G H I J K L M Z 2012 Avg. 29.2% 46.8% 12.7% 3.9% 7.4% 2013 Avg. 31.9% 45.8% 12.8% 4.6% 4.8% 2014 Avg. 30.5% 46.3% 12.8% 4.9% 5.6% 2015 Avg. 26.3% 50.8% 13.1% 5.3% 4.6%
Std. Dev. 3.0% 5.1% 2.8% 2.3% 4.1%
*Percentages read from this table should be read as "of the tissue used for EK"

94
2015 International Eye Banking Statistics Indications for Corneal Transplant

95
2015 International Eye Banking Statistics Indications for Corneal Transplant

96
2015 International Eye Banking Statistics Indications for Corneal Transplant
Indications for Keratoplasty - International Eye Banks A B C D E F G H I J K L M Z
PK 152 279 61 245 33 2 128 80 24 0 55 50 101 193
EK 400 N/A 774 199 N/A N/A N/A N/A N/A N/A N/A N/A 80 70
ALK N/A 109 N/A 6 6 1 17 10 6 0 3 3 N/A 31
A - Post-Cataract Surgery Edema B - Ectasias/Thinning C - Endothelial Dystrophies D - Repeat Corneal Transplant E - Other Degeneration or Dystrophies F - Refractive G - Microbial Keratitis H - Mechanical (Non-Surgical) or Chemical Trauma I - Congenital Opacities J - Pterygium K - Non-infectious Ulcerative Keratitis, Thinning, or Perforation L - Other Causes of Corneal Opacification or Distortion M - Other Causes of Endothelial Dysfunction Z - Unknown or Unreported

97
Eye Banks Submitting Data for the 2015 Eye Banking Statistical Report
STATE EYE BANK NAME CITY
AL Alabama Eye Bank Birmingham AR Arkansas Lions Eye Bank & Laboratory Little Rock AZ Donor Network of Arizona Phoenix CA California Transplant Services Carlsbad One Legacy Los Angeles San Diego Eye Bank San Diego Sierra Donor Services Sacramento CO Rocky Mountain Lions Eye Bank Aurora CT Eversight Connecticut New Britain FL Florida Lions Eye Bank Miami TBI Orlando / Medical Eye Bank of Florida Orlando International Sight Restoration Tampa Lions Eye Institute for Transplantation and Research Tampa GA Georgia Eye Bank Atlanta HI Hawaii Lions Eye Bank & Makana Foundation Honolulu IA Iowa Lions Eye Bank Coralville ID Idaho Lions Eye Bank Boise IN Indiana Lions Eye & Tissue Transplant Bank Indianapolis KS Kansas Eye Bank & Cornea Research Center Wichita KY Lions Eye Bank of Lexington Lexington University of Louisville Lions Eye Bank Louisville LA Baton Rouge Regional Eye Bank Baton Rouge ISR Eye Bank of Louisiana Shreveport Southern Eye Bank Metaire MD TBI Corporate Baltimore TBI Baltimore/DC, Medical Eye Bank of Maryland Baltimore MI Eversight Corporate Ann Arbor MN Minnesota Lions Eye Bank Minneapolis MO Mid-America Transplant Services St. Louis Saving Sight Columbia MS Mississippi Lions Eye Bank Flowood NC Lifeshare of the Carolinas Charlotte Miracles in Sight. Winston-Salem NE Lions Eye Bank of Nebraska, Inc. Omaha NM New Mexico Lions Eye Bank Albuquerque NV Nevada Donor Network, Inc. Las Vegas NY Central New York Eye Bank Syracuse Sight Society of NENY, Inc. (Lions Eye Bank at Rochester) Rochester Sight Society of Northeastern NY (Lions Eye Bank at Albany) Albany The Lions Eye Bank for Long Island Valley Stream The Eye-Bank for Sight Restoration New York Upstate New York Transplant Services, Inc. Buffalo

98
STATE EYE BANK NAME CITY OH Central Ohio Lions Eye Bank, Inc. Columbus Cincinnati Eye Bank for Sight Restoration, Inc. Cincinnati Lions Eye Bank of West Central Ohio Dayton OK Oklahoma Lions Eye Bank Oklahoma City OR Lions VisionGift Portland PA Center for Organ Recovery & Education (CORE) Pittsburgh Gift of Life Donor Program Eye Bank Hershey Lions Eye Bank of Delaware Valley Philadelphia Lions Eye Bank of Northwest Pennsylvania, Inc. Erie Northeast Pennsylvania Lions Eye Bank Bethlehem PR Lions Eye Bank of Puerto Rico San Juan SC LifePoint, Inc. Charleston SD Dakota Lions Sight and Health Sioux Falls TN East Tennessee Lions Eye Bank, Inc. Knoxville Mid-South Eye Bank for Sight Restoration, Inc. Memphis Tennessee Donor Services Nashville TX Fort Worth Eye Bank Fort Worth Great Plains Lions Eye Bank, Inc. Lubbock Lions Eye Bank of Texas at Baylor College of Medicine Houston Lone Star Lions Eye Bank Manor San Antonio Eye Bank San Antonio Transplant Services Center, UT Southwestern Medical Center Dallas Western Texas Lions Eye Bank Alliance San Angelo UT Utah Lions Eye Bank Murray VA Lions Medical Eye Bank & Research Center of Eastern VA, Inc. Norfolk Old Dominion Eye Foundation, Inc. Richmond WA SightLife Seattle WI Lions Eye Bank of Wisconsin Madison WV Medical Eye Bank of West Virginia Charleston
COUNTRY EYE BANK NAME CITY Canada Lions Eye Bank Calgary, AB Eye Bank of British Columbia Vancouver, BC Misericordia Eye Bank Winnipeg, MB New Brunswick Organ and Tissue Donor Program- Ocular Division Saint John, NB Regional Tissue Bank Halifax, NS Eye Bank of Canada, Ontario Division Toronto, ON
Eye Bank of Saskatchewan Saskatoon, SK Japan Cornea Center & Eye Bank Ichikawa City Hong Kong Hospital Authority Lions Eye Bank Kowloon China Daqing Eye Bank Daqing


![The 320 EeV Fly’s Eye event: a key messenger or a statistical oddity · arXiv:1906.11170v1 [astro-ph.HE] 26 Jun 2019 The 320 EeV Fly’s Eye event: a key messenger or a statistical](https://static.fdocuments.in/doc/165x107/5fb0acc33d04eb5aa83ff1ff/the-320-eev-flyas-eye-event-a-key-messenger-or-a-statistical-oddity-arxiv190611170v1.jpg)