
2015 Department · PDF fileinterior cleaning which has gone from more than 20 ... Baseline our...
33
Operations Division Division Summary 107 Division Critical Initiatives and Measures 110 Paratransit District 113 Rail District 116 Asset & Configuration Management 119 Transit Police 121 Service Management 124 Service Quality Management 127 Fleet Management 129 Pass-Thrus 132 Hayden District 133 Triskett District 136 2015 Department Budgets
Transcript of 2015 Department · PDF fileinterior cleaning which has gone from more than 20 ... Baseline our...

Operations DivisionDivision Summary 107Division Critical Initiatives and Measures 110Paratransit District 113Rail District 116Asset & Configuration Management 119Transit Police 121Service Management 124Service Quality Management 127Fleet Management 129Pass-Thrus 132Hayden District 133Triskett District 136
2015 Department Budgets

Operations Division
107 FY2015
Mission Statement The mission of the Operations Division is to provide safe, reliable, and effective customer-focused transportation services throughout the RTA’s service area in accordance with the service policies and financial plans adopted by the Authority.
Division Summary Michael York, Deputy General Manager
The Operations Division provides special door-to-door and scheduled fixed route bus and rail transportation services to the general public and is responsible for maintenance of all vehicles, equipment, and properties. The Division is also responsible for security and transit police services.
2014 Achievements
♦ Continued focus on the goals established for the TEAM initiatives. ♦ Accepted responsibility for the Strategic Plan VFOs Grow Passenger Satisfaction and
Increase Service Efficiency and Initiatives 4 Implement Predictive Maintenance Program and 5 Analyze Paratransit Practices. Personnel are also participating on interagency teams responsible for other VFOs and Initiatives. A Predictive Maintenance RFP was developed and advertised and award is targeted for January 2015.
♦ Worked with Public Square Redevelopment Team to ensure that RTA services are addressed and customer inconvenience minimized.
♦ Procured the Lytx DriveCam Operator/Vehicle Performance system based on the results of the systems tested in 2013. The DriveCam system is also being implemented on rail vehicles as the Event Recorder system.
♦ Implemented the services identified in the 2014 Service Management Plan (SMP). ♦ Implemented new West Shore BRT service on Clifton Blvd effective Dec. 8. Cleveland
State University bought the naming rights to the service. ♦ Developed and operated services in support of the International Gay Games. ♦ Developed transportation plans (bus and rail) for the Republican National Convention to
be held in Cleveland in 2016. ♦ Continued fine-tuning services to minimize cost and maximize service delivery
productivity. ♦ Continued priority focus on improving customer communications and service delivery. ♦ In partnership with Safety, continued efforts to instill a Safety Culture orientation within all
Operations Division organizational units. ♦ Continued implementation of the MAP-21 Safety and State of Good Repair standards.
Reorganized the Equipment and Facility Maintenance Planners and Configuration Management in a new unit titled Asset and Configuration Management that reports directly to the DGM- Operations.
♦ Continued focus on Rail infrastructure repair/upgrades. Rail service frequency after 8:00 p.m. was reduced to every 30 minutes to provide more track availability for infrastructure work.
♦ Continued to aggressively support and participate in the TransitStat program to reduce costs and improve the Authority's business practices and services. A good example is bus interior cleaning which has gone from more than 20 days between cleanings to less than 14 days.
♦ Continued Proof-of-Payment (POP) fare enforcement on the Health Line and Red Line.

Operations Division
108 FY2015
♦ Continued Brand Management efforts in conjunction with Marketing: Health Line, Downtown Trolley, Red Line, Blue/Green Lines, Transit Centers and Park/Ride Service.
♦ Continued in-house interior rehabilitation of 40 Heavy Rail Vehicles. Project is expected to be completed until early 2016.
♦ Completed replacement/upgrade of the operator dispatch system (MIDAS replacement) with the new system from GIRO, Inc. (HASTUS).
♦ Continued establishment of standards/guidelines for measuring maintenance performance including all Rail Power & Way infrastructure systems.
♦ Continued to refine RTA's system security and emergency preparedness and operations plans.
♦ Continued increased Transit Police presence on Red Line trains, particularly during school travel periods.
♦ Continued efforts for reducing crime on RTA vehicles and at RTA facilities. Implemented Community Policing at Hayden and Triskett Bus Districts whereby Transit Police Officers report to the districts and interact with operators to better understand their concerns and target problem areas.
♦ Procured 50 non-revenue vehicles as provided for in 2014 budget. ♦ Continued staffing of vacant rail and bus management and technical positions. ♦ Began the procurement of revenue vehicles as provided for in the 2014 budget: 23 sixty
foot articulated buses from New Flyer (16 of which will be on the new Clifton Corridor BRT that has been branded as the CSU line); and, 89 Gillig CNG buses that will be delivered in 2015.
♦ Repaired the exterior of all Health Line RTVs and the downtown Trolleys. ♦ Maintained State-of-Good Repair of Health Line stations and equipment. ♦ Completed implementation of new CAD/RMS for Transit Police. ♦ Supported the development and implementation of a new IT department. ♦ Continued to aggressively support/enforce the Authority’s sustainability initiatives.
Participating on the FTA ESMS Institute pilot at CBM.
2015 Objectives
♦ Continue to focus on the goals established for the TEAM initiatives. ♦ Continue development/implementation of the Strategic Plan VFOs Grow Passenger
Satisfaction and Increase Service Efficiency and Initiatives 4 Implement Predictive Maintenance Program and 5 Analyze Paratransit Practices. Continue participating on interagency teams responsible for other VFOs and Initiatives.
♦ Seek Board approval for proposed changes being considered for Paratransit. ♦ Incorporate the Strategic Plan objectives in the Operations Division 2015 Performance
Plans. ♦ Improve internal communications at all levels of the Operations Division. ♦ Develop and implement a certification program for all position classifications in the Service
Quality Department ♦ Award contract for the Predictive Maintenance plan that was developed in 2014 and
implement the planned pilot at the Hayden District. Based on results/structure of the Hayden pilot, develop in-house Predictive Maintenance plans for the Triskett District and Electronic Repair. Rail will be the last district for Predictive Maintenance.
♦ Continue working with Public Square Redevelopment Team to ensure that RTA services are addressed and customer inconvenience minimized. Establish bus reroutes as needed during reconstruction of the Square.
♦ Complete the rail DriveCam/Event Recorder system implementation.

Operations Division
109 FY2015
♦ Implement the services identified in the 2015 Service Management Plan (SMP). ♦ Continue supporting the operational and security teams preparing for the Republican
National Convention to be held in Cleveland in 2016. ♦ Continue fine-tuning services to minimize cost and maximize service delivery productivity
in response to changing ridership and traffic conditions. ♦ Continue priority focus on improving customer communications and service delivery. This
initiative includes informational signage on revenue vehicles and passenger facilities and the new bus stop target program.
♦ In partnership with Safety, continue efforts to instill a Safety Culture orientation within all Operations Division organizational units.
♦ Continue implementation of the MAP-21 Safety and State of Good Repair standards. The new Asset and Configuration Management organization will report directly to the DGM- Operations.
♦ In partnership with Engineering, complete the outdoor bus storage areas at Hayden and at Triskett.
♦ Continue focus on Rail infrastructure repair/upgrades. ♦ Continue to aggressively support and participate in the TransitStat program to reduce
costs and improve the Authority's business practices and services. ♦ Continue Proof-of-Payment (POP) fare enforcement on the Health Line and Red Line. ♦ Continue Brand Management efforts in conjunction with Marketing: Health Line,
Downtown Trolley, Red Line, Blue/Green Lines, Transit Centers and Park/Ride Service. ♦ Continue in-house interior rehabilitation of 40 Heavy Rail Vehicles. Project is expected to
be completed until early 2016. ♦ Continue establishment of standards/guidelines for measuring maintenance performance. ♦ Continue to refine RTA's system security and emergency preparedness and operations
plans. ♦ Reorganize Transit Police management structure to better align functional responsibilities
and reporting relationships. ♦ Continue increased Transit Police presence on Red Line trains, particularly during school
travel periods. ♦ Continue efforts for reducing crime on RTA vehicles and at RTA facilities. ♦ Continue Community Policing at Hayden and Triskett Bus Districts whereby Transit Police
Officers report to the districts and interact with operators. ♦ Procure 30+ non-revenue vehicles as provided for in 2015 budget. ♦ Inspect and put-in service 89 Gillig CNG buses that will be delivered in 2015. ♦ Develop specifications for Paratransit and Trolley buses to be purchased in 2016. ♦ Continue to support the new IT department. ♦ Continue to aggressively support/enforce the Authority’s sustainability initiatives, including
the FTA ESMS Institute pilot at CBM

Operations Division
110 FY2015
2015 Strategic Plan Critical Initiatives and Measures
Critical Initiative Division Champion(s) Team
Outcomes
Activities Plan Start Plan End % Complete
Implement Predictive Maintenance Program Mike York Ron Baron, Floun’say Caver, Oliver Draper, Mike Lively,
Richard Newell Achieve Improve Service Efficiency VFO for Average Miles Between Service Interruption (MBSI) of 8,000 miles Reduce Work Requests by 20% in 2015 (over 2014 total requests) Increase PM Compliant Percentage to X% (Floun’say to finalize %) Decrease the % of unplanned maintenance by 5% of 2014 total Develop RFP for Consultant to Develop Predictive Maintenance Program 9/1/2014 12/31/2014 100%
Award Contract for Predictive Maintenance Program 9/1/2014 12/31/2014 90% Hayden Implementation: Predictive Maintenance Program for Gilligs, HL, 28/2600’s, and other implement on % of fleet
1/1/2015 12/31/2015
Implement Predictive Maintenance Program at Electronic Repair – Implement on X% of Fleet 1/1/2015 12/31/2015
Implement Predictive Maintenance Program for Triskett Fleet – Implement on X% of Fleet 1/1/2015 12/31/2015

Operations Division
111 FY2015
Analyze Paratransit Practices Mike York Ron Baron, Floun’say Caver, Oliver Draper, Mike Lively, Richard Newell, Gale Fisk
Achieve Improved Service Efficiency VFO for Average Paratransit Cost per Trip of $40 for 2015 Decrease Annualized exposure due to current fare policies (Currently Assessed as $12.1 million of exposure) Define Plan to re‐work functional testing for Paratransit and move the process back in‐house 9/1/2014 11/5/2014 25%
Gain Go/No Go on proposal to start charging fares for non‐ADA and PCA customers on fixed route 9/1/2014 3/1/2015 25%
Implement change in policy to start charging fares for non‐ADA and PCA customers on fixed route 3/1/2015 6/30/2015
Re‐engineer the ADA application form 3/1/2015 6/30/2015 95% Develop RFP for Consultant to Analyze RTA’s entire Paratransit Service and Processes, i.e. Fare Analysis, Curb‐to‐Curb vs. Door‐to‐Door, on‐line booking, vehicle type, CDL Requirements, registration, eligibility, etc.
1/1/2015 3/31/2015 20%
Award Contract 4/1/2015 7/31/2015 Complete Study TBD Develop Implementation Strategy TBD Implement Recommendations TBD Gain approval to start Charging fares for non‐ADA and PCA customers on fixed route TBD
Define plan to re‐work functional testing moved internally TBD

Operations Division
112 FY2015
Assess Top Priorities for State of Good Repair (SOGR)
Mike Schipper
William Boyce, Joeseph Shaffer, Mike York, Joe Bilek, Ron Finerty, Jim Stock, Terrance Boylan, Eugene Cranford
Baseline our current SOGR by end of 2015 Implement processes to use SOGR data for project prioritization and capital forecasting needs for backlog Development and acceptance of an Asset Management Plan in Compliance with MAP21 9/1/2014 12/31/2014 95%
Identification of Fleet Assets (Revenue and Non‐Revenue) 1/1/2015 6/30/2015 95%
Identification of Bridge Assets 3/1/2014 12/31/2014 100% Identification of Track Assets 1/1/2014 12/31/2014 80% Identification of Catenary Assets 1/1/2014 12/31/2015 20% Identification of Power Assets (Substations) 1/1/2014 12/31/2015 75% Identification of Fiber Optic/Communication Assets 1/1/2014 12/31/2015 20% Identification of Transit Center Assets 1/1/2014 12/31/2015 100% Identification of Rail Station assets 1/1/2014 12/31/2015 25% Identification of Park & Ride Assets 1/1/2014 12/31/2015 25% Identification of Bus Loop Assets 1/1/2014 12/31/2015 25% Identification of Operating District Assets 1/1/2014 12/31/2015 25% Identification of Main Office Assets 1/1/2014 12/31/2015 100% Identification of Elevators & Escalators Assets 1/1/2014 12/31/2015 100%

Operations Division
113 FY2015
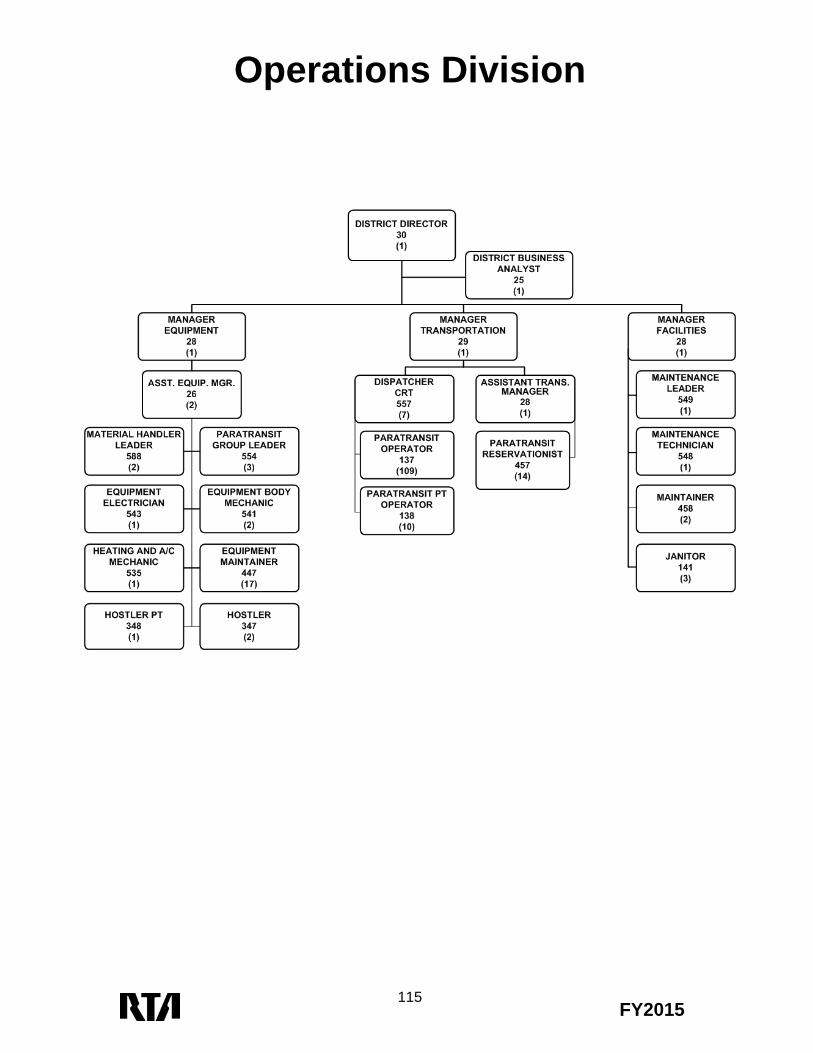
Mission Statement The mission of the Paratransit District is to provide essential door-to-door transportation services 24-hours a day, 7-days a week for Americans with Disabilities Act (ADA) eligible persons who cannot use regular GCRTA services as required by the ADA law and to manage all facilities and vehicle maintenance functions related to District operations.
2015 OPERATING BUDGET SUMMARY Department 31 – Paratransit District
OLIVER DRAPER, DISTRICT DIRECTOR Department Priorities for 2015
♦ Continue to implement the Paratransit Action plan to decrease customer wait times and trip denials, and increase unlinked passenger trips per revenue hour.
♦ Improve customer utilization of IVR and Web Access for scheduling.
♦ Create efficiencies to manage growth/demand for services.
2012 Actual
2013 Actual
2014 Estimate
2015 Budget
CALLS • Calls Taken (III, VII) 290,244 322,050 335,408 340,000• Average Wait Time (minutes) (III, VII) 2:05 1:00 2:00 1:45• % Calls Abandoned (III, VII) 7.73% 5.0% 6.0% 4.5%
TRIPS • Passenger Trips Completed (I, III, VII) 650,060 684,336 725,396 730,000• Cost per Revenue Mile (III, IV) $4.30 $4.30 $4.30 $4.30• Unlinked Passenger Trip/Revenue Hour (III, IV) 2.00 2.00 2.00 2.10• Average # Revenue Vehicles Inspected per month (I,
III, IV) 40 40 40 40
2014 Highlights
♦ Achieved over 4 million trip requests without denial (2007) ♦ Continued strong ridership growth 5.7% increase ♦ Maintained better than 90% total on-time performance ♦ Renewed contracts with primary contracted service providers ♦ Booked 5.3% of trips through Web/IVR

Operations Division
114 FY2015
Below are budget and staffing highlights of the Paratransit District Department
Staffing Comparison
Object Class
Description 2012 Actual 2013 Actual 2014 Estimate
2015 Budget
501100 BUS OPERATORS' LABOR 5,156,432.98 5,170,370.30 5,100,033.76 5,479,440.34 501110 OVERTIME - BUS OPERATORS 967,098.92 798,410.31 1,049,607.16 600,000.00 501200 HOURLY EMPLOYEES PAYROLL 2,430,537.19 2,587,217.41 2,703,874.57 2,755,093.17 501210 OVERTIME - HOURLY EMPLOYEES 247,332.44 261,704.61 288,643.24 200,000.00 501300 LABOR - SALARIED EMPLOYEES 864,333.56 879,151.10 1,009,811.76 1,022,172.03 501310 OVERTIME - SALARIED EMPLOYEES 46,831.31 50,861.67 56,020.19 30,000.00 502000 FRINGE BENEFITS 3,329,730.12 3,395,170.81 3,600,477.92 3,666,035.27 502071 W. C. - INJURIES & DAMAGES 1,534.86 2,326.23 3,741.25 0.00 503000 SERVICES 244,373.25 33,142.58 47,499.84 500.00 503042 VENDOR IN-HOUSE SERVICE (NAPA) 0.00 134,590.00 139,946.00 158,400.00 503052 OTHER MAINTENANCE CONTRACTS 0.00 0.00 27,967.52 77,600.00 504000 MATERIAL & SUPPLIES 693,569.56 11,384.08 23,358.61 49,322.50 504031 GASOLINE - STORAGE TANKS 674.20 797.34 1,836.73 3,300.00 504032 PROPANE FUEL 0.00 140,000.00 (0.24) 140,000.00 504081 VENDOR IN-HOUSE PARTS (NAPA) 0.00 660,407.00 595,661.00 720,000.00
508020 PURCHASED TRANSPORTATION - SUBURBAN 5,907,354.00 6,411,352.30 5,983,477.46 7,216,537.90
509000 MISCELLANEOUS EXPENSES 4,926.55 (148,189.95) 6,318.00 13,400.00 512000 LEASES & RENTALS 0.00 (190.86) 1,541.18 2,860.00
DEPT TOTAL 19,894,728.94 20,388,504.93 20,639,815.95 22,134,661.21
Grade Job Name 2012 2013 2014 2015 01 0137 Paratransit Operator 109.0 109.0 109.0 109.0 0138 Paratransit Operator – PT 10.0 10.0 10.0 9.0 0141 Janitor 3.0 3.0 3.0 3.002 0203 Clerk/Typist 1.0 0.0 0.0 0.003 0347 Hostler 2.0 2.0 2.0 2.0 0348 Hostler – PT 0.0 2.0 2.0 2.004 0442 Equipment Servicer 0.0 0.0 3.0 3.004 0447 Equipment Maintainer 17.0 18.0 14.0 14.0 0457 Paratransit Reservations Op 12.0 14.0 14.0 14.0 0458 Maintainer 2.0 2.0 2.0 2.005 0535 Heating A/C Mechanic 1.0 1.0 1.0 1.0 0541 Equipment Body Mechanic 1.0 1.0 1.0 1.0 0543 Equipment Electrician 1.0 1.0 1.0 1.0 0548 Maintenance Technician 1.0 1.0 1.0 1.0 0549 Maintenance Leader 1.0 1.0 1.0 1.0 0554 Paratransit Group Leader 3.0 3.0 3.0 3.0 0557 Dispatcher – Paratransit 6.0 7.0 7.0 7.0 0588 Material Handler 2.0 2.0 2.0 2.025 1085 District Business Analyst 1.0 1.0 1.0 1.026 1069 Asst. Supt. Paratran Equip 2.0 2.0 2.0 2.028 0761 Manager Facilities 1.0 1.0 1.0 1.0 0851 Manager Equipment 1.0 1.0 1.0 1.0 1084 Assistant Manager 1.0 1.0 1.0 1.029 0786 Manager Transportation 1.0 1.0 1.0 1.030 0777 District Director 1.0 1.0 1.0 1.0
Total 181.0 185.0 184.0 183.0
Operations Division
115 FY2015

Operations Division
116 FY2015
Mission Statement The mission of the Rail District is to provide safe, reliable, clean, and effective rapid transit services to GCRTA customers and to effectively manage all facilities, track infrastructure, and vehicle maintenance functions related to District operations.
2015 OPERATING BUDGET SUMMARY Department 32 – Rail District
DENNIS REHFUSS, DISTRICT DIRECTOR Department Priorities for 2015
♦ Continue the Heavy Rail Vehicle (Red Line) Interior Overhaul project.
♦ Continue to aggressively replace cross ties.
♦ Develop strategic plan for capital improvements to entire infrastructure to include stations, substations, track, signals and equipment.
♦ Continued implementation of LEAN programs to improve efficiency and reduce costs. ♦ Continue to support the Rail Clean Corridor program for graffiti removal. ♦ Aggressively perform signal system maintenance during relay testing, junction box
replacement, and double bonding to mitigate track circuit failure, reduce service delays, and ensure a safe system.
♦ In conjunction with Engineering, continue rebuilding the Fairhill Substation and develop an implementation plan for subsequent transformer and rectifier replacement.
♦ Install Blue/Green LED lights on Light Rail Vehicles to designate train route. ♦ Design and build new microprocessors for HRV’s to improve reliability and safety. ♦ Support 2015 Operations Division initiatives and projects as assigned.
2012
Actual 2013
Actual 2014
Estimate 2015
Budget Passenger Car Revenue Miles (III) 2,688,367 4,376,144 4,381,983 4,101,983% Deadhead miles (III) 0.8% 1.2% 1.2% 1.2%Cost per Passenger Trip (III, IV) $4.58 $4.13 $4.00 $4.20Average Passenger Trips per Revenue Hour (III, IV) 30.46 32.00 41.00 40.00# Preventable Accidents per 100,000 miles (I, III, VI) 0.00 0.05 0.00 0.00% Vehicles completed in HRV Exterior Overhaul (I, III, IV, V) 100% N/A N/A N/A% Vehicles completed in HRV Interior Overhaul (I, III, IV, V) N/A 0.0% 20% 75%Miles Between Service Interruptions (I, III, VII) 14,353 91,632 48,500 45,500Annual Delay (Hours) (I, III, VII) 18.00 21.45 20.00 19.00
2014 Highlights
♦ Exceeded TEAM (Together Everyone Achieves More) goal (8,500 miles) for miles between service interruptions.
♦ Completed installation of destination signs to enhance rider information. ♦ Continuing reconstruction of Little Italy Station. ♦ Replaced over 16,000 deteriorated railroad ties throughout the system. ♦ Implemented maintenance root cause analysis to increase performance and reliability. ♦ Applied cellular manufacturing to reduce motor rebuild time by 16%.

Operations Division
117 FY2015
Below are budget and staffing highlights of the Rail District Department
Obj. Class
Description 2012 Actual 2013 Actual 2014 Projection
2015 Budget
501100 Rail Operator Labor 4,152,965.17 4,571,479.67 4,653,291.43 5,118,714.00 501110 Overtime – Rail Operators 251,726.87 415,674.65 512,652.78 295,912.00 501200 Hourly Employees Payroll 10,388,189.61 11,331,346.11 12,157,328.48 12,900,489.35 501210 Overtime – Hourly Employees 1,520,197.31 1,386,301.46 1,483,870.21 850,000.00 501300 Labor – Salaried Employees 2,080,987.11 2,213,532.40 2,371,714.73 2,596,733.08 501310 Overtime – Salaried Employees 106,200.29 148,747.94 134,981.14 75,000.00 502000 Fringe Benefits 6,119,809.75 6,855,666.33 7,644,471.59 7,906,012.77 502071 W.C. – Injuries & Damages 7,902.07 3,059.24 3,606.11 0.00 503000 Services 2,778,747.24 743,670.91 578,955.96 291,000.00 503052 Other Maintenance Contracts 0.00 2,019,526.22 1,905,948.58 2,734,709.00 504000 Materials & Supplies 702,680.36 877,397.88 764,520.14 836,600.00 504090 Tires & Tubes (806.00) 6,501.00 0.00 3,000.00 505000 Utilities 379,303.09 (73,801.23) 0.00 0.00 505010 Propulsion Power 3,158,502.29 2,199,704.11 3,170,388.37 3,132,000.00 505020 Sewers 0.00 3,000.00 18.88 3,000.00 505021 Electricity 0.00 556,400.00 292,917.19 575,000.00 509000 Miscellaneous Expenses 73,948.25 34,630.89 26,354.02 72,480.00 509022 Meals & Concessions 0.00 0.00 0.00 500.00 512000 Leases & Rentals 1,200.00 (218.81) 0.00 5,000.00
Total: 31,721,553 33,292,618.77 35,701,019.60 37,396,150.20

Operations Division
118 FY2015
Grade Job Name 2012 2013 2014 2015 00 9943 HRV Overhaul Leaders 5.0 0.0 0.0 0.0 01 0141 Janitor 25.0 25.0 25.0 25.0 0152 Laborer 11.0 11.0 13.0 17.0 03 0301 Administrative Assistant 1.0 1.0 1.0 1.0 0337 Station Attendant 8.0 8.0 8.0 8.0 0341 Janitor Leader 1.0 1.0 1.0 1.0 0346 Vehicle Servicer 15.0 15.0 15.0 15.0 0352 Laborer 18.0 18.0 15.0 15.0 0358 Maintenance Helper 4.0 4.0 4.0 4.0 1635 Vehicle Servicer – PT 1.0 1.0 0.0 0.0 04 0437 Operator 58.0 60.0 70.0 70.0 0438 Operator – PT 15.0 15.0 11.0 11.0 0442 Equipment Servicer 0.0 8.0 7.0 9.0 0446 Body Mechanic 6.0 6.0 12.0 12.0 0447 Equipment Maintainer 45.0 30.0 31.0 29.0 0448 Substation Maintainer 5.0 5.0 4.0 4.0 0450 Signal Maintainer 15.0 15.0 14.0 14.0 0452 Track Maintainer 7.0 7.0 7.0 7.0 0453 Line Maintainer 8.0 8.0 8.0 8.0 0455 Upholsterer 1.0 0.0 0.0 0.0 0458 Maintainer 8.0 8.0 8.0 8.0 0485 Mat Handler/Stock Clerk 3.0 3.0 3.0 3.0 05 0521 Rail Equip Body Mechanic 2.0 2.0 2.0 2.0 0522 Rail Equip Electrician 5.0 5.0 5.0 5.0 0523 Rail Equipment Mechanic 3.0 4.0 4.0 4.0 0524 Rail Brake Mechanic 2.0 2.0 2.0 2.0 0525 Rail Machinist 1.0 2.0 1.0 1.0 0548 Maintenance Technician 7.0 7.0 7.0 7.0 0549 Maintenance Leader 3.0 3.0 3.0 3.0 0550 Signal Maint Technician 7.0 7.0 7.0 7.0 0552 Special Equip Op/Mechanic 3.0 3.0 3.0 3.0 0553 Rail A/C Mechanic 3.0 3.0 3.0 3.0 0567 Motor Repair Leader 1.0 1.0 1.0 1.0 0577 Dispatcher 5.0 5.0 5.0 5.0 0588 Material Handler Leader 1.0 1.0 1.0 1.0 06 0623 Asst Supervisor Rail Shop 6.0 6.0 7.0 7.0 0624 Electronics Technician 3.0 3.0 3.0 3.0 0637 Staff Assistant 1.0 1.0 1.0 1.0 0648 Substation Maintainer 10.0 10.0 10.0 10.0 0650 Signal Technician 7.0 7.0 7.0 7.0 0651 Lead Signal Technician 2.0 2.0 2.0 2.0 0652 Asst Supervisor Track 1.0 1.0 1.0 1.0 0653 Line Maintainer 7.0 7.0 7.0 7.0 0654 Spec Equip Op/Mech Ldr 1.0 1.0 1.0 1.0 0698 Lead Substn Maintainer 1.0 1.0 1.0 1.0 22 0721 Secretary I 1.0 1.0 1.0 1.0 25 1085 District Business Analyst 1.0 1.0 1.0 1.0 26 0799 Supv Rail Station Fac 2.0 2.0 2.0 2.0 0900 Janitor Supervisor 1.0 1.0 1.0 1.0 27 0762 Supervisor – Power & Way 4.0 4.0 4.0 4.0 1178 Equipment Administrator 1.0 1.0 1.0 1.0 1252 Supervisor Rail Shop 2.0 2.0 2.0 2.0 1705 Assistant Equipment Manager 0.0 0.0 1.0 1.0 28 0761 Manager Facilities 1.0 1.0 1.0 1.0 0895 HRV Project Manager 1.0 0.0 0.0 0.0 1234 Supervisor Signals 1.0 1.0 1.0 1.0 1239 Supervisor Overhead 1.0 1.0 1.0 1.0 1249 Supervisor Rail Traffic 1.0 1.0 1.0 1.0 1273 Supervisor Track and Stru 1.0 1.0 1.0 1.0 29 0786 Manager Transportation 1.0 1.0 1.0 1.0 0792 Manager Rail Equipment 1.0 1.0 1.0 1.0 1526 Manager Power & Way 1.0 1.0 1.0 1.0 30 0777 District Director 1.0 1.0 1.0 1.0
Total 364.0 354.0 361.0 365.0

Operations Division
119 FY2015
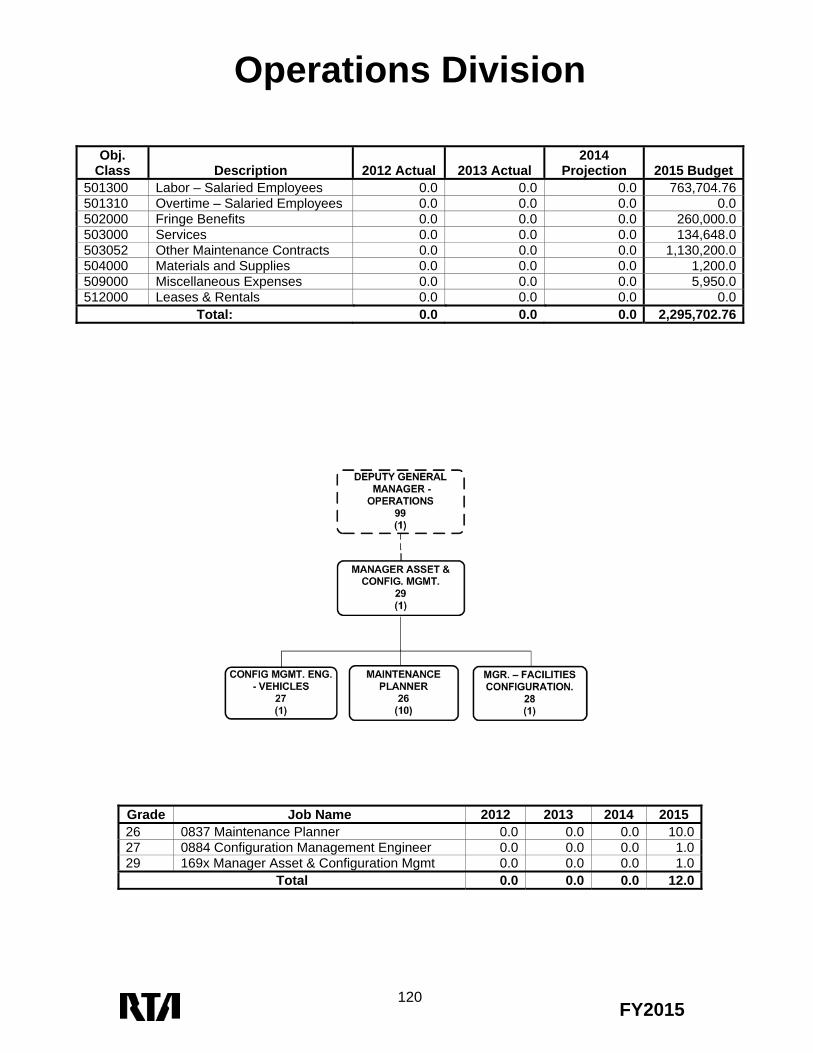
Mission Statement The mission of Asset and Configuration management is to utilize a strategic and systematic process through which our organization procures, operates, maintains, rehabilitates, and replaces assets ensuring FTA and State of Good Repair compliance.
2015 OPERATING BUDGET SUMMARY
Department 33 – Asset & Configuration Management
WILLIAM BOYCE, MANAGER Department Priorities for 2015.
♦ Implement the 2014 Asset Management Plan
♦ Continue to improve the cost effectiveness and efficiency in maintaining assets throughout the Authority.
♦ Implement Predictive Maintenance Program.
♦ Complete Asset Validations of Rail Stations, Bus Loops, and Shelters.
♦ Ensure all assets are tracked and maintained utilizing our asset management database system (Ultramain)
♦ Validate all Standard Operating Procedures are in compliance with ODOT, Internal Audit, and Safety.
♦ Develop a comprehensive baseline containing SOGR Ratings including assets maintained in Ultramain.
♦ Develop State of Good Repair Backlog and identify potential capital projects.
♦ Develop new TransitStat reporting format focusing more on Asset Management, SOGR, and Predictive Maintenance initiatives.
♦ Support employee training and development programs.
♦ Continue to revise all Configuration models pertaining to Fleet, Facilities, and Power and Way in Ultramain.
♦ Develop appropriate preventive maintenance programs and monitor compliance based on Asset Management Standards.
♦ Continue to build all maintenance inspections based off manufactures specifications. ♦ Replace Wheelchair Lifts at Shaker Square. ♦ Continue to work with Linex replacing damaged elevator floors. ♦ Repair the West 25th Elevator Hydraulic Cylinder and Piston. ♦ Complete all VFO initiatives developed for 2015. (Top Priorities for SOGR.)
2012 2013 2014 2015 Miles Between Service Interruptions’ (I, III, VI, VII)
Hayden N/A N/A 3,097 3,972 Triskett N/A N/A 4,144 4,467 Rail N/A N/A 23,794 27,109 Paratransit N/A N/A 95,836 110,778 Total Interruptions (I, III, VI, VII) Hayden N/A N/A 1,939 1,586 Triskett N/A N/A 1,097 986 Rail N/A N/A 93 86 Paratransit N/A N/A 22 18
Operations Division
120 FY2015
Obj. Class
Description
2012 Actual
2013 Actual
2014 Projection
2015 Budget
501300 Labor – Salaried Employees 0.0 0.0 0.0 763,704.76501310 Overtime – Salaried Employees 0.0 0.0 0.0 0.0502000 Fringe Benefits 0.0 0.0 0.0 260,000.0503000 Services 0.0 0.0 0.0 134,648.0503052 Other Maintenance Contracts 0.0 0.0 0.0 1,130,200.0504000 Materials and Supplies 0.0 0.0 0.0 1,200.0509000 Miscellaneous Expenses 0.0 0.0 0.0 5,950.0512000 Leases & Rentals 0.0 0.0 0.0 0.0
Total: 0.0 0.0 0.0 2,295,702.76
Grade Job Name 2012 2013 2014 2015 26 0837 Maintenance Planner 0.0 0.0 0.0 10.027 0884 Configuration Management Engineer 0.0 0.0 0.0 1.029 169x Manager Asset & Configuration Mgmt 0.0 0.0 0.0 1.0
Total 0.0 0.0 0.0 12.0

Operations Division
121 FY2015
Mission Statement The mission of the Greater Cleveland Regional Transit Authority (GCRTA) Transit Police Department is to provide a safe and orderly environment within the transit system, to promote the confidence of the riding public, and to enhance the use of the entire system. Central to this is the protection of life and property through the prevention of crime and terrorism. The TP will work in collaboration within the GCRTA and with our regional partners to respond and recover from man-made and natural disasters.
2015 OPERATING BUDGET SUMMARY
Department 34 – Transit Police JOHN P. JOYCE, DIRECTOR OF SECURITY / CHIEF OF POLICE Department Priorities for 2015
♦ Continue providing Proof of Payment – Fare Enforcement to deter fare evasion.
♦ Address serious crimes through participation in multi-agency task forces.
♦ Increase Transit Police visibility on revenue vehicles and at passenger facilities to address quality of life issues.
♦ Address Operator security concerns through Community Policing initiatives at Bus Districts.
♦ Continue to conduct Security and Risk Analysis for all GCRTA properties with assistance from the U.S. Department of Homeland Security, Transit Security Administration.
♦ Implement plan to reorganize Transit Police management staff. ♦ Initiate procurement process for Body Cameras for Transit Police Officers.
2012 Actual
2013 Actual
2014 Actual
2015 Budget
Quality of Life Crimes Misconduct on Public Transit (I, III) 3,329 3,672 5205 6283 Aggravated Disorderly Conduct (D/C) (I, III) 7 5 54 46 Disorderly Conduct (D/C) (I, III) 99 146 146 196 Disorderly Conduct (D/C) / Intoxication (I, III) 155 193 221 294 Open Container (I, III) 292 338 296 438 Trespassing (I, III) 49 52 71 88 Soliciting (I, III) 0 0 0 0 Fare Evasion Citations – HealthLine (I, III) 1,549 1,626 2238 2759 Fare Evasion Citations – Red Line (I, III) 1,764 2,016 2967 3516

Operations Division
122 FY2015
Below are budget and staffing highlights of the Transit Police Department
Obj. Class
Description
2012 Actual
2013 Actual
2014 Projection
2015 Budget
501200
Hourly Employees Payroll 6,608,537.29
6,690,774.22
7,018,134.99
7,433,516.93
501210 Overtime – Hourly Employees 340,166.59 431,956.41 364,375.31 561,200.00 501300 Labor – Salaried Employees 652,774.97 755,208.50 793,425.68 793,177.97 501310 Overtime – Salaried Employees 14.88 141.08 0.00 10,000.00 502000 Fringe Benefits 2,597,390.01 2,717,653.19 2,935,261.07 3,482,473.63 503000 Services 18,527.58 17,897.94 16,950.79 165,450.00504000 Materials & Supplies 395,477.99 396,098.61 241,842.97 139,800.00506000 Casualty & Liability Costs 81,210.14 2,790.00 0.00 7,500.00509000 Miscellaneous Expenses 4,680.00 43,088.51 74,780.30 71,400.00512000 Leases & Rentals 32,629.20 6,160.00 6,280.00 8,000.00
Total: 10,736,639 11,098,138.48 11,500,448.18 12,672,518.53
Grade Job Name 2012 2013 2014 2015 01 0139 Security Officer 1.0 1.0 1.0 1.002 0239 Dispatcher Transit Police 9.0 9.0 9.0 9.004 0440 Transit Police Officer 84.0 84.0 84.0 84.0 0440 FT Transit Police Fare Enforcement 0.0 15.0 15.0 15.0 0454 PT Transit Police Fare Enforcement 26.0 15.0 15.0 15.005 0540 Transit Police Sergeant 18.0 18.0 18.0 17.023 0725 Executive Secretary 1.0 1.0 1.0 1.0 1079 Security Technician 0.0 0.0 2.0 2.025 1085 District Business Analyst 1.0 1.0 1.0 1.026 1665 Security Systems Specialist 0.0 2.0 2.0 2.027 1060 Lieutenant 4.0 4.0 4.0 4.028 0840 Manager Security 1.0 1.0 1.0 1.029 1248 Commander 0.0 0.0 0.0 2.0 1356 Dpty Dir Security/Police 1.0 1.0 1.0 0.030 1151 Director Security/COP 1.0 1.0 1.0 1.0
Total 149.0 153.0 155.0 155.0

Operations Division
123 FY2015

Operations Division
124 FY2015
Mission Statement The Service Management Department plans, monitors, and adjusts all rail, bus and van pool services. The Department works with District Management to ensure safe, reliable, and effective service for all passengers. The Department also provides centralized facility maintenance services for the Authority and manages the signage and shelter programs.
2015 OPERATING BUDGET SUMMARY Department 35 – Service Management
JOEL FREILICH, ACTING DIRECTOR Department Priorities for 2015
♦ Implement the 2015 Service Management Plan.
♦ Continue to improve the cost effectiveness and efficiency of service delivery.
♦ Continue to focus on customer communications and quality of service delivery.
♦ Complete final review of HASTUS Bid/Dispatch System.
♦ Continue programs to electronically provide real-time service information to customers.
♦ Expand utilization of TransitMaster software to monitor schedule adherence and make real-time service adjustments as necessary.
♦ Assess all bus stops for safety and spacing.
♦ Continue to replace all bus stop signs with new design.
♦ Identify and implement workflow and operating efficiencies and aggressively enforce energy conservation and sustainability initiatives.
♦ Support employee training and development programs.
♦ Continue all facility models in UltraMain.
♦ Develop appropriate preventive maintenance programs and monitor compliance.
♦ Continue operation of the HealthLine & perform routine maintenance of stations, properties, and shelters on the Euclid Corridor.
2012
Actual 2013
Actual 2014
Estimate 2015
Budget Vehicle Revenue Miles (I, III, IV) Bus (Including van pool) 15,855,476 16,395,300 16,330,500 16,530,000 Heavy Rail 2,164,503 2,599,200 2,661,800 2,500,000 Light Rail 937,480 876,400 880,400 875,000 Vehicle Revenue Hours (I, III, IV) Bus (Including van pool) 1,262,446 1,325,500 1,332,300 1,350,000 Heavy Rail 98,791 132,400 133,300 125,000 Light Rail 76,075 63,200 59,200 60,000 2014 Highlights
• Installed, accepted, and utilized HASTUS Bid/Dispatch module. • Began installation of new design of Bus Stop signs • Implemented new services

Operations Division
125 FY2015
Below are budget and staffing highlights of the Service Management Department
Obj. Class
Description 2012 Actual 2013 Actual 2014 Projection
2015 Budget
501200 Hourly Employees Payroll 1,706,423.26 1,687,214.15 1,916,131.82 1,932,836.92 501210 Overtime – Hourly Employees 38,198.39 44,587.98 30,314.74 40,000.00 501300 Labor – Salaried Employees 1,648,487.56 1,773,370.43 1,999,885.97 1,382,641.33 501310 Overtime – Salaried Employees 2,163.65 334.14 37.99 1,000.00 502000 Fringe Benefits 1,274,089.47 1,278,132.75 1,480,182.18 1,217,930.28 502071 W/C –Injuries and Damages to Employees 451.49 445.26 0.00 0.00 503000 Services 1,195,130.77 774,071.15 234,427.44 176,960.00 503052 Other Maintenance Contracts 0.00 1,095,472.42 576,761.59 923,787.00 504000 Materials & Supplies 233,845.01 145,035.80 134,226.49 447,100.50 508024 Purchased Transportation – Work Access 864,000.00 1,200,000.00 648,897.17 0.00 509000 Miscellaneous Expenses 28,015.83 17,806.12 35,737.91 97,650.00 509022 Meals & Concessions 0.00 0.00 0.00 3,750.00 512000 Leases & Rentals 0.00 0.00 0.00 500.00
Total: 6,990,805.43 8,016,470.20 7,056,603.28 6,224,156.03

Operations Division
126 FY2015
Grade Job Name 2012 2013 2014 2015 01 9942 Service Management Intern 0.0 1.0 1.0 1.0 0141 Janitor 4.0 4.0 4.0 4.0 0152 Laborer 15.0 15.0 15.0 15.003 0318 Planning Secretary 1.0 1.0 1.0 1.0 0338 Service Monitor 10.0 9.0 8.0 8.0 0341 Janitor Leader 1.0 1.0 1.0 1.0 0358 Maintenance Helper 2.0 2.0 2.0 2.004 0401 Secretary 1.0 1.0 1.0 1.0 0447 Equipment Maintainer 1.0 0.0 0.0 0.0 0458 Maintainer 7.0 7.0 7.0 7.0 0460 Stop Sign Maintainer 2.0 2.0 2.0 2.005 0530 Schedule Analyst 2.0 2.0 2.0 2.0 0548 Maintenance Technician 1.0 1.0 1.0 1.0 0549 Maintenance Leader 1.0 1.0 1.0 1.0 0563 Chief Service Monitor 1.0 1.0 1.0 1.0 0577 Dispatcher 1.0 1.0 1.0 1.0 0599 Sign Shop Leader 0.0 1.0 1.0 1.0 1962 Dispatch Analyst 0.0 0.0 1.0 1.023 0725 Executive Secretary 1.0 1.0 1.0 1.025 0836 Mobility Specialist 2.0 2.0 2.0 2.0 1085 District Business Analyst 2.0 2.0 1.0 1.026 0793 Scheduling Section Group Leader 0.0 0.0 1.0 1.0 0837 Maintenance Planner 4.0 4.0 4.0 0.0 0881 Systems Admin CITME 1.0 1.0 1.0 1.0 0887 Transportation Data Analyst 2.0 1.0 1.0 1.0 1691 ITS Specialist 0.0 2.0 2.0 2.0 0900 Supv Janitorial Service 1.0 1.0 1.0 1.0 1274 Planner III 1.0 3.0 3.0 3.0 1625 Performance Leader Ops 2.0 0.0 0.0 0.027 0867 Bus Shltr/Grg Maint Supv 1.0 1.0 1.0 1.028 0854 Mgr Oper Analysis/Res/Sys 1.0 1.0 1.0 1.0 1346 Mgr Service Planning 0.0 1.0 1.0 1.0 1436 Manager Scheduling 1.0 1.0 1.0 1.0 1695 Manager Facilities Configuration 0.0 1.0 1.0 0.029 0791 Mgr Central Facilities 1.0 1.0 1.0 1.0 1621 Asst. Dir – Service Mgmt 1.0 1.0 1.0 1.030 0775 Director 1.0 1.0 1.0 1.099 9921 DGM Operations 1.0 1.0 1.0 1.0
Total 74.0 75.0 76.0 71.0

Operations Division
127 FY2015
Mission Statement The Service Quality Department ensures that the Authority’s various service offerings are safely provided, on-time, and courteously delivered. The Department is comprised of supervisors and managers, and utilizes a radio system for real-time communications. Primary internal customers include the Bus and Rail Districts and the Service Management Department.
2015 OPERATING BUDGET SUMMARY Department 38 – Service Quality Management
RICHARD NEWELL, DIRECTOR
Department Priorities for 2015 ♦ Continue efforts for operating
efficiencies. ♦ Continue efforts for goal of 80%
on-time service delivery. ♦ Work with the supervisory teams
assigned to mini-transit centers to stabilize and ensure the timeliness of the services originating from each location.
♦ Identify and target under-performing lines of service to facilitate resource allocations while working toward lowering percentage of early departures and arrivals.
♦ Provide all staff with high quality training opportunities. ♦ Work with the Safety Department and the service Districts to define, identify and review accident-prone
operators in an effort to identify any common underlying causal factors and use such information to develop more effective pre-selection techniques, training programs, and preventative measures.
♦ Continue use of performance management system for supervisors which assigns point values to supervisory work behaviors/tasks; which not only establishes a quantifiable basis for performance assessments, but also creates an indirect method for managers to set work priorities in response to the dynamics of a changing work environment.
♦ Continue use of Commuter Alerts Program. This Program allows for the transmission of certain service status information to rail customers via e-mail and text. A comparable service is planned for bus customers in the future.
♦ Effective roll-out and use of new Tour Guard System in conjunction with Transit Police.
2012 Actual
2013 Actual
2014 Estimate
2015 Budget
On-Time Service (III, VI, VII) 78% 79% 79% 80%Overtime per pay (III, IV, VI) $10,233 $12,700 $10,100 $7,800Absence Rate (IV, VI) 4.97% 4.00% 4.10% 4.00%High Accident Route Contacts (per month) (I, III, IV, VI) 4,103 4,800 4,500 4,500Safety Rule of the Month Contacts (per month) (I, III, IV, VI) 4,763 5,300 5,000 5,000Pull-out Checks/Paratransit Checks/Block Checks (per month) (I, III, IV, VI) 5,662 6,300 6,000 6,000 2014 Highlights
♦ Achieved 80% System On-Time Performance for three months ♦ Continued work with Service Management Department to adjust time points. ♦ Successfully procured new Tour Guard System to track and analyze supervisor tours. ♦ Continued the work of the Mobile Clean Team, which is designed to conduct standard “pit
stop” type cleaning for buses that are currently in service.
Operations Division
128 FY2015
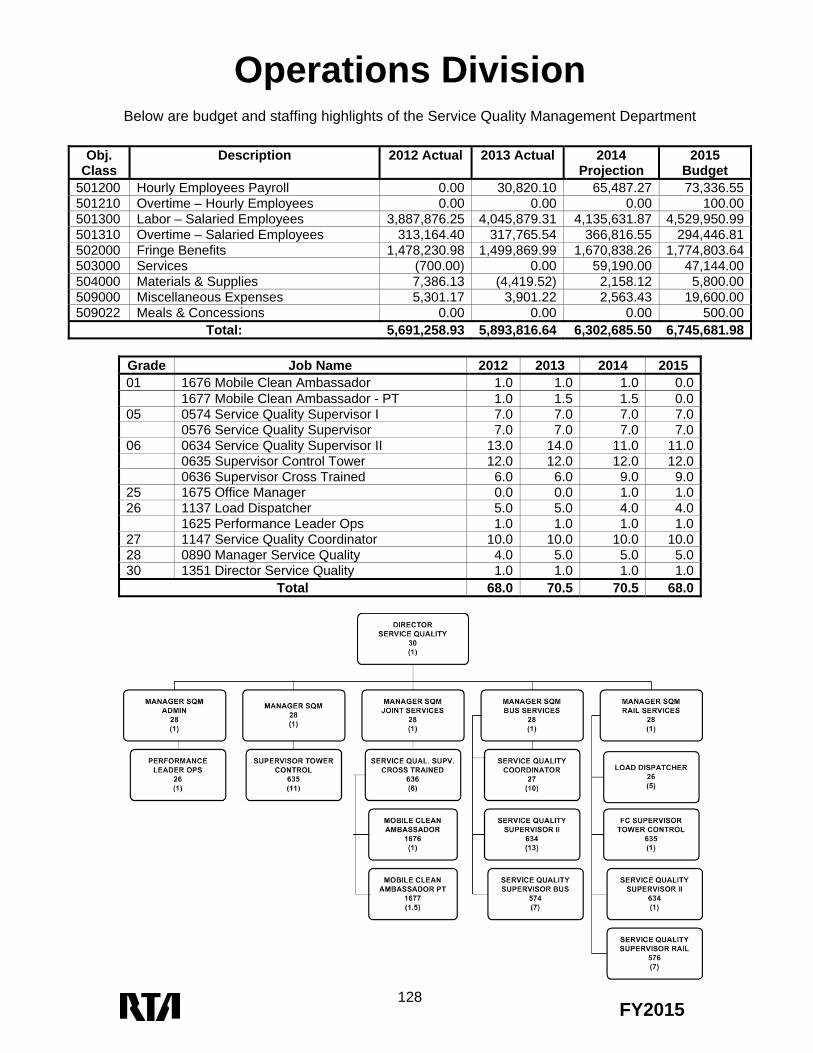
Below are budget and staffing highlights of the Service Quality Management Department
Obj. Class
Description 2012 Actual 2013 Actual 2014 Projection
2015 Budget
501200 Hourly Employees Payroll 0.00 30,820.10 65,487.27 73,336.55 501210 Overtime – Hourly Employees 0.00 0.00 0.00 100.00 501300 Labor – Salaried Employees 3,887,876.25 4,045,879.31 4,135,631.87 4,529,950.99 501310 Overtime – Salaried Employees 313,164.40 317,765.54 366,816.55 294,446.81 502000 Fringe Benefits 1,478,230.98 1,499,869.99 1,670,838.26 1,774,803.64 503000 Services (700.00) 0.00 59,190.00 47,144.00 504000 Materials & Supplies 7,386.13 (4,419.52) 2,158.12 5,800.00 509000 Miscellaneous Expenses 5,301.17 3,901.22 2,563.43 19,600.00 509022 Meals & Concessions 0.00 0.00 0.00 500.00
Total: 5,691,258.93 5,893,816.64 6,302,685.50 6,745,681.98
Grade Job Name 2012 2013 2014 2015 01 1676 Mobile Clean Ambassador 1.0 1.0 1.0 0.0 1677 Mobile Clean Ambassador - PT 1.0 1.5 1.5 0.005 0574 Service Quality Supervisor I 7.0 7.0 7.0 7.0 0576 Service Quality Supervisor 7.0 7.0 7.0 7.006 0634 Service Quality Supervisor II 13.0 14.0 11.0 11.0 0635 Supervisor Control Tower 12.0 12.0 12.0 12.0 0636 Supervisor Cross Trained 6.0 6.0 9.0 9.025 1675 Office Manager 0.0 0.0 1.0 1.026 1137 Load Dispatcher 5.0 5.0 4.0 4.0 1625 Performance Leader Ops 1.0 1.0 1.0 1.027 1147 Service Quality Coordinator 10.0 10.0 10.0 10.028 0890 Manager Service Quality 4.0 5.0 5.0 5.030 1351 Director Service Quality 1.0 1.0 1.0 1.0
Total 68.0 70.5 70.5 68.0

Operations Division
129 FY2015
Mission Statement The Fleet Management Department provides management support for the maintenance of the Authority’s bus fleet. Its primary objective is to provide sufficient, safe, operable, clean, and attractive buses to meet the Authority’s scheduled service requirements by maintaining and repairing vehicles and overseeing the Authority’s central inventory account.
2015 OPERATING BUDGET SUMMARY Department 39 – Fleet Management
RONALD BARON, DIRECTOR Department Priorities for 2015
♦ Support the Predictive Maintenance Program Plan (PMPP) implementation at Hayden, Triskett, and Electronic Repair.
♦ Use Computer Integrated Transit Maintenance Environment (CITME) to streamline inventory and maintenance processes.
♦ Provide technical support to departments within the Authority to support the progress of product reliability and sound maintenance practices.
♦ Administer Quality Assurance/Warranty program to ensure the receipt of quality goods/services and warranty recovery.
♦ Improve vehicle reliability and miles between service interruptions through data analysis; improve maintenance procedures and communication with the bus districts.
♦ Administer and control provision and delivery of materials within the inventory materials and supplies budget to all user departments.
♦ Manage the purchase of new vehicles and ensure the delivery of quality built vehicles that meet the needs of the Authority.
♦ Continue to improve efficiencies through the use of TransitStat data to control labor and material costs while maintaining Fleet Management operations.
♦ Manage contracts and associated budgets assigned to Fleet Management. 2012
Actual 2013
Actual 2014
Estimate 2015
Budget % of Active Fleet Available (I, III, IV, V, VI) 82% 82% 82% 82% Heavy Maintenance Overhauls Completed (I, III, IV, V, VI) 69 74 81
71
Problem Identification Corrective Action (PICA) completed (I, II, III, IV, V, VI, VII) 45 61 73 75 Q/A First Article Inspections (I, II, III, IV, V, VI, VII) 19 18 20 60 Warranty Dollars Recovered (III, IV, V, VI, VII) $1,075,090 $651,680 $931,582 $750,000 Facilities PM Maintenance On-Time (I, II, III, IV, V, VI, VII) 75% 85% 85%
84%
On-the-Job Injury Rate (I, IV, V, VI) 7.63 8.5 9.64 17.5 Inventory Service Level (I, II, III, IV, V, VI, VII) 95.0% 93.5% 96% 95% 2014 Highlights
♦ Purchased (23) sixty foot articulated buses from New Flyer. Sixteen buses will be used on the new CSU line and have been branded with CSU marketing material. Seven of the buses will be used on the 22 and 26 lines.
♦ Inspected and received Gillig CNG pilot bus. 89 more Gillig buses to be delivered in 2015. ♦ Developed the RFP for Predictive Maintenance and established a plan to implement Predictive Maintenance
Authority wide. ♦ Over 50 new Non-Revenue vehicles procured, received, inspected, and in-serviced in 2014. ♦ Created and hired a Parts Expediter position who has improved parts delivery dates on over 900 items.

Operations Division
130 FY2015
Below are budget and staffing highlights of the Fleet Management Department
Obj. Class
Description 2012 Actual 2013 Actual 2014 Projection
2015 Budget
501200 Hourly Employees Payroll 5,642,126.50 5,597,304.33 6,392,022.02 6,988,985.57 501210 Overtime – Hourly Employees 380,605.52 283,071.26 356,057.27 280,000.00 501300 Labor – Salaried Employees 2,423,179.04 2,448,396.48 2,616,871.20 2,498,553.30 501310 Overtime – Salaried Employees 9,557.59 428.55 897.01 8,000.00 502000 Fringe Benefits 3,035,344.30 3,183,629.28 3,622,641.57 3,536,724.28 502071 W.C. – Injuries & Damages 924.26 1,782.98 3,560.64 0.00 503000 Services 424,699.20 220,256.66 93,076.23 245,000.00 503052 Other Maintenance Contracts 0.00 24,294.70 237,601.78 307,190.00 504000 Materials & Supplies 295,889.11 431,839.60 387,038.95 327,200.00 201009 Materials & Supplies – Inventory 10,737,137.73 12,113,653.92 11,072,451.49 12,500,000.00 504020 Diesel Fuel 12,632,036.19 13,956,182.67 14,504,860.05 13,440,000.00 504021 Compressed Natural Gas (2,037.46) 0.00 0.00 0.00 504031 Gasoline 514,229.60 420,351.55 427,131.84 536,250.00 504090 Tires & Tubes 812,842.57 1,564,500.00 1,346,105.65 1,550,000.00 507050 State Fuel Tax 1,381,581.42 1,343,705.48 1,347,589.38 1,354,987.75 509000 Miscellaneous Receipts 27,707.85 36,379.33 51,307.77 38,400.00 512000 Leases & Rentals 151.20 0.00 0.00 0.00
Total: 38,315,974.62 41,625,776.79 42,459,212.85 43,611,290.90 Total (Net Inventory): 27,578,836.89 29,512,122.87 31,386,761.36 31,111,290.90

Operations Division
131 FY2015
Grade Job Name 2012 2013 2014 201501 0141 Janitor 4.0 4.0 4.0 4.002 0203 Clerk Typist 0.0 1.0 1.0 1.0 0281 Materials Clerk 2.0 1.0 1.0 1.003 0308 Stenographer 1.0 1.0 1.0 1.0 0347 Hostler 3.0 3.0 3.0 2.0 0358 Maintenance Helper 2.0 2.0 2.0 2.004 0404 Administrative Assistant 0.0 1.0 1.0 1.0 0442 Equipment Servicer 3.0 3.0 3.0 3.0 0445 Elec Equipment Maintainer 19.0 21.0 25.0 25.0 0446 Body Mechanic 2.0 3.0 3.0 3.0 0447 Equipment Maintainer 23.0 21.0 21.0 22.0 0455 Upholsterer 1.0 1.0 1.0 1.0 0458 Maintainer 3.0 3.0 3.0 3.0 0485 Mat Handler/Stock Clerk 9.0 8.0 8.0 8.005 0526 Machinist 1.0 1.0 1.0 1.0 0528 Automotive Brake Mechanic 5.0 5.0 5.0 5.0 0537 Administrative Assistant 1.0 0.0 0.0 0.0 0541 Equipment Body Mechanic 11.0 11.0 11.0 11.0 0542 Equip Elec Unit Mechanic 2.0 2.0 2.0 2.0 0543 Equipment Electrician 1.0 1.0 1.0 1.0 0545 Equipment Mechanic 15.0 16.0 16.0 16.0 0548 Maintenance Technician 2.0 3.0 3.0 3.0 0549 Maintenance Leader 1.0 1.0 1.0 1.0 0551 Elec Equipment Technician 10.0 10.0 12.0 12.0 0566 Certified Welder 1.0 0.0 0.0 0.0 0588 Material Handler Leader 2.0 2.0 2.0 2.0 0598 Material Mechanic Tech 1.0 0.0 0.0 0.006 0645 Asst Supervisor Section 2.0 2.0 2.0 2.0 0683 Supervisor Warehouse 2.0 2.0 2.0 2.022 0721 Secretary I 1.0 1.0 1.0 1.025 1047 QA/Warranty Electrical 1.0 1.0 1.0 1.0 1048 QA/Warranty Mechanical 3.0 3.0 3.0 3.0 1062 Vehicle Damage Estimator 1.0 1.0 1.0 1.0 1085 District Business Analyst 1.0 1.0 1.0 1.026 0837 Maintenance Planner 5.0 5.0 6.0 0.0 0863 Mat Cont & Release Spec 2.0 2.0 2.0 2.0 0874 Inventory Auditor/Analyst 1.0 1.0 1.0 1.0 0889 Material Planner 3.0 3.0 3.0 3.0 1258 Supervisor CBM 3.0 3.0 3.0 3.027 0753 Supervisor Elec Repair 3.0 3.0 3.0 3.0 0883 Config Mgmt Eng Fac 1.0 0.0 0.0 0.0 0884 Config Mgmt Eng Vehicles 1.0 1.0 1.0 0.0 1050 Supervisor Performance 1.0 1.0 1.0 1.0 1173 Supervisor Stores 1.0 1.0 1.0 1.0 1251 QA/Warranty Administrator 1.0 1.0 1.0 1.0 1327 Equip Engineer Electrical 1.0 1.0 2.0 2.0 1341 Engineer Bus Equipment 1.0 1.0 1.0 1.028 0759 Mgr Central Equipment 1.0 1.0 1.0 1.0 0761 Manager Facilities 1.0 1.0 1.0 1.0 0774 Manager Inventory 1.0 1.0 1.0 1.029 0768 Mgr Fleet Planning & Eng 1.0 1.0 1.0 1.030 0779 Director 1.0 1.0 1.0 1.0
Total 166.0 165.0 173.0 166.0

Operations Division
132 FY2015
Mission Statement Federal and State financial assistance is passed through the City of Brunswick for eligible transit projects.
2015 OPERATING BUDGET SUMMARY Department 43 – Pass Thrus
MICHAEL YORK DEPUTY GENERAL MANAGER – OPERATIONS
Department Priorities for 2015
♦ Administer the agreement with the City of Brunswick (Brunswick Transit Alternative) and the City of Medina (Medina County Public Transit) to ensure that Federal and State financial assistance is passed through for eligible projects.
Obj. Class
Description 2012 Actual 2013 Actual
2014 Projection
2015 Budget
509100 Brunswick Operating Assistance $245,142.10 235,053.11 $284,343.00 $318,883.00509107 Pass Through Medina – MCPT 0.0 0.0 $370,000.00 $436,590.00
Total: $245,142.10 235,053.11 $645,343.00 $755,473.00

Operations Division
133 FY2015
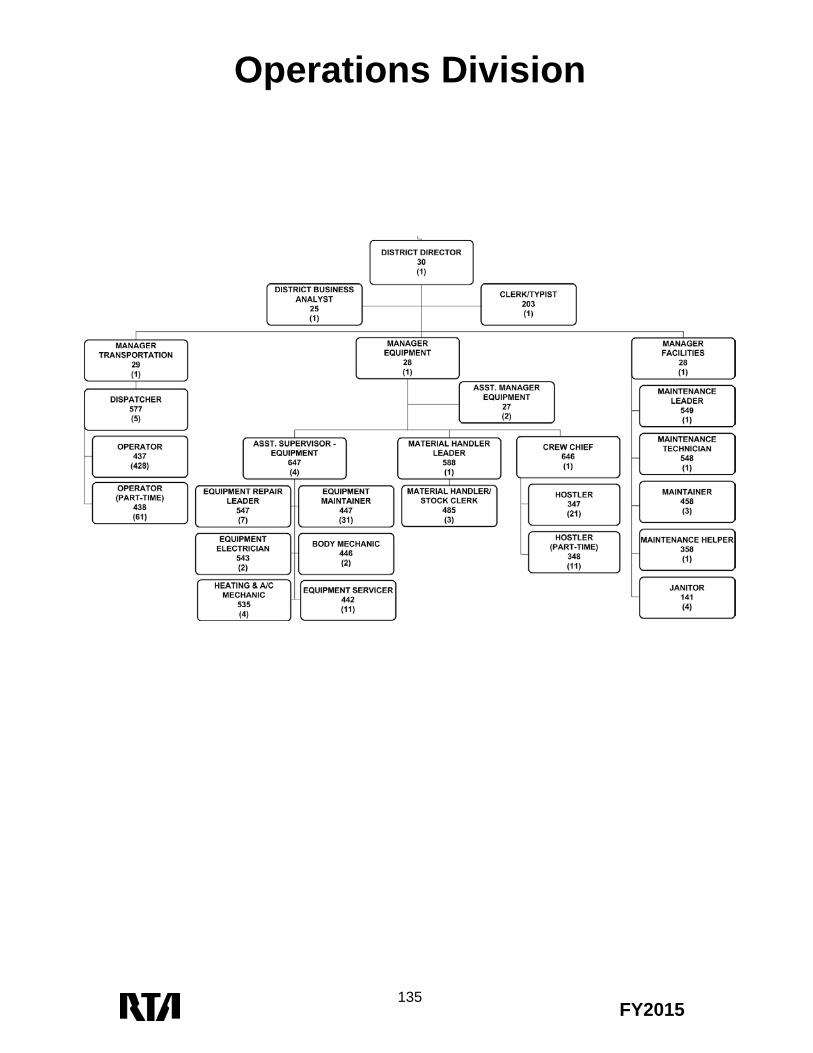
Mission Statement The mission of the Hayden District is to provide safe, reliable, clean, and courteous public transportation for the eastern and southeastern portions of the GCRTA service area.
2015 OPERATING BUDGET SUMMARY Department 46 – Hayden District
DR. FLOUN’SAY CAVER, DISTRICT DIRECTOR Department Priorities for 2015
♦ Procure Predictive Maintenance consultant
♦ Develop a Predictive Maintenance program for the new Gillig fleet, HealthLine RTV fleet, and 2800 fleet
♦ Implement program for the new Gillig fleet, HealthLine RTV fleet, and 2800 fleet
♦ Achieve 8,000 Miles Between Service Interruptions
♦ Integrate and Implement the Gillig CNG buses at Hayden ♦ Leverage the DriveCam Performance Monitoring System in order to achieve collisions and
risky driving reductions ♦ Achieve vehicle cleanliness goals
2012
Actual 2013
Actual 2014
Estimate 2015
Budget Vehicle Miles (III, IV) 9,147,207 9,080,755 9,500,000 9,550,000Preventable Collisions per 100,000 miles (I, II, III, IV, VI, VII)
0.96 1.37 1.76 0.91
Collision Accidents per 100,000 miles (I, II, III, IV, VI, VII)
3.73 4.55 5.50 3.00
Miles Between Service Interruptions (I, II, III, IV, V, VI, VII)
4,615 4,683 5,200 8,000
Absence Rate (II, III, IV, V, VI, VII) 5.69% 6.06% 6.06% 4.50% 2014 Highlights
♦ Developed and Hired the Assistant Equipment Manager – Quality Assurance for Hayden and Rail Districts
♦ Completed the asset validation for 100% of Hayden Assets in compliance with MAP -21 requirements
♦ Implemented the DriveCam Performance Monitoring System ♦ Assisted in the vendor selection and procurement of the CNG Compression Station at Hayden ♦ Achieved the performance metric of less than 14 days between major interior cleans ♦ Implemented employee stress reduction strategy including modernizing the District’s quiet and
game rooms ♦ Conducted “new operator” ride along program in efforts to reduce collision by new operators ♦ Continued the exterior refresh of HealthLine RTVs ♦ Vital Few Objective (VFO) - Completed RFP for Predictive Maintenance consultant ♦ Implemented HASTUS Bid Dispatch at the District

Operations Division
134 FY2015
Below are budget and staffing highlights of the Hayden District Department
Obj. Class
Description 2012 Actual 2013 Actual 2014 Projection
2015 Budget
501100 Operator Labor 22,385,561.27 23,321,576.12 23,446,354.69 24,395,000.00 501110 Overtime – Bus Operators 1,542,919.09 1,909,191.53 2,743,791.81 1,300,000.00 501200 Hourly Employees Payroll 5,097,737.70 5,534,442.27 5,566,745.74 5,249,425.68 501210 Overtime – Hourly Employees 718,228.42 571,011.93 653,447.28 350,000.00 501300 Labor – Salaried Employees 1,028,657.06 945,322.07 1,146,872.25 1,228,578.92 501310 Overtime – Salaried Employees 95,022.63 110,375.20 145,632.13 80,000.00 502000 Fringe Benefits 10,957,884.38 11,501,995.84 12,148,362.56 11,780,222.11 502071 W.C. – Injuries & Damages 9,490.66 6,278.23 7,716.04 0.00 503000 Services 12,681.17 38,792.43 33,546.00 267,000.00 504000 Materials & Supplies 89,106.13 83,386.47 106,681.47 105,320.00 509000 Miscellaneous Expenses 1,663.08 3,258.38 3,064.63 14,045.00 509022 Meals & Concessions 0.00 0.00 0.00 0.00 512000 Leases & Rentals 0.00 0.00 0.00 1,000.00
Total: 41,938,951.59 44,025,630.47 46,002,214.60 44,770,591.71
Grade Job Name 2012 2013 2014 2015 01 0141 Janitor 4.0 4.0 4.0 4.0 1676 Mobile Clean Ambassador 0.0 0.0 0.0 1.0 1677 Mobile Clean Ambassador PT 0.0 0.0 0.0 1.502 0203 Clerk/Typist 1.0 1.0 1.0 1.003 0347 Hostler 22.0 22.0 21.0 21.0 0348 Hostler PT 11.0 11.0 11.0 11.0 0358 Maintenance Helper 1.0 1.0 1.0 1.004 0437 Operator 425.0 426.0 434.0 428.0 0438 Operator PT 64.0 63.0 62.0 61.0 0442 Equipment Servicer 6.0 6.0 12.0 13.0 0446 Body Mechanic 2.0 2.0 2.0 2.0 0447 Equipment Maintainer 36.0 35.0 29.0 29.0 0458 Maintainer 3.0 3.0 3.0 3.0 0485 Mat Handler/Stock Clerk 3.0 4.0 3.0 3.005 0535 Heating/AC Mechanic 5.0 4.0 4.0 4.0 0543 Equipment Electrician 2.0 2.0 2.0 2.0 0547 Equipment Repair Leader 7.0 7.0 7.0 7.0 0548 Maintenance Technician 1.0 1.0 1.0 1.0 0549 Maintenance Leader 1.0 1.0 1.0 1.0 0577 Dispatcher 5.0 5.0 5.0 5.0 0588 Material Handler Leader 1.0 1.0 1.0 1.006 0646 Crew Chief 1.0 2.0 2.0 2.0 0647 Asst Supervisor Equip 4.0 4.0 4.0 4.025 1085 District Business Analyst 1.0 1.0 1.0 1.027 1705 Assistant Equipment Manager 0.0 0.0 2.0 2.028 0761 Manager Facilities 1.0 1.0 1.0 1.0 0851 Manager Equipment 1.0 1.0 1.0 1.029 0786 Manager Transportation 1.0 1.0 1.0 1.030 0777 District Director 1.0 1.0 1.0 1.0
Total 610.0 609.0 616.0 612.5
Operations Division
135 FY2015

Operations Division
136 FY2015
Mission Statement The mission of the Triskett District is to provide safe, reliable, clean, and courteous public transportation throughout the GCRTA service area.
2015 OPERATING BUDGET SUMMARY Department 49 – Triskett District
CATHERINE EATON, DISTRICT DIRECTOR Department Priorities for 2015
♦ Continue to instill a Safety Culture orientation within all Operations Division organizational units.
♦ Support participation in TransitStat program to reduce costs and improve the Authority’s business practices and services.
♦ Implement the MAP-21 Safety and State of Good Repair standards.
♦ Continue to aggressively enforce energy conservation and sustainability initiatives. ♦ Continue monitoring of Drive Cam Events. ♦ Continue priority focus on improving customer communications and service delivery. ♦ Support the Operations Division initiatives and projects as assigned. ♦ Complete the outside bus storage project.
2012
Actual 2013
Actual 2014
Estimate 2015
Budget Vehicle Miles (III, IV) 6,144,000 6,572,478 6,595,058 7,276,200Preventable Collisions per 100,000 miles (I, II, III, IV, VI, VII) 0.93 1.19 1.0 0.91Collision Accidents per 100,000 miles (I, II, III, IV, VI, VII) 3.00 2.92 3.0 2.9Miles Between Service Interruptions (I, II, III, IV, VI, VII) 8,500 6,727 8,500 8,500Absence Rate (II, IV, VI, VII) 4.50% 4.8% 5.0% 4,8% 2014 Highlights
♦ Aggressively work with operators to reduce collisions and on the job injury. ♦ Monitor Drive Cam events and aggressively work with operators to reduce the frequency
of events caused by risky behavior. ♦ Continue Safe driving competition: a TEAM-based incentive program offering a reward to
members of the team with the lowest number of accidents. ♦ Reduced vehicle tows by evaluating each tow and road call as not to duplicate towing ♦ Achieve vehicle cleanliness goals of less than 14 days between interior washes. ♦ PM Compliance of 90% or higher ♦ Maintain and ensure on time service for the new CSU line. ♦ Effectively Manage Overtime to cover staffing deficiency ♦ Upgrade the operator’s quite room ♦ Continue vehicle cleanliness goals ♦ Continue Trolley rehabilitation ♦ Nabi exterior rehabilitation ♦ Support the RTA Mission, Vision, Values

Operations Division
137 FY2015
Below are budget and staffing highlights of the Triskett District Department
Obj. Class
Description 2012 Actual 2013 Actual 2014 Projection
2015 Budget
501100 Operator Labor 15,115,932.70 15,758,332.95 15,740,008.01 16,500,000.00 501110 Overtime – Bus Operators 1,114,646.83 1,292,303.43 1,385,167.87 1,000,000.00 501200 Hourly Employees Payroll 3,863,314.36 4,031,581.65 4,117,964.17 4,253,316.42 501210 Overtime – Hourly Employees 570,466.15 422,135.70 497,414.01 300,000.00 501300 Labor – Salaried Employees 1,018,041.03 1,089,049.88 1,087,220.49 1,082,109.58 501310 Overtime – Salaried Employees 125,178.75 171,016.61 120,763.18 55,000.00 502000 Fringe Benefits 7,691,134.38 8,083,237.19 8,374,165.15 8,400,748.04 502071 W.C. – Injuries & Damages 6,880.17 2,796.18 3,518.74 0.00 503000 Services 34,276.85 22,080.13 39,771.59 70,600.00 503049 Temporary Help 0.00 11,600.00 (3,052.49) 0.00 504000 Materials & Supplies 64,735.78 87,295.74 76,362.80 73,400.00 509000 Miscellaneous Expenses 1,739.79 1,712.79 2,202.73 13,575.00 512000 Leases & Rentals 325.00 0.00 0.00 1,500.00
Total: 29,606,671.79 30,973,142.25 31,441,506.26 31,750,249.04
Grade Job Name 2012 2013 2014 2015 01 0141 Janitor 4.0 4.0 4.0 4.003 0347 Hostler 17.0 17.0 17.0 17.0 0348 Hostler PT 12.0 13.0 13.0 13.0 0358 Maintenance Helper 1.0 1.0 1.0 1.004 0404 Administrative Assistant 1.0 1.0 1.0 1.0 0437 Operator 275.0 276.0 293.0 290.0 0438 Operator PT 44.0 45.0 43.0 41.0 0442 Equipment Servicer 3.0 3.0 4.0 4.0 0446 Body Mechanic 1.0 1.0 1.0 1.0 0447 Equipment Maintainer 24.0 26.0 25.0 25.0 0458 Maintainer 3.0 3.0 3.0 3.0 0485 Mat Handler/Stock Clerk 3.0 3.0 3.0 3.005 0535 Heating/AC Mechanic 4.0 4.0 4.0 4.0 0543 Equipment Electrician 1.0 1.0 1.0 1.0 0547 Equipment Repair Leader 6.0 6.0 6.0 6.0 0548 Maintenance Technician 2.0 2.0 2.0 2.0 0549 Maintenance Leader 1.0 1.0 1.0 1.0 0577 Dispatcher 5.0 5.0 5.0 5.0 0588 Material Handler Leader 1.0 1.0 1.0 1.006 0646 Crew Chief 1.0 1.0 1.0 1.0 0647 Asst Supervisor Equip 4.0 4.0 4.0 4.025 1085 District Business Analyst 1.0 1.0 1.0 1.028 0761 Manager Facilities 1.0 1.0 1.0 1.0 0851 Manager Equipment 1.0 1.0 1.0 1.029 0786 Manager Transportation 1.0 1.0 1.0 1.030 0777 District Director 1.0 1.0 1.0 1.0
Total 419.0 423.0 438.0 433.0

Operations Division
138 FY2015


