2015 Cornell PULSE
109
Institutional Research and Planning 440 Day Hall Ithaca, New York 14853 2015 Cornell PULSE The Cornell PULSE (Perceptions of Undergraduate Life and Student Experiences) Survey asks currently enrolled undergraduate students about their involvement in various academic and extracurricular activities, their interactions with faculty and students, and their perceptions of their undergraduate experience. The 2015 Cornell PULSE was administered via the web in spring 2015. Of the 13,780 undergraduate students invited to complete the survey, a total of 4,892 students responded, yielding a 36% response rate. The results of the 2015 Cornell PULSE are displayed in the tables that follow. It may be most useful to refer to the survey instrument first in order to locate questions of interest. On the first line of each table, the responses for the applicable question on the survey are presented for Cornell undergraduate students as a whole. The responses of Cornell undergraduates are compared to the survey results of students from two different comparison groups: “Other Ivies” (the seven other Ivy League universities) and “Non- Ivies” (thirteen non-Ivy research universities). In order to highlight differences within Cornell, frequencies are also presented by class year, sex, race/citizenship, and undergraduate college.
Transcript of 2015 Cornell PULSE
Institutional Research and Planning 440 Day Hall Ithaca, New York 14853
2015 Cornell PULSE The Cornell PULSE (Perceptions of Undergraduate Life and Student Experiences) Survey asks currently enrolled undergraduate students about their involvement in various academic and extracurricular activities, their interactions with faculty and students, and their perceptions of their undergraduate experience. The 2015 Cornell PULSE was administered via the web in spring 2015. Of the 13,780 undergraduate students invited to complete the survey, a total of 4,892 students responded, yielding a 36% response rate. The results of the 2015 Cornell PULSE are displayed in the tables that follow. It may be most useful to refer to the survey instrument first in order to locate questions of interest. On the first line of each table, the responses for the applicable question on the survey are presented for Cornell undergraduate students as a whole. The responses of Cornell undergraduates are compared to the survey results of students from two different comparison groups: “Other Ivies” (the seven other Ivy League universities) and “Non-Ivies” (thirteen non-Ivy research universities). In order to highlight differences within Cornell, frequencies are also presented by class year, sex, race/citizenship, and undergraduate college.

2015 PULSE Survey Cornell University
Institutional Research and Planning Page 1
Very Dissatisfied
Generally Dissatisfied Ambivalent
Generally Satisfied Very Satisfied Total
Row % Row % Row % Row % Row % CountCornell .9% 4.0% 12.8% 58.3% 24.0% 4,869Other Ivies .8% 3.6% 10.0% 54.1% 31.4% 14,745Non-Ivies .9% 4.2% 10.8% 55.3% 28.8% 20,638First year .7% 3.7% 13.6% 57.5% 24.4% 1,309Sophomore .8% 4.2% 13.3% 61.7% 20.0% 1,140Junior 1.2% 4.5% 13.0% 58.1% 23.2% 1,245Senior .9% 3.6% 11.2% 56.0% 28.3% 1,175Male 1.1% 4.3% 13.7% 56.2% 24.7% 1,992Female .7% 3.8% 12.1% 59.8% 23.6% 2,856American Indian (U.S.) 0.0% 0.0% 5.9% 82.4% 11.8% 17Asian (U.S.) 1.1% 4.1% 15.3% 64.0% 15.3% 1,062Black (U.S.) 1.3% 6.7% 17.5% 51.6% 22.9% 223Hispanic (U.S.) .8% 4.9% 13.7% 55.8% 24.8% 532White (U.S.) .6% 3.7% 10.2% 56.5% 28.9% 2,316Multiracial URM (U.S.) .7% 3.3% 15.7% 55.6% 24.8% 153Multiracial non-URM (U.S.) .6% 4.5% 12.3% 59.7% 22.7% 154Unknown (U.S.) 5.2% 6.9% 17.2% 50.0% 20.7% 58International (any race/ethnicity) 1.1% 2.5% 16.4% 61.0% 18.9% 354Agriculture & Life Sciences .4% 4.5% 11.9% 54.8% 28.4% 1,113Art, Architecture, & Planning 0.0% 5.2% 10.4% 61.7% 22.6% 115Arts & Sciences 1.4% 4.4% 13.8% 58.8% 21.7% 1,490Engineering 1.2% 3.0% 14.3% 60.8% 20.7% 1,157Hotel Administration .4% 2.2% 8.2% 61.5% 27.7% 231Human Ecology .2% 4.7% 12.0% 59.8% 23.3% 443Industrial & Labor Relations .3% 4.1% 11.9% 53.1% 30.6% 320
Cornell, by College**
** p<.01, * p<.05 (based on chi-square)
Overall, how satisfied have you been with your undergraduate education so far?
Cornell and Peers**
Cornell, by Class Year**
Cornell, by Sex
Cornell, by Race/citizenship**
2015 PULSE Survey Cornell University
Institutional Research and Planning Page 2
Very Dissatisfied
Generally Dissatisfied
Generally Satisfied Very Satisfied Total
Row % Row % Row % Row % CountCornell 1.1% 7.8% 67.5% 23.6% 4,872Other Ivies .9% 6.6% 62.0% 30.4% 14,702Non-Ivies 1.2% 8.1% 63.3% 27.5% 20,556First year .9% 8.2% 68.7% 22.2% 1,306Sophomore .6% 9.4% 69.4% 20.6% 1,144Junior 1.6% 7.6% 67.4% 23.4% 1,244Senior 1.1% 6.2% 64.4% 28.3% 1,178Male 1.4% 8.2% 65.1% 25.3% 1,995Female .8% 7.6% 69.2% 22.4% 2,856American Indian (U.S.) 5.9% 11.8% 70.6% 11.8% 17Asian (U.S.) 1.3% 9.3% 73.0% 16.4% 1,066Black (U.S.) 1.8% 7.6% 67.7% 22.9% 223Hispanic (U.S.) 1.5% 8.9% 64.2% 25.4% 531White (U.S.) .6% 6.9% 65.9% 26.6% 2,314Multiracial URM (U.S.) .7% 7.8% 65.4% 26.1% 153Multiracial non-URM (U.S.) 1.3% 7.1% 72.1% 19.5% 154Unknown (U.S.) 5.2% 17.2% 56.9% 20.7% 58International (any race/ethnicity) 1.1% 7.0% 66.6% 25.3% 356Agriculture & Life Sciences .9% 8.2% 66.5% 24.4% 1,115Art, Architecture, & Planning .9% 7.8% 66.1% 25.2% 115Arts & Sciences 1.1% 7.3% 66.8% 24.7% 1,493Engineering 1.1% 9.9% 69.7% 19.2% 1,157Hotel Administration .9% 3.5% 61.3% 34.3% 230Human Ecology 1.6% 7.7% 69.0% 21.7% 442Industrial & Labor Relations .6% 5.0% 68.4% 25.9% 320
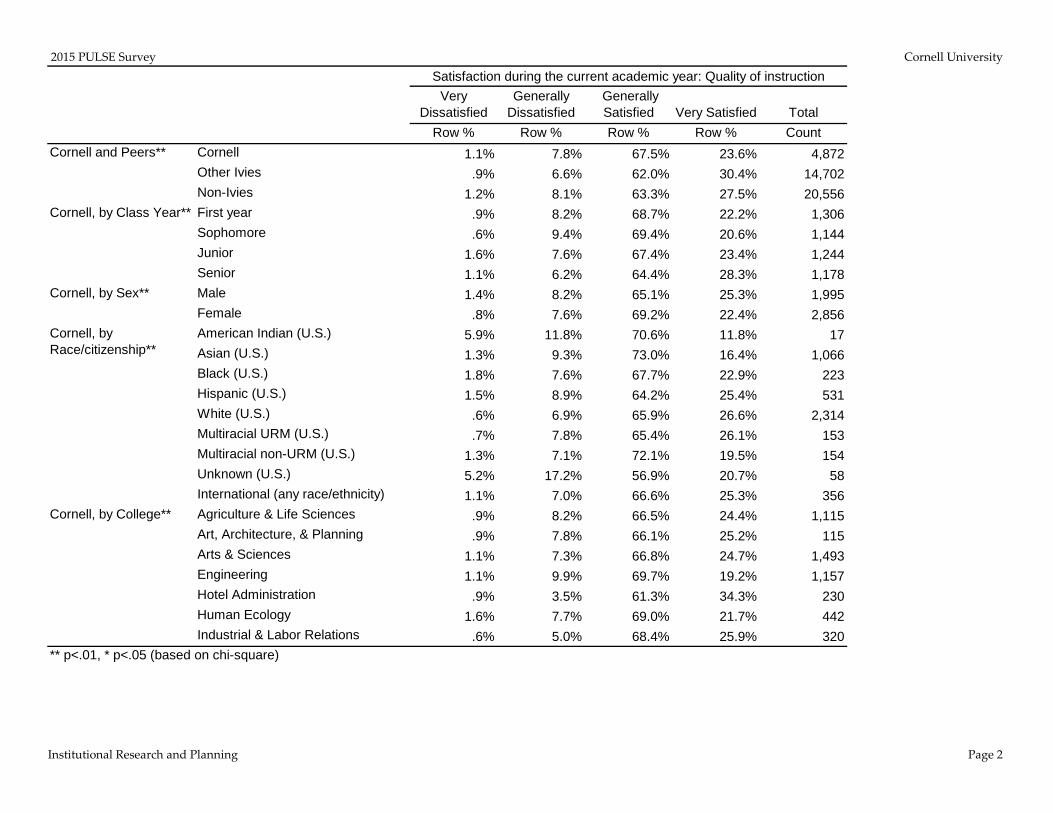
Satisfaction during the current academic year: Quality of instruction
Cornell and Peers**
Cornell, by Class Year**
Cornell, by Sex**
Cornell, by Race/citizenship**
Cornell, by College**
** p<.01, * p<.05 (based on chi-square)

2015 PULSE Survey Cornell University
Institutional Research and Planning Page 3
Very Dissatisfied
Generally Dissatisfied
Generally Satisfied Very Satisfied Total
Row % Row % Row % Row % CountCornell 1.5% 12.0% 64.0% 22.4% 4,862Other Ivies 1.2% 10.4% 59.5% 28.9% 14,670Non-Ivies 1.4% 11.6% 60.0% 27.0% 20,510First year 1.7% 11.8% 65.2% 21.3% 1,304Sophomore 1.2% 12.7% 66.6% 19.5% 1,141Junior 2.2% 12.3% 62.2% 23.3% 1,240Senior 0.9% 11.2% 62.3% 25.6% 1,177Male 2.0% 13.5% 62.1% 22.4% 1,991Female 1.2% 10.9% 65.5% 22.4% 2,850American Indian (U.S.) 5.9% 17.6% 58.8% 17.6% 17Asian (U.S.) 1.3% 14.2% 68.3% 16.2% 1,065Black (U.S.) 1.4% 9.0% 64.9% 24.8% 222Hispanic (U.S.) 1.9% 10.9% 60.9% 26.2% 530White (U.S.) 1.3% 11.5% 62.9% 24.3% 2,309Multiracial URM (U.S.) 1.3% 7.9% 67.1% 23.7% 152Multiracial non-URM (U.S.) 2.6% 16.2% 64.9% 16.2% 154Unknown (U.S.) 8.6% 19.0% 56.9% 15.5% 58International (any race/ethnicity) 1.4% 11.0% 62.8% 24.8% 355Agriculture & Life Sciences 1.3% 11.1% 65.3% 22.3% 1,113Art, Architecture, & Planning 1.7% 10.4% 56.5% 31.3% 115Arts & Sciences 1.7% 10.1% 63.6% 24.7% 1,491Engineering 2.3% 16.2% 66.1% 15.4% 1,153Hotel Administration .4% 6.1% 54.3% 39.1% 230Human Ecology 0.5% 15.6% 66.1% 17.9% 442Industrial & Labor Relations .9% 9.1% 61.3% 28.6% 318
Cornell, by Sex**
Cornell, by Race/citizenship**
Cornell, by College**
** p<.01, * p<.05 (based on chi-square)
Satisfaction during the current academic year: Opportunities for class discussion
Cornell and Peers**
Cornell, by Class Year*

2015 PULSE Survey Cornell University
Institutional Research and Planning Page 4
Very Dissatisfied
Generally Dissatisfied
Generally Satisfied Very Satisfied Total
Row % Row % Row % Row % CountCornell 7.7% 25.6% 46.6% 20.2% 4,844Other Ivies 7.9% 26.9% 46.1% 19.1% 14,636Non-Ivies 6.4% 22.2% 48.1% 23.2% 20,497First year 6.8% 24.7% 48.8% 19.7% 1,302Sophomore 7.2% 26.1% 47.0% 19.8% 1,132Junior 8.5% 26.4% 44.7% 20.4% 1,237Senior 8.3% 25.1% 45.8% 20.8% 1,173Male 7.6% 25.3% 46.6% 20.6% 1,983Female 7.7% 25.7% 46.6% 19.9% 2,841American Indian (U.S.) 5.9% 47.1% 41.2% 5.9% 17Asian (U.S.) 5.4% 26.0% 52.7% 15.9% 1,062Black (U.S.) 7.3% 18.6% 50.0% 24.1% 220Hispanic (U.S.) 10.3% 24.6% 39.1% 26.0% 524White (U.S.) 8.4% 26.1% 44.7% 20.8% 2,303Multiracial URM (U.S.) 7.2% 26.3% 44.1% 22.4% 152Multiracial non-URM (U.S.) 8.6% 28.3% 46.1% 17.1% 152Unknown (U.S.) 15.5% 22.4% 48.3% 13.8% 58International (any race/ethnicity) 5.1% 24.7% 50.6% 19.7% 356Agriculture & Life Sciences 7.0% 21.5% 42.8% 28.6% 1,110Art, Architecture, & Planning 10.4% 36.5% 42.6% 10.4% 115Arts & Sciences 9.3% 27.2% 47.0% 16.5% 1,484Engineering 4.8% 24.1% 52.9% 18.1% 1,147Hotel Administration 7.0% 27.8% 41.3% 23.9% 230Human Ecology 10.5% 33.2% 41.4% 15.0% 440Industrial & Labor Relations 8.5% 21.1% 47.5% 23.0% 318
Satisfaction during the current academic year: Academic advising
Cornell and Peers**
Cornell, by Class Year
Cornell, by Sex
Cornell, by Race/citizenship**
Cornell, by College**
** p<.01, * p<.05 (based on chi-square)

2015 PULSE Survey Cornell University
Institutional Research and Planning Page 5
Very Dissatisfied
Generally Dissatisfied
Generally Satisfied Very Satisfied Total
Row % Row % Row % Row % CountCornell 10.8% 30.3% 47.6% 11.4% 4,832Other Ivies 12.7% 29.9% 45.7% 11.7% 14,573Non-Ivies 11.0% 28.5% 47.9% 12.5% 20,399First year 7.9% 28.3% 50.9% 12.8% 1,296Sophomore 10.9% 32.2% 47.2% 9.7% 1,135Junior 13.8% 30.9% 43.2% 12.1% 1,235Senior 10.5% 29.9% 48.9% 10.7% 1,166Male 13.1% 30.0% 45.2% 11.7% 1,982Female 9.0% 30.4% 49.4% 11.2% 2,830American Indian (U.S.) 5.9% 47.1% 47.1% 0.0% 17Asian (U.S.) 8.3% 32.2% 49.8% 9.8% 1,053Black (U.S.) 11.8% 30.8% 48.4% 9.0% 221Hispanic (U.S.) 11.9% 27.8% 46.0% 14.2% 528White (U.S.) 11.7% 31.0% 46.7% 10.5% 2,295Multiracial URM (U.S.) 11.2% 27.6% 48.0% 13.2% 152Multiracial non-URM (U.S.) 14.4% 35.9% 39.2% 10.5% 153Unknown (U.S.) 20.7% 29.3% 39.7% 10.3% 58International (any race/ethnicity) 6.5% 20.8% 53.5% 19.2% 355Agriculture & Life Sciences 10.0% 24.8% 50.1% 15.1% 1,109Art, Architecture, & Planning 11.4% 31.6% 50.0% 7.0% 114Arts & Sciences 11.7% 33.9% 45.5% 8.9% 1,476Engineering 9.5% 31.2% 49.0% 10.4% 1,146Hotel Administration 9.2% 25.3% 48.5% 17.0% 229Human Ecology 10.9% 30.1% 49.5% 9.5% 442Industrial & Labor Relations 14.2% 32.3% 39.6% 13.9% 316
Cornell, by Race/citizenship**
Satisfaction during the current academic year: Administration's responsiveness to student concerns
Cornell and Peers**
Cornell, by Class Year**
Cornell, by Sex**
Cornell, by College**
** p<.01, * p<.05 (based on chi-square)
2015 PULSE Survey Cornell University
Institutional Research and Planning Page 6
Very Dissatisfied
Generally Dissatisfied
Generally Satisfied Very Satisfied Total
Row % Row % Row % Row % CountCornell 4.1% 14.1% 54.9% 27.0% 4,860Other Ivies 4.8% 15.7% 50.6% 28.9% 14,670Non-Ivies 6.0% 17.7% 51.4% 24.9% 20,515First year 3.7% 12.1% 51.8% 32.4% 1,302Sophomore 2.8% 13.9% 58.0% 25.4% 1,140Junior 5.3% 15.1% 54.7% 24.9% 1,243Senior 4.5% 15.4% 55.4% 24.7% 1,175Male 5.6% 15.7% 54.2% 24.5% 1,990Female 3.0% 12.9% 55.4% 28.7% 2,849American Indian (U.S.) 0.0% 11.8% 58.8% 29.4% 17Asian (U.S.) 3.4% 11.7% 62.3% 22.6% 1,064Black (U.S.) 7.2% 17.6% 50.7% 24.4% 221Hispanic (U.S.) 5.8% 13.2% 52.4% 28.6% 532White (U.S.) 3.7% 13.8% 52.1% 30.4% 2,308Multiracial URM (U.S.) 7.2% 11.8% 57.2% 23.7% 152Multiracial non-URM (U.S.) 2.6% 13.7% 53.6% 30.1% 153Unknown (U.S.) 6.9% 31.0% 43.1% 19.0% 58International (any race/ethnicity) 3.4% 20.3% 58.3% 18.0% 355Agriculture & Life Sciences 4.0% 14.3% 52.9% 28.8% 1,113Art, Architecture, & Planning 4.3% 14.8% 56.5% 24.3% 115Arts & Sciences 4.6% 13.7% 56.2% 25.4% 1,486Engineering 3.5% 13.3% 56.1% 27.1% 1,157Hotel Administration 3.9% 18.3% 49.8% 27.9% 229Human Ecology 3.4% 14.9% 56.8% 24.9% 442Industrial & Labor Relations 5.3% 13.2% 51.6% 29.9% 318
Cornell, by College
** p<.01, * p<.05 (based on chi-square)
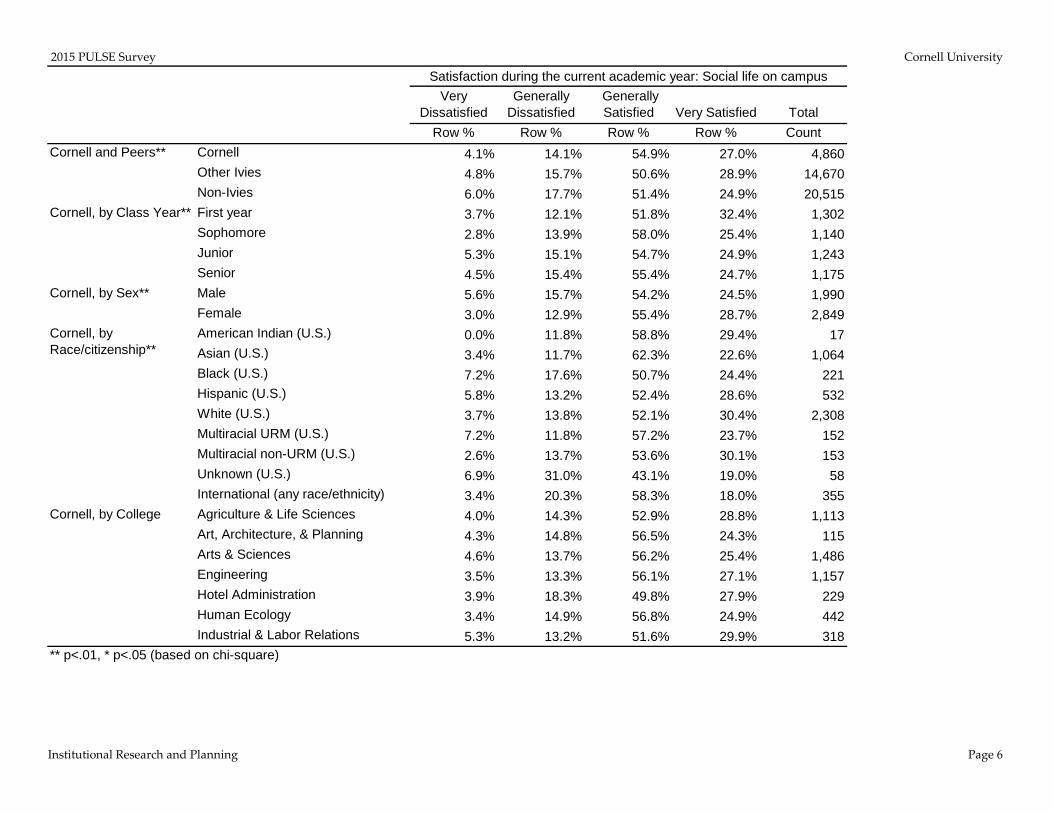
Satisfaction during the current academic year: Social life on campus
Cornell and Peers**
Cornell, by Class Year**
Cornell, by Sex**
Cornell, by Race/citizenship**
2015 PULSE Survey Cornell University
Institutional Research and Planning Page 7
Very Dissatisfied
Generally Dissatisfied
Generally Satisfied Very Satisfied Total
Row % Row % Row % Row % CountCornell 5.7% 20.7% 52.3% 21.3% 4,856Other Ivies 6.7% 21.0% 44.7% 27.6% 14,659Non-Ivies 7.2% 22.9% 46.4% 23.4% 20,493First year 4.2% 17.2% 51.5% 27.2% 1,300Sophomore 5.9% 21.1% 52.9% 20.1% 1,141Junior 7.3% 21.4% 52.5% 18.9% 1,240Senior 5.5% 23.4% 52.5% 18.6% 1,175Male 7.5% 22.9% 50.2% 19.4% 1,988Female 4.4% 19.1% 53.8% 22.7% 2,847American Indian (U.S.) 5.9% 23.5% 41.2% 29.4% 17Asian (U.S.) 4.0% 19.5% 58.3% 18.1% 1,064Black (U.S.) 9.5% 28.4% 44.6% 17.6% 222Hispanic (U.S.) 6.6% 21.0% 48.8% 23.6% 529White (U.S.) 5.8% 20.3% 50.4% 23.5% 2,305Multiracial URM (U.S.) 3.3% 20.4% 59.9% 16.4% 152Multiracial non-URM (U.S.) 6.5% 20.8% 51.9% 20.8% 154Unknown (U.S.) 12.1% 22.4% 46.6% 19.0% 58International (any race/ethnicity) 5.9% 20.8% 55.5% 17.7% 355Agriculture & Life Sciences 5.8% 19.2% 51.5% 23.5% 1,112Art, Architecture, & Planning 5.3% 18.4% 53.5% 22.8% 114Arts & Sciences 6.9% 22.3% 52.9% 18.0% 1,487Engineering 4.0% 19.4% 53.4% 23.2% 1,153Hotel Administration 6.1% 22.2% 52.6% 19.1% 230Human Ecology 5.4% 21.2% 53.5% 19.9% 443Industrial & Labor Relations 6.0% 22.4% 46.1% 25.6% 317
Cornell, by College*
** p<.01, * p<.05 (based on chi-square)
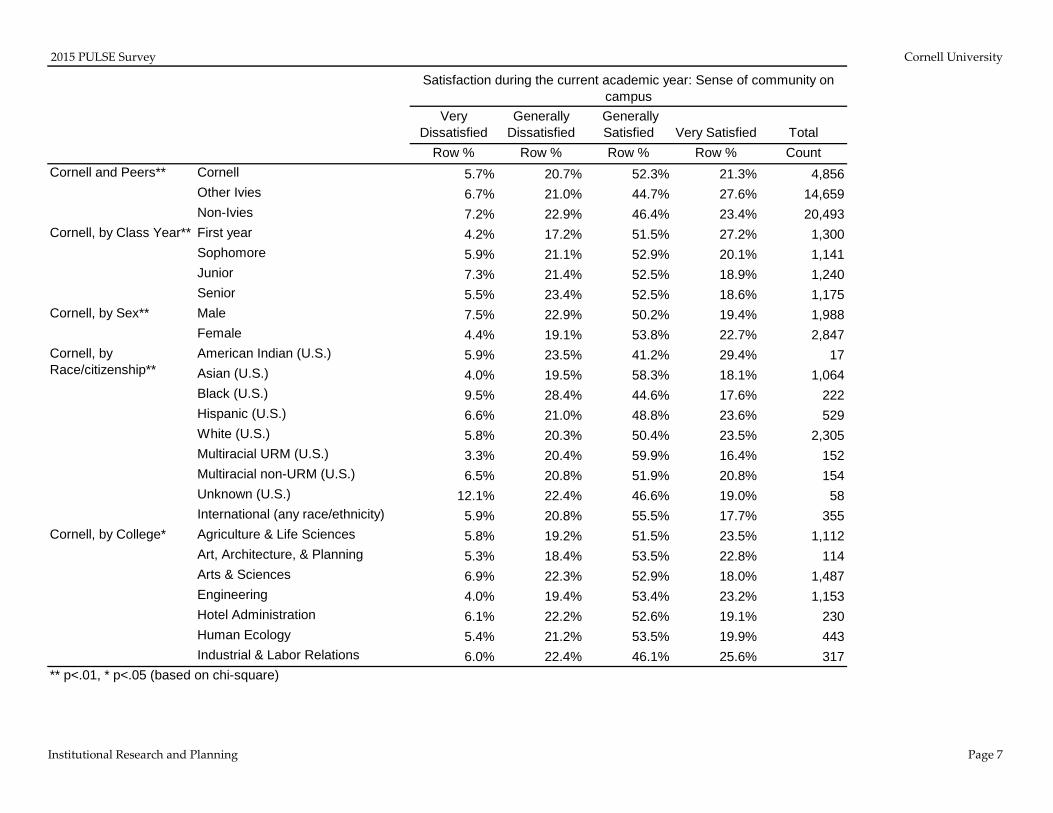
Satisfaction during the current academic year: Sense of community on campus
Cornell and Peers**
Cornell, by Class Year**
Cornell, by Sex**
Cornell, by Race/citizenship**

2015 PULSE Survey Cornell University
Institutional Research and Planning Page 8
Very Dissatisfied
Generally Dissatisfied
Generally Satisfied Very Satisfied Total
Row % Row % Row % Row % CountCornell 5.4% 16.8% 46.8% 31.0% 4,853Other Ivies 6.2% 18.0% 40.2% 35.7% 14,658Non-Ivies 6.4% 18.9% 41.2% 33.5% 20,461First year 6.3% 16.7% 44.3% 32.8% 1,303Sophomore 6.2% 16.7% 47.1% 30.1% 1,141Junior 5.2% 16.4% 47.4% 31.0% 1,236Senior 3.9% 17.4% 48.7% 30.0% 1,173Male 5.9% 17.2% 45.8% 31.2% 1,992Female 5.0% 16.6% 47.4% 31.0% 2,841American Indian (U.S.) 5.9% 29.4% 35.3% 29.4% 17Asian (U.S.) 5.0% 18.6% 54.2% 22.3% 1,065Black (U.S.) 7.7% 17.6% 45.0% 29.7% 222Hispanic (U.S.) 5.5% 17.5% 40.9% 36.0% 530White (U.S.) 5.0% 15.0% 44.2% 35.7% 2,303Multiracial URM (U.S.) 4.6% 16.4% 47.4% 31.6% 152Multiracial non-URM (U.S.) 7.2% 15.7% 47.7% 29.4% 153Unknown (U.S.) 16.1% 19.6% 44.6% 19.6% 56International (any race/ethnicity) 5.6% 20.6% 51.5% 22.3% 355Agriculture & Life Sciences 4.6% 15.3% 47.0% 33.1% 1,108Art, Architecture, & Planning 6.1% 21.7% 33.0% 39.1% 115Arts & Sciences 6.4% 16.2% 47.9% 29.5% 1,488Engineering 4.8% 16.8% 48.1% 30.4% 1,155Hotel Administration 7.0% 20.4% 42.2% 30.4% 230Human Ecology 4.8% 17.3% 47.0% 30.9% 440Industrial & Labor Relations 5.7% 19.6% 44.2% 30.6% 317
Cornell, by College
** p<.01, * p<.05 (based on chi-square)
Satisfaction during the current academic year: Sense of community where you live
Cornell and Peers**
Cornell, by Class Year
Cornell, by Sex
Cornell, by Race/citizenship**

2015 PULSE Survey Cornell University
Institutional Research and Planning Page 9
Definitely not Probably not Probably Definitely TotalRow % Row % Row % Row % Count
Cornell 2.2% 12.6% 39.8% 45.5% 4,877Other Ivies 2.0% 8.7% 32.9% 56.4% 14,749Non-Ivies 2.8% 12.3% 38.4% 46.5% 20,617First year 1.3% 11.0% 40.3% 47.4% 1,307Sophomore 2.7% 13.2% 41.5% 42.6% 1,145Junior 2.5% 13.4% 40.6% 43.5% 1,248Senior 2.3% 12.9% 36.6% 48.2% 1,177Male 2.9% 13.4% 39.8% 44.0% 1,997Female 1.6% 11.9% 39.8% 46.6% 2,859American Indian (U.S.) 0.0% 17.6% 41.2% 41.2% 17Asian (U.S.) 1.7% 12.5% 48.3% 37.6% 1,067Black (U.S.) 2.7% 19.3% 37.2% 40.8% 223Hispanic (U.S.) 3.2% 13.0% 36.1% 47.7% 532White (U.S.) 2.3% 11.1% 35.5% 51.2% 2,318Multiracial URM (U.S.) .7% 17.6% 47.1% 34.6% 153Multiracial non-URM (U.S.) 1.9% 14.9% 44.2% 39.0% 154Unknown (U.S.) 3.5% 24.6% 35.1% 36.8% 57International (any race/ethnicity) 1.7% 12.6% 45.2% 40.4% 356Agriculture & Life Sciences 1.9% 11.6% 37.6% 49.0% 1,115Art, Architecture, & Planning 2.6% 7.8% 42.2% 47.4% 116Arts & Sciences 2.9% 14.3% 42.4% 40.5% 1,494Engineering 1.6% 11.8% 41.4% 45.2% 1,160Hotel Administration 2.2% 11.3% 35.7% 50.9% 230Human Ecology 2.3% 14.0% 39.6% 44.1% 442Industrial & Labor Relations 1.6% 11.9% 31.9% 54.7% 320
Cornell, by College**
** p<.01, * p<.05 (based on chi-square)
If you could start all over again, would you go to Cornell/your institution?
Cornell and Peers**
Cornell, by Class Year*
Cornell, by Sex**
Cornell, by Race/citizenship**
2015 PULSE Survey Cornell University
Institutional Research and Planning Page 10
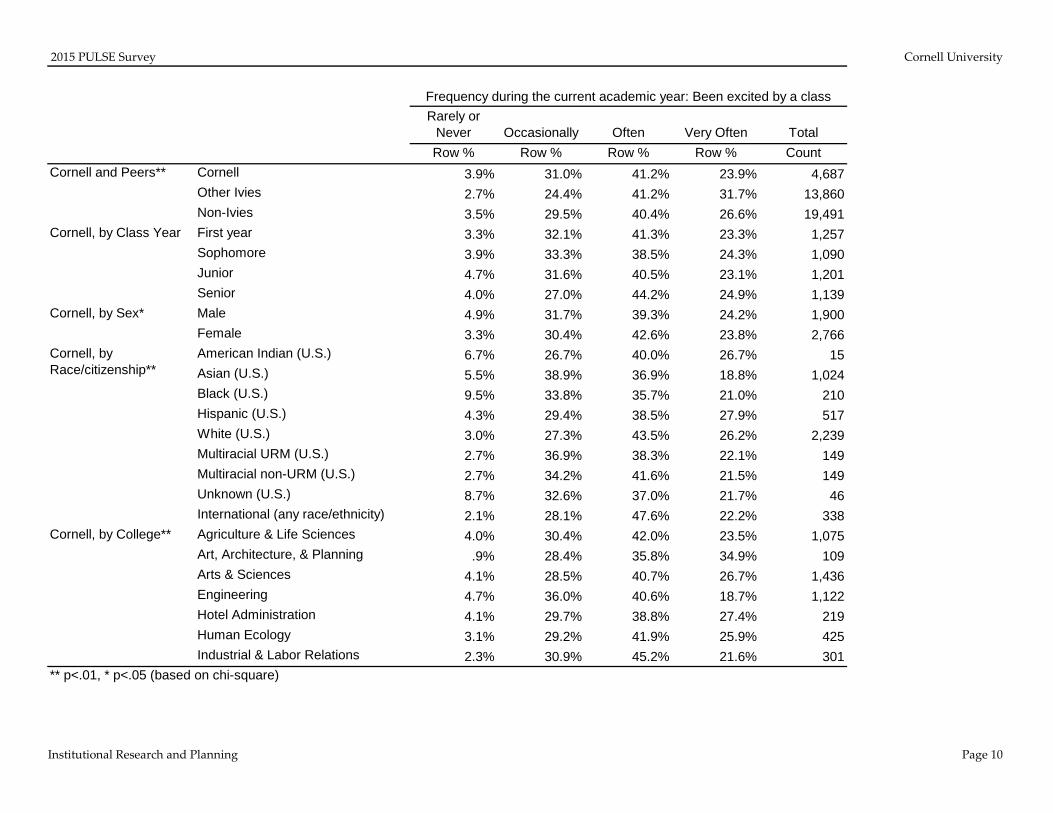
Rarely or Never Occasionally Often Very Often TotalRow % Row % Row % Row % Count
Cornell 3.9% 31.0% 41.2% 23.9% 4,687Other Ivies 2.7% 24.4% 41.2% 31.7% 13,860Non-Ivies 3.5% 29.5% 40.4% 26.6% 19,491First year 3.3% 32.1% 41.3% 23.3% 1,257Sophomore 3.9% 33.3% 38.5% 24.3% 1,090Junior 4.7% 31.6% 40.5% 23.1% 1,201Senior 4.0% 27.0% 44.2% 24.9% 1,139Male 4.9% 31.7% 39.3% 24.2% 1,900Female 3.3% 30.4% 42.6% 23.8% 2,766American Indian (U.S.) 6.7% 26.7% 40.0% 26.7% 15Asian (U.S.) 5.5% 38.9% 36.9% 18.8% 1,024Black (U.S.) 9.5% 33.8% 35.7% 21.0% 210Hispanic (U.S.) 4.3% 29.4% 38.5% 27.9% 517White (U.S.) 3.0% 27.3% 43.5% 26.2% 2,239Multiracial URM (U.S.) 2.7% 36.9% 38.3% 22.1% 149Multiracial non-URM (U.S.) 2.7% 34.2% 41.6% 21.5% 149Unknown (U.S.) 8.7% 32.6% 37.0% 21.7% 46International (any race/ethnicity) 2.1% 28.1% 47.6% 22.2% 338Agriculture & Life Sciences 4.0% 30.4% 42.0% 23.5% 1,075Art, Architecture, & Planning .9% 28.4% 35.8% 34.9% 109Arts & Sciences 4.1% 28.5% 40.7% 26.7% 1,436Engineering 4.7% 36.0% 40.6% 18.7% 1,122Hotel Administration 4.1% 29.7% 38.8% 27.4% 219Human Ecology 3.1% 29.2% 41.9% 25.9% 425Industrial & Labor Relations 2.3% 30.9% 45.2% 21.6% 301
** p<.01, * p<.05 (based on chi-square)
Frequency during the current academic year: Been excited by a class
Cornell and Peers**
Cornell, by Class Year
Cornell, by Sex*
Cornell, by Race/citizenship**
Cornell, by College**

2015 PULSE Survey Cornell University
Institutional Research and Planning Page 11
Never Occasionally Often Very Often TotalRow % Row % Row % Row % Count
Cornell 4.0% 27.4% 39.8% 28.8% 4,677Other Ivies 3.2% 22.6% 36.6% 37.6% 13,834Non-Ivies 4.3% 26.5% 35.7% 33.5% 19,464First year 2.8% 22.7% 46.0% 28.5% 1,253Sophomore 4.6% 31.0% 38.4% 26.1% 1,092Junior 5.3% 29.5% 37.4% 27.8% 1,196Senior 3.3% 26.8% 37.1% 32.7% 1,136Male 4.4% 27.8% 39.2% 28.6% 1,892Female 3.7% 27.2% 40.2% 28.9% 2,764American Indian (U.S.) 0.0% 20.0% 33.3% 46.7% 15Asian (U.S.) 6.0% 36.2% 37.7% 20.2% 1,022Black (U.S.) 6.2% 23.7% 40.3% 29.9% 211Hispanic (U.S.) 3.9% 25.1% 41.1% 29.9% 518White (U.S.) 3.5% 24.3% 39.3% 32.9% 2,231Multiracial URM (U.S.) 4.0% 28.0% 40.7% 27.3% 150Multiracial non-URM (U.S.) 2.7% 24.7% 50.7% 22.0% 150Unknown (U.S.) 2.2% 33.3% 46.7% 17.8% 45International (any race/ethnicity) 1.2% 27.5% 41.8% 29.6% 335Agriculture & Life Sciences 3.5% 26.5% 39.5% 30.6% 1,072Art, Architecture, & Planning 1.8% 13.6% 39.1% 45.5% 110Arts & Sciences 2.6% 22.4% 43.2% 31.8% 1,436Engineering 7.7% 37.3% 37.5% 17.5% 1,119Hotel Administration 1.9% 22.7% 38.4% 37.0% 216Human Ecology 3.5% 30.4% 36.5% 29.6% 425Industrial & Labor Relations 1.3% 22.1% 39.5% 37.1% 299
Cornell, by College**
** p<.01, * p<.05 (based on chi-square)
Frequency during the current academic year: Participated in class discussion
Cornell and Peers**
Cornell, by Class Year**
Cornell, by Sex
Cornell, by Race/citizenship**

2015 PULSE Survey Cornell University
Institutional Research and Planning Page 12
Rarely or Never Occasionally Often Very Often TotalRow % Row % Row % Row % Count
Cornell 12.0% 23.5% 32.6% 31.9% 4,681Other Ivies 21.0% 27.3% 26.5% 25.1% 13,828Non-Ivies 14.7% 25.3% 30.6% 29.4% 19,472First year 14.3% 26.2% 33.2% 26.3% 1,253Sophomore 12.2% 24.5% 31.7% 31.5% 1,088Junior 11.5% 22.2% 32.8% 33.6% 1,200Senior 9.6% 21.1% 32.7% 36.6% 1,140Male 12.6% 24.7% 33.5% 29.2% 1,896Female 11.5% 22.6% 32.1% 33.8% 2,765American Indian (U.S.) 20.0% 26.7% 13.3% 40.0% 15Asian (U.S.) 8.5% 22.0% 37.0% 32.4% 1,021Black (U.S.) 16.2% 22.4% 37.6% 23.8% 210Hispanic (U.S.) 13.0% 24.7% 30.1% 32.2% 515White (U.S.) 13.3% 22.9% 31.1% 32.8% 2,238Multiracial URM (U.S.) 12.1% 24.2% 31.5% 32.2% 149Multiracial non-URM (U.S.) 10.7% 28.2% 30.9% 30.2% 149Unknown (U.S.) 6.7% 33.3% 28.9% 31.1% 45International (any race/ethnicity) 10.3% 27.1% 33.0% 29.5% 339Agriculture & Life Sciences 7.0% 22.8% 34.5% 35.7% 1,073Art, Architecture, & Planning 6.4% 21.1% 26.6% 45.9% 109Arts & Sciences 20.3% 26.4% 28.1% 25.2% 1,434Engineering 3.8% 18.6% 38.3% 39.3% 1,121Hotel Administration 11.5% 27.5% 33.9% 27.1% 218Human Ecology 8.7% 18.1% 33.1% 40.1% 426Industrial & Labor Relations 27.3% 36.0% 27.0% 9.7% 300
Cornell and Peers**
Cornell, by Class Year**
Cornell, by Sex**
Cornell, by Race/citizenship**
Cornell, by College**
** p<.01, * p<.05 (based on chi-square)
Frequency during the current academic year: Participated in hands-on activities (lab work, experiments, project-based experiences)
2015 PULSE Survey Cornell University
Institutional Research and Planning Page 13
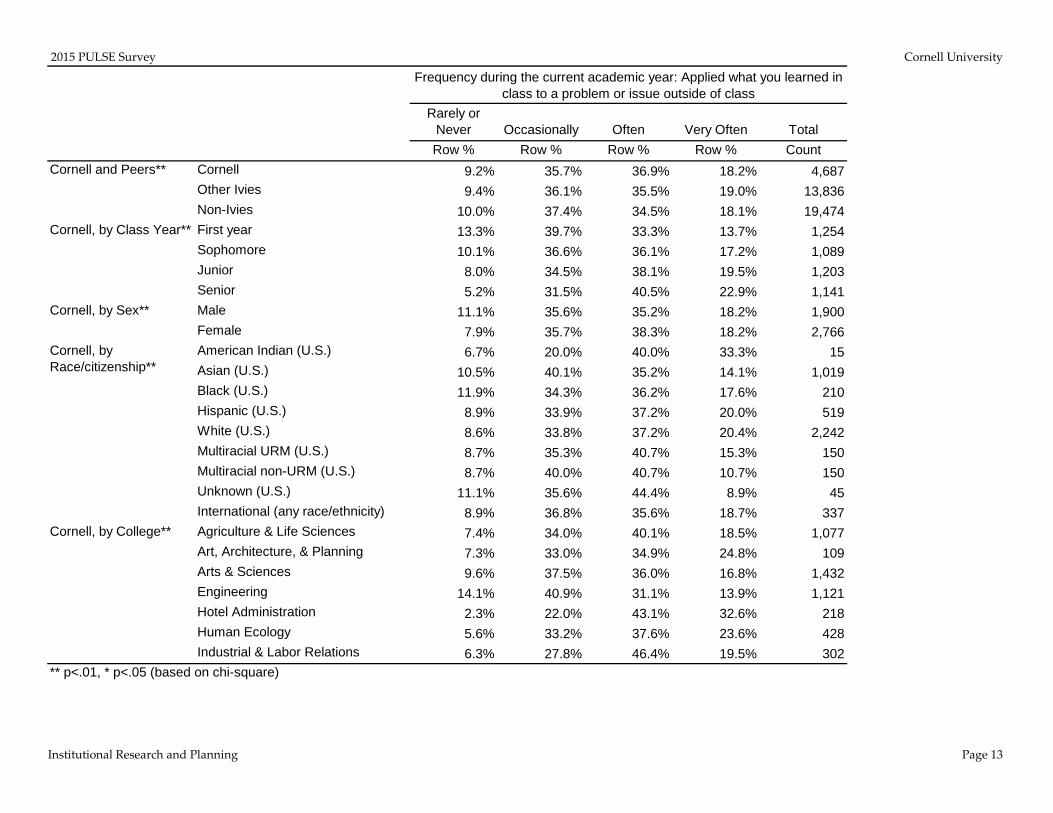
Rarely or Never Occasionally Often Very Often TotalRow % Row % Row % Row % Count
Cornell 9.2% 35.7% 36.9% 18.2% 4,687Other Ivies 9.4% 36.1% 35.5% 19.0% 13,836Non-Ivies 10.0% 37.4% 34.5% 18.1% 19,474First year 13.3% 39.7% 33.3% 13.7% 1,254Sophomore 10.1% 36.6% 36.1% 17.2% 1,089Junior 8.0% 34.5% 38.1% 19.5% 1,203Senior 5.2% 31.5% 40.5% 22.9% 1,141Male 11.1% 35.6% 35.2% 18.2% 1,900Female 7.9% 35.7% 38.3% 18.2% 2,766American Indian (U.S.) 6.7% 20.0% 40.0% 33.3% 15Asian (U.S.) 10.5% 40.1% 35.2% 14.1% 1,019Black (U.S.) 11.9% 34.3% 36.2% 17.6% 210Hispanic (U.S.) 8.9% 33.9% 37.2% 20.0% 519White (U.S.) 8.6% 33.8% 37.2% 20.4% 2,242Multiracial URM (U.S.) 8.7% 35.3% 40.7% 15.3% 150Multiracial non-URM (U.S.) 8.7% 40.0% 40.7% 10.7% 150Unknown (U.S.) 11.1% 35.6% 44.4% 8.9% 45International (any race/ethnicity) 8.9% 36.8% 35.6% 18.7% 337Agriculture & Life Sciences 7.4% 34.0% 40.1% 18.5% 1,077Art, Architecture, & Planning 7.3% 33.0% 34.9% 24.8% 109Arts & Sciences 9.6% 37.5% 36.0% 16.8% 1,432Engineering 14.1% 40.9% 31.1% 13.9% 1,121Hotel Administration 2.3% 22.0% 43.1% 32.6% 218Human Ecology 5.6% 33.2% 37.6% 23.6% 428Industrial & Labor Relations 6.3% 27.8% 46.4% 19.5% 302
Cornell and Peers**
Cornell, by Class Year**
Cornell, by Sex**
Cornell, by Race/citizenship**
Cornell, by College**
** p<.01, * p<.05 (based on chi-square)
Frequency during the current academic year: Applied what you learned in class to a problem or issue outside of class

2015 PULSE Survey Cornell University
Institutional Research and Planning Page 14
Rarely or Never Occasionally Often Very Often TotalRow % Row % Row % Row % Count
Cornell 20.9% 33.3% 28.6% 17.3% 4,676Other Ivies 23.2% 35.0% 24.3% 17.6% 13,843Non-Ivies 20.5% 33.6% 26.1% 19.8% 19,463First year 19.6% 34.2% 29.4% 16.9% 1,253Sophomore 20.9% 31.6% 30.7% 16.8% 1,089Junior 19.4% 31.5% 29.1% 20.0% 1,195Senior 23.8% 35.7% 25.3% 15.2% 1,139Male 22.4% 34.5% 27.6% 15.5% 1,898Female 19.6% 32.4% 29.5% 18.5% 2,758American Indian (U.S.) 40.0% 13.3% 26.7% 20.0% 15Asian (U.S.) 18.5% 34.3% 28.4% 18.7% 1,020Black (U.S.) 19.5% 31.4% 30.0% 19.0% 210Hispanic (U.S.) 22.8% 32.5% 26.9% 17.8% 517White (U.S.) 21.2% 33.3% 28.3% 17.2% 2,236Multiracial URM (U.S.) 21.5% 34.2% 29.5% 14.8% 149Multiracial non-URM (U.S.) 24.2% 32.9% 27.5% 15.4% 149Unknown (U.S.) 28.9% 26.7% 35.6% 8.9% 45International (any race/ethnicity) 19.7% 33.7% 32.2% 14.3% 335Agriculture & Life Sciences 19.6% 34.9% 28.6% 16.9% 1,074Art, Architecture, & Planning 22.9% 35.8% 26.6% 14.7% 109Arts & Sciences 26.1% 35.1% 23.9% 14.9% 1,431Engineering 19.2% 29.7% 30.9% 20.2% 1,116Hotel Administration 16.5% 32.1% 31.7% 19.7% 218Human Ecology 16.6% 30.0% 32.8% 20.6% 427Industrial & Labor Relations 15.3% 36.2% 35.2% 13.3% 301
Frequency during the current academic year: Participated in a study group outside of class
Cornell and Peers**
Cornell, by Class Year**
Cornell, by Sex**
Cornell, by Race/citizenship
Cornell, by College**
** p<.01, * p<.05 (based on chi-square)

2015 PULSE Survey Cornell University
Institutional Research and Planning Page 15
Rarely or Never Occasionally Often Very Often TotalRow % Row % Row % Row % Count
Cornell 5.5% 37.9% 41.8% 14.8% 4,670Other Ivies 4.4% 36.1% 41.4% 18.1% 13,810Non-Ivies 4.9% 37.5% 41.3% 16.3% 19,459First year 6.8% 38.4% 41.0% 13.8% 1,249Sophomore 4.7% 39.6% 41.5% 14.2% 1,089Junior 6.0% 36.4% 42.6% 14.9% 1,194Senior 4.2% 37.2% 42.2% 16.4% 1,138Male 5.7% 37.3% 40.9% 16.0% 1,897Female 5.2% 38.2% 42.6% 13.9% 2,753American Indian (U.S.) 6.7% 20.0% 60.0% 13.3% 15Asian (U.S.) 4.9% 39.5% 41.4% 14.2% 1,020Black (U.S.) 8.6% 42.9% 34.3% 14.3% 210Hispanic (U.S.) 7.0% 36.6% 39.4% 17.0% 513White (U.S.) 5.2% 37.1% 42.7% 14.9% 2,232Multiracial URM (U.S.) 4.7% 42.3% 43.6% 9.4% 149Multiracial non-URM (U.S.) 6.7% 44.7% 38.0% 10.7% 150Unknown (U.S.) 11.1% 35.6% 44.4% 8.9% 45International (any race/ethnicity) 3.6% 32.7% 45.2% 18.5% 336Agriculture & Life Sciences 6.7% 38.1% 39.8% 15.4% 1,069Art, Architecture, & Planning 2.8% 39.8% 39.8% 17.6% 108Arts & Sciences 5.2% 35.7% 45.2% 13.9% 1,430Engineering 5.7% 40.4% 40.4% 13.4% 1,118Hotel Administration 3.2% 42.7% 38.1% 16.1% 218Human Ecology 5.2% 34.6% 43.5% 16.7% 425Industrial & Labor Relations 4.6% 38.7% 39.1% 17.5% 302
Cornell, by Sex
Cornell, by Race/citizenship*
Cornell, by College
** p<.01, * p<.05 (based on chi-square)
Frequency during the current academic year: Reconsidered your position on a topic after evaluating the arguments of others
Cornell and Peers**
Cornell, by Class Year

2015 PULSE Survey Cornell University
Institutional Research and Planning Page 16
Rarely or Never Occasionally Often Very Often TotalRow % Row % Row % Row % Count
Cornell 3.2% 20.7% 41.0% 35.0% 4,681Other Ivies 2.6% 17.5% 34.0% 45.9% 13,852Non-Ivies 2.8% 18.3% 36.7% 42.2% 19,489First year 3.8% 23.2% 40.6% 32.4% 1,254Sophomore 3.6% 21.1% 40.9% 34.4% 1,092Junior 2.5% 19.3% 43.5% 34.7% 1,197Senior 3.0% 19.2% 39.0% 38.8% 1,138Male 3.2% 19.1% 40.6% 37.1% 1,900Female 3.2% 21.8% 41.5% 33.5% 2,761American Indian (U.S.) 0.0% 26.7% 46.7% 26.7% 15Asian (U.S.) 3.9% 25.6% 43.3% 27.2% 1,019Black (U.S.) 4.7% 21.2% 37.3% 36.8% 212Hispanic (U.S.) 3.1% 18.0% 41.0% 37.9% 517White (U.S.) 2.6% 18.0% 40.0% 39.4% 2,239Multiracial URM (U.S.) 4.0% 24.8% 36.2% 34.9% 149Multiracial non-URM (U.S.) 3.3% 19.3% 45.3% 32.0% 150Unknown (U.S.) 4.5% 18.2% 45.5% 31.8% 44International (any race/ethnicity) 3.9% 27.4% 43.2% 25.6% 336Agriculture & Life Sciences 3.7% 21.4% 39.9% 35.0% 1,074Art, Architecture, & Planning 2.8% 14.7% 39.4% 43.1% 109Arts & Sciences 3.8% 20.4% 40.6% 35.2% 1,432Engineering 2.7% 20.6% 42.4% 34.3% 1,119Hotel Administration 2.8% 24.8% 43.6% 28.9% 218Human Ecology 2.6% 22.7% 41.1% 33.6% 428Industrial & Labor Relations 2.3% 16.9% 40.9% 39.9% 301
Frequency during the current academic year: Had an intellectual discussion with students outside of class
Cornell and Peers**
Cornell, by Class Year*
Cornell, by Sex*
Cornell, by Race/citizenship**
Cornell, by College
** p<.01, * p<.05 (based on chi-square)

2015 PULSE Survey Cornell University
Institutional Research and Planning Page 17
Rarely or Never Occasionally Often Very Often TotalRow % Row % Row % Row % Count
Cornell 36.0% 37.3% 17.3% 9.4% 4,687Other Ivies 36.4% 38.2% 15.7% 9.7% 13,850Non-Ivies 37.2% 37.7% 16.0% 9.2% 19,489First year 44.5% 37.4% 12.7% 5.5% 1,253Sophomore 38.1% 36.7% 16.3% 8.9% 1,092Junior 31.6% 38.9% 19.1% 10.4% 1,202Senior 29.3% 36.0% 21.5% 13.2% 1,140Male 34.7% 37.0% 17.9% 10.5% 1,902Female 36.8% 37.4% 17.0% 8.8% 2,764American Indian (U.S.) 33.3% 46.7% 6.7% 13.3% 15Asian (U.S.) 42.3% 33.9% 16.6% 7.1% 1,023Black (U.S.) 37.0% 35.1% 19.2% 8.7% 208Hispanic (U.S.) 34.4% 37.6% 16.2% 11.8% 518White (U.S.) 35.0% 38.3% 16.8% 9.9% 2,239Multiracial URM (U.S.) 36.7% 38.0% 14.0% 11.3% 150Multiracial non-URM (U.S.) 36.7% 38.7% 18.7% 6.0% 150Unknown (U.S.) 43.5% 43.5% 10.9% 2.2% 46International (any race/ethnicity) 24.0% 39.1% 25.4% 11.5% 338Agriculture & Life Sciences 32.4% 39.3% 18.0% 10.3% 1,075Art, Architecture, & Planning 19.1% 40.9% 29.1% 10.9% 110Arts & Sciences 34.6% 38.2% 17.0% 10.2% 1,435Engineering 47.0% 33.9% 12.4% 6.7% 1,121Hotel Administration 29.7% 33.8% 24.7% 11.9% 219Human Ecology 33.6% 36.2% 19.7% 10.6% 426Industrial & Labor Relations 28.6% 40.9% 21.6% 9.0% 301
Cornell, by Sex
Cornell, by Race/citizenship**
Cornell, by College**
** p<.01, * p<.05 (based on chi-square)
Frequency during the current academic year: Had an intellectual discussion with a faculty member outside of class
Cornell and Peers
Cornell, by Class Year**
2015 PULSE Survey Cornell University
Institutional Research and Planning Page 18
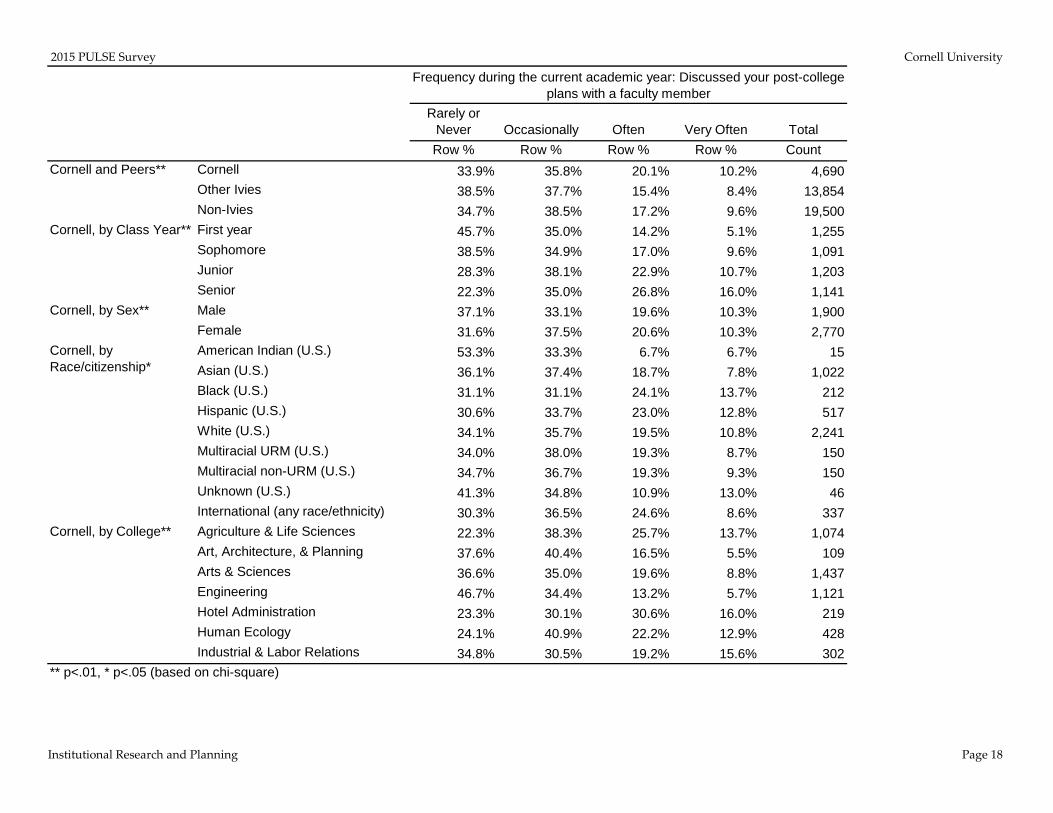
Rarely or Never Occasionally Often Very Often TotalRow % Row % Row % Row % Count
Cornell 33.9% 35.8% 20.1% 10.2% 4,690Other Ivies 38.5% 37.7% 15.4% 8.4% 13,854Non-Ivies 34.7% 38.5% 17.2% 9.6% 19,500First year 45.7% 35.0% 14.2% 5.1% 1,255Sophomore 38.5% 34.9% 17.0% 9.6% 1,091Junior 28.3% 38.1% 22.9% 10.7% 1,203Senior 22.3% 35.0% 26.8% 16.0% 1,141Male 37.1% 33.1% 19.6% 10.3% 1,900Female 31.6% 37.5% 20.6% 10.3% 2,770American Indian (U.S.) 53.3% 33.3% 6.7% 6.7% 15Asian (U.S.) 36.1% 37.4% 18.7% 7.8% 1,022Black (U.S.) 31.1% 31.1% 24.1% 13.7% 212Hispanic (U.S.) 30.6% 33.7% 23.0% 12.8% 517White (U.S.) 34.1% 35.7% 19.5% 10.8% 2,241Multiracial URM (U.S.) 34.0% 38.0% 19.3% 8.7% 150Multiracial non-URM (U.S.) 34.7% 36.7% 19.3% 9.3% 150Unknown (U.S.) 41.3% 34.8% 10.9% 13.0% 46International (any race/ethnicity) 30.3% 36.5% 24.6% 8.6% 337Agriculture & Life Sciences 22.3% 38.3% 25.7% 13.7% 1,074Art, Architecture, & Planning 37.6% 40.4% 16.5% 5.5% 109Arts & Sciences 36.6% 35.0% 19.6% 8.8% 1,437Engineering 46.7% 34.4% 13.2% 5.7% 1,121Hotel Administration 23.3% 30.1% 30.6% 16.0% 219Human Ecology 24.1% 40.9% 22.2% 12.9% 428Industrial & Labor Relations 34.8% 30.5% 19.2% 15.6% 302
Cornell, by Race/citizenship*
Cornell, by College**
** p<.01, * p<.05 (based on chi-square)
Frequency during the current academic year: Discussed your post-college plans with a faculty member
Cornell and Peers**
Cornell, by Class Year**
Cornell, by Sex**

2015 PULSE Survey Cornell University
Institutional Research and Planning Page 19
Rarely or Never Occasionally Often Very Often TotalRow % Row % Row % Row % Count
Cornell 22.8% 42.4% 23.0% 11.8% 4,687Other Ivies 18.5% 43.3% 23.5% 14.7% 13,855Non-Ivies 22.1% 43.8% 21.9% 12.3% 19,492First year 24.6% 42.2% 22.1% 11.2% 1,255Sophomore 24.2% 40.9% 23.0% 11.9% 1,093Junior 21.8% 43.5% 22.6% 12.0% 1,201Senior 20.4% 42.9% 24.5% 12.2% 1,138Male 25.4% 41.3% 22.6% 10.7% 1,899Female 21.0% 43.2% 23.4% 12.5% 2,767American Indian (U.S.) 20.0% 26.7% 26.7% 26.7% 15Asian (U.S.) 25.8% 40.0% 23.8% 10.4% 1,020Black (U.S.) 22.3% 38.4% 23.7% 15.6% 211Hispanic (U.S.) 20.2% 39.5% 25.6% 14.6% 519White (U.S.) 23.0% 45.3% 20.8% 10.8% 2,240Multiracial URM (U.S.) 24.0% 42.7% 22.7% 10.7% 150Multiracial non-URM (U.S.) 24.0% 44.0% 24.0% 8.0% 150Unknown (U.S.) 33.3% 40.0% 15.6% 11.1% 45International (any race/ethnicity) 13.9% 37.7% 31.2% 17.2% 337Agriculture & Life Sciences 19.6% 45.3% 22.8% 12.4% 1,074Art, Architecture, & Planning 10.0% 31.8% 32.7% 25.5% 110Arts & Sciences 21.8% 41.8% 24.0% 12.4% 1,433Engineering 32.4% 41.1% 19.4% 7.1% 1,123Hotel Administration 21.9% 43.8% 23.3% 11.0% 219Human Ecology 18.3% 43.7% 24.2% 13.8% 426Industrial & Labor Relations 14.6% 41.1% 27.2% 17.2% 302
Cornell, by College**
** p<.01, * p<.05 (based on chi-square)
Frequency during the current academic year: Attended a campus lecture, conference, symposium or arts event not required by a course
Cornell and Peers**
Cornell, by Class Year
Cornell, by Sex**
Cornell, by Race/citizenship**
2015 PULSE Survey Cornell University
Institutional Research and Planning Page 20
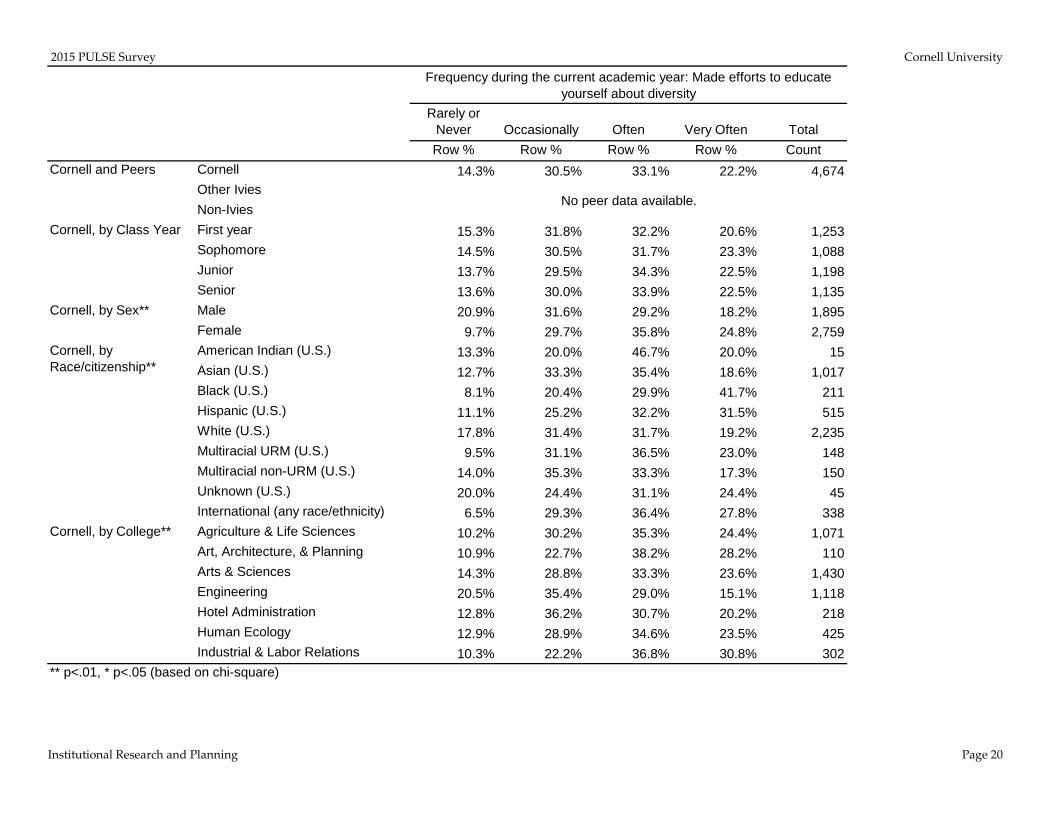
Rarely or Never Occasionally Often Very Often TotalRow % Row % Row % Row % Count
Cornell 14.3% 30.5% 33.1% 22.2% 4,674Other IviesNon-IviesFirst year 15.3% 31.8% 32.2% 20.6% 1,253Sophomore 14.5% 30.5% 31.7% 23.3% 1,088Junior 13.7% 29.5% 34.3% 22.5% 1,198Senior 13.6% 30.0% 33.9% 22.5% 1,135Male 20.9% 31.6% 29.2% 18.2% 1,895Female 9.7% 29.7% 35.8% 24.8% 2,759American Indian (U.S.) 13.3% 20.0% 46.7% 20.0% 15Asian (U.S.) 12.7% 33.3% 35.4% 18.6% 1,017Black (U.S.) 8.1% 20.4% 29.9% 41.7% 211Hispanic (U.S.) 11.1% 25.2% 32.2% 31.5% 515White (U.S.) 17.8% 31.4% 31.7% 19.2% 2,235Multiracial URM (U.S.) 9.5% 31.1% 36.5% 23.0% 148Multiracial non-URM (U.S.) 14.0% 35.3% 33.3% 17.3% 150Unknown (U.S.) 20.0% 24.4% 31.1% 24.4% 45International (any race/ethnicity) 6.5% 29.3% 36.4% 27.8% 338Agriculture & Life Sciences 10.2% 30.2% 35.3% 24.4% 1,071Art, Architecture, & Planning 10.9% 22.7% 38.2% 28.2% 110Arts & Sciences 14.3% 28.8% 33.3% 23.6% 1,430Engineering 20.5% 35.4% 29.0% 15.1% 1,118Hotel Administration 12.8% 36.2% 30.7% 20.2% 218Human Ecology 12.9% 28.9% 34.6% 23.5% 425Industrial & Labor Relations 10.3% 22.2% 36.8% 30.8% 302
Cornell and Peers
Cornell, by Class Year
Cornell, by Sex**
Cornell, by Race/citizenship**
Cornell, by College**
** p<.01, * p<.05 (based on chi-square)
Frequency during the current academic year: Made efforts to educate yourself about diversity
No peer data available.
2015 PULSE Survey Cornell University
Institutional Research and Planning Page 21
Done Plan to doDo not plan to
doHave not decided Total
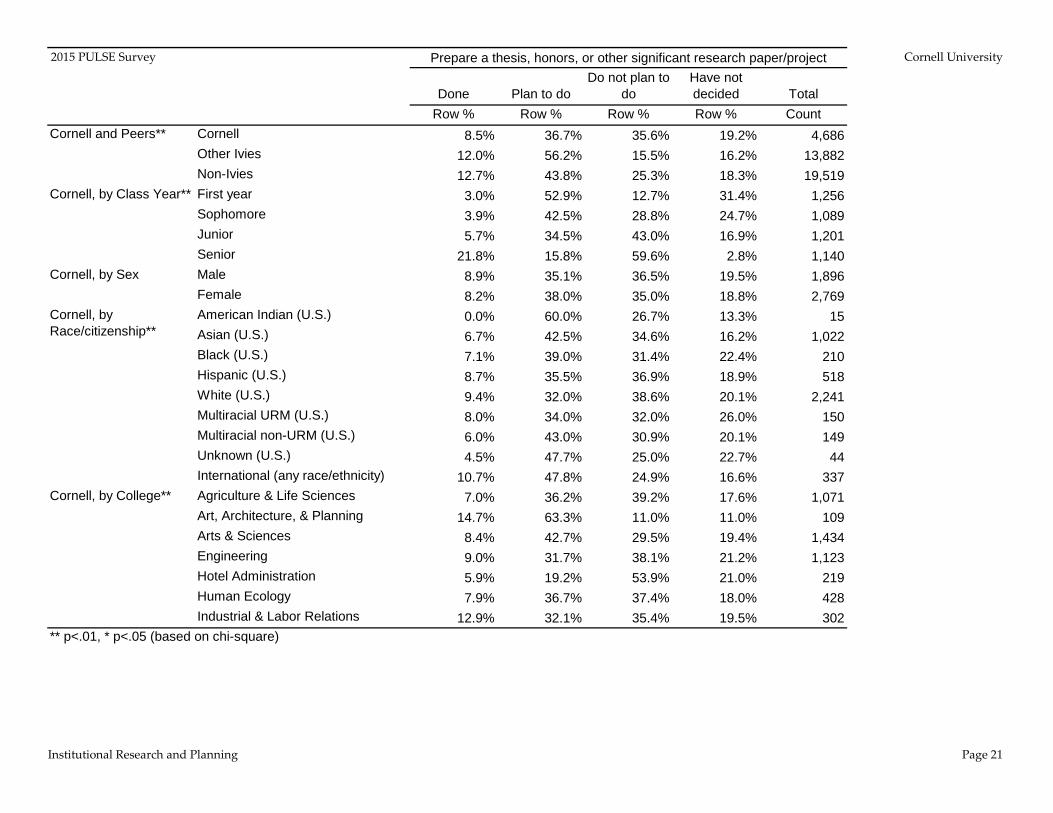
Row % Row % Row % Row % CountCornell 8.5% 36.7% 35.6% 19.2% 4,686Other Ivies 12.0% 56.2% 15.5% 16.2% 13,882Non-Ivies 12.7% 43.8% 25.3% 18.3% 19,519First year 3.0% 52.9% 12.7% 31.4% 1,256Sophomore 3.9% 42.5% 28.8% 24.7% 1,089Junior 5.7% 34.5% 43.0% 16.9% 1,201Senior 21.8% 15.8% 59.6% 2.8% 1,140Male 8.9% 35.1% 36.5% 19.5% 1,896Female 8.2% 38.0% 35.0% 18.8% 2,769American Indian (U.S.) 0.0% 60.0% 26.7% 13.3% 15Asian (U.S.) 6.7% 42.5% 34.6% 16.2% 1,022Black (U.S.) 7.1% 39.0% 31.4% 22.4% 210Hispanic (U.S.) 8.7% 35.5% 36.9% 18.9% 518White (U.S.) 9.4% 32.0% 38.6% 20.1% 2,241Multiracial URM (U.S.) 8.0% 34.0% 32.0% 26.0% 150Multiracial non-URM (U.S.) 6.0% 43.0% 30.9% 20.1% 149Unknown (U.S.) 4.5% 47.7% 25.0% 22.7% 44International (any race/ethnicity) 10.7% 47.8% 24.9% 16.6% 337Agriculture & Life Sciences 7.0% 36.2% 39.2% 17.6% 1,071Art, Architecture, & Planning 14.7% 63.3% 11.0% 11.0% 109Arts & Sciences 8.4% 42.7% 29.5% 19.4% 1,434Engineering 9.0% 31.7% 38.1% 21.2% 1,123Hotel Administration 5.9% 19.2% 53.9% 21.0% 219Human Ecology 7.9% 36.7% 37.4% 18.0% 428Industrial & Labor Relations 12.9% 32.1% 35.4% 19.5% 302
Cornell, by Class Year**
Cornell, by Sex
Cornell, by Race/citizenship**
Cornell, by College**
** p<.01, * p<.05 (based on chi-square)
Prepare a thesis, honors, or other significant research paper/project
Cornell and Peers**
2015 PULSE Survey Cornell University
Institutional Research and Planning Page 22
Done Plan to doDo not plan to
doHave not decided Total
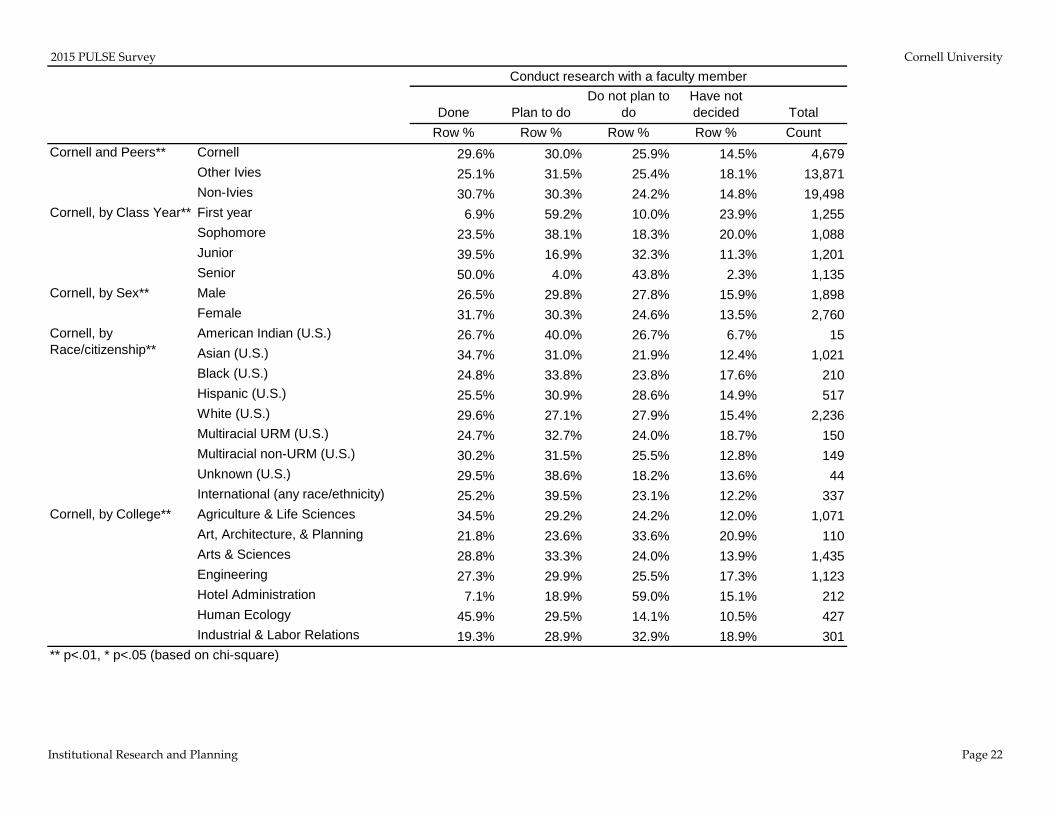
Row % Row % Row % Row % CountCornell 29.6% 30.0% 25.9% 14.5% 4,679Other Ivies 25.1% 31.5% 25.4% 18.1% 13,871Non-Ivies 30.7% 30.3% 24.2% 14.8% 19,498First year 6.9% 59.2% 10.0% 23.9% 1,255Sophomore 23.5% 38.1% 18.3% 20.0% 1,088Junior 39.5% 16.9% 32.3% 11.3% 1,201Senior 50.0% 4.0% 43.8% 2.3% 1,135Male 26.5% 29.8% 27.8% 15.9% 1,898Female 31.7% 30.3% 24.6% 13.5% 2,760American Indian (U.S.) 26.7% 40.0% 26.7% 6.7% 15Asian (U.S.) 34.7% 31.0% 21.9% 12.4% 1,021Black (U.S.) 24.8% 33.8% 23.8% 17.6% 210Hispanic (U.S.) 25.5% 30.9% 28.6% 14.9% 517White (U.S.) 29.6% 27.1% 27.9% 15.4% 2,236Multiracial URM (U.S.) 24.7% 32.7% 24.0% 18.7% 150Multiracial non-URM (U.S.) 30.2% 31.5% 25.5% 12.8% 149Unknown (U.S.) 29.5% 38.6% 18.2% 13.6% 44International (any race/ethnicity) 25.2% 39.5% 23.1% 12.2% 337Agriculture & Life Sciences 34.5% 29.2% 24.2% 12.0% 1,071Art, Architecture, & Planning 21.8% 23.6% 33.6% 20.9% 110Arts & Sciences 28.8% 33.3% 24.0% 13.9% 1,435Engineering 27.3% 29.9% 25.5% 17.3% 1,123Hotel Administration 7.1% 18.9% 59.0% 15.1% 212Human Ecology 45.9% 29.5% 14.1% 10.5% 427Industrial & Labor Relations 19.3% 28.9% 32.9% 18.9% 301
Cornell, by Sex**
Cornell, by Race/citizenship**
Cornell, by College**
** p<.01, * p<.05 (based on chi-square)
Conduct research with a faculty member
Cornell and Peers**
Cornell, by Class Year**

2015 PULSE Survey Cornell University
Institutional Research and Planning Page 23
Done Plan to doDo not plan to
doHave not decided Total
Row % Row % Row % Row % CountCornell 42.0% 45.9% 7.8% 4.3% 4,683Other Ivies 44.3% 43.5% 7.0% 5.2% 13,865Non-Ivies 40.7% 44.8% 8.8% 5.7% 19,503First year 4.6% 87.2% 2.2% 6.1% 1,251Sophomore 33.9% 56.4% 3.9% 5.8% 1,092Junior 57.7% 30.3% 8.3% 3.7% 1,203Senior 74.5% 6.9% 17.2% 1.5% 1,137Male 40.0% 46.3% 8.7% 5.0% 1,898Female 43.5% 45.6% 7.1% 3.8% 2,764American Indian (U.S.) 33.3% 53.3% 6.7% 6.7% 15Asian (U.S.) 40.9% 48.2% 7.3% 3.5% 1,024Black (U.S.) 42.4% 47.6% 5.2% 4.8% 210Hispanic (U.S.) 41.1% 47.8% 7.2% 3.9% 513White (U.S.) 44.5% 42.5% 8.3% 4.7% 2,239Multiracial URM (U.S.) 42.3% 47.7% 5.4% 4.7% 149Multiracial non-URM (U.S.) 39.6% 51.0% 5.4% 4.0% 149Unknown (U.S.) 42.2% 42.2% 11.1% 4.4% 45International (any race/ethnicity) 31.6% 54.3% 10.0% 4.1% 339Agriculture & Life Sciences 42.6% 45.3% 8.7% 3.5% 1,069Art, Architecture, & Planning 57.3% 38.2% 0.9% 3.6% 110Arts & Sciences 35.0% 48.3% 10.3% 6.4% 1,434Engineering 39.7% 50.0% 6.6% 3.7% 1,123Hotel Administration 64.7% 30.7% 2.8% 1.8% 218Human Ecology 43.7% 42.7% 8.7% 4.9% 426Industrial & Labor Relations 57.8% 39.6% 2.0% 0.7% 303
Cornell, by Race/citizenship**
Cornell, by College**
** p<.01, * p<.05 (based on chi-square)
Have an internship
Cornell and Peers**
Cornell, by Class Year**
Cornell, by Sex*
2015 PULSE Survey Cornell University
Institutional Research and Planning Page 24
Done Plan to doDo not plan to
doHave not decided Total
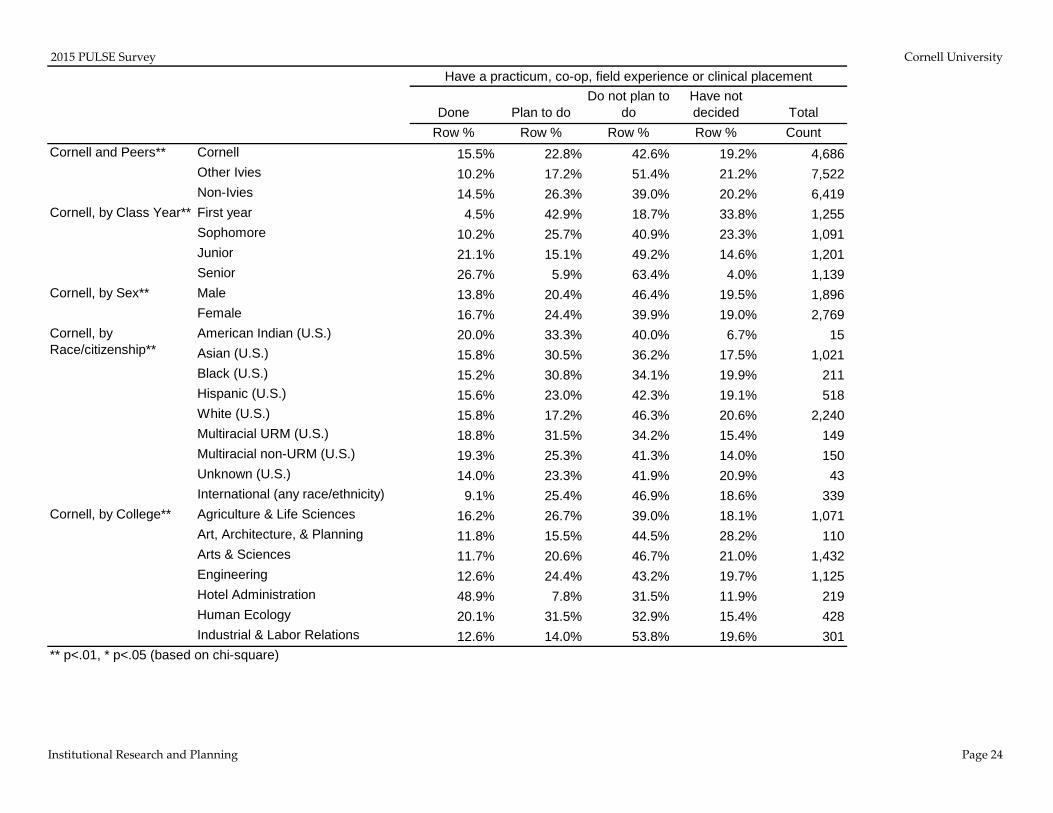
Row % Row % Row % Row % CountCornell 15.5% 22.8% 42.6% 19.2% 4,686Other Ivies 10.2% 17.2% 51.4% 21.2% 7,522Non-Ivies 14.5% 26.3% 39.0% 20.2% 6,419First year 4.5% 42.9% 18.7% 33.8% 1,255Sophomore 10.2% 25.7% 40.9% 23.3% 1,091Junior 21.1% 15.1% 49.2% 14.6% 1,201Senior 26.7% 5.9% 63.4% 4.0% 1,139Male 13.8% 20.4% 46.4% 19.5% 1,896Female 16.7% 24.4% 39.9% 19.0% 2,769American Indian (U.S.) 20.0% 33.3% 40.0% 6.7% 15Asian (U.S.) 15.8% 30.5% 36.2% 17.5% 1,021Black (U.S.) 15.2% 30.8% 34.1% 19.9% 211Hispanic (U.S.) 15.6% 23.0% 42.3% 19.1% 518White (U.S.) 15.8% 17.2% 46.3% 20.6% 2,240Multiracial URM (U.S.) 18.8% 31.5% 34.2% 15.4% 149Multiracial non-URM (U.S.) 19.3% 25.3% 41.3% 14.0% 150Unknown (U.S.) 14.0% 23.3% 41.9% 20.9% 43International (any race/ethnicity) 9.1% 25.4% 46.9% 18.6% 339Agriculture & Life Sciences 16.2% 26.7% 39.0% 18.1% 1,071Art, Architecture, & Planning 11.8% 15.5% 44.5% 28.2% 110Arts & Sciences 11.7% 20.6% 46.7% 21.0% 1,432Engineering 12.6% 24.4% 43.2% 19.7% 1,125Hotel Administration 48.9% 7.8% 31.5% 11.9% 219Human Ecology 20.1% 31.5% 32.9% 15.4% 428Industrial & Labor Relations 12.6% 14.0% 53.8% 19.6% 301
Cornell, by Race/citizenship**
Cornell, by College**
** p<.01, * p<.05 (based on chi-square)
Have a practicum, co-op, field experience or clinical placement
Cornell and Peers**
Cornell, by Class Year**
Cornell, by Sex**

2015 PULSE Survey Cornell University
Institutional Research and Planning Page 25
Done Plan to doDo not plan to
doHave not decided Total
Row % Row % Row % Row % CountCornell 11.8% 25.2% 50.8% 12.2% 4,662Other Ivies 20.1% 28.9% 38.7% 12.3% 13,847Non-Ivies 18.8% 30.9% 38.2% 12.2% 19,496First year .4% 52.0% 23.9% 23.8% 1,253Sophomore 2.0% 38.2% 41.8% 18.0% 1,087Junior 18.7% 6.6% 70.3% 4.5% 1,190Senior 26.5% 2.5% 68.9% 2.1% 1,132Male 8.8% 18.9% 58.8% 13.6% 1,888Female 13.8% 29.5% 45.4% 11.3% 2,753American Indian (U.S.) 6.7% 26.7% 40.0% 26.7% 15Asian (U.S.) 7.3% 23.8% 55.6% 13.4% 1,017Black (U.S.) 8.6% 34.4% 40.7% 16.3% 209Hispanic (U.S.) 13.5% 30.6% 45.2% 10.7% 513White (U.S.) 14.0% 23.6% 50.9% 11.5% 2,230Multiracial URM (U.S.) 11.5% 29.1% 43.9% 15.5% 148Multiracial non-URM (U.S.) 13.5% 23.0% 49.3% 14.2% 148Unknown (U.S.) 11.4% 15.9% 56.8% 15.9% 44International (any race/ethnicity) 9.5% 26.0% 54.1% 10.4% 338Agriculture & Life Sciences 12.3% 27.4% 49.0% 11.3% 1,065Art, Architecture, & Planning 42.2% 40.4% 12.8% 4.6% 109Arts & Sciences 10.3% 27.5% 48.3% 13.9% 1,429Engineering 5.8% 14.3% 65.9% 14.0% 1,115Hotel Administration 17.9% 25.7% 45.4% 11.0% 218Human Ecology 12.9% 29.1% 47.4% 10.6% 426Industrial & Labor Relations 22.0% 35.0% 35.7% 7.3% 300
Cornell, by College**
** p<.01, * p<.05 (based on chi-square)
Study abroad
Cornell and Peers**
Cornell, by Class Year**
Cornell, by Sex**
Cornell, by Race/citizenship**

2015 PULSE Survey Cornell University
Institutional Research and Planning Page 26
Done Plan to doDo not plan to
doHave not decided Total
Row % Row % Row % Row % CountCornell 26.5% 24.0% 31.5% 17.9% 4,673Other Ivies 29.5% 23.0% 28.0% 19.5% 13,847Non-Ivies 28.2% 22.3% 29.2% 20.3% 19,491First year 13.3% 43.4% 17.5% 25.9% 1,249Sophomore 21.2% 28.2% 27.5% 23.1% 1,088Junior 31.1% 17.2% 34.7% 17.0% 1,198Senior 41.4% 6.0% 47.5% 5.2% 1,138Male 19.5% 20.8% 40.8% 18.8% 1,893Female 31.4% 26.2% 25.0% 17.3% 2,759American Indian (U.S.) 26.7% 26.7% 20.0% 26.7% 15Asian (U.S.) 26.9% 29.0% 28.9% 15.1% 1,019Black (U.S.) 33.3% 32.4% 18.6% 15.7% 210Hispanic (U.S.) 32.2% 23.6% 25.4% 18.8% 516White (U.S.) 25.2% 20.2% 35.7% 18.9% 2,238Multiracial URM (U.S.) 35.6% 24.0% 19.9% 20.5% 146Multiracial non-URM (U.S.) 32.7% 21.8% 26.5% 19.0% 147Unknown (U.S.) 22.7% 20.5% 34.1% 22.7% 44International (any race/ethnicity) 15.7% 31.4% 36.1% 16.9% 338Agriculture & Life Sciences 30.2% 25.6% 25.8% 18.5% 1,071Art, Architecture, & Planning 28.2% 24.5% 25.5% 21.8% 110Arts & Sciences 26.7% 24.1% 32.0% 17.2% 1,429Engineering 17.9% 21.6% 40.7% 19.8% 1,116Hotel Administration 23.4% 23.4% 32.1% 21.1% 218Human Ecology 39.7% 25.9% 20.3% 14.0% 428Industrial & Labor Relations 27.6% 24.9% 33.6% 14.0% 301
Participate in a service or community-based learning course or program
Cornell and Peers**
Cornell, by Class Year**
Cornell, by Sex**
Cornell, by Race/citizenship**
Cornell, by College**
** p<.01, * p<.05 (based on chi-square)
2015 PULSE Survey Cornell University
Institutional Research and Planning Page 27
Strongly Disagree Disagree Agree
Strongly Agree Total
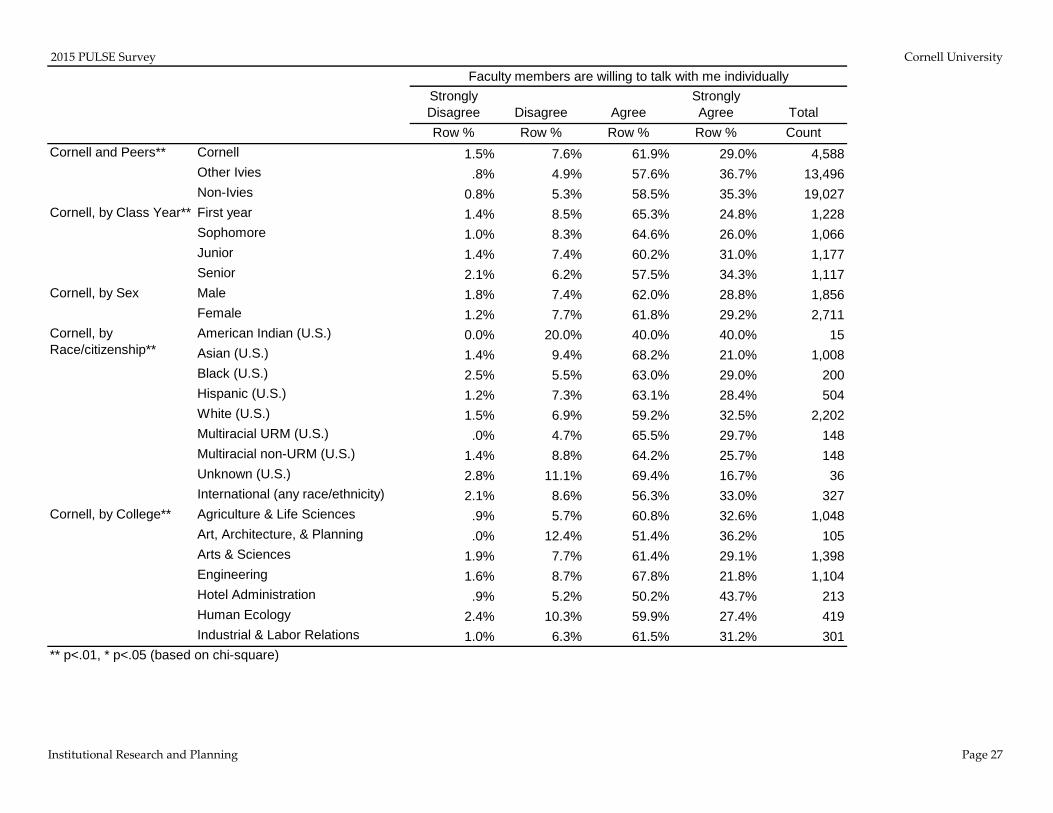
Row % Row % Row % Row % CountCornell 1.5% 7.6% 61.9% 29.0% 4,588Other Ivies .8% 4.9% 57.6% 36.7% 13,496Non-Ivies 0.8% 5.3% 58.5% 35.3% 19,027First year 1.4% 8.5% 65.3% 24.8% 1,228Sophomore 1.0% 8.3% 64.6% 26.0% 1,066Junior 1.4% 7.4% 60.2% 31.0% 1,177Senior 2.1% 6.2% 57.5% 34.3% 1,117Male 1.8% 7.4% 62.0% 28.8% 1,856Female 1.2% 7.7% 61.8% 29.2% 2,711American Indian (U.S.) 0.0% 20.0% 40.0% 40.0% 15Asian (U.S.) 1.4% 9.4% 68.2% 21.0% 1,008Black (U.S.) 2.5% 5.5% 63.0% 29.0% 200Hispanic (U.S.) 1.2% 7.3% 63.1% 28.4% 504White (U.S.) 1.5% 6.9% 59.2% 32.5% 2,202Multiracial URM (U.S.) .0% 4.7% 65.5% 29.7% 148Multiracial non-URM (U.S.) 1.4% 8.8% 64.2% 25.7% 148Unknown (U.S.) 2.8% 11.1% 69.4% 16.7% 36International (any race/ethnicity) 2.1% 8.6% 56.3% 33.0% 327Agriculture & Life Sciences .9% 5.7% 60.8% 32.6% 1,048Art, Architecture, & Planning .0% 12.4% 51.4% 36.2% 105Arts & Sciences 1.9% 7.7% 61.4% 29.1% 1,398Engineering 1.6% 8.7% 67.8% 21.8% 1,104Hotel Administration .9% 5.2% 50.2% 43.7% 213Human Ecology 2.4% 10.3% 59.9% 27.4% 419Industrial & Labor Relations 1.0% 6.3% 61.5% 31.2% 301
Faculty members are willing to talk with me individually
Cornell and Peers**
Cornell, by Class Year**
Cornell, by Sex
Cornell, by Race/citizenship**
Cornell, by College**
** p<.01, * p<.05 (based on chi-square)
2015 PULSE Survey Cornell University
Institutional Research and Planning Page 28
Strongly Disagree Disagree Agree
Strongly Agree Total
Row % Row % Row % Row % CountCornell 0.9% 5.0% 66.3% 27.7% 4,583Other Ivies .7% 3.9% 60.0% 35.4% 13,481Non-Ivies 0.7% 3.9% 61.2% 34.2% 19,017First year .8% 4.2% 70.0% 25.0% 1,225Sophomore 1.1% 4.8% 69.8% 24.3% 1,065Junior 1.1% 6.0% 64.1% 28.7% 1,176Senior 0.7% 5.0% 61.3% 32.9% 1,117Male 1.0% 4.9% 65.5% 28.6% 1,856Female .8% 5.0% 66.9% 27.2% 2,706American Indian (U.S.) 0.0% 13.3% 53.3% 33.3% 15Asian (U.S.) 0.8% 5.8% 72.3% 21.1% 1,005Black (U.S.) 2.0% 6.5% 63.8% 27.6% 199Hispanic (U.S.) 1.2% 5.2% 66.7% 27.0% 504White (U.S.) .8% 4.5% 63.7% 31.1% 2,202Multiracial URM (U.S.) .0% 4.8% 68.7% 26.5% 147Multiracial non-URM (U.S.) 1.3% 2.0% 75.8% 20.8% 149Unknown (U.S.) 2.8% 16.7% 61.1% 19.4% 36International (any race/ethnicity) 1.5% 4.9% 62.3% 31.3% 326Agriculture & Life Sciences .8% 4.3% 63.2% 31.7% 1,050Art, Architecture, & Planning 2.0% 8.8% 65.7% 23.5% 102Arts & Sciences 1.4% 4.6% 66.2% 27.9% 1,398Engineering 0.6% 4.7% 69.6% 25.1% 1,101Hotel Administration .0% 6.1% 60.6% 33.3% 213Human Ecology 1.2% 6.9% 68.4% 23.4% 418Industrial & Labor Relations .7% 6.0% 67.1% 26.2% 301
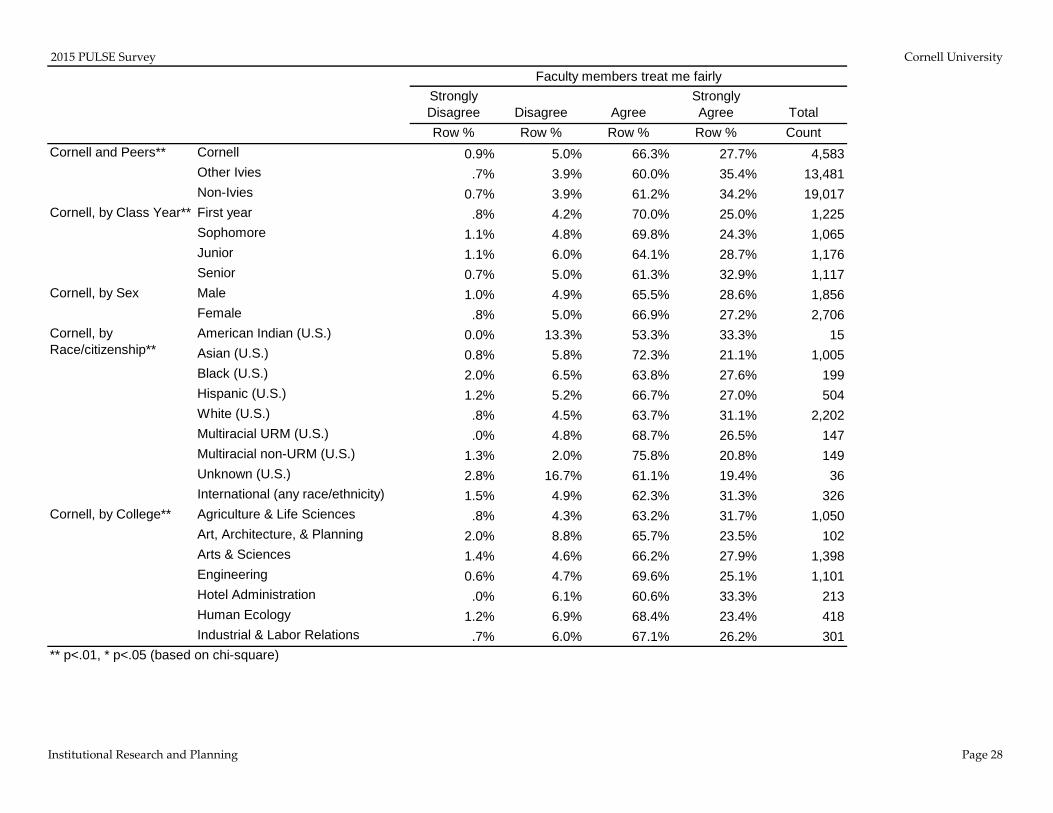
Faculty members treat me fairly
Cornell and Peers**
Cornell, by Class Year**
Cornell, by Sex
Cornell, by Race/citizenship**
Cornell, by College**
** p<.01, * p<.05 (based on chi-square)

2015 PULSE Survey Cornell University
Institutional Research and Planning Page 29
Strongly Disagree Disagree Agree
Strongly Agree Total
Row % Row % Row % Row % CountCornell 4.5% 15.8% 51.6% 28.1% 4,577Other Ivies 4.0% 13.8% 50.2% 32.0% 13,470Non-Ivies 3.3% 11.8% 50.5% 34.3% 19,020First year 4.3% 15.5% 54.2% 26.0% 1,223Sophomore 4.9% 16.1% 53.3% 25.8% 1,064Junior 4.4% 15.1% 50.3% 30.1% 1,171Senior 4.6% 16.5% 48.6% 30.3% 1,119Male 4.3% 13.5% 54.5% 27.7% 1,853Female 4.7% 17.4% 49.6% 28.4% 2,703American Indian (U.S.) 6.7% 33.3% 46.7% 13.3% 15Asian (U.S.) 3.3% 16.7% 58.0% 22.0% 1,003Black (U.S.) 4.5% 6.5% 55.0% 34.0% 200Hispanic (U.S.) 6.0% 16.6% 46.6% 30.8% 500White (U.S.) 5.1% 16.0% 49.7% 29.3% 2,198Multiracial URM (U.S.) 3.4% 19.6% 52.7% 24.3% 148Multiracial non-URM (U.S.) 4.1% 12.8% 58.8% 24.3% 148Unknown (U.S.) 5.4% 18.9% 54.1% 21.6% 37International (any race/ethnicity) 3.4% 14.3% 47.0% 35.4% 328Agriculture & Life Sciences 3.1% 12.8% 45.7% 38.4% 1,047Art, Architecture, & Planning 4.8% 30.8% 43.3% 21.2% 104Arts & Sciences 5.4% 15.9% 51.8% 27.0% 1,395Engineering 3.9% 16.8% 58.2% 21.1% 1,102Hotel Administration 4.7% 15.6% 50.7% 28.9% 211Human Ecology 5.5% 15.5% 51.3% 27.7% 419Industrial & Labor Relations 6.7% 17.1% 51.5% 24.7% 299
I can talk with my academic advisor(s) when I need to
Cornell and Peers**
Cornell, by Class Year
Cornell, by Sex**
Cornell, by Race/citizenship**
Cornell, by College**
** p<.01, * p<.05 (based on chi-square)

2015 PULSE Survey Cornell University
Institutional Research and Planning Page 30
Strongly Disagree Disagree Agree
Strongly Agree Total
Row % Row % Row % Row % CountCornell 1.5% 9.4% 62.1% 27.1% 4,574Other Ivies 1.6% 9.4% 61.0% 28.0% 13,456Non-Ivies 1.2% 9.0% 60.4% 29.4% 18,973First year .9% 7.8% 62.8% 28.5% 1,226Sophomore 1.5% 9.8% 63.8% 24.9% 1,061Junior 1.9% 10.5% 60.4% 27.3% 1,174Senior 1.7% 9.5% 61.4% 27.4% 1,113Male 1.5% 8.3% 63.6% 26.6% 1,850Female 1.5% 10.1% 60.9% 27.5% 2,703American Indian (U.S.) 0.0% 13.3% 73.3% 13.3% 15Asian (U.S.) 1.0% 9.8% 67.2% 22.1% 1,005Black (U.S.) 2.0% 8.5% 56.5% 33.0% 200Hispanic (U.S.) 1.4% 10.8% 57.5% 30.3% 499White (U.S.) 1.6% 9.0% 61.1% 28.3% 2,198Multiracial URM (U.S.) 2.1% 11.0% 61.6% 25.3% 146Multiracial non-URM (U.S.) 1.4% 7.4% 72.3% 18.9% 148Unknown (U.S.) 2.7% 24.3% 51.4% 21.6% 37International (any race/ethnicity) 1.8% 7.4% 59.2% 31.6% 326Agriculture & Life Sciences .9% 7.5% 60.8% 30.8% 1,047Art, Architecture, & Planning 1.0% 14.3% 63.8% 21.0% 105Arts & Sciences 1.8% 11.1% 61.7% 25.4% 1,392Engineering 1.5% 8.3% 63.3% 26.9% 1,102Hotel Administration .0% 5.7% 61.8% 32.5% 212Human Ecology 1.9% 10.8% 62.3% 25.0% 416Industrial & Labor Relations 3.0% 10.3% 62.7% 24.0% 300
Cornell, by Class Year
Cornell, by Sex
Cornell, by Race/citizenship**
Cornell, by College**
** p<.01, * p<.05 (based on chi-square)
Help with academic work is available to me
Cornell and Peers**

2015 PULSE Survey Cornell University
Institutional Research and Planning Page 31
0 1 2 3 4 5 or more TotalRow % Row % Row % Row % Row % Row % Count
Cornell 23.4% 24.6% 26.6% 15.5% 6.1% 3.7% 4,593Other Ivies 14.7% 22.1% 30.4% 19.0% 7.8% 6.2% 13,517Non-Ivies 16.0% 22.6% 29.3% 18.5% 7.8% 5.8% 19,065First year 41.5% 29.8% 19.9% 6.1% 1.7% 1.0% 1,229Sophomore 26.3% 28.9% 25.9% 12.2% 4.2% 2.4% 1,068Junior 15.0% 22.2% 32.7% 18.7% 7.6% 3.8% 1,177Senior 9.6% 17.5% 28.2% 25.6% 11.3% 7.8% 1,119Male 26.9% 23.5% 25.6% 13.8% 5.4% 4.7% 1,857Female 20.9% 25.5% 27.3% 16.6% 6.7% 3.0% 2,715American Indian (U.S.) 26.7% 13.3% 6.7% 33.3% 20.0% 0.0% 15Asian (U.S.) 29.3% 25.5% 26.8% 13.2% 3.7% 1.6% 1,008Black (U.S.) 20.5% 20.5% 30.5% 17.0% 7.5% 4.0% 200Hispanic (U.S.) 19.9% 24.5% 28.6% 17.1% 7.0% 3.0% 503White (U.S.) 21.6% 23.8% 25.9% 16.4% 7.5% 4.7% 2,205Multiracial URM (U.S.) 23.6% 25.7% 28.4% 15.5% 3.4% 3.4% 148Multiracial non-URM (U.S.) 22.8% 29.5% 28.2% 12.1% 3.4% 4.0% 149Unknown (U.S.) 35.1% 27.0% 18.9% 5.4% 8.1% 5.4% 37International (any race/ethnicity) 23.2% 28.4% 25.6% 14.6% 4.0% 4.3% 328Agriculture & Life Sciences 16.2% 24.1% 27.9% 19.9% 7.3% 4.7% 1,052Art, Architecture, & Planning 12.4% 16.2% 28.6% 22.9% 10.5% 9.5% 105Arts & Sciences 21.9% 25.6% 26.6% 15.6% 5.9% 4.2% 1,400Engineering 36.8% 25.9% 22.7% 9.6% 3.5% 1.5% 1,103Hotel Administration 12.2% 21.6% 31.5% 23.0% 6.6% 5.2% 213Human Ecology 18.1% 25.3% 28.9% 15.8% 8.1% 3.8% 419Industrial & Labor Relations 25.6% 21.3% 29.6% 12.6% 8.0% 3.0% 301
Cornell, by College**
** p<.01, * p<.05 (based on chi-square)
How many faculty members know you well enough to provide a letter of recommendation in support of an application for a job, internship, fellowship, or advanced degree work?
Cornell and Peers**
Cornell, by Class Year**
Cornell, by Sex**
Cornell, by Race/citizenship**

2015 PULSE Survey Cornell University
Institutional Research and Planning Page 32
Yes No TotalRow % Row % Count
Cornell 55.5% 44.5% 4,583Other Ivies 61.5% 38.5% 13,515Non-Ivies 62.4% 37.6% 19,039First year 41.1% 58.9% 1,225Sophomore 51.1% 48.9% 1,066Junior 60.6% 39.4% 1,176Senior 70.3% 29.7% 1,116Male 53.0% 47.0% 1,857Female 57.4% 42.6% 2,705American Indian (U.S.) 53.3% 46.7% 15Asian (U.S.) 48.0% 52.0% 1,004Black (U.S.) 68.5% 31.5% 200Hispanic (U.S.) 59.7% 40.3% 504White (U.S.) 58.2% 41.8% 2,202Multiracial URM (U.S.) 55.8% 44.2% 147Multiracial non-URM (U.S.) 53.7% 46.3% 149Unknown (U.S.) 50.0% 50.0% 36International (any race/ethnicity) 47.5% 52.5% 326Agriculture & Life Sciences 64.8% 35.2% 1,048Art, Architecture, & Planning 65.4% 34.6% 104Arts & Sciences 55.6% 44.4% 1,400Engineering 42.5% 57.5% 1,102Hotel Administration 67.9% 32.1% 212Human Ecology 58.5% 41.5% 417Industrial & Labor Relations 54.7% 45.3% 300
Cornell, by College**
** p<.01, * p<.05 (based on chi-square)
Is there at least one faculty member at Cornell/your institution who has taken a
personal interest in your success?
Cornell and Peers**
Cornell, by Class Year**
Cornell, by Sex**
Cornell, by Race/citizenship**
2015 PULSE Survey Cornell University
Institutional Research and Planning Page 33
No, I have not sought advice
from my academic advisor
Yes I have, but it was not very helpful
Yes I have, and it helped
some
Yes I have, and it helped
quite a bit TotalRow % Row % Row % Row % Count
Cornell 23.0% 20.8% 36.8% 19.4% 4,594Other Ivies 21.5% 20.6% 38.1% 19.7% 13,500Non-Ivies 20.6% 17.9% 39.9% 21.6% 19,054First year 23.1% 21.9% 38.8% 16.3% 1,230Sophomore 25.8% 20.4% 37.0% 16.9% 1,066Junior 21.8% 20.0% 36.8% 21.3% 1,178Senior 21.6% 20.9% 34.3% 23.2% 1,120Male 26.9% 18.6% 36.4% 18.1% 1,857Female 20.5% 22.2% 37.1% 20.3% 2,716American Indian (U.S.) 33.3% 13.3% 33.3% 20.0% 15Asian (U.S.) 24.7% 21.4% 40.0% 13.9% 1,008Black (U.S.) 23.5% 13.5% 32.0% 31.0% 200Hispanic (U.S.) 20.4% 20.8% 33.5% 25.3% 505White (U.S.) 23.1% 21.2% 35.8% 19.9% 2,204Multiracial URM (U.S.) 21.6% 18.2% 42.6% 17.6% 148Multiracial non-URM (U.S.) 25.5% 18.1% 38.9% 17.4% 149Unknown (U.S.) 21.6% 18.9% 40.5% 18.9% 37International (any race/ethnicity) 20.1% 23.5% 37.8% 18.6% 328Agriculture & Life Sciences 13.0% 18.6% 40.0% 28.4% 1,051Art, Architecture, & Planning 23.8% 30.5% 32.4% 13.3% 105Arts & Sciences 22.8% 22.0% 36.9% 18.3% 1,402Engineering 29.6% 20.6% 34.5% 15.4% 1,103Hotel Administration 28.6% 19.2% 34.3% 17.8% 213Human Ecology 17.2% 25.5% 40.3% 16.9% 419Industrial & Labor Relations 39.2% 14.6% 31.6% 14.6% 301
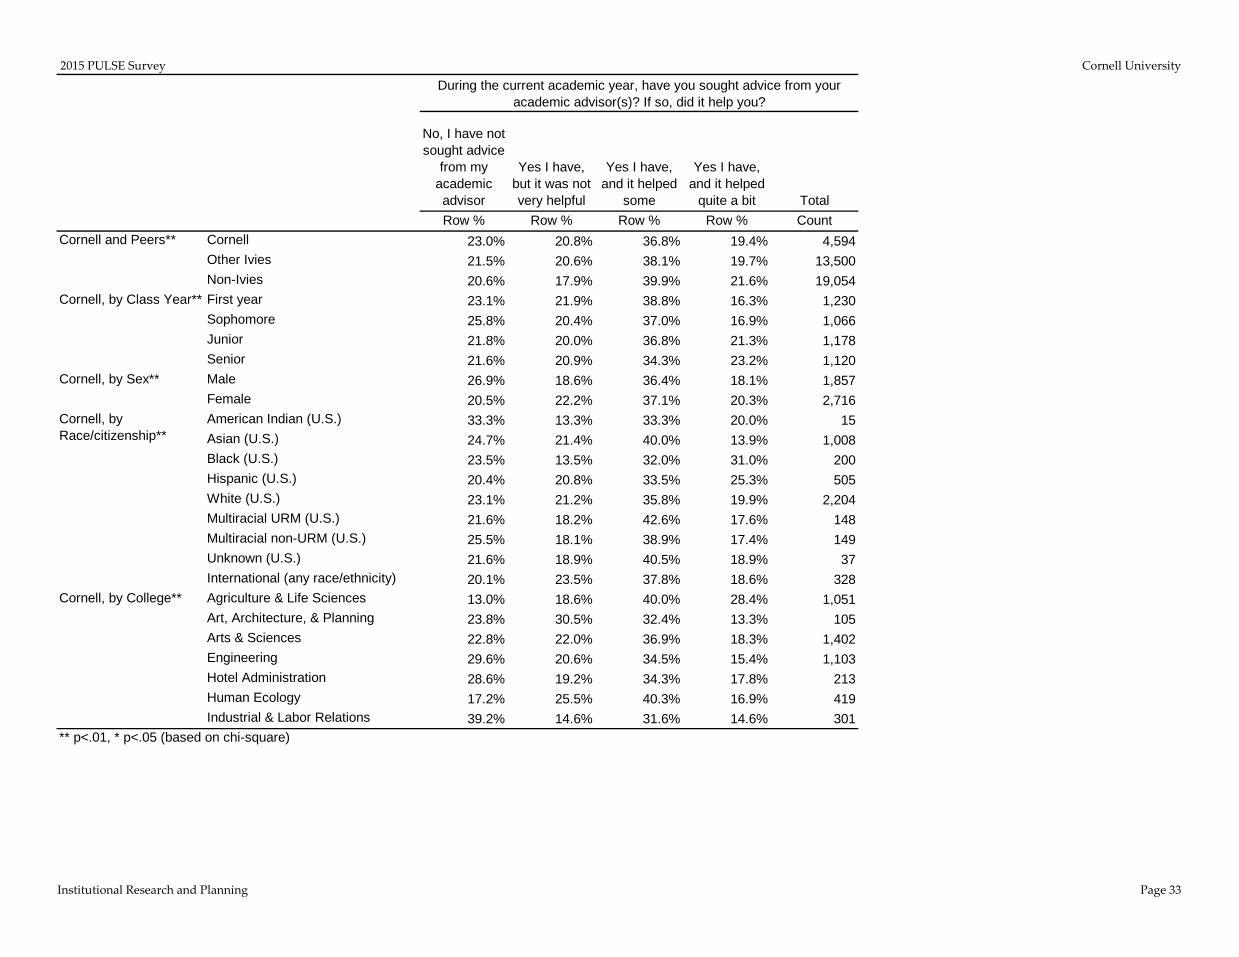
During the current academic year, have you sought advice from your academic advisor(s)? If so, did it help you?
Cornell and Peers**
Cornell, by Class Year**
Cornell, by Sex**
Cornell, by Race/citizenship**
Cornell, by College**
** p<.01, * p<.05 (based on chi-square)

2015 PULSE Survey Cornell University
Institutional Research and Planning Page 34
Not very Helpful
Somewhat Helpful Very helpful Not used Total
Row % Row % Row % Row % CountCornell 5.3% 23.2% 64.7% 6.8% 4,582Other Ivies 4.8% 22.0% 64.7% 8.5% 11,170Non-Ivies 5.0% 24.3% 60.9% 9.8% 18,382First year 4.7% 25.1% 63.9% 6.3% 1,227Sophomore 4.6% 22.2% 68.3% 5.0% 1,068Junior 5.2% 23.4% 64.5% 6.9% 1,173Senior 6.7% 21.9% 62.2% 9.2% 1,114Male 7.0% 25.8% 58.3% 8.9% 1,850Female 4.2% 21.4% 69.1% 5.3% 2,711American Indian (U.S.) 6.7% 33.3% 40.0% 20.0% 15Asian (U.S.) 5.4% 25.0% 64.7% 5.0% 1,006Black (U.S.) 6.0% 29.0% 56.5% 8.5% 200Hispanic (U.S.) 5.2% 25.8% 62.9% 6.2% 504White (U.S.) 5.1% 21.6% 65.3% 8.1% 2,198Multiracial URM (U.S.) 5.4% 23.1% 65.3% 6.1% 147Multiracial non-URM (U.S.) 6.0% 23.5% 64.4% 6.0% 149Unknown (U.S.) 11.1% 13.9% 58.3% 16.7% 36International (any race/ethnicity) 5.2% 21.7% 69.7% 3.4% 327Agriculture & Life Sciences 4.4% 21.3% 68.0% 6.4% 1,049Art, Architecture, & Planning 5.7% 32.4% 51.4% 10.5% 105Arts & Sciences 4.9% 22.7% 66.9% 5.4% 1,397Engineering 7.5% 24.9% 56.6% 11.0% 1,102Hotel Administration 6.5% 22.4% 67.8% 3.3% 214Human Ecology 3.4% 25.7% 66.6% 4.3% 416Industrial & Labor Relations 3.7% 20.1% 71.9% 4.3% 299
Cornell, by Class Year**
Cornell, by Sex**
Cornell, by Race/citizenship**
Cornell, by College**
** p<.01, * p<.05 (based on chi-square)
During the current academic year, how helpful have library study spaces been to you?
Cornell and Peers**
2015 PULSE Survey Cornell University
Institutional Research and Planning Page 35
Not very Helpful
Somewhat Helpful Very helpful Not used Total
Row % Row % Row % Row % CountCornell 15.1% 27.2% 15.3% 42.4% 4,583Other Ivies 10.1% 23.7% 15.3% 50.9% 11,147Non-Ivies 11.3% 20.9% 13.5% 54.2% 18,344First year 13.5% 26.2% 15.2% 45.0% 1,227Sophomore 15.8% 27.4% 13.2% 43.6% 1,066Junior 15.3% 28.0% 15.9% 40.8% 1,173Senior 16.0% 27.1% 16.7% 40.2% 1,117Male 16.6% 27.1% 14.5% 41.7% 1,850Female 14.1% 27.3% 15.7% 42.8% 2,712American Indian (U.S.) 20.0% 20.0% 6.7% 53.3% 15Asian (U.S.) 16.1% 31.0% 15.1% 37.7% 1,004Black (U.S.) 13.5% 28.0% 21.0% 37.5% 200Hispanic (U.S.) 16.8% 22.6% 17.4% 43.2% 505White (U.S.) 15.1% 25.5% 13.5% 45.8% 2,200Multiracial URM (U.S.) 12.9% 26.5% 10.9% 49.7% 147Multiracial non-URM (U.S.) 14.8% 28.2% 11.4% 45.6% 149Unknown (U.S.) 11.1% 27.8% 11.1% 50.0% 36International (any race/ethnicity) 11.3% 33.3% 25.1% 30.3% 327Agriculture & Life Sciences 12.3% 27.3% 16.7% 43.7% 1,051Art, Architecture, & Planning 9.5% 31.4% 30.5% 28.6% 105Arts & Sciences 14.2% 29.5% 16.2% 40.2% 1,398Engineering 18.6% 22.1% 9.0% 50.3% 1,100Hotel Administration 19.2% 28.6% 13.6% 38.5% 213Human Ecology 17.5% 27.1% 15.8% 39.6% 417Industrial & Labor Relations 12.0% 32.4% 24.1% 31.4% 299
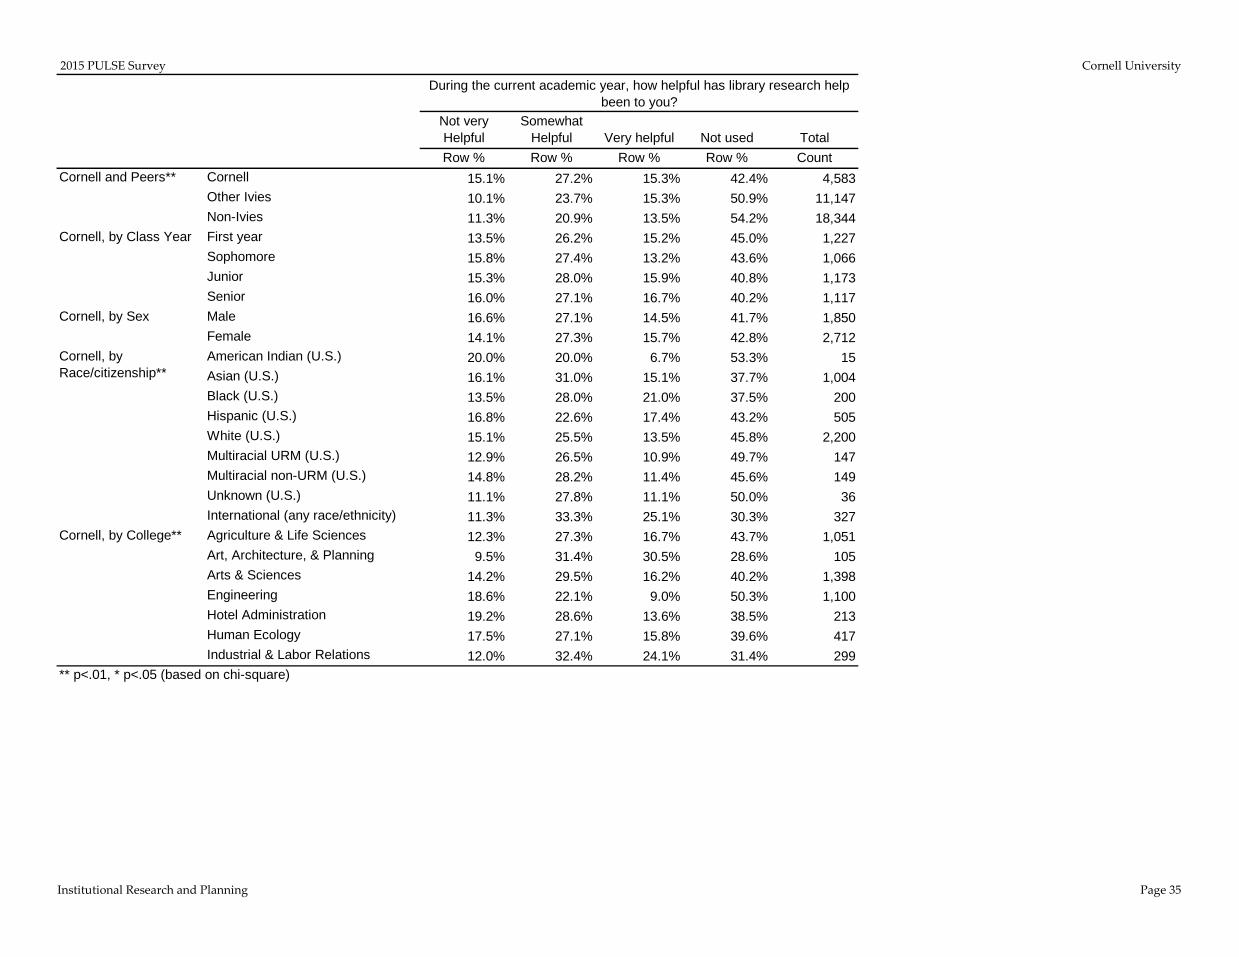
During the current academic year, how helpful has library research help been to you?
Cornell and Peers**
Cornell, by Class Year
Cornell, by Sex
Cornell, by Race/citizenship**
Cornell, by College**
** p<.01, * p<.05 (based on chi-square)

2015 PULSE Survey Cornell University
Institutional Research and Planning Page 36
Not very Helpful
Somewhat Helpful Very helpful Not used Total
Row % Row % Row % Row % CountCornell 8.6% 28.5% 49.1% 13.9% 4,578Other Ivies 6.1% 25.5% 55.5% 12.9% 11,157Non-Ivies 6.7% 25.7% 49.7% 17.9% 18,369First year 9.5% 29.9% 42.7% 17.9% 1,228Sophomore 8.4% 32.2% 46.1% 13.3% 1,064Junior 8.1% 26.2% 52.0% 13.7% 1,173Senior 8.2% 25.7% 56.1% 10.1% 1,113Male 9.9% 30.2% 46.4% 13.4% 1,850Female 7.6% 27.3% 51.0% 14.1% 2,707American Indian (U.S.) 20.0% 20.0% 40.0% 20.0% 15Asian (U.S.) 9.7% 32.3% 42.6% 15.4% 1,005Black (U.S.) 10.5% 20.0% 58.0% 11.5% 200Hispanic (U.S.) 8.0% 24.7% 54.5% 12.9% 503White (U.S.) 8.0% 28.9% 48.2% 14.9% 2,199Multiracial URM (U.S.) 8.9% 28.1% 49.3% 13.7% 146Multiracial non-URM (U.S.) 10.1% 29.1% 48.6% 12.2% 148Unknown (U.S.) 8.6% 25.7% 45.7% 20.0% 35International (any race/ethnicity) 7.3% 25.4% 62.4% 4.9% 327Agriculture & Life Sciences 8.4% 28.4% 49.9% 13.3% 1,049Art, Architecture, & Planning 4.8% 27.6% 61.9% 5.7% 105Arts & Sciences 8.2% 26.0% 52.9% 12.9% 1,398Engineering 10.4% 30.2% 39.6% 19.8% 1,098Hotel Administration 9.9% 27.2% 57.3% 5.6% 213Human Ecology 10.3% 31.0% 44.7% 13.9% 416Industrial & Labor Relations 2.3% 31.1% 59.5% 7.0% 299
Not very Helpful
Somewhat Helpful Very helpful Not used Total
Row % Row % Row % Row % CountCornell 20.8% 22.0% 11.3% 45.9% 4,574Other Ivies 16.0% 17.1% 8.5% 58.4% 11,147Non-Ivies 16.0% 15.6% 8.4% 60.0% 18,352First year 18.9% 28.3% 11.5% 41.2% 1,225
During the current academic year, how helpful have library classes and presentations been to you?
Cornell and Peers**
Cornell, by Class Year**
Cornell, by Sex**
Cornell, by Race/citizenship**
Cornell, by College**
** p<.01, * p<.05 (based on chi-square)
During the current academic year, how helpful have library electronic and print resources been to you?
Cornell and Peers**
Cornell, by Class Year**

2015 PULSE Survey Cornell University
Institutional Research and Planning Page 37
Sophomore 21.8% 19.7% 11.3% 47.2% 1,064Junior 20.6% 20.6% 11.6% 47.2% 1,172Senior 22.2% 18.7% 10.7% 48.4% 1,113Male 22.0% 20.4% 11.1% 46.6% 1,847Female 20.0% 23.2% 11.5% 45.3% 2,706American Indian (U.S.) 20.0% 20.0% 20.0% 40.0% 15Asian (U.S.) 23.0% 27.2% 10.7% 39.1% 1,003Black (U.S.) 17.5% 22.0% 17.0% 43.5% 200Hispanic (U.S.) 19.1% 21.9% 14.5% 44.4% 502White (U.S.) 21.8% 18.6% 9.2% 50.4% 2,198Multiracial URM (U.S.) 13.6% 23.8% 12.9% 49.7% 147Multiracial non-URM (U.S.) 23.5% 21.5% 5.4% 49.7% 149Unknown (U.S.) 17.1% 17.1% 5.7% 60.0% 35International (any race/ethnicity) 14.2% 29.5% 20.6% 35.7% 325Agriculture & Life Sciences 17.7% 21.3% 12.4% 48.6% 1,047Art, Architecture, & Planning 20.0% 23.8% 20.0% 36.2% 105Arts & Sciences 21.3% 22.1% 11.8% 44.7% 1,397Engineering 23.5% 17.4% 6.8% 52.3% 1,098Hotel Administration 24.3% 21.0% 15.4% 39.3% 214Human Ecology 19.0% 28.4% 9.2% 43.4% 415Industrial & Labor Relations 19.8% 32.2% 18.1% 29.9% 298
Cornell, by Race/citizenship**
Cornell, by College**
** p<.01, * p<.05 (based on chi-square)
Cornell, by Sex

2015 PULSE Survey Cornell University
Institutional Research and Planning Page 38
Unprepared Somewhat Prepared
Quite Well Prepared
Very Well Prepared Total
Row % Row % Row % Row % CountCornell 7.2% 31.8% 38.9% 22.2% 1,214Other Ivies 6.9% 28.9% 39.7% 24.5% 3,548Non-Ivies 6.6% 30.0% 38.5% 24.9% 5,411First year 7.2% 31.8% 38.9% 22.2% 1,214SophomoreJuniorSeniorMale 6.0% 27.2% 40.9% 25.8% 496Female 8.0% 34.9% 37.4% 19.6% 713American Indian (U.S.) 25.0% 0.0% 75.0% 0.0% 4Asian (U.S.) 9.1% 33.7% 44.1% 13.1% 297Black (U.S.) 15.5% 39.7% 29.3% 15.5% 58Hispanic (U.S.) 7.1% 36.2% 36.9% 19.9% 141White (U.S.) 4.3% 27.4% 38.1% 30.2% 533Multiracial URM (U.S.) 9.8% 41.5% 26.8% 22.0% 41Multiracial non-URM (U.S.) 8.1% 27.0% 43.2% 21.6% 37Unknown (U.S.) 14.3% 28.6% 42.9% 14.3% 7International (any race/ethnicity) 9.4% 38.5% 37.5% 14.6% 96Agriculture & Life Sciences 10.9% 37.6% 35.4% 16.2% 229Art, Architecture, & Planning 7.4% 29.6% 37.0% 25.9% 27Arts & Sciences 4.9% 30.6% 38.5% 26.0% 431Engineering 7.4% 31.2% 40.4% 21.0% 324Hotel Administration 4.7% 25.6% 46.5% 23.3% 43Human Ecology 10.9% 34.7% 32.7% 21.8% 101Industrial & Labor Relations 3.4% 22.0% 52.5% 22.0% 59
** p<.01, * p<.05 (based on chi-square)
Looking back to when you started at Cornell/your institution, how well prepared do you think you were to: Succeed academically
Cornell and Peers
Cornell, by Class Year
Cornell, by Sex**
Cornell, by Race/citizenship**
Question only asked of first year students.
Cornell, by College
2015 PULSE Survey Cornell University
Institutional Research and Planning Page 39
Unprepared Somewhat Prepared
Quite Well Prepared
Very Well Prepared Total
Row % Row % Row % Row % CountCornell 7.8% 28.3% 41.0% 23.0% 1,211Other Ivies 7.1% 24.4% 39.6% 28.9% 3,545Non-Ivies 5.9% 25.8% 39.6% 28.7% 5,404First year 7.8% 28.3% 41.0% 23.0% 1,211SophomoreJuniorSeniorMale 9.1% 29.2% 40.3% 21.4% 496Female 6.8% 27.6% 41.4% 24.2% 710American Indian (U.S.) 0.0% 25.0% 25.0% 50.0% 4Asian (U.S.) 10.5% 34.8% 41.9% 12.8% 296Black (U.S.) 6.9% 20.7% 46.6% 25.9% 58Hispanic (U.S.) 7.8% 19.9% 41.1% 31.2% 141White (U.S.) 5.5% 24.8% 42.5% 27.3% 532Multiracial URM (U.S.) 10.0% 32.5% 27.5% 30.0% 40Multiracial non-URM (U.S.) 5.4% 13.5% 51.4% 29.7% 37Unknown (U.S.) 14.3% 28.6% 28.6% 28.6% 7International (any race/ethnicity) 12.5% 49.0% 29.2% 9.4% 96Agriculture & Life Sciences 7.0% 29.7% 34.5% 28.8% 229Art, Architecture, & Planning 3.7% 48.1% 33.3% 14.8% 27Arts & Sciences 9.1% 30.0% 40.5% 20.5% 430Engineering 8.1% 28.6% 43.5% 19.9% 322Hotel Administration 4.7% 25.6% 41.9% 27.9% 43Human Ecology 6.9% 21.8% 48.5% 22.8% 101Industrial & Labor Relations 5.1% 13.6% 45.8% 35.6% 59
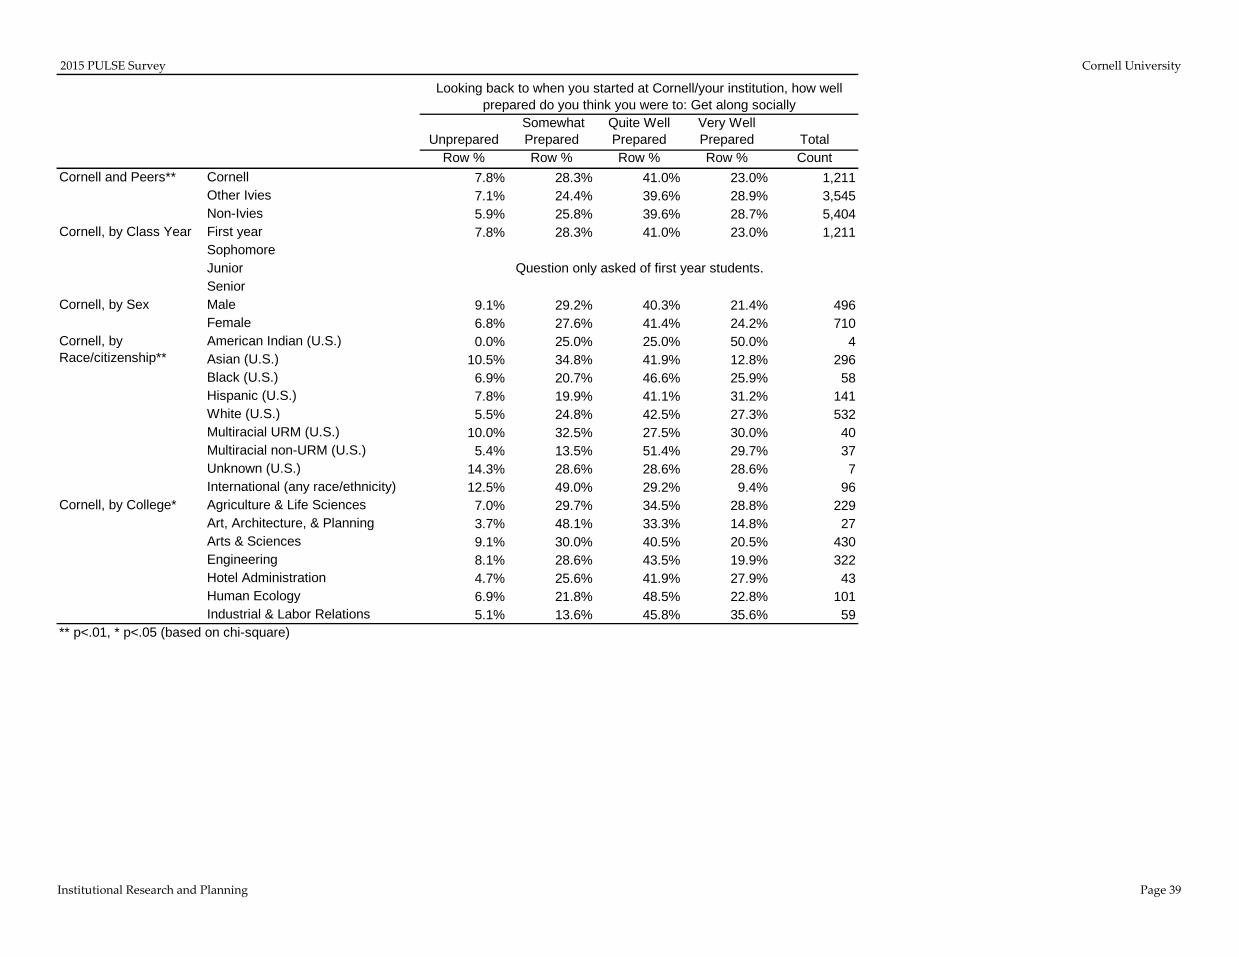
Cornell, by Race/citizenship**
Cornell, by College*
** p<.01, * p<.05 (based on chi-square)
Looking back to when you started at Cornell/your institution, how well prepared do you think you were to: Get along socially
Cornell and Peers**
Cornell, by Class Year
Cornell, by Sex
Question only asked of first year students.
2015 PULSE Survey Cornell University
Institutional Research and Planning Page 40
Unprepared Somewhat Prepared
Quite Well Prepared
Very Well Prepared Total
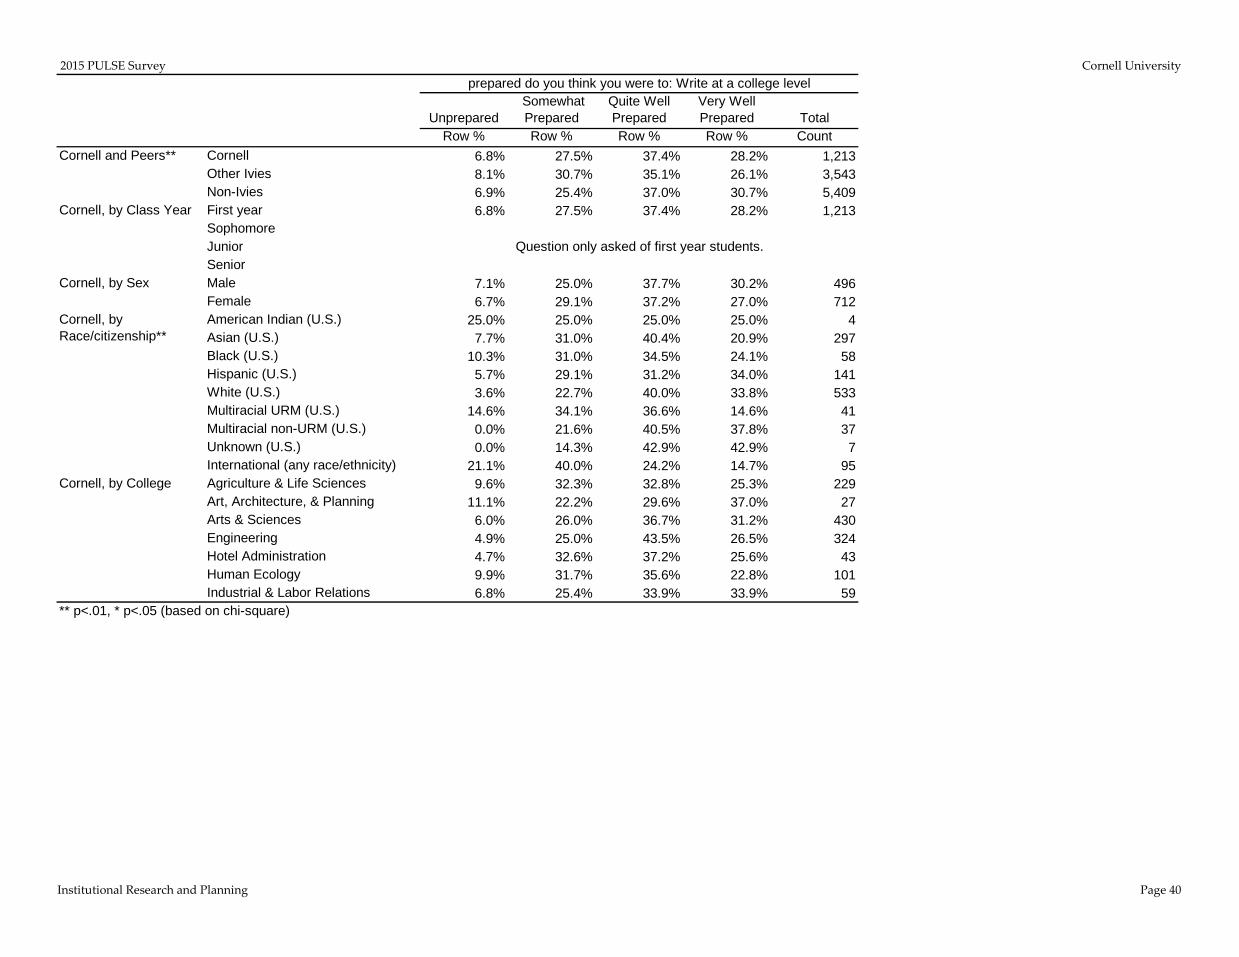
Row % Row % Row % Row % CountCornell 6.8% 27.5% 37.4% 28.2% 1,213Other Ivies 8.1% 30.7% 35.1% 26.1% 3,543Non-Ivies 6.9% 25.4% 37.0% 30.7% 5,409First year 6.8% 27.5% 37.4% 28.2% 1,213SophomoreJuniorSeniorMale 7.1% 25.0% 37.7% 30.2% 496Female 6.7% 29.1% 37.2% 27.0% 712American Indian (U.S.) 25.0% 25.0% 25.0% 25.0% 4Asian (U.S.) 7.7% 31.0% 40.4% 20.9% 297Black (U.S.) 10.3% 31.0% 34.5% 24.1% 58Hispanic (U.S.) 5.7% 29.1% 31.2% 34.0% 141White (U.S.) 3.6% 22.7% 40.0% 33.8% 533Multiracial URM (U.S.) 14.6% 34.1% 36.6% 14.6% 41Multiracial non-URM (U.S.) 0.0% 21.6% 40.5% 37.8% 37Unknown (U.S.) 0.0% 14.3% 42.9% 42.9% 7International (any race/ethnicity) 21.1% 40.0% 24.2% 14.7% 95Agriculture & Life Sciences 9.6% 32.3% 32.8% 25.3% 229Art, Architecture, & Planning 11.1% 22.2% 29.6% 37.0% 27Arts & Sciences 6.0% 26.0% 36.7% 31.2% 430Engineering 4.9% 25.0% 43.5% 26.5% 324Hotel Administration 4.7% 32.6% 37.2% 25.6% 43Human Ecology 9.9% 31.7% 35.6% 22.8% 101Industrial & Labor Relations 6.8% 25.4% 33.9% 33.9% 59
Cornell, by Sex
Cornell, by Race/citizenship**
Cornell, by College
** p<.01, * p<.05 (based on chi-square)
prepared do you think you were to: Write at a college level
Cornell and Peers**
Cornell, by Class Year
Question only asked of first year students.

2015 PULSE Survey Cornell University
Institutional Research and Planning Page 41
Unprepared Somewhat Prepared
Quite Well Prepared
Very Well Prepared Total
Row % Row % Row % Row % CountCornell 7.7% 28.9% 39.6% 23.7% 1,214Other Ivies 10.8% 31.6% 35.3% 22.2% 3,538Non-Ivies 8.8% 29.7% 37.1% 24.5% 5,403First year 7.7% 28.9% 39.6% 23.7% 1,214SophomoreJuniorSeniorMale 5.2% 23.2% 41.7% 29.8% 496Female 9.5% 33.0% 38.0% 19.5% 713American Indian (U.S.) 0.0% 50.0% 25.0% 25.0% 4Asian (U.S.) 5.1% 30.6% 45.1% 19.2% 297Black (U.S.) 20.7% 29.3% 31.0% 19.0% 58Hispanic (U.S.) 9.9% 31.9% 40.4% 17.7% 141White (U.S.) 5.8% 26.6% 39.2% 28.3% 533Multiracial URM (U.S.) 14.6% 41.5% 22.0% 22.0% 41Multiracial non-URM (U.S.) 13.5% 24.3% 43.2% 18.9% 37Unknown (U.S.) 28.6% 14.3% 42.9% 14.3% 7International (any race/ethnicity) 9.4% 28.1% 35.4% 27.1% 96Agriculture & Life Sciences 12.7% 31.9% 37.1% 18.3% 229Art, Architecture, & Planning 11.1% 37.0% 40.7% 11.1% 27Arts & Sciences 7.0% 30.6% 37.8% 24.6% 431Engineering 4.3% 22.5% 42.0% 31.2% 324Hotel Administration 2.3% 30.2% 37.2% 30.2% 43Human Ecology 11.9% 30.7% 41.6% 15.8% 101Industrial & Labor Relations 8.5% 32.2% 47.5% 11.9% 59
Cornell, by Class Year
Cornell, by Sex**
Cornell, by Race/citizenship**
Cornell, by College**
** p<.01, * p<.05 (based on chi-square)
Looking back to when you started at Cornell/your institution, how well prepared do you think you were to: Do the math and quantitative work
required of you
Cornell and Peers**
Question only asked of first year students.

2015 PULSE Survey Cornell University
Institutional Research and Planning Page 42
Unprepared Somewhat Prepared
Quite Well Prepared
Very Well Prepared Total
Row % Row % Row % Row % CountCornell 12.8% 28.2% 36.1% 22.9% 1,202Other Ivies 8.1% 20.8% 35.4% 35.8% 2,951Non-Ivies 7.1% 22.0% 35.9% 35.0% 1,067First year 12.8% 28.2% 36.1% 22.9% 1,202SophomoreJuniorSeniorMale 12.3% 27.5% 37.2% 22.9% 494Female 13.1% 28.6% 35.3% 23.0% 703American Indian (U.S.) 25.0% 50.0% 0.0% 25.0% 4Asian (U.S.) 17.9% 32.4% 35.8% 13.9% 296Black (U.S.) 19.0% 27.6% 22.4% 31.0% 58Hispanic (U.S.) 17.3% 21.6% 35.3% 25.9% 139White (U.S.) 8.1% 28.2% 38.0% 25.7% 529Multiracial URM (U.S.) 15.0% 25.0% 40.0% 20.0% 40Multiracial non-URM (U.S.) 8.6% 20.0% 45.7% 25.7% 35Unknown (U.S.) 0.0% 33.3% 50.0% 16.7% 6International (any race/ethnicity) 13.7% 28.4% 31.6% 26.3% 95Agriculture & Life Sciences 12.4% 28.8% 35.4% 23.5% 226Art, Architecture, & Planning 22.2% 18.5% 44.4% 14.8% 27Arts & Sciences 13.6% 28.4% 36.4% 21.6% 426Engineering 10.9% 27.3% 35.7% 26.1% 322Hotel Administration 7.1% 35.7% 33.3% 23.8% 42Human Ecology 13.0% 27.0% 41.0% 19.0% 100Industrial & Labor Relations 18.6% 30.5% 28.8% 22.0% 59
Cornell and Peers**
Cornell, by Class Year
Cornell, by Sex
Cornell, by Race/citizenship**
Cornell, by College
** p<.01, * p<.05 (based on chi-square)
Looking back to when you started at Cornell/your institution, how well prepared do you think you were to: Have a roommate
Question only asked of first year students.

2015 PULSE Survey Cornell University
Institutional Research and Planning Page 43
Unprepared Somewhat Prepared
Quite Well Prepared
Very Well Prepared Total
Row % Row % Row % Row % CountCornell 11.9% 35.1% 34.2% 18.8% 1,213Other Ivies 10.9% 32.5% 32.9% 23.8% 2,967Non-Ivies 11.1% 31.5% 33.8% 23.6% 4,209First year 11.9% 35.1% 34.2% 18.8% 1,213SophomoreJuniorSeniorMale 12.7% 34.5% 34.3% 18.5% 496Female 11.4% 35.5% 34.0% 19.1% 712American Indian (U.S.) 0.0% 25.0% 25.0% 50.0% 4Asian (U.S.) 13.5% 42.1% 32.7% 11.8% 297Black (U.S.) 20.7% 39.7% 27.6% 12.1% 58Hispanic (U.S.) 14.2% 33.3% 34.8% 17.7% 141White (U.S.) 8.4% 31.1% 36.6% 23.8% 533Multiracial URM (U.S.) 14.6% 43.9% 26.8% 14.6% 41Multiracial non-URM (U.S.) 13.5% 29.7% 24.3% 32.4% 37Unknown (U.S.) 0.0% 57.1% 28.6% 14.3% 7International (any race/ethnicity) 16.8% 32.6% 36.8% 13.7% 95Agriculture & Life Sciences 14.8% 34.5% 29.7% 21.0% 229Art, Architecture, & Planning 14.8% 29.6% 40.7% 14.8% 27Arts & Sciences 10.7% 36.5% 35.6% 17.2% 430Engineering 11.7% 32.1% 38.0% 18.2% 324Hotel Administration 11.6% 39.5% 25.6% 23.3% 43Human Ecology 7.9% 39.6% 33.7% 18.8% 101Industrial & Labor Relations 15.3% 35.6% 25.4% 23.7% 59
Cornell and Peers*
Cornell, by Class Year
Cornell, by Sex
Cornell, by Race/citizenship**
Cornell, by College
** p<.01, * p<.05 (based on chi-square)
Looking back to when you started at Cornell/your institution, how well prepared do you think you were to: Manage your time
Question only asked of first year students.

2015 PULSE Survey Cornell University
Institutional Research and Planning Page 44
Very little or none Some Quite a bit Very much Total
Row % Row % Row % Row % CountCornell 6.4% 30.4% 41.0% 22.3% 4,487Other Ivies 7.2% 28.4% 36.1% 28.2% 13,055Non-Ivies 9.9% 31.2% 34.6% 24.3% 18,485First year 6.9% 32.6% 44.3% 16.1% 1,210Sophomore 7.9% 32.0% 40.7% 19.5% 1,043Junior 6.7% 30.0% 39.2% 24.2% 1,138Senior 3.9% 26.7% 39.6% 29.7% 1,096Male 7.5% 31.8% 40.6% 20.0% 1,818Female 5.5% 29.3% 41.3% 23.9% 2,648American Indian (U.S.) 6.7% 13.3% 46.7% 33.3% 15Asian (U.S.) 6.1% 36.1% 41.3% 16.5% 987Black (U.S.) 11.8% 25.1% 34.4% 28.7% 195Hispanic (U.S.) 8.8% 29.7% 36.3% 25.3% 491White (U.S.) 5.5% 29.9% 41.8% 22.8% 2,165Multiracial URM (U.S.) 8.5% 21.8% 45.8% 23.9% 142Multiracial non-URM (U.S.) 8.3% 32.4% 42.8% 16.6% 145Unknown (U.S.) 10.7% 25.0% 39.3% 25.0% 28International (any race/ethnicity) 3.8% 24.1% 43.3% 28.8% 319Agriculture & Life Sciences 6.3% 27.8% 43.0% 22.9% 1,024Art, Architecture, & Planning 3.8% 29.8% 41.3% 25.0% 104Arts & Sciences 6.9% 28.5% 39.9% 24.7% 1,372Engineering 7.9% 41.4% 38.4% 12.3% 1,083Hotel Administration 2.0% 15.7% 43.1% 39.2% 204Human Ecology 5.2% 30.2% 44.2% 20.4% 407Industrial & Labor Relations 3.4% 18.1% 43.0% 35.5% 293
Cornell and Peers**
Cornell, by Class Year**
Cornell, by Sex**
Cornell, by Race/citizenship**
Cornell, by College**
** p<.01, * p<.05 (based on chi-square)
Cornell's contribution: Writing clearly and effectively

2015 PULSE Survey Cornell University
Institutional Research and Planning Page 45
Very little or none Some Quite a bit Very much Total
Row % Row % Row % Row % CountCornell 9.4% 31.7% 37.2% 21.7% 4,480Other Ivies 9.9% 32.2% 35.6% 22.3% 13,049Non-Ivies 11.4% 33.0% 34.9% 20.7% 18,483First year 14.8% 36.3% 35.0% 13.9% 1,211Sophomore 10.5% 31.9% 39.3% 18.4% 1,039Junior 7.5% 31.9% 36.0% 24.6% 1,134Senior 4.6% 26.2% 39.0% 30.3% 1,096Male 9.4% 33.2% 37.0% 20.3% 1,814Female 9.4% 30.5% 37.5% 22.6% 2,645American Indian (U.S.) 6.7% 26.7% 40.0% 26.7% 15Asian (U.S.) 11.1% 34.0% 38.3% 16.6% 985Black (U.S.) 11.9% 27.3% 36.6% 24.2% 194Hispanic (U.S.) 9.8% 26.8% 37.8% 25.6% 489White (U.S.) 9.1% 31.5% 36.4% 23.0% 2,165Multiracial URM (U.S.) 9.4% 34.5% 36.7% 19.4% 139Multiracial non-URM (U.S.) 8.9% 42.5% 33.6% 15.1% 146Unknown (U.S.) 10.7% 39.3% 32.1% 17.9% 28International (any race/ethnicity) 5.0% 29.2% 41.1% 24.8% 319Agriculture & Life Sciences 7.9% 29.6% 38.1% 24.4% 1,025Art, Architecture, & Planning 8.7% 30.1% 35.9% 25.2% 103Arts & Sciences 10.3% 33.0% 36.9% 19.9% 1,373Engineering 12.1% 38.3% 35.4% 14.2% 1,078Hotel Administration 1.5% 14.3% 42.4% 41.9% 203Human Ecology 11.1% 30.2% 35.4% 23.3% 407Industrial & Labor Relations 4.8% 23.4% 41.6% 30.2% 291
Cornell, by Class Year**
Cornell, by Sex
Cornell, by Race/citizenship**
Cornell, by College**
** p<.01, * p<.05 (based on chi-square)
Cornell's contribution: Communicating well orally
Cornell and Peers**

2015 PULSE Survey Cornell University
Institutional Research and Planning Page 46
Very little or none Some Quite a bit Very much Total
Row % Row % Row % Row % CountCornell 2.6% 17.1% 42.3% 38.0% 4,492Other Ivies 2.5% 16.3% 38.1% 43.2% 13,051Non-Ivies 2.3% 16.5% 38.9% 42.3% 18,481First year 3.7% 23.9% 46.1% 26.3% 1,213Sophomore 3.0% 19.6% 41.9% 35.6% 1,043Junior 2.0% 15.1% 40.1% 42.8% 1,139Senior 1.6% 9.4% 40.7% 48.3% 1,097Male 3.3% 16.8% 41.8% 38.1% 1,822Female 2.1% 17.2% 42.7% 38.1% 2,649American Indian (U.S.) 6.7% 26.7% 20.0% 46.7% 15Asian (U.S.) 2.7% 20.3% 46.7% 30.3% 987Black (U.S.) 6.7% 21.0% 36.4% 35.9% 195Hispanic (U.S.) 2.0% 16.1% 42.8% 39.1% 491White (U.S.) 2.3% 15.7% 40.7% 41.2% 2,168Multiracial URM (U.S.) 2.1% 13.3% 48.3% 36.4% 143Multiracial non-URM (U.S.) 4.1% 18.5% 43.8% 33.6% 146Unknown (U.S.) 7.1% 25.0% 39.3% 28.6% 28International (any race/ethnicity) 1.6% 16.0% 39.8% 42.6% 319Agriculture & Life Sciences 3.0% 17.6% 42.6% 36.8% 1,025Art, Architecture, & Planning 0.0% 16.3% 33.7% 50.0% 104Arts & Sciences 3.2% 18.8% 40.4% 37.7% 1,375Engineering 1.8% 16.5% 43.3% 38.5% 1,084Hotel Administration 1.5% 17.6% 47.1% 33.8% 204Human Ecology 2.7% 16.4% 43.1% 37.7% 408Industrial & Labor Relations 3.1% 11.0% 44.9% 41.1% 292
Cornell, by Race/citizenship**
Cornell, by College*
** p<.01, * p<.05 (based on chi-square)
Cornell's contribution: Thinking critically
Cornell and Peers**
Cornell, by Class Year**
Cornell, by Sex

2015 PULSE Survey Cornell University
Institutional Research and Planning Page 47
Very little or none Some Quite a bit Very much Total
Row % Row % Row % Row % CountCornell 12.2% 28.7% 35.2% 23.9% 4,485Other Ivies 15.1% 31.4% 29.9% 23.6% 13,025Non-Ivies 15.0% 31.0% 30.8% 23.3% 18,461First year 21.1% 37.1% 29.6% 12.3% 1,208Sophomore 12.6% 32.0% 35.1% 20.3% 1,040Junior 8.2% 25.3% 37.6% 28.8% 1,141Senior 6.0% 19.7% 39.1% 35.1% 1,096Male 12.3% 29.8% 36.2% 21.7% 1,820Female 12.0% 27.9% 34.6% 25.5% 2,644American Indian (U.S.) 6.7% 20.0% 46.7% 26.7% 15Asian (U.S.) 11.3% 29.0% 38.9% 20.8% 986Black (U.S.) 18.0% 26.3% 35.1% 20.6% 194Hispanic (U.S.) 11.8% 26.4% 34.7% 27.2% 493White (U.S.) 12.3% 28.5% 33.5% 25.8% 2,164Multiracial URM (U.S.) 15.6% 27.7% 32.6% 24.1% 141Multiracial non-URM (U.S.) 11.6% 34.9% 37.0% 16.4% 146Unknown (U.S.) 10.7% 25.0% 46.4% 17.9% 28International (any race/ethnicity) 10.4% 32.4% 35.5% 21.7% 318Agriculture & Life Sciences 10.9% 30.7% 32.6% 25.7% 1,023Art, Architecture, & Planning 11.7% 28.2% 32.0% 28.2% 103Arts & Sciences 16.0% 30.0% 34.0% 20.1% 1,372Engineering 11.7% 29.5% 37.6% 21.1% 1,083Hotel Administration 4.9% 14.7% 40.7% 39.7% 204Human Ecology 10.3% 30.7% 34.2% 24.8% 407Industrial & Labor Relations 8.2% 19.5% 40.3% 32.1% 293
Cornell, by College**
** p<.01, * p<.05 (based on chi-square)
Cornell's contribution: Leading and supervising tasks and groups of people
Cornell and Peers**
Cornell, by Class Year**
Cornell, by Sex*
Cornell, by Race/citizenship*

2015 PULSE Survey Cornell University
Institutional Research and Planning Page 48
Very little or none Some Quite a bit Very much Total
Row % Row % Row % Row % CountCornell 8.8% 29.3% 37.8% 24.0% 4,488Other Ivies 18.4% 33.6% 27.7% 20.2% 13,037Non-Ivies 14.1% 31.2% 31.6% 23.0% 18,468First year 14.6% 35.8% 35.3% 14.3% 1,211Sophomore 7.3% 29.6% 41.1% 22.1% 1,042Junior 7.1% 26.2% 36.4% 30.3% 1,139Senior 5.6% 25.3% 39.0% 30.2% 1,096Male 8.1% 27.0% 37.3% 27.6% 1,820Female 9.2% 30.9% 38.3% 21.6% 2,647American Indian (U.S.) 20.0% 20.0% 40.0% 20.0% 15Asian (U.S.) 8.1% 27.8% 42.4% 21.7% 986Black (U.S.) 11.8% 31.3% 31.8% 25.1% 195Hispanic (U.S.) 11.2% 27.2% 39.1% 22.5% 489White (U.S.) 8.1% 30.4% 36.4% 25.1% 2,166Multiracial URM (U.S.) 12.6% 28.0% 32.9% 26.6% 143Multiracial non-URM (U.S.) 9.6% 33.6% 39.7% 17.1% 146Unknown (U.S.) 13.8% 44.8% 13.8% 27.6% 29International (any race/ethnicity) 6.9% 26.3% 38.9% 27.9% 319Agriculture & Life Sciences 7.0% 29.4% 37.9% 25.8% 1,025Art, Architecture, & Planning 28.4% 27.5% 29.4% 14.7% 102Arts & Sciences 14.3% 32.9% 34.0% 18.7% 1,372Engineering 3.5% 22.5% 41.4% 32.6% 1,082Hotel Administration 3.9% 24.0% 43.1% 28.9% 204Human Ecology 6.4% 30.1% 41.3% 22.2% 409Industrial & Labor Relations 8.8% 40.8% 36.7% 13.6% 294
Cornell, by Sex**
Cornell, by Race/citizenship**
Cornell, by College**
** p<.01, * p<.05 (based on chi-square)
Cornell's contribution: Using quantitative tools (e.g., statistics, graphs)
Cornell and Peers**
Cornell, by Class Year**

2015 PULSE Survey Cornell University
Institutional Research and Planning Page 49
Very little or none Some Quite a bit Very much Total
Row % Row % Row % Row % CountCornell 51.3% 19.3% 17.5% 11.9% 4,489Other Ivies 33.6% 22.9% 21.4% 22.1% 13,054Non-Ivies 41.3% 22.5% 19.5% 16.7% 18,481First year 51.2% 19.3% 18.2% 11.3% 1,210Sophomore 52.0% 16.7% 17.8% 13.5% 1,043Junior 51.3% 19.8% 18.0% 10.9% 1,142Senior 50.7% 21.4% 15.9% 12.0% 1,094Male 52.2% 19.2% 17.9% 10.6% 1,819Female 50.8% 19.3% 17.3% 12.6% 2,649American Indian (U.S.) 53.3% 33.3% 6.7% 6.7% 15Asian (U.S.) 46.2% 23.5% 20.1% 10.2% 988Black (U.S.) 49.5% 20.1% 20.6% 9.8% 194Hispanic (U.S.) 48.6% 15.2% 20.5% 15.7% 492White (U.S.) 57.8% 17.1% 14.6% 10.5% 2,166Multiracial URM (U.S.) 49.3% 20.4% 16.9% 13.4% 142Multiracial non-URM (U.S.) 52.4% 20.7% 16.6% 10.3% 145Unknown (U.S.) 44.8% 20.7% 24.1% 10.3% 29International (any race/ethnicity) 29.2% 25.2% 23.3% 22.3% 318Agriculture & Life Sciences 64.2% 15.5% 13.0% 7.2% 1,023Art, Architecture, & Planning 41.3% 30.8% 16.3% 11.5% 104Arts & Sciences 17.6% 29.7% 29.4% 23.3% 1,373Engineering 74.4% 11.5% 9.2% 4.9% 1,085Hotel Administration 51.7% 18.7% 18.2% 11.3% 203Human Ecology 65.1% 15.7% 12.5% 6.6% 407Industrial & Labor Relations 62.9% 13.9% 15.0% 8.2% 294
Cornell, by Race/citizenship**
Cornell, by College**
** p<.01, * p<.05 (based on chi-square)
Cornell's contribution: Reading or speaking a foreign language
Cornell and Peers**
Cornell, by Class Year
Cornell, by Sex
2015 PULSE Survey Cornell University
Institutional Research and Planning Page 50
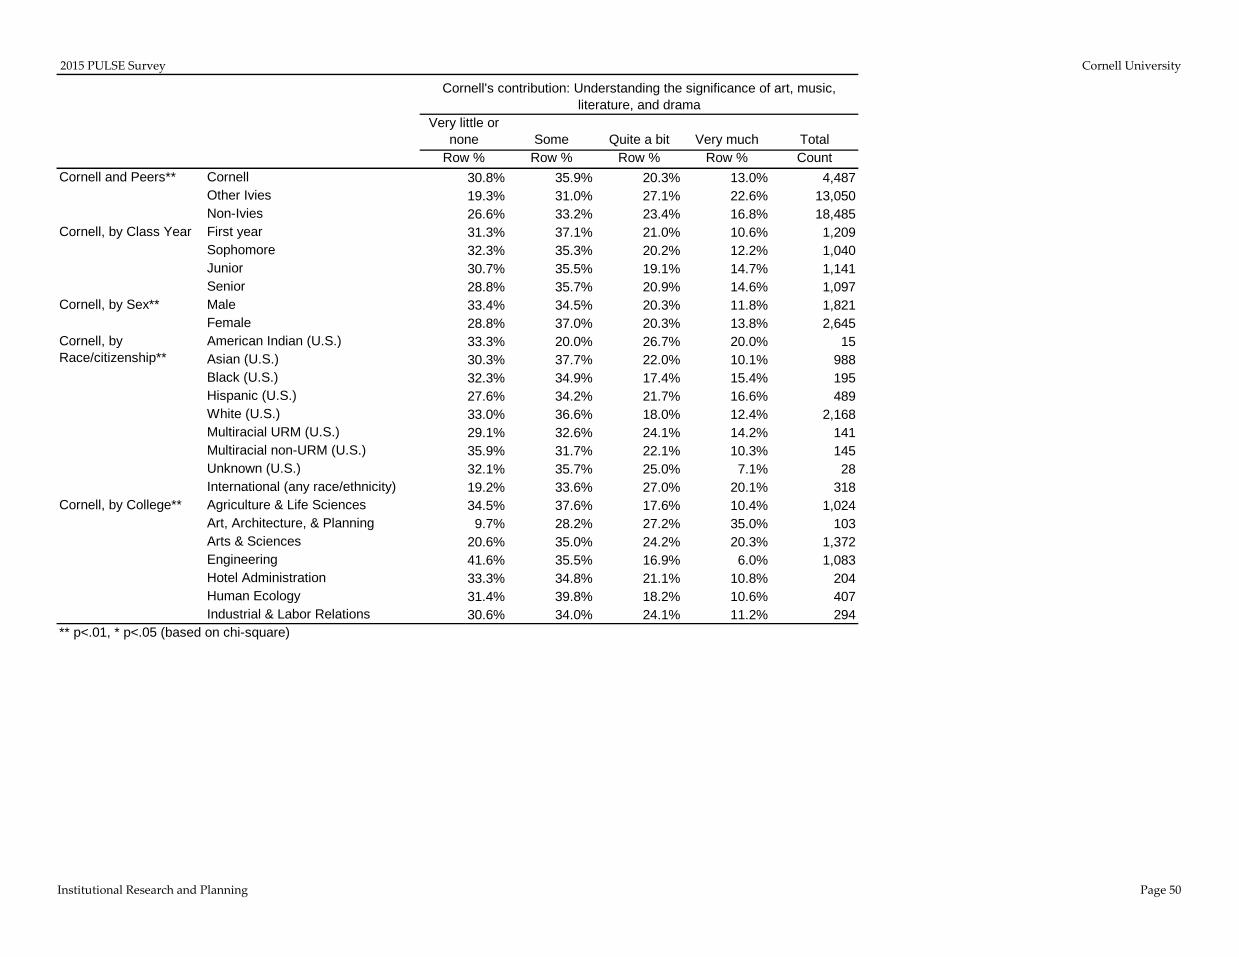
Very little or none Some Quite a bit Very much Total
Row % Row % Row % Row % CountCornell 30.8% 35.9% 20.3% 13.0% 4,487Other Ivies 19.3% 31.0% 27.1% 22.6% 13,050Non-Ivies 26.6% 33.2% 23.4% 16.8% 18,485First year 31.3% 37.1% 21.0% 10.6% 1,209Sophomore 32.3% 35.3% 20.2% 12.2% 1,040Junior 30.7% 35.5% 19.1% 14.7% 1,141Senior 28.8% 35.7% 20.9% 14.6% 1,097Male 33.4% 34.5% 20.3% 11.8% 1,821Female 28.8% 37.0% 20.3% 13.8% 2,645American Indian (U.S.) 33.3% 20.0% 26.7% 20.0% 15Asian (U.S.) 30.3% 37.7% 22.0% 10.1% 988Black (U.S.) 32.3% 34.9% 17.4% 15.4% 195Hispanic (U.S.) 27.6% 34.2% 21.7% 16.6% 489White (U.S.) 33.0% 36.6% 18.0% 12.4% 2,168Multiracial URM (U.S.) 29.1% 32.6% 24.1% 14.2% 141Multiracial non-URM (U.S.) 35.9% 31.7% 22.1% 10.3% 145Unknown (U.S.) 32.1% 35.7% 25.0% 7.1% 28International (any race/ethnicity) 19.2% 33.6% 27.0% 20.1% 318Agriculture & Life Sciences 34.5% 37.6% 17.6% 10.4% 1,024Art, Architecture, & Planning 9.7% 28.2% 27.2% 35.0% 103Arts & Sciences 20.6% 35.0% 24.2% 20.3% 1,372Engineering 41.6% 35.5% 16.9% 6.0% 1,083Hotel Administration 33.3% 34.8% 21.1% 10.8% 204Human Ecology 31.4% 39.8% 18.2% 10.6% 407Industrial & Labor Relations 30.6% 34.0% 24.1% 11.2% 294
** p<.01, * p<.05 (based on chi-square)
Cornell's contribution: Understanding the significance of art, music, literature, and drama
Cornell and Peers**
Cornell, by Class Year
Cornell, by Sex**
Cornell, by Race/citizenship**
Cornell, by College**

2015 PULSE Survey Cornell University
Institutional Research and Planning Page 51
Very little or none Some Quite a bit Very much Total
Row % Row % Row % Row % CountCornell 11.7% 25.9% 33.7% 28.7% 4,493Other Ivies 20.7% 30.0% 27.0% 22.2% 13,032Non-Ivies 16.3% 26.8% 30.5% 26.4% 18,482First year 14.9% 30.9% 34.3% 19.9% 1,209Sophomore 11.2% 28.0% 37.4% 23.4% 1,043Junior 11.4% 22.1% 32.3% 34.3% 1,144Senior 8.9% 22.2% 31.2% 37.6% 1,097Male 10.6% 25.9% 35.4% 28.1% 1,820Female 12.4% 25.8% 32.7% 29.1% 2,652American Indian (U.S.) 20.0% 20.0% 33.3% 26.7% 15Asian (U.S.) 10.3% 27.9% 37.0% 24.8% 987Black (U.S.) 19.5% 22.6% 31.3% 26.7% 195Hispanic (U.S.) 13.0% 22.2% 35.2% 29.7% 492White (U.S.) 11.8% 26.7% 31.2% 30.3% 2,169Multiracial URM (U.S.) 11.3% 28.2% 32.4% 28.2% 142Multiracial non-URM (U.S.) 10.3% 16.4% 43.2% 30.1% 146Unknown (U.S.) 14.3% 28.6% 32.1% 25.0% 28International (any race/ethnicity) 8.8% 25.1% 36.7% 29.5% 319Agriculture & Life Sciences 7.2% 21.6% 36.2% 35.0% 1,024Art, Architecture, & Planning 23.3% 37.9% 28.2% 10.7% 103Arts & Sciences 13.7% 29.0% 30.2% 27.2% 1,376Engineering 3.7% 21.4% 41.8% 33.1% 1,084Hotel Administration 33.3% 34.8% 22.5% 9.3% 204Human Ecology 5.6% 24.3% 35.0% 35.0% 408Industrial & Labor Relations 36.7% 34.7% 20.1% 8.5% 294
Cornell, by Sex
Cornell, by Race/citizenship**
Cornell, by College**
** p<.01, * p<.05 (based on chi-square)
Cornell's contribution: Understanding the process of science and experimentation
Cornell and Peers**
Cornell, by Class Year**
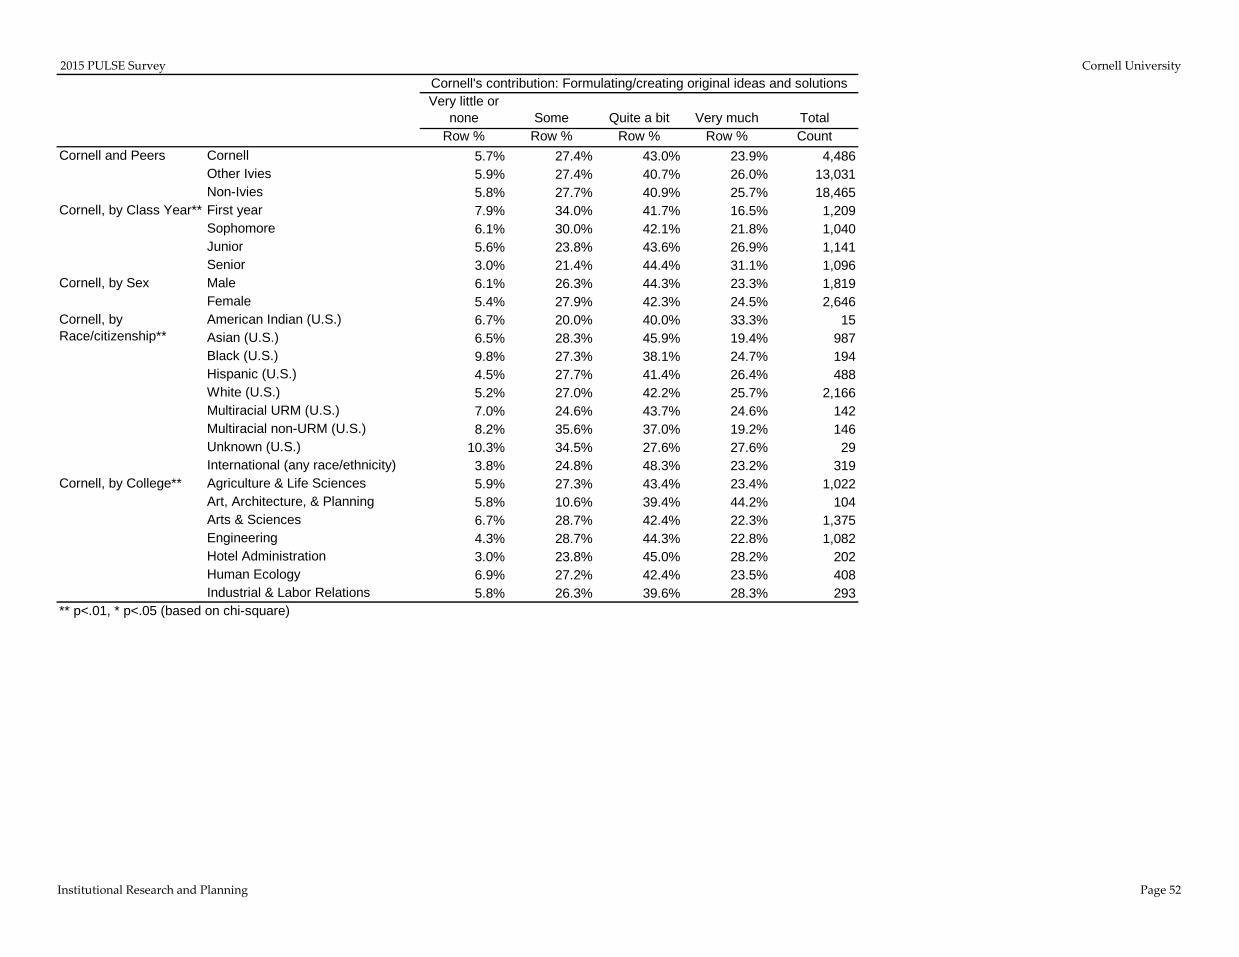
2015 PULSE Survey Cornell University
Institutional Research and Planning Page 52
Very little or none Some Quite a bit Very much Total
Row % Row % Row % Row % CountCornell 5.7% 27.4% 43.0% 23.9% 4,486Other Ivies 5.9% 27.4% 40.7% 26.0% 13,031Non-Ivies 5.8% 27.7% 40.9% 25.7% 18,465First year 7.9% 34.0% 41.7% 16.5% 1,209Sophomore 6.1% 30.0% 42.1% 21.8% 1,040Junior 5.6% 23.8% 43.6% 26.9% 1,141Senior 3.0% 21.4% 44.4% 31.1% 1,096Male 6.1% 26.3% 44.3% 23.3% 1,819Female 5.4% 27.9% 42.3% 24.5% 2,646American Indian (U.S.) 6.7% 20.0% 40.0% 33.3% 15Asian (U.S.) 6.5% 28.3% 45.9% 19.4% 987Black (U.S.) 9.8% 27.3% 38.1% 24.7% 194Hispanic (U.S.) 4.5% 27.7% 41.4% 26.4% 488White (U.S.) 5.2% 27.0% 42.2% 25.7% 2,166Multiracial URM (U.S.) 7.0% 24.6% 43.7% 24.6% 142Multiracial non-URM (U.S.) 8.2% 35.6% 37.0% 19.2% 146Unknown (U.S.) 10.3% 34.5% 27.6% 27.6% 29International (any race/ethnicity) 3.8% 24.8% 48.3% 23.2% 319Agriculture & Life Sciences 5.9% 27.3% 43.4% 23.4% 1,022Art, Architecture, & Planning 5.8% 10.6% 39.4% 44.2% 104Arts & Sciences 6.7% 28.7% 42.4% 22.3% 1,375Engineering 4.3% 28.7% 44.3% 22.8% 1,082Hotel Administration 3.0% 23.8% 45.0% 28.2% 202Human Ecology 6.9% 27.2% 42.4% 23.5% 408Industrial & Labor Relations 5.8% 26.3% 39.6% 28.3% 293
Cornell, by College**
** p<.01, * p<.05 (based on chi-square)
Cornell's contribution: Formulating/creating original ideas and solutions
Cornell and Peers
Cornell, by Class Year**
Cornell, by Sex
Cornell, by Race/citizenship**

2015 PULSE Survey Cornell University
Institutional Research and Planning Page 53
Very little or none Some Quite a bit Very much Total
Row % Row % Row % Row % CountCornell 15.2% 33.5% 34.7% 16.6% 4,483Other Ivies 17.2% 33.9% 30.8% 18.2% 13,035Non-Ivies 17.6% 34.1% 30.9% 17.4% 18,461First year 17.2% 37.3% 33.0% 12.4% 1,206Sophomore 18.2% 35.0% 32.8% 13.9% 1,042Junior 13.9% 31.7% 34.6% 19.8% 1,140Senior 11.5% 29.8% 38.4% 20.4% 1,095Male 16.6% 34.0% 33.6% 15.8% 1,819Female 14.1% 33.1% 35.6% 17.1% 2,643American Indian (U.S.) 33.3% 20.0% 26.7% 20.0% 15Asian (U.S.) 12.0% 36.6% 37.1% 14.3% 985Black (U.S.) 21.0% 27.2% 33.3% 18.5% 195Hispanic (U.S.) 15.3% 27.0% 39.3% 18.4% 489White (U.S.) 16.2% 34.2% 32.5% 17.1% 2,166Multiracial URM (U.S.) 16.4% 36.4% 32.1% 15.0% 140Multiracial non-URM (U.S.) 19.2% 37.0% 31.5% 12.3% 146Unknown (U.S.) 34.5% 34.5% 17.2% 13.8% 29International (any race/ethnicity) 10.4% 30.5% 39.9% 19.2% 318Agriculture & Life Sciences 15.1% 31.4% 36.1% 17.5% 1,023Art, Architecture, & Planning 10.8% 31.4% 37.3% 20.6% 102Arts & Sciences 17.4% 35.3% 32.1% 15.2% 1,372Engineering 15.9% 36.8% 33.6% 13.7% 1,081Hotel Administration 7.8% 25.0% 39.7% 27.5% 204Human Ecology 14.4% 32.0% 39.1% 14.4% 409Industrial & Labor Relations 11.0% 29.1% 35.3% 24.7% 292
** p<.01, * p<.05 (based on chi-square)
Cornell's contribution: Resolving interpersonal conflicts positively
Cornell and Peers**
Cornell, by Class Year**
Cornell, by Sex
Cornell, by Race/citizenship**
Cornell, by College**

2015 PULSE Survey Cornell University
Institutional Research and Planning Page 54
Very little or none Some Quite a bit Very much Total
Row % Row % Row % Row % CountCornell 16.8% 33.7% 30.8% 18.7% 4,486Other Ivies 9.8% 26.8% 33.1% 30.3% 13,048Non-Ivies 16.4% 30.8% 29.8% 22.9% 18,483First year 18.1% 38.0% 30.1% 13.7% 1,209Sophomore 17.1% 33.3% 31.2% 18.3% 1,041Junior 17.4% 32.1% 30.7% 19.8% 1,141Senior 14.4% 31.0% 31.1% 23.5% 1,095Male 17.7% 35.1% 30.6% 16.5% 1,821Female 16.2% 32.6% 30.9% 20.3% 2,644American Indian (U.S.) 6.7% 53.3% 0.0% 40.0% 15Asian (U.S.) 20.5% 36.4% 30.2% 12.9% 986Black (U.S.) 15.4% 27.2% 33.8% 23.6% 195Hispanic (U.S.) 14.5% 30.3% 32.2% 23.0% 491White (U.S.) 16.3% 34.1% 30.4% 19.2% 2,165Multiracial URM (U.S.) 16.4% 30.7% 28.6% 24.3% 140Multiracial non-URM (U.S.) 17.8% 36.3% 30.8% 15.1% 146Unknown (U.S.) 28.6% 32.1% 28.6% 10.7% 28International (any race/ethnicity) 12.5% 31.3% 33.1% 23.1% 320Agriculture & Life Sciences 15.2% 36.1% 32.6% 16.1% 1,023Art, Architecture, & Planning 3.9% 22.3% 37.9% 35.9% 103Arts & Sciences 12.8% 29.0% 33.0% 25.2% 1,374Engineering 29.7% 42.1% 21.6% 6.7% 1,081Hotel Administration 14.8% 34.5% 33.5% 17.2% 203Human Ecology 12.5% 35.5% 32.1% 19.9% 408Industrial & Labor Relations 5.4% 17.7% 41.5% 35.4% 294
Cornell, by Sex**
Cornell, by Race/citizenship**
Cornell, by College**
** p<.01, * p<.05 (based on chi-square)
Cornell's contribution: Placing current problems in historical/cutlural/philosophical perspective
Cornell and Peers**
Cornell, by Class Year**
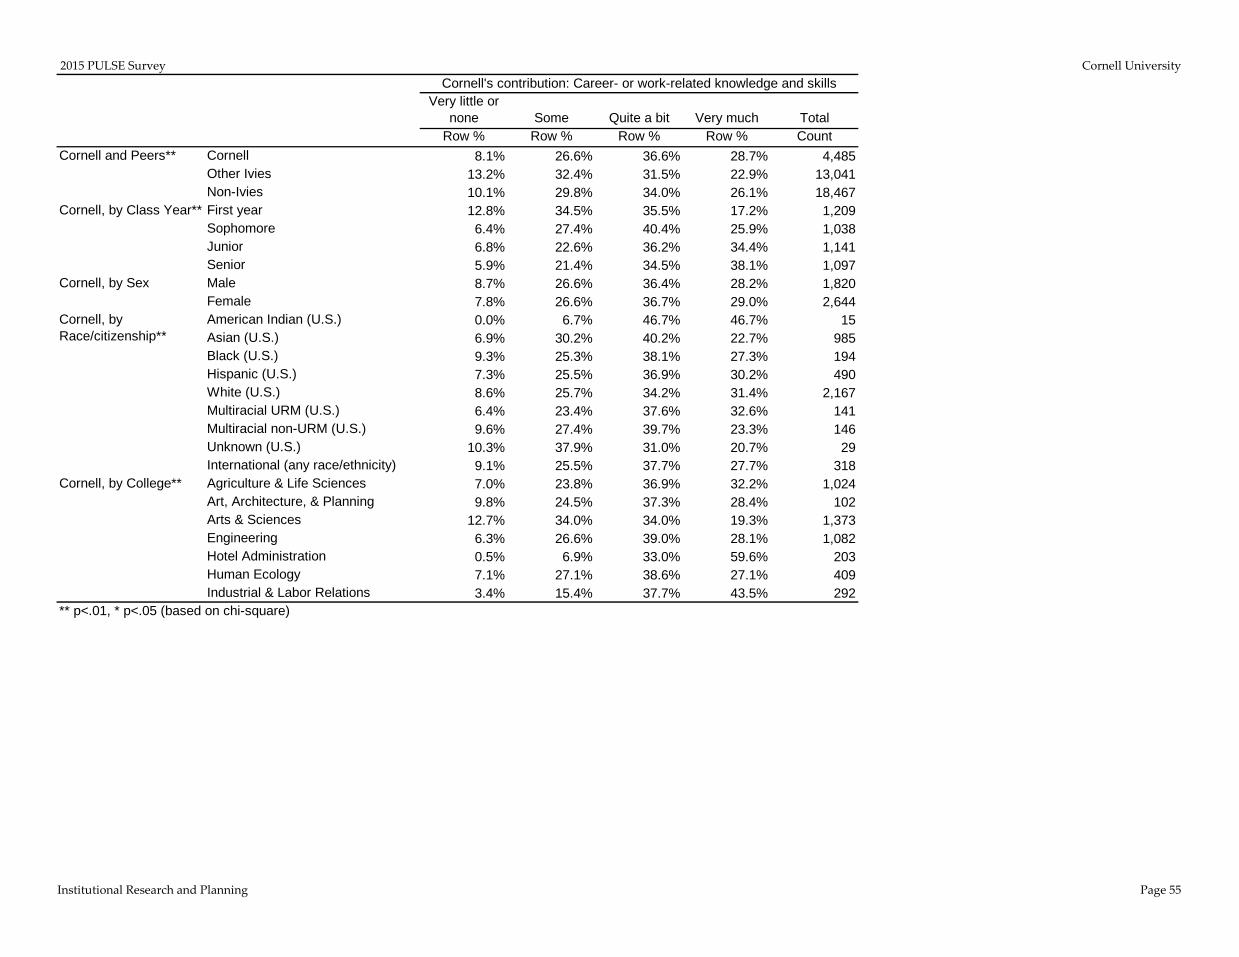
2015 PULSE Survey Cornell University
Institutional Research and Planning Page 55
Very little or none Some Quite a bit Very much Total
Row % Row % Row % Row % CountCornell 8.1% 26.6% 36.6% 28.7% 4,485Other Ivies 13.2% 32.4% 31.5% 22.9% 13,041Non-Ivies 10.1% 29.8% 34.0% 26.1% 18,467First year 12.8% 34.5% 35.5% 17.2% 1,209Sophomore 6.4% 27.4% 40.4% 25.9% 1,038Junior 6.8% 22.6% 36.2% 34.4% 1,141Senior 5.9% 21.4% 34.5% 38.1% 1,097Male 8.7% 26.6% 36.4% 28.2% 1,820Female 7.8% 26.6% 36.7% 29.0% 2,644American Indian (U.S.) 0.0% 6.7% 46.7% 46.7% 15Asian (U.S.) 6.9% 30.2% 40.2% 22.7% 985Black (U.S.) 9.3% 25.3% 38.1% 27.3% 194Hispanic (U.S.) 7.3% 25.5% 36.9% 30.2% 490White (U.S.) 8.6% 25.7% 34.2% 31.4% 2,167Multiracial URM (U.S.) 6.4% 23.4% 37.6% 32.6% 141Multiracial non-URM (U.S.) 9.6% 27.4% 39.7% 23.3% 146Unknown (U.S.) 10.3% 37.9% 31.0% 20.7% 29International (any race/ethnicity) 9.1% 25.5% 37.7% 27.7% 318Agriculture & Life Sciences 7.0% 23.8% 36.9% 32.2% 1,024Art, Architecture, & Planning 9.8% 24.5% 37.3% 28.4% 102Arts & Sciences 12.7% 34.0% 34.0% 19.3% 1,373Engineering 6.3% 26.6% 39.0% 28.1% 1,082Hotel Administration 0.5% 6.9% 33.0% 59.6% 203Human Ecology 7.1% 27.1% 38.6% 27.1% 409Industrial & Labor Relations 3.4% 15.4% 37.7% 43.5% 292
Cornell, by Race/citizenship**
Cornell, by College**
** p<.01, * p<.05 (based on chi-square)
Cornell's contribution: Career- or work-related knowledge and skills
Cornell and Peers**
Cornell, by Class Year**
Cornell, by Sex

2015 PULSE Survey Cornell University
Institutional Research and Planning Page 56
Very little or none Some Quite a bit Very much Total
Row % Row % Row % Row % CountCornell 3.9% 20.5% 38.8% 36.7% 4,482Other Ivies 4.6% 21.5% 37.2% 36.7% 13,044Non-Ivies 4.1% 20.1% 38.3% 37.5% 18,461First year 6.5% 31.2% 39.3% 23.0% 1,207Sophomore 3.5% 20.8% 39.9% 35.8% 1,037Junior 2.6% 16.0% 40.4% 41.0% 1,141Senior 2.7% 13.3% 35.6% 48.3% 1,097Male 4.3% 19.1% 39.2% 37.3% 1,818Female 3.5% 21.5% 38.7% 36.3% 2,643American Indian (U.S.) 0.0% 20.0% 40.0% 40.0% 15Asian (U.S.) 4.2% 24.2% 40.5% 31.1% 986Black (U.S.) 6.2% 28.7% 34.9% 30.3% 195Hispanic (U.S.) 4.7% 21.2% 38.7% 35.4% 491White (U.S.) 3.5% 18.6% 37.3% 40.6% 2,162Multiracial URM (U.S.) 2.1% 17.6% 43.0% 37.3% 142Multiracial non-URM (U.S.) 5.5% 15.8% 43.2% 35.6% 146Unknown (U.S.) 7.1% 14.3% 39.3% 39.3% 28International (any race/ethnicity) 2.8% 20.5% 42.9% 33.8% 317Agriculture & Life Sciences 3.6% 21.0% 38.5% 36.9% 1,022Art, Architecture, & Planning 2.9% 19.6% 35.3% 42.2% 102Arts & Sciences 5.2% 21.6% 38.8% 34.4% 1,369Engineering 3.3% 19.6% 41.2% 35.9% 1,084Hotel Administration 1.0% 14.3% 34.5% 50.2% 203Human Ecology 3.2% 22.7% 35.5% 38.6% 409Industrial & Labor Relations 4.1% 19.1% 40.3% 36.5% 293
** p<.01, * p<.05 (based on chi-square)
Cornell's contribution: In-depth knowledge of a field or discipline
Cornell and Peers**
Cornell, by Class Year**
Cornell, by Sex
Cornell, by Race/citizenship**
Cornell, by College**

2015 PULSE Survey Cornell University
Institutional Research and Planning Page 57
Very little or none Some Quite a bit Very much Total
Row % Row % Row % Row % CountCornell 6.4% 25.5% 39.4% 28.7% 4,486Other Ivies 9.7% 31.2% 35.0% 24.1% 13,025Non-Ivies 9.1% 29.8% 36.2% 24.9% 18,475First year 10.2% 32.6% 39.2% 18.0% 1,208Sophomore 6.9% 29.0% 39.6% 24.5% 1,045Junior 5.1% 21.9% 39.4% 33.7% 1,141Senior 3.3% 17.9% 39.5% 39.4% 1,092Male 7.0% 26.0% 39.7% 27.3% 1,823Female 6.0% 24.9% 39.4% 29.7% 2,642American Indian (U.S.) 6.7% 20.0% 46.7% 26.7% 15Asian (U.S.) 5.4% 26.9% 41.7% 26.0% 984Black (U.S.) 10.3% 30.4% 36.1% 23.2% 194Hispanic (U.S.) 6.9% 23.5% 38.7% 30.8% 493White (U.S.) 6.5% 24.8% 38.2% 30.6% 2,165Multiracial URM (U.S.) 7.7% 28.9% 35.9% 27.5% 142Multiracial non-URM (U.S.) 7.5% 24.7% 45.2% 22.6% 146Unknown (U.S.) 10.3% 27.6% 41.4% 20.7% 29International (any race/ethnicity) 5.0% 24.5% 42.1% 28.3% 318Agriculture & Life Sciences 5.7% 24.5% 38.9% 31.0% 1,024Art, Architecture, & Planning 6.7% 26.0% 39.4% 27.9% 104Arts & Sciences 10.7% 30.3% 37.9% 21.1% 1,373Engineering 3.3% 22.6% 42.4% 31.7% 1,081Hotel Administration 0.5% 18.1% 36.8% 44.6% 204Human Ecology 6.1% 27.3% 37.8% 28.7% 407Industrial & Labor Relations 5.1% 19.1% 41.6% 34.1% 293
Cornell, by College**
** p<.01, * p<.05 (based on chi-square)
Cornell's contribution: Functioning effectively as a member of a team
Cornell and Peers**
Cornell, by Class Year**
Cornell, by Sex
Cornell, by Race/citizenship

2015 PULSE Survey Cornell University
Institutional Research and Planning Page 58
Very little or none Some Quite a bit Very much Total
Row % Row % Row % Row % CountCornell 10.3% 30.0% 35.6% 24.1% 4,442Other Ivies 7.6% 25.6% 35.1% 31.7% 12,172Non-Ivies 11.1% 28.6% 34.5% 25.8% 17,026First year 11.3% 33.0% 35.2% 20.5% 1,198Sophomore 11.7% 30.1% 36.4% 21.8% 1,027Junior 9.6% 30.1% 34.1% 26.2% 1,130Senior 8.6% 26.5% 36.9% 28.1% 1,087Male 13.3% 31.6% 33.5% 21.5% 1,801Female 8.1% 28.7% 37.2% 25.9% 2,620American Indian (U.S.) 7.1% 28.6% 35.7% 28.6% 14Asian (U.S.) 10.2% 31.7% 37.7% 20.5% 982Black (U.S.) 14.6% 26.6% 27.1% 31.8% 192Hispanic (U.S.) 7.9% 26.8% 35.9% 29.5% 482White (U.S.) 10.6% 30.6% 35.7% 23.1% 2,154Multiracial URM (U.S.) 9.4% 31.7% 36.0% 23.0% 139Multiracial non-URM (U.S.) 11.6% 35.6% 32.2% 20.5% 146Unknown (U.S.) 33.3% 20.8% 33.3% 12.5% 24International (any race/ethnicity) 7.4% 24.6% 35.3% 32.7% 309Agriculture & Life Sciences 9.7% 27.9% 35.8% 26.5% 1,006Art, Architecture, & Planning 6.9% 20.8% 42.6% 29.7% 101Arts & Sciences 10.2% 29.7% 36.0% 24.1% 1,362Engineering 13.1% 35.3% 32.9% 18.7% 1,078Hotel Administration 8.0% 26.6% 34.2% 31.2% 199Human Ecology 7.1% 30.8% 38.2% 23.9% 406Industrial & Labor Relations 9.3% 23.1% 38.3% 29.3% 290
Cornell, by College**
** p<.01, * p<.05 (based on chi-square)
Cornell's contribution: Relating well to people of different races, nations, and religions
Cornell and Peers**
Cornell, by Class Year**
Cornell, by Sex**
Cornell, by Race/citizenship**

2015 PULSE Survey Cornell University
Institutional Research and Planning Page 59
Very little or none Some Quite a bit Very much Total
Row % Row % Row % Row % CountCornell 11.2% 33.0% 36.5% 19.3% 4,445Other Ivies 8.9% 28.2% 37.4% 25.6% 7,146Non-Ivies 10.0% 30.8% 35.4% 23.8% 12,892First year 13.2% 35.2% 36.7% 14.9% 1,198Sophomore 11.3% 33.2% 37.5% 17.9% 1,026Junior 11.5% 33.7% 35.1% 19.8% 1,129Senior 8.4% 29.7% 36.7% 25.2% 1,092Male 13.2% 35.4% 33.6% 17.8% 1,803Female 9.5% 31.4% 38.7% 20.5% 2,621American Indian (U.S.) 7.1% 14.3% 57.1% 21.4% 14Asian (U.S.) 11.1% 35.1% 39.4% 14.4% 983Black (U.S.) 13.0% 28.1% 33.9% 25.0% 192Hispanic (U.S.) 9.8% 26.6% 38.0% 25.6% 481White (U.S.) 11.4% 33.9% 35.0% 19.7% 2,154Multiracial URM (U.S.) 7.1% 38.6% 35.7% 18.6% 140Multiracial non-URM (U.S.) 18.5% 32.9% 33.6% 15.1% 146Unknown (U.S.) 20.8% 37.5% 20.8% 20.8% 24International (any race/ethnicity) 8.7% 30.9% 38.9% 21.5% 311Agriculture & Life Sciences 9.1% 29.6% 39.7% 21.6% 1,008Art, Architecture, & Planning 5.9% 23.8% 44.6% 25.7% 101Arts & Sciences 11.2% 32.1% 35.4% 21.2% 1,366Engineering 17.2% 42.6% 29.8% 10.4% 1,076Hotel Administration 7.5% 25.1% 38.7% 28.6% 199Human Ecology 7.7% 29.4% 41.7% 21.2% 405Industrial & Labor Relations 4.8% 27.2% 43.4% 24.5% 290
Cornell and Peers**
Cornell, by Class Year**
Cornell, by Sex**
Cornell, by Race/citizenship**
Cornell, by College**
** p<.01, * p<.05 (based on chi-square)
Cornell's contribution: Identifying moral and ethical issues

2015 PULSE Survey Cornell University
Institutional Research and Planning Page 60
Very little or none Some Quite a bit Very much Total
Row % Row % Row % Row % CountCornell 8.8% 28.2% 38.5% 24.4% 4,443Other Ivies 8.8% 29.7% 37.0% 24.5% 12,148Non-Ivies 7.4% 27.1% 38.6% 26.9% 10,094First year 16.5% 37.9% 32.0% 13.6% 1,197Sophomore 7.4% 31.9% 39.5% 21.2% 1,026Junior 6.3% 24.1% 41.4% 28.2% 1,130Senior 4.3% 18.5% 41.7% 35.4% 1,090Male 9.0% 27.6% 38.0% 25.4% 1,802Female 8.5% 28.6% 39.0% 23.9% 2,620American Indian (U.S.) 0.0% 35.7% 28.6% 35.7% 14Asian (U.S.) 8.6% 29.3% 43.4% 18.6% 983Black (U.S.) 15.6% 29.7% 32.3% 22.4% 192Hispanic (U.S.) 10.6% 27.8% 35.3% 26.3% 482White (U.S.) 8.1% 26.7% 38.1% 27.1% 2,152Multiracial URM (U.S.) 7.1% 35.0% 32.1% 25.7% 140Multiracial non-URM (U.S.) 8.9% 33.6% 39.7% 17.8% 146Unknown (U.S.) 8.3% 45.8% 20.8% 25.0% 24International (any race/ethnicity) 8.4% 28.1% 39.0% 24.5% 310Agriculture & Life Sciences 9.2% 27.5% 38.5% 24.8% 1,010Art, Architecture, & Planning 2.0% 18.8% 42.6% 36.6% 101Arts & Sciences 11.8% 33.2% 34.7% 20.3% 1,362Engineering 6.8% 25.4% 40.8% 27.0% 1,076Hotel Administration 4.5% 18.5% 45.5% 31.5% 200Human Ecology 8.7% 29.5% 37.6% 24.3% 404Industrial & Labor Relations 6.2% 26.6% 43.1% 24.1% 290
Cornell, by Class Year**
Cornell, by Sex
Cornell, by Race/citizenship**
Cornell, by College**
** p<.01, * p<.05 (based on chi-square)
Cornell's contribution: Planning and executing complex projects
Cornell and Peers**

2015 PULSE Survey Cornell University
Institutional Research and Planning Page 61
Very little or none Some Quite a bit Very much Total
Row % Row % Row % Row % CountCornell 4.7% 25.6% 43.9% 25.9% 4,442Other Ivies 3.3% 22.4% 43.9% 30.4% 12,146Non-Ivies 3.2% 21.5% 43.9% 31.4% 5,405First year 7.5% 34.7% 41.3% 16.5% 1,197Sophomore 5.0% 29.1% 42.6% 23.3% 1,028Junior 4.0% 20.7% 44.6% 30.6% 1,129Senior 2.0% 17.4% 47.1% 33.5% 1,088Male 5.2% 25.6% 44.9% 24.2% 1,803Female 4.1% 25.5% 43.3% 27.0% 2,618American Indian (U.S.) 7.1% 28.6% 28.6% 35.7% 14Asian (U.S.) 5.2% 28.4% 45.4% 21.0% 982Black (U.S.) 10.4% 27.1% 38.0% 24.5% 192Hispanic (U.S.) 3.7% 24.8% 46.0% 25.5% 483White (U.S.) 4.3% 24.6% 43.2% 28.0% 2,154Multiracial URM (U.S.) 2.9% 31.4% 37.9% 27.9% 140Multiracial non-URM (U.S.) 6.9% 28.3% 44.1% 20.7% 145Unknown (U.S.) 4.2% 41.7% 25.0% 29.2% 24International (any race/ethnicity) 3.6% 18.8% 48.7% 28.9% 308Agriculture & Life Sciences 4.4% 24.8% 45.3% 25.5% 1,010Art, Architecture, & Planning 2.0% 21.8% 41.6% 34.7% 101Arts & Sciences 6.0% 26.1% 43.1% 24.9% 1,360Engineering 4.2% 27.8% 44.4% 23.6% 1,078Hotel Administration 3.5% 26.1% 41.7% 28.6% 199Human Ecology 3.7% 23.3% 41.8% 31.2% 404Industrial & Labor Relations 4.8% 22.1% 45.2% 27.9% 290
Cornell, by Sex
Cornell, by Race/citizenship**
Cornell, by College
** p<.01, * p<.05 (based on chi-square)
Cornell's contribution: Synthesizing and integrating ideas and information
Cornell and Peers**
Cornell, by Class Year**

2015 PULSE Survey Cornell University
Institutional Research and Planning Page 62
Very little or none Some Quite a bit Very much Total
Row % Row % Row % Row % CountCornell 14.4% 33.4% 32.5% 19.7% 4,444Other Ivies 9.1% 29.5% 35.0% 26.4% 9,313Non-Ivies 13.0% 31.9% 31.6% 23.5% 10,953First year 16.9% 36.0% 31.5% 15.6% 1,196Sophomore 14.9% 34.0% 33.2% 17.9% 1,029Junior 14.5% 32.2% 32.8% 20.5% 1,131Senior 11.0% 31.3% 32.5% 25.2% 1,088Male 17.1% 34.7% 31.3% 16.9% 1,804Female 12.3% 32.5% 33.5% 21.7% 2,619American Indian (U.S.) 14.3% 35.7% 21.4% 28.6% 14Asian (U.S.) 16.3% 33.8% 34.4% 15.5% 981Black (U.S.) 14.6% 30.2% 32.8% 22.4% 192Hispanic (U.S.) 13.4% 28.5% 33.1% 25.0% 484White (U.S.) 13.9% 34.9% 31.4% 19.8% 2,153Multiracial URM (U.S.) 14.2% 32.6% 32.6% 20.6% 141Multiracial non-URM (U.S.) 19.9% 39.7% 26.7% 13.7% 146Unknown (U.S.) 20.8% 45.8% 16.7% 16.7% 24International (any race/ethnicity) 10.0% 27.5% 37.2% 25.2% 309Agriculture & Life Sciences 11.8% 31.6% 33.0% 23.6% 1,007Art, Architecture, & Planning 9.9% 18.8% 34.7% 36.6% 101Arts & Sciences 12.9% 33.4% 34.6% 19.1% 1,364Engineering 22.4% 40.3% 25.8% 11.5% 1,079Hotel Administration 13.6% 25.1% 36.7% 24.6% 199Human Ecology 11.1% 31.9% 34.6% 22.5% 405Industrial & Labor Relations 6.9% 27.0% 39.4% 26.6% 289
Cornell, by Sex**
Cornell, by Race/citizenship**
Cornell, by College**
** p<.01, * p<.05 (based on chi-square)
Cornell's contribution: Developing global awareness
Cornell and Peers**
Cornell, by Class Year**

2015 PULSE Survey Cornell University
Institutional Research and Planning Page 63
Very little or none Some Quite a bit Very much Total
Row % Row % Row % Row % CountCornell 21.7% 30.1% 28.3% 20.0% 4,439Other Ivies 17.9% 29.5% 29.0% 23.7% 9,312Non-Ivies 19.8% 30.4% 27.4% 22.5% 14,097First year 30.2% 37.8% 23.1% 8.9% 1,194Sophomore 22.7% 30.8% 30.8% 15.6% 1,029Junior 19.6% 26.2% 28.5% 25.7% 1,128Senior 13.5% 24.9% 31.3% 30.2% 1,088Male 22.0% 30.7% 28.8% 18.5% 1,799Female 21.2% 29.7% 28.1% 21.0% 2,619American Indian (U.S.) 21.4% 35.7% 14.3% 28.6% 14Asian (U.S.) 23.4% 30.2% 29.8% 16.6% 981Black (U.S.) 27.1% 29.7% 26.0% 17.2% 192Hispanic (U.S.) 24.7% 29.0% 26.6% 19.7% 482White (U.S.) 20.4% 31.1% 27.2% 21.3% 2,150Multiracial URM (U.S.) 19.1% 28.4% 29.1% 23.4% 141Multiracial non-URM (U.S.) 25.5% 29.0% 26.9% 18.6% 145Unknown (U.S.) 12.5% 29.2% 20.8% 37.5% 24International (any race/ethnicity) 17.4% 25.8% 36.5% 20.3% 310Agriculture & Life Sciences 16.9% 29.6% 28.4% 25.0% 1,010Art, Architecture, & Planning 14.9% 30.7% 33.7% 20.8% 101Arts & Sciences 19.4% 29.8% 27.9% 22.9% 1,361Engineering 30.9% 34.0% 23.7% 11.3% 1,075Hotel Administration 42.7% 21.6% 25.1% 10.6% 199Human Ecology 13.6% 26.5% 32.9% 27.0% 404Industrial & Labor Relations 14.2% 28.7% 40.1% 17.0% 289
Cornell, by Race/citizenship*
Cornell, by College**
** p<.01, * p<.05 (based on chi-square)
Cornell and Peers**
Cornell, by Class Year**
Cornell, by Sex
Cornell's contribution: Conducting scholarly research

2015 PULSE Survey Cornell University
Institutional Research and Planning Page 64
Yes No TotalRow % Row % Count
Cornell 44.5% 55.5% 4,462Other Ivies 55.2% 44.8% 12,788Non-Ivies 45.7% 54.3% 18,301First year 27.2% 72.8% 1,202Sophomore 39.4% 60.6% 1,033Junior 47.2% 52.8% 1,134Senior 65.7% 34.3% 1,093Male 43.0% 57.0% 1,811Female 45.7% 54.3% 2,630American Indian (U.S.) 42.9% 57.1% 14Asian (U.S.) 40.7% 59.3% 984Black (U.S.) 41.7% 58.3% 192Hispanic (U.S.) 47.7% 52.3% 486White (U.S.) 45.6% 54.4% 2,162Multiracial URM (U.S.) 43.7% 56.3% 142Multiracial non-URM (U.S.) 43.4% 56.6% 145Unknown (U.S.) 41.7% 58.3% 24International (any race/ethnicity) 47.3% 52.7% 313Agriculture & Life Sciences 47.7% 52.3% 1,013Art, Architecture, & Planning 71.3% 28.7% 101Arts & Sciences 45.7% 54.3% 1,369Engineering 27.4% 72.6% 1,080Hotel Administration 45.5% 54.5% 202Human Ecology 51.7% 48.3% 406Industrial & Labor Relations 71.8% 28.2% 291
Cornell, by College**
** p<.01, * p<.05 (based on chi-square)
Cornell and Peers**
Cornell, by Class Year**
Cornell, by Sex
Cornell, by Race/citizenship
During the current academic year, have you: Written a long (e.g., 15 pages or more) research paper that combined information
from many sources
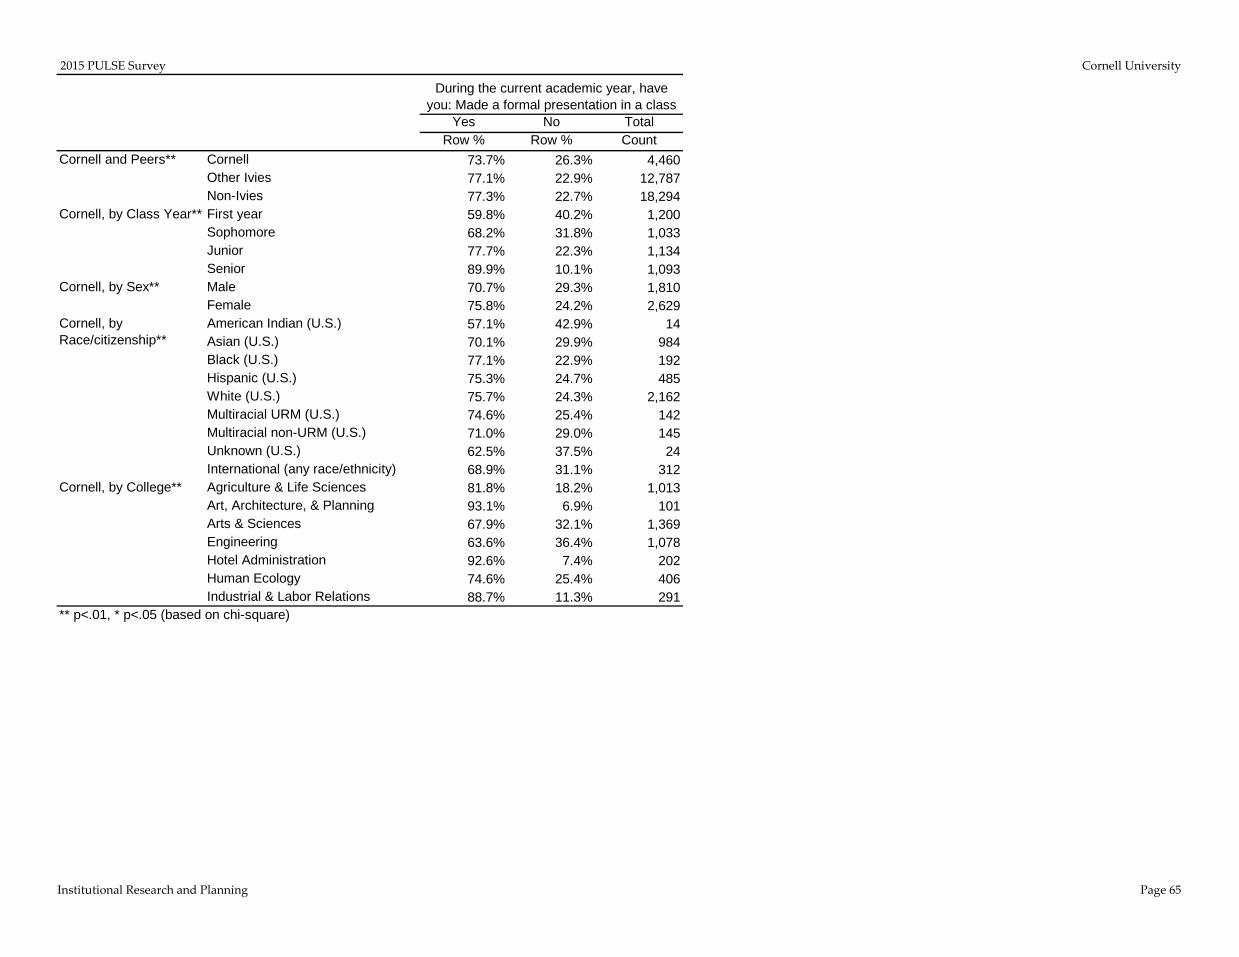
2015 PULSE Survey Cornell University
Institutional Research and Planning Page 65
Yes No TotalRow % Row % Count
Cornell 73.7% 26.3% 4,460Other Ivies 77.1% 22.9% 12,787Non-Ivies 77.3% 22.7% 18,294First year 59.8% 40.2% 1,200Sophomore 68.2% 31.8% 1,033Junior 77.7% 22.3% 1,134Senior 89.9% 10.1% 1,093Male 70.7% 29.3% 1,810Female 75.8% 24.2% 2,629American Indian (U.S.) 57.1% 42.9% 14Asian (U.S.) 70.1% 29.9% 984Black (U.S.) 77.1% 22.9% 192Hispanic (U.S.) 75.3% 24.7% 485White (U.S.) 75.7% 24.3% 2,162Multiracial URM (U.S.) 74.6% 25.4% 142Multiracial non-URM (U.S.) 71.0% 29.0% 145Unknown (U.S.) 62.5% 37.5% 24International (any race/ethnicity) 68.9% 31.1% 312Agriculture & Life Sciences 81.8% 18.2% 1,013Art, Architecture, & Planning 93.1% 6.9% 101Arts & Sciences 67.9% 32.1% 1,369Engineering 63.6% 36.4% 1,078Hotel Administration 92.6% 7.4% 202Human Ecology 74.6% 25.4% 406Industrial & Labor Relations 88.7% 11.3% 291
Cornell, by Sex**
Cornell, by Race/citizenship**
Cornell, by College**
** p<.01, * p<.05 (based on chi-square)
During the current academic year, have you: Made a formal presentation in a class
Cornell and Peers**
Cornell, by Class Year**

2015 PULSE Survey Cornell University
Institutional Research and Planning Page 66
Yes No TotalRow % Row % Count
Cornell 92.0% 8.0% 4,459Other Ivies 85.5% 14.5% 12,787Non-Ivies 87.1% 12.9% 18,297First year 89.8% 10.2% 1,201Sophomore 91.9% 8.1% 1,032Junior 91.5% 8.5% 1,134Senior 94.9% 5.1% 1,092Male 91.8% 8.2% 1,808Female 92.1% 7.9% 2,630American Indian (U.S.) 85.7% 14.3% 14Asian (U.S.) 92.8% 7.2% 984Black (U.S.) 88.0% 12.0% 192Hispanic (U.S.) 91.3% 8.7% 485White (U.S.) 92.6% 7.4% 2,159Multiracial URM (U.S.) 90.1% 9.9% 142Multiracial non-URM (U.S.) 93.2% 6.8% 146Unknown (U.S.) 79.2% 20.8% 24International (any race/ethnicity) 90.1% 9.9% 313Agriculture & Life Sciences 94.7% 5.3% 1,012Art, Architecture, & Planning 92.1% 7.9% 101Arts & Sciences 85.2% 14.8% 1,368Engineering 95.1% 4.9% 1,079Hotel Administration 98.0% 2.0% 202Human Ecology 93.6% 6.4% 406Industrial & Labor Relations 96.6% 3.4% 291
Cornell, by Sex
Cornell, by Race/citizenship
Cornell, by College**
** p<.01, * p<.05 (based on chi-square)
During the current academic year, have you: Worked with others on a group assignment, project, or presentation
Cornell and Peers**
Cornell, by Class Year**
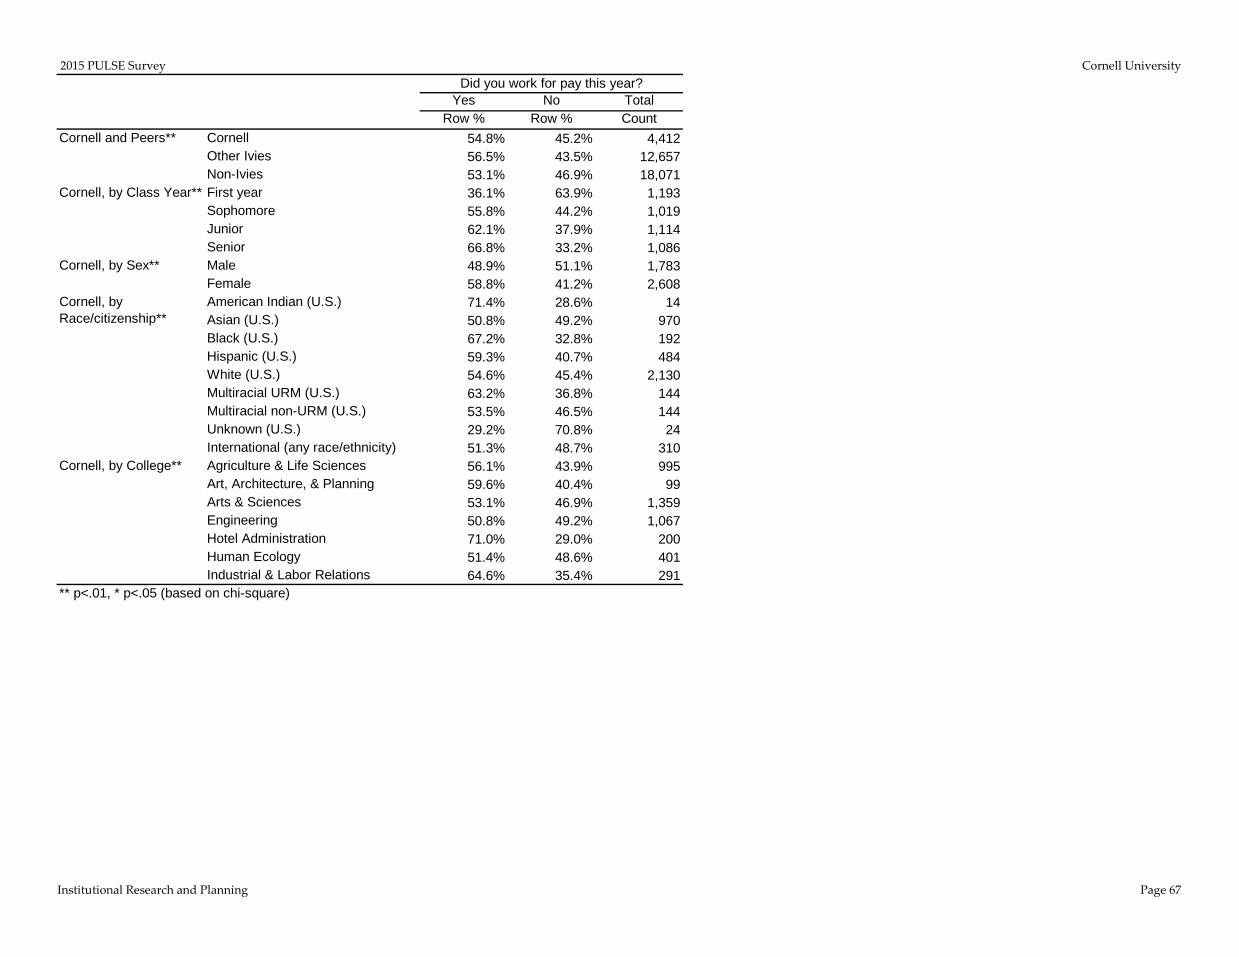
2015 PULSE Survey Cornell University
Institutional Research and Planning Page 67
Yes No TotalRow % Row % Count
Cornell 54.8% 45.2% 4,412Other Ivies 56.5% 43.5% 12,657Non-Ivies 53.1% 46.9% 18,071First year 36.1% 63.9% 1,193Sophomore 55.8% 44.2% 1,019Junior 62.1% 37.9% 1,114Senior 66.8% 33.2% 1,086Male 48.9% 51.1% 1,783Female 58.8% 41.2% 2,608American Indian (U.S.) 71.4% 28.6% 14Asian (U.S.) 50.8% 49.2% 970Black (U.S.) 67.2% 32.8% 192Hispanic (U.S.) 59.3% 40.7% 484White (U.S.) 54.6% 45.4% 2,130Multiracial URM (U.S.) 63.2% 36.8% 144Multiracial non-URM (U.S.) 53.5% 46.5% 144Unknown (U.S.) 29.2% 70.8% 24International (any race/ethnicity) 51.3% 48.7% 310Agriculture & Life Sciences 56.1% 43.9% 995Art, Architecture, & Planning 59.6% 40.4% 99Arts & Sciences 53.1% 46.9% 1,359Engineering 50.8% 49.2% 1,067Hotel Administration 71.0% 29.0% 200Human Ecology 51.4% 48.6% 401Industrial & Labor Relations 64.6% 35.4% 291
Cornell, by College**
** p<.01, * p<.05 (based on chi-square)
Did you work for pay this year?
Cornell and Peers**
Cornell, by Class Year**
Cornell, by Sex**
Cornell, by Race/citizenship**

2015 PULSE Survey Cornell University
Institutional Research and Planning Page 68
Yes No TotalRow % Row % Count
Cornell 44.5% 55.5% 2,325Other Ivies 38.1% 61.9% 6,777Non-Ivies 35.1% 64.9% 9,224First year 55.7% 44.3% 409Sophomore 44.1% 55.9% 549Junior 42.1% 57.9% 665Senior 40.6% 59.4% 702Male 41.4% 58.6% 823Female 46.4% 53.6% 1,490American Indian (U.S.) 50.0% 50.0% 10Asian (U.S.) 48.0% 52.0% 485Black (U.S.) 65.1% 34.9% 126Hispanic (U.S.) 59.6% 40.4% 275White (U.S.) 40.2% 59.8% 1,116Multiracial URM (U.S.) 43.8% 56.2% 89Multiracial non-URM (U.S.) 33.8% 66.2% 71Unknown (U.S.) 16.7% 83.3% 6International (any race/ethnicity) 25.9% 74.1% 147Agriculture & Life Sciences 46.5% 53.5% 540Art, Architecture, & Planning 60.7% 39.3% 56Arts & Sciences 48.6% 51.4% 691Engineering 40.1% 59.9% 521Hotel Administration 27.5% 72.5% 138Human Ecology 42.7% 57.3% 199Industrial & Labor Relations 45.6% 54.4% 180
Cornell, by Race/citizenship**
Cornell, by College**
** p<.01, * p<.05 (based on chi-square)
[If worked for pay] My job was part of a financial aid package (e.g., work-study
program)
Cornell and Peers**
Cornell, by Class Year**
Cornell, by Sex*

2015 PULSE Survey Cornell University
Institutional Research and Planning Page 69
Yes No TotalRow % Row % Count
Cornell 70.5% 29.5% 2,343Other Ivies 65.5% 34.5% 6,870Non-Ivies 63.6% 36.4% 9,316First year 76.3% 23.7% 418Sophomore 70.4% 29.6% 551Junior 68.7% 31.3% 668Senior 68.8% 31.2% 706Male 65.6% 34.4% 835Female 73.1% 26.9% 1,496American Indian (U.S.) 100.0% 0.0% 10Asian (U.S.) 64.9% 35.1% 485Black (U.S.) 83.6% 16.4% 128Hispanic (U.S.) 83.3% 16.7% 275White (U.S.) 68.7% 31.3% 1,126Multiracial URM (U.S.) 80.7% 19.3% 88Multiracial non-URM (U.S.) 62.7% 37.3% 75Unknown (U.S.) 83.3% 16.7% 6International (any race/ethnicity) 62.7% 37.3% 150Agriculture & Life Sciences 74.1% 25.9% 541Art, Architecture, & Planning 87.3% 12.7% 55Arts & Sciences 69.6% 30.4% 698Engineering 66.0% 34.0% 521Hotel Administration 63.3% 36.7% 139Human Ecology 74.0% 26.0% 204Industrial & Labor Relations 72.4% 27.6% 185
Cornell, by College**
** p<.01, * p<.05 (based on chi-square)
[If worked for pay] I worked because I needed money for school expenses
Cornell and Peers**
Cornell, by Class Year*
Cornell, by Sex**
Cornell, by Race/citizenship**

2015 PULSE Survey Cornell University
Institutional Research and Planning Page 70
Yes No TotalRow % Row % Count
Cornell 46.0% 54.0% 2,342Other Ivies 46.0% 54.0% 6,846Non-Ivies 50.0% 50.0% 9,294First year 26.6% 73.4% 403Sophomore 42.2% 57.8% 554Junior 55.6% 44.4% 671Senior 51.0% 49.0% 714Male 51.4% 48.6% 843Female 43.0% 57.0% 1,487American Indian (U.S.) 80.0% 20.0% 10Asian (U.S.) 44.8% 55.2% 480Black (U.S.) 25.6% 74.4% 125Hispanic (U.S.) 39.4% 60.6% 274White (U.S.) 49.0% 51.0% 1,136Multiracial URM (U.S.) 42.7% 57.3% 89Multiracial non-URM (U.S.) 44.4% 55.6% 72Unknown (U.S.) 50.0% 50.0% 6International (any race/ethnicity) 56.7% 43.3% 150Agriculture & Life Sciences 46.2% 53.8% 545Art, Architecture, & Planning 50.0% 50.0% 58Arts & Sciences 37.2% 62.8% 691Engineering 49.1% 50.9% 528Hotel Administration 80.0% 20.0% 140Human Ecology 42.2% 57.8% 199Industrial & Labor Relations 47.0% 53.0% 181
Cornell, by Class Year**
Cornell, by Sex**
Cornell, by Race/citizenship**
Cornell, by College**
** p<.01, * p<.05 (based on chi-square)
[If worked for pay] My job was related to my field of study or future career
Cornell and Peers**
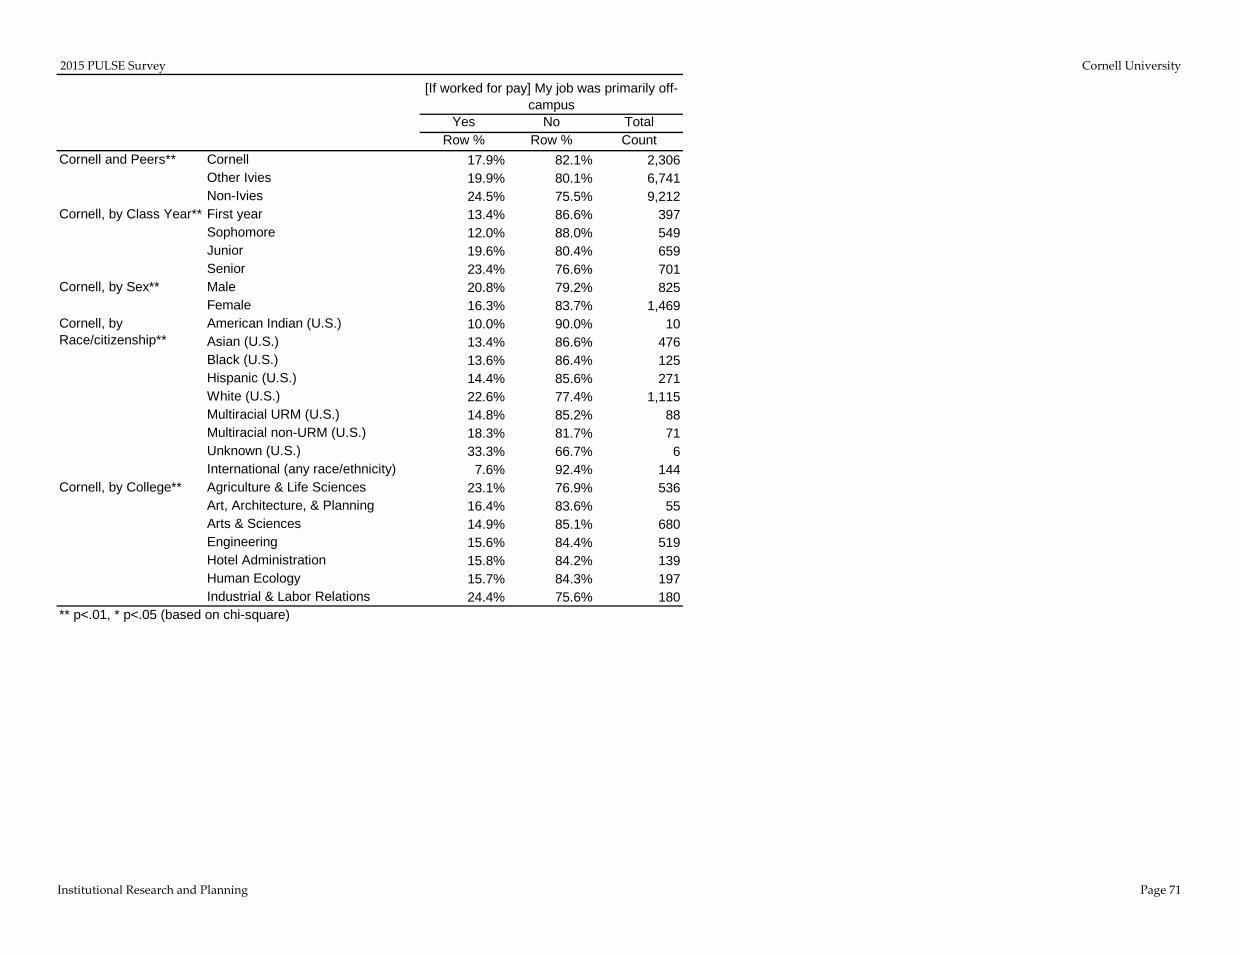
2015 PULSE Survey Cornell University
Institutional Research and Planning Page 71
Yes No TotalRow % Row % Count
Cornell 17.9% 82.1% 2,306Other Ivies 19.9% 80.1% 6,741Non-Ivies 24.5% 75.5% 9,212First year 13.4% 86.6% 397Sophomore 12.0% 88.0% 549Junior 19.6% 80.4% 659Senior 23.4% 76.6% 701Male 20.8% 79.2% 825Female 16.3% 83.7% 1,469American Indian (U.S.) 10.0% 90.0% 10Asian (U.S.) 13.4% 86.6% 476Black (U.S.) 13.6% 86.4% 125Hispanic (U.S.) 14.4% 85.6% 271White (U.S.) 22.6% 77.4% 1,115Multiracial URM (U.S.) 14.8% 85.2% 88Multiracial non-URM (U.S.) 18.3% 81.7% 71Unknown (U.S.) 33.3% 66.7% 6International (any race/ethnicity) 7.6% 92.4% 144Agriculture & Life Sciences 23.1% 76.9% 536Art, Architecture, & Planning 16.4% 83.6% 55Arts & Sciences 14.9% 85.1% 680Engineering 15.6% 84.4% 519Hotel Administration 15.8% 84.2% 139Human Ecology 15.7% 84.3% 197Industrial & Labor Relations 24.4% 75.6% 180
Cornell, by Race/citizenship**
Cornell, by College**
** p<.01, * p<.05 (based on chi-square)
[If worked for pay] My job was primarily off-campus
Cornell and Peers**
Cornell, by Class Year**
Cornell, by Sex**

2015 PULSE Survey Cornell University
Institutional Research and Planning Page 72
Done Plan to doDo not plan to
doHave not decided Total
Row % Row % Row % Row % CountCornell 48.7% 24.5% 16.9% 9.9% 4,421Other Ivies 50.8% 23.2% 15.1% 10.9% 12,704Non-Ivies 54.1% 21.1% 14.9% 9.9% 18,151First year 32.1% 44.2% 10.7% 13.0% 1,188Sophomore 46.0% 29.0% 14.0% 11.0% 1,025Junior 55.7% 16.2% 18.2% 9.9% 1,119Senior 62.4% 7.2% 25.0% 5.4% 1,089Male 40.8% 22.2% 24.2% 12.8% 1,786Female 54.4% 25.9% 11.7% 8.0% 2,614American Indian (U.S.) 50.0% 28.6% 0.0% 21.4% 14Asian (U.S.) 49.7% 25.6% 16.1% 8.5% 975Black (U.S.) 59.7% 27.2% 6.3% 6.8% 191Hispanic (U.S.) 52.6% 24.5% 14.6% 8.2% 485White (U.S.) 48.6% 22.3% 18.5% 10.5% 2,135Multiracial URM (U.S.) 53.1% 25.2% 12.6% 9.1% 143Multiracial non-URM (U.S.) 49.7% 24.1% 15.9% 10.3% 145Unknown (U.S.) 27.3% 31.8% 31.8% 9.1% 22International (any race/ethnicity) 32.8% 32.5% 20.3% 14.5% 311Agriculture & Life Sciences 51.3% 25.6% 13.5% 9.6% 1,008Art, Architecture, & Planning 45.5% 22.8% 19.8% 11.9% 101Arts & Sciences 49.2% 24.0% 17.4% 9.3% 1,360Engineering 40.3% 23.5% 23.6% 12.5% 1,066Hotel Administration 48.0% 26.5% 14.5% 11.0% 200Human Ecology 61.7% 23.3% 9.3% 5.8% 399Industrial & Labor Relations 52.6% 26.5% 12.5% 8.4% 287
** p<.01, * p<.05 (based on chi-square)
Volunteer in the community, not as part of a course
Cornell and Peers**
Cornell, by Class Year**
Cornell, by Sex**
Cornell, by Race/citizenship**
Cornell, by College**
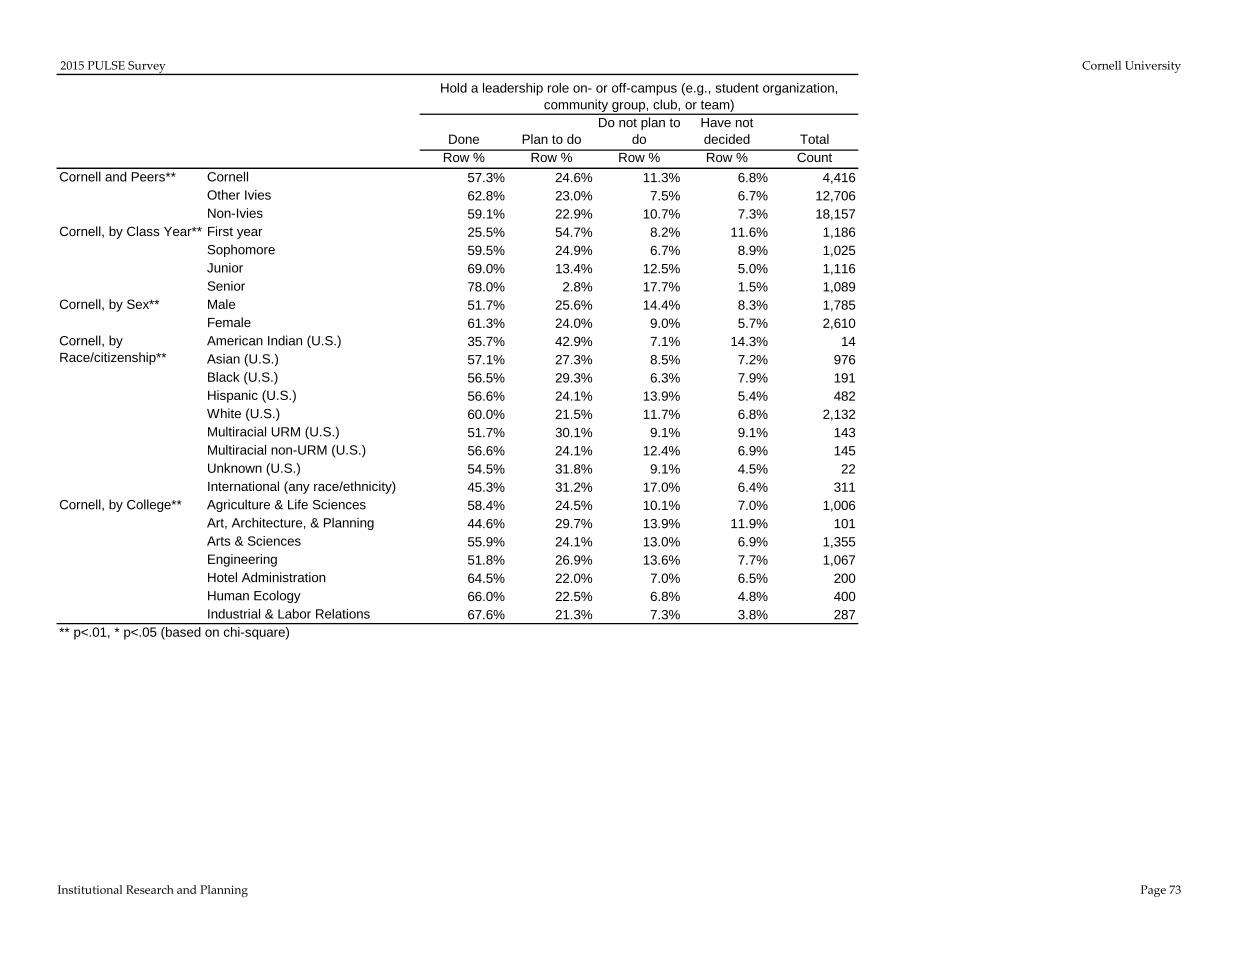
2015 PULSE Survey Cornell University
Institutional Research and Planning Page 73
Done Plan to doDo not plan to
doHave not decided Total
Row % Row % Row % Row % CountCornell 57.3% 24.6% 11.3% 6.8% 4,416Other Ivies 62.8% 23.0% 7.5% 6.7% 12,706Non-Ivies 59.1% 22.9% 10.7% 7.3% 18,157First year 25.5% 54.7% 8.2% 11.6% 1,186Sophomore 59.5% 24.9% 6.7% 8.9% 1,025Junior 69.0% 13.4% 12.5% 5.0% 1,116Senior 78.0% 2.8% 17.7% 1.5% 1,089Male 51.7% 25.6% 14.4% 8.3% 1,785Female 61.3% 24.0% 9.0% 5.7% 2,610American Indian (U.S.) 35.7% 42.9% 7.1% 14.3% 14Asian (U.S.) 57.1% 27.3% 8.5% 7.2% 976Black (U.S.) 56.5% 29.3% 6.3% 7.9% 191Hispanic (U.S.) 56.6% 24.1% 13.9% 5.4% 482White (U.S.) 60.0% 21.5% 11.7% 6.8% 2,132Multiracial URM (U.S.) 51.7% 30.1% 9.1% 9.1% 143Multiracial non-URM (U.S.) 56.6% 24.1% 12.4% 6.9% 145Unknown (U.S.) 54.5% 31.8% 9.1% 4.5% 22International (any race/ethnicity) 45.3% 31.2% 17.0% 6.4% 311Agriculture & Life Sciences 58.4% 24.5% 10.1% 7.0% 1,006Art, Architecture, & Planning 44.6% 29.7% 13.9% 11.9% 101Arts & Sciences 55.9% 24.1% 13.0% 6.9% 1,355Engineering 51.8% 26.9% 13.6% 7.7% 1,067Hotel Administration 64.5% 22.0% 7.0% 6.5% 200Human Ecology 66.0% 22.5% 6.8% 4.8% 400Industrial & Labor Relations 67.6% 21.3% 7.3% 3.8% 287
Cornell, by Race/citizenship**
Cornell, by College**
** p<.01, * p<.05 (based on chi-square)
Hold a leadership role on- or off-campus (e.g., student organization, community group, club, or team)
Cornell and Peers**
Cornell, by Class Year**
Cornell, by Sex**

2015 PULSE Survey Cornell University
Institutional Research and Planning Page 74
Done Plan to doDo not plan to
doHave not decided Total
Row % Row % Row % Row % CountCornell 9.8% 13.1% 60.3% 16.8% 4,415Other Ivies 15.6% 13.4% 53.0% 18.0% 12,689Non-Ivies 12.0% 13.7% 56.1% 18.2% 18,135First year 4.9% 20.5% 51.7% 22.9% 1,186Sophomore 10.9% 14.9% 54.9% 19.4% 1,023Junior 11.8% 9.7% 64.0% 14.6% 1,118Senior 12.1% 6.8% 71.1% 9.9% 1,088Male 11.0% 13.3% 59.8% 15.9% 1,783Female 9.0% 12.9% 60.7% 17.4% 2,611American Indian (U.S.) 14.3% 7.1% 50.0% 28.6% 14Asian (U.S.) 6.7% 14.4% 60.1% 18.8% 976Black (U.S.) 9.5% 18.9% 54.2% 17.4% 190Hispanic (U.S.) 14.1% 14.7% 54.9% 16.4% 483White (U.S.) 11.1% 12.3% 60.3% 16.3% 2,132Multiracial URM (U.S.) 9.1% 11.9% 62.2% 16.8% 143Multiracial non-URM (U.S.) 8.3% 11.7% 67.6% 12.4% 145Unknown (U.S.) 13.6% 22.7% 54.5% 9.1% 22International (any race/ethnicity) 5.2% 8.4% 70.0% 16.5% 310Agriculture & Life Sciences 8.7% 12.5% 61.1% 17.7% 1,007Art, Architecture, & Planning 12.9% 19.8% 50.5% 16.8% 101Arts & Sciences 10.7% 14.5% 57.6% 17.1% 1,355Engineering 4.0% 8.0% 71.7% 16.3% 1,067Hotel Administration 8.5% 13.5% 60.5% 17.5% 200Human Ecology 11.5% 15.5% 55.6% 17.3% 399Industrial & Labor Relations 28.3% 21.0% 38.1% 12.6% 286
Cornell, by Race/citizenship**
Cornell, by College**
** p<.01, * p<.05 (based on chi-square)
Participate in politics beyond voting
Cornell and Peers**
Cornell, by Class Year**
Cornell, by Sex

2015 PULSE Survey Cornell University
Institutional Research and Planning Page 75
Yes No TotalRow % Row % Count
Cornell 8.5% 91.5% 4,399Other Ivies 13.0% 87.0% 12,623Non-Ivies 11.3% 88.7% 18,056First year 7.6% 92.4% 1,182Sophomore 8.2% 91.8% 1,017Junior 9.0% 91.0% 1,117Senior 9.1% 90.9% 1,083Male 10.1% 89.9% 1,783Female 7.4% 92.6% 2,595American Indian (U.S.) 7.1% 92.9% 14Asian (U.S.) 3.7% 96.3% 973Black (U.S.) 8.8% 91.2% 193Hispanic (U.S.) 6.5% 93.5% 479White (U.S.) 11.0% 89.0% 2,127Multiracial URM (U.S.) 10.0% 90.0% 140Multiracial non-URM (U.S.) 9.0% 91.0% 144Unknown (U.S.) 4.3% 95.7% 23International (any race/ethnicity) 8.2% 91.8% 306Agriculture & Life Sciences 12.5% 87.5% 1,002Art, Architecture, & Planning 6.0% 94.0% 100Arts & Sciences 7.4% 92.6% 1,348Engineering 6.0% 94.0% 1,066Hotel Administration 11.6% 88.4% 199Human Ecology 7.3% 92.8% 400Industrial & Labor Relations 9.2% 90.8% 284
Cornell, by College**
** p<.01, * p<.05 (based on chi-square)
During the current academic year, have you participated (as more than a spectator) in:
Intercollegiate athletics (NCAA)
Cornell and Peers**
Cornell, by Class Year
Cornell, by Sex**
Cornell, by Race/citizenship**

2015 PULSE Survey Cornell University
Institutional Research and Planning Page 76
Yes No TotalRow % Row % Count
Cornell 21.4% 78.6% 4,394Other Ivies 25.1% 74.9% 12,577Non-Ivies 28.2% 71.8% 18,032First year 15.2% 84.8% 1,178Sophomore 22.9% 77.1% 1,015Junior 21.4% 78.6% 1,115Senior 26.7% 73.3% 1,086Male 30.5% 69.5% 1,780Female 15.3% 84.7% 2,593American Indian (U.S.) 35.7% 64.3% 14Asian (U.S.) 15.1% 84.9% 975Black (U.S.) 11.9% 88.1% 193Hispanic (U.S.) 23.9% 76.1% 476White (U.S.) 25.6% 74.4% 2,127Multiracial URM (U.S.) 23.6% 76.4% 140Multiracial non-URM (U.S.) 21.7% 78.3% 143Unknown (U.S.) 22.7% 77.3% 22International (any race/ethnicity) 12.2% 87.8% 304Agriculture & Life Sciences 22.8% 77.2% 997Art, Architecture, & Planning 9.0% 91.0% 100Arts & Sciences 19.4% 80.6% 1,347Engineering 22.3% 77.7% 1,064Hotel Administration 18.6% 81.4% 199Human Ecology 24.1% 75.9% 399Industrial & Labor Relations 25.3% 74.7% 288
Cornell and Peers**
Cornell, by Class Year**
Cornell, by Sex**
Cornell, by Race/citizenship**
Cornell, by College**
** p<.01, * p<.05 (based on chi-square)
During the current academic year, have you participated (as more than a spectator) in:
Club sports

2015 PULSE Survey Cornell University
Institutional Research and Planning Page 77
Yes No TotalRow % Row % Count
Cornell 16.3% 83.7% 4,398Other Ivies 18.7% 81.3% 12,567Non-Ivies 18.0% 82.0% 18,009First year 17.4% 82.6% 1,182Sophomore 18.9% 81.1% 1,017Junior 13.9% 86.1% 1,116Senior 15.1% 84.9% 1,083Male 20.6% 79.4% 1,781Female 13.4% 86.6% 2,597American Indian (U.S.) 21.4% 78.6% 14Asian (U.S.) 13.9% 86.1% 976Black (U.S.) 12.4% 87.6% 193Hispanic (U.S.) 14.4% 85.6% 478White (U.S.) 18.2% 81.8% 2,126Multiracial URM (U.S.) 17.9% 82.1% 140Multiracial non-URM (U.S.) 13.2% 86.8% 144Unknown (U.S.) 36.4% 63.6% 22International (any race/ethnicity) 15.4% 84.6% 305Agriculture & Life Sciences 16.8% 83.2% 998Art, Architecture, & Planning 10.1% 89.9% 99Arts & Sciences 15.2% 84.8% 1,351Engineering 18.1% 81.9% 1,065Hotel Administration 13.5% 86.5% 200Human Ecology 18.3% 81.7% 399Industrial & Labor Relations 14.0% 86.0% 286
Cornell, by Class Year**
Cornell, by Sex**
Cornell, by Race/citizenship**
Cornell, by College
** p<.01, * p<.05 (based on chi-square)
During the current academic year, have you participated (as more than a spectator) in:
Intramural athletics
Cornell and Peers**

2015 PULSE Survey Cornell University
Institutional Research and Planning Page 78
Yes No TotalRow % Row % Count
Cornell 16.3% 83.7% 4,388Other Ivies 23.3% 76.7% 12,563Non-Ivies 19.8% 80.2% 18,018First year 17.0% 83.0% 1,178Sophomore 17.3% 82.7% 1,015Junior 15.9% 84.1% 1,112Senior 15.1% 84.9% 1,083Male 15.6% 84.4% 1,774Female 16.8% 83.2% 2,593American Indian (U.S.) 14.3% 85.7% 14Asian (U.S.) 15.6% 84.4% 972Black (U.S.) 14.5% 85.5% 193Hispanic (U.S.) 15.5% 84.5% 478White (U.S.) 16.6% 83.4% 2,119Multiracial URM (U.S.) 13.6% 86.4% 140Multiracial non-URM (U.S.) 17.9% 82.1% 145Unknown (U.S.) 31.8% 68.2% 22International (any race/ethnicity) 18.7% 81.3% 305Agriculture & Life Sciences 14.7% 85.3% 996Art, Architecture, & Planning 18.0% 82.0% 100Arts & Sciences 19.9% 80.1% 1,349Engineering 15.3% 84.7% 1,064Hotel Administration 15.6% 84.4% 199Human Ecology 13.8% 86.2% 398Industrial & Labor Relations 12.4% 87.6% 282
Cornell, by Sex
Cornell, by Race/citizenship
Cornell, by College**
** p<.01, * p<.05 (based on chi-square)
During the current academic year, have you participated (as more than a spectator) in:
Music/theater group
Cornell and Peers**
Cornell, by Class Year
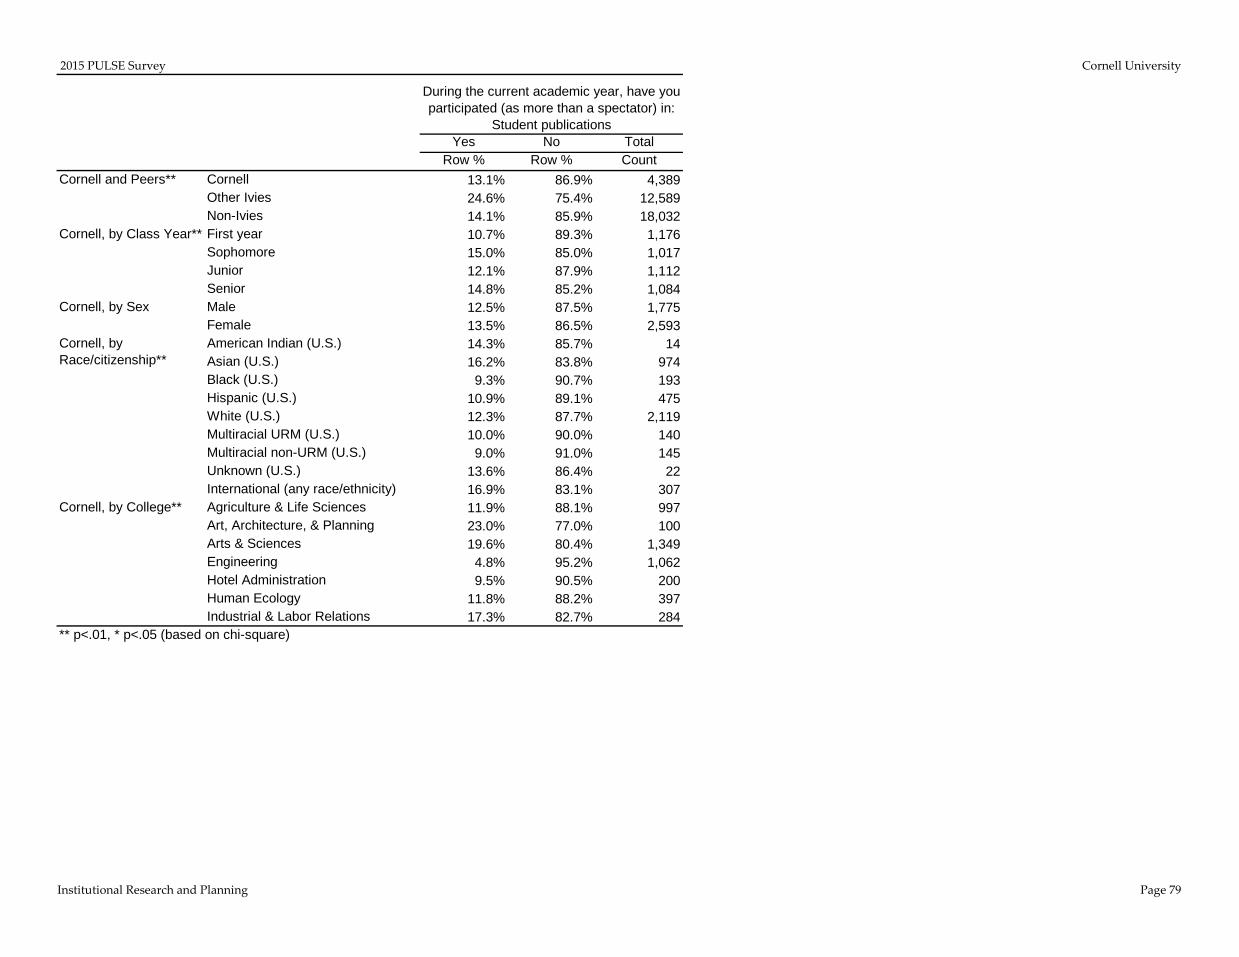
2015 PULSE Survey Cornell University
Institutional Research and Planning Page 79
Yes No TotalRow % Row % Count
Cornell 13.1% 86.9% 4,389Other Ivies 24.6% 75.4% 12,589Non-Ivies 14.1% 85.9% 18,032First year 10.7% 89.3% 1,176Sophomore 15.0% 85.0% 1,017Junior 12.1% 87.9% 1,112Senior 14.8% 85.2% 1,084Male 12.5% 87.5% 1,775Female 13.5% 86.5% 2,593American Indian (U.S.) 14.3% 85.7% 14Asian (U.S.) 16.2% 83.8% 974Black (U.S.) 9.3% 90.7% 193Hispanic (U.S.) 10.9% 89.1% 475White (U.S.) 12.3% 87.7% 2,119Multiracial URM (U.S.) 10.0% 90.0% 140Multiracial non-URM (U.S.) 9.0% 91.0% 145Unknown (U.S.) 13.6% 86.4% 22International (any race/ethnicity) 16.9% 83.1% 307Agriculture & Life Sciences 11.9% 88.1% 997Art, Architecture, & Planning 23.0% 77.0% 100Arts & Sciences 19.6% 80.4% 1,349Engineering 4.8% 95.2% 1,062Hotel Administration 9.5% 90.5% 200Human Ecology 11.8% 88.2% 397Industrial & Labor Relations 17.3% 82.7% 284
Cornell, by Race/citizenship**
Cornell, by College**
** p<.01, * p<.05 (based on chi-square)
During the current academic year, have you participated (as more than a spectator) in:
Student publications
Cornell and Peers**
Cornell, by Class Year**
Cornell, by Sex

2015 PULSE Survey Cornell University
Institutional Research and Planning Page 80
Yes No TotalRow % Row % Count
Cornell 5.6% 94.4% 4,386Other Ivies 6.2% 93.8% 12,552Non-Ivies 8.5% 91.5% 18,009First year 5.0% 95.0% 1,175Sophomore 7.1% 92.9% 1,014Junior 5.7% 94.3% 1,114Senior 4.7% 95.3% 1,083Male 6.4% 93.6% 1,775Female 5.0% 95.0% 2,590American Indian (U.S.) 7.1% 92.9% 14Asian (U.S.) 5.0% 95.0% 971Black (U.S.) 7.3% 92.7% 192Hispanic (U.S.) 6.7% 93.3% 476White (U.S.) 5.2% 94.8% 2,119Multiracial URM (U.S.) 2.9% 97.1% 140Multiracial non-URM (U.S.) 4.8% 95.2% 145Unknown (U.S.) 4.5% 95.5% 22International (any race/ethnicity) 8.8% 91.2% 307Agriculture & Life Sciences 6.5% 93.5% 996Art, Architecture, & Planning 6.0% 94.0% 100Arts & Sciences 4.7% 95.3% 1,345Engineering 2.4% 97.6% 1,062Hotel Administration 6.0% 94.0% 200Human Ecology 4.8% 95.2% 397Industrial & Labor Relations 18.9% 81.1% 286
Cornell, by College**
** p<.01, * p<.05 (based on chi-square)
During the current academic year, have you participated (as more than a spectator) in:
Student government
Cornell and Peers**
Cornell, by Class Year
Cornell, by Sex*
Cornell, by Race/citizenship

2015 PULSE Survey Cornell University
Institutional Research and Planning Page 81
Yes No TotalRow % Row % Count
Cornell 6.6% 93.4% 4,390Other Ivies 12.4% 87.6% 12,540Non-Ivies 7.7% 92.3% 18,002First year 6.9% 93.1% 1,177Sophomore 8.2% 91.8% 1,014Junior 6.3% 93.7% 1,114Senior 5.2% 94.8% 1,085Male 8.3% 91.7% 1,775Female 5.4% 94.6% 2,594American Indian (U.S.) 14.3% 85.7% 14Asian (U.S.) 4.3% 95.7% 974Black (U.S.) 5.8% 94.2% 191Hispanic (U.S.) 9.9% 90.1% 476White (U.S.) 7.3% 92.7% 2,121Multiracial URM (U.S.) 5.7% 94.3% 140Multiracial non-URM (U.S.) 6.2% 93.8% 145Unknown (U.S.) 4.5% 95.5% 22International (any race/ethnicity) 5.2% 94.8% 307Agriculture & Life Sciences 5.0% 95.0% 997Art, Architecture, & Planning 5.0% 95.0% 100Arts & Sciences 8.9% 91.1% 1,346Engineering 1.8% 98.2% 1,063Hotel Administration 5.5% 94.5% 200Human Ecology 4.3% 95.7% 398Industrial & Labor Relations 23.8% 76.2% 286
Cornell, by College**
** p<.01, * p<.05 (based on chi-square)
During the current academic year, have you participated (as more than a spectator) in:
Political group
Cornell and Peers**
Cornell, by Class Year*
Cornell, by Sex**
Cornell, by Race/citizenship**

2015 PULSE Survey Cornell University
Institutional Research and Planning Page 82
Yes No TotalRow % Row % Count
Cornell 21.5% 78.5% 4,394Other Ivies 20.5% 79.5% 12,560Non-Ivies 21.9% 78.1% 17,996First year 23.6% 76.4% 1,184Sophomore 21.6% 78.4% 1,016Junior 20.3% 79.7% 1,111Senior 20.4% 79.6% 1,083Male 18.6% 81.4% 1,778Female 23.5% 76.5% 2,595American Indian (U.S.) 23.1% 76.9% 13Asian (U.S.) 23.7% 76.3% 974Black (U.S.) 29.3% 70.7% 191Hispanic (U.S.) 19.1% 80.9% 476White (U.S.) 21.3% 78.7% 2,125Multiracial URM (U.S.) 18.6% 81.4% 140Multiracial non-URM (U.S.) 13.1% 86.9% 145Unknown (U.S.) 18.2% 81.8% 22International (any race/ethnicity) 20.5% 79.5% 308Agriculture & Life Sciences 21.9% 78.1% 998Art, Architecture, & Planning 18.0% 82.0% 100Arts & Sciences 20.2% 79.8% 1,349Engineering 18.6% 81.4% 1,065Hotel Administration 19.0% 81.0% 200Human Ecology 31.1% 68.9% 399Industrial & Labor Relations 26.9% 73.1% 283
Cornell, by College**
** p<.01, * p<.05 (based on chi-square)
Cornell and Peers*
Cornell, by Class Year
Cornell, by Sex**
Cornell, by Race/citizenship*
During the current academic year, have you participated (as more than a spectator) in:
Religious or spiritual group

2015 PULSE Survey Cornell University
Institutional Research and Planning Page 83
Yes No TotalRow % Row % Count
Cornell 23.4% 76.6% 4,377Other Ivies 28.7% 71.3% 12,536Non-Ivies 24.2% 75.8% 17,997First year 23.0% 77.0% 1,174Sophomore 24.0% 76.0% 1,009Junior 23.6% 76.4% 1,112Senior 23.2% 76.8% 1,082Male 20.9% 79.1% 1,772Female 25.2% 74.8% 2,584American Indian (U.S.) 38.5% 61.5% 13Asian (U.S.) 39.7% 60.3% 968Black (U.S.) 47.9% 52.1% 192Hispanic (U.S.) 28.1% 71.9% 474White (U.S.) 9.7% 90.3% 2,117Multiracial URM (U.S.) 24.8% 75.2% 141Multiracial non-URM (U.S.) 22.8% 77.2% 145Unknown (U.S.) 31.8% 68.2% 22International (any race/ethnicity) 42.6% 57.4% 305Agriculture & Life Sciences 20.9% 79.1% 997Art, Architecture, & Planning 24.5% 75.5% 98Arts & Sciences 26.5% 73.5% 1,341Engineering 18.5% 81.5% 1,060Hotel Administration 26.6% 73.4% 199Human Ecology 27.5% 72.5% 397Industrial & Labor Relations 27.7% 72.3% 285
Cornell, by Race/citizenship**
Cornell, by College**
** p<.01, * p<.05 (based on chi-square)
During the current academic year, have you participated (as more than a spectator) in:
Cultural/ethnic organization
Cornell and Peers**
Cornell, by Class Year
Cornell, by Sex**

2015 PULSE Survey Cornell University
Institutional Research and Planning Page 84
Yes No TotalRow % Row % Count
Cornell 41.4% 58.6% 4,396Other Ivies 32.3% 67.7% 12,575Non-Ivies 34.3% 65.7% 18,026First year 33.2% 66.8% 1,178Sophomore 41.7% 58.3% 1,018Junior 46.1% 53.9% 1,116Senior 44.9% 55.1% 1,084Male 37.7% 62.3% 1,777Female 44.0% 56.0% 2,598American Indian (U.S.) 50.0% 50.0% 14Asian (U.S.) 48.2% 51.8% 973Black (U.S.) 47.2% 52.8% 193Hispanic (U.S.) 37.4% 62.6% 478White (U.S.) 39.4% 60.6% 2,124Multiracial URM (U.S.) 36.9% 63.1% 141Multiracial non-URM (U.S.) 35.2% 64.8% 145Unknown (U.S.) 36.4% 63.6% 22International (any race/ethnicity) 40.5% 59.5% 306Agriculture & Life Sciences 44.9% 55.1% 999Art, Architecture, & Planning 37.0% 63.0% 100Arts & Sciences 39.7% 60.3% 1,350Engineering 36.8% 63.2% 1,064Hotel Administration 53.3% 46.7% 199Human Ecology 43.3% 56.7% 397Industrial & Labor Relations 43.9% 56.1% 287
Cornell, by Race/citizenship**
Cornell, by College**
** p<.01, * p<.05 (based on chi-square)
During the current academic year, have you participated (as more than a spectator) in:
Academic clubs, honor societies, or professional associations
Cornell and Peers**
Cornell, by Class Year**
Cornell, by Sex**

2015 PULSE Survey Cornell University
Institutional Research and Planning Page 85
Yes No TotalRow % Row % Count
Cornell 31.1% 68.9% 4,402Other Ivies 30.4% 69.6% 5,763Non-Ivies 31.0% 69.0% 12,932First year 26.2% 73.8% 1,181Sophomore 34.1% 65.9% 1,021Junior 31.1% 68.9% 1,115Senior 33.5% 66.5% 1,085Male 27.9% 72.1% 1,783Female 33.3% 66.7% 2,598American Indian (U.S.) 35.7% 64.3% 14Asian (U.S.) 21.7% 78.3% 972Black (U.S.) 17.8% 82.2% 191Hispanic (U.S.) 30.8% 69.2% 477White (U.S.) 39.0% 61.0% 2,134Multiracial URM (U.S.) 32.1% 67.9% 140Multiracial non-URM (U.S.) 31.7% 68.3% 145Unknown (U.S.) 22.7% 77.3% 22International (any race/ethnicity) 13.7% 86.3% 307Agriculture & Life Sciences 31.9% 68.1% 1,000Art, Architecture, & Planning 18.2% 81.8% 99Arts & Sciences 28.2% 71.8% 1,353Engineering 24.2% 75.8% 1,065Hotel Administration 48.8% 51.2% 201Human Ecology 40.4% 59.6% 396Industrial & Labor Relations 46.5% 53.5% 288
** p<.01, * p<.05 (based on chi-square)
During the current academic year, have you participated (as more than a spectator) in:
Fraternity or sorority
Cornell and Peers
Cornell, by Class Year**
Cornell, by Sex**
Cornell, by Race/citizenship**
Cornell, by College**

2015 PULSE Survey Cornell University
Institutional Research and Planning Page 86
Yes No TotalRow % Row % Count
Cornell 67.2% 32.8% 4,397Other Ivies 52.1% 47.9% 12,600Non-Ivies 56.2% 43.8% 18,047First year 64.7% 35.3% 1,179Sophomore 68.1% 31.9% 1,023Junior 69.6% 30.4% 1,114Senior 66.4% 33.6% 1,081Male 60.9% 39.1% 1,777Female 71.5% 28.5% 2,599American Indian (U.S.) 78.6% 21.4% 14Asian (U.S.) 65.9% 34.1% 971Black (U.S.) 71.5% 28.5% 193Hispanic (U.S.) 70.0% 30.0% 476White (U.S.) 67.5% 32.5% 2,128Multiracial URM (U.S.) 67.1% 32.9% 140Multiracial non-URM (U.S.) 68.5% 31.5% 143Unknown (U.S.) 63.6% 36.4% 22International (any race/ethnicity) 61.0% 39.0% 310Agriculture & Life Sciences 70.7% 29.3% 999Art, Architecture, & Planning 66.0% 34.0% 100Arts & Sciences 63.9% 36.1% 1,348Engineering 62.9% 37.1% 1,062Hotel Administration 72.6% 27.4% 201Human Ecology 74.8% 25.2% 401Industrial & Labor Relations 71.7% 28.3% 286
Cornell, by Race/citizenship
Cornell, by College**
** p<.01, * p<.05 (based on chi-square)
During the current academic year, have you participated (as more than a spectator) in:
Other student organizations or clubs
Cornell and Peers**
Cornell, by Class Year
Cornell, by Sex**
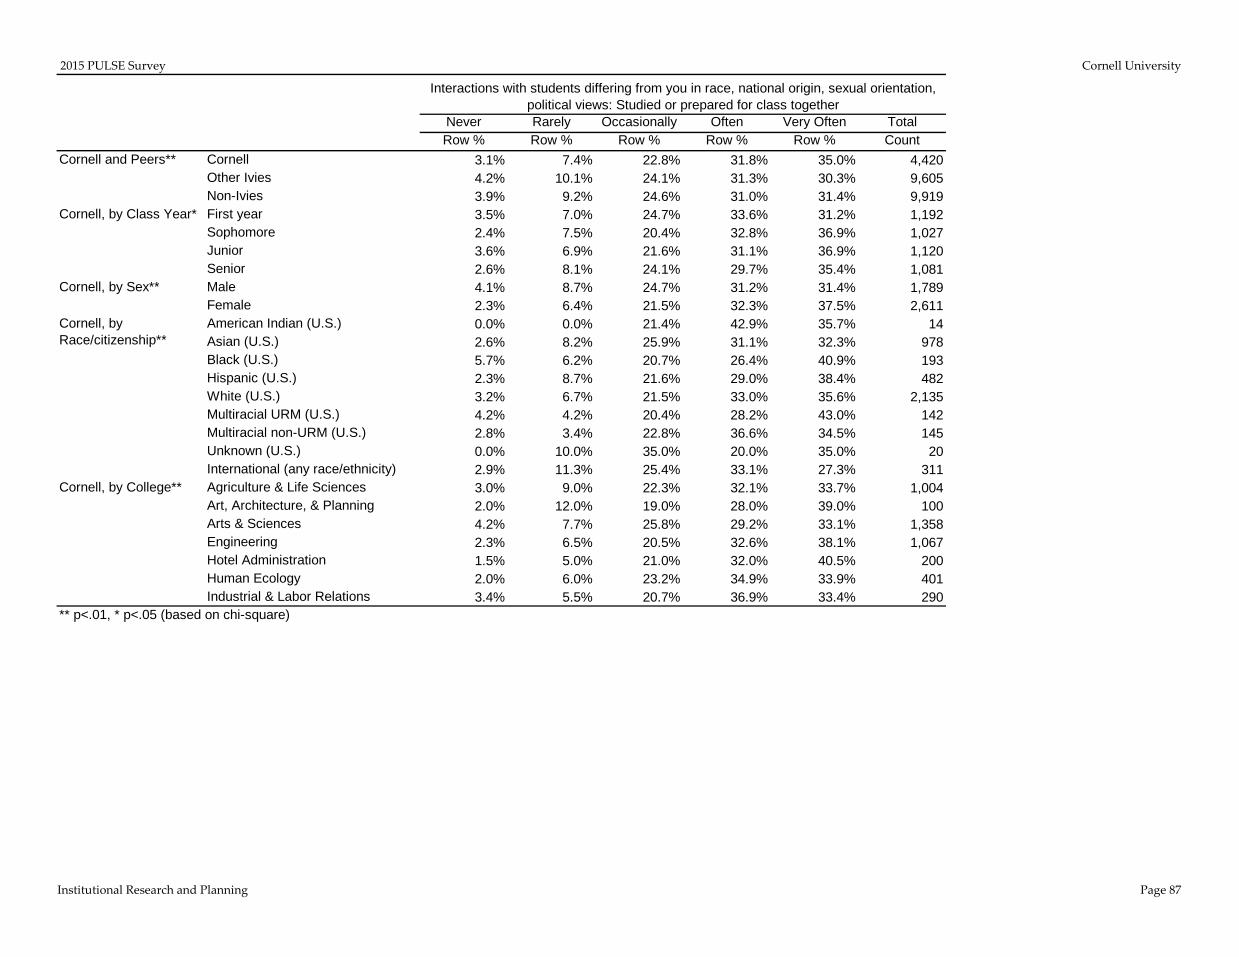
2015 PULSE Survey Cornell University
Institutional Research and Planning Page 87
Never Rarely Occasionally Often Very Often TotalRow % Row % Row % Row % Row % Count
Cornell 3.1% 7.4% 22.8% 31.8% 35.0% 4,420Other Ivies 4.2% 10.1% 24.1% 31.3% 30.3% 9,605Non-Ivies 3.9% 9.2% 24.6% 31.0% 31.4% 9,919First year 3.5% 7.0% 24.7% 33.6% 31.2% 1,192Sophomore 2.4% 7.5% 20.4% 32.8% 36.9% 1,027Junior 3.6% 6.9% 21.6% 31.1% 36.9% 1,120Senior 2.6% 8.1% 24.1% 29.7% 35.4% 1,081Male 4.1% 8.7% 24.7% 31.2% 31.4% 1,789Female 2.3% 6.4% 21.5% 32.3% 37.5% 2,611American Indian (U.S.) 0.0% 0.0% 21.4% 42.9% 35.7% 14Asian (U.S.) 2.6% 8.2% 25.9% 31.1% 32.3% 978Black (U.S.) 5.7% 6.2% 20.7% 26.4% 40.9% 193Hispanic (U.S.) 2.3% 8.7% 21.6% 29.0% 38.4% 482White (U.S.) 3.2% 6.7% 21.5% 33.0% 35.6% 2,135Multiracial URM (U.S.) 4.2% 4.2% 20.4% 28.2% 43.0% 142Multiracial non-URM (U.S.) 2.8% 3.4% 22.8% 36.6% 34.5% 145Unknown (U.S.) 0.0% 10.0% 35.0% 20.0% 35.0% 20International (any race/ethnicity) 2.9% 11.3% 25.4% 33.1% 27.3% 311Agriculture & Life Sciences 3.0% 9.0% 22.3% 32.1% 33.7% 1,004Art, Architecture, & Planning 2.0% 12.0% 19.0% 28.0% 39.0% 100Arts & Sciences 4.2% 7.7% 25.8% 29.2% 33.1% 1,358Engineering 2.3% 6.5% 20.5% 32.6% 38.1% 1,067Hotel Administration 1.5% 5.0% 21.0% 32.0% 40.5% 200Human Ecology 2.0% 6.0% 23.2% 34.9% 33.9% 401Industrial & Labor Relations 3.4% 5.5% 20.7% 36.9% 33.4% 290
Cornell, by College**
** p<.01, * p<.05 (based on chi-square)
Interactions with students differing from you in race, national origin, sexual orientation, political views: Studied or prepared for class together
Cornell and Peers**
Cornell, by Class Year*
Cornell, by Sex**
Cornell, by Race/citizenship**

2015 PULSE Survey Cornell University
Institutional Research and Planning Page 88
Never Rarely Occasionally Often Very Often TotalRow % Row % Row % Row % Row % Count
Cornell 1.7% 5.3% 16.8% 30.2% 46.1% 4,421Other Ivies 1.1% 3.8% 17.3% 33.5% 44.1% 9,611Non-Ivies 1.4% 5.3% 17.6% 31.9% 43.8% 9,937First year 1.7% 5.4% 15.8% 31.8% 45.4% 1,192Sophomore 1.6% 4.9% 17.5% 29.6% 46.5% 1,028Junior 2.1% 6.2% 17.9% 28.2% 45.5% 1,121Senior 1.3% 4.7% 16.1% 30.9% 46.9% 1,080Male 2.1% 6.9% 18.1% 30.0% 42.9% 1,789Female 1.4% 4.2% 15.9% 30.3% 48.2% 2,612American Indian (U.S.) 0.0% 0.0% 14.3% 42.9% 42.9% 14Asian (U.S.) 1.3% 6.2% 20.6% 30.2% 41.7% 977Black (U.S.) 2.6% 6.7% 16.1% 21.2% 53.4% 193Hispanic (U.S.) 1.0% 5.2% 12.8% 30.2% 50.8% 484White (U.S.) 1.8% 4.5% 15.5% 31.2% 47.0% 2,135Multiracial URM (U.S.) 1.4% 2.8% 12.7% 26.8% 56.3% 142Multiracial non-URM (U.S.) 2.1% 3.4% 15.9% 30.3% 48.3% 145Unknown (U.S.) 0.0% 10.0% 35.0% 15.0% 40.0% 20International (any race/ethnicity) 2.3% 9.3% 22.2% 29.9% 36.3% 311Agriculture & Life Sciences 1.7% 7.3% 16.1% 28.7% 46.3% 1,005Art, Architecture, & Planning 0.0% 5.0% 14.0% 34.0% 47.0% 100Arts & Sciences 2.4% 4.9% 16.9% 29.3% 46.6% 1,359Engineering 1.4% 5.3% 17.0% 30.8% 45.5% 1,067Hotel Administration 1.0% 2.5% 18.5% 31.0% 47.0% 200Human Ecology 1.2% 4.0% 17.0% 30.7% 47.1% 401Industrial & Labor Relations 1.0% 4.2% 18.0% 34.3% 42.6% 289
Cornell, by College
** p<.01, * p<.05 (based on chi-square)
Interactions with students differing from you in race, national origin, sexual orientation, political views: Socialized or shared a meal
Cornell and Peers**
Cornell, by Class Year
Cornell, by Sex**
Cornell, by Race/citizenship**

2015 PULSE Survey Cornell University
Institutional Research and Planning Page 89
Never Rarely Occasionally Often Very Often TotalRow % Row % Row % Row % Row % Count
Cornell 7.2% 17.2% 27.8% 24.5% 23.3% 4,419Other Ivies 5.1% 14.6% 30.5% 27.4% 22.4% 9,609Non-Ivies 5.9% 16.1% 30.7% 25.8% 21.5% 9,928First year 6.8% 17.8% 28.0% 25.8% 21.6% 1,190Sophomore 8.7% 17.1% 25.1% 24.3% 24.7% 1,027Junior 8.3% 15.8% 28.7% 24.5% 22.8% 1,120Senior 5.3% 18.0% 29.2% 23.3% 24.2% 1,082Male 9.3% 19.3% 26.5% 24.6% 20.3% 1,790Female 5.8% 15.8% 28.7% 24.4% 25.3% 2,609American Indian (U.S.) 0.0% 0.0% 35.7% 28.6% 35.7% 14Asian (U.S.) 7.0% 18.8% 30.3% 25.0% 18.9% 977Black (U.S.) 7.8% 13.0% 23.3% 23.3% 32.6% 193Hispanic (U.S.) 5.8% 12.0% 27.7% 28.0% 26.5% 483White (U.S.) 8.0% 17.8% 27.2% 23.6% 23.4% 2,135Multiracial URM (U.S.) 5.0% 17.7% 27.0% 21.3% 29.1% 141Multiracial non-URM (U.S.) 7.6% 15.9% 31.0% 21.4% 24.1% 145Unknown (U.S.) 10.0% 30.0% 20.0% 20.0% 20.0% 20International (any race/ethnicity) 6.1% 19.0% 25.7% 27.7% 21.5% 311Agriculture & Life Sciences 5.7% 17.6% 27.7% 25.3% 23.8% 1,005Art, Architecture, & Planning 5.0% 12.0% 31.0% 22.0% 30.0% 100Arts & Sciences 7.7% 18.1% 27.3% 23.7% 23.2% 1,357Engineering 9.8% 18.6% 28.7% 21.9% 21.0% 1,067Hotel Administration 5.5% 13.0% 28.0% 30.0% 23.5% 200Human Ecology 6.5% 16.0% 26.5% 26.3% 24.8% 400Industrial & Labor Relations 4.1% 12.8% 27.6% 30.0% 25.5% 290
Cornell, by College**
** p<.01, * p<.05 (based on chi-square)
Interactions with students differing from you in race, national origin, sexual orientation, political views: Had meaningful and honest discussions about inter-group relations
Cornell and Peers**
Cornell, by Class Year
Cornell, by Sex**
Cornell, by Race/citizenship**

2015 PULSE Survey Cornell University
Institutional Research and Planning Page 90
Never Rarely Occasionally Often Very Often TotalRow % Row % Row % Row % Row % Count
Cornell 2.3% 6.2% 22.2% 35.6% 33.7% 4,419Other Ivies 1.9% 7.0% 24.1% 37.4% 29.6% 9,611Non-Ivies 2.2% 7.4% 24.4% 36.5% 29.5% 9,393First year 2.3% 6.5% 22.5% 38.3% 30.5% 1,191Sophomore 2.7% 7.5% 23.1% 32.8% 33.9% 1,027Junior 2.7% 5.3% 22.8% 34.6% 34.6% 1,120Senior 1.7% 5.5% 20.4% 36.4% 36.2% 1,081Male 3.2% 7.3% 22.6% 35.0% 31.8% 1,789Female 1.6% 5.4% 21.7% 36.1% 35.1% 2,610American Indian (U.S.) 0.0% 0.0% 28.6% 21.4% 50.0% 14Asian (U.S.) 3.3% 8.2% 26.6% 36.3% 25.7% 978Black (U.S.) 3.6% 7.3% 28.0% 26.9% 34.2% 193Hispanic (U.S.) 1.0% 5.6% 20.5% 35.4% 37.5% 483White (U.S.) 2.2% 5.2% 19.2% 36.3% 37.1% 2,134Multiracial URM (U.S.) 2.1% 3.5% 23.4% 29.8% 41.1% 141Multiracial non-URM (U.S.) 2.1% 4.8% 22.1% 37.2% 33.8% 145Unknown (U.S.) 5.0% 15.0% 35.0% 25.0% 20.0% 20International (any race/ethnicity) 1.9% 8.0% 26.0% 37.6% 26.4% 311Agriculture & Life Sciences 1.9% 5.6% 20.7% 37.7% 34.1% 1,003Art, Architecture, & Planning 1.0% 6.0% 26.0% 31.0% 36.0% 100Arts & Sciences 2.4% 6.4% 22.8% 34.7% 33.7% 1,357Engineering 3.4% 6.6% 22.9% 34.6% 32.5% 1,068Hotel Administration 1.0% 5.0% 24.5% 34.5% 35.0% 200Human Ecology 2.0% 5.7% 21.2% 36.2% 34.9% 401Industrial & Labor Relations 1.7% 6.6% 19.7% 38.3% 33.8% 290
** p<.01, * p<.05 (based on chi-square)
Interactions with students differing from you in race, national origin, sexual orientation, political views: Felt comfortable sharing your own experiences
Cornell and Peers**
Cornell, by Class Year*
Cornell, by Sex**
Cornell, by Race/citizenship**
Cornell, by College

2015 PULSE Survey Cornell University
Institutional Research and Planning Page 91
No Yes TotalRow % Row % Count
Cornell 70.2% 29.8% 4,354Other IviesNon-IviesFirst year 71.9% 28.1% 1,176Sophomore 69.2% 30.8% 1,002Junior 68.6% 31.4% 1,101Senior 70.9% 29.1% 1,075Male 73.4% 26.6% 1,757Female 68.3% 31.7% 2,576American Indian (U.S.) 50.0% 50.0% 14Asian (U.S.) 66.6% 33.4% 957Black (U.S.) 52.1% 47.9% 192Hispanic (U.S.) 66.6% 33.4% 473White (U.S.) 74.3% 25.7% 2,110Multiracial URM (U.S.) 63.6% 36.4% 140Multiracial non-URM (U.S.) 74.5% 25.5% 145Unknown (U.S.) 70.0% 30.0% 20International (any race/ethnicity) 72.3% 27.7% 303Agriculture & Life Sciences 70.7% 29.3% 991Art, Architecture, & Planning 60.0% 40.0% 100Arts & Sciences 68.8% 31.2% 1,341Engineering 76.2% 23.8% 1,049Hotel Administration 68.1% 31.9% 191Human Ecology 64.6% 35.4% 398Industrial & Labor Relations 65.8% 34.2% 284
Cornell, by Class Year
Cornell, by Sex**
Cornell, by Race/citizenship**
Cornell, by College**
This academic year at Cornell, felt insulted or threatened based on: Any aspect of
social identity
Cornell and Peers
No peer data available.
** p<.01, * p<.05 (based on chi-square)
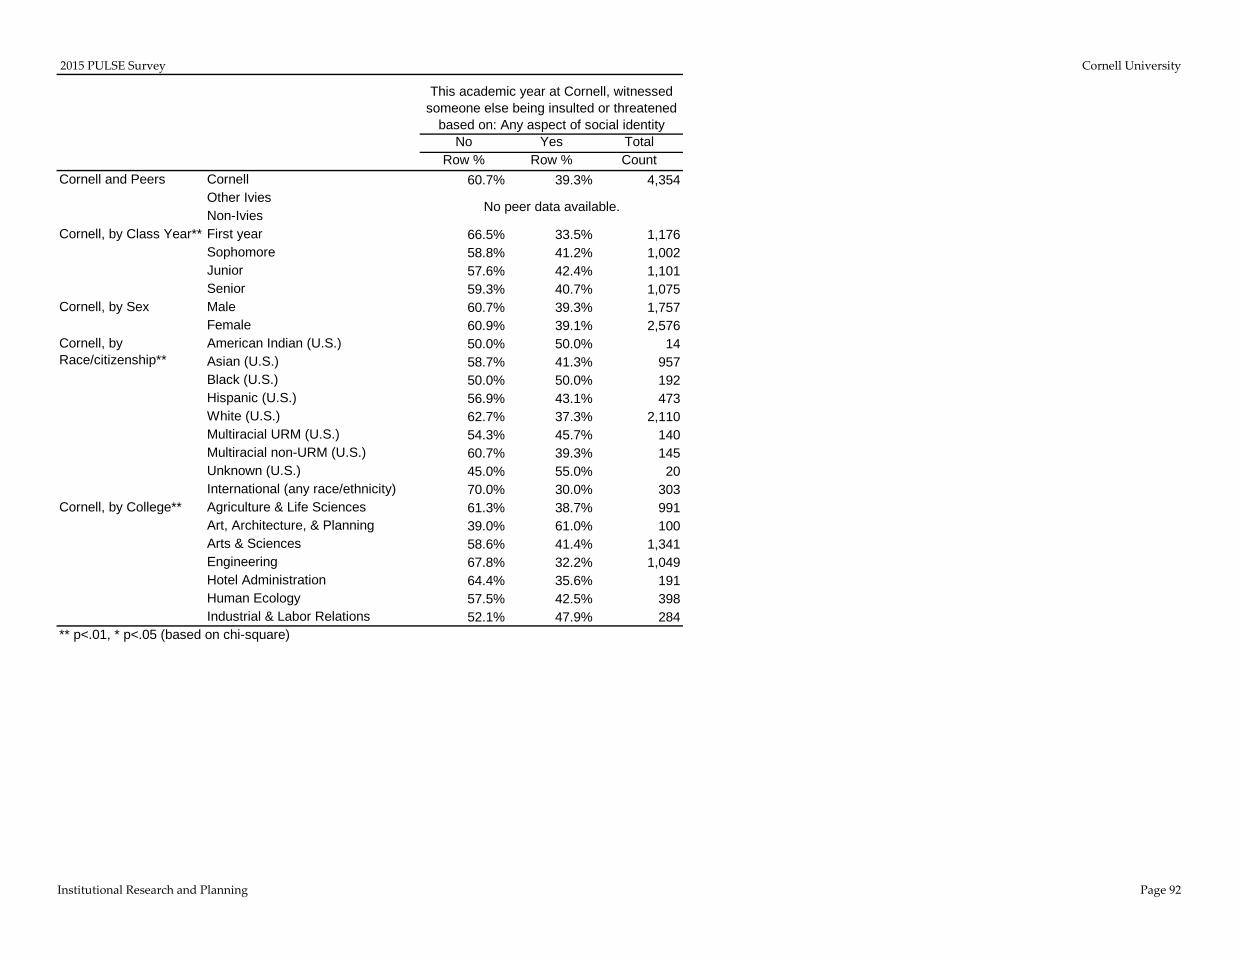
2015 PULSE Survey Cornell University
Institutional Research and Planning Page 92
No Yes TotalRow % Row % Count
Cornell 60.7% 39.3% 4,354Other IviesNon-IviesFirst year 66.5% 33.5% 1,176Sophomore 58.8% 41.2% 1,002Junior 57.6% 42.4% 1,101Senior 59.3% 40.7% 1,075Male 60.7% 39.3% 1,757Female 60.9% 39.1% 2,576American Indian (U.S.) 50.0% 50.0% 14Asian (U.S.) 58.7% 41.3% 957Black (U.S.) 50.0% 50.0% 192Hispanic (U.S.) 56.9% 43.1% 473White (U.S.) 62.7% 37.3% 2,110Multiracial URM (U.S.) 54.3% 45.7% 140Multiracial non-URM (U.S.) 60.7% 39.3% 145Unknown (U.S.) 45.0% 55.0% 20International (any race/ethnicity) 70.0% 30.0% 303Agriculture & Life Sciences 61.3% 38.7% 991Art, Architecture, & Planning 39.0% 61.0% 100Arts & Sciences 58.6% 41.4% 1,341Engineering 67.8% 32.2% 1,049Hotel Administration 64.4% 35.6% 191Human Ecology 57.5% 42.5% 398Industrial & Labor Relations 52.1% 47.9% 284
No peer data available.
Cornell, by Sex
Cornell, by Race/citizenship**
Cornell, by College**
** p<.01, * p<.05 (based on chi-square)
This academic year at Cornell, witnessed someone else being insulted or threatened
based on: Any aspect of social identity
Cornell and Peers
Cornell, by Class Year**
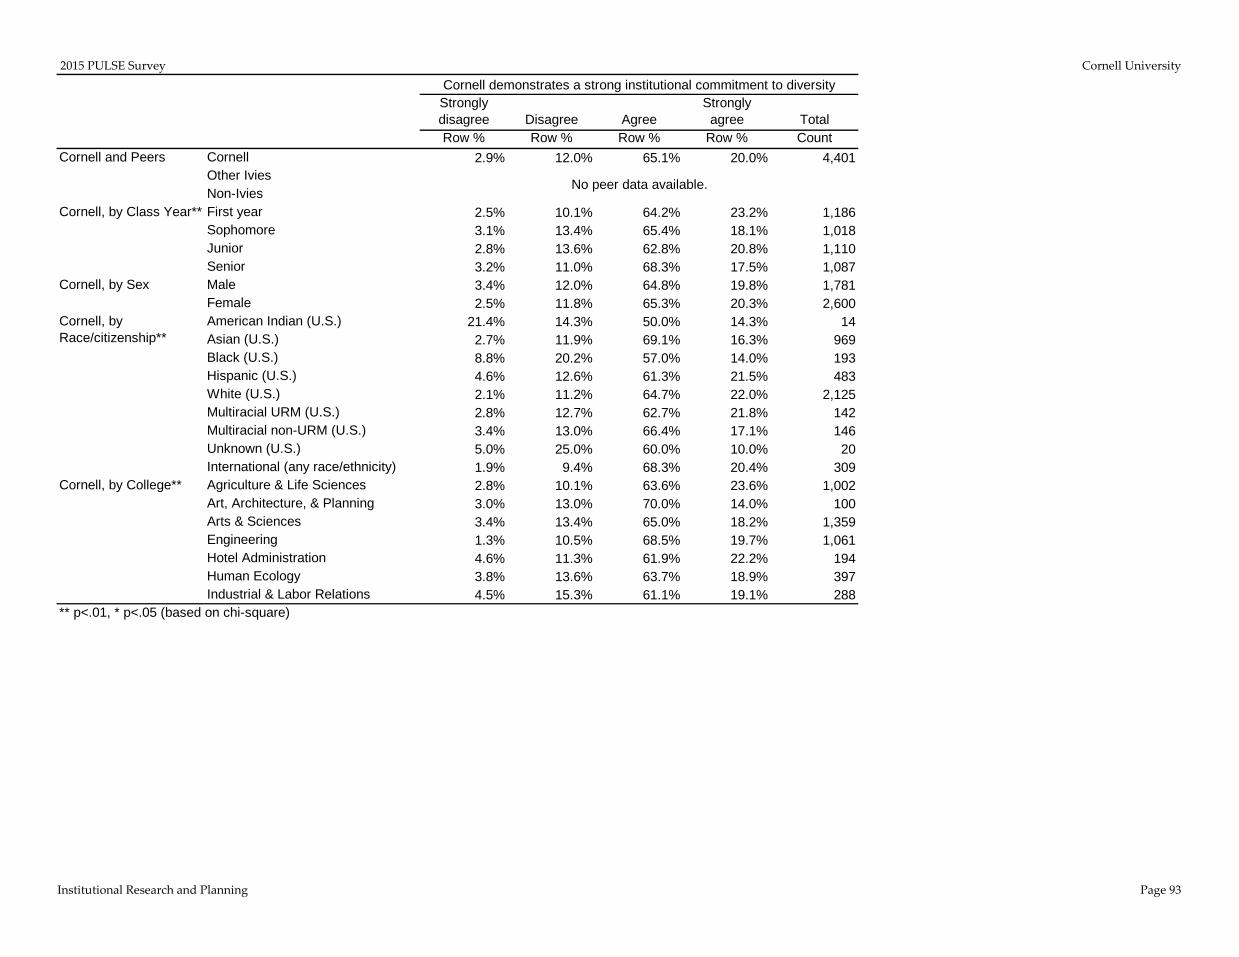
2015 PULSE Survey Cornell University
Institutional Research and Planning Page 93
Strongly disagree Disagree Agree
Strongly agree Total
Row % Row % Row % Row % CountCornell 2.9% 12.0% 65.1% 20.0% 4,401Other IviesNon-IviesFirst year 2.5% 10.1% 64.2% 23.2% 1,186Sophomore 3.1% 13.4% 65.4% 18.1% 1,018Junior 2.8% 13.6% 62.8% 20.8% 1,110Senior 3.2% 11.0% 68.3% 17.5% 1,087Male 3.4% 12.0% 64.8% 19.8% 1,781Female 2.5% 11.8% 65.3% 20.3% 2,600American Indian (U.S.) 21.4% 14.3% 50.0% 14.3% 14Asian (U.S.) 2.7% 11.9% 69.1% 16.3% 969Black (U.S.) 8.8% 20.2% 57.0% 14.0% 193Hispanic (U.S.) 4.6% 12.6% 61.3% 21.5% 483White (U.S.) 2.1% 11.2% 64.7% 22.0% 2,125Multiracial URM (U.S.) 2.8% 12.7% 62.7% 21.8% 142Multiracial non-URM (U.S.) 3.4% 13.0% 66.4% 17.1% 146Unknown (U.S.) 5.0% 25.0% 60.0% 10.0% 20International (any race/ethnicity) 1.9% 9.4% 68.3% 20.4% 309Agriculture & Life Sciences 2.8% 10.1% 63.6% 23.6% 1,002Art, Architecture, & Planning 3.0% 13.0% 70.0% 14.0% 100Arts & Sciences 3.4% 13.4% 65.0% 18.2% 1,359Engineering 1.3% 10.5% 68.5% 19.7% 1,061Hotel Administration 4.6% 11.3% 61.9% 22.2% 194Human Ecology 3.8% 13.6% 63.7% 18.9% 397Industrial & Labor Relations 4.5% 15.3% 61.1% 19.1% 288
Cornell, by Race/citizenship**
Cornell, by College**
** p<.01, * p<.05 (based on chi-square)
Cornell demonstrates a strong institutional commitment to diversity
Cornell and Peers
Cornell, by Class Year**
Cornell, by Sex
No peer data available.

2015 PULSE Survey Cornell University
Institutional Research and Planning Page 94
Strongly disagree Disagree Agree
Strongly agree Total
Row % Row % Row % Row % CountCornell 4.2% 13.4% 54.2% 28.3% 4,403Other IviesNon-IviesFirst year 4.1% 15.4% 55.3% 25.1% 1,185Sophomore 4.0% 12.8% 55.9% 27.2% 1,017Junior 4.1% 12.6% 53.9% 29.4% 1,112Senior 4.3% 12.4% 51.9% 31.4% 1,089Male 5.2% 13.3% 54.4% 27.1% 1,781Female 3.4% 13.3% 54.2% 29.1% 2,601American Indian (U.S.) 7.1% 35.7% 42.9% 14.3% 14Asian (U.S.) 4.2% 14.3% 59.2% 22.3% 970Black (U.S.) 6.8% 15.1% 51.6% 26.6% 192Hispanic (U.S.) 4.1% 15.9% 52.8% 27.1% 483White (U.S.) 3.8% 11.4% 52.0% 32.9% 2,130Multiracial URM (U.S.) 1.4% 17.7% 59.6% 21.3% 141Multiracial non-URM (U.S.) 6.8% 13.0% 48.6% 31.5% 146Unknown (U.S.) 5.3% 26.3% 47.4% 21.1% 19International (any race/ethnicity) 4.5% 15.3% 59.4% 20.8% 308Agriculture & Life Sciences 4.4% 14.1% 52.3% 29.2% 1,004Art, Architecture, & Planning 2.0% 19.0% 48.0% 31.0% 100Arts & Sciences 5.5% 14.1% 54.6% 25.7% 1,358Engineering 2.2% 13.2% 54.0% 30.6% 1,062Hotel Administration 5.2% 12.9% 54.1% 27.8% 194Human Ecology 3.8% 10.6% 57.7% 28.0% 397Industrial & Labor Relations 4.9% 9.7% 57.3% 28.1% 288
No peer data available.
Cornell, by Sex*
Cornell, by Race/citizenship**
Cornell, by College**
** p<.01, * p<.05 (based on chi-square)
I have found a community at Cornell where I feel like I belong
Cornell and Peers
Cornell, by Class Year

2015 PULSE Survey Cornell University
Institutional Research and Planning Page 95
Strongly disagree Disagree Agree
Strongly agree Total
Row % Row % Row % Row % CountCornell 4.0% 15.8% 65.0% 15.2% 4,394Other IviesNon-IviesFirst year 3.3% 12.9% 65.9% 17.9% 1,184Sophomore 4.9% 15.4% 67.0% 12.7% 1,016Junior 4.1% 17.0% 63.9% 14.9% 1,109Senior 3.9% 18.1% 63.2% 14.8% 1,085Male 4.7% 16.0% 63.4% 15.8% 1,780Female 3.5% 15.5% 66.3% 14.7% 2,594American Indian (U.S.) 14.3% 28.6% 50.0% 7.1% 14Asian (U.S.) 3.6% 13.9% 67.6% 14.9% 969Black (U.S.) 8.4% 25.1% 58.1% 8.4% 191Hispanic (U.S.) 4.8% 19.3% 62.1% 13.9% 483White (U.S.) 3.8% 15.4% 64.3% 16.5% 2,121Multiracial URM (U.S.) 3.5% 19.7% 62.7% 14.1% 142Multiracial non-URM (U.S.) 5.5% 17.1% 68.5% 8.9% 146Unknown (U.S.) 5.0% 15.0% 75.0% 5.0% 20International (any race/ethnicity) 2.3% 10.4% 69.8% 17.5% 308Agriculture & Life Sciences 4.6% 16.2% 62.9% 16.4% 996Art, Architecture, & Planning 1.0% 15.0% 66.0% 18.0% 100Arts & Sciences 4.6% 16.5% 65.2% 13.7% 1,359Engineering 2.5% 13.5% 66.9% 17.1% 1,061Hotel Administration 3.1% 19.6% 65.5% 11.9% 194Human Ecology 5.1% 15.2% 64.6% 15.2% 396Industrial & Labor Relations 4.9% 18.4% 64.2% 12.5% 288
** p<.01, * p<.05 (based on chi-square)
Students here are respectful of one another when discussing controversial issues or perspectives
Cornell and Peers
Cornell, by Class Year**
No peer data available.
Cornell, by Sex
Cornell, by Race/citizenship**
Cornell, by College*

2015 PULSE Survey Cornell University
Institutional Research and Planning Page 96
Rarely or Never Occasionally Often Very Often TotalRow % Row % Row % Row % Count
Cornell 42.0% 36.2% 13.3% 8.5% 4,419Other Ivies 37.4% 37.4% 14.7% 10.5% 12,652Non-Ivies 38.7% 36.9% 14.6% 9.8% 18,079First year 35.8% 40.6% 13.8% 9.8% 1,189Sophomore 41.9% 36.4% 12.8% 8.9% 1,024Junior 42.3% 34.6% 14.8% 8.3% 1,117Senior 48.5% 33.0% 11.7% 6.9% 1,089Male 44.2% 34.9% 12.2% 8.7% 1,790Female 40.7% 37.2% 13.8% 8.4% 2,608American Indian (U.S.) 42.9% 50.0% 7.1% 0.0% 14Asian (U.S.) 40.4% 37.9% 14.3% 7.4% 976Black (U.S.) 37.0% 28.1% 16.7% 18.2% 192Hispanic (U.S.) 37.9% 37.3% 15.5% 9.3% 483White (U.S.) 44.8% 35.5% 11.9% 7.9% 2,139Multiracial URM (U.S.) 34.0% 36.9% 17.0% 12.1% 141Multiracial non-URM (U.S.) 44.5% 33.6% 13.7% 8.2% 146Unknown (U.S.) 27.8% 33.3% 16.7% 22.2% 18International (any race/ethnicity) 40.6% 40.0% 12.3% 7.1% 310Agriculture & Life Sciences 41.4% 34.3% 14.7% 9.6% 1,007Art, Architecture, & Planning 35.6% 37.6% 17.8% 8.9% 101Arts & Sciences 40.6% 36.8% 13.4% 9.3% 1,355Engineering 46.4% 35.4% 11.3% 6.9% 1,069Hotel Administration 38.9% 39.9% 12.1% 9.1% 198Human Ecology 41.6% 38.7% 13.0% 6.7% 401Industrial & Labor Relations 39.2% 37.5% 14.9% 8.3% 288
Cornell, by Sex
Cornell, by Race/citizenship**
Cornell, by College
** p<.01, * p<.05 (based on chi-square)
During the current academic year, how often, if ever, have you: Felt out of place or that you just didn't fit in on campus
Cornell and Peers**
Cornell, by Class Year**

2015 PULSE Survey Cornell University
Institutional Research and Planning Page 97
Rarely or Never Occasionally Often Very Often TotalRow % Row % Row % Row % Count
Cornell 8.1% 35.7% 31.9% 24.3% 4,423Other Ivies 8.2% 37.0% 31.5% 23.3% 12,648Non-Ivies 8.1% 34.3% 32.2% 25.4% 18,080First year 7.6% 39.0% 31.3% 22.1% 1,190Sophomore 8.1% 29.7% 33.8% 28.4% 1,026Junior 6.9% 34.6% 32.1% 26.5% 1,119Senior 9.8% 38.9% 30.4% 20.9% 1,088Male 12.3% 41.8% 27.4% 18.5% 1,794Female 5.2% 31.6% 34.9% 28.2% 2,608American Indian (U.S.) 7.1% 28.6% 21.4% 42.9% 14Asian (U.S.) 9.3% 37.9% 30.6% 22.2% 977Black (U.S.) 5.7% 23.4% 32.8% 38.0% 192Hispanic (U.S.) 7.7% 30.4% 33.5% 28.4% 483White (U.S.) 7.8% 37.0% 31.4% 23.8% 2,142Multiracial URM (U.S.) 5.6% 27.5% 37.3% 29.6% 142Multiracial non-URM (U.S.) 7.5% 32.2% 35.6% 24.7% 146Unknown (U.S.) 5.6% 33.3% 33.3% 27.8% 18International (any race/ethnicity) 9.4% 41.4% 32.4% 16.8% 309Agriculture & Life Sciences 8.7% 35.5% 30.4% 25.5% 1,004Art, Architecture, & Planning 3.0% 36.6% 31.7% 28.7% 101Arts & Sciences 7.6% 35.0% 34.1% 23.3% 1,362Engineering 7.2% 38.3% 29.6% 25.0% 1,069Hotel Administration 9.1% 37.9% 31.3% 21.7% 198Human Ecology 7.5% 31.2% 33.9% 27.4% 401Industrial & Labor Relations 13.2% 34.7% 33.0% 19.1% 288
During the current academic year, how often, if ever, have you: Felt overwhelmed by all you had to do
Cornell and Peers**
Cornell, by Class Year**
Cornell, by Sex**
Cornell, by Race/citizenship**
Cornell, by College*
** p<.01, * p<.05 (based on chi-square)
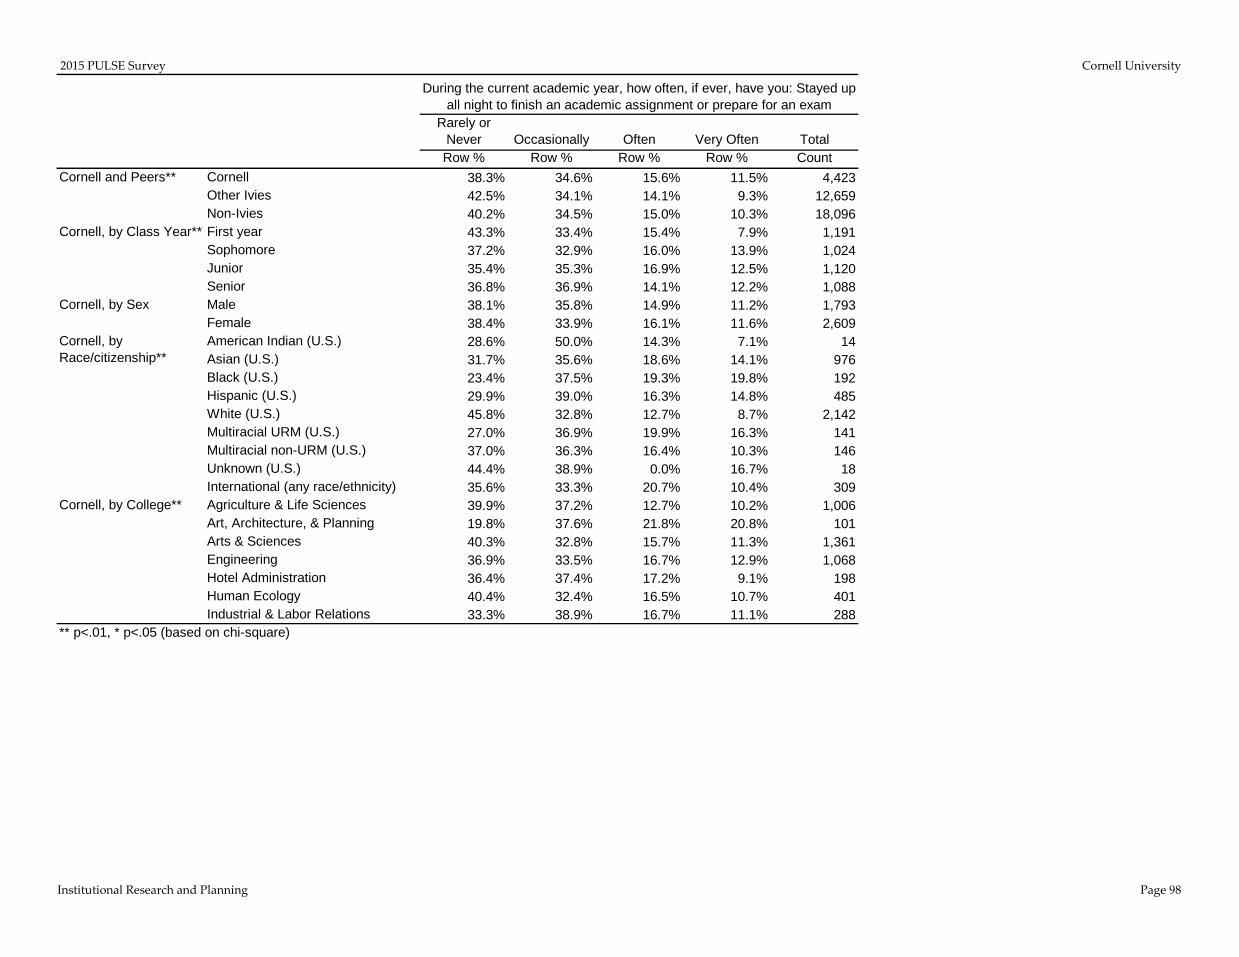
2015 PULSE Survey Cornell University
Institutional Research and Planning Page 98
Rarely or Never Occasionally Often Very Often TotalRow % Row % Row % Row % Count
Cornell 38.3% 34.6% 15.6% 11.5% 4,423Other Ivies 42.5% 34.1% 14.1% 9.3% 12,659Non-Ivies 40.2% 34.5% 15.0% 10.3% 18,096First year 43.3% 33.4% 15.4% 7.9% 1,191Sophomore 37.2% 32.9% 16.0% 13.9% 1,024Junior 35.4% 35.3% 16.9% 12.5% 1,120Senior 36.8% 36.9% 14.1% 12.2% 1,088Male 38.1% 35.8% 14.9% 11.2% 1,793Female 38.4% 33.9% 16.1% 11.6% 2,609American Indian (U.S.) 28.6% 50.0% 14.3% 7.1% 14Asian (U.S.) 31.7% 35.6% 18.6% 14.1% 976Black (U.S.) 23.4% 37.5% 19.3% 19.8% 192Hispanic (U.S.) 29.9% 39.0% 16.3% 14.8% 485White (U.S.) 45.8% 32.8% 12.7% 8.7% 2,142Multiracial URM (U.S.) 27.0% 36.9% 19.9% 16.3% 141Multiracial non-URM (U.S.) 37.0% 36.3% 16.4% 10.3% 146Unknown (U.S.) 44.4% 38.9% 0.0% 16.7% 18International (any race/ethnicity) 35.6% 33.3% 20.7% 10.4% 309Agriculture & Life Sciences 39.9% 37.2% 12.7% 10.2% 1,006Art, Architecture, & Planning 19.8% 37.6% 21.8% 20.8% 101Arts & Sciences 40.3% 32.8% 15.7% 11.3% 1,361Engineering 36.9% 33.5% 16.7% 12.9% 1,068Hotel Administration 36.4% 37.4% 17.2% 9.1% 198Human Ecology 40.4% 32.4% 16.5% 10.7% 401Industrial & Labor Relations 33.3% 38.9% 16.7% 11.1% 288
Cornell, by College**
** p<.01, * p<.05 (based on chi-square)
During the current academic year, how often, if ever, have you: Stayed up all night to finish an academic assignment or prepare for an exam
Cornell and Peers**
Cornell, by Class Year**
Cornell, by Sex
Cornell, by Race/citizenship**

2015 PULSE Survey Cornell University
Institutional Research and Planning Page 99
Rarely or Never Occasionally Often Very Often TotalRow % Row % Row % Row % Count
Cornell 33.6% 43.4% 14.7% 8.3% 4,415Other Ivies 31.4% 43.0% 16.2% 9.4% 12,644Non-Ivies 30.2% 43.1% 16.7% 10.0% 18,073First year 32.0% 45.1% 13.4% 9.5% 1,188Sophomore 32.1% 42.9% 16.4% 8.6% 1,022Junior 32.5% 42.9% 16.1% 8.5% 1,117Senior 37.9% 42.6% 13.1% 6.3% 1,088Male 40.3% 40.1% 12.6% 7.0% 1,790Female 29.1% 45.9% 16.0% 8.9% 2,604American Indian (U.S.) 28.6% 28.6% 21.4% 21.4% 14Asian (U.S.) 34.8% 43.1% 13.8% 8.3% 974Black (U.S.) 34.2% 35.3% 16.8% 13.7% 190Hispanic (U.S.) 30.0% 41.5% 18.8% 9.7% 484White (U.S.) 34.6% 44.2% 13.6% 7.6% 2,139Multiracial URM (U.S.) 28.9% 45.1% 16.9% 9.2% 142Multiracial non-URM (U.S.) 29.0% 46.2% 17.9% 6.9% 145Unknown (U.S.) 33.3% 38.9% 5.6% 22.2% 18International (any race/ethnicity) 32.7% 45.6% 15.9% 5.8% 309Agriculture & Life Sciences 36.1% 41.4% 14.4% 8.2% 1,003Art, Architecture, & Planning 25.7% 46.5% 16.8% 10.9% 101Arts & Sciences 31.1% 43.5% 15.7% 9.6% 1,359Engineering 35.6% 43.6% 13.3% 7.5% 1,067Hotel Administration 30.8% 49.0% 13.1% 7.1% 198Human Ecology 30.8% 47.0% 14.5% 7.8% 400Industrial & Labor Relations 37.6% 39.7% 17.1% 5.6% 287
Cornell and Peers**
Cornell, by Class Year**
Cornell, by Sex**
Cornell, by Race/citizenship*
Cornell, by College
** p<.01, * p<.05 (based on chi-square)
During the current academic year, how often, if ever, have you: Felt very sad
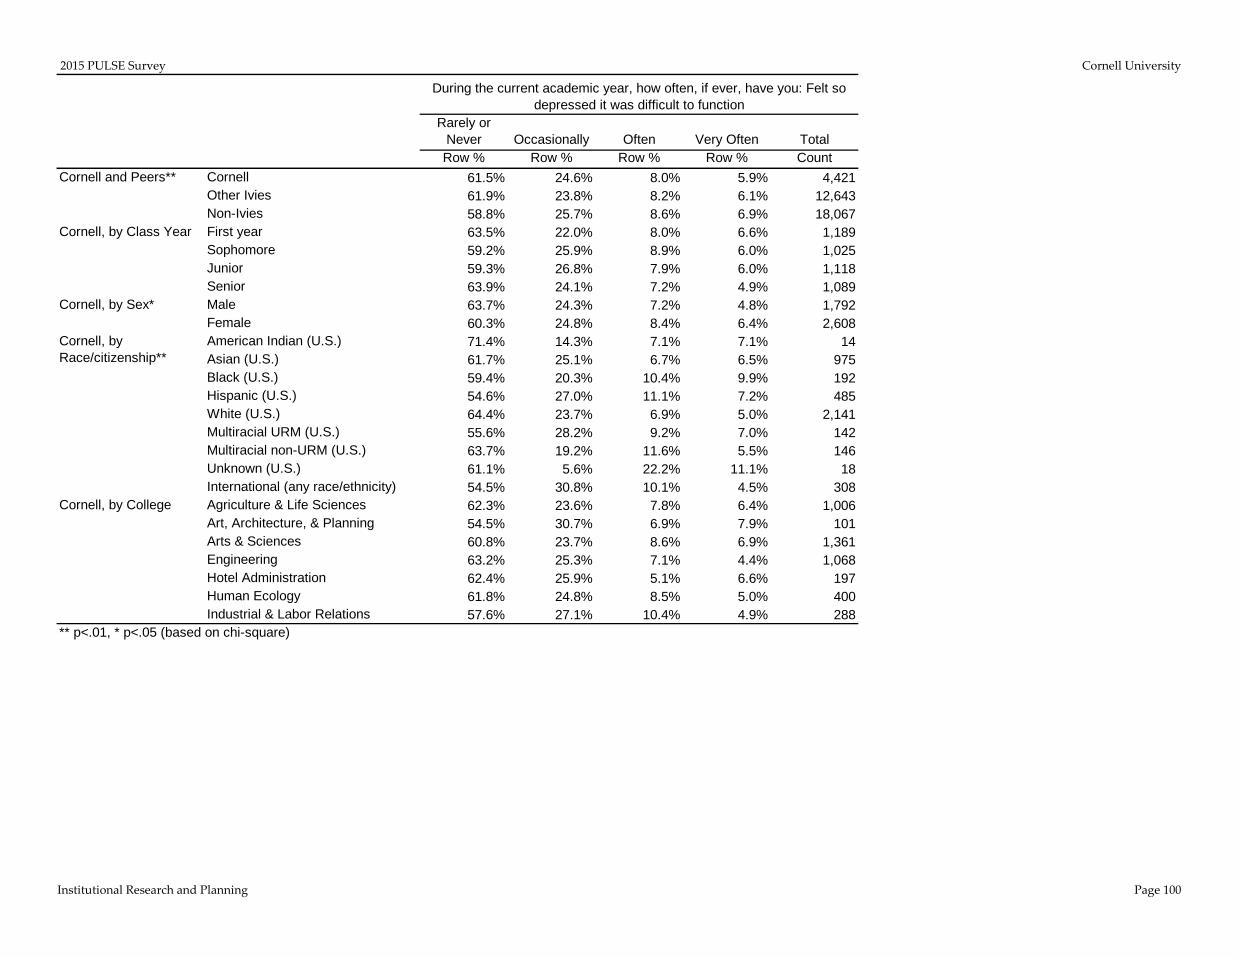
2015 PULSE Survey Cornell University
Institutional Research and Planning Page 100
Rarely or Never Occasionally Often Very Often TotalRow % Row % Row % Row % Count
Cornell 61.5% 24.6% 8.0% 5.9% 4,421Other Ivies 61.9% 23.8% 8.2% 6.1% 12,643Non-Ivies 58.8% 25.7% 8.6% 6.9% 18,067First year 63.5% 22.0% 8.0% 6.6% 1,189Sophomore 59.2% 25.9% 8.9% 6.0% 1,025Junior 59.3% 26.8% 7.9% 6.0% 1,118Senior 63.9% 24.1% 7.2% 4.9% 1,089Male 63.7% 24.3% 7.2% 4.8% 1,792Female 60.3% 24.8% 8.4% 6.4% 2,608American Indian (U.S.) 71.4% 14.3% 7.1% 7.1% 14Asian (U.S.) 61.7% 25.1% 6.7% 6.5% 975Black (U.S.) 59.4% 20.3% 10.4% 9.9% 192Hispanic (U.S.) 54.6% 27.0% 11.1% 7.2% 485White (U.S.) 64.4% 23.7% 6.9% 5.0% 2,141Multiracial URM (U.S.) 55.6% 28.2% 9.2% 7.0% 142Multiracial non-URM (U.S.) 63.7% 19.2% 11.6% 5.5% 146Unknown (U.S.) 61.1% 5.6% 22.2% 11.1% 18International (any race/ethnicity) 54.5% 30.8% 10.1% 4.5% 308Agriculture & Life Sciences 62.3% 23.6% 7.8% 6.4% 1,006Art, Architecture, & Planning 54.5% 30.7% 6.9% 7.9% 101Arts & Sciences 60.8% 23.7% 8.6% 6.9% 1,361Engineering 63.2% 25.3% 7.1% 4.4% 1,068Hotel Administration 62.4% 25.9% 5.1% 6.6% 197Human Ecology 61.8% 24.8% 8.5% 5.0% 400Industrial & Labor Relations 57.6% 27.1% 10.4% 4.9% 288
During the current academic year, how often, if ever, have you: Felt so depressed it was difficult to function
Cornell and Peers**
Cornell, by Class Year
Cornell, by Sex*
Cornell, by Race/citizenship**
Cornell, by College
** p<.01, * p<.05 (based on chi-square)

2015 PULSE Survey Cornell University
Institutional Research and Planning Page 101
Rarely or Never Occasionally Often Very Often TotalRow % Row % Row % Row % Count
Cornell 77.8% 13.8% 5.1% 3.3% 4,419Other IviesNon-IviesFirst year 78.3% 14.1% 5.0% 2.6% 1,190Sophomore 78.9% 12.2% 4.8% 4.1% 1,025Junior 77.2% 13.8% 5.1% 3.9% 1,116Senior 76.7% 14.9% 5.6% 2.8% 1,088Male 77.3% 13.8% 5.5% 3.4% 1,788Female 78.2% 13.6% 4.9% 3.3% 2,610American Indian (U.S.) 64.3% 28.6% 7.1% 0.0% 14Asian (U.S.) 77.8% 13.5% 5.4% 3.2% 975Black (U.S.) 70.7% 15.2% 6.8% 7.3% 191Hispanic (U.S.) 72.3% 16.5% 5.4% 5.8% 484White (U.S.) 80.4% 12.6% 4.1% 2.9% 2,140Multiracial URM (U.S.) 73.0% 18.4% 6.4% 2.1% 141Multiracial non-URM (U.S.) 78.8% 14.4% 5.5% 1.4% 146Unknown (U.S.) 77.8% 5.6% 16.7% 0.0% 18International (any race/ethnicity) 74.2% 14.8% 8.1% 2.9% 310Agriculture & Life Sciences 76.7% 14.3% 5.3% 3.7% 1,005Art, Architecture, & Planning 69.3% 17.8% 10.9% 2.0% 101Arts & Sciences 77.9% 14.0% 4.2% 4.0% 1,359Engineering 81.5% 11.2% 5.1% 2.2% 1,067Hotel Administration 75.8% 15.7% 5.6% 3.0% 198Human Ecology 77.3% 14.0% 5.2% 3.5% 401Industrial & Labor Relations 71.9% 17.4% 6.6% 4.2% 288
Cornell, by Class Year
Cornell, by Sex
Cornell, by Race/citizenship**
Cornell, by College*
** p<.01, * p<.05 (based on chi-square)
During the current academic year, how often, if ever, have you: Skipped meals or not had enough to eat because of financial constraints
Cornell and Peers
No peer data available.

2015 PULSE Survey Cornell University
Institutional Research and Planning Page 102
0 1 2 3 4 5 6 7 TotalRow % Row % Row % Row % Row % Row % Row % Row % Count
Cornell 9.6% 11.8% 18.0% 18.5% 16.0% 14.5% 7.2% 4.5% 4,425Other Ivies 7.5% 9.8% 15.5% 18.8% 17.4% 16.1% 9.0% 5.9% 12,674Non-Ivies 7.6% 10.5% 16.9% 18.3% 17.0% 15.7% 7.9% 6.2% 18,102First year 10.7% 12.0% 17.6% 18.5% 16.7% 13.8% 6.4% 4.3% 1,191Sophomore 10.3% 13.7% 20.9% 18.8% 14.0% 12.9% 5.4% 4.0% 1,028Junior 8.5% 11.2% 18.9% 19.4% 15.0% 14.3% 7.6% 5.1% 1,117Senior 8.7% 10.3% 14.7% 17.4% 18.2% 17.0% 9.4% 4.4% 1,089Male 9.1% 9.6% 15.6% 18.7% 16.3% 16.7% 8.2% 5.7% 1,793Female 9.8% 13.3% 19.6% 18.3% 15.7% 13.1% 6.5% 3.6% 2,612American Indian (U.S.) 0.0% 7.1% 28.6% 21.4% 14.3% 21.4% 7.1% 0.0% 14Asian (U.S.) 10.5% 10.5% 19.5% 21.1% 16.0% 12.4% 5.5% 4.4% 974Black (U.S.) 11.5% 11.5% 20.8% 19.3% 9.9% 15.1% 5.2% 6.8% 192Hispanic (U.S.) 9.1% 11.5% 18.3% 21.6% 15.8% 14.8% 5.6% 3.3% 486White (U.S.) 9.1% 12.6% 16.9% 16.4% 16.3% 15.3% 9.2% 4.2% 2,141Multiracial URM (U.S.) 12.6% 13.3% 16.8% 19.6% 14.7% 15.4% 4.2% 3.5% 143Multiracial non-URM (U.S.) 10.3% 11.0% 20.5% 16.4% 19.2% 13.7% 4.8% 4.1% 146Unknown (U.S.) 0.0% 10.5% 5.3% 21.1% 21.1% 21.1% 10.5% 10.5% 19International (any race/ethnicity) 9.0% 10.6% 18.1% 19.7% 17.1% 13.9% 4.5% 7.1% 310Agriculture & Life Sciences 9.5% 10.8% 18.0% 18.3% 15.9% 14.8% 7.5% 5.2% 1,006Art, Architecture, & Planning 6.1% 8.1% 14.1% 27.3% 18.2% 17.2% 5.1% 4.0% 99Arts & Sciences 10.8% 11.3% 18.7% 18.2% 15.4% 14.0% 7.4% 4.2% 1,367Engineering 9.5% 14.0% 18.0% 17.6% 14.7% 13.9% 7.5% 4.9% 1,068Hotel Administration 6.1% 12.6% 18.2% 17.7% 17.7% 18.2% 6.1% 3.5% 198Human Ecology 9.2% 12.2% 15.0% 21.2% 18.7% 16.0% 4.7% 3.0% 401Industrial & Labor Relations 8.4% 9.1% 20.3% 17.8% 18.2% 12.6% 9.1% 4.5% 286
Cornell, by Race/citizenship*
Cornell, by College
** p<.01, * p<.05 (based on chi-square)
On how many of the past seven days did you get enough sleep so that you felt rested when you woke up?
Cornell and Peers**
Cornell, by Class Year**
Cornell, by Sex**
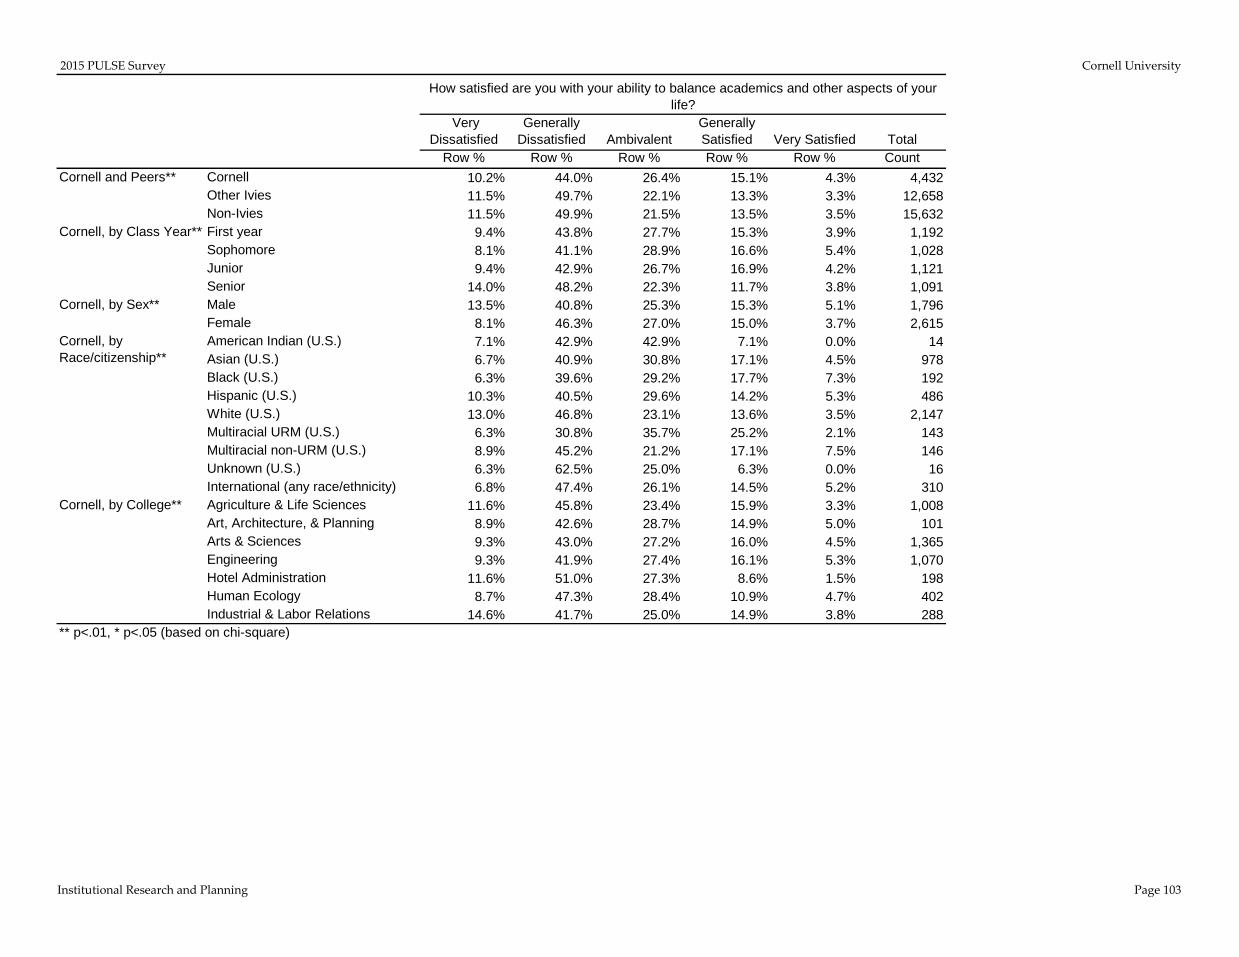
2015 PULSE Survey Cornell University
Institutional Research and Planning Page 103
Very Dissatisfied
Generally Dissatisfied Ambivalent
Generally Satisfied Very Satisfied Total
Row % Row % Row % Row % Row % CountCornell 10.2% 44.0% 26.4% 15.1% 4.3% 4,432Other Ivies 11.5% 49.7% 22.1% 13.3% 3.3% 12,658Non-Ivies 11.5% 49.9% 21.5% 13.5% 3.5% 15,632First year 9.4% 43.8% 27.7% 15.3% 3.9% 1,192Sophomore 8.1% 41.1% 28.9% 16.6% 5.4% 1,028Junior 9.4% 42.9% 26.7% 16.9% 4.2% 1,121Senior 14.0% 48.2% 22.3% 11.7% 3.8% 1,091Male 13.5% 40.8% 25.3% 15.3% 5.1% 1,796Female 8.1% 46.3% 27.0% 15.0% 3.7% 2,615American Indian (U.S.) 7.1% 42.9% 42.9% 7.1% 0.0% 14Asian (U.S.) 6.7% 40.9% 30.8% 17.1% 4.5% 978Black (U.S.) 6.3% 39.6% 29.2% 17.7% 7.3% 192Hispanic (U.S.) 10.3% 40.5% 29.6% 14.2% 5.3% 486White (U.S.) 13.0% 46.8% 23.1% 13.6% 3.5% 2,147Multiracial URM (U.S.) 6.3% 30.8% 35.7% 25.2% 2.1% 143Multiracial non-URM (U.S.) 8.9% 45.2% 21.2% 17.1% 7.5% 146Unknown (U.S.) 6.3% 62.5% 25.0% 6.3% 0.0% 16International (any race/ethnicity) 6.8% 47.4% 26.1% 14.5% 5.2% 310Agriculture & Life Sciences 11.6% 45.8% 23.4% 15.9% 3.3% 1,008Art, Architecture, & Planning 8.9% 42.6% 28.7% 14.9% 5.0% 101Arts & Sciences 9.3% 43.0% 27.2% 16.0% 4.5% 1,365Engineering 9.3% 41.9% 27.4% 16.1% 5.3% 1,070Hotel Administration 11.6% 51.0% 27.3% 8.6% 1.5% 198Human Ecology 8.7% 47.3% 28.4% 10.9% 4.7% 402Industrial & Labor Relations 14.6% 41.7% 25.0% 14.9% 3.8% 288
Cornell, by Race/citizenship**
Cornell, by College**
** p<.01, * p<.05 (based on chi-square)
How satisfied are you with your ability to balance academics and other aspects of your life?
Cornell and Peers**
Cornell, by Class Year**
Cornell, by Sex**
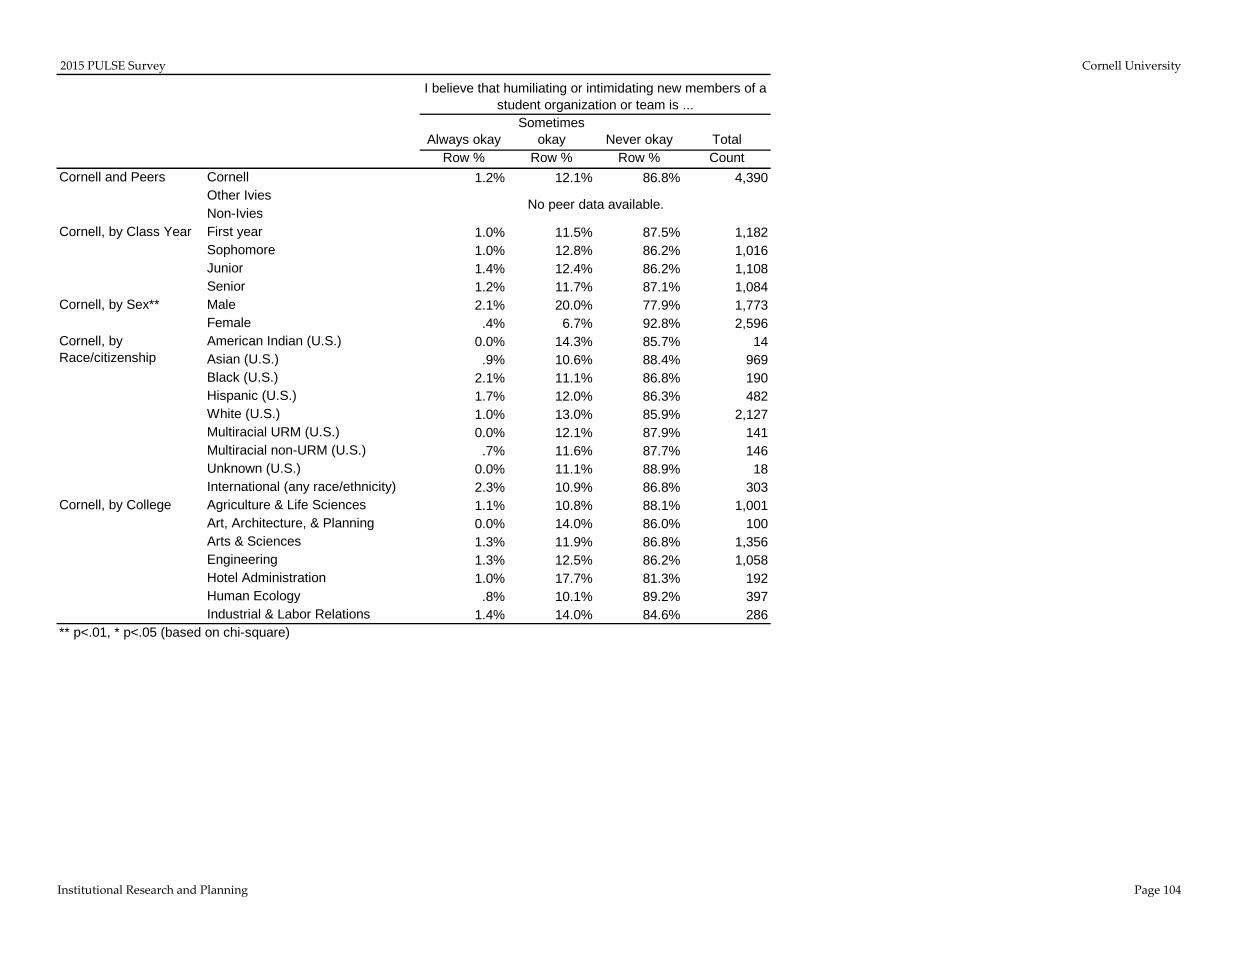
2015 PULSE Survey Cornell University
Institutional Research and Planning Page 104
Always okaySometimes
okay Never okay TotalRow % Row % Row % Count
Cornell 1.2% 12.1% 86.8% 4,390Other IviesNon-IviesFirst year 1.0% 11.5% 87.5% 1,182Sophomore 1.0% 12.8% 86.2% 1,016Junior 1.4% 12.4% 86.2% 1,108Senior 1.2% 11.7% 87.1% 1,084Male 2.1% 20.0% 77.9% 1,773Female .4% 6.7% 92.8% 2,596American Indian (U.S.) 0.0% 14.3% 85.7% 14Asian (U.S.) .9% 10.6% 88.4% 969Black (U.S.) 2.1% 11.1% 86.8% 190Hispanic (U.S.) 1.7% 12.0% 86.3% 482White (U.S.) 1.0% 13.0% 85.9% 2,127Multiracial URM (U.S.) 0.0% 12.1% 87.9% 141Multiracial non-URM (U.S.) .7% 11.6% 87.7% 146Unknown (U.S.) 0.0% 11.1% 88.9% 18International (any race/ethnicity) 2.3% 10.9% 86.8% 303Agriculture & Life Sciences 1.1% 10.8% 88.1% 1,001Art, Architecture, & Planning 0.0% 14.0% 86.0% 100Arts & Sciences 1.3% 11.9% 86.8% 1,356Engineering 1.3% 12.5% 86.2% 1,058Hotel Administration 1.0% 17.7% 81.3% 192Human Ecology .8% 10.1% 89.2% 397Industrial & Labor Relations 1.4% 14.0% 84.6% 286
No peer data available.
Cornell, by Race/citizenship
Cornell, by College
** p<.01, * p<.05 (based on chi-square)
I believe that humiliating or intimidating new members of a student organization or team is ...
Cornell and Peers
Cornell, by Class Year
Cornell, by Sex**
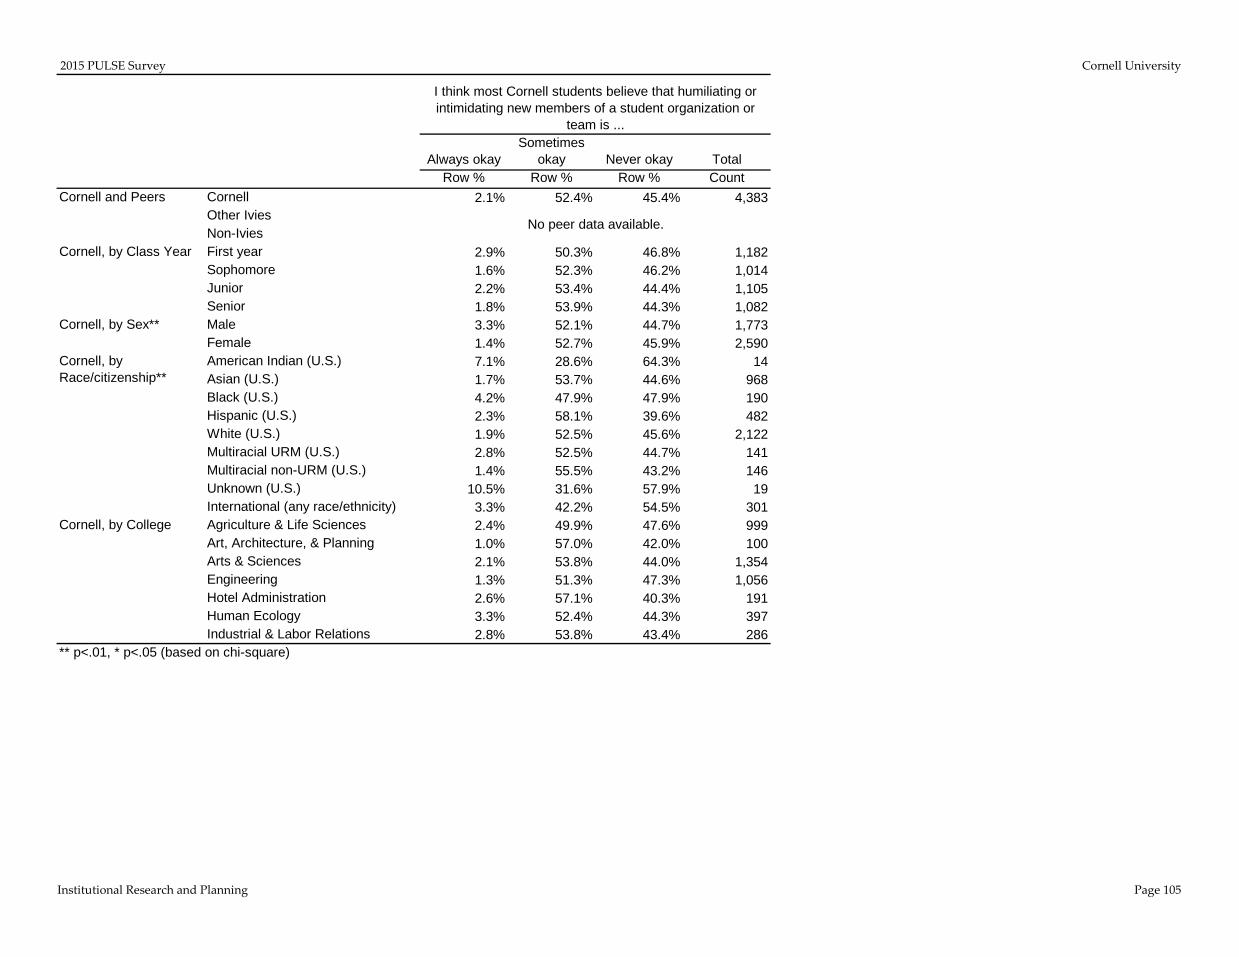
2015 PULSE Survey Cornell University
Institutional Research and Planning Page 105
Always okaySometimes
okay Never okay TotalRow % Row % Row % Count
Cornell 2.1% 52.4% 45.4% 4,383Other IviesNon-IviesFirst year 2.9% 50.3% 46.8% 1,182Sophomore 1.6% 52.3% 46.2% 1,014Junior 2.2% 53.4% 44.4% 1,105Senior 1.8% 53.9% 44.3% 1,082Male 3.3% 52.1% 44.7% 1,773Female 1.4% 52.7% 45.9% 2,590American Indian (U.S.) 7.1% 28.6% 64.3% 14Asian (U.S.) 1.7% 53.7% 44.6% 968Black (U.S.) 4.2% 47.9% 47.9% 190Hispanic (U.S.) 2.3% 58.1% 39.6% 482White (U.S.) 1.9% 52.5% 45.6% 2,122Multiracial URM (U.S.) 2.8% 52.5% 44.7% 141Multiracial non-URM (U.S.) 1.4% 55.5% 43.2% 146Unknown (U.S.) 10.5% 31.6% 57.9% 19International (any race/ethnicity) 3.3% 42.2% 54.5% 301Agriculture & Life Sciences 2.4% 49.9% 47.6% 999Art, Architecture, & Planning 1.0% 57.0% 42.0% 100Arts & Sciences 2.1% 53.8% 44.0% 1,354Engineering 1.3% 51.3% 47.3% 1,056Hotel Administration 2.6% 57.1% 40.3% 191Human Ecology 3.3% 52.4% 44.3% 397Industrial & Labor Relations 2.8% 53.8% 43.4% 286
No peer data available.
Cornell, by Sex**
Cornell, by Race/citizenship**
Cornell, by College
** p<.01, * p<.05 (based on chi-square)
I think most Cornell students believe that humiliating or intimidating new members of a student organization or
team is ...
Cornell and Peers
Cornell, by Class Year
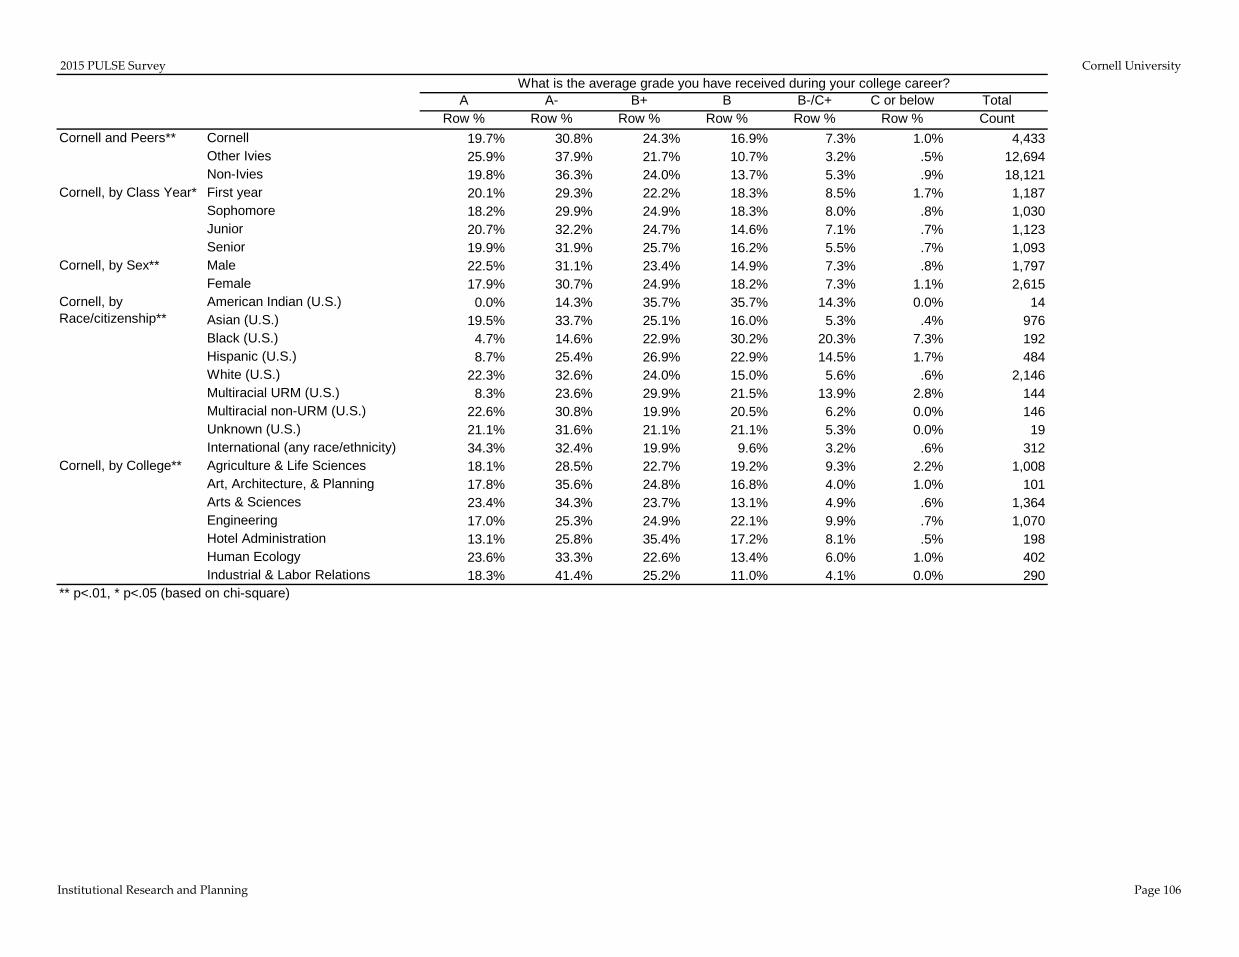
2015 PULSE Survey Cornell University
Institutional Research and Planning Page 106
A A- B+ B B-/C+ C or below TotalRow % Row % Row % Row % Row % Row % Count
Cornell 19.7% 30.8% 24.3% 16.9% 7.3% 1.0% 4,433Other Ivies 25.9% 37.9% 21.7% 10.7% 3.2% .5% 12,694Non-Ivies 19.8% 36.3% 24.0% 13.7% 5.3% .9% 18,121First year 20.1% 29.3% 22.2% 18.3% 8.5% 1.7% 1,187Sophomore 18.2% 29.9% 24.9% 18.3% 8.0% .8% 1,030Junior 20.7% 32.2% 24.7% 14.6% 7.1% .7% 1,123Senior 19.9% 31.9% 25.7% 16.2% 5.5% .7% 1,093Male 22.5% 31.1% 23.4% 14.9% 7.3% .8% 1,797Female 17.9% 30.7% 24.9% 18.2% 7.3% 1.1% 2,615American Indian (U.S.) 0.0% 14.3% 35.7% 35.7% 14.3% 0.0% 14Asian (U.S.) 19.5% 33.7% 25.1% 16.0% 5.3% .4% 976Black (U.S.) 4.7% 14.6% 22.9% 30.2% 20.3% 7.3% 192Hispanic (U.S.) 8.7% 25.4% 26.9% 22.9% 14.5% 1.7% 484White (U.S.) 22.3% 32.6% 24.0% 15.0% 5.6% .6% 2,146Multiracial URM (U.S.) 8.3% 23.6% 29.9% 21.5% 13.9% 2.8% 144Multiracial non-URM (U.S.) 22.6% 30.8% 19.9% 20.5% 6.2% 0.0% 146Unknown (U.S.) 21.1% 31.6% 21.1% 21.1% 5.3% 0.0% 19International (any race/ethnicity) 34.3% 32.4% 19.9% 9.6% 3.2% .6% 312Agriculture & Life Sciences 18.1% 28.5% 22.7% 19.2% 9.3% 2.2% 1,008Art, Architecture, & Planning 17.8% 35.6% 24.8% 16.8% 4.0% 1.0% 101Arts & Sciences 23.4% 34.3% 23.7% 13.1% 4.9% .6% 1,364Engineering 17.0% 25.3% 24.9% 22.1% 9.9% .7% 1,070Hotel Administration 13.1% 25.8% 35.4% 17.2% 8.1% .5% 198Human Ecology 23.6% 33.3% 22.6% 13.4% 6.0% 1.0% 402Industrial & Labor Relations 18.3% 41.4% 25.2% 11.0% 4.1% 0.0% 290
Cornell, by Sex**
Cornell, by Race/citizenship**
Cornell, by College**
** p<.01, * p<.05 (based on chi-square)
What is the average grade you have received during your college career?
Cornell and Peers**
Cornell, by Class Year*

2015 PULSE Survey Cornell University
Institutional Research and Planning Page 107
No Yes TotalRow % Row % Count
Cornell 87.4% 12.6% 4,415Other Ivies 86.5% 13.5% 12,639Non-Ivies 91.8% 8.2% 18,068First year 87.6% 12.4% 1,187Sophomore 85.2% 14.8% 1,024Junior 88.9% 11.1% 1,116Senior 87.6% 12.4% 1,088Male 86.5% 13.5% 1,782Female 87.9% 12.1% 2,612American Indian (U.S.) 85.7% 14.3% 14Asian (U.S.) 95.6% 4.4% 973Black (U.S.) 93.3% 6.7% 193Hispanic (U.S.) 93.2% 6.8% 484White (U.S.) 80.5% 19.5% 2,137Multiracial URM (U.S.) 88.7% 11.3% 142Multiracial non-URM (U.S.) 85.4% 14.6% 144Unknown (U.S.) 61.1% 38.9% 18International (any race/ethnicity) 97.7% 2.3% 310Agriculture & Life Sciences 86.5% 13.5% 1,009Art, Architecture, & Planning 94.0% 6.0% 100Arts & Sciences 85.3% 14.7% 1,363Engineering 89.1% 10.9% 1,061Hotel Administration 87.2% 12.8% 196Human Ecology 89.7% 10.3% 398Industrial & Labor Relations 88.2% 11.8% 288
Cornell, by Class Year
Cornell, by Sex
Cornell, by Race/citizenship**
Cornell, by College*
** p<.01, * p<.05 (based on chi-square)
Did either of your parents attend Cornell/your institution?
Cornell and Peers**

2015 PULSE Survey Cornell University
Institutional Research and Planning Page 108
Low income or poor
Working class Middle class
Upper-middle or
professional class Wealthy Total
Row % Row % Row % Row % Row % CountCornell 5.0% 13.3% 38.1% 39.4% 4.2% 4,368Other IviesNon-IviesFirst year 5.3% 13.5% 38.7% 37.8% 4.8% 1,176Sophomore 4.7% 12.9% 36.9% 40.7% 4.7% 1,012Junior 6.2% 12.1% 39.1% 39.1% 3.4% 1,107Senior 3.7% 14.5% 37.6% 40.2% 4.0% 1,073Male 5.1% 12.5% 38.0% 39.7% 4.8% 1,773Female 5.0% 13.7% 38.3% 39.2% 3.8% 2,574American Indian (U.S.) 14.3% 28.6% 42.9% 7.1% 7.1% 14Asian (U.S.) 8.0% 16.1% 41.9% 32.5% 1.5% 961Black (U.S.) 9.3% 31.6% 39.4% 18.7% 1.0% 193Hispanic (U.S.) 12.2% 19.4% 37.5% 28.0% 2.9% 475White (U.S.) 1.9% 9.4% 34.9% 47.7% 6.1% 2,121Multiracial URM (U.S.) 7.1% 21.3% 35.5% 34.0% 2.1% 141Multiracial non-URM (U.S.) .7% 5.6% 37.8% 50.3% 5.6% 143Unknown (U.S.) 21.4% 7.1% 21.4% 35.7% 14.3% 14International (any race/ethnicity) 2.9% 9.8% 50.3% 33.3% 3.6% 306Agriculture & Life Sciences 6.4% 15.3% 39.6% 35.3% 3.4% 998Art, Architecture, & Planning 5.0% 21.0% 34.0% 37.0% 3.0% 100Arts & Sciences 4.2% 13.4% 36.4% 41.6% 4.5% 1,345Engineering 4.6% 10.9% 42.7% 38.9% 2.9% 1,052Hotel Administration 2.1% 9.9% 34.9% 44.3% 8.9% 192Human Ecology 5.1% 15.2% 31.8% 43.2% 4.8% 396Industrial & Labor Relations 7.7% 11.2% 36.5% 37.5% 7.0% 285
No peer data available.
Cornell, by Sex
Cornell, by Race/citizenship**
Cornell, by College**
** p<.01, * p<.05 (based on chi-square)
Which of the following best describes your social class when you were growing up?
Cornell and Peers
Cornell, by Class Year