

2015 Business of Farming Conference: Risk Management Options: Crop Insurance and Accessing Credit
99
Risk Management Options James Robison -- RAFI-USA Charles Zink -- USDA Farm Service Agency Molly Nicholie --ASAP
-
Upload
asapconnections -
Category
Business
-
view
141 -
download
0
Transcript of 2015 Business of Farming Conference: Risk Management Options: Crop Insurance and Accessing Credit
Risk Management Options
James Robison -- RAFI-USA
Charles Zink -- USDA Farm Service Agency
Molly Nicholie --ASAP

Welcome and Introductions (Molly Nicholie- 5 minutes)
2
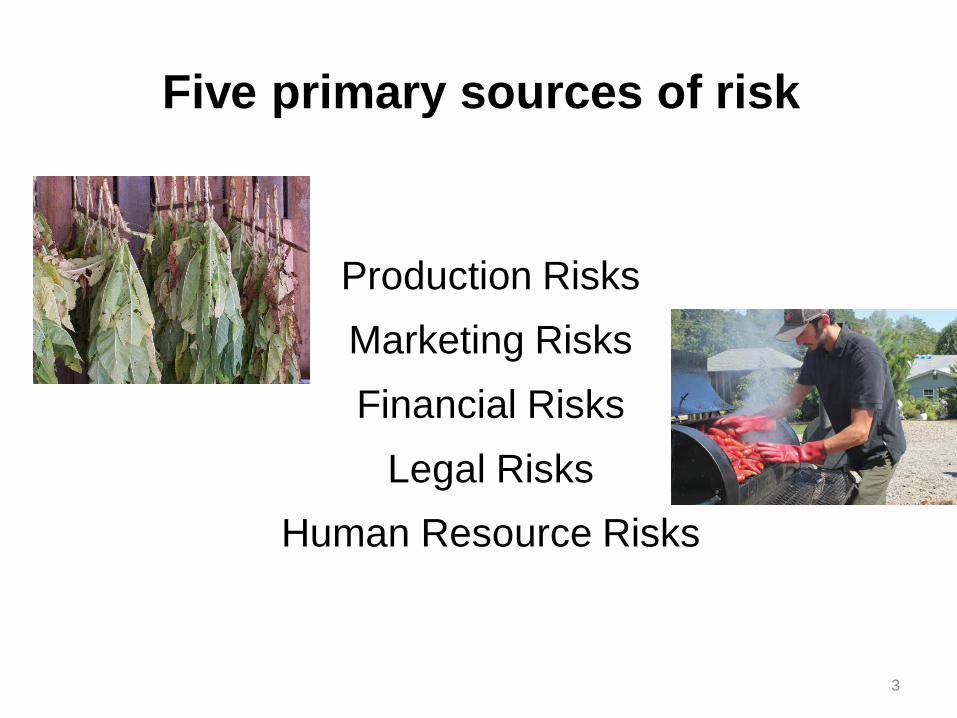
Five primary sources of risk
�
Production Risks Marketing Risks Financial Risks
Legal Risks Human Resource Risks
3

Managing Risk: Planning
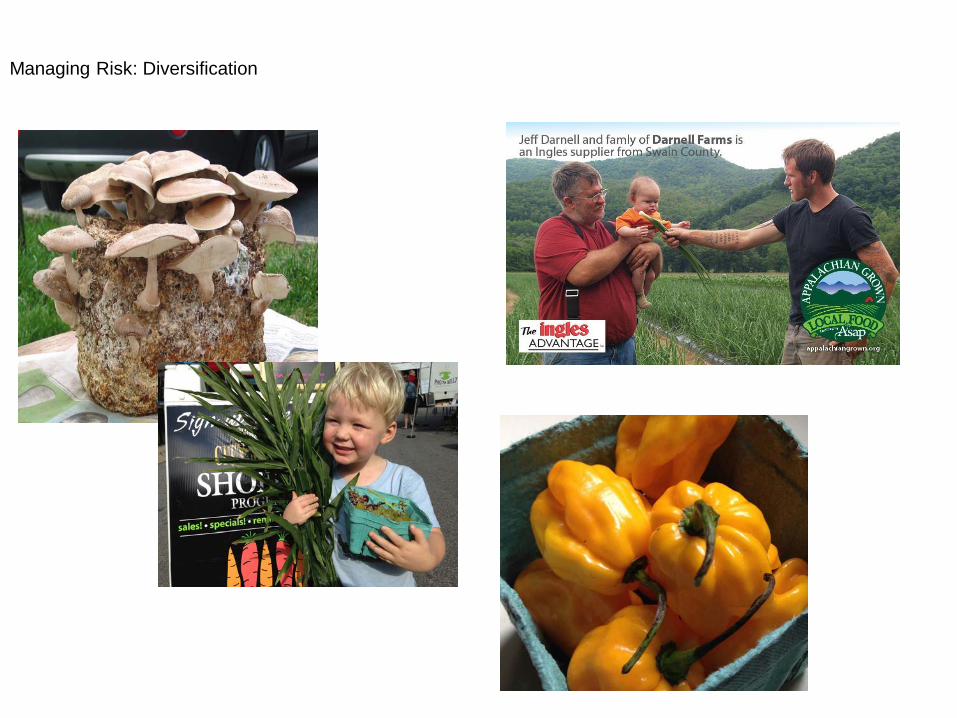
Managing Risk: Diversification

Managing Risk: Market Opportunities
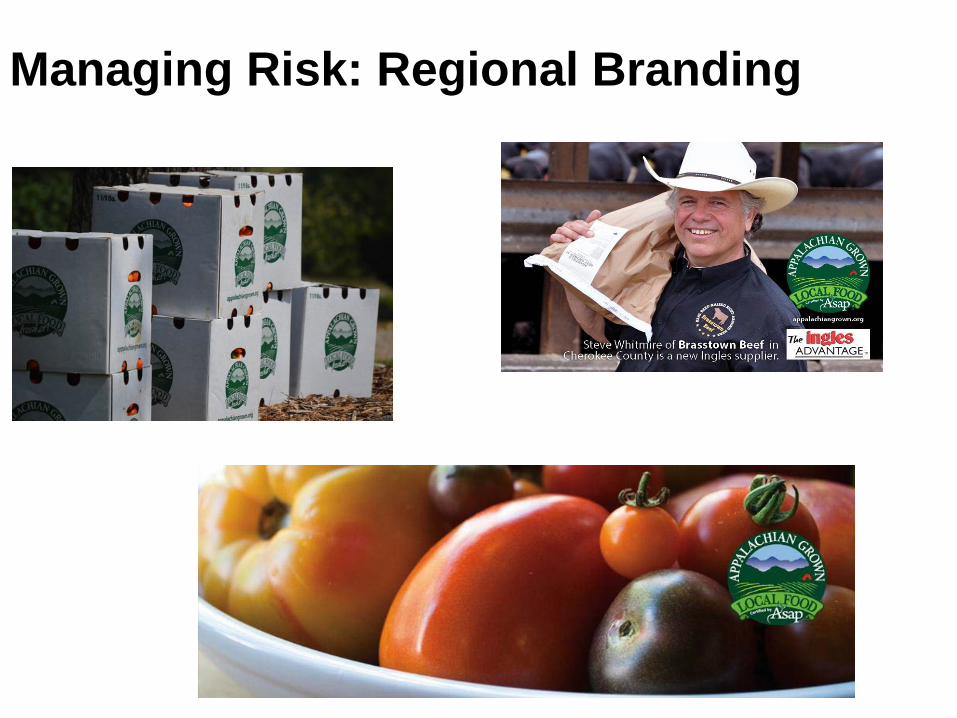
Managing Risk: Regional Branding
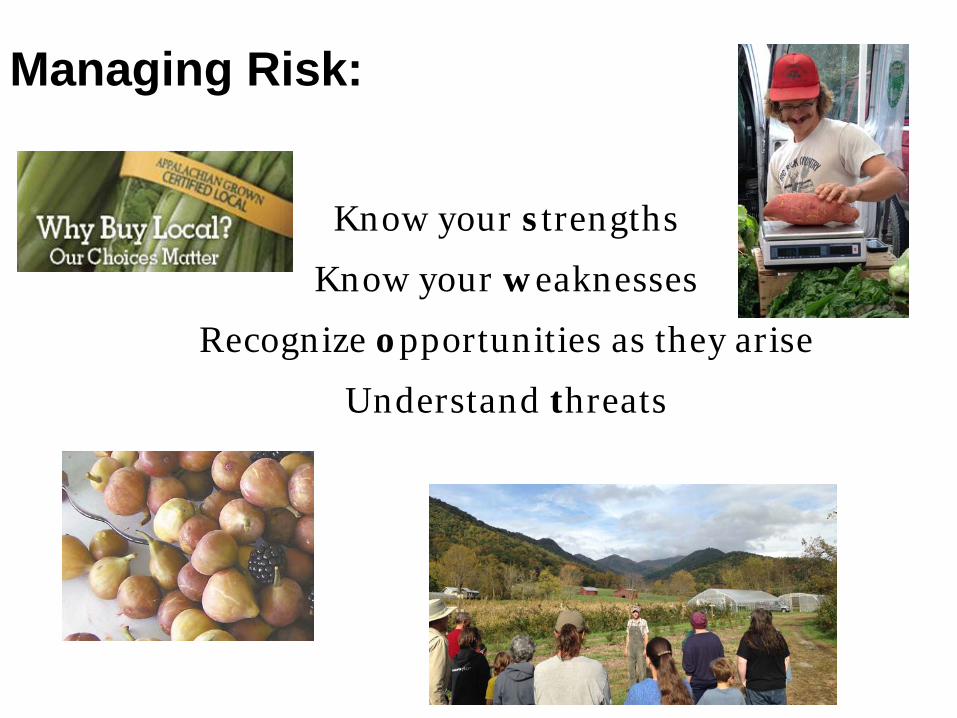
Managing Risk:
Know your strengths
Know your weaknesses
Recognize opportunities as they arise
Understand threats
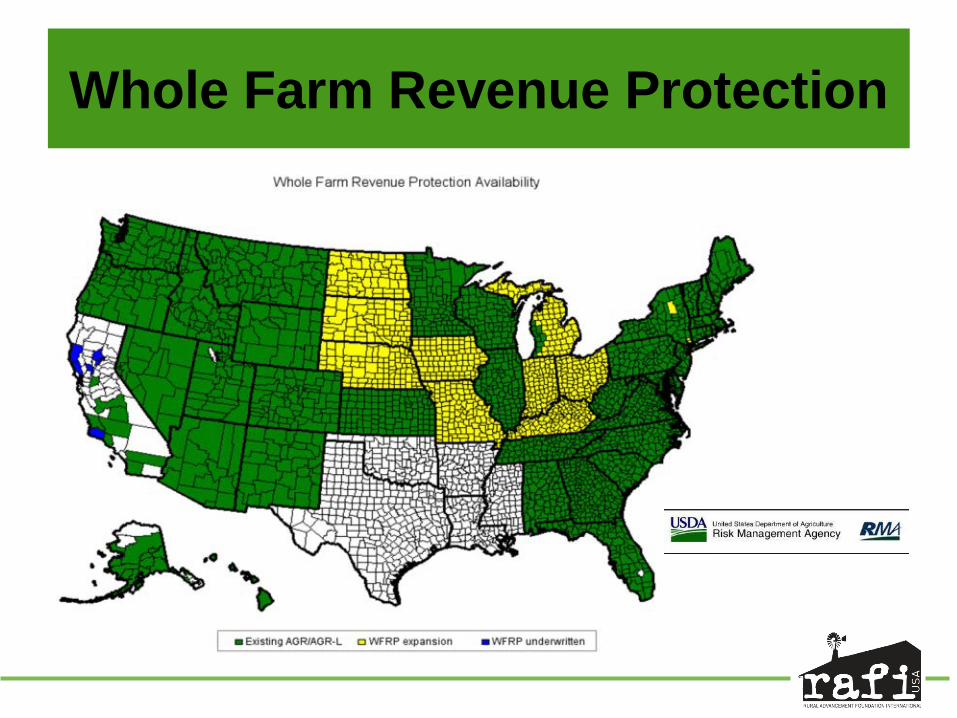
Whole Farm Revenue Protection
James Robinson, Research and Policy Associate
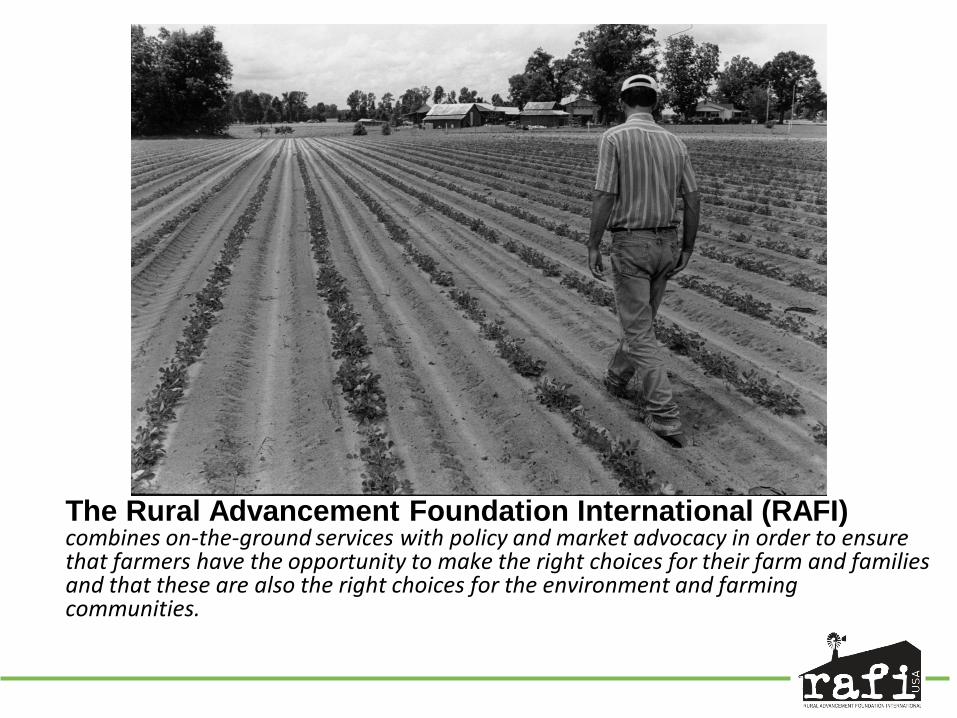
The Rural Advancement Foundation International (RAFI) combines on-the-ground services with policy and market advocacy in order to ensure that farmers have the opportunity to make the right choices for their farm and families and that these are also the right choices for the environment and farming communities.

Sections
1. Crop Insurance Overview: Why does RAFI work on crop insurance?
1. Whole Farm Revenue Protection (WFRP): An Overview 1. The Nuts and Bolts of WFRP: How does it work?
• Crop Insurance 101 • Application Process • Claims Process • Model Farm Premiums
Crop Insurance Overview: Why Does RAFI Work on Crop Insurance?

How many have considered crop
insurance?
How many of you have crop insurance?

What comes to mind when you hear…
“crop insurance”

A farm’s risk management strategy and overall level of risk is directly
linked with what financial concept?
Credit Worthiness

The structure of lending and crop insurance programs drives investment and production decisions long before a disaster takes place.
Farmer Decisions • Specialty crops? • More diverse cropping
systems? • Other production-
based risk management practices?
Creditors • Limited recognition of
production-based risk management, like crop, and income diversification
• So, creditors reduce risk by requiring crop insurance
Crop Insurance • Historically not designed
for specialty crop, diverse, or livestock producers
Farmers Find Limited Credit
Opportunities for Specialty Crop, Diversified and
Livestock Operations

What does this mean for specialty crop, diversified, and livestock?
• If obtaining credit is difficult for specialty crop and diversified producers, then it is:
• Harder to access land, • More likely producers farm under production contracts,
• And harder to expand operations.
1.Whole Farm Revenue Protection (WFRP): An Overview

Why is WFRP Important?
• Multi-peril Insurance
• Pest related losses
• Weather related losses
• Losses in price caused by “natural” events
• Incentivizes Diversification
• Insures multiple crops without requiring a producer to purchase multiple policies
• Premiums reduced for growing up to 7 additional crops • Covers crops and livestock
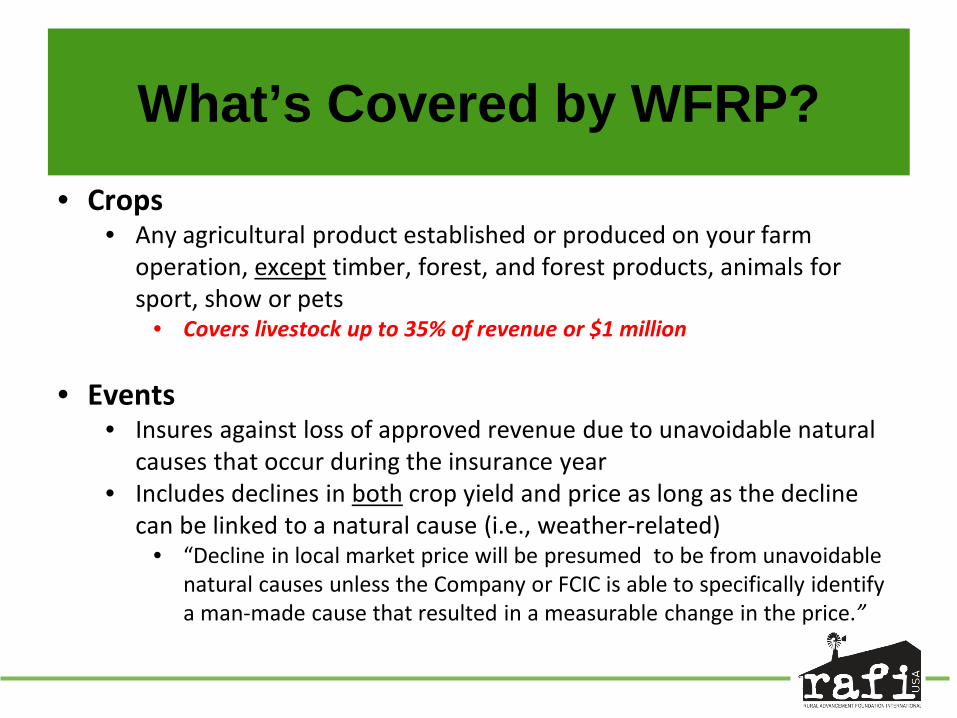
What’s Covered by WFRP? • Crops
• Any agricultural product established or produced on your farm operation, except timber, forest, and forest products, animals for sport, show or pets
• Covers livestock up to 35% of revenue or $1 million
• Events • Insures against loss of approved revenue due to unavoidable natural
causes that occur during the insurance year • Includes declines in both crop yield and price as long as the decline
can be linked to a natural cause (i.e., weather-related) • “Decline in local market price will be presumed to be from unavoidable
natural causes unless the Company or FCIC is able to specifically identify a man-made cause that resulted in a measurable change in the price.”

What’s Not Covered by WFRP? • Yield
• Negligence, mismanagement, wrongdoing • Act of person rather than nature (chemical drift, fire) • Water contained by dam or reservoir • Damage to machinery or equipment • Breakdown in irrigation equipment or practices when not related to
natural cause • Theft and vandalism
• Price • Quarantine, boycott or refusal of anyone to accept commodities • Lack of labor • Deterioration of commodities in storage, unless due to unavoidable
natural cause

Why Did Prior Whole Farm Revenue Crop Insurance Policies Not Work?
• Adjusted Gross Revenue (AGR) & Adjusted Gross Revenue-Lite (AGR-Lite) • Geographically Limited- Policies were not available in some major farming
states • Coverage- limited to 72% of average adjusted gross revenue • Expensive- Producers frequently reported the policy was not cost-
effective • Difficulty Expanding Coverage- producers were required to show a history
of crop expansion in prior years before being able to expand coverage
• Low Liability Limit- $1 million liability limit • Only 3 policies sold in NC each of the last three years
Whole Farm Revenue Protection

WFRP Comparison
WFRP AGR-Lite AGR Type of Coverage Revenue Revenue Revenue 5-year Tax History Yes- Schedule
F Yes- Schedule
F Yes-
Schedule F Diversification Incentive
Yes Yes Yes
Coverage Level 50%-85% 65%-80% 65%-80% Payment Rate 100% 75%-90% 75%-90% Maximum Subsidy 80% 59% 59% Covers Post Production Expenses
Yes, on-farm, post-production expenses that do
not add value
No No
Liability Limit $8.5 Million $1 million $6.5 million

Additional Needed Reforms
• Beginning farmers do not have access to WRFP until 7th year of farming
• 5 years of Schedule F tax records • Plus 1 lag year • No option to build a history using
transitional-yields
• How can we reform the policy during the pilot phase to increase access for beginning farmers?

The Nuts and Bolts: WFRP in Action
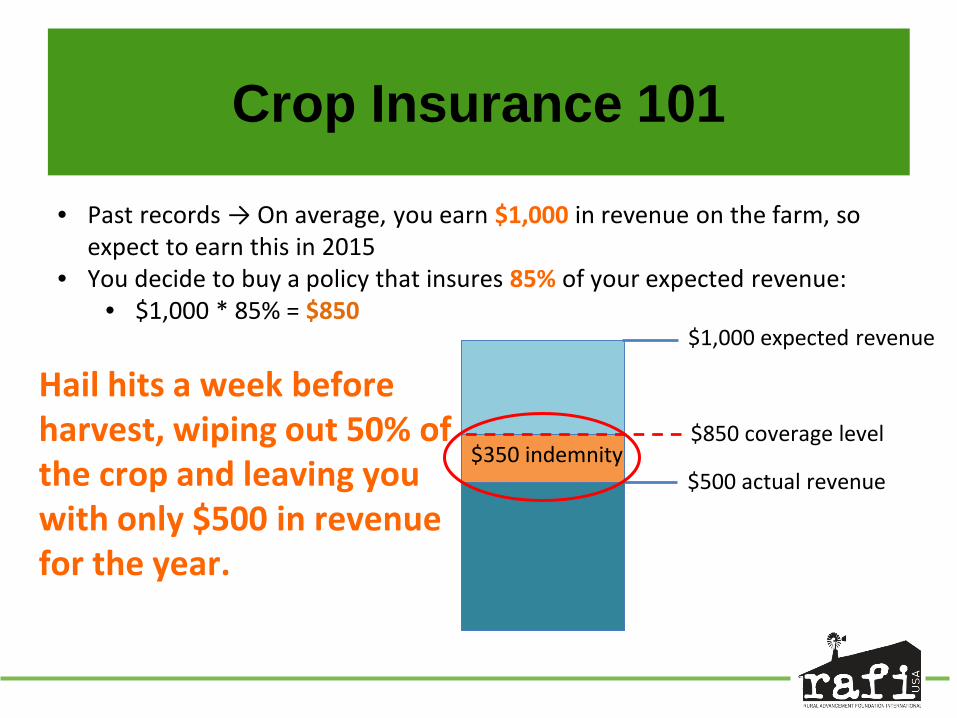
Crop Insurance 101
• Past records → On average, you earn $1,000 in revenue on the farm, so expect to earn this in 2015
• You decide to buy a policy that insures 85% of your expected revenue: • $1,000 * 85% = $850
Hail hits a week before harvest, wiping out 50% of the crop and leaving you with only $500 in revenue for the year.
$1,000 expected revenue
$500 actual revenue
$350 Pa
$850 coverage level $350 indemnity

Crop Insurance 101
• Past records → On average, you earn $1,000 in revenue on the farm, so expect to earn this in 2015
• You decide to buy a policy that insures 85% of your expected revenue: • $1,000 * 85% = $850
Minor flooding in a single field brings your revenue down to $900 in 2015.
$1,000 expected revenue
$900 actual revenue
$350 Pa
$850 coverage level
NO INDEMNITY

Application Process: Tax Records
• Requires 5 consecutive years of Schedule F • Sales of products raised on your farm for sale (or bought for resale),
such as livestock, produce, or grains • OR you may use another person’s tax returns if you
purchased, inherited, or leased 90% of their farm operation • Prices must be from verifiable sources and come with
documentation
Approved revenue
Coverage level
Actual revenue
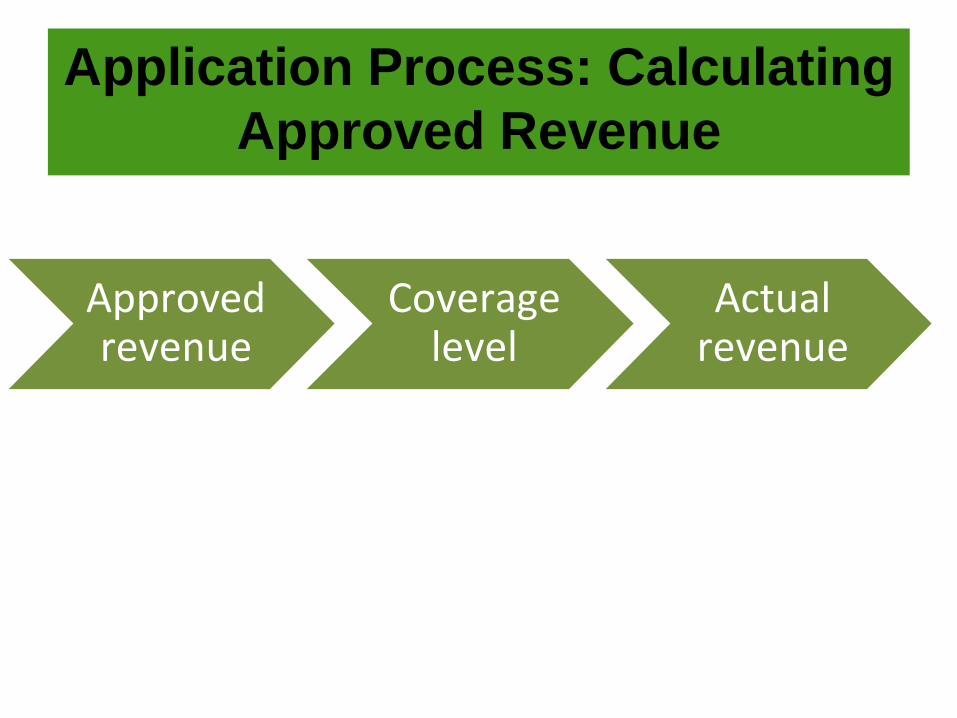
Application Process: Calculating Approved Revenue

• The lower of historic and expected revenue • Historic revenue from 5 years of Schedule F
calculated using Allowable Revenue and Expense Worksheets • May include adjustment for recent or future
growth • Expected yield based on expectations for the
coming year and the Farm Operation Report
Approved revenue
Coverage level
Actual revenue

Year Revenue
2009 $5,608
2010 $6,789
2011 $4,578
2012 $3,567
2013 $7,890
5-Year Average = $5,686 *Can also expand by 10% with approval of insurance provider
Calculating historic revenue
Approved revenue
Coverage level
Actual revenue

Approved revenue
Coverage level
Actual revenue
Calculating expected revenue
• Farm Operation Reports • Submitted at sales closing date for each insurance year • Detailed information for each commodity you intend to produce
or purchase for resale on your farm • what the farm can reasonably produce during the insurance year • expected revenue for each commodity, reflecting expected sale
price in markets where the crop is normally sold • 3 Versions
• Intended and Revised – Submitted before season begins and before coverage level is finalized, used to calculated expected revenue
• Final – Submitted after season is closed, reflects actual production and sales
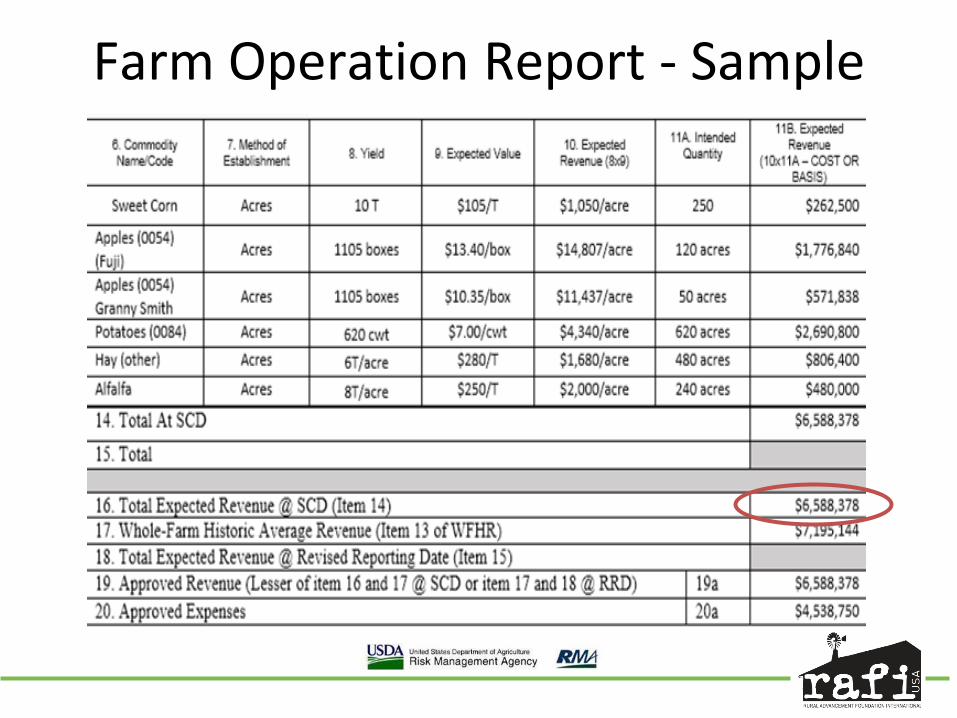
Farm Operation Report - Sample

Commodity Name
Method of Estab. Yield/Acre Expected Value
Expected Value/Ac
Intended
Quantity Expected Revenue
Cucumbers Acres 425 carton $20/40 lb carton $8,500 0.10 $850
Greens Acres 800 carton $16/20 lb carton $12,800 0.10 $1,280
Strawberries
Acres 1,750 cont $17/8 lb container
$29,750 0.10 $2,975
Total Expected Revenue $5,105
Calculating expected revenue
Approved revenue
Coverage level
Actual revenue
• Expected values must be realistic and consistent with available local market information, supported by verifiable records and take into account current local markets, cycles and trends.
Historic revenue = $5,686
Expected revenue = $5,105
What is the approved revenue?

Approved revenue
Coverage level
Actual revenue
• Approved revenue = $5,105
• 50% to 85% in 5% increments available – 85% level is only available if you have 3 or more crop – Higher coverage=higher premium cost
$5,105 * 50% = $2,553 $5,105 * 85% = $4,339

Approved revenue
Coverage level
Actual revenue
Commodity Name
Expected Revenue
10% Loss, Actual
Revenue 40% Loss,
Actual Revenue Cucumbers $850 $746 $900 Greens $1,280 $990 $1,400 Strawberries $2,975 $2,858 $763
Total Revenue $5,105 $4,594 $3,063
Approved revenue
Coverage level
Actual revenue
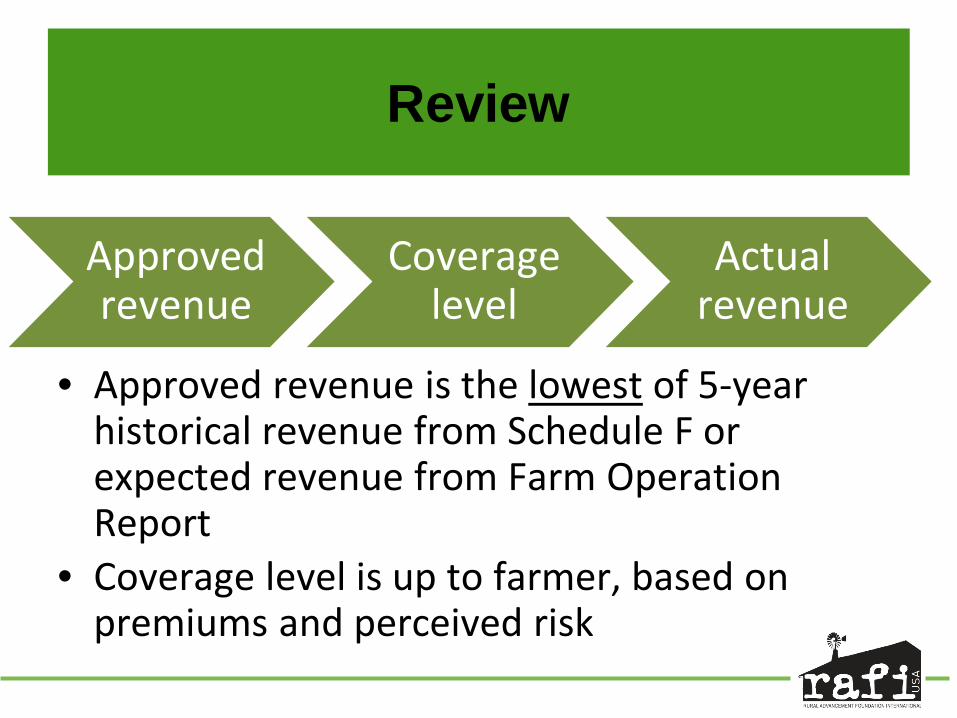
Review
• Approved revenue is the lowest of 5-year historical revenue from Schedule F or expected revenue from Farm Operation Report
• Coverage level is up to farmer, based on premiums and perceived risk

1. Timeline: What to do after experiencing a loss?
1. Documentation: What forms will I need to file a claim?
1. Claims Calculation Process: How is my indemnity calculated? 1. Miscellaneous Claims Information: When am I eligible for a
replant payment? What happens if I amend tax forms after a payment is received? What happens if I’m audited?
Claims Process
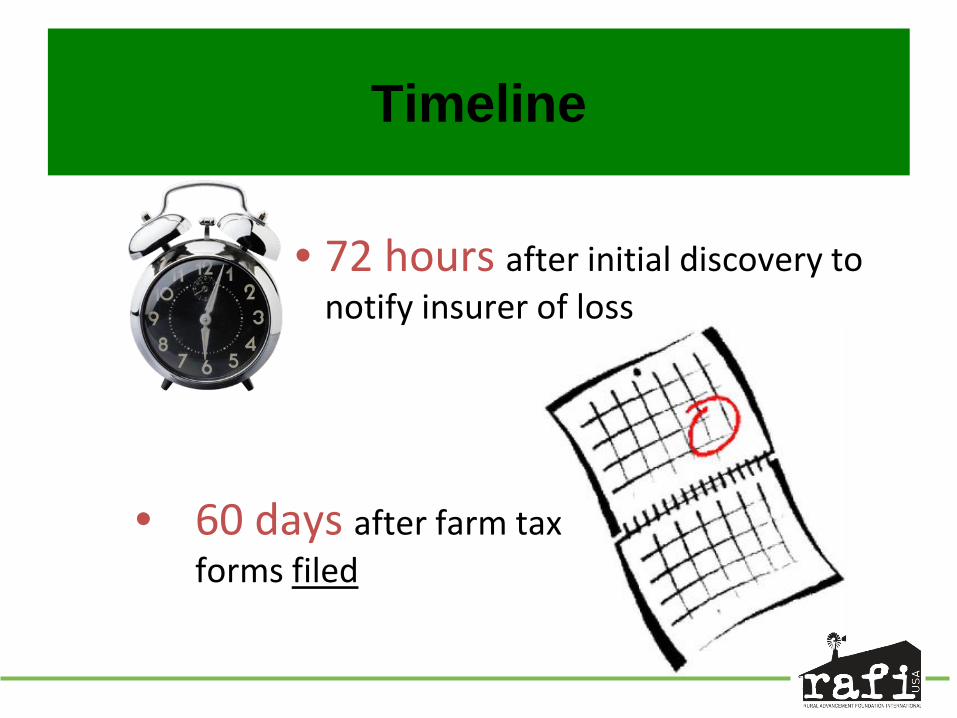
Timeline
• 72 hours after initial discovery to notify insurer of loss
• 60 days after farm tax forms filed

Required Documentation
Claim Year Updated
Application forms
• Allowable Expenses Worksheet • Allowable Revenue Worksheet • Final Farm Operation Report
Additional Forms
• Inventory and Accounts Receivable • Market Animal and Nursery Inventory if applicable • Replant Payment Worksheet if applicable
Claim for Indemnity Form

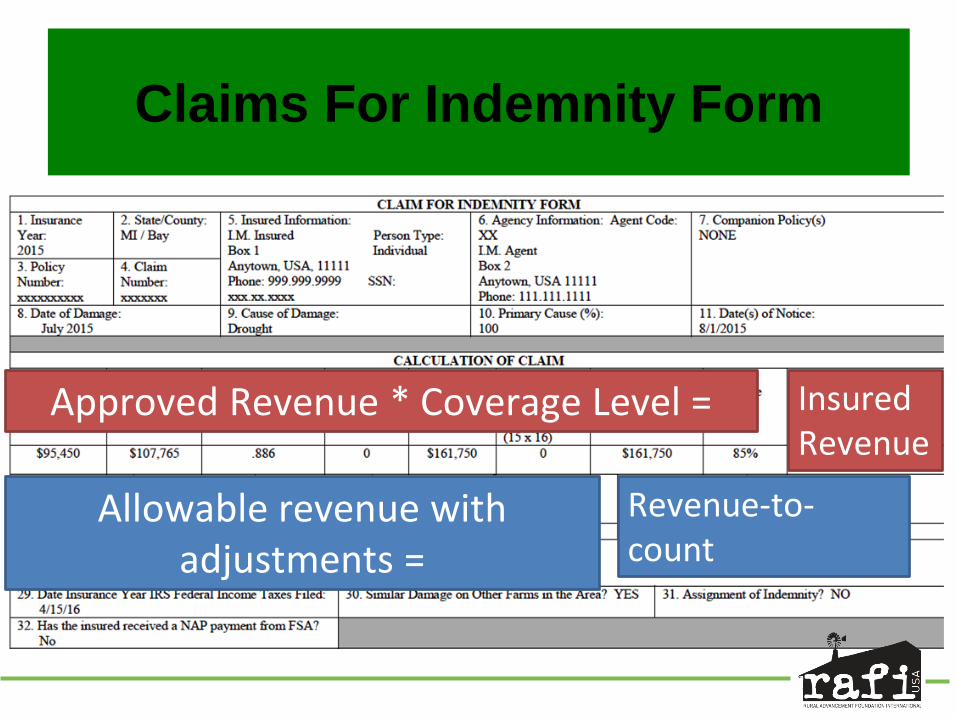
Claims For Indemnity Form

Claims For Indemnity Form
Claims For Indemnity Form
Approved Revenue * Coverage Level =
Allowable revenue with adjustments =
Insured Revenue
Revenue-to-count

Claims For Indemnity Form
Insured Revenue – Revenue-to-Count =

Claims For Indemnity Form
Insured Revenue – Revenue-to-Count =
I bought coverage for $140,000. My farm’s actual revenue was $130,000. What’s my claim?
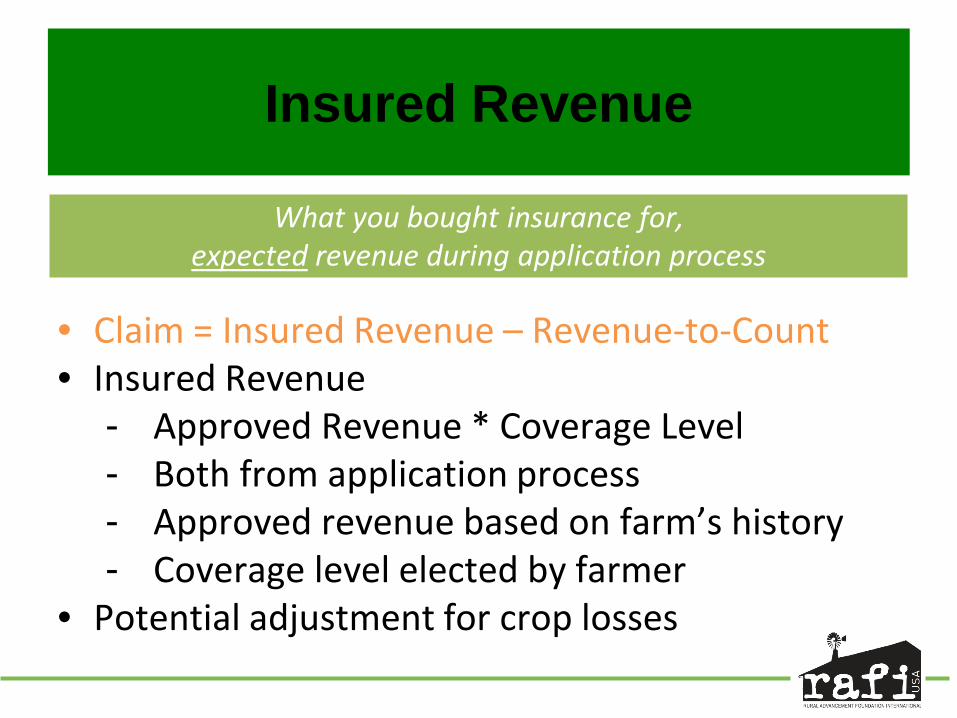
Insured Revenue
What you bought insurance for, expected revenue during application process
• Claim = Insured Revenue – Revenue-to-Count • Insured Revenue
- Approved Revenue * Coverage Level - Both from application process - Approved revenue based on farm’s history - Coverage level elected by farmer
• Potential adjustment for crop losses

Revenue-to-Count
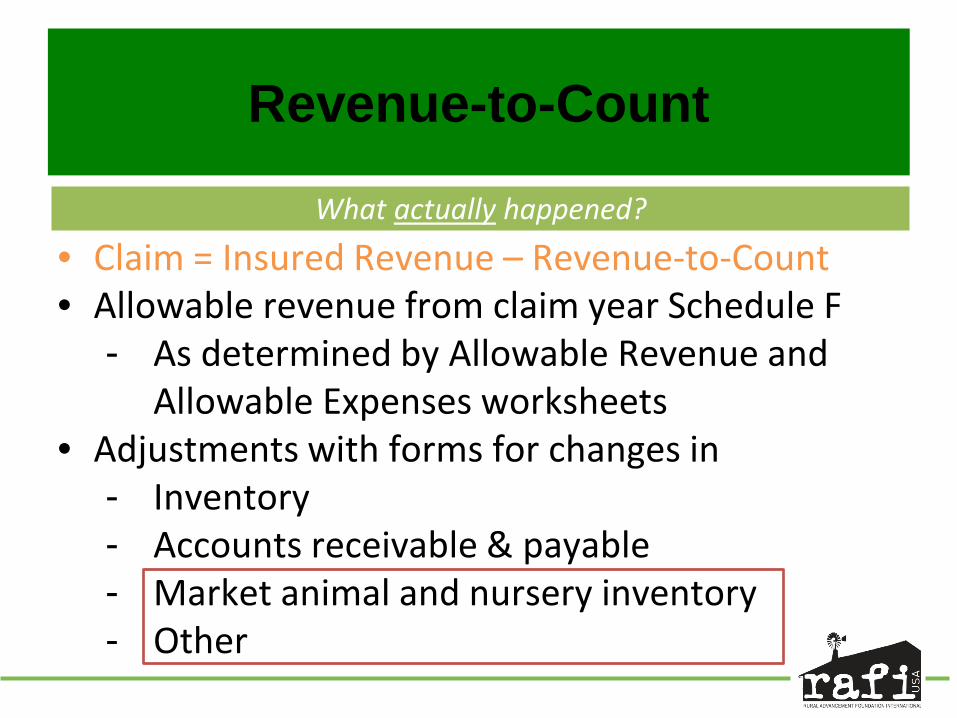
• Claim = Insured Revenue – Revenue-to-Count • Allowable revenue from claim year Schedule F
- As determined by Allowable Revenue and Allowable Expenses worksheets
• Adjustments with forms for changes in - Inventory - Accounts receivable & payable - Market animal and nursery inventory - Other
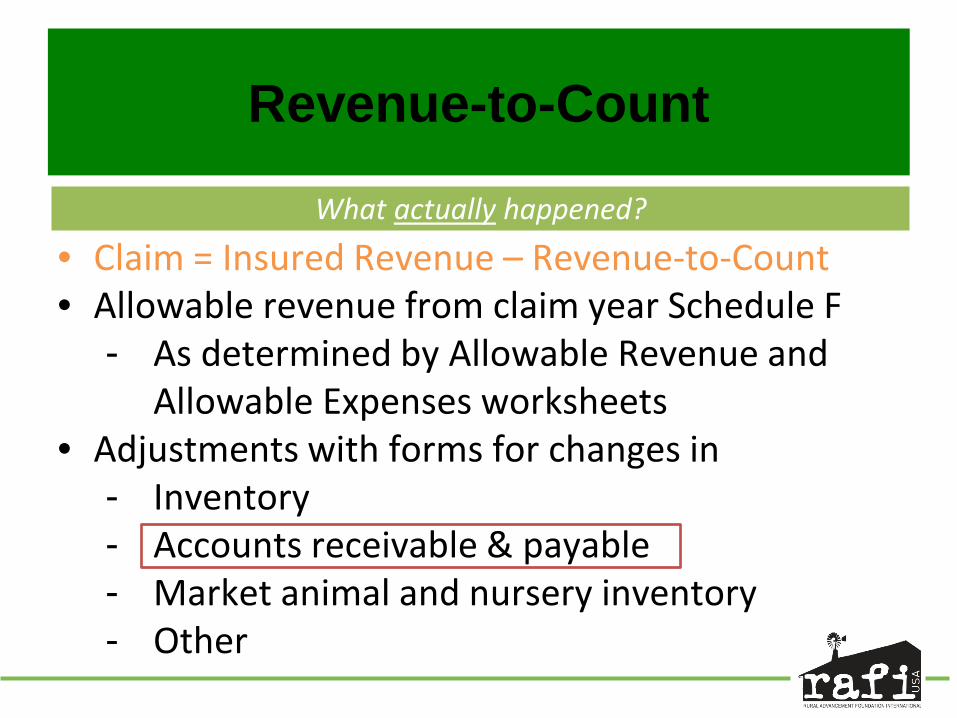
What actually happened?

Revenue-to-Count
• Claim = Insured Revenue – Revenue-to-Count • Allowable revenue from claim year Schedule F
- As determined by Allowable Revenue and Allowable Expenses worksheets
• Adjustments with forms for changes in - Inventory - Accounts receivable & payable - Market animal and nursery inventory - Other
What actually happened?
Inventory grows (End > Beginning)
Add to revenue-to-count Lowers claim
Inventory falls (End < Beginning)
Subtract from revenue-to-count Increases claim
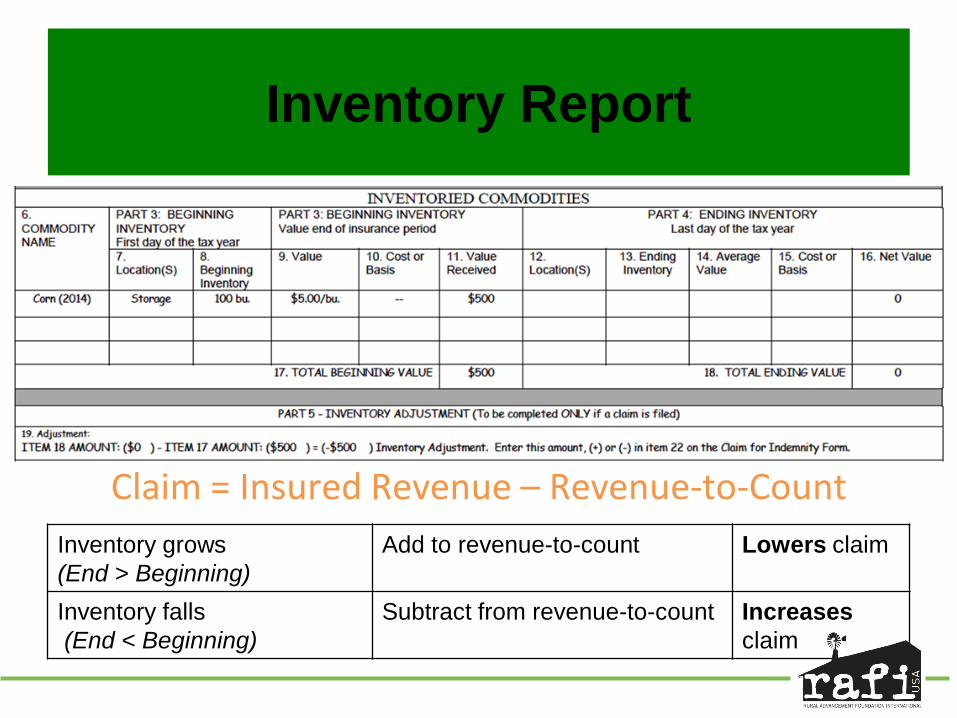
Claim = Insured Revenue – Revenue-to-Count
Inventory Report
Inventory grows (End > Beginning)
Add to revenue-to-count Lowers claim
Inventory falls (End < Beginning)
Subtract from revenue-to-count Increases claim
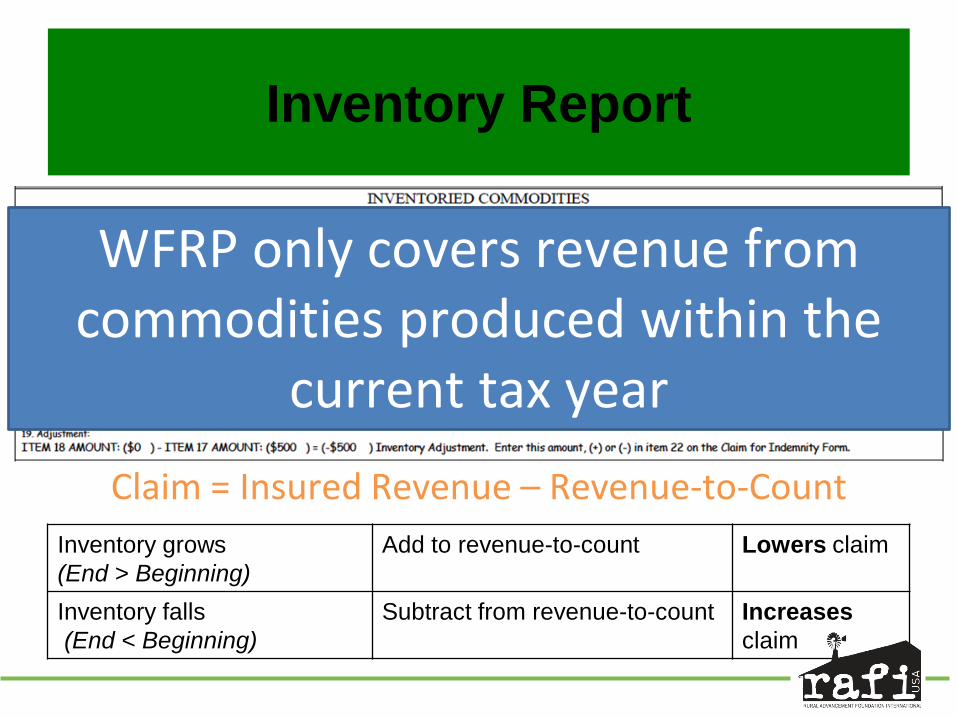
Claim = Insured Revenue – Revenue-to-Count
Inventory Report
WFRP only covers revenue from commodities produced within the
current tax year
Revenue-to-Count
• Claim = Insured Revenue – Revenue-to-Count • Allowable revenue from claim year Schedule F
- As determined by Allowable Revenue and Allowable Expenses worksheets
• Adjustments with forms for changes in - Inventory - Accounts receivable & payable - Market animal and nursery inventory - Other
What actually happened?

Accounts receivable grows (End > Beginning)
Add to revenue-to-count Lowers claim
Accounts receivable falls (End < Beginning)
Subtract from revenue-to-count Increases claim
Accounts Report
Revenue-to-Count
• Claim = Insured Revenue – Revenue-to-Count • Allowable revenue from claim year Schedule F
- As determined by Allowable Revenue and Allowable Expenses worksheets
• Adjustments with forms for changes in - Inventory - Accounts receivable & payable - Market animal and nursery inventory - Other
What actually happened?

Market Inventory and Other Adjustments
• Market animal and nursery inventory • Other
- Revenue loss from uninsured cause of loss ▪ Quarantine, neglect, etc.
- Abandoned acreage - Other indemnity payments - Gains from hedging - Anything else discussed by insurer and farmer

Claims For Indemnity Form
Approved Revenue * Coverage Level =
Allowable revenue with adjustments =

Claims For Indemnity Form
Insured Revenue – Revenue-to-Count =

Model Farm Examples
• What is Diversification? • WFRP offers a premium discount for more diverse
operations – But what does this mean?
• Crop Diversification – Count of crops grown
• Income Diversification – How much farm income comes from each crop
RMA WANTS BOTH

But How Much Does it Cost?
• It depends! – How much revenue you want to insure – The premium level – The specific crops you grow and how they interact – How many crops you grow (more diversity = lower
premium!)
• Ultimately, this must be settled with your agent • For your own purposes, http://tinyurl.com/USDA-
WFRP

Crop Revenue % of Revenue
Cucumbers $400,000 33%
Bell Peppers $400,000 33%
Tomatoes $400,000 33%
85% 80% 75% 70% 65% 60% 55% 50%
Total $71,808 $40,090 $24,300 $19,992 $16,692 $14,256 $12,012 $10,200 Per Acre $334 $186 $113 $93 $78 $66 $56 $47
• Mid-scale specialty crop commercial operation: – $1.2 million in revenue, 215 acres
Model Farm Example
Producer-Paid Premium
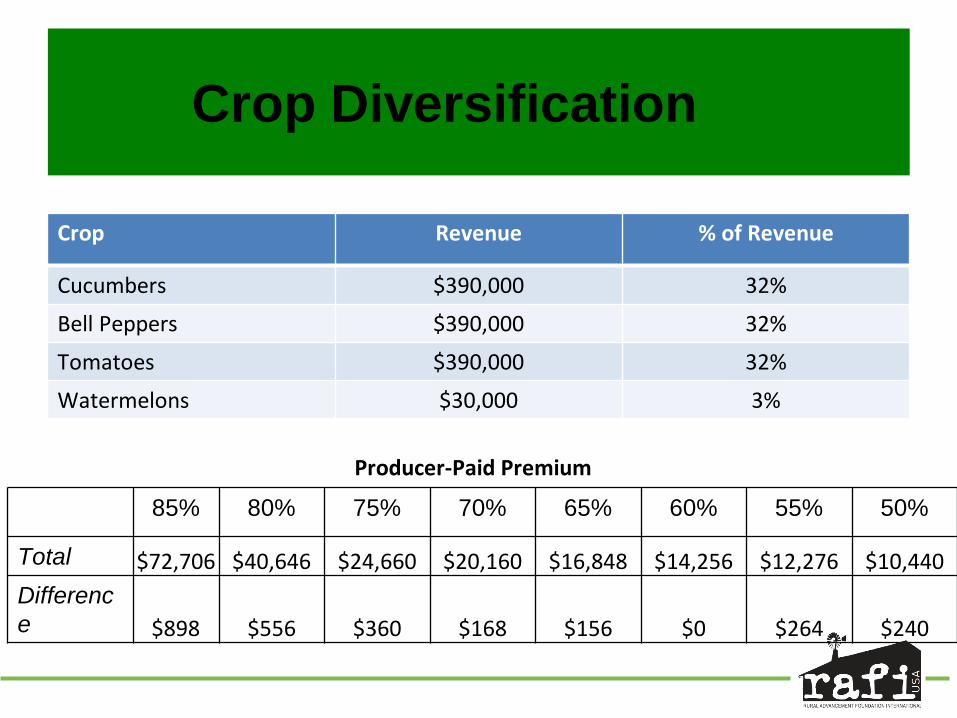
Crop Diversification
Crop Revenue % of Revenue
Cucumbers $390,000 32%
Bell Peppers $390,000 32%
Tomatoes $390,000 32%
Watermelons $30,000 3%
85% 80% 75% 70% 65% 60% 55% 50%
Total $72,706 $40,646 $24,660 $20,160 $16,848 $14,256 $12,276 $10,440 Difference $898 $556 $360 $168 $156 $0 $264 $240
Producer-Paid Premium
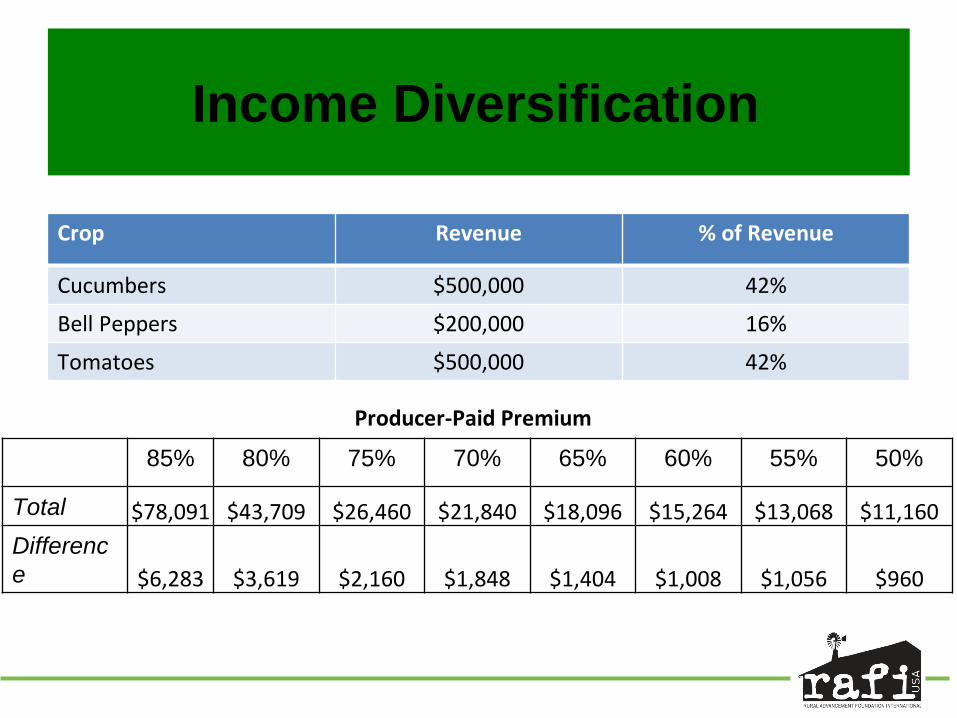
Income Diversification
Crop Revenue % of Revenue
Cucumbers $500,000 42%
Bell Peppers $200,000 16%
Tomatoes $500,000 42%
85% 80% 75% 70% 65% 60% 55% 50%
Total $78,091 $43,709 $26,460 $21,840 $18,096 $15,264 $13,068 $11,160 Difference $6,283 $3,619 $2,160 $1,848 $1,404 $1,008 $1,056 $960
Producer-Paid Premium
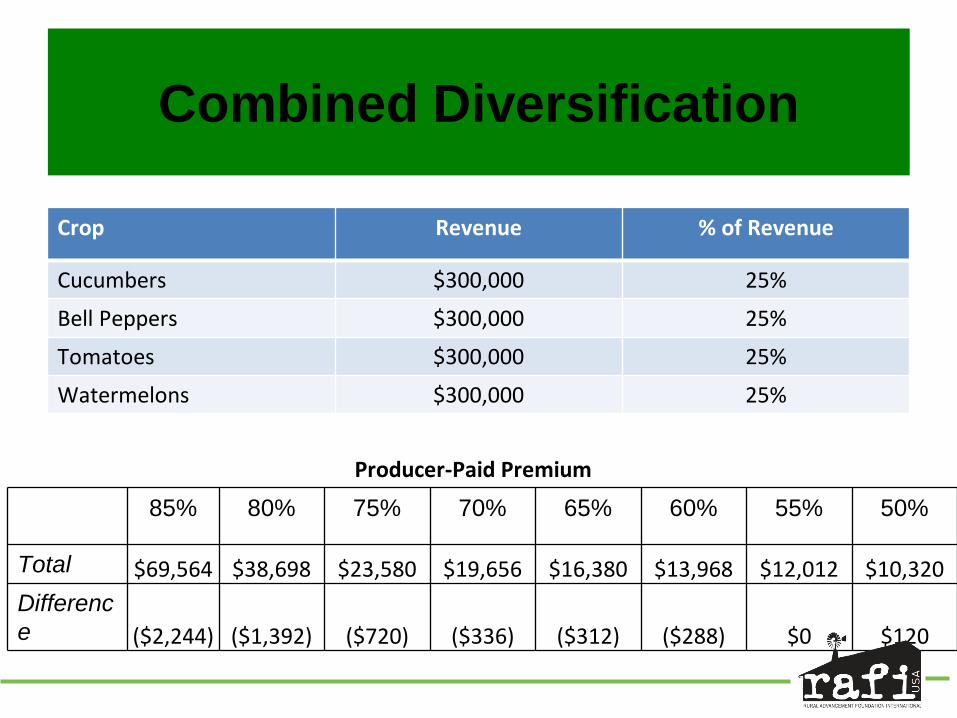
Crop Revenue % of Revenue
Cucumbers $300,000 25%
Bell Peppers $300,000 25%
Tomatoes $300,000 25%
Watermelons $300,000 25%
85% 80% 75% 70% 65% 60% 55% 50%
Total $69,564 $38,698 $23,580 $19,656 $16,380 $13,968 $12,012 $10,320 Difference ($2,244) ($1,392) ($720) ($336) ($312) ($288) $0 $120
Combined Diversification
Producer-Paid Premium
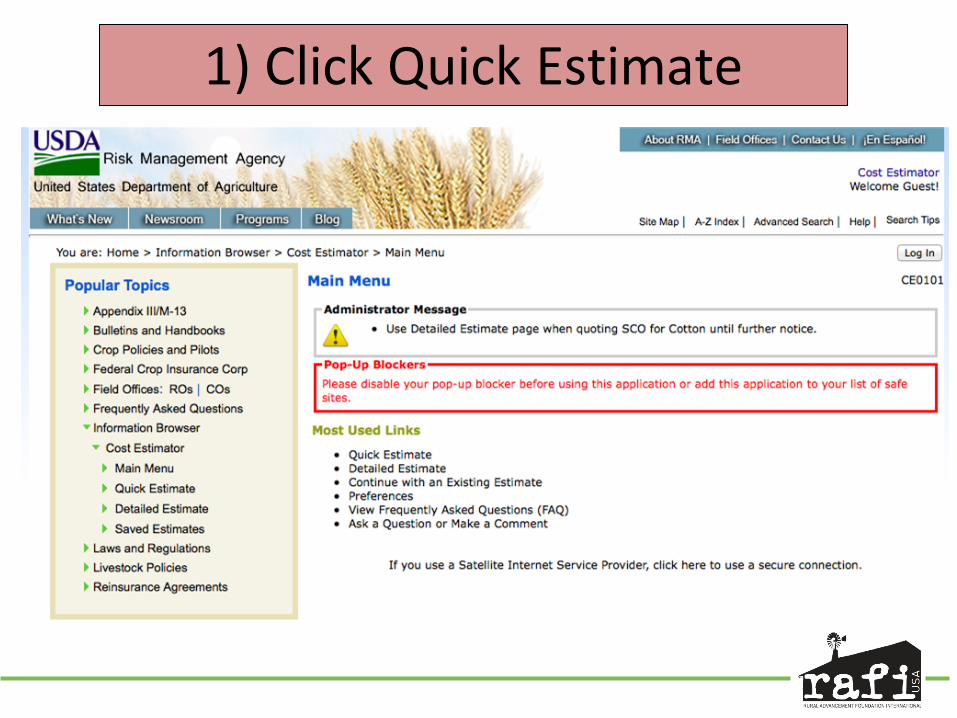
1) Click Quick Estimate
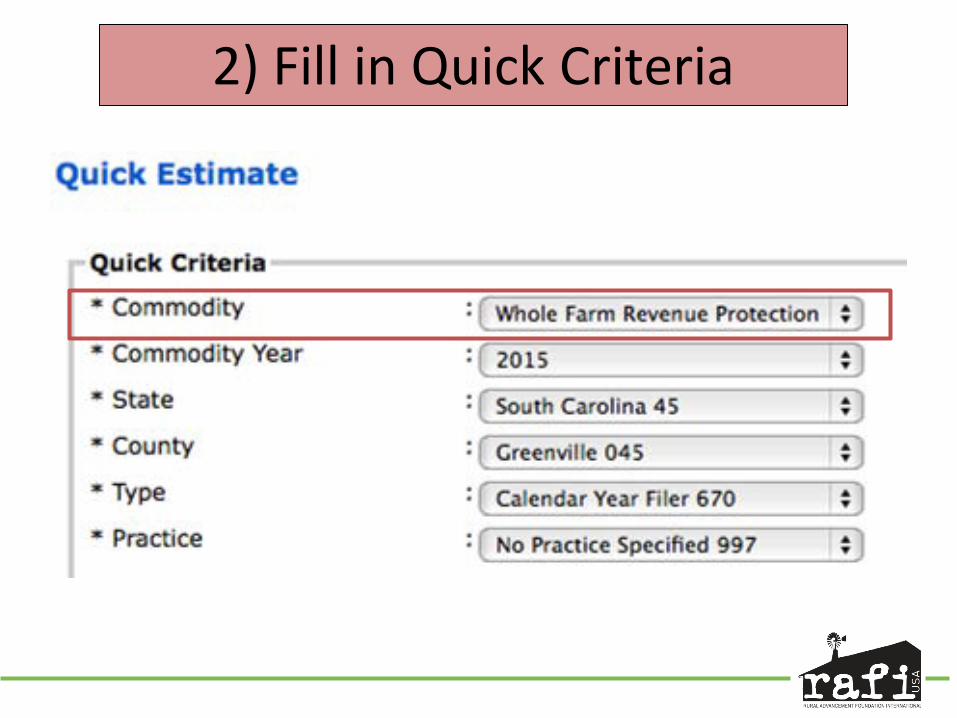
2) Fill in Quick Criteria
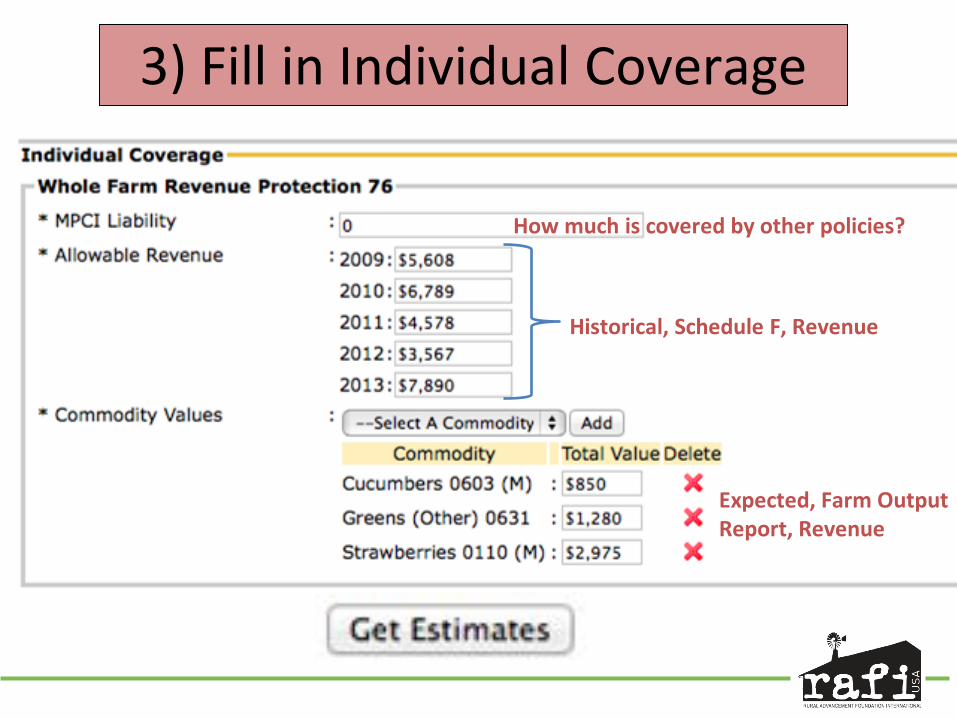
3) Fill in Individual Coverage
How much is covered by other policies?
Historical, Schedule F, Revenue
Expected, Farm Output Report, Revenue

4) Premium Estimates & Details

RECAP
• Sign-up for more info on sign-in sheet • Talk to crop insurance agents, try out the tools
yourself and please please let us know how it goes • WFRP – Completed application must be submitted
no later than the sales closing date specified in the actuarial documents (corresponds to spring sales closing dates for the county). – February 28th, March 15th
USDA – Farm Service Agency
Charles E. Zink
County Executive Director Madison/Buncombe County FSA Office
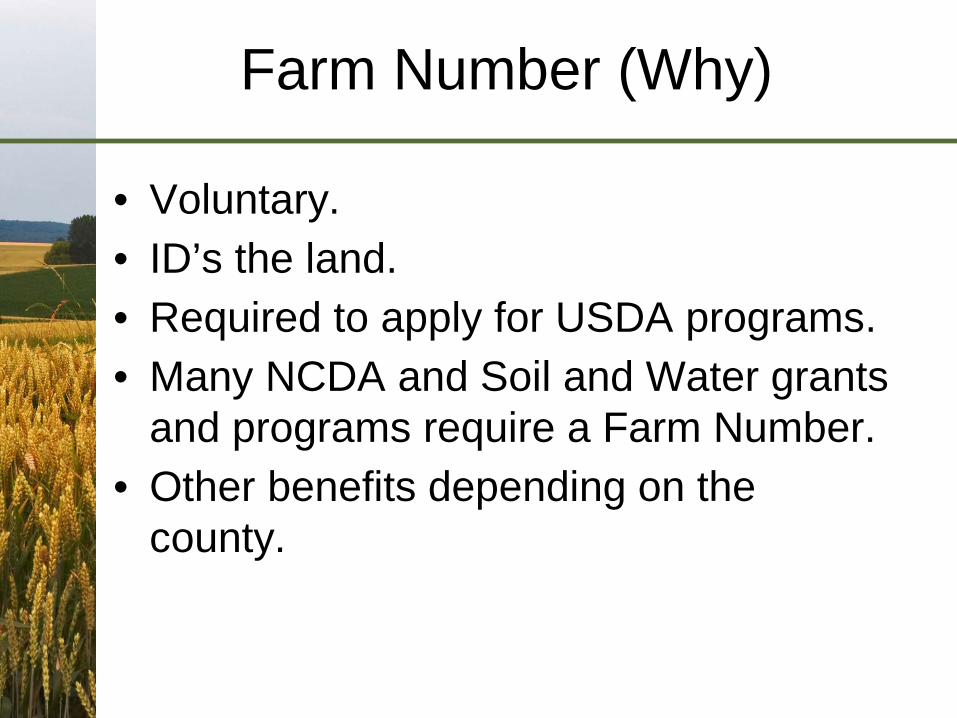
Farm Number (Why)
• Voluntary. • ID’s the land. • Required to apply for USDA programs. • Many NCDA and Soil and Water grants
and programs require a Farm Number. • Other benefits depending on the
county.
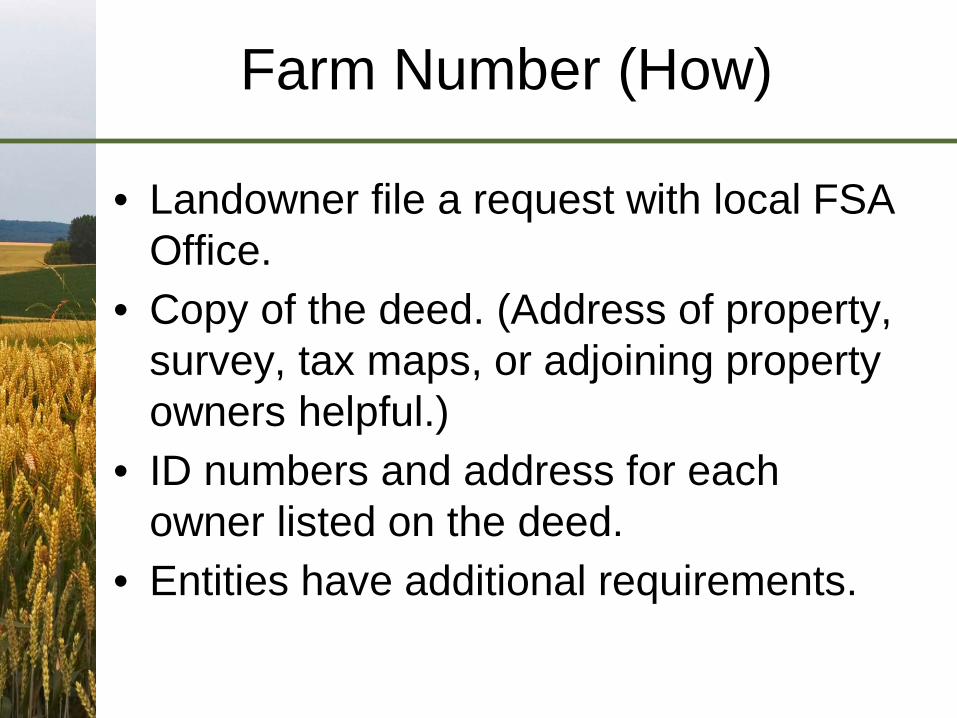
Farm Number (How)
• Landowner file a request with local FSA Office.
• Copy of the deed. (Address of property, survey, tax maps, or adjoining property owners helpful.)
• ID numbers and address for each owner listed on the deed.
• Entities have additional requirements.

NAP
• Non Insurable Crop Disaster Assistance Program
• Provides coverage for crop losses on crops when crop insurance is not offered.
• Covered losses are caused by natural disaster.
• Apply for the program at your local FSA Office.
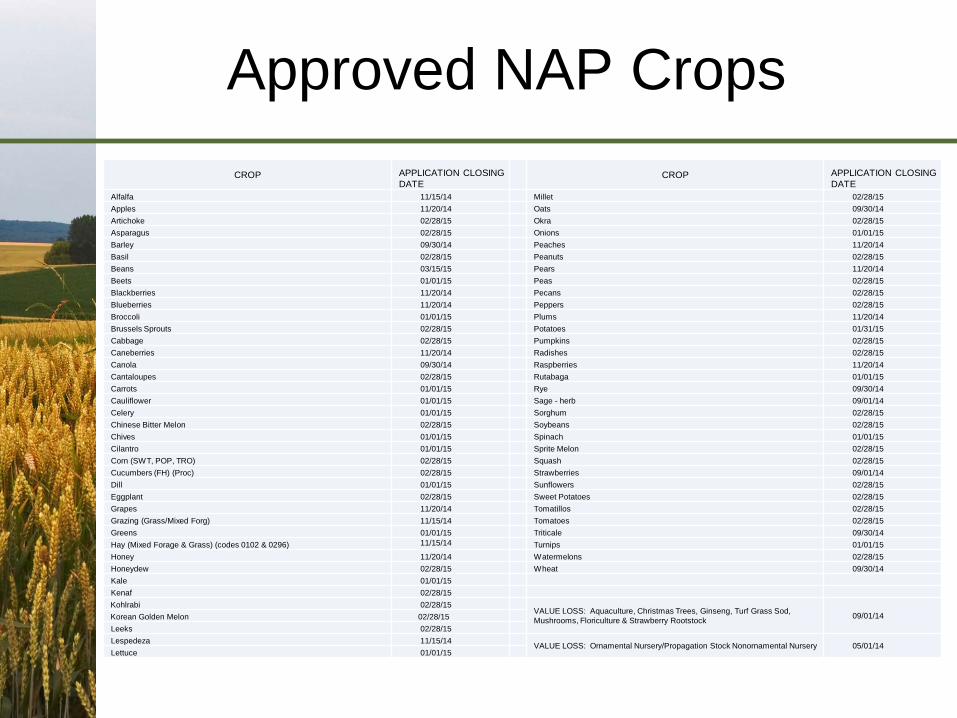
Approved NAP Crops CROP APPLICATION CLOSING
DATE CROP APPLICATION CLOSING
DATE Alfalfa 11/15/14 Millet 02/28/15 Apples 11/20/14 Oats 09/30/14 Artichoke 02/28/15 Okra 02/28/15 Asparagus 02/28/15 Onions 01/01/15 Barley 09/30/14 Peaches 11/20/14 Basil 02/28/15 Peanuts 02/28/15 Beans 03/15/15 Pears 11/20/14 Beets 01/01/15 Peas 02/28/15 Blackberries 11/20/14 Pecans 02/28/15 Blueberries 11/20/14 Peppers 02/28/15 Broccoli 01/01/15 Plums 11/20/14 Brussels Sprouts 02/28/15 Potatoes 01/31/15 Cabbage 02/28/15 Pumpkins 02/28/15 Caneberries 11/20/14 Radishes 02/28/15 Canola 09/30/14 Raspberries 11/20/14 Cantaloupes 02/28/15 Rutabaga 01/01/15 Carrots 01/01/15 Rye 09/30/14 Cauliflower 01/01/15 Sage - herb 09/01/14 Celery 01/01/15 Sorghum 02/28/15 Chinese Bitter Melon 02/28/15 Soybeans 02/28/15 Chives 01/01/15 Spinach 01/01/15 Cilantro 01/01/15 Sprite Melon 02/28/15 Corn (SWT, POP, TRO) 02/28/15 Squash 02/28/15 Cucumbers (FH) (Proc) 02/28/15 Strawberries 09/01/14 Dill 01/01/15 Sunflowers 02/28/15 Eggplant 02/28/15 Sweet Potatoes 02/28/15 Grapes 11/20/14 Tomatillos 02/28/15 Grazing (Grass/Mixed Forg) 11/15/14 Tomatoes 02/28/15 Greens 01/01/15 Triticale 09/30/14 Hay (Mixed Forage & Grass) (codes 0102 & 0296) 11/15/14 Turnips 01/01/15 Honey 11/20/14 Watermelons 02/28/15 Honeydew 02/28/15 Wheat 09/30/14 Kale 01/01/15 Kenaf 02/28/15
Kohlrabi 02/28/15 VALUE LOSS: Aquaculture, Christmas Trees, Ginseng, Turf Grass Sod, Mushrooms, Floriculture & Strawberry Rootstock 09/01/14 Korean Golden Melon 02/28/15
Leeks 02/28/15 Lespedeza 11/15/14 VALUE LOSS: Ornamental Nursery/Propagation Stock Nonornamental Nursery 05/01/14 Lettuce 01/01/15
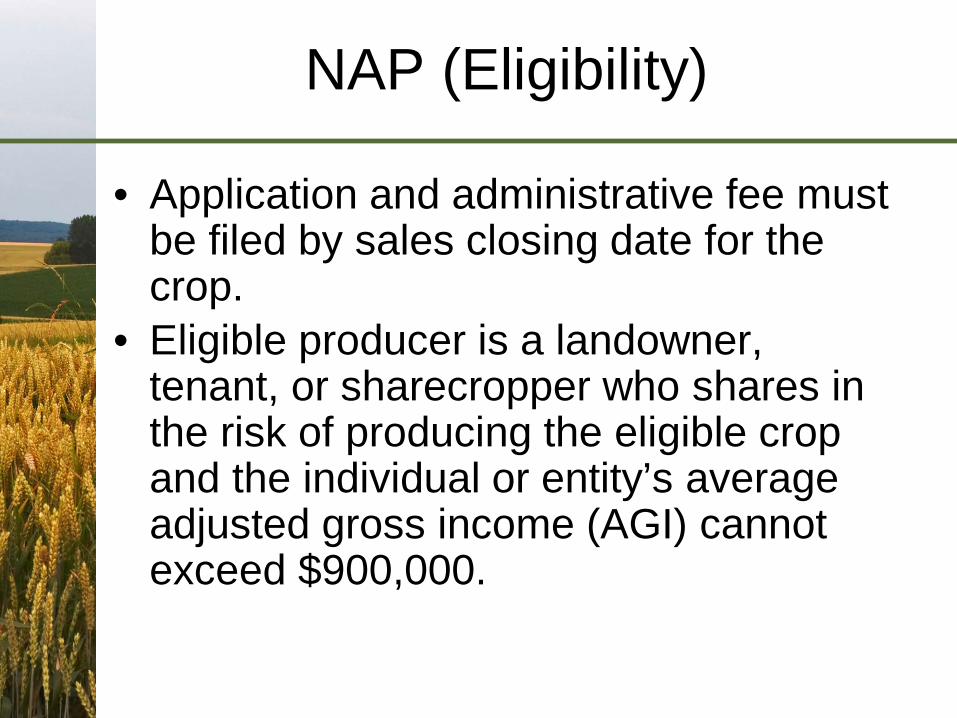
NAP (Eligibility)
• Application and administrative fee must be filed by sales closing date for the crop.
• Eligible producer is a landowner, tenant, or sharecropper who shares in the risk of producing the eligible crop and the individual or entity’s average adjusted gross income (AGI) cannot exceed $900,000.
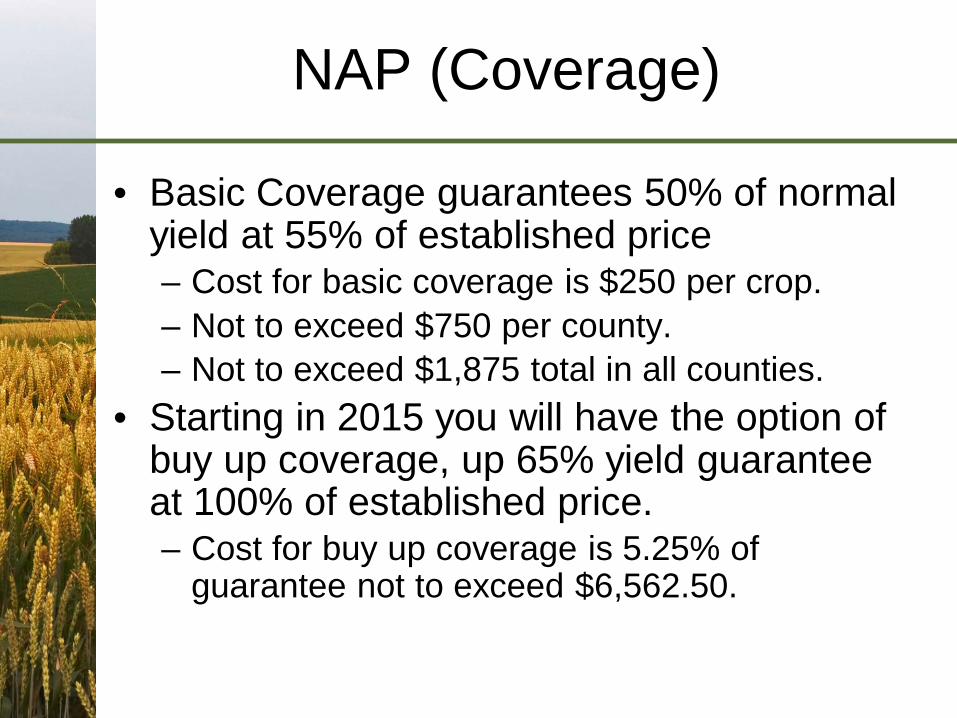
NAP (Coverage)
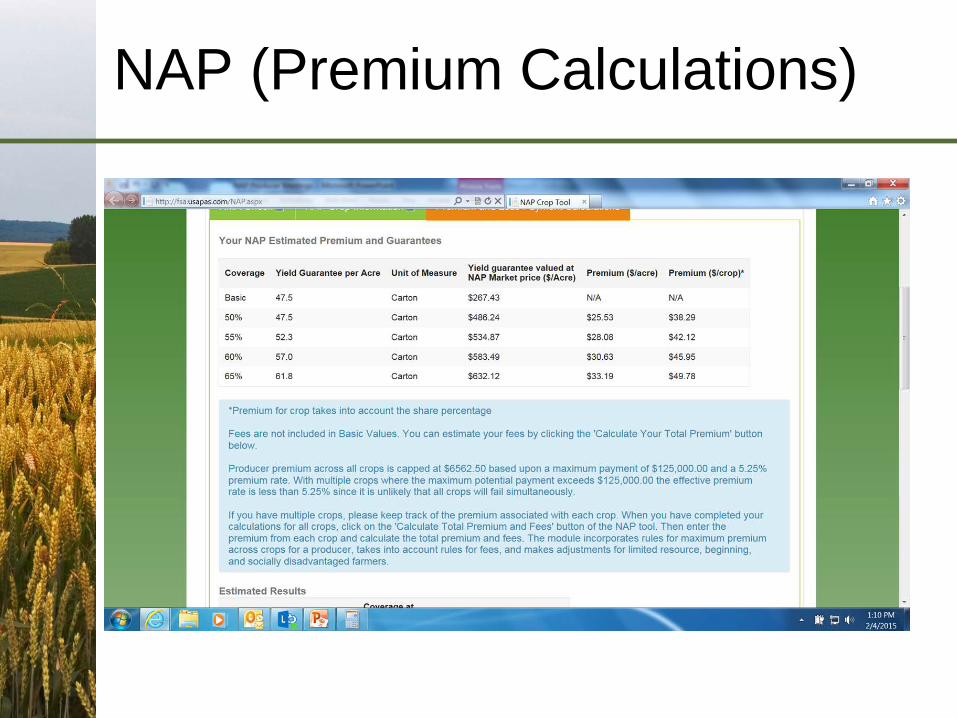
• Basic Coverage guarantees 50% of normal yield at 55% of established price – Cost for basic coverage is $250 per crop. – Not to exceed $750 per county. – Not to exceed $1,875 total in all counties.
• Starting in 2015 you will have the option of buy up coverage, up 65% yield guarantee at 100% of established price. – Cost for buy up coverage is 5.25% of
guarantee not to exceed $6,562.50.

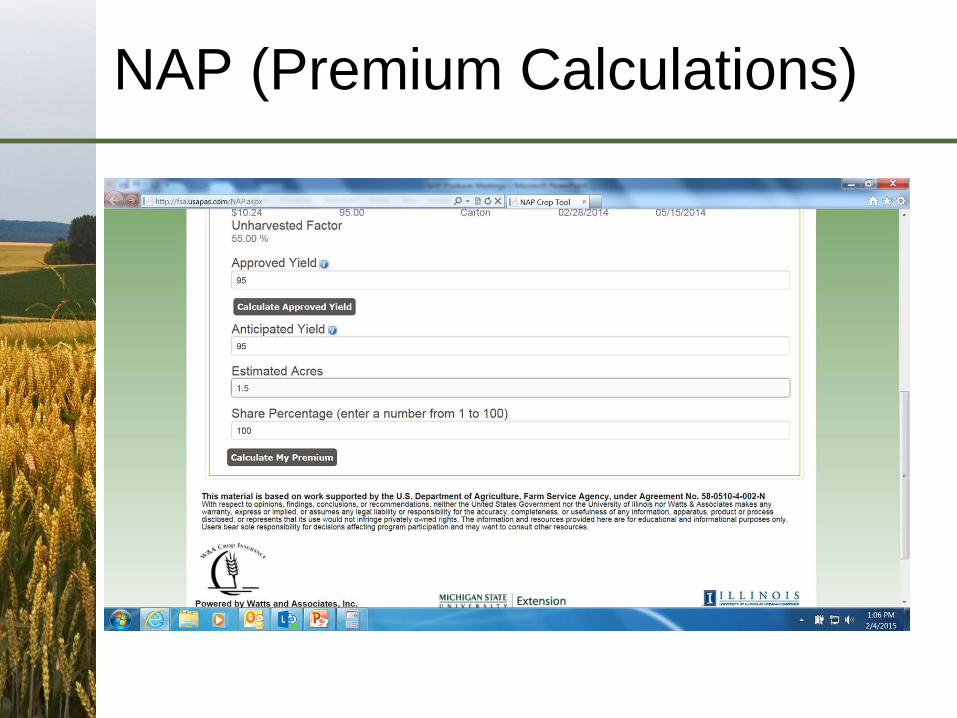
NAP (Coverage)
• Producers who elect buy up coverage must pay the administrative fee plus a premium equal to: – The producer's share of the crop; times – The number of acres of the crop; times – The approved yield per acre; times – The coverage level; times the average
market price; times – 5.25% premium fee.

NAP (Eligibility)
• Limited resource, traditionally underserved, and beginning farmers are eligible for a waiver of the administrative fee and a 50% premium reduction when they file form CCC-860, Socially Disadvantaged, Limited Resource and Beginning Farmer or Rancher Certification.
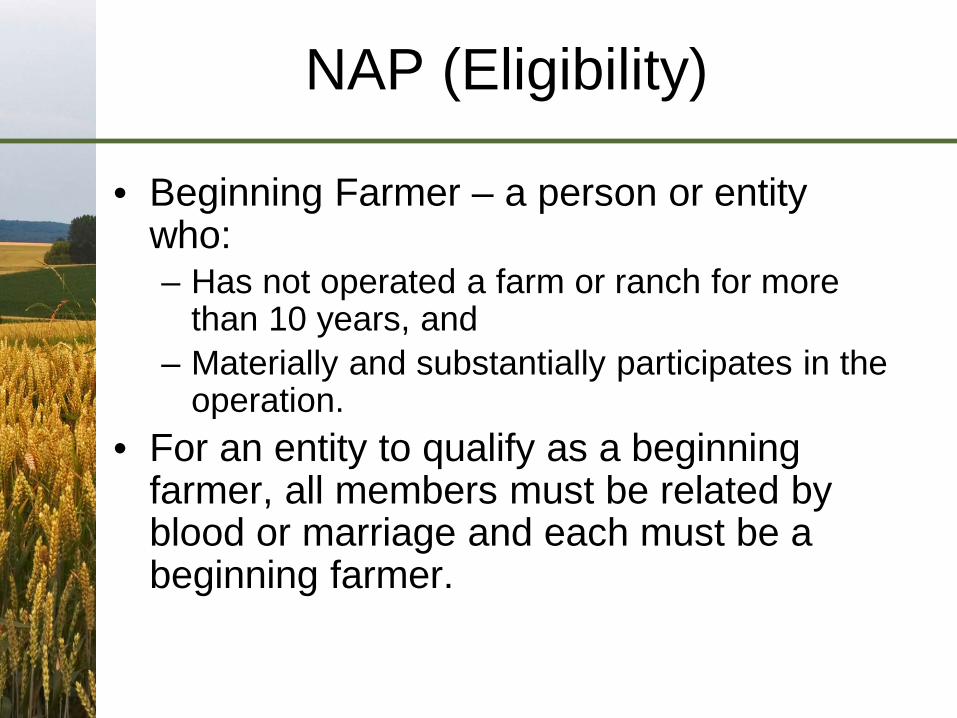
NAP (Eligibility)
• Beginning Farmer – a person or entity who: – Has not operated a farm or ranch for more
than 10 years, and – Materially and substantially participates in the
operation. • For an entity to qualify as a beginning
farmer, all members must be related by blood or marriage and each must be a beginning farmer.

NAP (Eligibility)
• Limited resource farmer – a person or entity that: – Earns no more than $176,800 in each of the 2
previous tax years, and – Has a total household income at or below the
national poverty level or less than 50% of the county Median household income for the 2 previous years ($23,850 for most WNC counties).
• Online tool located at www.lrftool.sc.egov.usda.gov
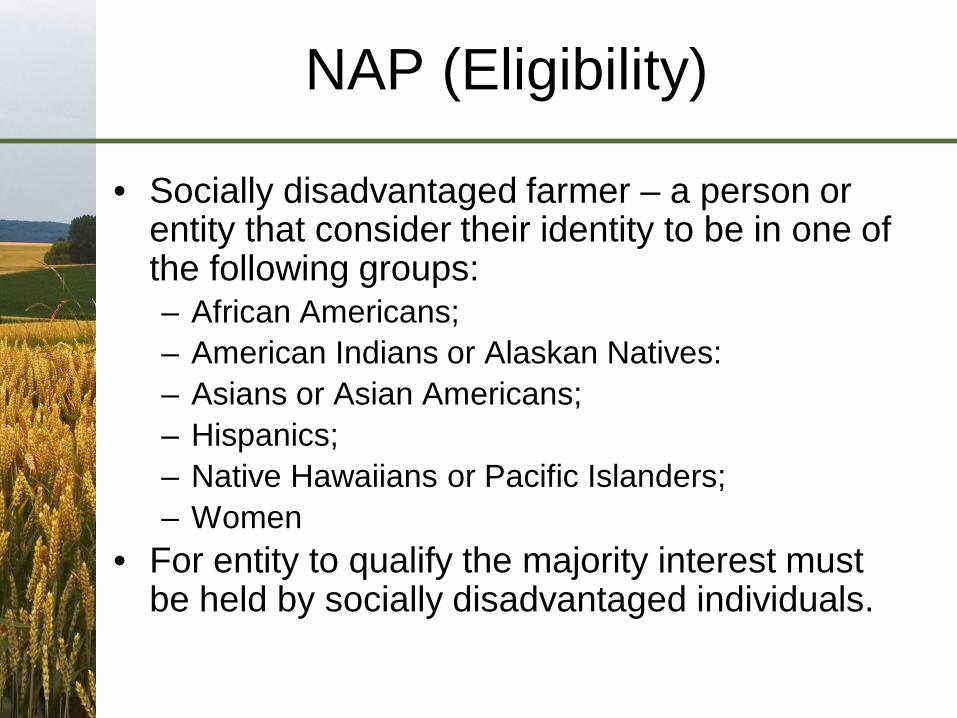
NAP (Eligibility)
• Socially disadvantaged farmer – a person or entity that consider their identity to be in one of the following groups: – African Americans; – American Indians or Alaskan Natives: – Asians or Asian Americans; – Hispanics; – Native Hawaiians or Pacific Islanders; – Women
• For entity to qualify the majority interest must be held by socially disadvantaged individuals.
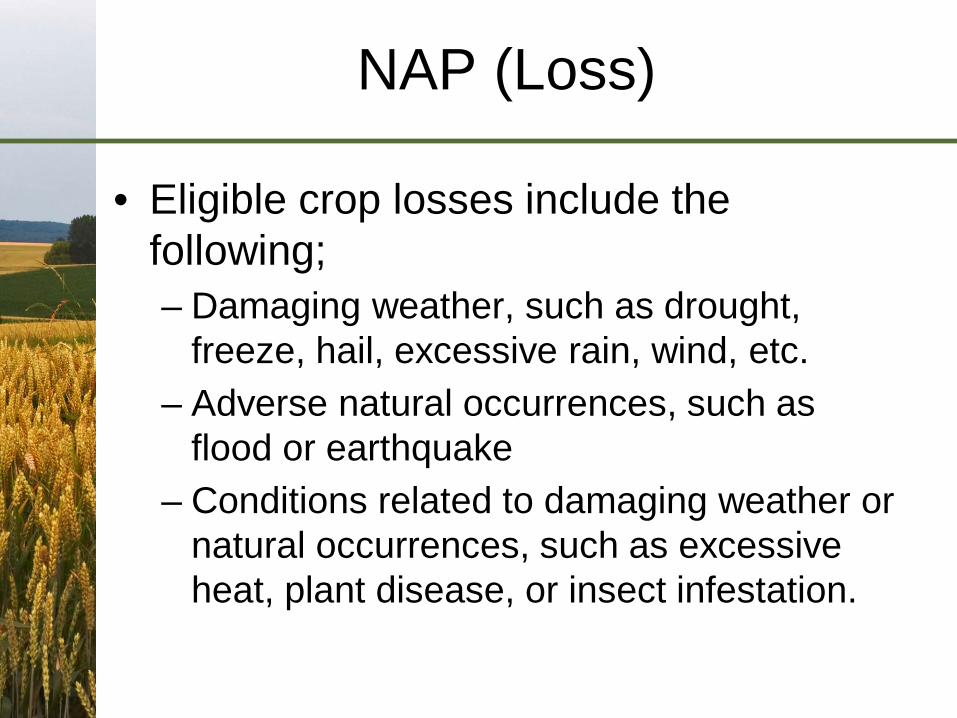
NAP (Loss)
• Eligible crop losses include the following; – Damaging weather, such as drought,
freeze, hail, excessive rain, wind, etc. – Adverse natural occurrences, such as
flood or earthquake – Conditions related to damaging weather or
natural occurrences, such as excessive heat, plant disease, or insect infestation.
NAP (Loss)
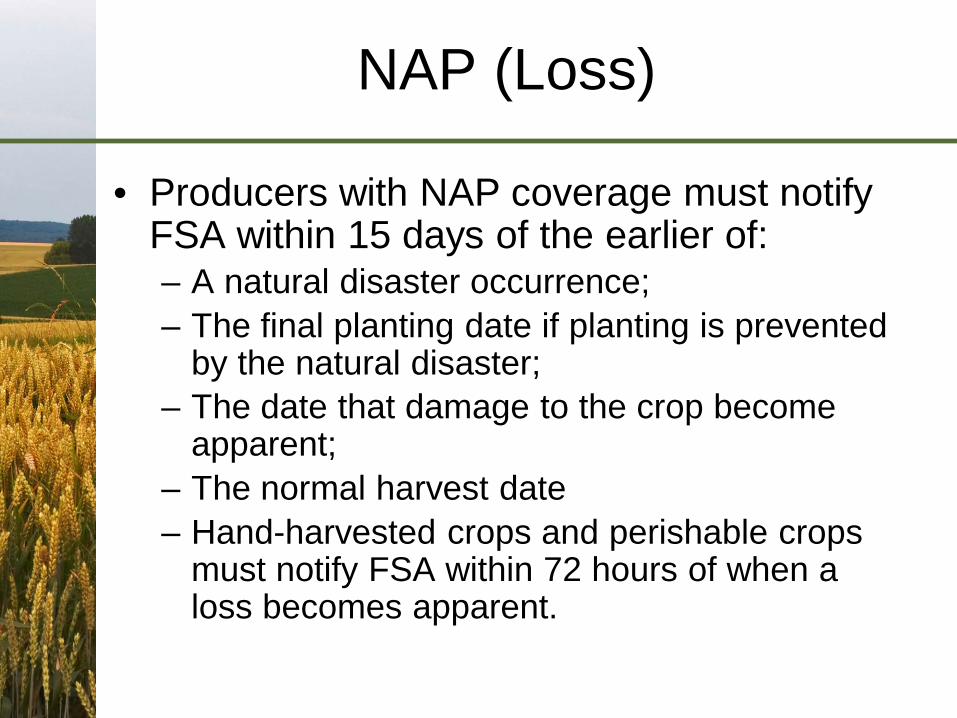
• Producers with NAP coverage must notify FSA within 15 days of the earlier of: – A natural disaster occurrence; – The final planting date if planting is prevented
by the natural disaster; – The date that damage to the crop become
apparent; – The normal harvest date – Hand-harvested crops and perishable crops
must notify FSA within 72 hours of when a loss becomes apparent.
NAP (Loss)
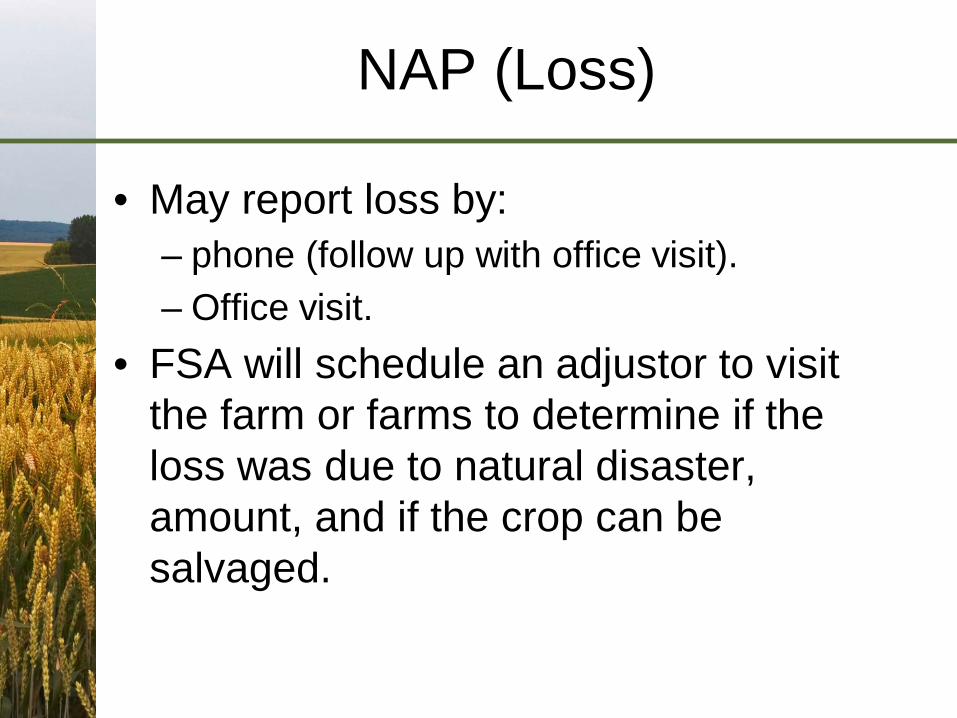
• May report loss by: – phone (follow up with office visit). – Office visit.
• FSA will schedule an adjustor to visit the farm or farms to determine if the loss was due to natural disaster, amount, and if the crop can be salvaged.

NAP (Premium Calculations)

NAP (Premium Calculations)
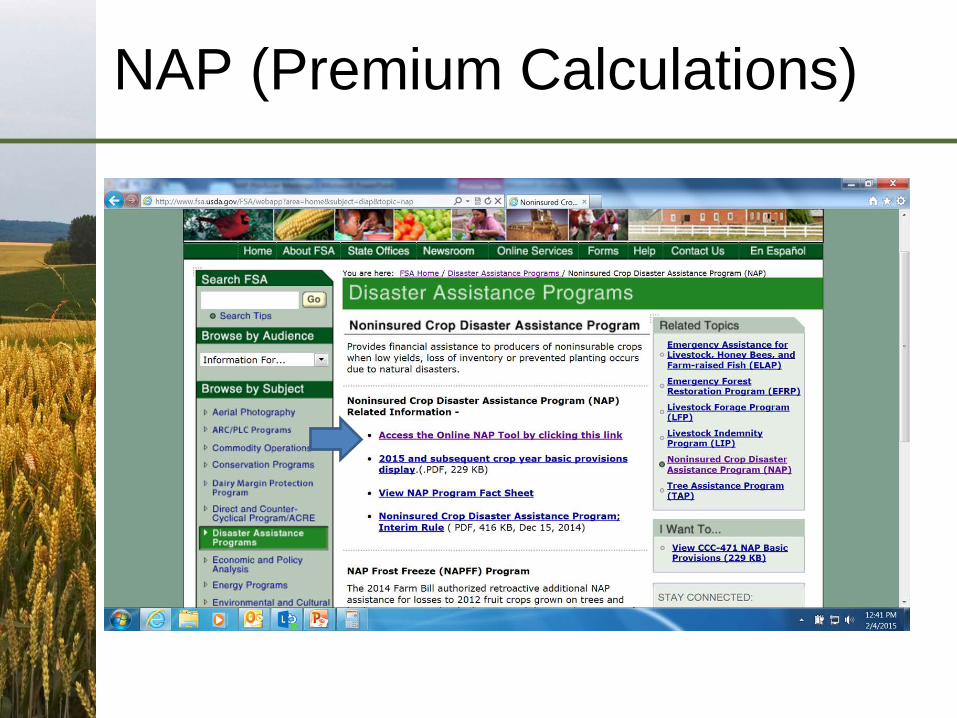
NAP (Premium Calculations)

NAP (Premium Calculations)
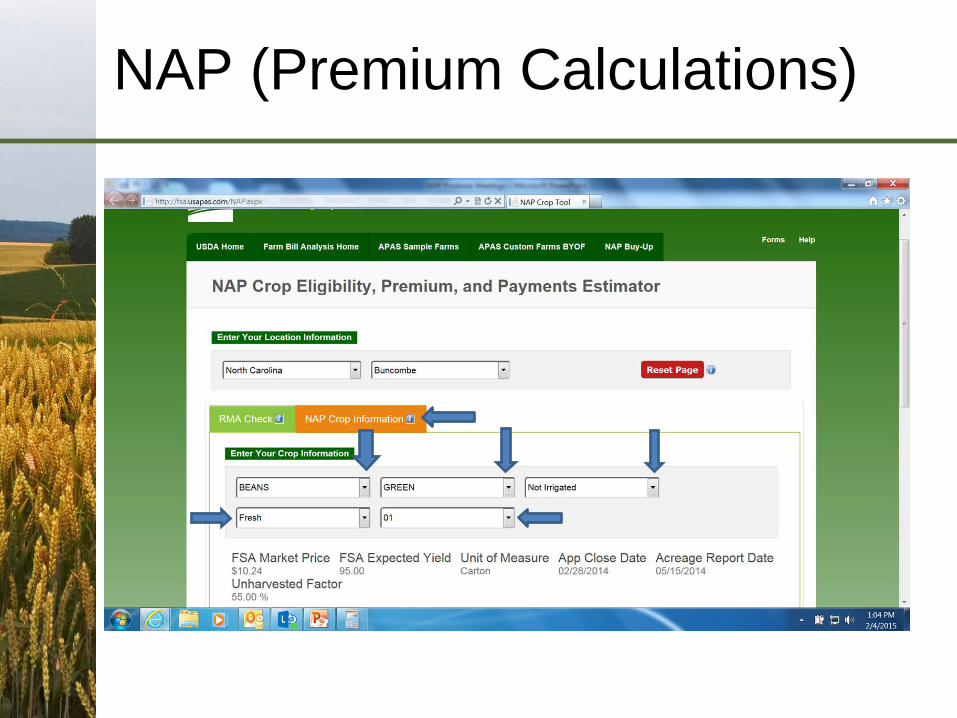
NAP (Premium Calculations)
NAP (Premium Calculations)
NAP (Premium Calculations)
NAP (Crop Reporting)
• NAP producers are required to make crop acreage reports each year. Must report by crop reporting deadline (most crops July 15); – Name and type of crop planted. – Farm, field location and acreage. – Who shares in the crop. – Date crop is planted. – Intended use.
• In most cases this requires an office visit because the producer must identify the fields on aerial photography.
NAP (Record Keeping)
• Producers are required to provide record of production of the crop. Records must be: – Verifiable - such as sales receipts with dates,
name of buyer, product sold, and amount. – Reliable - such as pick records, farm book
keeping records. – Records must be easy to read and
understand. • Producers should contact FSA for
questions regarding acceptable production records.
NAP • Failure to make crop acreage report and
provide production information for NAP covered crops may result in reduced or zero NAP assistance.
• The acreage and production reports are used to calculate the approved yield. The approved yield is an average of the producer’s actual production history (APH) for a minimum of 4 to a maximum of 10 crop years.
• A producer’s approved yield may be calculated using substantially reduced yield data if acreage and suitable production records are not provided.

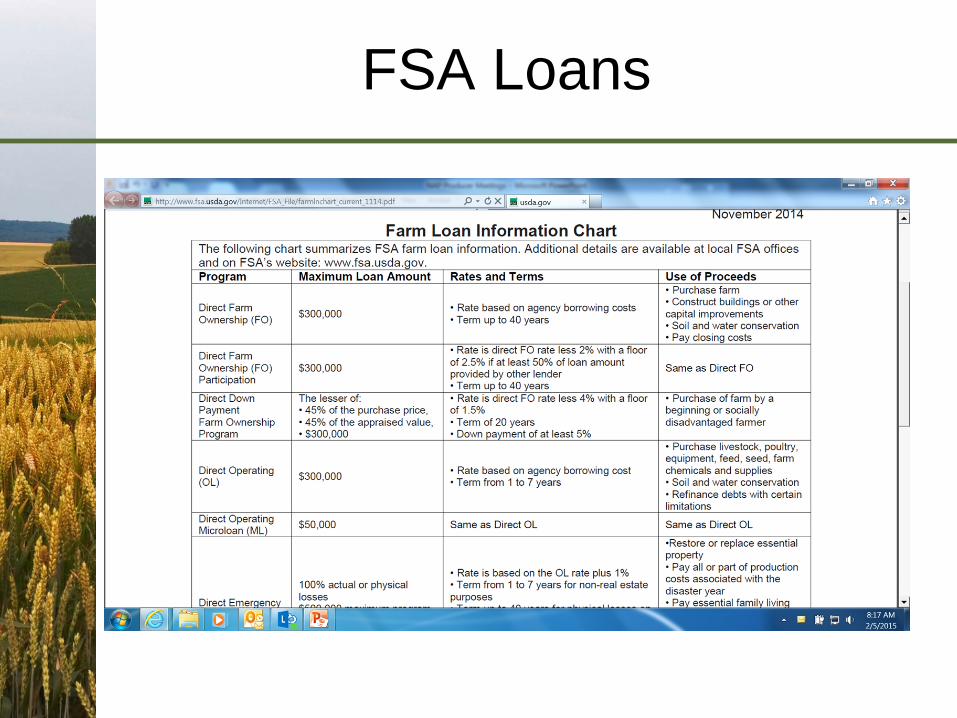
FSA Loans
• FSA’s loan programs are designed to help family farmers to start, purchase or expand their farming operation.
• Several loan options are available and each person’s needs are different so visit our booth during lunch to get detailed information.
FSA Loans

Questions