2015 Broken Hill Resources Investment Symposium - Heathgate Resources - Brett Rava
26
Heathgate Resources Pty Ltd Frome Basin – Beverley North Deposits Discovery to Recovery Brett Rava – Geology Manager Resources Investment Symposium Broken Hill May 2015
Transcript of 2015 Broken Hill Resources Investment Symposium - Heathgate Resources - Brett Rava

Heathgate Resources Pty Ltd
Frome Basin – Beverley North Deposits
Discovery to Recovery
Brett Rava – Geology Manager
Resources Investment Symposium
Broken Hill
May 2015

2
Affiliate of General Atomics (San Diego, California) – World leader for high-technology research and production for
industry and government in the U.S. and overseas • nuclear fuel cycle , electromagnetic systems, remotely operated
surveillance aircraft, airborne sensors, and advanced electric, electronic, wireless and laser technologies.
Heathgate Resources Pty Ltd – Established in 1990; based in Adelaide – Operator of the Beverley uranium mine, which commenced
production in 2000 – Owner of the Beverley North uranium mines, commenced
production in late 2010 – Heathgate Resources is a service provider to Quasar
Resources.
Quasar Resources Pty Ltd – Subsidiary of GA; based in Adelaide – 75% ownership and manager of the Four Mile Uranium Project
General Atomics Torrey Pines Site
Beverley Uranium Mine

Regional Picture – Frome Embayment
3

Gammon Ranges
National Park
EL5261
EL5118
EL5119
EL5177
EL5349
EL5328
EL5311
EL5329
EL5017
25km
Heathgate EL
Quasar-Alliance EL
Heathgate ML
Quasar-Alliance ML
Quasar EL
Heathgate Resources & Quasar Resources – Frome Basin tenements
FROME BASIN PROJECT – 100% Heathgate
Total Total Area (km2)
Exploration Licences (EL) ** 7 4,108
Retention Leases (RL) 3 7.5
Mining Leases (ML) 2 178
TOTAL 4,115.5 km2
5
FROME BASIN PROJECT – Quasar-Alliance JV
Total Total Area (km2)
Exploration Licences (EL) ** 1 780
Mining Leases (ML) 1 122.1
TOTAL 780 km2
FROME BASIN PROJECT – 100% Quasar
Total Total Area (km2)
Exploration Licences (EL) 2 1,051
TOTAL 1,051 km2
TOTALS
Total Total Area (km2)
Exploration Licences (EL) ** 10 5,816.9
Mining Leases (ML) 3 300.1
• Active exploration since 2002.
• Sedimentary uranium focussed exploration programs.
• Exploration investment since 2002 approximately +$150M.
• Total planned exploration budget 2015 (excluding JV) ~$3.47M.
• CSIRO Collaborative Project
• Approximately 36 Mlbs of in-place resources discovered in 100% HGR tenements (not all amenable to ISR)
** EL underlies ML

5
• Northern Flinders Ranges – rated one of the 5 most naturally radioactive places in the world
• Surface could contain ~1Mlbs based on airborne radiometric data (within drainage area)
• In the last 5.3Ma (time of last uplift and erosion – Skirrow, 2009) significant amount of uranium has been mobilised into the basin (Skirrow, 2009 & Quigley et al, 2006)
• In-ground resources discovered to date (not all in-ground resource amenable to ISR)
ü Pepegoona E & W 3.5 Mlbs ü Pannikan 3.9 Mlbs ü Beverley 25.9 Mlbs ü Other ~3 Mlbs(?) ü Four Mile East (FME) & Four Mile West (FMW) 71 Mlbs* (Indicated & Inferred) ü FMNE (Four Mile North East) 70-80 Mlbs** (Exploration Target)
Total ~177-187 Mlbs
• Is there more and where is it?
Skirrow, R.G., 2009 (editor) GA Record 2009/40, p110
* Alliance Resources Ltd, Annual Report 2014 ** Alliance Resources Ltd, ASX Announcement 24 February 2015
Airborne Radiometrics (U channel)
Why are we looking in the Frome Basin?

Roll-front in an open cut mine – South Texas Upper and Lower Limbs
• generally narrow, weakly mineralised, dominated by daughter products
• Strong –ve DEF
Roll • strongly mineralised – roll-front ore zone
• strong +ve DEF
Redox Front
• precipitation uraninite or coffinite at redox front/boundary
• moderately to strongly mineralised
• weak –ve DEF
Protore • weakly mineralised
• +ve DEF
What are we exploring for ?
DEF = Disequilibrium Factor (ratio PFN grade vs. γ grade)
DEF > 1.0; +ve DEF = uranium enriched
DEF < 1.0; -ve DEF = uranium depleted
DEF = 1.0; equilibrium
7
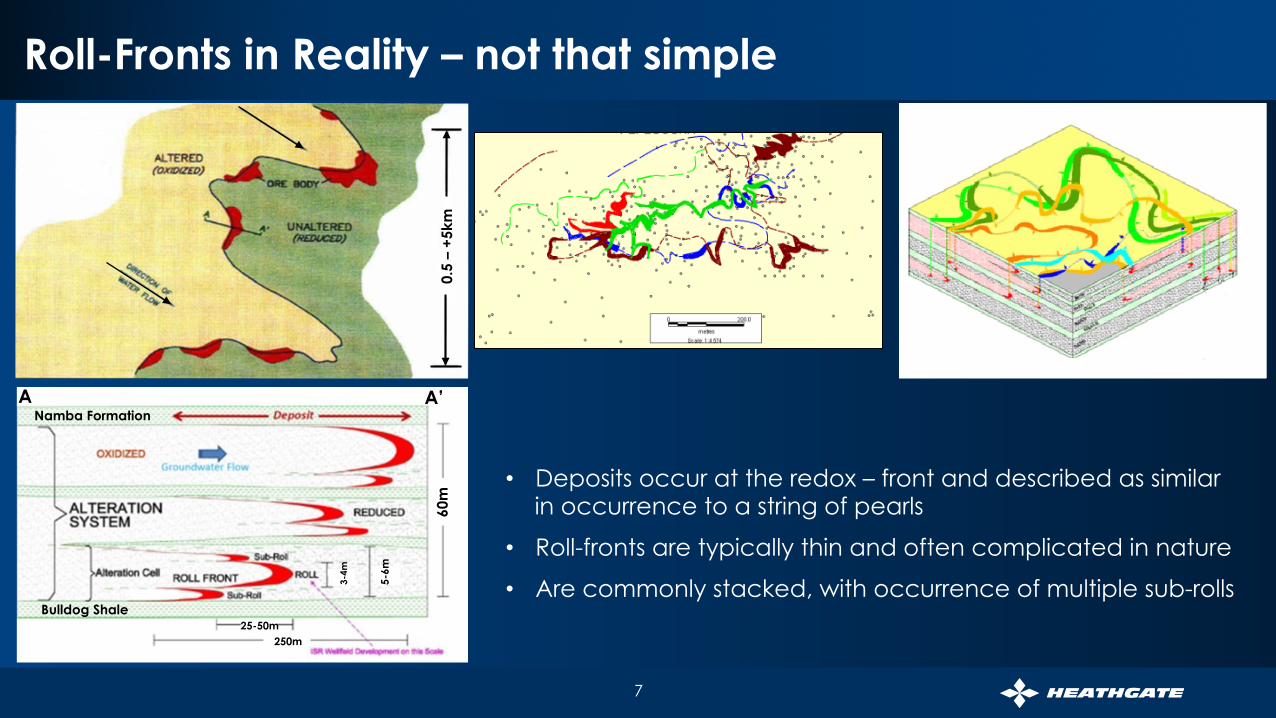
0.5
– +5
km
Bulldog Shale
Namba Formation
60m
5-6m
3-4m
250m 25-50m
A A’
• Deposits occur at the redox – front and described as similar in occurrence to a string of pearls
• Roll-fronts are typically thin and often complicated in nature
• Are commonly stacked, with occurrence of multiple sub-rolls
Roll-Fronts in Reality – not that simple

8
• Regional exploration to initially define redox-front
• Great start - extensive drillhole database • approximately +15,000 holes • majority within Beverley and Beverley North MLs • historical drilling
• Majority of historical holes limited to testing of Namba Formation – an issue when exploring the Eyre Formation
• HGR-QSR exploration holes drilled to Bulldog Shale
• Redox boundary defined by broad spaced (+1km) drilling over approximately 110km length within northern tenements.
• Re-reduction a consideration– looking at geochemical finger-printing
• Potential for Beverley style palaeochannel mineralisation still considered high
Where to start ?
9
How hard is it !
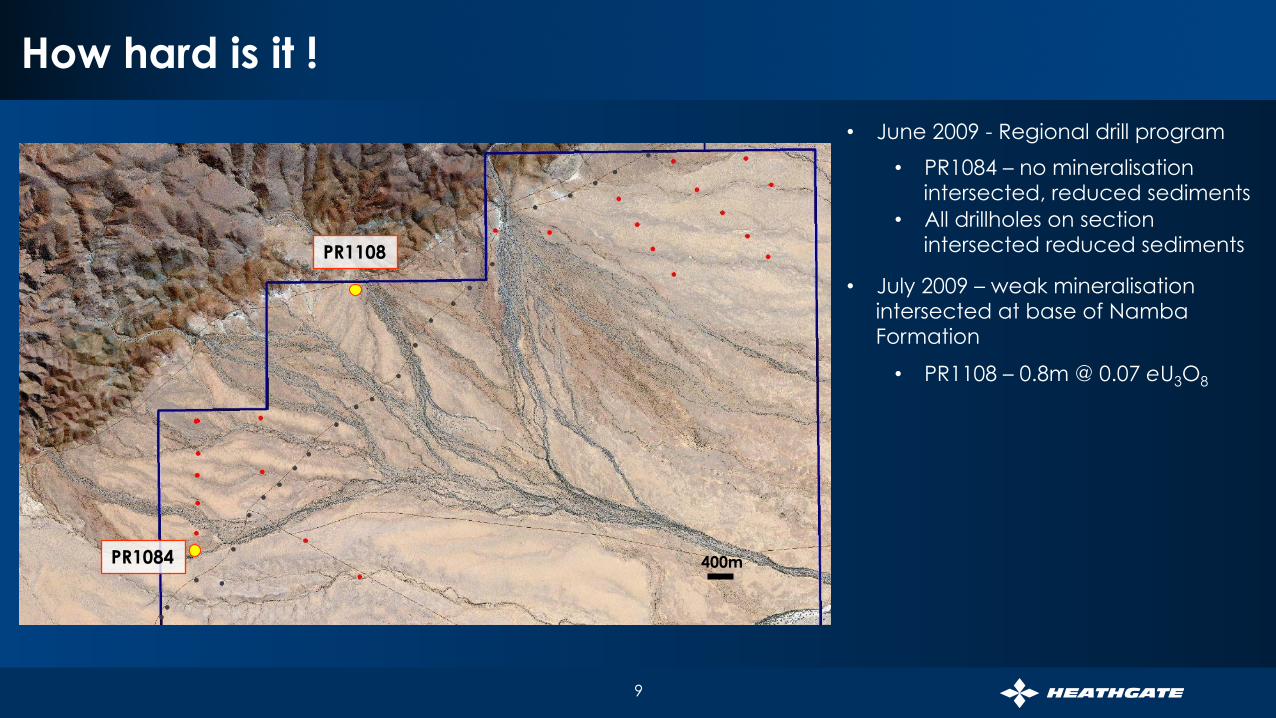
PR1108
• June 2009 - Regional drill program
• PR1084 – no mineralisation intersected, reduced sediments
• All drillholes on section intersected reduced sediments
• July 2009 – weak mineralisation intersected at base of Namba Formation
• PR1108 – 0.8m @ 0.07 eU3O8
PR1084 400m
10
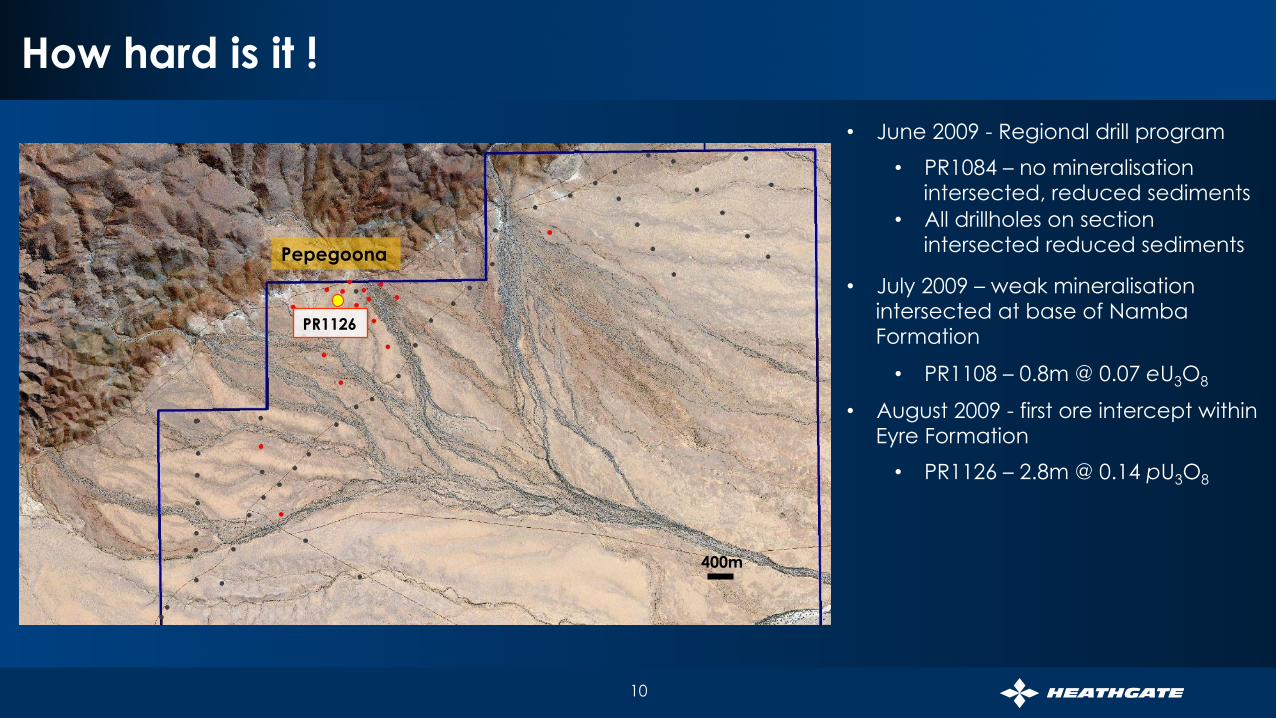
PR1126
• August 2009 - first ore intercept within Eyre Formation
• PR1126 – 2.8m @ 0.14 pU3O8
Pepegoona
How hard is it !
• June 2009 - Regional drill program
• PR1084 – no mineralisation intersected, reduced sediments
• All drillholes on section intersected reduced sediments
• July 2009 – weak mineralisation intersected at base of Namba Formation
• PR1108 – 0.8m @ 0.07 eU3O8
400m

11
PR1132
Pepegoona
• September 2009 - first major ore intercept
• PR1132 – 4.6m @ 0.36 pU3O8
• August 2009 - first ore intercept within Eyre Formation
• PR1126 – 2.8m @ 0.14 pU3O8
How hard is it !
• June 2009 - Regional drill program
• PR1084 – no mineralisation intersected, reduced sediments
• All drillholes on section intersected reduced sediments
• July 2009 – weak mineralisation intersected at base of Namba Formation
• PR1108 – 0.8m @ 0.07 eU3O8
400m

12
Pepegoona
• Further drilling defined Pepegoona Deposit
How hard is it !
• September 2009 - first major ore intercept
• PR1132 – 4.6m @ 0.36 pU3O8
• August 2009 - first ore intercept within Eyre Formation
• PR1126 – 2.8m @ 0.14 pU3O8
• June 2009 - Regional drill program
• PR1084 – no mineralisation intersected, reduced sediments
• All drillholes on section intersected reduced sediments
• July 2009 – weak mineralisation intersected at base of Namba Formation
• PR1108 – 0.8m @ 0.07 eU3O8
400m

13
• February 2010 – restart regional drill program
• PR1218 – no mineralisation intersected, reduced sediments
PR1218
Pepegoona
400m
How hard is it...to miss!

14
• February 2010 – restart regional drill program
• PR1218 – barren
PR1219
• March 2010 – first intercept At Pannikan
• PR1219 – 6.6m @ 0.24 pU3O8
400m
How hard is it...to miss!

15
• February 2010 – restart regional drill program
• PR1218 – barren
• March 2010 – first intercept At Pannikan
• PR1219 – 6.6m @ 0.24 pU3O8
• Pannikan drill out completed by end March 2010
Pepegoona
MISSED by <200m
400m
How hard is it...to miss!
Pannikan

16
Pannikan • Large “classic” roll front or wedge-shaped
“geochemical” cell encompassing nearly the entire Eyre succession
• Highest grades hosted by carbonaceous sands
• Multiple stacked rolls
Pepegoona West • Series of relatively competent multiple stacks of roll-
fronts hosted within the Eyre Formation
Pepegoona • Multiple stacked roll fronts (staggered)
• Hard to predict behavior due to the interference of abundant reductants (pyrite)
• Complex network of thinner, less competent roll fronts
Pepegoona
Beverley North Deposits

Pannikan Deposit
17
Downhole geophysical logs from wellfield drilling are correlated to enable grade and resource determination
Roll
Protore Limbs Roll
Limb

18
Statistical Analysis
• Statistical analysis of drill data is undertaken on;
• Grade
• Thickness
• GT
• DEF
to determine distribution, trends and correlations
• statistical analysis enables us to understand spatial relationships in order to properly use geostatistical methods
• roll front grade is very positively skewed and requires log normal kriging or multi-indicator kriging
PFN reading error
Is this indicative of another grade population?
Is high grade data missing
or Is this another population?

19
Geology Front Mapping – GT Contouring GT Contouring for Resource Estimation and Wellfield Planning
• Map • Redox-front • DEF • GT values • Interpreted roll-front characteristic

20
GT Contouring for Resource Estimation and Wellfield Planning
• Map • Redox-front • DEF • GT values • Interpreted roll-front characteristic
• Contour • Contour GT values • Each roll-front must be mapped separately
• Why GT Contouring
• Defines the geometry of the roll-front
• Cumulative GT
• doesn’t take into account the nature of the roll-fronts (e.g. stacked roll-fronts or sub-rolls)
• represents a 2D grade distribution but no continuity between roll-fronts especially when roll-fronts are of varying depth
• will over-estimate resource in early exploration stages of stacked fronts
Geology Front Mapping – GT Contouring
21
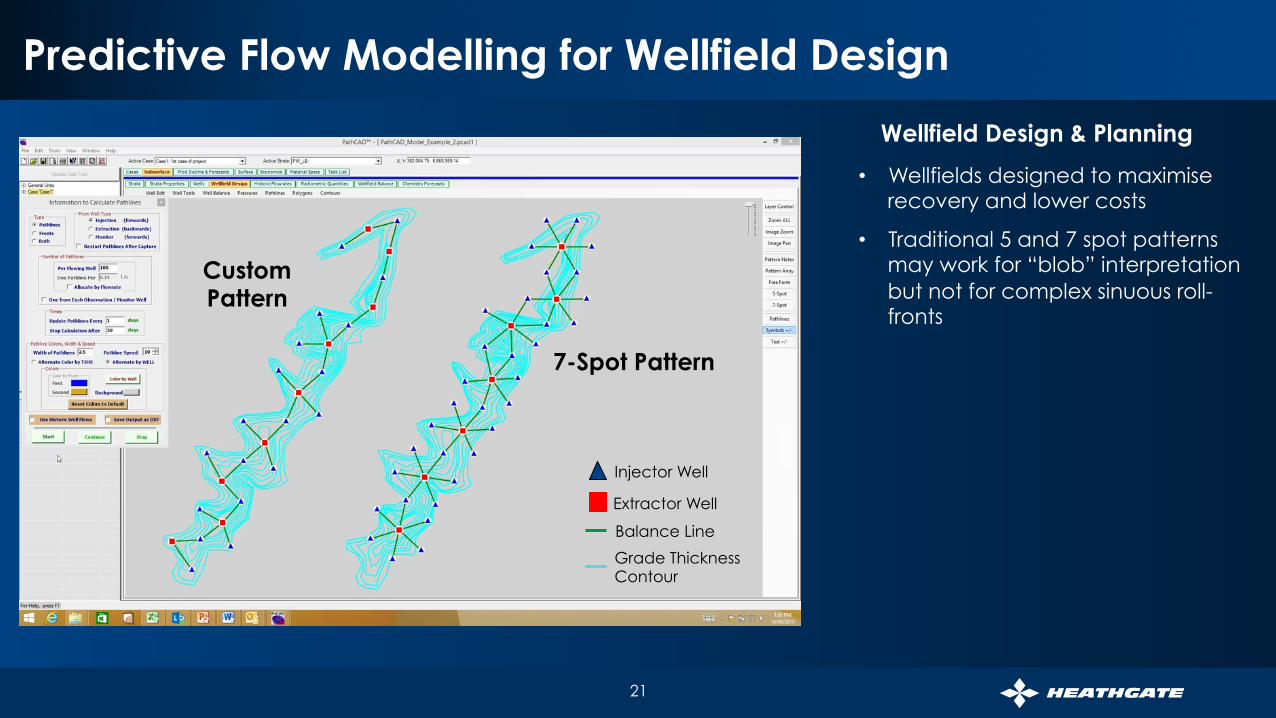
Predictive Flow Modelling for Wellfield Design
Injector Well
Extractor Well
Balance Line
Grade Thickness Contour
Wellfield Design & Planning
• Wellfields designed to maximise recovery and lower costs
• Traditional 5 and 7 spot patterns may work for “blob” interpretation but not for complex sinuous roll-fronts
Custom Pattern
7-Spot Pattern

22
Predictive Flow Modelling for Wellfield Design
Wellfield Design & Planning
• Wellfields designed to maximise recovery and lower costs
• Traditional 5 and 7 spot patterns may work for “blob” interpretation but not for complex sinuous roll-fronts
Injector Well
Extractor Well
Balance Line
Grade Thickness Contour
Custom Pattern
7-Spot Pattern

23
7-Spot Pattern
• 40 wells (7 extractors, 33 injectors)
• 30m well spacing
• Installation cost ~$3.6M
• Under leach ??
Injector Well
Extractor Well
Balance Line
Grade Thickness Contour
Custom Pattern
• 28 wells (9 extractors, 19 injectors)
• 28 – 34m well spacing
• Installation cost ~$2.52M
• Under leach ??
versus
Modelling Resource Under Leach
Custom Pattern
7-Spot Pattern

24
Custom Pattern
7-Spot Pattern
Mineralisation not initially swept is swept by later role reversals
7-Spot Pattern
• 40 wells (7 extractors, 33 injectors)
• 30m well spacing
• Installation cost * - $3.6M
• Under leach – 1,264,000 lbs
Custom Pattern
• 28 wells (9 extractors, 19 injectors)
• 28 – 34m well spacing
• Installation cost * - $2.52M
• Under leach – 1,323,000 lbs
versus
Injector Well
Extractor Well
Balance Line
Grade Thickness Contour
Modelling Resource Under Leach

Geophysics – Seismic Interpretation, Palaeochannels
25
POO
NTA
NA
FA
ULT
PO
ON
TAN
A F
AU
LT
Stratigraphy picked from drilling WEST EAST
POO
NTA
NA
FA
ULT
NAMBA
Channels
EYRE

Thankyou