2015 Bainbridge Report
21
Pleasant Beach Sunrise Eagledale Toe Jam Hill Lynwood Center Agate Point Edgecombe Meadowmeer Arrow Point Rockaway Euclid South Beach Upper Farms Grand Country Club Bainbridge Island Tolo Battle Point Hidden Cove West Port Madison Rolling Bay Yeomalt Bill Point Manzanita Baker Hill Fletcher Bay Winslow Crystal Springs Point White BAINBRIDGE REPORT presented by Dennis Paige 2015
-
Upload
dennis-paige -
Category
Documents
-
view
224 -
download
0
description
Â
Transcript of 2015 Bainbridge Report
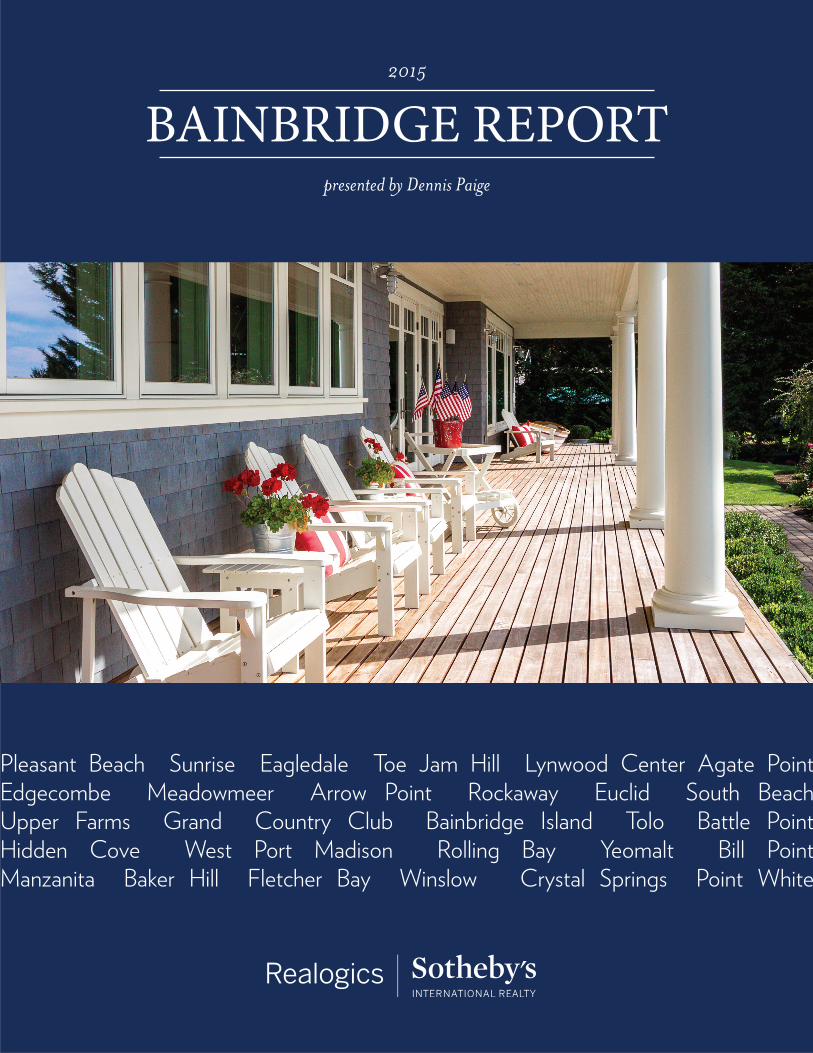
Pleasant Beach Sunrise Eagledale Toe Jam Hill Lynwood Center Agate PointEdgecombe Meadowmeer Arrow Point Rockaway Euclid South BeachUpper Farms Grand Country Club Bainbridge Island Tolo Battle PointHidden Cove West Port Madison Rolling Bay Yeomalt Bill PointManzanita Baker Hill Fletcher Bay Winslow Crystal Springs Point White
BAINBRIDGE REPORTpresented by Dennis Paige
2015
As one of the most successful brokers in the Bainbridge Island market, Dennis has long been respected by both clients and colleagues for his professionalism, discretion, and ability to accurately read a dynamic market. With an insider's knowledge of the Island, and a reputation for integrity and honesty, Dennis offers his clients an invaluable perspective when it comes to understanding the history and subtleties of the Island's neighborhoods. And with his proven business practices and over 25 years of experience on Bainbridge, he's served as a trusted advisor to hundreds of home buyers and sellers, establishing a track record very few other brokers can match.
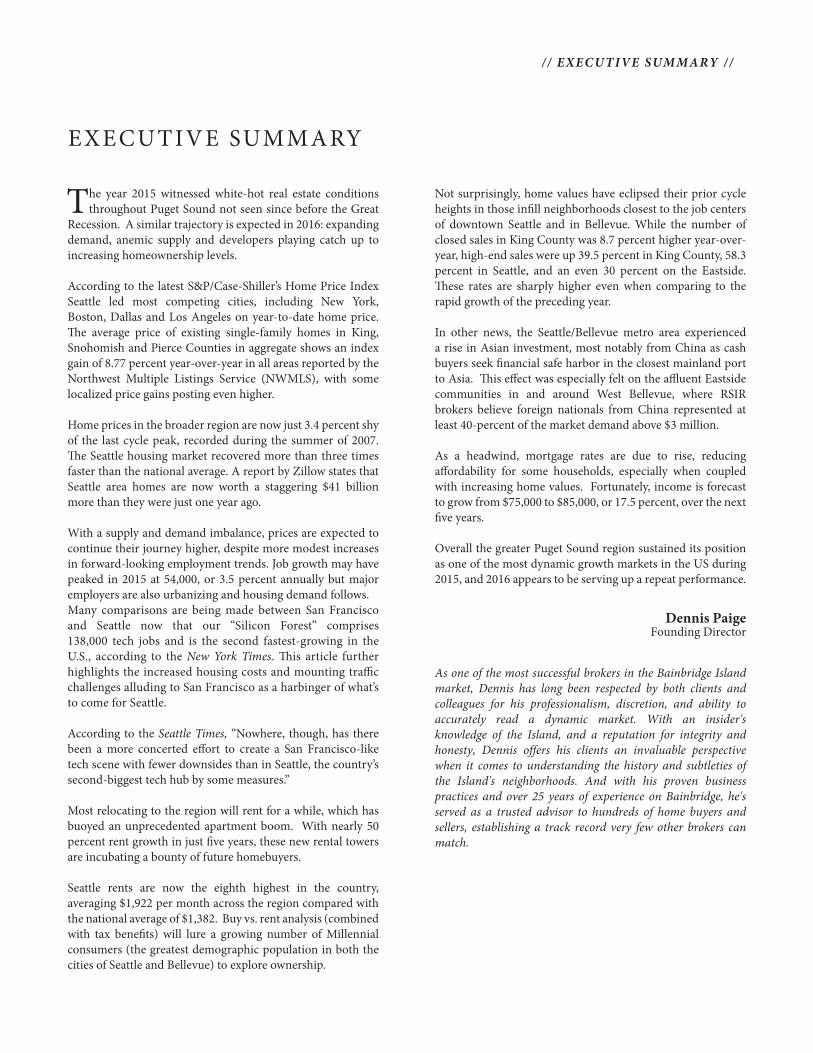
The year 2015 witnessed white-hot real estate conditionsthroughout Puget Sound not seen since before the Great
Recession. A similar trajectory is expected in 2016: expanding demand, anemic supply and developers playing catch up to increasing homeownership levels.
According to the latest S&P/Case-Shiller’s Home Price Index Seattle led most competing cities, including New York, Boston, Dallas and Los Angeles on year-to-date home price. The average price of existing single-family homes in King, Snohomish and Pierce Counties in aggregate shows an index gain of 8.77 percent year-over-year in all areas reported by the Northwest Multiple Listings Service (NWMLS), with some localized price gains posting even higher.
Home prices in the broader region are now just 3.4 percent shy of the last cycle peak, recorded during the summer of 2007. The Seattle housing market recovered more than three times faster than the national average. A report by Zillow states that Seattle area homes are now worth a staggering $41 billion more than they were just one year ago.
With a supply and demand imbalance, prices are expected to continue their journey higher, despite more modest increases in forward-looking employment trends. Job growth may have peaked in 2015 at 54,000, or 3.5 percent annually but major employers are also urbanizing and housing demand follows. Many comparisons are being made between San Francisco and Seattle now that our “Silicon Forest” comprises 138,000 tech jobs and is the second fastest-growing in the U.S., according to the New York Times. This article furtherhighlights the increased housing costs and mounting trafficchallenges alluding to San Francisco as a harbinger of what’sto come for Seattle.
According to the Seattle Times, “Nowhere, though, has there been a more concerted effort to create a San Francisco-like tech scene with fewer downsides than in Seattle, the country’s second-biggest tech hub by some measures.”
Most relocating to the region will rent for a while, which has buoyed an unprecedented apartment boom. With nearly 50 percent rent growth in just five years, these new rental towers are incubating a bounty of future homebuyers.
Seattle rents are now the eighth highest in the country, averaging $1,922 per month across the region compared with the national average of $1,382. Buy vs. rent analysis (combined with tax benefits) will lure a growing number of Millennial consumers (the greatest demographic population in both the cities of Seattle and Bellevue) to explore ownership.
Not surprisingly, home values have eclipsed their prior cycle heights in those infill neighborhoods closest to the job centers of downtown Seattle and in Bellevue. While the number of closed sales in King County was 8.7 percent higher year-over-year, high-end sales were up 39.5 percent in King County, 58.3 percent in Seattle, and an even 30 percent on the Eastside. These rates are sharply higher even when comparing to the rapid growth of the preceding year.
In other news, the Seattle/Bellevue metro area experienced a rise in Asian investment, most notably from China as cash buyers seek financial safe harbor in the closest mainland port to Asia. This effect was especially felt on the affluent Eastside communities in and around West Bellevue, where RSIR brokers believe foreign nationals from China represented at least 40-percent of the market demand above $3 million.
As a headwind, mortgage rates are due to rise, reducing affordability for some households, especially when coupled with increasing home values. Fortunately, income is forecast to grow from $75,000 to $85,000, or 17.5 percent, over the next five years.
Overall the greater Puget Sound region sustained its position as one of the most dynamic growth markets in the US during 2015, and 2016 appears to be serving up a repeat performance.
EXECUTIVE SUMMARY
Dennis Paige Founding Director
/ / EXECUTIVE SUMMARY //
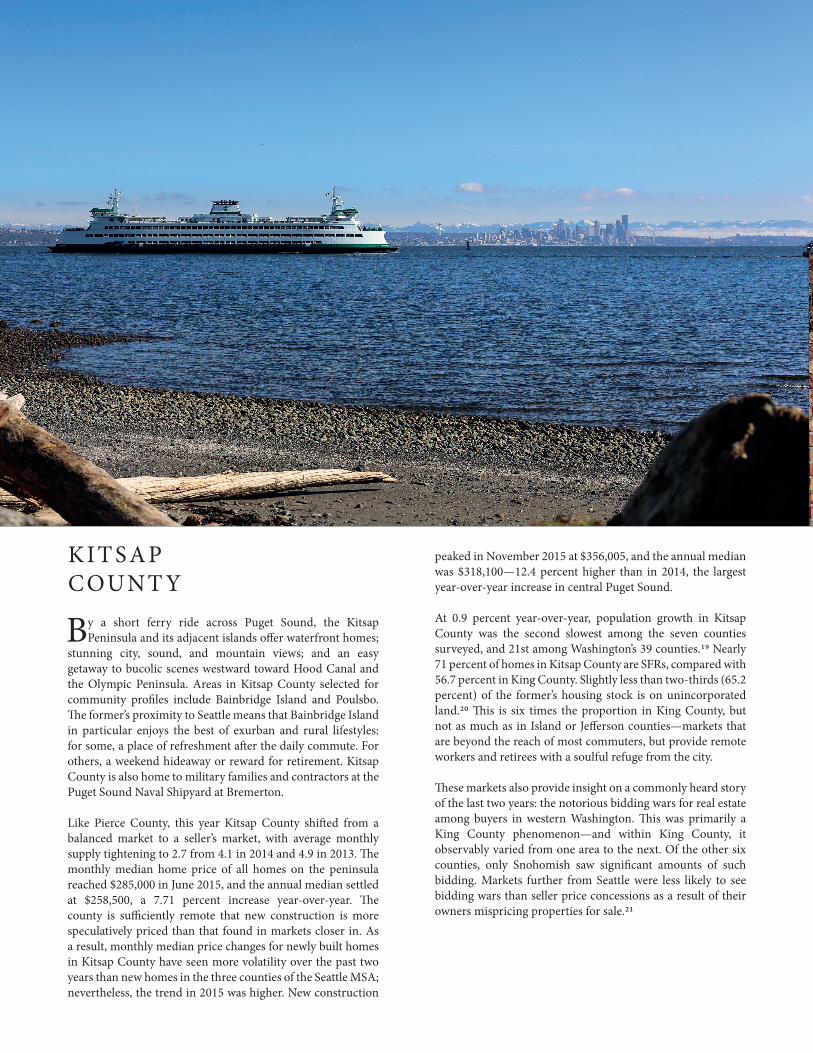
By a short ferry ride across Puget Sound, the KitsapPeninsula and its adjacent islands offer waterfront homes;
stunning city, sound, and mountain views; and an easy getaway to bucolic scenes westward toward Hood Canal and the Olympic Peninsula. Areas in Kitsap County selected for community profiles include Bainbridge Island and Poulsbo. The former’s proximity to Seattle means that Bainbridge Island in particular enjoys the best of exurban and rural lifestyles: for some, a place of refreshment after the daily commute. For others, a weekend hideaway or reward for retirement. Kitsap County is also home to military families and contractors at the Puget Sound Naval Shipyard at Bremerton.
Like Pierce County, this year Kitsap County shifted from a balanced market to a seller’s market, with average monthly supply tightening to 2.7 from 4.1 in 2014 and 4.9 in 2013. The monthly median home price of all homes on the peninsula reached $285,000 in June 2015, and the annual median settled at $258,500, a 7.71 percent increase year-over-year. The county is sufficiently remote that new construction is more speculatively priced than that found in markets closer in. As a result, monthly median price changes for newly built homes in Kitsap County have seen more volatility over the past two years than new homes in the three counties of the Seattle MSA; nevertheless, the trend in 2015 was higher. New construction
peaked in November 2015 at $356,005, and the annual median was $318,100—12.4 percent higher than in 2014, the largest year-over-year increase in central Puget Sound.
At 0.9 percent year-over-year, population growth in Kitsap County was the second slowest among the seven counties surveyed, and 21st among Washington’s 39 counties.19 Nearly 71 percent of homes in Kitsap County are SFRs, compared with 56.7 percent in King County. Slightly less than two-thirds (65.2 percent) of the former’s housing stock is on unincorporated land.20 This is six times the proportion in King County, but not as much as in Island or Jefferson counties—markets that are beyond the reach of most commuters, but provide remote workers and retirees with a soulful refuge from the city.
These markets also provide insight on a commonly heard story of the last two years: the notorious bidding wars for real estate among buyers in western Washington. This was primarily a King County phenomenon—and within King County, it observably varied from one area to the next. Of the other six counties, only Snohomish saw significant amounts of such bidding. Markets further from Seattle were less likely to see bidding wars than seller price concessions as a result of their owners mispricing properties for sale.21
KIT SAPC OUNT Y
/ / COMMUNITY REPORT S / /
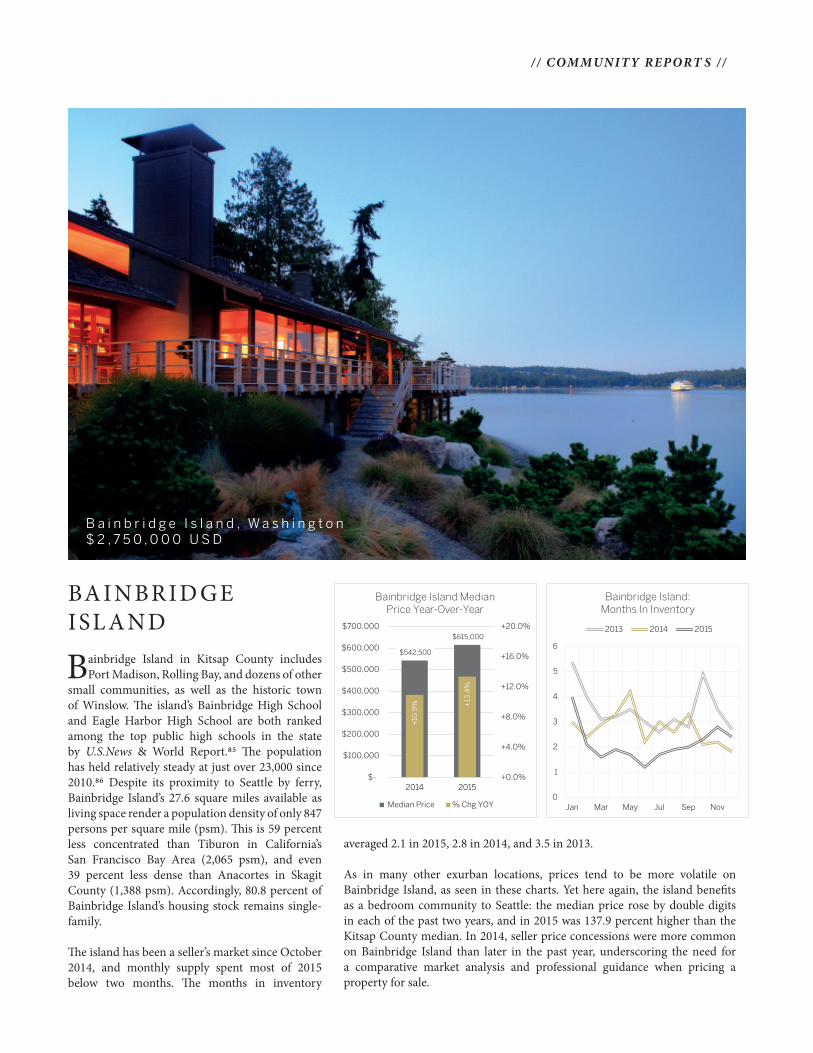
Bainbridge Island in Kitsap County includesPort Madison, Rolling Bay, and dozens of other
small communities, as well as the historic town of Winslow. The island’s Bainbridge High School and Eagle Harbor High School are both ranked among the top public high schools in the state by U.S.News & World Report.85 The population has held relatively steady at just over 23,000 since 2010.86 Despite its proximity to Seattle by ferry, Bainbridge Island’s 27.6 square miles available as living space render a population density of only 847 persons per square mile (psm). This is 59 percent less concentrated than Tiburon in California’s San Francisco Bay Area (2,065 psm), and even 39 percent less dense than Anacortes in Skagit County (1,388 psm). Accordingly, 80.8 percent of Bainbridge Island’s housing stock remains single-family.
The island has been a seller’s market since October 2014, and monthly supply spent most of 2015 below two months. The months in inventory
averaged 2.1 in 2015, 2.8 in 2014, and 3.5 in 2013.
As in many other exurban locations, prices tend to be more volatile on Bainbridge Island, as seen in these charts. Yet here again, the island benefits as a bedroom community to Seattle: the median price rose by double digits in each of the past two years, and in 2015 was 137.9 percent higher than the Kitsap County median. In 2014, seller price concessions were more common on Bainbridge Island than later in the past year, underscoring the need for a comparative market analysis and professional guidance when pricing a property for sale.
BAINBRID GE ISL AND
B a i n b r i d g e I s l a n d , W a s h i n g t o n$ 2 , 7 5 0 , 0 0 0 U S D
0
1
2
3
4
5
6
Jan Mar May Jul Sep Nov
Bainbridge Island:Months In Inventory
2013 2014 2015
$542,500
$615,000
+10
.9% +
13.4
%
+0.0%
+4.0%
+8.0%
+12.0%
+16.0%
+20.0%
$-
$100,000
$200,000
$300,000
$400,000
$500,000
$600,000
$700,000
2014 2015
Bainbridge Island Median Price Year-Over-Year
Median Price % Chg YOY
0
1
2
3
4
Jan Mar May Jul Sep Nov
Southeast Seattle: Months In Inventory
2013 2014 2015
$380,000
$438,750
+8
.0%
+15
.5%
+0.0%
+4.0%
+8.0%
+12.0%
+16.0%
+20.0%
$-
$50,000
$100,000
$150,000
$200,000
$250,000
$300,000
$350,000
$400,000
$450,000
$500,000
2014 2015
Southeast Seattle Median PriceYear-Over-Year
Median Price % Chg YOY
0
1
2
3
4
Jan Mar May Jul Sep Nov
Central Seattle: Months InInventory
2013 2014 2015
$495,000
$550,000
+9
.0% +
11.1
%
+0.0%
+4.0%
+8.0%
+12.0%
+16.0%
+20.0%
$-
$100,000
$200,000
$300,000
$400,000
$500,000
$600,000
2014 2015
Central Seattle Median PriceYear-Over-Year
Median Price % Chg YOY
0
1
2
3
4
5
6
Jan Mar May Jul Sep Nov
Bainbridge Island: Months In Inventory
2013 2014 2015
$542,500
$615,000
+10
.9% +
13.4
%
+0.0%
+4.0%
+8.0%
+12.0%
+16.0%
+20.0%
$-
$100,000
$200,000
$300,000
$400,000
$500,000
$600,000
$700,000
2014 2015
Bainbridge Island Median Price Year-Over-Year
Median Price % Chg YOY
0
1
2
3
4
Jan Mar May Jul Sep Nov
Southeast Seattle: Months In Inventory
2013 2014 2015
$380,000
$438,750
+8
.0%
+15
.5%
+0.0%
+4.0%
+8.0%
+12.0%
+16.0%
+20.0%
$-
$50,000
$100,000
$150,000
$200,000
$250,000
$300,000
$350,000
$400,000
$450,000
$500,000
2014 2015
Southeast Seattle Median PriceYear-Over-Year
Median Price % Chg YOY
0
1
2
3
4
Jan Mar May Jul Sep Nov
Central Seattle: Months InInventory
2013 2014 2015
$495,000
$550,000
+9
.0% +
11.1
%
+0.0%
+4.0%
+8.0%
+12.0%
+16.0%
+20.0%
$-
$100,000
$200,000
$300,000
$400,000
$500,000
$600,000
2014 2015
Central Seattle Median PriceYear-Over-Year
Median Price % Chg YOY
/ / COMMUNITY REPORT S / /
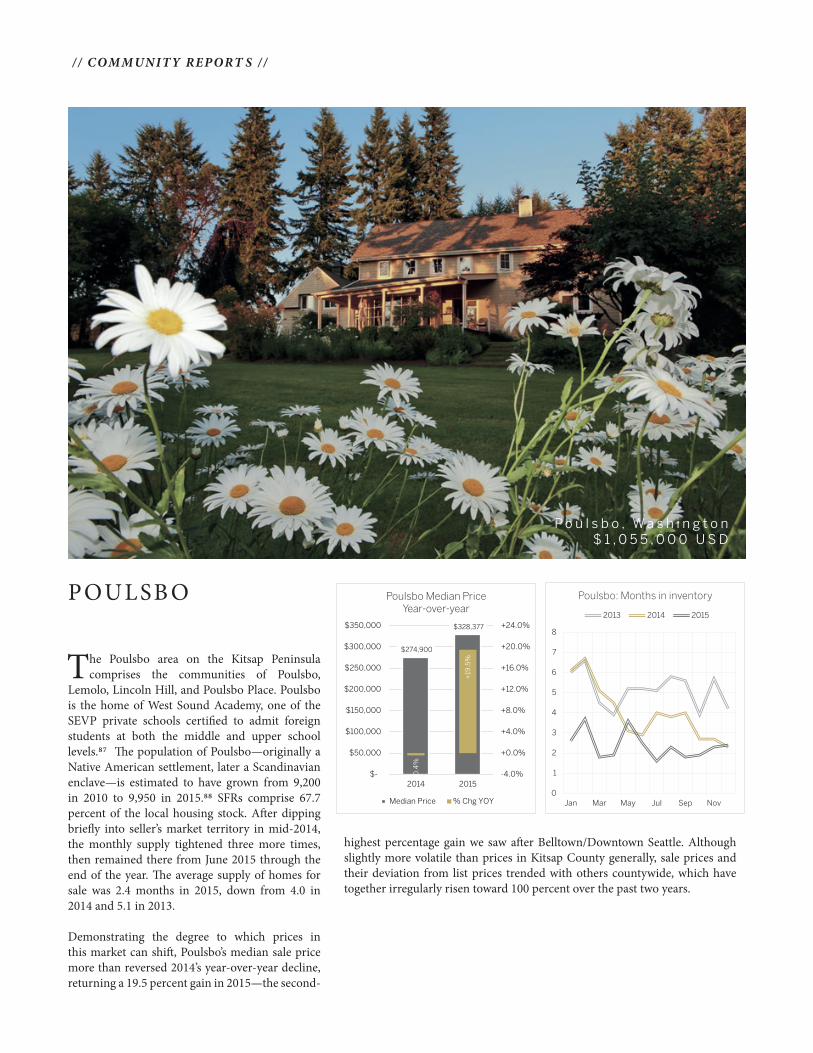
The Poulsbo area on the Kitsap Peninsulacomprises the communities of Poulsbo,
Lemolo, Lincoln Hill, and Poulsbo Place. Poulsbo is the home of West Sound Academy, one of the SEVP private schools certified to admit foreign students at both the middle and upper school levels.87 The population of Poulsbo—originally a Native American settlement, later a Scandinavian enclave—is estimated to have grown from 9,200 in 2010 to 9,950 in 2015.88 SFRs comprise 67.7 percent of the local housing stock. After dipping briefly into seller’s market territory in mid-2014, the monthly supply tightened three more times, then remained there from June 2015 through the end of the year. The average supply of homes for sale was 2.4 months in 2015, down from 4.0 in 2014 and 5.1 in 2013.
Demonstrating the degree to which prices in this market can shift, Poulsbo’s median sale price more than reversed 2014’s year-over-year decline, returning a 19.5 percent gain in 2015—the second-
highest percentage gain we saw after Belltown/Downtown Seattle. Although slightly more volatile than prices in Kitsap County generally, sale prices and their deviation from list prices trended with others countywide, which have together irregularly risen toward 100 percent over the past two years.
POULSB O
P o u l s b o , W a s h i n g t o n$ 1 , 0 5 5 , 0 0 0 U S D
0
1
2
3
4
5
Jan Mar May Jul Sep Nov
Burien/Normandy Park:Months In Inventory
2013 2014 2015
$244,950
$287,000
+9
.8%
+17
.2%
+0.0%
+4.0%
+8.0%
+12.0%
+16.0%
+20.0%
$-
$50,000
$100,000
$150,000
$200,000
$250,000
$300,000
2014 2015
Burien/Normandy Park Median Price Year-Over-Year
Median Price % Chg YOY
0
1
2
3
4
5
Jan Mar May Jul Sep Nov
West Seattle: Months In Inventory
2013 2014 2015
$385,000
$435,000
+6
.9%
+13
.0%
+0.0%
+4.0%
+8.0%
+12.0%
+16.0%
+20.0%
+24.0%
$-
$50,000
$100,000
$150,000
$200,000
$250,000
$300,000
$350,000
$400,000
$450,000
$500,000
2014 2015
West Seattle Median Price Year-Over-Year
Median Price % Chg YOY
0
1
2
3
4
5
6
7
8
Jan Mar May Jul Sep Nov
Poulsbo: Months in inventory
2013 2014 2015
$274,900
$328,377
-0.4
%
+19
.5%
-4.0%
+0.0%
+4.0%
+8.0%
+12.0%
+16.0%
+20.0%
+24.0%
$-
$50,000
$100,000
$150,000
$200,000
$250,000
$300,000
$350,000
2014 2015
Poulsbo Median Price Year-over-year
Median Price % Chg YOY
0
1
2
3
4
5
Jan Mar May Jul Sep Nov
Burien/Normandy Park:Months In Inventory
2013 2014 2015
$244,950
$287,000
+9
.8%
+17
.2%
+0.0%
+4.0%
+8.0%
+12.0%
+16.0%
+20.0%
$-
$50,000
$100,000
$150,000
$200,000
$250,000
$300,000
2014 2015
Burien/Normandy Park Median Price Year-Over-Year
Median Price % Chg YOY
0
1
2
3
4
5
Jan Mar May Jul Sep Nov
West Seattle: Months In Inventory
2013 2014 2015
$385,000
$435,000 +
6.9
%
+13
.0%
+0.0%
+4.0%
+8.0%
+12.0%
+16.0%
+20.0%
+24.0%
$-
$50,000
$100,000
$150,000
$200,000
$250,000
$300,000
$350,000
$400,000
$450,000
$500,000
2014 2015
West Seattle Median Price Year-Over-Year
Median Price % Chg YOY
0
1
2
3
4
5
6
7
8
Jan Mar May Jul Sep Nov
Poulsbo: Months in inventory
2013 2014 2015
$274,900
$328,377
-0.4
%
+19
.5%
-4.0%
+0.0%
+4.0%
+8.0%
+12.0%
+16.0%
+20.0%
+24.0%
$-
$50,000
$100,000
$150,000
$200,000
$250,000
$300,000
$350,000
2014 2015
Poulsbo Median PriceYear-over-year
Median Price % Chg YOY
10FORTUNE 500 COMPANIESKING
C OUNT YANNUAL REPORT
HO
ME
TO A
LL T
EN O
F W
ASH
ING
TON
STA
TE’S
FO
RTU
NE
500
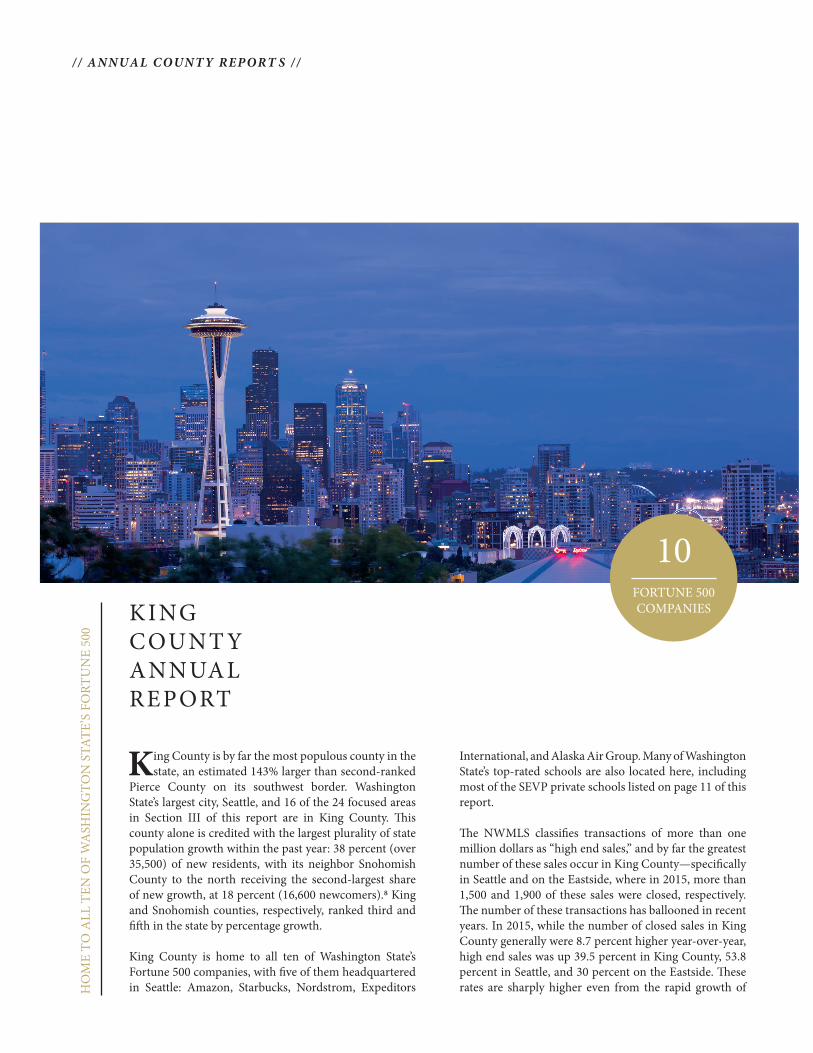
King County is by far the most populous county in the state, an estimated 143% larger than second-ranked
Pierce County on its southwest border. Washington State’s largest city, Seattle, and 16 of the 24 focused areas in Section III of this report are in King County. This county alone is credited with the largest plurality of state population growth within the past year: 38 percent (over 35,500) of new residents, with its neighbor Snohomish County to the north receiving the second-largest share of new growth, at 18 percent (16,600 newcomers).8 King and Snohomish counties, respectively, ranked third and fifth in the state by percentage growth.
King County is home to all ten of Washington State’s Fortune 500 companies, with five of them headquartered in Seattle: Amazon, Starbucks, Nordstrom, Expeditors
International, and Alaska Air Group. Many of Washington State’s top-rated schools are also located here, including most of the SEVP private schools listed on page 11 of this report.
The NWMLS classifies transactions of more than one million dollars as “high end sales,” and by far the greatest number of these sales occur in King County—specifically in Seattle and on the Eastside, where in 2015, more than 1,500 and 1,900 of these sales were closed, respectively. The number of these transactions has ballooned in recent years. In 2015, while the number of closed sales in King County generally were 8.7 percent higher year-over-year, high end sales was up 39.5 percent in King County, 53.8 percent in Seattle, and 30 percent on the Eastside. These rates are sharply higher even from the rapid growth of
/ / ANNUAL COUNTY REPORT S / /
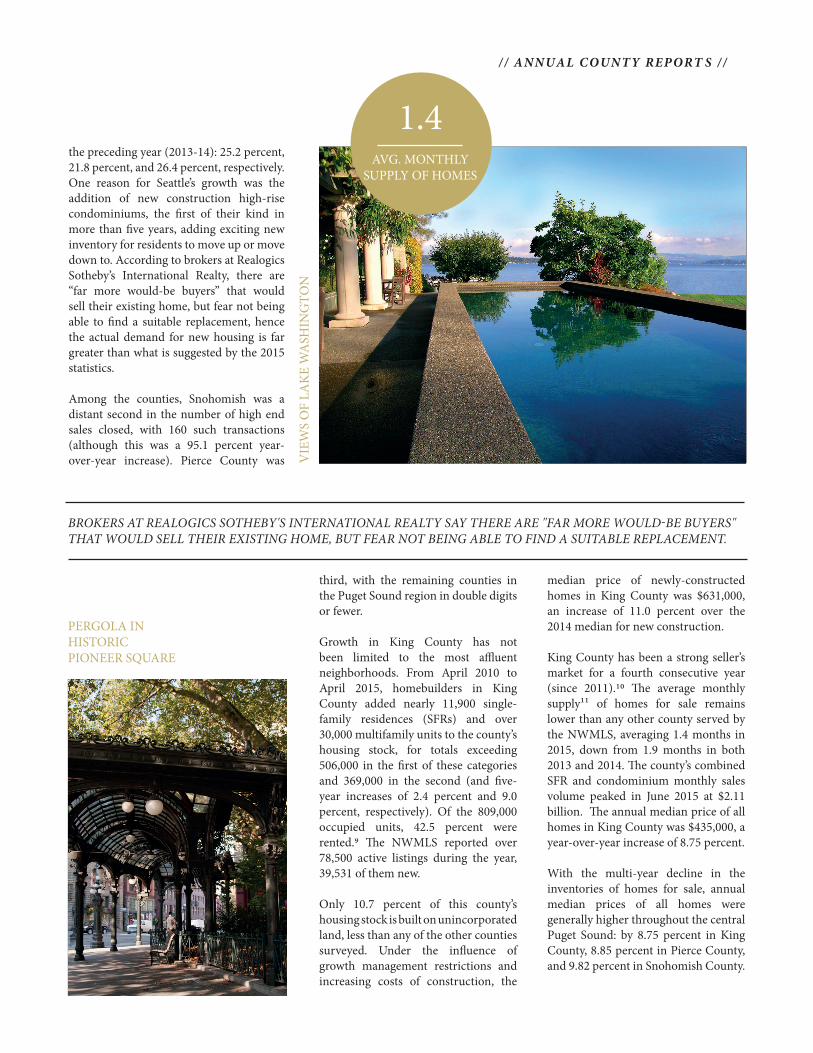
1.4AVG. MONTHLY
SUPPLY OF HOMES
VIE
WS
OF
LAK
E W
ASH
ING
TON
BROKERS AT REALOGICS SOTHEBY'S INTERNATIONAL REALTY SAY THERE ARE "FAR MORE WOULD-BE BUYERS" THAT WOULD SELL THEIR EXISTING HOME, BUT FEAR NOT BEING ABLE TO FIND A SUITABLE REPLACEMENT.
third, with the remaining counties in the Puget Sound region in double digits or fewer.
Growth in King County has not been limited to the most affluent neighborhoods. From April 2010 to April 2015, homebuilders in King County added nearly 11,900 single-family residences (SFRs) and over 30,000 multifamily units to the county’s housing stock, for totals exceeding 506,000 in the first of these categories and 369,000 in the second (and five-year increases of 2.4 percent and 9.0 percent, respectively). Of the 809,000 occupied units, 42.5 percent were rented.9 The NWMLS reported over 78,500 active listings during the year, 39,531 of them new.
Only 10.7 percent of this county’s housing stock is built on unincorporated land, less than any of the other counties surveyed. Under the influence of growth management restrictions and increasing costs of construction, the
the preceding year (2013-14): 25.2 percent, 21.8 percent, and 26.4 percent, respectively. One reason for Seattle’s growth was the addition of new construction high-rise condominiums, the first of their kind in more than five years, adding exciting new inventory for residents to move up or move down to. According to brokers at Realogics Sotheby’s International Realty, there are “far more would-be buyers” that would sell their existing home, but fear not being able to find a suitable replacement, hence the actual demand for new housing is far greater than what is suggested by the 2015 statistics.
Among the counties, Snohomish was a distant second in the number of high end sales closed, with 160 such transactions (although this was a 95.1 percent year-over-year increase). Pierce County was
median price of newly-constructed homes in King County was $631,000, an increase of 11.0 percent over the 2014 median for new construction.
King County has been a strong seller’s market for a fourth consecutive year (since 2011).10 The average monthly supply11 of homes for sale remains lower than any other county served by the NWMLS, averaging 1.4 months in 2015, down from 1.9 months in both 2013 and 2014. The county’s combined SFR and condominium monthly sales volume peaked in June 2015 at $2.11 billion. The annual median price of all homes in King County was $435,000, a year-over-year increase of 8.75 percent.
With the multi-year decline in the inventories of homes for sale, annual median prices of all homes were generally higher throughout the central Puget Sound: by 8.75 percent in King County, 8.85 percent in Pierce County, and 9.82 percent in Snohomish County.
PERGOLA IN HISTORIC PIONEER SQUARE
/ / ANNUAL COUNTY REPORT S / /
REAL ESTATE ACTIVITY
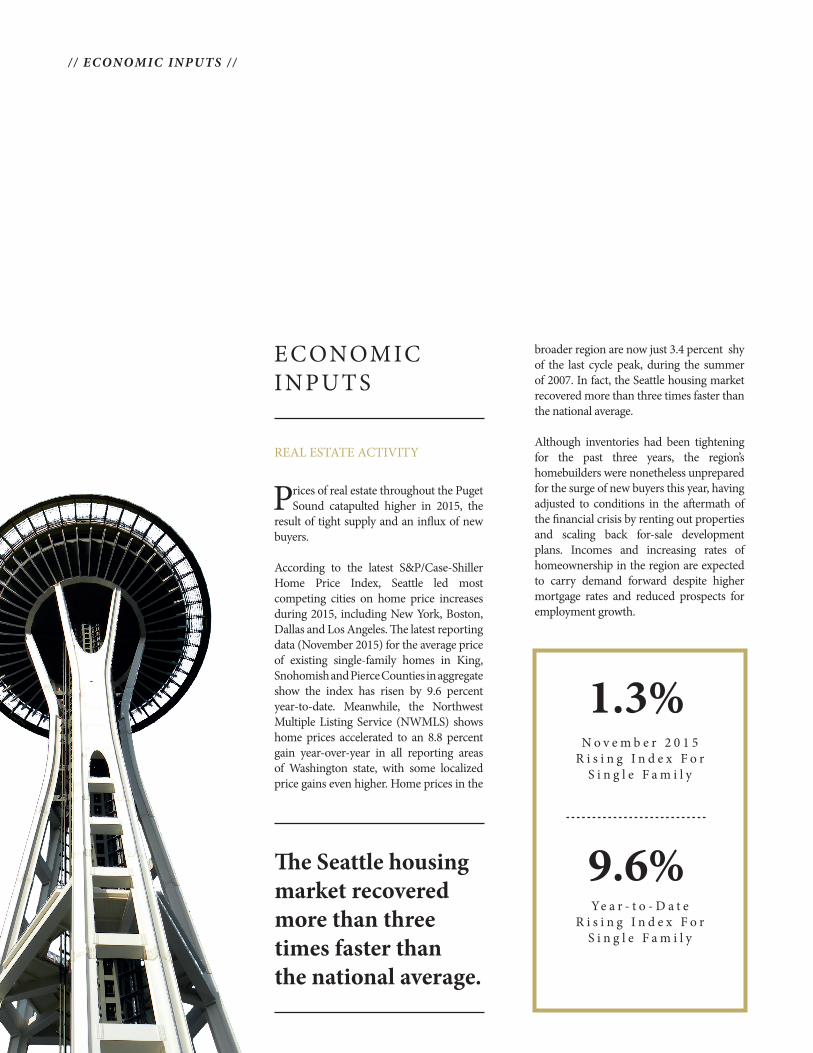
Prices of real estate throughout the PugetSound catapulted higher in 2015, the
result of tight supply and an influx of new buyers.
According to the latest S&P/Case-Shiller Home Price Index, Seattle led most competing cities on home price increases during 2015, including New York, Boston, Dallas and Los Angeles. The latest reporting data (November 2015) for the average price of existing single-family homes in King, Snohomish and Pierce Counties in aggregate show the index has risen by 9.6 percent year-to-date. Meanwhile, the Northwest Multiple Listing Service (NWMLS) shows home prices accelerated to an 8.8 percent gain year-over-year in all reporting areas of Washington state, with some localized price gains even higher. Home prices in the
broader region are now just 3.4 percent shy of the last cycle peak, during the summer of 2007. In fact, the Seattle housing market recovered more than three times faster than the national average.
Although inventories had been tightening for the past three years, the region’s homebuilders were nonetheless unprepared for the surge of new buyers this year, having adjusted to conditions in the aftermath of the financial crisis by renting out properties and scaling back for-sale development plans. Incomes and increasing rates of homeownership in the region are expected to carry demand forward despite higher mortgage rates and reduced prospects for employment growth.
The Seattle housing market recovered more than three times faster than the national average.
Ye a r - t o - D a t eR i s i n g I n d e x F o r
S i n g l e F a m i l y
9.6%
N o v e m b e r 2 0 1 5 R i s i n g I n d e x F o r
S i n g l e F a m i l y
1.3%
EC ONOMIC INPUT S
/ / ECONOMIC INPUTS //
The Puget Sound region has taken a different path from other boomtowns in North America whose economies are based
on resource extraction (e.g., oil), financial intermediation, or entertainment. Here, Seattle’s aerospace industry has gradually yielded its eminence to the service expansion and new product development cycles of the information tech industry—driven by leaders such as Amazon, Tableau, and F5 Networks—and their secondary employment effects on IT contractors, food & beverage businesses, and real estate developers.
Office space demand is back to pre-recessionary levels. This is being partially met, though not filled, by new projects in the pipeline. According to a report by commercial real estate broker Jones Lang LaSalle,1 in Seattle and Bellevue over the next two years, over 5.9 million square feet of office space is scheduled to open, but only 35.1 percent of the space has been preleased.
New office space is not inexpensive. The average asking rent is $48.50 per square foot per year, including expenses. That's a 42.7 percent premium over the average asking rate for all office space in the region.
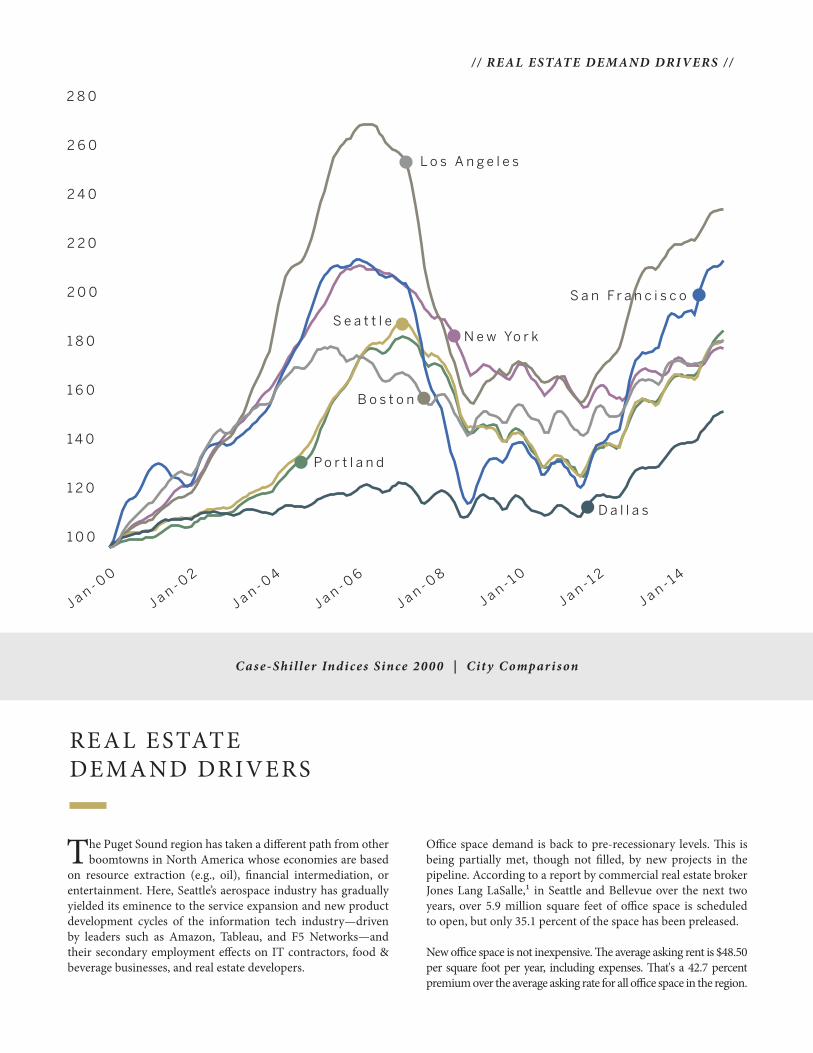
Case-Shi l ler Indices Since 2000 | Cit y Compar i son
S e a t t l e
S a n F r a n c i s c o
L o s A n g e l e s
D a l l a s
B o s t o n
N e w Yo r k
P o r t l a n d
2 2 0
2 0 0
1 8 0
1 6 0
2 8 0
1 4 0
2 6 0
1 2 0
2 4 0
1 0 0
REAL ESTATE DEMAND DRIVERS
/ / REAL ESTATE DEMAND DRIVERS //
C ONTINUED | REAL ESTATE DEMAND DRIVERS
an average of $117,000 per year. The same report showed nearly 54,000 of the region’s workers in the architecture and engineering professions, including 8,460 aerospace engineers.5
These employment sectors, which have enabled the
Puget Sound region to compete with other U.S. industrial centers for domestic homebuyers, have proven resilient in past recessions. They may need to prove that resilience again soon. Complicating the picture for households are the effects of tighter home lending. Mortgage rates are due to rise, reducing affordability for some households when coupled with increasing home values. The current rate of homeownership is low. Single-family home prices increased 8.2 percent over the year, compared with an increase of 5.5 percent in the Case-Shiller 20-City Index.
Despite increasing prices, homeowner-ship is expected to increase in localized areas. Income growth is strong; Seattle median income is forecast to grow from
Even with all this space coming to the market, it still looks as though landlords are in the driver's seat, because companies are looking for a total of 8 million square feet — and the region's vacancy rate of 10.2 percent is the lowest seen since 2007.
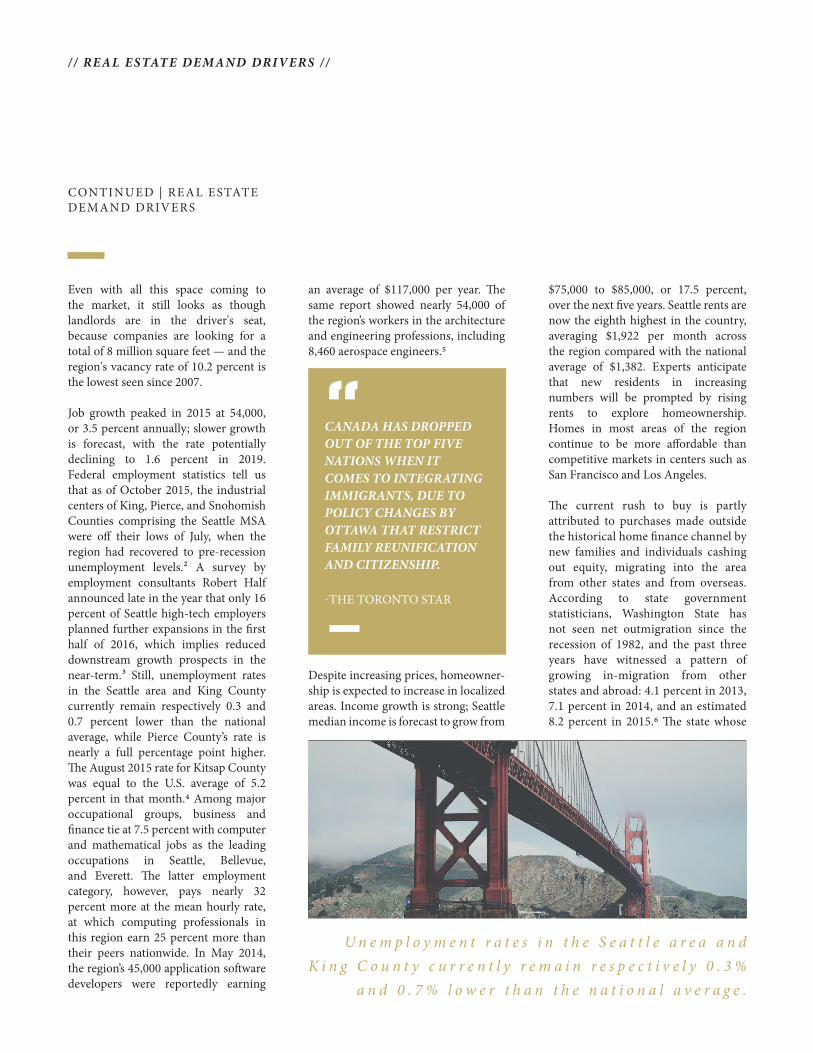
Job growth peaked in 2015 at 54,000, or 3.5 percent annually; slower growth is forecast, with the rate potentially declining to 1.6 percent in 2019. Federal employment statistics tell us that as of October 2015, the industrial centers of King, Pierce, and Snohomish Counties comprising the Seattle MSA were off their lows of July, when the region had recovered to pre-recession unemployment levels.2 A survey by employment consultants Robert Half announced late in the year that only 16 percent of Seattle high-tech employers planned further expansions in the first half of 2016, which implies reduced downstream growth prospects in the near-term.3 Still, unemployment rates in the Seattle area and King County currently remain respectively 0.3 and 0.7 percent lower than the national average, while Pierce County’s rate is nearly a full percentage point higher. The August 2015 rate for Kitsap County was equal to the U.S. average of 5.2 percent in that month.4 Among major occupational groups, business and finance tie at 7.5 percent with computer and mathematical jobs as the leading occupations in Seattle, Bellevue, and Everett. The latter employment category, however, pays nearly 32 percent more at the mean hourly rate, at which computing professionals in this region earn 25 percent more than their peers nationwide. In May 2014, the region’s 45,000 application software developers were reportedly earning
U n e m p l o y m e n t r a t e s i n t h e S e a t t l e a r e a a n d K i n g C o u n t y c u r r e n t l y r e m a i n r e s p e c t i v e l y 0 . 3 %
a n d 0 . 7 % l o w e r t h a n t h e n a t i o n a l a v e r a g e .
$75,000 to $85,000, or 17.5 percent, over the next five years. Seattle rents are now the eighth highest in the country, averaging $1,922 per month across the region compared with the national average of $1,382. Experts anticipate that new residents in increasing numbers will be prompted by rising rents to explore homeownership. Homes in most areas of the region continue to be more affordable than competitive markets in centers such as San Francisco and Los Angeles.
The current rush to buy is partly attributed to purchases made outside the historical home finance channel by new families and individuals cashing out equity, migrating into the area from other states and from overseas. According to state government statisticians, Washington State has not seen net outmigration since the recession of 1982, and the past three years have witnessed a pattern of growing in-migration from other states and abroad: 4.1 percent in 2013, 7.1 percent in 2014, and an estimated 8.2 percent in 2015.6 The state whose
CANADA HAS DROPPED OUT OF THE TOP FIVE NATIONS WHEN IT COMES TO INTEGRATING IMMIGRANTS, DUE TO POLICY CHANGES BY OTTAWA THAT RESTRICT FAMILY REUNIFICATION AND CITIZENSHIP.
-THE TORONTO STAR
/ / REAL ESTATE DEMAND DRIVERS //
The past three years have witnessed a pattern of growing in-migration.
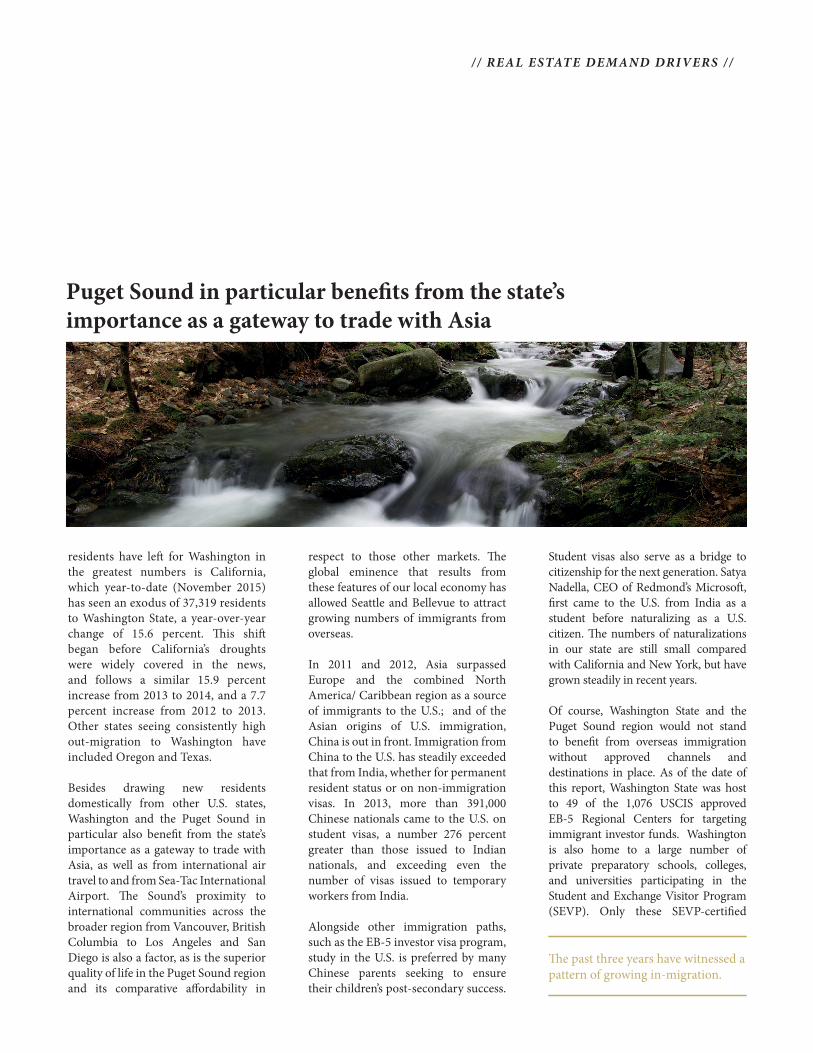
Puget Sound in particular benefits from the state’s importance as a gateway to trade with Asia
residents have left for Washington in the greatest numbers is California, which year-to-date (November 2015) has seen an exodus of 37,319 residents to Washington State, a year-over-year change of 15.6 percent. This shift began before California’s droughts were widely covered in the news, and follows a similar 15.9 percent increase from 2013 to 2014, and a 7.7 percent increase from 2012 to 2013. Other states seeing consistently high out-migration to Washington have included Oregon and Texas.
Besides drawing new residents domestically from other U.S. states, Washington and the Puget Sound in particular also benefit from the state’s importance as a gateway to trade with Asia, as well as from international air travel to and from Sea-Tac International Airport. The Sound’s proximity to international communities across the broader region from Vancouver, British Columbia to Los Angeles and San Diego is also a factor, as is the superior quality of life in the Puget Sound region and its comparative affordability in
Student visas also serve as a bridge to citizenship for the next generation. Satya Nadella, CEO of Redmond’s Microsoft, first came to the U.S. from India as a student before naturalizing as a U.S. citizen. The numbers of naturalizations in our state are still small compared with California and New York, but have grown steadily in recent years.
Of course, Washington State and the Puget Sound region would not stand to benefit from overseas immigration without approved channels and destinations in place. As of the date of this report, Washington State was host to 49 of the 1,076 USCIS approved EB-5 Regional Centers for targeting immigrant investor funds. Washington is also home to a large number of private preparatory schools, colleges, and universities participating in the Student and Exchange Visitor Program (SEVP). Only these SEVP-certified
respect to those other markets. The global eminence that results from these features of our local economy has allowed Seattle and Bellevue to attract growing numbers of immigrants from overseas.
In 2011 and 2012, Asia surpassed Europe and the combined North America/ Caribbean region as a source of immigrants to the U.S.; and of the Asian origins of U.S. immigration, China is out in front. Immigration from China to the U.S. has steadily exceeded that from India, whether for permanent resident status or on non-immigration visas. In 2013, more than 391,000 Chinese nationals came to the U.S. on student visas, a number 276 percent greater than those issued to Indian nationals, and exceeding even the number of visas issued to temporary workers from India.
Alongside other immigration paths, such as the EB-5 investor visa program, study in the U.S. is preferred by many Chinese parents seeking to ensure their children’s post-secondary success.
/ / REAL ESTATE DEMAND DRIVERS //

C ONTINUED | REAL ESTATE DEMAND DRIVERS
schools can provide a student with an I-20 form required to obtain an F-1student visa. There are 180 SEVP highschools in Washington State, 34 ofthem in Seattle. Those families withschool-age children who have alreadyconverted to permanent residency orcitizenship may enroll their childrenin one of the region’s many top-rankedpublic secondary schools. The BellevueSchool District alone includes five ofthe state’s top high schools as rankedby U.S.News & World Report. Amongthem is fourth-ranked Newport High
School, whose student body is 45 percent ethnically Asian, with 32 percent of the total speaking a language other than English at home.
The University of Washington is currently ranked No. 15 by the Shanghai Ranking of World Universities—higher than any other West Coast university outside of certain institutions in the state of California, which is more distant from Asia and generally more expensive than Seattle. As a result, in 2014, 52.7 percent of the foreign students at the University of Washington were from China.7
FOR THE CHINESE THE REAL ESTATE AXIOM IS: "LOCATION, EDUCATION AND ENVIRONMENT"
2010 2011 2012 2013
12
,77
44
,05
6
12
,82
04
,49
7
12
,93
94
,58
5
13
,06
44
,52
5
RestofWASeattleMSA
P E R S O N S N A T U R A L I Z E D
A S R E S I D E N T S O F WA S H I N G T O N
/ / REAL ESTATE DEMAND DRIVERS //
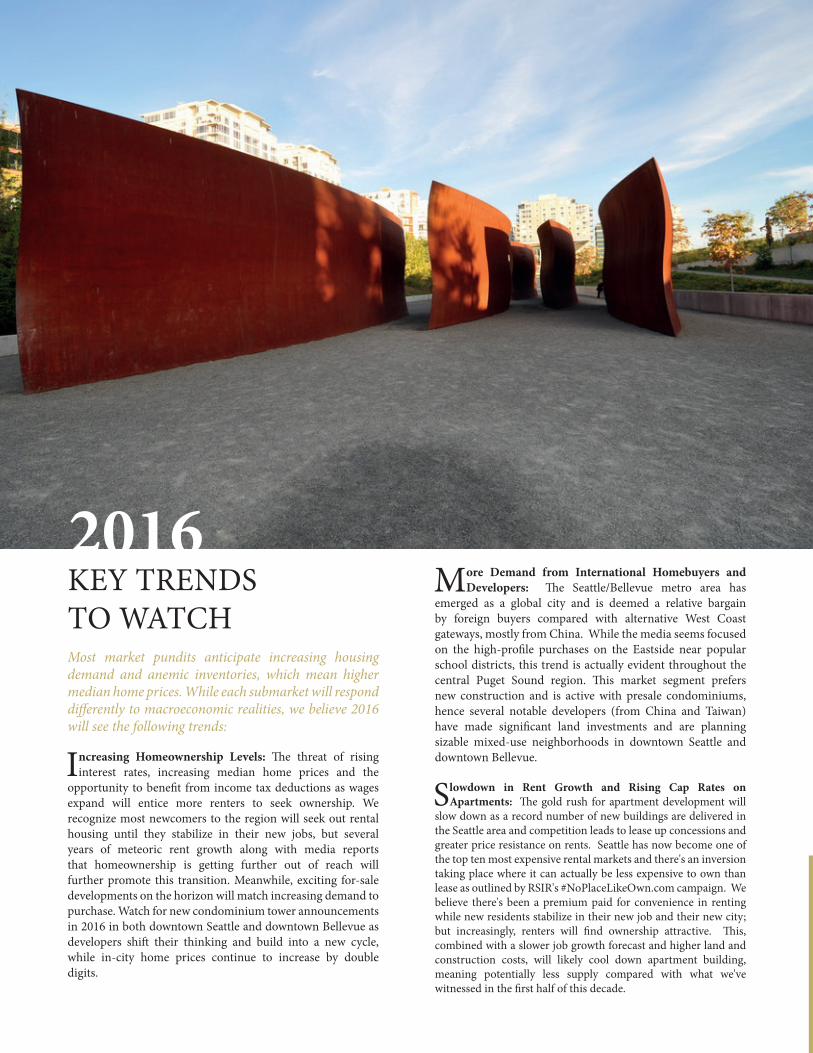
KEY TRENDS TO WATCH Most market pundits anticipate increasing housing demand and anemic inventories, which mean higher median home prices. While each submarket will respond differently to macroeconomic realities, we believe 2016 will see the following trends:
Increasing Homeownership Levels: The threat of risinginterest rates, increasing median home prices and the
opportunity to benefit from income tax deductions as wages expand will entice more renters to seek ownership. We recognize most newcomers to the region will seek out rental housing until they stabilize in their new jobs, but several years of meteoric rent growth along with media reports that homeownership is getting further out of reach will further promote this transition. Meanwhile, exciting for-sale developments on the horizon will match increasing demand to purchase. Watch for new condominium tower announcements in 2016 in both downtown Seattle and downtown Bellevue as developers shift their thinking and build into a new cycle, while in-city home prices continue to increase by double digits.
More Demand from International Homebuyers andDevelopers: The Seattle/Bellevue metro area has
emerged as a global city and is deemed a relative bargain by foreign buyers compared with alternative West Coast gateways, mostly from China. While the media seems focused on the high-profile purchases on the Eastside near popular school districts, this trend is actually evident throughout the central Puget Sound region. This market segment prefers new construction and is active with presale condominiums, hence several notable developers (from China and Taiwan) have made significant land investments and are planning sizable mixed-use neighborhoods in downtown Seattle and downtown Bellevue.
Slowdown in Rent Growth and Rising Cap Rates onApartments: The gold rush for apartment development will
slow down as a record number of new buildings are delivered in the Seattle area and competition leads to lease up concessions and greater price resistance on rents. Seattle has now become one of the top ten most expensive rental markets and there's an inversion taking place where it can actually be less expensive to own than lease as outlined by RSIR's #NoPlaceLikeOwn.com campaign. We believe there's been a premium paid for convenience in renting while new residents stabilize in their new job and their new city; but increasingly, renters will find ownership attractive. This, combined with a slower job growth forecast and higher land and construction costs, will likely cool down apartment building, meaning potentially less supply compared with what we've witnessed in the first half of this decade.
2016
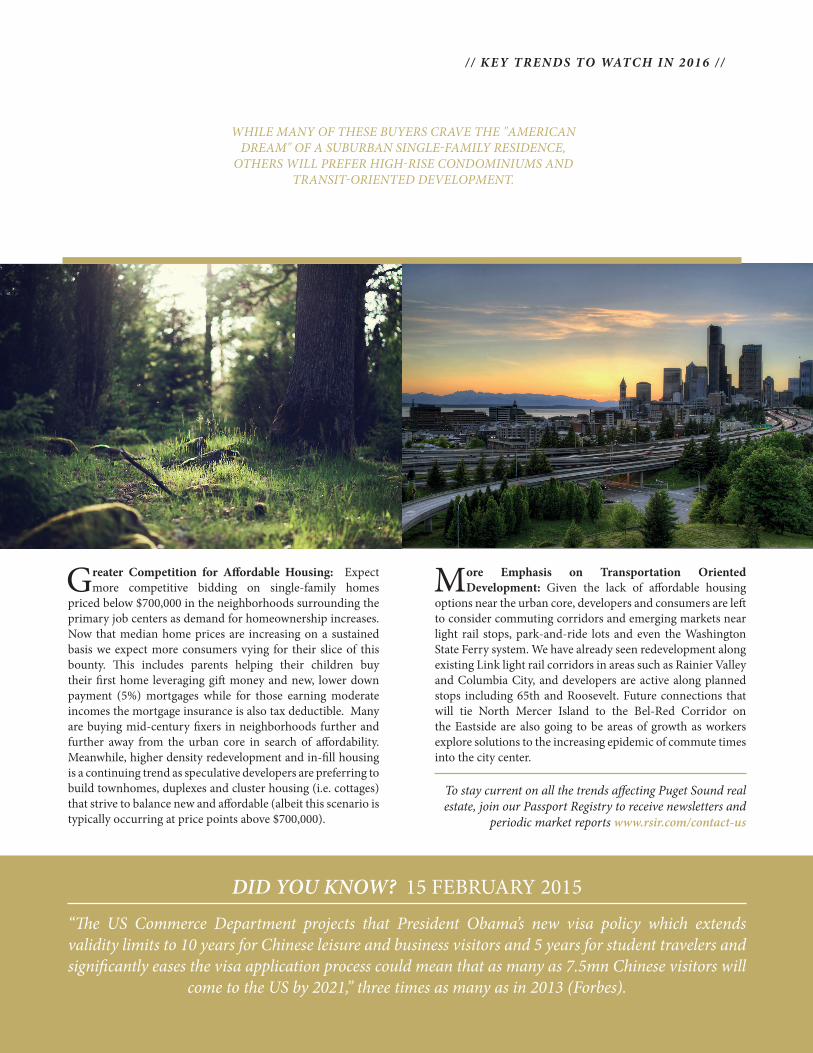
Greater Competition for Affordable Housing: Expectmore competitive bidding on single-family homes
priced below $700,000 in the neighborhoods surrounding the primary job centers as demand for homeownership increases. Now that median home prices are increasing on a sustained basis we expect more consumers vying for their slice of this bounty. This includes parents helping their children buy their first home leveraging gift money and new, lower down payment (5%) mortgages while for those earning moderate incomes the mortgage insurance is also tax deductible. Many are buying mid-century fixers in neighborhoods further and further away from the urban core in search of affordability. Meanwhile, higher density redevelopment and in-fill housing is a continuing trend as speculative developers are preferring to build townhomes, duplexes and cluster housing (i.e. cottages) that strive to balance new and affordable (albeit this scenario is typically occurring at price points above $700,000).
WHILE MANY OF THESE BUYERS CRAVE THE "AMERICAN DREAM" OF A SUBURBAN SINGLE-FAMILY RESIDENCE,
OTHERS WILL PREFER HIGH-RISE CONDOMINIUMS AND TRANSIT-ORIENTED DEVELOPMENT.
“The US Commerce Department projects that President Obama’s new visa policy which extends validity limits to 10 years for Chinese leisure and business visitors and 5 years for student travelers and significantly eases the visa application process could mean that as many as 7.5mn Chinese visitors will
come to the US by 2021,” three times as many as in 2013 (Forbes).
DID YOU KNOW? 15 FEBRUARY 2015
More Emphasis on Transportation OrientedDevelopment: Given the lack of affordable housing
options near the urban core, developers and consumers are left to consider commuting corridors and emerging markets near light rail stops, park-and-ride lots and even the Washington State Ferry system. We have already seen redevelopment along existing Link light rail corridors in areas such as Rainier Valley and Columbia City, and developers are active along planned stops including 65th and Roosevelt. Future connections that will tie North Mercer Island to the Bel-Red Corridor on the Eastside are also going to be areas of growth as workers explore solutions to the increasing epidemic of commute times into the city center.
To stay current on all the trends affecting Puget Sound real estate, join our Passport Registry to receive newsletters and
periodic market reports www.rsir.com/contact-us
/ / KEY TRENDS TO WATCH IN 2016 / /

$400,000
$350,000
$300,000
$250,000
$200,000
$150,000
$100,000
$0
$50,000
SNOHOMISH
SKAGITPIERCE
NWMLSKING
ISLANDKITSAP
JEFFERSON
2013 2014 2015
AROUND THE PUGET SOUND
Within the past two years, the inventory of housing for sale in Western Washington State has completed a large bell-shaped curve, returning to degrees of shortage
not seen since the year 2005. The impact is most remarkable in the Greater Seattle area of King, Pierce, and Snohomish counties. This region of central Puget Sound has remained a seller’s market since January 2015, with inventories in most areas remaining below four months for nearly the entire year.
PUGET SOUND MEDIAN PRICES BY COUNTY, 2013-15
/ / AROUND THE PUGET SOUND //
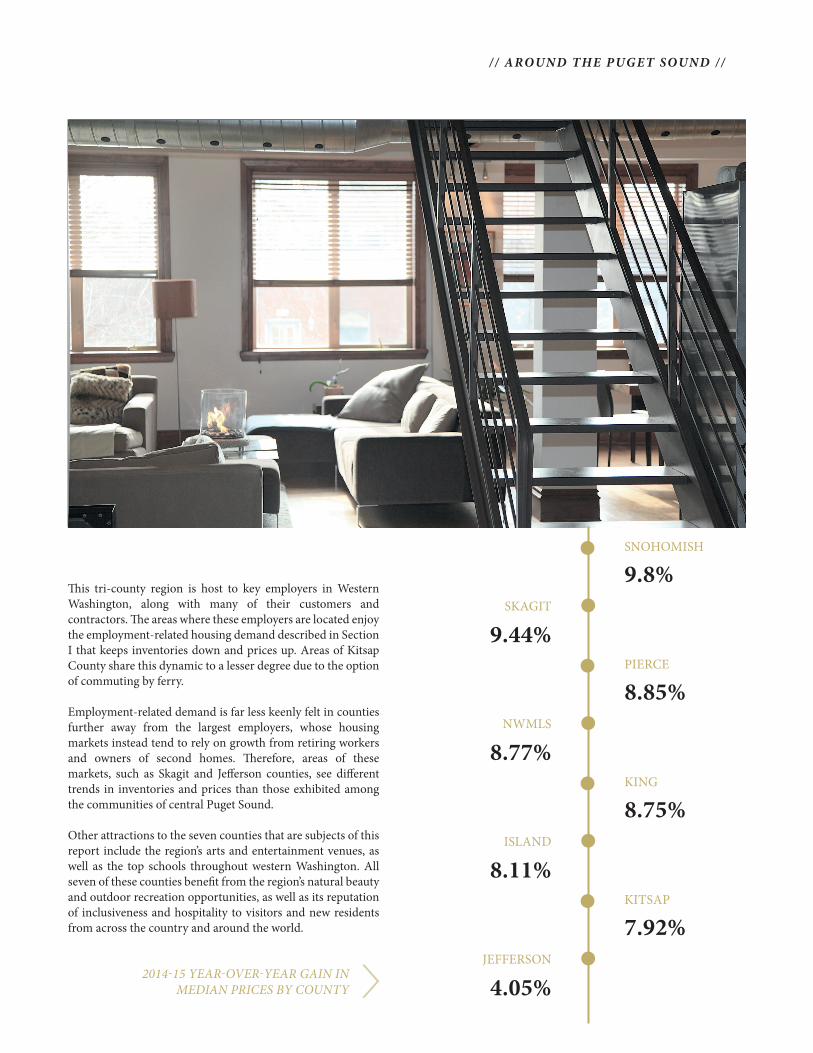
SNOHOMISH
9.8%
PIERCE
8.85%
KING
8.75%
KITSAP
7.92%
9.44%SKAGIT
8.77%NWMLS
8.11%ISLAND
4.05%JEFFERSON
2014-15 YEAR-OVER-YEAR GAIN IN MEDIAN PRICES BY COUNTY
This tri-county region is host to key employers in Western Washington, along with many of their customers and contractors. The areas where these employers are located enjoy the employment-related housing demand described in Section I that keeps inventories down and prices up. Areas of Kitsap County share this dynamic to a lesser degree due to the option of commuting by ferry.
Employment-related demand is far less keenly felt in counties further away from the largest employers, whose housing markets instead tend to rely on growth from retiring workers and owners of second homes. Therefore, areas of these markets, such as Skagit and Jefferson counties, see different trends in inventories and prices than those exhibited among the communities of central Puget Sound.
Other attractions to the seven counties that are subjects of this report include the region’s arts and entertainment venues, as well as the top schools throughout western Washington. All seven of these counties benefit from the region’s natural beauty and outdoor recreation opportunities, as well as its reputation of inclusiveness and hospitality to visitors and new residents from across the country and around the world.
/ / AROUND THE PUGET SOUND //
/ / COMMUNITY REPORT S / /
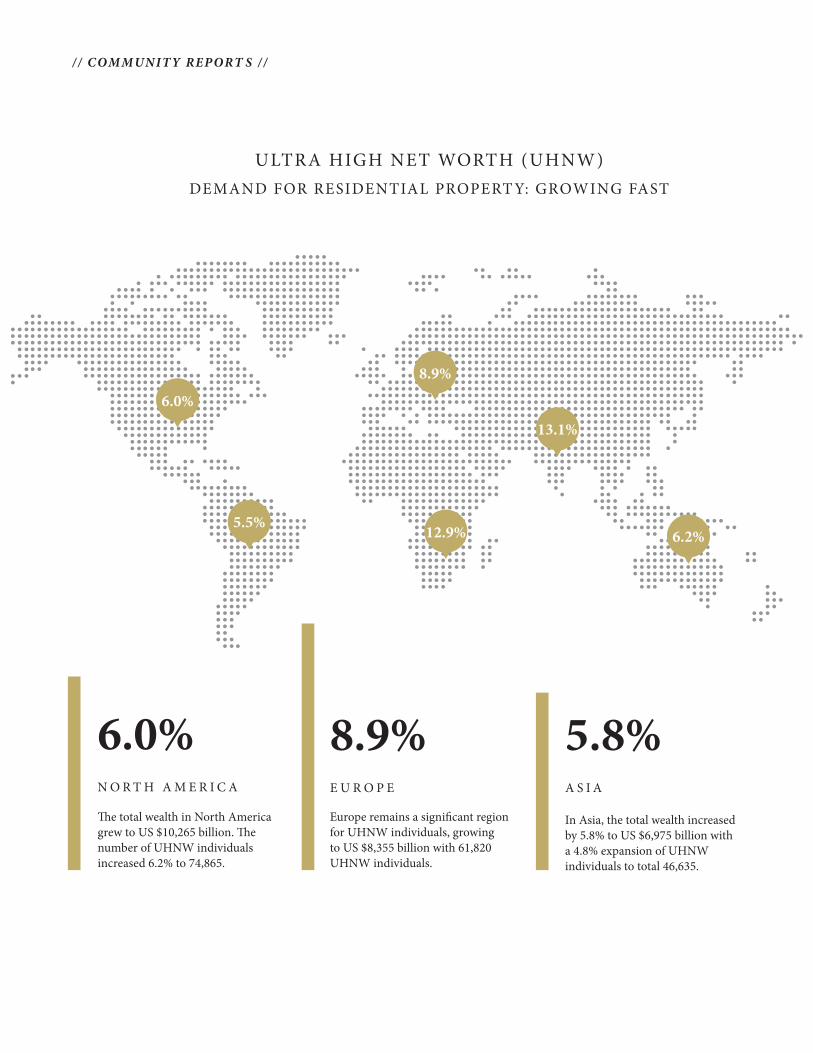
The total wealth in North America grew to US $10,265 billion. The number of UHNW individuals increased 6.2% to 74,865.
Europe remains a significant region for UHNW individuals, growing to US $8,355 billion with 61,820 UHNW individuals.
In Asia, the total wealth increased by 5.8% to US $6,975 billion with a 4.8% expansion of UHNW individuals to total 46,635.
6.0% 8.9% 5.8%N O R T H A M E R I C A E U R O P E A S I A
6.2%
13.1%
5.5% 12.9%
6.0%
8.9%
ULTRA HIGH NET WORTH (UHNW) DEMAND FOR RESIDENTIAL PROPERT Y: GROWING FAST
30.2%19.0%
17.8%17.6%
15.5%13.5%13.4%
13.0%12.7%
12.4%12.2%
11.5%11.1%10.9%
10.6%10.4%10.1%
9.6%9.2%
8.8%8.2%
7.6%3.3%3.2%
2.1%
0.0% 5.0% 10.0% 15.0% 20.0% 25.0% 30.0% 35
Belltown/DowntownPoulsbo
Burien/Normandy ParkBellevue West of I-405
Southeast SeattleBallard/Green Lake
Bainbridge IslandWest Seattle
Southwest SnohomishCamano Island
Queen Anne/MagnoliaKirkland/Bridle Trails
Central SeattleMercer IslandNorth Seattle
East of SammamishNortheast SnohomishBellevue East of I-405
Everett/MukilteoNWMLS
East Side SouthJuanita/Woodinville
AnacortesPort Ludlow
Redmond/Carnation
YOY Median Price Gain
/ / COMMUNITY REPORT S / /
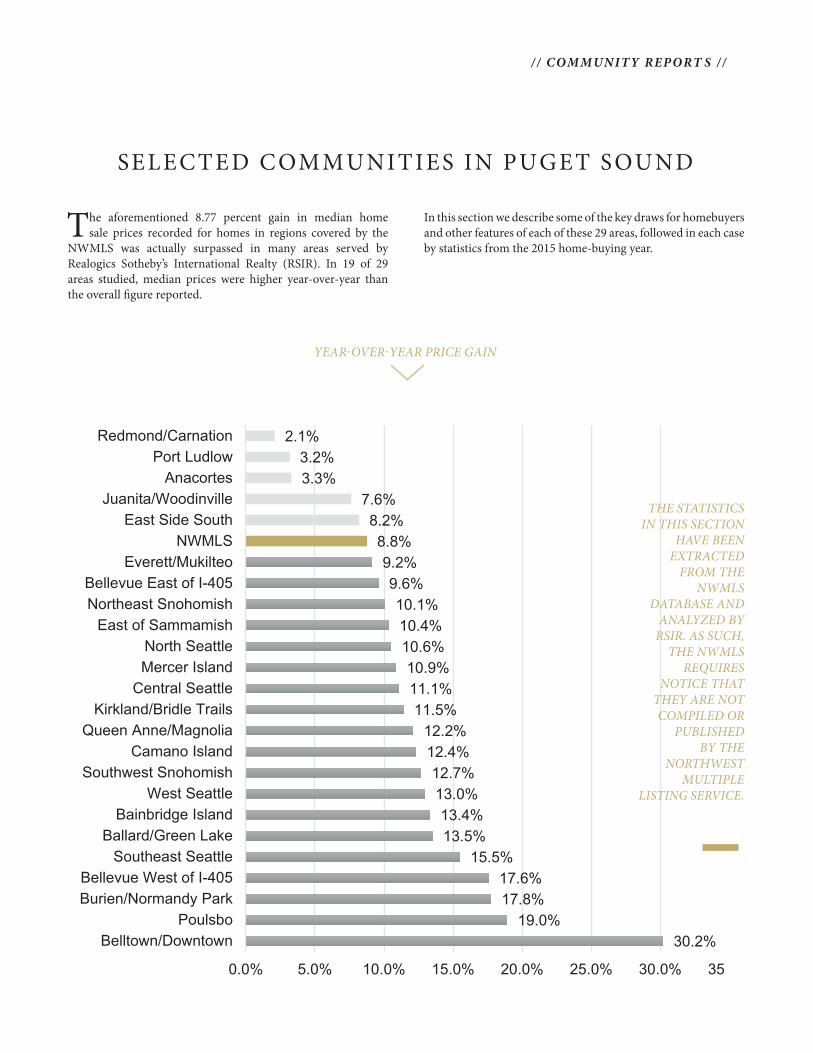
The aforementioned 8.77 percent gain in median homesale prices recorded for homes in regions covered by the
NWMLS was actually surpassed in many areas served by Realogics Sotheby’s International Realty (RSIR). In 19 of 29 areas studied, median prices were higher year-over-year than the overall figure reported.
In this section we describe some of the key draws for homebuyers and other features of each of these 29 areas, followed in each case by statistics from the 2015 home-buying year.
THE STATISTICS IN THIS SECTION
HAVE BEEN EXTRACTED
FROM THE NWMLS
DATABASE AND ANALYZED BY
RSIR. AS SUCH, THE NWMLS
REQUIRES NOTICE THAT
THEY ARE NOT COMPILED OR
PUBLISHED BY THE
NORTHWEST MULTIPLE
LISTING SERVICE.
YEAR-OVER-YEAR PRICE GAIN
SELECTED C OMMUNITIES IN PUGET SOUND ULTRA HIGH NET WORTH (UHNW)DEMAND FOR RESIDENTIAL PROPERT Y: GROWING FAST

B e l l t o w n , S e a t t l e$ 5 9 0 , 0 0 0 U S D
/ / OUR PHILOSOPHY //
SINCE 1744 THE SOTHEBY’S BRAND IS RENOWNED WORLDWIDE FOR MARKETING THE EXTRAORDINARY. WE CONTINUE THIS LEGACY IN THE PASSIONATE PURSUIT OF REAL ESTATE EXCELLENCE WITH TRUSTED INSIGHT, QUALITY SERVICE AND PROVEN RESULTS AT ALL PRICE POINTS. WHETHER YOUR NEXT ADDRESS IS AROUND THE CORNER OR AROUND THE GLOBE, WE’RE HERE TO HELP.
1 7 4 4
1 7 4 4
/ / OUR PHILOSOPHY //
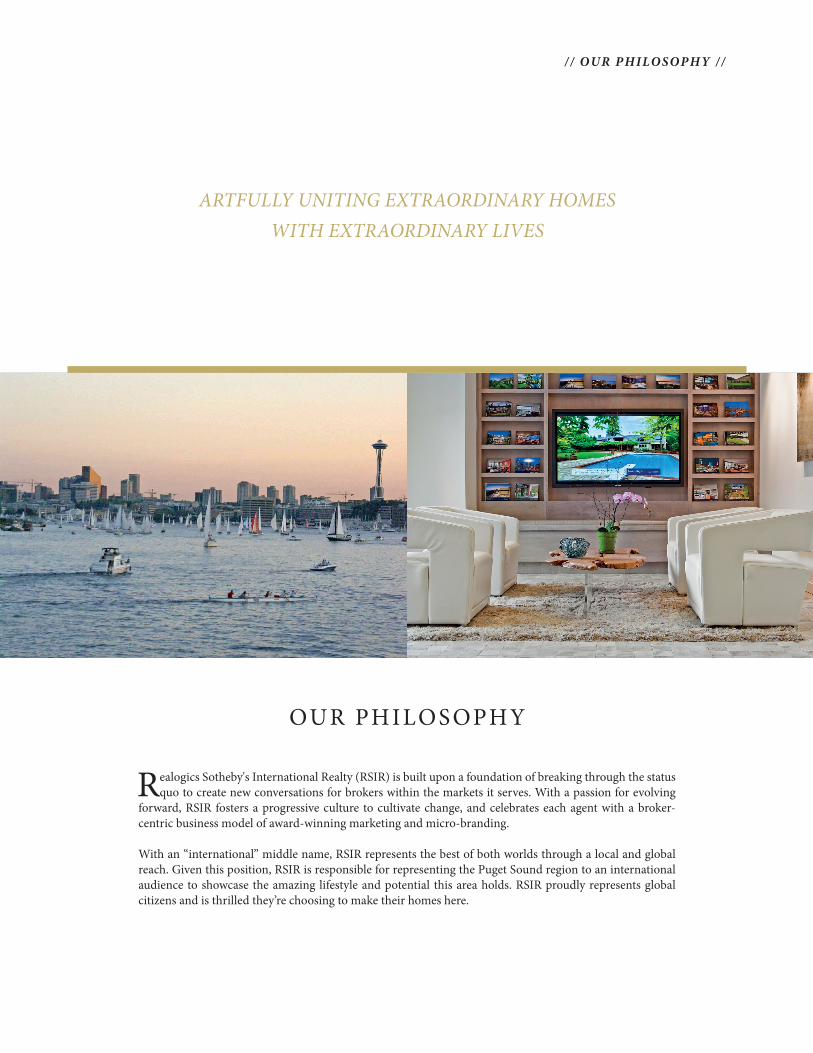
OUR PHILOSOPHY
Realogics Sotheby's International Realty (RSIR) is built upon a foundation of breaking through the status quo to create new conversations for brokers within the markets it serves. With a passion for evolving
forward, RSIR fosters a progressive culture to cultivate change, and celebrates each agent with a broker-centric business model of award-winning marketing and micro-branding.
With an “international” middle name, RSIR represents the best of both worlds through a local and global reach. Given this position, RSIR is responsible for representing the Puget Sound region to an international audience to showcase the amazing lifestyle and potential this area holds. RSIR proudly represents global citizens and is thrilled they’re choosing to make their homes here.
ARTFULLY UNITING EXTRAORDINARY HOMES WITH EXTRAORDINARY LIVES
www.DennisPaige.com
Sotheby’s International Realty® is a registered trademark licensed to Sotheby’s International Realty Affiliates LLC. An Equal Opportunity Company. If your property is listed with a real estate broker, please disregard. It is not our intention to solicit the offerings of other real estate brokers. We are happy to work with them and cooperate fully.
Each office is Independently owned and operated. Information Deemed Reliable But Cannot Be Guaranteed.