2015 ANNUAL REPORT - U.S. Department of the Treasury · PDF fileFinancial Stability Oversight...
150
2015 | ANNUAL REPORT Financial Stability Oversight Council
Transcript of 2015 ANNUAL REPORT - U.S. Department of the Treasury · PDF fileFinancial Stability Oversight...

2015 | ANNUAL REPORTF inanc ia l S tab i l i t y Overs ight Counc i l

F inanc ia l S tab i l i t y Overs ight Counc i l ii
Financial Stability Oversight Council
The Financial Stability Oversight Council (Council) was established by the Dodd-Frank Wall
Street Reform and Consumer Protection Act (Dodd-Frank Act) and is charged with three
primary purposes:
1. To identify risks to the financial stability of the United States that could arise from the
material financial distress or failure, or ongoing activities, of large, interconnected bank
holding companies or nonbank financial companies, or that could arise outside the
financial services marketplace.
2. To promote market discipline, by eliminating expectations on the part of shareholders,
creditors, and counterparties of such companies that the U.S. government will shield
them from losses in the event of failure.
3. To respond to emerging threats to the stability of the U.S. financial system.
Pursuant to the Dodd-Frank Act, the Council consists of ten voting members and five
nonvoting members and brings together the expertise of federal financial regulators, state
regulators, and an insurance expert appointed by the President.
The voting members are:
• the Secretary of the Treasury, who serves as the Chairperson of the Council;
• the Chairman of the Board of Governors of the Federal Reserve System;
• the Comptroller of the Currency;
• the Director of the Bureau of Consumer Financial Protection;
• the Chairman of the Securities and Exchange Commission;
• the Chairperson of the Federal Deposit Insurance Corporation;
• the Chairperson of the Commodity Futures Trading Commission;
• the Director of the Federal Housing Finance Agency;
• the Chairman of the National Credit Union Administration; and
• an independent member with insurance expertise who is appointed by the President
and confirmed by the Senate for a six-year term.
The nonvoting members, who serve in an advisory capacity, are:
• the Director of the Office of Financial Research;
• the Director of the Federal Insurance Office;
• a state insurance commissioner designated by the state insurance commissioners;
• a state banking supervisor designated by the state banking supervisors; and
• a state securities commissioner (or officer performing like functions) designated by the
state securities commissioners.
The state insurance commissioner, state banking supervisor, and state securities commissioner
serve two-year terms.
2 0 1 5 F S O C / / Annual Reportii
Statutory Requirements for the Annual Report
Section 112(a)(2)(N) of the Dodd-Frank Act requires that the annual report
address the following:
i. the activities of the Council;
ii. significant financial market and regulatory developments, including
insurance and accounting regulations and standards, along with an
assessment of those developments on the stability of the
financial system;
iii. potential emerging threats to the financial stability of the United
States;
iv. all determinations made under Section 113 or Title VIII, and the
basis for such determinations;
v. all recommendations made under Section 119 and the result of such
recommendations; and
vi. recommendations—
I. to enhance the integrity, efficiency, competitiveness, and
stability of United States financial markets;
II. to promote market discipline; and
III. to maintain investor confidence.
Approval of the Annual Report
This annual report was approved unanimously by the voting members of the
Council on May 19, 2015. Except as otherwise indicated, data cited in this report
is as of March 31, 2015.
Abbreviations for Council Member Agencies and Member Agency Offices
• Department of the Treasury (Treasury)
• Board of Governors of the Federal Reserve System (Federal Reserve)
• Office of the Comptroller of the Currency (OCC)
• Bureau of Consumer Financial Protection (CFPB)
• Securities and Exchange Commission (SEC)
• Federal Deposit Insurance Corporation (FDIC)
• Commodity Futures Trading Commission (CFTC)
• Federal Housing Finance Agency (FHFA)
• National Credit Union Administration (NCUA)
• Office of Financial Research (OFR)
• Federal Insurance Office (FIO)

iiiContents
Contents
1 Member Statement ...................................................... 1
2 Executive Summary ..................................................... 3
3 Annual Report Recommendations ............................... 93.1 Heightened Risk Management and Supervisory Attention ........................9
3.2 Reforms to Address Structural Vulnerabilities ........................................15
4 Macroeconomic Environment .................................... 194.1 U.S. Economic Activity ..........................................................................19
4.2 Nonfinancial Balance Sheets .................................................................22
4.3 Government Finance .............................................................................26
BOX A: Municipal Debt Markets: Challenges in Puerto Rico .................................29
4.4 External Environment ............................................................................30
BOX B: ECB’s Comprehensive Assessment of Euro Area Banks ...........................32
5 Financial Developments ............................................. 375.1 Asset Valuations ...................................................................................37
BOX C: Implications of Lower Oil Prices ..............................................................44
5.2 Wholesale Funding Markets ..................................................................53
5.3 Bank Holding Companies and Depository Institutions ............................57
5.4 Nonbank Financial Companies ..............................................................67
5.5 Investment Funds .................................................................................76
5.6 OTC Derivatives Markets .......................................................................81
BOX D: Overview of Central Counterparties Relevant to OTC
Derivatives Markets ................................................................................84

2 0 1 5 F S O C / / Annual Reportiv
6 Regulatory Developments & Council Activities ......... 876.1 Safety and Soundness ..........................................................................87
6.2 Financial Infrastructure, Markets, and Oversight....................................93
6.3 Mortgage Transactions, Housing, and Consumer Protection ..................97
6.4 Data Gaps and Standards .....................................................................98
6.5 Council Activities ................................................................................101
7 Potential Emerging Threats and Vulnerabilities ..... 1057.1 Cybersecurity: Vulnerabilities to Attacks on Financial Services .............105
7.2 Increased Risk-Taking in a Low-Yield Environment ..............................106
7.3 Changes in Financial Market Structure and Implications for Financial
Stability ..............................................................................................107
BOX E: Financial Markets on October 15, 2014 ................................................. 109
7.4 Central Counterparties ........................................................................ 111
7.5 Global Economic and Financial Developments ..................................... 112
7.6 Financial Innovation and Migration of Activities ................................... 113
7.7 Short-Term Wholesale Funding ........................................................... 115
7.8 Risk-Taking Incentives of Large, Complex, Interconnected Financial
Institutions ......................................................................................... 115
7.9 Reliance upon Reference Rates ........................................................... 118
7.10 Challenges to Data Quality, Collection, and Sharing ............................120
Abbreviations .................................................................121
Glossary ........................................................................ 129
List of Charts ................................................................ 139

1Member S tatement
In accordance with Section 112(b)(2) of the Dodd-Frank Wall Street Reform and Consumer Protection
Act, for the reasons outlined in the annual report, I believe that additional actions, as described below,
should be taken to ensure financial stability and to mitigate systemic risk that would negatively affect
the economy: the issues and recommendations set forth in the Council’s annual report should be fully
addressed; the Council should continue to build its systems and processes for monitoring and responding
to emerging threats to the stability of the United States financial system, including those described in the
Council’s annual report; the Council and its member agencies should continue to implement the laws they
administer, including those established by, and amended by, the Dodd-Frank Act, through efficient and
effective measures; and the Council and its member agencies should exercise their respective authorities
for oversight of financial firms and markets so that the private sector employs sound financial risk
management practices to mitigate potential risks to the financial stability of the United States.
The Honorable John A. Boehner
Speaker of the House
United States House of Representatives
The Honorable Nancy Pelosi
Democratic Leader
United States House of Representatives
The Honorable Joseph R. Biden, Jr.
President of the Senate
United States Senate
The Honorable Mitch McConnell
Majority Leader
United States Senate
The Honorable Harry Reid
Democratic Leader
United States Senate
1 Member Statement
Jacob J. Lew Secretary of the Treasury Chairperson, Financial Stability Oversight Council
Thomas J. Curry Comptroller of the Currency Office of the Comptroller of the Currency
Mary Jo White Chair Securities and Exchange Commission
Timothy G. Massad Chairman Commodity Futures Trading Commission
Debbie Matz Chairman National Credit Union Administration
Janet L. Yellen Chair Board of Governors of the Federal Reserve System
Richard Cordray Director Bureau of Consumer Financial Protection
Martin J. Gruenberg Chairman Federal Deposit Insurance Corporation
Melvin L. Watt Director Federal Housing Finance Agency
S. Roy Woodall, Jr. Independent Member with Insurance Expertise Financial Stability Oversight Council


3E xecut i ve Summar y
Vulnerabilities in the U.S. financial system remained moderate over the past year. Domestic economic
conditions improved and regulators continued to make progress in financial reforms, which further
strengthened the balance sheets of financial institutions. The U.S. financial system successfully
weathered a variety of shocks from abroad. These included rising geopolitical tensions in Ukraine and
the Middle East; slowing growth in Europe, Japan, and China; renewed concerns about the sustainability
of Greece’s debt; and a sharp drop in oil prices. Despite improvements in some areas, the financial
system became more vulnerable to shocks in other areas. For example, recent cyber attacks have
heightened concerns about the potential of an even more destructive incident that could significantly
disrupt the workings of the financial system. Also, the continued low-rate environment has encouraged
some investors to take on more risk by reaching for yield.
Over the past year, progress toward financial reforms included further strengthening of capital,
leverage, and liquidity standards for financial institutions; continued application of supervisory and
company-run stress tests; ongoing supervisory review and comment on large banking organizations’
resolution plans; adoption of a credit risk-retention requirement for asset-backed securities (ABS);
adoption of money market mutual fund (MMF) and credit rating agency reforms; and other measures
to enhance consumer protections. In the tri-party repo market, intraday credit exposures have largely
been eliminated. In addition, the Council made a determination that a nonbank financial company will
be subject to Federal Reserve supervision and enhanced prudential standards, and completed its first
annual reevaluations of three previous determinations. The Council also conducted extensive public
outreach regarding potential risks posed by asset management products and activities.
The Council regularly examines significant market developments and structural issues within the
financial system. For example, over the past year, the Council has considered issues such as short-term
wholesale funding, cybersecurity, volatility in fixed income markets, equity market structure, high-
frequency and automated trading activities, leveraged lending, reference rate reform, and interest
rate risk at a variety of financial institutions. The Council will continue to monitor potential threats to
financial stability, whether from external shocks or structural weaknesses, and to facilitate coordination
among federal and state agencies.
This year’s annual report highlights two new topics that have received increased regulatory attention:
changes in financial market structure and central counterparties (CCPs). In particular, the report
discusses how changes in financial market structure—including trends that predate the financial
crisis—may impact the provision of liquidity and market functioning. With regard to CCPs, which are
designed to enhance financial stability, the report highlights the importance of taking steps so that
CCPs have robust frameworks for risk management. Below are the key potential emerging threats and
vulnerabilities, as well as recommended reforms identified by the Council.
2 Executive Summary

2 0 1 5 F S O C / / Annual Report4
Cybersecurity
Over the past year, financial sector organizations and other U.S. businesses experienced numerous cyber
incidents, including large-scale data breaches that compromised financial information. Malicious cyber
activity is likely to continue, and financial sector organizations should be prepared to mitigate the threat
posed by cyber attacks that have the potential to destroy critical data and systems and impair operations.
Treasury and the U.S. regulators have taken steps to prompt financial institutions to mitigate risks to the
financial system posed by malicious cyber activities. As cyber threats continue to evolve, strong collaboration
and data sharing among financial service companies and government agencies; improvements in technology
infrastructure; and adequate plans for responding to and recovering from cyber incidents will remain critical
areas of focus.
Increased Risk-Taking in a Low-Yield Environment
The historically low-yield environment continues to encourage greater risk-taking across the financial system.
Investors may seek incremental gains in yield for disproportionate amounts of risk. Banks, credit unions, and
broker-dealers have lower net interest margins (NIMs), leading some firms to increase risk by holding longer-
duration assets, easing lending standards, or engaging in other forms of increased risk-taking. For example,
federal banking agencies have found serious deficiencies in underwriting standards and risk management
practices for certain leveraged loans. Although more recent data may suggest improvement in the quality of
newly issued loans, the growth in loan issuance combined with the decline in credit risk premia in recent
years warrants further monitoring. The low-rate environment is also making it difficult for pension and
retirement funds to meet their long-term liabilities, some of which are seeking to boost returns by extending
the duration of their assets or by purchasing lower quality, higher- yielding assets. Some insurance companies
have also repositioned their investment portfolios in a similar fashion. A sharp increase in interest rates or
credit spreads could generate losses on longer-term assets, including less liquid assets such as high-yield and
emerging market bonds. If such losses are borne by leveraged investors, they could lead to fire sales and
further declines in asset prices.
Changes in Financial Market Structure and Implications for Financial Stability
Financial market structure has evolved substantially over the years, owing to a confluence of factors including
technology, regulation, and competition. As electronic trading has captured an increasingly significant share
of total trading, electronic trading platforms and algorithmic trading firms now play an increasing role in
facilitating market liquidity. In addition, the business models and risk appetite of traditional broker-dealers
have changed, with some broker-dealers reducing their securities inventories and, in some cases, exiting
certain markets. New trading venues and platforms have also developed or expanded in certain markets,
including new regulated exchanges, interdealer platforms, and dark pools among others. As this evolution
of market structure plays out across a broader collection of asset classes and markets, market participants
and regulators should continue to monitor how it affects the provision of liquidity and market functioning,
including operational risks.
Central Counterparties
Following the crisis, U.S. and foreign regulators have encouraged or required more derivatives and other
financial transactions to be cleared through CCPs. CCPs require robust frameworks for risk management
if they are to enhance financial stability and increase market resiliency. Regulators have taken significant
steps in recent years to promote strong risk management at systemically important CCPs and remain focused
in identifying and mitigating any potential threats to financial stability that could arise from CCPs. In
particular, it is important to evaluate whether existing rules and standards are sufficiently robust to mitigate
the risk that CCPs could transmit credit and liquidity problems among financial institutions and markets
during periods of market stress.

5
Global Economic and Financial Risks
In today’s globally integrated financial markets, foreign shocks have the potential to disrupt financial
stability in the United States. In 2014, concerns about stability in the euro area resurfaced amid weak
economic growth and political uncertainty in Greece. It is unclear whether Greece will be able to implement
the reforms needed to maintain the European Union (EU)-International Monetary Fund (IMF) financial
assistance program, which it needs to meet debt obligations coming due later in 2015. In China, an abrupt
correction in the property market could cause financial stress and pressure on the economy. Furthermore,
the rapid growth in dollar credit to emerging market economies (EMEs) raises concerns that a disorderly
increase in yields in advanced economies or a sudden change in market sentiment could trigger a sell-off in
emerging market bonds and destabilize markets, as occurred in the summer of 2013.
Financial Innovation and Migration of Activities
Technology, competition, and regulatory changes are continuously reshaping the financial system and
bringing about innovations in products, services, and business practices, which benefit investors and
consumers. Since the financial crisis, the changing financial system landscape has fostered many innovations.
One challenge for regulators is the need to monitor new products or services in light of existing standards
and regulations. Another challenge is the migration of activities to less regulated or unregulated institutions.
Short-Term Wholesale Funding
Domestic banking firms’ reliance on short-term wholesale funding has decreased since the financial crisis.
The decline reflects in part the large growth in retail deposits and adjustments some banks are making to
their funding and balance sheet structures in response to enhanced liquidity standards—such as the liquidity
coverage ratio (LCR)—and capital requirements—such as the supplementary leverage ratio (SLR). Similarly,
total borrowing by primary dealers across all segments of the repurchase agreements (repo) market was
essentially flat in 2014.
Previous annual reports have highlighted structural vulnerabilities in the tri-party repo market. Significant
progress has been made in this market in recent years, in particular reducing market participants’ reliance on
intraday credit from clearing banks. The risk of fire sales of collateral deployed in repo transactions remains
an important financial stability concern. The industry is still working to bring the settlement of General
Collateral Finance (GCF) repo transactions in line with the reforms effected for tri-party repo generally.
Risk-Taking Incentives of Large, Complex, Interconnected Financial Institutions
In the 2008 financial crisis, the official sector—including the Federal Reserve, Treasury, and FDIC—
provided liquidity and capital to some of the largest U.S. financial institutions to prevent an already
significant financial disruption from becoming even worse. That support, while critical, likely exacerbated
the existing too-big-to-fail moral hazard problem, that is, the risk that these financial institutions will become
even larger and more interconnected because they and other market participants expect the official sector to
intervene to prevent a catastrophic financial market failure. In addition, creditors and counterparties to these
institutions may misprice risk when lending or transacting if they continue to expect support from the
official sector.
E xecut i ve Summar y

2 0 1 5 F S O C / / Annual Report6
The Dodd-Frank Act directly addressed this problem by enhancing the safety and soundness of the largest
financial institutions and by instituting limits on the support that can be provided. Specifically, the Dodd-
Frank Act requires the Federal Reserve to adopt enhanced prudential standards for the largest bank holding
companies (BHCs) and designated nonbank financial companies, requires that certain companies develop
and submit to the Federal Reserve and the FDIC their own plan for rapid and orderly resolution, and limits
the ability of the Federal Reserve to provide extraordinary support to individual institutions.
Although the largest BHCs have become larger, some market-based measures indicate they have become less
interconnected and less complex since the passage of the Dodd-Frank Act. Additionally, some credit rating
agencies have lowered their assessments of the likelihood of government support for the largest banks in time
of stress. However, these rating agencies still consider some chance that the government will provide support
to the largest banks if they become financially distressed. The full implementation of Orderly Liquidation
Authority (OLA) and the phasing in of enhanced prudential standards in the coming years should
help reduce remaining perceptions of government support for large, complex, interconnected financial
institutions.
Reforms of Reference Rates
Investigations of manipulation of the widely used London Interbank Offered Rate (LIBOR) that surfaced in
2012 highlighted concerns about the integrity of interest rate and other financial benchmarks. Incidents of
manipulation reduce public confidence in the financial system and risk financial instability, in part owing to
the significant disruptions associated with changing the reference rates for financial contracts. The problems
with U.S. dollar LIBOR (USD LIBOR) reflect several interrelated structural factors including the decline
in unsecured interbank lending markets, the incentives to manipulate rates submitted to reference rate
panels, and the dominance of instruments tied to LIBOR in terms of market liquidity. Since the Council’s
2014 annual report, administrators of LIBOR, the Euro Interbank Offered Rate (Euribor), and the Tokyo
Interbank Offered Rate (TIBOR) have made substantial progress toward enhancing oversight, governance,
transparency, and accountability of these benchmark rates. Official sector efforts have focused on developing
multiple reference rates, which would allow the rate used in a financial transaction to be more closely tied to
the underlying economic purpose, reduce incentives for manipulation, and enhance stability by having more
ready alternatives. Concerns have also been raised about other financial benchmarks, including swap rates
and foreign exchange (FX) rates, which are used for valuing numerous contracts and portfolios of assets.
U.S. regulators continue to cooperate with foreign regulators and official sector bodies in their assessment of
market practices for these benchmarks.
Housing Finance Reform
The housing market recovery continued in 2014, despite some signs of softness early in the year. As house
prices continued to rise, the number of households with negative equity declined while the performance
of outstanding loans improved. Although mortgage origination activity slumped in 2014, this was mainly
due to fewer refinance originations, as mortgage rates remained elevated relative to 2013. In the absence
of housing finance reform, FHFA, primarily through its conservatorship and oversight of Fannie Mae and
Freddie Mac—the government-sponsored enterprises (GSEs)—continued to make meaningful efforts to
improve housing finance infrastructure and reduce the amount of taxpayer risk. However, core challenges
persist. The GSEs remain in conservatorship, subject to FHFA supervision, with the vast majority of newly

7E xecut i ve Summar y
originated mortgages carrying a federal government backing either through the GSEs, the Federal
Housing Administration (FHA), or other government-backed programs. Over the past year, the GSEs have
continued to reduce their overall exposure to mortgage credit risk by engaging in risk-sharing with market
participants—primarily through structured transactions and reinsurance agreements. Legislative action
is still needed for federal and state regulators to implement necessary reforms. Legislation addressing
the conservatorship of the GSEs and clarifying the future role of the federal and state governments in
mortgage markets would also help reduce uncertainty in the mortgage market and better enable market
participants to make long-term investment decisions.
Data Quality, Collection, and Sharing
Data limitations can hamper the ability of market participants and regulators to fully comprehend the
scope and size of risks throughout the financial system. Regulators took several steps in 2014 to improve
the scope, comparability, and transparency of existing data collections. Promoting transparency in
the over-the-counter (OTC) derivatives markets is a major priority for the Council and international
regulators, given the market’s role in the financial crisis, its decentralized nature, and evolving
infrastructure. The global Legal Entity Identifier (LEI) project progressed in 2014. In the United States,
more regulatory reporting forms are requiring the use of the LEI. Also, in 2014, the CFTC and OFR
entered into a cooperative effort to enhance the quality, types, and formats of data collected from
CFTC-registered swap data repositories (SDRs). Although regulators now collect significantly more data
on financial markets and institutions, critical gaps remain in the scope and quality of available data. For
example, regulators and market participants lack comprehensive data on repo and securities lending
markets. Regulatory and supervisory efforts to improve visibility and transparency in various markets,
such as bilateral repo, are ongoing.


9Annua l Repor t Recommendat ions
3.1 Heightened Risk Management and Supervisory Attention
3.1.1 Cybersecurity
Cybersecurity is an increasing concern, with cyber attacks creating a growing operational risk to the
financial sector. Mitigating risks to the financial system posed by malicious cyber activities requires
strong collaboration among financial services companies, agencies, and regulators. The Council
continues to support comprehensive legislation on cybersecurity issues, including proposals to enhance
cybersecurity information sharing and data breach notifications.
Information Sharing
The Council recommends additional enhancements to cybersecurity information sharing between
the private sector and government. Specifically, the Treasury should continue to work closely with
intelligence and law enforcement agencies to enhance the sharing of timely and actionable cyber threat
information with regulators and the private sector through the Financial Sector Cyber Intelligence
Group and the Financial Sector Information Sharing and Analysis Center (FS-ISAC). This includes
increasing the speed of information exchange by automating the sharing of technical data wherever
possible. The Council also encourages continued efforts by the Federal Financial Institutions
Examination Council (FFIEC) to collaborate and coordinate on cybersecurity issues affecting the
banking sector. These information-sharing efforts should be undertaken in a manner that respects civil
liberties and protects the privacy of customers.
In addition, financial regulators should enhance capabilities to allow for timely distribution of urgent
cyber threat information to regulated entities in the event of a cyber incident with the potential
to impact the whole sector, working in collaboration with the Financial and Banking Information
Infrastructure Committee (FBIIC).
Best Practices
The Council recommends continued efforts to enhance the security and resilience of the nation’s
critical infrastructure through the use of the National Institute of Standards and Technology’s
Framework for Improving Critical Infrastructure Cybersecurity (NIST Cybersecurity Framework)
among financial services sector companies, in addition to other relevant standards issued by the
financial regulators. This includes integrating better security practices into agreements with vendors.
The Council also recommends that financial regulators expand and complete efforts to map existing
regulatory guidance to reflect and incorporate appropriate elements of the NIST Cybersecurity
Framework and encourage consistency across regulatory regimes for cybersecurity. In addition, the
Council notes that approaches and authorities to supervise third-party service providers vary across
financial regulators. The Council supports efforts to synchronize these authorities, including by
passing new legislation that helps to enhance the security of third-party service providers and the
critical services they provide. The Council supports the granting of examination and enforcement
powers to NCUA and FHFA to oversee third-party service providers engaged respectively with credit
unions and the GSEs.
3 Annual Report Recommendations

2 0 1 5 F S O C / / Annual Report10
Response and Recovery
The private sector and government should maintain robust plans for responding to a significant cyber
incident. Treasury and financial regulators have been working closely with the private sector and other
government agencies on a series of cybersecurity exercises to improve response and recovery from incidents
impacting the financial services sector. The Council encourages the establishment of a national plan for
cyber incident response for the sector, coordinated by the Treasury, that includes identifying and articulating
the role of law enforcement, the Department of Homeland Security, and financial regulators.
3.1.2 Increased Risk-Taking in a Low-Yield Environment
Depository Institutions, Broker-Dealers, and Bank Holding Companies
With slowing global growth, falling inflation, and central banks providing accommodative monetary policies,
long-term interest rates returned to near record lows, despite an improving U.S. economy. Low interest rates
have helped to improve financial stability by strengthening the balance sheets of households, firms, and
most financial institutions. However, these conditions continue to incentivize depository institutions, broker-
dealers, and BHCs to seek additional yield by holding longer-duration assets, easing lending standards,
or engaging in other forms of risk-taking. One sector that warrants continued monitoring is leveraged
finance, with respect to which federal banking agencies’ 2014 Shared National Credit (SNC) Review found
serious deficiencies in underwriting standards and risk management practices of certain leveraged loans as
compared to the norms set forth in their 2013 leveraged lending guidance. In response to these findings, the
agencies increased the frequency of their reviews of these loans. The quality of newly originated loans will
continue to be a focal point in the agencies’ 2015 SNC review.
Such risk-seeking may lead to large losses or potential market disruptions under a shock to fixed income
markets. This could come either from a sudden rise in interest rates or yield curve steepening, or from a
turning of the credit cycle and a significant jump in credit spreads, leaving institutions exposed to losses from
underwritten loans.
The Council recommends that supervisors, regulators, and firm management continue to closely monitor
and assess the heightened risks resulting from continued search-for-yield behaviors as well as the risks from
potential severe interest rate shocks.
Insurance Companies
A similar dynamic is playing out in the insurance industry. To boost returns, some insurers are taking on
incremental risk by extending the durations of their portfolios, or investing in assets of lower credit quality.
Some have also moved into less liquid investments, such as commercial mortgage loans, real estate, or
alternative assets such as private equity or hedge funds.
The Council recommends that FIO and state insurance regulators continue to closely monitor and assess the
growing risks that insurers have been taking by extending the duration of their portfolios, and by investing in
lower quality or less liquid assets.
3.1.3 Changes in Financial Market Structure and Implications for Financial Stability
While changes in market structure, such as the ability to trade at higher speeds, and the expansion and
diversity of trading venues have increased competition and reduced transaction costs, regulators should be
mindful of the introduction of certain vulnerabilities. In particular, the expansion of electronic trading
beyond equities and futures markets should be assessed for potential vulnerabilities. First, risk management
and technology systems must be equipped to quickly detect and mitigate issues that may arise from erroneous

11
trades or disruptive strategies. Second, in today’s highly complex and interlinked markets, liquidity provision
and pricing may adjust quickly and unexpectedly, even in the absence of significant market events.
Over the last five years, the SEC and CFTC have implemented a series of market structure reforms to improve
transparency, fairness, risk management, and technology systems. These reforms include the enhancement
of market-wide circuit breakers in the equity markets, rules that require brokers to implement better risk
controls, as well as rules that place stricter requirements relating to the technology used by exchanges, large
alternative trading systems, clearing institutions, and securities information processors. Last year, the SEC
enacted Regulation Systems Compliance and Integrity (SCI), which imposes requirements on certain key
market participants that are intended to reduce the occurrence of systems issues and improve resiliency
when problems do occur. In addition, the self-regulatory organizations have advanced new backup recovery
processes for each consolidated data feed—known as securities information processors—to improve failovers
to backup sites in the event of a failure of the primary site and resume operations within a short timeframe.
The SEC has also proposed rules that would close a regulatory gap by requiring active proprietary traders to
be registered with Financial Industry Regulatory Authority (FINRA).
The Council recommends that members and member agencies continue to remain vigilant to the confluence
of factors driving changes in market structure, the extent of their impact on market functioning and the
provision of liquidity, and potential implications for financial stability. Regulators should assess the extent to
which potential actions in certain markets might be applicable to other markets as well. Regulators should
also work to better understand the linkages between and across markets, both regulated and unregulated,
by improving data collection efforts and data sharing arrangements across the member agencies. The
Council also recommends that regulators continue to enhance their understanding of firms that may act like
intermediaries and that may be outside the regulatory perimeter, work to develop enhanced tools, and, as
warranted, make recommendations to Congress to close such regulatory gaps.
3.1.4 Central Counterparties
CCPs serve important risk-mitigating functions and have long been core components in a range of
markets including exchange-traded derivatives and cash markets. The Dodd-Frank Act requirement that
certain standardized OTC derivatives contracts be cleared via CCPs—a key plank of post-crisis regulatory
reforms—recognizes that opaque and highly interconnected derivatives markets played a significant role
in exacerbating financial instability. Properly regulated and managed CCPs have the potential to greatly
improve the transparency and stability of OTC derivatives markets. However, the increasing importance of
CCPs has heightened public and regulatory focus on risk management practices at CCPs and the potential
threat to financial stability in the event of a CCP failure. As U.S. regulators and their foreign counterparts
continue to implement and expand clearing requirements for additional derivatives products, the role
of derivatives CCPs as risk management hubs will necessarily increase. There is a broad recognition that
regulatory scrutiny must be commensurate with this increased role.
The Council recommends that the Federal Reserve, CFTC, and SEC continue to coordinate closely in the
supervision of all CCPs that are designated as systemically important financial market utilities (FMUs)
under Dodd-Frank Title VIII, and recommends that the agencies continue to actively evaluate whether
recently enhanced rules and standards are sufficiently robust to mitigate potential threats to financial
stability. The Council also encourages regulators to continue working collaboratively through the Council’s
FMU Committee as well as through international work streams and other avenues, to review the adequacy
of margining, stress testing, enhanced transparency and disclosures, and cyber resilience. Further, the
Council recommends that the agencies continue to evaluate whether certain CCP-related risk areas are being
addressed adequately, in particular: (1) CCP credit, default, and liquidity risk management; (2) bank-CCP
interactions and risk management, including how banks and other clearing members manage and account
Annua l Repor t Recommendat ions

2 0 1 5 F S O C / / Annual Report12
for their potential exposures to the full range of CCPs, both foreign and domestic, in which they participate;
and (3) CCP recovery and resolution planning. In addition, member agencies should continue working with
respective international official sector bodies to identify and address areas of common concern as additional
derivatives clearing requirements are implemented in other jurisdictions.
3.1.5 Financial Innovation and Migration of Activities
Financial markets continue to change in response to technological advances, competition, and regulatory
developments. Many of these changes have greatly benefited investors, consumers, and firms, but in some
instances, such changes may pose risks to financial stability. The Council recommends that members and
member agencies remain vigilant to the potential financial stability risks that may arise from financial
innovation, business practices, and migration of activities in the financial system.
In particular, nonbank mortgage servicing companies, which in recent years have purchased large amounts
of mortgage servicing rights (MSRs) from banks and thrifts, have grown to account for a material portion
of the mortgage servicing market. These nonbank firms are subject to CFPB regulation, as well as state-level
prudential standards, which consist of bonding and net worth requirements, and counterparty standards
imposed by the GSEs. Following the recommendation made in the Council’s 2014 Annual Report, FHFA
proposed new minimum financial eligibility requirements for mortgage seller/servicers that do business
with the GSEs in January 2015. Also, in March 2015, state bank and mortgage regulators issued a proposed
framework for prudential regulation of nonbank mortgage servicers, which would establish baseline
standards for all firms and enhanced standards for larger, more complex ones. The Council recommends that
state regulators continue to monitor these firms and collaborate with the CFPB and FHFA, as appropriate, on
further developing and implementing prudential and corporate governance standards to strengthen these
companies.
3.1.6 Capital, Liquidity, and Resolution
Capital and Liquidity
U.S. banks and credit unions have continued to make progress toward robust capital and liquidity planning.
The banking agencies are developing more stringent capital requirements on banking organizations that
pose greater risks to financial stability. For instance, in April 2014, the federal banking agencies adopted a
final rule that enhances the supplementary leverage requirement for the largest, most interconnected U.S.
BHCs and their subsidiary depository institutions. In December 2014, the Federal Reserve sought comment
on a proposal to establish risk-based capital surcharges for this category of BHCs, which would be calibrated
based on an institution’s size, interconnectedness, cross-jurisdictional activity, complexity, and use of short-
term wholesale funding. In addition, the Federal Reserve continues to conduct its supervisory stress tests
to ensure that the largest U.S. BHCs have sufficient capital and rigorous forward-looking capital planning
processes to enable banking firms to continue operations throughout periods of severe stress. NCUA also is
conducting its first supervisory stress tests and capital planning review on credit unions with over $10 billion
in assets, the results of which will be communicated in May 2015. In February 2014, the Federal Reserve
finalized enhanced prudential standards, including enhanced capital and liquidity standards, for the largest
domestic BHCs and foreign banking organizations (FBOs) with a U.S. banking presence. Similarly, the OCC
implemented heightened risk governance standards for the financial institutions it supervises. In April 2014,
the FDIC implemented Basel III regulatory capital standards, which were substantively identical to those
implemented by the Federal Reserve and the OCC in October 2013. The Council recommends that the
agencies continue to promote forward-looking capital and liquidity planning at large BHCs, U.S. operations
of FBOs, and other depositories.

13
The traditional banking sector model relies on many different forms of funding. As such, firms are
encouraged to diversify their funding base and place prudent limits on the volume of short-term liabilities.
The Council recommends that supervisors and private sector risk managers closely monitor the liquidity
risks inherent in short-term funding of longer-term assets. In September 2014, the federal banking agencies
finalized the LCR that would strengthen the liquidity position of large banking firms. The Council
recommends that the agencies continue work on potential quantitative rules that would address structural
liquidity needs for the largest banking organizations.
Resolution
In its 2014 annual report, the Council acknowledged the importance of establishing a framework for effective
cross-border cooperation in the event a global systemically important financial institution (G-SIFI) requires
resolution and recommended that the FDIC and Federal Reserve continue to work with international
counterparts to identify and address issues of mutual concern. The Federal Reserve and FDIC have been
working diligently to improve the capabilities for an orderly resolution of a G-SIFI under the U.S. Bankruptcy
Code and, if needed to protect the financial stability of the United States, the OLA provided in the Dodd-
Frank Act. In the past year, important progress has been made on international efforts to mitigate two
broadly recognized obstacles to a cross-border resolution of a G-SIFI.
First, in November 2014, the Financial Stability Board (FSB) published for consultation a proposal for a
common international standard on total loss-absorbing capacity for global systemically important banking
organizations (G-SIBs), which is intended to ensure that G-SIBs have sufficient financial resources to absorb
losses and enable resolution authorities to implement an orderly cross-border resolution. The FSB standard is
expected to be finalized by the end of 2015. In the United States, the Federal Reserve is considering adopting
a proposal that would require the largest, most complex U.S. banking firms to maintain a minimum amount
of long-term unsecured debt outstanding at the holding company level. The Council recommends that U.S.
regulators continue to work with foreign regulators and official sector bodies toward the finalization of the
FSB proposal. The Council also recommends that the Federal Reserve work toward proposing regulations
regarding maintenance of a minimum amount of long-term debt at the holding company level for the largest,
most complex U.S. BHCs.
Second, during 2014, the International Swaps and Derivatives Association (ISDA) and its members developed
a set of standard contractual amendments that should improve the resolvability of G-SIBs by providing for a
short-term suspension of termination rights and other remedies in the context of an orderly resolution. This
work was done in consultation with U.S. and foreign regulators. In November 2014, ISDA published the ISDA
2014 Resolution Stay Protocol, which enables parties to amend the terms of their relevant OTC derivatives
agreements to contractually recognize the cross-border application of certain special resolution regimes
and support the resolution of certain financial companies under the U.S. Bankruptcy Code. At that time,
18 of the largest banking organizations adhered to the protocol. To become fully effective, the protocol for
covered transactions among the 18 firms requires the issuance of regulations in the United States and foreign
countries. The Council recommends that the appropriate member agencies take steps, including through
notice-and-comment rulemaking, so that the provisions of the protocol become effective and to encourage a
more widespread adoption of contractual amendments to ISDA documentation and other financial contracts.
The Council also recommends that regulators and market participants continue to work together to facilitate
industry-developed mechanisms to address similar risks in other financial contracts governed by standardized
market documentation.
Annua l Repor t Recommendat ions

2 0 1 5 F S O C / / Annual Report14
In addition, in August 2014, the FDIC and the Federal Reserve Board delivered letters to the largest financial
firms regarding their second resolution plan submissions. In these letters, the agencies jointly identified
shortcomings among the firms’ submissions, and directed the firms to demonstrate in their 2015 plans
that they are making significant progress to address these shortcomings (see Section 6.1.3). The Council
recommends that the FDIC and Federal Reserve review and assess upcoming resolution plans and take
appropriate action to foster resolvability.
3.1.7 Data Quality, Collection, and Sharing
Efforts to address financial data gaps and promote standards must keep pace with changes in market
activity. Analysis into potential vulnerabilities in the financial system by market participants, regulators,
and researchers requires more detailed and frequent data, as well as new ways of integrating existing data.
The Council recommends that regulators and market participants continue to work together to improve the
quality, access and comprehensiveness of financial data in the United States and across global markets.
Regulators and supervisors should seek to attain greater visibility into certain sectors of the financial system.
The Council recommends that the SEC continue its work to address data gaps for the asset management
industry and that the appropriate member agencies continue to improve data collection on bilateral repo
and securities lending activities. The Council also recommends that the state insurance regulators and the
National Association of Insurance Commissioners (NAIC) continue to work to improve the public availability
of data, including financial statements relating to captive reinsurance activity, and that FIO continue to
monitor and publicly report on the regulatory treatment of issues relating to captive reinsurance, which FIO
previously noted as an area of concern in its Modernization Report.
Regulators are increasingly encouraging or requiring use of the LEI. However, the full benefits of the LEI
will not be realized without broader adoption. The Council recommends that members and member agencies
continue moving to adopt the LEI in reporting requirements and rulemakings, where appropriate. The
Council also recommends that member agencies support the adoption and use of standards in mortgage
data, particularly the CFPB’s efforts to develop a unique loan identifier, and the adoption and use of the LEI
in mortgage data collections.
For derivatives markets, swaps must now be reported to new entities known as SDRs and security-based swap
data repositories (SBSDRs). It is important that these data be sufficiently standardized for effective analysis
by regulators and with appropriate aggregation and protection for public dissemination. SDRs and SBSDRs
need to have strong and common standards to facilitate counterparty analysis by financial institutions, in
addition to aiding in the monitoring of financial stability by the regulatory community. Regulators’ access
to these data remains a challenge both in the United States and globally. The Council recommends that
members and member agencies work with international regulators to promote high standards in derivatives
data reporting and recommends that impediments to U.S. authorities’ access to data stored at repositories be
resolved.
During the financial crisis, the inability to access or share certain data prevented market participants and
regulators from fully understanding the size and scope of risks throughout the financial system. Both
increased data sharing and reporting efficiency could also help reduce the reporting burden on the industry.
The Council recommends that member agencies continue to explore best practices for data sharing and for
improving reporting efficiency.

15
3.2 Reforms to Address Structural Vulnerabilities
3.2.1 Reforms of Wholesale Funding Markets
Repo Markets
Significant progress has been made in recent years in reducing market participants’ reliance on intraday
credit from clearing banks. The share of tri-party repo volume funded intraday by the clearing banks
fell from 92 percent in December 2012, to under 20 percent in December 2013, to less than 5 percent in
December 2014. However, the industry is still working to bring the settlement of GCF repo transactions
in line with the reforms effected for tri-party repo generally, by moving the settlement for those trades in
step with the 3:30 p.m. unwind and making it much less reliant on intraday credit. The risk of fire sales of
collateral by creditors of a defaulted broker-dealer, many of whom may themselves be vulnerable to runs
in a stress event, remains an important financial stability concern. The Council recommends that market
participants continue to make progress toward extending improvements in the tri-party repo settlement
process to GCF repo settlement. The Council also urges continued coordination between market participants
and financial regulators to address the risk of post-default fire sales of assets by repo investors.
Money Market Mutual Funds
In July 2014, the SEC adopted structural and operational reforms to the rules governing MMFs in order to
address the risk of investor runs in those funds, as exhibited during the financial crisis. The new structural
and operational reforms for MMFs build upon the SEC’s 2010 MMF reforms. The reforms adopted in 2010
were designed to reduce the interest rate, credit, and liquidity risks of MMF portfolios and have provided
regulators and the public comprehensive data on MMF portfolios. The new rules require a floating net asset
value (NAV) for institutional prime MMFs, which were the funds that experienced significant redemptions
during September 2008, and institutional tax-exempt MMFs. Both government and retail funds will be
allowed to continue using stable NAVs.
The floating NAV reform addresses incentives for investor runs by requiring the daily share prices of these
funds to fluctuate along with changes in the market-based value of some fund assets. The reforms also
provide the boards of directors of non-government MMFs with new tools—liquidity fees and redemption
gates—that are intended to address runs during periods of stress. The reforms also enhance diversification,
disclosure, regulatory reporting, and stress testing requirements for MMFs. Finally, the reforms require
private liquidity funds that operate like MMFs to report on a monthly basis their full portfolio holdings on
Form PF to facilitate regulators’ understanding of these funds’ operations and investments.
The Council will monitor the effectiveness of the SEC’s reforms in addressing risks to financial stability—
including any unintended consequences of liquidity fees and gates—as well as the treatment of retail funds.
After these measures have been implemented, the Council intends to review and consider the effects of these
reforms and their broader implications for financial stability.
The Council recommends that regulators assess the extent to which other types of cash management vehicles
may present run risk or be relied upon as a source of short-term wholesale funding, and whether regulatory
gaps may exist for some of these vehicles. Other cash management vehicles of interest include short-term
investment funds, local government investment pools, and common and collective trust funds, particularly
those that serve as cash collateral reinvestment pools for securities lending transactions, as well as private
liquidity funds.
Annua l Repor t Recommendat ions
2 0 1 5 F S O C / / Annual Report16
3.2.2 Housing Finance Reform
The housing market was a proximate cause of the financial crisis, and yet six years have passed without major
statutory reforms to the housing finance system. Market conditions have improved over the past several years,
albeit at a gradual pace, with fewer underwater borrowers and improved loan performance. In the absence of
major housing finance reform, FHFA, primarily through its conservatorship and oversight of the GSEs, has
made progress to improve housing finance infrastructure and reduce the amount of taxpayer risk. However,
core challenges persist. The GSEs remain in conservatorship, subject to FHFA supervision, with the vast
majority of newly originated mortgages backed by the federal government either through the GSEs, FHA,
or other government-backed programs. Efforts to reinvigorate private capital’s role in supporting mortgage
markets should move forward in ways that provide access to credit for creditworthy borrowers, adequately
protect taxpayers, and support financial stability. The Council recommends that member agencies continue
to work with Congress and other stakeholders to carry out reforms of the housing finance system to achieve
these goals.
Promoting Comprehensive Housing Finance Legislation
Congress has debated several housing finance reform proposals, including separate pieces of legislation that
advanced out of the House Financial Services Committee in July 2013 and the Senate Banking Committee
in May 2014. While federal and state regulators have made progress toward improving both prudential
regulation and housing finance infrastructure, the Council reaffirms that, in the absence of legislative action,
federal and state regulators have limited scope to implement necessary reforms. Legislation would reduce
uncertainty in the mortgage market and enable market participants to make better long-term investment
decisions. Furthermore, without any resolution of the long-term relationship between the federal government
and the mortgage market, taxpayers will remain exposed to the GSEs’ balance sheets indefinitely. The
Council recommends that comprehensive legislation address the conservatorship of the GSEs and clarify the
future role of the federal and state governments in mortgage markets.
Reducing Taxpayer Risk by Facilitating Increased Private Mortgage Market Activity
Over the past year, the GSEs have continued to reduce their overall exposure to mortgage credit risk by
engaging in risk-sharing with market participants. FHFA has encouraged the GSEs to continue this process in
2015 by transferring credit risk of at least $270 billion in unpaid principal balance. The Council recommends
that FHFA continues to encourage the GSEs to engage in a variety of risk-sharing transactions to spread
mortgage credit risk across a broad spectrum of private capital providers.
The GSEs also continued the steady reduction of their retained portfolios, which declined by nearly 14
percent in 2014. Also, FHFA provided guidance that the GSEs should meet their annual cap even under
adverse conditions. This measured approach is designed to reduce taxpayer risk without impairing the overall
functioning of the housing finance system. The Council recommends further reduction in the GSEs’ retained
portfolios, particularly their less liquid assets, through measures that do not disrupt the stability of mortgage
markets or access to credit for creditworthy borrowers.
Reform of representations and warranties frameworks will also increase transparency and enhance
certainty for both mortgage investors and mortgage originators. FHFA and the U.S. Department of Housing
and Urban Development (HUD) have worked with the GSEs and the FHA, respectively, to clarify their
representations and warranties policies over the past few years. However, loan originators continue to cite
uncertainty regarding repurchase requirements as a major driver of their credit policies for GSE and FHA
loans, which are often more conservative than these institutions require. The Council therefore recommends
that FHFA, Treasury, and HUD work with market participants to more clearly define and standardize
representations and warranties.

17Annua l Repor t Recommendat ions
Building a New Housing Finance Infrastructure
The development of new infrastructure within the secondary mortgage market continued in 2014, as further
progress was made toward a functional Common Securitization Platform. FHFA has also actively sought input
on the design and implementation of methods to create fungible contracts in the to-be-announced market
for mortgage-backed securities (MBS) separately issued and guaranteed by the GSEs. This will enhance
liquidity in the secondary mortgage market by addressing certain trading disparities between existing
securities. The Council continues to support this effort to enhance efficiencies in the secondary market and
to allow for integration into a future system featuring the Common Securitization Platform.
3.2.3 Reforms Relating to Reference Rates
In its 2014 annual report, the Council recommended U.S. regulators cooperate with foreign regulators,
international bodies, and market participants to identify alternative interest rate benchmarks anchored in
observable transactions and supported by appropriate governance structures, as well as develop a plan for a
smooth and orderly transition to these new benchmarks. Significant progress has been made, including the
formation of the Alternative Reference Rates Committee (ARRC), a group of market participants working
with U.S. authorities to meet these recommendations, but more work is needed. The Council recommends
that U.S. regulators continue to cooperate with the ARRC and foreign authorities to fully implement the
recommendations of the FSB Report on Reforming Major Interest Rate Benchmarks, which was drafted as
part of an international process in which U.S. regulators were significant participants.
The Council also recommended that U.S. regulators continue to cooperate with foreign regulators and
official sector bodies in assessing market practices and benchmarks in FX markets. The FSB released a
report based on that work in 2014, and implementation of its recommendations has begun. The Council
recommends continued cooperation in implementing those recommendations.
The Council also recommends that U.S. agencies consider the International Organization of Securities
Commissions (IOSCO) Principles for Financial Benchmarks in their ongoing assessment of financial
benchmarks in the United States.


19Macroeconomic Env i ronment
4.1.1 Change in Real Gross Domestic Product
4.1.2 Change in Real Personal Consumption Expenditures
4.1 U.S. Economic Activity
4.1.1 Real Gross Domestic Product
The growth rate of U.S. real gross domestic
product (GDP) slowed to 2.4 percent during
2014, from 3.1 percent the previous year (Chart
4.1.1). After contracting in the first quarter
of 2014, real GDP grew at a solid pace during
the remainder of the year, supported by gains
in personal consumption expenditures (PCE)
and nonresidential fixed investment. In the
first quarter of 2015, real GDP increased at an
annual rate of 0.2 percent according to the
“advance” estimate released by the Bureau of
Economic Analysis (BEA). The deceleration
in real GDP growth in the first quarter
likely reflected transitory factors, as well as
a deceleration in PCE and declines in net
exports, nonresidential fixed investment, and
state and local government spending.
Consumption and Residential Investment
Real PCE increased at a moderate pace of 2.9
percent during 2014 (Chart 4.1.2), gaining
strength toward the end of the year. PCE
growth was supported by improved labor
market conditions, lower gasoline prices,
continued growth in household net worth, and
rising consumer confidence. An expansion in
credit availability likely also played a role in
increasing real PCE, particularly for automobile
purchases, but many forms of credit remain
limited for households with lower credit scores
or limited financial resources. BEA estimates
that real PCE increased at an annual rate of
1.9 percent in the first quarter of 2015. Real
disposable personal income grew 3.1 percent
in 2014 and its growth rate is estimated to have
accelerated to 6.2 percent in the first quarter of
2015.
In the first half of 2014, housing activity was
muted, likely reflecting transitory factors such
as bad weather and a step-up in mortgage
4 Macroeconomic Environment
0.0
0.1
0.2
0.3
0.4
0.5
0.0
0.5
1.0
1.5
2.0
2002 2004 2006 2008 2010 2012 2014Source: Census Bureau, Haver Analytics
As Of: Mar-2015Millions of Units
Note: Seasonally adjusted at an annualized rate. Multifamily housing starts are calculated on a 3-month moving average. Gray bar signifies NBER recession.
Millions of Units
Single-family(left axis)
Multifamily(right axis)
4.1.3 Private Housing Starts

20 2 0 1 5 F S O C / / Annual Report
3
6
9
12
3
6
9
12
1982 1987 1992 1997 2002 2007 2012
Source: BLS, Haver Analytics
As Of: Apr-2015Percent
Note: Gray bars signify NBER recessions.
Percent
-1000
-800
-600
-400
-200
0
200
400
600
-1000
-800
-600
-400
-200
0
200
400
600
2006 2007 2008 2009 2010 2011 2012 2013 2014 2015
Source: BLS, Haver Analytics
As Of: Apr-2015Thousands of Jobs
Note: Gray bar signifies NBER recession.
Thousands of Jobs
Monthly Change
3-Month Moving Average
4.1.6 Civilian Unemployment Rate
4.1.5 Net Change in Nonfarm Payroll Employment
4.1.4 U.S. Oil Imports and Production rates that began in mid-2013. However, in the
second half of the year, single-family housing
starts gradually resumed growth (Chart 4.1.3)
and sales of new homes rose, as mortgage
rates moved back down and the labor market
continued to improve. Despite these gains,
both housing construction and new home sales
remain well below long-term averages.
Business Fixed Investment
Real business fixed investment rose at a
moderate but uneven pace during 2014 and
early 2015, supported by the ongoing expansion
of economic activity and favorable corporate
financial conditions (see Section 4.2). Although
overall investment in mining continued to rise
through the end of 2014, some energy firms
have announced that they will reduce their
capital spending in response to the drop in oil
prices, and shipments of mining machinery
have recently declined sharply.
Government Purchases
Real government purchases edged up by
0.8 percent during 2014. State and local
governments benefited from increased tax
revenues, as real purchases increased 1.2
percent. Real federal government purchases
ticked up 0.2 percent in 2014 after decreasing in
each of the previous three years. The uptick was
driven by increases in nondefense spending,
which rose 1.1 percent. BEA estimates that real
government purchases fell slightly in the first
quarter of 2015.
Imports and Exports
Real exports of goods and services grew 2.4
percent during 2014, tempered by sluggish
foreign growth and a strengthening dollar.
BEA estimates that real exports declined at an
annual rate of 7.2 percent in the first quarter of
2015, compared to the previous quarter. Real
imports grew at a pace of 5.6 percent in 2014,
fueled by the stronger dollar and increased
business and consumer spending. This pickup
in imports occurred despite a decline in U.S.
oil imports, due in part to a rapid expansion
in domestic oil production (Chart 4.1.4). In
the first quarter of 2015, the growth rate of
21Macroeconomic Env i ronment
0
10
20
30
40
50
0
10
20
30
40
50
1982 1987 1992 1997 2002 2007 2012Source: BLS, Haver Analytics
As Of: Apr-2015Percent
Note: Long-term unemployment as a percent of total unemployment. Gray bars signify NBER recessions.
Percent
62
63
64
65
66
67
68
62
63
64
65
66
67
68
1982 1987 1992 1997 2002 2007 2012
Source: BLS, Haver Analytics
As Of: Apr-2015Percent
Note: Gray bars signify NBER recessions.
Percent
4.2.1 Private Nonfinancial Debt
4.1.8 Long-Term Unemployment
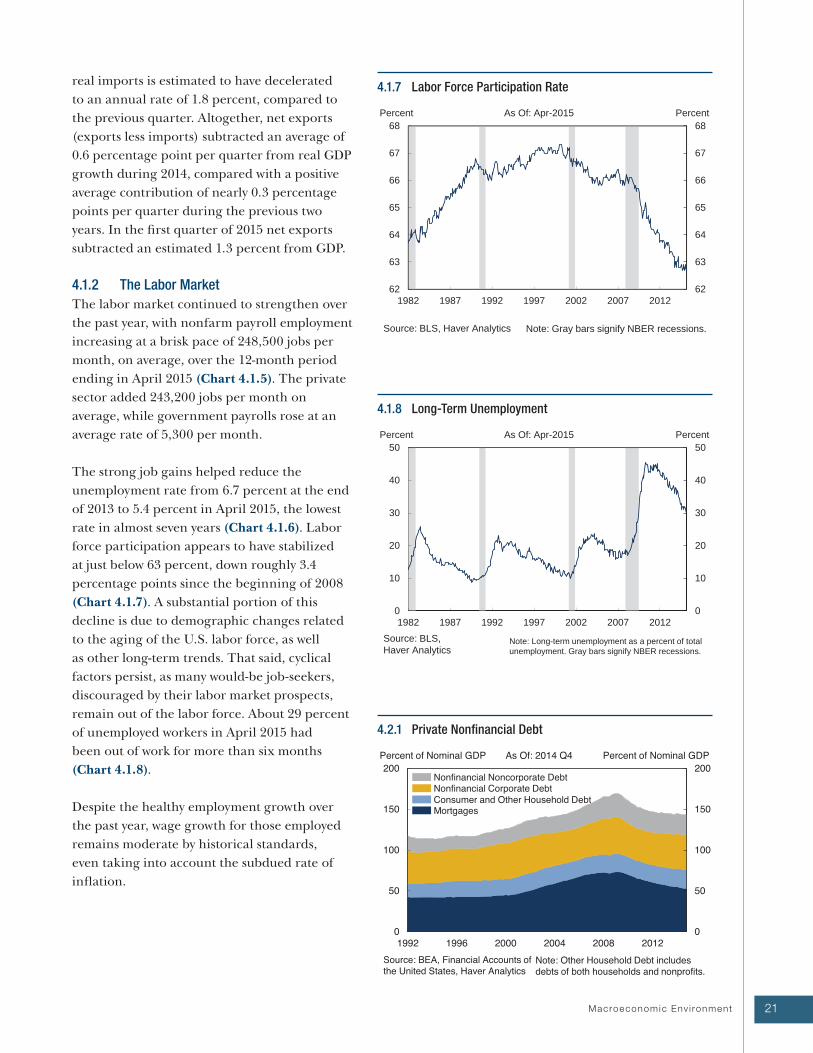
4.1.7 Labor Force Participation Ratereal imports is estimated to have decelerated
to an annual rate of 1.8 percent, compared to
the previous quarter. Altogether, net exports
(exports less imports) subtracted an average of
0.6 percentage point per quarter from real GDP
growth during 2014, compared with a positive
average contribution of nearly 0.3 percentage
points per quarter during the previous two
years. In the first quarter of 2015 net exports
subtracted an estimated 1.3 percent from GDP.
4.1.2 The Labor Market
The labor market continued to strengthen over
the past year, with nonfarm payroll employment
increasing at a brisk pace of 248,500 jobs per
month, on average, over the 12-month period
ending in April 2015 (Chart 4.1.5). The private
sector added 243,200 jobs per month on
average, while government payrolls rose at an
average rate of 5,300 per month.
The strong job gains helped reduce the
unemployment rate from 6.7 percent at the end
of 2013 to 5.4 percent in April 2015, the lowest
rate in almost seven years (Chart 4.1.6). Labor
force participation appears to have stabilized
at just below 63 percent, down roughly 3.4
percentage points since the beginning of 2008
(Chart 4.1.7). A substantial portion of this
decline is due to demographic changes related
to the aging of the U.S. labor force, as well
as other long-term trends. That said, cyclical
factors persist, as many would-be job-seekers,
discouraged by their labor market prospects,
remain out of the labor force. About 29 percent
of unemployed workers in April 2015 had
been out of work for more than six months
(Chart 4.1.8).
Despite the healthy employment growth over
the past year, wage growth for those employed
remains moderate by historical standards,
even taking into account the subdued rate of
inflation.

22 2 0 1 5 F S O C / / Annual Report
4.2.4 Noncurrent Commercial and Industrial Loans
4.2.3 Bank Business Lending Standards and Demand
4.2.2 Debt to Assets for Nonfinancial Corporations 4.2 Nonfinancial Balance Sheets
4.2.1 Nonfinancial Corporate Sector
Favorable economic conditions contributed
to solid earnings growth in 2014, lifting stock
prices and strengthening corporate balance
sheets. Corporations’ outstanding debt relative
to GDP continued to rise in 2014 (Chart
4.2.1), supported by robust gross issuance of
bonds in an environment of low interest rates
and favorable earnings. Total outstanding
bank and nonbank loans to corporations
also continued to rise. However, in late 2014
issuance of speculative-grade bonds slowed, in
part reflecting the increase in spreads as well as
the effect of lower oil prices on the prospects of
speculative-grade issuers in the energy sector.
Although gross total debt increased, the ratio
of debt to assets for the sector remains around
long-term averages (Chart 4.2.2).
Bank respondents to the Federal Reserve
Senior Loan Officer Opinion Survey on Bank
Lending Practices (SLOOS) reported stronger
demand in 2014 for commercial and industrial
(C&I) loans by firms as well as some easing of
underwriting standards (Chart 4.2.3).
Corporate credit performance remains strong.
The delinquency rate on C&I loans continued
to decline (Chart 4.2.4), and the default rate on
nonfinancial corporate bonds remained low in
comparison with recent history (Chart 4.2.5).
4.2.2 Noncorporate Business Sector
Financial conditions in the noncorporate
business sector, composed primarily of small
businesses, continued to improve in 2014.
Relative to the corporate sector, however, the
recovery in the noncorporate business sector
has been slow. Small businesses have fewer
financing options than corporations, with
bank loans constituting the principal form
of debt available to noncorporate businesses.
Noncorporate business debt accounts for about
one third of total nonfinancial business debt.

23Macroeconomic Env i ronment
4.2.7 Net Borrowing by Nonfinancial Noncorporate Businesses
4.2.6 Nonfinancial Noncorporate Assets
4.2.5 Nonfinancial Corporate Bond Default RateMost of the assets owned by noncorporate
businesses are in the form of real estate
(Chart 4.2.6), so changes in the value of real
estate collateral affect the sector’s ability to
borrow from banks. The decline in real estate
values during the financial crisis hindered
noncorporate borrowers’ ability to borrow
from banks (Chart 4.2.7). Since then, net
borrowing by noncorporate businesses has
gradually increased as rising real estate prices
and improving business conditions have
enabled banks to ease lending standards for
small firms, and boosted demand for C&I loans
(Chart 4.2.8). The number of small businesses
indicating difficulty in obtaining credit
continued to decline (Chart 4.2.9).

24 2 0 1 5 F S O C / / Annual Report
4.2.10 Household Debt as a Percent of Disposable Personal Income
4.2.9 Small Businesses' Difficulty Obtaining Credit
4.2.8 Bank Business Lending Standards and Demand
0
4
8
12
16
0
4
8
12
16
2000 2002 2004 2006 2008 2010 2012 2014
Source: NFIB, Haver Analytics
As Of: 2015 Q1Net Percentage
Note: Percent of firms reporting credit was harder to obtain minus those reporting credit was easier to obtain over the past three months. Gray bars signify NBER recessions.
Net Percentage
Reporting Credit Harder to Obtain
4.2.3 Household Sector
Since 2012, household debt has grown roughly
in line with disposable personal income, and
has remained at approximately 107 percent
of disposable personal income, well below the
pre-crisis high of 135 percent in 2007 (Chart
4.2.10). Mortgage debt continued to decline
despite improving labor markets, rising home
prices, and low mortgage rates. While borrowers
with high credit scores and other financial
resources generally have access to mortgages,
credit remains tight for many other households.
Slow debt growth, historically low interest rates,
and improving labor markets have reduced
the overall household debt service ratio to
near 30-year lows (Chart 4.2.11). Reduced debt
burdens and improving economic conditions
have allowed households to slowly become
more current on their debts. Since 2009, the
percentage of household debt that is delinquent
has decreased from nearly 12 percent to 6
percent, though it still remains significantly
above pre-crisis levels. The share of seriously
delinquent debt (more than 120 days) has also
declined, but remains elevated (Chart 4.2.12).
Thus, while aggregate measures of the debt
burden have improved, many households
continue to face difficulties meeting their
financial obligations.
Aggregate household net worth (the difference
between assets and liabilities) rose more than
$4 trillion in 2014, to almost $83 trillion,
primarily due to rising asset and equity prices
(Chart 4.2.13). Owners’ equity as a share of
household real estate continued to increase
with rising house prices, although it remains
well below its 1990 to 2005 average (Chart
4.2.14). Furthermore, the percentage of
mortgages with negative equity continued to
decline in 2014 (see Section 5.1.4).
Non-housing related debt, which accounts for
about one quarter of total household debt,
continued to expand in 2014, driven mainly
by an increase in auto loans and student loans
(Chart 4.2.15). The increase in auto loans
reflects eased credit conditions in this market

25Macroeconomic Env i ronment
-40-20020406080100120
-40-20
020406080
100120
2000 2002 2004 2006 2008 2010 2012 2014Source: Financial Accounts of the United States, Haver Analytics
As Of: 2014 Q4Trillions of US$
Note: Other Assets primarily include life insurance reserves, pension entitlements, and noncorporateequities. Other Debt primarily includes security credit, trade payables, and unpaid life insurance premiums.
Trillions of US$Other AssetsEquitiesCredit Market InstrumentsCash InstrumentsReal Estate
MortgagesConsumer CreditOther Debt
Net Worth
0
3
6
9
12
15
0
3
6
9
12
15
2003 2005 2007 2009 2011 2013Source: FRBNY Consumer CreditPanel/Equifax, Haver Analytics
As Of: 2014 Q4Percent
Note: Severely derogatory loans are loans for which there are reports of a repossession, charge off to bad debt, or foreclosure.
Percent
Severely Derogatory120+ Days Late90 Days Late60 Days Late30 Days Late
4.2.13 Household and Nonprofit Balance Sheets
4.2.12 Share of Household Debt by Delinquency Status
4.2.11 Household Debt Service Ratioand rising consumer demand for motor vehicles
(see Section 5.4.3). Federal student loan
programs remain the primary source of student
loan balances, which continued to rise against
a backdrop of increasing costs of education, a
growing number of borrowers, and increasing
participation in repayment programs that
reduce required payments and lengthen loan
terms.
Delinquency rates on credit cards and
mortgage loans declined further in 2014, while
delinquencies on student loans and home equity
lines of credit (HELOCs) were little changed.
Except for credit card loans, delinquency rates
overall remained elevated compared to pre-
crisis levels (Chart 4.2.16). Lower delinquency
rates for credit cards reflect, in part, a
composition shift toward borrowers with higher
credit scores. The delinquency rates on credit
cards to consumers with prime and super-prime
credit scores are currently near their historical
averages. The delinquency rate on student loans
remained elevated at about 12 percent in 2014.
Large and growing student-debt burdens and
slowly recovering labor markets have pushed
many younger borrowers into delinquency.
The risk to lenders is mitigated by the fact
that student loans are difficult to discharge in
bankruptcy, and the federal government has
extraordinary collection authorities on loans
it originated or guaranteed. However, high
student-debt burdens could impact household
consumption and limit access to other forms of
credit, such as mortgages.

26 2 0 1 5 F S O C / / Annual Report
4.2.16 90+ Day Delinquency Rate by Loan Type
4.2.15 Components of Consumer Credit
4.2.14 Owners’ Equity as Share of Household Real Estate 4.3 Government Finance
4.3.1 Federal Government
The federal unified budget deficit continued
to shrink in fiscal year 2014, with outlays
exceeding revenue by 2.8 percent of nominal
GDP, down from 4.1 percent in 2013 (Chart
4.3.1). This represents the smallest deficit in the
post-crisis period, and a return to the 50-year
historical average. Outlays maintained their
downward trajectory and fell to 20.3 percent of
GDP, while revenue increased to 17.5 percent of
GDP.
The path of outlays and revenues over the next
decade depends on both the performance
of the economy and changes to fiscal policy.
The Congressional Budget Office (CBO)
baseline projects the deficit to move slightly
lower in 2015 and remain stable through 2018,
before expanding thereafter. This projected
expansion is mainly due to increases in outlays,
as revenues are expected to remain roughly flat
at around 18 percent of GDP through 2025. The
projected increases in outlays over this period
are primarily due to an aging population, rising
health care costs, and larger interest payments
on the federal debt (Chart 4.3.2). The expected
increase in interest payments, in turn, reflects
assumptions of higher interest rates in the
future. Together the projected rise in outlays
is expected to outweigh the savings associated
with the slightly lower levels of discretionary
spending. Federal debt held by the public—
which includes Federal Reserve holdings, but
not other intra-governmental debt—increased
nearly 2 percentage points as a share of GDP in
2014, reaching 74.1 percent of GDP at year-end.
The CBO baseline projects federal debt held by
the public to hold relatively steady in the near
future, with a modest decrease through 2018
before an increase to 77.1 percent of GDP by
2025 (Chart 4.3.3).
The three major credit rating agencies left
their overall ratings of U.S. sovereign debt
unchanged over the past 12 months, and
each maintains a stable outlook for Treasury
securities. After the completion of the Federal

27Macroeconomic Env i ronment
4.3.3 Federal Debt Held by the Public
4.3.2 Outlays in Major Budget Categories
4.3.1 Federal Revenues and OutlaysReserve’s asset purchase program, demand for
Treasury securities remains strong among both
domestic and foreign institutions, as evidenced
by allocations to various investor classes and the
relatively high bid-to-cover ratios at Treasury
auctions.
Low interest rates have kept interest outlays
on the federal debt at around 1.3 percent of
GDP, similar to the low levels seen throughout
the post-crisis period. The average maturity of
outstanding federal debt continued to climb
in 2014, reaching its highest level since 2001
(Chart 4.3.4).
4.3.2 State and Local Governments
The fiscal position of state and local
governments improved modestly in 2014.
Nominal tax revenue growth was positive
for the year but the rate of growth declined
through the third quarter (Chart 4.3.5). State
and local spending grew in 2014, as states
rolled back some cuts to discretionary spending
enacted after the crisis, but then fell in the first
quarter of 2015. This improved fiscal picture
has been accompanied by growth in state and
local employment over the past year. Despite the
modest gains, the current pace of employment
growth in state and local governments
remains sluggish, as more than five years after
the recession, state and local government
employment remains more than 600,000 jobs
below its previous peak (Chart 4.3.6).
One long-term challenge facing state and local
governments relates to the underfunding of
pension and other post-employment benefit
systems (see Section 5.5.3). Many governments
have not set aside sufficient funding for
their ongoing obligations to provide post-
employment health care to retired employees,
resulting in large unfunded liabilities. Legal
protections for retiree health care are limited
in most jurisdictions and the percentage of
government entities offering retiree coverage
continues to drop.

28 2 0 1 5 F S O C / / Annual Report
17.5
18.0
18.5
19.0
19.5
20.0
17.5
18.0
18.5
19.0
19.5
20.0
2000 2002 2004 2006 2008 2010 2012 2014
Source: BLS, Haver Analytics
As Of: Apr-2015Millions of Employees
Note: Gray bars signify NBER recessions.
Millions of Employees
40
44
48
52
56
60
64
68
72
1.0
1.4
1.8
2.2
2.6
3.0
3.4
1981 1986 1991 1996 2001 2006 2011Source: BEA, OMB, Haver Analytics
As Of: 2014 Q4Percent of GDP
Note: Gray bars signify NBER recessions.
Months
Interest Outlays (left axis)
Average Maturity of Outstanding Debt
(right axis)
4.3.6 State and Local Government Employment
4.3.5 Change in State and Local Government Tax Revenues
4.3.4 Interest Outlays and Average Maturity of U.S. Public Debt These funding challenges have been reflected
in the credit ratings of some state and local
issuers, with the number of downgrades
outweighing the number of upgrades over the
past year, despite upgrades for New York and
California, among other states. Structural
budget imbalances—in part due to unfunded
pension liabilities—have led to credit
downgrades for states including New Jersey,
Kansas, Pennsylvania, and Michigan, along
with Puerto Rico (see Box A) and cities such as
Chicago. Challenges of this nature have also
prompted notable defaults in recent years by
Detroit; Jefferson County, Alabama; and several
California municipalities. However, these more
severe events appear to be idiosyncratic and not
representative of a broader trend in municipal
credit.
Net credit flows to state and local governments
were mixed in 2014. Municipal bond funds
experienced very strong inflows for each of
the 12 months of the year (Chart 4.3.7), but
bond issuance was relatively unchanged year-
over-year at about $335 billion, with declines in
new issuance largely offsetting an increase in
refunding stemming from lower interest rates
in the second half of the year (Chart 4.3.8).
Yield spreads for general obligation bonds—a
proxy for municipal bond demand—generally
tightened over the year (Chart 4.3.9). The
municipal bond sector had an overall return
of 9 percent, above that of other fixed income
asset classes.

29Macroeconomic Env i ronment
Puerto Rico continues to face a difficult fiscal situation
due to high levels of debt and the lack of economic
growth. The outstanding debt of roughly $73 billion
represents more than 100 percent of gross national
product. The vast majority of Puerto Rico’s debt is
exempt from federal, state, and local taxes in the
United States. Many municipal bond mutual funds
hold this debt although most funds have been
reducing their holdings. Additionally, hedge funds and
distressed debt traders have also invested in Puerto
Rico debt.
For the past several years the government of
Puerto Rico has pursued reforms to help address
these challenges, including raising taxes, cutting
expenditures, and reforming the government pension
systems. The fiscal situation, however, continues to
be challenging and the rating agencies have further
downgraded Puerto Rico and public corporation
debt, in part based on the Commonwealth’s limited
liquidity position and lower-than-forecasted tax
revenue.
Commonwealth debt yields rose significantly over the
past six months with some types of debt yielding over
10 percent (Chart A.1). Despite problems exhibited
by Puerto Rico, there has been little spillover thus far
to the broader municipal bond market. Overall inflows
into municipal bond mutual funds remain positive
and average municipal bond yields have fallen. The
continued deterioration in the economic and financial
conditions in Puerto Rico, however, could impact the
municipal debt market.
Box A: Municipal Debt Markets: Challenges in Puerto Rico
Source: Bloomberg, L.P.
8.0
8.5
9.0
9.5
10.0
10.5
11.0
2.0
2.5
3.0
3.5
4.0
4.5
Mar:14 May:14 Jul:14 Sep:14 Nov:14 Jan:15 Mar:15
Percent PercentAs Of: 31-Mar-2015
20-Year AAA GO (left axis)Puerto Rico (right axis)
Note: Puerto Rico yields based on 8 percent GO bonds maturing 7/1/2035.
A.1 Municipal Bond Yields

30 2 0 1 5 F S O C / / Annual Report
4.3.9 Municipal Bond Spreads
4.3.8 Municipal Bond Issuance
4.3.7 Long-Term Mutual Fund Flows: Municipal Bonds 4.4 External Environment
4.4.1 Advanced Foreign Economies
Growth in the advanced economies was
sluggish and uneven in 2014. The United
States, Canada, and the United Kingdom
have been expanding moderately. Recovery of
growth in the euro area stalled in early 2014
(Chart 4.4.1). In Japan, GDP contracted in
the second and third quarters of 2014 due to a
hike in its consumption tax rate. In response
to weak economic growth, low inflation, and
related factors, central banks in some advanced
economies have lowered key policy rates into
negative territory. Additionally, shorter-term
sovereign bond yields in Japan and a number
of European countries are trading in negative
territory. The IMF expects growth in the
advanced economies to strengthen in 2015,
led by strong growth in the United States and
continued recovery in the euro area
(Chart 4.4.2).

31Macroeconomic Env i ronment
4.4.3 Euro Area Real GDP Growth
4.4.2 Real GDP Growth
4.4.1 Advanced Economies Real GDP GrowthEuro Area
Growth in the euro area stopped improving in
2014, largely as a result of weak investment and
exports. Germany grew at 1.6 percent, while
France stagnated, and Italy contracted (Chart
4.4.3). Headline inflation (including food and
energy) in the euro area has continued to fall
and dipped below zero in the fourth quarter of
2014 (Chart 4.4.4), in part because of sustained
economic slack, but also because of the sharp
drop in oil prices in the second half of 2014.
While supportive of growth, oil price declines
are dampening inflation, which could further
depress medium-term inflation expectations
and exert upward pressure on real interest
rates. So far, however, real interest rates have
continued to decline as these pressures have
been more than offset by the sharp decline
in nominal yields related to the European
Central Bank’s (ECB) bond purchases under
its asset purchase program designed to support
the recovery and bring inflation back to the
2 percent target. These large-scale purchases
of public and private bonds complement
other stimulus measures that the ECB has
announced since June 2014, such as lowering
the rates on its main refinancing operations
and deposit facilities, and introducing targeted
longer-term refinancing operations to support
bank lending to households and nonfinancial
corporations. In 2014, the ECB also performed
a comprehensive assessment of euro area banks
(see Box B). The IMF predicts that real GDP
in the euro area will expand by 1.5 percent in
2015, and 1.6 percent in 2016, supported by
a combination of accommodative monetary
policy, a more neutral fiscal policy stance, lower
energy prices, looser financial conditions, and a
weaker currency.

2 0 1 5 F S O C / / Annual Report32
The ECB released the results of its comprehensive
assessment of euro area banks in October 2014.
The assessment was conducted in advance of the
launch of the Single Supervisory Mechanism (SSM),
which became operational in early November. Under
the SSM, the ECB directly supervises “significant”
(larger) banks, and indirectly supervises the “less
significant” (smaller) banks in cooperation with the
national-level authorities. The ECB’s comprehensive
assessment was designed to enhance transparency
and strengthen the balance sheets of the 130
banks directly supervised by the SSM, thereby
assuring investors that these banks are sufficiently
capitalized. The comprehensive assessment had two
components:
1. The asset-quality review: This review was a
health check of banks’ assets as of December
31, 2013, which resulted in additional provisions
for losses on exposures on banks’ balance
sheets, leading to downward revisions to the
capital of some banks.
2. Stress test: Starting from the asset-quality
review-adjusted capital ratios, this exercise
examined banks’ ability to maintain minimum
capital levels over a three-year period under a
baseline and an adverse stress scenario. The
adverse stress scenario entailed an increase
in global bond yields; further deterioration
in credit quality; increased cost of funding
for banks; and higher borrowing costs for
households and corporations, as well as
declines in GDP and inflation relative to the
baseline scenario. Under the adverse scenario,
banks were required to maintain a minimum ratio
of common equity tier 1 capital to risk-weighted
assets (RWAs) of 5.5 percent.
Overall, the comprehensive assessment identified a
capital shortfall of €25 billion across 25 banks in the
euro area. After taking into account the capital raised
between January 1, 2014 and September 30, 2014,
€9.5 billion remained to be filled among 13 banks.
Despite the new capital raised, the assessment
identified 14 banks that did not meet a minimum
requirement of 3 percent for the leverage ratio, which
will likely become a regulatory requirement in Europe
in 2018.
All told, the assessment encouraged banks to raise
capital and improved the transparency of banks’
balance sheets, but vulnerabilities at some banks
remain. European authorities are now enhancing their
focus on factors beyond capital-raising to resolve the
€1 trillion stock of non-performing loans and remove
impediments to market-based finance through the
European Commission’s Capital Markets Union.
Box B: ECB’s Comprehensive Assessment of Euro Area Banks

33Macroeconomic Env i ronment
4.4.5 Japanese Real GDP Growth
4.4.6 Japanese Consumer Price Inflation
4.4.4 Euro Area Consumer Price InflationJapan
Japanese real GDP grew at a robust 5.1
percent in the first quarter of 2014, as
households anticipated spending ahead of
the April 1 consumption tax hike (Chart
4.4.5). However, this gain was more than
fully reversed the following quarter, as
the severe decline in household spending
following the tax hike resulted in a sharp
contraction in GDP. Japanese GDP contracted
again in the third quarter, amid continuing
weak domestic demand and a reduction in
inventory investment. With the economy in
recession, Prime Minister Abe delayed a second
consumption tax hike—originally planned for
October 2015—to April 2017. In addition, to
combat low inflation (Chart 4.4.6), in October
2014, the Bank of Japan (BoJ) increased the
pace of its asset purchases. The government
also rebalanced Japan’s largest pension fund
away from domestic bonds toward domestic
equities and foreign assets. This additional
monetary policy accommodation, together with
lower energy prices and the delay of the second
consumption tax hike, is generally anticipated
to strengthen growth in 2015 and 2016.
4.4.2 Emerging Market Economies
In 2014, economic growth in EMEs edged down
further to 4.6 percent, which marks the fifth
consecutive slowdown in emerging market
growth since the post-crisis rebound in 2010.
Chinese growth slowed in 2014 as the economy
continued to rebalance away from export- and
investment-led growth. Elsewhere in emerging
Asia, growth was relatively robust in 2014.
Growth in Latin America was restrained by
lower commodity prices and in some cases by
tighter financial conditions or longstanding
structural bottlenecks. For commodity
exporters, lower commodity prices also weighed
on growth. In particular, the Russian economy
was hampered by the effects of sanctions, lower
oil prices, and turbulence in financial markets.

34 2 0 1 5 F S O C / / Annual Report
4.4.9 Chinese Credit Growth
4.4.8 Chinese Property Prices
4.4.7 Chinese Real GDP Growth According to the IMF, the pace of emerging
market growth in 2015 is expected to drop by
0.3 percentage point to 4.3 percent, weighed
down by the continued slowing in China and
subdued growth in Latin America.
China
Chinese real GDP growth edged down to
7.3 percent in 2014, close to the authorities’
target of 7.5 percent (Chart 4.4.7). Growth
was supported by strong exports, but this was
more than offset by a moderation in residential
investment growth amid a cooling property
market (Chart 4.4.8). Property prices have been
falling rapidly since May 2014, and declined
by about 10 percent at an annual rate in July
through October. The price declines have
also become widespread, affecting all but a
few cities in the 70-city index. Consumer price
inflation has been falling since May 2014 and
was 1.6 percent for the 12 months through
December 2014. For 2015, Chinese officials
reduced their growth target to “approximately
7 percent” and their inflation target to “around
3 percent,” citing the formidable difficulties
faced by the Chinese economy as it attempts to
rebalance toward a sustainable growth path in a
challenging external environment. In the
first quarter of 2015 Chinese real GDP grew by
7.0 percent.
In response to the global financial crisis,
Chinese authorities induced a massive increase
in bank lending to local governments and the
property sector (Chart 4.4.9). This surge was
accompanied by an even faster expansion in
nontraditional forms of credit, especially trust
loans (Chart 4.4.10). Overall credit to the
nonfinancial private sector has continued to
increase, albeit at a slower pace, reaching 191
percent of GDP in September 2014
(Chart 4.4.11).

35Macroeconomic Env i ronment
The People’s Bank of China has been trying
to manage a smooth transition toward a
more sustainable growth path, while trying to
discourage nontraditional forms of lending.
In late 2014, the People’s Bank of China took
a series of measures to try to lower firms’
financing costs, which included liquidity
injections into large- and medium-sized banks,
cuts to banks’ benchmark lending and deposit
rates, and an easing of macroprudential
measures to support the property sector.
Further measures were taken in early 2015,
including a cut in bank reserve requirements
and an expansion in local governments’ ability
to issue debt.
4.4.11 Credit to the Chinese Nonfinancial Private Sector
4.4.10 Components of Chinese Nonbank Credit Growth


37
5.1.1 10-Year Treasury Yields
5.1.2 2-Year Treasury Yields
5.1.3 Publicly Held Federal Debt Outstanding
5 Financial Developments
5.1 Asset Valuations
5.1.1 Fixed Income Valuations
Two broad and interlinked themes dominated
valuation and issuance patterns in fixed income
markets over the last 12 months. The first is
that a weaker outlook for the global economy,
large-scale policy accommodation by the ECB
and the BoJ, and global disinflation pressures
associated with the falling price of oil, have
all put downward pressure on global long-
term interest rates. This has happened despite
the strengthening of the U.S. economy and
the approaching normalization of domestic
monetary policy.
The second theme is that, in the low-rate
environment, investors continued to reach for
yield by accepting larger amounts of risk in
exchange for relatively smaller increments in
yield. The greater incremental return available
in the United States may be prompting more
foreign buying of U.S. assets, further pushing
down domestic fixed income yields. These
trends are particularly acute in high-yield
and emerging market bonds, leveraged loans,
and commercial mortgage-backed securities
(CMBS). Amidst heavy issuance volumes
in corporate credit markets, debt spreads
narrowed and underwriting standards loosened
until the oil price-driven sell-off starting in
late 2014. Changes in the types of investors and
markets for certain assets heighten concerns
about potential credit and liquidity risks
(see Section 7).
U.S. Treasuries
The Treasury yield curve flattened during
2014. Long-term U.S. Treasury yields fell in the
second half of 2014 due to the macro pressures
mentioned above. In 2015, yields again dropped
sharply to near-record lows, but have since
recovered to just below December 2014 levels.
F inanc ia l Deve lopments

38 2 0 1 5 F S O C / / Annual Report
0
50
100
150
200
250
300
0
50
100
150
200
250
300
2005 2006 2007 2008 2009 2010 2011 2012 2013 2014 2015
Merrill Lynch Option Volatility Estimate
(MOVE) Index
1994-PresentMOVE Average
Basis Points Basis Points
Source: Bloomberg, L.P.
As Of: 31-Mar-2015
Note: Implied volatility is calculated using a yield curve-weighted index of the normalized implied volatility on 1-month Treasury options.
5.1.6 European 10-Year Yields
5.1.5 Fixed Income Implied Volatility
5.1.4 Foreign Holders of U.S. Federal Debt Year over year, 10-year Treasury note yields
have fallen by 79 basis points to 1.94 percent
in March 2015. At the same time, the real yield
on Treasury Inflation-Protected Securities has
fallen 42 basis points to nearly zero
(Chart 5.1.1).
In contrast, yields on 2-year Treasury notes have
been gradually increasing since mid-2014, as
the U.S. economy continues to improve and the
expected date of monetary policy normalization
approaches (Chart 5.1.2). As of the end of the
first quarter of 2015, 2-year Treasury notes stood
at 0.56 percent, roughly 12 basis points higher
than at the same period last year.
The total outstanding U.S. sovereign debt
held by the public increased slightly over the
previous year to $13.1 trillion as of March 2015
(Chart 5.1.3). Over the same period, foreign
holdings of U.S. Treasury securities increased
by $273 billion, reaching $6.2 trillion. The
countries with the largest holdings, Japan and
China, hold over $2.4 trillion, or approximately
40 percent of total foreign (Chart 5.1.4).
Fixed income volatility, as measured by prices
of options on Treasury securities, was mostly
flat in 2014, but spiked in early 2015 and is now
closer to its long-term average (Chart 5.1.5).
Developed Markets Sovereign Debt
Other developed markets also experienced
significant decreases in their sovereign yields in
2014 (Chart 5.1.6). German and other core euro
area debt yields dropped even more sharply
than those in the United States amidst a slowing
euro area economy, declines in realized and
expected inflation, and additional monetary
policy accommodation by the ECB. Over the
year ending March 2015, German 10-year
government bond yields declined by 139 basis
points to 0.18 percent. Consequently, the spread
between U.S. Treasury securities and German
Bunds of 176 basis points is significantly above
its long-run average. In an extraordinary
development, many core European bonds
maturing in seven years or fewer are trading at
negative yields.

39 F inanc ia l Deve lopments
5.1.9 Emerging Market Bond Spreads
5.1.8 Emerging Market Gross Global Bond Issuance
5.1.7 Gross Capital Flows to EMEsConsistent with these trends, 10-year sovereign
yields in the United Kingdom declined by 116
basis points to 1.58 percent over the 12-month
period ending in March 2015.
With the exception of Greece, spreads on 10-
year government bonds of peripheral European
countries over their German equivalent also
declined substantially in 2014. At the end of
March 2015, the yield on peripheral European
debt was significantly lower than that of U.S.
Treasury securities. In contrast, Greek sovereign
bond spreads increased by 645 basis points over
the 12-month period ending in March 31, 2015,
amid concerns about the willingness and ability
of the newly elected government to implement
reforms necessary to borrow critical funds from
the EU and the IMF and maintain ECB liquidity
support for Greek banks. In Japan, government
bond yields declined 24 basis points over the
12-month period ending in March 31, 2015, to
0.40 percent.
Emerging Market Debt
Amid record gross issuance of emerging market
debt in 2014, capital inflows to emerging
markets remained strong (Charts 5.1.7, 5.1.8).
Furthermore, dollar credit to EMEs has grown
rapidly since the financial crisis, driven largely
by a surge in offshore corporate bond issuance.
Sudden changes in market sentiment may elicit
capital flight and pose challenges to rolling
over maturing bonds. Also, a rise in yields in
advanced economies could spark a sell-off
in emerging market bonds and destabilize
markets, as occurred in the summer of 2013.
Spreads to U.S. Treasury securities on emerging
market dollar bonds generally declined during
the first half of 2014, but then increased in the
second half (Chart 5.1.9). Spreads widened
across most emerging markets, although
moves were particularly acute in a few troubled
countries, such as Russia and Venezuela.
Russian sovereign debt was downgraded to
below investment grade status. Venezuelan debt
is now trading at severely distressed levels with
the fall in oil prices (see Box C). Spreads on
Brazilian debt have also widened.

40 2 0 1 5 F S O C / / Annual Report
5.1.12 CMBS Senior Debt Spreads
5.1.11 CMBS Issuance
5.1.10 Agency MBS Yield and Spread MBS and Other Securitized Products
Consistent with strong demand from investors,
risk premia for agency MBS, as measured by the
spread between 30-year MBS yields and 10-year
U.S. Treasury yields, remain depressed
(Chart 5.1.10). New issuance of private-label
securities backed by residential mortgages
remains dormant. Net agency issuance was
only slightly positive in 2014 at $87 billion,
reinforcing the dynamic of tight supply with
increasing demand.
Strong CMBS issuance continued in 2014, but
volumes were still well below 2007 peak levels
(Chart 5.1.11). Spreads remained relatively tight
in 2014 (Chart 5.1.12), and lenders continued
to ease underwriting standards by allowing
longer amortization schedules and higher loan-
to-value ratios. Even so, current underwriting
standards are not as weak as they were before
the financial crisis.
While delinquency rates remain low by
historical standards, there are potential risks
in the commercial real estate (CRE) market.
Over 50 percent of outstanding securitized CRE
loans will need to be refinanced over the next
three years. A significant rise in interest rates
could cause a decline in property values and
lower debt service coverage ratios. This could
make refinancing difficult for some borrowers
and result in an increase in delinquencies.

41 F inanc ia l Deve lopments
0.0
0.5
1.0
1.5
2.0
2.5
3.0
0.0
0.5
1.0
1.5
2.0
2.5
3.0
2004 2006 2008 2010 2012 2014
Trillions of US$ Trillions of US$
Source: BAML High-Yield Strategy, S&P LCD
As Of: 2014
High-Yield BondsLeveraged Loans
0
200
400
600
800
1000
0
50
100
150
200
250
300
350
400
2010 2011 2012 2013 2014 2015Source: Bank of America Merrill Lynch, Federal Reserve, S&P LCD
As Of: 31-Mar-2015
Leveraged Loans (right axis)High-Yield (right axis)Investment Grade (left axis)
Basis Points Basis Points
Note: Secondary market spreads. Investment grade and high-yield data represent option-adjusted spreads.Dotted lines represent 1997-to-present median.
5.1.15 Outstanding Investment Grade Bonds
5.1.14 Total High-Yield Debt Outstanding
5.1.13 Corporate Credit SpreadsCorporate Credit
Corporate credit issuance was strong in 2014,
although issuance declined somewhat in the
second half of the year as spreads increased.
After tightening to post-crisis lows in mid-2014,
credit spreads have now widened out nearly to
historical median levels, driven mostly by moves
in the energy sector (see Box C, Chart 5.1.13).
After reaching a record $2.20 trillion in 2013,
total outstanding high-yield debt continued
to increase in 2014, reaching $2.48 trillion
(Chart 5.1.14). Outstanding investment grade
debt also continued to rise, particularly in
the industrials sector (Chart 5.1.15). In 2014,
underwriting standards weakened further
amid strong issuance, as evidenced by both the
increase in leverage in new issuance (Chart
5.1.16), as well as reduced lender protections. In
leveraged loans, “covenant-lite” issuance, which
provides less protection to lenders by foregoing
the maintenance covenants typically seen in
secured lending, rose to its highest levels ever
as a percentage of total leveraged issuance
(Chart 5.1.17). Issuance of debt for leveraged
buyouts and acquisitions, which are historically
associated with higher use of leverage, also
increased. However, leveraged buyout- and
leveraged merger and acquisition-related
volume was still only 76 percent of 2007 levels.
Leveraged buyout issuance was at 45 percent
of 2007 levels.

42 2 0 1 5 F S O C / / Annual Report
5.1.17 Covenant-Lite Volume as a Percent of Total Issuance
5.1.16 Leveraged Loans: Debt to EBITDA Ratios Guidance issued by the banking agencies in
2013 set forth standards for sound leveraged
lending practices and stated that financial
institutions should ensure they do not
unnecessarily heighten risks by originating
poorly underwritten loans. However, the SNC
Review for 2014, undertaken by the FDIC,
Federal Reserve, and OCC, found serious
deficiencies in underwriting standards and risk
management practices of leveraged loans issued
by supervised institutions.
The SNC review identified several areas where
institutions need to strengthen compliance
with the guidance, including provisions
addressing borrower repayment capacity,
leverage, underwriting, and enterprise
valuation. While institutions have formally
addressed many of the risk management
issues noted in the guidance, full
implementation has not been achieved.
Examiners noted numerous exceptions at
all the large leveraged loans originators.
In response to these findings, the federal
banking agencies stated that institutions
that participate in leveraged lending without
implementing strong risk management
practices will be criticized and that the agencies
plan to increase the frequency of their reviews
of this activity. The federal banking agencies
also reiterated their expectations that loans
should be originated with a sound business
premise, a sustainable capital structure, and
borrower capacity to repay the loan or de-lever
to a sustainable level over a reasonable period.

43 F inanc ia l Deve lopments
5.1.19 Share of Leveraged Loan Primary Market by Investor Type
5.1.18 CLO IssuanceRecent public data shows total leveraged loan
issuance for the first quarter of 2015 dropped
abruptly, partly due to a sharp rise in credit
spreads near the end of 2014. However, over
the same period, the leveraged loan market
witnessed moderate improvement in the quality
of new issue loans, along with a decline in the
share of loans associated with high leverage and
lower credit ratings.
Collateralized loan obligations (CLOs) remain
the most important buyer of leveraged loans,
with both CLO issuance levels and their share
of the primary loan market at all-time highs
(Charts 5.1.18, 5.1.19). The continued search
for higher yielding assets by institutional
investors has helped spur demand for CLO
tranches. Meanwhile, demand from banks for
leveraged loans continues to decline, with CLOs
and loan mutual funds supplanting this buyer
base since the crisis. On the supply side, CLO
managers are motivated to issue deals prior to
new risk-retention regulations that will come
into place in December 2016. Loan mutual
funds saw significant net outflows of $21 billion
in 2014, but nevertheless purchased 19 percent
of leveraged loan primary issuance in 2014,
compared to just 4 percent in 2008.

2 0 1 5 F S O C / / Annual Report44
Box C: Implications of Lower Oil Prices
Oil reached a peak price of $115 per barrel (Brent
crude) in June 2014, but then dropped precipitously
to $57 per barrel at the end of 2014. This is only the
fourth time in the last 30 years the price has fallen
more than 50 percent in six months. The move
has had significant repercussions across financial
markets, as currencies, equities, and credit assets
linked to the price of oil have fallen in value.
Likely Causes of the DeclineThe main driver of this decline is likely favorable
supply conditions, including increased shale
production from the United States, and the recovery
of production and exports from Iraq and Libya.
In addition, prices dropped sharply following the
decision by the Organization of the Petroleum
Exporting Countries (OPEC) in November 2014
to keep its production levels unchanged. But the
decline is also partly in response to weaker-than-
expected demand from China and other oil importers
amid weaker global growth. Notably, oil has far
underperformed industrial metals this past year,
whereas previously metals and oil were tightly linked
through global demand channels (Chart C.1). This
divergence further supports the view that supply
factors were an important driver of the recent oil price
declines.
Impact on U.S. and Global GrowthThe IMF estimates that the positive effect of lower oil
prices on growth will outweigh the negative effects
from the slowdown of investment in energy and the
increased financial risks to oil-exporting countries.
In addition, the disinflationary effects of lower oil
prices should provide more room for monetary policy
accommodation in countries facing higher inflation.
All told, the IMF projects that, on net, the decline
in oil prices will expand U.S. GDP in 2015 by an
additional 0.8 percent, and global GDP by 0.5 to 0.7
percent. In the United States, lower oil prices should
boost consumer spending—the Energy Information
Administration estimates that lower gasoline prices
will increase disposable income of this year by $700
on average across U.S. households.
Regional Bank LendingWhile the economic benefits of lower oil prices are
shared widely, some oil-dependent sectors and
regions of the country will likely experience adverse
consequences. For example, the credit quality of
institutions with higher levels of direct lending to oil
exploration, oil production, and other supporting
services may deteriorate. In addition, some
institutions located in or near oil-dependent regions
may experience knock-on effects from weaker
investment and subdued business activity.
Domestic Credit MarketsOf concern is the potential impact on credit markets,
in particular high-yield bonds. Energy companies
compose roughly 15 percent of the $1.6 trillion
U.S. high-yield bond market, compared to only 10
percent in 2009. Much of this rise has been driven
by issuance of bonds by energy exploration and
production companies that have been hit hard by the
recent drop in oil prices. In June 2014, the high-yield
bond market began a significant sell-off, especially in
the energy sector, which is now trading at distressed
levels (Chart C.2). Market participants noted at the
C.1 Commodity Prices: Metals vs. Oil

45Financ ia l Deve lopments
time that energy sector bonds became significantly
less liquid. High-yield mutual funds and exchange-
traded products (ETPs) also saw significant outflows
during this period. In the first quarter of 2015, this
market stabilized, with distressed debt specialists and
other investors purchasing discounted bonds. Some
borrowers have been able to issue new debt and
equity as well.
Emerging Markets Debt and FX MarketsAbout one third of the $3.3 trillion of outstanding
dollar-denominated emerging market debt is
issued by energy companies, or by corporates and
sovereigns in countries where oil profits compose
more than 10 percent of GDP. Many of these
issuers have seen their debt downgraded. Russia,
Venezuela, and other oil-exporters have also seen
their currencies weaken significantly. Because sharp
drops in commodity prices have in the past triggered
emerging market crises—such as in Latin America
in the 1980s—these developments bear close
monitoring. Similar to high-yield bonds, emerging
market debt is relatively illiquid compared to other
fixed income products. Lower oil prices may lead to
sizable capital losses, which may dampen investor
risk appetite and lead to emerging market debt
outflows. Significant outflows, coupled with illiquidity,
could exacerbate market risks.
C.2 High-Yield Bond Spreads

46 2 0 1 5 F S O C / / Annual Report
0
5
10
15
20
25
30
35
40
0
5
10
15
20
25
30
35
40
2008 2009 2010 2011 2012 2013 2014 2015
Currency VIX Average,
2002-Present
Percent PercentAs Of: 31-Mar-2015
Source: Bloomberg, L.P.
3-Month Euro-Dollar3-Month Dollar-YenCurrency VIX
5.1.22 U.S. Dollar Exchange Rates
5.1.21 Currency Implied Volatility
5.1.20 Nominal U.S. Dollar Trade-Weighted Index 5.1.2 Foreign Exchange
The dollar has appreciated significantly on
a trade-weighted basis since mid-2014 as the
economic outlook in the United States began
to improve relative to the rest of the world,
perhaps faster than markets had expected, and
as foreign central banks began aggressively
easing monetary policy or signaling their intent
to do so (Chart 5.1.20). Along with the dollar’s
appreciation there has been an increase in
developed market currency volatility, albeit
from a very low level (Chart 5.1.21). The euro
and Japanese yen depreciated significantly,
as did the currencies of oil-exporters (Chart
5.1.22), with the Russian ruble experiencing
the steepest decline due to plummeting oil
prices and the effects of U.S. and EU sanctions,
which were implemented in response to Russia’s
aggressive actions in Ukraine (Chart 5.1.23).
On January 15, 2015, the Swiss National Bank
unexpectedly abandoned its cap on the value
of the Swiss franc to the euro that had been
in place since September 2011. This caused
the franc to unexpectedly appreciate almost
21 percent against the euro in one day, with
an intraday rise of close to 40 percent. While
the sharp appreciation of the franc resulted
in stresses to some smaller FX brokers, the
knock-on effects to broader financial markets
were muted. There has also been appreciation
pressure on the Danish krone, causing the
Danish Central Bank to intervene heavily to
maintain its longstanding peg to the euro.

47 F inanc ia l Deve lopments
1.0
1.5
2.0
2.5
3.0
3.5
10
15
20
25
30
2008 2009 2010 2011 2012 2013 2014 2015
Ratio Ratio
Source: Bloomberg, L.P.
P/B Ratio (right axis)
TrailingP/E Ratio (left axis)
As Of: 31-Mar-2015
Note: Dotted lines represent 1995-to-present median.
5.1.25 S&P 500 Key Ratios
5.1.24 Returns in Selected Equities Indices
5.1.23 Change in Exchange Rates (Mar 2014 - Mar 2015)5.1.3 Equities and Commodities
Equities
Equity indices in developed markets saw
mixed performances in 2014, with U.S. indices
outperforming those of other countries.
However, in the first quarter of 2015, Japanese
and European equity markets surged, leading
them to outperform the U.S. market for the
12-month period ending in March 2015 (Chart
5.1.24). In 2014, U.S. stocks generally benefitted
from low interest rates and continuing
accommodative monetary policy, as well as
modest growth in earnings and economic
performance, but these gains were tempered
by global growth concerns, commodity-
driven declines in energy-related stocks, and
geopolitical tensions. In the United States,
the S&P 500 Index gained 10 percent over
the 12-month period ending in March 2015,
while the S&P 500 composite trailing price-to-
earnings ratio continued to climb, reaching a
level only slightly below its 20-year average of
19.4 (Chart 5.1.25). The Euro Stoxx Index rose
17 percent over this period, while in the United
Kingdom, the FTSE 250 Index increased 3
percent. Japanese equity markets increased by
30 percent over the same period.

48 2 0 1 5 F S O C / / Annual Report
80
100
120
140
160
180
200
220
80
100
120
140
160
180
200
220
2000 2002 2004 2006 2008 2010 2012 2014Source: CoreLogic, FHFA, Haver Analytics
As Of: Feb-2015Index
Note: Jan-2000 = 100. Gray bars signify NBER recessions.
Index
CoreLogic (including
distressed sales)CoreLogic (excluding
distressed sales)
FHFA
0
20
40
60
80
100
0
20
40
60
80
100
2008 2009 2010 2011 2012 2013 2014 2015
VIX
1995-2014Average
Percent Percent
Source: Capital IQ
As Of: 31-Mar-2015
5.1.28 National Repeat Sales Home Price Indices
5.1.27 Commodities
5.1.26 Market Volatility U.S. equity market implied volatility, as
measured by the Chicago Board Options
Exchange Volatility Index (VIX), averaged 14
percent during 2014 and generally remained
below its historical average (Chart 5.1.26).
Levels of volatility were particularly low
during the first half of the year, but then
increased owing to concerns about the
weaker global outlook.
Commodities
Commodity prices declined in 2014, led by the
50 percent drop in oil prices (see Box C) during
the second half of the year (Chart 5.1.27). The
overall S&P GSCI (formerly the Goldman Sachs
Commodity Index) decreased over 30 percent
during the course of the year, while the S&P
GSCI Energy Index declined nearly 50 percent.
Prices of metals and agricultural commodities
also declined in 2014, but much less so than
energy prices. The S&P GSCI Industrial Metals
Index declined approximately 6 percent in 2014,
as slowing growth in China and other emerging
markets affected demand expectations.
Agricultural commodities prices also declined
in 2014, as harvests in several key agricultural
commodities were larger than expected.
5.1.4 Real Estate Markets
Housing Market Overview
The housing market recovery continued in 2014,
despite some signs of softness early in the year.
Home prices rose, and many of the legacy issues
from the financial crisis continued to abate, as
loan performance improved and negative equity
declined. But mortgage origination activity and
home sales were generally below 2013 levels.
According to the FHFA’s repeat sales home
price index, national home prices rose 5.4
percent during 2014 (Chart 5.1.28). Existing
home sales started the year slowly. Although
about 3 percent fewer existing homes were
sold in 2014 than in 2013, the second half of
2014 showed some signs of recovery from the

49 F inanc ia l Deve lopments
5.1.31 Mortgage Delinquency and Foreclosure
5.1.30 Mortgages with Negative Equity
5.1.29 Originations by Purchase and Refinanceslowdown earlier in the year. Both sales and
construction starts of new single-family homes
picked up in the second half of 2014, though
they remain well below levels seen in decade
before the housing market collapse.
Household formation, a key driver of housing
demand, surged in the second half of 2014
after eight years of tepid growth. Nearly
2 million households were added from
December 2013 through December 2014—
more than were added during the previous
three years combined. In contrast, the
national homeownership rate marked its ninth
consecutive year of decline in 2014, ending the
year at 64.0 percent, while a surge in rentals
have pushed down rental vacancy rates to their
lowest level since the mid-1990s.
Overall, mortgage origination activity slumped
in 2014, mainly because of a dramatic reduction
in refinance originations, as mortgage rates
remained elevated relative to early 2013 (Chart
5.1.29). Refinance originations in 2014 totaled
$484 billion, 56 percent below their 2013 level.
Mortgage purchase originations also declined
in 2014 to $638 billion, 13 percent lower than
the previous year.
The number of households with negative equity
continued to fall in 2014, with approximately 1.2
million households rising out of negative equity
over that period. Sustained price increases,
completed foreclosures on underwater loans,
loan modifications, and the amortization of
older loans have helped lower the percentage
of mortgages with negative equity from 13.4
percent at the end of 2013 to 10.8 percent by
December 2014 (Chart 5.1.30). The total value
of negative equity fell from $403 billion to $349
billion over the year.
The performance of outstanding loans also
continued to improve in 2014. The estimated
number of loans with past-due installments
declined from 2.6 million in December 2013
to 2.3 million in December 2014. The pipeline
of mortgages likely to require foreclosure has
also declined (Chart 5.1.31). The share of

50 2 0 1 5 F S O C / / Annual Report
5.1.33 Mortgage Originations by Product
5.1.32 Purchase Origination Volume by Credit Score loans with payments more than 90 days past
due dropped from 2.5 percent to 2.2 percent
between December 2013 and December 2014.
Over the same period, the share of mortgages
in foreclosure dropped from 2.9 percent to 2.3
percent. The pace of mortgage modifications
also slowed.
Underwriting standards for new mortgages
remained conservative relative to historical
norms in 2014. The segment of purchase
originations for borrowers with FICO scores
below 600, which composed over 10 percent
of originations in the early 2000s, is less than
0.5 percent of the market today (Chart 5.1.32).
The private label securitization market, a major
source of financing for low-FICO loans in
the years before the crisis, remains dormant.
The share of loans with FICO scores over 760
has doubled from about 20 percent of the
market to about 40 percent. While the SLOOS
showed an increasing share of respondents
reporting easing credit standards in 2014, the
vast majority of respondents reported that
their credit standards remained unchanged.
Similarly, the OCC’s 2014 Survey of Credit
Underwriting Practices reported just over
two thirds of respondents held lending
standards unchanged.
Through November 2014, the GSEs completed
1.4 million refinances, significantly less than the
4.1 million refinances completed in all of 2013.
The number of Home Affordable Refinance
Program (HARP) refinances also declined
sharply. As borrowers have regained equity, a
smaller proportion of loans require the low-
and negative-equity refinances offered through
HARP. FHA’s total refinance volumes fell 70
percent to 191,000 refinances between fiscal
years 2013 and 2014.
The federal government continues to back the
majority of new mortgages, though its market
share has declined over the past several years as
jumbo loans have gained market share (Chart
5.1.33). Private lending in 2014 was largely
concentrated in jumbo loans held in bank
portfolios. As has been the case since 2008,

51 F inanc ia l Deve lopments
5.1.35 Mortgage Servicing Market
5.1.34 RMBS Issuancethe government backed nearly all residential
mortgage-backed security (RMBS) issuance in
2014 (Chart 5.1.34).
Investor activity, as indicated by cash sales,
dropped in 2014, partly reflecting a decline
in the share of sales composed of real estate
owned (REO) properties. CoreLogic estimates
that cash sales composed 35.5 percent of total
home sales in December 2014. This figure is
down 3.0 percentage points from a year earlier
and 11.0 percentage points from the peak in
January 2011. Typically, investors purchase
homes for rental. Investors also participated
in the rental market through equity real estate
investment trusts (REITs) and an expanded
rental property securitization market.
Originations of HELOCs rose 18 percent
in 2014; however the number of HELOC
accounts—and the balances associated
with those accounts—declined slightly. On
net, the pace of HELOC closure and pay-
down exceeded the pace of originations.
Approximately $190 billion in HELOC
balances—which represents more than one
quarter of outstanding balances—face payment
resets in 2015 and 2016 as the interest-only
period expires. About $30 billion of this debt is
associated with negative-equity borrowers.
Over the course of 2014, the Federal Reserve
tapered its large-scale asset purchase program,
which ended in October. However, the Federal
Reserve has continued to reinvest maturing
principal payments in agency MBS. As of
December 2014, the Federal Reserve held about
$1.7 trillion in agency MBS, or about 30 percent
of outstanding agency MBS.
Nonbank firms continued to increase their
purchases of MSRs from banks and thrifts
in 2014, though the pace of this shift slowed
notably compared to 2013 (Chart 5.1.35).
Nonbank firms have also gained share in
mortgage originations. Last year, nonbank

52 2 0 1 5 F S O C / / Annual Report
40
60
80
100
120
140
40
60
80
100
120
140
2008 2009 2010 2011 2012 2013 2014 2015
Index Index
Source: Real Capital Analytics,
– National
Note: Jan-2008 = 100.
– Major Markets
As Of: Feb-2015
5.1.36 Commercial Property Price Indices firms accounted for 38 percent of mortgages
originated by the largest 40 lenders, up from 27
percent the year before.
Government-Sponsored Enterprises
GSE issuance of new MBS declined markedly
in 2014, as both refinance and purchase activity
remained near 15-year lows. In 2014, Fannie
Mae issued $408 billion and Freddie Mac issued
$280 billion in new MBS, down from $765
billion and $461 billion in 2013, respectively.
Fannie Mae and Freddie Mac both saw large
declines in net income in 2014 relative to 2013,
due in large part to a reversal in the valuation
allowance for deferred tax assets in 2013, as well
as losses on derivatives.
The GSEs continued to expand their use of
several risk-sharing structures. In 2014, they
issued risk-sharing agreements on about $370
billion in single-family MBS—or about half
of their MBS issuances for the year. Investors
in the most senior tranches of these securities
were composed largely of mutual funds, and
the most junior tranches disproportionately
attracted hedge funds. On a limited basis,
Fannie Mae and Freddie Mac also negotiated
bilateral agreements with private entities
to insure or reinsure portions of
guaranteed pools.
Commercial Real Estate
CRE markets improved in 2014, as measured by
vacancy rates, property values, loan volume, and
loan performance. In 2014, the national CRE
price index experienced year-over-year growth
of 13.0 percent (Chart 5.1.36), with retail
experiencing moderate growth (3.4 percent)
relative to other sectors. Price growth in the six
major markets (Boston, Chicago, Los Angeles,
San Francisco, New York, and Washington, DC)
has recovered faster than the national index
since the crisis. Construction of commercial,
nonresidential properties increased in 2014 but
remains well below historical levels. Multifamily
construction recovered rapidly, and is near pre-
crisis highs in nominal terms.

53 F inanc ia l Deve lopments
CRE loans outstanding—excluding multifamily
residential loans—reached $1.6 trillion in
December 2014, an increase of nearly $100
billion from the prior December. Between
the fourth quarter of 2013 and the fourth
quarter of 2014, CRE delinquency rates
steadily fell from 2.45 percent to 1.56 percent.
Correspondingly, the CRE charge-off rate fell
from 0.19 percent to 0.08 percent.
Although some credit-risk indicators have
stabilized, underwriting standards appear to
be loosening in some CRE portfolios. Bank
examiners surveyed for the OCC’s 2014 Survey
of Credit Underwriting Practices indicated
that commercial construction, residential
construction, and other CRE loans are a
growing concern in 65 percent of all banks.
5.2 Wholesale Funding Markets
Short-term wholesale funding markets provide
financial and nonfinancial firms with funds
that supplement other funding sources such
as retail deposits and long-term debt. Short-
term wholesale funding is obtained through
instruments such as federal funds, commercial
paper (CP), repos, certificates of deposit (CDs),
and large time deposits. Financial institutions
have varying reliance on short-term wholesale
funding. U.S. branches of foreign banks and
broker-dealers tend to rely more on short-
term wholesale funding than domestic banks,
which have access to U.S. retail deposits.
Sources of short-term wholesale funding
include cash held by nonfinancial companies,
MMFs, pension funds, and sovereign wealth
funds, among others. Domestic banking firms’
reliance on short-term wholesale funding
measured as a share of retail deposits has
decreased since the financial crisis (Chart
5.2.1). The decline reflects in part the large
growth in retail deposits and adjustments
some banks are making to their funding and
balance sheet structures to meet enhanced
liquidity standards—such as the LCR—and
capital requirements—such as the SLR. In
particular, the LCR and the net stable funding
ratio (NSFR) incentivize banks to rely on
5.2.1 Composition of Bank Short-Term Funding

54 2 0 1 5 F S O C / / Annual Report
0
1
2
3
4
5
0
1
2
3
4
5
2002 2004 2006 2008 2010 2012 2014
Trillions of US$ Trillions of US$
Source: FRBNY
As Of: 31-Mar-2015
Note: Limited data were provided by the clearing banks prior to April 2008. These figures are estimates based on the data provided. Daily Federal Reserve RRP operations beginning in September 2013 are depicted; small-scale RRP test operations undertaken periodically at earlier dates are not depicted. Gray bar signifies NBER recession.
FR 2004 Primary Dealer Repo
Tri-Party Repo Market(excluding Federal
Reserve RRPs)
Tri-Party Repo Market(including Federal Reserve RRPs)
5.2.4 Primary Dealer Repo Agreements
5.2.3 Value of the Repo Market
traditional retail deposits or issue longer-term
debt. In addition, the SLR and the systemically
important financial institutions capital
surcharge incentivize overall reduction in
balance sheet and thus borrowing needs.
5.2.1 Commercial Paper, Asset-Backed
Commercial Paper, and Large Time Deposits
Total CP outstanding—domestic, foreign,
and asset-backed—remained relatively flat
over the past 12 months, with the growth in
nonfinancial CP roughly offsetting the declines
in financial CP and asset-backed commercial
paper (ABCP) (Chart 5.2.2). Year over year,
domestic financial CP outstanding declined by
10 percent. Meanwhile, domestic nonfinancial
CP outstanding increased by 12 percent amid
low financing rates and favorable economic
conditions. Total foreign CP outstanding
remained stable, with a small increase in
financial CP outstanding offset by a small
decline in nonfinancial CP outstanding. U.S.
commercial bank large time deposits, which
include wholesale CDs, increased modestly in
2014 to reach $1.7 trillion.
5.2.2 Repo Markets
Total borrowing by primary dealers across all
segments of the repo market was essentially flat
in 2014, as was tri-party repo market volume
(Chart 5.2.3). Dealer activity in the tri-party
repo market was largely unchanged following
the declines seen in 2013. The Federal Reserve’s
reverse repo operations (RRPs) increased
gradually over the course of the year, though
they continue to represent only a relatively small
portion of the overall tri-party market. The
relative size of the primary dealer term repo
market compared to the overnight repo market
remained roughly constant over the course of
the year (Chart 5.2.4).
Market observers have cited a number of
factors, such as changing risk appetites among
market participants, the activities and holdings
of central banks, and enhanced capital and
liquidity requirements as potential contributors
to the decline in primary dealer repo activity
since 2012, though repo activity since 2012,
5.2.2 Commercial Paper Outstanding

55 F inanc ia l Deve lopments
though repo activity remained relatively stable
in 2014.
The lack of available data on bilateral repo
makes estimation of the size of that market
segment difficult, particularly with respect to
the composition of collateral. Some studies
estimate that bilateral repo may represent the
largest of the repo market segments, and that
Treasury securities may compose close to 80
percent of collateral. Other important data
gaps in the bilateral repo market include the
size of haircuts, the tenor of trades, and the
distribution of counterparties. A joint pilot
project recently initiated by OFR and the
Federal Reserve aims to close some of these
gaps by collecting and aggregating data on the
bilateral repo market (see Section 6.4.1).
The collateral composition of the tri-party
market, which since late 2009 includes the
Federal Reserve’s RRPs, remained consistent
throughout 2014. The majority of tri-party repo
financing continues to be collateralized by
high-quality assets such as Treasury securities,
agency debentures, and agency MBS. As of
March 2015, these types of collateral accounted
for 74 percent of all tri-party repo collateral
(Chart 5.2.5). The share of these high-quality
assets posted as collateral has declined slightly
among dealer-financed repo transactions,
though remains above pre-crisis levels. Haircuts
demanded by cash investors in the tri-party
market have been stable over the last few years
across all collateral classes.
The Federal Reserve has continued to test
the operational readiness of its policy tools,
including overnight reverse repo agreements
(ON RRPs) and term reverse repo agreements
(term RRPs) in order to examine how such tools
might support the monetary policy objectives
of the Federal Open Market Committee
(FOMC). These transactions are open market
operations in which the Open Market Trading
Desk (the Desk) at the Federal Reserve
Bank of New York conducts a reverse repo
operation with an eligible RRP counterparty.
In addition to the set of primary dealers with
whom the Federal Reserve had traditionally
5.2.5 Collateral in Tri-Party Repo

56 2 0 1 5 F S O C / / Annual Report
0
50
100
150
200
250
0.0
0.3
0.6
0.9
1.2
1.5
1.8
2000 2002 2004 2006 2008 2010 2012 2014
Trillions of US$ Days
Source: The Risk Management Association
Mean WAM (right axis)
Median WAM (right axis)
As Of: 2014 Q4
Note: WAM = Weighted-Average Maturity. Data is based on a survey of agent-based lenders.
Total Cash Reinvestment (left axis)
5.2.8 Securities Lending Cash Reinvestment
5.2.7 Composition of Securities Lending by Security Type
5.2.6 Value of Securities on Loan conducted reverse repo agreements, the current
operational exercises involve an expanded set of
counterparties that includes banks, GSEs,
and MMFs.
The Desk has been conducting a series of daily,
overnight, fixed-rate RRP test operations since
September 2013, and in September 2014 the
Desk tested several notable changes, including
the introduction of an overall size limit. The
Desk has also periodically conducted term
RRP operations over quarter-ends and other
dates. These test operations have proceeded
smoothly. Overall, the offered rate on ON RRPs
continued to provide a soft floor for money
market rates, and the term RRPs appeared to
ease downside rate pressures in money markets
around quarter-end dates. Even so, GCF repo
rates have recently shown increased volatility at
quarter-ends, a development that
bears monitoring.
5.2.3 Securities Lending
The estimated value of securities on loan
globally decreased slightly over the past 12
months to just below $1.9 trillion (Chart
5.2.6), with government bonds and equities
composing the bulk of these securities (Chart
5.2.7). The main lenders of securities continue
to be retirement funds, mutual funds, and
government bodies—including central banks.
Market participants’ strategies for reinvesting
cash collateral remain conservative—the
weighted-average maturity of cash reinvestment
is relatively low and well below pre-crisis levels
(Chart 5.2.8), and the collateral is mostly
reinvested in liquid assets such as overnight
repos and MMFs.

57 F inanc ia l Deve lopments
5.3.3 Annualized Net Interest Margin
5.3.2 Return on Average Assets for Domestic BHCs
5.3.1 Domestic BHC Pre-Tax Income5.3 Bank Holding Companies and Depository Institutions
5.3.1 Bank Holding Companies and Dodd-
Frank Act Stress Tests
Performance
BHCs are companies with at least one
commercial bank subsidiary. Subsidiaries
of BHCs may also include nonbanks such
as broker-dealers, investment advisers, or
insurance companies. As of the fourth quarter
of 2014, there were 1,034 BHCs in the United
States (excluding Puerto Rico) with greater
than $500 million in assets, the aggregate assets
of which totaled $18.1 trillion.
The domestic banking sector in 2014 continued
to face a challenging interest rate environment,
enhanced regulatory requirements, foreign
geopolitical and macroeconomic uncertainties,
and a slowly recovering macroeconomic
environment that led to a flattening of the yield
curve. Aggregate pre-tax income for BHCs was
$191 billion for the full year ending December
31, 2014, compared to $195 billion for the full
year ending December 31, 2013 (Chart 5.3.1).
Return on assets across BHCs slightly declined
year-over-year and remained lower than the
levels that prevailed in the 10 years before the
crisis (Chart 5.3.2).
BHC NIMs declined slightly compared to 2013
due to continued historically low levels of
interest rates—both long- and short-term—as
well as the run-off of higher yielding assets,
and, to a lesser extent, increased holdings of
higher quality, lower yielding liquid assets to
meet new minimum liquidity requirements
(Chart 5.3.3). In addition, revenues from
mortgage origination and trading were lower
while litigation expenses were elevated.
However, these headwinds were in part offset by
increased revenues from growth in C&I lending
in addition to strong investment banking and
wealth management activities. Revenue losses
were also offset by low loan loss provisions
as BHCs moved towards their lowest levels of
reserves post-crisis due to the improvement in
credit quality.

58 2 0 1 5 F S O C / / Annual Report
0
10
20
30
40
50
0
10
20
30
40
50
2010 2011 2012 2013 2014
Billions of US$ Billions of US$
Source: Public Disclosures and Releases
As Of: 2014
Note: Data covers BAC, C, GS, JPM, MS, and WFC. Totals represent approximations based on disclosures. Values presented in financial periods in which BHCs report the values or litigation is concluded. Settlement amounts may not be accrued in the given period. Data includes cash payments and dollars required for assistance programs. Data does not include other fines and legal settlements such as those related to money laundering and reference rate manipulation.
0.0
0.4
0.8
1.2
1.6
2.0
1.01.52.02.53.03.54.04.55.05.5
2010 2011 2012 2013 2014 2015
Source: Bloomberg, L.P.
As Of: 31-Mar-2015Percent Percent
30-Year Agency MBS Yield (left axis)
30-Year Mortgage Rate (left axis)
Spread (right axis)
5.3.6 Select Crisis-Era Security and Mortgage-Related Settlements
5.3.5 U.S. Mortgage Spread
5.3.4 Total Residential Mortgage Originations Mortgage banking results were lower year-over-
year, as total originations fell by roughly 39
percent (Chart 5.3.4). The level of refinancing
activity declined in the second half of 2013
due to the increase in the 30-year mortgage
rates (Chart 5.3.5) and did not recover in 2014.
In addition, originations of home purchase
loans remained subdued in 2014. On the
expense side, BHCs are seeking cost-saving
measures in mortgage banking operations
through headcount reductions and more
focused geographic footprints. However, legal
settlements and increases in litigation reserves,
especially by the largest BHCs, have more than
offset many cost-saving efforts (Chart 5.3.6).
Despite the continued low interest rate
environment, estimates of asset-liability
maturity gaps suggest that large banks are not
taking on significantly higher banking book
interest rate risk from an income standpoint,
although holdings of longer-term securities
could experience material depreciation in an
environment of increasing interest rates (Chart
5.3.7). However, smaller banks on average
continued to lengthen the maturity of their
asset portfolios (Chart 5.3.8). In addition,
noninterest-bearing deposit accounts as a share
of liabilities are near all-time highs and could
leave the banking sector when interest rates
begin to rise. Meanwhile, loans grew moderately
during the year, amid continued easing in
lending policies and increases in demand across
several loan categories.

59 F inanc ia l Deve lopments
5.3.9 KBW Bank Index and Historical Volatility
5.3.8 Maturity Gap at Small Banks
5.3.7 Maturity Gap at Large BanksMarket Indicators
BHC equity prices and volatility rose in 2014,
as indicated by the KBW Bank Index (Chart
5.3.9). Large BHC equity valuations are at
the highest level since early 2012, though they
remain well below pre-crisis levels (Chart
5.3.10). Credit spreads of the six largest BHCs
also tightened slightly in 2014 and remained
well below pre-crisis levels (Chart 5.3.11).
Capital
The aggregate common equity capital ratio
for U.S. BHCs slightly increased in 2014, as
the increase in capital was largely offset by the
increase in RWAs (Chart 5.3.12).
Although certain aspects of the revised capital
rules, including the capital conservation buffer,
do not become fully phased in until 2019, most
U.S. G-SIBs already meet the fully phased-in
capital minimums under the revised capital
rules plus the proposed U.S. G-SIB risk-based
capital surcharge. In addition, most U.S. G-SIBs
meet the 5 percent enhanced SLR standard on
a fully phased-in basis as of December 31, 2014.
As of the fourth quarter of 2014, most BHCs
continued to increase their capital distributions
and share repurchases. Common dividends
paid by BHCs that participated in the 2015
Comprehensive Capital Analysis and Review
(CCAR) increased approximately 15 percent
in the aggregate, while net share repurchases
increased approximately 19 percent from 2013.
However, capital distributions remain lower
than pre-crisis levels.
Liquidity
BHCs continued to increase their holdings of
liquid assets, which are now well above pre-
crisis levels (Chart 5.3.13). Liquid assets as a
percentage of total assets continued to increase
over the past year for BHCs with consolidated
assets over $50 billion, but remained flat
for other BHCs. The improvement in the
liquidity profiles of large BHCs was driven

60 2 0 1 5 F S O C / / Annual Report
11.65 11.76
9
10
11
12
13
9
10
11
12
13
CommonEquity Capital
Ratio(4Q13)
RWAChangeImpact
NetIssuanceof Stock
RetainedEarnings
OtherAdjustments
CommonEquity Capital
Ratio(4Q14)
(1.10).77
.52
(.10)
Percent of RWA Percent of RWA
Source: FR Y-9C
As Of: 2014 Q4
Note: In 2013 Q4, the tier 1 common capital ratio is used to measure common equity capital for all BHCs. In 2014 Q4, the tier 1 common capital ratio is used for non-advanced approaches BHCs and the common equity tier 1 capital ratio is used for advanced approaches BHCs.
Source: Bloomberg, L.P.
0
10
20
30
40
50
60
0
1
2
3
4
5
2000 2002 2004 2006 2008 2010 2012 2014
Ratio RatioAs Of: 31-Mar-2015
P/B Ratio (left axis)
2000-2014 Average P/E (right axis)
2000-2014 Average P/B
(left axis)
P/E Ratio (right axis)
Note: Market cap-weighted average of BAC, C, GS, JPM, MS, and WFC.
5.3.12 Change in Aggregate Common Equity Capital Ratios for Domestic BHCs
5.3.11 CDS Spreads of Six Large Complex BHCs
5.3.10 P/B and P/E Ratios of Six Large Complex BHCs by both anticipated compliance with certain
new liquidity requirements and by a change
in balance sheet mix, as banks invested more
of their increased deposit inflows into excess
reserves and liquid investment securities than
into loans.
The enhanced prudential standards rule
issued in 2014 imposes enhanced liquidity risk
management, stress testing, and liquidity buffer
requirements on BHCs with consolidated assets
of $50 billion or more. In addition, the LCR
and the modified LCR rules require BHCs to
meet certain minimum liquidity needs. The
transition period for LCR compliance began
on January 1, 2015, and is due to be fully
implemented by January 1, 2017. Compliance
with the modified LCR becomes effective
on January 1, 2016. Most BHCs appear to be
well-positioned to comply with the LCR and
modified LCR requirements as well as the
expected NSFR requirement—a long-term
structural liquidity measure included in the
international liquidity framework agreed
to by the Basel Committee on Banking
Supervision (BCBS).
Asset Quality
Asset quality also continued to improve in 2014,
with ratios of non-performing loans falling
across most major categories (Chart 5.3.14).
Delinquency rates on residential mortgages
continued to decline through December
31, 2014, but remain elevated as extended
foreclosure timelines in many states are
delaying resolutions.
Net charge-offs continued to decline through
December 31, 2014, and are now at pre-crisis
levels (Chart 5.3.15). Total non-performing
loans also declined, especially in CRE
portfolios, which improved as a result of better
market fundamentals. While reserve levels have
fallen on net since 2010 due to slower growth
in provisions, the level of reserves relative to
charge-offs has improved significantly over the
past four years (Chart 5.3.16).

61 F inanc ia l Deve lopments
5.3.15 Credit Quality
5.3.14 Non-Performing Loans (90+ Days and Non-Accrual)
5.3.13 Consolidated BHC Liquid Assets Ratio by Firm SizeOn net, the sizable decline in crude oil prices
in the latter half of 2014 (see Box C) may have
a relatively neutral to positive effect on asset
quality, as lower oil prices may bolster overall
credit portfolios through increased consumer
spending and economic growth. However,
regional banks with larger oil and gas portfolio
concentrations, smaller banks in areas whose
local economies are dependent upon the energy
sector, and banks exposed to countries whose
sovereign debt is supported by oil production
may be at increased risk.
DFAST and CCAR
In March 2015, the Federal Reserve released
the results of the 2015 annual Dodd-Frank Act
stress tests (DFAST) and the CCAR. A total of
31 BHCs with total consolidated assets of $50
billion or more participated in the annual stress
tests and CCAR.
DFAST, a forward-looking exercise conducted
by the Federal Reserve, evaluated whether
the 31 BHCs have sufficient capital to absorb
losses resulting from stressful economic and
financial market conditions, using hypothetical
supervisory scenarios designed by the Federal
Reserve. In the nine quarters of the planning
horizon covered in the stress test, the aggregate
projected tier 1 common ratio for the 31 BHCs
fell from 11.9 percent in the third quarter of
2014, to a minimum level of 8.3 percent under
the severely adverse scenario (Chart 5.3.17), but
remained well above the minimum requirement
of 5.0 percent.
Through CCAR, the Federal Reserve evaluates
the capital adequacy and the capital planning
processes of the 31 BHCs, including the
proposed capital actions such as dividend
payments and stock repurchases. The
Federal Reserve considers both qualitative
and quantitative factors in analyzing a firm’s
capital plan. In 2015, the Federal Reserve did
not object to the capital plans and planned
capital distributions of 28 of the 31 BHCs,
issued a conditional non-objection to one
BHC, requiring it to correct weaknesses in its
capital planning process, and objected to the

62 2 0 1 5 F S O C / / Annual Report
5.3.18 Federal Reserve’s Actions in CCAR 2015
5.3.17 Initial and Stressed Tier 1 Common Capital Ratios
5.3.16 Loan Loss Reserves capital plans of two BHCs due to widespread
and substantial weaknesses across their capital
planning processes (Chart 5.3.18). Further, the
2015 CCAR results revealed that these BHCs
have substantially increased their capital since
the first round of stress tests in 2009. The
common equity capital ratio, which compares
high-quality capital to RWAs of the 31 BHCs,
has more than doubled from 5.5 percent in
the first quarter of 2009 to 12.5 percent in the
fourth quarter of 2014, reflecting a $641 billion
increase in common equity capital to $1.1
trillion during the same period.
Insured Commercial Banks and Savings
Institutions
At the end of 2014, the banking industry was
composed of 6,509 FDIC-insured commercial
banks and savings institutions with total assets
of $15.6 trillion. There were 1,872 institutions
with assets under $100 million and 681
institutions with assets over $1 billion. The
total number of institutions fell by 303 firms
during 2014 due to failures and mergers.
Failures of insured depository institutions have
continued to decline since the financial crisis;
18 institutions with $3 billion in total assets
failed in 2014 (Chart 5.3.19), which represents
the smallest number of failures since 2007.
As of December 31, 2014, 291 institutions—4.5
percent of all institutions—were on the FDIC’s
“problem bank” list, compared to 467 problem
banks in December 2013. Banks on this list
have financial, operational, or managerial
weaknesses that require corrective action in
order to operate in a safe and sound manner.
Pre-tax income for all U.S. commercial banks
and savings institutions totaled $221 billion in
2014, representing a 1.6 percent decline from
2013. Most of this decline was attributed to a
drop in noninterest income, which in turn was
largely driven by a decrease in income from the
sale, securitization, and servicing of mortgage
loans, as well as an increase in litigation
expenses at a few of the largest banks (Chart
5.3.20). Net interest income rose by 1.3 percent,
primarily due to a decline in interest expense,

63 F inanc ia l Deve lopments
0
1
2
3
4
5
0
100
200
300
400
500
600
1980 1985 1990 1995 2000 2005 2010Source: BEA, FDIC, Haver Analytics
As Of: 2014Number of Institutions
Note: No FDIC-insured institutions failed during 2005 and 2006.
Percent
Number of Institutions (left axis)
Assets of Failed Institutions as a Percent
of Nominal GDP (right axis)
5.3.21 Risk-Weighted Assets and Return on Assets
5.3.20 Commercial Bank and Thrift Pre-Tax Income
5.3.19 FDIC-Insured Failed Institutionsand interest-earning assets grew by 6.2 percent.
Almost two thirds of commercial banks and
savings institutions reported higher earnings in
2014 compared to 2013. Credit quality continues
to improve with an associated reduction in loan
loss provisions and other expenses. In the past
two years, the increase in loan growth has been
accompanied by an increase in overall portfolio
risk, as evidenced by the rise in RWAs relative to
total assets (Chart 5.3.21).
5.3.2 U.S. Branches and Agencies of Foreign
Banks
Foreign banks have a large presence in the
United States. Together, assets of U.S. branches
and agencies of foreign banks total $2.53
trillion. Asset growth in U.S. branches and
agencies in 2014 may have been buoyed by a
shift in assets from U.S. subsidiaries ahead
of the implementation of the U.S. enhanced
prudential standards rule, which requires the
formation of an intermediate holding company.
The enhanced prudential standards rule
requires foreign banks with U.S. non-branch
assets of $50 billion or more to form a U.S.
intermediate holding company over virtually all
of their U.S. subsidiaries, including bank and
nonbank subsidiaries.
The operations and behavior of U.S. branches
and agencies of foreign banks have changed
notably since the crisis in response to both
U.S. monetary policy and global regulatory
developments. Pre-crisis, U.S. branches and
agencies of foreign banks, in aggregate,
obtained wholesale dollar deposits in the
United States and used those deposits to
provide dollar funding to their parent
organizations and related affiliates, which in
turn used the funds for lending and investment.
This trend reversed beginning in 2011. In
recent years, dollar inflows to U.S. branches and
agencies of foreign banks, in conjunction with
an increase in U.S. deposit-taking on the part of
these institutions, have funded an accumulation
of reserve balances at the Federal Reserve.
Safer and highly liquid assets such as cash and
cash equivalents now represent the largest asset

64 2 0 1 5 F S O C / / Annual Report
0.0
0.5
1.0
1.5
2.0
2.5
3.0
3.5
4.0
0.0
0.5
1.0
1.5
2.0
2.5
3.0
3.5
4.0
2004 2006 2008 2010 2012 2014Source: Federal Reserve, Haver Analytics
As Of: 2014 Q4Trillions of US$
Note: Other liabilities includes transaction accounts, non-transaction accounts, and other borrowed money.
Trillions of US$
Deposits & Credit BalancesNet Due to Related Depository Institutions
Other LiabilitiesSecurities Sold with Repos & Fed Funds Purchased
5.3.24 Cash Assets of U.S. Branches and Agencies of Foreign Banks
5.3.23 U.S. Branches and Agencies of Foreign Banks: Liabilities
5.3.22 U.S. Branches and Agencies of Foreign Banks: Assets category for foreign branches and agencies
(Chart 5.3.22).
The liability structures of U.S. branches and
agencies of foreign banks vary considerably.
These U.S. branches lack access to the stable
source of funds represented by households’
checking, savings, and other transaction
accounts, as they are generally not permitted
to offer deposits insured by the FDIC. Instead,
wholesale funding, particularly CDs issued
primarily to institutional investors, provides
the majority of funding for these institutions
(Chart 5.3.23).
Regulatory factors appear to have contributed
to aggressive balance sheet management
by foreign banks around period-end dates,
particularly via reductions of cash balances
held (Chart 5.3.24). Unlike the U.S. banking
agencies’ implementation of the BCBS
international leverage ratio requirement,
which requires daily averaging of balance
sheet amounts, the BCBS version allows for
calculation of the international leverage ratio
exclusively based on month-end amounts.
This creates an incentive for actions to reduce
the size of balance sheets at month-ends. The
chart suggests the possibility that some FBOs
may have been responding to this incentive.
Volatility was especially pronounced in the two
weeks surrounding year-end 2013 and 2014.
5.3.3 Credit Unions
Credit unions are member-owned, not-for-
profit depository institutions that face unique
challenges in addition to many of those faced
by other similarly sized depository institutions.
As of the fourth quarter of 2014, there were
6,273 federally insured credit unions with
aggregate assets of more than $1.1 trillion.
More than three quarters of credit unions
(4,784) had assets of under $100 million, 1,262
credit unions had assets between $100 million
and $1 billion, and 227 credit unions had assets
over $1 billion. Corporate credit unions, which
provide critical services to the broader credit
union system, continue to consolidate and
deleverage as they refocus their business models

65 F inanc ia l Deve lopments
5.3.25 Federally Insured Credit Union Incomeon providing operational support to consumer
credit unions, raising capital, and adjusting to
the new regulatory environment. As of year-end
2014, there were 14 corporate credit unions
with over $18 billion in assets serving consumer
credit unions—a decline from 27 corporate
credit unions with $96 billion in assets in
2007. Consumer credit unions play a role in
the financial lives of a sizable number of U.S.
households. Data from the Federal Reserve’s
Survey of Consumer Finances showed that just
over a third of households have some financial
affiliation with a credit union, and almost 18
percent of households use credit unions as their
primary financial institution. Credit unions
account for approximately 12 percent of private
consumer installment lending.
Annualized net income at consumer credit
unions was just under $9 billion in 2014 (Chart
5.3.25), an increase of 8.0 percent from 2013.
The amount of outstanding loans at credit
unions increased by 10.4 percent year-over-
year during 2014, compared to an increase of
8.0 percent in 2013. The credit union system
experienced return on average assets (ROA) of
80 basis points in 2014, a slight increase from
78 basis points in 2013. The modest increase in
ROA in 2014 reflected a similarly modest rise
in the NIM, which had declined in each of the
previous four years. The system-wide NIM rose
to 2.84 percent of average assets in 2014 from
2.80 percent in 2013, though it remained 40
basis points below its recent high at year-end
2010. Provisions for loan losses were relatively
stable, edging up from 26 basis points as a
percent of average assets in 2013 to 28 basis
points in 2014, which contrasts sharply with the
experience in the early part of the economic
recovery. Over the four years ending in 2013,
loan loss provisions fell approximately 90 basis
points, which contributed to a largely upward
trend in ROA over that period.
A key concern for the industry is ongoing
challenges related to the low interest rate
environment and the eventual transition
process to a higher rate environment,
potentially with a flatter yield curve. Although

66 2 0 1 5 F S O C / / Annual Report
5.3.28 Credit Union Investments by Maturity
5.3.27 Credit Union Net Long-Term Assets
5.3.26 Credit Union Deposits interest-sensitive deposits continue to decline
as a share of total liabilities and are nearing
pre-crisis levels, the share of money market
accounts and IRA deposit accounts remains
elevated (Chart 5.3.26). Net long-term assets
declined in 2014, but remain high relative to
the pre-crisis period (Chart 5.3.27). Like some
other financial institutions, some credit unions
are reaching for yield by holding relatively high
levels of longer-duration assets.
Investments in total trended higher through
2012, rising from under 19 percent of assets
in the fourth quarter of 2006 to more than 27
percent in the fourth quarter of 2012. Since
then, investments have edged down as a share
of assets, at least partly reflecting substitution
toward lending as loan demand increased.
However, the share of investments with greater
than three years’ maturity has remained high.
After increasing sharply from 3 percent of
assets in the fourth quarter of 2006 to nearly 12
percent at the end of 2013, the share retreated
to just under 10 percent at the end of 2014
(Chart 5.3.28). The rise in long-term interest
rates in 2013 began reducing the market value
of these longer-term investments. At the end of
2012, credit unions had an unrealized gain of
$2.8 billion from held-to-maturity and available-
for-sale securities. By the end of 2013, this
gain had reversed to an unrealized loss of $2.4
billion, and losses continued through the first
three quarters of 2014, before reversing in the
fourth quarter of 2014.
In addition to the federally insured credit
unions, there are 129 non-federally insured
credit unions operating in nine states. These
credit unions, which are insured privately and
not backed by NCUA share insurance, had $13.9
billion in combined assets at the end of 2014
and served 1.2 million members. While federal
law requires all federally chartered credit
unions to be insured through the National
Credit Union Share Insurance Fund, these
nine states allow state-chartered credit unions
to obtain deposit insurance either through the
National Credit Union Share Insurance Fund or
through a private insurer.

67 F inanc ia l Deve lopments
5.4.2 Broker-Dealer Assets and Leverage
5.4.1 Broker-Dealer Revenues5.4 Nonbank Financial Companies
5.4.1 Securities Broker-Dealers
As of December 31, 2014, there were
approximately 4,300 securities broker-dealers
registered with the SEC. The U.S. broker-dealer
sector is relatively concentrated; approximately
60 percent of industry assets were held by
the top 10 broker-dealers at year-end 2014.
The largest broker-dealers are affiliated with
domestic BHCs and foreign banks.
Aggregate revenues across broker-dealers
increased 4 percent to $281 billion, driven
largely by a 15 percent increase in supervision,
advisory, and administration fees (Chart 5.4.1).
Notably, underwriting revenue increased 6
percent, reflecting strong issuance activity,
while securities commissions fell 1 percent with
lower trading volumes.
Assets held within the U.S. broker-dealer
industry totaled $4.5 trillion as of December
31, 2014, well below the peak of $6.8 trillion
in 2007 (Chart 5.4.2). Broker-dealer leverage,
measured in various ways, has also declined
markedly after the crisis. Broker-dealers
typically obtain leverage through the use of
secured lending arrangements, such as repos
and securities lending transactions. Measured
as total assets over equity, broker-dealers
operated at 18 times leverage in aggregate as of
year-end 2014, well below the peak of 36 as of
year-end 2007.
The top 20 broker-dealers compose 75 percent
of the total industry assets at year-end 2014.
Of these, broker-dealers that are part of U.S.
BHCs account for 66 percent of the assets, and
broker-dealers that are part of FBOs account
for an additional 27 percent. The revenue share
of the top 20 broker-dealers is similarly divided
between those affiliated with BHCs, FBOs, and
other institutions. Since 2010, assets for the
BHC-affiliated broker-dealers declined slightly
by 1 percent, while assets for FBO-affiliated
broker-dealers declined by 22 percent. Non-
BHC and non-FBO broker-dealers saw a 46
percent increase in asset size, although on an

68 2 0 1 5 F S O C / / Annual Report
5.4.4 Primary Dealer Securities
5.4.3 Large Broker-Dealer Assets and Leverage by Affiliation absolute basis the contribution of these broker-
dealers to total assets remains small.
Among the three categories of broker-dealers,
those affiliated with BHCs have the lowest
leverage, followed by those affiliated with FBOs
and non-BHC/non-FBO broker-dealers (Chart
5.4.3).
Unlike the traditional banking sector model
that relies in large part on the use of customer
deposits for funding, broker-dealers generally
fund themselves through short-term secured
financing arrangements. Because of the nature
of this as well as lessons learned during the
financial crisis, broker-dealers are focused
on liquidity risk. A broker-dealer’s short-term
liabilities are typically supported by a very liquid
asset base such as U.S. Treasury securities as
well as agency debt and MBS. Less liquid assets
such as high-yield debt are typically financed
through term-secured financing arrangements,
capital, or long-term lending from the parent
company.
Post-crisis, primary dealers have adjusted
their inventories by decreasing their net (long
positions minus short positions) holdings of
corporate securities (which includes corporate
bonds, CP, non-agency MBS, and other CMBS),
and increasing their net holdings of U.S.
government securities (Chart 5.4.4).
5.4.2 Insurance Companies
The insurance industry provides an array of
important financial services to individuals and
businesses in the United States. The insurance
industry composes a significant part of the U.S.
economy—altogether, insurance companies and
related businesses added $421.4 billion to U.S.
GDP, or 2.5 percent of the total, in the latest
figures for 2013. Gross revenues received by
U.S. licensed insurance companies—both life,
which includes some accident and health, and
property and casualty (P&C)—from premiums
and deposits on insurance policies and annuity
contracts totaled $1.2 trillion in 2014.

69 F inanc ia l Deve lopments
5.4.7 Net Yield on Invested Assets
5.4.6 Insurance Industry Net Income
5.4.5 Select U.S. Financial Holding Companies and InsurersBalance sheet assets of U.S. licensed P&C
and life companies totaled $8.1 trillion
(measured on a statutory accounting basis)
at year-end 2014, roughly 8.6 percent of total
U.S. credit and equity market assets. Insurers
also rank among the largest U.S. financial
corporations based on total assets (Chart 5.4.5).
In comparison to the largest bank and thrift
holding companies compiled by the FFIEC for
year-end 2014, insurers make up nearly half
of the 26 financial firms whose assets exceed
$200 billion, and hold assets of $4.6 trillion
representing 27 percent of the total assets of
these firms. The largest 10 publicly traded
insurance-based corporations held 70 percent
of total consolidated assets for all such firms at
year-end 2014.
The insurance industry, taken as a whole, was
profitable and solvent in 2014. Profitability,
as measured by net income in 2014, was $65
billion in the P&C sector and $38 billion in the
life sector, resulting in total industry profits
of $102.4 billion (Chart 5.4.6). Net income for
both sectors fell from record highs observed in
2013, but remained above average levels over
the past decade. The P&C sector benefited from
strong underwriting revenue, led by growth
in premiums. In the life sector, premiums
and investment income remained strong
and increased slightly from 2013, but these
increases were more than offset by increases in
surrenders and aggregate reserves.
The current low interest rate environment is
often cited as a challenge to the profitability of
the insurance industry, especially life insurers,
but the decline in the net yield on invested
assets of insurers has been gradual and not
as large as changes in market interest rates
(Chart 5.4.7). Similarly, the low level of interest
rates is often cited as a factor driving insurer
investments towards longer duration and higher
credit risk.

70 2 0 1 5 F S O C / / Annual Report
5.4.8 Insurance Industry Capital and Surplus Leverage in the life insurance sector, as
measured by the ratio of capital to assets,
has remained close to 9 percent over the
past five years (Chart 5.4.8). The P&C sector
operates with far less leverage, because the
core P&C business model faces greater risks
from unexpected losses and it focuses more on
earning premium income from underwriting
insurable risks rather than from investment
income. The capital-asset ratio in the P&C
sector increased from 35 to 38 percent over
the period.
The use of captive reinsurers in the life
insurance industry is motivated by several
possible factors including tax benefits and
relief from statutory reserve requirements.
Captives add complexity and impact the
potential resolvability of certain life insurance
companies. Moreover, at least for purposes of
insurance regulatory accounting, captives can
reduce clarity about the financial condition
of such companies. Regulators and rating
agencies have noted that the broad use of
captive reinsurance by life insurers may result
in regulatory capital ratios that potentially
understate risk. Efforts to address these
concerns with regulatory reforms are ongoing
(see Section 6).
Pension Risk Transfers
An important development in the life insurance
market has been the transfer of pension risk
by corporate-sponsored pension plans to
insurance companies and derivatives markets.
The largest and most noticeable transactions
were the deals by General Motors and Verizon
in 2012, worth a combined $33 billion, that
moved pension plan assets and obligations to
Prudential Financial. More recently, in July
2014, British Telecom and Prudential Financial
entered into a longevity reinsurance transaction
valued at approximately $28 billion. Aside
from those very large transactions, underlying
growth continues in the market, and recent
developments such as the creation of a longevity
index to structure longevity derivatives may
boost that growth rate.

71 F inanc ia l Deve lopments
Pension risk transfer is conducted through
three types of transactions. The most familiar,
though not the largest, is a “buyout” deal in
which the pension plan sponsor shifts all of the
assets and obligations to a life insurer through
the purchase of a group annuity. In cases
where plans are under-funded, the pension
sponsor makes a payment to the life insurer
to augment the transferred assets in order for
the transaction to be profitable for the life
insurer. Another type of pension risk transfer
is a “buy-in” transaction in which the pension
plan retains the assets and obligations to
beneficiaries but reduces its risks of its ability to
meet these obligations by purchasing insurance
from a life insurer against the variability of
longevity and funding costs. This is sometimes
structured using reinsurance through the
use of a captive insurer. The third and largest
type of risk transfer is conducted through
longevity swaps. These derivatives help manage
the longevity risk of meeting obligations to
beneficiaries by allowing the pension plan to
make fixed payments in exchange for a series
of payments that vary according to how much
longevity exceeds a targeted or indexed rate.
The counterparties to this class of derivatives
include some of the large derivatives dealers
and insurance companies.
The potential consequences of pension risk
transfers include the growth in the number of
counterparties as well as changes in the type
and amount of financial counterparty risk
arising from the risk shifting transactions. In
the case of buyouts, the beneficiaries have their
credit exposure shifted from the pension plan
to the life insurer. Accordingly, the backstop for
pension plans switches from the Pension Benefit
Guaranty Corporation to the state insurance
guaranty funds. In the case of longevity
swaps, the counterparty risk is like that of other
derivatives and resides with the dealer
or insurer.
Guaranteed Living Benefits
Since 2003, the life insurance industry has sold
a large amount of life insurance products that
contain minimum financial guarantees. One of

72 2 0 1 5 F S O C / / Annual Report
5.4.9 Variable Annuities with Guaranteed Living Benefits the most common of these products is a variable
annuity contract combined with guaranteed
living benefits (GLBs). These products contain
embedded derivatives related to interest rate
and equity market movements.
Between 2009 and 2013, sales of individual
variable annuities with GLBs averaged $83
billion annually compared to total variable
annuity average annual sales of $111 billion—
not including allocations to fixed accounts.
Moreover, as of the end of 2014, the estimated
total outstanding account value of all variable
annuities with GLBs exceeds $800 billion
(Chart 5.4.9). In addition to variable annuities
with GLBs, fixed indexed annuities, which link
investment returns to stock market indexes, are
another life insurance product with minimum
financial guarantees. More than two thirds
of the fast-growing fixed indexed annuity
market includes sales with GLBs. As of year-
end 2014, the aggregate account value of fixed
indexed annuities with GLBs was $112 billion—
approximately half the account value of all
outstanding fixed annuities.
GLBs are riders to the base annuity contract
to provide minimum financial guarantees on
investment returns or withdrawal benefits. GLBs
offer the policyholder the potential for market
gains while providing protection against some
of the downside risk from market volatility. A
common feature of GLBs allows the benefit
base to appreciate in a ratchet-like manner with
increases in the market value of linked security
prices. Another type of rider guarantees a
minimum return on invested assets during the
savings or accumulation phase of the policy,
and yet another guarantees a minimum rate of
withdrawal from the account.
These riders represent intermediate- to
long-term guarantees against unfavorable
fluctuations in securities markets rather than
insurable events such as death, longevity,
or morbidity. Financial guarantees and the
manner in which the associated risks are
managed are more complex than for
traditional life insurance and fixed annuity

73 F inanc ia l Deve lopments
5.4.11 Business Loans Outstanding
5.4.10 Consumer Loans Outstanding
products. Insurers have many decades of
experience in managing the interest rate
risk arising from fixed income assets and
conventional life insurance and annuity
product liabilities. Yet by comparison, exposure
to equity price fluctuations in life insurance
and annuity product liabilities is relatively new
for life insurers.
Like other financial firms, life insurers have
developed sophisticated risk management
programs to hedge the combined risks from
interest rate and equity price fluctuations
and the optionality embedded in the various
financial guarantees through the use of
derivatives. Using available data for five of the
largest ten writers of variable annuities with
GLBs, aggregate gross notional amounts of
outstanding derivatives contracts grew from
$132 billion in 2003 to over $1,139 billion as of
year-end 2014. The reforms being implemented
as a result of Title VII of the Dodd-Frank Act
will help improve transparency and mitigate
the counterparty risks arising from the use of
derivatives associated with hedging of GLB
market risks.
Following the financial crisis, several carriers
exited the market for GLBs, and the remaining
carriers have taken a range of actions to
reduce risk arising from both new and in-
force business. Although these actions have
significantly reduced balance sheet exposures,
GLBs continue to present meaningful financial
risks.
5.4.3 Specialty Finance Companies
Credit activity in the specialty-lending
sector continued to expand moderately in
2014, yet still remains below pre-crisis levels
in both consumer and business lending.
Overall, specialty finance companies owned
approximately $881 billion of consumer
loans and $404 billion of business loans as of
January 2015 (Charts 5.4.10, 5.4.11). Finance
companies’ ownership of real estate loans
further declined, however, to $147 billion in
early 2015, and remains considerably lower than
the pre-crisis peak of $612 billion.

74 2 0 1 5 F S O C / / Annual Report
5.4.14 Selected ABS Spreads
5.4.13 ABS Issuance
5.4.12 Auto Loans Outstanding and Originations by TypeAlthough the growth in credit held by specialty
finance companies is much less than banks,
specialty finance companies are gaining
importance in certain types of origination.
This trend is evident in growing rates of
mortgage origination; from 2010 to 2014, the
ten largest nonbank mortgage originators
increased their market share from 11 percent
to nearly 20 percent. Many of these firms have
only recently entered the business.
Auto credit expanded at a brisk pace through
the end of 2014, with continued strong growth
in subprime loans. The share of automobile
loans originated by finance companies
remained stable at 53 percent (Chart 5.4.12).
Specialty finance companies also continue to
be the main originator of subprime auto loans,
originating 72 percent of these loans in the
fourth quarter of 2014.
Given the absence of a deposit base,
specialty finance companies rely heavily on
securitization. The private securitization
market has been highly supportive of growth
in the specialty finance company sector, with
overall issuance volume increasing 19 percent
to $225 billion in 2014 (Chart 5.4.13). Much
of the growth is attributed to increases in
issuance of housing-related ABS—which
does not include MBS—and credit card ABS.
Issuance of auto loan ABS increased 7 percent
in 2014, as well, with subprime securitizations
continuing to compose a larger share of total
issuance. The recent growth in subprime auto
loan securitizations has brought the amount of
these ABS outstanding to levels last observed
in 2007. Meanwhile, student loan ABS issuance
has continued to decline, reaching $14.1 billion
in 2014, well below its 2006 peak of $67.1
billion. Senior credit spreads on credit card and
auto ABS relative to Treasury securities have
widened since the start of 2014, consistent with
the rise in risk premia across credit markets in
general (Chart 5.4.14).

75 F inanc ia l Deve lopments
5.4.16 Agency REIT Price-to-Book Ratio
5.4.15 Agency REIT Assets and Leverage5.4.4 Agency REITs
After declining by roughly 25 percent in 2013,
agency REIT assets stabilized in 2014 at about
$300 billion (Chart 5.4.15). Leverage in the
industry, as measured by the ratio of assets
to equity, remained roughly flat at about 7,
which is significantly lower than the average of
11 observed in the mid-2000s, when both the
number of firms and total industry assets were
much smaller than their current levels.
Share prices of agency REITs largely rose in
2014, though the industry price-to-book ratio
remains below one (Chart 5.4.16), which
generally discourages issuance of new equity,
as agency REITs are incentivized to sell MBS
and use the proceeds to repurchase their
discounted shares. While MBS portfolio growth
would therefore require increased leverage,
agency REITs have instead continued to pare
back their leverage, in part due to expectations
that MBS spreads may widen in the future.
Many large agency REITs have also taken steps
to shorten the durations of their portfolios by
acquiring shorter-dated MBS, adjustable-rate
mortgages, and CRE assets. This shortened
duration, along with an increase in overall
hedging activity, may improve agency REITs’
resilience to the consequences of any potential
interest rate volatility moving forward.
Heavy reliance upon short-term borrowing
in the repo market exposes agency REITs
to rollover risk—the risk that lenders will
provide new funding on less attractive terms
or cease to provide funding at all. But as these
entities have continued to deleverage, funding
accessibility has remained stable. Some agency
REITs have taken further steps to reduce their
rollover risk by seeking greater diversity in
both the sources and the types of funding that
they utilize, such as Federal Home Loan Bank
(FHLB) borrowings. Deterioration of funding
conditions could occur, however, if agency
REITs were to undertake broad changes in their
risk profiles, or if unrelated dislocations in repo
markets prompted lenders to pull back from
their funding commitments.

76 2 0 1 5 F S O C / / Annual Report
5.5.3 Liquidity of Prime MMFs
5.5.2 U.S. MMF Holdings of European Entities’ CP, CD, and Repos
5.5.1 MMF Assets by Fund Type 5.5 Investment Funds
5.5.1 Money Market Mutual Funds
MMFs held $3.0 trillion of assets as of March
2015, practically unchanged from the previous
year. Over half of these assets ($1.7 trillion) are
held by prime MMFs, and about one third ($1.0
trillion) by government and Treasury MMFs
(Chart 5.5.1), with the balance held by tax-
exempt funds.
MMFs are major participants in the Federal
Reserve’s ON RRP and term RRP operational
exercises (see Section 5.2.2). MMFs have
significantly increased their participation in
the exercises as the Federal Reserve increased
participation limits as part of the evolution of
the exercise.
U.S. prime MMFs’ unsecured exposures to the
euro area have remained stable (Chart 5.5.2).
Prime MMFs continue to have small direct
exposure to peripheral euro area institutions.
A trend towards consolidation in MMFs
continues. As of March 2015, there were 542
MMFs, down from 559 at the same point in
2014. With short-term interest rates near zero,
many MMFs have waived their management
fees to keep net yields positive and retain their
investor base, while some fund sponsors have
exited the business.
In July 2014, the SEC adopted new money
market reforms, which will require a floating
NAV for institutional prime and institutional
tax-exempt MMFs, allowing the daily share
prices of these funds to fluctuate along with
changes in the market-based value of fund
assets. The reforms also allow for liquidity
fees and redemption gates in non-government
MMFs and are intended to mitigate the risk
of runs in prime and tax-exempt MMFs. As a
response to these reforms, MMF providers are
considering different options for funds they
manage, including converting prime MMFs
into government MMFs.

77 F inanc ia l Deve lopments
5.5.6 Monthly Bond Mutual Fund Flows
5.5.5 Net Assets of the Investment Company Industry
5.5.4 Weighted-Average Life of MMFsPrime MMFs’ daily liquidity hovered around
25 percent of assets in 2014 and early 2015,
significantly higher than the 10 percent
minimum required by SEC rules. Weekly
liquidity was steady at around 40 percent
of assets, also higher than the 30 percent
minimum required by the SEC (Chart 5.5.3).
The weighted-average life of all MMFs increased
slightly over the past 12 months, from 72 days to
75 days, but fell slightly for prime funds, from
80 days to 78 days (Chart 5.5.4).
5.5.2 Mutual Funds
Assets under management (AUM) of U.S.
mutual funds and other investment companies
have grown from approximately $1 trillion in
1990 to $18 trillion in December 2014 (Chart
5.5.5). Long-term (equity and bond/hybrid)
mutual funds, with assets of over $13 trillion,
represented 72 percent of total AUM as of
December 2014, which is unchanged from
December 2013.
Flows into bond and equity funds slowed
considerably in the second half of 2014
(Charts 5.5.6, 5.5.7), amid a weaker outlook
for the global economy and rising geopolitical
risks, but remained positive for the year as
a whole.
Bank loan mutual funds, which primarily
invest in lower-rated bank loans with floating
interest rates, had net outflows of $21 billion
in 2014, compared to inflows of $62 billion
in 2013 (Chart 5.5.8). Despite idiosyncratic
concerns about the financial condition of some
state and local finances, $28 billion flowed into
tax-exempt bond funds in 2014, compared to
outflows of $58 billion in 2013.
Alternative mutual funds, which include long-
short, market neutral and inverse strategies,
continued to grow fairly rapidly from a small
base, with inflows of $17 billion in 2014, down
from $40 billion in 2013 (Chart 5.5.9).

78 2 0 1 5 F S O C / / Annual Report
5.5.9 Alternative Mutual Funds: Annual Flows
5.5.8 Bank Loan Mutual Funds: Annual Flows
5.5.7 Monthly Equity Mutual Fund Flows Investors of equity funds continued to gravitate
toward passive, index-based investment
products. Index mutual funds and exchange-
traded funds (ETFs) now represent 39 percent
of U.S. equity fund AUM compared to 27
percent in 2009. Over the past 12 months,
inflows into U.S. equity index funds were $178
billion while active outflows were $138 billion,
resulting in a net inflow of $40 billion (Chart
5.5.10).
5.5.3 Pension Funds
As of the third quarter of 2014, the combined
AUM of private and public pensions, including
federal pensions and defined contribution
plans, was approximately $24.8 trillion
(Chart 5.5.11).
Corporate Plans
Corporate defined benefit funded status—the
estimated share of fund liabilities covered by
current assets—deteriorated in 2014 (Chart
5.5.12). One estimate of the funded status of
the 100 largest corporate pension plans fell to
81.7 percent in December 2014, a decline of
6.0 percentage points from the previous year.
The lower aggregate corporate funded status
resulted in part from the significant decrease
in the corporate pension liability discount rate
over the course of 2014. Corporate pension
discount rates, which are used to value pension
liabilities, declined in tandem with the
decrease in longer-term Treasury yields. Higher
investment returns in equities and alternative
assets failed to keep pace with the growth in
pension liabilities.
As of the end of 2014, new mortality
assumptions reflecting increases in life
expectancy were incorporated by some pension
funds, resulting in higher liabilities. Pension
funds can obtain relief via risk transfer
mechanisms such as longevity swaps, annuities
purchased from insurance companies, and
buyout or buy-in options. However, industry
analysis indicates an increase of about 3.4
percent in liabilities when new mortality
assumptions are incorporated.

79 F inanc ia l Deve lopments
-600
-400
-200
0
200
400
600
-600
-400
-200
0
200
400
600
2009 2010 2011 2012 2013 2014 2015
Billions of US$ Billions of US$
Source: Morningstar, Inc.
As Of: Mar-2015
Note: Includes ETFs and mutual funds.
International Passively ManagedU.S. Passively ManagedInternational Actively ManagedU.S. Actively Managed
5.5.12 Public and Private Pension Funding Levels
5.5.11 Retirement Fund Assets by Plan Type
5.5.10 Cumulative Equity Fund FlowsPublic Plans
Preliminary estimates of the aggregate funded
ratio of U.S. public pension plans rose to 80
percent as of June 30, 2014. Assets in public
plans grew by 13.7 percent driven by strong
equity and fixed income performance. Of
note, public pension funds generally use a
different set of accounting rules than private
pension funds, which could overstate funded
status. Indeed, industry analysis of liabilities
recalibrated to reflect similar methods used
by private pension funds shows liabilities to be
approximately 3.8 percent higher than those
reported by plan sponsors for 2014.
Several localities and states, such as Puerto
Rico, Detroit, Chicago, Connecticut, and
Illinois continue to face low levels of pension
funding as efforts to strengthen retirement
plans faltered amid a persistently low interest
rate environment. States, municipalities, and
territories may face important constraints in
improving strained fiscal conditions while
addressing pension funding shortfalls.
5.5.4 Hedge Funds
Hedge fund industry assets grew 8 percent in
2014 to an estimated $2.9 trillion, according
to industry research. The growth in assets was
driven by $140 billion in investment returns
and net inflows of $76 billion in 2014. Unlike
in previous years when the large majority of
net inflows were received by the largest hedge
funds, roughly half of all net inflows in 2014
were received by funds with less than $5 billion
in assets. Assets managed by funds of hedge
funds increased modestly in 2014, as investment
returns exceeded the net capital outflows from
this vehicle. Despite the bump in AUM, these
funds-of-funds nonetheless experienced net
capital outflows for the seventh straight year
in 2014.
Form PF data indicates that the use of
financial leverage by hedge funds was little
changed during 2014. In the Federal Reserve’s
Senior Credit Officer Opinion Surveys on
Dealer Financing Terms, about one fifth
of the respondents to the December 2014

80 2 0 1 5 F S O C / / Annual Report
5.5.15 Sponsor-Backed Payment-in-Kind Bonds
5.5.14 Pension Investment in Private Equity
5.5.13 U.S. Private Equity AUMsurvey indicated that the price terms, such
as financing rates, offered to hedge funds
for securities financing and OTC derivatives
transactions tightened during the quarter.
The most cited reason was the diminished
availability of balance sheet or capital from
bank counterparts. Market participants have
suggested that enhanced capital regulations,
notably the SLR, have made it more difficult
and more expensive for hedge funds to finance
their positions as dealers have deemphasized
low return on equity businesses such as repo
financing.
5.5.5 Private Equity
Private equity AUM for U.S.-focused funds
increased by $53 billion to $2.15 trillion as
of the third quarter of 2014 (Chart 5.5.13).
Existing investments climbed 3 percent year-to-
date to $1.52 trillion, while undeployed capital
remained relatively flat at $628 billion over this
period.
The growth in private equity investments
has been attributed, in part, to increased
participation by public pension funds. The
number of U.S.-based pension funds with
private equity exposure increased from 294 at
year-end 2013 to 305 in 2015 year-to-date, with
the average pension fund allocating 7.2 percent
of assets to private equity, slightly higher than
last year’s share (Chart 5.5.14).
Sponsor-backed high-yield bond issuance
declined to $59 billion over the past 12 months,
the lowest level since 2009, as leveraged buyout
activity was relatively limited during this period.
Of note, the ratio of debt to gross earnings
on leveraged loan deals is at its highest level
since 2007 and is near the upper end of bank
regulator guidance on leveraged lending. The
issuance of sponsor-backed payment-in-kind
(PIK) bonds, which are financing vehicles used
by private equity firms that are typically viewed
as highly risky for investors, declined to about
$3.6 billion, with no issuance in the past two
quarters (Chart 5.5.15). PIK issuance accounted
for 6 percent of all sponsor-backed high-yield
issuance over this period.

81 F inanc ia l Deve lopments
5.5.6 Exchange-Traded Products
ETPs include 1940 Act registered ETFs, non-
1940 Act registered ETPs (e.g., those that
primarily hold commodities or physical metals),
and exchange-traded notes. U.S.-listed ETPs
continued to grow at a faster pace than other
types of investment vehicles, with AUM over
$2 trillion, an 18 percent increase from the
previous year (Chart 5.5.16). ETPs now make
up roughly 15 percent of all long-term public
funds, with mutual funds composing almost
all the remaining 85 percent. Both equity and
fixed income ETPs experienced similar rates of
asset growth.
ETP flows and performance tended to mirror
that of their underlying assets; for example,
popular ETP themes in 2014 included demand
for domestic equity exposure and a continued
preference for dividend or income yield. Amid
central bank accommodation and recent
currency fluctuations, those internationally
focused ETPs that hedge out currency risk have
become increasingly popular among investors.
Finally, with much of the index landscape
already covered by existing ETPs, new products
have focused on tracking more exotic indices
or engaging in active management. Notably,
the SEC approved a structure that is a hybrid
between an ETF and a mutual fund.
5.6 OTC Derivatives Markets
Globally, Bank for International Settlements
(BIS) data shows that the notional amount of
outstanding OTC derivatives declined in 2014
to an estimated $630 trillion, but remains well
above levels seen in the mid-2000s (Chart 5.6.1).
Nearly half of these derivatives are booked
in U.S. institutions, which must report their
transaction data to SDRs regulated by
the CFTC.
5.5.16 U.S.-Listed ETP AUM and Count
0
100
200
300
400
500
600
700
800
0
100
200
300
400
500
600
700
800
2000 2002 2004 2006 2008 2010 2012 2014
Source: BIS, Haver Analytics
As Of: 2014 Q4Trillions of US$
Note: Notional values.
Trillions of US$
Unallocated
Interest Rate Contracts
Commodity ContractsCredit Default Swaps
Equity-linked Contracts
FX Contracts
5.6.1 Global OTC Derivatives Market

82 2 0 1 5 F S O C / / Annual Report
0
10
20
30
40
50
60
70
0
10
20
30
40
50
60
70
2005 2007 2009 2011 2013
Source: BIS, Haver Analytics
As Of: 2014 Q4Trillions of US$
Note: Notional values.
Trillions of US$
Single NameMulti-Name
The CFTC’s Swaps Report showed $327 trillion
in total notional amount outstanding across all
swap asset classes as of March 27, 2015. Interest
rate swaps dominate both the U.S. and global
OTC derivatives markets, and domestically
account for roughly 83 percent of notional
value, followed by FX swaps at roughly 10
percent and credit swaps at roughly 2 percent.
Equity and commodity swaps remain a small
percentage of the total market. The total
notional volume of credit default swaps (CDS)
continued to decline from its pre-crisis levels
(Chart 5.6.2).
Overall risk from derivatives exposures
measured by replacement cost, or the amount
that a market participant would lose if its
counterparty defaults, increased in the
second half of 2014 to approximately $3.36
trillion (Chart 5.6.3). The OCC estimates
show that total gross derivatives exposure to
the U.S. banking system reached a peak of
$804 billion at year-end 2008, when interest
rates steeply declined and credit spreads
widened significantly. But this exposure has
since fallen to $445 billion at the end of 2014,
in part because of the extended low interest
rate environment and the continuing drop in
exposure to credit contracts.
A few highly active dealer banks continue to
dominate U.S. OTC derivatives markets, with
four major U.S. banking institutions composing
92 percent of total U.S. banking industry
notional amounts outstanding (Chart 5.6.4).
The OCC estimates that roughly half (53
percent) of banks’ derivatives exposure is to
other banks and security firms, while 38 percent
is to corporations. The remaining 9 percent of
the derivatives exposures of banks is to hedge
funds, sovereigns, and monoline insurance
companies. Although the vast majority of actual
bank exposures to other financial institutions
are collateralized, a significant portion of
bank exposures to sovereigns and nonfinancial
corporations are not. Box D gives an overview
of the role of CCPs in the OTC derivatives
market.
5.6.2 Credit Derivatives Outstanding
5.6.3 Global OTC Derivatives: Gross Credit Exposure
5.6.4 Concentration of U.S. Derivative Exposures
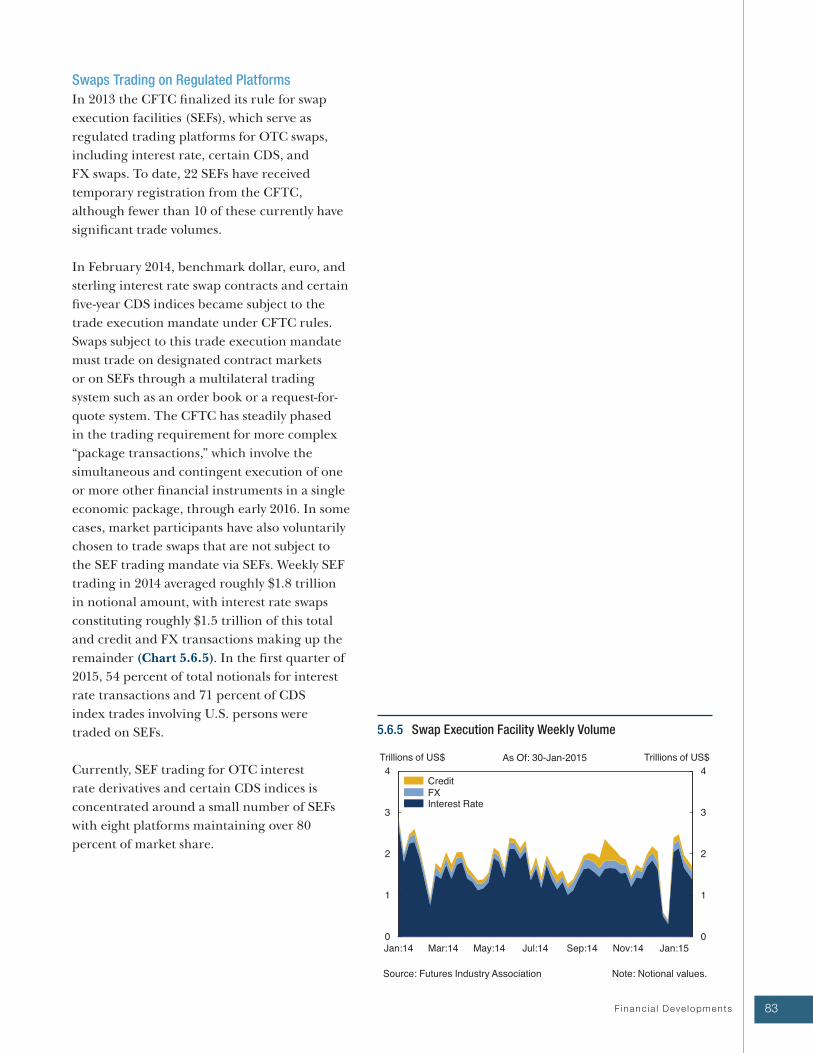
83 F inanc ia l Deve lopments
Swaps Trading on Regulated Platforms
In 2013 the CFTC finalized its rule for swap
execution facilities (SEFs), which serve as
regulated trading platforms for OTC swaps,
including interest rate, certain CDS, and
FX swaps. To date, 22 SEFs have received
temporary registration from the CFTC,
although fewer than 10 of these currently have
significant trade volumes.
In February 2014, benchmark dollar, euro, and
sterling interest rate swap contracts and certain
five-year CDS indices became subject to the
trade execution mandate under CFTC rules.
Swaps subject to this trade execution mandate
must trade on designated contract markets
or on SEFs through a multilateral trading
system such as an order book or a request-for-
quote system. The CFTC has steadily phased
in the trading requirement for more complex
“package transactions,” which involve the
simultaneous and contingent execution of one
or more other financial instruments in a single
economic package, through early 2016. In some
cases, market participants have also voluntarily
chosen to trade swaps that are not subject to
the SEF trading mandate via SEFs. Weekly SEF
trading in 2014 averaged roughly $1.8 trillion
in notional amount, with interest rate swaps
constituting roughly $1.5 trillion of this total
and credit and FX transactions making up the
remainder (Chart 5.6.5). In the first quarter of
2015, 54 percent of total notionals for interest
rate transactions and 71 percent of CDS
index trades involving U.S. persons were
traded on SEFs.
Currently, SEF trading for OTC interest
rate derivatives and certain CDS indices is
concentrated around a small number of SEFs
with eight platforms maintaining over 80
percent of market share.
5.6.5 Swap Execution Facility Weekly Volume

2 0 1 5 F S O C / / Annual Report84
Box D: Overview of Central Counterparties Relevant to OTC Derivatives Markets
CCPs simplify and centralize risk management for
particular financial markets by assuming the role
of buyer to every seller and seller to every buyer. In
the pre-Dodd-Frank bilateral market, the major OTC
derivatives dealers formed the core of the derivatives
market, transacting with each other and their clients
directly (Chart D.1). In contrast, CCPs are the
counterparty for their direct clearing members, which
include major derivatives dealer banks and other large
financial institutions. These clearing members interact
directly with the CCP both as principal and as agent
for their clients, which range from smaller financial
institutions to insurance companies and nonfinancial
firms (Chart D.2). In addition, a CCP reduces risks
to participants through multilateral netting of trades,
imposing risk controls on clearing members, and
maintaining financial resources commensurate with
risks it carries.
D.1 Bilateral Derivatives Market
Note: Clearing members consist mostly of large financial institutions.
CCP
Client
Small Financial Institution
Client
Clearing Members
Clearing Members
Clearing Members
Clearing Members
Clearing Members
Clearing Members
Small Financial Institution
Small Financial Institution
Small Financial Institution
Client
Client
Client
Small Financial Institution
D.2 Centrally Cleared Derivatives Market
losses in the event of a clearing member default.
The first level of these resources, initial margin, is
commensurate with clearing members’ individual
risk profiles. Many regulators further require CCPs to
establish ex-ante procedures for managing a clearing
member default and allocating any resulting losses,
in addition to procedures for allocating non-default
losses. While CCP default procedures vary in some
respects, the clarity provided by ex-ante delineation
of those procedures can potentially provide greater
certainty and confidence in times of market stress.
As the United States and other Group of Twenty (G-
20) members implement their commitment to centrally
clear standardized derivatives, the resulting increase
in central clearing of OTC derivatives transactions
via CCPs (Chart D.3) has focused market attention
on these risk management-driven institutions and
increased the profile of global and domestic regulatory
efforts to continue refining CCP risk management and
recovery and resolution planning. Centrally clearing
derivatives may require more sophisticated risk
modeling than centrally clearing transactions involving
assets that have clearly defined maximum exposures,
such as cash equity, fixed income securities, and
repos. Given the growing importance of CCPs,
domestic and foreign regulators have been actively
Unlike banks, CCPs do not undertake transactions
in derivatives markets that result in directional
exposures. Rather, by interposing themselves
between the parties to a transaction, in a process
known as novation, CCPs manage the clearing risk of
that transaction. CCPs maintain multiple levels of pre-
funded financial resources that may be used to cover

85 F inanc ia l Deve lopments
engaged in developing and implementing robust
risk management standards for CCPs (see Section 6.2.1).
The FSB estimates that globally, as of September
2014, CCPs were clearing an estimated 56 percent
of all currently clearable OTC derivatives transactions,
which represented 44 percent of OTC derivatives
transactions outstanding. For CDS, central clearing
increased from 10 percent in 2010 to 27 percent in
mid-2014.
In the United States, the CFTC has implemented
Dodd-Frank requirements for clearing certain
interest rate and index CDS transactions via CCPs.
As of March 20, 2015, 62 percent of interest rate
swap gross notionals reported to CFTC-registered
trade repositories were being cleared, according to
the CFTC Weekly Swaps Report. The SEC is also
adopting rules for clearing security-based swaps.
0
20
40
60
80
100
0
20
40
60
80
100
Oct:12 Apr:13 Oct:13 Apr:14 Oct:14
Source: CFTC
Percent Percent
Percentage of Interest Rate
Swaps Cleared
Percentage of Credit Swaps
Cleared
As Of: 27-Mar-2015
Note: Notional values. Data are adjusted for double-counting of cleared trades to show a single exposure for each trade. Methodology for collecting and reporting data changed in October 2013.
D.3 Centrally Cleared Swap Market

86 2 0 1 5 F S O C / / Annual Report
International Developments
European derivatives markets are similar to U.S.
markets in overall size. In 2014 the EU began
requiring derivatives transaction reporting by
all EU entities. The EU plans to begin imposing
its clearing mandate in 2015. European
exchange or platform trading requirements are
still under development and will not take effect
before early 2017.
Asian derivatives markets are significantly
smaller than those in the United States and
Europe, though they continue to grow. Japan
has made significant progress in implementing
reporting and clearing reforms, but other major
Asian jurisdictions are further behind. Several
jurisdictions have publicly expressed their
reluctance to impose trading requirements
on the basis that their derivatives markets are
much smaller than U.S. and European markets
and may lack the liquidity necessary to support
exchange or platform trading.
These developments have created a potential for
regulatory arbitrage—some jurisdictions have
reported that banks and other financial firms
are reorganizing their business activities, often
at client request, with the possible purpose of
avoiding U.S. regulatory requirements. For
instance, market observers have noted that the
largest globally active U.S. banking institutions
use their nonguaranteed U.K. affiliates for
transactions with their foreign customers, many
of whom prefer to avoid the CFTC clearing,
trading, and reporting requirements that
would apply if they transacted with the U.S.
parent institution. As a result of this shift,
the U.S. parent is not technically liable for
the transactions of the overseas affiliate with
the bank’s foreign customers. Regulators are
actively reviewing this development.

87Regu lato r y Deve lopments & Counc i l Ac t i v i t i es
Since the Council’s 2014 annual report, financial reform progress included further strengthening
of capital, leverage, and liquidity standards for financial institutions; continued application of
supervisory and company-run stress tests; continued supervisory review and comment on large banking
organizations’ resolution plans; adoption of a credit risk-retention requirement for ABS; adoption of
MMF reform; and other measures to enhance consumer protection.
In addition, the Council continued to fulfill its mandate. The Council continued to monitor potential
risks to U.S. financial stability and served as a forum for discussion and coordination among the
member agencies. The Council also made a determination that a nonbank financial company will
be subject to Federal Reserve supervision and enhanced prudential standards and completed its first
annual reevaluations of three previous determinations. The Council also conducted extensive public
engagement regarding potential risks posed by asset management products and activities.
The following is a discussion of the significant financial regulatory reforms implemented by the Council
and its member agencies since the Council’s 2014 annual report.
6.1 Safety and Soundness
6.1.1 Enhanced Capital and Prudential Standards and Supervision
Capital, Leverage, and Liquidity Standards
The banking agencies continued to make significant progress over the last year in implementing capital,
leverage, and liquidity standards.
In April 2014, the FDIC issued a final rule on the implementation of Basel III regulatory capital
standards, which revised risk-based and leverage capital requirements and was substantively identical
to the joint final rule issued by the OCC and the Federal Reserve in October 2013. Relatedly, the
FDIC issued a final rule in November 2014 to revise its risk-based deposit insurance assessment system,
primarily to conform it to the updated capital rules referenced in the FDIC’s assessment regulations.
In September 2014, the Federal Reserve, FDIC, and OCC adopted a final rule modifying the definition
of the denominator of the SLR in a manner consistent with international leverage ratio standards. The
final rule strengthens the SLR by modifying the methodology for including off-balance sheet items,
including credit derivatives, repo-style transactions, and lines of credit, in the denominator of the SLR.
The final rule’s changes apply to the SLR the agencies adopted in July 2013, which applies to advanced
approaches banking organizations, and to the enhanced SLR standards adopted in April 2014, which
apply to the largest U.S. banking organizations.
6 Regulatory Developments & Council Activities

2 0 1 5 F S O C / / Annual Report88
In September 2014, the banking agencies adopted a final rule implementing a quantitative LCR
requirement for certain large and internationally active banking organizations. After a transition period,
a company subject to the rule is required to maintain an amount of high-quality liquid assets that is no less
than 100 percent of its total net cash outflows over a prospective 30-day period of stress. The final rule,
effective January 1, 2015, applies the LCR requirements to banking organizations with consolidated total
assets of $250 billion or more or consolidated total on-balance sheet foreign exposure of $10 billion or more,
and to their subsidiary depository institutions with $10 billion or more of consolidated total assets. Under the
rule separately adopted by the Federal Reserve, banking organizations that are smaller or have less foreign
exposure, but still have $50 billion or more in total consolidated assets, are subject to a modified
LCR requirement.
In December 2014, Congress passed and the President signed into law the “Insurance Capital Standards
Clarification Act of 2014,” which provides the Federal Reserve with flexibility to tailor its capital framework to
firms substantially engaged in insurance underwriting activity.
Enhanced Prudential Standards
In November 2014, the Federal Reserve invited public comment on a proposed order to apply enhanced
prudential standards for the regulation and supervision of General Electric Capital Corporation, Inc.
(GECC), a nonbank financial company designated by the Council in July 2013 for Federal Reserve
supervision. The proposed standards include risk-based and leverage capital requirements, capital planning
and stress testing requirements, liquidity requirements, risk-management and risk-committee requirements,
independence requirements for GECC’s board of directors, and restrictions on intercompany transactions
between GECC and its parent, General Electric Corporation. The proposed order would also require GECC
to file certain regulatory reports with the Federal Reserve.
Separately, the Federal Reserve is assessing the business model, capital structure, risk profile, and systemic
footprint of the three insurance companies designated by the Council—MetLife, American International
Group (AIG), and Prudential Financial—to determine how enhanced prudential standards related to capital,
liquidity, and risk management would apply and if additional prudential standards may be necessary to reflect
any unique aspects in these companies’ business model, activities, or structure.
In December 2014, the Federal Reserve issued a proposed rule that would establish a methodology to identify
whether a U.S. BHC is a G-SIB. As such, a G-SIB would be subject to a risk-based capital surcharge that is
calibrated based on its systemic profile. The proposal builds on a G-SIB capital surcharge framework agreed
to by the BCBS and is augmented to address the risk arising from the over-reliance on short-term wholesale
funding. The G-SIB surcharge under the proposal would generally be higher than under the BCBS approach.
Failure to maintain the capital surcharge would subject the G-SIB to restrictions on capital distributions and
certain discretionary bonus payments.
Risk Governance Standards for Large Banks
In September 2014, the OCC issued enforceable guidelines that establish minimum standards for the design
and implementation of a risk governance framework for large insured national banks, insured federal savings
associations, and insured federal branches of foreign banks. The final guidelines also establish minimum
standards for an institution’s board of directors in overseeing the framework. The guidelines set out the roles
and responsibilities for front line units, independent risk management, and internal audit and provide that
such an institution should have a comprehensive written statement that articulates its risk appetite and serves
as a basis for the risk governance framework. The guidelines also provide that at least two members of such
an institution’s board of directors should be independent.

89Regu lato r y Deve lopments & Counc i l Ac t i v i t i es
Risk-Management Standards for Designated FMUs
In October 2014, the Federal Reserve issued a final rule amending the risk-management standards in its
Regulation HH, designated FMUs, to replace two sets of risk-management standards, one for payment
systems and one for central securities depositories and CCPs, with a common set of standards for all types
of designated FMUs. The new standards and definitions amendments are based on the international risk-
management standards in the Principles for Financial Market Infrastructures (PFMIs) developed jointly by
the Committee on Payment and Market Infrastructures and the Technical Committee of the IOSCO. The
final rule was effective December 31, 2014.
Concentration Limit
In November 2014, the Federal Reserve issued a final rule, Regulation XX, to implement Section 622 of
the Dodd-Frank Act and establish a financial sector concentration limit. The final rule prohibits a financial
company from merging or consolidating with, or acquiring control of, another company if the resulting
company’s liabilities would exceed 10 percent of the aggregate consolidated liabilities of all financial
companies. The rule also establishes reporting requirements for certain financial companies that do not
otherwise report consolidated financial information to a bank regulatory agency.
6.1.2 Dodd-Frank Act Stress Tests and Comprehensive Capital Analysis and Review
Section 165(i) of the Dodd-Frank Act requires two types of stress tests. First, the Federal Reserve must
conduct annual supervisory stress tests of BHCs with $50 billion or more in total consolidated assets and of
nonbank financial companies designated by the Council. Second, financial companies with more than $10
billion in total consolidated assets regulated by a primary federal financial regulatory agency must conduct
annual stress tests, and BHCs with $50 billion or more in total consolidated assets and nonbank financial
companies designated by the Council must also conduct semiannual company-run stress tests.
This is the third year that the stress tests have been conducted pursuant to the Dodd-Frank Act and the fifth
round of stress tests and capital plan assessments since 2009. The results of company-run, mid-year stress tests
were released by certain banking organizations in September 2014. Institutions with $10 billion to $50 billion
in assets began their second stress test cycle in 2014, and public disclosures of their 2014 to 2015 stress test
results will occur in June 2015. The results of the Federal Reserve’s annual Dodd-Frank Act supervisory stress
tests were released in March 2015 (see Section 5.3.1).
6.1.3 Resolution Plans and Orderly Liquidation Authority
Resolution Plans
Under the framework of the Dodd-Frank Act, resolution under the U.S. Bankruptcy Code is the statutory
first option in the event of the failure of a financial company. Section 165(d) of the Dodd-Frank Act
requires nonbank financial companies designated by the Council for supervision by the Federal Reserve
and BHCs—including FBOs that are, or are treated as, BHCs—with total consolidated assets of $50 billion
or more to report periodically to the Federal Reserve, the FDIC, and the Council with plans—also referred
to as living wills—for their rapid and orderly resolution under the U.S. Bankruptcy Code in the event of
material financial distress or failure. The Federal Reserve and the FDIC review each plan and may jointly
determine that a plan is not credible or would not facilitate an orderly resolution of the company under
the U.S. Bankruptcy Code. If the Federal Reserve and the FDIC make such a joint determination, then the
company must resubmit its plan with revisions that address the deficiencies jointly identified by the Federal
Reserve and FDIC, including any proposed changes in business operations and corporate structure, and with
an explanation of why the company believes that the revised plan is credible and would result in an orderly
resolution under the U.S. Bankruptcy Code.

2 0 1 5 F S O C / / Annual Report90
In August 2014, the Federal Reserve and the FDIC delivered letters to 11 large global banking organizations
regarding their second round of resolution plan submissions. In the letters, the agencies jointly identified
some shortcomings that the companies must demonstrate they are making significant progress toward
addressing in their 2015 plans. The common features of the identified shortcomings include:
• assumptions that the agencies regard as unrealistic or inadequately supported, such as assumptions
about the likely behavior of customers, counterparties, investors, central clearing facilities, and
regulators; and
• failure to make or identify the kinds of changes in firm structure and practices that would be
necessary to enhance the prospects for orderly resolution.
Based on its review, the FDIC Board of Directors determined, pursuant to Section 165(d) of the Dodd-Frank
Act, that these plans are not credible and do not facilitate an orderly resolution under the U.S. Bankruptcy
Code. The Federal Reserve determined that these banking organizations must take immediate action to
improve their resolvability and reflect those improvements in their 2015 plans. These firms are required to
submit plans that are responsive to the identified shortcomings on or before July 1, 2015. The agencies agreed
that in the event that the firms do not submit such plans, the agencies expect to use their authority under
Section 165(d) to determine that a resolution plan does not meet the requirements of the Dodd-Frank Act.
The firms have begun to undertake projects to improve their resolvability under the U.S. Bankruptcy Code.
An important area stressed in the letters is the need for legal entity rationalization that would take into
account the best alignment of legal entities and business lines to improve a firm’s resolvability. Agency staff
are working with the firms to discuss expected improvements in the forthcoming 2015 resolution plans and
efforts, both proposed and already in progress, to facilitate each firm's 2015 resolution strategy.
Orderly Liquidation Authority
In cases for which resolution of a financial company under the U.S. Bankruptcy Code would have serious
adverse effects on financial stability in the United States, the Dodd-Frank Act establishes the OLA as a
statutory framework to enable the orderly resolution of financial companies without cost to taxpayers. The
OLA includes specific authorities granted to the FDIC that were not available during the 2008 financial crisis
but which largely parallel those the FDIC uses to resolve failed insured depository institutions.
The OLA also allows the FDIC to impose a temporary stay on certain financial contracts to prevent
contagion and market disruption in a failure. Though this stay helps address risks posed by such contracts
within the United States, questions remain regarding cross-border contracts or those not subject to
U.S. law. The resolution stay protocol adopted by ISDA represents a step toward addressing these questions
(see Section 3.1.6).
Orderly resolution also requires sufficient debt and equity to absorb losses and fund operations during a
resolution process. In November 2014, the FSB issued a consultative paper on “total loss-absorbing capacity”
for G-SIBs (see Section 3.1.6). Both the resolution stay protocol and the upcoming loss-absorbing capacity
requirements are designed to significantly improve the cross-border resolvability of firms under both the
OLA and the U.S. Bankruptcy Code.

91Regu lato r y Deve lopments & Counc i l Ac t i v i t i es
U.S. regulators have worked closely with all the major financial jurisdictions, including the United Kingdom,
Germany, France, and other EU entities as well as Switzerland and Japan, to identify issues and to address
obstacles to cross-border resolution. Key to this effort has been the on-going dialogue with authorities in the
United Kingdom. In October 2014, the FDIC hosted the heads of the Treasuries, central banks, and leading
financial regulatory bodies in the United States and United Kingdom at a discussion regarding resolution
strategies in the event of the failure of a G-SIB under U.S. and U.K. resolution regimes. The exercise built
upon prior bilateral work, including the publication of a joint paper on resolution, participation in detailed
simulation exercises, and participation in other joint staff-level resolution planning efforts.
6.1.4 Insurance
FIO, state regulators, and the Federal Reserve compose the U.S.-based members of the International
Association of Insurance Supervisors (IAIS). FIO’s director and three state insurance regulators, in addition
to supervisors from other jurisdictions, serve on the IAIS’s Executive Committee.
Through service on the IAIS’s Financial Stability Committee, FIO, NAIC, the Federal Reserve, and state
regulators have participated extensively in the process of evaluating insurers for potential identification
by the IAIS and the FSB as global systemically important insurers (G-SIIs) and in developing the policy
measures to be applied to any such G-SII. The FSB, which was tasked by the G-20 to identify G-SIIs, delegated
the development of a methodology to identify G-SIIs and the development of policy measures applicable to
G-SIIs to the IAIS. On July 18, 2013, the FSB, in consultation with the IAIS, identified an initial list of nine
G-SIIs that included three U.S.-based insurers. On November 6, 2014, the FSB, after consultation with the
IAIS and national authorities, reaffirmed the G-SII status of the nine firms identified in 2013. A decision on
the G-SII status of reinsurers was postponed pending further development of the methodology as needed to
ensure, among other things, that it appropriately addresses all types of insurance and reinsurance, and other
financial activities of global insurers.
In the absence at that time of an international capital standard for insurance companies, the FSB also called
upon the IAIS to develop several separate capital measures. On October 23, 2014, the IAIS finalized the
first such measure—a straightforward basic capital requirement (BCR) that applies to all group activities,
including the non-insurance activities, of G-SIIs. The BCR will serve as an initial foundation for the higher
loss-absorbency (HLA) requirements for G-SIIs; HLA is scheduled for development by the IAIS by the end
of 2015.
The IAIS also has made significant progress toward developing a more risk-sensitive group-wide global
insurance capital standard (ICS) that will apply to internationally active insurance groups and the G-SIIs.
On December 17, 2014, the IAIS issued a public consultation document on the ICS, and the IAIS is currently
considering the extensive feedback received from stakeholders. Once implemented, it is expected that the
ICS will replace the BCR as the foundation for HLA applicable to G-SIIs. U.S. representatives from FIO, the
Federal Reserve, and state insurance regulators have been working together on efforts to develop the ICS.
Since early 2012, FIO, state regulators, the NAIC, the European Commission, and the European Insurance
and Occupational Pensions Authority have participated in a FIO-initiated project to increase mutual
understanding and enhance cooperation between the EU and the United States intended to promote
business opportunity, consumer protection, and effective supervision. During 2014, the Steering Committee
of the EU-U.S. Insurance Project reaffirmed its commitment to the project and updated its Way Forward
document establishing objectives and initiatives concerning professional secrecy and confidentiality, group
supervision, solvency and capital requirements, reinsurance and collateral requirements, supervisory
reporting and data collection, peer reviews and examinations.

2 0 1 5 F S O C / / Annual Report92
Under Title V of the Dodd-Frank Act, FIO has the authority to assist the Treasury Secretary in negotiating
“Covered Agreements” in conjunction with the U.S. Trade Representative. A covered agreement is a written
bilateral or multilateral agreement between the United States and one or more foreign governments,
authorities, or regulatory entities regarding prudential measures with respect to the business of insurance
or reinsurance that meets certain specified standards and can preempt state laws in certain narrow
circumstances. In 2013, FIO recommended that the United States pursue a covered agreement relating
to reinsurance collateral requirements. FIO and the U.S. Trade Representative are continuing work
towards achieving the preconditions in order to initiate negotiations for a covered agreement with leading
reinsurance jurisdictions.
Title I of the Terrorism Risk Insurance Program Reauthorization Act of 2015 (2015 Reauthorization Act),
which was enacted on January 12, 2015, amended several features of the Terrorism Risk Insurance Act of
2002. The 2015 Reauthorization Act extends the termination date of the Terrorism Risk Insurance Program
(TRIP) to December 31, 2020, while gradually reducing the federal share of loss reimbursement that may
be paid to insurers under TRIP. The 2015 Reauthorization Act also requires that Treasury issue several
reports and new rules as part of the implementation process. Broad support existed for extending the federal
backstop for insured terrorism losses. According to the 2014 report of the President’s Working Group on
Financial Markets, terrorism risk insurance would likely be less available and more costly in the absence of
TRIP. FIO also assists in administering the TRIP.
Congress also passed the National Association of Registered Agents and Brokers (NARAB) Reform Act of
2015, which requires the establishment of a nonprofit corporation through which non-resident insurance
producers may do business on a multi-state basis. NARAB maintains state supervisory and disciplinary
authority over insurance producers while also creating a mechanism to streamline market access nationwide.
State insurance regulators, through the NAIC, continue work on updating the insurance financial solvency
framework and to refine existing accounting, reporting, valuation, and risk-based capital requirements.
States continue to enact new and updated NAIC model laws related to the Solvency Modernization Initiative,
including the revised Credit for Reinsurance Model Act, the revised Insurance Holding Company System
Regulatory Act (including the new enterprise risk report), the Risk Management and Own Risk and Solvency
Assessment (ORSA) Model Act (requiring the ORSA filing), and the revised Standard Valuation Law to
implement principle-based reserving.
In addition, state insurance regulators continue to build on various aspects of these projects through
implementation efforts at the NAIC. This includes the NAIC’s approval of six international supervisory
authorities as qualified jurisdictions under the Process for Developing and Maintaining the NAIC List
of Qualified Jurisdictions as part of the implementation of the Credit for Reinsurance Model Act. As of
February 2015, the NAIC Reinsurance Financial Analysis Working Group had approved 26 companies as
certified insurers for passporting purposes to facilitate consistency among the states and to coordinate
multi-state efforts.
The states, through the NAIC, are moving toward establishing a more consistent regulatory framework for
life insurance affiliated captive reinsurance transactions relating to certain term and universal life insurance
products. This framework would provide for transparency of the reserves and assets held by the captives,
including through the 2015 implementation of a new Reinsurance Supplement to the Annual Statement
covering existing transactions as of year-end 2014 and through financial analysis procedures for use by
states when reviewing 2014 statutory financial statements, as well as through Actuarial Guideline 48, which
is effective for these transactions as of the beginning of 2015. While efforts continue on a new Reinsurance
Model Regulation and related modifications to risk-based capital and audited financial statement disclosures

93Regu lato r y Deve lopments & Counc i l Ac t i v i t i es
for these transactions, the Financial Regulation Standards and Accreditation (F) Committee is considering
revisions to the scope of the NAIC Accreditation program to clarify its application to certain captives,
including those established to finance term and universal life insurance product reserves as well as captive
transactions involving variable annuities and long-term care. The NAIC’s Financial Condition (E) Committee
will study the regulatory-related incentives that encourage insurers to engage in variable annuity reinsurance
transactions with captives and consider any appropriate adjustments to the NAIC solvency framework
required by the Accreditation program.
6.1.5 Federal Mortgage-related Settlements
Since the Council’s last annual report, federal agencies continued to reach significant settlements with
financial institutions relating to mortgage practices and the sale of mortgage securities. These settlements
contained provisions for consumer relief in several forms, including loan modifications, new loans and
payment assistance to borrowers, and financing for affordable rental housing.
In June 2014, the Justice Department, CFPB, and HUD, together with state attorneys general in 49 states and
the District of Columbia, reached a nearly $1 billion settlement with SunTrust Mortgage, Inc. The agreement
addresses mortgage origination, servicing, and foreclosure abuses between January 2006 and March 2012. In
July 2014, the Justice Department announced an additional $320 million settlement with the company related
to a criminal investigation of its administration of the Home Affordable Modification Program (HAMP). The
settlement amounts include relief to certain borrowers and consumers.
Also in July 2014, the Justice Department, along with federal and state authorities, announced a $7.0 billion
settlement with Citigroup to resolve claims related to Citigroup’s conduct in the offering of RMBS prior
to January 1, 2009. This amount includes a $4.5 billion civil penalty paid to the Justice Department and
$2.5 billion in consumer relief. As part of the settlement, Citigroup acknowledged that it made serious
misrepresentations about the mortgage loans it securitized in RMBS.
The Justice Department and federal and state authorities announced a $16.7 billion settlement in August
2014 with Bank of America to resolve claims regarding conduct in the origination of mortgages and offering
of RMBS that occurred at Countrywide and Merrill Lynch. Approximately $7.0 billion will go to consumers
harmed by the unlawful conduct. The amount also includes a $5.0 billion civil penalty, which is the largest
civil penalty to date under the Financial Institutions Reform, Recovery, and Enforcement Act.
6.2 Financial Infrastructure, Markets, and Oversight
6.2.1 Over-the-Counter Derivatives Reform
The CFTC and SEC continued to implement Title VII of the Dodd-Frank Act, which establishes a
comprehensive new regulatory framework for swaps and security-based swaps.
In June 2014, the SEC adopted the first of a series of rules and guidance that explain when a cross-border
transaction must be counted toward the requirement to register as a security-based swap dealer or major
security-based swap participant. The rules also address the scope of the SEC’s cross-border anti-fraud
authority.

2 0 1 5 F S O C / / Annual Report94
Margin Standards for Uncleared Derivatives
In September 2013, IOSCO published a policy framework establishing global minimum margin standards
for non-centrally cleared transactions. Once implemented, these margin standards will increase protective
collateral and decrease implicit leverage in OTC derivatives markets. While implementation of these
standards by national jurisdictions was originally scheduled to begin in December 2015, the BCBS and
IOSCO have recently recommended extending initial implementation until September 2016 to provide firms
with additional time to adjust operational and risk-management practices.
In September 2014, the CFTC, the federal banking agencies, the FHFA, and the Farm Credit Administration
re-proposed rules previously proposed in 2011 governing margin requirements for swap and security-based
swap dealers and for major swap and security-based swap market participants. The proposed rules would
impose initial margin and variation margin requirements for uncleared swaps held by entities under each
agency’s jurisdiction. The CFTC’s release also included an advance notice of proposed rulemaking requesting
public comment on the cross-border application of such margin requirements.
CCPs: Relevant Standards, Regulation, and Regulators
CCPs that serve U.S. market participants are regulated by the CFTC and SEC. The SEC is the supervisory
agency for the Fixed Income Clearing Corporation (FICC), the National Securities Clearing Corporation
(NSCC), the Depository Trust Company (DTC), and the Options Clearing Corporation, while the CFTC is
the supervisory agency for Intercontinental Exchange (ICE) Clear Credit, LLC and the Chicago Mercantile
Exchange (CME), although both the CFTC and the SEC supervise Options Clearing Corporation, ICE Clear
Credit, LLC and CME for activities under their respective jurisdictions. Under Title VIII, the Federal Reserve
also has certain authorities with respect to the supervision of CCPs that have been designated as systemically
important by the Council. These authorities include participation in examinations, review of material
changes to their operations that may affect the level or nature of risk of the CCP, and the ability to establish
an account at a Federal Reserve Bank and to offer associated account services for each designated FMU. In
2012, the Council designated FICC, NSCC, Options Clearing Corporation, CME, and ICE Clear Credit LLC
as systemically important FMUs under Title VIII of the Dodd-Frank Act. DTC, CLS Bank International, and
The Clearing House Payments Company L.L.C. also were designated as systemically important FMUs, but
are not CCPs.
In April 2012, the Committee on Payments and Market Infrastructures (CPMI), an international group
of central banks of which the Federal Reserve is a member, and IOSCO, of which the CFTC and SEC are
members—together CPMI-IOSCO—released the PFMIs, which harmonized and strengthened existing
international standards for CCPs and other types of financial market infrastructures (FMIs).
U.S. supervisory agencies have implemented or proposed regulations that are consistent with the PFMIs.
In December 2013, the CFTC implemented rules for CFTC-regulated CCPs that are designated FMUs. The
SEC proposed its rules for certain clearing agencies in March 2014. The Federal Reserve issued a final rule
amending the Regulation HH risk management standards for designated FMUs that became effective in
2014.
In October 2014, the FSB published an annex to the Key Attributes of Effective Resolution Regimes
standard covering FMIs and FMI participants, which include CCPs. Among other things, this annex provides
additional detail on the aspects that domestic regulators should incorporate into their resolution planning
efforts for CCPs. CPMI-IOSCO also released a report providing guidance for FMIs and authorities on the
development of comprehensive and effective recovery plans as well as discussing the relationship between risk
management, recovery, and resolution.

95Regu lato r y Deve lopments & Counc i l Ac t i v i t i es
CCPs: Ongoing Domestic and International Regulatory Initiatives
Regulators are actively working on many domestic and international work streams related to CCPs, a number
of which are highlighted here. The Federal Reserve, as a member of CPMI, and the CFTC and SEC, as
members of IOSCO, are actively engaged in ongoing discussions relating to CCP risk management standards,
stress testing, cyber risk, and disclosure standards. To promote transparency in the implementation by
CCPs of the PFMIs and risk management practices, CPMI-IOSCO published additional guidance on public
quantitative disclosure standards for CCPs in February 2015. Also in February, the G-20 tasked the FSB,
together with CPMI, IOSCO, and the BCBS, to develop a work plan for identifying and addressing any
remaining gaps and potential financial stability risks related to CCPs that are systemic across multiple
jurisdictions and to help enhance CCP resolvability.
Domestically, the Council remains engaged on FMU matters to carry out its responsibilities under the
Dodd-Frank Act. Staff committees of the Council are currently engaged in work on two priority areas. First,
a working group is focusing on various CCP risk management issues, including the default management
process, liquidity risk management, and banks’ management of exposures to CCPs. Second, another working
group is providing input to the FDIC’s efforts to develop resolution plans for the designated FMUs.
6.2.2 Securitization Reform
Pursuant to the Dodd-Frank Act, the Federal Reserve, FDIC, OCC, SEC, FHFA, and HUD, with coordination
by the Secretary of the Treasury, in his capacity as Chairperson of the Council, adopted a joint final
rule in October 2014 requiring sponsors of ABS to retain at least 5 percent of the credit risk of the assets
collateralizing the ABS. As required by the Dodd-Frank Act, the final rule defines a qualified residential
mortgage (QRM) and exempts securitizations of QRMs from the risk retention requirement. The final
rule also does not require any retention for securitizations of commercial loans, commercial mortgages, or
automobile loans if they meet specific standards for high quality underwriting. The rule is intended to help
align the interests of ABS-deal sponsors and investors and provide an incentive for sponsors to monitor the
credit quality and underwriting of assets they securitize.
Separately, in August 2014, the SEC adopted revisions to its regulations governing the public offering process,
disclosure, and reporting for ABS. The final rules generally require that the public offering prospectuses and
ongoing reports of ABS backed by real estate-related assets, auto-related assets, or debt securities—including
resecuritizations—contain specified asset-level information about each of the assets in the pool. These
revisions are intended, in part, to address a concern that previously ABS investors may not have received all
the information necessary to understand the risks underlying the securities.
6.2.3 Money Market Mutual Fund Reform
In July 2014, the SEC adopted significant structural reforms for the regulation of MMFs (see Section 3.2.1).
The reforms are intended to make MMFs less susceptible to runs that could threaten financial stability and
harm investors.
6.2.4 Credit Rating Reforms
The Dodd-Frank Act included a number of measures to improve the quality of credit ratings. In August 2014,
the SEC adopted new rules and amendments to existing rules regarding credit rating agencies. These rules
addressed internal controls; conflicts of interest; disclosure of credit rating performance statistics; procedures
to protect the integrity and transparency of rating methodologies; disclosures to promote the transparency of
credit ratings; and standards for training, experience, and competence of credit analysts. The requirements
provide for an annual certification by a credit rating agency’s CEO as to the effectiveness of internal controls
and additional certifications to accompany credit ratings attesting that the rating was not influenced by other
business activities.

2 0 1 5 F S O C / / Annual Report96
6.2.5 Operational Risks for Technological Systems and Cybersecurity
In November 2014, the SEC adopted Regulation SCI, which is designed to strengthen the technology
infrastructure of the U.S. securities markets. The rules, which impose requirements on certain key market
participants, including registered national securities exchanges and clearing agencies, are intended to reduce
the occurrence of systems issues, including operational disruptions, compliance issues and intrusions such
as hacking incidents, and to improve resiliency when systems issues do occur. The rules provide a framework
for these entities to implement comprehensive policies and procedures to help ensure operational capability,
take appropriate corrective action when systems issues occur, provide notifications and reports to the SEC
regarding systems problems and systems changes, inform members and participants about systems issues,
conduct business continuity testing, and conduct annual reviews of their automated systems.
The banking regulators have prioritized and are collaborating and coordinating on cybersecurity through
the FFIEC. In the past year, the FFIEC members piloted a cybersecurity exam work program at over 500
community institutions. The results of this assessment are informing the FFIEC members’ priorities on
cybersecurity including development and issuance of a self-assessment tool that financial institutions can use
to evaluate their readiness to identify, mitigate, and respond to cyber threats. The FFIEC also will enhance its
incident analysis, crisis management, training, and policy development and expand its focus on technology
service providers’ cybersecurity preparedness. Additionally, the members raised awareness of cybersecurity
threats and vulnerabilities and risk mitigation steps to address them, including hosting a webinar and
publishing statements on ATM cash-out schemes, distributed denial of service attacks, and the Heartbleed
and Shellshock vulnerabilities. This year, the FFIEC published updated business continuity guidance on
strengthening the resilience of outsourced technology services, including cyber resilience.
FIO and the NAIC, along with the Council’s independent member with insurance expertise, as well as other
federal financial regulators, also participate in governmental and industry groups focused on cyber issues,
including the FBIIC and the Financial Services Sector Coordinating Council’s (FSSCC) Cyber Insurance
Working Group. State insurance regulators, through the NAIC, also have established a Cyber Security Task
Force to coordinate state regulatory activities relating to cybersecurity issues including analyzing information
regarding the cyber insurance market and discuss potential regulatory standards relating to cybersecurity.
FIO is encouraging examination standards for cybersecurity for the insurance sector that are consistent
across all states and which comply with best practices. FIO also heads the IAIS Financial Crimes Task Force,
which is called upon to “explore the area of cyber-crime risks to the insurance sector.”
6.2.6 Accounting Standards
In May 2014, the Financial Accounting Standards Board (FASB) and the International Accounting
Standards Board (IASB) jointly issued a converged standard on the recognition of revenue from contracts
with customers. The core principle of the new standard is for companies to recognize revenue to depict
the transfer of goods or services to customers in amounts that reflect the payment to which the company
expects to be entitled in exchange for those goods or services. The new standard is also intended to result in
enhanced disclosures about revenue, provide guidance for transactions that were not previously addressed
comprehensively, and improve guidance for multiple-element arrangements.
In June 2014, the FASB issued a new standard to improve the financial reporting of repos and other similar
transactions. The new guidance aligns the accounting for repurchase-to-maturity transactions and repos
executed as a repurchase financing with the accounting for other typical repos such that, going forward,
these transactions would all be accounted for as secured borrowings. The new guidance also brings U.S.
generally accepted accounting principles (GAAP) into greater alignment with International Financial
Reporting Standards for repurchase-to-maturity transactions.

97Regu lato r y Deve lopments & Counc i l Ac t i v i t i es
In February 2015, the FASB issued a new standard to improve targeted areas of consolidation guidance
for legal entities such as limited partnerships, limited liability corporations, and securitization structures,
including collateralized debt obligations, CLOs, and MBS. The new standard simplifies consolidation
accounting by reducing the number of consolidation models and places more emphasis on risk of loss in
determining when to consolidate.
6.3 Mortgage Transactions, Housing, and Consumer Protection
6.3.1 Mortgage Transactions and Housing
The Dodd-Frank Act requires certain federal agencies that guarantee, insure, or administer mortgages to
define which loans are defined as qualified mortgages (QMs) for the purposes of the Truth in Lending Act
(TILA). It also authorizes the agencies to exempt streamlined refinances from certain income-verification
requirements of TILA. In May 2014, the Department of Veterans Affairs (VA) issued an interim final rule to
establish which VA-guaranteed loans are to be considered QMs for the purposes of the new ability-to-repay
requirements under TILA. In its interim final rule, the VA establishes that almost all VA loans that meet
current VA underwriting standards will qualify for the QM safe harbor with regard to the ability-to-repay
requirements of TILA.
In August 2014, the CFPB published a proposed rule to amend its Regulation C, which implements the
Home Mortgage Disclosure Act (HMDA). Among other measures, the CFPB has proposed to revise the
tests for determining which financial institutions and housing-related credit transactions are covered under
HMDA to require the reporting of new data points identified in the Dodd-Frank Act, and to better align the
requirements of Regulation C to existing industry standards to the extent practicable.
In November 2014, the CFPB published a final rule amending its 2013 ability-to-repay and mortgage servicing
rules. The final rule provides an alternative small servicer definition for nonprofit entities that meet certain
requirements and amends the existing exemption from the ability-to-repay rule for nonprofit entities that
meet certain requirements. The final rule also provides a cure mechanism for the points and fees limit that
applies to QMs.
In January 2015, the FHFA proposed new minimum financial eligibility requirements for mortgage seller/
servicers to do business with Fannie Mae and Freddie Mac. The proposed minimum financial requirements
include net worth, capital ratio, and liquidity criteria for such seller/servicers, which are designed to ensure
the safe and sound operation of Fannie Mae and Freddie Mac. In March 2015, state bank and mortgage
regulators published a proposed set of prudential standards for nonbank mortgage servicers; this proposal
establishes baseline prudential standards that apply to all nonbank mortgage servicers and enhanced
prudential standards for larger, more complex entities.
6.3.2 Consumer Protection
Among its authorities, the CFPB may supervise certain nonbank entities, including mortgage companies,
private education lenders, payday lenders, “larger participants” of a market for other consumer financial
products and services, and any nonbank covered person that the CFPB has reasonable cause to determine is
engaging or has engaged in conduct that poses risks to consumers with regard to the offering or provision of
consumer financial products or services. The CFPB has issued a series of larger-participant rulemakings for
specific markets, which establish the scope of the CFPB’s nonbank supervision authority in those markets. In
September 2014, CFPB issued its latest larger-participant rulemaking, defining a market for “international
money transfers.” This rule covers certain electronic transfers. In general, the definitions in the final rule
track many key terms of the CFPB’s Regulation E for remittance transfers. The rule provides that a nonbank

2 0 1 5 F S O C / / Annual Report98
covered person is a larger participant in the market for international money transfers if the entity has at least
one million aggregate annual international money transfers.
In October 2014, the CFPB also published a proposed rule to identify a market for automobile financing
and define certain nonbank covered persons as larger participants in this market. Under the proposal, a
nonbank entity would be a larger participant in the market for automobile financing if the entity has at
a least 10,000 aggregate annual originations. Automobile financing would be defined to include grants
of credit for purchasing an automobile, refinancing of these credit obligations, and the purchasing or
acquiring of these obligations. The proposed rule would also define automobile leases and the purchasing or
acquiring of automobile leases as automobile financing but would not include automobile title lending or the
securitization of automobile loans or leases.
The CFPB also published in December 2014 a proposed rule to amend its Regulation E to regulate a broad
range of general purpose reloadable prepaid accounts, including extensions of credit offered through
those accounts. These prepaid accounts typically offer services and functionality similar to a debit card
linked to a checking account, although not necessarily including deposit insurance, and consumers who
are unbanked or otherwise underserved in financial services can use these prepaid accounts to obtain
access to financial services such as the ability to (1) avoid carrying cash; (2) conduct card transactions with
merchants that accept network-branded cards; (3) use direct-deposit services; (4) use online bill-pay services;
and (5) review a history of financial transactions. Regulation E provides consumer protections for certain
electronic fund transfers. Under the CFPB’s proposed rule, those protections generally would be extended
to a prepaid account. Under the proposed rule, for example, a financial institution would be required to
provide consumers who use prepaid accounts with certain disclosures before they acquire the account and to
make more detailed disclosures easily available. The proposed rule also would require financial institutions
to provide consumers with access to information about their accounts’ transactions, to resolve errors in
accordance with Regulation E, and to limit consumers’ liability for unauthorized transactions. The CFPB also
proposed to amend its Regulation Z, which implements TILA, to require a financial institution that offers
credit or overdraft services in connection with a prepaid account to treat the account as a credit card and
to provide relevant protections under Regulation Z, including assessing the consumer’s ability to pay before
extending credit.
6.4 Data Gaps and Standards
6.4.1 Data Gaps
From a regulatory perspective, data gaps can take various forms. Regulators may not have data of sufficient
scope, detail, or frequency to conduct robust analyses. Those data also may not be sufficiently standardized,
or there may be legal restrictions on sharing the data. Furthermore, market participants need high-quality
financial data to ensure efficient market functioning. Regulators took several steps in 2014 to improve the
scope, comparability, and transparency of existing data collections.
In 2014, the SEC adopted amendments to its Form PF regulatory report, filed by registered advisors to hedge
funds and other private funds, to align the data reported by liquidity funds with the information that MMFs
report on the SEC’s Form N-MFP. Since July 2013, national banks and federal savings associations have
been reporting on the OCC’s Monthly Schedule of Short-term Investment Funds. These changes will permit
analysts to evaluate and compare risks in MMFs and private liquidity funds. The SEC also eliminated the
60-day lag on public availability of information that MMFs file on Form N-MFP.

99Regu lato r y Deve lopments & Counc i l Ac t i v i t i es
In 2014, for the first time, the Federal Reserve made available to the public the data from its FR Y-15 data
collection—the Banking Organization Systemic Risk Report—except for certain line items related to LCRs.
These data on 33 BHCs provide insights into the structure of financial networks and interconnectedness of
the largest financial institutions.
Also in 2014, FINRA began posting on its website data submitted by FINRA members that operate alternative
trading systems. These alternative trading systems are relatively opaque, raising concerns about efficient
market functioning, potentially abusive trading behavior, and market vulnerability from the impact of high-
frequency trading. This data provides information on aggregated transactions based on the volume and
number of trades for each equity security traded on a weekly basis, utilizing a unique market participant
identifier.
Pilot Repo Data Collection
In 2014, the OFR and Federal Reserve announced a joint pilot project to collect data from participants in
the bilateral repo market and the securities lending industry. The project focuses on the bilateral repo
market due to its relative opacity as compared to the tri-party repo market. Some bilateral repo market
participants have volunteered to take part in the pilot data collection and have already provided valuable
feedback. Regulators would also like to improve their information about securities lending markets, as there
is no systematic, targeted data collection for the benefit of regulators or the investing public. The OFR and
Federal Reserve intend to publish aggregated data from the survey to provide greater transparency to market
participants and policymakers. The SEC is a key contributor to this initiative, as well, and will have access to
the data collected. The joint data collection of the OFR and the Federal Reserve in secured funding markets
is aligned with global efforts by regulators, acting through the FSB, to collect data on secured funding
markets that can be aggregated for cross-border analysis.
6.4.2 Data Standards
Legal Entity Identifier
Further progress toward the broader adoption of the LEI for financial market participants remains a
Council priority. The LEI is an alphanumeric code that uniquely identifies legal entities that engage in
financial transactions. It provides a globally accepted standard for identifying market participants and
serves as a linchpin for making connections in the massive volumes of financial data that course through the
international economy every day. As of March 31, 2015, more than 356,000 LEIs have been issued to entities
in 189 countries and 20 operational issuers have been approved to issue LEIs for use in regulatory reporting.
The operational issuers are overseen by the Global LEI Foundation, which began to assume operational
management of the LEI system in June 2014. The OFR’s Chief Counsel continues to serve as chair of the LEI’s
Regulatory Oversight Committee, representing more than 60 public authorities in over 40 countries.
So far, derivatives regulators have driven LEI adoption across the world. The CFTC has required use of the
LEI for reporting swap transactions to SDRs since 2012 and, beginning in 2015, the SEC will also require
use of the LEI for reporting security-based swap transactions to SDRs. Swaps regulators in Europe, Canada,
Australia, and Singapore also now require companies to use the LEI. In the United States, required use of the
LEI is expanding beyond the initial focus on swap transactions. The Federal Reserve announced in late 2014
that BHCs that have already acquired an LEI are required to report it on the cover page of several forms after
October 31, 2014. The Federal Reserve proposed in early 2015 that banking organizations and their affiliates
that have already acquired an LEI would be required to report it on several forms after June 30, 2015. The
CFPB included use of the LEI as the entity identifier in its proposed HMDA rule, published in August 2014.

2 0 1 5 F S O C / / Annual Report100
Rules proposed in January 2015 by the Secretary of the Treasury, in his capacity as Chairperson of the
Council, to implement the qualified financial contract recordkeeping requirements of the Dodd-Frank Act
would generally require covered entities to use LEIs to identify counterparties of qualified financial contracts.
Requirements to use the LEI for mandatory reporting will help drive the use of the LEI in the private sector.
Swap Data Repositories
The Dodd-Frank Act amended the Commodity Exchange Act and the Securities Exchange Act to establish
a new regulatory framework for swaps and security-based swaps, respectively. Under the Dodd-Frank Act,
the CFTC was granted regulatory authority over SDRs, and the SEC was granted regulatory authority
over SBSDRs. In 2012, the CFTC adopted rules to implement swap data recordkeeping and reporting
requirements. Furthermore, in 2014, the CFTC and OFR entered into a cooperative effort to enhance
the quality, types, and formats of data collected from CFTC-registered SDRs. In 2015, the SEC adopted
Regulation SBSR—Reporting and Dissemination of Security-Based Swap Information, which sets forth
the data elements that must be collected by SBSDRs.
Promoting transparency in the OTC derivatives markets is also a major priority for international regulators,
given the market’s role in the financial crisis, its decentralized nature, and still-developing infrastructure.
Consistent with a 2014 Council recommendation, U.S. regulators sought to advance the work of the CFTC
and OFR with international regulators through the newly formed Working Group for Harmonization of Key
OTC Derivatives Data Elements of the CPMI-IOSCO. This international working group is tasked with issuing
guidance on the development of a Unique Product Identifier and a Unique Transaction Identifier and with
further harmonizing other OTC derivatives data elements, leveraging work already completed by the CFTC
and OFR.
Universal Loan Identifier
In August 2014, as part of its HMDA/Regulation C rulemaking, the CFPB published a proposal to create a
Universal Loan Identifier (ULI) to strengthen Regulations C’s self-assigned loan identifier for each covered
loan or application reported under HMDA. The CFPB’s proposal would combine the LEI with a uniquely
generated loan number to create a ULI to track mortgage loan applications, originations and purchase of
most mortgages.
Financial Instrument Reference Database
Under the Dodd-Frank Act, the OFR is required to create a financial instrument reference database that is
easily accessible to the public. Over the past year, OFR moved forward in developing a conceptual framework,
which contemplates public-private engagement in various forms. To this purpose, the OFR has begun
planning for an initial workshop in 2015, hosted by NIST, with the aim of further informing the development
plans for the project. This project may reduce the adverse effects of information asymmetry by giving
investors access to financial instrument data to enable better-informed investment decisions.
Data Inventory
The Council’s Interagency Data Inventory, publicly available on OFR’s website, was updated on February 12,
2015, with new and updated information on agencies’ data collections. By providing an easy and searchable
view of agencies’ data collections, the inventory can help regulators assess data gaps and data overlaps
in regulatory collections. For researchers and the public, the inventory provides a view of the breadth of
agencies’ collections.

101Regu lato r y Deve lopments & Counc i l Ac t i v i t i es
Reporting Efficiency
It is a Council priority to make regulatory reporting requirements more efficient. In 2014, the OFR initiated
a pilot project to gain insights into overlap and reporting efficiencies. The OFR also hosted a workshop in
January 2015 with the Bank of England and the ECB to discuss regulatory reporting efficiency and effective
use of data standards on an international level.
6.5 Council Activities
6.5.1 Determinations Regarding Nonbank Financial Companies
One of the Council’s statutory authorities is to subject certain nonbank financial companies to supervision
by the Federal Reserve and enhanced prudential standards if the company’s material financial distress—or
the nature, scope, size, scale, concentration, interconnectedness, or mix of its activities—could pose a threat
to U.S. financial stability. The Council’s authority to make these determinations is an important tool to help
mitigate potential threats posed by these companies to U.S. financial stability. The Dodd-Frank Act sets
forth the standard for the Council’s determinations regarding nonbank financial companies and requires
the Council to take into account 10 specific considerations when evaluating those companies. To further
inform the public of the Council’s framework and processes for assessing nonbank financial companies, the
Council issued a final rule and interpretive guidance following three separate requests for public comment.
Additionally, the Council adopted supplemental procedures in February 2015, describing changes to increase
the transparency of its determinations and to formalize certain practices (see Section 6.5.4).
In December 2014, the Council voted to make a final determination regarding MetLife. Previously, the
Council had made final determinations regarding AIG, GECC, and Prudential Financial. The basis for each
final determination is available on the Council’s website.
The Council’s determination regarding MetLife followed the standards laid out in the Dodd-Frank Act and
the framework and processes set forth in the Council’s rule and guidance. In July 2013, the Council notified
MetLife that the company was under consideration for a proposed determination by the Council. After over
a year of engagement between the Council and MetLife, the Council notified the company in September
2014 that the Council had made a proposed determination and provided the company with an explanation of
the basis of the Council’s proposed determination. The company requested a written and an oral hearing to
contest the Council’s proposed determination. The Council granted the request and held an oral hearing in
November 2014.
In addition, the Council in 2014 completed its first reevaluations of previous determinations regarding
nonbank financial companies. Under Section 113 of the Dodd-Frank Act, the Council is required at least
annually to reevaluate each previous determination and rescind any determination if the company no longer
meets the statutory standards. In the summer and fall of 2014, the Council reevaluated its determinations
regarding AIG, GECC, and Prudential Financial. The Council did not rescind any of its determinations.
The Council’s supplemental procedures with respect to nonbank financial company determinations provide
the public with additional information regarding the process for the Council’s annual reevaluations of
determinations (see Section 6.5.4). As of the date of this report, as discussed above, four nonbank financial
companies are subject to final determinations by the Council, and the Council has voted not to advance five
nonbank financial companies to Stage 3 of the Council’s three-stage process for evaluating nonbank financial
companies. In 2014, the Council did not make a proposed or final determination regarding a nonbank
financial company other than MetLife.

2 0 1 5 F S O C / / Annual Report102
6.5.2 Risk Monitoring and Regulatory Coordination
The Dodd-Frank Act charges the Council with responsibility to identify risks to U.S. financial stability,
promote market discipline, and respond to emerging threats to the stability of the U.S. financial system.
The Council also has a duty to facilitate coordination among member agencies and other federal and state
agencies regarding financial services policy and other developments.
The Council regularly examines significant market developments and structural issues within the financial
system. This risk monitoring process is facilitated by the Council’s Systemic Risk Committee (SRC), which is
composed primarily of member agency staff in supervisory, monitoring, examination, and policy roles. The
SRC serves as a forum for member agency staff to identify and analyze potential risks that may extend beyond
the jurisdiction of any one agency.
The OFR plays an important role in the activities of the Council. In 2014, the OFR reported regularly to the
SRC on developments in financial markets. In its 2014 annual report, the OFR issued a Financial Stability
Monitor that assesses risks to the financial system based on five areas of risk: macroeconomic, market, credit,
funding and liquidity, and contagion.
6.5.3 Asset Management Analysis
The Council has engaged in work over the past year to analyze risks associated with the asset management
industry and the potential of such risks to affect U.S. financial stability. In May 2014, the Council’s
Deputies Committee hosted a conference on the asset management industry and its activities during which
practitioners, academics, and other stakeholders discussed a variety of topics related to the industry.
In July 2014, the Council directed staff to undertake a more focused analysis of industry-wide products and
activities to assess potential risks associated with the asset management industry. In order to inform that
analysis, in December 2014 the Council voted unanimously to release a notice seeking public comment on
aspects of the asset management industry. In particular, the Council sought input from the public about
potential risks to the U.S. financial system associated with liquidity and redemptions, leverage, operational
functions, and resolution in the asset management industry. The notice provided another important
mechanism to solicit input from the public and built upon the Council’s prior public engagement in this area.
The public comment period closed in March 2015. The Council has not made any determination regarding
the existence or nature of any potential risks to U.S. financial stability arising from asset management
products or activities; in the event the Council’s analysis identifies risks to U.S. financial stability, the Council
will consider potential responses.
6.5.4 Adoption of Supplemental Procedures Relating to Nonbank Financial Company Determinations
In February 2015, the Council adopted changes relating to its process for reviewing nonbank financial
companies for potential determinations. The changes fall into three categories:
• Engagement with companies under consideration by the Council: The Council will inform companies
earlier when they come under review and provide opportunities for companies and their regulators
to engage with the Council and staff, without compromising the Council’s ability to conduct its work.
• Transparency to the broader public regarding the determinations process: The Council will make
available to the public more information about its determinations work, while continuing to protect
sensitive, nonpublic information.

103Regu lato r y Deve lopments & Counc i l Ac t i v i t i es
• Engagement during the Council’s annual reevaluations of determinations: These changes create a
clearer and more robust process for the Council’s annual reviews of its determinations. This process
will enable more engagement between a company subject to a final determination and the Council
and staff, with ample opportunity for companies to present information and to understand the
Council’s analysis.
Under the new procedures, before the Council’s annual reevaluation of a nonbank financial company
subject to a Council determination, the company will be provided an opportunity to meet with Council staff
to discuss the scope and process for the review and to present information regarding any change that may
be relevant to the threat the company could pose to financial stability, including a company restructuring,
regulatory developments, market changes, or other factors. Companies subject to a final determination are
also provided, pursuant to these supplemental procedures, an opportunity for an oral hearing before the
Council once every five years at which the company can contest the determination.
The adoption of these changes followed extensive outreach to stakeholders during the second half of 2014
regarding the Council’s determinations process.
6.5.5 Governance and Transparency Initiatives
The Council has recognized the importance of transparency since its first meeting in October 2010, when
it voluntarily adopted its transparency policy. The Council continually examines how it can more effectively
open up its work to the public and improve its internal policies and procedures.
In May 2014, the Council adopted enhancements to its transparency policy and adopted bylaws for its
Deputies Committee. These changes were adopted following a review of existing Council practices and a
comparison to organizations with similar structures, memberships, or responsibilities to the Council. As part
of these changes, the Council now provides the public with information regarding its agenda in advance of
each meeting and publishes on its website a written readout of meeting proceedings, in advance of formal
minutes. The Council also reaffirmed its commitment to conducting its meetings in public whenever possible
and to providing detailed minutes for its meetings.
Additionally, in September 2014, the Council published an extensive set of frequently asked questions
on its website, providing greater transparency regarding its practices for nonbank financial company
determinations.
The Council has also continued to make improvements to its website to provide the public with timely
updates on a wide range of Council materials. Among other important information about the Council’s work,
the website contains the minutes of all its meetings; its governance documents and budgets; all rulemakings,
studies, requests for comment, and reports; and explanations of the basis of the Council’s designations of
nonbank financial companies and FMUs.
6.5.6 Operations of the Council
The Dodd-Frank Act requires the Council to convene no less than quarterly. In 2014, the Council met 10
times. The meetings bring Council members together to discuss and analyze market developments, threats
to financial stability, and financial regulatory issues. Although the Council’s work frequently involves
confidential supervisory and sensitive information, the Council is committed to conducting its business as
openly and transparently as practicable. Consistent with the Council’s transparency policy, the Council
opens its meetings to the public whenever possible. The Council held a public session at three of its
meetings in 2014.

2 0 1 5 F S O C / / Annual Report104
Approximately every two weeks, the Council’s Deputies Committee, which is composed of senior
representatives of Council members, convenes to discuss the Council’s agenda and to coordinate and
oversee the work of the SRC and the five other functional committees. The other functional committees are
organized around the Council’s ongoing statutory responsibilities: (1) identification and consideration of
nonbank financial companies for designation; (2) identification and consideration of FMUs and payment,
clearing, and settlement activities for designation; (3) making recommendations to primary financial
regulatory agencies regarding heightened prudential standards for financial firms; (4) consultation with the
FDIC on OLA and review of the resolution plan requirements for designated nonbank financial firms and the
largest BHCs; and (5) data availability, data gaps, and improvement of data-reporting standards.
In 2014, the Council adopted its fifth budget.
6.5.7 Section 119 of the Dodd-Frank Act
Section 119 of the Dodd-Frank Act provides that the Council may issue non-binding recommendations to
member agencies on disputes about the agencies’ respective jurisdiction over a particular BHC, nonbank
financial company, or financial activity or product. (Certain consumer protection matters, for which another
dispute mechanism is provided under Title X of the Act, are excluded.) To date, no member agency has
approached the Council to resolve a dispute under Section 119.

105Potent ia l Emerg ing Threats and Vu lne rab i l i t i es
7.1 Cybersecurity: Vulnerabilities to Attacks on Financial Services
Over the past year, financial sector
organizations and other U.S. businesses
experienced a host of notable cyber incidents,
including large-scale data breaches that
compromised financial information. While
security technologies and user awareness are
improving, malicious cyber activity is likely to
continue in the future. Even more concerning
is the prospect of a more destructive incident
that could impair financial sector operations.
While the financial sector has in many
ways been an industry leader in adopting
cybersecurity measures, continued vigilance is
necessary. For example:
• The U.S. financial sector is highly
dependent upon information
technology systems that are often
interconnected. Financial transactions,
such as payments and clearing, operate
on computer and network systems that
require robust data confidentiality,
integrity, and availability.
• Various service providers operate
infrastructure that is critical to
financial sector operations. The
concentration of key services may
create the risk of a cyber incident
impacting many organizations
simultaneously, with significant impacts
on financial sector operations.
• Malicious actors may infiltrate supply
chains and compromise equipment and
software in a manner that is difficult for
companies to detect.
Cybercriminals have the capability to steal
payment information from retail networks,
7 Potential Emerging Threats and Vulnerabilities
as well as accessing sensitive client data from financial
institutions. More troubling, the recent destructive
malware attack on an entertainment company was
apparently able to render the company’s computers
inoperable, which suggests a higher level of
sophistication. As a result of these intrusions, several
technical and administrative best practices have been
identified to mitigate the potential damage from future
cyber incidents, including:
• Third-party Vendor Management: The cyber
attack on a large retailer’s network, executed
through network access provided to a third-
party vendor, highlighted the importance of
establishing robust system controls for third-
party vendors. Several firms have begun using
the NIST Cybersecurity Framework to assist with
vendor management.
• Administrative Access: Acquiring administrative
access is a requirement for many malicious cyber
attackers to penetrate secure systems. Both
protecting administrative access—for example by
requiring two-factor layered authentication for
privileged accounts and sensitive systems—and
detecting compromised administrative access
through continuous and routine monitoring
should be emphasized.
• Recovery: Financial firms should assume
they will be subject to destructive attacks and
develop capabilities and procedures to resume
operations.Financial firms also need to be
ready to quickly restore computer networks and
technology-enabled operations in response to
known or unforeseen threats that could cause
catastrophic disruption.

2 0 1 5 F S O C / / Annual Report106
these moves, spreads remain below long-term
averages outside of the energy industry, and a
spike in defaults could lead to further losses,
increased volatility, and redemptions from
credit funds.
A sharp increase in interest rate volatility or
credit spreads could threaten the stability of the
financial system, for example:
• If a rise in rates leads to a significant
drop in demand for credit assets, less
liquid markets such as high-yield bonds,
emerging market bonds, and leveraged
loans could have difficulty coping with
demand imbalances and price volatility.
• Highly leveraged corporate borrowers
could be at risk from a sharp rise in
short-term interest rates. The rates on
their floating-rate loans could increase
significantly, leading to a drop in their
cash flow and a potential downgrade of
their credit quality, which could then
have adverse effects on their credit
holders.
• Strategies that use leverage to increase
yields in fixed income could suffer
sizeable losses if interest rates rise
rapidly. If these losses lead to forced
selling of assets, this could further
depress prices, with this feedback loop
potentially leading to further forced
selling.
7.2 Increased Risk-Taking in a Low-Yield Environment
The low-rate environment and improved economic
conditions are encouraging greater risk-taking across
the financial system as investors are more likely to
accept incremental gains in yield for disproportionate
amounts of risk. The low-rate environment could
persist as global monetary authorities may need to keep
rates low in order to fulfill their employment and price
stability objectives. Banks, credit unions, and broker-
dealers have lower NIMs, leading some firms to increase
risk by holding longer-duration assets, easing lending
standards, and otherwise seeking additional yield. For
example, regulators have found serious deficiencies in
underwriting standards and risk management practices
of certain leveraged loans (see Section 5.1.1). The low
rate environment has also put pressure on the ability of
pension and retirement funds to meet their long-term
liabilities. To boost returns, pension and retirement
funds are taking on additional risk by extending
duration or buying lower quality, higher-yielding assets
and less liquid assets. Some insurance companies have
repositioned their investment portfolios in a similar
manner. Also, hedge funds and private equity are under
pressure to maintain high absolute returns in a low-
yielding environment.
In credit markets, despite strong outflows in 2014, high-
yield and leveraged loan funds have seen significant
growth since the crisis. Issuance of CLOs was at record
highs in 2014. Emerging market bonds largely recovered
from their sell-off in 2013 and continued to see strong
issuance in 2014. In addition, agency REITs experienced
similarly substantial inflows since the crisis. While each
of these developments is likely due to a range of factors,
including the economic recovery and an increase in risk
appetite, low interest rates have played a role.
Since the 2014 annual report, credit markets exhibited
loosening lending standards and declining spreads until
the energy-market led sell-off that began in the second
half of 2014 (see Box C). The sharp rise in spreads
triggered losses across credit investment strategies and
vehicles, and leveraged loan mutual funds saw record
outflows in 2014. Following this sell-off, public data
reveals a moderate improvement in new issue quality, as
the percentage of highly levered deals done in the first
quarter of 2015 decreased versus the prior year. Despite

107Potent ia l Emerg ing Threats and Vu lne rab i l i t i es
7.3 Changes in Financial Market Structure and Implications for Financial Stability
Financial market structure has evolved
substantially over the years. It has resulted in
lower costs, faster and more effective methods
of risk transfer, improved price discovery, and
expanded access for new market participants.
It has also introduced operational
vulnerabilities and potential liquidity risks.
These changes to market structure stem from
a confluence of factors including technology,
regulation, and competition.
Some changes predated the financial crisis,
such as the growing “electronification”
of financial markets. This process is most
developed in cash equity and futures markets
while automated trading and electronification
has increased steadily in fixed income, FX,
and OTC derivative markets (Chart 7.3.1). As
electronification becomes more prevalent across
markets, regulators and market participants
should monitor and seek to mitigate risks and
vulnerabilities that may emerge.
The differing degrees of automated and
electronic trading in interdependent markets,
such as those for Treasury notes, Treasury
futures, Eurodollar futures, U.S. interest
rate swaps, and agency debt and MBS, may
pose challenges. For example, for highly
interdependent markets such as the cash and
futures Treasury markets, which take price
signals from each other, the varying degree
of electronification and differences in trading
systems among them may cause changes in
liquidity demand in one market to spill over to
the other, possibly amplifying price movements
in periods of market stress.
As electronic trading has captured an
increasingly significant share of total trading,
there has been tremendous growth among
electronic trading platforms and algorithmic
trading firms that play an increasing role in
facilitating market liquidity. For example,
7.3.1 Use of Electronic Trading by Asset Class

2 0 1 5 F S O C / / Annual Report108
trading systems may not align with actual
market responses during volatile periods.
Also, broker-dealers have significantly reduced
their inventories of fixed income securities such
as Treasury securities, agency and corporate
debt, MBS, and related derivative instruments.
This contraction has taken place while the
volume of new issuance and the overall size
of many such markets have expanded and
asset managers and other buy-side investors
have grown relative to market makers. Market
liquidity may be impaired if broker-dealers are
less willing or unable to intermediate supply
and demand imbalances.
In addition to market structure changes, cyclical
forces such as the supply of credit, leverage
of financial intermediaries, and monetary
policy may also affect liquidity. As mentioned
elsewhere in this report, the prolonged period
of low interest rates and subdued volatility has
encouraged a “reach for yield” behavior with
increased positioning in cash and derivative
fixed income markets. A sudden rise in interest
rates could trigger a sell-off, which could be
magnified by changes in market structure. The
effects of such a sell-off may be especially acute
for riskier or less liquid assets, such as high-yield
or emerging market debt. On the other hand,
a more normalized market environment could
increase trading activity and incentivize greater
liquidity provisioning. In the aftermath of the
sharp movements in Treasury yields observed
on October 15, 2014 (see Box E), market
participants cited such cyclical forces, as well as
market structure changes, as factors affecting
liquidity in the $39 trillion domestic fixed
income market.
As this evolution of market structure plays out
across a broader collection of asset classes and
markets, market participants and regulators
should monitor how it affects the provision of
liquidity and market functioning.
trading in equity markets is highly fragmented while
trading in futures markets is highly centralized, yet both
markets have a significant electronic and algorithmic
trading presence. In addition, the business model and
risk appetite of traditional broker-dealers have changed,
with some reducing their securities inventories and, in
some cases, exiting certain markets. New trading venues
and platforms have also developed or expanded in some
markets, including new regulated exchanges, interdealer
platforms, and dark pools.
Operational Vulnerabilities
As evidenced in the Flash Crash in 2010, the Facebook
initial public offering in 2012, and the outage of
consolidated pricing measures related to NASDAQ-listed
equities in 2013, automation and electronic trading can
nevertheless be susceptible to various types of market
and operational risk. For example, as the speed with
which large investment positions can be accumulated
increases, it is critical that risk management systems
across a variety of markets and market participants move
equally fast. In addition, investment in technology,
infrastructure, and appropriate safeguards is important
to ensure the resiliency of market participants against
potential operational risks, including those related to
clearing and settlement processes.
Liquidity Risks
As market structures have evolved, non-traditional
liquidity providers such as proprietary-trading firms and
hedge funds that engage in high-frequency trading have
come to play an increasingly important role in market-
making and the provision of liquidity. In equity markets,
the process has evolved most as these firms have largely
replaced exchange specialists and market makers that
trade directly with customers. Across all markets that
feature electronic trading, non-traditional liquidity
providers engage exchanges and other electronic
markets by rapidly submitting multiple bids and offers
at different prices and sizes through automated systems.
These orders are often cancelled and resubmitted
at extremely fast speeds to avoid becoming stale,
especially during volatile periods. Hence, the increased
electronification in some markets, such as fixed income
and FX, has been coupled with similarly quick changes
in the provision of liquidity in response to market
volatility. In such an environment, expectations about
market speed and liquidity based on prior generation

109Potent ia l Emerg ing Threats and Vu lne rab i l i t i es
On October 15, 2014, benchmark Treasury yields
experienced the fourth-largest intraday move since
the financial crisis, with the 10-year yield trading
between 1.86 percent and an overnight peak of
2.23 percent (Chart E.1). Importantly, there was a
15 basis point drop in yields shortly after 9:30 a.m.
that largely reversed within 15 minutes. Similarly
large price movements were also observed in highly
correlated U.S. interest rate markets including
Eurodollar futures, Treasury future options, interest
rate swaps and swaptions. While Treasury cash
and futures trading volume on the day hit record
highs, other measures of liquidity showed signs of
deterioration. Interest rate swap contracts traded on
regulated SEFs and OTC also registered then-record
volumes. Other asset classes, such as equities,
were also volatile. Historically, similarly sharp intraday
changes in U.S. interest rates were associated with
major economic events. By contrast, the volatility on
October 15 followed slightly weaker-than-expected
U.S. retail sales data, and the round-trip in yields in
the short window just after 9:30 a.m. did not appear
to correspond with any fundamental economic news.
Leading into the morning of October 15,
macroeconomic risks in the euro area, accompanied
by uncertainty around the eventual ECB response,
generated considerable negative risk sentiment. This
was compounded by the gloomy tone investors took
away from the annual IMF/World Bank meetings
the prior weekend and by increasing concerns over
the risk of a widespread Ebola outbreak. Market
commentary points to the potential amplifying
effects of the unwinding of significant short positions
established in cash and derivatives markets by
leveraged investors in anticipation of higher interest
rates in the United States. Data indicates that such
interest rate positions, including for example those
established via Eurodollar futures contracts (Chart E.2) and other instruments, began to be unwound
in early October as interest rates moved lower, and
continued on October 15.
Box E: Financial Markets on October 15, 2014
E.1 10-Year Treasury Yield on October 15, 2014
E.2 Net Positioning by Leveraged Funds in Eurodollar Futures

2 0 1 5 F S O C / / Annual Report110
Global risk and positioning factors, however, do not
adequately explain the volatile price movements in
the short window just after 9:30 a.m., which was
particularly notable for the sharp drop in interest
rates and subsequent retracement. In both the
cash and futures markets, the depth of standing
quotes visible to market participants—a common
metric of liquidity—rapidly fell to low levels and
remained around those levels during the window
of interest. Transactions continued to occur in a
highly continuous manner during the window, which
stands in contrast to some past episodes of sharp
volatility that were marked by highly discontinuous
trading, with prices “gapping” from one transaction to
another. Some reports later suggested widespread
disengagement by some of the largest broker-
dealers and proprietary trading firms, as a means of
managing their risk.
Many market participants have discussed the
events of October 15 within the larger context of
market structure changes in the U.S. Treasury
market, particularly those related to market-making
and electronic trading. The record volumes and
continuous nature of trading during the most volatile
window were due to the presence of automated
trading systems capable of transacting at high speed
that are now used by many market participants.
Given the importance of the U.S. Treasury market to
private and public participants, the relevant authorities
are undertaking a thorough review of the Treasury
market on October 15. Certain member agencies
will publish an interagency white paper in the coming
weeks, providing analysis into these events and
changes in market structure.

111Potent ia l Emerg ing Threats and Vu lne rab i l i t i es
unexpected timing of these costs to CCP participants
could increase market uncertainty during a time of
overall market stress.
While CCPs have failed in jurisdictions outside the
United States, there is no precedent for the failure of a
global CCP active in multiple jurisdictions. It is possible
that significant market uncertainty and volatility could
result if a major cross-border CCP’s financial resources,
risk management practices, or business continuity
plans were to prove inadequate to weather the default
of multiple clearing members or another disruptive
event. The failure of such an interconnected financial
infrastructure potentially could disrupt financial
markets and transmit unpredictable financial stress. The
structure of CCPs may also pose unique challenges to
successful resolution, including how to determine the
point where a CCP’s recovery becomes impossible and
regulators may choose to resolve the CCP, as well as how
to ensure there is sufficient time to consider the systemic
impact of, and implement, loss-allocation rules and
procedures in stressed market environments.
Regulators are reviewing CCPs’ default waterfalls,
including how those plans allocate losses among clearing
members, CCP owners, and other CCP stakeholders to
maximize their respective incentives to remain focused
on risk mitigation. They are also reviewing the level
and breadth of transparency that should be provided
into CCP risk management, including the risk models
used to calculate margin requirements for each type
of transaction. In addition, regulators are reviewing
the practicability of a framework for consistent and
comparable stress testing, including transparency into
stress testing methodologies, and the development of
sufficiently rigorous stress testing scenarios used, among
other things, to calculate financial and liquidity resource
requirements. Finally, domestic and foreign regulators
are working to complete resolution plans that provide
further clarity regarding how CCPs can be resolved safely
by the appropriate authorities.
7.4 Central Counterparties
CCPs are designed to enhance financial stability
and increase market resiliency. To realize
these financial stability benefits, systemically
important CCPs must have robust frameworks
for risk management. U.S. regulators have
taken significant steps over the past several
years to promote strong risk management
practices at CCPs designated by the Council
as systemically important and remain focused
on identifying and mitigating any potential
threats to financial stability that could arise
from the activities of such CCPs, especially as an
increasing amount of derivatives transactions
shift onto these critical institutions.
Toward that end, regulators are analyzing
the potential that under stressed market
conditions CCPs could transmit significant
liquidity or credit problems among financial
institutions or markets. For example, in
response to heightened market volatility,
CCPs could require increased initial margin
from their clearing members and clients in a
procyclical manner. In addition, market stress
could result in the failure of multiple major
clearing members in a compressed time period,
potentially creating exposures across major
global CCPs. If a CCP suffers clearing member
defaults of sufficient size and number and the
resulting net losses across their portfolios are
sufficiently severe, prefunded default resources
could be exhausted. If the defaulted clearing
member also provided other services to the
CCP, this could complicate the CCP’s response
to the default.
While unprecedented in the United States, the
exhaustion of the pre-funded resources could
result in assessments on clearing members,
to the extent specified in their ex ante rules.
For some CCPs, if available defaulters’ and
mutualized resources are insufficient, CCP
participants, including clients, could incur pro
rata losses on their unpaid gains. The CCPs’
default allocation procedures, which detail
participants’ obligations to the CCPs, are set
forth in the CCPs’ rulebooks. Nevertheless, the

2 0 1 5 F S O C / / Annual Report112
Ukrainian government reached an agreement
with the IMF for a new financial assistance
package of about $17.5 billion, which will be
supplemented by additional resources from
the international community. Although the
situation in Ukraine is likely to remain volatile,
direct spillovers to the United States are likely
to be muted because of limited trade and
financial linkages.
In China, a disorderly correction in the
property market could impose large losses on
many property developers and cause a sharp
retrenchment in real estate investment. Also,
credit growth has boomed since the global
financial crisis, fueled by nontraditional
lending and new financial products such as
wealth management products (WMPs). A loss
of investor confidence in WMPs could exert
funding pressures in the banking system,
potentially setting off a broader credit crunch.
Adverse feedback loops between such a
pullback in credit and declines in investment
growth could generate broad financial stress
in China. China does, however, maintain
ample fiscal space for bank recapitalization or
macroeconomic stimulus if necessary.
An abrupt slowdown in China poses a key risk
to other EMEs, including through lower exports
to China and downward pressure on commodity
prices. Furthermore, dollar credit to EMEs has
grown rapidly since the financial crisis, driven
largely by a surge in offshore corporate bond
issuance. Sudden changes in market sentiment
may elicit capital flight and pose challenges
to rolling over maturing bonds. Also, a rise
in yields in advanced economies could spark
a sell-off in emerging market bonds and
destabilize markets, as occurred in the summer
of 2013. Finally, oil exporters, such as Russia
and Venezuela, are particularly vulnerable to
weaker currencies and increased risk spreads
and interest rates.
7.5 Global Economic and Financial Developments
The euro area recovery is fragile and could be derailed
by shocks and political uncertainty. A key risk for
the euro area is the political uncertainty in Greece,
which must still successfully negotiate comprehensive
reforms with the EU and IMF in order to continue
to receive financial assistance needed to help fund
the government’s external and domestic obligations.
Successful negotiation of reforms is also a necessary
step for the Eurosystem to continue to provide Greece’s
financial sector with access to Eurosystem liquidity. In
February 2015, after contentious negotiations, the new
Greek government secured a four-month extension of
its loan program with its official creditors, which would
release €7.2 billion in undisbursed funds provided that
Greece developed and implemented a comprehensive list
of reforms. Technical negotiations between Greece and
its creditors continue, but timing is short for the various
parties to agree to a sufficiently robust set of reforms
in time to provide Greece with necessary financing.
In addition, it is likely Greece will need additional
financing over the near-term in order to meet domestic
and external obligations. Despite the agreement, Greek
bond spreads remain elevated. So far, spillovers to other
peripheral bonds have been muted, but such risks merit
careful monitoring.
In addition, a key macroeconomic risk facing the euro
area is that further disinflation could result in an
unanchoring of inflation expectations, hindering the
recovery. Also, despite approaching normalization
of monetary policy in the United States, aggressive
quantitative easing measures by the ECB and the BoJ
to combat deflation may dampen global yields for a
prolonged period of time, incentivizing continued reach
for yield behavior which could result in excessive risk-
taking.
The ongoing conflict in Ukraine has led to a
deterioration of economic and financial conditions in
both Ukraine and Russia, whose economies contracted
in 2014. The Russian economy has experienced
contractionary pressure from the combined effect
of the drop in oil prices (see Box C) and sanctions
imposed by the United States and Europe in response
to Russian aggression. To help meet its financing needs
and support its new economic reform program, the

113Potent ia l Emerg ing Threats and Vu lne rab i l i t i es
VIX futures was about $6 billion as of early 2015.
As for OTC products, market exposures are
reportedly significantly smaller than before the
recent financial crisis; however, these exposures
are difficult to measure.
• MSRs: Nonbank mortgage servicers maintain
a large presence in the mortgage servicing
market. These entities are not currently subject
to company-wide capital and liquidity standards,
which could inhibit their ability to withstand
an economic downturn. Large-scale servicing
transfers have also exposed significant data
integrity issues, such as inaccurate loan files, that
can hinder loss mitigation efforts. These issues
contribute to larger concerns regarding the
adequacy of risk management processes at some
nonbank mortgage servicers.
• Captive reinsurance: In the insurance industry,
life insurance companies continue to use
affiliated captive reinsurers to address perceived
redundancies in statutory reserves, and for other
reasons. The states, through the NAIC, are
working to establish a more consistent regulatory
framework for captive reinsurance transactions.
• Captive insurers and FHLB funding: FHLB
membership is limited to insured depository
institutions, insurance companies, and
community development financial institutions
(CDFIs); however, some financial firms, such as
REITs, have recently formed captive insurance
companies in part to gain access to FHLB
funding. The FHLBs provide a stable funding
source that may allow for accelerated balance
sheet and earnings growth. While insurance
companies are subject to supervision and
regulation by state regulators, some financial
firms that are forming captives—and thereby
gaining indirect access to FHLB funding—may
be subject to less regulatory oversight. FHFA has
proposed a rule on FHLB membership eligibility
that could impose limits on captive insurers.
7.6 Financial Innovation and Migration of Activities
Competition, regulatory changes, and
improvements in technology are continuously
re-shaping the financial system and bringing
about innovations in products, services, and
business practices that benefit investors and
consumers. One challenge for regulators is
the creation of new products or services that
could weaken the effectiveness of regulations.
Another challenge for regulators is the
migration of activities to areas outside of the
regulatory perimeter, or to entities that are
less regulated. Even seemingly beneficial
innovations may later create vulnerabilities
depending on how they are ultimately utilized.
Since the financial crisis, the changing
landscape of the financial system has fostered
many innovations. What follows are examples
of innovations in products, services, and
business practices that Council member
agencies are monitoring so as to understand the
potential benefits and risks.
• Expansion of ETFs / bond mutual
funds: Mutual funds and ETFs
provide investors with daily liquidity
for an underlying portfolio that may
include illiquid assets. The Council is
exploring how these funds, based on
their structure or the nature of their
redemption management practices,
may raise distinct liquidity and
redemption risks, particularly during
periods of market stress. The Council
is also examining, among other things,
how incentives to redeem funds may
increase the risk of fire sales or pose
other risks to financial stability.
• Volatility products: Volatility products
are derivatives (swaps, futures, or
options) whose value is explicitly
linked to the volatility of a reference
asset. These products can be listed on
exchanges or traded OTC. The market
for exchange-listed products is relatively
small. For instance, the market size for

2 0 1 5 F S O C / / Annual Report114
• Digital Currencies: There are several
hundred digital currencies (also
called virtual or crypto currencies).
Although there is no single definition
or model of a digital currency, many
have two main features. First, the units
of the currency are not denominated
or tied to a sovereign currency such
as the U.S. dollar. In fact, in most
cases, the units of the digital currency
are not a liability of any individual
or institution. Second, transactions
with the currency take place over a
decentralized, peer-to-peer computer
network that maintains a public ledger
of transactions, often without the need
for third-party intermediaries. At this
time, digital currencies do not appear
to pose financial stability concerns, as
the extent to which digital currencies
are used is extremely small, and their
connection to the broader financial
system is limited. Nonetheless, the
potential applications and uses of the
peer-to-peer network for transferring
value in the payment and financial
service industry warrant continued
monitoring. Further, the relative
anonymity of decentralized virtual
currency transactions and holdings
may hamper efforts to prevent money
laundering and adherence to Bank
Secrecy Act requirements.
• Migration of leveraged loan origination to
nonbank entities: Leveraged loans are typically
underwritten by a syndicate of firms such as
banks, broker-dealers, and private equity firms.
Banks currently represent the majority of the
participants in these syndicates. Most of these
loans are then sold to a variety of investors
including CLOs, loan funds, hedge funds,
and insurance companies. In response to the
significant growth and weakened underwriting
standards in the leveraged loan space, banking
regulators updated their leveraged lending
guidance in 2013 and subsequently in November
2014 released clarifying frequently asked
questions. The guidance outlines high-level
principles related to safe-and-sound leveraged
lending activities for exposures held by banks.
According to one estimate, deals that do not
comply with this leveraged lending guidance
represented over $100 billion of the leveraged
loans originated in 2014. A pullback by banks
could provide an opportunity for institutions not
subject to the guidance such as private equity
firms, unregulated arms of broker-dealers, and
business development companies to expand
their participation in the riskiest deals. In this
scenario, banks would continue to originate less
risky leveraged loans while firms not subject to
the guidance would originate more risky loans
targeted by the guidance. The migration in
credit origination outside of the banking system
could result in a further decline in underwriting
standards for those particular loans, which could
result in larger losses in stressed conditions.
• Peer-to-peer lending: Peer-to-peer lending, also
known as marketplace lending, refers to loans
which are arranged through companies that
match borrowers and lenders and that manage
loan applications, borrower screening, and loan
servicing. In addition to credit risk, peer-to-peer
lenders are also subject to liquidity risk because
there is no secondary market for these loans.
Although the amount of current peer-to-peer
loans outstanding is small, the rapid growth of
this sector bears monitoring.

115Potent ia l Emerg ing Threats and Vu lne rab i l i t i es
7.8 Risk-Taking Incentives of Large, Complex, Interconnected Financial Institutions
In the 2008 financial crisis, the official sector, including
the Federal Reserve, Treasury, and FDIC, supported
some of the largest U.S. financial institutions that
became distressed by providing them with liquidity
and capital in order to maintain financial stability.
Expectations of continued support from the official
sector could incentivize these financial institutions to
further increase their systemic importance by growing in
size, interconnectedness, and complexity, and could also
lead creditors and counterparties to these institutions to
misprice risk when lending or transacting.
The Dodd-Frank Act mitigates the incentives and
abilities of large, complex, interconnected financial
institutions to take excessive risks by limiting the ability
of the Federal Reserve to provide extraordinary support
to individual institutions, requiring the Federal Reserve
to adopt enhanced prudential standards for the largest
BHCs and designated nonbank financial companies (see
Section 6.1.1), and by requiring that certain companies
develop and submit to the Federal Reserve and the FDIC
their own plan for rapid and orderly resolution under the
Bankruptcy Code in the event they experience material
financial distress or failure (see Section 6.1.3).
Title I of the Act requires certain companies to develop
and submit to the Federal Reserve and the FDIC their
own plan for rapid and orderly resolution under the
Bankruptcy Code in the event they experience material
financial distress or failure. In August 2014, the Federal
Reserve and the FDIC jointly identified shortcomings
among the plans of the largest filers. Letters were
delivered to the firms directing them to demonstrate
in their July 2015 plans that they are making significant
progress to address all identified shortcomings. The
letters also stated that if the firms fail to demonstrate
significant progress with respect to the identified
shortcomings that the Federal Reserve and the FDIC
may determine that that the plans are not credible or
would not facilitate orderly resolution under the U.S.
Bankruptcy Code.
7.7 Short-Term Wholesale Funding
In repo markets, the risk of pre-default fire
sales—when a dealer begins to lose access to
funding and sells its securities quickly—and
post-default fire sales—when investors who
receive collateral from a defaulted dealer sell
that collateral in a rapid and uncoordinated
fashion—continues to pose a significant threat
to financial stability. The risk of pre-default fire
sale can be mitigated by proper management
of rollover risk, maturity of repo books, single-
day concentrations, and capital and liquidity
resources. However, post-default fire sale risk is
harder to mitigate because no single regulator
has the ability to impose a coordinated and
orderly liquidation of collateral across all
investors in the market.
Greater transparency about bilateral
repo activity would expand policymakers’
understanding of how the overall repo market
works, its functioning and interconnectedness.
Unfortunately, regulators and policymakers still
do not have good visibility into the full range
of repo market activity in the United States.
While tri-party repo market activity has become
increasingly transparent in recent years, there
is limited information currently available on
the bilateral repo market’s size, composition,
concentration, pricing, or risk profile. This
lack of transparency inhibits the ability of U.S.
regulators and policymakers to monitor and
detect emerging developments that can pose
risks to financial stability.
While the SEC took meaningful reform
steps for MMFs in 2014, and the OCC has
implemented short-term investment fund
reforms for federally chartered banks and
thrifts, other similar types of short-term
investment vehicles could pose potential run
risks. These risks could be particularly acute
among existing or newly developed vehicles
that are outside of the regulatory perimeter,
and thus require continued monitoring.

2 0 1 5 F S O C / / Annual Report116
Title II of the Act authorizes the FDIC to
resolve financial companies whose failure
and resolution under otherwise applicable
law would haveserious adverse effects on U.S.
financial stability. The FDIC is continuing
its work to carry out its OLA for resolving a
financial company. Additionally, the Federal
Reserve is considering adopting a proposal that
would require the largest, most complex U.S.
banking firms to maintain a minimum amount
of long-term unsecured debt outstanding at the
holding company level.
In the United States, BHCs with assets over
$50 billion are required to disclose, on an
annual basis, their systemic risk indicators to
the Federal Reserve by filing FR Y-15—the
Banking Organization Systemic Risk Report.
The systemic risk indicators are grouped
into multiple categories including size,
interconnectedness, and complexity.
• Size is a measure of a bank’s total risk
exposure, and includes total assets,
securities financing transactions,
derivatives, and off-balance sheet items,
among other things. In the aggregate,
the largest BHCs have grown in size
since 2012 (Chart 7.8.1).
• Interconnectedness is the measure
of how connected a bank is to
other financial institutions.
Interconnectedness is measured using
the sum of three indicators: the bank’s
total claims to the financial system; the
bank’s total liabilities to the financial
system; and the total value of the
bank’s issued equity and debt. Since
2012, the largest BHCs have overall
become slightly less interconnected,
but some BHCs, like Wells Fargo and
JPMorgan Chase, have become more
interconnected (Chart 7.8.2).
• Complexity is a measure of how
difficult a bank is to resolve. Two
components of complexity include the
notional amount of OTC derivatives
7.8.1 Total Exposure of Six Large Complex BHCs
7.8.2 Interconnectedness of Six Large Complex BHCs
7.8.3 OTC Derivatives Held by Six Large Complex BHCs

117Potent ia l Emerg ing Threats and Vu lne rab i l i t i es
the bank holds and the total value of
the bank’s level 3 assets—assets that are
illiquid and hard to value. The overall
amount of OTC derivatives at the
largest BHCs since 2012 has remained
roughly flat, with variation among the
BHCs (Chart 7.8.3). However, level 3
assets have significantly dropped at all
of the largest BHCs (Chart 7.8.4).
Other metrics which attempt to gauge systemic
risk continued to decline at the largest BHCs
in 2014 and remain well below crisis levels,
indicating a reduction in systemic risk (Chart
7.8.5). The Conditional Value-at-Risk (CoVaR),
Systemic Expected Shortfall (SES), and Distress
Insurance Premium (DIP) all attempt to
measure the spillover or correlation from one
firm’s failure to the whole system. As such,
they measure interconnectedness. The CoVaR
measure is defined as the value-at-risk of the
financial system as a whole, conditional on the
firm in question being in distress. The SES
measure predicts the propensity of a firm to be
undercapitalized when the system as a whole
is in distress. The DIP measure represents a
hypothetical insurance premium that covers
distressed losses in a banking system. The
current measures, based on the average of the
six largest U.S BHCs, continue to moderate. All
told, since the passage of the Dodd-Frank Act,
although the largest BHCs have become larger,
some market-based measures indicate they have
become less interconnected and less complex.
In recent years, both Moody’s and Fitch rating
agencies have lowered their assessments of the
likelihood of government support for the largest
banks in time of stress (Charts 7.8.6, 7.8.7).
However, both rating agencies still consider
some chance that the government will provide
support to the largest banks if they become
financially distressed.
7.8.4 Level 3 Assets Held by Six Large Complex BHCs
7.8.5 Systemic Risk Measures
7.8.6 Moody’s Systemic Support Uplift

2 0 1 5 F S O C / / Annual Report118
Banks have also experienced an increase
in legal settlements and fines related to
misconduct issues, which have heightened
concerns about their ability to manage legal risk
and adequately quantify their potential legal
exposures. Uncertainty about the scale and size
of these potential legal exposures could pose
significant threats to banks’ capital, earnings,
and reputation, as well as undermine the
public trust in the financial system. Moreover,
a continued pattern of misconduct could
undermine efforts to towards a more stable and
sound financial system.
Firms also rely on technology and models to
conduct much of their day-to-day business such
as pricing securities and managing portfolio
risk, confirming trades and booking traders’
positions for accounting and regulatory
reporting, as well as monitoring market, credit,
and operational risks. Regardless of whether
the systems and models are built in-house or
purchased from third-party vendors, there
are often differences in how they measure,
aggregate, and report portfolio exposures and
risks, which may complicate risk management
across all the firms’ business lines.
7.9 Reliance upon Reference Rates
As discussed in the Council’s 2013 and 2014
annual reports, the problems with USD LIBOR
reflect several interrelated structural factors,
including the decline in unsecured interbank
lending, the incentives to manipulate rates
submitted to reference rate panels owing to the
vast scale of derivatives tied to the reference
rate, and the dominant market position of
instruments tied to LIBOR. Reliance on USD
LIBOR creates vulnerabilities that could pose
a threat to market integrity, the safety and
soundness of individual financial institutions,
and to U.S. financial stability for several
reasons. First, a reference rate that is not
anchored in observable transactions or that
relies overly on transactions in a relatively low-
volume market increases the incentives and
potential for manipulative activity. Second,
the current and prospective levels of activity
7.8.7 Fitch Support Rating Floors

119Potent ia l Emerg ing Threats and Vu lne rab i l i t i es
appropriate for financial markets today. Using largely
risk-free rates based on observable transactions, rather
than interbank markets with relatively few transactions,
is consistent with the Council’s recommendations.
Separating the reference rate used for most derivatives
from the interbank market would also remove one of
the significant incentives to manipulate LIBOR. This
separation would also allow some users to select a
reference rate that is based on what is most appropriate
for their transaction rather than the current system
in which the vast majority of contracts reference
LIBOR. The reformed LIBOR rate and the alternatives
would exist side-by-side going forward, giving market
participants a choice of reference rates.
A number of steps have been taken to implement
the report’s recommendations. The administration
of LIBOR shifted last year from the British Bankers’
Association to ICE Benchmark Administration (IBA). In
October 2014, IBA issued a position paper with a request
for comments that suggested using a more transactions-
based approach to calculating LIBOR, expanding the
size of the submission panels, widening the scope of
transactions that are used, and increasing the time frame
considered. The Federal Reserve has been cooperating
with the FSB, the U.K. Financial Conduct Authority, and
IBA on LIBOR reform.
In order to implement the second part of the
recommendation of the FSB report to develop risk-
free U.S. dollar alternative reference rates, the Federal
Reserve, with the support of the Treasury, is sponsoring
a group of market participants, the ARRC, charged
with developing a plan to identify alternative reference
rate(s) that both fits the needs of the market and meets
IOSCO standards. More specifically, the ARRC has four
objectives:
• Identify best practices for alternative reference
rate(s).
• Identify best practices for contract robustness.
• Develop an adoption plan.
• Create an implementation plan with metrics of
success and a timeline.
Concerns about Other Reference Rates
Over the past several years, concerns have been raised
about other financial benchmarks, including swap rates
in unsecured interbank markets raise the risk
that continued production of LIBOR might not
be sustainable. The cessation of such a heavily
used reference rate would pose substantial legal
risks and could cause substantial disruptions
to and uncertainties around the large gross
flows of LIBOR-related payments and receipts
between financial institutions.
Reform Efforts in Interest Rate Benchmarks
Since the Council’s 2014 annual report, official
sector efforts to strengthen interest rate
benchmarks have made substantial progress.
In July 2014, IOSCO published its first
review of the extent to which the benchmark
administrators of LIBOR, Euribor, and TIBOR
had implemented the IOSCO Principles for
Financial Benchmarks. The review found
that the administrators had made significant
progress in implementing the majority of
the IOSCO principles. Completed and
ongoing reforms raised the overall oversight,
governance, transparency, and accountability
of the three administrators and their respective
benchmarks. Nonetheless, the review noted
several areas in which further progress was
needed in order to meet the IOSCO principles.
In the same month, the FSB released its report,
Reforming Major Interest Rate Benchmarks,
containing recommendations for reference
rate reform. Those recommendations were
made after extensive consultation with market
participants who conducted a thorough study of
possible alternatives.
The key recommendation from these
reports was that efforts should focus on the
accommodation of multiple reference rates. A
multiple-rate approach will allow the rate used
in a financial transaction to be more closely
tied to the underlying economic purpose,
reduce the incentive to manipulate, and
enhance stability by improving the availability
of alternatives. One of those reference
rates would be a reformed version of LIBOR
anchored in transactions. The others should
be nearly risk-free rates, which are more

2 0 1 5 F S O C / / Annual Report120
in separately managed accounts would also
improve visibility into broader market practices.
The SEC has identified these issues and has
targeted enhanced data reporting in separately
managed accounts and derivatives in mutual
funds as possible areas for rulemaking in 2015.
Data gaps can emerge as financial activities
migrate to new products and markets.
Regulators have little information about certain
types of traditional banking activities that
are increasingly taking place outside of the
prudential regulatory perimeter. For example,
there is a lack of public information about the
use of captive reinsurers by the life insurance
industry and the growing concentration of risks
in CCPs.
There has been important progress in
implementing the LEI (see Section 6).
Since the LEI implementation in 2013, new
regulations requiring LEI reporting are being
issued across the world.
SDRs and SBSDRs collect and maintain
confidential information about transactions
and make those data available to regulators.
However, under current rules the repositories
have significant discretion in how they report
data. Without strong and common standards,
the data collected by repositories are unlikely
to bring the desired benefits to counterparty
analysis and financial stability monitoring. The
CFTC is working to improve data quality and
standards in swaps data reporting with input
from the OFR. However, some U.S. authorities’
access to these data remains a challenge due to
legal and other obstacles.
Regulators need better mechanisms to quickly
share, link, and integrate data that cut across
different types of institutions and markets.
International cooperation on data standards
and data sharing is also essential to reduce
variations in data collections across national
boundaries.
and FX rates. These benchmarks are used for valuing
numerous contracts and portfolios of assets.
The FSB’s Official Sector Steering Group established
a working group to examine the rate setting process
for exchange rate benchmarks. That group issued a
report containing recommendations in September 2014,
and implementation of those recommendations has
begun. WM/Reuters, the provider of the most widely
used FX benchmark, made changes to its calculation
by expanding the length of the calculation window
and by utilizing more data inputs. Banks have begun
to announce changes to promote more transparent
and consistent pricing of fixing transactions and
to strengthen internal procedures related to such
transactions. In addition, the various central bank-
sponsored FX committees developed a document to help
provide globally consistent guidance covering topics,
such as personal and market conduct and protection of
client information. Currently, the WM/Reuters rates are
regulated as critical benchmarks by the FCA.
7.10 Challenges to Data Quality, Collection, and Sharing
The financial crisis illustrated that insufficient or low-
quality data obfuscates a buildup in vulnerabilities and
that greater data transparency can improve the ability
of both regulators and market participants to respond
effectively. Although regulators now collect significantly
more data on financial markets and institutions, critical
gaps remain in the scope, quality, and access to data.
For example, there is a lack of data available to
regulators and market participants with respect to
wholesale funding markets. The joint Federal Reserve
and OFR pilot data collection on repo markets, in which
the SEC is participating, is an important step toward
addressing that data gap. There are similar data gaps in
securities lending activities of financial institutions and a
similar pilot collection for securities lending transactions
is already underway.
Regulators and market participants would also benefit
from more data about asset management activities.
Mutual fund data provided in a similar format to the
MMF data collected on the SEC’s Form N-MFP would
increase the transparency of fund practices for investors
and regulators. Greater transparency of investments

121Abbrev ia t ions
ABCP Asset-Backed Commercial Paper
ABS Asset-Backed Security
AIG American International Group
ARRC Alternative Reference Rates Committee
AUM Assets Under Management
BCBS Basel Committee on Banking Supervision
BCR Basic Capital Requirement
BEA Bureau of Economic Analysis
BHC Bank Holding Company
BIS Bank for International Settlements
BLS Bureau of Labor Statistics
BoJ Bank of Japan
C&I Commercial and Industrial
CBO Congressional Budget Office
CCAR Comprehensive Capital Analysis and Review
CCP Central Counterparty
CD Certificate of Deposit
CDFI Community Development Financial Institution
Abbreviations

2 0 1 5 F S O C / / Annual Report122
CDO Collateralized Debt Obligation
CDS Credit Default Swap
CFPB Bureau of Consumer Financial Protection
CFTC Commodity Futures Trading Commission
CLO Collateralized Loan Obligation
CMBS Commercial Mortgage-Backed Security
CME Chicago Mercantile Exchange
CMO Collateralized Mortgage Obligation
Council Financial Stability Oversight Council
CoVaR Conditional Value-at-Risk
CP Commercial Paper
CPMI Committee on Payments and Market Infrastructures
CRE Commercial Real Estate
DFAST Dodd-Frank Act Stress Tests
DIP Distress Insurance Premium
Dodd-Frank Act Dodd-Frank Wall Street Reform and Consumer Protection Act
DTC Depository Trust Company
EBITDA Earnings Before Interest, Taxes, Depreciation, and Amortization
ECB European Central Bank
EME Emerging Market Economy

123Abbrev ia t ions
ETF Exchange-Traded Fund
ETP Exchange-Traded Product
EU European Union
Euribor Euro Interbank Offered Rate
FASB Financial Accounting Standards Board
FBIIC Financial and Banking Information Infrastructure Committee
FBO Foreign Banking Organization
FDIC Federal Deposit Insurance Corporation
Federal Reserve Board of Governors of the Federal Reserve System
FFIEC Federal Financial Institutions Examination Council
FHA Federal Housing Administration
FHFA Federal Housing Finance Agency
FHLB Federal Home Loan Bank
FICC Fixed Income Clearing Corporation
FINRA Financial Industry Regulatory Authority
FIO Federal Insurance Office
FMI Financial Market Infrastructure
FMU Financial Market Utility
FOMC Federal Open Market Committee

2 0 1 5 F S O C / / Annual Report124
FRBNY Federal Reserve Bank of New York
FS-ISAC Financial Sector Information Sharing and Analysis Center
FSB Financial Stability Board
FSOC Financial Stability Oversight Council
FSSCC Financial Services Sector Coordinating Council
FX Foreign Exchange
G-20 The Group of Twenty
G-SIB Global Systemically Important Banking Organization
G-SIFI Global Systemically Important Financial Institution
G-SII Global Systemically Important Insurer
GAAP Generally Accepted Accounting Principles
GCF General Collateral Finance
GDP Gross Domestic Product
GECC .General Electric Capital Corporation, Inc
GLB Guaranteed Living Benefit
GO General Obligation
GSE Government-Sponsored Enterprise
HAMP Home Affordable Modification Program
HARP Home Affordable Refinance Program
HELOC Home Equity Line of Credit

125Abbrev ia t ions
HLA Higher Loss Absorbency
HMDA Home Mortgage Disclosure Act
HUD U.S. Department of Housing and Urban Development
IAIS International Association of Insurance Supervisors
IASB International Accounting Standards Board
IBA ICE Benchmark Administration
ICE Intercontinental Exchange
ICI Investment Company Institute
ICS Insurance Capital Standard
IMF International Monetary Fund
IOSCO International Organization of Securities Commissions
ISDA International Swaps and Derivatives Association
LBO Leveraged Buyout
LCF Last Cash Flow
LCR Liquidity Coverage Ratio
LEI Legal Entity Identifier
LIBOR London Interbank Offered Rate
MBS Mortgage-Backed Security
MMF Money Market Mutual Fund
MOVE Merrill Lynch Option Volatility Estimate

2 0 1 5 F S O C / / Annual Report126
MSR Mortgage Servicing Right
NAIC National Association of Insurance Commissioners
NARAB National Association of Registered Agents and Brokers
NAV Net Asset Value
NBER National Bureau of Economic Research
NCUA National Credit Union Administration
NFIB National Federation of Independent Business
NIM Net Interest Margin
NIST National Institute of Standards and Technology
NSCC National Securities Clearing Corporation
NSFR Net Stable Funding Ratio
OCC Office of the Comptroller of the Currency
OFR Office of Financial Research
OLA Orderly Liquidation Authority
OMB Office of Management and Budget
ON RRP Overnight Reverse Repurchase Agreement
OPEC Organization of the Petroleum Exporting Countries
ORSA Own Risk and Solvency Assessment
OTC Over-the-Counter
P&C Property and Casualty

127Abbrev ia t ions
PCE Personal Consumption Expenditures
PFMI Principles for Financial Market Infrastructures
PIK Payment-in-Kind
QM Qualified Mortgage
QRM Qualified Residential Mortgage
REIT Real Estate Investment Trust
REO Real Estate Owned
Repo Repurchase Agreement
RMBS Residential Mortgage-Backed Security
ROA Return on Average Assets
RRP Reverse Repurchase Operation
RWA Risk-Weighted Asset
S&P Standard and Poor's
SBSDR Security-Based Swap Data Repository
SBSR Security-Based Swap Reporting
SCI Systems Compliance and Integrity
SDR Swap Data Repository
SEC Securities and Exchange Commission
SEF Swap Execution Facility
SES Systemic Expected Shortfall

2 0 1 5 F S O C / / Annual Report128
SIFMA Securities Industry and Financial Markets Association
SLOOS Senior Loan Officer Opinion Survey
SLR Supplementary Leverage Ratio
SNC Shared National Credit
SRC Systemic Risk Committee
SSM Single Supervisory Mechanism
Term RRP Term Reverse Repurchase Agreement
TIBOR Tokyo Interbank Offered Rate
TILA Truth in Lending Act
Treasury U.S. Department of the Treasury
TRIP Terrorism Risk Insurance Program
ULI Universal Loan Identifier
USD U.S. Dollar
VA U.S. Department of Veterans Affairs
VaR Value-at-Risk
VIX Chicago Board Options Exchange Volatility Index
WAM Weighted-Average Maturity
WMP Wealth Management Product
WTI West Texas Intermediate

129Glossar y
Glossary
1940 Act The Investment Company Act of 1940 is an act of Congress
primarily concerning the regulation of mutual funds, closed-
end funds, exchange-traded funds, and business development
companies.
Additional Tier 1 Capital A regulatory capital measure which includes items such as non-
cumulative perpetual preferred stock and related surplus, minority
interest in subsidiaries, and mandatory convertible preferred
securities.
Advanced Approaches
Capital Framework
The Advanced Approaches capital framework requires certain
banking organizations to use an internal ratings-based approach
and other methodologies to calculate risk-based capital require-
ments for credit risk and advanced measurement approaches
to calculate risk-based capital requirements for operational risk.
The framework applies to large, internationally active banking
organizations—generally those with at least $250 billion in total
consolidated assets or at least $10 billion in total on-balance
sheet foreign exposure—and includes the depository institution
subsidiaries of those firms.
Asset-Backed Commercial Paper
(ABCP)
Short-term debt that has a fixed maturity of up to 270 days and
is backed by some financial asset, such as trade receivables,
consumer debt receivables, securities, or auto and equipment
loans or leases.
Asset-Backed Security (ABS) A fixed income or other type of security that is collateralized
by self-liquidating financial assets that allows the holder of the
security to receive payments that depend primarily on cash flows
from the assets.
Bid-to-Cover Ratio A measure of investor demand, typically with respect to auctions
of fixed income securities, calculated as the total bids placed
divided by the total bids accepted.
Bilateral Repo Bilateral repos are repos between two institutions where settle-
ment typically occurs on a “delivery versus payment” basis. More
specifically, the transfer of the collateral to the cash lender occurs
simultaneously with the transfer of the cash to the collateral
provider.
Central Counterparty (CCP) An entity that interposes itself between counterparties to contracts
traded in one or more financial markets, becoming the buyer to
every seller and the seller to every buyer and thereby ensuring the
performance of open contracts.

2 0 1 5 F S O C / / Annual Report130
Clearing Bank A BHC subsidiary that facilitates payment
and settlement of financial transactions,
such as check clearing, or facilitates
trades between the sellers and buyers of
securities or other financial instruments
or contracts.
Collateral Any asset pledged by a borrower to guarantee payment of a debt.
Collateralized Loan
Obligation (CLO)
A securitization vehicle backed predominantly by commercial
loans.
Commercial Mortgage-Backed
Security (CMBS)
A security that is collateralized by a pool of commercial mortgage
loans and makes payments derived from the interest and principal
payments on the underlying mortgage loans.
Commercial Paper (CP) Short-term (maturity of up to 270 days), unsecured corporate
debt.
Common Equity Tier 1 Capital A regulatory capital measure which includes capital with the high-
est loss-absorbing capacity, such as common stock and retained
earnings.
Common Equity Tier 1
Capital Ratio
A ratio that divides common equity tier 1 capital by total risk-
weighted assets. The ratio applies to all banking organizations
subject to the Revised Capital Rule.
Common Securitization
Platform (CSP)
A common RMBS securitization infrastructure between Fannie
Mae and Freddie Mac.
Comprehensive Capital Analysis
and Review (CCAR)
An annual exercise by the Federal Reserve to ensure that institu-
tions have robust, forward-looking capital planning processes that
account for their unique risks and sufficient capital to continue
operations throughout times of economic and financial stress.
Conditional Value-at-Risk (CoVaR) The value-at-risk (VaR) of the financial system conditional on
institutions being in distress.
Consumer Price Index (CPI) A monthly index containing data on changes in the prices paid
by urban consumers for a representative basket of goods and
services.
Credit Default Swap (CDS) A financial contract in which one party agrees to make a pay-
ment to the other party in the event of a specified credit event, in
exchange for one or more fixed payments.
Credit Rating Agency A private company that evaluates the credit quality of debt issuers
as well as their issued securities and provides ratings on the
issuers and securities. Many credit rating agencies are Nationally
Recognized Statistical Rating Organizations, the largest of which
are Fitch Ratings, Moody’s Investors Service, and Standard &
Poor’s.

131Glossar y
Defined Benefit Plan A retirement plan in which the cost to the employer is based on a
predetermined formula to calculate the amount of a participant’s
future benefit. In defined benefit plans, the investment risk is
borne by the plan sponsor.
Defined Contribution Plan A retirement plan in which the cost to the employer is limited to
the specified annual contribution. In defined contribution plans,
the investment risk is borne by the plan participant.
Distress Insurance Premium (DIP) A measure of systemic risk that integrates the characteristics of
bank size, default probability, and interconnectedness.
Dodd-Frank Act Stress Tests (DFAST) Annual stress tests required by Dodd-Frank for national banks
and federal savings associations with total consolidated assets of
more than $10 billion.
Duration The sensitivity of the prices of bonds and other fixed income
securities to changes in the level of interest rates.
Euro Interbank Offered Rate
(Euribor)
The rate at which euro interbank term deposits are offered by one
prime bank to another prime bank within the euro area.
Exchange-Traded Product (ETP) An investment fund or note whose shares are traded on an
exchange. ETPs offer continuous pricing—unlike mutual funds,
which offer only end-of-day pricing. ETPs are often designed to
track an index or a portfolio of assets.
Federal Funds Rate The interest rate at which depository institutions lend balances
to each other overnight. The FOMC sets a target level for the
overnight federal funds rate, and the Federal Reserve Bank of New
York then uses open market operations to influence the overnight
federal funds rate to trade around the policy target rate or within
the target rate range.
FICO Score A measure of a borrower’s creditworthiness based on the bor-
rower’s credit data; developed by the Fair Isaac Corporation.
Financial Market Infrastructure (FMI) A multilateral system among participating financial institutions,
including the operator of the system, used for the purposes of
recording, clearing, or settling payments, securities, derivatives,
or other financial transactions. Under the Dodd-Frank Act, certain
FMIs are recognized as FMUs.
Financial Market Utility (FMU) A Dodd-Frank defined entity, which, subject to certain exclusions,
is “any person that manages or operates a multilateral system for
the purpose of transferring, clearing, or settling payments, securi-
ties, or other financial transactions among financial institutions or
between financial institutions and the person.”

2 0 1 5 F S O C / / Annual Report132
Fire Sale The disorderly liquidation of assets to meet margin requirements
or other urgent cash needs. Such a sudden sell-off drives down
prices, potentially below their intrinsic value, when the quantities
to be sold are large relative to the typical volume of transactions.
Fire sales can be self-reinforcing and lead to additional forced
selling by some market participants that, subsequent to an initial
fire sale and consequent decline in asset prices, may also need to
meet margin or other urgent cash needs.
Fiscal Year Any 12-month accounting period. The fiscal year for the federal
government begins on October 1 and ends on September 30 of
the following year; it is named after the calendar year in which it
ends.
Future A standardized contract traded over exchanges to buy or sell an
asset in the future.
General Collateral Finance (GCF) An interdealer repo market in which the Fixed Income Clearing
Corporation plays the role of intraday CCP. Trades are netted at
the end of each day and settled at the tri-party clearing banks.
See Tri-party Repo.
Government-Sponsored
Enterprise (GSE)
A corporate entity that has a federal charter authorized by law, but
that is a privately owned financial institution. Examples include
the Federal National Mortgage Association (Fannie Mae) and the
Federal Home Loan Mortgage Corporation (Freddie Mac).
Gross Domestic Product (GDP) The broadest measure of aggregate economic activity, measuring
the total value of all final goods and services produced within a
country’s borders during a specific period.
Haircut The discount, represented as a percentage of par or market value,
at which an asset can be pledged as collateral. For example, a
$1,000,000 bond with a 5 percent haircut would collateralize a
$950,000 loan. The purpose of a haircut is to provide a collateral
margin for a secured lender.
Held-to-Maturity An accounting term for debt securities accounted for at amortized
cost, under the proviso that the company can assert that it has the
positive intent and ability to hold the securities to maturity.
High-Quality Liquid Asset An asset—such as a government bond—that is considered
eligible as a liquidity buffer in the U.S. banking agencies’ liquidity
coverage ratio. High-quality liquid assets should be liquid in mar-
kets during times of stress and, ideally, be central bank-eligible.
Home Equity Line of Credit
(HELOC)
A line of credit extended to a homeowner that uses the home as
collateral.
Household Debt Service Ratio An estimate of the ratio of debt payments to disposable personal
income. Debt payments consist of the estimated required pay-
ments on outstanding mortgage and consumer debt.
Household Formation A measure of housing demand, calculated as the month-to-month
change in the number of occupied housing units.

133Glossar y
Interest Rate Risk Management The management of the exposure of an individual’s or an institu-
tion’s financial condition to movements in interest rates.
Interest Rate Swap A derivative contract in which two parties swap interest rate cash
flows on a periodic basis, referencing a specified notional amount
for a fixed term. Typically one party will pay a predetermined fixed
rate while the other party will pay a short-term variable reference
rate that resets at specified intervals.
Large-Scale Asset Purchases Purchases by the Federal Reserve of securities issued by the U.S.
government or securities issued or guaranteed by government-
sponsored agencies (including Fannie Mae, Freddie Mac, Ginnie
Mae, and the Federal Home Loan Banks) in the implementation of
monetary policy.
Legal Entity Identifier (LEI) A 20-digit alpha-numeric code that connects to key reference
information that enables clear and unique identification of com-
panies participating in global financial markets. The LEI system is
designed to facilitate many financial stability objectives, includ-
ing: improved risk management in firms; better assessment of
microprudential and macroprudential risks; expedition of orderly
resolution; containment of market abuse and financial fraud; and
provision of higher-quality and more accurate financial data.
Level 3 Assets Assets for which fair value measurement is based on unobserv-
able inputs.
Leveraged Buyout (LBO) An acquisition of a company financed by a private equity contribu-
tion combined with borrowed funds, with debt comprising a
significant portion of the purchase price.
Leveraged Loan A loan for which the obligor’s post-financing leverage as mea-
sured by debt-to-assets, debt-to-equity, cash flow-to-total debt, or
other such standards unique to particular industries significantly
exceeds industry norms. Leveraged borrowers typically have a
diminished ability to adjust to unexpected events and changes in
business conditions because of their higher ratio of total liabilities
to capital.
Liquidity Coverage Ratio (LCR) A standard to ensure that covered companies maintain adequate
unencumbered, high-quality liquid assets to meet anticipated
liquidity needs for a 30-day horizon under a standardized liquidity
stress scenario.
Loan-to-Value Ratio The ratio of the amount of a loan to the value of the asset that
the loan funds, typically expressed as a percentage. This is a
key metric when considering the level of collateralization of a
mortgage.
London Interbank Offered Rate
(LIBOR)
The interest rate at which banks can borrow unsecured funds
from other banks in London wholesale money markets, as mea-
sured by daily surveys. The published rate is a trimmed average
of the rates obtained in the survey.

2 0 1 5 F S O C / / Annual Report134
Major Security-Based Swap
Participant
A person that is not a security-based swap dealer and maintains a
substantial position in security-based swaps, creates substantial
counterparty exposure, or is a financial entity that is highly lever-
aged and not subject to federal banking capital rules.
Maturity Gap The weighted-average time to maturity of financial assets less the
weighted-average time to maturity of liabilities.
Money Market Mutual
Fund (MMF)
A type of mutual fund that invests in short-term, liquid securities
such as government bills, CDs, CP, or repos.
Mortgage-Backed Security
(MBS)
ABS backed by a pool of mortgages. Investors in the security re-
ceive payments derived from the interest and principal payments
on the underlying mortgages.
Mortgage Servicing Company A company that acts as an agent for mortgage holders by collect-
ing and distributing mortgage cash flows. Mortgage servicers
also manage defaults, modifications, settlements, foreclosure
proceedings, and various notifications to borrowers and investors.
Mortgage Servicing Rights
(MSRs)
The rights to service and collect fees on a mortgage.
Municipal Bond A bond issued by states, cities, counties, local governmental agen-
cies, or certain nongovernment issuers to finance certain general
or project-related activities.
Net Asset Value (NAV) An investment company’s total assets minus its total liabilities.
Net Interest Margin (NIM) Net interest income as a percent of interest-earning assets.
Net Stable Funding Ratio (NSFR) A liquidity standard to promote the funding stability of interna-
tionally active banks, through the maintenance of stable funding
resources relative to assets and off-balance sheet exposures.
Open Market Operations The purchase and sale of securities in the open market by a
central bank to implement monetary policy.
Option A financial contract granting the holder the right but not the obli-
gation to engage in a future transaction on an underlying security
or real asset. The most basic examples are an equity call option,
which provides the right but not the obligation to buy a block of
shares at a fixed price for a fixed period, and an equity put option,
which similarly grants the right to sell a block of shares.
Over-the-Counter (OTC) A method of trading that does not involve an organized exchange.
In OTC markets, participants trade directly on a bilateral basis,
typically through voice or computer communication and often with
certain standardized documentation with counterparty-dependent
terms.

135Glossar y
Prudential Regulation Regulation aimed at ensuring the safe and sound operation of
financial institutions, set by both state and federal authorities.
Public Debt All debt issued by Treasury and the Federal Financing Bank,
including both debt held by the public and debt held in intergov-
ernmental accounts such as the Social Security Trust Funds. Not
included is debt issued by government agencies other than the
Department of the Treasury.
Qualified Mortgage (QM) A mortgage loan that meets certain underwriting criteria and
product feature requirements announced by the CFPB, VA, or other
applicable agencies. An originator of a QM is provided with cer-
tain protections from borrower lawsuits alleging that the originator
failed to fulfill its duty under the Dodd-Frank Act to make a good
faith and reasonable determination of the borrower’s ability to
repay the loan.
Qualified Residential Mortgage
(QRM)
A mortgage loan that is exempt from the Dodd-Frank Act’s
securitization risk retention rule requiring securitization issuers to
retain a portion of securitized risk exposure in transactions that
they issue.
Real Estate Investment Trust
(REIT)
An operating company that manages income-producing real
estate or real estate-related assets. Certain REITs also operate
real estate properties in which they invest. To qualify as a REIT, a
company must have three-fourths of its assets and gross income
connected to real estate investment and must distribute at least
90 percent of its taxable income to shareholders annually in the
form of dividends.
Repurchase Agreement (Repo) The sale of a security combined with an agreement to repurchase
the security, or a similar security, on a specified future date at a
prearranged price. A repo is a secured lending arrangement.
Residential Mortgage-Backed
Security (RMBS)
A security that is collateralized by a pool of residential mortgage
loans and makes payments derived from the interest and principal
payments on the underlying mortgage loans.
Revised Capital Rule The capital rule that revised the risk-based and leverage capital
requirements for U.S. banking organizations, as finalized by the
U.S. banking agencies in October 2013 (78 FR 198 (October 11,
2013)).
Risk-Based Capital An amount of capital, based on the risk-weighting of various asset
categories, that a financial institution holds to help protect against
losses.

2 0 1 5 F S O C / / Annual Report136
Risk-Weighted Assets (RWAs) A risk-based concept used as the denominator of risk-based
capital ratios (common equity tier 1, tier 1, and total). The total
RWAs for an institution are a weighted total asset value calculated
from assigned risk categories or modeled analysis. Broadly, total
RWAs are determined by calculating RWAs for market risk and
operational risk, as applicable, and adding the sum of RWAs for
on-balance sheet, off-balance sheet, counterparty, and other
credit risks.
Rollover Risk The risk that as an institution’s debt nears maturity, the institu-
tion may not be able to refinance the existing debt or may have to
refinance at less favorable terms.
Run Risk The risk that investors lose confidence in an institution—due to
concerns about counterparties, collateral, solvency, or related
issues—and respond by pulling back their funding.
Securities Information Processor A system that consolidates and disseminates equity prices.
Securities Lending/Borrowing The temporary transfer of securities from one party to another for
a specified fee and term, in exchange for collateral in the form of
cash or securities.
Securitization A financial transaction in which assets such as mortgage loans
are pooled, securities representing interests in the pool are issued,
and proceeds from the underlying pooled assets are used to
service and repay securities issued via the securitization.
Security-Based Swap Dealer A person that holds itself out as a dealer in security-based swaps,
makes a market in security-based swaps, regularly enters into
security-based swaps with counterparties, or engages in any
activity causing it to be known as a dealer or market maker in
security-based swaps; does not include a person entering into
security-based swaps for such person’s own account.
Short-Term Wholesale Funding Short-term funding instruments not covered by deposit insur-
ance that are typically issued to institutional investors. Examples
include large checkable and time deposits, brokered CDs, CP,
Federal Home Loan Bank borrowings, and repos.
Sponsor-Backed Payment-in-Kind
(PIK) Bond
A bond that compensates the holder with other bonds rather than
cash.
Supplementary Leverage
Ratio (SLR)
Tier 1 capital of an advanced approaches banking organization di-
vided by total leverage exposure. All advanced approaches bank-
ing organizations must maintain an SLR of at least 3 percent. The
SLR is effective January 1, 2018, and organizations must calculate
and publicly disclose their SLRs beginning March 31, 2015.

137Glossar y
Swap An exchange of cash flows with defined terms and over a fixed
period, agreed upon by two parties. A swap contract may refer-
ence underlying financial products across various asset classes
including interest rates, credit, equities, commodities, and FX.
Swap Data Repository (SDR) A person that collects and maintains information or records with
respect to transactions or positions in, or the terms and conditions
of, swaps entered into by third parties for the purpose of providing
a centralized recordkeeping facility for swaps. In certain jurisdic-
tions, SDRs are referred to as trade repositories. The Committee
on Payments and Settlement Systems and IOSCO describe a trade
repository as “an entity that maintains a centralized electronic
record (database) of transaction data.”
Swap Dealer A person that holds itself out as a dealer in swaps, makes a
market in swaps, regularly enters into swaps with counterparties,
or engages in any activity causing it to be known as a dealer or
market maker in swaps; does not include a person entering into
swaps for such person’s own account.
Swap Execution Facility (SEF) A term defined in the Dodd-Frank Act as a trading platform which
market participants use to execute and trade swaps by accepting
bids and offers made by other participants.
Swap Future A futures contract that mimics the economic substance of a swap.
Swaption An option granting the right to enter into a swap. See Option and
Swap.
Systemic Expected Shortfall (
SES)
A systemic risk indicator that estimates the extent to which the
market value equity of a financial firm would be depleted by a
decline in equity prices.
Tier 1 Capital A regulatory capital measure comprised of common equity tier 1
capital and additional tier 1 capital. See Common Equity Tier 1
Capital and Additional Tier 1 Capital.
Tier 2 Capital A regulatory capital measure that includes subordinated debt
with a minimum maturity of five years and satisfies the eligibility
criteria in the Revised Capital Rule.
Time Deposits Deposits which the depositor generally does not have the right
to withdraw before a designated maturity date without paying an
early withdrawal penalty. A CD is a time deposit.
Total Capital A regulatory capital measure comprised of tier 1 capital and tier 2
capital. See Tier 1 Capital and Tier 2 Capital.
Tri-Party Repo A repo in which a clearing bank acts as third-party agent to
provide collateral management services and to facilitate the ex-
change of cash against collateral between the two counterparties.

2 0 1 5 F S O C / / Annual Report138
Underwriting Standards Terms, conditions, and criteria used to determine the extension of
credit in the form of a loan or bond.
Value-at-Risk (VaR) A tool measuring the risk of portfolio losses. The VaR projects the
probability and maximum expected loss for a specific time period.
For example, the VaR over 10 days and with 99 percent certainty
measures the most one would expect to lose over a 10-day
period, 99 percent of the time.
VIX (Chicago Board Options
Exchange Market Volatility Index)
Standard measure of market expectations of short-term volatility
based on S&P equity index option prices.
Wealth Management Products
(WMPs)
Products sold to investors as higher-yielding alternatives to time
deposits. WMPs are largely off-balance sheet investment vehicles
offered by banks, trusts, and securities companies.
Weighted-Average Life A weighted average of the time to each principal payment in a
security.
Weighted-Average Maturity (WAM) A weighted average of the time to maturity on all loans in an
asset-backed security.
Yield Curve A graphical representation of the relationship between bond yields
and their respective maturities.

139L is t o f Char ts
List of Charts
4.1.1 Change in Real Gross Domestic Product .......................................... 19
4.1.2 Change in Real Personal Consumption Expenditures ....................... 19
4.1.3 Private Housing Starts ...................................................................... 19
4.1.4 U.S. Oil Imports and Production ........................................................ 20
4.1.5 Net Change in Nonfarm Payroll Employment .................................... 20
4.1.6 Civilian Unemployment Rate ............................................................. 20
4.1.7 Labor Force Participation Rate .......................................................... 21
4.1.8 Long-Term Unemployment ................................................................ 21
4.2.1 Private Nonfinancial Debt .................................................................. 21
4.2.2 Debt to Assets for Nonfinancial Corporations .................................... 22
4.2.3 Bank Business Lending Standards and Demand .............................. 22
4.2.4 Noncurrent Commercial and Industrial Loans ................................... 22
4.2.5 Nonfinancial Corporate Bond Default Rate ........................................ 23
4.2.6 Nonfinancial Noncorporate Assets .................................................... 23
4.2.7 Net Borrowing by Nonfinancial Noncorporate Businesses ................ 23
4.2.8 Bank Business Lending Standards and Demand .............................. 24
4.2.9 Small Businesses’ Difficulty Obtaining Credit .................................... 24
4.2.10 Household Debt as a Percent of Disposable Personal Income .......... 24
4.2.11 Household Debt Service Ratio .......................................................... 25
4.2.12 Share of Household Debt by Delinquency Status .............................. 25
4.2.13 Household and Nonprofit Balance Sheets ........................................ 25
4.2.14 Owners’ Equity as Share of Household Real Estate .......................... 26
4.2.15 Components of Consumer Credit ..................................................... 26
4.2.16 90+ Day Delinquency Rate by Loan Type .......................................... 26
4.3.1 Federal Revenues and Outlays .......................................................... 27
4.3.2 Outlays in Major Budget Categories .................................................. 27
4.3.3 Federal Debt Held by the Public ........................................................ 27
4.3.4 Interest Outlays and Average Maturity of U.S. Public Debt ................ 28
4.3.5 Change in State and Local Government Tax Revenues ..................... 28
4.3.6 State and Local Government Employment ........................................ 28
A.1 Municipal Bond Yields ...................................................................... 29
4.3.7 Long-Term Mutual Fund Flows: Municipal Bonds .............................. 30
4.3.8 Municipal Bond Issuance .................................................................. 30
4.3.9 Municipal Bond Spreads ................................................................... 30
4.4.1 Advanced Economies Real GDP Growth .......................................... 31
4.4.2 Real GDP Growth ............................................................................. 31

2 0 1 5 F S O C / / Annual Report140
4.4.3 Euro Area Real GDP Growth ............................................................. 31
4.4.4 Euro Area Consumer Price Inflation ................................................... 33
4.4.5 Japanese Real GDP Growth ............................................................. 33
4.4.6 Japanese Consumer Price Inflation ................................................... 33
4.4.7 Chinese Real GDP Growth................................................................ 34
4.4.8 Chinese Property Prices ................................................................... 34
4.4.9 Chinese Credit Growth ..................................................................... 34
4.4.10 Components of Chinese Nonbank Credit Growth ............................. 35
4.4.11 Credit to the Chinese Nonfinancial Private Sector ............................. 35
5.1.1 10-Year Treasury Yields ..................................................................... 37
5.1.2 2-Year Treasury Yields ....................................................................... 37
5.1.3 Publicly Held Federal Debt Outstanding ............................................ 37
5.1.4 Foreign Holders of U.S. Federal Debt ................................................ 38
5.1.5 Fixed Income Implied Volatility........................................................... 38
5.1.6 European 10-Year Yields ................................................................... 38
5.1.7 Gross Capital Flows to EMEs ............................................................ 39
5.1.8 Emerging Market Gross Global Bond Issuance ................................. 39
5.1.9 Emerging Market Bond Spreads ....................................................... 39
5.1.10 Agency MBS Yield and Spread ......................................................... 40
5.1.11 CMBS Issuance ................................................................................ 40
5.1.12 CMBS Senior Debt Spreads ............................................................. 40
5.1.13 Corporate Credit Spreads ................................................................. 41
5.1.14 Total High-Yield Debt Outstanding .................................................... 41
5.1.15 Outstanding Investment Grade Bonds .............................................. 41
5.1.16 Leveraged Loans: Debt to EBITDA Ratios ......................................... 42
5.1.17 Covenant-Lite Volume as a Percent of Total Issuance ....................... 42
5.1.18 CLO Issuance ................................................................................... 43
5.1.19 Share of Leveraged Loan Primary Market by Investor Type ............... 43
C.1 Commodity Prices: Metals vs. Oil ...................................................... 44
C.2 High-Yield Bond Spreads .................................................................. 45
5.1.20 Nominal U.S. Dollar Trade-Weighted Index ........................................ 46
5.1.21 Currency Implied Volatility ................................................................. 46
5.1.22 U.S. Dollar Exchange Rates .............................................................. 46
5.1.23 Change in Exchange Rates (Mar 2014 – Mar 2015) ........................... 47
5.1.24 Returns in Selected Equities Indices ................................................. 47
5.1.25 S&P 500 Key Ratios .......................................................................... 47
5.1.26 Market Volatility ................................................................................. 48
5.1.27 Commodities .................................................................................... 48
5.1.28 National Repeat Sales Home Price Indices ....................................... 48
5.1.29 Originations by Purchase and Refinance ........................................... 49

141L is t o f Char ts
5.1.30 Mortgages with Negative Equity ........................................................ 49
5.1.31 Mortgage Delinquency and Foreclosure ............................................ 49
5.1.32 Purchase Origination Volume by Credit Score ................................... 50
5.1.33 Mortgage Originations by Product .................................................... 50
5.1.34 RMBS Issuance ................................................................................ 51
5.1.35 Mortgage Servicing Market ............................................................... 51
5.1.36 Commercial Property Price Indices ................................................... 52
5.2.1 Composition of Bank Short-Term Funding ........................................ 53
5.2.2 Commercial Paper Outstanding ........................................................ 54
5.2.3 Value of the Repo Market .................................................................. 54
5.2.4 Primary Dealer Repo Agreements ..................................................... 54
5.2.5 Collateral in Tri-Party Repo................................................................ 55
5.2.6 Value of Securities on Loan ............................................................... 56
5.2.7 Composition of Securities Lending by Security Type ......................... 56
5.2.8 Securities Lending Cash Reinvestment ............................................. 56
5.3.1 Domestic BHC Pre-Tax Income ........................................................ 57
5.3.2 Return on Average Assets for Domestic BHCs .................................. 57
5.3.3 Annualized Net Interest Margin ......................................................... 57
5.3.4 Total Residential Mortgage Originations ............................................ 58
5.3.5 U.S. Mortgage Spread ...................................................................... 58
5.3.6 Select Crisis-Era Security and Mortgage-Related Settlements .......... 58
5.3.7 Maturity Gap at Large Banks ............................................................ 59
5.3.8 Maturity Gap at Small Banks ............................................................. 59
5.3.9 KBW Bank Index and Historical Volatility ........................................... 59
5.3.10 P/B and P/E Ratios of Six Large Complex BHCs ............................... 60
5.3.11 CDS Spreads of Six Large Complex BHCs ....................................... 60
5.3.12 Change in Aggregate Common Equity Capital Ratios for
Domestic BHCs ................................................................................ 60
5.3.13 Consolidated BHC Liquid Assets Ratio by Firm Size ......................... 61
5.3.14 Non-Performing Loans (90+ Days and Non-Accrual) ........................ 61
5.3.15 Credit Quality .................................................................................... 61
5.3.16 Loan Loss Reserves ......................................................................... 62
5.3.17 Initial and Stressed Tier 1 Common Capital Ratios ............................ 62
5.3.18 Federal Reserve’s Actions in CCAR 2015 .......................................... 62
5.3.19 FDIC-Insured Failed Institutions ......................................................... 63
5.3.20 Commercial Bank and Thrift Pre-Tax Income .................................... 63
5.3.21 Risk-Weighted Assets and Return on Assets .................................... 63
5.3.22 U.S. Branches and Agencies of Foreign Banks: Assets ..................... 64
5.3.23 U.S. Branches and Agencies of Foreign Banks: Liabilities ................. 64
5.3.24 Cash Assets of U.S. Branches and Agencies of Foreign Banks......... 64

2 0 1 5 F S O C / / Annual Report142
5.3.25 Federally Insured Credit Union Income .............................................. 65
5.3.26 Credit Union Deposits ....................................................................... 66
5.3.27 Credit Union Net Long-Term Assets .................................................. 66
5.3.28 Credit Union Investments by Maturity ................................................ 66
5.4.1 Broker-Dealer Revenues ................................................................... 67
5.4.2 Broker-Dealer Assets and Leverage .................................................. 67
5.4.3 Large Broker-Dealer Assets and Leverage by Affiliation .................... 68
5.4.4 Primary Dealer Securities .................................................................. 68
5.4.5 Select U.S. Financial Holding Companies and Insurers ..................... 69
5.4.6 Insurance Industry Net Income ......................................................... 69
5.4.7 Net Yield on Invested Assets ............................................................. 69
5.4.8 Insurance Industry Capital and Surplus ............................................. 70
5.4.9 Variable Annuities with Guaranteed Living Benefits ........................... 72
5.4.10 Consumer Loans Outstanding .......................................................... 73
5.4.11 Business Loans Outstanding ............................................................ 73
5.4.12 Auto Loans Outstanding and Originations by Type ............................ 74
5.4.13 ABS Issuance ................................................................................... 74
5.4.14 Selected ABS Spreads ..................................................................... 74
5.4.15 Agency REIT Assets and Leverage ................................................... 75
5.4.16 Agency REIT Price-to-Book Ratio ..................................................... 75
5.5.1 MMF Assets by Fund Type ................................................................ 76
5.5.2 U.S. MMF Holdings of European Entities’ CP, CD, and Repos .......... 76
5.5.3 Liquidity of Prime MMFs .................................................................... 76
5.5.4 Weighted-Average Life of MMFs ....................................................... 77
5.5.5 Net Assets of the Investment Company Industry ............................... 77
5.5.6 Monthly Bond Mutual Fund Flows ..................................................... 77
5.5.7 Monthly Equity Mutual Fund Flows .................................................... 78
5.5.8 Bank Loan Mutual Funds: Annual Flows ........................................... 78
5.5.9 Alternative Mutual Funds: Annual Flows ............................................ 78
5.5.10 Cumulative Equity Fund Flows .......................................................... 79
5.5.11 Retirement Fund Assets by Plan Type ............................................... 79
5.5.12 Public and Private Pension Funding Levels ....................................... 79
5.5.13 U.S. Private Equity AUM .................................................................... 80
5.5.14 Pension Investment in Private Equity ................................................. 80
5.5.15 Sponsor-Backed Payment-in-Kind Bonds ......................................... 80
5.5.16 U.S.-Listed ETP AUM and Count ...................................................... 81
5.6.1 Global OTC Derivatives Market ......................................................... 81
5.6.2 Credit Derivatives Outstanding .......................................................... 82
5.6.3 Global OTC Derivatives: Gross Credit Exposure ................................ 82
5.6.4 Concentration of U.S. Derivative Exposures ...................................... 82

143L is t o f Char ts
5.6.5 Swap Execution Facility Weekly Volume ............................................ 83
D.1 Bilateral Derivatives Market ............................................................... 84
D.2 Centrally Cleared Derivatives Market ................................................. 84
D.3 Centrally Cleared Swap Market ......................................................... 85
7.3.1 Use of Electronic Trading by Asset Class ........................................ 107
E.1 10-Year Treasury Yield on October 15, 2014 ................................... 109
E.2 Net Positioning by Leveraged Funds in Eurodollar Futures .............. 109
7.8.1 Total Exposure of Six Large Complex BHCs ....................................116
7.8.2 Interconnectedness of Six Large Complex BHCs .............................116
7.8.3 OTC Derivatives Held by Six Large Complex BHCs ..........................116
7.8.4 Level 3 Assets Held by Six Large Complex BHCs ............................117
7.8.5 Systemic Risk Measures ..................................................................117
7.8.6 Moody’s Systemic Support Uplift .....................................................117
7.8.7 Fitch Support Rating Floors .............................................................118


F I N A N C I A L S TA B I L I T Y O V E R S I G H T C O U N C I L 1500 PENNSYLVANIA AVENUE, NW | WASHINGTON, D.C. 20220