2015 ANNUAL REPORT - Home » SkyWest...
161
2015 ANNUAL REPORT Notice of 2016 Annual Meeting and Proxy Statement
Transcript of 2015 ANNUAL REPORT - Home » SkyWest...

2 0 1 5 A N N U A L R E P O R TNot ice of 2016 Annual Meet ing and Prox y Statement
3/8/16 9:11 AM

Pac
ific
Mou
ntai
nC
entra
lE
aste
rn
10:0
011
:00
Atla
ntic
NO
ON
9:00
(Ariz
ona
does
not
obs
erve
Day
light
Sav
ings
)8:
00
EFFE
CTIV
E MA
RCH
2016
CU
RR
EN
T
CO
MB
IN
ED
R
OU
TE
S
YS
TE
M
Valp
arai
so
Kno
xvill
e
Texa
rkan
a
Tuls
a
Wic
hita
Fal
ls
Sprin
gfie
ld
San
Ang
elo
Sant
a Fe
Ros
wel
l
Pens
acol
a
Hat
tiesb
urg-
Laur
el
Chi
cago
Mon
roe
Mer
idia
n
Lare
do
Lafa
yette
Law
ton
Jopl
inW
ichi
ta
Hou
ston
Hun
tsvi
lle
Fort
Hoo
dLo
ngvi
ewFort
Sm
ith
Bea
umon
t
Wac
o
Man
zani
llo
Ixta
pa
Win
nipe
g
Lond
on
Otta
wa
Hal
ifax
Nor
thw
est A
rkan
sas
Villa
herm
osa
Valp
arai
so
Vera
cruz
Kno
xvill
e
Tucs
on
Tuls
a
Torr
eon
Tam
pico
Syra
cuse
San
Luis
Pot
osi
Sprin
gfie
ld
Loui
svill
e
Stat
e C
olle
geSo
uth
Ben
d
Sava
nnah
San
Ant
onio
Fort
Mye
rs
Port
land
Prov
iden
ce
Pitts
burg
h
Peor
ia
Phoe
nix
Wes
t Pal
m B
each
Pueb
la
Nor
folk
Om
aha
Okl
ahom
a C
ity
Oax
aca
Mon
tros
e
New
Orle
ans
Min
neap
olis
/St.
Paul
Mob
ile
Mon
roe
Mor
elia
Mol
ine
Man
ches
ter
Mc
Alle
n
Mem
phis
Kan
sas
City
Mid
land
Lare
do
Linc
oln
Littl
e R
ock
New
Yor
k
Lexi
ngto
n
Lubb
ock
Will
isto
n
Wic
hita
Har
linge
n
Hob
bs
Gre
ensb
oro
Gra
nd R
apid
s
Fort
Hoo
d
Gre
en B
ay
Gra
nd J
unct
ion
Siou
x Fa
lls
Flin
t
Farg
o
Evan
svill
e
Erie
El P
aso
Elm
iraD
etro
itD
es M
oine
s
Day
ton
Wau
sau
Chi
huah
ua
Cha
rlest
on
Cor
pus
Chr
isti
Col
orad
o Sp
rings
Col
umbu
s
Ciu
dad
Del
Car
men
East
erw
ood
Ced
ar R
apid
s
Cha
rlest
on
Akr
on-C
anto
n
Col
umbi
a
Bal
timor
e
Bur
lingt
on
Bro
wns
ville
Birm
ingh
am
Kal
amaz
oo
Aus
tin
App
leto
n
Am
arill
o
Alb
any
Agu
asca
lient
es
Alb
uque
rque
Toro
nto
Mon
trea
l
Nor
thw
est A
rkan
sas
Valp
arai
soVa
ldos
ta
Kno
xvill
e
Trav
erse
City
Tuls
a
Bris
tol/K
ings
port
/Jo
hnso
n C
ity
Talla
hass
ee
Syra
cuse
St. L
ouis
Shre
vepo
rt
Sprin
gfie
ld
Loui
svill
e
Roc
hest
erR
oche
ster
Roa
nokeR
ichm
ond
Ral
eigh
/Dur
ham
Port
land
Prov
iden
cial
es, T
urks
and
Cai
cos
Phila
delp
hia
New
port
New
s/W
illia
msb
urg
Om
aha
Okl
ahom
a C
ityJa
ckso
nvill
e
Myr
tle B
each
Mad
ison
Mon
roe
Mel
bour
ne
Milw
auke
e
Mar
sh H
arbo
ur
Mon
tgom
ery
Mon
terr
ey
Mem
phis
Har
risbu
rg
Orla
ndo
Sagi
naw
Mon
tego
Bay
Linc
oln
Littl
e R
ock
Lans
ing
Jack
sonv
ille
Jack
son
Indi
anap
olis
Wilm
ingt
on
Wic
hita
Was
hing
ton,
DC
Whi
te P
lain
s
Col
umbu
s/St
arkv
ille/
Wes
t Poi
nt
Gre
envi
lle-S
part
anbu
rg
Fort
Hoo
dG
ulfp
ort
Gai
nesv
ille
Gra
nd C
aym
an
Geo
rge
Tow
n
Fort
Sm
ith
Free
port
Faye
ttevi
lle
Key
Wes
t
New
ark
New
Ber
n
Evan
svill
e Pana
ma
City
Det
roit
Dot
han
Dal
las
Coz
umelCin
cinn
ati
Col
umbu
s
Cha
rlotte
Cle
vela
nd
Cha
rlest
on
Cha
rlotte
svill
e
Cha
ttano
oga
Bal
timor
e
Buf
falo
Bur
lingt
on
Bat
on R
ouge
Bru
nsw
ick
Bos
ton
Nas
hvill
e
Blo
omin
gton
Leon
/Gua
naju
ato
Win
dsor
Loc
ksW
ilkes
-Bar
re/S
cran
ton
Ash
evill
e
Atla
nta
Ale
xand
riaA
lban
y
Alle
ntow
n
(OR
D, M
DW
)(O
RD
, MD
W)
(DC
A, I
AD
)(D
CA
, IA
D)
Cal
gary
Vanc
ouve
r
Tuls
a
Ora
nge
Cou
nty
Sacr
amen
to
San
Jose
Red
mon
d/B
end
Rap
id C
ity
Pasc
o/R
ichl
and/
Ken
new
ick
Chi
cago
Om
aha
Okl
ahom
a C
ity
Min
neap
olis
/St.
Paul
Mis
soul
a
Mad
ison
Milw
auke
eM
edfo
rd
Las
Vega
s
Idah
o Fa
lls
Hou
ston
Hel
ena
Gre
at F
alls
Gill
ette
Kal
ispe
ll
Fres
no
Farg
o
Euge
ne
Det
roit
Dul
uth
Den
ver
Col
orad
o Sp
rings
Boz
eman
Boi
se
Tucs
on
St. L
ouis
Salt
Lake
City
San
Fran
cisc
o
Seat
tle/T
acom
a
Sant
a B
arba
ra
San
Die
go
Port
land
Om
aha
Ont
ario
Okl
ahom
a C
ity
Oak
land
Min
neap
olis
/St.
Paul
Milw
auke
e
Kan
sas
City
Fres
no
Hay
den/
Stea
mbo
at S
prin
gs
Col
orad
o Sp
rings
Bur
bankB
oise
Yum
a
Mon
trea
l
Tucs
on
Salt
Lake
City
San
Luis
Obi
spo
Sant
a B
arba
ra
Ros
wel
lPa
lm S
prin
gsPh
oeni
x
Chi
cago
Oak
land
Mon
tros
e
Mon
tere
y
Milw
auke
e
Los
Ang
eles
Wic
hita
Her
mos
illo
Gra
nd J
unct
ion
Flag
staf
f
Fres
noD
uran
go
Bak
ersf
ield
Alb
uque
rque
Toro
nto
Vict
oria
Win
nipe
g
Mon
trea
lO
ttaw
a
Nor
thw
est A
rkan
sas
Fort
Wal
ton
Bea
ch
Kno
xvill
e
Tucs
on
Trav
erse
City
Syra
cuse
Sun
Valle
y
Sprin
gfie
ld
Ora
nge
Cou
nty
St. L
ouis
Sant
a M
aria
Salt
Lake
City
St. G
eorg
eSp
ringf
ield
San
Fran
cisc
o
Seat
tle/T
acom
a
Shre
vepo
rt
Loui
svill
e
San
Luis
Obi
spo
Sout
h B
end
Sant
a B
arba
ra
Sava
nnah
San
Ant
onio
San
Die
go
Fort
Mye
rs
Ren
o
Roc
k Sp
rings
Ric
hmon
d
Red
ding
Que
reta
ro
Palm
Spr
ings
Pens
acol
a
Pitts
burg
h
Phoe
nix
Port
land
Wes
t Pal
m B
each
Padu
cah
Nor
th B
end
Ont
ario
Nas
sau
Mex
ico
City
Mon
terr
ey
Mon
tros
e
New
Orle
ans
Mon
tere
y
Min
ot
Mam
mot
h La
kes
Mol
ine
Mus
kego
n
Mem
phis
Mia
mi
Kan
sas
City
Sagi
naw
Mid
land
Linc
oln
Littl
e R
ock
New
Yor
k
Lafa
yette
Lubb
ock
Las
Vega
s
Los
Ang
eles
Lexi
ngto
n
Lara
mie
Jam
esto
wn
Jack
sonv
ille
Jack
son
Hol
e
Indi
anap
olis
Wic
hita
Was
hing
ton,
DC
Hay
s
Hua
tulc
o
Hay
den/
Stea
mbo
at S
prin
gs
Gun
niso
n
Gre
envi
lle/S
part
anbu
rg
Gra
nd R
apid
s
Gre
en B
ay
Gra
nd J
unct
ion
Spok
ane
Fort
Way
ne
Siou
x Fa
lls
El P
aso
Eagl
e
Eau
Cla
ire
Dev
ils L
ake
Des
Moi
nes
Dur
ango
Was
hing
ton,
DC
Day
ton
Wau
sau
Cin
cinn
ati
Cor
pus
Chr
isti
Cas
per
Cod
y
Hou
ghto
n/H
anco
ck
Col
umbu
s
Cha
rlotte Cha
rlest
on
Ced
ar R
apid
s
Akr
on-C
anto
n
Col
umbi
a
Bur
bank
Buf
falo
Bat
on R
ouge
Bro
wns
ville
Bos
ton
Bill
ings
Birm
ingh
am
Bak
ersf
ield
Har
tford
Ash
evill
e
Asp
en
App
leto
n
Atla
nta
Am
arill
o
Alb
any
Eure
ka/A
rcat
a
Aca
pulc
o
Alb
uque
rque
Toro
nto
Win
nipe
g
Otta
wa
Edm
onto
n
Nor
thw
est A
rkan
sas
Kno
xvill
e
Tucs
on
Twin
Fal
ls
Trav
erse
City
Sun
Valle
y
St. L
ouis
Salt
Lake
City
Los
Cab
os
St. G
eorg
eSa
n Fr
anci
sco
Seat
tle/T
acom
a
Sout
h B
end
San
Die
go
Roc
hest
erR
oche
ster
Ren
o
Rhi
nela
nder
Ral
eigh
/Dur
ham
Rap
id C
ity
Puer
to V
alla
rta
Palm
Spr
ings
Pells
ton
Phoe
nix
Port
land
Phila
delp
hia
Poca
tello
Ont
ario
Oak
land
Min
neap
olis
/St.
Paul
Mar
quet
te
Min
ot
Mol
ine
Mon
tgom
ery
Mem
phis
Chi
cago
Kan
sas
City
Sagi
naw
Lew
isto
n
La C
ross
e
Linc
oln
Long
Bea
ch
Lexi
ngto
n
Los
Ang
eles
Las
Vega
s
Lans
ing
Jack
son
Hol
e
Ithac
a
Inte
rnat
iona
l Fal
lsW
illis
ton
Indi
anap
olis
Iron
Mou
ntai
n
Wilm
ingt
on
Wic
hita
Was
hing
ton,
DC
Hib
bing
Gre
ensb
oro
Gra
nd R
apid
s
Gre
en B
ay
Gra
nd J
unct
ion
Gra
nd F
orks
Spok
ane
Gua
dala
jara
Fort
Way
ne
Siou
x Fa
lls
Flin
t
Fres
no
Elko
Esca
naba
Des
Moi
nes
Dic
kins
on
Dal
las
Day
ton
Cas
per
Cod
y
Col
umbu
s
Cin
cinn
ati
Cha
rlotte
Cle
vela
nd
Saul
t Ste
Mar
ie
Ced
ar R
apid
s
Cha
rlotte
svill
e
Cha
ttano
oga
Ced
ar C
ity
Bur
bank
But
teB
rain
erd
Gua
naju
ato
Nas
hvill
e
Bem
idji
Bill
ings
Bis
mar
ck
Bin
gham
ton
Har
tford
Kal
amaz
ooW
ilkes
-Bar
re/S
cran
ton
Aus
tin
App
leto
n
Atla
nta
Asp
en
Alp
ena
Alb
uque
rque
Abe
rdee
n
Prov
iden
ce
45541cvr.indd 2

To our Shareholders:
We appreciate your investment and interest in SkyWest, Inc. In the second half of 2014, weinitiated a significant transition plan for SkyWest that centered on a multi-year improvement in ourfleet mix. Our focus included adding new aircraft to our fleet at improved economics, removing aircraftthat were operating under unprofitable flying agreements and improving our operational performanceand reliability.
During 2015, we made significant progress executing our transition plan. First, our dedicatedemployees worked hard to provide best-in-class regional airline service to our passengers and to ourmajor airline partners. Our flight completion rates were consistently ranked at the top of our majorairline partners’ comparisons to our peer group. A safe and reliable operation is our number onepriority and we want to thank our 20,000 employees for a job well done.
Second, we placed 46 aircraft into service during 2015, including 25 new Embraer E175 aircraftand 21 used 50-seat aircraft. It’s worth noting that we added aircraft to flying agreements with all fourof our major airline partners in 2015, which indicates the value we provide to each of our partners.These aircraft additions were meaningful contributors to our improved financial results from 2014.
Third, we removed 103 unprofitable 30-seat and 50-seat aircraft from service during 2015. Werecognize that reducing total fleet size may be viewed negatively; however, in our case, these aircraftwere specific to unprofitable agreements, meaning the reductions had a positive impact on our financialresults.
It is no small task to add 46 aircraft and remove 103 aircraft over a 12-month period. It is a creditto our tremendous employees who delivered a consistent, quality product notwithstanding significantmovement in our fleet. A few other accomplishments to highlight over the past year:
• We have commitments in place for an additional 54 E175 aircraft scheduled for delivery fromearly 2016 through mid-2017.
• We were named on Forbes ‘‘America’s Best Employers 2015’’ list. Notably, SkyWest was the onlyregional airline company on the list.
• We reached a three-year labor agreement with our pilots at SkyWest Airlines
• We reached a two-year labor agreement with our pilots at ExpressJet
As we look ahead, we expect 2016 will remain a year of transition. We anticipate additionalimprovement to our fleet mix, with 37 E175 deliveries scheduled for 2016 and continued removal ofunprofitable aircraft from our system. Challenges include the availability of qualified new pilots,fluctuating demand for the 50-seat aircraft from our major airline partners, and reaching agreementswith our labor groups with open contracts. We remain focused on executing a disciplined strategy thatprovides both model stability and fleet flexibility.
From a liquidity perspective, the strength of our balance sheet continues to provide us withfinancing leverage to grow our operations. We anticipate using a significant portion of our 2016 freecash flow towards our investment in the E175 platform.
In total, SkyWest carriers operate roughly 35% of the regional flying in the United States, morethan double the volume of the next regional airline. This equates to approximately one in 12 passengersin the United States flying on one of our operating carriers.
The airline industry, specifically the regional airline industry, continues to evolve at a rapid pace.We’ve spent the last two years placing SkyWest ahead of the evolution by proactively addressing theindustry’s challenges, delivering consistent operational credibility and initiating disciplined execution ofour fleet strategy. Our commitment to these priorities continues to result in very high demand for ourproducts, and we remain focused on moving forward with discipline to profitably deliver best what ourmajor partners need.

6MAR20151907092813MAR200820562581
We want to thank the nearly 20,000 employees across our organization for their excellent work andthe outstanding service they provide. Not only have our people continued to evolve and adapt througha period of transition, they’ve worked hard to deliver excellence. Our people are the foundation ofwhat we do, and the fundamental reason we have been successful. Our thanks to each of them forworking hard every day to be the best in the industry.
Jerry C. Atkin Russell A. ‘‘Chip’’ ChildsChairman Chief Executive Officer and PresidentSkyWest, Inc. SkyWest, Inc.

UNITED STATES
SECURITIES AND EXCHANGE COMMISSION Washington, D.C. 20549
FORM 10-K
ANNUAL REPORT PURSUANT TO SECTION 13 OR 15(d) OF THE SECURITIES EXCHANGE ACT OF 1934
For the fiscal year ended December 31, 2015 OR
TRANSITION REPORT PURSUANT TO SECTION 13 OR 15(d) OF THE SECURITIES EXCHANGE ACT OF 1934
For the transition period from to
Commission File No. 0-14719
SKYWEST, INC.
Incorporated under the Laws of Utah 87-0292166 (IRS Employer ID No.)
444 South River Road St. George, Utah 84790
(435) 634-3000 Securities Registered Pursuant to Section 12(b) of the Act: None
Securities Registered Pursuant to Section 12(g) of the Act: Common Stock, No Par Value
Indicate by check mark if the registrant is a well-known seasoned issuer, as defined in Rule 405 of the Securities Act. Yes No
Indicate by check mark if the registrant is not required to file reports pursuant to Section 13 or Section 15(d) of the Act. Yes No
Indicate by check mark whether the registrant (1) has filed all reports required to be filed by Section 13 or 15(d) of the Securities Exchange Act of 1934 during the preceding 12 months (or such shorter period that the registrant was required to file such reports), and (2) has been subject to such filing requirements for the past 90 days. Yes No
Indicate by check mark whether the registrant has submitted electronically and posted on its corporate Web site, if any, every Interactive Data File required to be submitted and posted pursuant to Rule 405 of Regulation S-T (§ 232.405 of this chapter) during the preceding 12 months (or for such shorter period that the registrant was required to submit and post such files). Yes No
Indicate by check mark if disclosure of delinquent filers pursuant to Item 405 of Regulation S-K is not contained herein, and will not be contained, to the best of registrant’s knowledge, in the definitive proxy or information statements incorporated by reference in Part III of this Form 10-K or any amendment to this Form 10-K.
Indicate by check mark whether the registrant is a large accelerated filer, an accelerated filer, a non-accelerated filer, or a smaller reporting company. See the definitions of “large accelerated filer,” “accelerated filer” and “smaller reporting company” in Rule 12b-2 of the Exchange Act.
Large accelerated filer Accelerated filer Non-accelerated filer (Do not check if a
smaller reporting company)
Smaller reporting company
Indicate by check mark whether the registrant is a shell company (as defined in Rule 12b-2 of the Act). Yes No The aggregate market value of the registrant’s common stock held by non- affiliates (based upon the closing sale price of the
registrant’s common stock on The Nasdaq National Market) on June 30, 2015 was approximately $759,240,572. As of February 16, 2016, there were 51,127,542 shares of the registrant’s common stock outstanding.
Documents Incorporated by Reference Portions of the registrant’s proxy statement to be used in connection with the Registrant’s 2015 Annual Meeting of
Shareholders are incorporated by reference into Part III of this Report as specified.

2
SKYWEST, INC. ANNUAL REPORT ON FORM 10-K
TABLE OF CONTENTS
Page No.PART I
Cautionary Statement Concerning Forward Looking Statements . . . . . . . . . . . . . . . . . . . . . . . . . . . . . . . . . . . 3Item 1. Business . . . . . . . . . . . . . . . . . . . . . . . . . . . . . . . . . . . . . . . . . . . . . . . . . . . . . . . . . . . . . . . . . . . . . . . 3Item 1A. Risk Factors . . . . . . . . . . . . . . . . . . . . . . . . . . . . . . . . . . . . . . . . . . . . . . . . . . . . . . . . . . . . . . . . . . . . 15Item 1B. Unresolved Staff Comments . . . . . . . . . . . . . . . . . . . . . . . . . . . . . . . . . . . . . . . . . . . . . . . . . . . . . . 25Item 2. Properties . . . . . . . . . . . . . . . . . . . . . . . . . . . . . . . . . . . . . . . . . . . . . . . . . . . . . . . . . . . . . . . . . . . . . . 25Item 3. Legal Proceedings . . . . . . . . . . . . . . . . . . . . . . . . . . . . . . . . . . . . . . . . . . . . . . . . . . . . . . . . . . . . . . . 28Item 4. Mine Safety Disclosures . . . . . . . . . . . . . . . . . . . . . . . . . . . . . . . . . . . . . . . . . . . . . . . . . . . . . . . . . . 28
PART II Item 5. Market for Registrant’s Common Equity, Related Stockholder Matters and Issuer Purchases
of Equity Securities . . . . . . . . . . . . . . . . . . . . . . . . . . . . . . . . . . . . . . . . . . . . . . . . . . . . . . . . . . . . . . 28Item 6. Selected Financial Data . . . . . . . . . . . . . . . . . . . . . . . . . . . . . . . . . . . . . . . . . . . . . . . . . . . . . . . . . . 30Item 7. Management’s Discussion and Analysis of Financial Condition and Results of Operations . . . 32Item 7A. Quantitative and Qualitative Disclosures About Market Risk . . . . . . . . . . . . . . . . . . . . . . . . . . . . 54Item 8. Financial Statements and Supplementary Data . . . . . . . . . . . . . . . . . . . . . . . . . . . . . . . . . . . . . . . . 55Item 9. Changes in and Disagreements with Accountants on Accounting and Financial Disclosure . . . 86Item 9A. Controls and Procedures . . . . . . . . . . . . . . . . . . . . . . . . . . . . . . . . . . . . . . . . . . . . . . . . . . . . . . . . . . 86Item 9B. Other Information . . . . . . . . . . . . . . . . . . . . . . . . . . . . . . . . . . . . . . . . . . . . . . . . . . . . . . . . . . . . . . . 88
PART III Item 10. Directors, Executive Officers and Corporate Governance . . . . . . . . . . . . . . . . . . . . . . . . . . . . . . . 88Item 11. Executive Compensation . . . . . . . . . . . . . . . . . . . . . . . . . . . . . . . . . . . . . . . . . . . . . . . . . . . . . . . . . 88Item 12. Security Ownership of Certain Beneficial Owners and Management and Related
Stockholder Matters . . . . . . . . . . . . . . . . . . . . . . . . . . . . . . . . . . . . . . . . . . . . . . . . . . . . . . . . . . . . . 88Item 13. Certain Relationships and Related Transactions . . . . . . . . . . . . . . . . . . . . . . . . . . . . . . . . . . . . . . . 88Item 14. Principal Accountant Fees and Services . . . . . . . . . . . . . . . . . . . . . . . . . . . . . . . . . . . . . . . . . . . . . 88
PART IV Item 15. Exhibits and Financial Statement Schedules . . . . . . . . . . . . . . . . . . . . . . . . . . . . . . . . . . . . . . . . . . 88Signatures . . . . . . . . . . . . . . . . . . . . . . . . . . . . . . . . . . . . . . . . . . . . . . . . . . . . . . . . . . . . . . . . . . . . . . . . . . . . . . . . 94

3
PART I
Unless otherwise indicated in this Report, “SkyWest,” “we,” “us,” “our” and similar terms refer to SkyWest, Inc. and “SkyWest Airlines” refers to our wholly-owned subsidiary, SkyWest Airlines, Inc.
Effective December 31, 2011, our subsidiary, ExpressJet Airlines, Inc. was merged into our subsidiary, Atlantic Southeast Airlines, Inc., with the surviving corporation named ExpressJet Airlines, Inc. (the “ExpressJet Combination”). In this Report, “Atlantic Southeast” refers to Atlantic Southeast Airlines, Inc. for periods prior to the ExpressJet Combination, “ExpressJet Delaware” refers to ExpressJet Airlines, Inc., a Delaware corporation, for periods prior to the ExpressJet Combination, and “ExpressJet” refers to ExpressJet Airlines, Inc., the Utah corporation resulting from the ExpressJet Combination, for periods subsequent to the ExpressJet Combination.
Cautionary Statement Concerning Forward-Looking Statements
Certain of the statements contained in this Report should be considered “forward-looking statements” within the meaning of the Private Securities Litigation Reform Act of 1995. These forward-looking statements may be identified by words such as “may,” “will,” “expect,” “intend,” “anticipate,” “believe,” “estimate,” “plan,” “project,” “could,” “should,” “hope,” “likely,” and “continue” and similar terms used in connection with statements regarding our outlook, anticipated operations, the revenue environment, our contractual relationships, and our anticipated financial performance. These statements include, but are not limited to, statements about our future growth and development plans, including our future financial and operating results, our plans for SkyWest Airlines and ExpressJet, our objectives, expectations and intentions and other statements that are not historical facts. Readers should keep in mind that all forward-looking statements are based on our existing beliefs about present and future events outside of our control and on assumptions that may prove to be incorrect. If one or more risks identified in this Report materializes, or any other underlying assumption proves incorrect, our actual results will vary, and may vary materially, from those anticipated, estimated, projected, or intended. These risks and uncertainties include, but are not limited to, those described below in Item 1A. Risk Factors.
There may be other factors that may affect matters discussed in forward-looking statements set forth in this Report, which factors may also cause actual results to differ materially from those discussed. We assume no obligation to publicly update any forward-looking statement to reflect actual results, changes in assumptions or changes in other factors affecting these statements other than as required by applicable law.
ITEM 1. BUSINESS
General
Through SkyWest Airlines and ExpressJet, we offer scheduled passenger service with approximately 3,400 daily departures to destinations in the United States, Canada, Mexico and the Caribbean. Substantially all of our flights are operated as Delta Connection, United Express, American Eagle or Alaska under code-share arrangements with Delta Air Lines, Inc. (“Delta”), United Air Lines, Inc. (“United”), American Airlines, Inc. (“American”) or Alaska Airlines, Inc. (“Alaska”), respectively. SkyWest Airlines and ExpressJet generally provide regional flying to our partners under long-term, fixed-fee code-share agreements. Among other features of our fixed-fee agreements, our major airline partners generally reimburse us for specified direct operating expenses (including fuel expense, which is passed through to our partners), and pay us a fee for operating the aircraft.
On December 31, 2011, Atlantic Southeast and ExpressJet Delaware completed the ExpressJet Combination. Since November 17, 2011, the operations formerly conducted by Atlantic Southeast and ExpressJet Delaware have been conducted under a single operating certificate issued by the U.S. Federal Aviation Administration (the “FAA”).
SkyWest Airlines and ExpressJet have developed industry-leading reputations for providing quality regional airline service during their long operating histories. SkyWest Airlines has been flying since 1972 and ExpressJet (and its predecessors) since 1979. As of December 31, 2015, we had a combined fleet of 702 aircraft consisting of the following:

4
CRJ200 CRJ700 CRJ900 ERJ135 ERJ145 E175 EMB120 Total United . . . . . . . . . . . . . . . . . . . . . . . . . . . . . . . . . 83 70 — 5 166 40 — 364Delta . . . . . . . . . . . . . . . . . . . . . . . . . . . . . . . . . . 111 60 64 — — — — 235American . . . . . . . . . . . . . . . . . . . . . . . . . . . . . . 31 — — — 16 — — 47Alaska . . . . . . . . . . . . . . . . . . . . . . . . . . . . . . . . . — 9 — — — 5 — 14Aircraft in scheduled service . . . . . . . . . . . . . . 225 139 64 5 182 45 — 660 Subleased to an un-affiliated entity . . . . . . 2 — — — — — — 2 Other* . . . . . . . . . . . . . . . . . . . . . . . . . . . . . 10 — — 4 — — 26 40Total . . . . . . . . . . . . . . . . . . . . . . . . . . . . . . . . . . 237 139 64 9 182 45 26 702
*Other aircraft consisted of leased aircraft removed from service that were in the process of being returned to the lessor and owned aircraft removed from service that were for sale.
As of December 31, 2015, our fleet scheduled for service consisted of aircraft manufactured by Bombardier Aerospace (“Bombardier”) and Embraer S.A. (“Embraer”) summarized as follows:
Manufacturer Aircraft Type Seat Configuration Bombardier . . CRJ900s 76 Bombardier . . CRJ700s 66-70 Bombardier . . CRJ200s 50 Embraer . . . . . E175s 76 Embraer . . . . . ERJ145s 50 Embraer . . . . . ERJ135s 37
We ceased operation of the 30-seat Embraer Brasilia EMB- 120 turboprop (the “EMB120”) during the fiscal
year ended December 31, 2015.
We were incorporated in Utah in 1972. Our principal executive offices are located at 444 South River Road, St. George, Utah 84790, and our primary telephone number is (435) 634-3000. We maintain an internet website at inc.skywest.com, which provides a link to our annual, quarterly and current reports filed with the Securities and Exchange Commission (“SEC”). In addition, we provide electronic or paper copies of our SEC filings free of charge upon request.
Our Operating Platforms
SkyWest Airlines
SkyWest Airlines provides regional jet service to airports primarily located in the Midwestern and Western United States, as well as Mexico and Canada. SkyWest Airlines offered approximately 1,700 daily scheduled departures as of December 31, 2015, of which approximately 920 were United Express flights, 560 were Delta Connection flights, 170 were American Eagle flights and 50 were Alaska-coded flights. SkyWest Airlines’ operations are conducted principally from airports located in Chicago (O’Hare), Denver, Los Angeles, Houston, Minneapolis, Portland, Seattle, Phoenix, San Francisco and Salt Lake City. As of December 31, 2015, SkyWest Airlines operated a fleet of 348 aircraft consisting of the following:
CRJ200 CRJ700 CRJ900 E175 Total United . . . . . . . . . . . . . . . . . . . . . . . . . . . . . . . . . . . . 83 70 — 40 193 Delta . . . . . . . . . . . . . . . . . . . . . . . . . . . . . . . . . . . . . 69 19 36 — 124 American . . . . . . . . . . . . . . . . . . . . . . . . . . . . . . . . . 17 — — — 17 Alaska . . . . . . . . . . . . . . . . . . . . . . . . . . . . . . . . . . . . — 9 — 5 14 Total . . . . . . . . . . . . . . . . . . . . . . . . . . . . . . . . . . . . . 169 98 36 45 348

5
SkyWest Airlines conducts its code-share operations with its major airline partners pursuant to the following agreements:
Major airline partner Agreement United . . . . . . . . . . .
“SkyWest Airlines United Express Agreements” and “SkyWest Airlines United Express Pro-rateAgreement”
Delta . . . . . . . . . . . .
“SkyWest Airlines Delta Connection Agreement” and “SkyWest Airlines Delta Pro-rate Agreement”
American . . . . . . . .
“SkyWest Airlines American Agreement” and “SkyWest Airlines American Pro-rate Agreement”
Alaska . . . . . . . . . . . “SkyWest Airlines Alaska Agreement”
A summary of the terms for each SkyWest Airlines code-share agreement with the respective major partner is provided under the heading “Code Share Agreements” below on page 6.
ExpressJet
ExpressJet provides regional jet service principally in the Eastern United States, primarily from airports located in Atlanta, Cleveland, Chicago (O’Hare), Houston, Detroit, Memphis, Newark and Minneapolis, as well as Mexico and Canada. ExpressJet offered approximately 1,658 daily scheduled departures as of December 31, 2015, of which approximately 926 were Delta Connection flights, 586 were United Express flights and 146 were American Eagle flights. As of December 31, 2015, ExpressJet operated a fleet of 312 aircraft consisting of the following:
CRJ200 ERJ145 ERJ135 CRJ700 CRJ900 Total United . . . . . . . . . . . . . . . . . . . . . . . . . . . . . . . . . — 166 5 — — 171Delta . . . . . . . . . . . . . . . . . . . . . . . . . . . . . . . . . . 42 — — 41 28 111American . . . . . . . . . . . . . . . . . . . . . . . . . . . . . . 14 16 — — — 30Total . . . . . . . . . . . . . . . . . . . . . . . . . . . . . . . . . . 56 182 5 41 28 312
ExpressJet conducts its code-share operations with its major airline partners pursuant to the following agreements:
Major airline partner Agreement United (ERJ aircraft types) “ExpressJet United ERJ Agreement” United (CRJ aircraft types) “ExpressJet United CRJ Agreement” Delta . . . . . . . . . . . . . . . . . . “ExpressJet Delta Connection Agreement” American . . . . . . . . . . . . . . “ExpressJet American Agreement” and “ExpressJet American Pro-rate Agreement”
A summary of the terms for each ExpressJet code-share agreement with the respective major partner is provided under the heading “Code Share Agreements” below on page 6.
Competition and Economic Conditions
The airline industry is highly competitive. SkyWest Airlines and ExpressJet compete principally with other regional airlines. The combined operations of SkyWest Airlines and ExpressJet extend throughout most major geographic markets in the United States. Our competition includes, therefore, nearly every other domestic regional airline. The primary competitors of SkyWest Airlines and ExpressJet include Air Wisconsin Airlines Corporation (“Air Wisconsin”); Envoy Air Inc. (“Envoy”), PSA Airlines, Inc. (“PSA”) and Piedmont Airlines (“Piedmont”) (Envoy, PSA and Piedmont are owned by American); Horizon Air Industries, Inc. (“Horizon”) (owned by Alaska Air Group, Inc.); Mesa Air Group, Inc. (“Mesa”); Endeavor, Inc. (“Endeavor”) (owned by Delta); Republic Airways Holdings Inc. (“Republic”); and Trans State Airlines, Inc. (“Trans State”). Major airlines typically award additional code-share flying arrangements to regional airlines based primarily upon the following criteria: ability to fly contracted schedules,

6
availability of labor resources, including pilots, low operating cost, financial resources, geographical infrastructure, overall customer service levels relating to on-time arrival and flight completion percentages and the overall image of the regional airline.
The principal competitive factors for regional airline code-share arrangements include labor resources, code-share agreement terms, reliable flight operations, operating cost structure, certification to operate certain aircraft types, geographical infrastructure and markets and routes served.
The combined operations of SkyWest Airlines and ExpressJet represent the largest regional airline operations in the United States. However, regional carriers owned by major airlines may have access to greater resources through their parent companies than SkyWest Airlines and ExpressJet.
Generally, the airline industry is highly sensitive to changes in general economic conditions. Economic downturns, combined with competitive pressures, have contributed to a number of reorganizations, bankruptcies, liquidations and business combinations among major and regional carriers. The effect of economic downturns may be somewhat mitigated by the predominantly contract based flying arrangements of SkyWest Airlines and ExpressJet. If, however, any of our code share partners experience a prolonged decline in the number of passengers or are negatively affected by low ticket prices or high fuel prices, they may seek to renegotiate their code share agreements with SkyWest Airlines or ExpressJet, or materially reduce scheduled flights in order to reduce their costs. In addition, adverse weather conditions can impact our ability to complete scheduled flights and have a negative impact on our operations and financial condition.
Industry Overview
Major and Regional Airlines
The airline industry in the United States has traditionally been comprised of several major airlines, including American, Delta and United. The major airlines offer scheduled flights to most major U.S. cities, numerous smaller U.S. cities, and cities throughout the world through a hub and spoke network.
Regional airlines, such as SkyWest Airlines, ExpressJet, Mesa, Air Wisconsin, Endeavor, Trans State and Republic, typically operate smaller aircraft on lower-volume routes than major and low-cost carriers. Several regional airlines, including Envoy, Endeavor, PSA, Piedmont and Horizon, are wholly-owned subsidiaries of major airlines.
Regional airlines generally do not try to establish an independent route system to compete with the major airlines. Rather, regional airlines typically enter into relationships with one or more major airlines, pursuant to which the regional airline agrees to use its smaller, lower-cost aircraft to carry passengers booked and ticketed by the major airline between a hub of the major airline and a smaller outlying city. In exchange for such services, the major airline pays the regional airline either a fixed flight fee, termed “contract” or “fixed-fee” flights, or receives a percentage of applicable passenger ticket revenues, termed “pro-rate” or “revenue-sharing” flights as described in more detail below.
Code-Share Agreements
Regional airlines generally enter into code-share agreements with major airlines, pursuant to which the regional airline is authorized to use the major airline’s two-letter flight designator codes to identify the regional airline’s flights and fares in the central reservation systems, to paint its aircraft with the colors and/or logos of its code-share partner and to market and advertise its status as a carrier for the code-share partner. Code-share agreements also generally obligate the major airline to provide services such as reservations, ticketing, ground support and gate access to the regional airline, and the major partners often coordinate marketing, advertising and other promotional efforts. In exchange, the regional airline provides a designated number of low-capacity (usually between 50 and 76 seats) flights between larger airports served by the major airline and surrounding cities, usually in lower-volume markets. The financial arrangements between the regional airlines and their code-share partners usually involve either fixed-fee arrangements or revenue-sharing arrangements as explained below:
• Fixed-Fee Arrangements. Under a fixed-fee arrangement (referenced in this report as a “fixed-fee arrangement,” “contract flying” or a “capacity purchase agreement”), the major airline generally pays the regional airline a fixed-fee for each departure, flight or block hours incurred, and an amount per aircraft in

7
service each month with additional incentives based on completion of flights, on- time performance and other operating metrics. In addition, the major and regional airline often enter into an arrangement pursuant to which the major airline bears the risk of changes in the price of fuel and other such costs that are passed through to the major airline partner. Regional airlines benefit from a fixed-fee arrangement because they are sheltered from some of the elements that cause volatility in airline financial performance, including variations in ticket prices, number of passengers and fuel prices. However, regional airlines in fixed-fee arrangements generally do not benefit from positive trends in ticket prices (including ancillary revenue programs), the number of passengers enplaned or fuel prices because the major airlines retain passenger fare volatility risk and fuel costs associated with the regional airline flight.
• Revenue-Sharing Arrangements. Under a revenue-sharing arrangement (referenced in this report as a “revenue-sharing” arrangement or “pro-rate” arrangement), the major airline and regional airline negotiate a passenger fare proration formula, pursuant to which the regional airline receives a percentage of the ticket revenues for those passengers traveling for one portion of their trip on the regional airline and the other portion of their trip on the major airline. Substantially all costs associated with the regional airline flight are borne by the regional airline. In such a revenue-sharing arrangement, the regional airline may realize increased profits as ticket prices and passenger loads increase or fuel prices decrease and, correspondingly, the regional airline realizes decreased profits as ticket prices and passenger loads decrease or fuel prices increase.
SkyWest Airlines has code-share agreements with United, Delta, American and Alaska. ExpressJet has code-share agreements with United, Delta and American.
During the year ended December 31, 2015, approximately 86.3% of our passenger revenues related to fixed-fee contract flights, where Delta, United, Alaska and American controlled scheduling, ticketing, pricing and seat inventories. The remainder of our passenger revenues during the year ended December 31, 2015 related to pro-rate flights for Delta, United or American, where we controlled scheduling, pricing and seat inventories, and shared passenger fares with Delta, United or American according to pro-rate formulas. The following summaries of our code-share agreements do not purport to be complete and are qualified in their entirety by reference to the applicable agreement.
Under our fixed-fee arrangements, the major airline partners compensate us for our costs of owning or leasing the aircraft on a monthly basis. The aircraft compensation structure varies by agreement, but is intended to cover either our aircraft principal and interest debt service costs, our aircraft depreciation and interest expense or our aircraft lease expense costs while the aircraft is under contract. Under our ExpressJet United ERJ Agreement and our ExpressJet American ERJ145 Agreement, the major partner provides the aircraft to us for a nominal amount. The number of aircraft under our fixed-fee arrangements and our pro-rate arrangements as of December 31, 2015 is reflected in the summary below.

8
Delta Connection Agreements
Number of Pass through costs aircraft under Term / Termination or costs paid directly Agreement agreements Dates by major partner SkyWest Airlines • CRJ 200 - 48
• The contract is scheduled to expire on an individual aircraft basis commencing in 2016
• Fuel
Delta Connection • CRJ 700 - 19 • The final aircraft is scheduled to expire in 2022 • Engine Maintenance Agreement (fixed-fee arrangement) • CRJ 900 - 36 • The average remaining term of the aircraft under contract is 3.8 years • Landing fees • Upon expiration, aircraft may be renewed or extended • Station Rents, Deice • Insurance ExpressJet Delta • CRJ 200 - 42
• The contract is scheduled to expire on an individual aircraft basis commencing in 2016
• Fuel
Connection • CRJ 700 - 41 • The final aircraft is scheduled to expire in 2022 • Engine Maintenance Agreement (fixed-fee arrangement) • CRJ 900 - 28 • The average remaining term of the aircraft under contract is 3.7 years • Landing fees • Upon expiration, aircraft may be renewed or extended • Station Rents, Deice • Insurance SkyWest Airlines • CRJ 200 - 21 • Terminable with 30 days' notice • None Pro-rate Agreement (revenue-sharing agreement)
United Express Agreements
Pass through costs Number of or costs paid aircraft under Term / Termination directly by major Agreement agreements Dates partner SkyWest Airlines • CRJ 200 - 57
• The contract is scheduled to expire on an individual aircraft basis commencing in 2016
• Fuel
United Express • CRJ 700 - 70 • The final aircraft is scheduled to expire in 2027 • Landing fees Agreements (fixed-fee arrangement) • E175 - 40
• The average remaining term of the aircraft under contract is 4.3 years
• Station Rents, Deice
• Upon expiration, aircraft may be renewed or extended • Insurance ExpressJet United ERJ • ERJ 135 - 5
• The contract is scheduled to expire on an individual aircraft basis commencing in 2016
• Fuel
Agreement (fixed-fee arrangement) • ERJ 145 - 166 • The final aircraft is scheduled to expire in 2017 • Engine Maintenance
• The average remaining term of the aircraft under contract is 1.9 years • Landing fees
• Upon expiration, aircraft may be renewed or extended • Station Rents, Deice • Insurance SkyWest Airlines United • CRJ 200 - 26 • Terminable with 120 days' notice • None Express Pro-rate Agreement (revenue-sharing arrangement)
Alaska Capacity Purchase Agreement
Pass through costs Number of or costs paid aircraft under Term / Termination directly by major Agreement agreements Dates partner SkyWest Airlines • CRJ 700 - 9
• The contract is scheduled to expire on an individual aircraft basis commencing in 2016
• Fuel
Alaska Agreement • E175 - 5 • The final aircraft is scheduled to expire in 2028 • Landing fees (fixed-fee arrangement) • Upon expiration, aircraft may be renewed or extended • Station Rents, Deice • Insurance

9
American Agreements
Pass through costs Number of or costs paid aircraft under Term / Termination directly by major Agreement agreements Dates partner SkyWest Airlines • CRJ 200 - 12 • Scheduled to expire in 2016 • Fuel American Agreement • Upon expiration, aircraft may be renewed or extended • Landing fees (fixed-fee agreement) • Station Rents, Deice • Insurance SkyWest Airlines • CRJ 200 - 5 • Terminable with 120 days' notice • None American Pro-rate Agreement (revenue- sharing agreement) ExpressJet American • CRJ 200 - 11 • Scheduled to expire in 2017 • Fuel Agreement (fixed-fee • ERJ 145 - 16 • Upon expiration, aircraft may be renewed or extended • Landing fees agreement) • Station Rents, Deice • Insurance ExpressJet American Pro-rate • CRJ 200 - 3 • Terminable with 120 days' notice • None Agreement (revenue-sharing agreement)
As of December 31, 2015, we anticipate placing an additional 25 E175 aircraft with United, ten additional E175 aircraft with Alaska and 19 E175 aircraft with Delta. The delivery dates for the new aircraft are expected to take place from January 2016 to June 2017.
SkyWest Airlines and ExpressJet Delta Connection Agreements
SkyWest Airlines and ExpressJet are each parties to a Delta Connection Agreement, pursuant to which SkyWest Airlines and ExpressJet provide contract flight services for Delta. The SkyWest Airlines and ExpressJet Delta Connection Agreements contain multi-year rate reset provisions that became operative in 2010 and reset each fifth year thereafter. Delta additionally has the right to require that certain contractual rates under those agreements shall not exceed the second lowest of all carriers within the Delta Connection program. SkyWest Airlines and ExpressJet have agreed with Delta on contractual rates that are effective through December 31, 2015. A rate reset period became effective on January 1, 2016.
The SkyWest Airlines Delta Connection Agreement is scheduled to terminate on December 31, 2022 for the CRJ aircraft. The SkyWest Airlines Delta Connection Agreement is subject to early termination in various circumstances, including:
• if SkyWest Airlines or Delta commits a material breach of the SkyWest Airlines Delta Connection Agreement, subject to 30-day notice and cure rights;
• if SkyWest Airlines fails to conduct all flight operations and maintain all aircraft under the SkyWest Airlines Delta Connection Agreement in compliance in all material respects with applicable government regulations;
• if SkyWest Airlines fails to satisfy certain performance and safety requirements;
• if, under certain circumstances, Delta has a right to terminate the ExpressJet Delta Connection Agreement;
• if the other party files for bankruptcy, reorganization or similar action (subject to limitations imposed by the U.S. Bankruptcy Code) or if either party makes an assignment for the benefit of creditors; or
• if SkyWest Airlines fails to maintain competitive base rate costs (provided, however, that SkyWest Airlines has the right to adjust its rates prior to any such termination).
In October 2015, SkyWest Airlines reached an agreement with Delta to place 19 new E175 aircraft into service pursuant to the SkyWest Airlines Delta Connection Agreement. Under the agreement, we anticipate that delivery of the

10
E175 aircraft to be flown for Delta will begin in August 2016, with all 19 aircraft being delivered by mid-2017. The E175 agreement has a nine-year term for each of the aircraft subject to the agreement.
The ExpressJet Delta Connection Agreement is scheduled to terminate on December 31, 2022, subject to certain Delta extension rights. The ExpressJet Delta Connection Agreement is subject to early termination in various circumstances including:
• if ExpressJet or Delta commits a material breach of the ExpressJet Delta Connection Agreement, subject to 30-day notice and cure rights;
• if ExpressJet fails to conduct all flight operations and maintain all aircraft under the ExpressJet Delta Connection Agreement in compliance in all material respects with applicable government regulations;
• if ExpressJet fails to satisfy certain performance and safety requirements;
• if, under certain circumstances, Delta has a right to terminate the SkyWest Airlines Delta Connection Agreement;
• if the other party files for bankruptcy, reorganization or similar action (subject to limitations imposed by the U.S. Bankruptcy Code) or if either party makes an assignment for the benefit of creditors; or
• if ExpressJet fails to maintain competitive base rate costs (provided, however, that ExpressJet has the right to adjust its rates prior to any such termination).
SkyWest Airlines United Express Agreements
SkyWest Airlines and United are parties to two United Express agreements: a United Express agreement to operate certain CRJ200s and CRJ700s, and a United Express agreement to operate E175 aircraft (collectively, the “SkyWest Airlines United ExpressJet Agreements”). Under the E175 agreement, SkyWest Airlines began service in May 2014 and 40 E175 aircraft had been delivered as of December 31, 2015. We anticipate deliveries of the remaining 25 E175 aircraft will continue through 2017. The E175 agreement has a 12-year term for each of the aircraft subject to the agreement.
The SkyWest Airlines United Express Agreements have a latest scheduled termination date in 2027. The SkyWest Airlines United Express Agreements are subject to early termination in various circumstances including:
• if SkyWest Airlines or United fails to fulfill an obligation under the SkyWest Airlines United Express Agreements for a period of 60 days after written notice to cure;
• if SkyWest Airlines’ operations fall below certain performance levels for a period of three consecutive months;
• subject to limitations imposed by the U.S. Bankruptcy Code, if the other party becomes insolvent, fails to pay its debts when due, takes action leading to its cessation as a going concern, makes an assignment of substantially all of its assets, or ceases or suspends operations; or
• if bankruptcy proceedings are commenced against the other party (subject to limitations imposed by the U.S. Bankruptcy Code) and certain specified conditions are not satisfied.
ExpressJet United ERJ Agreement
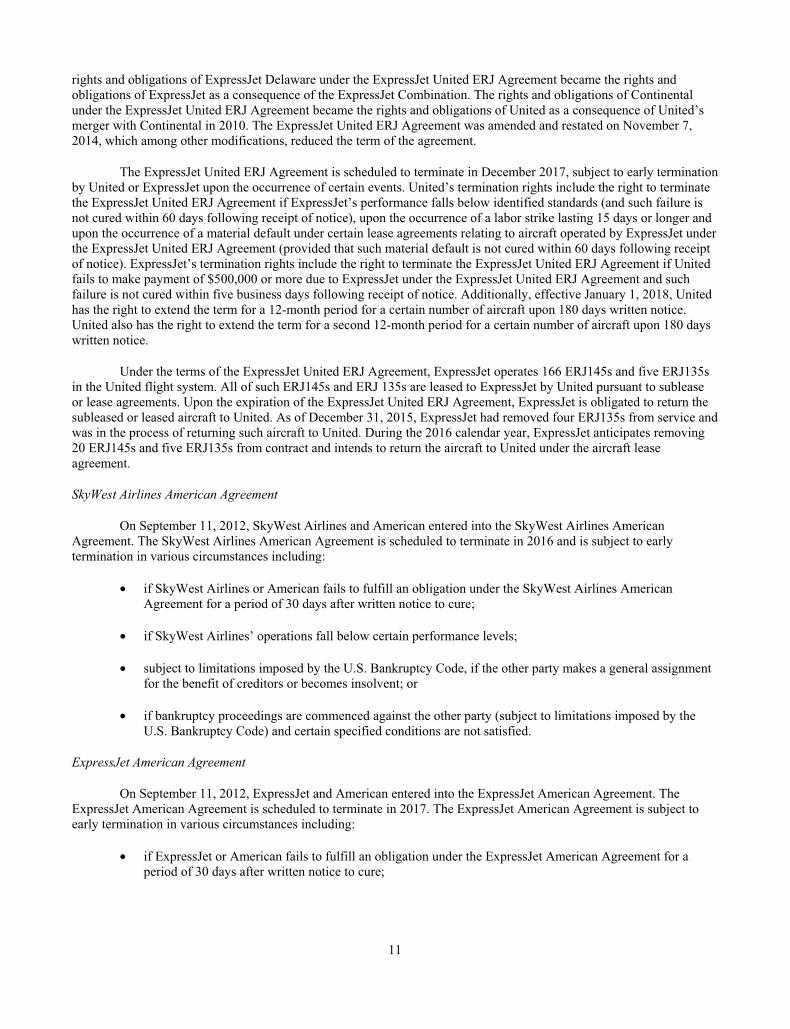
Effective November 12, 2010, ExpressJet Delaware and Continental entered into the ExpressJet United ERJ Agreement, whereby ExpressJet Delaware agreed to provide regional airline service in the Continental flight system. The
11
rights and obligations of ExpressJet Delaware under the ExpressJet United ERJ Agreement became the rights and obligations of ExpressJet as a consequence of the ExpressJet Combination. The rights and obligations of Continental under the ExpressJet United ERJ Agreement became the rights and obligations of United as a consequence of United’s merger with Continental in 2010. The ExpressJet United ERJ Agreement was amended and restated on November 7, 2014, which among other modifications, reduced the term of the agreement.
The ExpressJet United ERJ Agreement is scheduled to terminate in December 2017, subject to early termination by United or ExpressJet upon the occurrence of certain events. United’s termination rights include the right to terminate the ExpressJet United ERJ Agreement if ExpressJet’s performance falls below identified standards (and such failure is not cured within 60 days following receipt of notice), upon the occurrence of a labor strike lasting 15 days or longer and upon the occurrence of a material default under certain lease agreements relating to aircraft operated by ExpressJet under the ExpressJet United ERJ Agreement (provided that such material default is not cured within 60 days following receipt of notice). ExpressJet’s termination rights include the right to terminate the ExpressJet United ERJ Agreement if United fails to make payment of $500,000 or more due to ExpressJet under the ExpressJet United ERJ Agreement and such failure is not cured within five business days following receipt of notice. Additionally, effective January 1, 2018, United has the right to extend the term for a 12-month period for a certain number of aircraft upon 180 days written notice. United also has the right to extend the term for a second 12-month period for a certain number of aircraft upon 180 days written notice.
Under the terms of the ExpressJet United ERJ Agreement, ExpressJet operates 166 ERJ145s and five ERJ135s in the United flight system. All of such ERJ145s and ERJ 135s are leased to ExpressJet by United pursuant to sublease or lease agreements. Upon the expiration of the ExpressJet United ERJ Agreement, ExpressJet is obligated to return the subleased or leased aircraft to United. As of December 31, 2015, ExpressJet had removed four ERJ135s from service and was in the process of returning such aircraft to United. During the 2016 calendar year, ExpressJet anticipates removing 20 ERJ145s and five ERJ135s from contract and intends to return the aircraft to United under the aircraft lease agreement.
SkyWest Airlines American Agreement
On September 11, 2012, SkyWest Airlines and American entered into the SkyWest Airlines American Agreement. The SkyWest Airlines American Agreement is scheduled to terminate in 2016 and is subject to early termination in various circumstances including:
• if SkyWest Airlines or American fails to fulfill an obligation under the SkyWest Airlines American Agreement for a period of 30 days after written notice to cure;
• if SkyWest Airlines’ operations fall below certain performance levels;
• subject to limitations imposed by the U.S. Bankruptcy Code, if the other party makes a general assignment for the benefit of creditors or becomes insolvent; or
• if bankruptcy proceedings are commenced against the other party (subject to limitations imposed by the U.S. Bankruptcy Code) and certain specified conditions are not satisfied.
ExpressJet American Agreement
On September 11, 2012, ExpressJet and American entered into the ExpressJet American Agreement. The ExpressJet American Agreement is scheduled to terminate in 2017. The ExpressJet American Agreement is subject to early termination in various circumstances including:
• if ExpressJet or American fails to fulfill an obligation under the ExpressJet American Agreement for a period of 30 days after written notice to cure;

12
• if ExpressJet’s operations fall below certain performance levels;
• subject to limitations imposed by the U.S. Bankruptcy Code, if the other party makes a general assignment for the benefit of creditors or becomes insolvent; or
• if bankruptcy proceedings are commenced against the other party (subject to limitations imposed by the U.S. Bankruptcy Code) and certain specified conditions are not satisfied.
SkyWest Airlines Alaska Agreement
On April 13, 2011, SkyWest Airlines and Alaska entered into the SkyWest Airlines Alaska Capacity Purchase Agreement. The SkyWest Airlines Alaska Capacity Purchase Agreement is scheduled to terminate in 2018.
SkyWest and Alaska amended the SkyWest Airlines Alaska Capacity Purchase Agreement to establish a 12-year fixed-fee arrangement for SkyWest to operate 15 new E175 aircraft for Alaska. Under the amended agreement, SkyWest Airlines began service in July 2015 and five E175 aircraft had been delivered as of December 31, 2015. We anticipate deliveries of the remaining E175 aircraft will continue through mid-2017. The E175 agreement has a 12-year term for each of the aircraft subject to the agreement. The SkyWest Airlines Alaska Capacity Purchase Agreement is subject to early termination in various circumstances including:
• if SkyWest Airlines or Alaska fails to fulfill an obligation under the SkyWest Airlines Alaska Capacity Purchase Agreement for a period of 30 days after written notice to cure;
• if SkyWest Airlines’ operational performance falls below certain performance levels;
• subject to limitations imposed by the U.S. Bankruptcy Code, if the other party makes a general assignment for the benefit of creditors or becomes insolvent; or
• if bankruptcy proceedings are commenced against the other party (subject to limitations imposed by the U.S. Bankruptcy Code) and certain specified conditions are not satisfied.
Segment Financial Information
See Management’s Discussion and Analysis of Financial Condition and Results of Operations, set forth in Item 7 of this Report, and Note 2 to our Consolidated Financial Statements for the fiscal year ended December 31, 2015, included in Item 8 of this Report, for financial information regarding our business segments.
Training and Aircraft Maintenance
SkyWest Airlines and ExpressJet provide substantially all training to their crew members and maintenance personnel at their respective training facilities. SkyWest Airlines and ExpressJet employees perform routine airframe and engine maintenance along with periodic inspections of equipment at their respective maintenance facilities. SkyWest Airlines and ExpressJet also use third-party vendors for certain airframe and engine maintenance work.
Fuel
Our fixed-fee agreements with Delta, United, American and Alaska provide that fuel costs we incur under those agreements are to be reimbursed, thereby reducing our exposure to fuel price fluctuations. Under our pro-rate agreements we are responsible for the costs we incur under those agreements and are exposed to fuel price fluctuations which we buy directly from our fuel suppliers. During the year ended December 31, 2015, United and Delta purchased the majority of the fuel for our aircraft flying under their respective fixed-fee agreements under contract directly from their fuel vendors. Historically, we have not experienced problems with the availability of fuel, and believe we will be able to obtain fuel in quantities sufficient to meet our existing and anticipated future requirements at competitive prices. Standard industry

13
contracts generally do not provide protection against fuel price increases, nor do they ensure availability of supply. A substantial increase in the price of jet fuel, to the extent our fuel costs are not reimbursed, or our lack of adequate fuel supplies in the future, could have a material adverse effect on our business, financial condition, results of operations or liquidity.
Employee Matters
Railway Labor Act
Our relations with labor unions in the U.S. are governed by the Railway Labor Act (the “RLA”). Under the RLA, a labor union seeking to represent an unrepresented craft or class of employees is required to file with the National Mediation Board (the “NMB”) an application alleging a representation dispute, along with authorization cards signed by at least 35% of the employees in that craft or class. The NMB then investigates the dispute and, if it finds the labor union has obtained a sufficient number of authorization cards, conducts an election to determine whether to certify the labor union as the collective bargaining representative of that craft or class. Under the NMB’s usual rules, a labor union will be certified as the representative of the employees in a craft or class only if more than 50% of those employees vote for union representation. A certified labor union then enters into negotiations toward a collective bargaining agreement with the employer.
Under the RLA, a collective bargaining agreement between an airline and a labor union does not expire, but instead becomes amendable as of a stated date. Either party may request that the NMB appoint a federal mediator to participate in the negotiations for a new or amended agreement. If no agreement is reached in mediation, the NMB may determine, at any time, that an impasse exists and offer binding arbitration. If either party rejects binding arbitration, a 30-day “cooling off” period begins. At the end of this 30-day period, the parties may engage in “self help,” unless the U.S. President appoints a Presidential Emergency Board (“PEB”) to investigate and report on the dispute. The appointment of a PEB maintains the “status quo” for an additional 60 days. If the parties do not reach agreement during this period, the parties may then engage in “self help.” “Self help” includes, among other things, a strike by the union or the imposition of proposed changes to the collective bargaining agreement by the airline. The U.S. Congress and the President have the authority to prevent “self help” by enacting legislation that, among other things, imposes a settlement on the parties.
Collective Bargaining
As of December 31, 2015, we had approximately 18,300 full-time equivalent employees. Approximately 38.0% of these employees were represented by unions, including the employee groups listed in the table below. Notwithstanding the completion of the ExpressJet Combination, ExpressJet’s employee groups primarily continue to be represented by those unions who provided representation prior to the ExpressJet Combination. Accordingly, the following table refers to ExpressJet’s employee groups based upon their union affiliations prior to the ExpressJet Combination.

14
Approximate
Number of Active Employees Status of Employee Group Represented Representatives Agreement
Atlantic Southeast Pilots . . . . . . . . . . 1,491 Air Line Pilots Association International Amendable February 2018
Atlantic Southeast Flight Attendants 1,031 International Association of Machinists and Aerospace Workers Amendable
Atlantic Southeast Flight Controllers 36 Transport Workers Union of America Amendable Atlantic Southeast Mechanics . . . . . . 364 International Brotherhood of Teamsters Amendable Atlantic Southeast Stock Clerks . . . . 73 International Brotherhood of Teamsters Amendable
ExpressJet Delaware Pilots . . . . . . . . 2,107 Air Line Pilots Association International Amendable February 2018
ExpressJet Delaware Flight Attendants . . . . . . . . . . . . . . . . . . . . 993
International Association of Machinists and Aerospace Workers Amendable
ExpressJet Delaware Mechanics . . . . 711 International Brotherhood of Teamsters Amendable ExpressJet Delaware Dispatchers . . . 53 Transport Workers Union of America Amendable ExpressJet Delaware Stock Clerks . . 96 International Brotherhood of Teamsters Amendable
In February 2016, the Atlantic Southwest Pilots and the ExpressJet Delaware Pilots ratified a two-year contract extension to their respective labor agreements. Delays or expenses or other challenges associated with executing an acceptable agreement with each labor workgroup with an amendable contract could impact our financial performance.
As of December 31, 2015, SkyWest and SkyWest Airlines collectively employed 10,411 full-time equivalent employees, consisting of 3,676 pilots, 2,703 flight attendants, 1,742 customer service personnel, 872 mechanics, 729 other maintenance personnel, 134 dispatchers and 555 operational support and administrative personnel. None of these employees are currently represented by a union. Collective bargaining group organization efforts among SkyWest Airlines’ employees do, however, occur from time to time and we anticipate that such efforts will continue in the future. If unionization efforts are successful, we may be subjected to risks of work interruption or stoppage and/or incur additional expenses associated with increased union representation of our employees. Neither SkyWest nor SkyWest Airlines has ever experienced a work stoppage due to a strike or other labor dispute, and we consider SkyWest Airlines’ relationships with its employees to be good.
Government Regulation
All interstate air carriers, including SkyWest Airlines and ExpressJet, are subject to regulation by the U.S. Department of Transportation (the “DOT”), the FAA and other governmental agencies. Regulations promulgated by the DOT primarily relate to economic aspects of air service. The FAA requires operating, air worthiness and other certificates; approval of personnel who may engage in flight, maintenance or operating activities; record-keeping procedures in accordance with FAA requirements; and FAA approval of flight training and retraining programs. Generally, governmental agencies enforce their regulations through, among other methods, certifications, which are necessary for the continued operations of SkyWest Airlines and ExpressJet, and proceedings, which can result in civil or criminal penalties or revocation of operating authority. The FAA can also issue maintenance directives and other mandatory orders relating to, among other things, grounding of aircraft, inspection of aircraft, installation of new safety-related items and the mandatory removal and replacement of aircraft parts.
We believe SkyWest Airlines and ExpressJet are in compliance in all material respects with FAA regulations and hold all operating and airworthiness certificates and licenses which are necessary to conduct their respective operations. We incur substantial costs in maintaining current certifications and otherwise complying with the laws, rules and regulations to which SkyWest Airlines and ExpressJet are subject. SkyWest Airlines’ and ExpressJet’s flight

15
operations, maintenance programs, record keeping and training programs are conducted under FAA approved procedures. All air carriers operating in the United States of America are required to comply with federal laws and regulations pertaining to noise abatement and engine emissions. All such air carriers are also subject to certain provisions of the Federal Communications Act of 1934, as amended, because of their extensive use of radio and other communication facilities. SkyWest Airlines and ExpressJet are also subject to certain federal and state laws relating to protection of the environment, labor relations and equal employment opportunity. We believe SkyWest Airlines and ExpressJet are in compliance in all material respects with these laws and regulations.
Environmental Matters
SkyWest, SkyWest Airlines and ExpressJet are subject to various federal, state, local and foreign laws and regulations relating to environmental protection matters. These laws and regulations govern such matters as environmental reporting, storage and disposal of materials and chemicals and aircraft noise. We are, and expect in the future to be, involved in various environmental matters and conditions at, or related to, our properties. We are not currently subject to any environmental cleanup orders or actions imposed by regulatory authorities. We are not aware of any active material environmental investigations related to our assets or properties.
Safety and Security
We are committed to the safety and security of our passengers and employees. Since the September 11, 2001 terrorist attacks, SkyWest Airlines and ExpressJet have taken many steps, both voluntarily and as mandated by governmental authorities, to increase the safety and security of their operations. Some of the safety and security measures we have taken with our code-share partners include: aircraft security and surveillance, positive bag matching procedures, enhanced passenger and baggage screening and search procedures, and securing of cockpit doors. We are committed to complying with future safety and security requirements.
Insurance
SkyWest, SkyWest Airlines and ExpressJet maintain insurance policies we believe are of types customary in the industry and in amounts we believe are adequate to protect against material loss. These policies principally provide coverage for public liability, passenger liability, baggage and cargo liability, property damage, including coverage for loss or damage to our flight equipment, and workers’ compensation insurance. We cannot assure, however, that the amount of insurance we carry will be sufficient to protect us from material loss.
Seasonality
Our results of operations for any interim period are not necessarily indicative of those for the entire year, in part because the airline industry is subject to seasonal fluctuations and changes in general economic conditions. Our operations are somewhat favorably affected by pleasure travel on our pro-rate routes, historically contributing to increased travel in the summer months, and are unfavorably affected by decreased business travel during the months from November through January and by inclement weather which can result in cancelled flights, principally during the winter months. Additionally, a significant portion of our fixed-fee arrangements is based on completing flights. We generally experience a significantly higher number of weather cancellations during the winter months, which negatively impacts our revenue during such months.
ITEM 1A. RISK FACTORS
In addition to factors discussed elsewhere in this Report, the following are important risks which could adversely affect our future results. Additional risks and uncertainties not presently known to us or that we currently do not deem material may also impair our business operations. If any of the risks we describe below occur, or if any unforeseen risk develops, our operating results may suffer, our financial condition may deteriorate, the trading price of our common stock may decline and investors could lose all or part of their investment in us.
16
Risks Related to Our Operations
The supply of pilots to the airline industry is limited and may negatively affect our operations and financial condition.
On July 8, 2013, as directed by the U.S. Congress, the FAA issued more stringent pilot qualification and crew member flight training standards, which increase the required training time for new commercial pilots. In recent years, we have also experienced a reduction in pilot applicants with previous military experience. With these changes, the supply of qualified pilot candidates eligible for hiring by the airline industry has been dramatically reduced. Additionally, major airlines may significantly increase the number of pilots hired from regional carriers due to the number of pilots at the major airlines reaching the statutory mandatory retirement age of 65 years. These factors may cause our pilot attrition rates to be higher than our ability to hire and retain replacement pilots. If we are unable to maintain a sufficient number of eligible pilots to operate our scheduled flights, we may need to request a reduced flight schedule with our major airline partners, which may result in operational performance penalties under our flying contracts with those partners and our operations and financial results could be materially and adversely affected.
Additionally, our projected number of available pilots and attrition rates may impact our fleet planning decisions. If actual pilot availability or our actual pilot attrition rates are materially different than our projections, our operations and financial results could be materially and adversely affected. A shortage of qualified pilots to conduct our operations may cause us to underutilize our aircraft and would negatively impact our operations and financial condition.
We have aircraft lease and debt commitments that extend beyond our existing fixed-fee contractual term on certain aircraft.
Under our fixed-fee arrangements with multiple major partners we have a total of 20 CRJ700s with flying contract expirations in 2016. Our underlying lease or debt financing obligations associated with each of these aircraft are scheduled to terminate between 2018 and 2024 on an aircraft-by-aircraft basis. We may not be successful in extending the flying contract term on these aircraft with our major partner at acceptable economic terms. In the event we are unsuccessful in extending the flying contract terms on these aircraft, we intend to pursue alternative uses for the aircraft over the remaining aircraft financing term including, but not limited to, operating the aircraft with another major carrier under a negotiated code-share agreement, subleasing the aircraft to another operator, and/or marketing the debt financed aircraft for sale. Additionally, we may negotiate an early lease return agreement with the aircraft lessor. In the event we are unable to extend the flying contract terms for these aircraft at each respective contract’s expiration, we may incur cash and non-cash early lease termination costs that would negatively impact our operations and financial condition. Additionally, in the event we are unable to extend a flying contract with an existing major airline partner, but reach an agreement to place the aircraft into service with a different major airline partner, we likely will incur inefficiencies and incremental costs, such as changing the aircraft livery, during the transition period, which would negatively impact our financial results.
Increased labor costs, strikes, labor disputes and increased unionization of our workforces may adversely affect our ability to conduct our business and reduce our profitability.
Our business is labor intensive, requiring large numbers of pilots, flight attendants, mechanics and other personnel. Labor costs constitute a significant percentage of our total operating costs. For example, during the year ended December 31, 2015, our salary, wage and benefit costs constituted approximately 42.1% of our total operating costs. Increases in our labor costs could result in a material reduction in our earnings. Any new collective bargaining agreements entered into by other regional carriers with their work forces may also result in higher industry wages and increased pressure on us to increase the wages and benefits of our employees. Future agreements with unionized and non-unionized employees may be on terms that are not as attractive as our current agreements or comparable to agreements entered into by our competitors.
Approximately 38.0% of our workforce is unionized. Strikes or labor disputes with our unionized employees may adversely affect our ability to conduct business. Relations between air carriers and labor unions in the U.S. are governed by the RLA, which provides that a collective bargaining agreement between an airline and a labor union does not expire, but instead becomes amendable as of a stated date. The RLA generally prohibits strikes or other types of

17
self-help action both before and after a collective bargaining agreement becomes amendable, unless and until the collective bargaining processes required by the RLA have been exhausted.
SkyWest Airlines’ employees are not currently represented by any union; however, collective bargaining group organization efforts among those employees occur from time to time. Such efforts will likely continue in the future and may ultimately result in some or all of SkyWest Airlines’ employees being represented by one or more unions. Moreover, one or more unions representing ExpressJet employees may seek a single carrier determination by the National Mediation Board, which could require SkyWest Airlines to recognize such union or unions as the certified bargaining representative of SkyWest Airlines’ employees. One or more unions representing ExpressJet employees may also assert that SkyWest Airlines’ employees should be subject to ExpressJet’s collective bargaining agreements. If SkyWest Airlines’ employees were to unionize or be deemed to be represented by one or more unions, negotiations with unions representing SkyWest Airlines’ employees could divert management attention and disrupt operations, which may result in increased operating expenses and may negatively impact our financial results. Moreover, we cannot predict the outcome of any future negotiations relating to union representation or collective bargaining agreements. Agreements reached in collective bargaining may increase our operating expenses and negatively impact our financial results.
There are long-term risks related to supply and demand of regional aircraft associated with our regional airline services strategy.
Our major airline partners have indicated that their committed supply of regional airline capacity is larger than they desire given current market conditions. Specifically, they have identified a general oversupply of 50-seat regional jets under contractual commitments with regional airlines. Delta in particular has reduced both the number of 50-seat regional jets within its network and the number of regional airlines with which it contracts. There are currently more than 100 50-seat aircraft within the Delta Connection system. In addition to reducing the number of 50-seat jets under contract, major airlines have reduced the utilization of regional aircraft, thereby reducing the revenue paid to regional airlines under capacity purchase agreements (See the risk factor titled “Reduced utilization levels of our aircraft under our code-share agreements would adversely impact our financial results” for additional details). This decrease has had, and may continue to have, a negative impact on our regional airline services revenue and financial results.
The amounts we receive under our code-share agreements may be less than the corresponding costs we incur.
Under our fixed-fee flying contracts with Delta, United, American and Alaska, a portion of our compensation is based upon pre-determined rates typically applied to production statistics (such as departures, block hours, flight hours and number of aircraft in service each month). The primary operating costs intended to be compensated by the pre-determined rates include labor costs, including crew training costs, certain aircraft maintenance expenses, and overhead costs. During the year ended December 31, 2015, approximately 84% of our code-share operating costs were reimbursable at pre-determined rates and 16% of our code-share operating costs were pass-through costs. Additionally, our aircraft maintenance costs may increase annually as our fleet ages at a higher rate than our pre-determined rates allow. If our operating costs for labor, aircraft maintenance and overhead costs exceed the compensation earned from our pre-determined rates under our fixed-fee arrangements, our financial position and operating results will be negatively affected.
The Airline Safety and Pilot Training Improvement Act of 2009 could negatively affect our operations and our financial condition.
The Airline Safety and Pilot Training Improvement Act of 2009 (the “Improvement Act”) became effective in August 2013. The Improvement Act added new certification requirements for entry-level commercial pilots, requires additional emergency training for airline personnel, improves availability of pilot records and mandates stricter rules to minimize pilot fatigue.
The Improvement Act also:
• Requires that all airline pilots obtain an Airline Transport Pilot license, which was previously only required for captains.
• Obligates the FAA to maintain a database of pilot records, including records to be provided by airlines and other sources, so that airlines will have access to more information before they hire pilots.

18
• Requires the FAA to issue new regulations governing the airlines’ obligations to submit pilot records and the requirements for airlines to obtain access for information in the database before the database portion of the Improvement Act becomes effective.
• Directs the FAA to rewrite the rules for how long pilots are allowed to work and how much rest they must have before working.
The Improvement Act (and associated regulations) has increased our compliance and FAA reporting obligations, has had a negative effect on pilot scheduling, work hours and the number of pilots required to be employed for our operations or other aspects of our operations, and may continue to negatively impact our operations and financial condition.
We are highly dependent on Delta and United.
As of December 31, 2015, we had 599 aircraft out of our total 660 aircraft available for scheduled service operating under a fixed-fee arrangement or a revenue-sharing agreement with either Delta or United. If our code-share agreements with Delta or United were terminated, we would be significantly impacted and likely would not have an immediate source of revenue or earnings to offset such loss. A termination of either of these agreements would likely have a material adverse effect on our financial condition, operating revenues and net income unless we are able to enter into satisfactory substitute arrangements for the utilization of the affected aircraft by other code-share partners, or, alternatively, obtain the airport facilities and gates and make the other arrangements necessary to fly as an independent airline. We may not be able to enter into substitute code-share arrangements, and any such arrangements we might secure may not be as favorable to us as our current agreements. Operating our airlines independent from major partners would be a significant departure from our business plan, would likely be very difficult and would likely require significant time and resources, which may not be available to us at that point.
The SkyWest Airlines and ExpressJet Delta Connection Agreements are subject to certain early termination provisions. Delta’s termination rights include cross-termination rights (meaning that a breach by either of SkyWest Airlines or ExpressJet of its Delta Connection Agreement could, under certain circumstances, permit Delta to terminate any or all of the Delta Connection Agreements to which we or either of our operating subsidiaries is a party), the right to terminate each of the agreements upon the occurrence of certain force majeure events (including certain labor-related events) that prevent SkyWest Airlines or ExpressJet from performance for certain periods and the right to terminate each of the agreements if SkyWest Airlines or ExpressJet, as applicable, fails to maintain competitive base rate costs, subject to certain rights of SkyWest Airlines to take corrective action to reimburse Delta for lost revenues. The current terms of the SkyWest Airlines and ExpressJet United Express Agreements are subject to certain early termination provisions and subsequent renewals. United may terminate the SkyWest Airlines and ExpressJet United Express Agreements due to an uncured breach by SkyWest Airlines or ExpressJet of certain operational or performance provisions, including measures and standards related to flight completions, baggage handling and on-time arrivals. The current terms of the United CPA are subject to certain early termination provisions and subsequent renewals. United may terminate the United CPA due to an uncured breach by ExpressJet of certain operational and performance provisions, including measures and standards related to flight completions and on-time arrivals.
We currently use the systems, facilities and services of Delta and United to support a significant portion of our operations, including airport and terminal facilities and operations, information technology support, ticketing and reservations, scheduling, dispatching, fuel purchasing and ground handling services. If Delta or United were to cease to maintain any of these systems, close any of these facilities or no longer provide these services to us, due to termination of one of our code-share agreements, a strike or other labor interruption by Delta or United personnel or for any other reason, we may not be able to obtain alternative systems, facilities or services on terms and conditions as favorable as those we currently receive, or at all. Since our revenues and operating profits are dependent on our level of flight operations, we could then be forced to significantly reduce our operations. Furthermore, upon certain terminations of our code-share agreements, Delta and United could require us to sell or assign to them facilities and assets, including maintenance facilities, we use in connection with the code-share services we provide. As a result, in order to offer airline service after termination of any of our code-share agreements, we may have to replace these facilities, assets and services. We may be unable to arrange such replacements on satisfactory terms, or at all.

19
Disagreements regarding the interpretation of our code-share agreements with our major partners could have an adverse effect on our operating results and financial condition.
Long-term contractual agreements, such as our code-share agreements, are subject to interpretation and disputes may arise under such agreements if the parties to an agreement apply different interpretations to that agreement. Those disputes may divert management time and resources from the core operation of the business, and may result in litigation, arbitration or other forms of dispute resolution.
In recent years we have experienced disagreements with our major partners regarding the interpretation of various provisions of our code-share agreements. Some of those disagreements have resulted in litigation, and we may be subject to additional disputes and litigation in the future. Those disagreements have also required a significant amount of management time, financial resources and settlement negotiations of disputed matters.
To the extent that we continue to experience disagreements regarding the interpretation of our code-share or other agreements, we will likely expend valuable management time and financial resources in our efforts to resolve those disagreements. Those disagreements may result in litigation, arbitration, settlement negotiations or other proceedings. Furthermore, there can be no assurance that any or all of those proceedings, if commenced, would be resolved in our favor. An unfavorable result in any such proceeding could have adverse financial consequences or require us to modify our operations. Such disagreements and their consequences could have an adverse effect on our operating results and financial condition.
We may be limited from expanding our flying within the Delta and United flight systems.
Additional growth opportunities within the Delta and United flight systems are limited by various factors including a limited number of regional aircraft each major partner can operate in its regional network due to its own labor agreements. Except as contemplated by our existing code-share agreements, we cannot assure that Delta and United will contract with us to fly any additional aircraft. We may not receive additional growth opportunities, or may agree to modifications to our code-share agreements that reduce certain benefits to us in order to obtain additional aircraft, or for other reasons. Given the competitive nature of the airline industry, we believe that some of our competitors may be more inclined to accept reduced margins and less favorable contract terms in order to secure new or additional code-share operations. Even if we are offered growth opportunities by our major partners, those opportunities may involve economic terms or financing commitments that are unacceptable to us. Additionally, our major partners may reduce the number of regional jets in their system by not renewing or extending existing flying arrangements with regional operators. Any one or more of these factors may reduce or eliminate our ability to expand our flight operations with our existing code-share partners. We also cannot provide any assurance that we will be able to obtain the additional ground and maintenance facilities, including gates, and support equipment, to expand our operations. The failure to obtain these facilities and equipment would likely impede our efforts to implement our business strategy and could materially and adversely affect our operating results and our financial condition.
Our business model depends on major airlines, including Delta and United, electing to contract with us instead of operating their own regional jets. Some major airlines own their own regional airlines or operate their own regional jets instead of entering into contracts with regional carriers. We have no guarantee that in the future our code-share partners will choose to enter into contracts with us instead of operating their own regional jets. Our partners are not prohibited from doing so under our code-share agreements. A decision by Delta or United to phase out code-share relationships and instead acquire and operate their own regional jets could have a material adverse effect on our financial condition, results of operations or the price of our common stock.
Reduced utilization levels of our aircraft under our code-share agreements would adversely impact our financial results.
The majority of our code-share agreements set forth minimum levels of flight operations which our major partners are required to schedule for our operations and we are required to provide. These minimum flight operating levels are intended to compensate us for reduced operating efficiencies caused by production decreases made by our major partners under our respective code-share agreements. Historically, our major partners have utilized our flight operations at levels which exceed the minimum levels set forth in our code-share agreements, however, higher fuel costs

20
or other factors may cause our major partners to reduce our utilization levels. If our major partners schedule the utilization of our aircraft below historical levels (including taking into account the stage length and frequency of our scheduled flights), we may not be able to maintain operating efficiencies previously obtained, which would negatively impact our operating results and financial condition. Additionally, our major partners may change routes and frequencies of flights, which can shorten flight trip lengths. Changes in schedules may increase our flight costs, which could exceed the reimbursed rates paid by our major partners. Continued reduced utilization levels of our aircraft or other changes to our schedules under our code-share agreements would adversely impact our financial results.
We have a significant amount of contractual obligations.
As of December 31, 2015, we had a total of approximately $1.9 billion in total long-term debt obligations. Substantially all of this long-term debt was incurred in connection with the acquisition of aircraft and engines. We also have significant long-term lease obligations primarily relating to our aircraft fleet. These leases are classified as operating leases and therefore are not reflected as liabilities in our consolidated balance sheets. At December 31, 2015, we had 470 aircraft under lease, with remaining terms ranging up to 10 years. Future minimum lease payments due under all long-term operating leases were approximately $1.2 billion at December 31, 2015. At a 4.89% discount factor, the present value of these lease obligations was equal to approximately $1.0 billion at December 31, 2015. Our high level of fixed obligations could impact our ability to obtain additional financing to support additional expansion plans or divert cash flows from operations and expansion plans to service the fixed obligations.
Our anticipated fleet replacement would require a significant increase in our leverage and the related cash requirements.
We currently have 237 CRJ200s with an average life of 13.7 years and 182 ERJ145s with an average life of 13.0 years. We removed all of our EMB120s from service during the second quarter of 2015, and we anticipate that over the next several years, we will continue to replace the CRJ200s and ERJ145s with larger regional jets. Our fleet replacement strategy, if undertaken as we currently anticipate, will require significant amounts of capital to acquire these larger regional jets.
There can be no assurance that our operations will generate sufficient cash flow or liquidity to enable us to obtain the necessary aircraft acquisition financing to replace our current fleet, or to make required debt service payments related to our existing or anticipated future obligations. Even if we meet all required debt, lease and purchase obligations, the size of these long-term obligations could negatively affect our financial condition, results of operations and the price of our common stock in many ways, including:
• increasing the cost, or limiting the availability of, additional financing for working capital, acquisitions or other purposes;
• limiting the ways in which we can use our cash flow, much of which may have to be used to satisfy debt and lease obligations; and
• adversely affecting our ability to respond to changing business or economic conditions or continue our growth strategy.
If we need additional capital and cannot obtain such capital on acceptable terms, or at all, we may be unable to realize our fleet replacement plans or take advantage of unanticipated opportunities
We could be adversely affected by an outbreak of a disease that affects travel behavior.
In recent years, various virus and illness outbreaks, including, but not limited to Zika, Ebola, H1N1 flu virus and SARS, have an adverse impact on travel behavior. Any outbreak of a disease or spread of existing illnesses that affects travel behavior could have a material adverse impact on our operating results and financial condition. In addition, outbreaks of disease could result in quarantines of our personnel or an inability to access facilities or our aircraft, which could adversely affect our operations and financial condition.

21
Interruptions or disruptions in service at one of our hub airports, due to adverse weather or for any other reason, could have a material adverse impact on our operations.
We currently operate primarily through hubs in Atlanta, Los Angeles, Houston, Minneapolis, Detroit, San Francisco, Salt Lake City, Chicago, Denver, Houston, Washington, D.C., Newark, Cleveland and the Pacific Northwest. Nearly all of our flights either originate from or fly into one of these hubs. Our revenues depend primarily on our completion of flights and secondarily on service factors such as timeliness of departure and arrival. Any interruptions or disruptions could, therefore, severely and adversely affect us. Extreme weather can cause flight disruptions, and, during periods of storms or adverse weather, fog, low temperatures, etc., our flights may be canceled or significantly delayed. Hurricanes Katrina and Rita and Superstorm Sandy, in particular, caused severe disruption to air travel in the affected areas and adversely affected airlines operating in the region, including ExpressJet. We operate a significant number of flights to and from airports with particular weather difficulties, including Atlanta, Salt Lake City, Chicago, San Francisco, Newark and Denver. A significant interruption or disruption in service at one of our hubs, due to adverse weather, security closures or otherwise, could result in the cancellation or delay of a significant portion of our flights and, as a result, could have a severe adverse impact on our operations and financial performance.
Economic and industry conditions constantly change, and negative economic conditions in the United States and other countries may create challenges for us that could materially and adversely affect our operations and financial condition.
Our operations and financial condition are affected by many changing economic and other conditions beyond our control, including, among others:
• disruptions in the credit markets, which have resulted in greater volatility, less liquidity, widening of credit spreads, and decreased availability of financing;
• actual or potential changes in international, national, regional and local economic, business and financial conditions, including recession, inflation, higher interest rates, wars, terrorist attacks or political instability;
• changes in consumer preferences, perceptions, spending patterns or demographic trends;
• changes in the competitive environment due to industry consolidation and other factors;
• actual or potential disruptions to U.S. air traffic control systems;
• price of jet fuel and oil;
• outbreaks of diseases that affect travel behavior; and
• weather and natural disasters.
The effect of any, or some combination, of the foregoing economic and industry conditions on our operations or financial condition is virtually impossible to forecast; however, the occurrence of any or all of such conditions in a significant manner could materially and adversely affect our operations and financial condition.
We could be adversely affected by significant disruptions in the supply of fuel or by significant fluctuation in fuel prices.
Dependence on foreign imports of crude oil, limited refining capacity and the possibility of changes in government policy on jet fuel production, transportation and marketing make it impossible to predict the future availability of jet fuel. If there are additional outbreaks of hostilities or other conflicts in oil-producing areas or elsewhere, or a reduction in refining capacity (due to weather events, for example), or governmental limits on the production or sale of jet fuel, there could be a reduction in the supply of jet fuel and significant increases in the cost of jet
22
fuel. Major reductions in the availability of jet fuel or significant increases in its cost, or a continuation of high fuel prices for a significant period of time, would have a material adverse impact on us.
Pursuant to our fixed-fee arrangements, our major partners have agreed to bear the economic risk of fuel price fluctuations on our contracted flights. However, we bear the economic risk of fuel price fluctuations on our pro-rate operations. As of December 31, 2015, we operated 26 CRJ200s under a pro-rate agreement with United. We also operated 21 CRJ200s under a pro-rate agreement with Delta, and eight CRJ200s under a pro-rate agreement with American. Our operating and financial results with respect to these pro-rate arrangements can be negatively affected by the price of jet fuel in the event we are unable to increase our passenger fares. Additionally in the event of prolonged low fuel prices, our competitors may lower their passenger ticket prices on routes that compete with our pro-rate markets, which could negatively impact our passenger load factors.
The issuance of operating restrictions applicable to one of the fleet types we operate could negatively impact our business and financial condition.
We rely on a limited number of aircraft types, and are dependent upon Bombardier and Embraer as the sole manufacturers of our aircraft. The issuance of FAA or manufacturer directives restricting or prohibiting the use of Bombardier or Embraer aircraft types we operate could negatively impact our business and financial results. We are also dependent upon General Electric and Rolls Royce as the sole manufacturers of our aircraft engines. Our operations could be materially and adversely affected by the failure or inability of Bombardier, Embraer, General Electric or Rolls Royce to provide sufficient parts or related maintenance and support services to us on a timely manner, or the interruption of our flight operations as a result of unscheduled or unanticipated maintenance requirements for our aircraft or engines.
Certain flying arrangements with our major partners are terminable upon notice of 120 days or less.
Certain of our flying agreements with our major partners permit the major partner to terminate the agreement in its discretion by giving us notice of 120 days or less. If one of our major partners elects to terminate a flying agreement with notice of 120 days or less, our ability to use the aircraft under an alternative agreement with similar economics may be limited, which could negatively impact our financial results. Additionally, even if we can subsequently place the aircraft into service with a different major airline partner, of which there can be no assurance, we likely would incur inefficiencies and incremental costs, such as changing the aircraft livery, during the transition period, which would negatively impact our financial results.
If we have a failure in our technology or if we have security breaches of our information technology infrastructure, our business and financial condition may be adversely affected.
The performance and reliability of our technology are critical to our ability to compete effectively. Any internal technological error or failure or large-scale external interruption in the technological infrastructure we depend on, such as power, telecommunications or the internet, may disrupt our internal network. Any individual, sustained or repeated failure of technology could impact our ability to conduct our business and result in increased costs. Our technological systems and related data may be vulnerable to a variety of sources of interruption due to events beyond our control, including natural disasters, terrorist attacks, telecommunications failures, computer viruses, hackers and other security issues.
In addition, as a part of our ordinary business operations, we collect and store sensitive data, including personal information of our passengers and employees and information of our business partners. Our information systems are subject to an increasing threat of continually evolving cybersecurity risks. Unauthorized parties may attempt to gain access to our systems or information through fraud or other means of deception. The methods used to obtain unauthorized access, disable or degrade service or sabotage systems are constantly evolving, and may be difficult to anticipate or to detect for long periods of time. We may not be able to prevent all data security breaches or misuse of data. The compromise of our technology systems resulting in the loss, disclosure, misappropriation of, or access to, customers’, employees’ or business partners’ information could result in legal claims or proceedings, liability or regulatory penalties under laws protecting the privacy of personal information, disruption to our operations and damage to our reputation, any or all of which could adversely affect our business and financial condition.

23
Our business could be harmed if we lose the services of our key personnel.
Our business depends upon the efforts of our chief executive officer, Russell A. Childs, and our other key management and operating personnel. We may have difficulty replacing management or other key personnel who cease to be employed by us and, therefore, the loss of the services of any of these individuals could harm our business. We do not maintain key-person insurance on any of our executive officers.
Risks Related to the Airline Industry
We may be materially affected by uncertainties in the airline industry.
The airline industry has experienced tremendous challenges in recent years and will likely remain volatile for the foreseeable future. Among other factors, the financial challenges faced by major and regional carriers and continuing hostilities in the Middle East and other regions have significantly affected, and are likely to continue to affect, the U.S. airline industry. These events have resulted in declines and shifts in passenger demand, increased insurance costs, increased government regulations and tightened credit markets, all of which have affected, and will likely continue to affect, the operations and financial condition of participants in the industry, including us, major carriers (including our major partners), low-cost carriers, competitors and aircraft manufacturers. These industry developments raise substantial risks and uncertainties, which will likely affect us, major carriers (including our major partners), competitors and aircraft manufacturers in ways that we are unable to predict.
The airline industry is highly competitive and has undergone a period of consolidation and transition leaving fewer potential code-share partners.
The airline industry is highly competitive. We not only compete with other regional airlines, some of which are owned by or operated as code-share partners of major airlines, but we also face competition from low-cost carriers and major airlines on many of our routes. Low-cost carriers such as Southwest, Allegiant, Spirit and JetBlue among others, operate at many of our hubs, resulting in significant price competition. Additionally, a large number of other carriers operate at our hubs, creating intense competition. Certain of our competitors are larger and have significantly greater financial and other resources than we do. Moreover, federal deregulation of the industry allows competitors to rapidly enter our markets and to quickly discount and restructure fares. The airline industry is particularly susceptible to price discounting because airlines incur only nominal costs to provide service to passengers occupying otherwise unsold seats. Increased fare competition could adversely affect our operations and the price of our common stock. The airline industry has undergone substantial consolidation, including the merger between American and US Airways in 2013, Southwest and AirTran Airways, Inc. in 2011, United and Continental in 2010 and Delta and Northwest Airlines, Inc. in 2008. Any additional consolidation or significant alliance activity within the airline industry could limit the number of potential partners with whom we could enter into code-share relationships and could have a material adverse effect on our relationships with our code-share partners.
Due, in part, to the dynamic nature of the airline industry, major airlines may also make other strategic changes such as changing or consolidating hub locations. If our major partners were to make changes such as these in their strategy and operations, our operations and financial results could be adversely impacted.
Terrorist activities or warnings have dramatically impacted the airline industry, and will likely continue to do so.
The terrorist attacks of September 11, 2001 and their aftermath have negatively impacted the airline industry in general, including our operations. The primary effects experienced by the airline industry include a substantial loss of passenger traffic and revenue. If additional terrorist attacks are launched against the airline industry, there will be lasting consequences of the attacks, which may include loss of life, property damage, increased security and insurance costs, increased concerns about future terrorist attacks, increased government regulation and airport delays due to heightened security. Additional terrorist attacks and the fear of such attacks could negatively impact the airline industry, and result in further decreased passenger traffic and yields, increased flight delays or cancellations associated with new government mandates, as well as increased security, fuel and other costs. We cannot provide any assurance that these events will not harm the airline industry generally or our operations or financial condition in particular.

24
We are subject to significant governmental regulation.
All interstate air carriers, including SkyWest Airlines and ExpressJet, are subject to regulation by the DOT, the FAA and other governmental agencies. Regulations promulgated by the DOT primarily relate to economic aspects of air service. The FAA requires operating, air worthiness and other certificates; approval of personnel who may engage in flight, maintenance or operation activities; record keeping procedures in accordance with FAA requirements; and FAA approval of flight training and retraining programs. We cannot predict whether we will be able to comply with all present and future laws, rules, regulations and certification requirements or that the cost of continued compliance will not have a material adverse effect on our operations. We incur substantial costs in maintaining our current certifications and otherwise complying with the laws, rules and regulations to which we are subject. A decision by the FAA to ground, or require time-consuming inspections of or maintenance on, all or any of our aircraft for any reason may have a material adverse effect on our operations. In addition to state and federal regulation, airports and municipalities enact rules and regulations that affect our operations. From time to time, various airports throughout the country have considered limiting the use of smaller aircraft, such as our aircraft, at such airports. The imposition of any limits on the use of our aircraft at any airport at which we operate could have a material adverse effect on our operations.
The occurrence of an aviation accident involving our aircraft would negatively impact our operations and financial condition.
An accident or incident involving one of our aircraft could result in significant potential claims of injured passengers and others, as well as repair or replacement of a damaged aircraft and its consequential temporary or permanent loss from service. In the event of an accident, our liability insurance may not be adequate to offset our exposure to potential claims and we may be forced to bear substantial losses from the accident. Substantial claims resulting from an accident in excess of our related insurance coverage would harm our operational and financial results. Moreover, any aircraft accident or incident, even if fully insured, could cause a public perception that our operations are less safe or reliable than other airlines.
Risks Related to Our Common Stock
We can issue additional shares without shareholder approval.
Our Restated Articles of Incorporation, as amended (the “Restated Articles”), authorize the issuance of up to 120,000,000 shares of common stock, all of which may be issued without any action or approval by our shareholders. As of December 31, 2015, we had 51,004,985 shares outstanding. In addition, as of December 31, 2015, we had equity-based incentive plans under which 4,259,137 shares are reserved for issuance and an employee stock purchase plan under which 1,006,631 shares are reserved for issuance, both of which may dilute the ownership interest of our shareholders. Our Restated Articles also authorize the issuance of up to 5,000,000 shares of preferred stock. Our board of directors has the authority to issue preferred stock with the rights and preferences, and at the price, which it determines. Any shares of preferred stock issued would likely be senior to shares of our common stock in various regards, including dividends, payments upon liquidation and voting. The value of our common stock could be negatively affected by the issuance of any shares of preferred stock.
The amount of dividends we pay may decrease or we may not pay dividends.
Historically, we have paid dividends in varying amounts on our common stock. The future payment and amount of cash dividends will depend upon our financial condition and results of operations, loan covenants and other factors deemed relevant by our board of directors. There can be no assurance that we will continue our practice of paying dividends on our common stock or that we will have the financial resources to pay such dividends.
The amount of common stock we repurchase may decrease from historical levels, or we may not repurchase any additional shares of common stock.
Historically, we have repurchased shares of our common stock in varying amounts. Our future repurchases of shares of common stock, if any, and the number of shares of common stock we may repurchase will depend upon our financial condition, results of operations, loan covenants and other factors deemed relevant by our Board of Directors.

25
There can be no assurance that we will continue our practice of repurchasing shares of common stock or that we will have the financial resources to repurchase shares of common stock in the future.
Provisions of our charter documents and code-share agreements may limit the ability or desire of others to gain control of our company.
Our ability to issue shares of preferred and common stock without shareholder approval may have the effect of delaying or preventing a change in control and may adversely affect the voting and other rights of the holders of our common stock, even in circumstances where such a change in control would be viewed as desirable by most investors. The provisions of the Utah Control Shares Acquisitions Act may also discourage the acquisition of a significant interest in or control of our company. Additionally, our code-share agreements contain termination and extension trigger provisions related to change in control type transactions that may have the effect of deterring a change in control of our company.
ITEM 1B. UNRESOLVED STAFF COMMENTS
None
ITEM 2. PROPERTIES
Flight Equipment
As of December 31, 2015, our fleet available for scheduled service consisted of the following types of owned and leased aircraft:
Number of Number of Scheduled Average Owned Leased Passenger Flight Cruising Average Aircraft Type Aircraft Aircraft Capacity Range (miles) Speed (mph) Age (years) CRJ900s . . . . . . . . . . . . . . . . . . . . . . . . . . . . . . 11 53 76 1,500 530 8.1CRJ700s . . . . . . . . . . . . . . . . . . . . . . . . . . . . . . 70 69 66-70 1,600 530 10.6CRJ200s . . . . . . . . . . . . . . . . . . . . . . . . . . . . . . 92 133 50 1,500 530 13.8E175s . . . . . . . . . . . . . . . . . . . . . . . . . . . . . . . . 45 — 76 2,100 530 1.0ERJ145s . . . . . . . . . . . . . . . . . . . . . . . . . . . . . . — 182 50 1,500 530 13.0ERJ135s . . . . . . . . . . . . . . . . . . . . . . . . . . . . . . — 5 37 1,500 530 14.6
The following table outlines the anticipated delivery scheduled for new E175 aircraft during the years indicated.
2016 2017 E175s 37 17
The following table outlines the currently anticipated size and composition of our combined fleet for the periods indicated based on anticipated contract expirations. Several factors may impact our forecasted fleet size including

26
assumptions regarding contract extensions with our major airline partners. Our actual future fleet size will likely vary, and may vary materially, from our current forecast.
As of December 31, Aircraft Type Anticipated Fleet Size 2015 2016 2017 2018 CRJ900s . . . . . . . . . . . . . . . . . . . . . . . . . . . . . . . . . . . . . . . . . 64 64 64 64CRJ700s . . . . . . . . . . . . . . . . . . . . . . . . . . . . . . . . . . . . . . . . . 139 119 119 119CRJ200s . . . . . . . . . . . . . . . . . . . . . . . . . . . . . . . . . . . . . . . . . 225 208 175 175E175s . . . . . . . . . . . . . . . . . . . . . . . . . . . . . . . . . . . . . . . . . . . 45 82 99 99ERJ145s . . . . . . . . . . . . . . . . . . . . . . . . . . . . . . . . . . . . . . . . . 182 153 97 —ERJ135s . . . . . . . . . . . . . . . . . . . . . . . . . . . . . . . . . . . . . . . . . 5 5 3 —Total Fleet Size . . . . . . . . . . . . . . . . . . . . . . . . . . . . . . . . . . . 660 631 557 457
Bombardier and Embraer Regional Jets
The Bombardier and Embraer Regional Jets are among the quietest commercial jets currently available and offer many of the amenities of larger commercial jet aircraft, including flight attendant service, as well as a stand-up cabin, overhead and under seat storage, lavatories and in-flight snack and beverage service. The speed of Bombardier and Embraer Regional Jets is comparable to larger aircraft operated by the major airlines, and they have a range of approximately 1,600 miles (2,100 miles for the E175 aircraft); however, because of their smaller size and efficient design, the per-flight cost of operating a Bombardier or Embraer Regional Jet is generally less than that of a 120- seat or larger jet aircraft.
Ground Facilities
SkyWest, SkyWest Airlines and ExpressJet own or lease the following principal properties:
SkyWest Facilities
• We own the corporate headquarters facilities of SkyWest and SkyWest Airlines, located in St. George, Utah, which consist of two adjacent buildings of 63,000 and 55,000 square feet, respectively.
SkyWest Airlines Facilities
• SkyWest Airlines leases a 221,000 square foot facility at the Salt Lake International Airport. This facility consists of a 98,000 square- foot aircraft maintenance hangar and a 123,000 square-foot training and office facility. SkyWest Airlines is leasing the facility from the Salt lake City Department of Airports under a lease that expires in 2028.
• SkyWest Airlines leases a 94,000 square-foot hangar and a 32,000 square-foot office facility in Boise, Idaho.
• SkyWest Airlines leases a 90,000 square-foot maintenance hangar and a 15,000 square-foot office facility in Fresno, California.
• SkyWest Airlines leases a 70,000 square-foot maintenance hangar in Tucson, Arizona.
• SkyWest Airlines owns a 57,000 square-foot maintenance facility and an 18,000 square-foot office facility in Chicago, Illinois. The City of Chicago possesses the right to acquire ownership rights of the facility in 2017.
• SkyWest Airlines owns a 57,000 square foot aircraft maintenance facility in Palm Springs, California.
• SkyWest Airlines owns a 55,000 square-foot hangar and a 46,000 square-foot office facility in Colorado Springs, Colorado.
• SkyWest Airlines owns a 55,000 square-foot maintenance accessory shop (which includes 5,000 square-foot office space) and a 5,000 square- foot training facility in Salt Lake City, Utah.
• SkyWest Airlines leases a 42,000 square-foot maintenance hangar facility in South Bend, Indiana.

27
• SkyWest Airlines leases a 41,000 square-foot hangar and office facility in Milwaukee, Wisconsin.
• SkyWest Airlines leases a 32,000 square-foot hangar and office facility in Nashville, Tennessee.
ExpressJet Facilities
• ExpressJet leases an aircraft hangar complex consisting of 203,000 square feet of building space at the Hartsfield-Jackson Atlanta Airport. The complex also contains a 15,000 square-foot ground service equipment facility. The 203,000 square-foot building space consists of a 114,000 square foot aircraft maintenance hangar, 18,000 square-foot training facility, and 71,000 square feet of renovated office space which is utilized to support various operating divisions and ExpressJet’s Operational Control Center. The lease agreement for the aircraft hangar complex has a 25-year term and is scheduled to expire on April 30, 2033.
• ExpressJet leases a 20,000 square-foot facility at the Hartsfield- Jackson Atlanta International Airport which serves as ExpressJet’s corporate headquarters. The lease agreement for this facility has a seven-year term and is scheduled to expire on July 31, 2018.
• ExpressJet leases a group of warehouse units for the purpose of parts storage in College Park, Georgia. The 17,000 square feet of warehouse space is leased on a month-to-month basis.
• ExpressJet leases 24 gates and other premises of the Central Passenger Terminal Complex located on Concourse C and Concourse D at Hartsfield-Jackson Atlanta International Airport. The lease agreement is scheduled to expire on September, 20, 2017.
• ExpressJet leases a 380,000 square-foot hangar and office support facility in Houston, Texas. The lease agreement is currently month to month.
• ExpressJet leases a 152,000 square-foot hangar, and a 29,000 square-foot shop facility in Shreveport, Louisiana. The lease agreement is scheduled to expire on May 31, 2020.
• ExpressJet subleases a 91,000 square-foot aircraft maintenance facility in Cleveland, Ohio. The lease agreement is scheduled to expire on January 30, 2020.
• ExpressJet leases an 83,000 square-foot hangar, and a 25,000 square-foot shop facility in Knoxville, Tennessee. The lease agreement for the hangar facility is scheduled to expire on November 30, 2020, and the lease for the shop facility is scheduled to expire on October 31, 2017.
• ExpressJet leases an aircraft hangar complex located at the Middle Georgia Regional Airport. The complex includes a 77,000 square-foot aircraft hangar facility and 41,000 square feet of training and office space. The lease agreement has a sixteen-year term and is scheduled to expire on April 1, 2018. ExpressJet has subleased the hangar complex to an unrelated aircraft maintenance provider; however ExpressJet remains obligated for payment and other obligations of the lease under the lease agreement.
• ExpressJet leases a 68,000 square-foot facility in Houston, Texas. ExpressJet has subleased the building to an unrelated aircraft maintenance provider; however ExpressJet remains obligated for payment and other obligations under the lease agreement which is scheduled to expire on March 31, 2017.
• ExpressJet leases a 57,000 square-foot training center and support space in Houston, Texas. The lease agreement is scheduled to expire on December 31, 2027.
• ExpressJet leases a 35,000 square-foot hangar facility in Columbia, South Carolina. The lease agreement has a five-year term and is scheduled to expire on June 30, 2018.
• ExpressJet leases a 32,000 square-foot aircraft maintenance facility in Richmond, Virginia. The lease agreement is scheduled to expire on October 31, 2016.
• ExpressJet leases an aircraft hangar complex located at the Baton Rouge Metropolitan Airport District. The complex includes a 27,000 square-foot hangar facility and 12,000 square feet of office support space. ExpressJet has the right to occupy the Baton Rouge facility rent-free until 2018.

28
• ExpressJet subleases 12,000 square-feet of hangar space in Detroit, Michigan. The term of the sublease agreement is scheduled to expire on March 5, 2016.
Our management deems the current facilities of SkyWest, SkyWest Airlines and ExpressJet as being suitable to support existing operations and believes these facilities will be adequate for the foreseeable future.
ITEM 3. LEGAL PROCEEDINGS
We are subject to certain legal actions which we consider routine to our business activities. As of December 31, 2015, our management believed, after consultation with legal counsel, that the ultimate outcome of such legal matters was not likely to have a material adverse effect on our financial position, liquidity or results of operations.
ITEM 4. MINE SAFETY DISCLOSURES
The disclosure required by this item is not applicable.
PART II
ITEM 5. MARKET FOR REGISTRANT’S COMMON EQUITY, RELATED STOCKHOLDER MATTERS AND ISSUER PURCHASES OF EQUITY SECURITIES
Market Price for Our Common Stock
Our common stock is traded on The Nasdaq Global Select Market under the symbol “SKYW.” At February 16, 2016, there were approximately 843 stockholders of record of our common stock. Securities held of record do not include shares held in securities position listings. The following table sets forth the range of high and low closing sales prices for our common stock, during the periods indicated.
2015 2014 Quarter High Low High Low First . . . . . . . . . . . . . . . . . . . . . . . . . . . . . . . $ 15.86 $ 11.96 $ 14.98 $ 11.77Second . . . . . . . . . . . . . . . . . . . . . . . . . . . . . 16.91 13.58 13.72 11.21Third . . . . . . . . . . . . . . . . . . . . . . . . . . . . . . . 17.90 13.91 12.66 7.78Fourth . . . . . . . . . . . . . . . . . . . . . . . . . . . . . . 21.26 16.55 13.28 7.07
The transfer agent for our common stock is Zions First National Bank, Salt Lake City, Utah.
Dividends
During 2015 and 2014, our Board of Directors declared regular quarterly dividends of $0.04 per share.
29
Securities Authorized for Issuance Under Equity Compensation Plans
The following table contains information regarding our equity compensation plans as of December 31, 2015.
Number of Securities Weighted-Average Remaining Available for Exercise Price of Future Issuance under Number of Securities to be Outstanding Equity Compensation Issued upon Exercise of Options, Plans (Excluding Outstanding Options, Warrants and Securities Reflected in Plan Category Warrants and Rights Rights the First Column) Equity compensation plans approved by
security holders(1) . . . . . . . . . . . . . . . . . . . . . . . . . . . . 1,064,429 $ 13.64 5,265,768
(1) Consists of our SkyWest Inc. Long Term Incentive Plan, and our Employee Stock Purchase Plan. See Note 9 to our Consolidated Financial Statements for the fiscal year ended December 31, 2015, included in Item 8 of this Report, for additional information regarding these plans.
Stock Performance Graph
The following Performance Graph and related information shall not be deemed “soliciting material” or “filed” with the Securities and Exchange Commission,(the “Commission”), nor shall such information be incorporated by reference into any future filing under the Securities Act of 1933, as amended, or the Securities Exchange Act of 1934, as amended (the “Exchange Act”), except to the extent we specifically incorporate it by reference into such filing.
The following graph compares the cumulative total shareholder return on our common stock over the five-year period ended December 31, 2015, with the cumulative total return during such period of the Nasdaq Stock Market (U.S. Companies), Nasdaq Stock Market Transportation Index and a peer group index composed of regional and major passenger airlines with U.S operations that have equity securities traded on the Nasdaq Stock Market or the New York Stock Exchange, the members of which are identified below (the “Peer Group”) for the same period. The following graph assumes an initial investment of $100.00 with dividends reinvested. The stock performance shown on the graph below represents historical stock performance and is not necessarily indicative of future stock price performance.

30
INDEXED RETURNS Base
Period Years Ending Company Name / Index Dec10 Dec11 Dec12 Dec13 Dec14 Dec15 SkyWest, Inc. . . . . . . . . . . . . . . . . . . . . 100 81.55 81.81 98.48 89.75 129.83 NASDAQ Composite . . . . . . . . . . . . . . 100 99.17 116.48 163.21 187.27 200.31 NASDAQ Transportation Index . . . . 100 90.09 95.46 130.08 181.38 153.54 Peer Group . . . . . . . . . . . . . . . . . . . . . . 100 71.22 90.64 169.14 315.67 302.97
The Peer Group consists of regional and major passenger airlines with U.S operations that have equity securities traded on the Nasdaq Stock Market or the New York Stock Exchange. The members of the Peer Group are: Alaska Air Group, Inc.: Allegiant Travel Co.; American Airlines Group, Inc.; Delta Air Lines, Inc.; Hawaiian Holdings, Inc.; JetBlue Airways Corp.; Republic Airways, Holdings Inc.; SkyWest, Inc.; Southwest Airlines Co.; Spirit Airlines Inc.; United Continental Holdings Inc.; and Virgin America, Inc.
ITEM 6. SELECTED FINANCIAL DATA
The following selected financial and operating data should be read in conjunction with “Management’s Discussion and Analysis of Financial Condition and Results of Operations,” and our consolidated financial statements and related notes included elsewhere in this Report.

31
Selected Consolidated Financial Data (amounts in thousands, except per share data):
Year ended December 31, 2015 2014 2013 2012 2011 Operating revenues . . . . . . . . . . . . . . . $ 3,095,563 $ 3,237,447 $ 3,297,725 $ 3,534,372 $ 3,654,923 Operating income . . . . . . . . . . . . . . . . 234,515 24,848 153,111 165,987 41,105 Net income (loss) . . . . . . . . . . . . . . . . . 117,817 (24,154) 58,956 51,157 (27,335) Net income (loss) per common share:
Basic . . . . . . . . . . . . . . . . . . . . . . . . $ 2.31 $ (0.47) $ 1.14 $ 1.00 $ (0.52) Diluted . . . . . . . . . . . . . . . . . . . . . . . $ 2.27 $ (0.47) $ 1.12 $ 0.99 $ (0.52)
Weighted average shares: Basic . . . . . . . . . . . . . . . . . . . . . . . . 51,077 51,237 51,688 51,090 52,201 Diluted . . . . . . . . . . . . . . . . . . . . . . . 51,825 51,237 52,422 51,746 52,201
Total assets . . . . . . . . . . . . . . . . . . . . . . $ 4,802,886 $ 4,409,928 $ 4,233,219 $ 4,254,637 $ 4,281,908 Current assets(1) . . . . . . . . . . . . . . . . . 1,017,570 1,089,501 1,287,568 1,279,163 1,146,559 Current liabilities . . . . . . . . . . . . . . . . . 751,386 684,355 620,464 591,425 624,148 Long-term debt, net of current
maturities . . . . . . . . . . . . . . . . . . . . . . 1,676,776 1,533,990 1,293,179 1,470,567 1,606,993 Stockholders’ equity . . . . . . . . . . . . . . 1,506,435 1,400,346 1,434,939 1,387,175 1,334,261 Return (loss) on average equity(2) . . . 7.8 % (1.7)% 4.2 % 3.8 % (2.0)%Cash dividends declared per common
share . . . . . . . . . . . . . . . . . . . . . . . . . $ 0.16 $ 0.16 $ 0.16 $ 0.16 $ 0.16
(1) Certain reclassifications were made to prior year balances. See Note 1 to our Consolidated Financial Statements presented in Item 8 of this Report.
(2) Calculated by dividing net income (loss) by the average of beginning and ending stockholders’ equity for the year.
Selected Operating Data
Year ended December 31, 2015 2014 2013 2012 2011 Block hours . . . . . . . . . . . . . . . . . . . . . . . . . 2,074,804 2,275,562 2,380,118 2,297,014 2,250,280Departures . . . . . . . . . . . . . . . . . . . . . . . . . . 1,226,897 1,357,454 1,453,601 1,435,512 1,390,523Passengers carried . . . . . . . . . . . . . . . . . . . . 56,228,593 58,962,010 60,581,948 58,803,690 55,836,271Revenue passenger miles (000) . . . . . . . . . 29,671,911 31,499,397 31,834,735 30,088,278 29,109,039Available seat miles (000) . . . . . . . . . . . . . 35,902,503 38,220,150 39,207,910 37,278,554 36,698,859Revenue per available seat mile . . . . . . . . . 8.6 ¢ 8.5 ¢ 8.4 ¢ 9.5 ¢ 10.0 ¢Cost per available seat mile . . . . . . . . . . . . 8.2 ¢ 8.6 ¢ 8.2 ¢ 9.2 ¢ 10.1 ¢Average passenger trip length . . . . . . . . . . 528 534 525 512 521Number of operating aircraft at end of year 660 717 755 738 732
The following terms used in this section and elsewhere in this Report have the meanings indicated below:
“Revenue passenger miles” represents the number of miles flown by revenue passengers.
“Available seat miles” represents the number of seats available for passengers multiplied by the number of miles those seats are flown.
“Revenue per available seat mile” represents passenger revenue divided by available seat miles.
“Cost per available seat mile” represents operating expenses plus interest divided by available seat miles.
“Number of operating aircraft at end of year” excludes aircraft leased to un-affiliated and affiliated entities.

32
ITEM 7. MANAGEMENT’S DISCUSSION AND ANALYSIS OF FINANCIAL CONDITION AND RESULTS OF OPERATIONS
The following discussion and analysis presents factors that had a material effect on our results of operations during the years ended December 31, 2015, 2014 and 2013. Also discussed is our financial position as of December 31, 2015 and 2014. You should read this discussion in conjunction with our consolidated financial statements, including the notes thereto, appearing elsewhere in this Report or incorporated herein by reference. This discussion and analysis contains forward-looking statements. Please refer to the sections of this Report entitled “Cautionary Statement Concerning Forward-looking Statements” and “Item 1A. Risk Factors” for discussion of some of the uncertainties, risks and assumptions associated with these statements.
Overview
Through SkyWest Airlines and ExpressJet, we operate the largest regional airline in the United States. As of December 31, 2015, SkyWest Airlines and ExpressJet offered scheduled passenger and air freight service with approximately 3,600 total daily departures to destinations in the United States, Canada, Mexico and the Caribbean. As of December 31, 2015, we had a combined fleet of 702 aircraft consisting of the following:
CRJ200 CRJ700 CRJ900 ERJ135 ERJ145 E175 EMB120 Total United . . . . . . . . . . . . . . . . . . . . . . . . . . . . . . . . . 83 70 — 5 166 40 — 364Delta . . . . . . . . . . . . . . . . . . . . . . . . . . . . . . . . . . 111 60 64 — — — — 235American . . . . . . . . . . . . . . . . . . . . . . . . . . . . . . 31 — — — 16 — — 47Alaska . . . . . . . . . . . . . . . . . . . . . . . . . . . . . . . . . — 9 — — — 5 — 14Aircraft in scheduled service . . . . . . . . . . . . . . 225 139 64 5 182 45 — 660 Subleased to an un-affiliated entity . . . . . . . 2 — — — — — — 2 Other* . . . . . . . . . . . . . . . . . . . . . . . . . . . . . . 10 — — 4 — — 26 40Total . . . . . . . . . . . . . . . . . . . . . . . . . . . . . . . . . . 237 139 64 9 182 45 26 702
*Other aircraft consisted of leased aircraft removed from service that were in the process of being returned to the lessor and owned aircraft removed from service that were held for sale.
For the year ended December 31, 2015, approximately 57.5% of our aggregate capacity was operated for United, approximately 33.2% was operated for Delta, approximately 6.4% was operated for American and approximately 2.9% was operated for Alaska.
Under our fixed-fee arrangements, three components have a significant impact on comparability of revenue and operating expense for the periods presented in this Report. The first item is the reimbursement of fuel expense, which is a directly-reimbursed expense under all of our fixed-fee arrangements. If we purchase fuel directly from vendors, our major partners reimburse us for fuel expense incurred under each respective fixed-fee contract, and we record such reimbursement as passenger revenue. Thus, the price volatility of fuel and the volume of fuel expensed under our fixed-fee arrangements during a particular period will impact our fuel expense and our passenger revenue during the period equally, with no impact on our operating income. Over the past few years, some of our major airline partners have purchased an increased volume of fuel directly from vendors on flights we operated under our fixed-fee contracts, which has decreased both revenue and operating expenses compared to previous periods presented in this Report.
The second item is the reimbursement of landing fees and station rents, which is a directly-reimbursed expense under all of our fixed-fee arrangements. Our major partners reimburse us for landing fees and station rent expense incurred under each respective fixed-fee contract, and we record such reimbursement as passenger revenue. Over the past few years, some of our major airline partners have paid an increased volume of landing fees and station rents directly to our vendors on flights we operated under our flying contracts, which has also decreased both revenue and operating expenses compared to previous periods presented in this Report.
The third item is the compensation we receive for engine maintenance under our fixed-fee arrangements. Under our United CRJ and E175 fixed-fee contracts, American fixed-fee contracts, and Alaska fixed-fee contracts, a portion of our compensation is based upon fixed hourly rates the aircraft is in operation, which is intended to cover various operating costs, including engine maintenance costs (“Fixed-Rate Engine Contracts”). Under the compensation structure

33
for our Delta Connection and United ERJ145 flying contracts, our major partner reimburses us for engine maintenance expense when the expense is incurred as a pass-through cost (“Directly-Reimbursed Engine Contracts”). We use the direct-expense method of accounting for our CRJ200 regional jet aircraft engine overhaul costs and, accordingly, we recognize engine maintenance expense on our CRJ200 engines on an as-incurred basis. Under the direct-expense method, the maintenance liability is recorded when the maintenance services are performed (“CRJ200 Engine Overhaul Expense”).
Because we use the direct-expense method of accounting for our CRJ200 engine expense, and because we recognize revenue using the applicable fixed hourly rates under our Fixed-Rate Engine Contracts, the number of engine maintenance events and related expense we incur may vary between reporting periods under the Fixed-Rate Engine Contracts without a corresponding change to our passenger revenues that may impact the comparability of our operating income for the presented reporting periods.
Because we recognize revenue in the same amount and in the same period when we incur engine maintenance expense on engines operating under our Directly- Reimbursed Engine Contracts, the number of engine events and related expense we incur each reporting period does not have a direct impact on the comparability of our operating income for the presented reporting periods.
We have an agreement with a third-party vendor to provide long-term engine maintenance covering scheduled and unscheduled repairs for engines on our CRJ700s and E175s operating under our Fixed-Rate Engine Contracts (a “Power-by-the-Hour Agreement”). Under the terms of the Power-by-the-Hour Agreement, we are obligated to pay a set dollar amount per engine hour flown on a monthly basis and the vendor assumes the obligation to repair the engines at no additional cost to us, subject to certain specified exclusions. Thus, under the Power-by-the-Hour Agreement, we expense the engine maintenance costs as flight hours are incurred on the engines and using the contractual rate set forth in the agreement. Because we record engine maintenance expense based on the fixed hourly rate pursuant to the Power-by-the-Hour Agreement on our CRJ700s and E175s operating under our Fixed-Rate Engine Contracts, and because we recognize revenue using the applicable fixed hourly rates under our Fixed-Rate Engine Contracts, the number of engine events and related expense we incur each reporting period does not have a direct impact on the comparability of our operating income for the presented reporting periods. The table below summarizes how we are compensated by our major partners under our flying contracts for engine expense and the method we use to recognize the corresponding expense.
Flying Contract Compensation of Engine Expense Expense Recognition SkyWest Delta Connection . . . . . . . . . . . . . Directly-Reimbursed Engine Contracts Direct Expense Method ExpressJet Delta Connection . . . . . . . . . . . . Directly-Reimbursed Engine Contracts Direct Expense Method SkyWest United Express (CRJ200) . . . . . . . Fixed-Rate Engine Contracts Direct Expense Method SkyWest United Express (CRJ700) . . . . . . . Fixed-Rate Engine Contracts Power-by-the-Hour AgreementSkyWest United Express (E175) . . . . . . . . . Fixed-Rate Engine Contracts Power-by-the-Hour AgreementExpressJet United (CRJ200) . . . . . . . . . . . . Fixed-Rate Engine Contracts Direct Expense Method ExpressJet United (ERJ145) . . . . . . . . . . . . Directly-Reimbursed Engine Contracts Power-by-the-Hour AgreementAlaska Agreement (CRJ700) . . . . . . . . . . . . Fixed-Rate Engine Contracts Power-by-the-Hour AgreementAlaska Agreement (E175) . . . . . . . . . . . . . . Fixed-Rate Engine Contracts Power-by-the-Hour AgreementSkyWest American Agreement (CRJ200) . . Fixed-Rate Engine Contracts Direct Expense Method ExpressJet American Agreement (CRJ200) . Fixed-Rate Engine Contracts Direct Expense Method
Historically, multiple contractual relationships with major airlines have enabled us to reduce our reliance on any single major airline code and to enhance and stabilize operating results through a mix of fixed-fee flying arrangements and our pro-rate flying arrangements. For the year ended December 31, 2015, contract flying revenue and pro-rate revenue represented approximately 88% and 12%, respectively, of our total passenger revenues. On contract routes, the major airline partner controls scheduling, ticketing, pricing and seat inventories and we are compensated by the major airline partner at contracted rates based on completed block hours, flight departures and other operating measures.
Financial Highlights
We had total operating revenues of $3.1 billion for the year ended December 31, 2015, a 4.4% decrease, compared to total operating revenues of $3.2 billion for the year ended December 31, 2014. We had a net income of

34
$117.8 million, or $2.27 per diluted share, for the year ended December 31, 2015, compared to a net loss of $24.2 million, or $(0.47) per diluted share, for the year ended December 31, 2014.
The significant items affecting our financial performance during the year ended December 31, 2015 are outlined below:
Revenue
The number of aircraft we have in scheduled service and the number of block hours we generate on our flights are primary drivers to our passenger revenues under our fixed-fee flying agreements. During 2015, we had a significant change in the number of aircraft operating under fixed-fee agreements. Our primary objective in the fleet change is to improve our profitability by adding new aircraft to fixed-fee agreements at improved economics, including the E175 aircraft, while removing aircraft that were operating under less profitable arrangements. As summarized under the Fleet Activity Section below, from December 31, 2014 to December 31, 2015, we removed 103 aircraft from service that were operating under less profitable flying contracts and added 46 aircraft to new or existing fixed-fee flying arrangements at improved economics. The number of aircraft available for scheduled service decreased from 717 aircraft at December 31, 2014 to 660 at December 31, 2015, or by 8.6%. Our completed block hours decreased 8.8% primarily due to the reduced fleet size during 2015.
The decrease in our total revenue passenger revenues from 2014 to 2015 of 4.4% was primarily attributable to a
decrease in revenue earned associated with the reduction to our fleet size of 8.8%, partially offset by higher compensation we earned on aircraft placed into new agreements during 2015 and by an increase in fixed-fee contract performance incentives we earned in 2015 primarily through higher flight completion rates.
Operating Expenses
The decrease in our operating expense from 2014 to 2015 of 10.9% was primarily attributable to a decrease in direct operating costs associated with the reduction to our fleet size of 8.8% and the effect of $74.8 million of special items in our 2014 operating expense (primarily attributable to the accelerated removal of certain aircraft from service).
Fleet Activity
The following table summarizes our fleet activity for the 2015 year:
Aircraft in Service December 31, 2014 Additions Removals December 31, 2015CRJ200s . . . . . . . . . . . . . . . . . . . . . . . . 242 5 (22) 225 CRJ700s . . . . . . . . . . . . . . . . . . . . . . . . 139 — — 139 CRJ900s . . . . . . . . . . . . . . . . . . . . . . . . 64 — — 64 ERJ145/135s . . . . . . . . . . . . . . . . . . . . . 225 16 (54) 187 E175s . . . . . . . . . . . . . . . . . . . . . . . . . . . 20 25 — 45 EMB120s . . . . . . . . . . . . . . . . . . . . . . . 27 — (27) — Total . . . . . . . . . . . . . . . . . . . . . . . . . . . 717 46 (103) 660
The additional five CRJ200s and 16 ERJ145s are used aircraft we leased from the respective major partner at a nominal amount that were placed into fixed-fee flying contracts during 2015. The additional 25 E175 aircraft were new aircraft we acquired and placed into fixed-fee flying contracts during 2015. The 22 CRJ200s, 54 ERJ145s and 27 EMB120s were aircraft removed from scheduled service during 2015, and were either leased aircraft that were returned or in the process of being returned to lessors, owned aircraft that were sold to third parties or owned aircraft that were in process of being sold to third parties.
35
Fleet Developments
As of December 31, 2015, we had 45 E175 aircraft in service. We have agreements with multiple major partners to place 37 and 17 new E175 aircraft into fixed-fee flying contracts in 2016 and 2017, respectively.
Critical Accounting Policies
Our significant accounting policies are summarized in Note 1 to our consolidated financial statements for the year ended December 31, 2015, included in Item 8 of this Report. Critical accounting policies are those policies that are most important to the preparation of our consolidated financial statements and require management’s subjective and complex judgments due to the need to make estimates about the effect of matters that are inherently uncertain. Our critical accounting policies relate to revenue recognition, aircraft maintenance, aircraft leases, impairment of long-lived assets and intangibles, stock-based compensation expense and fair value as discussed below. The application of these accounting policies involves the exercise of judgment and the use of assumptions as to future uncertainties and, as a result, actual results will likely differ, and could differ materially, from such estimates.
Revenue Recognition
Passenger and ground handling revenues are recognized when service is provided. Under our fixed-fee and pro-rate flying agreements with our code-share partners, revenue is considered earned when each flight is completed. Our agreements with our code-share partners contain certain provisions pursuant to which the parties could terminate the respective agreement, subject to certain rights of the other party, if certain performance criteria are not maintained. Our revenues could be impacted by a number of factors, including changes to the applicable code-share agreements, contract modifications resulting from contract renegotiations and our ability to earn incentive payments contemplated under applicable agreements. In the event contracted rates are not finalized at a quarterly or annual financial statement date, we record that period’s revenues based on the lower of the prior period’s approved rates adjusted for the current contract negotiations and our estimate of rates that will be implemented. Also, in the event we have a reimbursement dispute with a major partner at a quarterly or annual financial statement date, we evaluate the dispute under established revenue recognition criteria and, provided the revenue recognition criteria have been met, we recognize revenue for that period based on our estimate of the resolution of the dispute. Accordingly, we are required to exercise judgment and use assumptions in the application of our revenue recognition policy.
Maintenance
We use the direct-expense method of accounting for our regional jet aircraft engine overhaul costs. Under this method, the maintenance liability is not recorded until the maintenance services are performed. With respect to SkyWest Airlines, a third-party vendor provides our long-term engine services covering the scheduled and unscheduled repairs for engines on our CRJ700s and E175s operated under our Fixed-Rate Engine Contracts. Under the terms of the vendor agreement, we pay a set dollar amount per engine hour flown on a monthly basis and the third-party vendor assumes the obligation to repair the engines at no additional cost to us, subject to certain specified exclusions. Thus, under the third-party vendor agreement, we expense the engine maintenance costs as flight hours are incurred on the engines and using the contractual rate set forth in the agreement.

36
Aircraft Leases
The majority of SkyWest Airlines’ aircraft are leased from third parties, while the majority of ExpressJet’s aircraft flying for Delta and American are debt-financed. All of ExpressJet’s ERJ145 aircraft flying for United are leased from United for nominal amounts and all of ExpressJet’s ERJ145 aircraft flying for American are leased from American for nominal amounts. In order to determine the proper classification of our leased aircraft as either operating leases or capital leases, we must make certain estimates at the inception of the lease relating to the economic useful life and the fair value of an asset as well as select an appropriate discount rate to be used in discounting future lease payments. These estimates are utilized by management in making computations as required by existing accounting standards that determine whether the lease is classified as an operating lease or a capital lease. All of our aircraft leases have been classified as operating leases, which results in rental payments being charged to expense over the terms of the related leases. Additionally, operating leases are not reflected in our consolidated balance sheet and accordingly, neither a lease asset nor an obligation for future lease payments is reflected in our consolidated balance sheets. See “Recent Accounting Pronouncements” set forth below for a discussion of a recently-adopted new accounting standard that is likely to have an impact on our aircraft lease accounting beginning in 2019.
Impairment of Long-Lived Assets
As of December 31, 2015, we had approximately $3.5 billion of property and equipment and related assets net of accumulated depreciation. Additionally, as of December 31, 2015, we had approximately $10.5 million in intangible assets. In accounting for these long-lived and intangible assets, we make estimates about the expected useful lives of the assets, the expected residual values of certain of these assets, and the potential for impairment based on the fair value of the assets and the cash flows they generate. We recorded an intangible of approximately $33.7 million relating to the acquisition of Atlantic Southeast in September 2005. That intangible is being amortized over fifteen years under the straight-line method. As of December 31, 2015, we had recorded $23.3 million in accumulated amortization expense. Factors indicating potential impairment include, but are not limited to, significant decreases in the market value of the long-lived assets, a significant change in the condition of the long-lived assets and operating cash flow losses associated with the use of the long-lived assets.
When considering whether or not impairment of long-lived assets exists, we group similar assets together at the lowest level for which identifiable cash flows are largely independent of the cash flows of other assets and liabilities and compare the undiscounted cash flows for each asset group to the net carrying amount of the assets supporting the asset group. Asset groupings are done at the fleet type or contract level.
Stock-Based Compensation Expense
We estimate the fair value of stock options as of the grant date using the Black-Scholes option pricing model. We use historical data to estimate option exercises and employee termination in the option pricing model. The expected term of options granted is derived from the output of the option pricing model and represents the period of time that options granted are expected to be outstanding. The expected volatilities are based on the historical volatility of our common stock and other factors.
Fair value
We hold certain assets that are required to be measured at fair value in accordance with United States GAAP. We determined fair value of these assets based on the following three levels of inputs:
Level 1—Quoted prices in active markets for identical assets or liabilities. Level 2—Observable inputs other than Level 1 prices such as quoted prices for similar assets
or liabilities; quoted prices in markets that are not active; or other inputs that are observable or can be corroborated by observable market data for substantially the full term of the assets or liabilities. Some of our marketable securities primarily utilize broker quotes in a non-active market for valuation of these securities.
Level 3—Unobservable inputs that are supported by little or no market activity and that are significant to the fair value of the assets or liabilities, therefore requiring an entity to develop its own assumptions.

37
We utilize several valuation techniques in order to assess the fair value of our financial assets and liabilities. Our cash and cash equivalents primarily utilize quoted prices in active markets for identical assets or liabilities.
We have valued non-auction rate marketable securities using quoted prices in active markets for identical assets or liabilities. If a quoted price is not available, we utilize broker quotes in a non-active market for valuation of these securities. For auction-rate security instruments, quoted prices in active markets are no longer available. As a result, we have estimated the fair values of these securities utilizing a discounted cash flow model.
Recent Accounting Pronouncements
In May 2014, the Financial Accounting Standards Board (the “FASB”) issued Accounting Standards Update No. 2014-09, “Revenue from Contracts with Customers” (“ASU No. 2014-09”). Under ASU No. 2014-09, revenue is recognized at the time a good or service is transferred to a customer for the amount of consideration received for that specific good or service. In July 2015, the FASB deferred the effective date of ASU No. 2014-09 to January 2, 2018. The FASB also proposed permitting early adoption of the standard, but not before January 2, 2017. Entities may use a full retrospective approach or report the cumulative effect as of the date of adoption. Our management is currently evaluating the impact the adoption of ASU No. 2014-09 is anticipated to have on our consolidated financial statements.
In April 2015, the Financial Accounting Standards Board (the “FASB”) issued Accounting Standards Update
No. 2015-03, “Simplifying the Presentation of Debt Issuance Costs” (“ASU No. 2015-03”). In August 2015, ASU No. 2015-03 was amended to modify existing guidance to require the presentation of debt issuance costs in the balance sheet as a deduction from the carrying amount of the related debt liability instead of as a deferred charge. ASU No. 2015-03 is effective for annual reporting periods beginning after December 15, 2015, but early adoption is permitted. We anticipate reclassifying the unamortized debt issuance costs and present debt net of those unamortized costs on our balance sheet upon adoption of ASU No. 2015-03.
In November 2015, the FASB issued Accounting Standards Update 2015-17, Income Taxes (Topic 740):
Balance Sheet Classification of Deferred Taxes (ASU No. 2015-17). The standard requires that deferred tax liabilities and assets be classified as noncurrent in a classified statement of financial position. The current requirement that deferred tax liabilities and assets of a tax-paying component of an entity be offset and presented as a single amount is not affected by ASU No. 2015-17. ASU No. 2015-17 is effective for annual periods beginning after December 15, 2016, and interim periods within those annual periods. We are evaluating the impact the adoption of ASU 2015-17 is anticipated to have on our consolidated financial statements.
In February 2016, the FASB issued ASU 2016-02, Leases (“ASU 2016-02”). The standard amends the existing
accounting standards for lease accounting, including requiring lessees to recognize most leases on their balance sheets and making targeted changes to lessor accounting. ASU 2016-02 will be effective beginning in the first quarter of 2019. Early adoption of ASU 2016-02 is permitted. The new leases standard requires a modified retrospective transition approach for all leases existing at, or entered into after, the date of initial application, with an option to use certain transition relief. We are currently evaluating the impact of adopting ASU 2016-02 on our consolidated financial statements.

38
Results of Operations
2015 Compared to 2014
Operational Statistics. The following table sets forth our major operational statistics and the associated percentages of change for the periods identified below.
Year ended December 31, 2015 2014 % Change Revenue passenger miles (000) . . . . . . . . . . . . . . . . . . . . . . . . . . . . . . . . . . . . 29,671,911 31,499,397 (5.8)%Available seat miles (“ASMs”) (000) . . . . . . . . . . . . . . . . . . . . . . . . . . . . . . . 35,902,503 38,220,150 (6.1)%Block hours . . . . . . . . . . . . . . . . . . . . . . . . . . . . . . . . . . . . . . . . . . . . . . . . . . . . 2,074,804 2,275,562 (8.8)%Departures . . . . . . . . . . . . . . . . . . . . . . . . . . . . . . . . . . . . . . . . . . . . . . . . . . . . . 1,226,897 1,357,454 (9.6)%Passengers carried . . . . . . . . . . . . . . . . . . . . . . . . . . . . . . . . . . . . . . . . . . . . . . . 56,228,593 58,962,010 (4.6)%Passenger load factor . . . . . . . . . . . . . . . . . . . . . . . . . . . . . . . . . . . . . . . . . . . . . 82.6 % 82.4 % 0.2 ptsRevenue per available seat mile . . . . . . . . . . . . . . . . . . . . . . . . . . . . . . . . . . . . 8.6 ¢ 8.5 ¢ 1.2 %Cost per available seat mile . . . . . . . . . . . . . . . . . . . . . . . . . . . . . . . . . . . . . . . 8.2 ¢ 8.6 ¢ (4.7)%Average passenger trip length (miles) . . . . . . . . . . . . . . . . . . . . . . . . . . . . . . . 528 534 (1.1)%
Revenues. Total operating revenues decreased $141.9 million, or 4.4%, during the year ended December 31, 2015, compared to the year ended December 31, 2014 primarily due to a decrease in our fleet size as further explained in the passenger revenues section below. Under certain of our fixed-fee flying contracts, certain expenses are subject to direct reimbursement from our major partners and we record such reimbursements as passenger revenue. These reimbursed expenses include fuel, landing fees, station rents and certain engine maintenance expenses. Our fuel expense, landing fees, station rents and directly-reimbursed engine expense decreased by $73.1 million during the year ended December 31, 2015, as compared to the year ended December 31, 2014, due primarily to (i) our major partners purchasing an increased volume of fuel, landing fees and station rents directly from vendors on flights we operated under our fixed-fee flying agreements and (ii) a reduction in the number of engine maintenance events. The following table summarizes the amount of fuel, landing fees, station rents, and engine maintenance incurred under our fixed-fee agreements and the direct reimbursement was included in our passenger revenues for the periods indicated (dollar amounts in thousands).
Year Ended December 31, 2015 2014 $ Change % Change Passenger revenues . . . . . . . . . . . . . . . . . . . . . . . . . . . . . . . . . . . . . $ 3,030,023 $ 3,168,000 $ (137,977) (4.4)%Less: directly-reimbursed fuel from airline partners . . . . . . . . . . . 41,567 76,675 (35,108) (45.8)%Less: directly-reimbursed landing fee and station rent from airline partners . . . . . . . . . . . . . . . . . . . . . . . . . . . . . . . . . . . . . . . . . 22,171 23,800 (1,629) (6.8)%Less: directly-reimbursed engine maintenance from airline partners . . . . . . . . . . . . . . . . . . . . . . . . . . . . . . . . . . . . . . . . . . . . . . . 94,142 130,505 (36,363) (27.9)%Passenger revenue excluding directly-reimbursed fuel, landing fee, station rent and engine maintenance . . . . . . . . . . . . . . . . . . . . $ 2,872,143 $ 2,937,020 $ (64,877) (2.2)%
Passenger revenues. Passenger revenues decreased $138.0 million, or 4.4%, during year ended December 31, 2015, compared to the year ended December 31, 2014. Our passenger revenues, excluding fuel, landing fees, station rents and engine overhaul reimbursements from major partners, decreased $64.9 million, or 2.2%, during the year ended December 31, 2015, compared to the year ended December 31, 2014. The decrease in passenger revenues, excluding fuel, landing fees, station rents and engine overhaul reimbursements, was primarily due to the net reduction to our aircraft in scheduled service from 717 aircraft at December 31, 2014 to 660 aircraft at December 31, 2015 and a reduction to revenue of $7.9 million from a resolution of a contract matter with a major partner. This decrease was partially offset by higher compensation we earned on aircraft placed into service during 2015, improvements in the provisions in certain of our flying contracts since 2014 and additional operational performance incentives earned under our fixed-fee contracts in 2015.

39
Ground handling and other. Total ground handling and other revenues decreased $3.9 million, or 5.6%, during the year ended December 31, 2015, compared to the year ended December 31, 2014. Ground handling and other revenue primarily consists of ground handling services we provide to third-party airlines and government subsidies we receive for operating certain routes under our pro-rate agreements. Revenues associated with ground handling services we provide for our aircraft are recorded as passenger revenues. The decrease in ground handling and other revenue was primarily due to a reduction in the number of locations for which SkyWest Airlines provided ground handling services to third party airlines during 2015, which was partially offset by an increase volume of departures during the 2015 year on routes subject to government subsidies.
Individual expense components attributable to our operations are expressed in the following table on the basis of cents per ASM (dollar amounts in thousands).
For the year ended December 31, 2015 2014 $ Change % Change 2015 Cents 2014 Cents Amount Amount Amount Percent Per ASM Per ASM Salaries, wages and benefits . . . . . . . . . . . . . . . . . . . . . . . . . $ 1,203,312 $ 1,258,155 $ (54,843) (4.4)% 3.4 3.3Aircraft maintenance, materials and repairs . . . . . . . . . . . . . 604,863 682,773 (77,910) (11.4)% 1.7 1.8Aircraft rentals . . . . . . . . . . . . . . . . . . . . . . . . . . . . . . . . . . 273,696 305,334 (31,638) (10.4)% 0.8 0.8Depreciation and amortization . . . . . . . . . . . . . . . . . . . . . . . 264,507 259,642 4,865 1.9 % 0.7 0.7Aircraft fuel . . . . . . . . . . . . . . . . . . . . . . . . . . . . . . . . . . . . 118,124 193,247 (75,123) (38.9)% 0.3 0.5Ground handling services . . . . . . . . . . . . . . . . . . . . . . . . . . 82,694 123,917 (41,223) (33.3)% 0.2 0.3Special items . . . . . . . . . . . . . . . . . . . . . . . . . . . . . . . . . . . . — 74,777 (74,777) NM — 0.2Station rentals and landing fees . . . . . . . . . . . . . . . . . . . . . . 54,167 51,024 3,143 6.2 % 0.2 0.1Other . . . . . . . . . . . . . . . . . . . . . . . . . . . . . . . . . . . . . . . . . 259,685 263,730 (4,045) (1.5)% 0.7 0.7Total operating expenses . . . . . . . . . . . . . . . . . . . . . . . . . . . $ 2,861,048 $ 3,212,599 $ (351,551) (10.9)% 8.0 8.4Interest expense . . . . . . . . . . . . . . . . . . . . . . . . . . . . . . . . . . 75,850 65,995 9,855 14.9 % 0.2 0.2Total airline expenses . . . . . . . . . . . . . . . . . . . . . . . . . . . . . $ 2,936,898 $ 3,278,594 $ (341,696) (10.4)% 8.2 8.6
Salaries, Wages and Employee Benefits. Salaries, wages and employee benefits decreased $54.8 million, or 4.4%, during the year ended December 31, 2015, compared to the year ended December 31, 2014. The decrease in salaries, wages and employee benefits was primarily due to the decrease in our fleet size and related decrease in the number of departures and block hours compared to the year ended December 31, 2014, which was partially offset by additional training costs for the E175 deliveries and an increase in employee benefit costs.
Aircraft maintenance, materials and repairs. Aircraft maintenance expense decreased $77.9 million, or 11.4%, during the year ended December 31, 2015, compared to the year ended December 31 2014. The following table summarizes the effect of directly-reimbursed engine maintenance costs under our fixed-fee flying arrangements included in our aircraft maintenance expense for the periods indicated (dollar amounts in thousands).
For the year ended December 31, 2015 2014 $ Change % Change Aircraft maintenance, materials and repairs . . . . . . . . . . . . . . . . . . . $ 604,863 $ 682,773 $ (77,910) (11.4)%Less: directly-reimbursed engine maintenance from airline partners 94,142 130,505 (36,363) (27.9)%Other aircraft maintenance, materials and repairs . . . . . . . . . . . . . . . $ 510,721 $ 552,268 $ (41,547) (7.5)%
Other aircraft maintenance, materials and repairs, excluding our directly-reimbursed engine overhaul costs, decreased $41.5 million, or 7.5%, during the year ended December 31, 2015, compared to the year ended December 31, 2014. The decrease in aircraft maintenance expense (excluding directly-reimbursed engine overhaul costs) was primarily due to a reduction in direct maintenance costs resulting from a reduced fleet size, partially offset by an increase in power-by-the-hour maintenance costs associated with the additional E175 aircraft added to our fleet since 2014.
The decrease in our engine overhaul costs incurred under our Directly-Reimbursed Engine Contracts, was primarily due to a reduced number of engine overhaul events in 2015 compared to 2014.
Aircraft rentals. Aircraft rentals decreased $31.6 million, or 10.4%, during the year ended December 31, 2015, compared to the year ended December 31, 2014. The decrease was primarily due to a reduction in the number of leased aircraft in our fleet and lower aircraft lease renewal rates since 2014.

40
Depreciation and amortization. Depreciation and amortization expense increased $4.8 million, or 1.9%, during the year ended December 31, 2015, compared to the year ended December 31, 2014. The increase in depreciation and amortization expense was primarily due to the purchase of additional E175 aircraft and spare engines in 2015 that was significantly offset by the reduction in fixed asset depreciation expense that resulted from our removal of all EMB 120 aircraft from service in early 2015.
Fuel. Fuel costs decreased $75.1 million, or 38.9%, during the year ended December 31, 2015, compared to the year ended December 31, 2014. The decrease in fuel cost was primarily due to the decrease in the average fuel cost per gallon in 2015 compared to 2014, along with a decrease in the volume in gallons that we purchased under our fixed-fee contracts. The following table summarizes our aircraft fuel expenses (less directly-reimbursed fuel expense under our fixed-fee flying arrangements) for the periods indicated (dollar amounts in thousands).
For the year ended December 31, 2015 2014 $ Change % Change Aircraft fuel expenses . . . . . . . . . . . . . . . . . . . . . . . . . . . . . . . . . . . . . $ 118,124 $ 193,247 $ (75,123) (38.9)%Less: directly-reimbursed fuel from airline partners . . . . . . . . . . . . . 41,567 76,675 (35,108) (45.8)%Aircraft fuel less fuel reimbursement from airline partners . . . . . . . $ 76,557 $ 116,572 $ (40,015) (34.3)%
The average fuel cost per gallon was $2.09 and $3.33 for the years ended December 31, 2015 and 2014, respectively. The following table summarizes the gallons of fuel we purchased directly and our fuel expense, for the periods indicated:
For the year ended December 31, (in thousands) 2015 2014 % Change Fuel gallons purchased . . . . . . . . . . . . . . . . . . . . . . . . . . . . . . . . . . . . . . . . . . . . . 56,389 57,959 (2.7)%Fuel expense . . . . . . . . . . . . . . . . . . . . . . . . . . . . . . . . . . . . . . . . . . . . . . . . . . . . . $ 118,124 $ 193,247 (38.9)%
Ground handling service. Ground handling service expense decreased $41.2 million, or 33.3%, during the year ended December 31, 2015, compared to the year ended December 31, 2014. The decrease in ground handling service expense was primarily due to a reduction in the number of locations for which SkyWest Airlines provided ground handling services subsequent to December 31, 2014.
Special items. Special items for the year ended December 31, 2014 included impairment charges to write-down owned EMB120 aircraft, including capitalized engine overhaul costs, and related long-lived assets to their estimated fair value and accrued obligations on leased aircraft and related costs of $57.1 million. The special item associated with the EMB120 aircraft was triggered by our decision in November 2014 to remove the EMB120 aircraft from service by the end of the second quarter of 2015. The special item additionally consisted of impairment charges to write-down certain ERJ145 long-lived assets, including spare engines and capitalized aircraft improvements, to their estimated fair value and accrued obligations on leased aircraft and related costs of $12.9 million. The special item associated with the ERJ145 aircraft was triggered by our execution of an amended and restated contract with United in November 2014. The amended and restated contract provides for accelerated lease termination dates of certain ERJ145 aircraft and advances the termination date of the ExpressJet United ERJ Agreement to operate the ERJ145s from the year 2020 to 2017. The special item also includes the write-down of assets associated with the disposition of our paint facility located in Saltillo, Mexico of $4.8 million. We sold the Saltillo paint facility during the year ended December 31, 2014.
Station rents and landing fees. Station rents and landing fees expense increased $3.1 million, or 6.2%, during the year ended December 31, 2015, compared to the year ended December 31, 2014. Excluding our directly-reimbursed expenses incurred under our fixed-fee contracts, station rents and landing fees increased $4.8 million, or 17.5%, during the year ended December 31, 2015. The increase in station rents and landing fees, excluding our directly-reimbursed expenses, was primarily due to an increase in the number of flights operated in our pro-rate agreements. The following table summarizes our station rents and landing fees (less directly-reimbursed landing fees and station rents under our fixed-fee flying arrangements) for the periods indicated (dollar amounts in thousands).

41
For the year ended December 31, 2015 2014 $ Change % Change Station rents and landing fees . . . . . . . . . . . . . . . . . . . . . . . . . . . . . . . $ 54,167 $ 51,024 $ 3,143 6.2%Less: directly-reimbursed landing fee and station rent from airline partners . . . . . . . . . . . . . . . . . . . . . . . . . . . . . . . . . . . . . . . . . . . . . . . . . 22,171 23,800 (1,629) (6.8)%Station rents and landing fees less directly-reimbursed landing fee and station rent from airline partners . . . . . . . . . . . . . . . . . . . . . . . . . $ 31,996 $ 27,224 $ 4,772 17.5%
Other operating expenses. Other operating expenses, primarily consisting of property taxes, hull and liability insurance, crew simulator training, and crew hotel costs, decreased $4.0 million, or 1.5%, during the year ended December 31, 2015, compared to the year ended December 31, 2014. The decrease in other operating expenses was primarily related to a reduction in fleet size, partially offset by additional training costs associated with E175 deliveries, including the use of simulators, hotels and crew per diem costs.
Total airline expenses. Total airline expenses (consisting of total operating and interest expenses) decreased $341.7 million, or 10.4%, during the year ended December 31, 2015, compared to the year ended December 31, 2014. Under our contract flying arrangements, we are reimbursed by our major airline partners for our actual fuel costs, contract related station rents, landing fees and engine overhaul costs under our Directly-Reimbursed Engine Contracts. We record such reimbursements as revenue. The following table summarizes the amount of fuel and engine overhaul expenses which are included in our total airline expenses for the periods indicated (dollar amounts in thousands).
For the year ended December 31, 2015 2014 $ Change % Change Total airline expense . . . . . . . . . . . . . . . . . . . . . . . . . . . . . . . . . . . $ 2,936,898 $ 3,278,594 (341,696) (10.4)%Less: directly-reimbursed fuel from airline partners . . . . . . . . . . 41,567 76,675 (35,108) (45.8)%Less: directly-reimbursed landing fee and station rent from airline partners . . . . . . . . . . . . . . . . . . . . . . . . . . . . . . . . . . . . . . . . 22,171 23,800 (1,629) (6.8)%Less: directly-reimbursed engine maintenance from airline partners . . . . . . . . . . . . . . . . . . . . . . . . . . . . . . . . . . . . . . . . . . . . . . 94,142 130,505 (36,363) (27.9)%Total airline expense excluding directly-reimbursed fuel, landing fee, station rent and engine maintenance . . . . . . . . . . . . $ 2,779,018 $ 3,047,614 (268,596) (8.8)%
Excluding directly reimbursed costs by our major partners for fuel, station rents, landing fees and engine overhaul costs, our total airline expenses decreased $268.6 million, or 8.8%, during the year ended December 31, 2015, compared to the year ended December 31, 2014. The decrease in total airline expenses, excluding directly-reimbursed fuel, station rents, landing fees and engine overhauls, was primarily due to the reduction in fleet size and related block hour production of 8.8% during the year ended December 31, 2015, compared to the year ended December 31, 2014.
Summary of other income (expense) items and provision for income taxes:
Other Income (expense), net. Other income (expense) for the 2015 year of $33.7 million was primarily due to a gain resulting from the early payoff of $145.4 million in debt with $110.8 million in cash, net of deferred loan costs written off associated with the debt. Other income for the 2014 year of $24.9 million primarily resulted from the sale of our equity investment in TRIP Linhas Arereas, a regional airline operation in Brazil (“TRIP”).
Provision for income taxes. The income tax provision for the 2015 year included a release of valuation allowance of $0.9 million for previously generated state net operating loss benefits primarily for ExpressJet that we previously anticipated would expire. The release of the valuation allowance was based on the gain related to early retirement of certain long term debt which reduced the amount of deferred tax assets that we anticipate will expire before the deferred tax assets may be utilized.
The income tax provision for the 2014 year included a valuation allowance of $6.0 million for previously generated state net operating loss benefits specific to ExpressJet that we anticipate to expire, $2.0 million of foreign income tax associated with our sale of ownership in TRIP stock, and the write-off of $2.4 million of tax assets associated

42
with the sale of our paint facility located in Saltillo, Mexico during 2014. These discrete income tax provision items were partially offset by the income tax benefit associated with our loss before income tax of $16.3 million for 2014.
Net Income (loss). Primarily due to factors described above, we generated net income of $117.8 million, or $2.27 per diluted share, for the year ended December 31, 2015, compared to net loss of $24.2 million, or $(0.47) per diluted share, for the year ended December 31, 2014.
2014 Compared to 2013
Operational Statistics. The following table sets forth our major operational statistics and the associated percentages-of-change for the periods identified below.
For the year ended December 31, 2014 2013 % Change Revenue passenger miles (000) . . . . . . . . . . . . . . . . . . . . . . . . . . . . . . . . . . . . 31,499,397 31,834,735 (1.1)%Available seat miles (“ASMs”) (000) . . . . . . . . . . . . . . . . . . . . . . . . . . . . . . . 38,220,150 39,207,910 (2.5)%Block hours . . . . . . . . . . . . . . . . . . . . . . . . . . . . . . . . . . . . . . . . . . . . . . . . . . . . 2,275,562 2,380,118 (4.4)%Departures . . . . . . . . . . . . . . . . . . . . . . . . . . . . . . . . . . . . . . . . . . . . . . . . . . . . . 1,357,454 1,453,601 (6.6)%Passengers carried . . . . . . . . . . . . . . . . . . . . . . . . . . . . . . . . . . . . . . . . . . . . . . . 58,962,010 60,581,948 (3)%Passenger load factor . . . . . . . . . . . . . . . . . . . . . . . . . . . . . . . . . . . . . . . . . . . . . 82.4 % 81.2 % 1.2 ptsRevenue per available seat mile . . . . . . . . . . . . . . . . . . . . . . . . . . . . . . . . . . . . 8.5 ¢ 8.4 ¢ 1.2 %Cost per available seat mile . . . . . . . . . . . . . . . . . . . . . . . . . . . . . . . . . . . . . . . 8.6 ¢ 8.2 ¢ 4.9 %Average passenger trip length (miles) . . . . . . . . . . . . . . . . . . . . . . . . . . . . . . . 534 525 1.7 %
Revenues. Total operating revenues decreased $60.3 million, or 1.8%, during the year ended December 31, 2014, compared to the year ended December 31, 2013. Under certain of our fixed-fee flying contracts, certain expenses are subject to direct reimbursement from our major partners and we record such reimbursements as passenger revenue. These reimbursed expenses include fuel, landing fees, station rents and certain engine maintenance expenses. Our fuel expense, landing fees, station rents and directly-reimbursed engine expense decreased by $79.1 million during the year ended December 31, 2014, as compared to the year ended December 31, 2013, which was due primarily to (i) our major partners purchasing an increased volume of fuel, landing fees and station rents directly from vendors on flights we operated under our fixed-fee flying agreements and (ii) a reduction in the number of engine maintenance events. The following table summarizes the amount of fuel, landing fees, station rents, and engine maintenance incurred under our fixed-fee agreements and the direct reimbursement was included in our passenger revenues for the periods indicated (dollar amounts in thousands).
For the year ended December 31, 2014 2013 $ Change % Change Passenger revenues . . . . . . . . . . . . . . . . . . . . . . . . . . . . . . . . . . . . . $ 3,168,000 $ 3,239,525 $ (71,525) (2.2)%Less: directly-reimbursed fuel from airline partners . . . . . . . . . . . 76,675 91,925 (15,250) (16.6)%Less: directly-reimbursed landing fee and station rent from airline partners . . . . . . . . . . . . . . . . . . . . . . . . . . . . . . . . . . . . . . . . . 23,800 95,175 (71,375) (75.0)%Less: directly-reimbursed engine maintenance from airline partners . . . . . . . . . . . . . . . . . . . . . . . . . . . . . . . . . . . . . . . . . . . . . . . 130,505 123,024 7,481 6.1 %Passenger revenue excluding directly-reimbursed fuel, landing fee, station rent and engine maintenance . . . . . . . . . . . . . . . . . . . . $ 2,937,020 $ 2,929,401 $ 7,619 0.3 %
Passenger revenues. Passenger revenues decreased $71.5 million, or 2.2%, during year ended December 31, 2014, compared to the year ended December 31, 2013. Our passenger revenues, excluding fuel, landing fees, station rents and engine overhaul reimbursements from major partners, increased $7.6 million, or 0.3%, during the year ended December 31, 2014, compared to the year ended December 31, 2013. The increase in passenger revenues, excluding fuel, landing fees, station rents and engine overhaul reimbursements, was primarily due to the additional E175 operations

43
that began in 2014, improvements in the provisions in certain of our flying contracts and additional revenue sharing operations, partially offset by reductions in the ExpressJet fleet size, severe weather experienced in the first half of 2014 and reduced contract performance incentives.
Ground handling and other. Total ground handling and other revenues increased $11.3 million, or 19.3%, during the year ended December 31, 2014, compared to the year ended December 31, 2013. Ground handling and other revenue primarily consists of ground handling services we provide to third-party airlines and government subsidies we receive for operating certain routes. Revenues associated with ground handling services we provide for our aircraft are recorded as passenger revenues. The increase in ground handling and other revenue was primarily due to an increased volume of departures during the 2014 year on routes subject to government subsidies.
Individual expense components attributable to our operations are expressed in the following table on the basis of cents per ASM (dollar amounts in thousands).
For the year ended December 31, 2014 2013 2014 2013 $ Change % Change Cents Per Cents Per Amount Amount Amount Percent ASM ASM Salaries, wages and benefits . . . . . . . . $ 1,258,155 $ 1,211,307 $ 46,848 3.9 % 3.3 3.1 Aircraft maintenance, materials and repairs . . . . . . . . . . . . . . . . . . . . . . 682,773 686,381 (3,608) (0.5)% 1.8 1.8 Aircraft rentals . . . . . . . . . . . . . . . . . . . 305,334 325,360 (20,026) (6.2)% 0.8 0.8 Depreciation and amortization . . . . . . 259,642 245,005 14,637 6.0 % 0.7 0.6 Aircraft fuel . . . . . . . . . . . . . . . . . . . . . 193,247 193,513 (266) (0.1)% 0.5 0.5 Ground handling services . . . . . . . . . . 123,917 129,119 (5,202) (4.0)% 0.3 0.3 Special Items . . . . . . . . . . . . . . . . . . . . 74,777 — 74,777 NM 0.2 — Station rentals and landing fees . . . . . 51,024 114,688 (63,664) (55.5)% 0.1 0.3 Other . . . . . . . . . . . . . . . . . . . . . . . . . . . 263,730 239,241 24,489 10.2 % 0.7 0.6 Total operating expenses . . . . . . . . . . . 3,212,599 3,144,614 67,985 2.2 % 8.4 8.0 Interest expense . . . . . . . . . . . . . . . . . . 65,995 68,658 (2,663) (3.9)% 0.2 0.2 Total airline expenses . . . . . . . . . . . . . $ 3,278,594 $ 3,213,272 $ 65,322 2.0 % 8.6 8.2
Salaries, Wages and Employee Benefits. Salaries, wages and employee benefits increased $46.8 million, or 3.9%, during the year ended December 31, 2014, compared to the year ended December 31, 2013. The increase in salaries, wages and employee benefits was primarily due to additional expenses attributable to the implementation of the Improvement Act, which had a negative effect on pilot scheduling and work hours and resulted in increased crew costs. The increase was also due to the additional E175 operations and training costs associated with the commencement of our E175 flight operations during 2014.
Aircraft maintenance, materials and repairs. Aircraft maintenance expense decreased $3.6 million, or 0.5%, during the year ended December 31, 2014, compared to the year ended December 31 2013. The following table summarizes the effect of directly reimbursed engine maintenance costs under our fixed-fee flying arrangements included in our aircraft maintenance expense for the periods indicated (dollar amounts in thousands).
For the Year ended December 31, 2014 2013 $ Change % Change Aircraft maintenance, materials and repairs . . . . . $ 682,773 $ 686,381 $ (3,608) (0.5)%Less: directly-reimbursed engine maintenance from airline partners . . . . . . . . . . . . . . . . . . . . . . . . 130,505 123,024 7,481 6.1 %Other aircraft maintenance, materials and repairs . $ 552,268 $ 563,357 $ (11,089) (2.0)%
Other aircraft maintenance, materials and repairs, decreased $11.1 million, or 2.0%, during the year ended December 31, 2014, compared to the year ended December 31, 2013. The decrease was primarily driven by a reduction

44
in CRJ200 engine overhaul costs of $14.1 million in 2014 compared to 2013. This decrease was partially offset by an increase in the number of scheduled maintenance events and aircraft parts replacement primarily due to the timing of major maintenance events and general aging of our CRJ and ERJ fleet.
We recognize engine maintenance expense on our CRJ200 engines on an as-incurred basis as maintenance expense. Under our Fixed-Rate Engine Contracts, we recognize revenue at fixed hourly rates for mature engine maintenance on regional jet engines. Accordingly, the timing of engine maintenance events associated with aircraft under the Fixed-Rate Engine Contracts can have a significant impact on our financial results. During the year ended December 31, 2014, our CRJ200 engine expense under our Fixed-Rate Engine Contracts decreased $14.2 million compared to the year ended December 31, 2013. The decrease in CRJ200 engine overhauls reimbursed under our Fixed-Rate Engine Contracts was principally due to fewer scheduled engine maintenance events.
Under our Directly-Reimbursed Engine Contracts, we are reimbursed for engine overhaul costs by our applicable major partner at the time the maintenance event occurs. Such reimbursements are reflected as passenger revenue in the same amount and during the same period we recognized the expense in our consolidated statements of comprehensive income.
Aircraft rentals. Aircraft rentals decreased $20.0 million, or 6.2%, during the year ended December 31, 2014, compared to the year ended December 31, 2013. The decrease was primarily due to a reduction in leased aircraft in our fleet and lower aircraft lease renewal rates since 2013.
Depreciation and amortization. Depreciation and amortization expense increased $14.6 million, or 6.0%, during the year ended December 31, 2014, compared to the year ended December 31, 2013. The increase in depreciation and amortization expense was primarily due to the purchase of 20 E175 aircraft and related long lived assets in 2014, combined with acquisition of used aircraft and spare engines in 2014.
Fuel. Fuel costs decreased $0.3 million, or 0.1%, during the year ended December 31, 2014, compared to the year ended December 31, 2013. The decrease in fuel cost was primarily due to the decrease in the average fuel cost per gallon in 2014 compared to 2013, offset by the increased volume of fuel used in our expanded pro-rate flying operations during 2014 year compared to 2013. The following table summarizes our aircraft fuel expenses (less directly-reimbursed fuel expense under our fixed-fee flying arrangements) for the periods indicated (dollar amounts in thousands). 4
For the year ended December 31, 2014 2013 $ Change % Change Aircraft fuel expenses . . . . . . . . . . . . . . . . . . . . . . . . . . . . . . . . . . . . . $ 193,247 $ 193,513 $ (266) (0.1)%Less: directly-reimbursed fuel from airline partners . . . . . . . . . . . . . 76,675 91,925 (15,250) (16.6)%Aircraft fuel less fuel reimbursement from airline partners . . . . . . . $ 116,572 $ 101,588 $ 14,984 14.7%
The average fuel cost per gallon was $3.33 and $3.60 for the years ended December 31, 2014 and 2013, respectively. The following table summarizes the gallons of fuel we purchased directly and our fuel expense, for the periods indicated:
For the year ended December 31, (in thousands, except per gallon amounts) 2014 2013 % Change Fuel gallons purchased . . . . . . . . . . . . . . . . . . . . . . . . . . . . . . . . . . . . . . . . . . . . 57,959 53,825 7.7 % Fuel expense . . . . . . . . . . . . . . . . . . . . . . . . . . . . . . . . . . . . . . . . . . . . . . . . . . . . $ 193,247 $ 193,513 (0.1)%
Ground handling service. Ground handling service expense decreased $5.2 million, or 4.0%, during the year ended December 31, 2014, compared to the year ended December 31, 2013. The decrease in ground handling service expense was primarily due to a reduction in outsourced customer service and ramp functions at airport locations serving our pro-rate operations.
Special items. Special items for the year ended December 31, 2014 included impairment charges to write-down owned EMB120 aircraft, including capitalized engine overhaul costs, and related long-lived assets to their estimated fair value and accrued obligations on leased aircraft and related costs of $57.1 million. The special item associated with the

45
EMB120 aircraft was triggered by our decision in November 2014 to remove the EMB120 aircraft from service by the end of the second quarter of 2015. The special item additionally consisted of impairment charges to write-down certain ERJ145 long-lived assets, including spare engines and capitalized aircraft improvements, to their estimated fair value and accrued obligations on leased aircraft and related costs of $12.9 million. The special item associated with the ERJ145 aircraft was triggered by our execution of an amended and restated contract with United in November 2014. The amended and restated contract provides for accelerated lease termination dates of certain ERJ145 aircraft and advances the termination date of the ExpressJet United ERJ Agreement to operate the ERJ145s from the year 2020 to 2017. The special item also includes the write-down of assets associated with the disposition of our paint facility located in Saltillo, Mexico of $4.8 million. We sold the Saltillo paint facility during the year ended December 31, 2014.
Station rentals and landing fees. Station rentals and landing fees expense decreased $63.7 million, or 55.5%, during the year ended December 31, 2014, compared to the year ended December 31, 2013. The decrease in station rentals and landing fees expense was primarily due to our major partners paying for an increased amount of station rents and landing fees directly to the applicable airports related to our contract flying arrangements.
4
For the year ended December 31, 2014 2013 $ Change % Change Station rents and landing fees . . . . . . . . . . . . . . . . . . . . . . . . . . . . . . . $ 51,024 $ 114,688 $ (63,664) (55.5)%Less: Landing fee and station rent reimbursements from airline partners . . . . . . . . . . . . . . . . . . . . . . . . . . . . . . . . . . . . . . . . . . . . . . . . .
23,800 95,175 (71,375) (75.0)%
Station rents and landing fees less station rent and landing fee reimbursements from airline partners . . . . . . . . . . . . . . . . . . . . . . . . . $ 27,224 $ 19,513 $ 7,711 39.5%
Other operating expenses. Other operating expenses, primarily consisting of property taxes, hull and liability insurance, crew simulator training and crew hotel costs, increased $24.5 million, or 10.2%, during the year ended December 31, 2014, compared to the year ended December 31, 2013. The increase in other operating expenses was primarily due to additional crew lodging expenses attributable to the requirements of the Improvement Act. The increase was also attributable to additional other operating expense items associated with incremental pro-rate operations in 2014.
Total airline expenses. Total airline expenses (consisting of total operating and interest expenses) increased $65.3 million, or 2.0%, during the year ended December 31, 2014, compared to the year ended December 31, 2013. Under our contract flying arrangements, we are reimbursed by our major airline partners for our actual fuel costs and engine overhaul costs under our Directly-Reimbursed Engine Contracts. We record such reimbursements as revenue. The following table summarizes the amount of fuel and engine overhaul expenses which are included in our total airline expenses for the periods indicated (dollar amounts in thousands).
For the year ended December 31, 2014 2013 $ Change % Change Total airline expense . . . . . . . . . . . . . . . . . . . . . . . . $ 3,278,594 $ 3,213,272 $ 65,322 2.0 %Less: directly-reimbursed fuel from airline
partners . . . . . . . . . . . . . . . . . . . . . . . . . . . . . . . . . 76,675 91,925 (15,250) (16.6)%Less: directly-reimbursed landing fee and station
rent from airline partners . . . . . . . . . . . . . . . . . . . 23,800 95,175 (71,375) (75.0)%Less: directly-reimbursed engine maintenance
from airline partners . . . . . . . . . . . . . . . . . . . . . . . 130,505 123,024 7,481 6.1 %Total airline expense excluding directly-
reimbursed fuel, landing fee, station rent and engine maintenance . . . . . . . . . . . . . . . . . . . . . . . $ 3,047,614 $ 2,903,148 $ 144,466 5.0 %
Excluding directly-reimbursed fuel, station rent, landing fees and engine overhaul costs, our total airline expenses increased $144.5 million, or 5.0%, during the year ended December 31, 2014, compared to the year ended December 31, 2013. The increase in total airline expenses, excluding directly-reimbursed fuel, station rent, landing fees and engine overhaul costs,, was primarily due to the special items recorded during 2014 of $74.8 million, and an increase in salaries, wages and benefits and other operating expenses of $71.3 million, offset by a reduction in station rents and landing fees of $63.7 million, as further explained above.
46
Summary of other income (expense) items and provision for income taxes:
Other Income (expense), net. Other income (expense) for the 2014 year includes a gain of $24.9 million resulting from the sale of our ownership in TRIP stock, offset by losses from the sale of assets during 2014. Other income (expense) for the year ended December 31, 2014 primarily consisted of $10.1 million associated with our sale of stock in Mekong Aviation Joint Stock Company, an airline operating in Vietnam (“Air Mekong”), and recognition of maintenance deposit we collected associated with the aircraft sub-leases we terminated with Air Mekong.
Provision for income taxes. The income tax provision for the 2014 year included a valuation allowance of $6.0 million for previously generated state net operating loss benefits specific to ExpressJet that we anticipate to expire, $2.0 million of foreign income tax associated with our sale of ownership in TRIP stock, and the write-off of $2.4 million of tax assets associated with the sale of our paint facility located in Saltillo, Mexico during 2014. These discrete income tax provision items were partially offset by the income tax benefit associated with our loss before income tax of $16.3 million for 2014.
Net Income (loss). Primarily due to factors described above, we generated a net loss of $24.2 million, or $(0.47) per diluted share, for the year ended December 31, 2014, compared to net income of $59.0 million, or $1.12 per diluted share, for the year ended December 31, 2013.
Our Business Segments 2015 compared to 2014:
For the year ended December 31, 2015, we had three reportable segments which are the basis of our internal financial reporting: Our segment disclosure relates to components of our business for which separate financial information is available to, and regularly evaluated by our chief operating decision maker. Our operating segment consists of SkyWest Airlines, ExpressJet and SkyWest Leasing. Corporate overhead expense is allocated to the operating expenses of SkyWest Airlines and ExpressJet.
During the fourth quarter of 2015, due to the increase in acquired E175 aircraft and the related aircraft debt financing, our chief operating decision maker started to analyze the flight operations of our E175 aircraft separately from the acquisition, ownership and financing costs and related revenue. Because of this change, the “SkyWest Leasing” segment includes revenue attributed to our E175 ownership cost earned under the applicable fixed-fee flying contracts, and the depreciation and interest expense of our E175 aircraft. The “SkyWest Leasing” segment’s total assets and capital expenditures include the acquired E175 aircraft. The “SkyWest Leasing” segment additionally includes the income from two CRJ200 aircraft leased to a third party.
As a result of the change in segmentation, prior periods have been recast to conform to the current presentation. We reclassified $15.0 million of operating revenue, $8.5 million of depreciation expense, $4.9 million of interest expense, $1.6 million of segment profit, $527.0 million of total assets and $535.5 million of capital expenditures (including non-cash) from the “SkyWest Airlines” segment to the “SkyWest Leasing” segment for the year ended December 31, 2014 to reflect the respective E175 activity in the “SkyWest Leasing” segment for 2014.
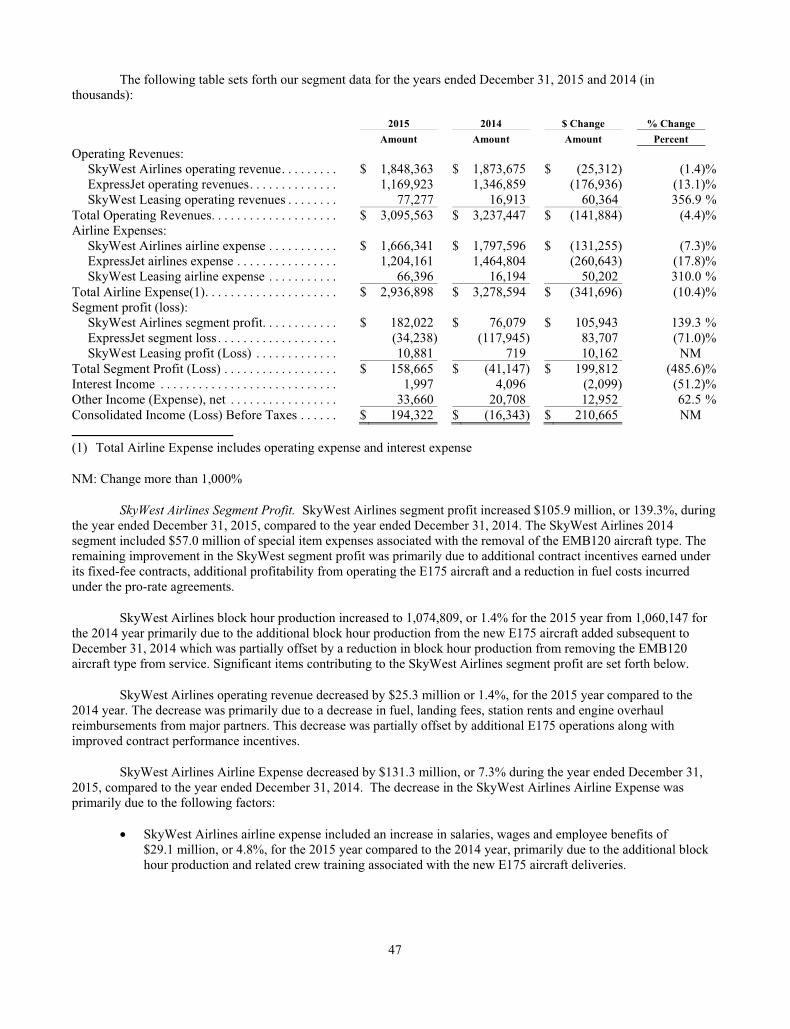
47
The following table sets forth our segment data for the years ended December 31, 2015 and 2014 (in thousands):
2015 2014 $ Change % Change Amount Amount Amount Percent Operating Revenues:
SkyWest Airlines operating revenue . . . . . . . . . $ 1,848,363 $ 1,873,675 $ (25,312) (1.4)%ExpressJet operating revenues . . . . . . . . . . . . . . 1,169,923 1,346,859 (176,936) (13.1)%SkyWest Leasing operating revenues . . . . . . . . 77,277 16,913 60,364 356.9 %
Total Operating Revenues . . . . . . . . . . . . . . . . . . . . $ 3,095,563 $ 3,237,447 $ (141,884) (4.4)%Airline Expenses:
SkyWest Airlines airline expense . . . . . . . . . . . $ 1,666,341 $ 1,797,596 $ (131,255) (7.3)%ExpressJet airlines expense . . . . . . . . . . . . . . . . 1,204,161 1,464,804 (260,643) (17.8)%SkyWest Leasing airline expense . . . . . . . . . . . 66,396 16,194 50,202 310.0 %
Total Airline Expense(1) . . . . . . . . . . . . . . . . . . . . . $ 2,936,898 $ 3,278,594 $ (341,696) (10.4)%Segment profit (loss):
SkyWest Airlines segment profit . . . . . . . . . . . . $ 182,022 $ 76,079 $ 105,943 139.3 %ExpressJet segment loss . . . . . . . . . . . . . . . . . . . (34,238) (117,945) 83,707 (71.0)%SkyWest Leasing profit (Loss) . . . . . . . . . . . . . 10,881 719 10,162 NM
Total Segment Profit (Loss) . . . . . . . . . . . . . . . . . . $ 158,665 $ (41,147) $ 199,812 (485.6)%Interest Income . . . . . . . . . . . . . . . . . . . . . . . . . . . . 1,997 4,096 (2,099) (51.2)%Other Income (Expense), net . . . . . . . . . . . . . . . . . 33,660 20,708 12,952 62.5 %Consolidated Income (Loss) Before Taxes . . . . . . $ 194,322 $ (16,343) $ 210,665 NM
(1) Total Airline Expense includes operating expense and interest expense
NM: Change more than 1,000%
SkyWest Airlines Segment Profit. SkyWest Airlines segment profit increased $105.9 million, or 139.3%, during the year ended December 31, 2015, compared to the year ended December 31, 2014. The SkyWest Airlines 2014 segment included $57.0 million of special item expenses associated with the removal of the EMB120 aircraft type. The remaining improvement in the SkyWest segment profit was primarily due to additional contract incentives earned under its fixed-fee contracts, additional profitability from operating the E175 aircraft and a reduction in fuel costs incurred under the pro-rate agreements.
SkyWest Airlines block hour production increased to 1,074,809, or 1.4% for the 2015 year from 1,060,147 for the 2014 year primarily due to the additional block hour production from the new E175 aircraft added subsequent to December 31, 2014 which was partially offset by a reduction in block hour production from removing the EMB120 aircraft type from service. Significant items contributing to the SkyWest Airlines segment profit are set forth below.
SkyWest Airlines operating revenue decreased by $25.3 million or 1.4%, for the 2015 year compared to the 2014 year. The decrease was primarily due to a decrease in fuel, landing fees, station rents and engine overhaul reimbursements from major partners. This decrease was partially offset by additional E175 operations along with improved contract performance incentives.
SkyWest Airlines Airline Expense decreased by $131.3 million, or 7.3% during the year ended December 31, 2015, compared to the year ended December 31, 2014. The decrease in the SkyWest Airlines Airline Expense was primarily due to the following factors:
• SkyWest Airlines airline expense included an increase in salaries, wages and employee benefits of
$29.1 million, or 4.8%, for the 2015 year compared to the 2014 year, primarily due to the additional block hour production and related crew training associated with the new E175 aircraft deliveries.

48
• SkyWest Airlines’ ground handling service expense decreased $22.0 million, or 25.6%, during the 2015 year, compared to the 2014 year. The decrease in ground handling service expense was primarily due to a reduction in the locations at which SkyWest Airlines provided ground handling services subsequent to December 31, 2014.
• SkyWest Airlines’ fuel expense decreased $60.2 million, or 34.4%, during the 2015 year, compared to the 2014 year. The decrease in fuel cost was primarily due to a decrease in the average fuel cost per gallon in 2015 compared to 2014. The average fuel cost per gallon was $2.09 and $3.33 for the year 2015 and 2014, respectively.
• SkyWest Airlines’ aircraft maintenance, materials and repairs expense decreased by $9.0 million, or 3.0%, during the 2015 year, compared to the 2014 year. The decrease was primarily attributable to a decrease in scheduled maintenance events and the replacement and repair of aircraft parts and components.
• SkyWest Airlines airline expense in 2014 included special items of $57.1 million for impairment charges to write-down owned EMB120 aircraft, including capitalized engine overhaul costs, and related long-lived assets to their estimated fair value and accrued obligations on leased aircraft and related costs.
• The remaining decrease in the SkyWest Airlines airline expense was primarily attributable to a reduction in the EMB120 aircraft related depreciation, partially offset by crew-related training costs including simulators, hotels and crew per diem.
ExpressJet Segment Loss. ExpressJet segment loss decreased $83.7 million, or 71.0%, during the year ended December 31, 2015, compared to the year ended December 31, 2014. The ExpressJet 2014 segment included $17.7 million of special item expenses associated with the ERJ145 aircraft and write down of certain assets. The remaining improvement in the ExpressJet segment loss was primarily due to the removal of aircraft operating under unprofitable fixed-fee contracts, higher flight completion rates, higher contract incentives earned under its fixed-fee contracts and rate improvements in certain fixed-fee contracts rates compared to 2014.
ExpressJet’s block hour production decreased to 999,995, or 17.7% for the year ended December 31, 2015 from 1,215,413 for the year ended December 31, 2014 primarily due to the removal of ERJ145 aircraft previously operated under its United fixed-fee agreement, which was partially offset by additional block hour production from its ERJ145 agreement with American subsequent to December 31, 2014. Significant items contributing to the ExpressJet segment loss are set forth below:
ExpressJet’s operating revenue decreased by $176.9 million, or 13.1%, for the 2015 year compared to the 2014 year. The decrease was primarily due to a reduction in scheduled departures in ExpressJet’s ERJ145 fleet operating under its United fixed-fee arrangement, which was partially offset by an increase in contract performance incentives earned and higher completion rates.
ExpressJet’s Airline Expense decreased $260.6 million, or 17.8%, during the year ended December 31, 2015, compared to the year ended December 31, 2014. The decrease in the ExpressJet Airlines Expense was primarily due to the following factors:
• ExpressJet’s salaries, wages and benefits decreased $83.7 million, or 12.9%, during the 2015 year, compared to the 2014 year.. The decrease was primarily due to a decrease in scheduled production subsequent to 2014 that resulted, from the decreased number of ERJ145 and CRJ200 aircraft in operation under ExpressJet’s United fixed-fee arrangements.
• ExpressJet’s aircraft maintenance, materials and repairs expense, decreased $70.5 million, or 18.1%, during the 2015 year, compared to the 2014 year. The decrease was primarily due to the reduced fleet size and related production subsequent to 2014.

49
• ExpressJet’s aircraft rental expenses decreased $21.0 million, or 23.3%, during the 2015 year, compared to the 2014 year, primarily due to the termination of aircraft leases on CRJ200 aircraft since 2014.
• ExpressJet’s ground handling services expenses decreased $19.2 million, or 50.7%, during the 2015 year, compared to the 2014 year, primarily due to a decrease in scheduled production and reduced fleet size.
• ExpressJet’s other airline expenses decreased $25.4 million, or 18.1%, during the 2015 year, compared to the 2014 year, primarily due to a decrease in scheduled production subsequent to 2014.
• ExpressJet airlines 2014 expenses included special items of $12.9 million for impairment charges to write-down certain ERJ145 long-lived assets, including spare engines and capitalized aircraft improvements, to their estimated fair value and accrued obligations on leased aircraft and related costs. ExpressJet also had $4.8 million in special charges associated with the write-down of its paint facility located in Saltillo, Mexico that was sold in 2014.
SkyWest Leasing segment Profit. SkyWest Leasing profit increased $10.2 million during the year ended December 31, 2015, compared to the year ended December 31, 2014, primarily due to the additional E175 aircraft revenue attributed to the ownership costs of the E175 aircraft earned under the applicable fixed-fee flying contract and profitability offset by the E175 aircraft depreciation and interest expense. During the fourth quarter of 2015, we resolved a contract matter with one of our major partners that resulted in a $7.9 million reduction to revenue. This reduction is reflected in the SkyWest Leasing segment as this amount related to an aircraft financing matter for the year ended December 31, 2015.
Our Business Segments 2014 compared to 2013:
For the year ended December 31, 2014, we had three reportable segments which are the basis of our internal financial reporting: Our segment disclosure relates to components of our business for which separate financial information is available to, and regularly evaluated by our chief operating decision maker. Our operating segment consists of SkyWest Airlines, ExpressJet and SkyWest Leasing. Corporate overhead expense is allocated to the operating expenses of SkyWest Airlines and ExpressJet.
During the fourth quarter of 2015, due to the increase in acquired E175 aircraft and the related aircraft debt financing, our chief operating decision maker started to analyze the flight operations of our E175 aircraft separately from the acquisition, ownership and financing costs and related revenue. Because of this change, the “SkyWest Leasing” segment includes revenue attributed to our E175 ownership cost earned under the applicable fixed-fee flying contracts, and the depreciation and interest expense of our E175 aircraft. The “SkyWest Leasing” segment’s total assets and capital expenditures include the acquired E175 aircraft. The “SkyWest Leasing” segment additionally includes the income from two CRJ200 aircraft leased to a third party.
As a result of the change in segmentation, prior periods have been recast to conform to the current presentation. We reclassified $15.0 million of operating revenue, $8.5 million of depreciation expense, $4.9 million of interest expense, $1.6 million of segment profit, $527.0 million of total assets and $535.5 million of capital expenditures (including non-cash) from the “SkyWest Airlines” segment to the “SkyWest Leasing” segment for the year ended December 31, 2014 to reflect the respective E175 activity in the “SkyWest Leasing” segment for 2014.

50
The following table sets forth our segment data for the years ended December 31, 2014 and 2013 (in thousands):
2014 2013 $ Change % Change Amount Amount Amount Percent Operating Revenues:
SkyWest Airlines operating revenue . . . . . . . . . $ 1,873,675 $ 1,827,568 $ 46,107 2.5 %ExpressJet operating revenues . . . . . . . . . . . . . . 1,346,859 1,466,341 (119,482) (8.1)%SkyWest Leasing operating revenues . . . . . . . . 16,913 3,816 13,097 343.2 %
Total Operating Revenues . . . . . . . . . . . . . . . . . . . . $ 3,237,447 $ 3,297,725 $ (60,278) (1.8)%Airline Expenses:
SkyWest airlines expense . . . . . . . . . . . . . . . . . $ 1,797,596 $ 1,688,049 $ 109,547 6.5 %ExpressJet airlines expense . . . . . . . . . . . . . . . . 1,464,804 1,515,336 (50,532) (3.3)%SkyWest Leasing airline expense . . . . . . . . . . . 16,194 9,887 6,307 63.8 %
Total Airline Expense(1) . . . . . . . . . . . . . . . . . . . . . 3,278,594 $ 3,213,272 $ 65,322 2.0 %Segment profit (loss):
SkyWest Airlines segment profit . . . . . . . . . . . . $ 76,079 $ 139,519 $ (63,440) (45.5)%ExpressJet segment loss . . . . . . . . . . . . . . . . . . . (117,945) (48,995) (68,950) 140.7 %SkyWest Leasing profit (Loss) . . . . . . . . . . . . . 719 (6,071) 6,790 (111.8)%
Total Segment Profit . . . . . . . . . . . . . . . . . . . . . . . . $ (41,147) $ 84,453 $ (125,600) (148.7)%Interest Income . . . . . . . . . . . . . . . . . . . . . . . . . . . . 4,096 3,689 407 11.0 %Other . . . . . . . . . . . . . . . . . . . . . . . . . . . . . . . . . . . . . 20,708 10,390 10,318 99.3 %Consolidated Income Before Taxes . . . . . . . . . . . . $ (16,343) $ 98,532 $ (114,875) (116.6)%
Total Airline Expense includes operating expense and interest expense
SkyWest Airlines Segment Profit. SkyWest Airlines segment profit decreased $63.4 million, or 45.5%, during the year ended December 31, 2014, compared to the year ended December 31, 2013. The decrease in the SkyWest Airlines’ segment profit was due primarily to the following factors:
• SkyWest Airlines operating revenue increased by $46.1 million or 2.5%, for the 2014 year compared to the 2013 year. The increase was primarily due to the additional E175 operations we began in 2014, increased government subsidies applicable to certain routes we operated and improvements in the provisions of certain of our flying contracts since 2013. The increase in operating revenue was partially offset by additional expenses described below.
• SkyWest Airlines airline expense included special items of $57.1 million for impairment charges to write-down owned EMB120 aircraft, including capitalized engine overhaul costs, and related long-lived assets to their estimated fair value and accrued obligations on leased aircraft and related costs.
• SkyWest Airlines airline expense included an increase in salaries, wages and employee benefits of $41.1 million, or 7.2%, for the 2014 year compared to the 2013 year, primarily due to direct labor costs associated with our increased pro-rate and E175 operations during the year, and increased labor related costs attributable to the implementation of the Improvement Act.
• SkyWest Airlines’ airline expense included an increase in other direct operating costs of $11.3 million, or 1.0%, during the 2014 year, compared to the 2013 year, primarily due to other operating expenses associated with the additional pro-rate and E175 operations and additional crew hotel expenses due to crew scheduling inefficiencies resulting from the Improvement Act.
ExpressJet Segment Loss. ExpressJet segment loss increased $68.9 million, or 140.7%, during the year ended December 31, 2014, compared to the year ended December 31, 2013. The increase in ExpressJet segment loss was due primarily to the following factors:

51
• ExpressJet’s operating revenue decreased by $119.5 million, or 8.1%, for the 2014 year compared to the 2013 year. The decrease in operating revenue was primarily due to a reduction in the ExpressJet fleet size and severe weather that negatively impacted the operations in the first half of 2014. These two factors resulted in a decrease in block hour production of 107,220 hours at ExpressJet, or 8.1%, for 2014 compared to 2013.
• ExpressJet airlines 2014 expenses included special items of $12.9 million for impairment charges to write-down certain ERJ145 long-lived assets, including spare engines and capitalized aircraft Improvements, to their estimated fair value and accrued obligations on leased aircraft and related costs. ExpressJet also had $4.8 million in special charges associated with the write-down of its paint facility located in Saltillo, Mexico that was sold in 2014.
• ExpressJet’s airline expense decreased $50.5 million, or 3.3%, for the 2014 year compared to the 2013 year. The decrease was not proportionate to the decrease in operating revenue for the comparable periods due to the inefficiencies and costs associated with the weather cancellations experienced in the first half of 2014 and additional expenses, including pilot training, associated with the implementation of the Improvement Act in 2014 compared to 2013.
SkyWest Leasing Profit (Loss). SkyWest Leasing profit increased $6.8 million during the year ended December 31, 2014, compared to the year ended December 31, 2013, primarily due to the additional E175 aircraft revenue attributed to the ownership costs of the E175 aircraft earned under the applicable fixed-fee flying contracts and profitability offset by the E175 aircraft depreciation and interest expense. SkyWest Leasing profit(loss) for 2013 was primarily due to maintenance costs associated with transferring aircraft costs from Air Mekong to SkyWest Airlines.
Liquidity and Capital Resources
Sources and Uses of Cash—2015 Compared to 2014
Cash Position and Liquidity. The following table provides a summary of the net cash provided by (used in) our operating, investing and financing activities for the years ended December 31, 2015 and 2014, and our total cash and marketable securities position as of December 31, 2015 and December 31, 2014 (in thousands).
For the year ended December 31, 2015 2014 $ Change % Change Net cash provided by operating activities . . . . . . . . . . . . . . . . . . . . . . $ 420,104 $ 285,539 $ 134,565 47.1 %Net cash used in investing activities . . . . . . . . . . . . . . . . . . . . . . . . . . (569,716) (585,226) 15,510 (2.7)%Net cash provided by financing activities . . . . . . . . . . . . . . . . . . . . . . 220,372 261,326 (40,954) (15.7)%
December 31, December 31, 2015 2014 $ Change % Change Cash and cash equivalents . . . . . . . . . . . . . . . . . . . . . . . . . . . . . . . . . . $ 203,035 $ 132,275 $ 70,760 53.5 %Restricted cash . . . . . . . . . . . . . . . . . . . . . . . . . . . . . . . . . . . . . . . . . . . 8,216 11,582 (3,366) (29.1)%Marketable securities . . . . . . . . . . . . . . . . . . . . . . . . . . . . . . . . . . . . . . 286,668 415,273 (128,605) (31.0)%Total . . . . . . . . . . . . . . . . . . . . . . . . . . . . . . . . . . . . . . . . . . . . . . . . . . . $ 497,919 $ 559,130 $ (61,211) (10.9)%
Cash Flows from Operating Activities. Net cash provided from operating activities increased $134.6 million, or 47.1%, during 2015, compared to 2014. The primary factors impacting our cash provided from operating activities include: our net income improved $142.0 million from 2014 to 2015 and our deferred income taxes increased $73.8 million from 2014 to 2015. Additionally, the combination of the 2014 special items, the 2014 gain on sale of our TRIP shares and the 2015 gain on early debt payoff resulted in a net decrease to cash from operations of $83.6 million.
Cash Flows from Investing Activities. Net cash used in investing activities decreased $15.5 million, or 2.7% during 2015, compared to 2014. The decrease in cash used in investing activities was primarily due to the net sales of

52
marketable securities which increased $57.4 million during 2015, compared to 2014 along with the decrease of other assets of $16.0 million during 2015, compared to 2014. These changes were partially offset by the acquisition of 25 E175 aircraft along with the related rotable spare assets in 2015, compared to 20 E175 aircraft, one used CRJ700 aircraft and 20 used CRJ200 engines along with the related rotable spare assets purchased in 2014, which in total represented an increase of $57.4 million compared to the aircraft acquisition and related rotable spare aircraft purchases from 2014. No additional aircraft deposits were made but $1.9 million in aircraft deposits were returned during 2015.
Cash Flows from Financing Activities. Net cash provided by financing activities decreased $41.0 million, or 15.7%, during 2015, compared to 2014. The decrease was primarily due to the early payoff and principal payments of long-term debt which increased $168.9 million during 2015, compared to 2014. This decrease was partially offset by the proceeds from the issuance of long-term debt of $591.9 million associated with 25 E175 aircraft acquired during 2015, compared to the issuance of long-term debt of $460.6 million associated with 20 E175 aircraft acquired during 2014.
Sources and Uses of Cash—2014 Compared to 2013
Cash Position and Liquidity. The following table provides a summary of the net cash provided by (used in) our operating, investing and financing activities for the years ended December 31, 2014 and 2013, and our total cash and marketable securities position as of December 31, 2014 and December 31, 2013 (in thousands).
For the Year ended December 31, 2014 2013 $ Change % Change Net cash provided by operating activities $ 285,539 $ 289,890 (4,351) (1.5)%Net cash used in investing activities . . . (585,226) (65,961) (519,265) 787.2 %Net cash provided by (used in) financing
activities . . . . . . . . . . . . . . . . . . . . . . . . 261,326 (187,065) 448,391 (239.7)%
December 31, December 31, 2014 2013 $ Change % Change Cash and cash equivalents . . . . . . . . . . . $ 132,275 $ 170,636 (38,361) (22.5)%Restricted cash . . . . . . . . . . . . . . . . . . . . . 11,582 12,219 (637) (5.2)%Marketable securities . . . . . . . . . . . . . . . 415,273 487,239 (71,966) (14.8)%Total . . . . . . . . . . . . . . . . . . . . . . . . . . . . . $ 559,130 $ 670,094 (110,964) (16.6)%
Cash Flows from Operating Activities. Net cash provided by operating activities decreased $4.4 million, or 1.5%, during 2014, compared to 2013. The primary factors impacting our cash provided from operating activities include: our income before income taxes was $58.4 million, excluding special items of $74.8 million, in 2014, compared to income before income taxes of $98.5 million for 2013, which resulted in a decrease in cash flows from operating activities of $40.1 million. This reduction in cash from operating activities was substantially offset by an increase in non-cash depreciation expense of $14.6 million from 2013 to 2014, primarily due to 20 E175 aircraft purchased in 2014; a reduction in capitalized EMB120 engine overhaul events, which are reflected as an operating activity, of $10.8 million from 2013 to 2014 primarily due to a reduction in the number of overhaul events; and other changes in working capital accounts.
Cash Flows from Investing Activities. Net cash used in investing activities increased $519.3 million, or 787.2% during 2014, compared to 2013. The increase in cash used in investing activities was primarily due to the acquisition of 20 E175 aircraft, one used CRJ700 aircraft and related rotable spare assets in 2014, which in total represented an increase of $563.4 million compared to the aircraft acquisition and related rotable spare aircraft purchases from 2013. This amount was offset by $40.0 million in aircraft deposits paid in 2013 associated with the order of 40 E175 aircraft. No additional aircraft deposits were made and no aircraft deposits were received during 2014.
Cash Flows from Financing Activities. Net cash provided by financing activities increased $448.4 million, or 239.7%, during 2014, compared to 2013. The increase was primarily related to proceeds from the issuance of long term debt of $460.6 million associated with 20 E175 aircraft acquired during 2014. The remaining change in cash flows from

53
financing activities was primarily due to increased principal payments on long term debt and a reduction in treasury stock purchase activity.
Liquidity and Capital Resources as of December 31, 2015 and 2014
We believe that in the absence of unusual circumstances, the working capital currently available to us, together with our projected cash flows from operations, will be sufficient to meet our present financial requirements, including anticipated expansion, planned capital expenditures, and scheduled lease payments and debt service obligations for at least the next 12 months.
At December 31, 2015, our total capital mix was 47.3% equity and 52.7% long-term debt, compared to 47.7% equity and 52.3% long-term debt at December 31, 2014.
As of December 31, 2015 and 2014, SkyWest Airlines had a $25 million line of credit. As of December 31, 2015 and 2014, SkyWest Airlines had no amount outstanding under the facility. The facility is scheduled to expire on April 19, 2016 and has a variable interest rate of Libor plus 3%.
As of December 31, 2015 and 2014, we had $88.9 million and $79.9 million, respectively, in letters of credit and surety bonds outstanding with various banks and surety institutions.
As of December 31, 2015 and 2014, we classified $8.2 million and $11.6 million as restricted cash, respectively, related to our workers compensation policies.
Significant Commitments and Obligations
General
The following table summarizes our commitments and obligations as noted for each of the next five years and thereafter (in thousands):
Total 2016 2017 2018 2019 2020 Thereafter Operating lease payments for
aircraft and facility obligations . $ 1,219,523 $ 269,520 $ 192,122 $ 154,077 $ 121,107 $ 133,659 $ 349,038 Firm aircraft commitments . . . . . 1,565,401 1,071,430 493,971 — — — —Interest commitments(A) . . . . . . . 343,386 68,561 59,763 50,850 42,515 34,568 87,129Principal maturities on long-term
debt . . . . . . . . . . . . . . . . . . . . . . 1,948,803 272,027 248,629 230,681 223,898 183,620 789,948Total commitments and
obligations . . . . . . . . . . . . . . . . $ 5,077,113 $ 1,681,538 $ 994,485 $ 435,608 $ 387,520 $ 351,847 $ 1,226,115
(A) At December 31, 2015, we had variable rate notes representing 12.1% of our total long-term debt. Actual interest commitments will change based on the actual variable interest.
Purchase Commitments and Options
On May 21, 2013, we announced our execution of an agreement with Embraer, S.A. for the purchase of 100 new E175 dual-class regional jet aircraft. Of the 100 aircraft, 99 are considered firm deliveries and the remaining aircraft is considered conditional until we enter into capacity purchase agreements to operate the aircraft. As of December 31, 2015, we had taken delivery of 45 E175s. We anticipate taking delivery of the remaining 54 E175s covered by the firm order through mid-2017.
We have not historically funded a substantial portion of our aircraft acquisitions with working capital. Rather, we have generally funded our aircraft acquisitions through a combination of manufacturer financing, operating leases and long-term debt financing. At the time of each aircraft acquisition, we evaluate the financing alternatives available to us, and select one or more of these methods to fund the acquisition. At present, we intend to fund our acquisition of additional aircraft through debt financing. Based on current market conditions and discussions with prospective leasing organizations and financial institutions, we currently believe that we will be able to obtain financing for our committed

54
acquisitions, as well as additional aircraft, without materially reducing the amount of working capital available for our operating activities.
Aircraft Lease and Facility Obligations
We also have significant long-term lease obligations, primarily relating to our aircraft fleet. At December 31, 2015, we had 470 aircraft under lease with remaining terms ranging from less than one year to 10 years. Future minimum lease payments due under all long-term operating leases were approximately $1.2 billion at December 31, 2015. Assuming a 4.89% discount rate, which is the average rate used to approximate the implicit rates within the applicable aircraft leases, the present value of these lease obligations would have been equal to approximately $1.0 billion at December 31, 2015.
Long-term Debt Obligations
As of December 31, 2015, we had $1.9 billion of long-term debt obligations related to the acquisition of CRJ200, CRJ700, CRJ900 and E175 aircraft. The average effective interest rate on those long-term debt obligations was approximately 3.7% at December 31, 2015.
Under our fixed-fee arrangements, the major airline partners compensate us for our costs of owning or leasing the aircraft on a monthly basis. The aircraft compensation structure varies by agreement, but is intended to cover either our aircraft principal and interest debt service costs, our aircraft depreciation and interest expense or our aircraft lease expense costs while the aircraft is under contract.
Guarantees
We have guaranteed the obligations of SkyWest Airlines under the SkyWest Airlines Delta Connection Agreement and the SkyWest Airlines United Express Agreement for the E175 aircraft. We have also guaranteed the obligations of ExpressJet under the ExpressJet Delta Connection Agreement and the ExpressJet United ERJ Agreement.
ITEM 7A. QUANTITATIVE AND QUALITATIVE DISCLOSURES ABOUT MARKET RISK
Aircraft Fuel
In the past, we have not experienced difficulties with fuel availability and we currently expect to be able to obtain fuel at prevailing prices in quantities sufficient to meet our future needs. Pursuant to our contract flying arrangements, United, Delta, Alaska and American have agreed to bear the economic risk of fuel price fluctuations on our contracted flights. We bear the economic risk of fuel price fluctuations on our pro-rate operations. For each of the years ended December 31, 2015, 2014 and 2013, approximately 4%, 3% and 3% of our ASMs were flown under pro-rate arrangements. For the years ended December 31, 2015, 2014 and 2013, the average price per gallon of aircraft fuel was $2.09, $3.33 and $3.45, respectively. For illustrative purposes only, we have estimated the impact of the market risk of fuel on our pro-rate operations using a hypothetical increase of 25% in the price per gallon we purchase. Based on this hypothetical assumption, we would have incurred an additional $19.1 million, $29.1 million and $25.3 million in fuel expense for the years ended December 31, 2015, 2014 and 2013, respectively.
Interest Rates
Our earnings are affected by changes in interest rates due to the amounts of variable rate long-term debt and the amount of cash and securities held. The interest rates applicable to variable rate notes may rise and increase the amount of interest expense. We would also receive higher amounts of interest income on cash and securities held at the time; however, the market value of our available-for-sale securities would likely decline. At December 31, 2015, 2014 and 2013, we had variable rate notes representing 12.1%, 41.3% and 29.5% of our total long-term debt, respectively. For illustrative purposes only, we have estimated the impact of market risk using a hypothetical increase in interest rates of one percentage point for both variable rate long-term debt and cash and securities. Based on this hypothetical assumption, we would have incurred an additional $3.5 million in interest expense and received $5.2 million in additional interest income for the year ended December 31, 2015; we would have incurred an additional $5.8 million in interest expense and received $5.5 million in additional interest income for the year ended December 31, 2014; and we would have incurred an additional $4.8 million in interest expense and received $6.7 million in additional interest income for the year ended December 31, 2013. However, under our contractual arrangement with our major partners, the majority of the increase in interest expense would be passed through and recorded as passenger revenue in our

55
consolidated statements of comprehensive income (loss). If interest rates were to decline, our major partners would receive the principal benefit of the decline, since interest expense is generally passed through to our major partners, resulting in a reduction to passenger revenue in our consolidated statement of comprehensive income (loss).
We currently intend to finance the acquisition of aircraft through manufacturer financing or long-term borrowings. Changes in interest rates may impact the actual financing cost associated with these aircraft. To the extent we place these aircraft in service under our code-share agreements with Delta, United, or other carriers, our code-share agreements currently provide that reimbursement rates will be adjusted higher or lower to reflect interest rate changes in our aircraft ownership costs.
Auction Rate Securities
We have investments in auction rate securities, which are classified as available for sale securities and reflected at fair value. As of December 31, 2015, we had investments in auction rate securities valued at a total of $2.3 million which were classified as “Other Assets” on our consolidated balance sheet. For a more detailed discussion on auction rate securities, including our methodology for estimating their fair value, see Note 6 to our consolidated financial statements appearing in Item 8 of this Report.
ITEM 8. FINANCIAL STATEMENTS AND SUPPLEMENTARY DATA
The information set forth below should be read together with the “Management’s Discussion and Analysis of Financial Condition and Results of Operations,” appearing elsewhere herein.

56
Report of Independent Registered Public Accounting Firm
The Board of Directors and Stockholders SkyWest, Inc.
We have audited the accompanying consolidated balance sheets of SkyWest, Inc. and subsidiaries as of December 31, 2015 and 2014, and the related consolidated statements of comprehensive income (loss), stockholders’ equity and cash flows for each of the three years in the period ended December 31, 2015. These financial statements are the responsibility of the Company’s management. Our responsibility is to express an opinion on these financial statements based on our audits.
We conducted our audits in accordance with the standards of the Public Company Accounting Oversight Board (United States). Those standards require that we plan and perform the audit to obtain reasonable assurance about whether the financial statements are free of material misstatement. An audit includes examining, on a test basis, evidence supporting the amounts and disclosures in the financial statements. An audit also includes assessing the accounting principles used and significant estimates made by management, as well as evaluating the overall financial statement presentation. We believe that our audits provide a reasonable basis for our opinion.
In our opinion, the financial statements referred to above present fairly, in all material respects, the consolidated financial position of SkyWest, Inc. and subsidiaries at December 31, 2015 and 2014, and the consolidated results of their operations and their cash flows for each of the three years in the period ended December 31, 2015, in conformity with U.S. generally accepted accounting principles.
We also have audited, in accordance with the standards of the Public Company Accounting Oversight Board (United States), SkyWest, Inc. and subsidiaries’ internal control over financial reporting as of December 31, 2015, based on criteria established in Internal Control—Integrated Framework issued by the Committee of Sponsoring Organizations of the Treadway Commission (2013 framework) and our report dated February 26, 2016 expressed an unqualified opinion thereon.
/s/ Ernst & Young LLP
Salt Lake City, Utah February 26, 2016
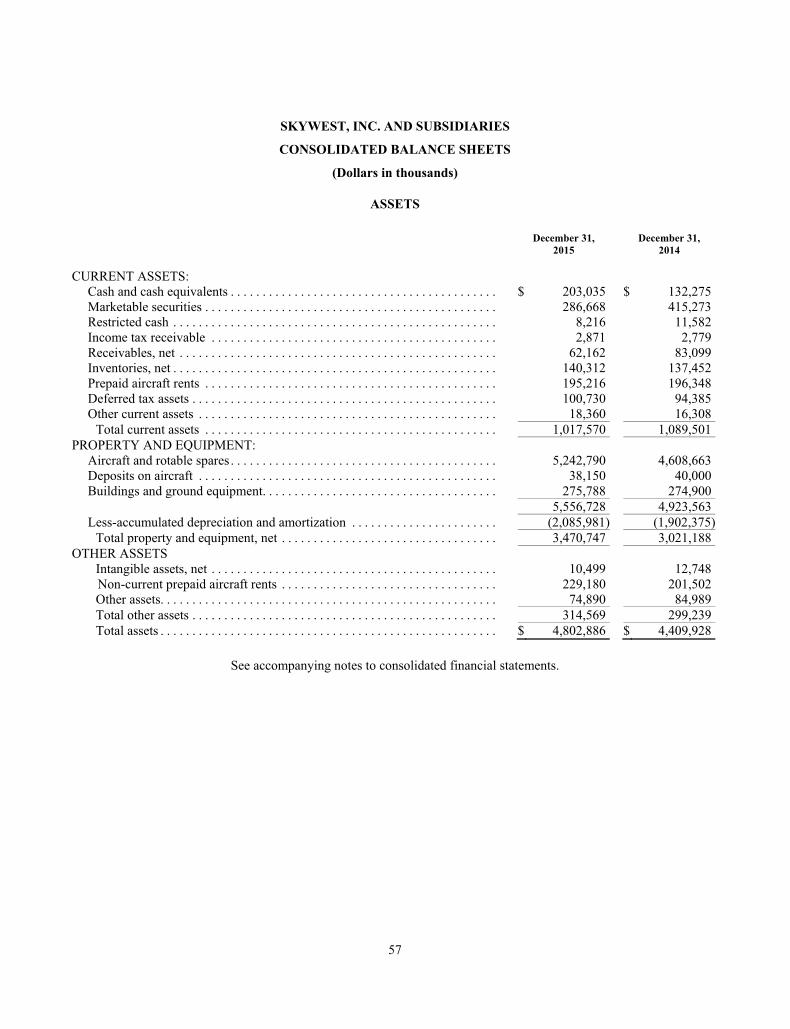
57
SKYWEST, INC. AND SUBSIDIARIES
CONSOLIDATED BALANCE SHEETS
(Dollars in thousands)
ASSETS
December 31, December 31, 2015 2014 CURRENT ASSETS:
Cash and cash equivalents . . . . . . . . . . . . . . . . . . . . . . . . . . . . . . . . . . . . . . . . . . $ 203,035 $ 132,275Marketable securities . . . . . . . . . . . . . . . . . . . . . . . . . . . . . . . . . . . . . . . . . . . . . . 286,668 415,273Restricted cash . . . . . . . . . . . . . . . . . . . . . . . . . . . . . . . . . . . . . . . . . . . . . . . . . . . 8,216 11,582Income tax receivable . . . . . . . . . . . . . . . . . . . . . . . . . . . . . . . . . . . . . . . . . . . . . 2,871 2,779Receivables, net . . . . . . . . . . . . . . . . . . . . . . . . . . . . . . . . . . . . . . . . . . . . . . . . . . 62,162 83,099Inventories, net . . . . . . . . . . . . . . . . . . . . . . . . . . . . . . . . . . . . . . . . . . . . . . . . . . . 140,312 137,452Prepaid aircraft rents . . . . . . . . . . . . . . . . . . . . . . . . . . . . . . . . . . . . . . . . . . . . . . 195,216 196,348Deferred tax assets . . . . . . . . . . . . . . . . . . . . . . . . . . . . . . . . . . . . . . . . . . . . . . . . 100,730 94,385Other current assets . . . . . . . . . . . . . . . . . . . . . . . . . . . . . . . . . . . . . . . . . . . . . . . 18,360 16,308
Total current assets . . . . . . . . . . . . . . . . . . . . . . . . . . . . . . . . . . . . . . . . . . . . . . 1,017,570 1,089,501PROPERTY AND EQUIPMENT:
Aircraft and rotable spares . . . . . . . . . . . . . . . . . . . . . . . . . . . . . . . . . . . . . . . . . . 5,242,790 4,608,663Deposits on aircraft . . . . . . . . . . . . . . . . . . . . . . . . . . . . . . . . . . . . . . . . . . . . . . . 38,150 40,000Buildings and ground equipment. . . . . . . . . . . . . . . . . . . . . . . . . . . . . . . . . . . . . 275,788 274,900
5,556,728 4,923,563Less-accumulated depreciation and amortization . . . . . . . . . . . . . . . . . . . . . . . (2,085,981) (1,902,375)
Total property and equipment, net . . . . . . . . . . . . . . . . . . . . . . . . . . . . . . . . . . 3,470,747 3,021,188OTHER ASSETS
Intangible assets, net . . . . . . . . . . . . . . . . . . . . . . . . . . . . . . . . . . . . . . . . . . . . . 10,499 12,748 Non-current prepaid aircraft rents . . . . . . . . . . . . . . . . . . . . . . . . . . . . . . . . . . 229,180 201,502
Other assets. . . . . . . . . . . . . . . . . . . . . . . . . . . . . . . . . . . . . . . . . . . . . . . . . . . . . 74,890 84,989Total other assets . . . . . . . . . . . . . . . . . . . . . . . . . . . . . . . . . . . . . . . . . . . . . . . . 314,569 299,239Total assets . . . . . . . . . . . . . . . . . . . . . . . . . . . . . . . . . . . . . . . . . . . . . . . . . . . . . $ 4,802,886 $ 4,409,928
See accompanying notes to consolidated financial statements.

58
SKYWEST, INC. AND SUBSIDIARIES
CONSOLIDATED BALANCE SHEETS (Continued)
(Dollars in thousands)
LIABILITIES AND STOCKHOLDERS’ EQUITY
December 31, December 31, 2015 2014 CURRENT LIABILITIES:
Current maturities of long-term debt . . . . . . . . . . . . . . . . . . . . . . . . . . . . . . . . . . $ 272,027 $ 211,821Accounts payable . . . . . . . . . . . . . . . . . . . . . . . . . . . . . . . . . . . . . . . . . . . . . . . . . 279,864 270,097Accrued salaries, wages and benefits . . . . . . . . . . . . . . . . . . . . . . . . . . . . . . . . . 138,291 138,902Accrued aircraft rents . . . . . . . . . . . . . . . . . . . . . . . . . . . . . . . . . . . . . . . . . . . . . . 3,226 3,303Taxes other than income taxes . . . . . . . . . . . . . . . . . . . . . . . . . . . . . . . . . . . . . . . 17,176 17,457Other current liabilities . . . . . . . . . . . . . . . . . . . . . . . . . . . . . . . . . . . . . . . . . . . . 40,802 42,775
Total current liabilities . . . . . . . . . . . . . . . . . . . . . . . . . . . . . . . . . . . . . . . . . . . . 751,386 684,355OTHER LONG TERM LIABILITIES . . . . . . . . . . . . . . . . . . . . . . . . . . . . . . . . . . 56,191 49,625LONG TERM DEBT, net of current maturities . . . . . . . . . . . . . . . . . . . . . . . . . . . 1,676,776 1,533,990DEFERRED INCOME TAXES PAYABLE . . . . . . . . . . . . . . . . . . . . . . . . . . . . . . 749,575 669,385DEFERRED AIRCRAFT CREDITS . . . . . . . . . . . . . . . . . . . . . . . . . . . . . . . . . . . . 62,523 72,227COMMITMENTS AND CONTINGENCIES (Note 5) STOCKHOLDERS’ EQUITY:
Preferred stock, 5,000,000 shares authorized; none issued . . . . . . . . . . . . . . . . — —Common stock, no par value, 120,000,000 shares authorized; 79,020,371 and 77,951,411 shares issued, respectively . . . . . . . . . . . . . . . . . . . . . . . . . . . . . . . . 641,643 626,521Retained earnings . . . . . . . . . . . . . . . . . . . . . . . . . . . . . . . . . . . . . . . . . . . . . . . . . 1,275,142 1,165,478Treasury stock, at cost, 28,015,386 and 26,765,386 shares, respectively . . . . (410,090) (391,364)Accumulated other comprehensive income (loss) . . . . . . . . . . . . . . . . . . . . . . . (260) (289)
Total stockholders’ equity . . . . . . . . . . . . . . . . . . . . . . . . . . . . . . . . . . . . . . . . . 1,506,435 1,400,346Total liabilities and stockholders’ equity . . . . . . . . . . . . . . . . . . . . . . . . . . . . . $ 4,802,886 $ 4,409,928
See accompanying notes to consolidated financial statements.

59
SKYWEST, INC. AND SUBSIDIARIES
CONSOLIDATED STATEMENTS OF COMPREHENSIVE INCOME (LOSS)
(In thousands, except per share amounts)
Year Ended December 31, 2015 2014 2013 OPERATING REVENUES:
Passenger . . . . . . . . . . . . . . . . . . . . . . . . . . . . . . . . . . . . . . . . . . . . . . . . . $ 3,030,023 $ 3,168,000 $ 3,239,525Ground handling and other . . . . . . . . . . . . . . . . . . . . . . . . . . . . . . . . . . 65,540 69,447 58,200
Total operating revenues . . . . . . . . . . . . . . . . . . . . . . . . . . . . . . . . . . . 3,095,563 3,237,447 3,297,725OPERATING EXPENSES:
Salaries, wages and benefits . . . . . . . . . . . . . . . . . . . . . . . . . . . . . . . . . 1,203,312 1,258,155 1,211,307Aircraft maintenance, materials and repairs . . . . . . . . . . . . . . . . . . . . . 604,863 682,773 686,381Aircraft rentals . . . . . . . . . . . . . . . . . . . . . . . . . . . . . . . . . . . . . . . . . . . . 273,696 305,334 325,360Depreciation and amortization . . . . . . . . . . . . . . . . . . . . . . . . . . . . . . . . 264,507 259,642 245,005Aircraft fuel . . . . . . . . . . . . . . . . . . . . . . . . . . . . . . . . . . . . . . . . . . . . . . . 118,124 193,247 193,513Ground handling services . . . . . . . . . . . . . . . . . . . . . . . . . . . . . . . . . . . 82,694 123,917 129,119Special items . . . . . . . . . . . . . . . . . . . . . . . . . . . . . . . . . . . . . . . . . . . . . . — 74,777 —Station rentals and landing fees . . . . . . . . . . . . . . . . . . . . . . . . . . . . . . . 54,167 51,024 114,688Other, net . . . . . . . . . . . . . . . . . . . . . . . . . . . . . . . . . . . . . . . . . . . . . . . . . 259,685 263,730 239,241
Total operating expenses . . . . . . . . . . . . . . . . . . . . . . . . . . . . . . . . . . . 2,861,048 3,212,599 3,144,614OPERATING INCOME . . . . . . . . . . . . . . . . . . . . . . . . . . . . . . . . . . . . . . . 234,515 24,848 153,111OTHER INCOME (EXPENSE):
Interest income . . . . . . . . . . . . . . . . . . . . . . . . . . . . . . . . . . . . . . . . . . . . 1,997 4,096 3,689Interest expense . . . . . . . . . . . . . . . . . . . . . . . . . . . . . . . . . . . . . . . . . . . (75,850) (65,995) (68,658)Other, net . . . . . . . . . . . . . . . . . . . . . . . . . . . . . . . . . . . . . . . . . . . . . . . . . 33,660 20,708 10,390
Total other expense, net . . . . . . . . . . . . . . . . . . . . . . . . . . . . . . . . . . . . (40,193) (41,191) (54,579)INCOME (LOSS) BEFORE INCOME TAXES . . . . . . . . . . . . . . . . . . . . 194,322 (16,343) 98,532PROVISION FOR INCOME TAXES . . . . . . . . . . . . . . . . . . . . . . . . . . . . 76,505 7,811 39,576NET INCOME (LOSS) . . . . . . . . . . . . . . . . . . . . . . . . . . . . . . . . . . . . . . . . $ 117,817 $ (24,154) $ 58,956BASIC EARNINGS (LOSS) PER SHARE . . . . . . . . . . . . . . . . . . . . . . . $ 2.31 $ (0.47) $ 1.14DILUTED EARNINGS (LOSS) PER SHARE . . . . . . . . . . . . . . . . . . . . . $ 2.27 $ (0.47) $ 1.12Weighted average common shares:
Basic . . . . . . . . . . . . . . . . . . . . . . . . . . . . . . . . . . . . . . . . . . . . . . . . . . . . 51,077 51,237 51,688Diluted . . . . . . . . . . . . . . . . . . . . . . . . . . . . . . . . . . . . . . . . . . . . . . . . . . . 51,825 51,237 52,422
COMPREHENSIVE INCOME (LOSS): Net income (loss) . . . . . . . . . . . . . . . . . . . . . . . . . . . . . . . . . . . . . . . . . . $ 117,817 $ (24,154) $ 58,956Proportionate share of equity method investee foreign currency translation adjustment, net of taxes . . . . . . . . . . . . . . . . . . . . . . . . . . . . — (1,129) 66Net unrealized appreciation (depreciation) on marketable securities, net of taxes . . . . . . . . . . . . . . . . . . . . . . . . . . . . . . . . . . . . . . . . . . . . . . . 29 (719) (13)
TOTAL COMPREHENSIVE INCOME (LOSS) . . . . . . . . . . . . . . . . . . . $ 117,846 $ (26,002) $ 59,009
See accompanying notes to consolidated financial statements.

60
SKYWEST, INC. AND SUBSIDIARIES
CONSOLIDATED STATEMENTS OF STOCKHOLDERS’ EQUITY
(In thousands)
Accumulated Other Common Stock Retained Treasury Stock Comprehensive Shares Amount Earnings Shares Amount Income (Loss) Total
Balance at December 31, 2012 . .
76,713 $ 609,763 $ 1,147,117 (25,280) $ (371,211) $ 1,506 $ 1,387,175
Net income . . . . . . . . . . . . . . . — — 58,956 — — — 58,956Proportionate share of other companies foreign currency translation adjustment, net of tax of $8 . . . . . . . . . . . . . . . . . . . — — — — — 66 66Net unrealized depreciation on marketable securities, net of tax of $43 . . . . . . . . . . . . . . . . . . . . — — — — — (13) (13)Exercise of common stock options and issuance of restricted stock . 313 835 — — — — 835Sale of common stock under employee stock purchase plan . . 300 3,696 — — — — 3,696Stock based compensation expense related to the issuance of stock options and restricted stock — 4,363 — — — — 4,363Tax deficiency from exercise of common stock options . . . . . . . — (146) — — — — (146)Treasury stock purchases . . . . . — — — (816) (11,739) — (11,739)Cash dividends declared ($0.16 per share) . . . . . . . . . . . . . . . . — — (8,254) — — — (8,254)Balance at December 31, 2013 . . 77,326 618,511 1,197,819 (26,096) (382,950) 1,559 1,434,939Net (loss) . . . . . . . . . . . . . . . . — — (24,154) — — — (24,154)Proportionate share of other companies foreign currency translation adjustment, net of tax of $678 . . . . . . . . . . . . . . . . . . — — — — — (1,129) (1,129)Net unrealized depreciation on marketable securities, net of tax of $437 . . . . . . . . . . . . . . . . . . . — — — — — (719) (719)Exercise of common stock options and issuance of restricted stock . 330 287 — — — — 287Sale of common stock under employee stock purchase plan . . 295 3,752 — — — — 3,752Stock based compensation expense related to the issuance of stock options and restricted stock — 5,318 — — — — 5,318Tax deficiency from exercise of common stock options . . . . . . . — (1,347) — — — — (1,347)Treasury stock purchases . . . . . — — — (669) (8,414) — (8,414)Cash dividends declared ($0.16 per share) . . . . . . . . . . . . . . . . — — (8,187) — — — (8,187)Balance at December 31, 2014 . . 77,951 626,521 1,165,478 (26,765) (391,364) (289) 1,400,346Net income . . . . . . . . . . . . . . . — — 117,817 — — — 117,817Net unrealized depreciation on marketable securities, net of tax of $18 . . . . . . . . . . . . . . . . . . . . — — — — — 29 29Exercise of common stock options and issuance of restricted stock . 815 8,490 — — — — 8,490Sale of common stock under employee stock purchase plan . . 254 3,430 — — — — 3,430Stock based compensation expense related to the issuance of stock options and restricted stock — 5,368 — — — — 5,368Tax deficiency from exercise of common stock options . . . . . . . — (2,166) — — — — (2,166)Treasury stock purchases . . . . . — — — (1,250) (18,726) — (18,726)Cash dividends declared ($0.16 per share) . . . . . . . . . . . . . . . . — — (8,153) — — — (8,153)Balance at December 31, 2015 . . 79,020 $ 641,643 $ 1,275,142 (28,015) $ (410,090) $ (260) $ 1,506,435
See accompanying notes to consolidated financial statements.

61
SKYWEST, INC. AND SUBSIDIARIES
CONSOLIDATED STATEMENTS OF CASH FLOWS
(In thousands)
Year Ended December 31, 2015 2014 2013 CASH FLOWS FROM OPERATING ACTIVITIES: Net income (loss) . . . . . . . . . . . . . . . . . . . . . . . . . . . . . . . . . . . . . . . . . . . . . . . . . . . . . $ 117,817 $ (24,154) $ 58,956Adjustments to reconcile net income (loss) to net cash provided by operating activities:
Depreciation and amortization . . . . . . . . . . . . . . . . . . . . . . . . . . . . . . . . . . . . . . . . . 264,507 259,642 245,005Stock based compensation expense . . . . . . . . . . . . . . . . . . . . . . . . . . . . . . . . . . . . . 5,368 5,318 4,363Loss on sale of property and equipment . . . . . . . . . . . . . . . . . . . . . . . . . . . . . . . . . . — 4,016 —Gain from equity ownership in TRIP and Air Mekong airlines . . . . . . . . . . . . . . . . . — (24,922) (10,830)Gain from early extinguishment of debt . . . . . . . . . . . . . . . . . . . . . . . . . . . . . . . . . . (33,660) — —Capitalized Brasilia EMB-120 engine overhauls . . . . . . . . . . . . . . . . . . . . . . . . . . . . — (18,812) (29,606)Special items . . . . . . . . . . . . . . . . . . . . . . . . . . . . . . . . . . . . . . . . . . . . . . . . . . . . . . — 74,777 —Net increase in deferred income taxes . . . . . . . . . . . . . . . . . . . . . . . . . . . . . . . . . . . . 73,844 5,054 38,007Changes in operating assets and liabilities:
Decrease in restricted cash . . . . . . . . . . . . . . . . . . . . . . . . . . . . . . . . . . . . . . . . . . 3,366 637 7,334Decrease in receivables . . . . . . . . . . . . . . . . . . . . . . . . . . . . . . . . . . . . . . . . . . . . . 21,076 25,540 18,916Increase in income tax receivable . . . . . . . . . . . . . . . . . . . . . . . . . . . . . . . . . . . . . (92) (1,939) (840)Increase in inventories . . . . . . . . . . . . . . . . . . . . . . . . . . . . . . . . . . . . . . . . . . . . . (2,860) (890) (24,513)Increase in other current assets and prepaid aircraft rents . . . . . . . . . . . . . . . . . . . . (28,598) (25,985) (31,578)Decrease in deferred aircraft credits . . . . . . . . . . . . . . . . . . . . . . . . . . . . . . . . . . . . (8,635) (7,672) (8,432)Increase in accounts payable and accrued aircraft rents . . . . . . . . . . . . . . . . . . . . . 9,690 5,852 17,594Increase (decrease) in other current liabilities . . . . . . . . . . . . . . . . . . . . . . . . . . . . . (1,719) 9,077 5,514
NET CASH PROVIDED BY OPERATING ACTIVITIES . . . . . . . . . . . . . . . . . . . . . . . 420,104 285,539 289,890CASH FLOWS FROM INVESTING ACTIVITIES:
Purchases of marketable securities . . . . . . . . . . . . . . . . . . . . . . . . . . . . . . . . . . . . . . (1,170,439) (326,964) (488,564)Sales of marketable securities . . . . . . . . . . . . . . . . . . . . . . . . . . . . . . . . . . . . . . . . . . 1,299,069 398,148 557,424Proceeds from the sale of aircraft, property and equipment . . . . . . . . . . . . . . . . . . . . 10,308 9,473 293Proceeds from installment payment of equity shares of TRIP . . . . . . . . . . . . . . . . . . — 17,237 16,658Acquisition of property and equipment:
Aircraft and rotable spare parts . . . . . . . . . . . . . . . . . . . . . . . . . . . . . . . . . . . . . . . (710,871) (653,473) (102,499)Deposits on aircraft . . . . . . . . . . . . . . . . . . . . . . . . . . . . . . . . . . . . . . . . . . . . . . . . — — (40,000)Buildings and ground equipment . . . . . . . . . . . . . . . . . . . . . . . . . . . . . . . . . . . . . . (10,405) (21,966) (9,502)Return of deposits on aircraft . . . . . . . . . . . . . . . . . . . . . . . . . . . . . . . . . . . . . . . . 1,850 — —
Decrease (increase) in other assets . . . . . . . . . . . . . . . . . . . . . . . . . . . . . . . . . . . . . . 10,772 (7,681) 229NET CASH USED IN INVESTING ACTIVITIES . . . . . . . . . . . . . . . . . . . . . . . . . . . . (569,716) (585,226) (65,961)CASH FLOWS FROM FINANCING ACTIVITIES:
Proceeds from issuance of long-term debt . . . . . . . . . . . . . . . . . . . . . . . . . . . . . . . . . 591,881 460,600 —Principal payments on long-term debt . . . . . . . . . . . . . . . . . . . . . . . . . . . . . . . . . . . . (354,277) (185,357) (171,453)Net proceeds from issuance of common stock . . . . . . . . . . . . . . . . . . . . . . . . . . . . . . 9,754 2,692 4,385Purchase of treasury stock . . . . . . . . . . . . . . . . . . . . . . . . . . . . . . . . . . . . . . . . . . . . (18,726) (8,414) (11,739)Payment of cash dividends . . . . . . . . . . . . . . . . . . . . . . . . . . . . . . . . . . . . . . . . . . . . (8,260) (8,195) (8,258)
NET CASH PROVIDED BY (USED IN) FINANCING ACTIVITIES . . . . . . . . . . . . . . 220,372 261,326 (187,065)Increase (decrease) in cash and cash equivalents . . . . . . . . . . . . . . . . . . . . . . . . . . . . . . . 70,760 (38,361) 36,864Cash and cash equivalents at beginning of year . . . . . . . . . . . . . . . . . . . . . . . . . . . . . . . 132,275 170,636 133,772CASH AND CASH EQUIVALENTS AT END OF YEAR . . . . . . . . . . . . . . . . . . . . . . 203,035 132,275 170,636SUPPLEMENTAL DISCLOSURE OF CASH FLOW INFORMATION:
Cash paid during the year for: Interest, net of capitalized amounts . . . . . . . . . . . . . . . . . . . . . . . . . . . . . . . . . . . . $ 80,657 $ 67,763 $ 71,323Income taxes . . . . . . . . . . . . . . . . . . . . . . . . . . . . . . . . . . . . . . . . . . . . . . . . . . . . . $ 5,104 $ 2,066 $ 3,678
See accompanying notes to consolidated financial statements.
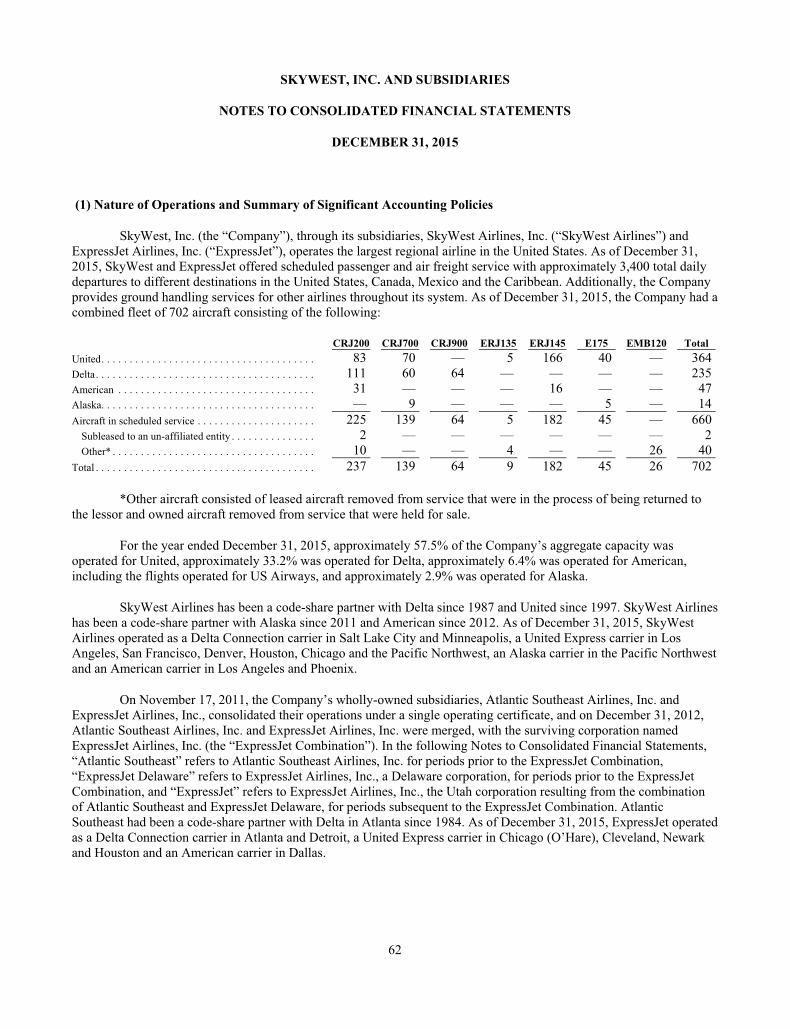
62
SKYWEST, INC. AND SUBSIDIARIES
NOTES TO CONSOLIDATED FINANCIAL STATEMENTS
DECEMBER 31, 2015
(1) Nature of Operations and Summary of Significant Accounting Policies
SkyWest, Inc. (the “Company”), through its subsidiaries, SkyWest Airlines, Inc. (“SkyWest Airlines”) and ExpressJet Airlines, Inc. (“ExpressJet”), operates the largest regional airline in the United States. As of December 31, 2015, SkyWest and ExpressJet offered scheduled passenger and air freight service with approximately 3,400 total daily departures to different destinations in the United States, Canada, Mexico and the Caribbean. Additionally, the Company provides ground handling services for other airlines throughout its system. As of December 31, 2015, the Company had a combined fleet of 702 aircraft consisting of the following:
CRJ200 CRJ700 CRJ900 ERJ135 ERJ145 E175 EMB120 Total United . . . . . . . . . . . . . . . . . . . . . . . . . . . . . . . . . . . . . . 83 70 — 5 166 40 — 364Delta . . . . . . . . . . . . . . . . . . . . . . . . . . . . . . . . . . . . . . . 111 60 64 — — — — 235American . . . . . . . . . . . . . . . . . . . . . . . . . . . . . . . . . . . 31 — — — 16 — — 47Alaska. . . . . . . . . . . . . . . . . . . . . . . . . . . . . . . . . . . . . . — 9 — — — 5 — 14Aircraft in scheduled service . . . . . . . . . . . . . . . . . . . . . 225 139 64 5 182 45 — 660
Subleased to an un-affiliated entity . . . . . . . . . . . . . . . 2 — — — — — — 2Other* . . . . . . . . . . . . . . . . . . . . . . . . . . . . . . . . . . . . 10 — — 4 — — 26 40
Total . . . . . . . . . . . . . . . . . . . . . . . . . . . . . . . . . . . . . . . 237 139 64 9 182 45 26 702
*Other aircraft consisted of leased aircraft removed from service that were in the process of being returned to the lessor and owned aircraft removed from service that were held for sale.
For the year ended December 31, 2015, approximately 57.5% of the Company’s aggregate capacity was operated for United, approximately 33.2% was operated for Delta, approximately 6.4% was operated for American, including the flights operated for US Airways, and approximately 2.9% was operated for Alaska.
SkyWest Airlines has been a code-share partner with Delta since 1987 and United since 1997. SkyWest Airlines has been a code-share partner with Alaska since 2011 and American since 2012. As of December 31, 2015, SkyWest Airlines operated as a Delta Connection carrier in Salt Lake City and Minneapolis, a United Express carrier in Los Angeles, San Francisco, Denver, Houston, Chicago and the Pacific Northwest, an Alaska carrier in the Pacific Northwest and an American carrier in Los Angeles and Phoenix.
On November 17, 2011, the Company’s wholly-owned subsidiaries, Atlantic Southeast Airlines, Inc. and ExpressJet Airlines, Inc., consolidated their operations under a single operating certificate, and on December 31, 2012, Atlantic Southeast Airlines, Inc. and ExpressJet Airlines, Inc. were merged, with the surviving corporation named ExpressJet Airlines, Inc. (the “ExpressJet Combination”). In the following Notes to Consolidated Financial Statements, “Atlantic Southeast” refers to Atlantic Southeast Airlines, Inc. for periods prior to the ExpressJet Combination, “ExpressJet Delaware” refers to ExpressJet Airlines, Inc., a Delaware corporation, for periods prior to the ExpressJet Combination, and “ExpressJet” refers to ExpressJet Airlines, Inc., the Utah corporation resulting from the combination of Atlantic Southeast and ExpressJet Delaware, for periods subsequent to the ExpressJet Combination. Atlantic Southeast had been a code-share partner with Delta in Atlanta since 1984. As of December 31, 2015, ExpressJet operated as a Delta Connection carrier in Atlanta and Detroit, a United Express carrier in Chicago (O’Hare), Cleveland, Newark and Houston and an American carrier in Dallas.

63
Basis of Presentation
The Company’s consolidated financial statements include the accounts of SkyWest, Inc. and its subsidiaries, including SkyWest Airlines and ExpressJet, with all inter-company transactions and balances having been eliminated.
In preparing the accompanying consolidated financial statements, the Company has reviewed, as determined necessary by the Company’s management, events that have occurred after December 31, 2015, through the filing date of the Company’s annual report with the U.S. Securities and Exchange Commission.
Use of Estimates
The preparation of financial statements in conformity with accounting principles generally accepted in the United States of America requires management to make estimates and assumptions that affect the reported amounts of assets and liabilities and disclosure of contingent assets and liabilities at the date of the financial statements and the reported amounts of revenues and expenses during the reporting period. Actual results could differ from those estimates.
Cash and Cash Equivalents
The Company considers all highly liquid investments with an original maturity of three months or less to be cash equivalents. The Company classified $8.2 million and $11.6 million of cash as restricted cash collateralizing letters of credit under the Company’s workers’ compensation insurance policy and classified it accordingly in the consolidated balance sheets as of December 31, 2015 and 2014, respectively.
Marketable Securities
The Company’s investments in marketable debt and equity securities are deemed by management to be available-for-sale and are reported at fair market value with the net unrealized appreciation (depreciation) reported as a component of accumulated other comprehensive income (loss) in stockholders’ equity. At the time of sale, any realized appreciation or depreciation, calculated by the specific identification method, is recognized in other income and expense. The Company’s position in marketable securities as of December 31, 2015 and 2014 was as follows (in thousands):
Gross unrealized Gross unrealized At December 31, 2015 Amortized Cost holding gains holding losses Fair market value Total cash and cash equivalents . . . . . . . . . . . . . $ 203,035 $ — $ — $ 203,035Available-for-sale securities:
Bond and bond funds . . . . . . . . . . . . . . . . . . . $ 286,857 $ — $ (220) $ 286,637Asset backed securities . . . . . . . . . . . . . . . . . 30 1 — 31
Total available-for-sale securities . . . . . . . . . . $ 286,887 $ 1 $ (220) $ 286,668Total cash and cash equivalents and available
for sale securities . . . . . . . . . . . . . . . . . . . . . . . $ 489,922 $ 1 $ (220) $ 489,703
Gross unrealized Gross unrealized At December 31, 2014 Amortized Cost holding gains holding losses Fair market value Total cash and cash equivalents . . . . . . . . . . . . . $ 132,275 $ — $ — $ 132,275Available-for-sale securities:
Bond and bond funds . . . . . . . . . . . . . . . . . . . $ 410,618 $ 9 $ (464) $ 410,163Asset backed securities . . . . . . . . . . . . . . . . . 5,108 3 (1) 5,110
Total available-for-sale securities . . . . . . . . . . $ 415,726 $ 12 $ (465) $ 415,273Total cash and cash equivalents and available
for sale securities . . . . . . . . . . . . . . . . . . . . . . . $ 548,001 $ 12 $ (465) $ 547,548

64
Marketable securities had the following maturities as of December 31, 2015 (in thousands):
Maturities Amount Year 2016 . . . . . . . . . . . . . . . . . . . . . . . . . . . . . . . . . . . . . . . . . . . . . . . . . . . . . . . . . . . . . . . $ 231,298Years 2017 through 2020 . . . . . . . . . . . . . . . . . . . . . . . . . . . . . . . . . . . . . . . . . . . . . . . . . . 55,370
As of December 31, 2015 and 2014, the Company had classified $286.7 million and $415.3 million of marketable securities, respectively, as short-term since it had the intent to maintain a liquid portfolio and the ability to redeem the securities within one year. The Company has classified approximately $2.3 million and $2.3 million of investments as non-current and has identified them as “Other assets” in the Company’s consolidated balance sheet as of December 31, 2015 and 2014, respectively (see Note 6).
Inventories
Inventories include expendable parts, fuel and supplies and are valued at cost (FIFO basis) less an allowance for obsolescence based on historical results and management’s expectations of future operations. Expendable inventory parts are charged to expense as used. An obsolescence allowance for flight equipment expendable parts is accrued based on estimated lives of the corresponding fleet types and salvage values. The inventory allowance as of December 31, 2015 and 2014 was $13.9 million and $11.6 million, respectively. These allowances are based on management estimates, which can be modified based on future changes in circumstances.
Property and Equipment
Property and equipment are stated at cost and depreciated over their useful lives to their estimated residual values using the straight-line method as follows:
Assets Depreciable Life Residual ValueNew Aircraft . . . . . . . . . . . . . . . . . . . . . . . . . . . 18 years 30 %Used Aircraft and rotable spares . . . . . . . . . . . 3 – 10 years 0 - 30 %Ground equipment . . . . . . . . . . . . . . . . . . . . . . . 5 – 10 years 0 %Office equipment . . . . . . . . . . . . . . . . . . . . . . . . 5 – 7 years 0 %Leasehold improvements . . . . . . . . . . . . . . . . . Shorter of 15 years or lease term 0 %Buildings . . . . . . . . . . . . . . . . . . . . . . . . . . . . . . 20 – 39.5 years 0 %
Impairment of Long-Lived Assets
As of December 31, 2015, the Company had approximately $5.6 billion of property and equipment and related assets. Additionally, as of December 31, 2015, the Company had approximately $10.5 million in intangible assets. In accounting for these long-lived and intangible assets, the Company makes estimates about the expected useful lives of the assets, the expected residual values of certain of these assets, and the potential for impairment based on the fair value of the assets and the cash flows they generate. On September 7, 2005, the Company acquired all of the issued and outstanding capital stock of Atlantic Southeast and recorded an intangible asset for specifically identifiable contracts of approximately $33.7 million relating to the acquisition. The intangible asset is being amortized over fifteen years under the straight-line method. As of December 31, 2015 and 2014, the Company had $23.3 million and $21.0 million in accumulated amortization expense, attributable to the acquisition, respectively. Factors indicating potential impairment include, but are not limited to, significant decreases in the market value of the long-lived assets, a significant change in the condition of the long-lived assets and operating cash flow losses associated with the use of the long-lived assets. On a periodic basis, the Company evaluates whether impairment indicators are present. When considering whether or not impairment of long-lived assets exists, the Company groups similar assets together at the lowest level for which identifiable cash flows are largely independent of the cash flows of other assets and liabilities and compare the undiscounted cash flows for each asset group to the net carrying amount of the assets supporting the asset group. Asset groupings are done at the fleet or contract level.

65
The Company did not recognize any impairment charges of long lived assets during 2015 or 2013.
In 2014, the Company had impairments on several long-lived assets relating to Embraer Brasilia EMB 120 (“EMB120”) turboprop aircraft, ERJ145 aircraft type specific assets and an aircraft paint facility located in Saltillo, Mexico. See Note 8, Special items, for the impairment charges recorded during the year ended December 31, 2014 related to the EMB120 long-lived assets, ERJ145 long-lived assets, Saltillo, Mexico paint facility and related assets.
Capitalized Interest
Interest is capitalized on aircraft purchase deposits as a portion of the cost of the asset and is depreciated over the estimated useful life of the asset. During the years ended December 31, 2015, 2014 and 2013, the Company capitalized interest costs of approximately $2.2 million, $1.8 million, and $1.2 million, respectively.
Maintenance
The Company operates under a FAA approved continuous inspection and maintenance program. The Company uses the direct expense method of accounting for its regional jet engine overhauls wherein the expense is recorded when the overhaul event occurs. The Company has engine services agreements with third-party vendors to provide long-term engine services covering the scheduled and unscheduled repairs for certain of its Bombardier CRJ700 Regional Jets (“CRJ700s”), Embraer ERJ145 regional jet aircraft and Embraer E-175 jet (“E175”) aircraft. Under the terms of the agreements, the Company pays a fixed dollar amount per engine hour flown on a monthly basis and the third-party vendors will assume the responsibility to repair the engines at no additional cost to the Company, subject to certain specified exclusions. Maintenance costs under these contracts are recognized when the engine hour is flown pursuant to the terms of each contract.
The Company used the “deferral method” of accounting for its EMB120 turboprop aircraft engine overhauls, wherein the overhaul costs were capitalized and depreciated to the next estimated overhaul event, or remaining lease term for leased aircraft, whichever was shorter. In 2015, the Company removed all of its EMB120 aircraft from service.
The costs of maintenance for airframe and avionics components, landing gear and normal recurring maintenance are expensed as incurred.
Passenger and Ground Handling Revenues
The Company recognizes passenger and ground handling revenues when the service is provided under its code-share agreements. Under the Company’s fixed fee arrangements (referred to as “fixed-fee arrangements, “contract flying” or “capacity purchase agreements”) with Delta, United, American and Alaska, the major airline generally pays the Company a fixed fee for each departure, flight or block time incurred, and an amount per aircraft in service each month with additional incentives based on completion of flights and on time performance. The major airline partner also directly reimburses the Company for certain direct expenses incurred under the fixed-fee arrangement such as fuel expense and landing fee expenses. Under the fixed-fee arrangements, revenue is earned when each flight is completed.
Under a Revenue Sharing Arrangement (referred to as a “revenue-sharing” or “pro rate” arrangement), the major airline and regional airline negotiate a passenger fare proration formula, pursuant to which the regional airline receives a percentage of the ticket revenues for those passengers traveling for one portion of their trip on the regional airline and the other portion of their trip on the major airline. Revenue is recognized under the Company’s pro rate flying agreements when each flight is completed based upon the portion of the pro rate passenger fare the Company anticipates that it will receive for each completed flight.
Other ancillary revenues commonly associated with airlines such as baggage fee revenue, ticket change fee revenue and the marketing component of the sale of mileage credits are retained by the Company’s major airline partners on flights that the Company operates under its code-share agreements.

66
In the event that the contractual rates under the agreements have not been finalized at quarterly or annual financial statement dates, the Company records revenues based on the lower of prior period’s approved rates, as adjusted to reflect any contract negotiations and the Company’s estimate of rates that will be implemented in accordance with revenue recognition guidelines. In the event the Company has a reimbursement dispute with a major partner, the Company evaluates the dispute under its established revenue recognition criteria and, provided the revenue recognition criteria have been met, the Company recognizes revenue based on management’s estimate of the resolution of the dispute.
In several of the Company’s agreements, the Company is eligible for incentive compensation upon the achievement of certain performance criteria. The incentives are defined in the agreements and are being measured and determined on a monthly, quarterly or semi-annual basis. At the end of each period, the Company calculates the incentives achieved during that period and recognizes revenue accordingly.

67
The following summarizes the significant provisions of each code share agreement the Company has with each major partner:
Delta Connection Agreements
Number of Pass through costs aircraft under Term / Termination or costs paid directly Agreement agreements Dates by major partner SkyWest Airlines • CRJ 200 - 48
• The contract is scheduled to expire on an individual aircraft basis commencing in 2016
• Fuel
Delta Connection • CRJ 700 - 19 • The final aircraft is scheduled to expire in 2022 • Engine Maintenance Agreement (fixed-fee arrangement) • CRJ 900 - 36 • The average remaining term of the aircraft under contract is 3.8 years • Landing fees • Upon expiration, aircraft may be renewed or extended • Station Rents, Deice • Insurance ExpressJet Delta • CRJ 200 - 42
• The contract is scheduled to expire on an individual aircraft basis commencing in 2016
• Fuel
Connection • CRJ 700 - 41 • The final aircraft is scheduled to expire in 2022 • Engine Maintenance Agreement (fixed-fee arrangement) • CRJ 900 - 28 • The average remaining term of the aircraft under contract is 3.7 years • Landing fees • Upon expiration, aircraft may be renewed or extended • Station Rents, Deice • Insurance SkyWest Airlines • CRJ 200 - 21 • Terminable with 30 days' notice • None Pro-rate Agreement (revenue-sharing agreement)
United Express Agreements
Pass through costs Number of or costs paid aircraft under Term / Termination directly by major Agreement agreements Dates partner SkyWest Airlines • CRJ 200 - 57
• The contract is scheduled to expire on an individual aircraft basis commencing in 2016
• Fuel
United Express • CRJ 700 - 70 • The final aircraft is scheduled to expire in 2027 • Landing fees Agreements (fixed-fee arrangement) • E175 - 40
• The average remaining term of the aircraft under contract is 4.3 years
• Station Rents, Deice
• Upon expiration, aircraft may be renewed or extended • Insurance ExpressJet United ERJ • ERJ 135 - 5
• The contract is scheduled to expire on an individual aircraft basis commencing in 2016
• Fuel
Agreement (fixed-fee arrangement) • ERJ 145 - 166 • The final aircraft is scheduled to expire in 2017 • Engine Maintenance
• The average remaining term of the aircraft under contract is 1.9 years • Landing fees
• Upon expiration, aircraft may be renewed or extended • Station Rents, Deice • Insurance SkyWest Airlines United • CRJ 200 - 26 • Terminable with 120 days' notice • None Express Pro-rate Agreement (revenue-sharing arrangement)
Alaska Capacity Purchase Agreement
Pass through costs Number of or costs paid aircraft under Term / Termination directly by major Agreement agreements Dates partner SkyWest Airlines • CRJ 700 - 9
• The contract is scheduled to expire on an individual aircraft basis commencing in 2016
• Fuel
Alaska Agreement • E175 - 5 • The final aircraft is scheduled to expire in 2028 • Landing fees (fixed-fee arrangement) • Upon expiration, aircraft may be renewed or extended • Station Rents, Deice • Insurance

68
American Agreement
Pass through costs Number of or costs paid aircraft under Term / Termination directly by major Agreement agreements Dates partner SkyWest Airlines • CRJ 200 - 12 • Scheduled to expire in 2016 • Fuel American Agreement • Upon expiration, aircraft may be renewed or extended • Landing fees (fixed-fee agreement) • Station Rents, Deice • Insurance SkyWest Airlines • CRJ 200 - 5 • Terminable with 120 days' notice • None American Pro-rate Agreement (revenue- sharing agreement) ExpressJet American • CRJ 200 - 11 • Scheduled to expire in 2017 • Fuel Agreement (fixed-fee • ERJ 145 - 16 • Upon expiration, aircraft may be renewed or extended • Landing fees agreement) • Station Rents, Deice • Insurance ExpressJet American Pro-rate • CRJ 200 - 3 • Terminable with 120 days' notice • None Agreement (revenue-sharing agreement)
As of December 31, 2015, the Company anticipated placing an additional 25 E175 aircraft with United, ten additional E175 aircraft with Alaska and 19 E175 aircraft with Delta. The delivery dates for the new aircraft are expected to take place from January 2016 to June 2017.
Under the Company’s fixed-fee arrangements, the major airline partners compensate the Company for its costs of owning or leasing the aircraft on a monthly basis. The aircraft compensation structure varies by agreement, but is intended to cover either the Company’s aircraft principal and interest debt service costs, its aircraft depreciation and interest expense or its aircraft lease expense costs while the aircraft is under contract. Under the Company’s ExpressJet United ERJ Agreement and ExpressJet American ERJ145 Agreement, the major partner provides the aircraft to the Company for a nominal amount.
The Company’s passenger and ground handling revenues could be impacted by a number of factors, including changes to the Company’s code-share agreements with Delta, United, Alaska or American, contract modifications resulting from contract re-negotiations, the Company’s ability to earn incentive payments contemplated under the Company’s code-share agreements and settlement of reimbursement disputes with the Company’s major partners.
Under the Company’s fixed-fee agreements with Delta, United, Alaska, and American, the compensation structure generally consists of a combination of agreed-upon rates for operating flights and direct reimbursement for other certain costs associated with operating the aircraft. A portion of the Company’s contract flying compensation is designed to reimburse the Company for certain aircraft ownership costs. The Company has concluded that a component of its revenue under these agreements is rental income, inasmuch as the agreements identify the “right of use” of a specific type and number of aircraft over a stated period of time. The amounts deemed to be rental income under the agreements for the years ended December 31, 2015, 2014 and 2013 were $504.9 million, $497.0 million and $500.2 million, respectively. These amounts are reflected as passenger revenues on the Company’s consolidated statements of comprehensive income (loss). The Company has not separately stated aircraft rental income and aircraft rental expense in the consolidated statement of comprehensive income (loss) since the use of the aircraft is not a separate activity of the total service provided.
Deferred Aircraft Credits
The Company accounts for incentives provided by aircraft manufacturers as deferred credits. The deferred credits related to leased aircraft are amortized on a straight-line basis as a reduction to rent expense over the lease term. Credits related to owned aircraft reduce the purchase price of the aircraft, which has the effect of amortizing the credits on a straight-line basis as a reduction in depreciation expense over the life of the related aircraft. The incentives are credits that may be used to purchase spare parts and pay for training and other expenses.

69
Income Taxes
The Company recognizes a liability or asset for the deferred tax consequences of all temporary differences between the tax basis of assets and liabilities and their reported amounts in the consolidated financial statements that are expected to result in taxable or deductible amounts in future years when the reported amounts of the assets and liabilities are recovered or settled.
Net Income (Loss) Per Common Share
Basic net income (loss) per common share (“Basic EPS”) excludes dilution and is computed by dividing net income (loss) by the weighted average number of common shares outstanding during the period. Diluted net income (loss) per common share (“Diluted EPS”) reflects the potential dilution that could occur if stock options or other contracts to issue common stock were exercised or converted into common stock. The computation of Diluted EPS does not assume exercise or conversion of securities that would have an anti-dilutive effect on net income (loss) per common share. During the years ended December 31, 2015, 2014 and 2013, 505,000, 3,191,000 and 3,072,000 shares reserved for issuance upon the exercise of outstanding options were excluded from the computation of Diluted EPS respectively, as their inclusion would be anti-dilutive.
The calculation of the weighted average number of common shares outstanding for Basic EPS and Diluted EPS are as follows for the years ended December 31, 2015, 2014 and 2013 (in thousands):
Year Ended December 31, 2015 2014 2013 Numerator: Net Income (Loss) . . . . . . . . . . . . . . . . . . . . . . . . . . . . . . . . . $ 117,817 $ (24,154) $ 58,956 Denominator: Denominator for basic earnings per-share weighted average shares . . . . . . . . . . . . . . . . . . . . . . . . . . . . . . . . . . . . . 51,077 51,237 51,688 Dilution due to stock options and restricted stock . . . . . . . . 748 — 734 Denominator for diluted earnings per-share weighted average shares . . . . . . . . . . . . . . . . . . . . . . . . . . . . . . . . . . . . . 51,825 51,237 52,422 Basic earnings (loss) per-share . . . . . . . . . . . . . . . . . . . . . . . $ 2.31 $ (0.47) $ 1.14 Diluted earnings (loss) per-share . . . . . . . . . . . . . . . . . . . . . . $ 2.27 $ (0.47) $ 1.12
Comprehensive Income (Loss)
Comprehensive income (loss) includes charges and credits to stockholders’ equity that are not the result of transactions with the Company’s shareholders. Also, comprehensive income (loss) consisted of net income (loss) plus changes in unrealized appreciation (depreciation) on marketable securities and unrealized gain (loss) on foreign currency translation adjustment related to the Company’s equity investment in Trip Linhas Aereas, a regional airline operating in Brazil (“TRIP”) and Mekong Aviation Joint Stock Company, an airline operating in Vietnam (“Air Mekong”).
Fair Value of Financial Instruments
The carrying amounts reported in the consolidated balance sheets for receivables and accounts payable approximate fair values because of the immediate or short-term maturity of these financial instruments. Marketable securities are reported at fair value based on market quoted prices in the consolidated balance sheets. If quoted prices in active markets are no longer available, the Company has estimated the fair values of these securities utilizing a discounted cash flow analysis as of December 31, 2015. These analyses consider, among other items, the collateralization underlying the security investments, the creditworthiness of the counterparty, the timing of expected future cash flows, and the expectation of the next time the security is expected to have a successful auction. The fair value of the Company’s long-term debt is estimated based on current rates offered to the Company for similar debt and was approximately $1,939.8 million as of December 31, 2015, as compared to the carrying amount of $1,948.8 million

70
as of December 31, 2015. The Company’s fair value of long-term debt as of December 31, 2014 was $1,813.1 million as compared to the carrying amount of $1,745.8 million as of December 31, 2014.
Segment Reporting
Generally accepted accounting principles require disclosures related to components of a company for which separate financial information is available to, and regularly evaluated by, the Company’s chief operating decision maker when deciding how to allocate resources and in assessing performance. The Company’s three operating segments consist of the operations conducted by SkyWest Airlines and ExpressJet, as well as other activities. Information pertaining to the Company’s reportable segments is presented in Note 2, Segment Reporting.
Recent Accounting Pronouncements
In May 2014, the Financial Accounting Standards Board (the “FASB”) issued Accounting Standards Update
No. 2014-09, “Revenue from Contracts with Customers” (“ASU No. 2014-09”). Under ASU No. 2014-09, revenue is recognized at the time a good or service is transferred to a customer for the amount of consideration received for that specific good or service. In July 2015, the FASB deferred the effective date of ASU No. 2014-09 to January 1, 2018. The FASB also proposed permitting early adoption of the standard, but not before January 1, 2017. Entities may use a full retrospective approach or report the cumulative effect as of the date of adoption. The Company’s management is currently evaluating the impact the adoption of ASU No. 2014-09 is anticipated to have on the Company’s consolidated financial statements.
In April 2015, the FASB issued Accounting Standards Update No. 2015-03, “Simplifying the Presentation of
Debt Issuance Costs” (“ASU No. 2015-03”). In August 2015, ASU No. 2015-03 was amended to modify existing guidance to require the presentation of debt issuance costs in the balance sheet as a deduction from the carrying amount of the related debt liability instead of as a deferred charge. It is effective for annual reporting periods beginning after December 15, 2015, but early adoption is permitted. The Company anticipates reclassifying the unamortized debt issuance costs and present debt net of those unamortized costs on its balance sheet upon adoption of ASU No. 2015-03. As of December 31, 2015, the Company had $20.9 million in unamortized debt issuance costs.
In November 2015, the FASB issued Accounting Standards Update 2015-17, Income Taxes (Topic 740):
Balance Sheet Classification of Deferred Taxes (“ASU No. 2015-17”). The standard requires that deferred tax liabilities and assets be classified as noncurrent in a classified statement of financial position. The current requirement that deferred tax liabilities and assets of a tax-paying component of an entity be offset and presented as a single amount is not affected by ASU No. 2015-17. ASU No. 2015-17 is effective for annual periods beginning after December 15, 2016, and interim periods within those annual periods. The Company’s management is currently evaluating the impact the adoption of ASU No. 2015-17 is anticipated to have on the Company’s consolidated financial statements.
In February 2016, the FASB issued ASU 2016-02, Leases (“ASU 2016-02”). The standard amends the existing
accounting standards for lease accounting, including requiring lessees to recognize most leases on their balance sheets and making targeted changes to lessor accounting. ASU 2016-02 will be effective beginning in the first quarter of 2019. Early adoption of ASU 2016-02 is permitted. The new leases standard requires a modified retrospective transition approach for all leases existing at, or entered into after, the date of initial application, with an option to use certain transition relief. The Company’s management is currently evaluating the impact of adopting ASU 2016-02 on the Company’s consolidated financial statements.
Immaterial error correction to consolidated balance sheet
In connection with the preparation of the Company’s consolidated financial statements for the year ended December 31, 2015, the Company determined that certain non-current prepaid aircraft rents previously reported were improperly presented as current on the Company’s consolidated balance sheet at December 31, 2014. As a result, current prepaid aircraft rents, as previously reported, were overstated by $201.5 million and non-current prepaid aircraft rents were understated by $201.5 million. The Company concluded that the error was not material to the consolidated balance sheet, but has elected to correct the error in the accompanying 2014 consolidated financial statements for consistency of

71
presentation. The classification error had no effect on the consolidated statements of comprehensive income (loss), stockholders’ equity, or cash flows for the year ended December 31, 2014.
(2) Segment Reporting
Generally accepted accounting principles require disclosures related to components of a company for which separate financial information is available to, and regularly evaluated by, the Company’s chief operating decision maker when deciding how to allocate resources and in assessing performance.
The Company’s three operating segments consist of the operations of SkyWest Airlines, ExpressJet and SkyWest Leasing activities. Corporate overhead expense incurred by the Company is allocated to the operating expenses of SkyWest Airlines and ExpressJet.
During the fourth quarter of 2015, due to the increase in acquired E175 aircraft and the related aircraft debt financing, the Company’s chief operating decision maker started to analyze the flight operations of the Company’s E175 aircraft separately from the acquisition, ownership and financing costs and related revenue. Because of this change, the “SkyWest Leasing” segment includes revenue attributed to the Company’s E175 ownership cost earned under the applicable fixed-fee flying contracts, and the depreciation and interest expense of the Company’s E175 aircraft. The “SkyWest Leasing” segment’s total assets and capital expenditures include the acquired E175 aircraft. The “SkyWest Leasing” segment additionally includes the activity of two CRJ200 aircraft leased to a third party.
As a result of the change in segmentation, prior periods have been recast to conform to the current presentation. The Company reclassified $15.0 million of operating revenue, $8.5 million of depreciation expense, $5.0 million of interest expense, $1.6 million of segment profit, $527.0 million of total assets and $535.5 million of capital expenditures (including non-cash) from the “SkyWest Airlines” segment to the “SkyWest Leasing” segment for the year ended December 31, 2014 to reflect the respective E175 activity in the “SkyWest Leasing” segment for 2014.
During the fourth quarter of 2015, the Company resolved a contract matter with one of its major partners that resulted in a $7.9 million reduction to revenue. This reduction is reflected in the SkyWest Leasing segment as this amount related to an aircraft financing matter for the year ended December 31, 2015.
The following represents the Company’s segment data for the years ended December 31, 2015, 2014 and 2013 (in thousands).
Year Ended December 31, 2015 SkyWest Airlines ExpressJet SkyWest Leasing Consolidated Operating revenues . . . . . . . . . . . . . . . . . . . . . . . $ 1,848,363 $ 1,169,923 $ 77,277 $ 3,095,563Operating expense . . . . . . . . . . . . . . . . . . . . . . . . 1,630,200 1,192,070 38,778 2,861,048Depreciation and amortization expense . . . . . . . 141,189 86,382 36,936 264,507Interest expense . . . . . . . . . . . . . . . . . . . . . . . . . . 36,141 12,091 27,618 75,850Segment profit (loss) (1) . . . . . . . . . . . . . . . . . . . 182,022 (34,238) 10,881 158,665Identifiable intangible assets, other than goodwill . . . . . . . . . . . . . . . . . . . . . . . . . . . . . . . . — 10,499 — 10,499
Total assets . . . . . . . . . . . . . . . . . . . . . . . . . . . . . . 2,319,295 1,332,995 1,150,596 4,802,886Capital expenditures (including non-cash) . . . . 30,897 24,679 659,513 715,089

72
Year Ended December 31, 2014 SkyWest Airlines ExpressJet SkyWest Leasing Consolidated Operating revenues . . . . . . . . . . . . . . . . . . . . . . . $ 1,873,675 $ 1,346,859 $ 16,913 $ 3,237,447Operating expense . . . . . . . . . . . . . . . . . . . . . . . . 1,758,145 1,446,050 8,404 3,212,599Depreciation and amortization expense . . . . . . . 162,699 88,459 8,484 259,642Interest expense . . . . . . . . . . . . . . . . . . . . . . . . . . 39,452 18,754 7,789 65,995Segment profit (loss) (1) . . . . . . . . . . . . . . . . . . . 76,078 (117,945) 720 (41,147)Identifiable intangible assets, other than
goodwill . . . . . . . . . . . . . . . . . . . . . . . . . . . . . . — 12,748 — 12,748
Total assets . . . . . . . . . . . . . . . . . . . . . . . . . . . . . . 2,492,828 1,390,129 526,971 4,409,928Capital expenditures (including non-cash) . . . . 137,678 23,790 535,455 696,923
Year Ended December 31, 2013 SkyWest Airlines ExpressJet SkyWest Leasing Consolidated Operating revenues . . . . . . . . . . . . . . . . . . . . . . . $ 1,827,568 $ 1,466,341 $ 3,816 $ 3,297,725Operating expense . . . . . . . . . . . . . . . . . . . . . . . . 1,644,129 1,494,302 6,183 3,144,614Depreciation and amortization expense . . . . . . . 155,667 89,338 — 245,005Interest expense . . . . . . . . . . . . . . . . . . . . . . . . . . 43,920 21,034 3,704 68,658Segment profit (loss) (1) . . . . . . . . . . . . . . . . . . . 139,519 (48,995) (6,071) 84,453Identifiable intangible assets, other than goodwill . . . . . . . . . . . . . . . . . . . . . . . . . . . . . . . . — 14,998 — 14,998
Total assets . . . . . . . . . . . . . . . . . . . . . . . . . . . . . . 2,532,431 1,700,788 — 4,233,219Capital expenditures (including non-cash) . . . . 103,387 38,657 — 142,044
(1) Segment profit is operating income less interest expense

73
(3) Long-term Debt
Long-term debt consisted of the following as of December 31, 2015 and 2014 (in thousands):
December 31, December 31, 2015 2014 Notes payable to banks, due in semi-annual installments, variable interest
based on LIBOR, or with interest rates ranging from 1.29% to 2.22% through 2016 to 2020, secured by aircraft . . . . . . . . . . . . . . . . . . . . . . . . $ 108,348 $ 174,159
Notes payable to a financing company, due in semi-annual installments, variable interest based on LIBOR, or with interest rates ranging from 1.76% to 3.25% through 2017 to 2021, secured by aircraft . . . . . . . . . . 217,341 350,177
Notes payable to banks, due in semi-annual installments plus interest at 6.06% to 6.51% through 2021, secured by aircraft . . . . . . . . . . . . . . . . . 108,069 129,201
Notes payable to a financing company, due in semi-annual installments plus interest at 5.78% to 6.23% through 2017, secured by aircraft . . . . . 17,208 25,090
Notes payable to banks, due in monthly installments plus interest of 2.68% to 6.86% through 2025, secured by aircraft . . . . . . . . . . . . . . . . . 479,170 572,446
Notes payable to banks, due in monthly installments, plus interest at 6.05% through 2020, secured by aircraft . . . . . . . . . . . . . . . . . . . . . . . . . 11,304 13,551
Notes payable to banks, due in monthly installments, plus interest at 3.10% through 2019, secured by aircraft . . . . . . . . . . . . . . . . . . . . . . . . . 4,615 5,909
Notes payable to banks, due in quarterly installments plus interest at 3.39% to 4.02% through 2027, secured by aircraft . . . . . . . . . . . . . . . . . 966,156 446,724
Notes payable to banks, due in monthly installments, plus interest based on LIBOR at 3.21% to 3.33% through 2017, secured by aircraft . . . . . . 14,538 28,554
Notes payable to banks due in monthly installments, interest at 3.30% through 2019, secured by spare engines . . . . . . . . . . . . . . . . . . . . . . . . . . 22,054 —
Long-term debt . . . . . . . . . . . . . . . . . . . . . . . . . . . . . . . . . . . . . . . . . . . . . . . $ 1,948,803 $ 1,745,811Less current maturities . . . . . . . . . . . . . . . . . . . . . . . . . . . . . . . . . . . . . . . . . (272,027) (211,821)Long-term debt, net of current maturities . . . . . . . . . . . . . . . . . . . . . . . . . . $ 1,676,776 $ 1,533,990
During the year ended December 31, 2015, the Company acquired 25 new E175 aircraft. Approximately 85% of the aircraft purchase price was financed through the issuance of debt and 15% of the aircraft purchase price was paid with cash.
As of December 31, 2015, the Company had $1.9 billion of long-term debt obligations primarily related to the acquisition of CRJ200, CRJ700, CRJ900 and E175 aircraft. The average effective interest rate on the debt related to those long-term debt obligations was approximately 3.7% at December 31, 2015.
During the year ended December 31, 2015, the Company used $110.8 million in cash to pay off $145.4 million in debt. The payment resulted in a pre-tax gain of $33.7 million, net of the write off of deferred loan costs associated with the debt, reflected as other income in the consolidated statements of comprehensive income (loss), of which the Company used $94 million in cash to pay off $128 million in debt, resulting in a pre-tax gain of $33 million during the fourth quarter of 2015.
The aggregate amounts of principal maturities of long-term debt as of December 31, 2015 were as follows (in thousands):

74
2016 . . . . . . . . . . . . . . . . . . . . . . . . . . . . . . . . . . . . . . . . . . . . . . . . . . . $ 272,027 2017 . . . . . . . . . . . . . . . . . . . . . . . . . . . . . . . . . . . . . . . . . . . . . . . . . . . 248,6292018 . . . . . . . . . . . . . . . . . . . . . . . . . . . . . . . . . . . . . . . . . . . . . . . . . . . 230,6812019 . . . . . . . . . . . . . . . . . . . . . . . . . . . . . . . . . . . . . . . . . . . . . . . . . . . 223,8982020 . . . . . . . . . . . . . . . . . . . . . . . . . . . . . . . . . . . . . . . . . . . . . . . . . . . 183,620Thereafter . . . . . . . . . . . . . . . . . . . . . . . . . . . . . . . . . . . . . . . . . . . . . . . 789,948 $ 1,948,803
As of December 31, 2015 and 2014, SkyWest Airlines had a $25 million line of credit. As of December 31, 2015 and 2014, SkyWest Airlines had no amount outstanding under the facility. However, at December 31, 2015 and 2014 the Company had $6 million and $5 million, respectively, in letters of credit issued under the facility which reduced the amount available under the facility to $19 million and $20 million, respectively. The facility expires on April 19, 2016 and has a variable interest rate of Libor plus 3.0%.
As of December 31, 2015 and 2014, the Company had $88.9 million and $79.9 million, respectively, in letters of credit and surety bonds outstanding with various banks and surety institutions.
(4) Income Taxes
The provision for income taxes includes the following components (in thousands):
Year ended December 31, 2015 2014 2013 Current tax provision (benefit):
Federal. . . . . . . . . . . . . . . . . . . . . . . . . . . . $ 3,801 $ (176) $ 1,767State . . . . . . . . . . . . . . . . . . . . . . . . . . . . . . 1,035 838 343Foreign . . . . . . . . . . . . . . . . . . . . . . . . . . . — 2,081 —
4,836 2,743 2,110Deferred tax provision (benefit):
Federal. . . . . . . . . . . . . . . . . . . . . . . . . . . . 66,430 4,697 34,728State . . . . . . . . . . . . . . . . . . . . . . . . . . . . . . 5,239 371 2,738
71,669 5,068 37,466Provision for income taxes . . . . . . . . . . . . . . $ 76,505 $ 7,811 $ 39,576
The following is a reconciliation between the statutory federal income tax rate of 35% and the effective rate which is derived by dividing the provision for income taxes by income (loss) before for income taxes (in thousands):
Year ended December 31, 2015 2014 2013 Computed provision (benefit) for income taxes at the
statutory rate . . . . . . . . . . . . . . . . . . . . . . . . . . . . . . . . . . $ 68,013 $ (5,720) $ 34,486Increase (decrease) in income taxes resulting from:
State income tax provision (benefit), net of federal income tax benefit . . . . . . . . . . . . . . . . . . . . . . . . . . . 5,416 (107) 2,867
Non-deductible expenses . . . . . . . . . . . . . . . . . . . . . . . 3,641 3,865 3,257Valuation allowance changes affecting the provision
for income taxes . . . . . . . . . . . . . . . . . . . . . . . . . . . . (899) 5,981 1,430Foreign income taxes, net of federal & state benefit . — 1,973 Other, net . . . . . . . . . . . . . . . . . . . . . . . . . . . . . . . . . . . . 334 1,819 (2,464)
Provision for income taxes . . . . . . . . . . . . . . . . . . . . . . . . $ 76,505 $ 7,811 $ 39,576

75
For the year ended December 31, 2015, the Company released a $0.9 million valuation allowance against certain deferred tax assets primarily associated with ExpressJet state net operating losses with a limited carry forward period. The release of the valuation allowance was based on the Company's gain resulting from the early retirement of certain long term debt which reduced the amount of deferred tax assets that were anticipated to expire before the deferred tax assets may be utilized.
For the year ended December 31, 2014, the Company recorded a $6.0 million valuation allowance against certain deferred tax assets primarily associated with ExpressJet state net operating losses with a limited carry forward period. The valuation allowance was based on the Company’s assessment of deferred tax assets that are anticipated to expire before the deferred tax assets may be utilized. The Company additionally recorded a $2.0 million foreign tax expense associated with Brazilian withholding tax on the sale of the Company's equity ownership in TRIP.
For the year ended December 31, 2013, the Company recorded a $1.4 million valuation allowance against certain deferred tax assets primarily associated with ExpressJet state net operating losses with a limited carry forward period. The valuation allowance was based on the Company’s assessment at December 31, 2013 of deferred tax assets that were anticipated to expire before the deferred tax assets may be utilized.
The significant components of the Company’s net deferred tax assets and liabilities as of December 31, 2015 and 2014 are as follows (in thousands):
As of December 31, 2015 2014 Deferred tax assets:
Intangible Asset . . . . . . . . . . . . . . . . . . . . . . . . . . . . . . $ 30,369 $ 34,819Accrued benefits . . . . . . . . . . . . . . . . . . . . . . . . . . . . . . 47,514 43,853Net operating loss carryforward . . . . . . . . . . . . . . . . . 82,211 152,361AMT credit carryforward . . . . . . . . . . . . . . . . . . . . . . 21,391 17,590Deferred aircraft credits . . . . . . . . . . . . . . . . . . . . . . . . 55,544 53,797Accrued reserves and other . . . . . . . . . . . . . . . . . . . . . 24,575 27,008
Total deferred tax assets . . . . . . . . . . . . . . . . . . . . . . . . . . 261,604 329,428Valuation allowance . . . . . . . . . . . . . . . . . . . . . . . . . . . . . (8,126) (9,025)Deferred tax liabilities:
Accelerated depreciation . . . . . . . . . . . . . . . . . . . . . . . (902,322) (895,405)Total deferred tax liabilities . . . . . . . . . . . . . . . . . . . . . . . (902,322) (895,405)Net deferred tax liability . . . . . . . . . . . . . . . . . . . . . . . . . . $ (648,844) $ (575,002)
The Company’s deferred tax liabilities were primarily generated through accelerated depreciation, combined with shorter depreciable tax lives, allowed under the IRS tax code for purchased aircraft and support equipment compared to the Company’s US GAAP depreciation policy for such assets using the straight-line method (see note 1 Nature of Operations and Summary of Significant Accounting Policies).
The Company's valuation allowance is related to certain deferred tax assets with a limited carry forward period. The Company does not anticipate utilizing these deferred tax assets prior to the lapse of the carry forward period.
At December 31, 2015 and 2014, the Company had federal net operating losses, net of valuation allowance, of approximately $189.0 million and $379.3 million and state net operating losses of approximately $352.2 million and $452.2 million, respectively. The estimated effective tax rate applicable to the state and federal net operating losses net of valuation allowances as of December 31, 2015 was 35.0% and 2.6%, respectively. The Company anticipates that the federal and state net operating losses will start to expire in 2026 and 2017, respectively. The Company has recorded a valuation allowance for state net operating losses the Company anticipates will expire before the benefit will be realized due to the limited carry forward periods. As of December 31, 2015 and 2014, the Company also had an alternative minimum tax credit of approximately $21.4 million and $17.6 million, respectively, which does not expire.

76
(5) Commitments and Contingencies
Lease Obligations
The Company leases 470 aircraft, as well as airport facilities, office space, and various other property and equipment under non-cancelable operating leases which are generally on a long-term net rent basis where the Company pays taxes, maintenance, insurance and certain other operating expenses applicable to the leased property. The following table summarizes future minimum rental payments required under operating leases that have non-cancelable lease terms as of December 31, 2015 (in thousands):
Year ended December 31, 2016 . . . . . . . . . . . . . . . . . . . . . . . . . . . . . . . . . . . . . . . . . . . . . . . . . . . . . . . . . . . . . . $ 269,520 2017 . . . . . . . . . . . . . . . . . . . . . . . . . . . . . . . . . . . . . . . . . . . . . . . . . . . . . . . . . . . . . . 192,1222018 . . . . . . . . . . . . . . . . . . . . . . . . . . . . . . . . . . . . . . . . . . . . . . . . . . . . . . . . . . . . . . 154,0772019 . . . . . . . . . . . . . . . . . . . . . . . . . . . . . . . . . . . . . . . . . . . . . . . . . . . . . . . . . . . . . . 121,1072020 . . . . . . . . . . . . . . . . . . . . . . . . . . . . . . . . . . . . . . . . . . . . . . . . . . . . . . . . . . . . . . 133,659Thereafter . . . . . . . . . . . . . . . . . . . . . . . . . . . . . . . . . . . . . . . . . . . . . . . . . . . . . . . . . . 349,038 $ 1,219,523
The majority of the Company’s leased aircraft are owned and leased through trusts whose sole purpose is to purchase, finance and lease these aircraft to the Company; therefore, they meet the criteria of a variable interest entity. However, since these are single owner trusts in which the Company does not participate, the Company is not considered at risk for losses and is not considered the primary beneficiary. As a result, based on the current rules, the Company is not required to consolidate any of these trusts or any other entities in applying the accounting guidance. The Company’s management believes that the Company’s maximum exposure under these leases is the remaining lease payments.
The Company’s leveraged lease agreements typically obligate the Company to indemnify the equity/owner participant against liabilities that may arise due to changes in benefits from tax ownership of the respective leased aircraft. The terms of these contracts range up to 11 years. The Company did not accrue any liability relating to the indemnification to the equity/owner participant because of management’s assessment that the probability of this occurring is remote.
During the year ended December 31, 2015, the Company built a maintenance facility in Boise, Idaho and entered into a sale lease-back agreement with the city of Boise. The sales price of the facility was $18.5 million and the operating lease expires in 2040. The future lease obligations for the Boise maintenance facility are included in the above future minimum rental payments schedule.
Total rental expense for non-cancelable aircraft operating leases was approximately $273.7 million, $305.3 million and $325.4 million for the years ended December 31, 2015, 2014 and 2013, respectively. The minimum rental expense for airport station rents was approximately $35.1 million, $29.0 million and $35.1 million for the years ended December 31, 2015, 2014 and 2013, respectively.
Self-insurance
The Company self-insures a portion of its potential losses from claims related to workers’ compensation, environmental issues, property damage, medical insurance for employees and general liability. Losses are accrued based on an estimate of the ultimate aggregate liability for claims incurred, using standard industry practices and the Company’s actual experience. Actual results could differ from these estimates.

77
Legal Matters
The Company is subject to certain legal actions which it considers routine to its business activities. As of December 31, 2015, management believed, after consultation with legal counsel, that the ultimate outcome of such legal matters was not likely to have a material adverse effect on the Company’s financial position, liquidity or results of operations.
Concentration Risk and Significant Customers
The Company requires no collateral from its major partners or customers but monitors the financial condition of its major partners. Under the majority of the Company’s code-share agreements, the Company receives weekly payments from its major code share partners that approximates a significant percentage of the compensation earned for such period. Additionally, the Company provides certain customer service functions at multiple airports for various airlines and the Company maintains an allowance for doubtful accounts receivable based upon expected collectability of all accounts receivable. The Company’s allowance for doubtful accounts totaled $187,300 and $326,600 as of December 31, 2015 and 2014, respectively. For the years ended December 31, 2015, 2014 and 2013, the Company’s contractual relationships with Delta and United combined accounted for approximately 86.9%, 88.7% and 91.6%, respectively of the Company’s total revenues.
Employees Under Collective Bargaining Agreements
As of December 31, 2015, the Company had approximately 18,300 full-time equivalent employees. Approximately 38.0% of these employees were represented by unions, including the following employee groups. Notwithstanding the completion of the ExpressJet Combination, ExpressJet’s employee groups continue to be represented by those unions who provided representation prior to the ExpressJet Combination.
Accordingly, the following table refers to ExpressJet’s employee groups based upon their union affiliations prior to the ExpressJet Combination.
Approximate Number of Active Employees Status of Employee Group Represented Representatives Agreement Atlantic Southeast Pilots . . 1,491 Air Line Pilots Association International Amendable February 2018Atlantic Southeast Flight
Attendants . . . . . . . . . . . . 1,031 International Association of Machinists and Aerospace Workers Amendable
Atlantic Southeast Flight Controllers. . . . . . . . . . . . 36 Transport Workers Union of America Amendable
Atlantic Southeast Mechanics . . . . . . . . . . . . 364 International Brotherhood of Teamsters Amendable
Atlantic Southeast Stock Clerks . . . . . . . . . . . . . . . 73 International Brotherhood of Teamsters Amendable
ExpressJet Delaware Pilots 2,107 Air Line Pilots Association International Amendable February 2018ExpressJet Delaware Flight
Attendants . . . . . . . . . . . . 993 International Association of Machinists and Aerospace Workers Amendable
ExpressJet Delaware Mechanics . . . . . . . . . . . . 711 International Brotherhood of Teamsters Amendable
ExpressJet Delaware Dispatchers . . . . . . . . . . . 53 Transport Workers Union of America Amendable
ExpressJet Delaware Stock Clerks . . . . . . . . . . . . . . . 96 International Brotherhood of Teamsters Amendable

78
In February 2016, the Atlantic Southeast Pilots and the ExpressJet Delaware Pilots ratified a two-year contract extension to their respective labor agreements.
(6) Fair Value Measurements
The Company holds certain assets that are required to be measured at fair value in accordance with United States GAAP. The Company determined fair value of these assets based on the following three levels of inputs:
Level 1—Quoted prices in active markets for identical assets or liabilities. Level 2—Observable inputs other than Level 1 prices such as quoted prices for similar assets
or liabilities; quoted prices in markets that are not active; or other inputs that are observable or can be corroborated by observable market data for substantially the full term of the assets or liabilities. Some of the Company’s marketable securities primarily utilize broker quotes in a non-active market for valuation of these securities.
Level 3—Unobservable inputs that are supported by little or no market activity and that are significant to the fair value of the assets or liabilities, therefore requiring an entity to develop its own assumptions.
As of December 31, 2015, the Company held certain assets that are required to be measured at fair value on a recurring basis. Assets measured at fair value on a recurring basis are summarized below (in thousands):
Fair Value Measurements as of December 31, 2015 Total Level 1 Level 2 Level 3 Marketable Securities
Bonds . . . . . . . . . . . . . . . . . . . . . . . . . . . . . . . . . . . . . . . . . . . . . . . $ 286,637 $ — $ 286,637 $ —Commercial paper . . . . . . . . . . . . . . . . . . . . . . . . . . . . . . . . . . . . 31 — 31 —
Asset backed securities . . . . . . . . . . . . . . . . . . . . . . . . . . . . . . . . . . . $ 286,668 $ — $ 286,668 $ —Cash, Cash Equivalents and Restricted Cash . . . . . . . . . . . . . . . . . 211,251 211,251 — —Other Assets(a) . . . . . . . . . . . . . . . . . . . . . . . . . . . . . . . . . . . . . . . . . 2,321 (a) — — 2,321Total Assets Measured at Fair Value . . . . . . . . . . . . . . . . . . . . . . . . $ 500,240 $ 211,251 $ 286,668 $ 2,321
Fair Value Measurements as of December 31, 2014 Total Level 1 Level 2 Level 3 Marketable Securities
Bonds . . . . . . . . . . . . . . . . . . . . . . . . . . . . . . . . . . . . . . . . . . . . . . . $ 410,163 $ — $ 410,163 $ —Commercial paper . . . . . . . . . . . . . . . . . . . . . . . . . . . . . . . . . . . . 5,110 — 5,110 —Asset backed securities . . . . . . . . . . . . . . . . . . . . . . . . . . . . . . . . 415,273 — 415,273 —
Cash, Cash Equivalents and Restricted Cash . . . . . . . . . . . . . . . . . 143,857 143,857 — —Other Assets(a) . . . . . . . . . . . . . . . . . . . . . . . . . . . . . . . . . . . . . . . . . 2,309 — — 2,309Total Assets Measured at Fair Value . . . . . . . . . . . . . . . . . . . . . . . . $ 561,439 $ 143,857 $ 415,273 $ 2,309
(a) Auction rate securities included in long-term “Other assets” in the Consolidated Balance Sheet
Based on market conditions, the Company uses a discounted cash flow valuation methodology for auction rate securities. Accordingly, for purposes of the foregoing consolidated financial statements, these securities were categorized as Level 3 securities. The Company’s “Marketable Securities” classified as Level 2 primarily utilize broker quotes in a non-active market for valuation of these securities.
No significant transfers between Level 1, Level 2 and Level 3 occurred during the year ended December 31, 2015. The Company’s policy regarding the recording of transfers between levels is to record any such transfers at the end of the reporting period.

79
The following table presents the Company’s assets measured at fair value on a recurring basis using significant unobservable inputs (Level 3) at December 31, 2015 (in thousands):
Fair Value Measurements Using Significant Unobservable Inputs
(Level 3)
Auction Rate Securities Balance at January 1, 2015 . . . . . . . . . . . . . . . . . . . . . . . . . . . . . . . . . . . $ 2,309Total realized and unrealized gains or (losses)
Included in earnings . . . . . . . . . . . . . . . . . . . . . . . . . . . . . . . . . . . . . . —Included in other comprehensive income . . . . . . . . . . . . . . . . . . . . . 12
Transferred out . . . . . . . . . . . . . . . . . . . . . . . . . . . . . . . . . . . . . . . . . . . . —Settlements . . . . . . . . . . . . . . . . . . . . . . . . . . . . . . . . . . . . . . . . . . . . . . . . —Balance at December 31, 2015 . . . . . . . . . . . . . . . . . . . . . . . . . . . . . . . . $ 2,321
(7) Investment in Other Companies
In 2014, the Company completed the sale of its 20% interest in TRIP to Trip investments Ltda (“Trip Investimentos”) for $42 million. The Company recorded a gain from the sale of its TRIP shares of $24.9 million during the year ended December 31, 2014, which is reflected in Other Income in the Consolidated Statements of Comprehensive Income (Loss).
In 2013, the Company sold its 30% ownership interest in Mekong Aviation Joint Stock Company, an airline operating in Vietnam (“Air Mekong”). The Company recognized a gain from the sale of its Air Mekong shares of $5 million during the year ended December 31, 2013, which is reflected in other income in the Consolidated Statements of Comprehensive Income (Loss). Additionally, in 2013, the Company terminated its sub-lease of certain aircraft to Air Mekong and recognized $5.1 million of other income during the year ended December 31, 2013 primarily due to the recognition of collected and realized contingent rent payments, net of the write-off of certain maintenance deposits.
(8) Special Items
The following table summarizes the components of the Company's special items, for the year ended December 31, 2015, 2014 and 2013 (in thousands):
Year ended December 31, 2015 2014 2013 Special items:
EMB120 aircraft related items 1 . . . . . . . . . $ — $ 57,046 $ —ERJ145 aircraft related items 2 . . . . . . . . . . — 12,931 —Paint facility and related items 3 . . . . . . . . . — 4,800 —
Total special items . . . . . . . . . . . . . . . . . . . . . . . $ — $ 74,777 $ —
(1) Consists primarily of impairment charges to write-down owned EMB120 aircraft including capitalized engine overhaul costs, and related long-lived assets to their estimated fair value write down of $48.3 million and accrued obligations on leased aircraft and related costs of $8.8 million. The estimated fair value of the long-lived assets was based on third party valuations for similar assets which is considered an unobservable input (Level 3) under the fair value hierarchy. In November 2014, the Company approved a plan to discontinue operating the EMB120 aircraft by the end of the second quarter of 2015. The decision to discontinue use of the EMB120 aircraft included management’s assessment of the need for pilots to operate upcoming deliveries for the E175 aircraft, the incremental training cost to hire new pilots compared to retraining existing EMB120 pilots to operate CRJ or E175 aircraft, and the uncertainty related to the number of qualified pilots available for hire, combined with the overall age and

80
increased operating costs of the Company’s EMB120 fleet. These special items are reflected in the SkyWest Airlines operating expenses under Note 2 Segment Reporting.
(2) Consists primarily of impairment charges to write-down certain ERJ145 long-lived assets, which primarily consisted
of spare engines and ERJ145 spare aircraft parts, to their estimated fair value of $11.4 million and accrued obligations on leased aircraft and related costs of $1.5 million. The estimated fair value of the long-lived assets was based on third party valuations for similar assets which is considered an unobservable input (Level 3) under the fair value hierarchy. In November 2014, the Company entered into an amended and restated contract with United that accelerated the lease terminations of certain ERJ145 aircraft and accelerated the termination date of the Company’s flying contract to operate the ERJ145s with United from the year 2020 to 2017. The reduced term shortened the anticipated useful life of the ERJ145 long-lived assets which triggered the impairment evaluation. These special items are reflected in the ExpressJet operating expenses under Note 2 Segment Reporting.
(3) Consists primarily of the write-down of assets associated with the disposition of the Company’s paint facility
located in Saltillo, Mexico, which was sold during the year ended December 31, 2014. These special items are reflected in the ExpressJet operating expenses under Note 2 Segment Reporting.
(9) Capital Transactions
Preferred Stock
The Company is authorized to issue 5,000,000 shares of preferred stock in one or more series without shareholder approval. No shares of preferred stock are presently outstanding. The Company’s Board of Directors is authorized, without any further action by the shareholders of the Company, to (i) divide the preferred stock into series; (ii) designate each such series; (iii) fix and determine dividend rights; (iv) determine the price, terms and conditions on which shares of preferred stock may be redeemed; (v) determine the amount payable to holders of preferred stock in the event of voluntary or involuntary liquidation; (vi) determine any sinking fund provisions; and (vii) establish any conversion privileges.
Stock Compensation
On May 4, 2010, the Company’s shareholders approved the adoption of the SkyWest Inc. 2010 Long-Term Incentive Plan, which provides for the issuance of up to 5,150,000 shares of common stock to the Company’s directors, employees, consultants and advisors (the “2010 Incentive Plan”). The 2010 Incentive Plan provides for awards in the form of options to acquire shares of common stock, stock appreciation rights, restricted stock grants, restricted stock units and performance awards. The 2010 Incentive Plan is administered by the Compensation Committee of the Company’s Board of Directors (the “Compensation Committee”), which is authorized to designate option grants as either incentive stock options for income tax purposes (“ISO”) or non-statutory stock options ISOs are granted at not less than 100% of the market value of the underlying common stock on the date of grant. Non-statutory stock options are granted at a price as determined by the Compensation Committee.
In prior years, the Company adopted three stock option plans: the Executive Stock Incentive Plan (the “Executive Plan”), the 2001 Allshare Stock Option Plan (the “Allshare Plan”) and SkyWest Inc. Long-Term Incentive Plan (the “2006 Incentive Plan”). As of December 31, 2015, options to purchase an aggregate 76,923 shares of the Company’s common stock remained outstanding under the Executive Plan, the Allshare Plan and the 2006 Incentive Plan. There are no additional shares of common stock available for issuance under these plans.
The fair value of stock options awarded under the Company’s stock option plans has been estimated as of the grant date using the Black-Scholes option pricing model. The Company uses historical data to estimate option exercises and employee termination in the option pricing model. The expected term of options granted is derived from the output of the option pricing model and represents the period of time that options granted are expected to be outstanding. The expected volatilities are based on the historical volatility of the Company’s traded stock and other factors. The Company granted 267,433, 255,503 and 173,560 stock options to employees under the 2010 Incentive Plan during the years ended

81
December 31, 2015, 2014 and 2013, respectively. Stock options granted in 2015 vest in three equal installments over a three-year period. Stock options granted in 2014 and 2013 have three-year vesting periods. The following table shows the assumptions used and weighted average fair value for grants in the years ended December 31, 2015, 2014 and 2013.
2015 2014 2013 Expected annual dividend rate . . . . . . . . . . . . . . . . . . . . . . . . . . . . . . . . . . 1.18 % 1.32 % 1.21 %Risk-free interest rate . . . . . . . . . . . . . . . . . . . . . . . . . . . . . . . . . . . . . . . . . 1.62 % 1.50 % 0.92 %Average expected life (years) . . . . . . . . . . . . . . . . . . . . . . . . . . . . . . . . . . . 5.7 5.8 6.0 Expected volatility of common stock . . . . . . . . . . . . . . . . . . . . . . . . . . . . . 0.401 0.431 0.446 Forfeiture rate . . . . . . . . . . . . . . . . . . . . . . . . . . . . . . . . . . . . . . . . . . . . . . . 0.0 % 0.0 % 0.0 %Weighted average fair value of option grants . . . . . . . . . . . . . . . . . . . . . . $ 4.75 $ 4.47 $ 5.04
The Company recorded share-based compensation expense only for those options that are expected to vest. The estimated fair value of the stock options is amortized over the vesting period of the respective stock option grants.
During the year ended December 31, 2015, the Company granted 408,163 shares of restricted stock units to certain Company’s employees under the 2010 Incentive Plan. The restricted stock units granted during the year ended December 31, 2015 have a three-year vesting period, during which the recipient must remain employed with the Company or its subsidiaries. The weighted average fair value of the restricted stock units the date of grants made during the year ended December 31, 2015 was $13.57 per share.
The following table summarizes the activity of restricted stock units granted to certain Company employees as of December 31, 2015, 2014 and 2013:
Weighted-Average Grant-Date Fair Number of Shares Value Non-vested shares outstanding at December 31, 2012 . 698,885 $ 14.21Granted . . . . . . . . . . . . . . . . . . . . . . . . . . . . . . . . . . . . . . . 282,651 13.43Vested . . . . . . . . . . . . . . . . . . . . . . . . . . . . . . . . . . . . . . . (202,012) 14.51Cancelled . . . . . . . . . . . . . . . . . . . . . . . . . . . . . . . . . . . . . (45,933) 13.69Non-vested shares outstanding at December 31, 2013 . 733,591 13.79Granted . . . . . . . . . . . . . . . . . . . . . . . . . . . . . . . . . . . . . . . 312,749 12.00Vested . . . . . . . . . . . . . . . . . . . . . . . . . . . . . . . . . . . . . . . (284,891) 14.74Cancelled . . . . . . . . . . . . . . . . . . . . . . . . . . . . . . . . . . . . . (38,273) 12.83Non-vested shares outstanding at December 31, 2014 . 723,176 12.70Granted . . . . . . . . . . . . . . . . . . . . . . . . . . . . . . . . . . . . . . . 408,163 13.57Vested . . . . . . . . . . . . . . . . . . . . . . . . . . . . . . . . . . . . . . . (215,856) 13.06Cancelled . . . . . . . . . . . . . . . . . . . . . . . . . . . . . . . . . . . . . (106,184) 13.52Non-vested shares outstanding at December 31, 2015 . 809,299 13.13
During the year ended December 31, 2015, the Compensation Committee granted performance share units, which are performance based restricted stock units, to certain Company employees with three-year performance based financial metrics that the Company must meet before those awards may be earned and the performance period for those grants ends December 31, 2017. The Compensation Committee will determine the achievement of performance results and corresponding vesting of performance shares for each performance period. At the end of each performance period,

82
the number of shares awarded can range from 0% to 150% of the original granted amount, depending on the performance against the pre-established targets.
The following table summarizes the activity of performance share units granted at target as of December 31, 2015.
Weighted-Average Grant-Date Fair Number of Shares Value Non-vested shares outstanding at December 31, 2014 . — $ —Granted . . . . . . . . . . . . . . . . . . . . . . . . . . . . . . . . . . . . . . . 222,583 13.61Vested . . . . . . . . . . . . . . . . . . . . . . . . . . . . . . . . . . . . . . . — —Cancelled . . . . . . . . . . . . . . . . . . . . . . . . . . . . . . . . . . . . . (19,754) 13.51Non-vested shares outstanding at December 31, 2015 . 202,829 $ 13.62
During the years ended December 31, 2015, 2014 and 2013 the Company granted fully-vested shares of common stock to the Company’s directors in the amounts of 36,950, 44,631 and 29,453 shares, respectively, with a weighted average grant-date fair value of $14.05, $12.10, and $13.24, respectively.
During the year ended December 31, 2015, 2014 and 2013, the Company recorded equity-based compensation expense of $5.4 million, $5.3 million and $4.4 million, respectively.
As of December 31, 2015, the Company had $8.7 million of total unrecognized compensation cost related to non-vested stock options and non-vested restricted stock grants. Total unrecognized compensation cost will be adjusted for future changes in estimated forfeitures. The Company expects to recognize this cost over a weighted average period of 2.0 years.
Options are exercisable for a period as defined by the Compensation Committee on the date granted; however, no stock option will be exercisable before six months have elapsed from the date it is granted and no stock option shall be exercisable after seven years from the date of grant. The following table summarizes the stock option activity for all of the Company’s plans for the years ended December 31, 2015, 2014 and 2013:
2015 2014 2013 Weighted Weighted Average Aggregate Weighted Weighted Average Remaining Intrinsic Average Average Number of Exercise Contractual Value Number of Exercise Number of Exercise Options Price Term ($000) Options Price Options Price Outstanding at
beginning of year 2,888,074 $ 16.46 1.7 years $ — 3,407,575 $ 17.99 3,653,859 $ 18.44Granted . . . . . . . . . . 267,433 13.63 255,503 11.96 173,560 13.24Exercised . . . . . . . . (544,917) 14.68 (6,701) 12.10 (75,080) 10.91Cancelled . . . . . . . . (1,546,161) 18.53 (768,303) 6.81 (344,764) 20.67Outstanding at end
of year . . . . . . . . . 1,064,429 13.64 3.7 years $ 5,726.7 2,888,074 16.46 3,407,575 17.99Exercisable at
December 31, 2015 . . . . . . . . . . . 484,747 14.46 1.7 years $ 2,212.5
Exercisable at December 31, 2014 . . . . . . . . . . . 2,324,336 17.39 0.8 years —
The total intrinsic value of options to acquire shares of the Company’s common stock that were exercised during the years ended December 31, 2015, 2014 and 2013 was $1,800,000, $30,000 and $172,000, respectively.

83
The following table summarizes the status of the Company’s non-vested stock options as of December 31, 2015:
Weighted-Average Number of Grant-Date Shares Fair Value Non-vested shares at beginning of year . . . . . . . . . . . . . . . 563,738 $ 4.56Granted . . . . . . . . . . . . . . . . . . . . . . . . . . . . . . . . . . . . . . . . . 267,433 4.92Vested . . . . . . . . . . . . . . . . . . . . . . . . . . . . . . . . . . . . . . . . . (187,403) 4.43Cancelled . . . . . . . . . . . . . . . . . . . . . . . . . . . . . . . . . . . . . . . (64,086) 4.65Non-vested shares at end of year . . . . . . . . . . . . . . . . . . . . 579,682 $ 4.75
The following table summarizes information about the Company’s stock options outstanding at December 31, 2015:
Options Outstanding Options Exercisable Weighted Average Number Remaining Weighted Average Number Weighted Average Range of Exercise Prices Outstanding Contractual Life Exercise Price Exercisable Exercise Price $8 to $11 19,458 5.4 years $ 11.10 — $ —$12 to $14 859,595 4.1 years 13.31 305,331 13.90$15 to $18 185,376 1.4 years 15.43 179,416 15.64$8 to $18 1,064,429 3.7 years $ 13.64 484,747 $ 14.46
Taxes
The Company’s treatment of stock option grants of non- qualified options, restricted stock units and performance shares results in the creation of a deferred tax asset, which is a temporary difference, until the time that the option is exercised or the restrictions lapse.
(10) Retirement Plans and Employee Stock Purchase Plans
SkyWest Retirement Plan
The Company sponsors the SkyWest, Inc. Employees’ Retirement Plan (the “SkyWest Plan”). Employees who have completed 90 days of service and are at least 18 years of age are eligible for participation in the SkyWest Plan. Employees may elect to make contributions to the SkyWest Plan. Generally, the Company matches 100% of such contributions up to 2%, 4% or 6% of the individual participant’s compensation, based upon length of service for non-pilot employees and up to 3%, 5% or 7% of the individual participant’s compensation, based upon length of service for pilot employees. Additionally, a discretionary contribution may be made by the Company. The Company’s combined contributions to the SkyWest Plan were $20.4 million, $19.3 million and $18.3 million for the years ended December 31, 2015, 2014 and 2013, respectively.
ExpressJet and Atlantic Southeast Retirement Plans
ExpressJet (formerly Atlantic Southeast) sponsors the Atlantic Southeast Airlines, Inc. Investment Savings Plan (the “Atlantic Southeast Plan”). Employees who have completed 90 days of service and are 18 years of age are eligible for participation in the Atlantic Southeast Plan. Employees may elect to make contributions to the Atlantic Southeast Plan; however, ExpressJet limits the amount of company match at 6% of each participant’s total compensation, except for those with ten or more years of service whose company match is limited to 8% of total compensation. Additionally, ExpressJet matches the individual participant’s contributions from 20% to 75%, depending on the length of the participant’s service. Additionally, participants are 100% vested in their elective deferrals and rollover amounts and from 10% to 100% vested in company matching contributions based on length of service.

84
Effective December 31, 2002, ExpressJet Delaware adopted the ExpressJet Airlines, Inc. 401(k) Savings Plan (the “ExpressJet Retirement Plan”). Substantially all of ExpressJet Delaware’s domestic employees were covered by this plan at the time of the ExpressJet Combination. Effective January 1, 2009, the ExpressJet Retirement Plan was amended such that certain matching payment amounts have been reduced or eliminated depending on the terms of the collective bargaining unit or work group, as applicable.
ExpressJet’s contribution to the Atlantic Southeast and the ExpressJet Retirement Plans was $24.0 million, $27.2 million and $26.7 million for the years ended December 31, 2015, 2014 and 2013, respectively.
Employee Stock Purchase Plans
In May 2009, the Company’s Board of Directors approved the SkyWest, Inc. 2009 Employee Stock Purchase Plan (the “2009 Stock Purchase Plan”). All employees who have completed 90 days of employment with the Company or one of its subsidiaries are eligible to participate in the 2009 Stock Purchase Plan, except employees who own five percent or more of the Company’s common stock. The 2009 Stock Purchase Plan enables employees to purchase shares of the Company’s common stock at a five percent discount, through payroll deductions. Employees can contribute up to 15% of their base pay, not to exceed $25,000 each calendar year, for the purchase of shares. Shares are purchased semi-annually at a five percent discount based on the end of the period price. Employees can terminate their participation in the 2009 Stock Purchase Plan at any time upon written notice.
The following table summarizes purchases made under the 2009 Employee Stock Purchase Plans during the years ended December 31, 2015, 2014 and 2013:
Year ended December 31, 2015 2014 2013 Number of shares purchased . . . . . . . . . . . . 254,098 295,035 299,786Average price of shares purchased . . . . . . . . $ 13.50 $ 12.72 $ 12.33
The 2009 Stock Purchase Plan is a non-compensatory plan under the accounting guidance. Therefore, no compensation expense was recorded for the years ended December 31, 2015, 2014 and 2013.
(11) Stock Repurchase
The Company’s Board of Directors has previously authorized the repurchase of the Company’s common stock in the public market. During the years ended December 31, 2015, 2014 and 2013, the Company repurchased 1.3 million, 0.7 million, 0.8 million shares of common stock for approximately $18.7 million, $8.4 million and $11.7 million, respectively at a weighted average price per share of $14.98, $12.54 and $14.40, respectively. As of December 31, 2015, the Company’s Board of Directors has not authorized additional repurchases of the Company’s common stock.
(12) Related-Party Transactions
The Company’s Chairman of the Board and former Chief Executive Officer, serves on the Board of Directors of Zions Bancorporation (“Zions”). The Company maintains a line of credit (see Note 3) and certain bank accounts with Zions. Zions is an equity participant in leveraged leases on one CRJ200, two CRJ700 and four EMB120 aircraft leased by the Company’s subsidiaries. Zions also refinanced five CRJ200 and two CRJ700 aircraft in 2012 for terms of three to four years, becoming the debtor on these aircraft. Zions also serves as the Company’s transfer agent. The Company’s cash balance in the accounts held at Zions as of December 31, 2015 and 2014 was $65.0 million and $90.6 million, respectively.
During the year ended December 31, 2015, the Company purchased $363,910 of spare aircraft parts from an entity affiliated with a director of the Company.

85
(13) Quarterly Financial Data (Unaudited)
Unaudited summarized financial data by quarter for 2015 and 2014 is as follows (in thousands, except per share data):
Year ended December 31, 2015 First Second Third Fourth Quarter Quarter Quarter Quarter Year Operating revenues . . . . . . . . . . . . . . . . . . . . . . . $ 760,398 $ 788,417 $ 794,004 $ 752,744 $ 3,095,563Operating income . . . . . . . . . . . . . . . . . . . . . . . . 34,075 69,932 78,296 52,212 234,515Net income . . . . . . . . . . . . . . . . . . . . . . . . . . . . . . 9,620 31,475 36,268 40,454 117,817Net income per common share: Basic . . . . . . . . . . . . . . . . . . . . . . . . . . . . . . . . . . . 0.19 0.61 0.72 0.80 2.31Diluted . . . . . . . . . . . . . . . . . . . . . . . . . . . . . . . . . 0.18 0.61 0.71 0.78 2.27Weighted average common shares: Basic: . . . . . . . . . . . . . . . . . . . . . . . . . . . . . . . . . . 51,457 51,357 50,616 50,880 51,077Diluted: . . . . . . . . . . . . . . . . . . . . . . . . . . . . . . . . . 52,392 51,971 51,282 51,657 51,825
Year ended December 31, 2014 First Second Third Fourth Quarter Quarter Quarter Quarter Year Operating revenues . . . . . . . . . . . . . . . . . . . . . . . $ 772,386 $ 816,574 $ 834,633 $ 813,854 $ 3,237,447Operating income . . . . . . . . . . . . . . . . . . . . . . . . (27,774) 13,244 59,080 (19,702) 24,848Net income (loss) . . . . . . . . . . . . . . . . . . . . . . . . . (22,887) (14,737) 41,338 (27,868) (24,154)Net income (loss) per common share: Basic . . . . . . . . . . . . . . . . . . . . . . . . . . . . . . . . . . . (0.44) (0.29) 0.81 (0.54) (0.47)Diluted . . . . . . . . . . . . . . . . . . . . . . . . . . . . . . . . . (0.44) (0.29) 0.79 (0.54) (0.47)Weighted average common shares: Basic: . . . . . . . . . . . . . . . . . . . . . . . . . . . . . . . . . . 51,467 51,183 51,127 51,174 51,237Diluted: . . . . . . . . . . . . . . . . . . . . . . . . . . . . . . . . . 51,467 51,183 52,036 51,174 51,237
86
ITEM 9. CHANGES IN AND DISAGREEMENTS WITH ACCOUNTANTS ON ACCOUNTING AND FINANCIAL DISCLOSURE
None.
ITEM 9A. CONTROLS AND PROCEDURES
Disclosure Controls and Procedures
Our management, including our Chief Executive Officer and Chief Financial Officer, performed an evaluation of our disclosure controls and procedures, which have been designed to ensure that information we are required to disclose in the reports we file or submit under the Exchange Act is recorded, processed, summarized and reported accurately and within the time periods specified in the Commission rules and forms. Our management, including our Chief Executive Officer and Chief Financial Officer, concluded that, as of December 31, 2015, those controls and procedures were effective to ensure that information we are required to disclose in the reports we file or submit under the Exchange Act is accumulated and communicated to our management, including our Chief Executive Officer and Chief Financial Officer, as appropriate to allow timely decisions regarding required disclosure.
Changes in Internal Control
During the most recently completed fiscal quarter, we did not make any changes in our internal control over financial reporting that have materially affected, or are reasonably likely to materially affect, our internal control over financial reporting.
Management’s Annual Report on Internal Control Over Financial Reporting
Management is responsible for establishing and maintaining adequate internal control over financial reporting, as such term is defined in Rules13a-15(f) and 15d-15(f) under the Exchange Act. Our internal control over financial reporting is designed to provide reasonable assurance regarding the reliability of financial reporting and the preparation of financial statements for external purposes in accordance with accounting principles generally accepted in the United States of America.
Because of its inherent limitations, internal control over financial reporting may not prevent or detect misstatements. Projections of any evaluation of effectiveness to future periods are subject to the risk that controls may become inadequate because of changes in conditions, or that the degree of compliance with the policies may deteriorate.
Management conducted an evaluation of the effectiveness of our internal control over financial reporting as of December 31, 2015 using the criteria issued by the Committee of Sponsoring Organizations of the Treadway Commission (COSO) in Internal Control—Integrated Framework (2013). Based on that evaluation, management believes that our internal control over financial reporting was effective as of December 31, 2015.
The effectiveness of our internal control over financial reporting as of December 31, 2015, has been audited by Ernst & Young LLP (“Ernst & Young”), the independent registered public accounting firm who also has audited our Consolidated Financial Statements included in this Report. Ernst & Young’s report on our internal control over financial reporting appears on the following page.

87
Report of Independent Registered Public Accounting Firm
The Board of Directors and Stockholders SkyWest, Inc.
We have audited SkyWest, Inc. and subsidiaries’ internal control over financial reporting as of December 31, 2015, based on criteria established in Internal Control—Integrated Framework issued by the Committee of Sponsoring Organizations of the Treadway Commission (2013 framework) (the COSO criteria). SkyWest, Inc. and subsidiaries’ management is responsible for maintaining effective internal control over financial reporting, and for its assessment of the effectiveness of internal control over financial reporting included in the accompanying Management’s Annual Report on Internal Control over Financial Reporting. Our responsibility is to express an opinion on the company’s internal control over financial reporting based on our audit.
We conducted our audit in accordance with the standards of the Public Company Accounting Oversight Board (United States). Those standards require that we plan and perform the audit to obtain reasonable assurance about whether effective internal control over financial reporting was maintained in all material respects. Our audit included obtaining an understanding of internal control over financial reporting, assessing the risk that a material weakness exists, testing and evaluating the design and operating effectiveness of internal control based on the assessed risk, and performing such other procedures as we considered necessary in the circumstances. We believe that our audit provides a reasonable basis for our opinion.
A company’s internal control over financial reporting is a process designed to provide reasonable assurance regarding the reliability of financial reporting and the preparation of financial statements for external purposes in accordance with generally accepted accounting principles. A company’s internal control over financial reporting includes those policies and procedures that (1) pertain to the maintenance of records that, in reasonable detail, accurately and fairly reflect the transactions and dispositions of the assets of the company; (2) provide reasonable assurance that transactions are recorded as necessary to permit preparation of financial statements in accordance with generally accepted accounting principles, and that receipts and expenditures of the company are being made only in accordance with authorizations of management and directors of the company; and (3) provide reasonable assurance regarding prevention or timely detection of unauthorized acquisition, use, or disposition of the company’s assets that could have a material effect on the financial statements.
Because of its inherent limitations, internal control over financial reporting may not prevent or detect misstatements. Also, projections of any evaluation of effectiveness to future periods are subject to the risk that controls may become inadequate because of changes in conditions, or that the degree of compliance with the policies or procedures may deteriorate.
In our opinion, SkyWest, Inc. and subsidiaries maintained, in all material respects, effective internal control over financial reporting as of December 31, 2015, based on the COSO criteria.
We also have audited, in accordance with the standards of the Public Company Accounting Oversight Board (United States), the consolidated balance sheets of SkyWest, Inc. and subsidiaries as of December 31, 2015 and 2014, and the related consolidated statements of comprehensive income (loss), stockholders’ equity, and cash flows for each of the three years in the period ended December 31, 2015 of SkyWest, Inc. and subsidiaries and our report dated February 26, 2016 expressed an unqualified opinion thereon.
/s/ Ernst & Young LLP
Salt Lake City, Utah February 26, 2016

88
ITEM 9B. OTHER INFORMATION
None.
PART III
Items 10, 11, 12, 13 and 14 in Part III of this Report are incorporated herein by reference to our definitive proxy statement for our 2015 Annual Meeting of Shareholders scheduled for May 3, 2016. We intend to file our definitive proxy statement with the SEC not later than 120 days after December 31, 2015, pursuant to Regulation 14A of the Exchange Act.
Headings in Proxy Statement ITEM 10. DIRECTORS, EXECUTIVE
OFFICERS AND CORPORATE GOVERNANCE
“Election of Directors,” “Executive Officers,” “Corporate Governance,” “Meetings and Committees of the Board” and “Section 16(a) Beneficial Ownership Reporting Compliance”
ITEM 11. EXECUTIVE COMPENSATION
“Corporate Governance,” “Meetings and Committees of the Board,” “Compensation Discussion and Analysis,” “Compensation Committee Report,” “Executive Compensation,” “Director Compensation” and “Director Summary Compensation Table”
ITEM 12. SECURITY OWNERSHIP OF CERTAIN BENEFICIAL OWNERS AND MANAGEMENT AND RELATED STOCKHOLDER MATTERS
“Security Ownership of Certain Beneficial Owners”
ITEM 13. CERTAIN RELATIONSHIPS AND RELATED TRANSACTIONS
“Certain Relationships and Related Transactions”
ITEM 14. PRINCIPAL ACCOUNTANT FEES AND SERVICES
“Audit and Finance Committee Disclosure” and “Fees Paid to Independent Registered Public Accounting Firm”
PART IV
ITEM 15. EXHIBITS AND FINANCIAL STATEMENT SCHEDULES
(a) Documents Filed:
1. Financial Statements: Reports of Independent Auditors, Consolidated Balance Sheets as of December 31, 2015 and 2014, Consolidated Statements of Comprehensive Income (Loss) for the years ended December 31, 2015, 2014 and 2013, Consolidated Statements of Cash Flows for the year ended December 31, 2015, 2014 and 2013, Consolidated Statements of Stockholders’ Equity for the years ended December 31, 2015, 2014 and 2013 and Notes to Consolidated Financial Statements.
2. Financial Statement Schedule. The following consolidated financial statement schedule of our company is included in this Item 15.
• Report of independent auditors on financial statement schedule
• Schedule II—Valuation and qualifying accounts

89
All other schedules for which provision is made in the applicable accounting regulations of the Commission are not required under the related instructions or are not applicable, and therefore have been omitted.
(b) Exhibits
Number Exhibit Incorporated by Reference
3.1 Restated Articles of Incorporation (1)3.2 Amended and Restated Bylaws (12)4.1 Specimen of Common Stock Certificate (2)
10.1 Amended and Restated Delta Connection Agreement, dated as of September 8, 2005, between SkyWest Airlines, Inc. and Delta Air Lines, Inc. (3)
10.2 Second Amended and Restated Delta Connection Agreement, dated as of September 8, 2005, between Atlantic Southeast Airlines, Inc. and Delta Air Lines, Inc. (3)
10.3 United Express Agreement dated July 31, 2003, between United Air Lines, Inc., and SkyWest Airlines, Inc. (4)
10.4 Stock Option Agreement dated January 28, 1987 between Delta Air Lines, Inc. and SkyWest, Inc. (5)
10.5 Lease Agreement dated December 1,1989 between Salt Lake City Corporation and SkyWest Airlines, Inc. (6)
10.6 Master Purchase Agreement dated November 7, 2000 between Bombardier, Inc. and SkyWest Airlines, Inc. (7)
10.7 Supplement to Master Purchase Agreement dated November 7, 2000 between Bombardier, Inc. and SkyWest Airlines, Inc. (4)
10.8 SkyWest Inc. 2006 Employee Stock Purchase Plan (8)10.9 First Amendment to SkyWest, Inc. 2006 Employee Stock Purchase Plan (9)
10.10 SkyWest, Inc. 2002 Deferred Compensation Plan, as amended and restated effective January 1, 2008 (9)
10.11 First Amendment to the Restated SkyWest, Inc. 2002 Deferred Compensation Plan (9)10.12 SkyWest, Inc. 2006 Long-Term Incentive Plan (9)10.13 First Amendment to the SkyWest, Inc. 2006 Long-Term Incentive Plan (9)
10.13(a) Second Amendment to the SkyWest, Inc. 2006 Long-Term Incentive Plan (9)10.14 SkyWest, Inc. 2009 Employee Stock Purchase Plan (9)10.15 Capacity Purchase Agreement, dated November 12, 2010, by and among ExpressJet
Airlines, Inc. and Continental Airlines, Inc. (10)10.16 Aircraft Purchase Agreement, dated December 7, 2012, between Mitsubishi Aircraft
Corporation and SkyWest Inc. (11)10.17 Letter Agreement dated December 7, 2012, between Mitsubishi Aircraft Corporation
and SkyWest, Inc. (11)10.18 Purchase Agreement COM0028-13 between Embraer S.A. and SkyWest Inc. dated
February 15, 2013 (13)10.19 Purchase Agreement COM0344-13 between Embraer S.A. and SkyWest Inc. dated
June 17, 2013 (13)10.20 Form of Indemnification Agreement executed by and between SkyWest, Inc. and
each of Jerry C. Atkin, W. Steve Albrecht, J. Ralph Atkin, Margaret Billson, Henry J. Eyring, Robert G. Sarver, Steven F. Udvar-Hazy, James L. Welch, Bradford R. Rich, Michael J. Kraupp, Eric J. Woodward, Russell A. Childs and Bradford R. Holt, as of August 6, 2013 (13)

90
Number Exhibit Incorporated by Reference
10.21 Form of Indemnification Agreement executed by and between SkyWest, Inc. and each of Ronald J. Mittelstaedt and Keith E. Smith, as of October 1, 2013 (14)
10.22 Amended and Restated Capacity Purchase Agreement, dated as of November 7, 2014, by and between ExpressJet Airlines, Inc. and United Airlines* (15)
10.23 Indemnification Agreement executed by and between SkyWest, Inc. and Robert J. Simmons, as of March 16, 2015 Filed herewith
10.25 Form of Indemnification Agreement executed by and between SkyWest, Inc. and each of Meredith S. Madden and Andrew C. Roberts, as of May 5, 2015 Filed herewith
21.1 Subsidiaries of the Registrant (12)23.1 Consent of Independent Registered Public Accounting Firm Filed herewith31.1 Certification of Chief Executive Officer Filed herewith31.2 Certification of Chief Financial Officer Filed herewith32.1 Certification of Chief Executive Officer Filed herewith32.2 Certification of Chief Financial Officer Filed herewith
101.INS** XBRL Instance Document 101.SCH** XBRL Taxonomy Extension Schema Document 101.CAL** XBRL Taxonomy Extension Calculation Linkbase Document 101.LAB** XBRL Taxonomy Extension Label Linkbase Document 101.PRE** XBRL Taxonomy Extension Presentation Linkbase Document 101.DEF** XBRL Taxonomy Extension Definition Linkbase Document
* Certain portions of this exhibit have been omitted pursuant to Rule 24b-2 and are subject to a confidential treatment request.
** Attached as Exhibit 101 to this report are the following documents formatted in XBRL (Extensible Business Reporting Language): (i) the Consolidated Statement of Comprehensive Income (Loss) for the years ended December 31, 2015, December 31, 2014 and December 31, 2013, (ii) the Consolidated Balance Sheet at December 31, 2015 and December 31, 2014, and (iii) the Consolidated Statement of Cash Flows for the years ended December 31, 2015, December 31, 2014 and December 31, 2013
(1) Incorporated by reference to the exhibits to a Registration Statement on Form S-3, File No. 333-129832
(2) Incorporated by reference to a Registration Statement on Form S-3, File No. 333-42508
(3) Incorporated by reference to Registrant’s Current Report on Form 8-K filed on September 13, 2005, as amended by Amendment No. 2 on Form 8-K/A filed on February 21, 2006
(4) Incorporated by reference to exhibits to Registrant’s Quarterly Report on Form 10-Q filed on November 14, 2003
(5) Incorporated by reference to the exhibits to Amendment No. 1 to a Registration Statement on Form S-3 filed on February 10, 1998 (File No. 333-44619)
(6) Incorporated by reference to the exhibits to Registrant’s Quarterly Report on Form 10-Q filed for the quarter ended December 31, 1986
(7) Incorporated by reference to the exhibits to Registrant’s Quarterly Report on Form 10-Q filed on February 13, 2001
(8) Incorporated by reference to the exhibits to a Registration Statement on Form S-8 (File No. 333-130848)

91
(9) Incorporated by reference to the exhibits to Registrant’s Annual Report on Form 10-K filed on February 25, 2009
(10) Incorporated by reference to the exhibits to Registrant’s Current Report on Form 8-K filed on November 18, 2010
(11) Incorporated by reference to the exhibits to Registrant’s Current Report on Form 8-K filed on December 13, 2012, as amended by Amendment No. 1 to Current Report on Form 8-K/A filed on June 25, 2013
(12) Incorporated by reference to the exhibits to Registrant’s Annual Report on Form 10-K filed on February 24, 2012
(13) Incorporated by reference to the exhibits to Registrant’s Quarterly Report on Form 10 Q filed on August 7, 2013, as amended by Amendment No. 1 to Quarterly Report on Form 10 Q/A filed on November 4, 2013
(14) Incorporated by reference to the exhibits to Registrant’s Annual Report on Form 10-K filed on February 14, 2014
(15) Incorporated by reference to the exhibits to Registrant’s Annual Report on Form 10-K filed on February 18, 2015

92
Report of Independent Registered Public Accounting Firm
The Board of Directors and Stockholders SkyWest, Inc.
We have audited the consolidated financial statements of SkyWest, Inc. and subsidiaries (the “Company”) as of December 31, 2015 and 2014, and for each of the three years in the period ended December 31, 2015, and have issued our report thereon dated February 26, 2016 (included elsewhere in this Form 10-K). Our audits also included the financial statement schedule listed in Item 15(a) of this Form 10-K. This schedule is the responsibility of the Company’s management. Our responsibility is to express an opinion based on our audits. In our opinion, the financial statement schedule referred to above, when considered in relation to the basic financial statements taken as a whole, presents fairly in all material respects the information set forth therein. /s/ Ernst & Young LLP Salt Lake City, Utah February 26, 2016

93
SKYWEST, INC. AND SUBSIDIARIES SCHEDULE II—VALUATION AND QUALIFYING ACCOUNTS
For the Years Ended December 31, 2015, 2014 and 2013 (Dollars in thousands)
Additions Balance at Charged to Beginning Costs and Balance at Description of Year Expenses Deductions End of Year Year ended December 31, 2015:
Allowance for inventory obsolescence . . . . . . . . $ 11,588 2,345 — $ 13,933Allowance for doubtful accounts receivable . . . 326 — (139) 187
11,914 2,345 (139) $ 14,120Year ended December 31, 2014:
Allowance for inventory obsolescence . . . . . . . . $ 10,138 1,450 — $ 11,588Allowance for doubtful accounts receivable . . . 94 232 — 326
10,232 1,682 — $ 11,914Year ended December 31, 2013:
Allowance for inventory obsolescence . . . . . . . . $ 9,189 949 — $ 10,138Allowance for doubtful accounts receivable . . . 94 — — 94
9,283 949 — 10,232

94
SIGNATURES
Pursuant to the requirements of Section 13 or 15 (d) of the Securities Act of 1934, as amended, the Registrant has duly caused this Annual Report on Form 10-K for the year ended December 31, 2015, to be signed on its behalf by the undersigned, thereunto duly authorized, on February 26, 2016.
SKYWEST, INC. By: /s/ ROBERT J. SIMMONS
Robert J. Simmons Chief Financial Officer

95
ADDITIONAL SIGNATURES
Pursuant to the requirement of the Securities Act of 1934, as amended, this Annual Report on Form 10-K has been signed below by the following persons in the capacities and on the dates indicated.
Name Capacities Date
/s/ JERRY C. ATKIN Jerry C. Atkin
Chairman of the Board
February 26, 2016
/s/ RUSSELL A. CHILDS Russell A. Childs
Chief Executive Officer (Principal Executive Officer) and Director February 26, 2016
/s/ ROBERT J. SIMMONS Robert J. Simmons
Chief Financial Officer (Principal Financial Officer) February 26, 2016
/s/ ERIC J. WOODWARD
Eric J. Woodward Chief Accounting Officer (Principal Accounting Officer) February 26, 2016
/s/ STEVEN F. UDVAR-HAZY
Steven F. Udvar-Hazy Lead Director February 26, 2016
/s/ W. STEVE ALBRECHT
Steve Albrecht Director February 26, 2016
/s/ HENRY J. EYRING
Henry J. Eyring Director February 26, 2016
/s/ MEREDITH S. MADDEN
Meredith S. Madden Director February 26, 2016
/s/ RONALD J. MITTELSTAEDT
Ronald J. Mittelstaedt Director February 26, 2016
/s/ ANDREW C. ROBERTS
Andrew C. Roberts Director February 26, 2016
/s/ KEITH E. SMITH
Keith E. Smith Director February 26, 2016
/s/ JAMES L. WELCH
James L. Welch Director February 26, 2016

SkyWest, Inc. 444 South River Road St. George, UT 84790
March 17, 2016
Dear Shareholder:
You are invited to attend the Annual Meeting of Shareholders of SkyWest, Inc. scheduled to be held at 11:00 a.m., Tuesday, May 3, 2016, at our headquarters located at 444 South River Road, St. George, Utah, 84790.
The accompanying Notice of Annual Meeting of Shareholders and Proxy Statement describe the items to be considered and acted upon by shareholders.
Your vote is very important. Whether you plan to attend the Annual Meeting or not, we urge you to vote your shares as soon as possible. This will ensure representation of your shares at the Annual Meeting if you are unable to attend.
We are pleased to make these proxy materials available over the Internet, which we believe increases the efficiency and reduces the expense of our annual meeting process. As a result, we are mailing to shareholders a Notice of Internet Availability of Proxy Materials (the “Notice”) instead of paper copies of these proxy materials and our 2015 Annual Report. The Notice contains instructions on how to access those documents over the Internet or request that a full set of printed materials be sent to you. The Notice also gives instructions on how to vote your shares.
We look forward to seeing you at the Annual Meeting.
Sincerely,
Jerry C. Atkin Chairman of the Board

SkyWest, Inc. 444 South River Road St. George, UT 84790
NOTICE OF THE ANNUAL MEETING OF SHAREHOLDERS OF SKYWEST, INC.
Date: Tuesday, May 3, 2016 Time: 11:00 a.m., Mountain Daylight Time (MDT) Place: SkyWest, Inc. Headquarters
444 South River Road St. George, Utah 84790
Purposes: 1. To elect ten directors of SkyWest, Inc. (the “Company”), to serve until the next Annual Meeting of the Company’s shareholders and until their successors are duly elected and qualified;
2. To conduct an advisory vote on a non-binding resolution to approve the compensation of the Company’s named executive officers;
3. To ratify the appointment of Ernst & Young, LLP to serve as the Company’s independent registered public accounting firm (independent auditors) for the year ending December 31, 2016; and
4. To transact such other business that may properly come before the Annual Meeting and any adjournment thereof.
Who Can Vote: Shareholders at the close of business on March 4, 2016. How You Can Vote: Shareholders may vote at the Annual Meeting, or in advance over the Internet, by telephone, or
by mail. By authorization of the Board of Directors
Jerry C. Atkin Chairman of the Board
March 17, 2016

Proxy Statement for the Annual Meeting of Shareholders of
SKYWEST, INC.
To Be Held on Tuesday, May 3, 2016
TABLE OF CONTENTS
PageOverview . . . . . . . . . . . . . . . . . . . . . . . . . . . . . . . . . . . . . . . . . . . . . . . . . . . . . . . . . . . . . . . . . . . . . . . . . . . . . . . . . . . . . 1Proposal 1—Election of Directors . . . . . . . . . . . . . . . . . . . . . . . . . . . . . . . . . . . . . . . . . . . . . . . . . . . . . . . . . . . . . . . . . 4Executive Officers . . . . . . . . . . . . . . . . . . . . . . . . . . . . . . . . . . . . . . . . . . . . . . . . . . . . . . . . . . . . . . . . . . . . . . . . . . . . . . 15Corporate Governance . . . . . . . . . . . . . . . . . . . . . . . . . . . . . . . . . . . . . . . . . . . . . . . . . . . . . . . . . . . . . . . . . . . . . . . . . . 16Meetings and Committees of the Board. . . . . . . . . . . . . . . . . . . . . . . . . . . . . . . . . . . . . . . . . . . . . . . . . . . . . . . . . . . . . 20Compensation Discussion and Analysis . . . . . . . . . . . . . . . . . . . . . . . . . . . . . . . . . . . . . . . . . . . . . . . . . . . . . . . . . . . . 24Compensation Committee Report . . . . . . . . . . . . . . . . . . . . . . . . . . . . . . . . . . . . . . . . . . . . . . . . . . . . . . . . . . . . . . . . . 33Executive Compensation . . . . . . . . . . . . . . . . . . . . . . . . . . . . . . . . . . . . . . . . . . . . . . . . . . . . . . . . . . . . . . . . . . . . . . . . 34Certain Relationships and Related Transactions . . . . . . . . . . . . . . . . . . . . . . . . . . . . . . . . . . . . . . . . . . . . . . . . . . . . . . 43Director Compensation . . . . . . . . . . . . . . . . . . . . . . . . . . . . . . . . . . . . . . . . . . . . . . . . . . . . . . . . . . . . . . . . . . . . . . . . . . 44Director Summary Compensation Table . . . . . . . . . . . . . . . . . . . . . . . . . . . . . . . . . . . . . . . . . . . . . . . . . . . . . . . . . . . . 45Security Ownership of Certain Beneficial Owners . . . . . . . . . . . . . . . . . . . . . . . . . . . . . . . . . . . . . . . . . . . . . . . . . . . . 46Proposal 2—Advisory Vote on Executive Compensation . . . . . . . . . . . . . . . . . . . . . . . . . . . . . . . . . . . . . . . . . . . . . . 48Proposal 3—Ratification of Appointment of Independent Registered Public Accounting Firm . . . . . . . . . . . . . . . . 49Audit and Finance Committee Disclosure . . . . . . . . . . . . . . . . . . . . . . . . . . . . . . . . . . . . . . . . . . . . . . . . . . . . . . . . . . . 50Fees Paid to Independent Registered Public Accounting Firm . . . . . . . . . . . . . . . . . . . . . . . . . . . . . . . . . . . . . . . . . . 54Report of the Audit and Finance Committee . . . . . . . . . . . . . . . . . . . . . . . . . . . . . . . . . . . . . . . . . . . . . . . . . . . . . . . . . 55Section 16(a) Beneficial Ownership Reporting Compliance . . . . . . . . . . . . . . . . . . . . . . . . . . . . . . . . . . . . . . . . . . . . 56Shareholder Proposals for the 2016 Annual Meeting of Shareholders . . . . . . . . . . . . . . . . . . . . . . . . . . . . . . . . . . . . 56Delivery of Documents to Shareholders Sharing an Address . . . . . . . . . . . . . . . . . . . . . . . . . . . . . . . . . . . . . . . . . . . 57Other Business . . . . . . . . . . . . . . . . . . . . . . . . . . . . . . . . . . . . . . . . . . . . . . . . . . . . . . . . . . . . . . . . . . . . . . . . . . . . . . . . . 57
1
PROXY STATEMENT FOR THE
ANNUAL MEETING OF SHAREHOLDERS OF
SKYWEST, INC.
TUESDAY, MAY 3, 2016
OVERVIEW
Solicitation
This Proxy Statement, the accompanying Notice of Annual Meeting, proxy card and the Annual Report to Shareholders of SkyWest, Inc. (the “Company” or “SkyWest”) are being mailed on or about March 17, 2016. The Board of Directors of the Company (the “Board”) is soliciting your proxy to vote your shares at the Annual Meeting of the Company’s Shareholders to be held on May 3, 2016 (the “Meeting”). The Board is soliciting your proxy in an effort to give all shareholders of record the opportunity to vote on matters that will be presented at the Meeting. This Proxy Statement provides information to assist you in voting your shares.
What is a proxy?
A proxy is your legal designation of another person to vote on your behalf. You are giving the individuals appointed by the Board as proxies (Jerry C. Atkin, Russell A. Childs and Robert J. Simmons) the authority to vote your shares in the manner you indicate.
Why did I receive more than one notice?
You may receive multiple notices if you hold your shares in different ways (e.g., joint tenancy, trusts, or custodial accounts) or in multiple accounts. If your shares are held by a broker (i.e., in “street name”), you will receive your notice or other voting information from your broker. In any case, you should vote for each notice you receive.
Voting Information
Who is qualified to vote?
You are qualified to receive notice of and to vote at the Meeting if you owned shares of common stock of SkyWest (the “Common Stock”) at the close of business on the record date of Friday, March 4, 2016.
How many shares of Common Stock may vote at the Meeting?
As of March 4, 2016, there were 51,353,043 shares of Common Stock outstanding and entitled to vote. Each share of Common Stock is entitled to one vote on each matter presented at the Meeting.
What is the difference between a “shareholder of record” and a “street name” holder?
If your shares are registered directly in your name with Zion’s First National Bank, the Company’s transfer agent, you are a “shareholder of record.” If your shares are held in the name of a brokerage, bank, trust or other nominee as a custodian, you are a “street name” holder.

2
How can I vote at the Meeting?
You may vote in person by attending the Meeting. You may also vote in advance over the Internet, or by telephone, or you may request a complete set of traditional proxy materials and vote your proxy by mail. To vote your proxy using the Internet or telephone, see the instructions on the proxy form and have the proxy form available when you access the Internet website or place your telephone call. To vote your proxy by mail, mark your vote on the enclosed proxy card, then follow the instructions on the card.
What are the Board’s recommendations on how I should vote my shares?
The Board recommends that you vote your shares as follows:
Proposal 1—FOR the election of all ten nominees for director with terms expiring at the next annual meeting of the Company’s shareholders.
Proposal 2—FOR the non-binding resolution to approve the compensation of the Company’s named executive officers. Proposal 3—FOR the ratification of the appointment of Ernst & Young, LLP as the Company’s independent registered
public accounting firm (independent auditors) for the year ending December 31, 2016. What are my choices when voting?
Proposal 1—You may cast your vote in favor of up to ten individual director-nominees. You may vote for less than ten director-nominees if you choose. You may also abstain from voting.
Proposals 2 and 3—You may cast your vote in favor of, or against, each proposal. You may also abstain from voting. How will my shares be voted if I do not specify how they should be voted?
If you execute the enclosed proxy card without indicating how you want your shares to be voted, the proxies appointed by the Board will vote as recommended by the Board and described previously in this section.
How will withheld votes, abstentions and broker non-votes be treated?
Withheld votes, abstentions and broker non-votes will be deemed as “present” at the Meeting, and will be counted for quorum purposes only.
Can I change my vote?
You may revoke your proxy before the time of voting at the Meeting in any of the following ways:
• by mailing a revised proxy card to the Chief Financial Officer of the Company;
• by changing your vote on the Internet website;
• by using the telephone voting procedures; or
• by voting in person at the Meeting.

3
What vote will be required to approve each proposal?
Proposal 1 provides that the ten director-nominees who receive a majority of the votes cast with respect to his or her election will be elected as directors of the Company. This means that the number of shares voted “for” the election of a director must exceed the number of shares voted “against” the election of that director.
Proposals 2 and 3 will be approved if the number of votes cast, in person or by proxy, in favor of a particular proposal exceeds the number of votes cast in opposition to the proposal. Proposal 2 is an advisory vote only, and has no binding effect on the Board or the Company.
Who will count the votes?
Representatives from Zion’s First National Bank, the Company’s transfer agent, or other individuals designated by the Board, will count the votes and serve as inspectors of election. The inspectors of election will be present at the Meeting.
Who will pay the cost of this proxy solicitation?
The Company will pay the costs of soliciting proxies. Upon request, the Company will reimburse brokers, dealers, banks and trustees, or their nominees, for reasonable expenses incurred by them in forwarding proxy materials to beneficial owners of shares of the Common Stock.
Is this Proxy Statement the only way proxies are being solicited for use at the Meeting?
Yes. The Company does not intend to employ any other methods of solicitation.
How are proxy materials being delivered?
The Company is pleased to take advantage of U.S. Securities and Exchange Commission rules that allow companies to furnish their proxy materials over the Internet. As a result, the Company is mailing to most of its shareholders a Notice of Internet Availability of Proxy Materials (the “Notice”) instead of a paper copy of this Proxy Statement and the Company’s 2015 Annual Report to Shareholders. The Notice contains instructions on how to access those documents over the Internet. The Notice also contains instructions on how to request a paper copy of the Company’s proxy materials, including this Proxy Statement, the 2015 Annual Report to Shareholders and a form of proxy card or voting instruction card. All shareholders who do not receive a Notice will receive a paper copy of the proxy materials by mail. The Company believes this process will allow it to provide its shareholders with the information they need in a more efficient manner, while reducing the environmental impact and lowering the costs of printing and distributing these proxy materials.

4
PROPOSAL 1 ELECTION OF DIRECTORS
Composition of the Board
The Board currently consists of ten directors. All directors serve a one-year term and are subject to re-election each year.
The current composition of the Board is:
• Jerry C. Atkin, Chairman
• W. Steve Albrecht
• Russell A. Childs
• Henry J. Eyring
• Meredith S. Madden
• Ronald J. Mittelstaedt
• Andrew C. Roberts
• Keith E. Smith
• Steven F. Udvar-Hazy
• James L. Welch
The Board Recommends That Shareholders Vote FOR All Ten Nominees Listed Below.
Nominees for Election as Directors
At the Meeting, the Company proposes to elect ten directors to hold office until the 2017 Annual Meeting of Shareholders and until their successors have been elected and have qualified. The ten nominees for election at the Meeting are listed below. All of the nominees are currently serving as a director of the Company and have consented to be named as a nominee. Shareholders voting in person or by proxy at the Meeting may only vote for ten nominees. If, prior to the Meeting, any of the nominees becomes unable to serve as a director, the Board may designate a substitute nominee. In that event, the persons named as proxies intend to vote for the substitute nominee designated by the Board.
The Board and the Nominating and Corporate Governance Committee believe that each of the following nominees possesses the experience and qualifications that directors of the Company should possess, as described in detail below, and that the experience and qualifications of each nominee compliments the experience and qualifications of the other nominees. The experience and qualifications of each nominee, including information regarding the specific experience, qualifications, attributes and skills that led the Board and its Nominating and Corporate Governance Committee to conclude that he or she should serve as a director of the Company at the present time, in light of the Company’s business and structure, are set forth on the following pages.

5
Jerry C. Atkin
Age: . . . . . . . . . . . . . . . 67 Director Since: . . . . . . 1974 Committees: . . . . . . . . None Principal Occupation: Chairman of the Board
Experience: . . . . . . . . . Mr. Atkin joined the Company in July 1974 as a director and the Company’s Director of
Finance. In 1975, he assumed the office of President and Chief Executive Officer and was elected Chairman of the Board in 1991. Mr. Atkin served as President of the Company until 2011and as Chief Executive Officer until December 31, 2015.
The Board nominated Mr. Atkin to serve as a director, in part, because Mr. Atkin was the Company’s Chief Executive Officer for more than 41 years. Mr. Atkin has a deep knowledge and understanding of the Company, SkyWest Airlines, Inc. (“SkyWest Airlines”) and ExpressJet Airlines, Inc. (“ExpressJet”), as well as the regional airline industry. Mr. Atkin performs an extremely valuable role as the Chairman of the Board, providing critical leadership and direction to the Board’s activities and deliberations. The Board also believes Mr. Atkin’s values and integrity are tremendous assets to the Company and its shareholders.
Other Directorships: . Mr. Atkin currently serves as a director of Zion’s Bancorporation, a regional bank holding company based in Salt Lake City, Utah (“Zions”).

6
W. Steve Albrecht
Age: . . . . . . . . . . . . . . . 69 Director Since: . . . . . . 2012 (Also served as a director of the Company from 2003 until 2009) Committees: . . . . . . . . Chairman of the Audit and Finance Committee; Member of the Nominating and Corporate
Governance Committee; Audit Committee Financial Expert Principal Occupation: Professor at Brigham Young University
Experience: . . . . . . . . . Mr. Albrecht, a certified public accountant, certified internal auditor, and certified fraud
examiner, joined the faculty of Brigham Young University in 1977, after teaching at the University of Illinois and Stanford University. At Brigham Young University, he served as director of the School of Accountancy (from 1990 to 1999) and as associate dean of the Marriott School (from 1999 to 2008). He served as the President of the Japan Tokyo Mission of The Church of Jesus Christ of Latter-day Saints from July 2009 to July 2012. Mr. Albrecht has also served as the President of the American Accounting Association, the Association of Certified Fraud Examiners and Beta Alpha Psi. He has also served as a member of the Committee of Sponsoring Organizations of the Treadway Commission (also known as “COSO”); the Financial Accounting Standards Advisory Committee, an advisory committee to the Financial Accounting Standards Board (the “FASB”); and the Financial Accounting Foundation that oversees the FASB and GASB. Mr. Albrecht has consulted with many major corporations and other organizations and has been an expert witness in over 35 major financial statement fraud cases.
The Board recognizes Mr. Albrecht’s valuable contribution as a director of the Company from 2003 through 2009 and since his re-election in 2012, including his service as the Chairman of the Audit and Finance Committee. The Board nominated Mr. Albrecht because of his exceptional academic and professional record, his many achievements, awards and other forms of recognition in the accounting profession, his extensive training in accounting practices and fraud detection, and his outstanding past service on the Board.
Other Directorships: . Mr. Albrecht currently serves as a director of Red Hat, Inc. and Cypress Semiconductor.

7
Russell A. Childs
Age: . . . . . . . . . . . . . . . 48 Director Since: . . . . . . January 1, 2016 Committees: . . . . . . . . None Principal Occupation: Chief Executive Officer and President of the Company and its two operating subsidiaries,
SkyWest Airlines and ExpressJet.
Experience: . . . . . . . . . Prior to being named Chief Executive Officer and President of SkyWest, Inc. effective January 1, 2016. Mr. Childs was named President of the Company in 2014 and was responsible for the holding company’s operating entities and all commercial activities. He joined the Company in 2001 and became Vice President – Controller later that year. He served as the President and Chief Operating Officer of SkyWest Airlines from 2007 to 2014. He is the only officer of the Company nominated to serve as a director, and plays a critical role in communicating the Board’s expectations, advice and encouragement to approximately 18,500 full-time equivalent employees of the Company. Mr. Childs earned his bachelor's degree in Economics and master's degree in Accounting from Brigham Young University. Prior to joining the Company, Mr. Childs was a certified public accountant employed by a public accounting firm.

8
Henry J. Eyring
Age: . . . . . . . . . . . . . . . 52 Director Since: . . . . . . 2006 (Also served as a director of the Company from 1995 until 2003) Committees: . . . . . . . . Member of the Compensation Committee; Member of the Audit and Finance Committee Principal Occupation: Academic Vice President at Brigham Young University Idaho
Experience: . . . . . . . . . Mr. Eyring has served in various positions of administration at Brigham Young University
Idaho since 2006. Mr. Eyring was President of the Japan Tokyo North Mission of The Church of Jesus Christ of Latter-day Saints from 2003 until 2006. From 2002 until 2003 he was a special partner with Peterson Capital, a private equity investment firm; and from 1998 through 2002 he was the Director of the Masters of Business Administration Program at Brigham Young University.
The Board recognizes the strong business and strategic consulting experience Mr. Eyring contributes to the Board’s direction of the Company. In addition to the recent experience summarized above, Mr. Eyring was previously engaged with the Monitor Company, an internationally-recognized management consulting firm. Mr. Eyring is a sound strategic thinker who possesses the unique ability to apply his academic thought and studies to the practical day-to-day challenges of the Company’s operations. His thoughtful application of business and legal principles has been a valuable contribution to his service on the Board.

9
Meredith S. Madden
Age: . . . . . . . . . . . . . . . 42 Director Since: . . . . . . 2015 Committees: . . . . . . . . Member of the Compensation Committee; Member of the Safety and Compliance Committee Principal Occupation: Chief Executive Officer of NORDAM Group, Inc. (“NORDAM”).
Experience: . . . . . . . . . Mrs. Madden was appointed Chief Executive Officer of NORDAM, one of the world’s largest
independently owned aerospace companies in July 2011. Prior to becoming the Chief Executive Officer of NORDAM, Mrs. Madden served in various leadership roles at NORDAM including President, Chief Operating Officer, Vice President Repair Group, Vice President Global Sales and Marketing and Vice President of NORDAM International, a subsidiary of NORDAM. Since joining NORDAM in 1999, Mrs. Madden has played a key role in transforming NORDAM into the global aerospace entity it is today.
The Board recognizes Mrs. Madden’s expertise and strategic insights related to aircraft maintenance vendor planning. Additionally Mrs. Madden has extensive expertise working with international maintenance service providers.
Other Directorships: . Mrs. Madden currently serves as a director of NORDAM, Erickson AirCrane, Inc. and World Travel Service LLC.

10
Ronald J. Mittelstaedt
Age: . . . . . . . . . . . . . . . 52 Director Since: . . . . . . 2013 Committees: . . . . . . . . Member of the Compensation Committee; Member of the Nominating and Corporate
Governance Committee; Member of the Safety and Compliance Committee Principal Occupation: Chairman of the Board and Chief Executive Officer of Waste Connections, Inc. (“Waste
Connections”)
Experience: . . . . . . . . . Mr. Mittelstaedt has served as the Chairman and Chief Executive Officer of Waste Connections, a company he founded, since January 1998. Under Mr. Mittelstaedt’s leadership, Waste Connections has become the third largest company in the North American solid waste and recycling industry, employing more than 7,000 people nationwide. Mr. Mittelstaedt also established the RDM Positive Impact foundation in 2004 to improve the lives of underprivileged and at-risk children. Prior to his career in waste management, he spent three years in the air freight industry. The common stock of Waste Connections is traded on the New York Stock Exchange. Mr. Mittelstaedt holds a bachelor’s degree in Business Economics and Finance from the University of California—Santa Barbara.
The Board recognizes Mr. Mittelstaedt’s expertise in making large capital equipment decisions, extensive experience working with groups of diverse employees in various geographic regions and history of developing an organizational culture of strong work ethics. Mr. Mittelstaedt also contributes to the Board his insight as an experienced chief executive officer of a publicly-traded company, which the Board has found valuable in its deliberations.
Other Directorships: . Mr. Mittelstaedt currently serves as Chairman of the Board for Waste Connections and as a director of Pride Industries, a non-profit organization which provides manufacturing, supply chain, logistics and facilities services to public and private organizations nationwide while creating jobs for people with disabilities.

11
Andrew C. Roberts
Age: . . . . . . . . . . . . . . . 55 Director Since: . . . . . . 2015 Committees: . . . . . . . . Chairman of the Safety and Compliance Committee; Member of the Audit and Finance
Committee Principal Occupation: Executive Chairman, Ryan Herco Flow Solutions, LLC (“Ryan Herco Flow Solutions”)
Experience: . . . . . . . . . Mr. Roberts has served as the Executive Chairman of Ryan Herco Flow Solutions since
September, 2015. Prior to joining Ryan Herco Flow Solutions, Mr. Roberts served as the President and Chief Executive Officer of Align Aerospace LLC, a global distributor of products to the aerospace and aviation Industries, from 2014 to September 2015. Mr. Roberts served as Chief Executive Officer of Permaswage Holding S.A.S., a designer and manufacturer of fluid fitting products, providing proprietary and standard components, tooling, and training to major aerospace companies, from 2009 until 2014. Mr. Roberts also developed significant experience in the management and operation of mainline and regional airlines from 1997 until 2008. During this time, Mr. Roberts served in multiple executive positions, including periods as Executive Vice President, Operations; Senior Vice President of Technical Operations; and Vice President of Materials Management Operations of Northwest Airlines, Inc.; and the Chairman of the Board and Chief Executive Officer of MCH, Inc., the holding company of Mesaba Airlines and Compass Airlines, two regional airlines. From 2000 until 2008, Mr. Roberts also served as Chairman of the Board of Aeroxchange Ltd., an aviation equipment purchasing portal established by 13 international airlines to create a global, neutral e-commerce platform designed to support the aviation supply chain. Mr. Roberts holds a bachelor of science degree (with Honors) in Engineering from the University of Birmingham and a post graduate diploma in Manufacturing Engineering from Coventry University.
Mr. Roberts’ nomination for service as a director by the Board and its Nominating and Corporate Governance Committee is based, in part, on Mr. Roberts’ extensive background in the aviation maintenance and overhaul industry, as well as Mr. Roberts’ experience as the principal executive officer of two regional airlines and as a senior executive officer of a major airline. The Board and its Nominating and Corporate Governance Committee also recognize Mr. Roberts’ education and professional training in the fields of engineering and aviation manufacturing, and believe he will make significant contributions to the Board in assessing the Company’s technical operations.
Other Directorships: . Mr. Roberts is a director of Continental Motors Group Limited.

12
Keith E. Smith
Age: . . . . . . . . . . . . . . . 55 Director Since: . . . . . . 2013 Committees: . . . . . . . . Chairman of the Compensation Committee; Member of the Audit and Finance Committee Principal Occupation: President and Chief Executive Officer of Boyd Gaming Corporation (“Boyd Gaming”)
Experience: . . . . . . . . . Mr. Smith is President, Chief Executive Officer and a director of Boyd Gaming, one of the
nation’s leading casino entertainment companies, with 22 operations in eight states and more than 25,000 employees. Mr. Smith is an industry veteran with nearly 31 years of gaming experience. He joined Boyd Gaming in 1990 and held various executive positions before being promoted to Chief Operating Officer in 2001. In 2005, Mr. Smith was named President and elected as a director of Boyd Gaming and in 2008 he assumed the role of Chief Executive Officer. The common stock of Boyd Gaming is traded on the New York Stock Exchange.
Mr. Smith holds a bachelor’s degree in Accounting from Arizona State University. He served as Chairman of the Los Angeles Branch of the Federal Reserve Bank of San Francisco from 2012 to 2014. He also serves as Chairman of the American Gaming Association and the Nevada Resort Association. He served as Vice Chairman of the Las Vegas Convention and Visitors Authority from 2005 to 2011.
The Board recognizes Mr. Smith’s diverse experience in investing in, financing, and managing capital assets and real properties in various geographic regions. Mr. Smith also has extensive experience in leading and directing a large group of diverse employees. Mr. Smith’s accounting training and experience and his service as Chairman of the Los Angeles Branch of the Federal Reserve Bank of San Francisco also enable him to provide valuable service as the Chair of the Compensation Committee and to the Audit and Finance Committee.
Other Directorships: . Mr. Smith is a director of Boyd Gaming.

13
Steven F. Udvar-Hazy
Age: . . . . . . . . . . . . . . . 70 Director Since: . . . . . . 1986 Committees: . . . . . . . . Lead Independent Director; Chairman of the Nominating and Corporate Governance
Committee; Member of the Compensation Committee Principal Occupation: Chairman of the Board and Chief Executive Officer of Air Lease Corporation
Experience: . . . . . . . . . Mr. Udvar-Hazy has been engaged in aircraft leasing and finance for more than 41 years and
has served as the Chairman of the Board and Chief Executive Officer of Air Lease Corporation since February 2010. Prior to his current engagement with Air Lease Corporation, which leases and finances commercial jet aircraft worldwide, Mr. Udvar-Hazy founded and served as the Chairman of the Board and Chief Executive Officer of International Lease Finance Corporation, which leases and finances commercial jet aircraft.
Mr. Udvar-Hazy is recognized as one of the leading experts in the aviation industry, and contributes to the Board the wisdom and insight he has accumulated through a lengthy, distinguished career in aviation, aircraft leasing and finance. The Company has benefitted greatly from Mr. Udvar-Hazy’s recognized position in the aviation industry, including introductions to his vast industry contacts and networking opportunities. In addition to his extensive industry experience, Mr. Udvar-Hazy is extremely knowledgeable of the Company’s operations and opportunities, having served as a director of the Company for more than 29 years. Mr. Udvar-Hazy’s even temperament and ability to encourage discussion, together with his experience as a chief executive officer and director of other successful organizations in the airline industry, make him an effective Lead Independent Director.
Other Directorships: . Mr. Udvar-Hazy is Chairman of the Board of Air Intercontinental, Inc., an aviation investment company, President and director of Ocean Equities, Inc., a financial holding company, and Chairman of the Executive Committee of the Board of Directors of Emerald Financial LLC, a real estate investment company.

14
James L. Welch
Age: . . . . . . . . . . . . . . . 61 Director Since: . . . . . . 2007 Committees: . . . . . . . . Member of the Audit and Finance Committee; Member of the Nominating and Corporate
Governance Committee; Member of the Safety and Compliance Committee Principal Occupation: Chief Executive Officer of YRC Worldwide Inc. (“YRC Worldwide”).
Experience: . . . . . . . . . Since July 2011, Mr. Welch has served as the Chief Executive Officer of YRC Worldwide, a
provider of global, national and regional ground transportation services. From 2008 until July 2011, Mr. Welch served as the President and Chief Executive Officer of Dynamex, Inc., a provider of same-day transportation and logistics services in the United States and Canada. During 2007 and 2008 he served as Interim Chief Executive Officer of JHT Holdings, a holding company of multiple enterprises engaged in automotive transport and management services. From 2000 until 2007, Mr. Welch served as the President and Chief Executive Officer of Yellow Transportation, an international transportation services provider.
Mr. Welch has over 33 years of senior executive experience in the transportation sector, including valuable experience in the leadership of large and varied groups. That experience includes extensive experience working with organized labor groups, including labor unions. Mr. Welch’s insights have been particularly valuable to the Board as the Company has addressed labor and related issues arising in the operation of SkyWest Airlines and ExpressJet. Mr. Welch also contributes to the Board valuable practical experience in the operation of a large enterprise, as well as the perspective of a successful entrepreneur.
Other Directorships: . Mr. Welch serves as a director for YRC Worldwide and Erickson Air Crane, a manufacturer and operator of heavy-lift helicopters.

15
EXECUTIVE OFFICERS
In addition to Russell A. Childs, the Chief Executive Officer of the Company, whose biographical information is set forth above, the following individuals served as executive officers of the Company or its operating subsidiaries during 2015.
Robert J. Simmons, 53 is the Chief Financial Officer of Company, SkyWest Airlines and ExpressJet. He is responsible for the areas of finance, accounting, treasury and investor relations for the Company and its subsidiaries.
From 2009 until his appointment as Chief Financial Officer in March 2015, Mr. Simmons served as a Partner with Bendigo Partners, LLC. (“Bendigo Partners”), a privately held firm focused on technology based financial services as private equity investors and operational consultants. In his role with Bendigo Partners, Mr. Simmons was responsible for portfolio management. He served as Chief Financial Officer for E*TRADE Financial Corporation from 2003 to 2008 and as Corporate Treasurer for E*TRADE Financial Corporation from 2001 to 2003. He has accumulated more than 29 years of finance and treasury experience in various leadership positions at companies including Oracle, Iomega, and Bank of America. Mr. Simmons holds a master’s degree in business administration, with an emphasis in finance from the Kellogg Graduate School of Management at Northwestern University, and graduated magna cum laude with a bachelor’s degree in international business from Brigham Young University.
Wade J. Steel, 40 is the Chief Commercial Officer of the Company, SkyWest Airlines and ExpressJet. He is responsible for the Company’s contractual relationships with American Airlines, Inc. (“American”), Delta Airlines, Inc. (“Delta”), United Airlines, Inc. (“United”) and Alaska Airlines, Inc. (“Alaska”), development of new business opportunities with network airlines, fleet management and information technology. He also plays a vital role for the strategic planning and development opportunities of the Company.
Mr. Steel was initially employed with the Company in March 2007 as Director of Financial Planning and Analysis. He held this position until May 2011, when he was appointed to serve as Vice President—Controller for SkyWest Airlines. From May 2014 until Mr. Steel’s appointment as Chief Commercial Officer of the Company in March 2015, he served as the Executive Vice President and acting Chief Financial Officer of the Company, with responsibility for the areas of finance, treasury, investor relations and information technology for the Company and its subsidiaries. Mr. Steel is a certified public accountant.
Michael B. Thompson, 40, is the Chief Operating Officer of SkyWest Airlines. He is responsible for oversight of all aspects of SkyWest Airlines’ operations, including safety, quality, flight operations, maintenance and customer service. He also oversees SkyWest Airline’s operational relationships with American, Delta, United and Alaska.
Mr. Thompson was initially employed with the Company in April 2001 as Operations Analyst and was later named Director of Market Planning. In 2007 he was named Vice President of Market Development of SkyWest Airlines, in which position he served until May 2014, when he was appointed to serve as Chief Operating Officer of SkyWest Airlines.
Terry M. Vais, 48, is the Chief Operating Officer of ExpressJet. Mr. Vais is responsible for oversight of all aspects of ExpressJet’s operations, including safety, quality, flight operations, maintenance and customer service. He also oversees ExpressJet’s operational relationships with its major airline partners, including American, Delta and United.
Prior to his appointment as Chief Operating Officer of ExpressJet in September 2015, Mr. Vais served as Vice President of Operations, Planning and Support for ExpressJet. He has accumulated more than 25 years of airline experience in various leadership positions.

16
Eric J. Woodward, 44, is the Chief Accounting Officer of the Company, SkyWest Airlines and ExpressJet. He is responsible for the oversight of the Company’s financial accounting practices, internal controls and reporting to the U.S. Securities and Exchange Commission.
Mr. Woodward was employed in various other capacities with the Company from April 2004 until April 2007 and served as the Company’s Vice President—Controller from April 2007 until May 2011, when he was appointed to serve as Chief Accounting Officer of the Company. Mr. Woodward is a certified public accountant.
CORPORATE GOVERNANCE
Corporate Governance Guidelines
The Board adopted Corporate Governance Guidelines on August 2, 2005 and has periodically reviewed and ratified those guidelines, most recently on February 10, 2016. The Corporate Governance Guidelines can be accessed at the Company’s website, inc.skywest.com. The Company’s Corporate Governance Guidelines supplement the Company’s Bylaws and the charters of the Board’s committees. Excerpts from the principal sections of the Company’s Corporate Governance Guidelines are noted below:
Director Independence
At a minimum, the Board will have a majority of directors who meet the criteria for independence as required by The Nasdaq Global Select Market.
Director Qualifications
Criteria for Membership
The Company’s Nominating and Corporate Governance Committee is responsible for annually reviewing with the Board the desired skills and characteristics of directors, as well as the composition of the Board as a whole.
Terms and Limitations
All directors currently stand for election each year. The Board does not believe it should establish a limit on the number of times that a director may stand for election.
Retirement
Directors are required to submit their resignation from the Board when their term expires upon reaching the age of 72 years old. The Board will accept the resignation unless the Nominating and Corporate Governance Committee recommends otherwise. Directors generally will not be nominated for election following their 72nd birthday.
Ownership of Company Stock
Directors are encouraged to own shares of Common Stock having a value equal to three times the amount of their annual cash retainer.

17
Director Responsibilities
General Responsibilities
The basic responsibility of directors is to exercise their business judgment to act in what they reasonably believe to be in the best interests of the Company and its shareholders.
Oversight of Management
The Board is responsible to encourage the Company’s management to effectively implement policies and strategies developed by the Board, and to provide dynamic leadership of the Company.
Board Meetings and Materials
Frequency of Meetings
The Board has four regularly scheduled meetings per year. As determined necessary by the Board and in order to address the Company’s needs, special meetings of the Board are convened from time to time.
Meeting Responsibilities
Absent extraordinary circumstances, directors of the Company should attend Board meetings, meetings of the committee on which they serve and shareholder meetings. The Chairman of the Board is responsible for establishing the agenda for each Board meeting. Each director is free to suggest the inclusion of items on the agenda and to raise at any Board meeting subjects that are not on the agenda for that meeting.
Executive Sessions of Independent Directors
The Company’s independent directors meet in executive session regularly, generally quarterly. The independent directors may either choose one director annually to serve as the Lead Independent Director and to preside at all executive sessions or establish a procedure by which a Lead Independent Director will be selected. The independent directors of the Company have chosen Mr. Udvar-Hazy to serve as the Lead Independent Director.
Committees
The Board has four standing committees: (1) Audit and Finance, (2) Compensation, (3) Nominating and Corporate Governance and (4) Safety and Compliance. The Board may, from time to time, establish or maintain additional committees as the Board deems necessary or appropriate.
Director Compensation
The form and amount of director compensation is determined by the Board based on general principles established on the Nominating and Corporate Governance Committee’s recommendation. These principles are in accordance with the policies and principles set forth in the Nominating and Corporate Governance Committee’s charter and are intended to be consistent with rules established by The Nasdaq Global Select Market, including those relating to director independence and to compensation of Audit and Finance Committee members.

18
CEO Evaluation and Management Succession
The Nominating and Corporate Governance Committee conducts an annual review to assess the performance of the Company’s Chief Executive Officer. The Nominating and Corporate Governance Committee communicates the results of its review to the other directors in a meeting that is not attended by the Chief Executive Officer. The directors of the Company, excluding the Chief Executive Officer, review the Nominating and Corporate Governance Committee’s report to assess the Chief Executive Officer’s leadership in the long and short-term, as well as the Company’s long-term succession plans.
Annual Evaluations
The Board conducts an annual evaluation to determine if the Board and its committees are functioning effectively. The Nominating and Corporate Governance Committee solicits comments from all of the Company’s directors and reports annually to the Board with an assessment of the Board’s performance. Each of the Board’s standing committees conducts an annual evaluation to assess the performance of the applicable committee.
Review and Access to Guidelines
The Nominating and Corporate Governance Committee reviews the Company’s Corporate Governance Guidelines at least annually, then, as it deems appropriate, recommends amendments to the Board.
Board Leadership Structure
Although the Board does not have a formal policy on whether the roles of Chairman of the Board and Chief Executive Officer should be combined or separated, from 1991 until January 2016, Jerry C. Atkin served as both Chairman of the Board and Chief Executive Officer of the Company. In January 2016, the Board appointed Russell A. Childs to serve as the Chief Executive Officer of the Company, which resulted in the separation of the roles of Chairman of the Board and Chief Executive Officer. Currently, Mr. Atkin serves as Chairman of the Board and Mr. Childs serves as the Chief Executive Officer. The Board believes that such separation allows Mr. Childs to focus his time and energy on managing the Company’s business on a day-to-day basis, while also leveraging Mr. Atkin’s background with the Company, perspective and vast experience in the aviation industry as he devotes his time and attention to matters of Board oversight.
The Company is committed to independent Board oversight. Pursuant to the Company’s Corporate Governance Guidelines, all of the Company’s directors (other than Messrs. Atkin and Childs) meet the standards of independence applicable to the Company, and the Board has designated Steven F. Udvar-Hazy as Lead Independent Director. As Lead Independent Director, Mr. Udvar-Hazy is empowered to prepare agendas for and conduct meetings of the non-management directors, communicate with the Chairman of the Board, disseminate information to the Board, and raise issues with management on behalf of the independent directors when appropriate. The Board’s independent oversight function is enhanced by the fact that the Audit and Finance, Compensation, Nominating and Corporate Governance and Safety and Compliance Committees are comprised entirely of independent directors.
The Board believes no single leadership model is right for all companies at all times. The Board recognizes that, depending on the circumstances, other leadership models may be appropriate. The independent directors and the Nominating and Corporate Governance Committee regularly review the Company’s leadership structure and, depending on the Company’s needs and the available resources, the Board may modify the Company’s existing leadership structure.

19
Communications with the Board
Shareholders and other interested parties may communicate with one or more directors or the non-management directors as a group in writing by regular mail. The following address may be used by those who wish to send such communications by regular mail:
Board of Directors or Name of Individual Director(s)c/o Chief Financial Officer SkyWest, Inc. 444 South River Road St. George, UT 84790
Code of Ethics
The Company has adopted a Code of Ethics for Directors and Senior Executive Officers (the “Code of Ethics”), which is available on the Company’s website, inc.skywest.com. The Code of Ethics includes the following principles related to the Company’s directors and executive officers:
• Act ethically with honesty and integrity;
• Promote full, fair, accurate, timely and understandable disclosure in reports and documents filed with the Securities and Exchange Commission and other public communications;
• Comply in all material respects with laws, rules and regulations of governments and their agencies;
• Comply in all material respects with the listing standards of a stock exchange where the shares of Common Stock are traded;
• Respect the confidentiality of information acquired in the course of performing work for the Company, except when authorized or otherwise legally obligated to disclose the information; and
• Do not use confidential information of the Company for personal advantage or for the benefit of acquaintances, friends or relatives.
Risk Oversight
The Board and its committees are involved in overseeing risk associated with the Company and its operations. The Board and the Audit and Finance Committee monitor the Company’s credit risk, liquidity risk, regulatory risk, operational risk and enterprise risk by regular reviews with management and internal and external auditors and other advisors. In its periodic meetings with the internal auditors and the Company’s independent accountants, the Audit and Finance Committee discusses the scope and plan for the internal audit and includes management in its review of accounting and financial controls, assessment of business risks, legal and ethical compliance programs and related-party transactions. The Board and the Nominating and Corporate Governance Committee monitor the Company’s governance and succession risk by regular review with management and outside advisors. The Board and the Compensation Committee monitor CEO succession and the Company’s compensation policies and related risks by regular reviews with management and the Compensation Committee’s outside advisors. The Board and the Safety and Compliance Committee monitor management’s administration of airline flight operations safety and compliance with safety regulations.

20
Whistleblower Hotline
The Company has established a whistleblower hotline that enables employees, customers, suppliers and shareholders of the Company and its subsidiaries, as well as other interested parties, to submit confidential and anonymous reports of suspected or actual violations of the Code of Ethics. The hotline number is (888) 273-9994.
MEETINGS AND COMMITTEES OF THE BOARD
The Board
Each director is expected to devote sufficient time, energy and attention to ensure diligent performance of his or her duties and to attend all Board, committee and shareholders’ meetings. The Board met five times during 2015, all of which were regularly-scheduled meetings. All directors attended at least 75% of the meetings of the Board and of the committees on which he or she served during the year ended December 31, 2015 and seven of the Company’s eight directors who were then serving attended the Annual Meeting of the Company’s Shareholders held on May 5, 2015.
Committees of the Board
The Board has four standing committees to facilitate and assist the Board in the execution of its responsibilities: (1) Audit and Finance, (2) Compensation, (3) Nominating and Corporate Governance and (4) Safety and Compliance. All the committees are comprised solely of non-employee, independent directors as defined by The Nasdaq Global Select Market listing standards. Charters for each committee are available on the Company’s website, inc.skywest.com.
The table below shows current membership for each of the standing Board committees.
Nominating & Corporate Audit & Finance Compensation Governance Safety and Compliance
W. Steve Albrecht* Keith E. Smith* Steven F. Udvar-Hazy* Andrew C. Roberts*Henry J. Eyring Ronald J. Mittelstaedt Ronald J. Mittelstaedt Meredith S. MaddenJames L. Welch Henry J. Eyring W. Steve Albrecht Ronald J. MittelstaedtKeith E. Smith Steven F. Udvar-Hazy James L. Welch James L. Welch
Andrew C. Roberts Meredith S. Madden
* Committee Chairman
Audit and Finance Committee
The Audit and Finance Committee has five members and met seven times during the year ended December 31, 2015. The Board has determined that Mr. W. Steve Albrecht, Chairman of the Audit and Finance Committee, is an “audit committee financial expert” within the meaning established by the U.S. Securities and Exchange Commission.
The Audit and Finance Committee’s responsibilities, which are discussed in further detail in its charter, include the responsibility to:
• Establish and implement policies and procedures for review and approval of the appointment, compensation and termination of the independent registered public accounting firm;
• Review and discuss with management and the independent registered public accounting firm the audited financial statements of the Company and the Company’s financial disclosure practices;

21
• Pre-approve all audit and permissible non-audit fees;
• Provide oversight of the Company’s internal auditors;
• Hold meetings periodically with the Company’s independent registered public accounting firm, the Company’s internal auditors and management to review and monitor the adequacy and effectiveness of the Company’s financial reporting, internal controls and risk assessment and compliance with Company policies;
• Review the Company’s consolidated financial statements and related disclosures;
• Review with management and the Company’s independent registered public accounting firm and approve disclosure controls and procedures and accounting principles and practices; and
• Perform other functions or duties deemed appropriate by the Board.
Additional information regarding the Audit and Finance Committee’s processes and procedures is addressed below under the heading “Audit and Finance Committee Disclosure.” The Report of the Audit and Finance Committee is set forth on page 55 of this Proxy Statement.
Compensation Committee
The Compensation Committee has five members and met four times during the year ended December 31, 2015. The Compensation Committee’s responsibilities, which are discussed in detail in its charter, include the responsibility to:
• In consultation with the Company’s senior management, establish the Company’s general compensation philosophy and oversee the development and implementation of the Company’s compensation programs;
• Recommend to the Board the base salary, incentive compensation and any other compensation for the Company’s Chief Executive Officer and review and approve the Chief Executive Officer’s recommendations for the compensation of all other officers of the Company and its subsidiaries;
• Administer the Company’s incentive and stock-based compensation plans, and discharge the duties imposed on the Compensation Committee by the terms of those plans;
• Review and approve any severance or termination payments proposed to be made to any current or former officer of the Company;
• Prepare and issue the report of the Compensation Committee required by the rules of the Securities and Exchange Commission; and
• Perform other functions or duties deemed appropriate by the Board.
Additional information regarding the Compensation Committee’s processes and procedures for consideration of executive compensation are addressed below under the Heading “Compensation Discussion and Analysis.” The report of the Compensation Committee is set forth on page 33 of this Proxy Statement.

22
Nominating and Corporate Governance Committee
The Nominating and Corporate Governance Committee has four members and met once during the year ended December 31, 2015. The Nominating and Corporate Governance Committee’s responsibilities, which are discussed in detail in its charter, include the responsibility to:
• Develop qualifications and criteria for selecting and evaluating directors and nominees;
• Consider and propose director nominees;
• Make recommendations to the Board regarding Board compensation;
• Make recommendations to the Board regarding Board committee memberships;
• Develop and recommend to the Board corporate governance guidelines;
• Facilitate an annual assessment of the performance of the Board and each of its standing committees;
• Consider the independence of each director and nominee for director; and
• Perform other functions or duties deemed appropriate by the Board.
Safety and Compliance Committee
The Safety and Compliance Committee has four members and met twice during the year ended December 31, 2015. The responsibilities of the Safety and Compliance Committee, which are discussed in detail in its charter, include the responsibility to:
• Review and make recommendations to the Board addressing airline flight operations, safety and compliance with safety regulations;
• Periodically review with the Company’s management, and such advisors as the Safety and Compliance Committee deems appropriate, aspects of flight operations, safety and compliance with safety regulations; and
• Monitor and provide input with respect to management’s efforts to create and maintain a safety culture within the Company’s operations.
Nomination Process
The policy of the Nominating and Corporate Governance Committee is to consider properly submitted shareholder recommendations for candidates to serve as directors of the Company. In evaluating those recommendations, the Nominating and Corporate Governance Committee seeks to achieve a balance of knowledge, experience and capability on the Board and to address the membership criteria described below. Any shareholder wishing to recommend a candidate for consideration by the Nominating and Corporate Governance Committee should submit a recommendation in writing indicating the candidate’s qualifications and other relevant biographical information and provide confirmation of the candidate’s consent to serve as a director. This information should be addressed to Jerry C. Atkin, Chairman of the Board of the Company, 444 South River Road, St. George, Utah 84790.

23
As contemplated by the Company’s Corporate Governance Guidelines, the Nominating and Corporate Governance Committee reviews the appropriate skills and characteristics required of directors in the context of the current composition of the Board, at least annually. There is currently no set of specific minimum qualifications that must be met by a nominee recommended by the Nominating and Corporate Governance Committee, as different factors may assume greater or lesser significance at particular times and the needs of the Board may vary in light of its composition and the Nominating and Corporate Governance Committee’s perceptions about future issues and needs. Among the factors the Nominating and Corporate Governance Committee considers, which are outlined in the Corporate Governance Guidelines, are independence, diversity, age, skills, integrity and moral responsibility, policy-making experience, ability to work constructively with the Company’s management and directors, capacity to evaluate strategy and reach sound conclusions, availability of time and awareness of the social, political and economic environment.
The Nominating and Corporate Governance Committee utilizes a variety of methods for identifying and evaluating director nominees. The Nominating and Corporate Governance Committee assesses the appropriate size of the Board, and whether any vacancies on the Board are expected due to retirement or otherwise. In the event that vacancies are anticipated, or otherwise arise, the Nominating and Corporate Governance Committee considers various potential candidates for director. Candidates may come to the attention of the Nominating and Corporate Governance Committee through various means, including current directors, professional search firms, shareholder recommendations or other referrals. Candidates are evaluated at meetings of the Nominating and Corporate Governance Committee, and may be considered at any point during the year. All director-nominee recommendations which are properly submitted to the Nominating and Corporate Governance Committee are aggregated and considered by the Nominating and Corporate Governance Committee at a meeting prior to the issuance of the proxy statement for the next annual meeting of shareholders. Any materials provided by a shareholder in connection with the recommendation of a director candidate are forwarded to the Nominating and Corporate Governance Committee, which considers the recommended candidate in light of the director qualifications discussed above. The Nominating and Corporate Governance Committee also reviews materials provided by professional search firms, if applicable, or other parties in connection with a candidate who is not proposed by a shareholder. In evaluating such recommendations, the Nominating and Corporate Governance Committee seeks to achieve a balance of knowledge, experience and capability on the Board. The Nominating and Corporate Governance Committee has, on occasion, engaged professional search firms to assist in identifying qualified candidates for Board service. When such firms have been engaged, the Nominating and Corporate Governance Committee has utilized their services principally for the purpose of identifying and screening potential candidates and conducting background research; however, the members of the Nominating and Corporate Governance Committee, as well as other directors of the Company, have conducted interviews with prospective candidates and have performed other functions in completing the nomination process.
Compensation Committee Interlocks and Insider Participation
Keith E. Smith, Ronald J. Mittelstaedt, Henry J. Eyring, Steven F. Udvar-Hazy, Margaret S. Billson and Robert G. Sarver served as members of the Compensation Committee at various times during the year ended December 31, 2015. None of the individuals who served on the Compensation Committee during the year ended December 31, 2015, was an officer or employee of the Company in 2015 or any time prior thereto. None of the members of the Compensation Committee during the year ended December 31, 2015, had any relationship with the Company requiring disclosure under Item 404 of Regulation S-K promulgated under the Securities Exchange Act of 1934, as amended (the “Exchange Act”). None of the executive officers of the Company served as a member of the Compensation Committee or of any similar committee of any other company whose executive officer(s) served as a director of the Company.

24
COMPENSATION DISCUSSION AND ANALYSIS
The following narrative compensation discussion and analysis provides information regarding the Company’s executive compensation objectives, principles, practices and decisions as they relate to the following named executive officers of the Company (the “Executives”):
• Jerry C. Atkin, Chairman of the Board and former Chief Executive Officer of the Company, SkyWest Airlines and ExpressJet (the “Chief Executive” for fiscal year 2015);
• Russell A. Childs, Chief Executive Officer and President of the Company, SkyWest Airlines and ExpressJet;
• Robert J. Simmons, Chief Financial Officer of the Company, SkyWest Airlines and ExpressJet;
• Wade J. Steel, Chief Commercial Officer and for portions of fiscal year 2015, Acting Chief Financial Officer of the Company, SkyWest Airlines and ExpressJet;
• Michael B. Thompson, Chief Operating Officer of SkyWest Airlines; and
• Terry M. Vais, Chief Operating Officer of ExpressJet.
The compensation discussion and analysis provides narrative perspective to the tables and disclosure in the tables following this section.
Current Year Accomplishments
The Company’s income before income taxes improved to $194 million in 2015, from a loss before income taxes of $16 million in 2014. Operating income improved to $234 million in 2015, from $25 million in 2014. The 2014 results included a $75 million pre-tax special items operating expense primarily related to fleet reductions. Such improvement was driven, in part, by the following accomplishments:
• The improvement in fleet mix, which included a net reduction in the total number of aircraft available for service from 717 aircraft at December 31, 2014 to 660 at December 31, 2015, summarized as follows:
o Added 25 new Embraer E175 aircraft under flying contracts with improved profitability;
o Added 21 used 50-seat aircraft under flying contracts with improved profitability;
o Removed 76 50-seat aircraft from unprofitable or less profitable flying contracts;
o Removed the remaining less profitable 27 Embraer EMB-120 turboprop from its operations;
• SkyWest Airlines’ and ExpressJet’s improved operational performance resulted in additional flying contract performance incentives earned;
• The Company continued to improve the profitability of its pro-rate operations; and
• The Company worked with its major airline partners to reduce scheduled operations at specific hubs to improve operational efficiencies.

25
These accomplishments not only improved the Company’s performance, but the Board believes these accomplishments will contribute to improved financial performance in future years.
Compensation Objectives and Principles
The overall objective of the Company’s executive compensation programs is to create long-term value for the Company’s shareholders by attracting and retaining talented executives that effectively manage the Company in a manner that is consistent with the long-term interest of shareholders.
Accordingly, the executive compensation program incorporates the following principles:
• The overall compensation package should encourage long-term focus and shareholder value creation.
• Compensation should be competitive with other airlines in order to attract and retain talented executives.
• Compensation should be based upon individual responsibility, leadership ability and experience.
• Compensation should reflect the fair market value of the services received.
• A significant amount of total compensation should be incentive based, and should correlate to the Company’s financial performance, as well as the achievement of operational goals.
• Compensation should not encourage the taking of undue, material risk.
Executive Compensation Procedures
To attain the Company’s executive compensation objectives and to implement the underlying compensation principles, the Company follows the following procedures:
Role of the Committee. The Compensation Committee has responsibility for establishing and monitoring the executive compensation programs and for making decisions regarding executive compensation. The Chief Executive regularly attends the Compensation Committee meetings. The Compensation Committee also meets regularly in executive sessions. The Compensation Committee recommends the compensation package of the Chief Executive to the Board, which then sets his compensation. The Compensation Committee also considers the recommendations of the Chief Executive with respect to compensation of the other Executives, and after reviewing such recommendations, sets their compensation. The Compensation Committee also monitors, administers and approves awards under the various incentive compensation plans for all levels within the Company, including awards under the Company’s annual bonus plan and 2010 Long-Term Incentive Plan (the “2010 Plan”). As permitted by the 2010 Plan, the Compensation Committee has authorized designated directors of the Company to approve interim awards under the 2010 Plan to non-Executives on a limited basis between meetings of the Compensation Committee.
The Compensation Committee relies on its judgment in making compensation decisions in addition to reviewing relevant information and results. When setting total compensation for each of the Executives, the Compensation Committee reviews tally sheets which show the Executive’s current compensation, including base pay, annual bonus objectives, long-term, equity-based compensation objectives, and deferred compensation retirement funding. The Compensation Committee has the sole discretion to award compensation and make adjustments to awards based on the Compensation Committee’s review of relevant information and other unusual or non-recurring items.
The Compensation Committee also occasionally evaluates surveys and other available data regarding the executive compensation programs of other regional and major air carriers in order to determine competitiveness of the

26
Company’s executive compensation programs. The Compensation Committee performed such a review in 2015 that included a review of the executive compensation practices of peer transportation companies including, but not limited to Allegiant, Hawaiian Holdings, JetBlue, Republic Airways, Virgin America, Alaska Air Group, Hub Group, Werner Enterprises and Spirit Airlines. The Compensation Committee did rely upon such review of peer company compensation practices. The executive compensation procedures and the Compensation Committee assessment process are designed to be flexible in an effort to promptly respond to the evolving business environment and individual circumstances.
Role of Consultants. Neither the Company nor the Compensation Committee has any contractual arrangement with any compensation consultant for determining the amount or particular form of any Executive’s compensation. During 2014 and 2015, the Company and Compensation Committee received advice from Frederic W. Cook & Co., Inc. (“F.W. Cook”) with respect to executive compensation practices and trends generally and within the airline industry. The Company and the Compensation Committee retained F.W. Cook to make recommendations regarding the specific amount or forms of compensation awarded to Executives in 2014 and 2015. The Company and the Compensation Committee will continue to periodically seek the advice of such consultants, as deemed necessary, in the future. The Compensation Committee has sole authority to hire and fire external compensation consultants.
No Employment and Severance Agreements. The Executives do not have employment, severance or change-in-control agreements, although the vesting of stock options, restricted stock, restricted stock units, performance shares and performance units generally is accelerated upon a change in control of the Company. The Executives serve at the will of the Board, which enables the Board to terminate the employment of any Executive with discretion as to the terms of any severance. This is consistent with the Company’s performance-based employment and compensation philosophy.
Compensation Committee Consideration of Shareholder Advisory Vote. At the Company’s Annual Meeting of Shareholders held in May 2015, the Company submitted the compensation of its named executive officers to the Company’s shareholders in a non-binding vote. The Company’s executive compensation program received the support of more than 63% of the shares represented at the meeting. The Compensation Committee considered the results of the 2015 vote and views the outcome as evidence of positive shareholder support of its executive compensation decisions and policies. The Compensation Committee made some revisions to the Company’s executive compensation program for 2015 in an effort to better align the compensation packages of the Executives with the executive compensation programs of other regional carriers and major airlines. The Compensation Committee will continue to review completed compensation surveys and future shareholder voting results, including the voting results with respect to “Proposal 2—Advisory Vote on Executive Compensation” described in this Proxy Statement, and determine whether to make any changes to the Company’s executive compensation program in light of such surveys and voting results.
Elements of Compensation
The Company’s executive compensation objectives and principles are implemented through the use of the following principal elements of compensation, each discussed more fully below:
• Salary
• Annual Bonus
• Long-Term Awards
• Retirement and Other Benefits
The compensation objectives for each Executive are more fully described in the following paragraphs.

27
Salary. Salary is provided with the objective of paying for the underlying role and responsibility associated with the Executive’s position, which the Compensation Committee believes allows the Company to attract and retain qualified executives. The Executives’ salaries are set at levels that the Compensation Committee believes are generally competitive with the compensation paid to officers in similar positions at other airlines. Salary adjustments are considered annually and influenced by growth of the Company’s operations, individual performance, changes in responsibility, changes in cost of living, and other factors. The salaries of the Executives are set forth in the Summary Compensation Table immediately following this section.
Annual Bonus. In an effort to encourage achievement of the Company’s objectives, an annual performance-based bonus plan is maintained for the Executives. The combination of salary and annual bonuses is intended to result in a cash compensation package for each Executive that falls within competitive market standards as determined by the Compensation Committee based on its review and understanding of other regional and major air carrier executive compensation programs when the performance measures are met. The purpose of the bonus plan is to reward the Executives with an annual cash bonus in an amount that correlates (i) in part, to the level of pre-tax earnings of the Company or its operating subsidiaries achieved for the year; (ii) in part, to the level of cash flow from operations of the Company or its operating subsidiaries achieved for the year; and (iii) in part, to the achievement of specific operational goals during the year. The 2015 annual bonus objective of 100% of salary for Messrs. Atkin and Childs, was allocated between 65% of salary based on a pre-tax earnings target established by the Compensation Committee, 10% of salary based on a cash flow from operations target established by the Compensation Committee and 25% of salary based on the achievement of specific operational targets. The 2015 annual bonus objective of 80% of salary for Messrs. Steel, Simmons and Thompson was allocated between 52% of salary based on a pre-tax earnings target established by the Compensation Committee, 8% of salary based on a cash flow from operations target established by the Compensation Committee and 20% of salary based on the achievement of specific operational targets. Mr. Vais was appointed Chief Operating Officer of ExpressJet during 2015. Mr. Vais 2015 weighted annual bonus objective was 68% of his salary, allocated between 44% of salary based on a pre-tax earnings target , 7% of salary based on a cash flow from operations target and 17% of salary based on the achievement of specific operational targets. The differing percentages for the Executives are due to differing entity level responsibilities. Details are explained below under the headings “2015 Pre-tax Earnings Target Component”, “2015 Cash Flow from Operations Target Component” and “2015 Operational Targets Component”.
In the case of Messrs. Atkin, Childs, Steel and Simmons, the applicable pre-tax earnings target, cash flow from operations target and operational targets were based on the pre-tax earnings, the cash flow from operations and the operational performance of both operating subsidiaries, SkyWest Airlines (weighted 50%) and ExpressJet (weighted 50%). Because of his primary responsibility with respect to operations of SkyWest Airlines, Mr. Thompson’s pre-tax earnings, cash flow from operations and operational performance targets were set at the designated amounts at the SkyWest Airlines level. Similarly, because Mr. Vais was principally engaged with respect to the operations of ExpressJet, his pre-tax earnings, cash flow from operations and operational performance targets were set at the designated amounts at the ExpressJet level. At year-end, the Compensation Committee reviewed the actual pre-tax earnings, cash flow from operations and operational performance for the year, as well as other items taken into account in setting the annual pre-tax earnings, cash flow from operations and operational performance targets, and determined the extent to which the applicable goals were met.
2015 Pre-tax Earnings Target Component. In determining the annual pre-tax earnings and other financial targets to be used for the purpose of determining each bonus amount for the Executives, the Compensation Committee began with a targeted pre-tax earnings objective which the Compensation Committee considered a key measure of the financial health of the Company and the Board believes is reflective of the Company’s development of shareholder value. The Compensation Committee then considered the planned budget for the year and other unusual or non-recurring items, including changes in pro-rate flying market yields and fuel price changes. The above measurement was identified to encourage continued focus on overall pre-tax earnings and to facilitate the exchange of best practices between the operating subsidiaries of the Company.

28
2015 Cash Flow from Operations Target Component. In determining the annual cash flow from operations target to be used for the purpose of determining each bonus amount for the Executives, the Compensation Committee began with a targeted cash flow from operations objective which the Compensation Committee considered a key measure of the financial health of the Company and the Board believes is reflective of the Company’s development of shareholder value. The Compensation Committee then considered the planned budget for the year and other unusual or non-recurring items. The above measurement was identified to encourage continued focus on overall generation of free cash flow from operations and to facilitate the continued strength of the Company’s balance sheet.
2015 Operational Targets Component. A portion of the Executives’ annual bonus is based on their achievement of operational targets established in advance each year. The Compensation Committee has adopted this approach because it believes the use of operational goals allow awards to reflect the operational achievements of operating subsidiaries of the Company that may not be reflected by corporate financial performance. The actual amount of the bonus payment for each Executive is determined by the Compensation Committee based on the Company’s and/or applicable subsidiary’s achievement of operational goals.
The corresponding results for each Executive performance-based annual bonus for the year ended December 31, 2015, are set forth below as a percentage of each Executive’s salary.
Pre-tax earnings & Financial
Cash Flow From Operations
Objective Total Annual Percentage Operational Bonus of Salary Target Results Target Results Target Results Results Jerry C. Atkin . . . . . . 100 % 65.0 % 95.1 % 10.0 % 15.0 % 25.0 % 30.6 % 140.7 % Russell A. Childs . . . . 100 % 65.0 % 95.1 % 10.0 % 15.0 % 25.0 % 30.6 % 140.7 % Wade J. Steel . . . . . . 80 % 52.0 % 76.1 % 8.0 % 12.0 % 20.0 % 24.5 % 112.6 % Robert J. Simmons . . . 80 % 52.0 % 76.1 % 8.0 % 12.0 % 20.0 % 24.5 % 112.6 % Michael B. Thompson 80 % 52.0 % 74.1 % 8.0 % 12.0 % 20.0 % 23.3 % 109.4 % Terry M. Vais(1) . . . . 68 % 44.5 % 66.7 % 6.8 % 10.3 % 17.1 % 21.9 % 98.9 %
(1) Objective Percentage of Salary for Mr. Vais was adjusted to 80% from 60% effective with his promotion to
Chief Operating Officer in September 2015. The blended Objective Percentage of Salary for the entire year for Mr. Vais was 68%.
Amount of 2015 Performance-Based Annual Bonus. The total annual performance-based bonus amounts
payable to the Executives for 2015 were: Mr. Atkin—$606,093; Mr. Childs—$464,277; Mr. Steel—$270,125; Mr. Simmons—$337,656; Mr. Thompson—$235,624 and Mr. Vais—$163,371. Those amounts are included in the amounts shown in the Summary Compensation Table below under the caption heading “Non-Equity Incentive Plan Compensation.”
2016 Annual Bonus. The Compensation Committee determined to make some changes to the annual bonus metrics for 2016 in an effort to better align the bonus with the creation of shareholder value and to align the compensation packages of the Executives with the executive compensation programs of other regional carriers and major airlines. The bonus objective will be based on two metrics, pre-tax earnings (weighted 75%) and operating performance (weighted 25%).
Long-Term Awards. The Company grants discretionary long-term incentive awards, in the form of stock options, restricted stock units and performance shares to the Executives annually.
Long-term incentive awards are made to encourage the Executives to continue their engagement with the Company throughout the vesting periods of the awards and to align management and shareholder interests. In making awards to the Executives, the grant size and the appropriate mix of equity- based awards are considered. The Compensation Committee generally grants long-term incentive awards at its first meeting of each year. Except in the

29
case of accelerated vesting upon a change in control of the Company, long-term incentive awards currently vest only if the Executive remains employed by the Company for three years from the date of grant, with the exception of stock options which vest one third at each annual anniversary of the date of grant over a three year period. The Compensation Committee believes the three-year cliff-vesting schedule for non-stock option grants and pro rata vesting over three years for stock options assists in retaining Executives and encourages the Executives to focus on the Company’s long-term performance.
In granting stock options, restricted stock units and performance shares to the Executives, the Compensation Committee also considers the impact of the grant on the Company’s financial performance, as determined in accordance with the requirements of Financial Accounting Standards Board Accounting Standards Codification Topic 718 (ASC Topic 718). For long-term equity awards, the Company records expense in accordance with ASC Topic 718. The amount of expense recorded pursuant to ASC Topic 718 may vary from the corresponding compensation value used in determining the amount of the awards.
Amount and allocation of grant—For 2015 the total annual targeted long-term incentive grant value was 125% of salary and targeted annual bonus for Messrs. Atkin and Childs and 100% of salary and targeted annual bonus for Messrs. Steel, Simmons and Thompson. Mr. Vais’ targeted long-term incentive grant value was awarded on a pro-rata basis at 70% of salary and targeted annual bonus through his September 2015 appointment as executive officer of ExpressJet and at 100% of salary and targeted annual bonus following his appointment. The Compensation Committee established these annual targeted amounts to provide a competitive pay package and to ensure that a large portion of each Executive’s compensation was based on continuing long-term service and correlated to the creation of shareholder value. This has been the Compensation Committee’s policy for several years, but is subject to review and continuation or modification each year by the Compensation Committee. The targeted levels of long-term incentive awards for Messrs. Atkin and Childs are higher than the targeted levels of long-term incentive awards for other Executives as a result of their overall responsibility for the long-term success of the Company. Each Executive’s 2015 long-term incentive award was allocated among three types of long-term awards as follows: stock options, restricted stock units and performance shares.
The value of stock options, restricted stock units and performance shares is directly related to the value of the Common Stock and correlates to long-term shareholder value. Stock options, restricted stock unit and performance share grants in 2015 were made pursuant to the Company’s 2010 Plan, as shown in greater detail below and in the table labeled “Grants of Plan Based Awards.”
The following table summarizes the number and nature of long-term awards granted to the Executives by the Company on February 17, 2015, and in the case of mid-year position changes, April 2, 2015 and September 9, 2015, under the 2010 Plan.
Time Vested LTI Performance-Contingent LTI Shares/Stock Shares/Stock Other Units Options Units Options Units(1) (Cash) Jerry C. Atkin . . . . . . . . . . . . . . . . . . . . . . . . . . . . . . . . . . . . . . 48,332 31,887 — 31,887 $ —Russell A. Childs . . . . . . . . . . . . . . . . . . . . . . . . . . . . . . . . . . . 37,023 24,426 — 24,426 $ —Wade J. Steel . . . . . . . . . . . . . . . . . . . . . . . . . . . . . . . . . . . . . . 19,386 12,791 — 12,791 $ —Robert J. Simmons . . . . . . . . . . . . . . . . . . . . . . . . . . . . . . . . . 24,233 15,988 — 15,988 $ —Michael B. Thompson . . . . . . . . . . . . . . . . . . . . . . . . . . . . . . . 17,391 11,474 — 11,474 $ —Terry M. Vais . . . . . . . . . . . . . . . . . . . . . . . . . . . . . . . . . . . . . . 10,418 6,873 — 6,873 $ —
(1) Number of performance shares if 100% of target is achieved.

30
Stock Options—Options are granted with an exercise price equal to the closing price per share on the date of grant and vest one third at each annual anniversary of the date of grant over a three year period. Grants are made on a systematic schedule, generally one grant per year made at the first Compensation Committee meeting of each year.
The purpose of stock options is to tie a significant percentage of the award’s ultimate value to increases in the market price of the Common Stock, thereby rewarding increased value to the shareholders. A stock option only has a value to the extent the value of the underlying shares on the exercise date exceeds the exercise price. Accordingly, stock options provide compensation only if the underlying share price increases over the option term and the Executive’s employment continues through the vesting date.
The size of the grant for each Executive is calculated by determining the number of shares with a theoretical future value equal to the targeted compensation for stock options, assuming each option will have a value equal to 33% of its exercise price. This value generally correlates to the ASC Topic 718 value of the awards. The targeted stock option allocation of each Executive’s aggregate, targeted level of long-term incentive compensation for 2015 was 20%.
Restricted Stock Units—The Company also granted restricted stock units to the Executives in 2015 under the 2010 Plan. The restricted stock units awarded to an Executive entitle the Executive to receive a designated number of shares of Common Stock upon completion of a three-year vesting period, measured from the date of grant. Until the vesting date, the shares underlying the restricted stock units are not issued and outstanding. Accordingly, the Executive is not entitled to vote or receive dividends on the shares underlying his restricted stock units unless and until those restricted stock units vest. The purpose of the restricted stock unit component is to support continued employment through volatile economic and stock market conditions, to manage dilution overhang, and to align officers’ interests with maintaining shareholder value already created. The Compensation Committee believes this approach mitigates the incentive for Executives to take unnecessary risks and helps retain the Executives’ expertise through continued employment. Recipients of restricted stock units do not pay for the underlying shares once the awards vest; however they must remain employed by the Company for three years to receive the underlying shares. Restricted stock unit awards provide the Executives with an indirect ownership stake in the Company and encourage the Executives to continue employment in order to receive the underlying shares. The compensation value of a restricted stock unit award does not depend solely on future stock price increases; at grant, its value is equal to the market price of the Common Stock. Although its value may increase or decrease with changes in the stock price during the period before vesting, a restricted stock unit award will likely have value even without future stock price appreciation. Accordingly, restricted stock unit awards deliver significantly greater share-for-share compensation value at grant than do stock options, and the Company can offer what it anticipates will be comparable grant date compensation value with approximately 65% fewer shares than if the grant were made solely with stock options.
The annual award of restricted stock units to each Executive for 2015 consisted of the right to receive upon future vesting a number of shares of Common Stock. The targeted restricted stock unit allocation of each Executive’s aggregate, targeted level of long-term incentive compensation for 2015 was 40%.
Performance Shares—The remaining component of each Executive’s 2015 annual long-term incentive award was performance shares payable in Common Stock under the 2010 Plan. The performance shares allocation of each Executive’s aggregate, targeted level of long-term incentive compensation for 2015 was 40%. The purpose of the performance share awards is to reward achievement of a financial efficiency objective that supports shareholder value and reflects real performance. The objectives upon which performance share awards are based are established annually by the Compensation Committee. It is the view of the Compensation Committee that those objectives should be set at levels which are high enough to motivate the Executives to achieve exceptional Company performance. Under each Executive’s performance shares award, a grant of Common Stock is made upon completion of a three-year vesting period from the date of the grant (subject to the Executive’s continued employment through the vesting date), based on the level of pre-tax earnings, cash flow from operations and increase in pre-tax return on equity actually attained over the 2015 to 2017 calendar years. Until the vesting date, the shares underlying the performance shares are not issued and

31
outstanding. Accordingly, the Executive is not entitled to vote or receive dividends on the shares underlying his performance shares unless and until those performance shares vest.
The Compensation Committee’s philosophy for setting performance share targets is to set maximum targets that will be difficult for the Executives to achieve on a consistent basis. The 2015 to 2017 committee-designated combined targeted pre-tax earnings over the three year period was set as $318 million (with a threshold of $249 million and max of $382 million), combined cash flow from operations over the three year period was set as $803 million (with a threshold of $642 million and max of $963 million) and combined increase in pre-tax return on equity over the three year period was set as 6.96% (with a threshold of 5.46% and max of 8.37%), with the actual amount of performance shares granted to each Executive to be adjusted in proportion to the extent to which the combined actual results varied from the target levels of performance. The performance shares are allocated equally between each of the three metrics in determining the actual awarded performance shares payable in Common Stock. Specifically, (i) if pre-tax earnings, cash flow from operations and increase in pre-tax return on equity had been equal to or greater than the above listed targets, then 100% or more of the performance shares would have been earned (up to a maximum of 150% of the performance shares) by the Executive attributable to each identified target; (ii) if pre-tax earnings, cash flow from operations and increase in pre-tax return on equity had ranged from the threshold to the target, then 50% to 100% of the performance shares would have been earned by the Executive attributable to each identified target; and (iii) if pre-tax earnings, cash flow from operations and increase in pre-tax return on equity had been less than the threshold, then no performance shares would have been earned by the Executive attributable to each identified target.
The 2015 to 2017 goals for each Executive were based on the combined Company’s targeted pre-tax earnings, cash flow from operations and increase in pre-tax return on equity, and there were no alternative operating company goals set for the Chief Operating Officers of the operating subsidiaries, thus encouraging teamwork and a collective focus on the creation of long-term value for the Company’s shareholders. In determining the degree to which the targeted pre-tax earnings, cash flow from operations and increase in pre-tax return on equity goals have been attained, the Compensation Committee will adjust results during the three year period for unusual or non-recurring items.
Actual results for performance shares awarded in 2015 are measured over a three year period including 2015 to 2017. Therefore, the degree to which performance shares granted in 2015 ultimately earned will not be determined until the conclusion of the 2017 calendar year.
Long-Term Awards for 2016. The Compensation Committee determined to adjust the long-term incentive metrics for performance shares awarded for 2016 in an effort to better align the incentive awards with the creation of shareholder value and to align the compensation package of the Executives with those of other regional and major air carrier executive compensation programs. The actual performance shares granted will be measured with respect to pre-tax earnings, cumulative earnings per share and return on invested capital over the applicable three-year measurement period.
Retirement and Other Benefits.
The Company and SkyWest Airlines sponsor a 401(k) retirement plan for their eligible employees, including the Executives other than Mr. Vais. ExpressJet also maintains a substantially equivalent 401(k) plan for its eligible employees, including Mr. Vais. Both plans are broad based, tax-qualified retirement plans under which eligible employees, including the Executives, may make annual pre-tax salary reduction contributions subject to the various limits imposed under the Internal Revenue Code of 1986, as amended (the “Code”). The sponsoring employers make matching contributions under the plans on behalf of eligible participants; however, the right of Executives and other officers to such matching contributions is limited. The Compensation Committee believes that maintaining the 401(k) retirement plans and providing a means to save for retirement is an essential part of a competitive compensation package necessary to attract and retain talented executives.

32
The Company also maintains the SkyWest, Inc. 2002 Deferred Compensation Plan, a non-qualified deferred compensation plan for the benefit of officers and other highly compensated employees. All of the Executives other than Mr. Vais participate in the SkyWest, Inc. 2002 Deferred Compensation Plan. ExpressJet also maintains a separate but similar non-qualified deferred compensation plan, the ExpressJet Executive Deferred Compensation Plan, for its highly compensated management employees, including Mr. Vais. Under both such deferred compensation plans (the “Deferred Compensation Plans”), the employer credits each Executive’s account with a discretionary employer contribution equal to 15% of salary and annual bonus. These amounts are included in the Summary Compensation Table under the column “All Other Compensation”. Additional information on the Deferred Compensation Plans is found in the section “Non-Qualified Deferred Compensation for 2015” below.
The SkyWest Inc. 2002 Deferred Compensation Plan (but not the ExpressJet Executive Deferred Compensation Plan) also permits eligible executives, including the Executives, to elect in advance of each calendar year to defer up to 100% of their cash salary and annual bonus compensation for the year. Only Mr. Thompson elected to defer any portion of his salary or annual bonus for 2015. The Company and its subsidiaries do not maintain any defined benefit pension plans for the Executives.
Other Benefits. In addition to the benefits described above, the Company provides certain other benefits to the Executives that the Compensation Committee believes are generally consistent with the benefits provided to senior executives of other airlines. The Compensation Committee believes that those benefits, which are detailed in the footnotes to the Summary Compensation Table applicable to the heading “All Other Compensation” below, are reasonable, competitive and consistent with overall executive compensation objectives. Those benefits consist primarily of employer-paid premiums on health, dental and eye insurance, a personal automobile allowance, and use of Company owned recreational equipment.
The Company and its subsidiaries also maintain a non-discriminatory, broad based program under which all full-time employees and their dependents, including the Executives and their dependents, may fly without charge on a space available basis on regularly scheduled flights of aircraft operated by the Company’s operating airline subsidiaries.
Ownership Guidelines
The Company maintains ownership guidelines for the Executives to encourage the alignment of their interests with the long-term interests of the Company’s shareholders. Each Executive is strongly encouraged to maintain a minimum ownership interest in the Company. The guideline ownership level is a number of shares of Common Stock having a value equal to a recommended multiple of the annual base salary for each Executive. Any Executive that did not meet the guidelines at December 31, 2015 is encouraged to make progress towards the ownership guideline. The holdings of the Executives are summarized in the table entitled “Security Ownership of Certain Beneficial Owners” below.
Deductibility of Executive Compensation
Section 162(m) of the Code imposes a $1 million annual limit on the amount that a publicly traded company may deduct for compensation paid to the company’s principal executive officer during a tax year or to any of the company’s three other most highly compensated executive officers who are still employed at the end of the tax year (other than the Company’s principal financial officer). The limit does not apply to compensation that meets the requirements of Section 162(m) of the Code for “qualified performance-based compensation” (i.e., compensation paid only if the executive meets pre-established, objective goals based upon performance criteria approved by the Company’s shareholders). The Compensation Committee reviews and considers the deductibility of executive compensation under Section 162(m) of the Code. In certain situations, the Compensation Committee may approve compensation that will not meet the requirements of Code Section 162(m) in order to ensure competitive levels of total compensation for its executive officers. Stock options and performance shares awarded to the Executives during 2015 were intended to constitute “qualified performance-based compensation” under Section 162(m) of the Code. The Company’s 2015

33
restricted stock unit grants and 2015 performance-based annual bonuses, however, were not “qualified performance-based compensation.” As a result, a portion of the compensation earned by Messrs. Atkin and Childs for 2015 exceeded the deduction limit of Section 162(m) of the Code.
Effect of Compensation on Risk
Based on the Compensation Committee’s review of the various elements of the Company’s executive compensation practices and policies, the Compensation Committee believes the Company’s compensation policies and practices are designed to create appropriate and meaningful incentives for the Company’s employees without encouraging excessive or inappropriate risk taking. Among other factors, The Compensation Committee considered the following information:
• The Company’s compensation policies and practices are designed to include a significant level of long-term compensation, which discourages short-term risk taking.
• The base salaries the Company provides to its employees are generally consistent with salaries paid for comparable positions in the Company’s industry, and provide the Company’s employees with steady income while reducing the incentive for employees to take risks in pursuit of short-term benefits.
• The Company’s incentive compensation is capped at levels established by the Compensation Committee, which the Compensation Committee believes reduces the incentive for excessive risk-taking.
• The Company has established internal controls and adopted codes of ethics and business conduct, which are designed to reinforce the balanced compensation objectives established by the Compensation Committee.
• The Company has adopted equity ownership guidelines for its executive officers, which the Compensation Committee believes discourages excessive risk-taking.
Based on the review outlined above, the Company has concluded that the risks arising from its compensation policies and practices for its employees are not reasonably likely to have a material adverse effect on the Company.
COMPENSATION COMMITTEE REPORT
The Compensation Committee has reviewed the foregoing compensation discussion and analysis and discussed with the Company’s management the information set forth herein. Based on such review and discussions with management, the Compensation Committee recommended to the Board that the foregoing compensation discussion and analysis be included in this proxy statement.
The Compensation Committee
Keith E. Smith, Chair Henry J. Eyring Meredith S. Madden Ronald J. Mittelstaedt Steven F. Udvar-Hazy

34
EXECUTIVE COMPENSATION
Summary Compensation Table
The table below summarizes the total compensation paid to or earned by each of the Executives for the years indicated.
(a) (b) (c) (d) (e) (f) (g) (h) (i) (j) Performance Non-Equity Discretionary Stock Option Shares Incentive Plan All Other Salary Bonus Awards Awards Awards Compensation Compensation Total Name and Principal Position Year ($) ($)(1) ($)(2) ($)(2) ($)(2) ($)(3) ($) ($) Jerry C. Atkin . . . . . . . . 2015 $ 430,800 $ — $ 430,800 $ 215,400 $ 430,800 $ 606,093 $ 136,110 (4) $ 2,250,003
Chairman and Chief . . 2014 $ 420,300 $ 392,641 $ 330,986 $ 226,049 $ — $ 283,676 $ 123,736 (5) $ 1,777,388Executive Officer. . . . 2013 $ 410,000 $ — $ 322,875 $ 138,375 $ — $ 478,028 $ 138,242 (6) $ 1,487,520
Russell A. Childs . . . . . . 2015 $ 330,000 $ — $ 330,000 $ 165,000 $ 330,000 $ 464,277 $ 111,563 (7) $ 1,730,840President . . . . . . . . . . 2014 $ 287,317 $ 252,475 $ 209,128 $ 97,481 $ — $ 237,593 $ 104,210 (8) $ 1,188,204
2013 $ 260,400 $ — $ 164,052 $ 70,308 $ — $ 328,781 $ 100,377 (9) $ 923,918Wade J. Steel . . . . . . . . . 2015 $ 240,000 $ — $ 172,800 $ 86,400 $ 172,800 $ 270,125 $ 85,299 (10)$ 1,027,424
Chief Commercial Officer . . . . . . . . . . . 2014 $ 185,708 $ 130,240 $ 103,549 $ 45,959 $ — $ 146,140 $ 56,133 (11)$ 667,729and former acting Chief Financial Officer
Robert J. Simmons . . . . 2015 $ 225,000 $ — $ 251,014 $ 125,507 $ 251,014 $ 337,656 $ 56,308 (12)$ 1,246,499Chief Financial Officer
Michael B. Thompson . . 2015 $ 215,300 $ — $ 155,016 $ 77,508 $ 155,016 $ 235,624 $ 78,770 (13)$ 917,234Chief Operating Officer—SkyWest Airlines . . . . . . . . . . . 2014 $ 176,125 $ 112,050 $ 98,347 $ 43,585 $ — $ 138,239 $ 53,483 (14)$ 621,829
Terry M. Vais . . . . . . . . 2015 $ 165,200 $ — $ 101,205 $ 51,883 $ 101,205 $ 163,371 $ 51,412 (15)$ 634,276Chief Operating Officer—ExpressJet
(1) Column (d) includes discretionary annual performance bonuses approved by the Compensation Committee for 2014 of $19,100 to Mr. Childs and $12,345 to Mr. Steel. Such bonuses were paid during 2015, Messrs. Atkin, Simmons, Thompson and Vais did not receive a discretionary annual performance bonus for 2014. No discretionary annual performance bonuses were awarded to the Executives in 2013 or 2015.
The amounts in column (d) also include the amounts, approved by the Compensation Committee, of discretionary performance unit awards issued in 2015 with respect to 2014, but payable in cash in 2017, subject to forfeiture in the event of termination of employment prior to February 18, 2017. The 2017 cash value of those discretionary performance unit awards for 2014 service were $392,641 for Mr. Atkin, $233,375 for Mr. Childs, $117,895 for Mr. Steel and $112,050 for Mr. Thompson. Messrs. Simmons and Vais did not earn discretionary performance unit awards with respect to 2014.
(2) These columns show the full grant date fair market value of the options granted as computed under ASC Topic 718, the expense attributable to restricted stock unit awards and the expense attributable to performance shares awards at the 100% target threshold (excluding estimates for forfeitures in case of awards with service-based vesting). These amounts do not reflect the extent to which the Executive realized an actual financial benefit from the awards. Assumptions and methodologies used in the calculation of these amounts are included in footnotes to the Company’s audited financial statements for the year ended December 31, 2015 which are included in the Company’s Annual Report on Form 10-K filed with the Securities and Exchange Commission.
(3) The amounts in column (h) reflect the annual performance bonus amounts earned in the year indicated based on performance in that year and paid in the subsequent year. As described in the section entitled “Compensation Discussion and Analysis” above, annual performance bonuses payable to the Executives are calculated based upon

35
the financial performance of the Company or its subsidiaries and also the achievement of individual goals. The target amount of each Executive’s annual performance bonus opportunity for 2015 is reported in the “Grants of Plan-Based Awards for 2015” table below, and included in the applicable amount shown in the column(c) of that table. The amounts of such annual performance bonuses, excluding discretionary bonuses reported in column (d), actually earned in 2015 and paid in 2016 were: Mr. Atkin—$606,093; Mr. Childs—$464,277; Mr. Steel—$270,125; Mr. Simmons—$337,656; Mr. Thompson—$235,624; and Mr. Vais—$163,371.
(4) All other compensation for Mr. Atkin for 2015 consists of $112,074 of employer credits under the SkyWest Deferred Compensation Plan attributable to compensation earned for 2015; $4,557 in employer-paid health insurance premiums; $12,728 for a personal vehicle lease; $5,155 for personal use of the Company’s recreational equipment; and $1,596 in discretionary matching contributions under the SkyWest 401(k) Plan.
(5) All other compensation for Mr. Atkin for 2014 consists of $100,834 of employer credits under the SkyWest Deferred Compensation Plan attributable to compensation earned for 2014; $4,077 in employer-paid health insurance premiums; $11,660 for a personal vehicle lease; $5,943 for personal use of the Company’s recreational equipment; and $1,222 in discretionary matching contributions under the SkyWest 401(k) Plan.
(6) All other compensation for Mr. Atkin for 2013 consists of $112,695 of employer credits under the SkyWest Deferred Compensation Plan attributable to compensation earned for 2013; $3,992 in employer-paid health insurance premiums; $15,761 for a personal vehicle lease; $4,362 for personal use of the Company’s recreational equipment; and $1,432 in discretionary matching contributions under the SkyWest 401(k) Plan.
(7) All other compensation for Mr. Childs for 2015 consists of: $88,793 of employer credits under the SkyWest Deferred Compensation Plan attributable to compensation earned for 2015; $5,887 in employer-paid health insurance premiums; $10,505 for a personal vehicle lease; $5,155 for personal use of the Company’s recreational equipment; and $1,223 in discretionary matching contributions under the SkyWest 401(k) Plan.
(8) All other compensation for Mr. Childs for 2014 consists of: $77,440 of employer credits under the SkyWest Deferred Compensation Plan attributable to compensation earned for 2014; $5,289 in employer-paid health insurance premiums; $14,727 for a personal vehicle lease; $5,943 for personal use of the Company’s recreational equipment; and $811 in discretionary matching contributions under the SkyWest 401(k) Plan.
(9) All other compensation for Mr. Childs for 2013 consists of: $73,494 of employer credits under the SkyWest Deferred Compensation Plan attributable to compensation earned for 2013; $5,195 in employer-paid health insurance premiums; $15,727 for a personal vehicle lease; $4,362 for personal use of the Company’s recreational equipment; and $1,599 in discretionary matching contributions under the SkyWest 401(k) Plan.
(10) All other compensation for Mr. Steel for 2015 consists of: $60,422 of employer credits under the SkyWest Deferred Compensation Plan attributable to compensation earned for 2015; $5,887 in employer-paid health insurance premiums; $12,000 for a personal vehicle lease; $5,155 for personal use of the Company’s recreational equipment; and $1,835 in discretionary matching contributions under the SkyWest 401(k) Plan.
(11) All other compensation for Mr. Steel for 2014 consists of: $37,640 of employer credits under the SkyWest Deferred Compensation Plan attributable to compensation earned for 2014; $5,132 in employer-paid health insurance premiums; $6,000 for a personal vehicle lease; $5,943 for personal use of the Company’s recreational equipment; and $1,418 in discretionary matching contributions under the SkyWest 401(k) Plan.
(12) All other compensation for Mr. Simmons for 2015 consists of: $34,452 of employer credits under the SkyWest Deferred Compensation Plan attributable to compensation earned for 2015; $5,887 in employer-paid health insurance premiums; $10,814 for a personal vehicle allowance; and $5,155 for personal use of the Company’s recreational equipment.
(13) All other compensation for Mr. Thompson for 2015 consists of: $54,051 of employer credits under the SkyWest Deferred Compensation Plan attributable to compensation earned for 2015; $5,729 in employer-paid health

36
insurance premiums; $12,000 for a personal vehicle lease; $5,155 for personal use of the Company’s recreational equipment; and $1,835 in discretionary matching contributions under the SkyWest 401(k) Plan.
(14) All other compensation for Mr. Thompson for 2014 consists of: $34,990 of employer credits under the SkyWest Deferred Compensation Plan attributable to compensation earned for 2014; $5,132 in employer-paid health insurance premiums; $6,000 for a personal vehicle lease; $5,943 for personal use of the Company’s recreational equipment; and $1,418 in discretionary matching contributions under the SkyWest 401(k) Plan.
(15) All other compensation for Mr. Vais for 2015 consists of: $42,972 of employer credits under the ExpressJet Deferred Compensation Plan attributable to compensation earned for 2015; $4,840 in employer-paid health insurance premiums; and $3,600 for a personal vehicle lease.
Grants of Plan-Based Awards For 2015
The following table provides information about non-equity based and equity-based plan awards granted to the Executives for the year ended December 31, 2015:
(a) (b) (c) (d) (e) (f) (g) (h) Estimated Possible Payouts Stock Option Under Awards: Stock Awards: Non-Equity Number of Awards: Number of Exercise Incentive Performance Number of Securities Price of Plan Awards Shares Shares Underlying Options Grant Date Target of Stock of Stock Options Awards Full Fair Name Grant Date ($) (# shares) (# shares) (# shares) ($S/share)(1) Value(2) Jerry C. Atkin . . . . . . . . . . . . 17-Feb-2015 (3) (4) $ 430,800 31,887 31,887 48,332 $ 13.51 $ 1,077,000Russell A. Childs . . . . . . . . . . 17-Feb-2015 (3) (4) $ 330,000 24,426 24,426 37,023 $ 13.51 $ 825,000Wade J. Steel . . . . . . . . . . . . . 17-Feb-2015 (3) (4) $ 192,000 12,791 12,791 19,386 $ 13.51 $ 432,000Robert J. Simmons . . . . . . . . . 2-Apr-2015 (3) (4) $ 180,000 15,988 15,988 24,233 $ 14.12 $ 627,535Michael B. Thompson . . . . . . 17-Feb-2015 (3) (4) $ 172,240 11,474 11,474 17,391 $ 13.51 $ 387,540Terry M. Vais . . . . . . . . . . . . 17-Feb-2015 & 8-Sep-2015 (3) (4) $ 112,997 6,873 6,873 10,418 $ 13.51 / $ 17.25 $ 254,293
(1) The exercise price of the options of $13.51 per share for the February 17, 2015 grant date, and $14.12 per share for the April 2, 2015 grant date and $17.25 per share for the September 8, 2015 grant date is the market closing price of the Common Stock on the date of grant.
(2) Column (h) shows the full grant date fair market value of the options granted in 2015 as computed under ASC Topic 718 and the expense attributable to restricted stock unit awards granted in 2015 and the expense attributable to the performance shares awards at the 100% target threshold (excluding the effect of estimates for forfeitures). Assumptions and methodologies used in the calculation of these amounts are included in footnotes to the Company’s audited financial statements for the year ended December 31, 2015, which are included in the Company’s Annual Report on Form 10-K filed with the Securities and Exchange Commission.
(3) On February 17, 2015, April 2, 2015 and September 8, 2015, the Company granted stock options, restricted stock units and performance shares pursuant to the 2010 Plan and approved the target annual performance bonuses for 2015. The number of shares underlying each Executive’s stock option grant earned in 2015, which vest one third at each annual anniversary of the date of grant over a three year period, is listed in column (f). The number of shares of Common Stock underlying each restricted stock unit award earned for year 2015 and payable in 2018 is shown in column (e). The number of shares of Common Stock underlying each performance shares award at the 100% target threshold earned throughout 2015-2017 and payable in 2018 is shown in column (d). All of the long-term incentive awards included in columns (d) through (f), with the exception of the stock options included in column (f) which vest one third at each annual anniversary of the date of grant over a three year period, vest on the third anniversary of the date of grant (with earlier acceleration upon a change in control of the Company).

37
(4) As a result of 2015 actual performance, the amounts of annual performance bonus estimated in column (c) approved by the Compensation Committee, earned in 2015 and paid in 2016 were: Mr. Atkin—$606,093; Mr. Childs—$464,277; Mr. Steel—$270,125; Mr. Simmons—$337,656; Mr. Thompson—$235,624; and Mr. Vais—$163,371.
Outstanding Equity Awards at Year-End
The following table provides information on the year-end 2015 holdings of stock options and other stock awards (restricted stock units and performance shares) by the Executives.
Option Awards Stock Awards (b) (c) (f) (g) Number of Number of Number of Market Value Securities Securities Performance of Performance Underlying Underlying (d) (e) Shares or Shares or Unexercised Unexercised Option Option Share Units Share Units (a) Options Options Exercise Expiration That Have That Have Name Exercisable (#) Unexercisable (#) Price ($) Date(7) Not Vested (#) Not Vested(8)($) Jerry C. Atkin . . . . . . . . . . . . . . . . . . . . . . . . . . . . . 60,282 $ 14.49 3 Feb 17 19,545 $ 15.51 2 Feb 18 39,627 13.06 15 Feb 19 32,255 (1) $ 13.24 13 Feb 20 24,386 (1) $ 463,822 50,570 (2) $ 12.10 18 Feb 21 27,354 (2) $ 520,273 48,332 (4) $ 13.510 17 Feb 22 63,774 (4)(5) $ 1,212,981Russell A. Childs . . . . . . . . . . . . . . . . . . . . . . . . . . . 31,029 $ 14.49 3 Feb 17 9,929 $ 15.51 2 Feb 18 22,979 13.06 15 Feb 19 16,389 (1) $ 13.24 13 Feb 20 12,391 (1) $ 235,677 18,054 (2) $ 12.10 18 Feb 21 13,896 (2) $ 264,302 4,687 (3) $ 11.36 15 May 21 3,608 (3) $ 68,624 37,023 (4) $ 13.510 17 Feb 22 48,852 (4)(5) $ 929,165Wade J. Steel . . . . . . . . . . . . . . . . . . . . . . . . . . . . . 4,895 (1) $ 13.24 13 Feb 20 3,701 (1) $ 70,393 5,429 (2) $ 12.10 18 Feb 21 4,179 (2) $ 79,485 6,059 (3) $ 11.36 15 May 21 4,664 (3) $ 88,709 19,386 (4) $ 13.510 17 Feb 22 25,582 (4)(5) $ 486,570Robert J. Simmons . . . . . . . . . . . . . . . . . . . . . . . . . . 24,233 (4) $ 14.120 17 Feb 22 31,976 (4)(5) $ 608,184Michael B. Thompson . . . . . . . . . . . . . . . . . . . . . . . 4,582 (1) $ 13.24 13 Feb 20 3,464 (1) $ 65,885 5,051 (2) $ 12.10 18 Feb 21 3,888 (2) $ 73,950 5,868 (3) $ 11.36 15 May 21 4,516 (3) $ 85,894 17,391 (4) $ 13.510 17 Feb 22 22,948 (4)(5) $ 436,471Terry M. Vais . . . . . . . . . . . . . . . . . . . . . . . . . . . . . 8,683 $ 15.51 2 Feb 18 4,796 $ 13.06 15 Feb 19 4,847 (1) $ 13.24 13 Feb 20 3,731 (1) $ 70964 5,515 (2) $ 12.10 18 Feb 21 4,245 (2) $ 80,740 7,037 (4) $ 13.510 17 Feb 22 9,284 (4)(5) $ 176,582 3,381 (6) $ 17.250 9-Sep 22 4,462 (6) $ 84,867
(1) Awards scheduled to vest on February 13, 2016.
(2) Awards scheduled to vest on February 18, 2017.
(3) Awards scheduled to vest on May 15, 2017.
(4) Awards scheduled to vest on February 17, 2018 with options vesting one third at each annual anniversary of the date of grant over a three year period.
(5) These represent the number of Restricted Stock Units and Performance Shares at the 100% target threshold granted in the 2015 period.

38
(6) Awards Scheduled to vest September 9, 2018.
(7) Stock options granted expire seven years from date of grant.
(8) Based on market closing price per share of Common Stock of $19.02 on December 31, 2015.
Option Exercises and Stock Vested
Stock options exercised and restricted stock units that vested for the Executives during the year ended December 31, 2015 are outlined below.
Option Awards Stock Awards (b) (c) (d) (e) Number of Shares Value Realized Number of Shares Value Realized (a) Acquired On Exercise on Exercise Acquired on Vesting on Vesting Name (#) ($) (#) ($) Jerry C. Atkin . . . . . . . . . . . . . . . . . . . . . . . . . . . . 99,124 $ 408,154 24,119 $ 333,807Russell A. Childs . . . . . . . . . . . . . . . . . . . . . . . . . 51,024 $ 228,873 12,253 $ 169,582Wade J. Steel . . . . . . . . . . . . . . . . . . . . . . . . . . . . 9,584 $ 49,927 3,582 $ 49,575Robert J. Simmons . . . . . . . . . . . . . . . . . . . . . . . — $ — — $ —Michael B. Thompson . . . . . . . . . . . . . . . . . . . . . 31,454 $ 149,833 3,422 $ 47,360Terry M. Vais . . . . . . . . . . . . . . . . . . . . . . . . . . . . 17,289 $ 63,962 3,692 $ 51,097
Non-Qualified Deferred Compensation for 2015
Pursuant to the SkyWest Deferred Compensation Plan and the ExpressJet Deferred Compensation Plan, covered Executives may elect prior to the beginning of each calendar year to defer the receipt of base salary and annual performance bonuses earned for the ensuing calendar year. Amounts deferred are credited to an unfunded liability account maintained by the Company on behalf of the applicable Executive, which account is deemed invested in and earns a rate of return based upon certain notational, self-directed investment options offered under the applicable plan.
Each Executive’s account under the SkyWest Deferred Compensation Plan and ExpressJet Deferred Compensation Plan, as applicable, is also credited with a discretionary employer contribution monthly, whether or not the Executive contributes. For 2015 that discretionary employer contribution was 15% of the Executive’s salary and annual bonus. Participant account balances under the SkyWest and ExpressJet Deferred Compensation Plans are fully
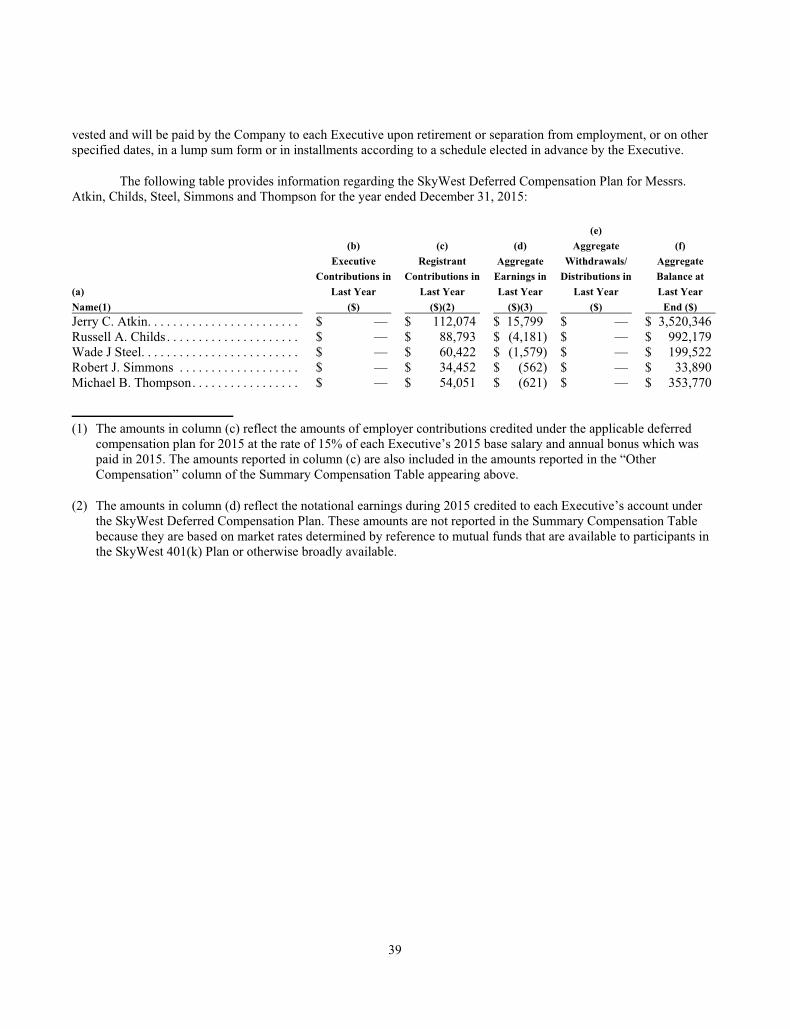
39
vested and will be paid by the Company to each Executive upon retirement or separation from employment, or on other specified dates, in a lump sum form or in installments according to a schedule elected in advance by the Executive.
The following table provides information regarding the SkyWest Deferred Compensation Plan for Messrs. Atkin, Childs, Steel, Simmons and Thompson for the year ended December 31, 2015:
(e) (b) (c) (d) Aggregate (f) Executive Registrant Aggregate Withdrawals/ Aggregate Contributions in Contributions in Earnings in Distributions in Balance at (a) Last Year Last Year Last Year Last Year Last Year Name(1) ($) ($)(2) ($)(3) ($) End ($) Jerry C. Atkin . . . . . . . . . . . . . . . . . . . . . . . . $ — $ 112,074 $ 15,799 $ — $ 3,520,346Russell A. Childs . . . . . . . . . . . . . . . . . . . . . $ — $ 88,793 $ (4,181) $ — $ 992,179Wade J Steel. . . . . . . . . . . . . . . . . . . . . . . . . $ — $ 60,422 $ (1,579) $ — $ 199,522Robert J. Simmons . . . . . . . . . . . . . . . . . . . $ — $ 34,452 $ (562) $ — $ 33,890Michael B. Thompson . . . . . . . . . . . . . . . . . $ — $ 54,051 $ (621) $ — $ 353,770
(1) The amounts in column (c) reflect the amounts of employer contributions credited under the applicable deferred compensation plan for 2015 at the rate of 15% of each Executive’s 2015 base salary and annual bonus which was paid in 2015. The amounts reported in column (c) are also included in the amounts reported in the “Other Compensation” column of the Summary Compensation Table appearing above.
(2) The amounts in column (d) reflect the notational earnings during 2015 credited to each Executive’s account under the SkyWest Deferred Compensation Plan. These amounts are not reported in the Summary Compensation Table because they are based on market rates determined by reference to mutual funds that are available to participants in the SkyWest 401(k) Plan or otherwise broadly available.

40
The table below shows the funds available for notational investment under the SkyWest Deferred Compensation Plan, and the annual rate of return for the calendar year ended December 31, 2015:
Name of Fund Rate of Return Fidelity VIP Investment Grad Bond Svc . . . . . . . . . . . . . . . . . . . . . . . . . . . . . . . . . . . . . . . . . . . . . . . . . . -0.71% PIMCO VIT Real Return Admin . . . . . . . . . . . . . . . . . . . . . . . . . . . . . . . . . . . . . . . . . . . . . . . . . . . . . . . . -2.70% Invesco Van Kampen V.I. Growth & Income I . . . . . . . . . . . . . . . . . . . . . . . . . . . . . . . . . . . . . . . . . . . . . -3.06% Dreyfus Stock Index Initial . . . . . . . . . . . . . . . . . . . . . . . . . . . . . . . . . . . . . . . . . . . . . . . . . . . . . . . . . . . . . 1.11% American Fund IS Growth 2 . . . . . . . . . . . . . . . . . . . . . . . . . . . . . . . . . . . . . . . . . . . . . . . . . . . . . . . . . . . . 6.86% Nationwide NVIT Mid Cap Index I . . . . . . . . . . . . . . . . . . . . . . . . . . . . . . . . . . . . . . . . . . . . . . . . . . . . . . -2.53% Fidelity VIP Mid Cap Svc. . . . . . . . . . . . . . . . . . . . . . . . . . . . . . . . . . . . . . . . . . . . . . . . . . . . . . . . . . . . . . -1.50% AllianceBernstein VPS Small/Mid Cap Value A . . . . . . . . . . . . . . . . . . . . . . . . . . . . . . . . . . . . . . . . . . . -5.49% Delaware VIP Small Cap Value Svc . . . . . . . . . . . . . . . . . . . . . . . . . . . . . . . . . . . . . . . . . . . . . . . . . . . . . -6.46% ClearBridge VP Small Cap Growth I . . . . . . . . . . . . . . . . . . . . . . . . . . . . . . . . . . . . . . . . . . . . . . . . . . . . . -4.37% Invesco VIF International Growth I . . . . . . . . . . . . . . . . . . . . . . . . . . . . . . . . . . . . . . . . . . . . . . . . . . . . . . -2.34% MFS VIT II International Value Svc . . . . . . . . . . . . . . . . . . . . . . . . . . . . . . . . . . . . . . . . . . . . . . . . . . . . . 6.32%
The following table provides information regarding the ExpressJet Deferred Compensation Plan for Mr. Vais for 2015.
(e) (b) (c) (d) Aggregate (f) Executive Registrant Aggregate Withdrawals/ Aggregate Contributions in Contributions in Earnings in Distributions in Balance at(a) Last Year Last Year Last Year Last Year Last YearName ($) ($)(1) ($)(2) ($) End ($)Terry M. Vais . . . . . . . . . . . . . . . . . . . . . . . . . — $ 42,972 $ (7,795) — $ 287,970
(1) The amount in column (c) reflects the employer contributions credited in 2015 at the rate of 15% of Mr. Vais’s 2015 base salary and 2014 annual bonus which was paid in 2015. The amount reported in column (c) is also included in the amount reported in the “Other Compensation” column of the Summary Compensation Table appearing above.
(2) The amounts in column (d) reflect the notational earnings during 2015 credited to Mr. Vais’s account under the ExpressJet Deferred Compensation Plan. This amount is not reported in the Summary Compensation Table because it is based on market rates determined by reference to mutual funds that are available to participants in the ExpressJet 401(k) Plan or, in certain cases, otherwise broadly available.

41
The table below shows the funds available under the ExpressJet Deferred Compensation Plan, and the annual rate of return for the calendar year ended December 31, 2015:
Name of Fund Rate of ReturnAmerican Century Equity Income-Inst . . . . . . . . . . . . . . . . . . . . . . . . . . . . . . . . . . . . . . . . . . . . . . . . . . . 0.31%American Century International Growth-Inst . . . . . . . . . . . . . . . . . . . . . . . . . . . . . . . . . . . . . . . . . . . . . . 0.83%American Century Premium Money Market-Inv . . . . . . . . . . . . . . . . . . . . . . . . . . . . . . . . . . . . . . . . . . . 0.01%American Century Strategic Alloc Aggressive-Inv. . . . . . . . . . . . . . . . . . . . . . . . . . . . . . . . . . . . . . . . . . -1.36%American Century Strategic Alloc Conservative-Inv . . . . . . . . . . . . . . . . . . . . . . . . . . . . . . . . . . . . . . . . -1.37%American Century Strategic Alloc Moderate-Inv . . . . . . . . . . . . . . . . . . . . . . . . . . . . . . . . . . . . . . . . . . . -1.78%American Century Value-Inst . . . . . . . . . . . . . . . . . . . . . . . . . . . . . . . . . . . . . . . . . . . . . . . . . . . . . . . . . . . -4.37%Buffalo Small Cap . . . . . . . . . . . . . . . . . . . . . . . . . . . . . . . . . . . . . . . . . . . . . . . . . . . . . . . . . . . . . . . . . . . . -4.47%JPMorgan Equity Index-Select . . . . . . . . . . . . . . . . . . . . . . . . . . . . . . . . . . . . . . . . . . . . . . . . . . . . . . . . . . 1.2%JPMorgan Large Cap Growth-R6 . . . . . . . . . . . . . . . . . . . . . . . . . . . . . . . . . . . . . . . . . . . . . . . . . . . . . . . . 7.94%
Potential Payments upon Termination or Change in Control
The information below describes and quantifies certain payments or benefits that would be payable under the existing plans and programs of the Company and its subsidiaries if an Executive’s employment had terminated on December 31, 2015, or the Company had undergone a change in control on December 31, 2015. These benefits are in addition to benefits generally available to all salaried employees of the Company in connection with a termination of employment, such as distributions from the 401(k) Plans, disability and life insurance benefits, the value of employee-paid group health plan continuation coverage under the Consolidated Omnibus Reconciliation Act, or “COBRA” and accrued vacation pay. Except as noted below, the Executives do not have any other severance benefits, severance agreements or change-in-control agreements.
Accelerated Vesting of Stock Options and Stock Awards Upon Change In Control. Under the Company’s long-term incentive plans, all outstanding stock options, restricted stock units, performance shares and performance units held by an Executive on December 31, 2015, would have become fully vested upon a “change in control” occurring on that date without regard to whether the Executive terminated employment in connection with or following the change in control subject to the Compensation Committee approval. The Company’s long-term incentive plans generally define a “change in control” as any of the following events: (i) the acquisition by any person of 50% or more of the Company’s voting shares, (ii) replacement of a majority of the Company’s directors within a two-year period under certain conditions, or (iii) shareholder approval of a merger in which the Company is not the surviving entity, sale of substantially all of the Company’s assets or liquidation.
The following table shows for each Executive the intrinsic value of his unvested stock options, unvested restricted stock units, performance shares and performance units payable in cash, as of December 31, 2015, that would have been accelerated had a change in control of the Company occurred on that date, calculated in the case of restricted stock units, performance shares and stock options, by multiplying the number of underlying shares by the closing price

42
of the Common Stock on the last trading day of 2015 ($19.02 per share) and, in the case of stock options, by then subtracting the applicable option exercise price:
Early Vesting Early Vesting Early Vesting Early Vesting Name of Stock Options of Restricted Stock Units of Performance Shares of Performance UnitsJerry C. Atkin . . . . . . . . . . $ 1,380,545 $ 1,590,586 $ 606,491 $ 595,325Russell A. Childs . . . . . . . $ 771,928 $ 1,033,185 $ 464,583 $ 350,555Wade J. Steel . . . . . . . . . . $ 219,091 $ 481,872 $ 243,285 $ 152,895Robert J. Simmons . . . . . $ 118,742 $ 304,092 $ 304,092 $ —Michael B. Thompson . . . $ 202,210 $ 443,965 $ 218,235 $ 144,810Terry M. Vais . . . . . . . . . . $ 169,999 $ 282,428 $ 130,724 $ 91,880
If a change in control with respect to the Company results in acceleration of vesting of an Executive’s otherwise
unvested stock options, unvested restricted stock units, performance shares or performance unit awards payable in cash, and if the value of such acceleration equals or exceeds three times the Executive’s average W-2 compensation with the Company for the five taxable years preceding the year of the change in control (the “Base Period Amount”), the acceleration would result in an excess parachute payment under Code Section 280G. An Executive would be subject to a 20% excise tax on any such parachute payment in excess of the Base Period Amount, and the Company would be unable to deduct the amount of the parachute payment in excess of the Base Period Amount for tax purposes. The Company has not agreed to provide its Executives with any gross-up or reimbursement for excise taxes imposed on excess parachute payments.
Deferred Compensation. If the employment of an Executive were terminated on December 31, 2015, the Executive would have become entitled to receive the balance in his account under the applicable deferred compensation plan. Distribution would be made in the form of a lump sum or in installments, and in accordance with the distributions schedule elected by the Executive under the applicable plan. The 2015 year-end account balances under those plans are shown in column (e) in the applicable Non-qualified Deferred Compensation Tables set forth above. An Executive’s account balance would continue to be credited with notational investment earnings or losses through the date of actual distribution.

43
CERTAIN RELATIONSHIPS AND RELATED TRANSACTIONS
Transaction with Related Party
Jerry C. Atkin, the Company’s Chairman of the Board and former Chief Executive Officer, serves on the Board of Directors of Zions Bancorporation (“Zions”). The Company maintains a line of credit and certain bank accounts with Zions. The Company’s cash balances in the accounts held at Zions as of December 31, 2015 and 2014 was $65.0 million and $90.6 million, respectively. Zions is an equity participant in leveraged leases on five aircraft leased by the Company’s subsidiaries. Zions also refinanced seven aircraft operated by the Company, becoming the debtor on these aircraft. Zions also serves as the Company’s transfer agent for which the Company pays to Zions annual fees of approximately $11,000.
During the year ended December 31, 2015, the Company purchased $364,000 of spare aircraft parts from NORDAM, an entity affiliated with Meredith S. Madden, a director of the Company.
Review and Approval of Transactions with Related Parties
The Company believes that transactions between the Company and its directors and executive officers, or between the Company and persons related to directors and executive officers of the Company, present a heightened risk of creating or appearing to create a conflict of interest. Accordingly, the Company has adopted a policy regarding related-party transactions that has been approved by the Board and incorporated into the Charter of the Audit and Finance Committee. The policy provides that the Audit and Finance Committee will review all transactions between the Company and related persons (as defined in Item 404 of Regulation S-K promulgated by the Securities and Exchange Commission) for potential conflicts of interest. Under the Company’s policy, all transactions between the Company and related persons are required to be submitted to the Audit and Finance Committee for approval prior to the Company’s entry or participation in such transactions.

44
DIRECTOR COMPENSATION
The Company uses a combination of cash and stock-based incentive compensation to attract and retain qualified candidates to serve as directors. In setting director compensation, the Company considers the significant amount of time that directors expend in fulfilling their duties to the Company, as well as the skill level required by the Company of its directors. Directors are encouraged to own shares of Common Stock having a value equal to three times the amount of their annual cash retainer.
Cash Compensation Paid to Directors
For the year ended December 31, 2015, all directors who were not employees of the Company received an annual cash retainer of $40,000 and attendance fees of $2,000 for each in-person Board meeting attended, $1,800 for each in-person Audit and Finance Committee meeting attended, $1,400 for each in-person Compensation Committee meeting attended, $1,400 for each in-person Nominating and Corporate Governance Committee meeting attended and $1,400 for each in-person Safety and Compliance Committee meeting attended. Non-employee directors who participated in telephonic meetings of the Board or its committees were also paid $1,000 for each telephonic Board meeting, $1,000 for each telephonic Audit and Finance Committee meeting and $1,000 for each telephonic Compensation Committee meeting, $1,000 for each telephonic Nominating and Corporate Governance Committee meeting and $1,000 for each telephonic Safety and Compliance Committee meeting. The Chairman of the Audit and Finance Committee was paid an annual fee of $16,000, the Chairman of the Compensation Committee was paid an annual fee of $5,000, the Chairman of Nominating and Corporate Governance Committee was paid an annual fee of $4,000, the Chairman of the Safety and Compliance Committee was paid an annual fee of $4,000 and the Lead Independent Director was paid an annual fee of $18,000. Jerry C. Atkin, who is the Chairman of the Board and was an employee of the Company during the 2015 year, received no compensation for his service on the Board for 2015. Russell A. Childs, who is a director and an employee of the Company, did not serve as a director during 2015 and receives no financial remuneration for his service on the Board.
Stock Awards
Each non-employee director receives a stock award annually. On February 17, 2015, each of the non-employee directors (other than Margaret S. Billson, Robert G. Sarver, Meredith S. Madden and Andrew C. Roberts, who did not serve as directors during the entire 2015 year) received an award of 4,441 shares of Common Stock, representing $60,000 of value based on the closing price of the Common Stock on the date of award. Prior to their retirement from the Board in May 2015, each of Ms. Billson and Mr. Sarver received an award of 2,221 shares of Common Stock, representing $30,000 of value based on the closing price of the Common Stock on February 17, 2015, which was the date of award. Subsequent to the their appointment as directors of the Company in May 2015, each of Ms. Madden and Mr. Roberts received an award of 2,931 shares of Common Stock, representing $46,046 of value based on the closing price of the Common Stock on May 5, 2015, which was the date of award. The Company did not grant stock options to its non-employee directors in 2015.

45
DIRECTOR SUMMARY COMPENSATION TABLE
The table below summarizes the compensation paid by the Company to its non-employee directors for the year ended December 31, 2015.
(a) (b) (c) (d) (e) (f) (g) Change in Pension Value
and Deferred
Fees Earned or Compensation All Other Paid in Cash Stock Awards Option Awards Earnings Compensation Total Name(1) ($) ($)(2) ($) ($) ($) ($) Steven F. Udvar-Hazy . . . . . . . $ 87,400 $ 60,000 — — — $ 147,400W. Steve Albrecht . . . . . . . . . . $ 78,000 $ 60,000 — — — $ 138,000Margaret S. Billson . . . . . . . . . $ 18,066 $ 30,000 — — — $ 48,066Henry J. Eyring . . . . . . . . . . . . $ 68,300 $ 60,000 — — — $ 128,300Robert G. Sarver . . . . . . . . . . . $ 20,933 $ 30,000 — — — $ 50,933James L. Welch . . . . . . . . . . . . $ 58,600 $ 60,000 — — — $ 118,600Keith E. Smith . . . . . . . . . . . . . $ 69,300 $ 60,000 — — — $ 129,300Ronald J. Mittelstaedt . . . . . . . $ 58,900 $ 60,000 — — — $ 118,900Andrew C. Roberts . . . . . . . . . $ 39,200 $ 46,046 — — — $ 85,246Meredith S. Madden . . . . . . . . $ 29,200 $ 46,046 — — — $ 75,246
(1) Jerry C. Atkin, the Chairman of the Board of the Company, is not included in the foregoing table as he was an employee of the Company during the year 2015 and received no financial remuneration for his service as a director. Russell A. Childs, the Chief Executive Officer, President and a director of the Company, is not included in the foregoing table because he did not serve as a director of the Company during the year 2015. Mr. Childs receives no financial remuneration for his service as a director.
(2) Represents the closing price of a share of Common Stock awarded on the grant date of (a) February 17, 2015, of $13.51 per share, multiplied by the 4,441 shares, in the case of each non-employee director other than Margaret S. Billson, Meredith S. Madden, Robert G. Sarver and Andrew C. Roberts; (b) February 17, 2015, of $13.51 per share, multiplied by 2,221 shares, in the case of Ms. Billson and Mr. Sarver; and (c) May 5, 2015, of $15.71 per share, multiplied by 2,931 shares, in the case of Ms. Madden and Mr. Roberts. These amounts are the aggregate grant date fair market values of awards as computed under ASC Topic 718. All such shares of Common Stock are fully vested.

46
SECURITY OWNERSHIP OF CERTAIN BENEFICIAL OWNERS
Security Ownership of Directors and Executive Officers
The following table sets forth the beneficial ownership of the Common Stock as of March 4, 2016, for each director and nominee for director, each Executive, and by all directors (including nominees) and executive officers of the Company as a group.
Unvested Options Restricted Beneficial Name Common Stock Exercisable Shares Total Ownership(1) Jerry C. Atkin . . . . . . . . . . . . . . . . . . . . . . . . . . . 1,210,886 167,658 59,241 1,437,785 2.8 %Russell A. Childs . . . . . . . . . . . . . . . . . . . . . . . . . 25,442 92,543 68,994 186,979 (2) Robert J. Simmons . . . . . . . . . . . . . . . . . . . . . . . . 1,000 7,997 31,089 40,086 (2) Wade J. Steel . . . . . . . . . . . . . . . . . . . . . . . . . . . . . 3,078 11,292 35,274 49,644 (2) Michael B. Thompson . . . . . . . . . . . . . . . . . . . . . . 7,276 10,321 30,595 48,192 (2) Terry M. Vais . . . . . . . . . . . . . . . . . . . . . . . . . . . . . 2,481 21,764 22,809 47,054 (2) Eric J. Woodward . . . . . . . . . . . . . . . . . . . . . . . . . 11,883 15,820 17,118 44,821 (2) W. Steve Albrecht . . . . . . . . . . . . . . . . . . . . . . . . 34,461 — — 34,461 (2) Henry J. Eyring . . . . . . . . . . . . . . . . . . . . . . . . . . 41,816 — — 41,816 (2) Meredith S. Madden . . . . . . . . . . . . . . . . . . . . . . . 7,667 — — 7,667 (2) Ronald J. Mittelstaedt . . . . . . . . . . . . . . . . . . . . . 15,118 — — 15,118 (2) Andrew C. Roberts . . . . . . . . . . . . . . . . . . . . . . . . 7,667 — — 7,667 (2) Keith E. Smith . . . . . . . . . . . . . . . . . . . . . . . . . . . 25,118 — — 25,118 (2) Steven F. Udvar-Hazy . . . . . . . . . . . . . . . . . . . . . 42,856 — — 42,856 (2) James L. Welch . . . . . . . . . . . . . . . . . . . . . . . . . . 35,456 — — 35,456 (2) All officers and directors as a group (15 persons) 1,472,205 327,395 265,120 2,064,720 4.0 %
(1) Based on 51,353,043 shares outstanding as of March 4, 2016.
(2) Less than one percent of the total shares outstanding as of March 4, 2016.
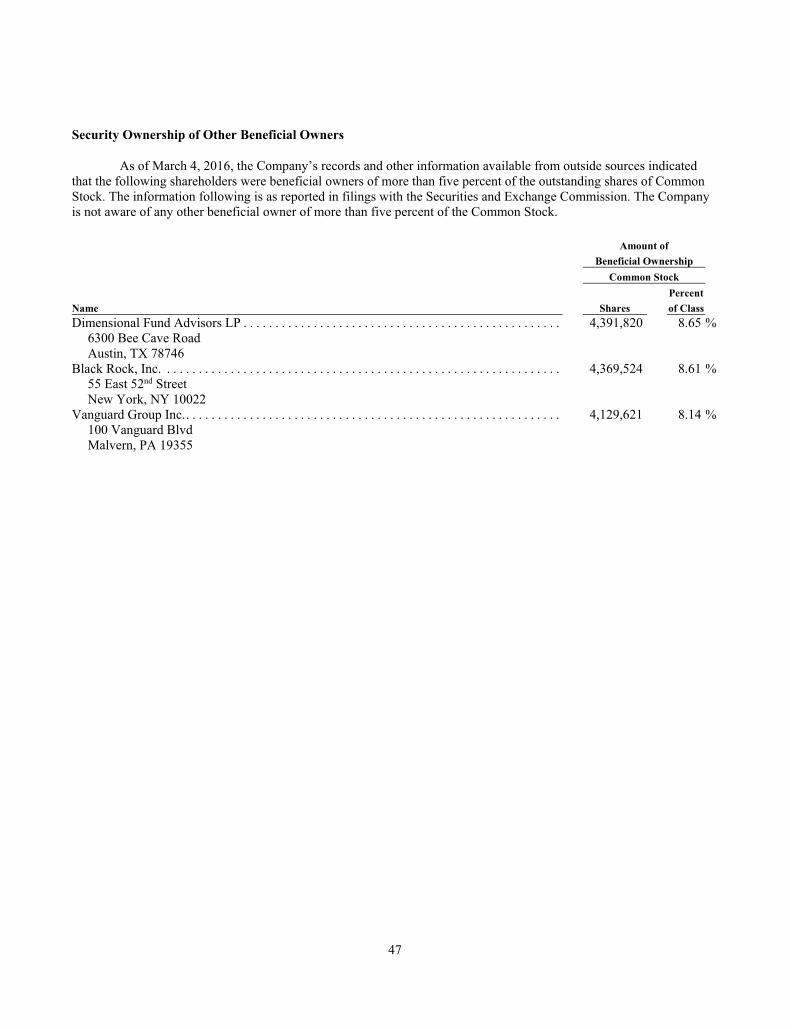
47
Security Ownership of Other Beneficial Owners
As of March 4, 2016, the Company’s records and other information available from outside sources indicated that the following shareholders were beneficial owners of more than five percent of the outstanding shares of Common Stock. The information following is as reported in filings with the Securities and Exchange Commission. The Company is not aware of any other beneficial owner of more than five percent of the Common Stock.
Amount of Beneficial Ownership Common Stock Percent Name Shares of Class Dimensional Fund Advisors LP . . . . . . . . . . . . . . . . . . . . . . . . . . . . . . . . . . . . . . . . . . . . . . . . . . 4,391,820 8.65 %
6300 Bee Cave Road Austin, TX 78746
Black Rock, Inc. . . . . . . . . . . . . . . . . . . . . . . . . . . . . . . . . . . . . . . . . . . . . . . . . . . . . . . . . . . . . . . 4,369,524 8.61 %55 East 52nd Street New York, NY 10022
Vanguard Group Inc. . . . . . . . . . . . . . . . . . . . . . . . . . . . . . . . . . . . . . . . . . . . . . . . . . . . . . . . . . . . 4,129,621 8.14 %100 Vanguard Blvd Malvern, PA 19355

48
PROPOSAL 2 ADVISORY VOTE ON EXECUTIVE COMPENSATION
Background
Section 14A of the Exchange Act, which was enacted pursuant to the Dodd-Frank Wall Street Reform and Consumer Protection Act, requires that the Company provide its shareholders with the opportunity to vote on an advisory (non-binding) resolution to approve the compensation of the Executives (referred to as a “Say-on-Pay” proposal) as disclosed in this Proxy Statement.
Accordingly, the following resolution will be submitted to the Company’s shareholders for approval at the Meeting:
“RESOLVED, that the Company’s shareholders approve, on an advisory basis, the compensation of the Executives, as disclosed in the Company’s Proxy Statement for the 2016 Annual Meeting of Shareholders pursuant to the compensation disclosure rules of the U.S. Securities and Exchange Commission, including the Compensation Discussion and Analysis, the 2015 Executive Compensation table and the other related tables and disclosure.”
As described in detail under the heading “Compensation Discussion and Analysis,” the Board believes the Company’s compensation of the Executives achieves the primary goals of (i) attracting and retaining experienced, well-qualified executives capable of implementing the Company’s strategic and operational objectives, (ii) aligning management compensation with the creation of shareholder value on an annual and long-term basis, and (iii) linking a substantial portion of the Executives’ compensation with long-term Company performance and the achievement of pre-determined goals, while at the same time avoiding the encouragement of unnecessary or excessive risk-taking. The Board encourages you to review in detail the Compensation Discussion and Analysis beginning on page 24 of this Proxy Statement and the executive compensation tables beginning on page 34 of this Proxy Statement. In light of the information set forth in such sections of this Proxy Statement, the Board believes the compensation of the Executives for the fiscal year ended December 31, 2015 was fair and reasonable and that the Company’s compensation programs and practices are in the best interests of the Company and its shareholders.
The vote on this Say-on-Pay resolution is not intended to address any specific element of compensation; rather, the vote relates to all aspects of the compensation of the Executives, as described in this Proxy Statement. While this vote is only advisory in nature, which means that the vote is not binding on the Company, the Board and the Compensation Committee (which is composed solely of independent directors), value the opinion of the Company’s shareholders and will consider the outcome of the vote when addressing future compensation arrangements.
We are required under current law to hold this advisory “Say-on-Pay” vote at least once every three years. We have held such an advisory vote at each of our annual meetings of shareholders since 2011 and currently anticipate that we will hold a similar vote on an annual basis until we hold our next shareholder advisory vote on the frequency of future Say-on-Pay votes.
Voting
Approval of the resolution above (on a non-binding, advisory basis) requires that the number of votes cast at the Meeting, in person or by proxy, in favor of the resolution exceeds the number of votes cast in opposition to the resolution.
The Board and the Compensation Committee Recommend that Shareholders Vote FOR Approval of the Compensation of the Executives, as disclosed in this Proxy Statement.

49
PROPOSAL 3 RATIFICATION OF APPOINTMENT OF
INDEPENDENT REGISTERED PUBLIC ACCOUNTING FIRM
The Audit and Finance Committee has recommended and approved the appointment of Ernst & Young LLP as the Company’s independent registered public accounting firm (independent auditors) to examine the consolidated financial statements of the Company for the year ending December 31, 2016. The Company is seeking shareholder ratification of such action.
It is expected that representatives of Ernst & Young LLP will attend the Meeting and be available to make a statement or respond to appropriate questions.
The Board and the Audit and Finance Committee Recommend that Shareholders Vote FOR the Ratification of Appointment of Ernst & Young LLP as the Company’s Independent Registered Public Accounting Firm
(Independent Auditors) for the year ending December 31, 2016.

50
AUDIT AND FINANCE COMMITTEE DISCLOSURE
Who served on the Audit and Finance Committee?
The members of the Audit and Finance Committee as of December 31, 2015, were W. Steve Albrecht (Chairman), Henry J. Eyring, Andrew C. Roberts, Keith E. Smith and James Welch. Each member of the Audit and Finance Committee has been determined by the Board to be independent under the rules of the Securities and Exchange Commission and The Nasdaq Global Select Market. The Board has determined that W. Steve Albrecht, who served on the Audit and Finance Committee during the year ended December 31, 2015, is an “audit committee financial expert” as defined in Item 401(h) (2) of Regulation S-K promulgated under the Exchange Act.
What document governs the activities of the Audit and Finance Committee?
The Audit and Finance Committee acts under a written charter, which sets forth its responsibilities and duties, as well as requirements for the Audit and Finance Committee’s composition and meetings. The Audit and Finance Committee charter is available on the Company’s website at inc.skywest.com, and is also available in print, free of charge, upon request. Requests for a printed copy of the Audit and Finance Committee charter should be submitted to Eric J. Woodward, Chief Accounting Officer of the Company, at 444 South River Road, St. George, Utah 84790.
How does the Audit and Finance Committee conduct its meetings?
During the year ended December 31, 2015, the Audit and Finance Committee met with the senior members of the Company’s financial management team at each of its regular scheduled quarterly meetings. The Audit and Finance Committee also met with representatives of Ernst & Young, LLP (“EY”), the Company’s independent registered public accounting firm, at each of its in-person meetings and met with representatives of Protiviti, Inc. (“Protiviti”), the Company’s principal internal auditor, at several of its meetings. Agendas for the Audit and Finance Committee’s meetings are established by the Chairman of the Audit and Finance Committee, after consultation with the Company’s Chief Financial Officer and Chief Accounting Officer. At those meetings, the Audit and Finance Committee reviewed and discussed the Company’s financial performance, financial reporting practices, various financial and regulatory issues, accounting and financial management issues, developments in the accounting profession, as well as the Company’s industry, risk management and a summary of calls received on the Company’s anonymous reporting line. The Audit and Finance Committee also had separate, executive sessions regularly with representatives of EY, the Company’s Chief Financial Officer, Protiviti and the Company’s legal counsel, at which meetings candid discussions of financial management, accounting, internal controls and legal and compliance issues took place. Additionally, the Chairman of the Audit and Finance Committee had separate discussions regularly with the Chief Financial Officer and representatives of EY, Protiviti and the Company’s legal counsel.
Does the Audit and Finance Committee review the periodic reports and other public financial disclosures of the Company?
The Audit and Finance Committee reviews each of the Company’s quarterly and annual reports, including Management’s Discussion and Analysis of Financial Condition and Results of Operations. As part of its review, the Audit and Finance Committee discusses the reports with the Company’s management and independent registered public accounting firm and considers the audit and review reports prepared by the independent registered public accounting firm about the Company’s quarterly and annual reports, as well as related matters such as the quality (and not just the acceptability) of the Company’s accounting practices, alternative methods of accounting under generally accepted accounting principles in the United States (“GAAP”) and the preferences of the independent registered public accounting firm in this regard, the Company’s critical accounting policies and the clarity and completeness of the Company’s financial and other disclosures.

51
Did the Audit and Finance Committee play any role in connection with the Company’s report on internal controls?
The Audit and Finance Committee reviewed management’s report on internal control over financial reporting, required under Section 404 of the Sarbanes Oxley Act of 2002 and related rules. As part of this review, the Audit and Finance Committee reviewed the bases for management’s conclusions in that report, and also reviewed the report of the independent registered public accounting firm on internal control over financial reporting. Throughout the year ended December 31, 2015, the Audit and Finance Committee reviewed management’s plan for documenting and testing controls, the results of their documentation and testing, any deficiencies discovered and the resulting remediation of any such deficiencies.
What is the role of the Audit and Finance Committee in connection with the financial statements and controls of the Company?
Management of the Company has primary responsibility for the Company’s financial statements and internal control over the Company’s financial reporting. The Company’s independent registered public accounting firm has responsibility for the integrated audit of the Company’s financial statements and internal control over financial reporting. It is the responsibility of the Audit and Finance Committee to oversee financial and control matters, among other responsibilities fulfilled by the Audit and Finance Committee under its charter. The Audit and Finance Committee meets regularly with representatives of EY and Protiviti, without the presence of management, to ensure candid and constructive discussions about the Company’s compliance with accounting standards and best practices among public companies comparable in size and scope to the Company. The Audit and Finance Committee also regularly reviews with its outside advisors material developments in the law and accounting literature that may be pertinent to the Company’s accounting financial reporting practices.
Does the Audit and Finance Committee have any policy-making responsibility?
From time to time, the Audit and Finance Committee establishes certain policies as required by the rules of the Securities and Exchange Commission and the listing standards of The Nasdaq Global Select Market. For example, the Audit and Finance Committee has established a policy for the receipt and retention (including on an anonymous basis) of complaints about financial and control matters. The Audit and Finance Committee also has implemented a policy that addresses when the Company may recruit personnel who formerly were employed by the Company’s independent registered public accounting firm. In other cases, the Audit and Finance Committee is responsible for overseeing the efficacy of management policies, including compliance with the Company’s Code of Ethics and the availability of perquisites.
What matters have members of the Audit and Finance Committee discussed with the independent registered public accounting firm?
In its meetings with representatives of EY, the Audit and Finance Committee asked EY to address and discuss their responses to several questions that they believed were particularly relevant to its oversight. These questions included:
• Are there any significant judgments made by management in preparing the financial statements that would have been made differently had EY prepared and been responsible for the financial statements?
• Based on EY’s experience, and their knowledge of the Company, do the Company’s financial statements fairly present to investors, with clarity and completeness, the Company’s financial position and performance for the reporting period in accordance with GAAP and Securities and Exchange Commission disclosure requirements?

52
• Based on EY’s experience, and their knowledge of the Company, has the Company implemented internal controls and internal audit procedures that are appropriate for the Company?
• During the course of the applicable year, has EY received any communication or discovered any information indicating any improprieties with respect to the Company’s accounting and reporting procedures or reports?
The Audit and Finance Committee has also discussed with EY that they are retained by the Audit and Finance Committee and that they must raise any concerns about the Company’s financial reporting and procedures directly with the Audit and Finance Committee. Based on these discussions and its discussions with management, the Audit and Finance Committee believes it has a basis for its oversight judgments and for recommending that the Company’s audited financial statements be included in the Company’s Annual Report on Form 10-K for the year ended December 31, 2015.
What has the Audit & Finance Committee done with regard to the Company’s audited financial statements for the year ended December 31, 2015?
The Audit and Finance Committee has:
• Reviewed and discussed the Company’s audited financial statements with the Company’s management; and
• Discussed with EY the matters required to be discussed by applicable standards of the Public Accounting Oversight Board.
Has the Audit and Finance Committee considered the independence of the Company’s independent registered public accounting firm?
The Audit and Finance Committee has received from EY the written disclosures regarding EY’s independence required by PCAOB Ethics and Independence Rule 3526, Communication with Audit Committees Concerning Independence, and has discussed with EY their independence. The Audit and Finance Committee has concluded that EY is independent from the Company and its management.
Has the Audit and Finance Committee made a recommendation regarding the audited financial statements for the year ended December 31, 2015?
Based upon its review and the discussions with management and the Company’s independent registered public accounting firm, the Audit and Finance Committee recommended to the Board that the audited consolidated financial statements for the Company be included in the Company’s Annual Report on Form 10-K for the year ended December 31, 2015.
Does the Audit and Finance Committee provide a periodic report of its activities to the Board?
The Audit and Finance Committee provides reports of its activities at each regularly scheduled Board meeting.
Has the Audit and Finance Committee reviewed the fees paid to the Company’s independent registered public accounting firm during the year ended December 31, 2015?
The Audit and Finance Committee has reviewed and discussed the fees paid to EY during the year ended December 31, 2015, for audit, audit-related, tax and other services, which are set forth below under “Fees Paid to

53
Independent Registered Public Accounting Firm.” The Audit and Finance Committee has concluded that EY’s delivery of non-audit services is compatible with EY’s independence.
What is the Company’s policy regarding the retention of the Company’s independent registered public accounting firm?
The Audit and Finance Committee has adopted a policy regarding the retention of the independent registered public accounting firm that requires pre-approval of all services by the Audit and Finance Committee or the Chairman of the Audit and Finance Committee. When services are pre-approved by the Chairman of the Audit and Finance Committee, notice of such approval is given to the other members of the Audit and Finance Committee and presented to the full Audit and Finance Committee at its next scheduled meeting.

54
FEES PAID TO INDEPENDENT REGISTERED PUBLIC ACCOUNTING FIRM
Audit Fees
During the years ended December 31, 2015 and 2014, the Company paid EY fees in the aggregate amount of $1,265,000 and $1,129,000, respectively, for the annual audit of the Company’s financial statements, the quarterly reviews of the Company’s financial statements included in its Quarterly Reports on Form 10-Q, audits of the closing balance sheets of certain businesses acquired, and the review of the Company’s registration statements.
Audit-Related Fees, Tax Fees and All Other Fees
The Company did not pay EY for audit-related fees, tax fees and all other fees during the year ended December 31, 2015. During the year ended December 31, 2014, the Company paid $44,000 to EY as audit-related fees, tax fees and all other fees, primarily related to domestic and international tax services.

55
REPORT OF THE AUDIT AND FINANCE COMMITTEE
In connection with the financial statements for the year ended December 31, 2015, the Audit and Finance Committee has:
(1) reviewed and discussed the audited financial statements with management;
(2) discussed with EY, the Company’s independent registered public accounting firm, the matters required to be discussed by applicable standards of the Public Accounting Oversight Board; and
(3) received the written disclosure and letter from EY regarding the auditors’ independence required by PCAOB Ethics and Independence Rule 3526, Communication with Audit Committees Concerning Independence, and has discussed with the independent auditors the independent auditor’s independence.
Based upon these reviews and discussions, the Audit and Finance Committee recommended to the Board at the February 10, 2016 meeting of the Board that the Company’s audited financial statements be included in the Annual Report on Form 10-K for the year ended December 31, 2015, filed with the Securities and Exchange Commission. The Board approved this inclusion.
The Audit and Finance Committee
W. Steve Albrecht, Chair Henry J. Eyring Andrew C. Roberts Keith E. Smith James L. Welch

56
SECTION 16(a) BENEFICIAL OWNERSHIP REPORTING COMPLIANCE
The Company’s executive officers, directors and 10% shareholders are required under Section 16 of the Exchange Act to file reports of ownership and changes in ownership with the Securities and Exchange Commission. Copies of these reports must also be furnished to the Company.
Based solely on a review of copies of reports furnished to the Company, or written representations that no reports were required, the Company believes that during 2015 its executive officers, directors and 10% holders complied with all filing requirements of Section 16 of the Exchange Act.
SHAREHOLDER PROPOSALS FOR THE 2017 ANNUAL MEETING OF SHAREHOLDERS
If any shareholder intends to present a proposal to be considered for inclusion in the Company’s proxy material in connection with the Company’s 2017 Annual Meeting of Shareholders, the proposal must be in proper form (per SEC Regulation 14A, Rule 14a-8—Shareholder Proposals) and received by the Chief Financial Officer of the Company on or before November 19, 2016. Shareholder proposals to be presented at the 2017 Annual Meeting of Shareholders which are not to be included in the Company’s proxy materials must be received by the Company no earlier February 5, 2017, and no later than February 25, 2017, in accordance with the procedures set forth in the Company’s Bylaws.

57
DELIVERY OF DOCUMENTS TO SHAREHOLDERS SHARING AN ADDRESS
In instances in which multiple holders of the Common Stock share a common address and are the beneficial owners, but not the record holders, of those shares of Common Stock, the holders’ banks, brokers or other nominees may only deliver one copy of this Proxy Statement and the Company’s 2015 Annual Report to Shareholders, unless the applicable bank, broker or nominee has received contrary instructions from one or more of the shareholders. The Company will deliver promptly, upon written request, a separate copy of this Proxy Statement and the Company’s 2015 Annual Report to Shareholders to any shareholder at a shared address to which a single copy of the documents was delivered. A shareholder who wishes to receive a separate copy of this Proxy Statement and the Company’s 2015 Annual Report to Shareholders should submit a request in writing to Robert J. Simmons, Chief Financial Officer of the Company, 444 South River Road, St. George, Utah 84790, Telephone: (435) 634-3200. Beneficial owners sharing an address who are receiving multiple copies of proxy materials and annual reports and who wish to receive a single copy of such materials in the future will need to contact their broker, bank or other nominee to request that only a single copy of each document be mailed to all shareholders at the shared address in the future.
OTHER BUSINESS
The Company’s management does not know of any other matter to be presented for action at the Meeting. However, if any other matters should be properly presented at the Meeting, it is the intention of the persons named in the accompanying proxy to vote said proxy in accordance with their best judgment.
Robert J. Simmons,
Chief Financial Officer
St. George, Utah
March 17, 2016

10:0
011
:00
NO
ON
9:00
(Ariz
ona
does
not
obs
erve
Day
light
Sav
ings
)
EFFE
CTIV
E MA
RCH
2016
Hua
tulc
o
OFFICERS AND DIRECTORS SKYWEST, INC and SUBSIDIARIES
CORPORATE INFORMATION
Headquarters Independent Public Accountants Registrar and Transfer Agent444 South River Road Ernst & Young, LLP Zions First National Bank St George Utah 84790 178 South Rio Grande Street, Suite 400 Stock Transfer DepartmentP: 435‐634‐3000 Salt Lake City, Utah 84101 PO Box 9088 inc.skywest.com Salt Lake City, Utah 84130 NASDAQ Stock Symbol: SKYW
SKYWEST, INCRussell A. Childs Chief Executive Officer & President
Robert J. Simmons Chief Financial Officer
Wade J. Steel Chief Commercial Officer
Eric J. WoodwardChief Accounting Officer
James B. JensenVice President, Information Technology
SKYWEST AIRLINES, INCMichael ThompsonChief Operating Officer
Steve Black Vice President, Customer Service
Bill Dykes Vice President, Maintenance
Tracy Gallo Vice President, Flight Operations
Lori Hunt Vice President, People
Sonya Wolford Vice President, InFlight Services
EXPRESSJET AIRLINES, INC Terry Vais Chief Operating Officer
Denise E. Harvill Vice President, People Resources
Bob MadiganVice President, Maintenance & Engineering
Brandee ReynoldsVice President, InFlight Services
Brad Sheehan Senior Vice President, Flight Operations
Kevin WadeVice President, Finance & Controller
BOARD OF DIRECTORSJerry C. AtkinChairman of the BoardElected Chairman 1991 Member of the Board Since 1974
Steven F. Udvar‐Hazy Chairman and CEO, Air Lease Corporation Board Lead Director Chairman, Nominating & Corporate Governance Committee Member, Compensation CommitteeMember of the Board since 1986
W. Steve AlbrechtProfessor, Brigham Young University Chairman, Audit & Finance Committee Member, Nominating & Corporate Governance Committee Member of the Board since 2012 (also served from 2003‐2009)
Henry J. EyringAcademic VP, Brigham Young University Idaho Member, Audit & Finance Committee Member, Compensation CommitteeMember of the Board since 2006 (also served from 1995‐2003)
Meredith S. MaddenChief Executive Officer, NORDAMMember, Compensation CommitteeMember, Safety & Compliance Committee Member of the Board since 2015
Ronald J. Mittelstaedt Chairman, President & CEO, Waste Connections Inc Member, Compensation CommitteeMember, Nominating & Corporate Governance Member, Safety & Compliance Committee Member of the Board since 2013
Andrew C. Roberts Executive Chairman, Ryan Herco Flow Solutions, LLC Chairman, Safety & Compliance Committee Member, Audit & Finance Committee Member of the Board since 2015
Keith E. Smith President & Chief Executive Officer, Boyd Gaming Corporation Chairman, Compensation Committee Member, Audit & Finance Committee Member of the Board since 2013
James L. Welch Chief Executive Officer, YRC Worldwide, IncMember, Audit & Finance Committee Member, Nominating & Corporate Governance Committee Member, Safety & Compliance Committee Member of the Board since 2007
3/8/16 9:11 AM

inc . sk ywest .com
45541cvr.indd 1