2015 ANNUAL PERFORMANCE MONITORING REPORT, … · 2018-03-30 · No. 53, Street 28, Beoung Kak I,...
64
2015 ANNUAL PERFORMANCE MONITORING REPORT, VOLUME 1 March, 2016 Second Health Sector Support Program, 2009-16 MINISTRY OF HEALTH No. 53, Street 28, Beoung Kak I, Toul Kork Phnom Penh, Kingdom of Cambodia. Ministry of Health
Transcript of 2015 ANNUAL PERFORMANCE MONITORING REPORT, … · 2018-03-30 · No. 53, Street 28, Beoung Kak I,...

i
2015 ANNUAL PERFORMANCE MONITORING REPORT, VOLUME 1
March, 2016 Second Health Sector Support Program, 2009-16
MINISTRY OF HEALTH No. 53, Street 28, Beoung Kak I, Toul Kork
Phnom Penh, Kingdom of Cambodia.
Ministry of Health

2
Second Health Sector Support Program, 2009-16
MINISTRY OF HEALTH No. 53, Street 28, Beoung Kak I, Toul Kork
Phnom Penh, Kingdom of Cambodia. Tel: 855.(0)23.880.261 Fax: 855.(0)23.880.262 Email: [email protected]
Implementing Units
Department of Administration
Department of Budget and Finance
Department of Communicable Disease Control
Department of Drugs, Food and Cosmetics
Central Medical Stores
Department of Hospital Services
Department of Human Resources
Department of Internal Audit
Department of International Cooperation
Department of Personnel
Department of Planning and Health Information
Department of Preventive Medicine
National Dengue Control Program (CNM)
Helminths Control Program (CNM)
National Maternal and Child Health Center (NMCHC)
National Nutrition Program
National Reproductive Health Program (NMCHC))
National Immunization Program (NMCHC)
Prevention of Mother to Child Transmission Program (NMCHC)
ARI-CDD-Cholera Program (NMCHC)
National Center for Blood Transfusion
National Center for Health Promotion
University of Health Sciences
Technical School for Medical Care
Regional Training Centers (Battambang, Kampot, Kampong Cham, Stung Treng)
All Provincial Health Departments
All Operational District Offices
in joint
partnership with:

3
ACRONYMS
ADB Asian Development Bank
AFD French Cooperation Agency
AFH Action for Health
AIDS Acquired Immune Deficiency Syndrome
ALOS Average Length of Stay
ANC Antenatal Care
AOP Annual Operational Plan
AusAID Australian Agency for International Development
BCC Behavior Change Communication
BHEF Bureau for Health Economics and Financing
BHIS Bureau for Health Information System
BOR Bed Occupancy Rate
BTR Bed Turnover Rate
CARE Cooperative for Assistance and Relief Everywhere, Inc
CBHI Community Based Health Insurance
CDC Communicable Disease Control Department
CDHS Cambodia Demographic and Health Survey
CEC Continuing Education Coordinators
CENAT National Anti-Tuberculosis Center
CFR Case Fatality Rate
CMS Central Medical Stores
CNM National Center for Parasitology, Entomology and Malaria
Control
CoC Continuum of Care
CPA Complementary Package of Activities
CPR Contraceptive Prevalence Rate
CSES Cambodia Socio-Economic Survey
CWG Construction Working Group

4
CWM Civil Works Manager
DBF Department of Budget and Finance
DDF Department of Drugs and Food
DFID Department for International Development (UK)
DRF Drug Revolving Fund
DOTS Directly Observed Treatment, Short Course
DPHI Department of Planning and Health Information
DPM Department of Preventive Medicine
EmONC Emergency Obstetric and Neonatal Care
EPI Expanded Program of Immunizations
FTI Fast Track Initiative
GIZ Deutsche Gesellschaft für Internationale Zusammenarbeit,
GmbH(German International Cooperation Agency)
HC Health Center
HCP Health Coverage Plan
HEF Health Equity Fund
HIS Health Information System
HIV Human Immuno-Deficiency Virus
HMIS Health Management Information System
HP Health Post
HRD Human Resources Development Department
HSP1
HSP2
First Health Sector Strategic Plan, 2003-07
Second Health Strategic Plan, 2008-15
HSSP1
HSSP2
First Health Sector Support Project (ADB, DFID, UNFPA,
IDA/The World Bank)
Second Health Sector Support Program (AFD, AusAID, BTC,
DFID, UNFPA, UNICEF, IDA/The World Bank)
ICB Institutional Capacity Building
ICBA Institutional Capacity Building Agency
IDA International Development Association/The World Bank

5
IEC Information, Education, Communication
IMCI Integrated Management of Childhood Illnesses
IPD Inpatient Department
ISC Integrated Supervision Checklist
IYCF Infant and Young Child Feeding
JAPA Joint Annual Plan Appraisal
JAPR Joint Annual Performance Review
JICA
KOICA
Japan International Cooperation Agency
Korean International Cooperation Agency
MCH Maternal and Child Health
MEF Ministry of Economy and Finance
MOEYS Ministry of Education, Youth and Sports
MOH Ministry of Health
MOP Ministry of Planning
MOU Memorandum of Understanding
MPA Minimum Package of Activities
MTR Mid Term Review
MVHL Most Vulnerable Households’ List
NCHADS National Center for HIV/AIDS, Dermatology, and Sexually
Transmitted Infections
NGO Non Governmental Organization
NHC National Health Congress
NIPH National Institute of Public Health
NIS National Institute of Statistics
NMCHC National Maternal and Child Health Center
NP National Program
NPH National Pediatric Hospital
NNP National Nutrition Program
OD Operational District
ODO Operational District Office

6
OPD Outpatient Department
PAP Priority Action Program
PHD Provincial Health Department
PMTCT Prevention of Mother to Child Transmission of HIV/AIDS
POE Provincial Office of Education
PRH Provincial Referral Hospital
PRO-TWGH Provincial Technical Working Group Health
PSI Population Services International
QA Quality Assurance
QI Quality Improvement
RACHA Reproductive and Child Health Alliance
RGC Royal Government of Cambodia
RH Referral Hospital
RHAC Reproductive Health Association of Cambodia
RMNCH Reproductive, Maternal, Newborn and Child Health
RTC Regional Training Center
SCA Save the Children Australia
SDMG Service Delivery Monitoring Group
SOA Special Operating Agency
SPF Social Protection Fund
SRC Swiss Red Cross
STD/STI Sexually Transmitted Diseases/Infections
SWAp Sector Wide Approach
SWiM Sector Wide Management
TA Technical Assistance
TB Tuberculosis
TOR Terms of Reference
TWG-H Technical Working Group - Health
UNFPA United Nations Population Fund

7
UNICEF United Nations Children’s Fund
URC University Research Company
USAID U.S. Agency for International Development
USD U.S. Dollars
VCCT Voluntary Confidential Counseling and Testing
VHIS Voluntary Health Insurance Scheme
VHV Village Health Volunteer
WB The World Bank/International Development Association
WHO World Health Organization

8
TABLE OF CONTENTS
CHAPTER 1. INTRODUCTION ...................................................................................... 10
CHAPTER 2. PROGRAM PROGRESS AND KEY ISSUES ........................................................ 10
2.1 PROGRAM PERFORMANCE INDICATOR DASHBOARD ....................................................................................................... 11 2.2 STATUS OF PROGRAM ACTIVITIES ............................................................................................................................... 12 2.3 KEY IMPLEMENTATION ISSUES .................................................................................................................................... 12
CHAPTER 3. COMPONENT A: STRENGTHENING HEALTH SERVICE DELIVERY ........................... 13
3.1 PROGRAM 1: REPRODUCTIVE, MATERNAL, NEWBORN AND CHILD HEALTH ........................................................................ 13
3.1.1 NUTRITION ...................................................................................................................................................... 13
3.1.2 REPRODUCTIVE HEALTH ..................................................................................................................................... 13
3.1.3 MATERNAL AND NEWBORN HEALTH ..................................................................................................................... 14
3.1.4 EXPANDING EMONC SERVICES ............................................................................................................................ 14 3.2 PROGRAM 2: COMMUNICABLE DISEASES PREVENTION AND CONTROL ............................................................................... 16
3.2.1 DENGUE CONTROL PROGRAM .............................................................................................................................. 16
3.2.2 HELMINTHS CONTROL PROGRAM (COMMUNITY AND SCHOOL BASED ACTIVITIES) ............................................................ 16
3.3 PROGRAM 3: NON COMMUNICABLE DISEASES .............................................................................................................. 17
3.3.1 PRIMARY PREVENTION ACTIVITIES ......................................................................................................................... 17 3.4 HEALTH PROMOTION ............................................................................................................................................... 19
3.5 HEALTH INFRASTRUCTURE DEVELOPMENT .................................................................................................................... 20
3.5.1 INFRASTRUCTURE DEVELOPMENT BY SOURCE OF FUND ............................................................................................. 20
3.5.2 INFRASTRUCTURE DEVELOPMENT BY TYPE OF FACILITY .............................................................................................. 21
3.5.3 INFRASTRUCTURE DEVELOPMENT BY PROVINCE ........................................................................................................ 21
3.5.4 BUDGET AND EXPENDITURES FOR INFRASTRUCTURE DEVELOPMENT ............................................................................ 23 3.6 SOA PERFORMANCE ................................................................................................................................................ 24
3.6.1 PERFORMANCE BONUS AWARDS ........................................................................................................................... 24
3.6.2 QUARTERLY SOA REVIEW REPORTS ....................................................................................................................... 24
3.6.3 SPECIFIC ISSUES REGARDING SOAS ........................................................................................................................ 25
3.6.4 TRACKING OF PBB BUDGET FOR SOAS ................................................................................................................... 26
3.6.5 SERVICE DELIVERY MONITORING GROUP REPORT ..................................................................................................... 26
3.6.6 INDIGENOUS PEOPLES SERVICE DELIVERY ................................................................................................................ 44
CHAPTER 4. COMPONENT B: IMPROVING HEALTH FINANCE ............................................ 447
4.1 HEALTH EQUITY FUNDS ............................................................................................................................................ 47 4.2 COMPARISON OF PRE AND POST-ID PATIENTS .............................................................................................................. 50
CHAPTER 5. COMPONENT C: STRENGTHENING HUMAN RESOURCES ................................... 51
5.1 TRAINING REPORT ................................................................................................................................................... 51
5.2 STAFF DEPLOYMENT ................................................................................................................................................ 51
CHAPTER 6. COMPONENT D: STRENGTHENING HEALTH SYSTEM STEWARDSHIP FUNCTIONS ...... 52
6.1 POLICY DEVELOPMENT AND IMPLEMENTATION.............................................................................................................. 52 6.2 HEALTH MANAGEMENT INFORMATION SYSTEM ............................................................................................................ 52 6.3 IMPROVING QUALITY OF CARE ................................................................................................................................... 52
CHAPTER 7. PROGRAM FINANCIAL INFORMATION .......................................................... 53 7.1 DISBURSEMENT ..................................................................................................................................................... 53

9
7.2 EXPENDITURES ........................................................................................................................................................ 53 7.3 PROJECTED CASH REQUIREMENT FOR Q3 & Q4, 2014 .................................................................................................. 53
CHAPTER 8. PROGRAM MANAGEMNET AND IMPLEMENTATION ......................................... 54 8.1 SAFEGUARDS ........................................................................................................................................................ .54
8.2 LEGAL COVENANTS .................................................................................................................................................. 54 8.3 GOOD GOVERNANCE FRAMEWORK ............................................................................................................................. 54
CHAPTER 9. PROGRAM PERFORMANCE MONITORING ..................................................... 55
9.1 OVERVIEW OF PROGRESS OF PROGRAM DEVELOPMENT OBJECTIVES INDICATORS................................................................. 55 9.2 PROGRAM DEVELOPMENT OBJECTIVES INDICATORS, PROVINCIAL RANKINGS ....................................................................... 55 9.3 PROGRAM PERFORMANCE INDICATORS........................................................................................................................ 55
CHAPTER 10.PROGRAM MONITORING ...................................................................... 611 10.1 PROGRAM MONITORING ...................................................................................................................................... .61
10.2 SUPERVISION VISITS ............................................................................................................................................... 61
CHAPTER 11. PROGRAM PROCUREMENT ................................................................... 644 11.1 WORKS ............................................................................................................................................................ 644 11.2GOODS ................................................................................................................................................................ 64 11.3 INDIVIDUAL CONSULTANTS ...................................................................................................................................... 64 11.4 CONSULTANT FIRMS AND HEALTH EQUITY FUND OPERATORS ........................................................................................ 64 11.5 PROCUREMENT OF GOODS AND WORKS FOR SOAS ..................................................................................................... 64
10
CHAPTER1.INTRODUCTION This Performance Monitoring Report is the fourteenth since the launching of HSSP2 in January,
2009 and covers the year 2015. As such, it incorporates materials from the 1st Semester 2015
Report .
CHAPTER 2.PROGRAM PROGRESS AND KEY ISSUES

11
Baseline Current
Infant mortality rate 66 28
Neonatal mortality rate 28 18
Under 5 mortality rate 83 35
Maternal mortality ratio 472 170
Total fertility rate 3.4 2.7
Stunting 43 32.4%
Wasting 8.4 10%
Underweight 28 23.9%
Exclusive breastfeeding 66 65%
Body mass index, women, 15-49 20.3 19%
HIV prevalence rate, 15-49 0.9 0.7%
TB prevalence all forms per 100,000
617 590
Malaria case fatality rate 7.3 0.07%
Road traffic accidents head trauma cases treated
NA 34.34%
2.1 PROGRAM PERFORMANCE INDICATOR DASHBOARD
PROGRAM DEVELOPMENT OBJECTIVE INDICATORS, 2003-15
REPRODUCTIVE, MATERNAL, NEWBORN AND CHILD HEALTH FAST TRACK INITIATIVECONTINUUM OF CARE COVERAGE PROGRAM INDICATORS BASELINE CURRENT
Source: CDHS 2010, National Programs/MOH Source: CDHS 2010, 2014, National Programs/MOH
Source: HMIS, National Programs/MOH
Note: Readers may note that where minor discrepancies exist in
figures above, these are due to differing sources of data e.g., CDHS
2010 and 2014 (survey estimates) versus Health Management
Information System (routine information). Note that all 2015 figures
are from Depts or NPs, not HMIS.
in joint partnership with:
2003 2004 2005 2006 2007 2008 2009 2010 2011 2012 2013 2014 2015
1 Trained attendance at delivery 22.14 32.97 40.57 35.87 46.00 58.00 63.00 69.00 72.00 75.00 84.00 85.00 85.20
2 Deliveries at public health facilities 10.60 16.34 24.14 17.77 25.54 39.00 44.00 52.00 61.00 66.00 80.00 80.00 80.35
3 Modern contraceptive method use 18.46 20.03 21.02 22.49 23.64 26.00 22.32 28.25 29.19 30.48 34.25 35.00 41.00
4 DPT3-HepB3 vaccinations 73.00 85.00 79.00 80.00 82.00 92.00 95.00 92.00 94.00 97.84 95.00 97.91 94.38
5 Pregnant women PMTCT 0.00 0.00 0.00 7.50 11.20 27.00 32.30 56.30 61.10 65.00 67.00 68.00 58.00
6 TB cure rate 89.00 90.00 90.00 89.00 87.00 90.00 92.00 92.00 91.00 91.00 91.00 90.00 89.00
7 Malaria cases treated per 1,000 10.80 7.50 5.50 7.20 4.20 4.41 5.58 4.31 4.39 2.90 1.70 1.89 2.26
8 Vitamin A supplements, 6-59 mos. 39.00 73.50 72.00 78.50 88.00 89.00 98.00 95.00 92.00 98.90 100.50 87.00 81.50
9 Pregnant women iron folate 0.00 0.00 0.00 69.00 63.00 80.00 83.00 80.00 89.69 88.24 84.00 86.00 82.17
10 Mebendazole, 12-59 mos. 71.00 86.00 92.00 83.00 103.00 103.00 96.00 97.00

12
2.2 STATUS OF PROGRAM ACTIVITIES
The level 2 assessments for quality of care were completed in October, 2015 and the results were made available in March, 2016. The payment of the 50% balance of 2014 performance bonus and the entire 2015 bonus to SOAs will be based on these results.
It should be noted that HEFs contracted in 2014 were first extended until June 30, 2015, and subsequently to December 31, 2015. To continue with its stated goal of covering all HCs in the country in 2015, the MOH authorized HEFOs to reimburse health facilities the sum of 2,000 Riels per OPD case, pending the completion of the Level 2 Quality of Care assessment, whose scores are required before an HEF can be made operational at a health facility. The introduction of the full benefits package will be based on the Level 2 results.
Addendum to the Program’s Joint Partnership Arrangement to include KFW was signed on March 5, 2015.
2.3 KEY IMPLEMENTATION ISSUES
HEALTH MANAGEMENT INFORMATION SYSTEM
The HMIS version 2 was established successfully and verified information was available in the database from July, 2015 onwards. In the same month, the USAID contractor providing technical assistance conducted a national training workshop in collaboration with the HIS Bureau to orient participants to the changes in the database.

13
CHAPTER 3.COMPONENTA: STRENGTHENING HEALTH SERVICE DELIVERY
3.1 PROGRAM 1: REPRODUCTIVE, MATERNAL, NEWBORN AND CHILD HEALTH
3.1.1 NUTRITION
CONSTRAINTS • Malnutrition among women and children in Cambodia is still high and most of nutrition
activities are still small scale, except Vitamin A and IFA supplementation
NEXT STEPS • Fund raising from DPs and government to expand nutrition interventions to reduce malnutrition in Cambodia.
3.1.2 REPRODUCTIVE HEALTH
NO INDICATOR
ANNUAL
TARGET ACH
1 Contraceptive Prevalence Rate (Modern Methods) 40% 41%
2 Number of public health facilities provide safe abortion 550 611
3 Number of public health facilities provide ADSRH services 900 816
Source:National Reproductive Health Program
CONSTRAINTS
ADSRH services are limited
New health center staff have not been trained in birth spacing
No financial support for training of HC midwives in ADSRH
NO INDICATOR ANNUAL
TARGET ACH
1 % of pregnant women receiving 90
tablets of iron/folate
supplementation
80 82.17
2 % of postpartum women receiving
42 tablets of iron/folate
supplementation
74 62
3 % of children 6-59 months
receiving vitamin A 2 doses during
the last 6 months (©: CMDG
indicator)
90 R1= 75 R2= 88
Source: National Nutrition Program

14
NEXT STEPS
Continue to conduct Training of Trainers
Expand ADSRH services at HC Level
Continue to conduct meetings and workshops
Continue to conduct field monitoring visits to PHD and HC level on Reproductive Health
Continue to conduct training follow up Request for printing of IEC/BCC materials for the RH health program and purchasing materials for HCs
3.1.3 MATERNAL AND NEWBORN HEALTH
NO INDICATOR ANNUAL
TARGET ACH
1 Two antenatal care consultations 90% 82.06%
2 Delivery by health trained provider 88 85
3 Delivery by trained health provider in health facilities 85 75.90
4 Delivery by C-section (public services only) 4.0 4.92
Source: National Reproductive Health Program
CONSTRAINTS • Transfers of trained service providers at HC level
• No support for training of HC midwives in birth spacing
NEXT STEPS • Continue to provide ToT training to PHD MCH staff • Continue to provide training support to HC staff • Continue to support monitoring and supervison to PHD and OD levels
3.1.4 EXPANDING EMONC SERVICES
NO INDICATOR ANNUAL
TARGET ACH
1 Number of Referral Hospitals and Health Centers
functioning as B-EmONC 136 110
2 Number of Referral Hospitals functioning as C-EmONC 44 37
Source: National Reproductive Health Program
CONSTRAINTS • Limited training for B-EmONC and C-EmONC

15
NEXT STEPS • Continue to conduct training in B-EmONC and C-EmONC • Continue to organize meetings and workshops
3.1.5 CHILD HEALTH AND NUTRITION
NO INDICATOR ANNUAL
TARGET ACH
1 BCG 98% 105.50%
2 HepB<24H 80% 90.30%
3 OPV3 97% 98.51%
4 DPT-HepB-Hib- 3 97% 98.82%
5 Measles 9 months 95% 97.89%
6 Measles 18 months 95% 77.15%
Source: National Immunization Program
CONSTRAINTS:
Funding for routine out-reach is insufficient
Operation according to EVM assessment to be Improved
Some provinces reported on Vaccine Preventable Diseases under estimate.
Inconsistency in denominators
Mobile population, Minorities , hard to reach
NEXT STEPS
JE SIA
JE Introduction
Conduct implementation for high risk communities (Quarter2,Quarter3 and Quarter4)
IPV Introduction and OPV switching
HPV demonstration
16
3.2 PROGRAM 2: COMMUNICABLE DISEASES PREVENTION AND CONTROL
3.2.1 DENGUE CONTROL PROGRAM
NO
INDICATOR
ANNUAL
TARGET ACH
1 Dengue Incidence Rate (per 100,000
population) 286.1 95.3
2 Dengue Case Fatality Rate (%) 0.5 0.25
Source: Dengue Control Program
CONSTRAINTS • Inadequacy of fund for sustaining routine activities • Lack of office supplies and equipment • Medical and clinical management are weak • Inadequacy of laboratory test supplies, tools and equipment • Lack of motivation for dengue data collection • Application of IVM as rapid response activities in some localities of some outbreak
provinces not properly done and on-time • Lack of local authority involvement in some localities
NEXT STEPS • Program needs to mobilize sufficient resources to sustain activities • Office supplies and equipment should be adequate, especially in areas with high dengue
incidence • Medical and clinical management should be Improved • Reagents for lab and rapid diagnosis tests (RDT tests) should be available and enough
for supporting investigation activities during dengue epidemic, • High coverage of health education through mass media and IEC materials should be
improved and maintained in the areas with high dengue incidence • New modality of budget allocation for implementing IVM strategy on time should be
considered
3.2.2 HELMINTHS CONTROL PROGRAM (COMMUNITY AND SCHOOL BASED ACTIVITIES) NO
INDICATOR
ANNUAL COMMENT
TARGET ACH
1 % of school age children 6 to 14 years received
deworming tablets
2,628,381
(100%)
4,983,410
(94.8%)
Round2
No HSSP2
budget
2 % of children aged 12-59 months received
deworming tablets
1,386,453
(100%)
2,695,542
(97.21%)
Round2
No HSSP2
budget
17
NO
INDICATOR
ANNUAL COMMENT
TARGET ACH
3 % of women of reproductive age 15 to 49 years
received deworming tablets
3,571,430
(100%)
2,257,144
(63.42%) No HSSP2
budget
Source: Helmints Control Program
CONSTRAINTS
No Program budget received for all activities
Mountainous areas are hard to access during rainy season
Due to no budget support and difficulty in reaching some remote villages, we will try
to integrate deworming activities into other programs
No budget for monitoring distribution of mebendazole for children 1-5 years old and
primary school age children
• No budget for meeting with school teachers for distribution of mebendazole in primary schools
• No budget for monitoring prevalence of soil-transmitted helminths (STH) • No budget for meeting with PHDs, ODs and HCs for distribution of mebendazole for
women of reproductive age
NEXT STEPS
• Need budget support to strengthen program activities
• Strengthen collaboration with partners and across sectors relevant to helminths
control
• If sufficient funds received, plan to investigate opisthorchiasis in settings where habit
of eating raw/undercooked fish is prevalent
• If funding available, we will improve health education skills at community level,
including primary school teachers, commune leaders and local authorities by using IEC
materials
• If budget available, plan to monitor prevalence of Soil-Transmitted Helminth (STH)
• Supervise deworming program at schools, outreach activity and campaigns, and
update mebendazole information into MHIS
• Capacity building for local helminth key persons
3.3 PROGRAM 3: NON COMMUNICABLE DISEASES
3.3.1 PRIMARY PREVENTION ACTIVITIES
3.3.1.1 DIABETES
NO
INDICATOR
ANNUAL
TARGET ACH

18
1 % of estimated people 25-64 years with diabetes receiving treatment in public facilities
NA 15.42% (201,857)
Source: Dept of Preventive Medicine
CONSTRAINTS
Software program run in local Patient Care Unit has problems
Drug and material supplies are not adequate and not supplied on time
Lack of trainers in lifestyle skills for patients
Lack of awareness in communities NEXT STEPS
Update web-based software program for diabetes management
Conduct lifestyle skills training courses for health staff
Provide drugs and supplies adequately and on time Promote awareness of NCD risk factors among HC staff in order to promote awareness in communities continuously
3.3.1.2 HIGH BLOOD PRESSURE NO
INDICATOR
ANNUAL
TARGET ACH
1 % of estimated people 25-64 years with hypertension receiving treatment in public facilities
NA 18.68%
(779,585)
Source: Dept of Preventive Medicine
CONSTRAINTS
No software program for data entry
Drugs and material supplies are not adequate and not on time
Lack of trainers in lifestyle skills for patients
Lack of awareness in communities
NEXT STEPS
Designweb-based software program for HBP management
Conduct lifestyle skillstraining courses for health staff
Provide drugs and material supplies adequately and on time
Promote awareness of NCD risk factors to HC staff in order to promote awareness
in communities continuously

19
3.3.1.3 CERVICAL CANCER
RESULTS OF THE PILOT ON CERVICAL CANCER SCREENING AND TREATMENT IN SOA OD PREY CHHOR
NO INDICATORS ANNUAL 2015
COMMENTS TARGET ACHIEVED
1 Number Screened (30-49
years) 13,630 6,797 Total target women screened are 50%
2
Number of
Positive and
Invasive Cases
Positive 6,797 135 Women with VIA(+) received from HCs
2% and referred to RH
Invasive
(˃49 years) 131 5
Transfer to National Hospital for
treatment
3 Number of
Cases Treated
Positive 24 11
Women with VIA(+) arrived of RH are
83
Second confirmation on VIA (+) are 24
Invasive
(˃49 years) 131 5
5 women have been transferred to
National Hospital for treatment
4
Follow-up
After
Treatment
11 2
One week after treatment among 11
women only 2 women came to RH for
follow up.
Source: Dept of Preventive Medicine
CONSTRAINTS
Low capacity of human resources (only one doctor can practice on cryotherapy machine)
Target women work in factories from morning till night, and on weekends as well
Heavy seasonal out-migration among target women
Cryotherapy machine did not arrive on time
Cryotherapy treatment, achieved only 11 women, because the doctor was busy with other activities
NEXT STEPS
Refresher training for staff
SOA OD should provide screening invitation letter to women for presenting at HC
Cryotherapy treatment should be handed over to trained midwives when a doctor is busy
3.4 HEALTH PROMOTION
NO INDICATOR ANNUAL
TARGET ACH
1 Number of monitoring and supervision visits on
BCC/IPC in RH NA NA
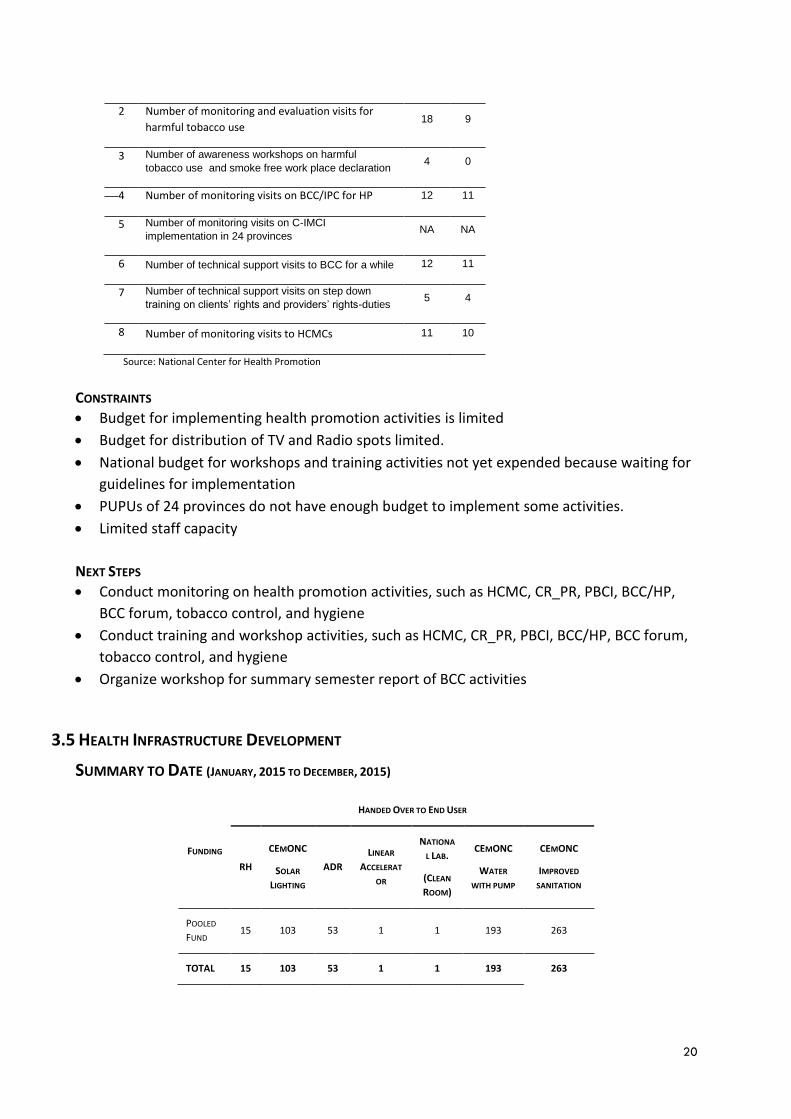
20
2 Number of monitoring and evaluation visits for
harmful tobacco use 18 9
3 Number of awareness workshops on harmful
tobacco use and smoke free work place declaration 4 0
4 Number of monitoring visits on BCC/IPC for HP 12 11
5 Number of monitoring visits on C-IMCI
implementation in 24 provinces NA NA
6 Number of technical support visits to BCC for a while 12 11
7 Number of technical support visits on step down
training on clients’ rights and providers’ rights-duties 5 4
8 Number of monitoring visits to HCMCs 11 10
Source: National Center for Health Promotion
CONSTRAINTS
Budget for implementing health promotion activities is limited
Budget for distribution of TV and Radio spots limited.
National budget for workshops and training activities not yet expended because waiting for
guidelines for implementation
PUPUs of 24 provinces do not have enough budget to implement some activities.
Limited staff capacity
NEXT STEPS
Conduct monitoring on health promotion activities, such as HCMC, CR_PR, PBCI, BCC/HP,
BCC forum, tobacco control, and hygiene
Conduct training and workshop activities, such as HCMC, CR_PR, PBCI, BCC/HP, BCC forum,
tobacco control, and hygiene
Organize workshop for summary semester report of BCC activities
3.5 HEALTH INFRASTRUCTURE DEVELOPMENT
SUMMARY TO DATE (JANUARY, 2015 TO DECEMBER, 2015)
FUNDING
HANDED OVER TO END USER
RH
CEMONC
SOLAR
LIGHTING
ADR
LINEAR
ACCELERAT
OR
NATIONA
L LAB.
(CLEAN
ROOM)
CEMONC
WATER
WITH PUMP
CEMONC
IMPROVED
SANITATION
POOLED
FUND 15 103 53 1 1 193 263
TOTAL 15 103 53 1 1 193 263

21
3.5.1 INFRASTRUCTURE DEVELOPMENT BY SOURCE OF FUND (JANUARY, 2015 TO DECEMBER, 2015)
FUNDING
HANDED OVER TO END USER
RH ADR
CEMONC
SOLAR
LIGHTING
LINEAR
ACCELERATOR
NATIONAL LAB.
(CLEAN ROOM)
CEMONC
WATER WITH
PUMP
CEMONC
IMPROVED
SANITATION
POOLED
FUND 15 53 103 1 1 193 263
AFD
BTC
TOTAL 15 53 103 1 1 193 263
3.5.2 INFRASTRUCTURE DEVELOPMENT BY TYPE OF FACILITY
NOTE:
* - Linear Accelerator for Khmer-Soviet Hospital
** - Upgrade Clean Room at National Laboratory in Phnom Penh
3.5.3 INFRASTRUCTURE DEVELOPMENT BY PROVINCE
PROVINCE
HANDED OVER TO END USER
RH
CEMONC
SOLAR
LIGHTING
ADR LINEAR
ACCELERATOR
NATIONAL LAB.
(CLEAN ROOM)
CEMONC
WATER WITH
PUMP
CEMONC
IMPROVED
SANITATION
Banteay
Meanchey - 6 - - - 16 21
FACILITY TYPE HANDED OVER TO
END USER
UNDER
CONSTRUCTION PLANNING STAGE
RH 15 - -
Linear Accelerator 1 - -
National Lab. (Clean Room) 1 - -
ADR 53 - -
CEmONC (Solar Panel for Lighting) 103 -
CEmONC (Water supply with pump) 193 - -
CEmONC (Improved Sanitation) 263 -
TOTAL 629 - -

22
PROVINCE
HANDED OVER TO END USER
RH
CEMONC
SOLAR
LIGHTING
ADR LINEAR
ACCELERATOR
NATIONAL LAB.
(CLEAN ROOM)
CEMONC
WATER WITH
PUMP
CEMONC
IMPROVED
SANITATION
Battambang 2 3 - - - 13 19
Kampot 2 5 1 - - 10 13
Kandal - 3 4 - - 6 14
Kep - - 1 - - 1 2
Kg Cham 1 13 6 - - 13 24
Kg Chhnang 1 11 - - - 7 14
Kg Speu 1 4 5 - - 11 17
Kg Thom 1 6 3 - - 11 10
Koh Kong - - - - - - -
Kratie 1 4 1 - - 4 5
Mondulkiri - 3 2 - - 1 2
Phnom Penh - - 4 1 1 - -
Preah Vihear - 1 - - - 9 9
Prey Veng 3 19 4 - - 22 27
Pursath 1 - - - - 4 8
Rattanakiri 1 3 1 - - 4 4
Siem Reap - 6 - - - 11 15
Sihanouk - - 2 - - - -
Stung Treng - - - - - 1 1
Svay Rieng - 5 6 - - 14 15
Takeo - 10 - - 18 23
Tbong Khmum - 6 3 14 16
Uddar
Meanchey 1 5 - - - 3 4
TOTAL 15 103 53 1 1 193 263

23
3.5.4 BUDGET AND EXPENDITURES FOR INFRASTRUCTURE DEVELOPMENT, 2015
TYPE OF FACILITY CONTRACT/BUDGET IN USD EXPENDITURES IN USD STATUS
RH – 15 additional maternity buildings 2,391,665.07 USD 2,636,214.01 USD
HANDED OVER
ADR – 53 Additional Delivery rooms 1,245,710.60 USD 1,259,161.27 USD
HANDED OVER
CEmONC (Solar Panel for Lighting) 170,156.00 USD 170,156.00 USD HANDED OVER
Linear Accelerator at Khmer-Soviet RH 1,496,000.00 USD 1,496,000.00 USD HANDED OVER
National Lab. (upgrade clean room) 1,698,359.15 USD 1,812,412.10 USD HANDED OVER
CEmONC (Water supply with Pump) 779,300.00 USD 774,230.00 USD HANDED OVER
CEmONC (Improved Sanitation) 1,081,637.00 USD 1,055,040.50 USD HANDED OVER
Grand Total 8,862,827.82 USD 9,203,213.88 USD
CONSTRAINTS
Some delays occurred due to:
Delay at commencement (Contractor management)
Work stoppages due to poor quality work & material shortages (Contractor management)
Bad access road during rainy season
Lack of labor forces due to movement to neighboring countries
Design modifications: Additional and/or Extra works.

24
3.6 SOA PERFORMANCE
Please see Annex D for detailed information on SOA performance.
3.6.1 PERFORMANCE BONUS AWARDS
Province SOA Score
# of valid indicators
Distribution of individual Scores
Average Score Grade
Banteay Meanchey Poipet 83 28 A: 25 ; B:1; C:0 2.96 B
Preah Net Preah 67 24 A: 19 ; B:2; C:0 2.79 B
Battambang Battambang PRH 41 19 A: 12 ; B:1; C:0 2.16 B
Pursat Bakan 73 24 A: 22 ; B:0; C:1 3.04 A
Stung Treng Stung Treng PRH 47 18 A: 15 ; B:1; C:0 2.61 B
Stung Treng 51 19 A: 16 ; B:0; C:0 2.68 B
Kampong Cham Kampong Cham PRH 38 18 A: 11 ; B:1; C:0 2.11 B
Chamkar Leu 69 26 A:21 ; B:0; C:0 2.65 B
Choeung Prey-Batheay 77 26 A:22 ; B:2; C:1 2.96 B
Prey Chhor-Kang Meas 55 24 A:16 ; B:0; C:1 2.29 B
Tbong Khmum Memot 89 27 A:26 ; B:1; C:0 3.30 A
Ponhea Krek-Dambae 64 24 A:18 ; B:2; C:0 2.67 B
Koh Kong Koh Kong PRH 43 18 A:13 ; B:2; C:0 2.39 B
Smach Mean Chey 36 19 A: 11; B:0; C:0 1.89 C
Srae Ambel 37 24 A: 10; B:1; C:2 1.54 C
Mondulkiri Mondulkiri PRH 38 16 A:12 ; B:1; C:0 2.38 B
Sen Monorom 55 19 A:16; B:2; C:0 2.89 B
Oddar Meanchey Oddar Meanchey PRH 40 18 A:13; B:0; C:1 2.22 B
Samraong 45 22 A:14 ; B:0; C:0 2.05 B
Preah Vihear Preah Vihaer PRH 39 18 A:13 ; B:0; C:0 2.17 B
Tbeng Meanchey 57 22 A:16 ; B:3; C:0 2.59 B
Prey Veng Pearaing 72 27 A:23 ; B:0; C:0 2.67 B
Preah Sdach 68 23 A:20 ; B:1; C:0 2.96 B
Ratanakiri Ratanakiri PRH 28 15 A:8; B:2; C:0 1.87 C
Banlong 48 21 A:14 ; B:0; C:3 2.29 B
Siem Reap Siem Reap PRH 45 17 A:14 ; B:0; C:0 2.65 B
Kralanh 71 27 A:21 ; B:1; C:0 2.63 B
Siem Reap 58 21 A:18 ; B:0; C:1 2.76 B
Sot Nikum 57 28 A:16 ; B:1; C:1 2.04 B
Angkor Chhum 59 24 A:15 ; B:4; C:0 2.46 B
Takeo Takeo PRH 36 17 A:12; B:0; C:0 2.12 B
Ang Rokar 51 24 A:15 ; B:1; C:1 2.13 B
Bati 54 23 A:16 ; B:1; C:1 2.35 B
Daun Keo 50 20 A:15 ; B:1; C:0 2.50 B
Kirivong 54 25 A:15 ; B:2; C:2 2.16 B
Prey Kabass 49 24 A:14 ; B:2; C:0 2.04 B
Summary
Grade Category Number Percent
A 2 6%
B 31 86%
C 3 8%
None 0 0%
Total 36 100%
Note: SOAs assessed by URC have results included
3.6.2 QUARTERLY SOA REVIEW REPORTS
The Revised SDG Operational Manual states that quarterly review reports from the SOAs and
PHD Commissioners are required to be submitted within 15 days of the end of the quarter. This
year there has been significant improvement in the timely submittal of SOA progress report but
still delays of PHD Commissioners' reports.

25
3.6.4 SPECIFIC ISSUES REGARDING SOAS
MANAGEMENT
• No training on AOP to PRH/wards
• Low knowledge on AOP/QWP at HC level
• Tally up and data entry by HF into HMIS using ICD10 code more complicated,
internet can’t access and no electricity supply in some areas
• Lack of some medical equipment to improve service quality like X-ray machine,
laboratory and dental equipment in some RHs
• Lack of skills for data analysis at ODO/RH/HC level
• Lack of skilled staff (MW, Dr, anesthetists)
• Lack of IMCI skills training for new staff to replace retired staff, and IMCI data sheet
to record IMCI information
• Drug/consumables supply from CMS insufficient such as Ferrous sulfate, Folic acid,
drugs for mental/diabetes diseases, gloves, but some items surplus to demand
• SDG disbursement late in the 2nd semester due to waiting for financing approval,
and staff incentive less due to increased number of staff
• HEF disbursement late to providers in the 2nd semester, the same reasons as SDG
delay
• PBB changing procedure, unclear guidance at the beginning but now adopted
• Some indicators have high targets
• Some medical equipment maintenance with high cost difficult to comply to
quotation procedure at provincial level (few suppliers) and skills of medical
equipment maintenance unavailable
SERVICE PROVISION
IMCI not applied appropriately
Lack of staff to provide service

26
3.6.5 TRACKING OF PBB BUDGET FOR SOAS
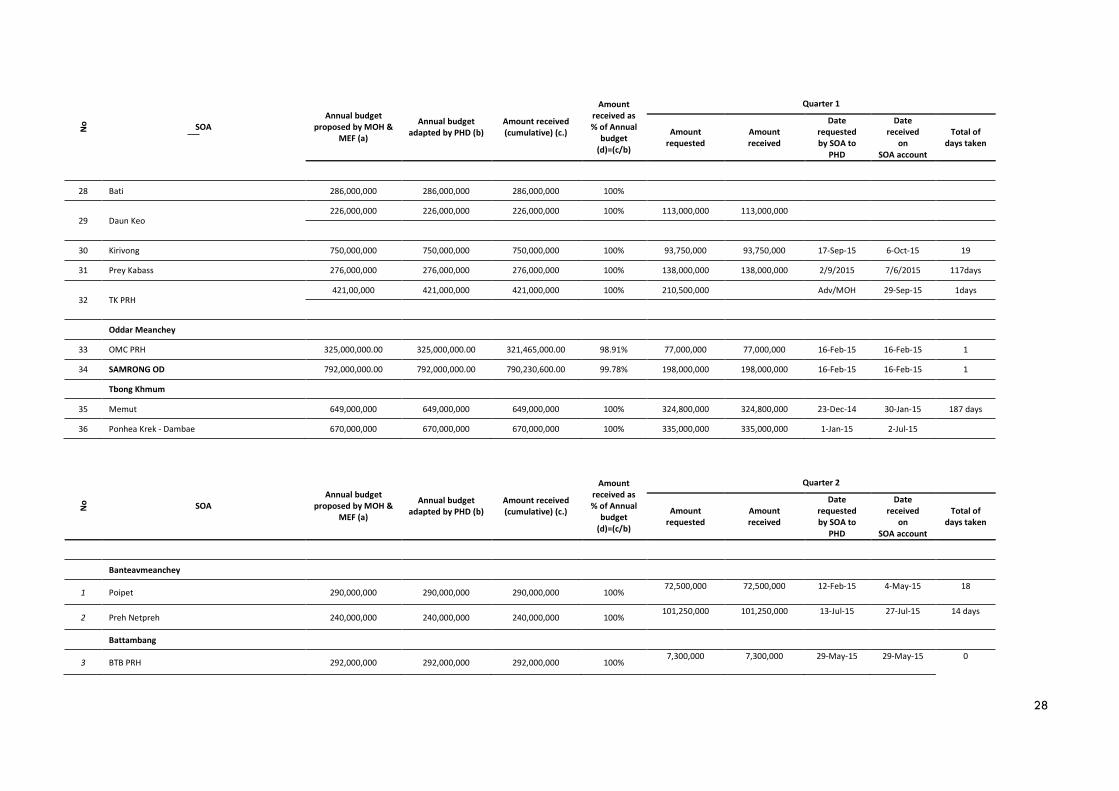
QUARTER 1 - 4, 2015
No
SOA Annual budget
proposed by MOH & MEF (a)
Annual budget adapted by PHD (b)
Amount received (cumulative) (c.)
Amount received as % of Annual
budget (d)=(c/b)
Quarter 1
Amount requested
Amount received
Date requested by SOA to
PHD
Date received
on SOA account
Total of days taken
Banteavmeanchey
1 Poipet 290,000,000 290,000,000 290,000,000 100% 72,500,000 72,500,000 12-Feb-15 12-Feb-15 1 day
2 Preh Netpreh 240,000,000 240,000,000 240,000,000 100% 60,000,000 18,750,000 10-Feb-15 4-May-15 83 days
Battambang
3 BTB PRH 292,000,000 292,000,000 292,000,000 100% 7,300,000 7,300,000 25-Feb-15 25-Feb-15 0
Kampong Cham Province 4,794,200,000.00 3,405,000,000.00 3,400,561,360.00 99.87% 851,250,000.00 851,250,000.00
4 Kg Cham PRH 2,174,000,000.00 1,928,000,000.00 1,923,561,360.00 99.77% 482,000,000.00 482,000,000.00 21-Jan-2015 13-Mar-2015 51
5 Prey Chhor-Kang Meas 787,600,000.00 422,000,000.00 422,000,000.00 100.00% 105,500,000.00 105,500,000.00 15-Jan-2015 13-Mar-2015 57
6 Choeung Prey 648,500,000.00 335,800,000.00 335,800,000.00 100.00% 83,950,000.00 83,950,000.00 16-Jan-2015 13-Mar-2015 56
Batheay 601,200,000.00 311,000,000.00 311,000,000.00 100.00% 77,750,000.00 77,750,000.00 19-Jan-2015 13-Mar-2015 53
7 Chamkar Leu 582,900,000.00 408,200,000.00 408,200,000.00 100.00% 102,050,000.00 102,050,000.00 20-Jan-2015 13-Mar-2015 52
Koh Kong
8 Smach Mean Chey 620,000,000 620,000,000 620,000,000 100% 155,000,000 155,000,000 20-Jan-15 31-Mar-15 70 days
9 Srae Ambel 1,079,000,000 1,079,000,000 1,079,000,000 100% 269,750,000 185,000,000 27-Mar-15 31-Mar-15 4 days
10 Koh Kong PRH 290,000,000 290,000,000 290,000,000 100% 72,500,000 72,500,000 5-Mar-15 31-Mar-15 26
Mondul Kiri
11 Sen Monorom 455,000,000 465,000,000 455,000,000 97% 116,250,000 25,125,000 5-Feb-15 3-May-15 87days
12 Mondul Kiri PRH 215,000,000.00 215,000,000.00 215,000,000.00 100.00% 50,250,000.00 25,125,000.00 5-Feb-2015 3-Mar-2015 26
Preah Vihear
13 Tbeng Meanchey 850,000,000 850,000,000 850,000,000 100% 245,000,000 180,000,000 Adv/MOH 3-Jul-15 3 days
14 16 Makara PRH 350,000,000 350,000,000 350,000,000 100% 175,000,000 175000000 Adv/MOH 3-Jul-15 3 days

27
No
SOA Annual budget
proposed by MOH & MEF (a)
Annual budget adapted by PHD (b)
Amount received (cumulative) (c.)
Amount received as % of Annual
budget (d)=(c/b)
Quarter 1
Amount requested
Amount received
Date requested by SOA to
PHD
Date received
on SOA account
Total of days taken
Prey Veng
15 Pearaing 2,090,000,000 2,090,000,000 2,090,000,000 100% 350,000,000 350,000,000 17-Mar-15 20-Mar-15 3days
Preah Sdach
1,120,000,000 1,120,000,000 1,120,000,000 100% 150,000,000 15,000,000 17-Mar-15 20-Mar-15 3days
16
Pursat
17 Bakan
664,300,000 664,300,000 664,300,000 100% 150,000,000 150,000,000 20-Mar-15 26-Mar-15 6
Ratanakiri
18 Banlong 934,800,000 934,800,000 934,800,000 100% 233,700,000 233,700,000 10/02/015 10/02/015 1
19 Ratanakiri PRH 565,200,000 565,200,000 565,200,000 100% 141,300,000 141,300,000 6-Feb-15 10-Feb-15 4 days
Siemreap
20 Kralanh 541,000,000 460,000,000 460,000,000 100% 40,000,000 40,000,000 13-Mar-15 18-Mar-15 7days
21 Siem Reap 740,000,000 740,000,000 740,000,000 100% 64,000,000 64,000,000 16-Mar-15 17-Mar-15 1day
81,000,000 81,000,000 11-Jun-15 12-Jun-15 1 day
22 Sot Nikum 720,000,000 720,000,000 720,000,000 100% 63,000,000 63,000,000 16-Mar-15 16-Mar-15 1
89,000,000 89,000,000 11-Jun-15 11-Jun-15 1
23 Angkorchum 680,000,000 680,000,000 680,000,000 100% 59,000,000 59,000,000 16-Mar-15 17-Mar-15 1days
80,000,000 80,000,000 3-Jun-15 5-Jun-15 2 days
24 Siemreap PRH 1,500,000,000 1,500,000,000 1,500,000,000 100% 375,000,000 124,000,000 17-Mar-15 17-Mar-15 1
Stung Treng
25 Steung Treng OD 871,000,000 871,000,000 871,000,000 100%
26 STR PRH 469,000,000.00 469,000,000.00 469,000,000.00 100.00% 117,250,000.00 117,250,000.00 28-Jan-2015 29-Mar-2015 1
Takeo
27 Ang Rokar 500,000,000 500,000,000 500,000,000 100% 125,000,000 125,000,000 6-Jan-15 1-Jul-15 174
28
No
SOA Annual budget
proposed by MOH & MEF (a)
Annual budget adapted by PHD (b)
Amount received (cumulative) (c.)
Amount received as % of Annual
budget (d)=(c/b)
Quarter 1
Amount requested
Amount received
Date requested by SOA to
PHD
Date received
on SOA account
Total of days taken
28 Bati 286,000,000 286,000,000 286,000,000 100%
29 Daun Keo 226,000,000 226,000,000 226,000,000 100% 113,000,000 113,000,000
30 Kirivong 750,000,000 750,000,000 750,000,000 100% 93,750,000 93,750,000 17-Sep-15 6-Oct-15 19
31 Prey Kabass 276,000,000 276,000,000 276,000,000 100% 138,000,000 138,000,000 2/9/2015 7/6/2015 117days
32 TK PRH 421,00,000 421,000,000 421,000,000 100% 210,500,000
Adv/MOH 29-Sep-15 1days
Oddar Meanchey
33 OMC PRH 325,000,000.00 325,000,000.00 321,465,000.00 98.91% 77,000,000 77,000,000 16-Feb-15 16-Feb-15 1
34 SAMRONG OD 792,000,000.00 792,000,000.00 790,230,600.00 99.78% 198,000,000 198,000,000 16-Feb-15 16-Feb-15 1
Tbong Khmum
35 Memut 649,000,000 649,000,000 649,000,000 100% 324,800,000 324,800,000 23-Dec-14 30-Jan-15 187 days
36 Ponhea Krek - Dambae 670,000,000 670,000,000 670,000,000 100% 335,000,000 335,000,000 1-Jan-15 2-Jul-15
No
SOA Annual budget
proposed by MOH & MEF (a)
Annual budget adapted by PHD (b)
Amount received (cumulative) (c.)
Amount received as % of Annual
budget (d)=(c/b)
Quarter 2
Amount requested
Amount received
Date requested by SOA to
PHD
Date received
on SOA account
Total of days taken
Banteavmeanchey
1 Poipet 290,000,000 290,000,000 290,000,000 100% 72,500,000 72,500,000 12-Feb-15 4-May-15 18
2 Preh Netpreh 240,000,000 240,000,000 240,000,000 100% 101,250,000 101,250,000 13-Jul-15 27-Jul-15 14 days
Battambang
3 BTB PRH 292,000,000 292,000,000 292,000,000 100% 7,300,000 7,300,000 29-May-15 29-May-15 0

29
No
SOA Annual budget
proposed by MOH & MEF (a)
Annual budget adapted by PHD (b)
Amount received (cumulative) (c.)
Amount received as % of Annual
budget (d)=(c/b)
Quarter 2
Amount requested
Amount received
Date requested by SOA to
PHD
Date received
on SOA account
Total of days taken
Kampong Cham Province 4,794,200,000.00 3,405,000,000.00 3,400,561,360.00 99.87% 851,250,000.00 851,211,120.00
4 Kg Cham PRH 2,174,000,000.00 1,928,000,000.00 1,923,561,360.00 99.77% 482,000,000.00 481,961,120.00 26-Mar-2015 8-Jun-2015 74
5 Prey Chhor-Kang Meas 787,600,000.00 422,000,000.00 422,000,000.00 100.00% 105,500,000.00 105,500,000.00 25-Mar-2015 8-Jun-2015 75
6
Choeung Prey 648,500,000.00 335,800,000.00 335,800,000.00 100.00% 83,950,000.00 83,950,000.00 27-Mar-2015 8-Jun-2015 73
Batheay 601,200,000.00 311,000,000.00 311,000,000.00 100.00% 77,750,000.00 77,750,000.00 27-Mar-2015 8-Jun-2015 73
7 Chamkar Leu 582,900,000.00 408,200,000.00 408,200,000.00 100.00% 102,050,000.00 102,050,000.00 27-Mar-2015 8-Jun-2015 73
Koh Kong
8 Smach Mean Chey 620,000,000 620,000,000 620,000,000 100% 155,000,000 155,000,000 27-May-15 6-Jul-15 40days
9 Srae Ambel 1,079,000,000 1,079,000,000 1,079,000,000 100% 354,500,000 354,500,000 13-May-15 6-Jul-15 54days
10 Koh Kong PRH 290,000,000 290,000,000 290,000,000 100% 72,500,000 72,500,000 9-Apr-15 6-Jul-15 88days
Mondul Kiri
11 Sen Monorom 455,000,000 465,000,000 455,000,000 97% 116,250,000 232,500,000 2-Mar-15 3-Jul-15 123 days
12 Mondul Kiri PRH 215,000,000.00 215,000,000.00 215,000,000.00 100.00% 50,250,000.00 25,125,000.00 2-Mar-2015 3-Jul-2015 123
Preah Vihear
13 Tbeng Meanchey 850,000,000 850,000,000 850,000,000 100%
80,000,000 80,000,000
3-Jul-15
14 16 Makara PRH 350,000,000 350,000,000 350,000,000 100%
35,000,000 35,000,000
3-Jul-15
Prey Veng
15 Pearaing 2,090,000,000 2,090,000,000 2,090,000,000 100%
Preah Sdach
1,120,000,000 1,120,000,000 1,120,000,000 100% 410,000,000 410,000,000 25-Jun-15 30-Jun-15 5days
16
Pursat

30
No
SOA Annual budget
proposed by MOH & MEF (a)
Annual budget adapted by PHD (b)
Amount received (cumulative) (c.)
Amount received as % of Annual
budget (d)=(c/b)
Quarter 2
Amount requested
Amount received
Date requested by SOA to
PHD
Date received
on SOA account
Total of days taken
17 Bakan
664,300,000 664,300,000 664,300,000 100% 182,150,000 182,150,000 1-Jul-15 10-Jul-15 9
Ratanakiri
18 Banlong 934,800,000 934,800,000 934,800,000 100% 233,700,000 233,700,000 10/07/015 10/07/015 1
19 Ratanakiri PRH 565,200,000 565,200,000 565,200,000 100% 141,300,000 141,300,000 25-May-15 10-Jul-15 45 days
Siemreap
20 Kralanh 541,000,000 460,000,000 460,000,000 100%
21 Siem Reap 740,000,000 740,000,000 740,000,000 100%
22 Sot Nikum 720,000,000 720,000,000 720,000,000 100%
208,000,000 208,000,000 13-Jul-15 13-Jul-15 1
23 Angkorchum 680,000,000 680,000,000 680,000,000 100%
201,000,000 201,000,000 13-Jul-15 14-Jul-15 2days
24
Siemreap PRH 1,500,000,000 1,500,000,000 1,500,000,000 100% 239,000,000 239,000,000 3-Jun-15 3-Jun-15 1
375,000,000 375,000,000 14-Jul-15 14-Jul-15 1
Stung Treng
25 Steung Treng OD 871,000,000 871,000,000 871,000,000 100%
26 STR PRH 469,000,000.00 469,000,000.00 469,000,000.00 100.00% 117,250,000.00 117,250,000.00 2-Jul-2015 3-Jul-2015 1
Takeo
27 Ang Rokar 500,000,000 500,000,000 500,000,000 100%
125,000,000 125,000,000 5-May-15 1-Jul-15 55
28 Bati 286,000,000 286,000,000 286,000,000 100% 143,000,000 143,000,000 Adv by MOH 6-Jul-15
29 Daun Keo 226,000,000 226,000,000 226,000,000 100%

31
No
SOA Annual budget
proposed by MOH & MEF (a)
Annual budget adapted by PHD (b)
Amount received (cumulative) (c.)
Amount received as % of Annual
budget (d)=(c/b)
Quarter 2
Amount requested
Amount received
Date requested by SOA to
PHD
Date received
on SOA account
Total of days taken
30 Kirivong 750,000,000 750,000,000 750,000,000 100% 93,750,000 93,750,000 22-Oct-15 18-Nov-15 26days
31 Prey Kabass 276,000,000 276,000,000 276,000,000 100% 34,500,000 34,500,000 10/2/2015 11/2/2015 30days
32 TK PRH 421,00,000 421,000,000 421,000,000 100%
Oddar Meanchey
33 OMC PRH 325,000,000.00 325,000,000.00 321,465,000.00 98.91% 85,350,000 85,350,000 18-May-14 25-May-14 7
34 SAMRONG OD 792,000,000.00 792,000,000.00 790,230,600.00 99.78% 197,954,000 197,954,000 19-May-14 25-May-14 8
Tbong Khmum
35 Memut 649,000,000 649,000,000 649,000,000 100%
36 Ponhea Krek - Dambae 670,000,000 670,000,000 670,000,000 100%
No
SOA Annual budget
proposed by MOH & MEF (a)
Annual budget adapted by PHD (b)
Amount received (cumulative) (c.)
Amount received as % of Annual
budget (d)=(c/b)
Quarter 3
Amount requested
Amount received
Date requested by SOA to
PHD
Date received
on SOA account
Total of days taken
Banteavmeanchey
1 Poipet 290,000,000 290,000,000 290,000,000 100% 72,500,000 72,500,000 9-Dec-15 11-Dec-15 3 days
2 Preh Netpreh 240,000,000 240,000,000 240,000,000 100% 60,000,000 60,000,000 21-Dec-15 25-Dec-15 5 days
Battambang
3 BTB PRH 292,000,000 292,000,000 292,000,000 100% 7,300,000 7,300,000 20-Jul-15 20-Jul-15 1 day
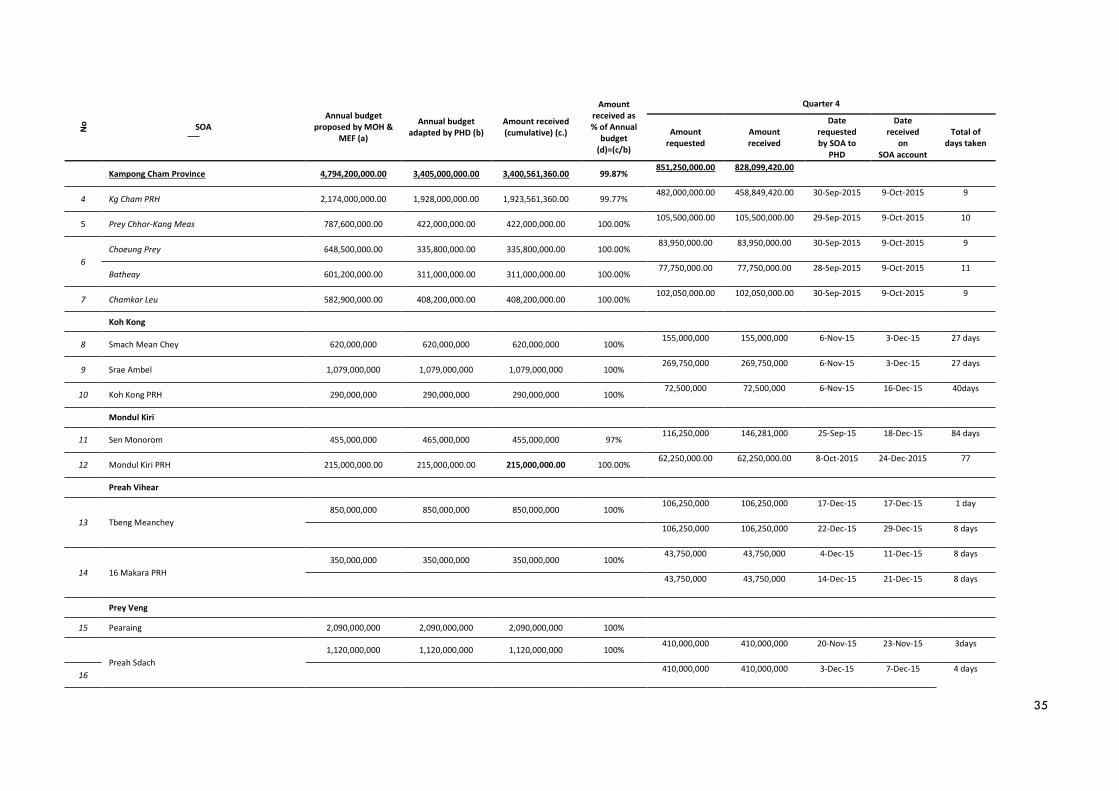
Kampong Cham Province 4,794,200,000.00 3,405,000,000.00 3,400,561,360.00 99.87% 851,250,000.00 870,000,820.00
4 Kg Cham PRH 2,174,000,000.00 1,928,000,000.00 1,923,561,360.00 99.77% 482,000,000.00 500,750,820.00 2-Jul-2015 27-Jul-2015 25

32
No
SOA Annual budget
proposed by MOH & MEF (a)
Annual budget adapted by PHD (b)
Amount received (cumulative) (c.)
Amount received as % of Annual
budget (d)=(c/b)
Quarter 3
Amount requested
Amount received
Date requested by SOA to
PHD
Date received
on SOA account
Total of days taken
5 Prey Chhor-Kang Meas 787,600,000.00 422,000,000.00 422,000,000.00 100.00% 105,500,000.00 105,500,000.00 30-Jun-2015 27-Jul-2015 27
6
Choeung Prey 648,500,000.00 335,800,000.00 335,800,000.00 100.00% 83,950,000.00 83,950,000.00 1-Jul-2015 27-Jul-2015 26
Batheay 601,200,000.00 311,000,000.00 311,000,000.00 100.00% 77,750,000.00 77,750,000.00 1-Jul-2015 27-Jul-2015 26
7 Chamkar Leu 582,900,000.00 408,200,000.00 408,200,000.00 100.00% 102,050,000.00 102,050,000.00 2-Jul-2015 27-Jul-2015 25
Koh Kong
8 Smach Mean Chey 620,000,000 620,000,000 620,000,000 100% 155,000,000 155,000,000 20-Aug-15 8-Oct-15 49 days
9 Srae Ambel 1,079,000,000 1,079,000,000 1,079,000,000 100% 269,750,000 269,750,000 8-Sep-15 8-Oct-15 30days
10 Koh Kong PRH 290,000,000 290,000,000 290,000,000 100% 72,500,000 72,500,000 4-Aug-15 8-Oct-15 65days
Mondul Kiri
11 Sen Monorom 455,000,000 465,000,000 455,000,000 97% 116,250,000 49,343,800 2-Jun-15 18-Sep-15 108days
12 Mondul Kiri PRH 215,000,000.00 215,000,000.00 215,000,000.00 100.00% 50,250,000.00 102,500,000.00 2-Jun-2015 18-Sep-2015 108
Preah Vihear
13 Tbeng Meanchey
850,000,000 850,000,000 850,000,000 100% 106,250,000 106,250,000 22-Oct-15 22-Oct-15 1 day
106,250,000 106,250,000 3-Dec-15 11-Dec-15 9days
14 16 Makara PRH
350,000,000 350,000,000 350,000,000 100% 43,750,000 43,750,000 28-Sep-15 22-Oct-15 24 days
43,750,000 43,750,000 5-Nov-15 30-Nov-15 25 days
Prey Veng
15 Pearaing 2,090,000,000 2,090,000,000 2,090,000,000 100%
Preah Sdach
1,120,000,000 1,120,000,000 1,120,000,000 100% 140,000,000 140,000,000 5-Oct-15 7-Oct-15 2 days
16
140,000,000 140,000,000 3-Nov-15 5-Nov-15 2 days
Pursat
17 Bakan 664,300,000 664,300,000 664,300,000 100% 166,075,000 166,075,000 10-Sep-15 15-Sep-15 5

33
No
SOA Annual budget
proposed by MOH & MEF (a)
Annual budget adapted by PHD (b)
Amount received (cumulative) (c.)
Amount received as % of Annual
budget (d)=(c/b)
Quarter 3
Amount requested
Amount received
Date requested by SOA to
PHD
Date received
on SOA account
Total of days taken
Ratanakiri
18 Banlong 934,800,000 934,800,000 934,800,000 100% 233,700,000 233,700,000 07/09/015 10/09/015 02 days
19 Ratanakiri PRH 565,200,000 565,200,000 565,200,000 100% 141,300,000 141,300,000 13-Jul-15 10-Sep-15 57 days
Siemreap
20 Kralanh
541,000,000 460,000,000 460,000,000 100% 57,500,000 57,500,000 8-Oct-15 27-Oct-15 19days
57,500,000 57,500,000 4-Nov-15 17-Nov-15 13 days
21 Siem Reap
740,000,000 740,000,000 740,000,000 100% 92,500,000 92,500,000 7-Oct-15 8-Oct-15 1 day
92,000,000 92,500,000 28-Oct-15 30-Oct-15 2 days
22 Sot Nikum
720,000,000 720,000,000 720,000,000 100% 90,000,000 90,000,000 7-Oct-15 7-Oct-15 1
90,000,000 90,000,000 28-Oct-15 28-Oct-15 1
23 Angkorchum
680,000,000 680,000,000 680,000,000 100% 85,000,000 85,000,000 12-Oct-15 16-Oct-15 4days
85,000,000 85,000,000 20-Oct-15 2-Nov-15 13 days
24 Siemreap PRH 1,500,000,000 1,500,000,000 1,500,000,000 100%
375,000,000 375,000,000 16-Sep-15 16-Sep-15 1
Stung Treng
25 Steung Treng OD 871,000,000 871,000,000 871,000,000 100% 217,750,000 217,750,000 28-Jan-15 30-Jan-15 2
26 STR PRH 469,000,000.00 469,000,000.00 469,000,000.00 100.00% 117,250,000.00 117,250,000.00 30-Sep-2015 1-Oct-2015 1
Takeo
27 Ang Rokar
500,000,000 500,000,000 500,000,000 100% 62,500,000 62,500,000 30-Jul-15 2-Oct-15 59
62,500,000 62,500,000 7-Oct-15 19-Nov-15 41
28 Bati 286,000,000 286,000,000 286,000,000 100%

34
No
SOA Annual budget
proposed by MOH & MEF (a)
Annual budget adapted by PHD (b)
Amount received (cumulative) (c.)
Amount received as % of Annual
budget (d)=(c/b)
Quarter 3
Amount requested
Amount received
Date requested by SOA to
PHD
Date received
on SOA account
Total of days taken
29 Daun Keo
226,000,000 226,000,000 226,000,000 100% 28,250,000 28,250,000 2-Sep-15 29-Sep-15 27 days
28,250,000 28,250,000
30 Kirivong 750,000,000 750,000,000 750,000,000 100% 93,750,000 93,750,000 22-Nov-15 17-Dec-15 10days
31 Prey Kabass 276,000,000 276,000,000 276,000,000 100% 138,000,000 138,000,000 17-Sep-15 6-Oct-15 19days
32 TK PRH
421,00,000 421,000,000 421,000,000 100% 52,625,000 52,625,000 23/Sep/15 7/Oct/15 14 days
52,625,000 52,625,000 30/Oct/15 20/Nov/15 20 days
Oddar Meanchey
33 OMC PRH 325,000,000.00 325,000,000.00 321,465,000.00 98.91% 72,185,000 72,185,000 21-Aug-15 21-Aug-15 1
34 SAMRONG OD 792,000,000.00 792,000,000.00 790,230,600.00 99.78% 196,424,700 196,424,700 31-Aug-15 31-Aug-15 1
Tbong Khmum
35 Memut 649,000,000 649,000,000 649,000,000 100% 324,800,000 324,800,000 25-Jun-15
36 Ponhea Krek - Dambae 670,000,000 670,000,000 670,000,000 100% 335,000,000 335,000,000 25-Jun-15
No
SOA Annual budget
proposed by MOH & MEF (a)
Annual budget adapted by PHD (b)
Amount received (cumulative) (c.)
Amount received as % of Annual
budget (d)=(c/b)
Quarter 4
Amount requested
Amount received
Date requested by SOA to
PHD
Date received
on SOA account
Total of days taken
Banteavmeanchey
1 Poipet 290,000,000 290,000,000 290,000,000 100% 72,500,000 72,500,000 9-Dec-15 11-Dec-15 3 days
2 Preh Netpreh 240,000,000 240,000,000 240,000,000 100% 60,000,000 60,000,000 21-Dec-15 25-Dec-15 5days
Battambang
3 BTB PRH 292,000,000 292,000,000 292,000,000 100% 7,300,000 7,300,00 2-Oct-15 2-Oct-15 1 day
35
No
SOA Annual budget
proposed by MOH & MEF (a)
Annual budget adapted by PHD (b)
Amount received (cumulative) (c.)
Amount received as % of Annual
budget (d)=(c/b)
Quarter 4
Amount requested
Amount received
Date requested by SOA to
PHD
Date received
on SOA account
Total of days taken
Kampong Cham Province 4,794,200,000.00 3,405,000,000.00 3,400,561,360.00 99.87% 851,250,000.00 828,099,420.00
4 Kg Cham PRH 2,174,000,000.00 1,928,000,000.00 1,923,561,360.00 99.77% 482,000,000.00 458,849,420.00 30-Sep-2015 9-Oct-2015 9
5 Prey Chhor-Kang Meas 787,600,000.00 422,000,000.00 422,000,000.00 100.00% 105,500,000.00 105,500,000.00 29-Sep-2015 9-Oct-2015 10
6
Choeung Prey 648,500,000.00 335,800,000.00 335,800,000.00 100.00% 83,950,000.00 83,950,000.00 30-Sep-2015 9-Oct-2015 9
Batheay 601,200,000.00 311,000,000.00 311,000,000.00 100.00% 77,750,000.00 77,750,000.00 28-Sep-2015 9-Oct-2015 11
7 Chamkar Leu 582,900,000.00 408,200,000.00 408,200,000.00 100.00% 102,050,000.00 102,050,000.00 30-Sep-2015 9-Oct-2015 9
Koh Kong
8 Smach Mean Chey 620,000,000 620,000,000 620,000,000 100% 155,000,000 155,000,000 6-Nov-15 3-Dec-15 27 days
9 Srae Ambel 1,079,000,000 1,079,000,000 1,079,000,000 100% 269,750,000 269,750,000 6-Nov-15 3-Dec-15 27 days
10 Koh Kong PRH 290,000,000 290,000,000 290,000,000 100% 72,500,000 72,500,000 6-Nov-15 16-Dec-15 40days
Mondul Kiri
11 Sen Monorom 455,000,000 465,000,000 455,000,000 97% 116,250,000 146,281,000 25-Sep-15 18-Dec-15 84 days
12 Mondul Kiri PRH 215,000,000.00 215,000,000.00 215,000,000.00 100.00% 62,250,000.00 62,250,000.00 8-Oct-2015 24-Dec-2015 77
Preah Vihear
13 Tbeng Meanchey
850,000,000 850,000,000 850,000,000 100% 106,250,000 106,250,000 17-Dec-15 17-Dec-15 1 day
106,250,000 106,250,000 22-Dec-15 29-Dec-15 8 days
14 16 Makara PRH
350,000,000 350,000,000 350,000,000 100% 43,750,000 43,750,000 4-Dec-15 11-Dec-15 8 days
43,750,000 43,750,000 14-Dec-15 21-Dec-15 8 days
Prey Veng
15 Pearaing 2,090,000,000 2,090,000,000 2,090,000,000 100%
Preah Sdach
1,120,000,000 1,120,000,000 1,120,000,000 100% 410,000,000 410,000,000 20-Nov-15 23-Nov-15 3days
16
410,000,000 410,000,000 3-Dec-15 7-Dec-15 4 days

36
No
SOA Annual budget
proposed by MOH & MEF (a)
Annual budget adapted by PHD (b)
Amount received (cumulative) (c.)
Amount received as % of Annual
budget (d)=(c/b)
Quarter 4
Amount requested
Amount received
Date requested by SOA to
PHD
Date received
on SOA account
Total of days taken
Pursat
17
Bakan
664,300,000 664,300,000 664,300,000 100% 83,037,500 83,037,500 21-Oct-15 22-Oct-15 1
83,037,500 83,037,500 20-Nov-15 20-Nov-15 0
Ratanakiri
18 Banlong 934,800,000 934,800,000 934,800,000 100% 233,700,000 233,700,000 16/11/015 18/11/015 02 days
19 Ratanakiri PRH 565,200,000 565,200,000 565,200,000 100% 141,300,000 141,300,000 14-Sep-15 18-Nov-15 64 days
Siemreap
20 Kralanh
541,000,000 460,000,000 460,000,000 100% 57,500,000 57,500,000 19-Nov-15 7-Dec-15 18days
57,500,000 57,500,000 14-Dec-15 23-Dec-15 9 days
21 Siem Reap
740,000,000 740,000,000 740,000,000 100% 92,000,000 92,000,000 19-Nov-15 19-Nov-15 1 day
92,000,000 92,000,000 9-Dec-15 9-Dec-15 1 day
22 Sot Nikum
720,000,000 720,000,000 720,000,000 100% 90,000,000 90,000,000 16-Nov-15 16-Nov-15 1
90,000,000 90,000,000 14-Dec-15 14-Dec-15 1
23 Angkorchum
680,000,000 680,000,000 680,000,000 100% 85,000,000 85,000,000 13-Nov-15 20-=Nov-15 7 days
85,000,000 85,000,000 23-Nov-15 7-Dec-15 14 days
24
Siemreap PRH 1,500,000,000 1,500,000,000 1,500,000,000 100% 187,500,000 187,500,000 13-Nov-15 13-Nov-15 1
187,500,000 187,000,000 4-Dec-15 4-Dec-15 1
Stung Treng
25 Steung Treng OD 871,000,000 871,000,000 871,000,000 100% 653,250,000 653,250,000 2-Dec-15 3-Dec-15 1
26 STR PRH 469,000,000.00 469,000,000.00 469,000,000.00 100.00% 117,250,000.00 117,250,000.00 3-Dec-2015 4-Dec-2015 1
Takeo
27 Ang Rokar 500,000,000 500,000,000 500,000,000 100% 62,500,000 62,500,000 27-Nov-15 17-Dec-15 19

37
No
SOA Annual budget
proposed by MOH & MEF (a)
Annual budget adapted by PHD (b)
Amount received (cumulative) (c.)
Amount received as % of Annual
budget (d)=(c/b)
Quarter 4
Amount requested
Amount received
Date requested by SOA to
PHD
Date received
on SOA account
Total of days taken
62,500,000 62,500,000 24-Dec-15 29-Dec-15 5
28 Bati 286,000,000 286,000,000 286,000,000 100% 143,000,000 143,000,000 17-Sep-15 6-Oct-15 19days
29 Daun Keo
226,000,000 226,000,000 226,000,000 100% 28,250,000 28,250,000 1-Dec-15 16-Dec-15 15days
28,250,000 28,250,000 21-Dec-15 30-Dec-15 9 days
30 Kirivong 750,000,000 750,000,000 750,000,000 100% 93,750,000 93,750,000 22-Dec-15 29-Dec-15 8days
31 Prey Kabass 276,000,000 276,000,000 276,000,000 100%
32 TK PRH
421,00,000 421,000,000 421,000,000 100% 52,625,000 52,625,000 3/Dec/15 21/Dec/15 18 days
52,625,000 52,625,000 22/Dec/15 29/Dec/15 07days
Oddar Meanchey
33 OMC PRH 325,000,000.00 325,000,000.00 321,465,000.00 98.91% 86,930,300 86,930,300 22-Sep-15 25-Sep-15 3
34 SAMRONG OD 792,000,000.00 792,000,000.00 790,230,600.00 99.78% 197,851,900 197,851,900 23-Sep-15 25-Sep-15 3
Tbong Khmum
35 Memut 649,000,000 649,000,000 649,000,000 100%
9-Dec-15 167days
36 Ponhea Krek - Dambae 670,000,000 670,000,000 670,000,000 100%
9-Dec-15 167days

38
SDMG TEAM DATE OF FIRST VISIT PLACE VISITED FINDINGS AND ISSUES RECOMMENDATIONS
Team 1 Head: Dr Sok Kanha
2-5 Jun 2015 ‧ PHD Banteay Meanchey
‧SOA OD Preah Net Preah, Chhnour Meanchey HC
‧SOA OD Poi Pet, Nimith HC
‧PHD did not conduct SOA annual performance review due to lack of budget
‧PHD conducted supervision irregularly due to lack of grants
‧PHD has plan to improve staff capacity but no budget
‧PHD received PBB late, 30% in first round
‧SOA OD Preah Net Preah: (i) lacking of admin and accountant staff at
ODO, lack of SMW in 2 HCs Lack of MD at RH, (ii) unclear guidance for SDG after Sub-decree 216 issued(iii) no self-assessments of OCM and QOC (iv) PMAS appraisal only conducted to HC chief and RH chief
‧SOA OD Poi Pet :(i) Lack of SMW in 2 HCs, MD at RH (ii) no clear
guidance for SDG after Sub-decree 216 issued(iii) PMAS appraisal only conducted to HC chief and RH chief
- For PHD should allocate staff to RH and improve Poipet RH capacity - For SOA OD Poi Pet : (i) improve RH's QOC to people to avoid them seek health care in Thailand care (ii) PMAS appraisal should conducted fully - For SOA OD Preah Net Preah : (i) should strengthen Operational plan and quarterly review (ii) PMAS appraisal should conducted fully if necessary asking for support from DP/MOH or HSSP2
Team 1 Head: Dr Sok Kanha
7-9 May 2015 ‧SOA Battambang PRH ‧ SOA has no annual and quarterly work plan by services
‧ SOA not applied PMAS yet
‧SOA has no update inventories
‧ SOA should prepare annual and quarterly work plan by services
‧SOA should update inventories comply to MOH guidelines
‧SOA should apply PMAS appraisal
3.6.6 SERVICE DELIVERY MONITORING GROUP REPORT

39
SDMG TEAM DATE OF FIRST VISIT PLACE VISITED FINDINGS AND ISSUES RECOMMENDATIONS
Team 1 Head: Dr Sok Kanha
26-29 May 2015 ‧PHD Mondulkiri
‧SOA Sen Monorom, O'raing, Dakdam HCs
‧SOA PRH
‧PHD PBB for Q1 receive only 30% other 70% for direct payment no guidance from MOH yet -For SOA Sen Monorom OD:
‧O'Raing HC report wrong data on BS for Q1-2015 ( sum up of Jan to
Mar)
‧Dakdam HC all 3 of midwives left facility for training while delivery no midwife
‧4 HCs lack of nurses and SMW no motivation to work at HC and not provide delivery service
‧Sub contract is available but difficult to verify due to no present of HC chief
‧Not understand well on expenditure for SDG after Sub-decree 216 issued
‧New formula of staff incentive demotivate staff cause by less amount
and big gap (all staff working the same)
‧PBB for Q1 receive only 30% and other 70% is waiting for form from
PBFD/PT - For SOA PRH:
‧Lack of many staff
‧Not understand well on expenditure for SDG
‧New formula of staff incentive demotivate staff cause by less amount and big gap (all staff working the same)
‧Do not define who implement AOP of PRH
‧HEF disbursed to PRH late
‧PHD should review all related documents before sending to HSSP2
‧OD supervisor team should strengthen HIS at HCs
‧Organize to has midwife at facility
‧OD supervisor team should strengthen HIS at HCs
‧PRH and OD please share information to all staff when any people absent or do any activity
‧Should strengthen on AOP, QWP and review
QWP
‧Should implement PMAS appropriately

40
SDMG TEAM DATE OF FIRST VISIT PLACE VISITED FINDINGS AND ISSUES RECOMMENDATIONS
Team 1 Head: Dr Sok Kanha
20-24 Apr 2015 ‧SOA Cheung Prey OD
‧SOA Prey Chhor OD
‧SOA Chamkar Leu OD
‧SOA PRH
‧All SOAs applied and complied to SDMC
‧SOA PRH no contract and PMAS since 2013
‧SOA Cheung Prey OD has not implemented accounting system register
of all sources of budget and not implemented register of expenditure by chapter and source
‧SOA Prey Chhor OD has not conducted self-assessment of OCM
‧ SOA Chamkar Leu OD has not conducted quarterly review
‧SOA PRH has no contract and PMAS since 2013
‧SOA PRH has no nomination of SOA head
‧SOA PRH has no QWP and not conducted annual and quarterly review
‧SOA PRH has no PMAS appraisal of staff
‧SOA PRH has not sent request for national budget to PHD
‧SOA PRH has not prepared annual budget plan following MOH guidelines
‧PHD should help PRH to prepare AOP and quarterly review
‧PHD should update inventory list every 6 months and provide guidance to OD level
‧PHD should conduct training on PMAS to PRH
‧PHD should advise PRH to request budget on time and keep those documents for SDMG review
‧PHD should provide all relevant documents/letters to all SOAs for filing
‧For the next program MOH should allocate SDG to PHD for staff involvement in SOA scheme, such as supervision
‧Personnel Department of MOH should
cooperate with PHD in conducting PMAS training
‧DBF of MOH should review and conduct register training

41
SDMG TEAM DATE OF FIRST VISIT PLACE VISITED FINDINGS AND ISSUES RECOMMENDATIONS
Team 1 Head: Dr Sok Kanha
19-22 May 2015 ‧PHD Tbongkhom
‧SOA Memot OD
‧SOA Ponhea Krek Dambe OD
‧PHD did not conduct monitoring to SOAs
‧PHD did not conduct quarterly review and not submit yet to MOH
‧PHD and both SOAs update inventory once a year
‧Both SOAs did not request additional budget on time
‧SOA Ponhea Krek Dambe OD: no sub contract at Trapaing Pring HC and medical waste dispersed on the floor and not well organized management meetings at HC, SOA did not facilitate regular HCMC meetings
‧PHD should conduct monitoring to SOAs
‧PHD should conduct quarterly review and send to MOH
‧PHD and both SOAs should update inventory twice a year
‧Both SOAs should request additional budget on time
‧SOA Ponhea Krek Dambe OD should organize and facilitate HC to conduct HCMC meeting regularly
‧SOA Ponhea Krek Dambe OD should help HC to keep all documents and have them available
Team 2 Head: Mrs. Khuot Thavary
27-30 April 2015 ‧PHD Ratanakiri
‧SOA OD Banlong, Konmom,
Vireakchey, Vernsay HCs
‧SOA PRH
‧PHD did not apply PMAS and will establish in the Q2
‧PHD quarterly report late submittal to MOH/HSSP2
SOA OD Banlong :
‧4 HCs have a midwife each and 2 HCs none‧Did not apply PMAS all levels, just conducted training on 28 April, 2015
‧Dashboard of Konmom HC not filled in with data of Q4-2014 and did not set targets following SDMG recommendation last year
‧No update for the year on the Dashboard of Vernsay HC
‧SOA PRH lack of technical staff due to 5 staffs transferred‧SOA PRH did not apply PMAS, promise to do in Q2
‧Organize evaluation system of PMAS ready in Q2 or Q3 -2015
‧Manage timing of report to PHD and HSSP2
‧SOA Banlong OD should manage data properly with data break down by 2 ODs
‧Fill vacant posts immediately

42
SDMG TEAM DATE OF FIRST VISIT PLACE VISITED FINDINGS AND ISSUES RECOMMENDATIONS
Team 2 Head: Mrs. Khuot Thavary
15-18 Jun 2015 ‧PHD Preah Vihear
‧SOA OD Tbeng Meanchey, Roveang and Sra Em HCs
‧SOA PRH
PHD applied and complied with the PA - SOA Tbeng Meanchey OD:
‧No sub-contract between SOA and Sra Em HC
‧No PMAs appraisal of HC chief to HC's staff
‧Cannot spend SDG due to sub-decree 216
‧PBB received less than 1/4 of total budget plan - SOA PRH:
‧PBB received less than 1/4 of total budget plan
‧No reply yet from HSSP2 for request to repair toilet, bathroom and drainage system
NA
Team 2 Head: Mrs. Khuot Thavary
22-27 Jun 2015 ‧PHD Siem Reap
‧SOA OD Siem Reap
‧SOA OD Kralanh
‧SOA OD Sot Nikum
‧SOA OD Angkor Chum
‧SOA PRH
‧PHD's quarterly progress report sent late to HSSP2
‧Lack of skilled staff and ambulance driver
‧PMAS applied only for HC chief and PRH not applied PMAS
‧Ferofolate acide out of stock at HCs
‧PBB received less than 1/4 of total budget cause QWP cannot be carried out, debt and AOP for next year are very worrying
‧Program will end by this year but bonus for 2014 is not approved yet
‧SOA PRH has a big gap of staff incentive between high and low qualified staff
‧SOA OD Siem Reap suggest to update treatment guidelines due to some new protocols have not been incorporated into the guidelines
‧PHD should send report on time
‧SOA ODs should apply PMAS for all staff
‧SDMG sub group will discuss this issue with DP/MOH
Team 3 Head: Dr. Sok Srun
19-22 May 2015 ‧PHD Stung Treng
‧SOA OD Stung Treng, Sre Krasaing HC
‧SOA PRH
‧Monthly staff schedule not available at visited HCs ‧PHD and both SOAs should strengthen and continue to apply and comply with PA and SDMC
‧SOA Stung Treng OD should prepare and update monthly staff schedule at HCs

43
SDMG TEAM DATE OF FIRST VISIT PLACE VISITED FINDINGS AND ISSUES RECOMMENDATIONS
Team 3 Head: Dr. Sok Srun
26-29 May 2015 ‧PHD Prey Veng
‧SOA OD Pearaing, RH,
‧SOA OD Preah Sdach, RH
‧PHD and both SOAs applied and complied with the PA and SDMC
‧SOA OD Pearaing did not conduct self-assessment on OCM/QOC in 2014
‧SOA OD Pearaing should conduct self-assessment on OCM/QOC in 2014 by using level 1 tools level 1 and not waiting for level 2 tools
Team 3 Head: Dr. Sok Srun
21-24 April 2015 ‧PHD Oddar Meanchey
‧SOA OD Samroang, Anlong Veng
HC, Anlong Veng RH
‧SOA PRH
‧PHD and both SOAs applied and complied with PA and SDMC ‧PHD and both SOAs should strengthen and continue to apply and comply with PA and SDMC
Team 3 Head: Dr. Sok Srun
9-12 Jun 2015 ‧PHD Koh Kong
‧SOA Sre Ambel OD
‧SOA Smach Meanchey OD, Trapaingroung and Kirisakor HCs
‧SOA PRH
‧Both SOA ODs did not conduct self-assessment on OCM
‧All 3 SOAs did not conduct self-assessment on QOC level 2
‧HCMC meeting not conducted
‧Both SOA ODs should conduct self-assessment
on OCM
‧All 3 SOAs should conduct self-assessment on QOC level 2
Team 4 Head: Dr. Chev Mony
2-5 Jun 2015 ‧PHD Pursat
‧SOA OD Bakan, RH, O'Tapong HC
‧PHD and SOA applied and complied with PA and SDMC ‧PHD and SOA should strengthen and continue
to apply and comply with PA and SDMC
Team 4 Head:Dr. Chev Mony
8-12 Jun 2015 ‧PHD Takeo
‧SOA: Duan Keo, Kirivong, Angroka
‧Roka Krauv, Prey Sleuk, Kork Pricg, Prey Chhour, Prey Sbat HCs and Angroka RH
‧PHD did not conduct monitoring to SOAs ‧Monthly staff schedule not available at visited HCs
‧PHD must conduct quarterly monitoring to SOAs

44
3.6.7 INDIGENOUS PEOPLES SERVICE DELIVERY
3.6.7.1 SOA OPERATIONAL DISTRICTS
TABLE I.1: OUTREACH SERVICES TO REMOTE VILLAGES
NO SOA PLAN IMPLEMENTATION REMOTE VILLAGES
TOTAL
POPULATION
1 Banlong OD 368 360 92 38,076
2 Senmonorom OD 150 115 25 11,653
3 Stung Treng OD 276 274 61 34,910
4 Poipet OD 80 78 20 6,788
5 Preah Net Preah OD 28 17 17 7,968
6 Bakan 4 3 3 2,045
7 Sre Ambel OD 4 9 2 2,045
8 Tbeng Meanchey OD 42 42 23 5,583
9 Kralanh OD 8 8 7 3,230
10 Siem Reap OD 30 24 6 3,168
11 Sot Nikum OD 276 193 43 19,859
12 Angkor Chum OD 27 25 8 5,960
Total 1,293 1,148 307 141,285
Source: HMIS
Source: HMIS
TABLE I.2: SERVICES DELIVERY TO IP
NO SOA
OPD
(NEW CASES) ANC 2 VISITS
DELIVERY AT
HEALTH
FACILITIES
DPT-HEPB3
(CHILDREN < 1
YEAR)
MEASLES (CHILDREN
< 1 YEAR)
MALE FEMALE MALE FEMALE MALE FEMALE
1 Banlong OD 83,163 85,926 8,083 3,399 2,407 2,859 2,230 2,564
2 Senmonorom OD 10,230 13,779 837 478 381 427 304 327
3 Stung Treng OD 7,345 7,175 1,010 481 630 660 559 604
Total 100,738 106,880 9,930 4,358 3,418 3,946 3,093 3,495

45
TABLE I.3: CIVIL SERVANT STAFF (HEALTH CENTER AND REFERRAL HOSPITAL)
NO SOA STAFF
DOCTOR/MA SECONDARY NURSE PRIMARY NURSE SECONDARY
MIDWIFE
PRIMARY
MIDWIFE MALE FEMALE MALE FEMALE MALE FEMALE
1 Banlong OD
Indigenous Staff 0 0 13 0 49 0 2 26
Staff who can speak
local indigenous
language
0 0 19 0 5 0 2 13
2 Senmonorom
OD
Indigenous Staff 0 0 1 19 10 3 2 19
Staff who can speak
local indigenous
language
0 0 2 11 4 1 1 11
3 Stung Treng
OD
Indigenous Staff 0 0 0 0 1 0 0 0
Staff who can speak
local indigenous
language
0 0 10 3 24 7 4 20
4 Tbeng
Meanchey OD
Indigenous Staff 0 0 1 0 5 0 2 7
Staff who can speak
local indigenous
language
0 0 4 0 0 0 0 0
Total
Indigenous Staff 0 0 15 19 65 3 6 52
Staff who can speak
local indigenous
language
0 0 35 14 33 8 7 44
Source: HMIS
3.6.7.2 SOA PROVINCIAL REFERRAL HOSPITALS
No SOA
TABLE III.1: SERVICES DELIVERY TO IP
OPD (NEW CASES) DISCHARGE
DELIVERY
MALE FEMALE MALE FEMALE
1 Mondulkiri 881 987 1,454 1,760 401
2 Stung Treng 1,864 2,430 724 1,942 1,264
3 Ratanakiri 228 157 840 574 69
Total 2,973 3,574 3,018 4,276 1,734
Source: HMIS

46
TABLE III.2 CIVIL SERVANT STAFF
NO SOA STAFF
DOCTOR/MA SECONDARY NURSE PRIMARY NURSE SECONDARY
MIDWIFE
PRIMARY
MIDWIFE MALE FEMALE MALE FEMALE MALE FEMALE
1 Mondulkiri
Indigenous
Staff 0 0 0 0 0 1 0 0
Staff who can
speak local
indigenous
language
0 0 3 0 0 1 0 0
2 Stung Treng
Indigenous
Staff 0 0 1 0 0 0 0 0
Staff who can
speak local
indigenous
language
1 0 6 4 0 0 9 4
3 Ratanakiri
Indigenous
Staff 0 1 3 3 2 0 1 5
Staff who can
speak local
indigenous
language
0 0 1 0 0 0 0 0
Total
Indigenous
Staff 0 1 4 3 2 1 1 5
Staff who can
speak local
indigenous
language
1 0 10 4 0 1 9 4
Source: HMIS

47
CHAPTER 4. COMPONENT B: IMPROVING HEALTH FINANCE
4.1 HEALTH EQUITY FUNDS
Health Equity Funds (HEFs) are a pro-poor 3rd party health financing mechanism which purchase health services for the identified poor, and provide them with reimbursements for transport costs, and caretaker food allowances. HEFs have been providing these services to Cambodian citizens identified as poor, either through a pre-identification or post-identification process. HEFs purchase health services from public health care providers through contracts between the facility, Health Equity Fund Operators (HEFOs) and the Health Equity Fund Implementer (HEFI), and involvement of local MOH officials as observers. The scheme (1) enables the poor to be protected against catastrophic health expenditures, (2) ensures access to priority curative care, and (3) improves regulation of public health care providers. Note that these schemes were supported by the Program and a variety of health development partners, as well as USAID. HEFs are operated by third party entities termed HEFOperators which are non-profit NGOs or Community Associations. There are a total of 11 Health Equity Fund Operators (HEFOs) operating in the sector. In addition to HEFs, there are also schemes labeled SUBOs which are subsidized directly by the MOH in 11 ODs and 6 national hospitals. By the end of 2015, 100% of the poor population is estimated to have been covered by HEF schemes.
4.1.1 HEALTH FACILITIES CONTRACTED WITH HEF SCHEME
By the end of 2015, the number of HEFs had been expanded to cover all ODs in the country, per the data from BHEF/DPHI. The provinces that did not see any expansion in the reporting period included Battambang, Kampong Chhnang, Kep, Koh Kong, and Preah Sihanoukville, since they already had extensive HEF coverage.
The Table below shows a comparison of HEFs in the country in 2014 and at the end of 2015. There has been a 36% increase in HEF schemes implemented at RHs from 59 in 2014 to 80 in 2015. A huge increase of 75% was observed in HCs, rising from 592 in 2014 to 1,037 in 2015. HPs also increased by 51% from 45to 68.
HEF Schemes in 2014 and 2015
HEALTH FACILITY HEFS 2014 HEFS 2015
NATIONAL HOSPITAL 1 1
Referral Hospital
CPA3
CPA2
CPA1
59
17
20
22
80
17
23
40
Health Center 592 1,046
Health Post 45 69
Source: BHEF/DPHI

48
Table in Annex H provides a detailed breakdown of HEF schemes by province, OD, cluster
number, type of scheme, source of funding, name of HEF implementer, type of contract, and
the name of the HEF operator.
4.1.2 KEY PERFORMANCE INDICATORS, 2008 TO 2015
NO INDICATORS
BASELINE ACHIEVEMENT
2008 2009 2010 2011 2012 2013 2014 2015
1 Percent of RHs implementing
health equity fund schemes 61% 67% 72% 73% 70% 67% 62% 82%
2 Percent of HCs implementing
health equity fund schemes 12 14 29 30% 36% 44% 52% 92%
3 Number of OPD cases receiving
health equity fund assistance 152,000 312,713 621,628 769,284 1,033,316 1,153,795 1,423,245 2,098,272
4 Number of IPD cases receiving
health equity fund assistance 67,204 102,205 123,553 78,122 135,090 110,655 119,109 159,996
5 Number of deliveries receiving
health equity fund assistance NA 15,629 25,388 25,150 25,782 30,237 33,112 43,639
6 Percent of poor people covered
by health equity funds 57% 73% 77% 78% 78% 93% 97% 100%
4.1.3 HEALTH EQUITY FUND EXPENDITURES
Total expenditures in 2015 were USD 13,984,837.47. These consisted of USD 11,594,805.47 for
total direct benefit costs equivalent to 83%, and USD 2,390,032 for indirect costs or 17% of
total expenditures. These proportions match very closely to the 2014 proportions of 82% and
18% respectively.
Total direct benefit costs including health services, transport, and food at RHs amounted to USD
9.5 million which was 82% of the total direct benefit cost at health facilities. The amount for
HCs was 2,078,890 or 18% of the total. A total of USD 9.2 million was spent on health services
which comprised 79% of the total direct benefit cost, USD 1.3 million on transport costs or 11%,
and USD 1.1 million or 10% for food and other expenses.
The Tables below provide trend data in respect of total expenditure, direct benefit cost at
health facilities, and indirect costs.

49
4.1.4 TOTAL EXPENDITURE
2009 2010 2011 2012 2013 2014 2015
Direct benefit cost (USD) 2,311,830 3,567,061 5,249,867 6,746,107 7,683,195 8,958,561 11,594,805
Indirect benefit costs (USD) 1,032,883 1,021,349 1,307,612 1,386,222 1,697,418 1,971,202 2,390,032
Total cost (USD) 3,344,713 4,588,410 6,557,479 8,132,329 9,380,613 10,929,763 13,984,837
Indirect cost as % of total
expenditure 31% 22% 20% 17% 18% 18% 17%
Source: HEF Bureau
4.1.5 DIRECT BENEFIT COST AT FACILITIES (RHS AND HCS)
2009 2010 2011 2012 2013 2014 2015
OPD 286,595 675,132 1,183,266 1,048,192 1,459,941 1,799,245 2,648,857
IPD including Deliveries 1,238,906 1,833,089 2,615,530 3,784,838 4,234,791 4,925,506 6,553,611
Transport OPD 40,966 28,404 110,219 409,621 650,407 802,728 826,905
Transport IPD 329,441 475,956 641,302 651,411 468,717 475,871 479,297
Food 405,755 531,562 680,115 831,809 847,493 933,023 1,063,256
Other 10,166 22,917 19,434 20,234 21,845 22,188 22,881
Total Direct Benefit Cost (USD) 2,311,830 3,567,061 5,249,867 6,746,107 7,683,195 8,958,561 11,594,805
Source: HEF Bureau
4.1.6 TOTAL EXPENDITURE BY FACILITIES
2009 2010 2011 2012 2013 2014 2015
Total direct benefit cost (USD) 2,311,830 3,567,061 5,249,867 6,746,107 7,683,195 8,958,561 11,594,805
Total direct benefit cost (USD) at
RHs 2,174,155 3,203,313 4,755,637 5,977,989 6,555,682 7,543,679 9,515,916
Total direct benefit cost (USD) at
HCs 137,676 363,748 494,230 768,118 1,127,513 1,414,882 2,078,889
Direct cost at HCs as % of total
direct benefit cost 6% 10% 9% 11% 15% 16% 18%
Source: HEF Bureau
4.1.7 INDIRECT COSTS
2009 2010 2011 2012 2013 2014 2015
Indirect Benefit Costs 715,037 607,412 840,155 881,209 1,055,435 1,277,674 1,539,874
Administrative Costs 308,634 405,162 449,276 503,550 636,833 689,665 820,491
Program Development Costs 9,213 8,775 18,182 1,463 5,151 3,863 29,667
Total 1,032,883 1,021,349 1,307,612 1,386,222 1,697,418 1,971,202 2,390,032
Source: HEF Bureau

50
4.2 COMPARISON OF PRE AND POST-ID PATIENTS
HEF beneficiaries are characteristically poor people identified through a Pre-ID process which is
usually done by the Ministry of Planning (MOP). However, the MOP is not able to identify all of
the poor and not infrequently, patients arriving at a hospital have not been pre-identified and
are unable to pay for the cost of care. In such cases, HEF operators verify that they are poor
through a process called post-identification, and these patients are called as Post-ID patients in
contradistinction to Pre-ID poor patients.
The total number of pre- and post-ID patients who received support from HEFs increased
significantly from 2009-12 as can be seen in the Table below. After a modest decline in 2014,
the number of pre and post ID in 2015 has substantially increased by 335,546 total
beneficiaries, as may be seen in the Table below.
4.2.1 TREND IN HEF BENEFICIARIES Year 2009 2010 2011 2012 2013 2014 S1-2015
Total number of HEF
beneficiaries (Pre and
Post-ID)
1,503,543 1,748,489 2,468,464 2,689,636 2,689,636 2,620,759 2,956,305
Annual
increase/decrease 244,946 719,975 221,172 0 -68,877 335,546
Source: BHEF/DPHI
NEXT STEP
MoH plans to expand HEFs to cover all health facilities in the country
The draft Health Finance policy has been submitted to MEF, and comments are awaited

51
CHAPTER 5. COMPONENT C: STRENGTHENING HUMAN RESOURCES
5.1 TRAINING REPORT
The program did not support any training activities in reporting period.
5.2 STAFF DEPLOYMENT
Please see Table in Annex E.

52
CHAPTER 6. COMPONENT D: STRENGTHENING HEALTH SYSTEM STEWARDSHIP
FUNCTIONS
6.1HARMONIZATION AND ALIGNMENT
The 2015 National Health Congress was conducted on 9-10 March, 2016 in Phnom Penh. The
Congress reviewed sector performance in 2015, reviewed targets for 2016, and established
priorities for 2017.
6.2 POLICY DEVELOPMENT AND IMPLEMENTATION
The draft Health Finance Policy is currently being reviewed by MEF before finalization and
implementation. In addition, the MEF has engaged a private consultancy firm to prepare the
Social Health Protection Framework which is likely to provide inputs toward the final Health
Financing Policy.
The final national Health Strategic Plan 3 (2016-20) was presented at the NHC during its
meeting in March, 2016.
6.3 DECENTRALIZATION AND DECONCENTRATION
In 2015, the MOH handed over responsibility for the functioning of the following ODs: (i) Dang
Koa OD to Khan Dang Koa of the Phnom Penh Municipality, (ii) O ReangOv OD to O
ReangOvdistricvt of Tbong Khmum province, (iii) LeukDeak OD to LeukDeak district of Kandal
province, and (iv) Phnom Srouch OD to Phnom Srouch district of Kampong Speu province.
During this reporting period, community health functions continued to be piloted in five
administrative districts in two provinces, Battambang and Pursat. An evaluation of the pilot has
been conducted by an inter-ministerial working group comprising representatives of MEF, MOI,
NCDD, MOH and international donors. MOH’s D&D working group continued to be active
during this reporting period.
6.4 HEALTH MANAGEMENT INFORMATION SYSTEM
Please see section 2.3 for information.
6.5 IMPROVING QUALITY OF CARE
Please see section 2.2 for information

53
CHAPTER 7. PROGRAM FINANCIAL INFORMATION
7.1 DISBURSEMENT
Under Pooled Fund, disbursements from IDA Credit, MDTF, UNICEF and UNFPA as at 31
December 2015 were US$ 27.56 million, US$ 115.82 million, US$ 2.65 million and US$ 1.5
million, equivalent to 99%, 93%, 100% and 100% of the total allocation US$ 27.8 million, US$
124.37 million, US$ 2.6 million and 1.5 million respectively.
Under Discrete Fund, disbursement from AFD, BTC, UNFPA, UNICEF and RGC as at 31 December
2015 were US$ 9.4 million, US$2 million, US$ 7.51 million, US$ 1.2 million and US$ 29.9 million,
equivalent to 100%, 100%, 100%, 100%, 100% and of the total allocated amount US$ 9.4
million, US$ 2million, US$ 7.51 million, US$ 1.2 and US$ 28.5 million respectively.
7.2 EXPENDITURES
Sharing of expenditure of the year 2015 for the Pooled is 32.69%, 61.50%, and 5.81% from IDA,
MDTF and UNICEF respectively. As of the quarter ended 31 December 2015, the consolidated
expenditures for all funds shows to 75.58% comparing to the total annual budget $40.27
million; which represents Pooled fund 85.25%, MDTF100%: 72.85%, UNICEF: 94.32%, UNFPA
87.92%, BTC 99.15%, and RGC 67.03% compare to the 2015 annual budget $12.19 million,
17.77 million, $0.007 million, $0.99 million, $0.02 million, and $9.8 million, respectively.
Expenses on Goods shows only 64% since there are more procurement packages of SOAs is
under process and commitment of payment for contract awards will be paid in Q1, 2016.
7.3 PROJECTED CASH REQUIREMENT FOR Q3 & Q4, 2014
POOLED FUNDS
Projected cash requirement the two quarters is US$ 16.07 million. Since there is a fund balance
of US$ 2.72 million at designed account and a fund request amount US$ 8.2 million is in
process, the program will need only US$ 5.12 million. Since there is a shortfall of fund about 4.7
from Pooled Fund, this fund requirement will be revised after getting confirmation from DPs or
MEF on the funding gap.
DISCRETE FUNDS
Under UNFPA discrete fund, projected cash requirement shows US$ 0.34 million. After
deducting the fund balance US$ 0.043 million at designated account, the amount US$ 0.29
million will be requested.
For the government contribution fund, projected cash requirement indicates US$ 6.2 million.
So, HSSP2 will request only US$ 0.01 million since the US$ 6.2 million is available at designated
account.

54
CHAPTER 8. PROGRAM MANAGEMENT AND IMPLEMENTATION
8.1 INTEGRATED FINANCIAL AND TECHNICAL AUDIT
Mondulkiri, Ratanakiri, Kratie, Svay Rieng, and the Phnom Penh municipal health department
were selected for field audits for Q4, 2015. The Q4 draft integrated technical and financial
quarterly audit report was received from the auditors in March, 2016. After review, the final
reports will be submitted to JPIG. Key issues identified in the financial audits related to control
issues which were discussed with relevant IUs in the Joint Quarterly Meetings and relevant
actions prescribed by Program Management. For the technical audit findings, these were
discussed first by the field audit teams by providing immediate feedback to the PHD
Commissioners, and they were also forwarded in written form to relevant PHD Commissioners.
8.2 JOINT QUARTERLY MEETINGS AND JOINT REVIEW MISSIONS
The 13th Joint Review Mission was conducted from 18 May to 3 July, 2015. This included field
visits to 5 provinces including Kampot, Kampong Cham, Koh Kong, Kampong Thom, and Tbong
Khmum. The review mission focused on implementation of health equity funds and service
delivery grants, infrastructure development, medical equipment, fiduciary management at the
sub-national level, and planning for health financing. The last JQM is planned to be held in late
March or early April 2016. The 14th Joint Review Mission will be conducted from 21 March,
2016. The provinces of Banteay Meanchey, Battambang, Pursat, Siem Reap, Steung Treng and
Mondolkiri were selected for field visits by the JRM team.
8.3 SAFEGUARDS
From 10 November to 12 November 2015, the field assessment for the Resettlement Planning
Framework (RPF), the Environment Planning Framework (EPF), and the Indigenous Peoples
Planning Framework(IPPF) were conducted in Siem Reap, Preah Vihear, Ratanakiri and
Mondulkiriprovinces. Both the draft EMP and RPF were updated and a consultative workshop
was conducted on 6 July, 2015.The documents were uploaded to the MOH website in
consonance with transparency and accountability requirements, per Program Director’s letter
dated 13 November 2015 to the PHD Directors and to the World Bank. The draft of the EMF
and the IPPF were also disclosed in November, 2015. The draft RPF will be finalized after the
receipt of feedback from thedepartment of resettlement of the MEF. Please see section 3.6.7
for additional information on service delivery to indigenous peoples.
8.4 LEGAL COVENANTS
The status of Legal Covenants table is presented in Annex F.
8.5 GOOD GOVERNANCE FRAMEWORK
The updated Good Governance framework is presented in Annex G.
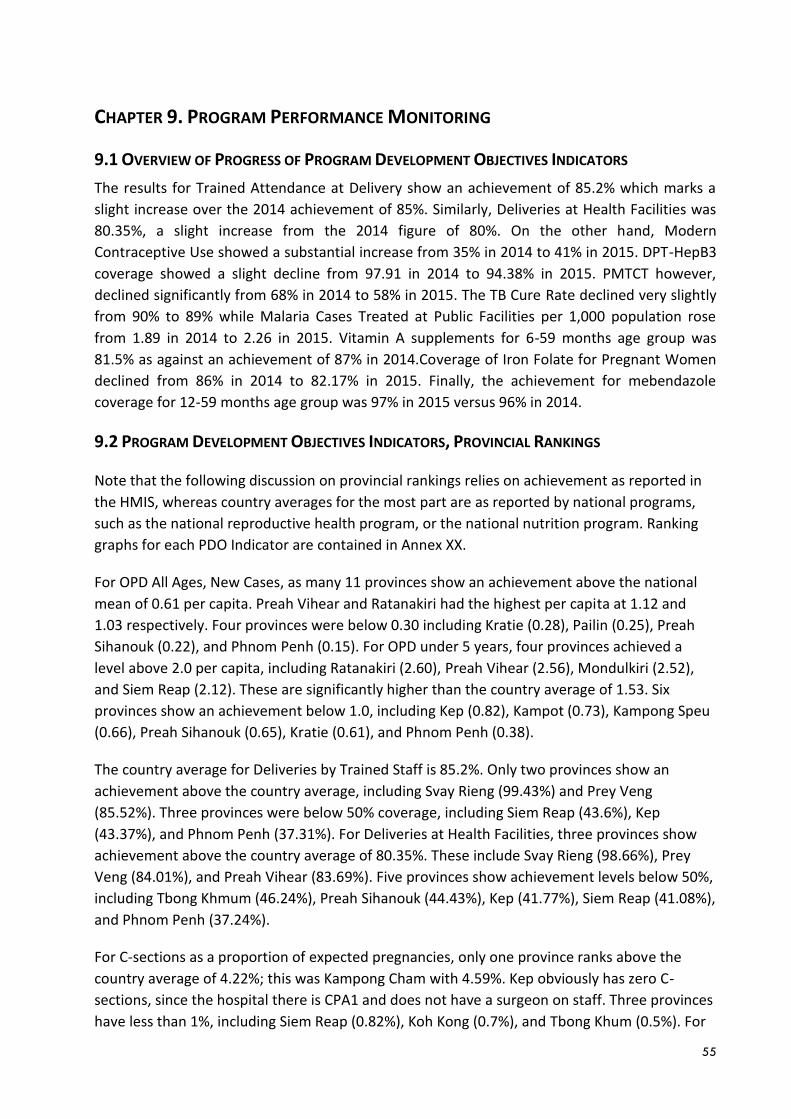
55
CHAPTER 9. PROGRAM PERFORMANCE MONITORING
9.1 OVERVIEW OF PROGRESS OF PROGRAM DEVELOPMENT OBJECTIVES INDICATORS
The results for Trained Attendance at Delivery show an achievement of 85.2% which marks a
slight increase over the 2014 achievement of 85%. Similarly, Deliveries at Health Facilities was
80.35%, a slight increase from the 2014 figure of 80%. On the other hand, Modern
Contraceptive Use showed a substantial increase from 35% in 2014 to 41% in 2015. DPT-HepB3
coverage showed a slight decline from 97.91 in 2014 to 94.38% in 2015. PMTCT however,
declined significantly from 68% in 2014 to 58% in 2015. The TB Cure Rate declined very slightly
from 90% to 89% while Malaria Cases Treated at Public Facilities per 1,000 population rose
from 1.89 in 2014 to 2.26 in 2015. Vitamin A supplements for 6-59 months age group was
81.5% as against an achievement of 87% in 2014.Coverage of Iron Folate for Pregnant Women
declined from 86% in 2014 to 82.17% in 2015. Finally, the achievement for mebendazole
coverage for 12-59 months age group was 97% in 2015 versus 96% in 2014.
9.2 PROGRAM DEVELOPMENT OBJECTIVES INDICATORS, PROVINCIAL RANKINGS
Note that the following discussion on provincial rankings relies on achievement as reported in
the HMIS, whereas country averages for the most part are as reported by national programs,
such as the national reproductive health program, or the national nutrition program. Ranking
graphs for each PDO Indicator are contained in Annex XX.
For OPD All Ages, New Cases, as many 11 provinces show an achievement above the national
mean of 0.61 per capita. Preah Vihear and Ratanakiri had the highest per capita at 1.12 and
1.03 respectively. Four provinces were below 0.30 including Kratie (0.28), Pailin (0.25), Preah
Sihanouk (0.22), and Phnom Penh (0.15). For OPD under 5 years, four provinces achieved a
level above 2.0 per capita, including Ratanakiri (2.60), Preah Vihear (2.56), Mondulkiri (2.52),
and Siem Reap (2.12). These are significantly higher than the country average of 1.53. Six
provinces show an achievement below 1.0, including Kep (0.82), Kampot (0.73), Kampong Speu
(0.66), Preah Sihanouk (0.65), Kratie (0.61), and Phnom Penh (0.38).
The country average for Deliveries by Trained Staff is 85.2%. Only two provinces show an
achievement above the country average, including Svay Rieng (99.43%) and Prey Veng
(85.52%). Three provinces were below 50% coverage, including Siem Reap (43.6%), Kep
(43.37%), and Phnom Penh (37.31%). For Deliveries at Health Facilities, three provinces show
achievement above the country average of 80.35%. These include Svay Rieng (98.66%), Prey
Veng (84.01%), and Preah Vihear (83.69%). Five provinces show achievement levels below 50%,
including Tbong Khmum (46.24%), Preah Sihanouk (44.43%), Kep (41.77%), Siem Reap (41.08%),
and Phnom Penh (37.24%).
For C-sections as a proportion of expected pregnancies, only one province ranks above the
country average of 4.22%; this was Kampong Cham with 4.59%. Kep obviously has zero C-
sections, since the hospital there is CPA1 and does not have a surgeon on staff. Three provinces
have less than 1%, including Siem Reap (0.82%), Koh Kong (0.7%), and Tbong Khum (0.5%). For

56
Modern Methods of Contraceptive Use, the country average is 41% of currently married
women of reproductive age. Seven provinces show an achievement higher than the country
average, with at least two above 50%, including Takeo (54.32%), and Kampot (51.09%). Low
performers include Battambang (29.81%), Kandal (27.99%), Preah Sihanouk (27.13%), Kratie
(27.09%), Kampong Chhnang (21.45%), Kep (18.28%), Pailin (14.77%), and Phnom Penh (6.03%).
For ANC2 visits, the country average is 88.11%. Three provinces show achievements in excess of
this figure including both Otdar Meanchey and Stung Trey that exceeded 100%, and Preah
Vihear at 98.91%. The two lowest performing provinces include Prey Veng (7.77%) and Kandal
(6.93%). As many as 18 provinces show achievement lower than 50% coverage. The revised
country average for Iron folate coverage for pregnant women as reported by the national
nutrition program is 82.17%, significantly higher than the 73% coverage reported in the NHC
report. Only five provinces exceeded this figure, including Ratanakiri (103.82%), Preah Vihear
(97.76%), Stung Treng (94.84%), Siem Reap (85.52%), and Otdar Meanchey (83.47%). The two
lowest performers are Kratie (49.05%), and Preah Sihanouk (46.82%).
The country average for the Measles vaccine is 91.93% coverage. As many as 10 provinces
report coverage figures in excess of 100%, with the highest being Stung Treng at 178.28%. The
lowest performers in this regard are Pailin (56.98%), and Preah Sihanouk (56.24%). The country
average for PMTCT is 58% with four provinces reporting achievement significantly higher than
100%, including Phnom Penh (281%), Pailin (172%), Koh Kong (158%), and Preah Sihanouk
(148%).
For DPT-HepB3 vaccinations, as many as 11 provinces report coverage as being in excess of
100%, with the country average being 94.38%. Low coverage provinces include Preah Sihanouk
(67.76%), Phnom Penh (65.82%), and Pailin (61.52%). The country average for vitamin A
coverage for children 6-59 months is 81.5% with the top three performers being Kampot (90%),
Stung Treng (87%), and Preah Vihear (84%). Five provinces performed at less than 50%
coverage, including Phnom Penh (49%), Koh Kong (48%), Preah Sihanouk (46%), Tbong Khmum
(45%), and Kep (43%).
9.3 PROGRAM PERFORMANCE INDICATORS
NO INDICATORS
BASELINE
2008
TARGET
2015
TARGET
2014
ACHIEVEMENT
2009 2010 2011 2012 2013 2014 2015
COMPONENT A: HEALTH SERVICE DELIVERY
1 OPD new cases all ages p.c. 0.54 ≥ 0.7 ≥ 0.7 0.54 0.64 0.64 0.63 0.61 0.59 0.61
2 OPD new cases under 5 p.c. 1.1 2.0 1.9 1.0 2,362,906 1.6 1.45 1.43 1.45 1.53
3 ANC 2 visits 81 90 88 88.5 80.4 86.24 87 81.5 91.4 93
4 C-section rate 0.77 4.0 3.2 1.69 2.03 2.43 2.83 3.3 4.29 4.22
5 No. of TB cases all forms notified 39,820 41,000 40,298 40,199 41,000 40,866 40,639 40,000 41,000 36,700
6 % of people living in malaria endemic
areas of 20 provinces have sufficient
76 >95 >95 75 82 95 100 100 100 100

57
NO INDICATORS
BASELINE
2008
TARGET
2015
TARGET
2014
ACHIEVEMENT
2009 2010 2011 2012 2013 2014 2015
(1 net per 2 persons) treated bed
nets(LLIN/ITN)*
7 DHF case fatality rate reported by
public health facilities 0.68 0.6 0.7 0.30 0.32 0.45 0.46 0.33 0.6 0.25
8 Percent of children under 5 years
with cough or difficult breathing who
sought treatment from public health
provider
48
(CDHS
2005)
67 66 NA 64 NA NA NA 68.8 68.8
9 Percent of children under 5 years
with diarrhea who received ORT and
Zinc
58
(CDHS
2005)
97 96 NA 81 NA NA NA NA
57(ORT)
5.4(Zinc)
10 Number of diabetes cases receiving
treatment per 1,000 patients in
public health facilities
35 30 33 30 29 21 46.60 47.29 1.81 15.42%
11 Percent of HCs implementing IMCI
services 69 NA NA 78 95 98 97 98 96 100
12 Percent of essential drugs (15 items
listed) at HCs that were out of stock 12.87 <5 <5 6.5 5.35 4.71 4.18 4.10 4.73 NA
COMPONENT B: HEALTH FINANCING AND SOCIAL PROTECTION
1 % of Government (MOH) Health Expenditure at Provincial level
29.85 NA NA 31 27.14 31 29.9 28.07 35.12 40.17
2 Percent of RHs implementing health equity fund + subsidy schemes
61 NA NA 67 72 73 70 67 77 93
3
Percent of HCs implementing health equity fund + subsidy schemes
12 NA NA 14 29 30 36 44 55 97
4 Number of OPD cases receiving health equity fund assistance
152,000 NA NA 312,713 621,628 769,284 1,033,316 1,153,795 1,423,245 2,098,272
5 Number of IPD cases receiving health equity fund assistance
67,204 NA NA 102,205 123,553 78,122 135,090 110,655 119,109 159,996
6 Number of deliveries receiving health equity fund assistance
NA NA NA 15,629 25,388 25,150 25,782 30,237 33,112 43,639
7 Percent of poor people covered by health equity funds
57 NA NA 73 77 78 78 93 97 100
8 Number of individuals insured under CBHI schemes
73,828 NA NA 130,397 170,490 237,541 166,663 103,557 112,737 357,680
9 Government health expenditure per
capita (USD) 7.77 NA NA 8.64 10.78 11.59 13 14 13 13
COMPONENT C: HUMAN RESOURCES DEVELOPMENT
1 Secondary midwives per 10,000 per
location:
- Country ratio
- Provincial average
- Provincial median
1.35
1.40
1.74
NA
NA
1.34
1.38
1.26
1.32
1.37
1.20
1.39
1.42
1.27
1.67
1.74
1.57
1.68
2.07
1.98
1.79
2.34
2.08
1.85
2.45
2.17
COMPONENT D: STEWARDSHIP AND INSTITUTIONS
1 Percent of external funds for health
included in AOPs 50.6 NA NA 66.4 64.6 98.7 121 117.7 92.74 NA
2 Percent of functioning HCMCs
NA >85 85 NA 85 85 85 85 75
62
(no Fund)

58
NO INDICATORS
BASELINE
2008
TARGET
2015
TARGET
2014
ACHIEVEMENT
2009 2010 2011 2012 2013 2014 2015
3 Percent of licensed private
pharmacies and depots 49 100 100 59 94 100 100 100 100 100
4 Percent of private entities
(polyclinics, consultation cabinets,
maternity clinics, dental clinics, etc.)
that are licensed
56 100
100
72 93 100 100 100 100 100
Note:*Dept of Preventive Medicine changed the denominator from “Total OPD patients” to “Population age 15 years and
above.”

59
9.4 PROJECT MONITORING INDICATORS
NO INDICATORS BASELINE 2008
TARGET 2013
ACHIEVEMENT
2009 2010 2011 2012 2013 2014 2015
1 Technical content and results-focus of AOP process improves based on MTR and Final Evaluation
NA Improvement since MTR
NA NA Improved Improved Improved Improved Improved
2
Number and percentage of MOH central institutions and provinces submitting AOP and 3YRPs according to schedule and in MOH format
79% (2008)
95%+
NA 100% 100% 100% 100% 100% 100%
3 AOP resource allocation of program budgets reflecting HSP2 and JAPR priorities (1.MCH; 2.CDs; and 3.NCDs)
NA NA NA MCH: $24.3 mill (8.9%)
CDC: $52.8 mill (19.4%)
NCD: $6 mill (2.2%)
MCH: 20% CDC: 57% NCD: 3%
MCH: 17% CDC: 53% NCD: 2%
MCH: 22.12% CDC: 43.58% NCD: 2.46%
MCH: 19.07%
CDC: 40.76%
NCD: 2.28%
NA
4 Rate of Program execution for
Government funds
Pooled DP
NA
105% (JAPR 2009)
95% 95%
RGC: 63%
DP(HSSP2): 41%
RGC: 94.8%
DP(HSSP2): 59%
RGC: 95.39% DP (HSSP2):
62.1%
60.18% 61.50%
62.86% 57.09%
67.19% 55.26%
67.03% 77.98%
5 Share of operating cost budget reaching contracting ODs
0 40% 10% 20% 25% 30% 35% 35% 35%
6 Proportion of ODs implementing SDGs and internal contracting meeting at least 80% of their performance targets
0 100% NA 93% 100% 100% 100% 100% 100%
7 Financial Management NA Implemente Implemented implemented Implemented Implemente Implemented Implement Implemented

60
NO INDICATORS BASELINE 2008
TARGET 2013
ACHIEVEMENT
2009 2010 2011 2012 2013 2014 2015
Improvement Plan developed and implemented
d d ed
8 Number of MOH staff receiving POC payments financed by Project.
0 NA 0 0 239 237 (up to June, 2012)
0 0 0
9 Annual health planning summits (JAPR and JAPA) conducted with wide stakeholder participation
NA JAPA and JAPR
conducted
JAPA and JAPR conducted
JAPR and JAPA conducted in March, 2011
JAPR conducted in March, 2012; JAPA conducted
in December, 2011
JAPR and JAPA
conducted
JAPR conducted;
JAPA not conducted
JAPR and JAPA not
conducted, but NHC
conducted
JAPR and JAPA not conducted,
but NHC conducted
10 Percentage of HSP2 indicators that have
Baselines
Targets
77% 69%
83% 73%
98% 90%
98% 90%
98% or
90%
83% (53/64) or
73% (47/64)
NA or NA
NA or NA
11 Selected key HSP2 indicators disaggregated by location and sex
PHDs: No
Sex disagg: No
PHDs: Yes
Sex disagg: No
PHDs: Yes
Sex disagg: No
PHDs: Yes
Sex disagg: No
PHDs: Yes
Sex disagg: No
PHDs: Yes
Sex disagg: Yes
PHDs: Yes
Sex disagg: Yes
PHDs: Yes
Sex disagg: Yes
PHDs: Yes
Sex disagg: Yes
12 Health personnel receiving training through the Project (number)
NA NA 43,989 20,359 31,053 37,867 22,205 10,569* No Fund supported
13 Health facilities constructed, renovated, and/or equipped through the Project
NA NA NA 5 3HCs 5HPs
1 PRH 82 HCs 3 HPs 1 RH
Landscapes Physical
29 HCs 2HPs
26ADRs, 1 OD Pharmacy
2 RTCs, Phase 1 NDQCL.
10 HCs 12
Renovation NCD Clinics
53 ADRs
15 RHs
1 LNAC
1 Clean Room
103 Solar Lighting
193 Water Improvement
263 Sanitation Improvement
*: Pooled Fund did not support Training in Semester2, 2014
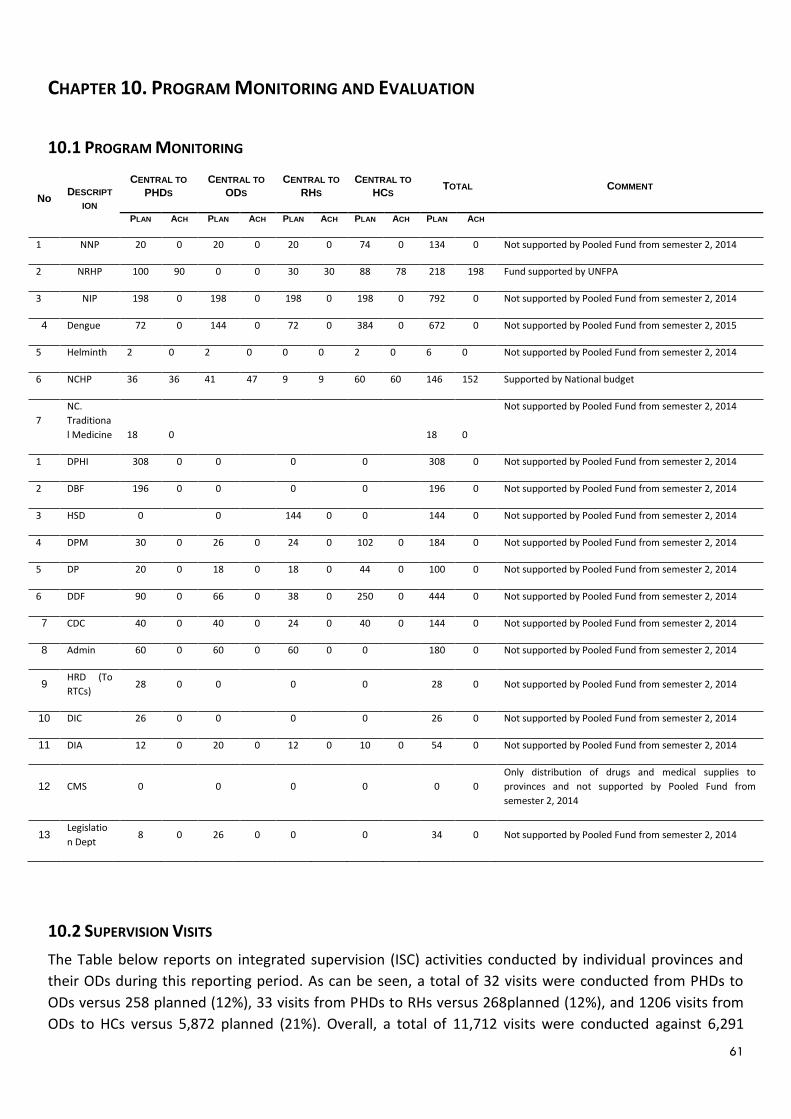
61
CHAPTER 10. PROGRAM MONITORING AND EVALUATION
10.1 PROGRAM MONITORING
10.2 SUPERVISION VISITS
The Table below reports on integrated supervision (ISC) activities conducted by individual provinces and
their ODs during this reporting period. As can be seen, a total of 32 visits were conducted from PHDs to
ODs versus 258 planned (12%), 33 visits from PHDs to RHs versus 268planned (12%), and 1206 visits from
ODs to HCs versus 5,872 planned (21%). Overall, a total of 11,712 visits were conducted against 6,291
No DESCRIPT
ION
CENTRAL TO
PHDS
CENTRAL TO
ODS
CENTRAL TO
RHS
CENTRAL TO
HCS TOTAL COMMENT
PLAN ACH PLAN ACH PLAN ACH PLAN ACH PLAN ACH
1 NNP 20 0 20 0 20 0 74 0 134 0 Not supported by Pooled Fund from semester 2, 2014
2 NRHP 100 90 0 0 30 30 88 78 218 198 Fund supported by UNFPA
3 NIP 198 0 198 0 198 0 198 0 792 0 Not supported by Pooled Fund from semester 2, 2014
4 Dengue 72 0 144 0 72 0 384 0 672 0 Not supported by Pooled Fund from semester 2, 2015
5 Helminth 2 0 2 0 0 0 2 0 6 0 Not supported by Pooled Fund from semester 2, 2014
6 NCHP 36 36 41 47 9 9 60 60 146 152 Supported by National budget
7
NC.
Traditiona
l Medicine 18 0 18 0
Not supported by Pooled Fund from semester 2, 2014
1 DPHI 308 0 0
0
0
308 0 Not supported by Pooled Fund from semester 2, 2014
2 DBF 196 0 0
0
0
196 0 Not supported by Pooled Fund from semester 2, 2014
3 HSD 0
0
144 0 0
144 0 Not supported by Pooled Fund from semester 2, 2014
4 DPM 30 0 26 0 24 0 102 0 184 0 Not supported by Pooled Fund from semester 2, 2014
5 DP 20 0 18 0 18 0 44 0 100 0 Not supported by Pooled Fund from semester 2, 2014
6 DDF 90 0 66 0 38 0 250 0 444 0 Not supported by Pooled Fund from semester 2, 2014
7 CDC 40 0 40 0 24 0 40 0 144 0 Not supported by Pooled Fund from semester 2, 2014
8 Admin 60 0 60 0 60 0 0
180 0 Not supported by Pooled Fund from semester 2, 2014
9 HRD (To
RTCs) 28 0 0
0
0
28 0 Not supported by Pooled Fund from semester 2, 2014
10 DIC 26 0 0
0
0
26 0 Not supported by Pooled Fund from semester 2, 2014
11 DIA 12 0 20 0 12 0 10 0 54 0 Not supported by Pooled Fund from semester 2, 2014
12 CMS 0
0
0
0
0 0
Only distribution of drugs and medical supplies to
provinces and not supported by Pooled Fund from
semester 2, 2014
13 Legislatio
n Dept 8 0 26 0 0
0
34 0 Not supported by Pooled Fund from semester 2, 2014

62
planned yielding an achievement rate of 53.71% .Detailed reasons with explanations for under-
achievement of number of planned visits are listed in the “Comments” column below.
No PROVINCE
PHD TO OD PHD TO RH OD TO HCS TOTAL
% COMMENT PLAN ACH PLAN ACH PLAN ACH PLAN ACH.
1 BanteayMeanchey 24 1 30 1 458 391 512 393 77% Funded by SDG, GAVI
& Government
2 Battambang 15 0 12 0 474 0 501 0 0% No fund
3 Kg Thom 6 0 6 0 132 108 144 108 75% Funded by Unicef&UNFPA
4 Kg Speu 9 0 9 0 300 0 318 0 0% No fund
5 Kampot 16 8 16 8 354 0 386 16 4% No fund
6 Kep 0 0 6 1 24 4 30 5 17% No fund, not done in S2
7 Kratie 12 0 12 0 82 0 106 0 0% No fund
8 Odor Meanchey 96 92 96 92 96% Supported by SDG
PHD no Fund
9 Pailin 4 0 36 0 40 0 0% No fund
10 PreahVihear 4 4 4 4 276 207 284 215 76% Supported by SDG,
PHD no Fund
11 Pursat 24 12 24 12 168 158 216 182 84% Funded by Unicef &
UNFPA
12 Stung Treng 3 0 3 0 72 72 78 72 92% Supported by SDG
13 Kampong Cham 14 7 14 7 348 188 376 202 54
Supported by
Government budget and
not supported by Pooled
Fund from Semester 2,
2014 onwards, and lack of
staff
14 Kampong Chhnang 120 40 120 35 2,398 849 2,638 924 35
Supported by
Government Budget and
UNFPA, lack of budget,
lack of transportation,
and overlap of times
15 Kandal 40 35 40 30 392 305 472 370 78 Supported by
Government Budget and
UNFPA
16 Koh Kong 20 10 10 2 288 286 318 298 94
Supported by
Government Budget, SDG,
and UNFPA Budgets
17 Mondulkiri
4 4 11 11 15 15 100 Supported by UNFPA
18 Prey Veng 642 476 234 120 1501 735 2,377 1,331 56
Supported by
Government UNFPA
budget and released
not matched budget
planned

63
No PROVINCE
PHD TO OD PHD TO RH OD TO HCS TOTAL
% COMMENT PLAN ACH PLAN ACH PLAN ACH PLAN ACH.
19 Preah Sihanouk
282 97 282 97 34
Supported by
Government Budget,
UNFPA, and GAVI and lack
of budget
20 Phnom Penh 48 24 63 35 396 285 507 344 68 Supported by UNFPA and
lack of budget
21 Ratanakiri 54 47 14 12 253 253 321 312 97 Supported by
Government budget, SDG,
UNFPA, UNICEF, and GAVI
22 SvayRieng 30 16 30 30 576 334 636 380 60 Supported by
Government budget,
UNFPA, and GAVI
23 Siem Reap 80 64 20 18 528 528 628 610 97
Supported by
Government budget, SDG,
and UNFPA and lack of
human resources
sometime
24 Takeo 20 12 4 2 304 228 328 242 74 Supported by
Government budget and
SDG
25 TbongKhmum 20 15 20 18 63 50 103 83 81 Supported by
Government budget and
SDG
1,177 771 699 339 9,812 5,181 11,712 6,291 53.71%
Note: Due to reduction in Program support, some PHDs and ODs set targets for 6 months while others set full year targets, hence rates of
target achievement vary widely.
Source: PHD reports

64
CHAPTER 11. PROGRAM PROCUREMENT
11.1 WORKS
1. NCB PACKAGE
Works for Improvement of water supply for Health Centers (Drill well with supply water pump & solar for water pump) for 280 HCs and 21 Provinces.
Works for Improvement in sanitation for Health Centers (Incinerator, Dump Pit, Toilet/Bath & Septic and Water Tanks) for 560 HCs.
Works for Improvement in sanitation for 12 Provinces.
11.2 GOODS
1. ICB PACKAGE
Medical Equipment 15 RHs : Contract signed on 12 June, 2015
2. NCB PACKAGE
Furniture for 15 RHs : Contract signed on 1st April 2015
Medical Materials & Equipment for Eye Health Program
3. NATIONAL SHOPPING PACKAGE
Laptop Computer (22 units) for Quality of Care Assessment Team of MoH
11.3 INDIVIDUAL CONSULTANTS
Contracts for all individual consultants: Contract have been signed
11.4 CONSULTANT FIRMS AND HEALTH EQUITY FUND OPERATORS
Health Equity Fund: Cluster (1, 2, 3, 4, 5, 6, 7, 8, 9, 10, 11, 13, 14, 15, 16, 17, 18, 19, 20, 21, 22, 26,
27, 28, 29 and 30) contract have been extended.