2015-2016 School Year State of Washington 1191FSUM I ... · Estimated Funding Report (State Summary...
53
State of Washington Superintendent of Public Instruction Run February 06, 2017 12:00 PM Estimated Funding Report (State Summary Final) 2015-2016 School Year Apportionment Final 1191FSUM Account 3100 I. Computation for Guaranteed School-Generated Entitlement A. District-Wide Staff Mix TOTALS 1. District-Wide Staff Mix 1.54090 B. School Generated – Certificated Instructional Staff (CIS) 1. School CIS Salary Maintenance Total $ 2,498,647,901.80 [School Generated CIS FTE] * [CIS - Salary Maint] * [CIS Mix] 47,475.917 * 34,155.23 * 1.54090 2. CIS School Salary Increase $ 74,931,272.94 [School Generated CIS FTE] * [CIS - Salary Inc] * [CIS Mix] - [School CIS Salary Maint Total] 47,475.917 * 35,179.50 * 1.54090 - 2,498,647,901.80 3. Subtotal School Generated CIS Salary $ 2,573,579,174.74 [School CIS Salary Maint Total] + [School CIS Salary Inc Total] 2,498,647,901.80 + 74,931,272.94 C. School Generated – Certificated Administrative Staff (CAS) 1. School CAS Salary Maintenance Total $ 178,040,256.57 [School Generated CAS FTE] * [CAS - Salary Maint] 2,969.923 * 59,947.77 2. CAS Salary Increase $ 5,341,609.41 [School Generated CAS FTE] * [CAS - Salary Inc] - [School CAS Salary Maint Total] 2,969.923 * 61,746.34 - 178,040,256.57 3. Subtotal School Generated CAS Salary $ 183,381,865.98 [School CAS Salary Maint Total] + [School CAS Salary Inc Total] 178,040,256.57 + 5,341,609.41 D. School Generated – Classified Staff (CLS) 1. CLS Salary Maintenance Level $ 365,995,261.20 [School Generated CLS FTE] * [CLS - Salary Maint] 11,319.520 * 32,333.11 2. CLS Salary Increase $ 10,979,891.17 [School Generated CLS FTE] * [CLS - Salary Inc] - [School CLS Salary Maint Total] 11,319.520 * 33,303.10 - 365,995,261.20 3. Subtotal School Generated CLS Salary $ 376,975,152.37 [School CLS Salary Maint Total] + [School CLS Salary Inc Total] 365,995,261.20 + 10,979,891.17 E. Other School Generated Entitlements 1. Substitutes $ 26,261,024.73 [TEACHERS FTE] * [Substitutes Days] * [Substitutes Rate] 43,232.294 * 4.000 * 151.86 Page 1 of 7
Transcript of 2015-2016 School Year State of Washington 1191FSUM I ... · Estimated Funding Report (State Summary...

State of Washington
Superintendent of Public Instruction Run February 06, 2017 12:00 PM
Estimated Funding Report (State Summary Final)
2015-2016 School Year
Apportionment Final
1191FSUM
Account 3100
I. Computation for Guaranteed School-Generated Entitlement
A. District-Wide Staff Mix TOTALS
1. District-Wide Staff Mix 1.54090
B. School Generated – Certificated Instructional Staff (CIS)
1. School CIS Salary Maintenance Total $ 2,498,647,901.80
[School Generated CIS FTE] * [CIS - Salary Maint] * [CIS Mix]
47,475.917 * 34,155.23 * 1.54090
2. CIS School Salary Increase $ 74,931,272.94
[School Generated CIS FTE] * [CIS - Salary Inc] * [CIS Mix] - [School CIS Salary Maint Total]
47,475.917 * 35,179.50 * 1.54090 - 2,498,647,901.80
3. Subtotal School Generated CIS Salary $ 2,573,579,174.74
[School CIS Salary Maint Total] + [School CIS Salary Inc Total]
2,498,647,901.80 + 74,931,272.94C. School Generated – Certificated Administrative Staff (CAS)
1. School CAS Salary Maintenance Total $ 178,040,256.57
[School Generated CAS FTE] * [CAS - Salary Maint]
2,969.923 * 59,947.77
2. CAS Salary Increase $ 5,341,609.41
[School Generated CAS FTE] * [CAS - Salary Inc] - [School CAS Salary Maint Total]
2,969.923 * 61,746.34 - 178,040,256.57
3. Subtotal School Generated CAS Salary $ 183,381,865.98
[School CAS Salary Maint Total] + [School CAS Salary Inc Total]
178,040,256.57 + 5,341,609.41
D. School Generated – Classified Staff (CLS)
1. CLS Salary Maintenance Level $ 365,995,261.20
[School Generated CLS FTE] * [CLS - Salary Maint]
11,319.520 * 32,333.11
2. CLS Salary Increase $ 10,979,891.17
[School Generated CLS FTE] * [CLS - Salary Inc] - [School CLS Salary Maint Total]
11,319.520 * 33,303.10 - 365,995,261.20
3. Subtotal School Generated CLS Salary $ 376,975,152.37
[School CLS Salary Maint Total] + [School CLS Salary Inc Total]
365,995,261.20 + 10,979,891.17E. Other School Generated Entitlements
1. Substitutes $ 26,261,024.73
[TEACHERS FTE] * [Substitutes Days] * [Substitutes Rate]
43,232.294 * 4.000 * 151.86
Page 1 of 7

2. Small School District and Remote & Necessary Substitutes $ 331,963.14
[SS RN CIS FTE] * [Teacher %] * [Substitutes Days] * [Substitutes Rate]
595.960 * 0.9170 * 4.000 * 151.86
II. Computation for Guaranteed District-Generated Entitlement
A. District Generated – Facilities, Maintenance, Grounds – Classified Staff (CLS)
1. CLS Salary Maintenance Level $ 54,985,255.09
[Facilities FTE] * [CLS - Salary Maint]
1,700.325 * 32,338.09
2. CLS Salary Increase $ 1,649,560.81
[Facilities FTE] * [CLS - Salary Inc] - [Facilities Salary Maint Total]
1,700.325 * 33,308.23 - 54,985,255.09
3. Subtotal Facilities, Maintenance, Grounds Salary $ 56,634,815.90
[Facilities Salary Maint Total] + [Facilities Salary Inc Total]
54,985,255.09 + 1,649,560.81
B. District Generated – Warehouse, Laborers, Mechanics - Classified Staff (CLS)
1. CLS Salary Maintenance Level $ 10,069,044.74
[Warehouse FTE] * [CLS - Salary Maint]
311.368 * 32,338.08
2. CLS Salary Increase $ 302,071.41
[Warehouse FTE] * [CLS - Salary Inc] - [Warehouse Salary Maint Total]
311.368 * 33,308.23 - 10,069,044.74
3. Subtotal Warehouse, Laborers, Mechanics Salary $ 10,371,116.15
[Warehouse Salary Maint Total] + [Warehouse Salary Inc Total]
10,069,044.74 + 302,071.41C. District Generated - Technology - Classified Staff (CLS)
1. CLS Salary Maintenance Level $ 19,046,126.45
[Technology FTE] * [CLS - Salary Maint]
588.969 * 32,338.08
2. CLS Salary Increase $ 571,384.68
[Technology FTE] * [CLS - Salary Inc] - [Technology Salary Maint Total]
588.969 * 33,308.22 - 19,046,126.45
3. Subtotal Technology Salary $ 19,617,511.13
[Technology Salary Maint Total] + [Technology Salary Inc Total]
19,046,126.45 + 571,384.68
D. Central Administration – Classified Staff (CLS)
1. CLS Salary Maintenance Level $ 81,132,300.07
[Central Admin CLS FTE] * [CLS - Salary Maint]
2,508.942 * 32,337.26
2. CLS Salary Increase $ 2,433,975.44
[Central Admin CLS FTE] * [CLS - Salary Inc] - [Central Admin CLS Salary Maint Total]
2,508.942 * 33,307.38 - 81,132,300.07
Page 2 of 7
1191FSUM
Run February 06, 2017 12:00 PM
TOTALS
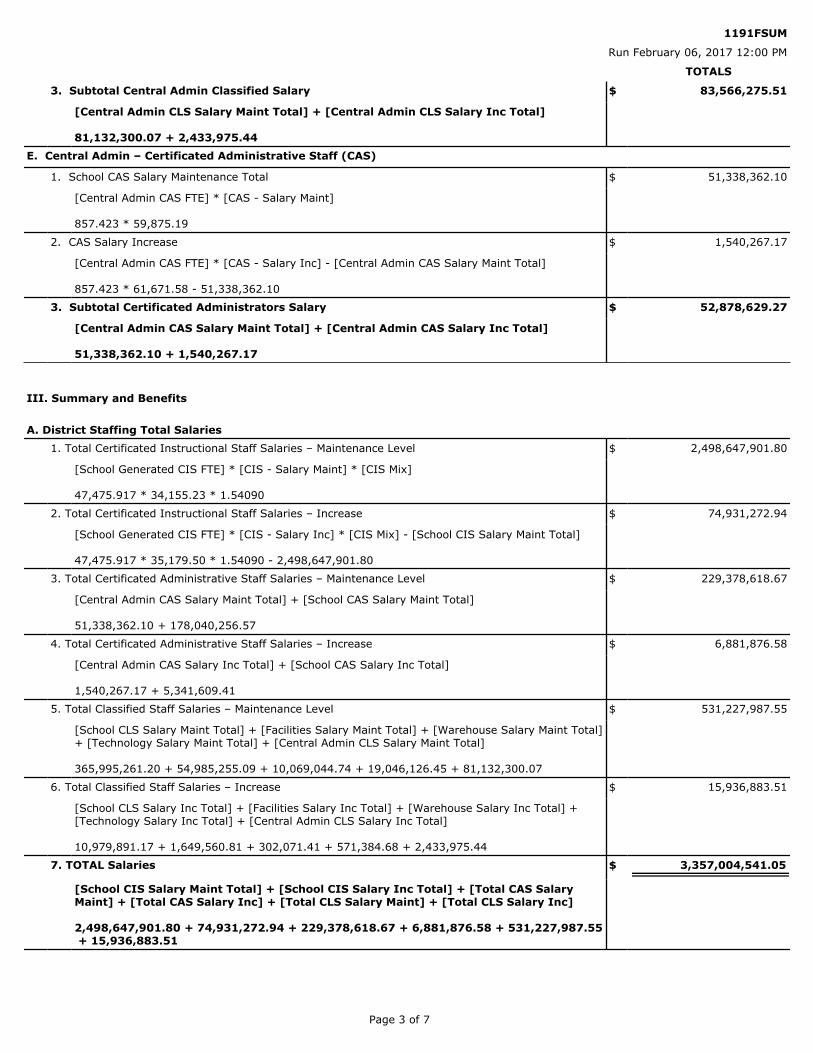
3. Subtotal Central Admin Classified Salary $ 83,566,275.51
[Central Admin CLS Salary Maint Total] + [Central Admin CLS Salary Inc Total]
81,132,300.07 + 2,433,975.44E. Central Admin – Certificated Administrative Staff (CAS)
1. School CAS Salary Maintenance Total $ 51,338,362.10
[Central Admin CAS FTE] * [CAS - Salary Maint]
857.423 * 59,875.19
2. CAS Salary Increase $ 1,540,267.17
[Central Admin CAS FTE] * [CAS - Salary Inc] - [Central Admin CAS Salary Maint Total]
857.423 * 61,671.58 - 51,338,362.10
3. Subtotal Certificated Administrators Salary $ 52,878,629.27
[Central Admin CAS Salary Maint Total] + [Central Admin CAS Salary Inc Total]
51,338,362.10 + 1,540,267.17
III. Summary and Benefits
A. District Staffing Total Salaries
1. Total Certificated Instructional Staff Salaries – Maintenance Level $ 2,498,647,901.80
[School Generated CIS FTE] * [CIS - Salary Maint] * [CIS Mix]
47,475.917 * 34,155.23 * 1.54090
2. Total Certificated Instructional Staff Salaries – Increase $ 74,931,272.94
[School Generated CIS FTE] * [CIS - Salary Inc] * [CIS Mix] - [School CIS Salary Maint Total]
47,475.917 * 35,179.50 * 1.54090 - 2,498,647,901.80
3. Total Certificated Administrative Staff Salaries – Maintenance Level $ 229,378,618.67
[Central Admin CAS Salary Maint Total] + [School CAS Salary Maint Total]
51,338,362.10 + 178,040,256.57
4. Total Certificated Administrative Staff Salaries – Increase $ 6,881,876.58
[Central Admin CAS Salary Inc Total] + [School CAS Salary Inc Total]
1,540,267.17 + 5,341,609.41
5. Total Classified Staff Salaries – Maintenance Level $ 531,227,987.55
[School CLS Salary Maint Total] + [Facilities Salary Maint Total] + [Warehouse Salary Maint Total] + [Technology Salary Maint Total] + [Central Admin CLS Salary Maint Total]
365,995,261.20 + 54,985,255.09 + 10,069,044.74 + 19,046,126.45 + 81,132,300.07
6. Total Classified Staff Salaries – Increase $ 15,936,883.51
[School CLS Salary Inc Total] + [Facilities Salary Inc Total] + [Warehouse Salary Inc Total] + [Technology Salary Inc Total] + [Central Admin CLS Salary Inc Total]
10,979,891.17 + 1,649,560.81 + 302,071.41 + 571,384.68 + 2,433,975.44
7. TOTAL Salaries $ 3,357,004,541.05
[School CIS Salary Maint Total] + [School CIS Salary Inc Total] + [Total CAS Salary Maint] + [Total CAS Salary Inc] + [Total CLS Salary Maint] + [Total CLS Salary Inc]
2,498,647,901.80 + 74,931,272.94 + 229,378,618.67 + 6,881,876.58 + 531,227,987.55 + 15,936,883.51
Page 3 of 7
1191FSUM
Run February 06, 2017 12:00 PM
TOTALS

7. Classified – Payroll Tax and Benefits $ 120,694,998.81
[Total CLS Salary Maint] * [CLS - Benefits Maint]
531,227,987.55 * 0.22720
8. Classified — Payroll Tax and Benefits – Increase $ 3,063,069.07
[Total CLS Salary Inc] * [CLS - Benefits inc]
15,936,883.51 * 0.19220
9. Total Insurance Payroll Taxes and Benefits $ 1,382,451,306.71
[CIS/CAS Insurance Maint Total] + [CIS/CAS Insurance Inc Total] + [CLS Insurance Maint Total] + [CLS Insurance Inc Total] + [CIS/CAS Benefits Maint Total] + [CIS/CAS Benefits Inc Total] + [CLS Benefits Maint Total] + [CLS Benefits Inc Total]
472,810,871.68 + 7,387,670.00 + 174,425,249.48 + 2,725,394.49 + 584,343,280.67 + 17,000,772.51 + 120,694,998.81 + 3,063,069.07
C. Running Start (Community and Technical College FTEs)
1. Non CTE $ 108,727,685.55
[Enroll Run Start] * [Run Start - Reg Rate]
17,234.59 * 6,308.69
2. CTE $ 8,772,137.28
[Enroll Run Start CTE] * [Run Start - CTE Rate]
1,327.36 * 6,608.71
3. Total Running Start $ 117,499,822.83
B. Staff Units Insurance, Payroll Taxes, and Benefits
1. Certificated Insurance Benefits $ 472,810,871.68
([School Generated CIS FTE] + [District Total CAS FTE]) * [Health Insurance]
(47,475.917 + 3,827.346) * 9,216.00
2. Certificated Insurance Benefits — Increase $ 7,387,670.00
(([School Generated CIS FTE] + [District Total CAS FTE]) * [Health Insurance Inc]) - [CIS/CAS Insurance Maint Total]
((47,475.917 + 3,827.346) * 9,360.00) - 472,810,871.68
3. Classified Insurance Benefits $ 174,425,249.48
[District Total CLS FTE] * [Health Insurance] * [CLS Health Factor]
16,429.124 * 9,216.00 * 1.152
4. Classified Insurance Benefits — Increase $ 2,725,394.49
([District Total CLS FTE] * [Health Insurance Inc] * [CLS Health Factor]) - [CLS Insurance Maint Total]
(16,429.124 * 9,360.00 * 1.152) - 174,425,249.48
5. Certificated — Payroll Tax and Benefits $ 584,343,280.67
([School CIS Salary Maint Total] + [Total CAS Salary Maint]) * [CIS/CAS - Benefits Maint]
(2,498,647,901.80 + 229,378,618.67) * 0.21420
6. Certificated — Payroll Tax and Benefits – Increase $ 17,000,772.51
([School CIS Salary Inc Total] + [Total CAS Salary Inc]) * [CIS/CAS - Benefits Inc]
(74,931,272.94 + 6,881,876.58) * 0.20780
Page 4 of 7
1191FSUM
Run February 06, 2017 12:00 PM
TOTALS

[Run Start-Reg] + [Run Start-CTE]
108,727,685.55 + 8,772,137.28D. Total Dropout Reengagement
1. Non CTE 19,771,308.35
[Enroll Reengage] * [Run Start - Reg Rate]
3,133.98 * 6,308.69
2. CTE 323,760.69
[Enroll Reengage CTE] * [Run Start - CTE Rate]
48.99 * 6,608.71
3. Total Dropout Reengagement 20,095,069.04
[Reengage - Reg] + [Reengage - CTE]
19,771,308.35 + 323,760.69
E. Alternative Learning Experience (ALE)
Total Alternative Learning Experience 169,125,001.75
([Enroll ALE K-6] + [Enroll ALE 7-8] + [Enroll ALE 9-12]) * [Run Start - Reg Rate]
(8,780.06 + 3,632.18 + 14,396.02) * 6,308.69
F. Materials, Supplies, and Operating Costs (MSOC)
1. Regular Instruction $ 1,134,852,326.35
[Total MSOC Technology-Reg] + [Total MSOC Utilities-Reg] + [Total MSOC Curriciulum-Reg] + [Total MSOC Library/Supplies-Reg] + [Total MSOC Prof Dvlp-Reg] + [Total MSOC Facilities-Reg] + [Total MSOC Districtwide-Reg]
119,267,113.25 + 324,076,047.63 + 128,054,821.39 + 271,865,619.02 + 19,807,513.01 + 160,551,522.42 + 111,229,689.63
2. Grades 9-12 Additional $ 48,784,762.37
[Total MSOC Technology-LabSci] + [Total MSOC Utilities-LabSci] + [Total MSOC Curriciulum-LabSci] + [Total MSOC Library/Supplies-LabSci] + [Total MSOC Prof Dvlp-LabSci] + [Total MSOC Facilities-LabSci] + [Total MSOC Districtwide-LabSci]
10,733,117.29 + 0.00 + 11,707,521.12 + 24,392,381.16 + 1,951,742.80 + 0.00 + 0.00
3. Small School District and Remote & Necessary MSOC enhancement $ 7,023,268.93
([SS RN CIS FTE] + [SS RN CAS FTE]) * [MSOC -SSRN]
(595.960 + 31.981) * 11,184.60
4. Total General Education MSOC $ 1,190,660,357.65
[Total MSOC -Reg] + [Total MSOC -9-12 Add] + [Total MSOC -SS RN]
1,134,852,326.35 + 48,784,762.37 + 7,023,268.93
G. Career, Technical Education and Skills Centers
1. Grades 7-8 Career & Technical Education – Total $ 52,891,868.10
[CTE 7-8 CIS Salary Total] + [CTE 7-8 CAS Salary Total] + [CTE 7-8 CLS Salary Total] + [CTE 7-8 insurance/Benefits Total] + [Total MSOC CTE 7-8] + [CTE 7-8 Substitutes]
21,994,804.04 + 2,113,054.25 + 4,725,018.04 + 11,857,064.09 + 11,972,502.48 + 229,425.20
Page 5 of 7
1191FSUM
Run February 06, 2017 12:00 PM
TOTALS

2. Grades 9 - 12 Career & Technical Education – Total $ 349,255,755.34
[CTE 9-12 CIS Salary Total] + [CTE 9-12 CAS Salary Total] + [CTE 9-12 CLS Salary Total] + [CTE 9-12 insurance/Benefits Total] + [Total MSOC CTE 9-12] + [CTE 9-12 Substitutes]
144,856,609.73 + 14,029,893.14 + 31,351,304.17 + 78,370,831.13 + 79,130,760.40 + 1,516,356.77
3. Skills Center – Total $ 39,450,561.57
[Skills CIS Salary Total] + [Skills CAS Salary Total] + [Skills CLS Salary Total] + [Skills insurance/Benefits Total] + [Total MSOC -Skills] + [Skills Center Substitutes]
17,615,597.00 + 1,727,595.29 + 3,273,195.94 + 9,260,351.34 + 7,387,950.21 + 185,871.79
4. Total Career and Technical Education and Skills Centers $ 441,598,185.01
[CTE 7-8 Total] + [CTE 9-12 Total] + [Skills Center Total]
52,891,868.10 + 349,255,755.34 + 39,450,561.57
IV. Guaranteed Entitlement
1. Total Guaranteed Entitlement $ 6,705,027,271.91
[Substitutes] + [SS RN Substitutes] + [TOTAL Salaries] + [TOTAL Benefits] + [Total Run Start] + [Total Reengage] + [Total ALE] + [Total GenEd MSOC] + [Total CTE/Skills]
26,261,024.73 + 331,963.14 + 3,357,004,541.05 + 1,382,451,306.71 + 117,499,822.83 + 20,095,069.04 + 169,125,001.75 + 1,190,660,357.65 + 441,598,185.01
V. Allocation Rates per Student
1. Basic Education Allocation Per FTE Student Rate $ 6,350.37
2. BEA Rate for Special Education $ 0.00
VI. Computation of State Funded Support
1. Local Deductible Revenue Sources
a. 1400 Local In-Lieu-Of Taxes $ 613,626.25
b. 1600 County Administered Forests $ 785,092.92
c. 3600 State Forests $ 13,500,159.33
d. 5400 Federal In-Lieu-Of Taxes $ 131,728.71
e. Total Deductible Revenue $ 15,030,607.21
[1400 Local In-Lieu-Of Taxes] + [1600 County Administered Forests] + [3600 State Forests] + [5400 Federal In-Lieu-Of Taxes]
613,626.25 + 785,092.92 + 13,500,159.33 + 131,728.71
2. BEA Reduce/Delay $ 200,000.00
3. General Apportionment Allocation for Special Ed Account 3121 $ 199,561,847.00
4. Total Due on Apportionment Schedule $ 6,490,234,817.70
[Total Guaranteed Entitlement] - [Local Deductible Revenue Sources] - [BEA Reduce/Delay] - [SpEd general apport 3121]
6,705,027,271.91 - 15,030,607.21 - 200,000.00 - 199,561,847.005. Federal Forest Account 5500 Deduction $ 0.00
6. Emergency Payment $ 0.00
7. Fire District Payment $ 594,173.83
8. Oversight Fee 201,067.44
9. Adjustment for prior year $ -1,673,959.30
10. Total Amount to be Paid Sept. 2015 - Aug. 2016 in Account 3100 $ 6,488,953,964.79
[Total Due on Apportionment Schedule] - [5500 Federal Forest] + [Emergency] + [Fire Dist Payment] - [Charter Oversight Fee] + [3100 Adjustment PY]
6,490,234,817.70 - 0.00 + 0.00 + 594,173.83 - 201,067.44 + -1,673,959.30
Page 6 of 7
1191FSUM
Run February 06, 2017 12:00 PM
TOTALS

VII. Analysis of Total Amount to be Paid
1. Total Allotment (3100) Paid Previously $ 6,484,439,115.43
2. Advance Payment This Year $ 0.00
3. Recovery $ 0.00
4. Other Deductions and/or Recoveries $ 284,361.31
5. Adjustment for 2015-16 $ 4,230,488.05
[Total Amount to be Paid 3100] - [3100 Total Paid Previously] - [3100 Recovery] - [3100 Other Deductions]
6,488,953,964.79 - 6,484,439,115.43 - 0.00 - 284,361.31
Page 7 of 7
1191FSUM
Run February 06, 2017 12:00 PM
TOTALS
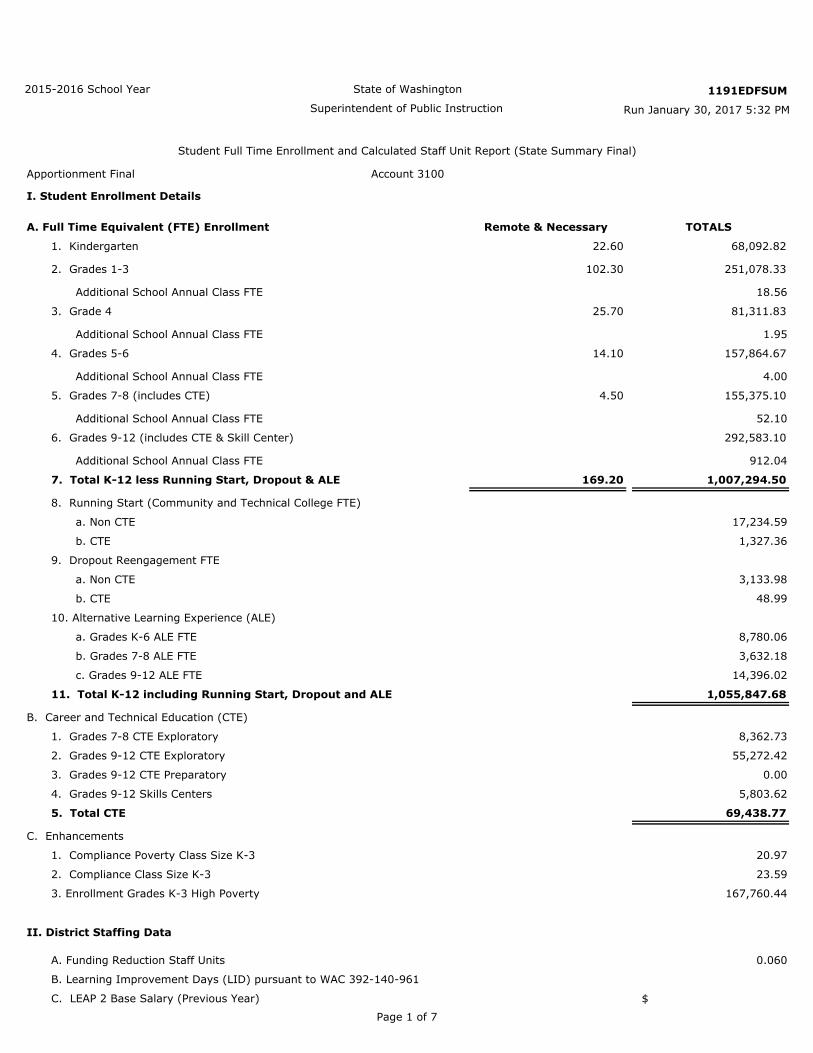
II. District Staffing Data
A. Funding Reduction Staff Units 0.060
B. Learning Improvement Days (LID) pursuant to WAC 392-140-961
C. LEAP 2 Base Salary (Previous Year) $
State of Washington
Superintendent of Public Instruction Run January 30, 2017 5:32 PM
Student Full Time Enrollment and Calculated Staff Unit Report (State Summary Final)
2015-2016 School Year
Apportionment Final
1191EDFSUM
Account 3100
I. Student Enrollment Details
A. Full Time Equivalent (FTE) Enrollment Remote & Necessary TOTALS
1. Kindergarten 22.60 68,092.82
2. Grades 1-3 102.30 251,078.33
Additional School Annual Class FTE 18.56
3. Grade 4 25.70 81,311.83
Additional School Annual Class FTE 1.95
4. Grades 5-6 14.10 157,864.67
Additional School Annual Class FTE 4.00
5. Grades 7-8 (includes CTE) 4.50 155,375.10
Additional School Annual Class FTE 52.10
6. Grades 9-12 (includes CTE & Skill Center) 292,583.10
Additional School Annual Class FTE 912.04
7. Total K-12 less Running Start, Dropout & ALE 169.20 1,007,294.50
8. Running Start (Community and Technical College FTE)
a. Non CTE 17,234.59
b. CTE 1,327.36
9. Dropout Reengagement FTE
a. Non CTE 3,133.98
b. CTE 48.99
10. Alternative Learning Experience (ALE)
a. Grades K-6 ALE FTE 8,780.06
b. Grades 7-8 ALE FTE 3,632.18
c. Grades 9-12 ALE FTE 14,396.02
11. Total K-12 including Running Start, Dropout and ALE 1,055,847.68
B. Career and Technical Education (CTE)
1. Grades 7-8 CTE Exploratory 8,362.73
2. Grades 9-12 CTE Exploratory 55,272.42
3. Grades 9-12 CTE Preparatory 0.00
4. Grades 9-12 Skills Centers 5,803.62
5. Total CTE 69,438.77
C. Enhancements
1. Compliance Poverty Class Size K-3 20.97
2. Compliance Class Size K-3 23.59
3. Enrollment Grades K-3 High Poverty 167,760.44
Page 1 of 7

D. Allocated CIS Base Salary (Previous Year) $
E. LEAP 2 Base Salary (Current Year) $
F. Allocated CIS Base Salary (Current Year) $
III. Formulated Staffing Units
A. School Generated
1. Principals 2,937.942
[Principal Elem FTE] + [Principal Middle FTE] + [Principal High FTE]
1,749.098 + 460.597 + 728.247
2. Classroom Teachers 43,232.294
[Teachers Elem FTE] + [Teachers Middle FTE] + [Teachers High FTE] + [Lab Science FTE]
26,894.719 + 6,185.672 + 9,704.350 + 447.553
3. Teacher Librarians 1,304.772
[Librarian Elem FTE] + [Librarian Middle FTE] + [Librarian High FTE]
925.501 + 176.679 + 202.592
4. Guidance Counselors 2,085.676
[Counselor Elem FTE] + [Counselor Middle FTE] + [Counselor High FTE]
688.193 + 413.961 + 983.522
5. Health And Social Services
a. School Nurses 163.701
[Nurses Elem FTE] + [Nurses Middle FTE] + [Nurses High FTE]
106.090 + 20.425 + 37.186
b. Social Workers 66.471
[Social Workers Elem FTE] + [Social Workers Middle FTE] + [Social Workers High FTE]
58.623 + 2.033 + 5.815
c. Psychologists 27.103
[Psychologists Elem FTE] + [Psychologists Middle FTE] + [Psychologists High FTE]
23.728 + 0.666 + 2.709
6. Teaching Assistance 1,797.450
[Teach Assist Elem FTE] + [Teach Assist Middle FTE] + [Teach Assist High FTE]
1,306.589 + 238.298 + 252.563
7. Office Support 4,866.394
[School Office Elem FTE] + [School Office Middle FTE] + [School Office High FTE]
2,808.613 + 791.492 + 1,266.289
8. Custodians 4,122.704
[Custodians Elem FTE] + [Custodians Middle FTE] + [Custodians High FTE]
2,313.060 + 661.111 + 1,148.533
9. Student & Staff Safety 196.229
[Security Elem FTE] + [Security Middle FTE] + [Security High FTE]
110.281 + 31.324 + 54.624
10. Family Involvement Coordinators 115.159
Page 2 of 7
1191EDFSUM
Run January 30, 2017 5:32 PM
TOTALS

[Family Involve Elem FTE] + [Family Involve Middle FTE] + [Family Involve High FTE]
115.159 + 0.000 + 0.000
Page 3 of 7
1191EDFSUM
Run January 30, 2017 5:32 PM
TOTALS

11. Total School Generated Staffing Units 60,915.835
[Principal FTE] + [Teachers FTE] + [Librarian FTE] + [Counselor FTE] + [Nurses FTE] + [Social Workers FTE] + [Psychologist FTE] + [Teaching Assist FTE] + [School Office FTE] + [Custodians FTE] + [Security FTE] + [Family Involve FTE] - [Staff Unit Reduction]
2,937.942 + 43,232.294 + 1,304.772 + 2,085.676 + 163.701 + 66.471 + 27.103 + 1,797.450 + 4,866.394 + 4,122.704 + 196.229 + 115.159 - 0.060
B. District Wide Support
1. Technology 588.969
([Enroll Total] - [Enroll 7-8 CTE] - [Enroll CTE/Skills 9-12]) * [Technology] / [Proto Enroll District]
(1,007,294.50 - 8,362.73 - 61,076.04) * 0.628 / 1,000.00
2. Facilities, Maintenance, Grounds 1,700.325
([Enroll Total] - [Enroll 7-8 CTE] - [Enroll CTE/Skills 9-12]) * [Facilities] / [Proto Enroll District]
(1,007,294.50 - 8,362.73 - 61,076.04) * 1.813 / 1,000.00
3. Warehouse, Laborers, Mechanics 311.368
([Enroll Total] - [Enroll 7-8 CTE] - [Enroll CTE/Skills 9-12]) * [Warehouse] / [Proto Enroll District]
(1,007,294.50 - 8,362.73 - 61,076.04) * 0.332 / 1,000.00
4. Central Administration Total 3,366.365
( [School Generated FTE] + [Technology FTE] + [Facilities FTE] + [Warehouse FTE] ) * [Central Admin Percent]
( 60,915.835 + 588.969 + 1,700.325 + 311.368 ) * 0.05300
a. Certificated Administrators 857.423
[Central Admin Total FTE] * [Central Admin CAS%]
3,366.365 * 0.25470
b. Classified Staff 2,508.942
[Central Admin Total FTE] * [Central Admin CLS%]
3,366.365 * 0.74530
Page 4 of 7
1191EDFSUM
Run January 30, 2017 5:32 PM
TOTALS

C. Small District Or Remote & Necessary
1. Small School K-8 <= 5
a. Certificated Administration 0.000
If: [Enroll K-6] + [Enroll 7-8] > 0 AND <= 5 Then, If: [Enroll 7-8] = 0 Then: 0.24 - {([Enroll K-3] * [Pupil K-3 CAS]) + ([Enroll 4] * [Pupil 4 CAS]) + ([Enroll 5-6] * [Pupil 5-6 CAS])} Else: 0.32 - {([Enroll K-3] * [Pupil K-3 CAS]) + ([Enroll 4] * [Pupil 4 CAS]) + ([Enroll 5-6] * [Pupil 5-6 CAS]) + ([Enroll 7-8] * [Pupil 7-8 CAS])} Else: 0
b. Certificated Instructional 0.000
If: [Enroll K-6] + [Enroll 7-8] > 0 AND <= 5 Then, If: [Enroll 7-8] = 0 Then: 1.76 - {([Enroll K-3] * [Pupil K-3 CIS]) + ([Enroll 4] * [Pupil 4 CIS]) + ([Enroll 5-6] * [Pupil 5-6 CIS])} Else: 1.68 - {([Enroll K-3] * [Pupil K-3 CIS]) + ([Enroll 4] * [Pupil 4 CIS]) + ([Enroll 5-6] * [Pupil 5-6 CIS]) + ([Enroll 7-8] * [Pupil 7-8 CIS])} Else: 0
2. Remote & Necessary K-8 <=5
a. Certificated Administration 0.616
If: [Enroll R&N K-6] + [Enroll R&N 7-8] > 0 AND <= 5 Then, If: [Enroll R&N 7-8] = 0 Then: 0.24 - ([Enroll R&N K-3] * [Pupil K-3 CAS]) + ([Enroll R&N 4] * [Pupil 4 CAS]) + ([Enroll R&N 5-6] * [Pupil 5-6 CAS])) Else: 0.32 - (([Enroll R&N K-3] * [Pupil K-3 CAS]) + ([Enroll R&N 4] * [Pupil 4 CAS]) + ([Enroll R&N 5-6] * [Pupil 5-6 CAS]) + ([Enroll R&N 7-8] * [Pupil 7-8 CAS])) Else: 0
b. Certificated Instructional 3.075
If: [Enroll R&N K-6] + [Enroll R&N 7-8] > 0 AND <= 5, Then, If: [Enroll R&N 7-8] = 0, Then: 1.76 - {([Enroll R&N K-3] * [Pupil K-3 CIS]) + ([Enroll R&N 4] * [Pupil 4 CIS]) + ([Enroll R&N 5-6] * [Pupil 5-6 CIS])}, Else: 1.68 - {([Enroll R&N K-3] * [Pupil K-3 CIS]) + ([Enroll R&N 4] * [Pupil 4 CIS]) + ([Enroll R&N 5-6] * [Pupil 5-6 CIS]) + ([Enroll R&N 7-8] * [Pupil 7-8 CIS])} Else: 0
3. Small School 5 < K-8 <= 25
a. Certificated Administration 1.441
If: [Enroll K-6 Total] + Enroll 7-8 Total > 5 AND <= 25 Then, If: Enroll 7-8 Total = 0 Then: 0.24 - {([Enroll K-3] * [Pupil K-3 CAS]) + ([Enroll 4] * [Pupil 4 CAS]) + ([Enroll 5-6] * [Pupil 5-6 CAS])} Else: 0.32 - {([Enroll K-3] * [Pupil K-3 CAS]) + ([Enroll 4] * [Pupil 4 CAS]) + ([Enroll 5-6] * [Pupil 5-6 CAS]) + (Enroll 7-8 Total * [Pupil 7-8 CAS])} Else: 0
b. Certificated Instructional 10.641
If: [Enroll K-6 Total] + Enroll 7-8 Total > 5 AND <= 25 Then, If: Enroll 7-8 Total = 0 Then: {1.76 + (([Enroll K-6 Total] - 5) / 20)} - {([Enroll K-3] * [Pupil K-3 CIS]) + ([Enroll 4] * [Pupil 4 CIS]) + ([Enroll 5-6] * [Pupil 5-6 CIS])} Else: {1.68 + (([Enroll K-8] - 5) / 10)} - {([Enroll K-3] * [Pupil K-3 CIS]) + ([Enroll 4] * [Pupil 4 CIS]) + ([Enroll 5-6] * [Pupil 5-6 CIS]) + (Enroll 7-8 Total * [Pupil 7-8 CIS])} Else: 0
4. Remote & Necessary 5 < K-8 <= 25
a. Certificated Administration 0.461
If: [Enroll R&N K-6] + [Enroll R&N 7-8] > 5 AND <= 25 Then, If: [Enroll R&N 7-8] = 0 Then: 0.24 - {([Enroll R&N K-3] * [Pupil K-3 CAS]) + ([Enroll R&N 4] * [Pupil 4 CAS]) + ([Enroll R&N 5-6] * [Pupil 5-6 CAS])} Else: 0.32 - {([Enroll R&N K-3] * [Pupil K-3 CAS]) + ([Enroll R&N 4] * [Pupil 4 CAS]) + ([Enroll R&N 5-6] * [Pupil 5-6 CAS]) + ([Enroll R&N 7-8] * [Pupil 7-8 CAS])} Else: 0
b. Certificated Instructional 3.179
If: [Enroll R&N K-6] + [Enroll R&N 7-8] > 5 AND <= 25 Then, If: [Enroll R&N 7-8] = 0 Then: {1.76 + (([Enroll R&N K-6] - 5) / 20)} - {([Enroll R&N K-3] * [Pupil K-3 CIS]) + ([Enroll R&N 4] * [Pupil 4 CIS]) + ([Enroll R&N 5-6] * [Pupil 5-6 CIS])} Else: {1.68 + (([Enroll R&N K-8] - 5) / 10)} - {([Enroll R&N K-3] * [Pupil K-3 CIS]) + ([Enroll R&N 4] * [Pupil 4 CIS]) + ([Enroll R&N 5-6] * [Pupil 5-6 CIS]) + ([Enroll R&N 7-8] * [Pupil 7-8 CIS])} Else: 0
5. Small School 25 < K-8 <= 100
a. Certificated Administration 4.477
([SS K-6 <60 CAS step 1] + [SS 7-8 >20 CAS step 2])
b. Certificated Instructional 47.857
([SS K-6 <60 CIS step 1] + [SS 7-8 >20 CIS step 2])
6. Remote & Necessary 25 < K-8 <= 100
a. Certificated Administration 0.395
([RN K-6 <60 CAS step 1] + [RN 7-8 >20 CAS step 2])
Page 5 of 7
1191EDFSUM
Run January 30, 2017 5:32 PM
TOTALS

b. Certificated Instructional 3.963
([RN K-6 <60 CIS step 1] + [RN 7-8 >20 CIS step 2])
7. Small High School
a. Certificated Administration 24.200
If: [Enroll 9-12 Total] > 0 AND <= 300 AND ([Enroll 9-12 Total] - [enroll 9-12 cte exp] - [Enroll 9-12 CTE Prep] - [Enroll Skills 9-12]) <> 0 Then, If: [Enroll 9-12 Total] <= 60 Then: 0.5 - ([Enroll 9-12 Total] * [Pupil 9-12 CAS]) Else: {0.5 + (([Enroll 9-12 Total] - 60) / 43.5)} - ([Enroll 9-12 Total] * [Pupil 9-12 CAS]) Else: 0
b. Certificated Instructional 512.997
If: [Enroll 9-12 Total] > 0 AND <= 300 AND ([Enroll 9-12 Total] - [Enroll 9-12 CTE exp] - [Enroll 9-12 CTE Prep] - [Enroll Skills 9-12]) <> 0 Then, If: [Enroll 9-12 Total] <= 60 Then: 9 - ([Enroll 9-12 Total] * [Pupil 9-12 CIS]) Else: {9 + (([Enroll 9-12 Total] - 60) / 43.5 * 0.8732)} - ([Enroll 9-12 Total] * [Pupil 9-12 CIS]) Else: 0
8. Non-High Districts
a. K-6 Certificated Instructional 1.000
If: [Enroll Total w/ Run Start] > 50 AND < 180 AND [Enroll 7-8] + [Enroll 9-12] = 0 Then: 0.50 Else: 0
b. K-8 Certificated Instructional 5.000
If: Enroll Total w/ Run Start > 70 AND < 180 AND [Enroll 7-8] > 0 AND [Enroll 9-12] = 0 Then: 0.50 Else: 0
9. Two Small Schools Or Remote & Necessary
a. Certificated Instructional 8.248
b. Certificated Administrative 0.391
10. Classified Bonus Units
a. Small Districts 213.584
([SS K-8 <5 CAS] + [SS K-8 <5 CIS] + [RN K-8 <5 CAS] + [RN K-8 <5 CIS] + [SS 5 < K-8 <25 CAS] + [SS 5 < K-8 <25 CIS] + [RN 5 < K-8 <25 CAS] + [RN 5 < K-8 <25 CIS] + [SS 25 < K-8 <100 CAS] + [SS 25 < K-8 <100 CIS] + [RN 25 < K-8 <100 CAS] + [RN 25 < K-8 <100 CIS] + [SS Small High CAS] + [SS Small High CIS] + [SS Non-High K-6] + [SS Non-High K-8] + [Add BEA CIS] + [Add BEA CAS]) / 2.94
b. Non-High Districts 8.000
If: Enroll Total w/ Run Start > 50 AND < 180 AND [Enroll 9-12] = 0 Then: 0.50 Else: 0
11. Small School and Remote and Necessary Subtotal
a. Certificated Instructional Staff (CIS) 595.960
[SS K-8 <5 CIS] + [RN K-8 <5 CIS] + [SS 5 < K-8 <25 CIS]+ [RN 5 < K-8 <25 CIS] + [SS 25 < K-8 <100 CIS] + [RN 25 < K-8 <100 CIS] + [SS Small High CIS] + [SS Non-High K-6] + [SS Non-High K-8] + [Add BEA CIS]
b. Certificated Administrative Staff (CAS) 31.981
[SS K-8 <5 CAS] + [RN K-8 <5 CAS] + [SS 5 < K-8 <25 CAS] + [RN 5 < K-8 <25 CAS] + [SS 25 < K-8 <100 CAS] + [RN 25 < K-8 <100 CAS] + [SS Small High CAS] + [Add BEA CAS]
c. Classified (CLS) 221.584
[SS CLS Small Districts] + [SS CLS Non-High]
D. District Summary
1. School Generated – General Education (Includes Small School District and Remote and Necessary Bonus Units)
a. Certificated Instructional Staff (CIS) 47,475.917
[Teachers FTE] + [Librarian FTE] + [Counselor FTE] + [Nurses FTE] + [Social Workers FTE] + [Psychologist FTE] + [SS RN CIS FTE] - [Staff Unit Reduction]
43,232.294 + 1,304.772 + 2,085.676 + 163.701 + 66.471 + 27.103 + 595.960 - 0.060
b. Certificated Administrative Staff (CAS) 2,969.923
[Principal FTE] + [SS RN CAS FTE]
2,937.942 + 31.981
c. Classified (CLS) 11,319.520
Page 6 of 7
1191EDFSUM
Run January 30, 2017 5:32 PM
TOTALS

[Teaching Assist FTE] + [School Office FTE] + [Custodians FTE] + [Security FTE] + [Family Involve FTE] + [SS RN CLS FTE]
1,797.450 + 4,866.394 + 4,122.704 + 196.229 + 115.159 + 221.584
2. District Level
a. Technology (CLS) 588.969
([Enroll Total] - [Enroll 7-8 CTE] - [Enroll CTE/Skills 9-12]) * [Technology] / [Proto Enroll District]
(1,007,294.50 - 8,362.73 - 61,076.04) * 0.628 / 1,000.00
b. Facilities, Maintenance, Grounds (CLS) 1,700.325
([Enroll Total] - [Enroll 7-8 CTE] - [Enroll CTE/Skills 9-12]) * [Facilities] / [Proto Enroll District]
(1,007,294.50 - 8,362.73 - 61,076.04) * 1.813 / 1,000.00
c. Warehouse, Laborers, Mechanics (CLS) 311.368
([Enroll Total] - [Enroll 7-8 CTE] - [Enroll CTE/Skills 9-12]) * [Warehouse] / [Proto Enroll District]
(1,007,294.50 - 8,362.73 - 61,076.04) * 0.332 / 1,000.00
d. Administrators - Central Administration (CAS) 857.423
[Central Admin Total FTE] * [Central Admin CAS%]
3,366.365 * 0.25470
e. Classified - Central Administration (CLS) 2,508.942
[Central Admin Total FTE] * [Central Admin CLS%]
3,366.365 * 0.74530
3. Total (School Generated and District Level)
a. Certificated Instructional Staff (CIS) 47,475.917
[Teachers FTE] + [Librarian FTE] + [Counselor FTE] + [Nurses FTE] + [Social Workers FTE] + [Psychologist FTE] + [SS RN CIS FTE] - [Staff Unit Reduction]
43,232.294 + 1,304.772 + 2,085.676 + 163.701 + 66.471 + 27.103 + 595.960 - 0.060
b. Certificated Administrative Staff (CAS) 3,827.346
[School Generated CAS FTE] + [Central Admin CAS FTE]
2,969.923 + 857.423c. Classified (CLS) 16,429.124
[School Generated CLS FTE] + [Technology FTE] + [Facilities FTE] + [Warehouse FTE] + [Central Admin CLS FTE]
11,319.520 + 588.969 + 1,700.325 + 311.368 + 2,508.942
Page 7 of 7
1191EDFSUM
Run January 30, 2017 5:32 PM
TOTALS

State of Washington
Superintendent of Public Instruction Run January 30, 2017 5:32 PM
Calculated Staff Units - Elementary School Report (State Summary Final)
2015-2016 School Year
Apportionment Final
1191EEFSUM
Account 3100
I. Formulated Staffing Units
A. School Generated TOTALS
1. Principals 1,749.098
[Enroll K-6] * [Principal Elem] / [Proto Enroll Elem]
558,372.16 * 1.253 / 400.00
2. Classroom Teachers 26,894.719
[Teachers K-3] + [Teachers K-3 HighPov] + [Teachers 4] + [Teachers 5-6]
7,395.717 + 9,267.297 + 3,478.431 + 6,753.274
a. Grades K-3 7,395.717
(([Enroll K-3] - [Enroll K-3 HighPov]) / [Comp Class Size K-3]) * (1 + [Planning K-3])
((319,189.71 - 167,760.44) / 49.85) * (1 + 0.155)
b. Grades K-3 High Poverty 9,267.297
([Enroll K-3 HighPov] /[Comp Pov Class Size K-3]) * (1 + [Planning K-3])
c. Grade 4 3,478.431
([Enroll 4] / [Class Size 4]) * (1 + [Planning 4])
(81,313.78 / 27.00) * (1 + 0.155)
d. Grades 5-6 6,753.274
([Enroll 5-6] / [Class Size 5-6]) * (1 + [Planning 5-6])
(157,868.67 / 27.00) * (1 + 0.155)
3. Teacher Librarians 925.501
[Enroll K-6] * [Librarian Elem] / [Proto Enroll Elem]
558,372.16 * 0.663 / 400.00
4. Guidance Counselors 688.193
[Enroll K-6] * [Counselor Elem] / [Proto Enroll Elem]
558,372.16 * 0.493 / 400.00
5. Health And Social Services
a. School Nurses 106.090
[Enroll K-6] * [Nurse Elem] / [Proto Enroll Elem]
558,372.16 * 0.076 / 400.00
b. Social Workers 58.623
[Enroll K-6] * [Social Worker Elem] / [Proto Enroll Elem]
558,372.16 * 0.042 / 400.00
c. Psychologists 23.728
[Enroll K-6] * [Psychologists Elem] / [Proto Enroll Elem]
558,372.16 * 0.017 / 400.00
Page 1 of 2

6. Teaching Assistance 1,306.589
[Enroll K-6] * [Teaching Assist Elem] / [Proto Enroll Elem]
558,372.16 * 0.936 / 400.00
7. Office Support 2,808.613
[Enroll K-6] * [School Office Elem] / [Proto Enroll Elem]
558,372.16 * 2.012 / 400.00
8. Custodians 2,313.060
[Enroll K-6] * [Custodians Elem] / [Proto Enroll Elem]
558,372.16 * 1.657 / 400.00
9. Student & Staff Safety 110.281
[Enroll K-6] * [Security Elem] / [Proto Enroll Elem]
558,372.16 * 0.079 / 400.00
10. Family Involvement Coordinators 115.159
[Enroll K-6] * [Family Involve Elem] / [Proto Enroll Elem]
558,372.16 * 0.0825 / 400.00
Page 2 of 2
1191EEFSUM
Run January 30, 2017 5:32 PM
TOTALS

State of Washington
Superintendent of Public Instruction Run January 30, 2017 5:32 PM
Calculated Staff Units - Middle School Report (State Summary Final)
2015-2016 School Year
Apportionment Final
1191EMFSUM
Account 3100
I. Formulated Staffing Units
A. School Generated TOTALS
1. Principals 460.597
([Enroll 7-8] - [Enroll 7-8 CTE]) * [Principal Middle] / [Proto Enroll Middle]
(155,427.20 - 8,362.73) * 1.353 / 432.00
2. Classroom Teachers 6,185.672
(([Enroll 7-8] - [Enroll 7-8 CTE]) / [Class Size 7-8]) * (1 + [Planning 7-8])
((155,427.20 - 8,362.73) / 28.53) * (1 + 0.200)
3. Teacher Librarians 176.679
([Enroll 7-8] - [Enroll 7-8 CTE]) * [Librarian Middle] / [Proto Enroll Middle]
(155,427.20 - 8,362.73) * 0.519 / 432.00
4. Guidance Counselors 413.961
([Enroll 7-8] - [Enroll 7-8 CTE]) * [Counselor Middle] / [Proto Enroll Middle]
(155,427.20 - 8,362.73) * 1.216 / 432.00
5. Health And Social Services
a. School Nurses 20.425
([Enroll 7-8] - [Enroll 7-8 CTE]) * [Nurse Middle] / [Proto Enroll Middle]
(155,427.20 - 8,362.73) * 0.060 / 432.00
b. Social Workers 2.033
([Enroll 7-8] - [Enroll 7-8 CTE]) * [Social Worker Middle] / [Proto Enroll Middle]
(155,427.20 - 8,362.73) * 0.006 / 432.00
c. Psychologists 0.666
([Enroll 7-8] - [Enroll 7-8 CTE]) * [Psychologists Middle] / [Proto Enroll Middle]
(155,427.20 - 8,362.73) * 0.002 / 432.00
6. Teaching Assistance 238.298
([Enroll 7-8] - [Enroll 7-8 CTE]) * [Teaching Assist Middle] / [Proto Enroll Middle]
(155,427.20 - 8,362.73) * 0.700 / 432.00
7. Office Support 791.492
([Enroll 7-8] - [Enroll 7-8 CTE]) * [School Office Middle] / [Proto Enroll Middle]
(155,427.20 - 8,362.73) * 2.325 / 432.00
8. Custodians 661.111
([Enroll 7-8] - [Enroll 7-8 CTE]) * [Custodians Middle] / [Proto Enroll Middle]
(155,427.20 - 8,362.73) * 1.942 / 432.00
9. Student & Staff Safety 31.324
([Enroll 7-8] - [Enroll 7-8 CTE]) * [Security Middle] / [Proto Enroll Middle]
(155,427.20 - 8,362.73) * 0.092 / 432.00
10. Family Engagement Coordinators 0.000
([Enroll 7-8] - [Enroll 7-8 CTE]) * [Family Involve Middle] / [Proto Enroll Middle]
(155,427.20 - 8,362.73) * 0.000 / 432.00
Page 1 of 1

State of Washington
Superintendent of Public Instruction Run January 30, 2017 5:32 PM
Calculated Staff Units - High School Report (State Summary Final)
2015-2016 School Year
Apportionment Final
1191EHFSUM
Account 3100
I. Formulated Staffing Units
A. School Generated TOTALS
1. Principals 728.247
([Enroll 9-12] - [Enroll CTE/Skills 9-12]) * [Principal High] / [Proto Enroll High]
(293,495.14 - 61,076.04) * 1.880 / 600.00
2.a. Classroom Teachers 9,704.350
(([Enroll 9-12] - [Enroll CTE/Skills 9-12]) / [Class Size 9-12]) * (1 + [Planning 9-12])
((293,495.14 - 61,076.04) / 28.74) * (1 + 0.200)
2.b. Laboratory Science Enhancement Teachers 447.553
([Enroll 9-12] * [LabSci% 9-12] * (1/[LabSci Class Size 9-12] - 1/[Class Size 9-12])) * (1 + [Planning 9-12])
(293,495.14 * 0.0833 * (1/19.98 - 1/28.74)) * (1 + 0.200)
3. Teacher Librarians 202.592
([Enroll 9-12] - [Enroll CTE/Skills 9-12]) * [Librarian High] / [Proto Enroll High]
(293,495.14 - 61,076.04) * 0.523 / 600.00
4. Guidance Counselors 983.522
([Enroll 9-12] - [Enroll CTE/Skills 9-12]) * [Counselor High] / [Proto Enroll High]
(293,495.14 - 61,076.04) * 2.539 / 600.00
5. Health And Social Services
a. School Nurses 37.186
([Enroll 9-12] - [Enroll CTE/Skills 9-12]) * [Nurse High] / [Proto Enroll High]
(293,495.14 - 61,076.04) * 0.096 / 600.00
b. Social Workers 5.815
([Enroll 9-12] - [Enroll CTE/Skills 9-12]) * [Social Worker High] / [Proto Enroll High]
(293,495.14 - 61,076.04) * 0.015 / 600.00
c. Psychologists 2.709
([Enroll 9-12] - [Enroll CTE/Skills 9-12]) * [Psychologists High] / [Proto Enroll High]
(293,495.14 - 61,076.04) * 0.007 / 600.00
6. Teaching Assistance 252.563
([Enroll 9-12] - [Enroll CTE/Skills 9-12]) * [Teaching Assist High] / [Proto Enroll High]
(293,495.14 - 61,076.04) * 0.652 / 600.00
7. Office Support 1,266.289
([Enroll 9-12] - [Enroll CTE/Skills 9-12]) * [School Office High] / [Proto Enroll High]
(293,495.14 - 61,076.04) * 3.269 / 600.00
8. Custodians 1,148.533
([Enroll 9-12] - [Enroll CTE/Skills 9-12]) * [Custodians High] / [Proto Enroll High]
(293,495.14 - 61,076.04) * 2.965 / 600.00
9. Student & Staff Safety 54.624
Page 1 of 2
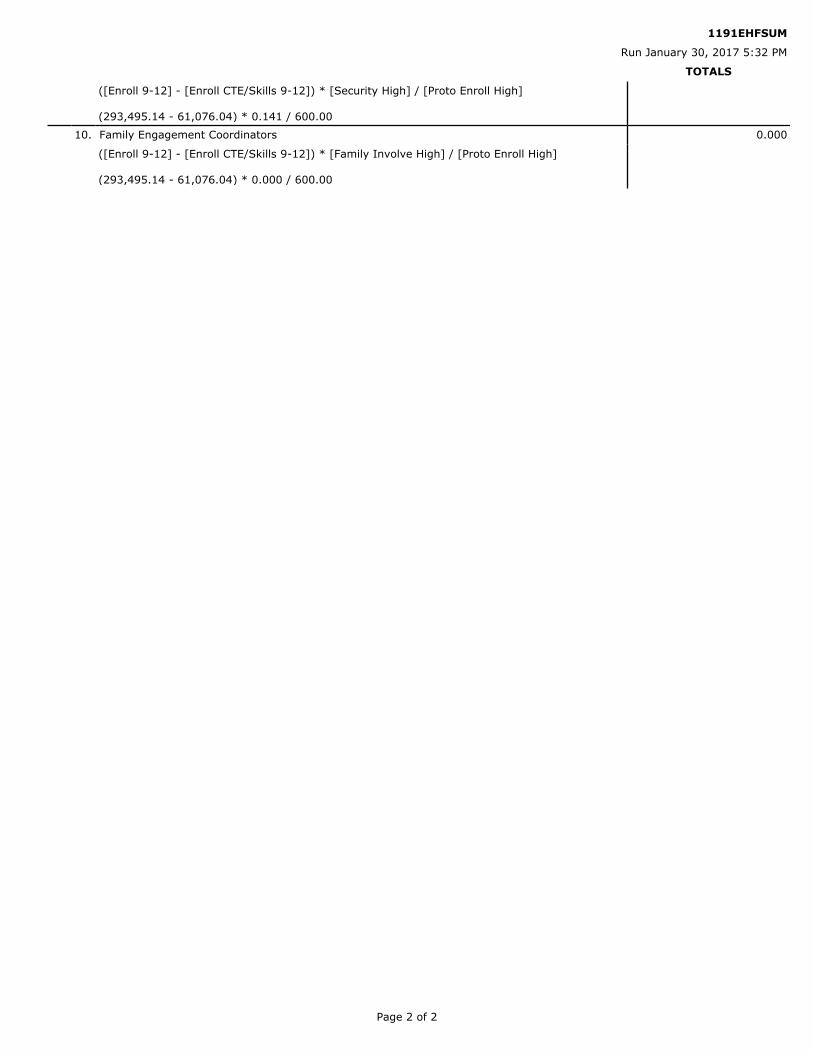
([Enroll 9-12] - [Enroll CTE/Skills 9-12]) * [Security High] / [Proto Enroll High]
(293,495.14 - 61,076.04) * 0.141 / 600.00
10. Family Engagement Coordinators 0.000
([Enroll 9-12] - [Enroll CTE/Skills 9-12]) * [Family Involve High] / [Proto Enroll High]
(293,495.14 - 61,076.04) * 0.000 / 600.00
Page 2 of 2
1191EHFSUM
Run January 30, 2017 5:32 PM
TOTALS

State of Washington
Superintendent of Public Instruction Run January 30, 2017 5:32 PM
Career & Technical Education - High School Report (State Summary Final)
2015-2016 School Year
Apportionment Final
1191CTEFSUM
Account 3100
I. Formulated Staffing units for CTE 9-12 Basic Education CTE Enhancement Total
1. Certificated Instructional Staff (CIS)
a. Classroom Teachers
CTE 9-12 Exploratory 2,307.830 188.477 2,496.307
([enroll 9-12 cte exp] / [CTE 9-12 expl Class Size]) * (1 + [Planning 9-12])
(55,272.42 / 26.57) * (1 + 0.200)
CTE 9-12 Preparatory 0.000 0.000 0.000
([Enroll 9-12 CTE Prep] / [CTE 9-12 prep Class Size]) * (1 + [Planning 9-12])
(0.00 / 26.57) * (1 + 0.200)
b. Librarian, Nurse, Social Worker, Psychologist, Guidance Counselor
CTE 9-12 Exploratory 292.942 -123.249 169.693
[Enroll 9-12 CTE Exp] * [CTE 9-12 expl Other Cert] / [Proto Enroll CTE 9-12 Exp]
55,272.42 * 3.070 / 1,000.00
CTE 9-12 Preparatory 0.000 0.000 0.000
[Enroll 9-12 CTE Prep] * [CTE 9-12 prep Other Cert] / [Proto Enroll 9-12 CTE Prep]
0.00 * 3.070 / 1,000.00
c. Subtotal CIS 2,600.772 65.228 2,666.000
[CTE 9-12 expl Teacher FTE] + [CTE 9-12 prep Teacher FTE] + [CTE 9-12 expl Other Cert FTE] + [CTE 9-12 prep Other Cert FTE]
2,496.307 + 0.000 + 169.693 + 0.000
2. Certificated Administrative Staff (CAS)
a. School Level Administration 173.157 4.345 177.502
Page 1 of 6

([Enroll 9-12 CTE Exp] + [Enroll 9-12 CTE Prep]) * [Pupil High Principal] * (1 + [CTE 9-12 Schl Admin FTE Enh Factor])
(55,272.42 + 0.00) * 0.003133 * (1 + 0.02500)
b. Central Office Administration 49.418 0.723 50.141
([Enroll 9-12 CTE Exp] + [Enroll 9-12 CTE Prep]) * [Pupil High Central Admin] * (1 + [CTE 9-12 Central Admin FTE Enh Factor])
(55,272.42 + 0.00) * 0.000894 * (1 + 0.01460)
c. Subtotal CAS 222.575 5.068 227.643
[CTE 9-12 Schl Admin FTE] + [CTE 9-12 Central Admin FTE]
177.502 + 50.1413. Classified Staff (CLS)
a. School Level Classified 800.623 0.000 800.623
([Enroll 9-12 CTE Exp] + [Enroll 9-12 CTE Prep]) * [Pupil High School CLS]
(55,272.42 + 0.00) * 0.014485
b. Central Office Classified 144.537 0.000 144.537
([Enroll 9-12 CTE Exp] + [Enroll 9-12 CTE Prep]) * [Pupil High Central CLS]
(55,272.42 + 0.00) * 0.002615
Page 2 of 6
1191CTEFSUM
Run January 30, 2017 5:32 PM
TOTALS
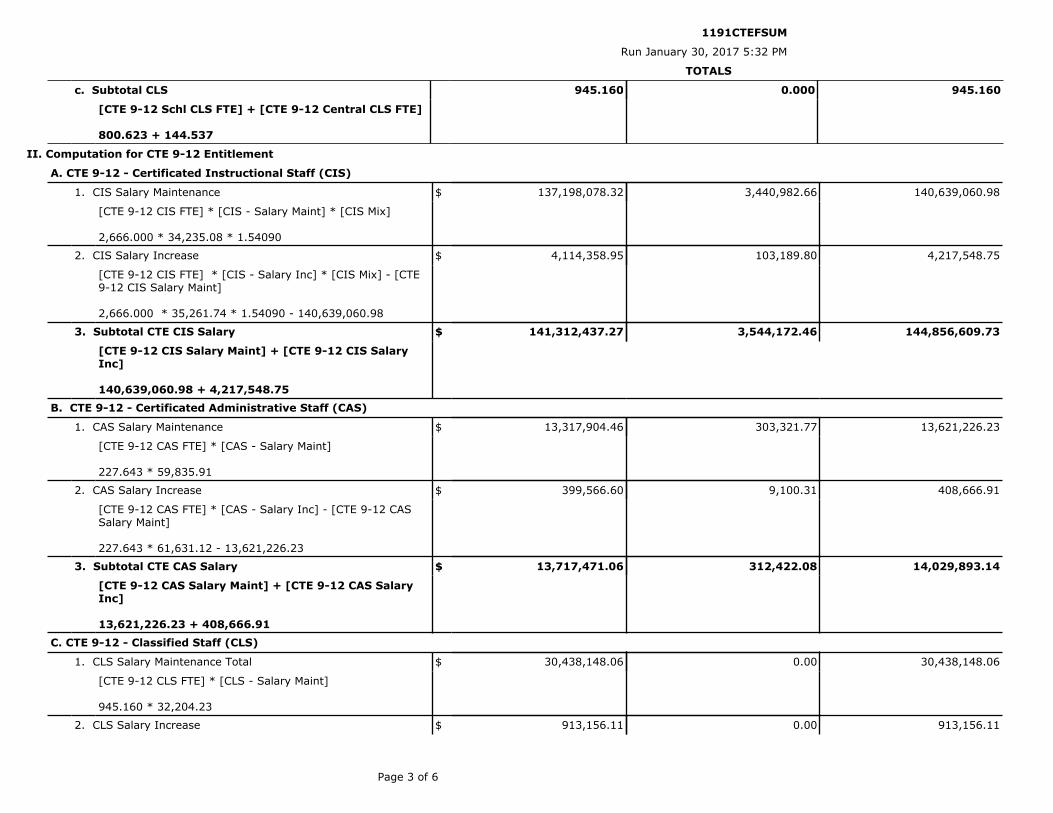
c. Subtotal CLS 945.160 0.000 945.160
[CTE 9-12 Schl CLS FTE] + [CTE 9-12 Central CLS FTE]
800.623 + 144.537
II. Computation for CTE 9-12 Entitlement
A. CTE 9-12 - Certificated Instructional Staff (CIS)
1. CIS Salary Maintenance $ 137,198,078.32 3,440,982.66 140,639,060.98
[CTE 9-12 CIS FTE] * [CIS - Salary Maint] * [CIS Mix]
2,666.000 * 34,235.08 * 1.54090
2. CIS Salary Increase $ 4,114,358.95 103,189.80 4,217,548.75
[CTE 9-12 CIS FTE] * [CIS - Salary Inc] * [CIS Mix] - [CTE 9-12 CIS Salary Maint]
2,666.000 * 35,261.74 * 1.54090 - 140,639,060.98
3. Subtotal CTE CIS Salary $ 141,312,437.27 3,544,172.46 144,856,609.73
[CTE 9-12 CIS Salary Maint] + [CTE 9-12 CIS Salary Inc]
140,639,060.98 + 4,217,548.75B. CTE 9-12 - Certificated Administrative Staff (CAS)
1. CAS Salary Maintenance $ 13,317,904.46 303,321.77 13,621,226.23
[CTE 9-12 CAS FTE] * [CAS - Salary Maint]
227.643 * 59,835.91
2. CAS Salary Increase $ 399,566.60 9,100.31 408,666.91
[CTE 9-12 CAS FTE] * [CAS - Salary Inc] - [CTE 9-12 CAS Salary Maint]
227.643 * 61,631.12 - 13,621,226.23
3. Subtotal CTE CAS Salary $ 13,717,471.06 312,422.08 14,029,893.14
[CTE 9-12 CAS Salary Maint] + [CTE 9-12 CAS Salary Inc]
13,621,226.23 + 408,666.91
C. CTE 9-12 - Classified Staff (CLS)
1. CLS Salary Maintenance Total $ 30,438,148.06 0.00 30,438,148.06
[CTE 9-12 CLS FTE] * [CLS - Salary Maint]
945.160 * 32,204.23
2. CLS Salary Increase $ 913,156.11 0.00 913,156.11
Page 3 of 6
1191CTEFSUM
Run January 30, 2017 5:32 PM
TOTALS

[CTE 9-12 CLS FTE] * [CLS - Salary Inc] - [CTE 9-12 CLS Salary Maint]
945.160 * 33,170.37 - 30,438,148.06
3. Subtotal CTE CLS Salary $ 31,351,304.17 0.00 31,351,304.17
[CTE 9-12 CLS Salary Maint] + [CTE 9-12 CLS Salary Inc]
30,438,148.06 + 913,156.11
D. Staff Units Insurance, Payroll Taxes, and Benefits
1. Certificated Insurance Benefits $ 26,019,965.88 647,848.05 26,667,813.93
[CTE 9-12 CIS CAS FTE] * [Health Insurance]
2,893.643 * 9,216.00
2. Certificated Insurance Benefits — Increase $ 406,562.04 10,122.51 416,684.55
([CTE 9-12 CIS CAS FTE] * [Health Insurance Inc]) - [CTE 9-12 Cert Insurance]
(2,893.643 * 9,360.00) - 26,667,813.93
3. Certificated — Payroll Tax and Benefits $ 32,240,523.53 802,029.97 33,042,553.50
([CTE 9-12 CIS Salary Maint] + [CTE 9-12 CAS Salary Maint]) * [CIS/CAS - Benefits Maint]
(140,639,060.98 + 13,621,226.23) * 0.21420
4. Certificated — Payroll Tax and Benefits – Increase $ 937,993.70 23,333.94 961,327.64
([CTE 9-12 CIS Salary Inc] + [CTE 9-12 CAS Salary Inc]) * [CIS/CAS - Benefits Inc]
(4,217,548.75 + 408,666.91) * 0.20780
5. Classified Insurance Benefits $ 10,034,604.92 0.00 10,034,604.92
[CTE 9-12 CLS FTE] * [Health Insurance] * [CLS Health Factor]
945.160 * 9,216.00 * 1.152
6. Classified Insurance Benefits — Increase $ 156,790.78 0.00 156,790.78
([CTE 9-12 CLS FTE] * [Health Insurance Inc] * [CLS Health Factor]) - [CTE 9-12 CLS Insurance]
(945.160 * 9,360.00 * 1.152) - 10,034,604.92
7. Classified — Payroll Tax and Benefits $ 6,915,547.23 0.00 6,915,547.23
[CTE 9-12 CLS Salary Maint] * [CLS - Benefits Maint]
30,438,148.06 * 0.22720
8. Classified — Payroll Tax and Benefits – Increase $ 175,508.58 0.00 175,508.58
Page 4 of 6
1191CTEFSUM
Run January 30, 2017 5:32 PM
TOTALS

[CTE 9-12 CLS Salary Inc] * [CLS - Benefits Inc]
913,156.11 * 0.19220
9. Total Insurance Payroll Taxes and Benefits $ 76,887,496.66 1,483,334.47 78,370,831.13
[CTE 9-12 Cert Insurance] + [CTE 9-12 Cert Insurance Inc] + [CTE 9-12 Cert Benefits Maint] + [CTE 9-12 Cert Benefits Inc] + [CTE 9-12 CLS Insurance] + [CTE 9-12 CLS Insurance Inc] + [CTE 9-12 CLS Benefits Maint] + [CTE 9-12 CLS Benefits Inc]
26,667,813.93 + 416,684.55 + 33,042,553.50 + 961,327.64 + 10,034,604.92 + 156,790.78 + 6,915,547.23 + 175,508.58
E. Other Generated Entitlements
1. Materials, Supplies, and Operating Costs (MSOC) $ 69,878,481.45 9,252,278.95 79,130,760.40
[Total MSOC -CTE 9-12expl] + [Total MSOC -CTE 9-12prep]
79,130,760.40 + 0.00
2. Substitutes $ 1,401,868.24 114,488.53 1,516,356.77
([CTE 9-12 expl Teacher FTE] + [CTE 9-12 prep Teacher FTE]) * [Substitutes Days] * [Substitutes Rate]
(2,496.307 + 0.000) * 4.000 * 151.86
F. Total CTE 9-12 Allocation $ 334,549,058.85 14,706,696.49 349,255,755.34
[CTE 9-12 CIS Salary Total] + [CTE 9-12 CAS Salary Total] + [CTE 9-12 CLS Salary Total] + [CTE 9-12 insurance/Benefits Total] + [Total MSOC CTE 9-12] + [CTE 9-12 Substitutes]
144,856,609.73 + 14,029,893.14 + 31,351,304.17 + 78,370,831.13 + 79,130,760.40 + 1,516,356.77
III. Computation for CTE 9-12 Minimum Expenditures
A. CTE 9-12 Certificated Instructional Staff (CIS) Allocation for Minimum Expenditures
1. CIS Salary Maintenance for Minimum Expenditures $ 142,583,950.12
[CTE 9-12 CIS FTE] * [CIS - Salary Maint] * [CIS Mix CTE 9-12]
2,666.000 * 0.00 * 0.00000
2. CIS Salary Increase for Minimum Expenditures $ 4,275,873.98
[CTE 9-12 CIS FTE] * [CIS - Salary Inc] * [CIS Mix CTE 9-12] - [CTE 9-12 CIS Salary Maint for Min Expend]
2,666.000 * 0.00 * 0.00000 - 142,583,950.12
3. Subtotal CTE 9-12 CIS Salary for Minimum Expenditures $ 146,859,824.10
Page 5 of 6
1191CTEFSUM
Run January 30, 2017 5:32 PM
TOTALS

[CTE 9-12 CIS Salary Maint for Min Expend] + [CTE 9-12 CIS Salary Inc for Min Expend]
142,583,950.12 + 4,275,873.98
4. Certificated Insurance Benefits for Minimum Expenditures $ 416,595.25
([CTE 9-12 CIS Salary Maint for Min Expend]-[CTE 9-12 CIS Salary Maint])*[CIS/CAS - Benefits Maint]
(142,583,950.12-140,639,060.98)*0.21420
5. Certificated Insurance Benefits Increase for Minimum Expenditures $ 12,119.97
([CTE 9-12 CIS Salary Inc for Min Expend]-[CTE 9-12 CIS Salary Inc])*[CIS/CAS - Benefits Inc]
(4,275,873.98-4,217,548.75)*0.20780
6. CTE 9-12 Total for Minimum Expenditures $ 351,687,684.93
[CTE 9-12 CIS Salary Total For Min Expend] + [CTE 9-12 CAS Salary Total] + [CTE 9-12 CLS Salary Total] + [CTE 9-12 Insurance/Benefits Total] + [CTE 9-12 Insurance Ben for Min Expend] + [Total MSOC CTE 9-12] + [CTE 9-12 Substitutes] + [CTE 9-12 Insurance Ben Inc for Min Expend]
146,859,824.10 + 14,029,893.14 + 31,351,304.17 + 78,370,831.13 + 416,595.25 + 79,130,760.40 + 1,516,356.77 + 12,119.97
B. Minimum Expenditures
1. CTE Total Less Indirects $ 298,934,532.31
([CTE 9-12 Total For Min Expend] * 0.85
(351,687,684.93 * 0.85
2. Add Running Start less indirects $ 8,158,087.65
[Run Start-CTE] * 0.93
8,772,137.28 * 0.93
3. CTE Minimum Expend $ 307,092,619.96
[CTE Min Less Indirects] + [CTE Min Running Start less indirects]
298,934,532.31 + 8,158,087.65
C. Reminder - CTE Prior Year Carry Forward $ 4,447,179.45
Page 6 of 6
1191CTEFSUM
Run January 30, 2017 5:32 PM
TOTALS

State of Washington
Superintendent of Public Instruction Run January 30, 2017 5:32 PM
Career & Technical Education - Middle School Report (State Summary Final)
2015-2016 School Year
Apportionment Final
1191MSCTEFSUM
Account 3100
I. Formulated Staffing Units for CTE 7-8 Basic Education CTE Enhancement Total
A. CTE 7-8 Staffing
1. Certificated Instructional Staff (CIS)
a. Classroom Teachers 351.744 25.948 377.692
([Enroll 7-8 CTE] / [CTE 7-8 Class Size]) * (1 + [Planning 7-8])
(8,362.73 / 26.57) * (1 + 0.200)
b. Librarian, Nurse, Social Worker, Psychologist, Guidance Counselor
34.904 -9.225 25.679
[Enroll 7-8 CTE] * [CTE 7-8 Other Cert] / [Proto Enroll CTE 7-8]
8,362.73 * 3.070 / 1,000.00
c. Subtotal CIS 386.648 16.723 403.371
[CTE 7-8 Teacher FTE] + [CTE 7-8 Other Cert FTE]
377.692 + 25.679
2. Certificated Administrative Staff (CAS)
a. School Level Administration 26.201 0.651 26.852
[Enroll 7-8 CTE] * [Pupil Middle Principal] * (1 + [CTE 7-8 Schl Admin FTE Enh Factor])
8,362.73 * 0.003132 * (1 + 0.02500)
b. Central Office Administration 7.477 -0.167 7.310
[Enroll 7-8 CTE] * [Pupil Middle Central Admin] * (1 + [CTE 7-8 Central Admin FTE Enh Factor])
8,362.73 * 0.000862 * (1 + 0.01460)
c. Subtotal CAS 33.678 0.484 34.162
Page 1 of 6
[CTE 7-8 Schl Admin FTE] + [CTE 7-8 Central Admin FTE]
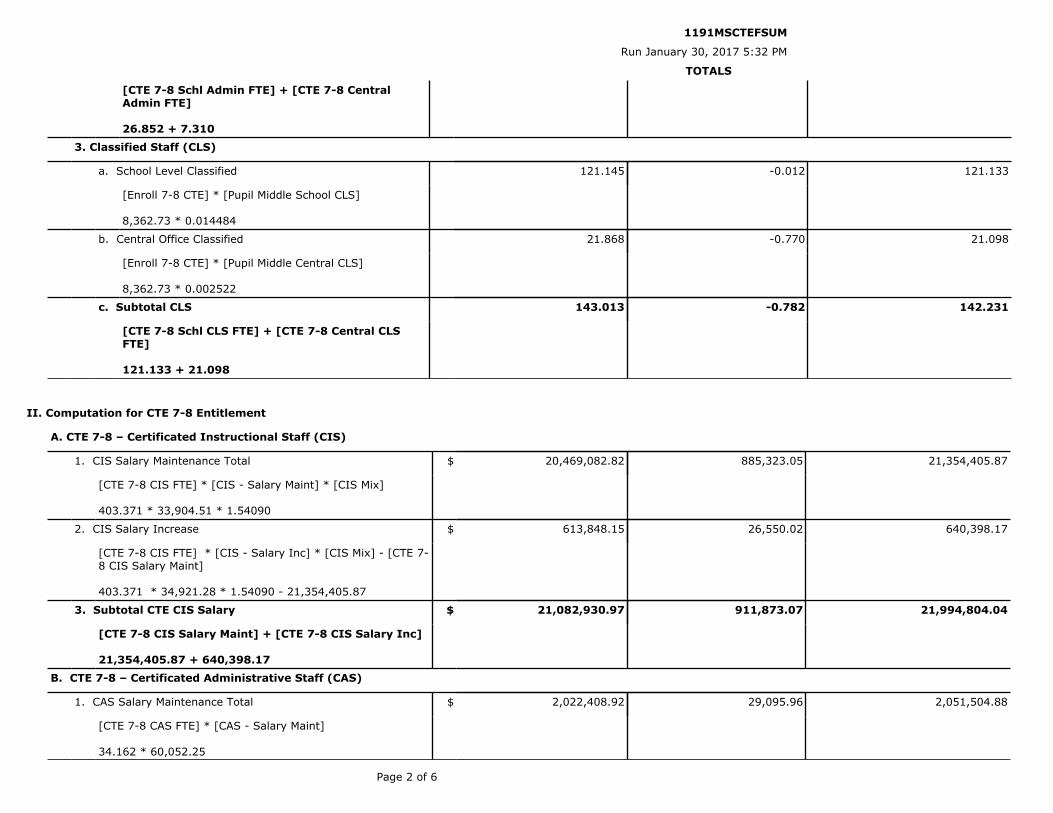
26.852 + 7.3103. Classified Staff (CLS)
a. School Level Classified 121.145 -0.012 121.133
[Enroll 7-8 CTE] * [Pupil Middle School CLS]
8,362.73 * 0.014484
b. Central Office Classified 21.868 -0.770 21.098
[Enroll 7-8 CTE] * [Pupil Middle Central CLS]
8,362.73 * 0.002522
c. Subtotal CLS 143.013 -0.782 142.231
[CTE 7-8 Schl CLS FTE] + [CTE 7-8 Central CLS FTE]
121.133 + 21.098
II. Computation for CTE 7-8 Entitlement
A. CTE 7-8 – Certificated Instructional Staff (CIS)
1. CIS Salary Maintenance Total $ 20,469,082.82 885,323.05 21,354,405.87
[CTE 7-8 CIS FTE] * [CIS - Salary Maint] * [CIS Mix]
403.371 * 33,904.51 * 1.54090
2. CIS Salary Increase $ 613,848.15 26,550.02 640,398.17
[CTE 7-8 CIS FTE] * [CIS - Salary Inc] * [CIS Mix] - [CTE 7-8 CIS Salary Maint]
403.371 * 34,921.28 * 1.54090 - 21,354,405.87
3. Subtotal CTE CIS Salary $ 21,082,930.97 911,873.07 21,994,804.04
[CTE 7-8 CIS Salary Maint] + [CTE 7-8 CIS Salary Inc]
21,354,405.87 + 640,398.17B. CTE 7-8 – Certificated Administrative Staff (CAS)
1. CAS Salary Maintenance Total $ 2,022,408.92 29,095.96 2,051,504.88
[CTE 7-8 CAS FTE] * [CAS - Salary Maint]
34.162 * 60,052.25
Page 2 of 6
1191MSCTEFSUM
Run January 30, 2017 5:32 PM
TOTALS

2. CAS Salary Increase $ 60,676.44 872.93 61,549.37
[CTE 7-8 CAS FTE] * [CAS - Salary Inc] - [CTE 7-8 CAS Salary Maint]
34.162 * 61,853.94 - 2,051,504.88
3. Subtotal CTE CAS Salary $ 2,083,085.36 29,968.89 2,113,054.25
[CTE 7-8 CAS Salary Maint] + [CTE 7-8 CAS Salary Inc]
2,051,504.88 + 61,549.37
C. CTE 7-8 – Classified Staff (CLS)
1. CLS Salary Maintenance Total $ 4,612,618.24 -25,222.44 4,587,395.80
[CTE 7-8 CLS FTE] * [CLS - Salary Maint]
142.231 * 32,253.14
2. CLS Salary Increase $ 163,601.43 -25,979.19 137,622.24
[CTE 7-8 CLS FTE] * [CLS - Salary Inc] - [CTE 7-8 CLS Salary Maint]
142.231 * 33,220.73 - 4,587,395.80
3. Subtotal CTE CLS Salary $ 4,776,219.67 -51,201.63 4,725,018.04
[CTE 7-8 CLS Salary Maint] + [CTE 7-8 CLS Salary Inc]
4,587,395.80 + 137,622.24
D. Staff Units Insurance, Payroll Taxes, and Benefits
1. Certificated Insurance Benefits $ 3,873,724.44 158,579.74 4,032,304.18
[CTE 7-8 CIS CAS FTE] * [Health Insurance]
437.533 * 9,216.00
2. Certificated Insurance Benefits — Increase $ 60,526.92 2,477.78 63,004.70
([CTE 7-8 CIS CAS FTE] * [Health Insurance Inc]) - [CTE 7-8 Cert Insurance]
(437.533 * 9,360.00) - 4,032,304.18
3. Certificated — Payroll Tax and Benefits $ 4,817,677.51 195,868.57 5,013,546.08
([CTE 7-8 CIS Salary Maint] + [CTE 7-8 CAS Salary Maint]) * [CIS/CAS - Benefits Maint]
(21,354,405.87 + 2,051,504.88) * 0.21420
4. Certificated — Payroll Tax and Benefits – Increase $ 140,166.20 5,698.52 145,864.72
Page 3 of 6
1191MSCTEFSUM
Run January 30, 2017 5:32 PM
TOTALS

([CTE 7-8 CIS Salary Inc] + [CTE 7-8 CAS Salary Inc]) * [CIS/CAS - Benefits Inc]
(640,398.17 + 61,549.37) * 0.20780
5. Classified Insurance Benefits $ 1,518,345.01 -8,302.38 1,510,042.63
[CTE 7-8 CLS FTE] * [Health Insurance] * [CLS Health Factor]
142.231 * 9,216.00 * 1.152
6. Classified Insurance Benefits — Increase $ 23,724.07 -129.70 23,594.37
([CTE 7-8 CLS FTE] * [Health Insurance Inc] * [CLS Health Factor]) - [CTE 7-8 CLS Insurance]
(142.231 * 9,360.00 * 1.152) - 1,510,042.63
7. Classified — Payroll Tax and Benefits $ 1,047,986.89 -5,730.56 1,042,256.33
[CTE 7-8 CLS Salary Maint] * [CLS - Benefits Maint]
4,587,395.80 * 0.22720
8. Classified — Payroll Tax and Benefits – Increase $ 31,444.18 -4,993.10 26,451.08
[CTE 7-8 CLS Salary Inc] * [CLS - Benefits Inc]
137,622.24 * 0.19220
9. Total Insurance Payroll Taxes and Benefits $ 11,513,595.22 343,468.87 11,857,064.09
[CTE 7-8 Cert Insurance] + [CTE 7-8 Cert Insurance Inc] + [CTE 7-8 Cert Benefits Maint] + [CTE 7-8 Cert Benefits Inc] + [CTE 7-8 CLS Insurance] + [CTE 7-8 CLS Insurance Inc] + [CTE 7-8 CLS Benefits Maint] + [CTE 7-8 CLS Benefits Inc]
4,032,304.18 + 63,004.70 + 5,013,546.08 + 145,864.72 + 1,510,042.63 + 23,594.37 + 1,042,256.33 + 26,451.08
E. Other Generated Entitlements
1. Materials, Supplies, and Operating Costs (MSOC) $ 10,567,874.35 1,404,628.13 11,972,502.48
[Total MSOC Technology-CTE 7-8] + [Total MSOC Utilities-CTE 7-8] + [Total MSOC Curriciulum-CTE 7-8] + [Total MSOC Library/Supplies-CTE 7-8] + [Total MSOC Prof Dvlp-CTE 7-8] + [Total MSOC Facilities-CTE 7-8] + [Total MSOC Districtwide-CTE 7-8]
1,258,172.80 + 3,419,018.47 + 1,350,999.07 + 2,868,165.50 + 208,901.05 + 1,693,787.32 + 1,173,458.27
2. Substitutes $ 213,663.40 15,761.80 229,425.20
Page 4 of 6
1191MSCTEFSUM
Run January 30, 2017 5:32 PM
TOTALS

[CTE 7-8 Teacher FTE] * [Substitutes Days] * [Substitutes Rate]
377.692 * 4.000 * 151.86
F. Total CTE 7-8 Allocation $ 50,237,368.97 2,654,499.13 52,891,868.10
[CTE 7-8 CIS Salary Total] + [CTE 7-8 CAS Salary Total] + [CTE 7-8 CLS Salary Total] + [CTE 7-8 insurance/Benefits Total] + [Total MSOC CTE 7-8] + [CTE 7-8 Substitutes]
21,994,804.04 + 2,113,054.25 + 4,725,018.04 + 11,857,064.09 + 11,972,502.48 + 229,425.20
Page 5 of 6
1191MSCTEFSUM
Run January 30, 2017 5:32 PM
TOTALS

III. Computation for CTE 7-8 Minimum Expenditures
A. CTE 7-8 Certificated Instructional Staff (CIS) Allocation for Minimum Expendiutres
1. CIS Salary Manitenance Total for Minimum Expenditures $ 21,538,760.61
[CTE 7-8 CIS FTE] * [CIS - Salary Maint] * [CIS Mix CTE 7-8]
403.371 * 0.00 * 0.00000
2. CIS Salary Increase for Minimum Expenditures $ 645,928.28
[CTE 7-8 CIS FTE] * [CIS - Salary Inc] * [CIS Mix CTE 7-8] - [CTE 7-8 CIS Salary Maint for Min Expend]
403.371 * 0.00 * 0.00000 - 21,538,760.61
3. Subtotal CTE 7-8 CIS Salary for Minimum Expenditures $ 22,184,688.89
[CTE 7-8 CIS Salary Maint for Min Expend] + [CTE 7-8 Salary Inc for Min Expend]
21,538,760.61 + 645,928.28
4. Certificated Insurance Benefits for Minimum Expenditures $ 39,488.76
([CTE 7-8 CIS Salary Maint for Min Expend]-[CTE 7-8 CIS Salary Maint])*[CIS/CAS - Benefits Maint]
(21,538,760.61-21,354,405.87)*0.21420
5. Certificated Insurance Benefits Increase for Minimum Expenditures $ 1,149.21
([CTE 7-8 Salary Inc for Min Expend]-[CTE 7-8 CIS Salary Inc])*[CIS/CAS - Benefits Inc]
(645,928.28-640,398.17)*0.20780
6. CTE 7-8 Total for Minimum Expenditures $ 53,122,390.92
([CTE 7-8 CIS Salary Total For Min Expend] + [CTE 7-8 CAS Salary Total] + [CTE 7-8 CLS Salary Total] + [CTE 7-8 Insurance/Benefits Total] + [CTE 7-8 Insurance Ben for Min Expend] + [Total MSOC CTE 7-8] + [CTE 7-8 Substitutes] + [CTE 7-8 Insurance Ben Inc for Min Expend])
(22,184,688.89 + 2,113,054.25 + 4,725,018.04 + 11,857,064.09 + 39,488.76 + 11,972,502.48 + 229,425.20 + 1,149.21)
B. Minimum Expenditures $ 45,154,032.29
[CTE 7-8 Total for Min Expend] * 0.85
53,122,390.92 * 0.85
C. Reminder - CTE 7-8 Prior Year Carry Forward $ 1,400,681.78
Page 6 of 6
1191MSCTEFSUM
Run January 30, 2017 5:32 PM
TOTALS
State of Washington
Superintendent of Public Instruction Run January 30, 2017 5:32 PM
Skill Center Program Report (State Summary Final)
2015-2016 School Year
Apportionment Final
1191SCFSUM
Account 3100
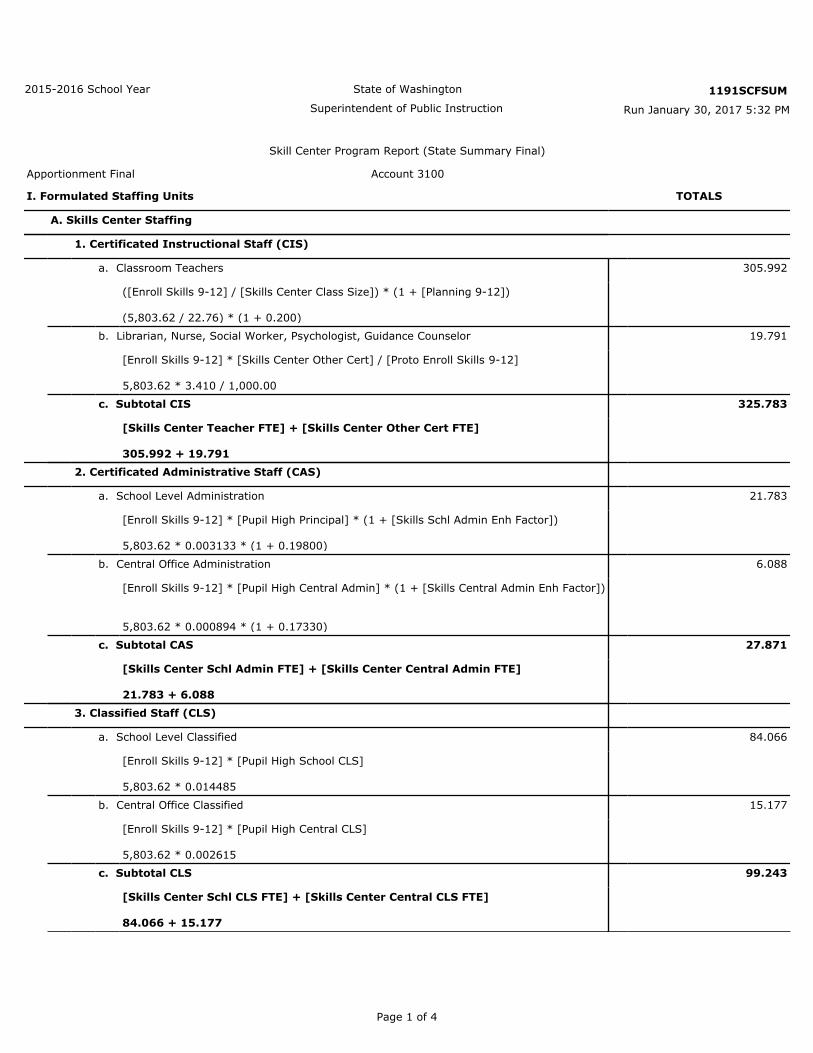
I. Formulated Staffing Units TOTALS
A. Skills Center Staffing
1. Certificated Instructional Staff (CIS)
a. Classroom Teachers 305.992
([Enroll Skills 9-12] / [Skills Center Class Size]) * (1 + [Planning 9-12])
(5,803.62 / 22.76) * (1 + 0.200)
b. Librarian, Nurse, Social Worker, Psychologist, Guidance Counselor 19.791
[Enroll Skills 9-12] * [Skills Center Other Cert] / [Proto Enroll Skills 9-12]
5,803.62 * 3.410 / 1,000.00
c. Subtotal CIS 325.783
[Skills Center Teacher FTE] + [Skills Center Other Cert FTE]
305.992 + 19.7912. Certificated Administrative Staff (CAS)
a. School Level Administration 21.783
[Enroll Skills 9-12] * [Pupil High Principal] * (1 + [Skills Schl Admin Enh Factor])
5,803.62 * 0.003133 * (1 + 0.19800)
b. Central Office Administration 6.088
[Enroll Skills 9-12] * [Pupil High Central Admin] * (1 + [Skills Central Admin Enh Factor])
5,803.62 * 0.000894 * (1 + 0.17330)
c. Subtotal CAS 27.871
[Skills Center Schl Admin FTE] + [Skills Center Central Admin FTE]
21.783 + 6.088
3. Classified Staff (CLS)
a. School Level Classified 84.066
[Enroll Skills 9-12] * [Pupil High School CLS]
5,803.62 * 0.014485
b. Central Office Classified 15.177
[Enroll Skills 9-12] * [Pupil High Central CLS]
5,803.62 * 0.002615
c. Subtotal CLS 99.243
[Skills Center Schl CLS FTE] + [Skills Center Central CLS FTE]
84.066 + 15.177
Page 1 of 4

II. Computation for Skills Center Entitlement
A. Skills Center – Certificated Instructional Staff (CIS)
1. CIS Salary Maintenance Total $ 17,102,694.67
[Skills Center CIS FTE] * [CIS - Salary Maint] * [CIS Mix]
325.783 * 0.00 * 1.54090
2. CIS Salary Increase $ 512,902.33
[Skills Center CIS FTE] * [CIS - Salary Inc] * [CIS Mix] - [Skills CIS Salary Maint]
325.783 * 0.00 * 1.54090 - 17,102,694.67
3. Subtotal CTE CIS Salary $ 17,615,597.00
[Skills CIS Salary Maint] + [Skills CIS Salary Inc]
17,102,694.67 + 512,902.33B. Skills Center – Certificated Administrative Staff (CAS)
1. CAS Salary Maintenance Total $ 1,677,273.42
[Skills Center CAS FTE] * [CAS - Salary Maint]
27.871 * 60,179.88
2. CAS Salary Increase $ 50,321.87
[Skills Center CAS FTE] * [CAS - Salary Inc] - [Skills CAS Salary Maint]
27.871 * 61,985.41 - 1,677,273.42
3. Subtotal CTE CAS Salary $ 1,727,595.29
[Skills CAS Salary Maint] + [Skills CAS Salary Inc]
1,677,273.42 + 50,321.87C. Skills Center - Classified Staff (CLS)
1. CLS Salary Maintenance Total $ 3,177,857.14
[Skills Center CLS FTE] * [CLS - Salary Maint]
99.243 * 32,020.97
2. CLS Salary Increase $ 95,338.80
[Skills Center CLS FTE] * [CLS - Salary Inc] - [Skills CLS Salary Maint]
99.243 * 32,981.63 - 3,177,857.14
3. Subtotal CTE CLS Salary $ 3,273,195.94
[Skills CLS Salary Maint] + [Skills CLS Salary Inc]
3,177,857.14 + 95,338.80
D. Staff Units Insurance, Payroll Taxes, and Benefits
1. Certificated Insurance Benefits $ 3,259,275.27
[Skills Center CIS CAS FTE] * [Health Insurance]
353.654 * 9,216.00
2. Certificated Insurance Benefits — Increase $ 50,926.17
([Skills Center CIS CAS FTE] * [Health Insurance Inc]) - [Skills Cert Insurance]
(353.654 * 9,360.00) - 3,259,275.27
3. Certificated — Payroll Tax and Benefits $ 4,022,669.17
Page 2 of 4
1191SCFSUM
Run January 30, 2017 5:32 PM
TOTALS
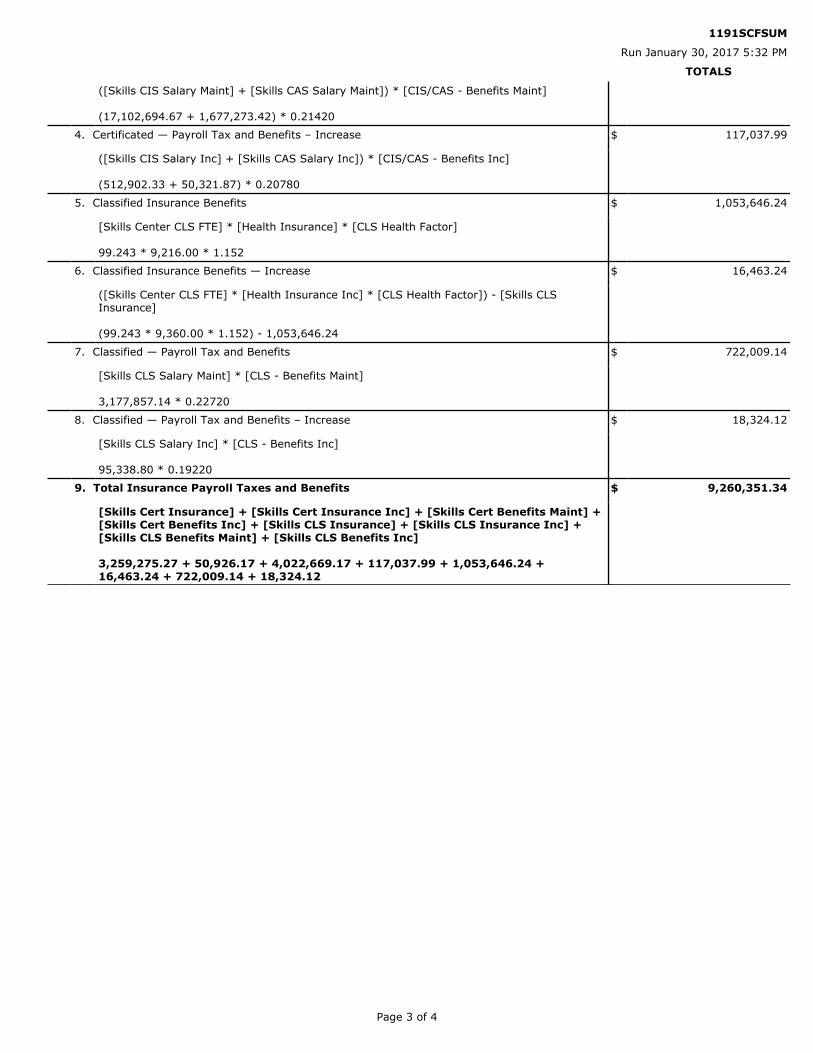
([Skills CIS Salary Maint] + [Skills CAS Salary Maint]) * [CIS/CAS - Benefits Maint]
(17,102,694.67 + 1,677,273.42) * 0.21420
4. Certificated — Payroll Tax and Benefits – Increase $ 117,037.99
([Skills CIS Salary Inc] + [Skills CAS Salary Inc]) * [CIS/CAS - Benefits Inc]
(512,902.33 + 50,321.87) * 0.20780
5. Classified Insurance Benefits $ 1,053,646.24
[Skills Center CLS FTE] * [Health Insurance] * [CLS Health Factor]
99.243 * 9,216.00 * 1.152
6. Classified Insurance Benefits — Increase $ 16,463.24
([Skills Center CLS FTE] * [Health Insurance Inc] * [CLS Health Factor]) - [Skills CLS Insurance]
(99.243 * 9,360.00 * 1.152) - 1,053,646.24
7. Classified — Payroll Tax and Benefits $ 722,009.14
[Skills CLS Salary Maint] * [CLS - Benefits Maint]
3,177,857.14 * 0.22720
8. Classified — Payroll Tax and Benefits – Increase $ 18,324.12
[Skills CLS Salary Inc] * [CLS - Benefits Inc]
95,338.80 * 0.19220
9. Total Insurance Payroll Taxes and Benefits $ 9,260,351.34
[Skills Cert Insurance] + [Skills Cert Insurance Inc] + [Skills Cert Benefits Maint] + [Skills Cert Benefits Inc] + [Skills CLS Insurance] + [Skills CLS Insurance Inc] + [Skills CLS Benefits Maint] + [Skills CLS Benefits Inc]
3,259,275.27 + 50,926.17 + 4,022,669.17 + 117,037.99 + 1,053,646.24 + 16,463.24 + 722,009.14 + 18,324.12
Page 3 of 4
1191SCFSUM
Run January 30, 2017 5:32 PM
TOTALS

E. Other Generated Entitlements
1. Materials, Supplies, and Operating Costs (MSOC) $ 7,387,950.21
[Total MSOC Technology-Skills] + [Total MSOC Utilities-Skills] + [Total MSOC Curriciulum-Skills] + [Total MSOC Library/Supplies-Skills] + [Total MSOC Prof Dvlp-Skills] + [Total MSOC Facilities-Skills] + [Total MSOC Districtwide-Skills]
776,466.33 + 2,109,789.97 + 833,631.97 + 1,769,871.96 + 128,898.39 + 1,045,173.91 + 724,117.68
2. Substitutes $ 185,871.79
[Skills Center Teacher FTE] * [Substitutes Days] * [Substitutes Rate]
305.992 * 4.000 * 151.86
F. Total $ 39,450,561.57
[Skills CIS Salary Total] + [Skills CAS Salary Total] + [Skills CLS Salary Total] + [Skills insurance/Benefits Total] + [Total MSOC -Skills] + [Skills Center Substitutes]
17,615,597.00 + 1,727,595.29 + 3,273,195.94 + 9,260,351.34 + 7,387,950.21 + 185,871.79
Page 4 of 4
1191SCFSUM
Run January 30, 2017 5:32 PM
TOTALS
State of Washington
Superintendent of Public Instruction Run January 30, 2017 5:32 PM
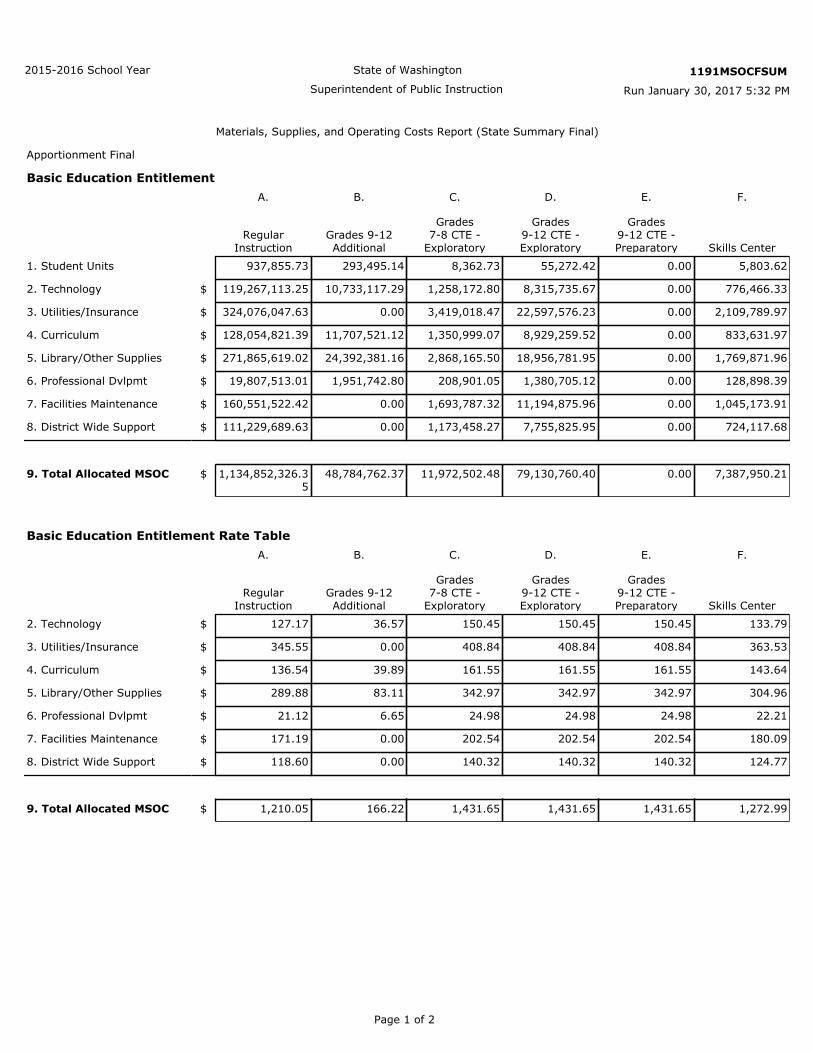
Materials, Supplies, and Operating Costs Report (State Summary Final)
2015-2016 School Year
Apportionment Final
1191MSOCFSUM
Basic Education EntitlementA. B. C. D. E. F.
RegularInstruction
Grades 9-12Additional
Grades7-8 CTE -
Exploratory
Grades9-12 CTE -Exploratory
Grades9-12 CTE -Preparatory Skills Center
1. Student Units 937,855.73 293,495.14 8,362.73 55,272.42 0.00 5,803.62
2. Technology $ 119,267,113.25 10,733,117.29 1,258,172.80 8,315,735.67 0.00 776,466.33
3. Utilities/Insurance $ 324,076,047.63 0.00 3,419,018.47 22,597,576.23 0.00 2,109,789.97
4. Curriculum $ 128,054,821.39 11,707,521.12 1,350,999.07 8,929,259.52 0.00 833,631.97
5. Library/Other Supplies $ 271,865,619.02 24,392,381.16 2,868,165.50 18,956,781.95 0.00 1,769,871.96
6. Professional Dvlpmt $ 19,807,513.01 1,951,742.80 208,901.05 1,380,705.12 0.00 128,898.39
7. Facilities Maintenance $ 160,551,522.42 0.00 1,693,787.32 11,194,875.96 0.00 1,045,173.91
8. District Wide Support $ 111,229,689.63 0.00 1,173,458.27 7,755,825.95 0.00 724,117.68
9. Total Allocated MSOC $ 1,134,852,326.35
48,784,762.37 11,972,502.48 79,130,760.40 0.00 7,387,950.21
Basic Education Entitlement Rate TableA. B. C. D. E. F.
RegularInstruction
Grades 9-12Additional
Grades7-8 CTE -
Exploratory
Grades9-12 CTE -Exploratory
Grades9-12 CTE -Preparatory Skills Center
2. Technology $ 127.17 36.57 150.45 150.45 150.45 133.79
3. Utilities/Insurance $ 345.55 0.00 408.84 408.84 408.84 363.53
4. Curriculum $ 136.54 39.89 161.55 161.55 161.55 143.64
5. Library/Other Supplies $ 289.88 83.11 342.97 342.97 342.97 304.96
6. Professional Dvlpmt $ 21.12 6.65 24.98 24.98 24.98 22.21
7. Facilities Maintenance $ 171.19 0.00 202.54 202.54 202.54 180.09
8. District Wide Support $ 118.60 0.00 140.32 140.32 140.32 124.77
9. Total Allocated MSOC $ 1,210.05 166.22 1,431.65 1,431.65 1,431.65 1,272.99
Page 1 of 2
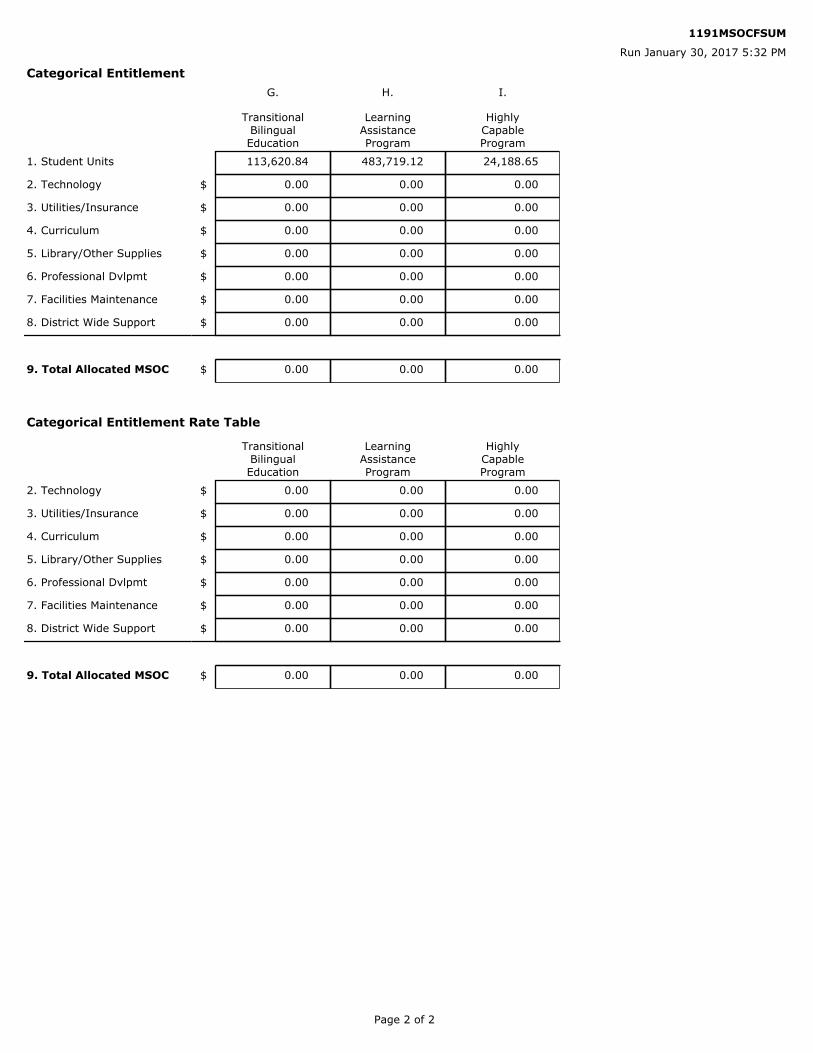
Categorical EntitlementG. H. I.
TransitionalBilingualEducation
LearningAssistanceProgram
HighlyCapableProgram
1. Student Units 113,620.84 483,719.12 24,188.65
2. Technology $ 0.00 0.00 0.00
3. Utilities/Insurance $ 0.00 0.00 0.00
4. Curriculum $ 0.00 0.00 0.00
5. Library/Other Supplies $ 0.00 0.00 0.00
6. Professional Dvlpmt $ 0.00 0.00 0.00
7. Facilities Maintenance $ 0.00 0.00 0.00
8. District Wide Support $ 0.00 0.00 0.00
9. Total Allocated MSOC $ 0.00 0.00 0.00
Categorical Entitlement Rate Table
TransitionalBilingualEducation
LearningAssistanceProgram
HighlyCapableProgram
2. Technology $ 0.00 0.00 0.00
3. Utilities/Insurance $ 0.00 0.00 0.00
4. Curriculum $ 0.00 0.00 0.00
5. Library/Other Supplies $ 0.00 0.00 0.00
6. Professional Dvlpmt $ 0.00 0.00 0.00
7. Facilities Maintenance $ 0.00 0.00 0.00
8. District Wide Support $ 0.00 0.00 0.00
9. Total Allocated MSOC $ 0.00 0.00 0.00
Page 2 of 2
1191MSOCFSUM
Run January 30, 2017 5:32 PM

State of Washington
Superintendent of Public Instruction Run January 30, 2017 5:32 PM
Food Service Report (State Summary Final)
2015-2016 School Year
Apportionment Final
1191FSFSUM
Account 4198 & 419801
I. 4198 School Lunch TOTALS
A. Projected number of meals served in 2015-16 0.00
B. Allotment for 2015-16 $ 0.00
[Est Reimursable Stdnt Lunches Srvd] * [Reimbursement Rate per Lunch]
0.00 * 0.000000
C. Adjustment for 2014-15 $ 0.00
D. Total Amount Due 2015-16 $ 0.00
[Lunch Allotment] + [Lunch Adjustment PY]
0.00 + 0.00
E. Total Amount Paid in 2015-16 $ 0.00
F. Adjustment for 2015-16 $ 0.00
[Lunch Total Due] - [Lunch Total Paid]
0.00 - 0.00
II. 419801 Free and Reduced Breakfasts
A. Projected number of meals served in 2015-16 19,621,192.00
B. Allotment for 2015-16 $ 3,335,602.64
[Est FRPB] * [Reimbursement Rate per Breakfast]
19,621,192.00 * 0.170000
C. Adjustment for 2014-15 $ 1,325,076.21
D. Total Amount Due 2015-16 $ 4,660,678.85
[Breakfast Allotment] + [Breakfast Adjustment PY]
3,335,602.64 + 1,325,076.21E. Total Amount Paid in 2015-16 $ 4,660,678.85
F. Adjustment for 2015-16 $ 0.00
[Breakfast Total Due] - [Breakfast Total Paid]
4,660,678.85 - 4,660,678.85
Page 1 of 1

State of Washington
Superintendent of Public Instruction Run January 30, 2017 5:32 PM
Special Education Report (State Summary Final)
2015-2016 School Year
Apportionment Final
1191SEFSUM
Account 4121
TOTALS
A. Special Education Allotment Without Insurance Benefit Increase (See Report 1220) $ 826,682,354.13
B. Home and Hospital Allotment $ 488,902.00
C. Foster Home Allotment $ 0.00
D. Calculated Allotment $ 827,171,256.13
[Total 4121] + [Home/Hosp Ed Alloc] + [Foster Care Alloc]
826,682,354.13 + 488,902.00 + 0.00
2. Prior Year Carry Forward $ 1,269,771.39
3. a. F-196, Program 21 Direct Expenditures $ 1,321,011,005
b. Account 3121 Allotment $ 199,561,847.00
c. State Recovery Rate 0.00
d. Total Expenditures $ 1,306,153,292.36
([F196 Prog 21 Expend] - [3121 Allotment]) * (1 + [SpEd State Recovery Rate])
(1,321,011,005 - 199,561,847.00) * (1 + 0.000)
e. Payments from other districts $ 13,164,657.53
f. Total $ 1,292,988,634.83
[SpEd Total Expenditures] - [SpEd Pymt from district]
1,306,153,292.36 - 13,164,657.534. Lesser of Calculated Allotment or Expenditures $ 823,663,718.73
If: [Prog 21 Calc] < ([SpEd Subtotal Calc Allot] - [Prog 21 PY Carry Forward]) Then: [Prog 21 Calc] Else: ([SpEd Subtotal Calc Allot] - [Prog 21 PY Carry Forward])
If: 827,171,256.13 < (1,292,988,634.83 - 1,269,771.39) Then: 827,171,256.13 Else: (1,292,988,634.83 - 1,269,771.39)
5. Carry Forward $ 1,907,841.65
If: ([Prog 21 Calc] * [SpEd Carry Fwd %]) < ([Prog 21 Calc] - [SpEd Lesser Calc Allot/Expend]) Then: ([Prog 21 Calc] * [SpEd Carry Fwd %]) Else: ([Prog 21 Calc] - [SpEd Lesser Calc Allot/Expend])
If: (827,171,256.13 * 0.10) < (827,171,256.13 - 823,663,718.73) Then: (827,171,256.13 * 0.10) Else: (827,171,256.13 - 823,663,718.73)
6. Total $ 825,571,560.38
[SpEd Lesser Calc Allot/Expend] + [SpEd Carry Forward]
823,663,718.73 + 1,907,841.65
E. Adjustment for Prior Year $ -539,967.34
F. Total Amount Due $ 825,031,593.04
[SpEd Total Calc Allot] + [SpEd Adjust PY]
825,571,560.38 + -539,967.34
G. Total Amount Paid $ 825,763,058.41
H. Adjustment for Current Year $ -731,465.37
[SpEd Total Due Final] - [SpEd Total Paid]
825,031,593.04 - 825,763,058.41
Page 1 of 2

Account 4122
A. Special Ed - Infants and Toddlers Allotment $ 50,879,940.33
[Prog 22 Calc]
50,879,940.33
2. Prior Year Carry Forward $ 1,217,654.90
3. a. F-196, Program 22 Direct Expenditures $ 46,814,507.43
c. State Recovery Rate 0.00
c. Total Expenditures $ 54,432,081.64
[F196 Prog 22 Expend] * (1 + [SpEd State Recovery Rate])
46,814,507.43 * (1 + 0.00)
e. Payments from other districts $ 31,421.42
f. Total $ 54,400,660.22
[SpEd Infants Total Expenditures] - [SpEd Infants Pymt from district]
54,432,081.64 - 31,421.42 4. Lesser of Calculated Allotment or Expenditures $ 48,523,720.31
If: ([Prog 22 Calc] < ([SpEd Infants Subtotal Calc Allot] - [Prog 22 PY Carry Forward])) Then: [Prog 22 Calc] Else: ([SpEd Infants Subtotal Calc Allot] - [Prog 22 PY Carry Forward])
If: (50,879,940.33 < (54,400,660.22 - 1,217,654.90)) Then: 50,879,940.33 Else: (54,400,660.22 - 1,217,654.90)
5. Carry Forward $ 1,542,732.38
If: ([Prog 22 Calc] * [SpEd Carry Fwd %]) < ([Prog 22 Calc] - [SpEd Infants Lesser Calc Allot/Expend]) Then: ([Prog 22 Calc] * [SpEd Carry Fwd %]) Else: ([Prog 22 Calc] - [SpEd Infants Lesser Calc Allot/Expend])
If: (50,879,940.33 * 0.10) < (50,879,940.33 - 48,523,720.31) Then: (50,879,940.33 * 0.10) Else: (50,879,940.33 - 48,523,720.31)
6. Total $ 50,066,452.69
([SpEd Infants Lesser Calc Allot/Expend] + [SpEd Infants Carry Forward])
(48,523,720.31 + 1,542,732.38)
B. Adjustment for Prior Year $ -421,051.54
C. Total Amount Due $ 49,645,401.15
([SpEd Infants Total Calc Allot] + [SpEd Infants Adjust PY])
(50,066,452.69 + -421,051.54)
D. Total Amount Paid $ 50,431,016.47
E. Adjustment for Current Year $ -785,615.32
([SpEd Infants Total Due Final] - [SpEd Infants Total Paid])
(49,645,401.15 - 50,431,016.47)
Page 2 of 2
1191SEF
Run January 30, 2017 5:32 PM
TOTALS

State of Washington
Superintendent of Public Instruction Run January 30, 2017 5:32 PM
Special Need Programs Report (State Summary Final)
2015-2016 School Year
Apportionment Final
1191SNFSUM
I. Learning Assistance Program (LAP) – Acct 4155 TOTALS
A. Eligible Students 483,719.12
([Enroll Total PY for LAP] * [LAP District Poverty %])
(1,033,600.64 * 0.46800)
B. Formulated Staffing Units 3,092.576
( ( [LAP Students] * [LAP Hr/Stdnt] * [Instruct Wks/Year]) / [LAP Class Size]) / [Instruct Hr/Year]
( ( 483,719.12 * 2.39750 * 36.00) / 15.00) / 900.00
C. CIS Salary Maintenance $ 162,187,422.10
[LAP CIS FTE] * [CIS - Salary Maint] * [CIS Mix]
3,092.576 * 0.00 * 1.54090
D. CIS Salary Increase $ 4,863,743.29
[LAP CIS FTE] * [CIS - Salary Inc] * [CIS Mix] - [LAP CIS Salary Maint]
3,092.576 * 0.00 * 1.54090 - 162,187,422.10
E. CIS Insurance Benefits $ 28,501,180.38
([LAP CIS FTE] * [Health Insurance])
(3,092.576 * 9,216.00)
F. CIS Insurance Benefits Increase $ 445,330.98
([LAP CIS FTE] * [Health Insurance Inc]) - [LAP CIS Insurance]
(3,092.576 * 9,360.00) - 28,501,180.38
G. CIS Payroll Tax and Benefits $ 34,740,545.80
([LAP CIS Salary Maint] * [CIS/CAS - Benefits Maint])
(162,187,422.10 * 0.21420)
H. CIS Payroll Tax and Benefits – Increase $ 1,010,685.88
([LAP CIS Salary Inc] * [CIS/CAS - Benefits Inc])
(4,863,743.29 * 0.20780)
I. LAP MSOC $ 0.00
([Total MSOC Technology-LAP] + [Total MSOC Utilities-LAP] + [Total MSOC Curriciulum-LAP] + [Total MSOC Library/Supplies-LAP] + [Total MSOC Prof Dvlp-LAP] + [Total MSOC Facilities-LAP] + [Total MSOC Districtwide-LAP])
(0.00 + 0.00 + 0.00 + 0.00 + 0.00 + 0.00 + 0.00)
J. Total Learning Assistance Program $ 231,748,908.43
([LAP CIS Salary Maint] + [LAP CIS Salary Inc] + [LAP CIS Insurance] + [LAP CIS Insurance Inc] + [LAP CIS Benefits Maint] + [LAP CIS Benefits Inc] + [Total MSOC -LAP])
(162,187,422.10 + 4,863,743.29 + 28,501,180.38 + 445,330.98 + 34,740,545.80 + 1,010,685.88 + 0.00)
K. Current Year Adjustment $ 0.00
L. 1. Calculated Allotment $ 231,748,908.43
[LAP TOTAL] + [LAP Current Adjust]
231,748,908.43 + 0.00
Page 1 of 5

2. Prior Year Carry Forward $ 14,809,650.31
3. a. F-196 Direct Expenditures $ 225,720,037.15
b. Federal Restricted Recovery Rate 0.04282
c. Total Expenditures $ 235,386,083.15
([F196 Prog 55 Expend] * (1 + [LAP Recovery Rate])
(225,720,037.15 * (1 + 0.04282)4. Lesser of Calculated Allotment or Expenditures $ 216,894,174.50
If: [LAP Calc] < ([LAP Total Expenditures] - [LAP PY Carry Forward]) Then: [LAP Calc] Else: ([LAP Total Expenditures] - [LAP PY Carry Forward])
If: 231,748,908.43 < (235,386,083.15 - 14,809,650.31) Then: 231,748,908.43 Else: (235,386,083.15 - 14,809,650.31)
5. Carry Forward $ 13,025,915.24
If: ([LAP Calc] * [LAP Carry Fwd %]) < ([LAP Calc] - [LAP Lesser Calc Allot/Expend]) IF < 0, Then 0 Then: ([LAP Calc] * [LAP Carry Fwd %]) Else: ([LAP Calc] - [LAP Lesser Calc Allot/Expend])
If: (231,748,908.43 * 0.10) < (231,748,908.43 - 216,894,174.50) IF < 0, Then 0 Then: (231,748,908.43 * 0.10) Else: (231,748,908.43 - 216,894,174.50)
6. Total $ 229,920,089.74
[LAP Lesser Calc Allot/Expend] + [LAP Carry Forward]
216,894,174.50 + 13,025,915.24
M. Adjustment for Prior Year $ -2,342,461.48
N. Total Amount Due $ 227,577,628.26
([LAP Total Calc Allot] + [LAP Adjust PY])
(229,920,089.74 + -2,342,461.48)
O. Total Amount Paid $ 229,180,546.02
P. Adjustment for Current Year $ -1,602,917.76
[LAP Total Due Final] - [LAP Total Paid]
227,577,628.26 - 229,180,546.02
II. Transitional Bilngual Program (TBIP) - Acct 4165
A. Eligible Students 113,620.84
B. Formulated Staffing Units 1,447.685
( ( [Enroll TBIP K-12] * [TBIP Hr/Stdnt] * [Instruct Wks/Year]) / [TBIP Class Size]) / [Instruct Hr/Year]
( ( 113,620.84 * 4.7780 * 36.00) / 15.00) / 900.00
C. Eligible Exited Students 27,216.07
D. Formulated Staffing Units (Exited Students) 217.733
( ( [Enroll TBIP Exited] * [TBIP Hr/Stdnt Exited] * [Instruct Wks/Year]) / [TBIP Class Size]) / [Instruct Hr/Year]
( ( 27,216.07 * 0 * 36.00) / 15.00) / 900.00
E. Total Formulated Staffing Units 1,665.418
[TBIP CIS FTE] + [TBIP CIS FTE Exited]
1,447.685 + 217.733
F. CIS Salary Maintenance $ 86,405,046.27
[Total TBIP CIS FTE] * [CIS - Salary Maint] * [CIS Mix]
1,665.418 * 0.00 * 1.54090
G. CIS Salary Increase $ 2,591,178.44
Page 2 of 5
1191SNFSUM
Run January 30, 2017 5:32 PM
TOTALS

[Total TBIP CIS FTE] * [CIS - Salary Inc] * [CIS Mix] - [TBIP CIS Salary Maint]
1,665.418 * 0.00 * 1.54090 - 86,405,046.27
H. CIS Insurance Benefits $ 15,348,492.37
[Total TBIP CIS FTE] * [Health Insurance]
1,665.418 * 9,216.00
I. CIS Insurance Benefits Increase $ 239,820.11
([Total TBIP CIS FTE] * [Health Insurance Inc]) - [TBIP CIS Insurance]
(1,665.418 * 9,360.00) - 15,348,492.37
J. CIS Payroll Tax and Benefits $ 18,507,960.90
([TBIP CIS Salary Maint] * [CIS/CAS - Benefits Maint])
(86,405,046.27 * 0.21420)
K. CIS Payroll Tax and Benefits – Increase $ 538,446.92
([TBIP CIS Salary Inc] * [CIS/CAS - Benefits Inc])
(0 * 0.20780)
L. TBIP MSOC $ 0.00
([Total MSOC Technology-TBIP] + [Total MSOC Utilities-TBIP] + [Total MSOC Curriciulum-TBIP] + [Total MSOC Library/Supplies-TBIP] + [Total MSOC Prof Dvlp-TBIP] + [Total MSOC Facilities-TBIP] + [Total MSOC Districtwide-TBIP])
(0.00 + 0.00 + 0.00 + 0.00 + 0.00 + 0.00 + 0.00)
M. Total Transitional Bilingual Program $ 123,630,945.01
([TBIP CIS Salary Maint] + [TBIP CIS Salary Inc] + [TBIP CIS Insurance] + [TBIP CIS Insurance Inc] + [TBIP CIS Benefits Maint] + [TBIP CIS Benefits Inc] + [Total MSOC -TBIP])
(86,405,046.27 + 0 + 15,348,492.37 + 239,820.11 + 18,507,960.90 + 538,446.92 + 0.00)
N. TBIP Withhold Amount $ 1,421,755.89
[TBIP Total] * [TBIP Withhold Factor]
123,630,945.01 * 0.01150
O. Total TBIP Allocation $ 122,209,189.12
[TBIP TOTAL] - [TBIP Withhold Amount]
123,630,945.01 - 1,421,755.89
P. Current Year Adjustment $ 0.00
Q. 1.Calculated Allotment $ 122,209,189.12
([TBIP TOTAL Allocation] + [TBIP Current Adjust])
(122,209,189.12 + 0.00)
2. a. F-196 Direct Expenditures $ 140,467,797.88
b. State Recovery Rate 0.16432
c. Total Expenditures $ 163,548,921.66
[F196 Prog 65 Expend] * (1 + [State Recovery Rate])
140,467,797.88 * (1 + 0.16431)
3. Lesser of Calculated Allotment or Expenditures $ 120,709,694.15
If: [TBIP Calc] < ([TBIP Total Expenditures]) Then: [TBIP Calc] Else: [TBIP Total Expenditures]
If: 122,209,189.12 < (163,548,921.66) Then: 122,209,189.12 Else: 163,548,921.66
R. Adjustment for Prior Year $ -3,505,212.76
S. Total Amount Due $ 117,204,461.53
Page 3 of 5
1191SNFSUM
Run January 30, 2017 5:32 PM
TOTALS

([TBIP Lesser Calc Allot/Expend] + [TBIP Adjust PY])
(120,709,694.15 + -3,505,212.76)T. Total Amount Paid $ 118,696,485.36
U. Adjustment for Current Year $ -1,492,023.83
[TBIP Total Due Final] - [TBIP Total Paid]
117,204,461.53 - 118,696,485.36
III. Highly Capable (HiCap) - Acct 4174
A. Eligible Students 24,188.65
([Enroll Total w/ Run Start] * [HiCap % Enroll])
(1,055,847.68 * 0.02314)
B. Formulated Staffing Units 139.260
( ( [HiCap Students] * [HiCap Hr/Stdnt] * [Instruct Wks/Year]) / [HiCap Class Size]) / [Instruct Hr/Year]
( ( 24,188.65 * 2.1590 * 36.00) / 15.00) / 900.00
C. CIS Salary Maintenance $ 7,334,414.13
[HiCap CIS FTE] * [CIS - Salary Maint] * [CIS Mix]
139.260 * 0.00 * 1.54090
D. CIS Salary Increase $ 219,949.92
[HiCap CIS FTE] * [CIS - Salary Inc] * [CIS Mix] - [HiCap CIS Salary Maint]
139.260 * 0.00 * 1.54090 - 7,334,414.13
E. CIS Insurance Benefits $ 1,283,420.17
([HiCap CIS FTE] * [Health Insurance])
(139.260 * 9,216.00)
F. CIS Insurance Benefits: Increase $ 20,053.43
([HiCap CIS FTE] * [Health Insurance Inc]) - [HiCap CIS Insurance]
(139.260 * 9,360.00) - 1,283,420.17
G. CIS Payroll Tax and Benefits $ 1,571,031.52
([HiCap CIS Salary Maint] * [CIS/CAS - Benefits Maint])
(7,334,414.13 * 0.21420)
H. CIS Payroll Tax and Benefits – Increase $ 45,705.57
([HiCap CIS Salary Inc] * [CIS/CAS - Benefits Inc])
(219,949.92 * 0.20780)
I. HiCap MSOC $ 0.00
([Total MSOC Technology-HiCap] + [Total MSOC Utilities-HiCap] + [Total MSOC Curriciulum-HiCap] + [Total MSOC Library/Supplies-HiCap] + [Total MSOC Prof Dvlp-HiCap] + [Total MSOC Facilities-HiCap] + [Total MSOC Districtwide-HiCap])
(0.00 + 0.00 + 0.00 + 0.00 + 0.00 + 0.00 + 0.00)
Page 4 of 5
1191SNFSUM
Run January 30, 2017 5:32 PM
TOTALS

J. Total Highly Capable Program $ 10,474,574.74
([HiCap CIS Salary Maint] + [HiCap CIS Salary Inc] + [HiCap CIS Insurance] + [HiCap CIS Insurance Inc] + [HiCap CIS Benefits Maint] + [HiCap CIS Benefits Inc] + [Total MSOC -HiCap])
(7,334,414.13 + 219,949.92 + 1,283,420.17 + 20,053.43 + 1,571,031.52 + 45,705.57 + 0.00)
K. Current Year Adjustment $ 0.00
L. 1. Calculated Allotment $ 10,474,574.74
([HiCap TOTAL] + [HiCap Current Adjust])
(10,474,574.74 + 0.00)
2. a. F-196 Direct Expenditures $ 19,084,406.50
b. State Recovery Rate 0.16432
c. Total Expenditures $ 22,208,400.35
[F196 Prog 74 Expend] * (1 + [State Recovery Rate])
19,084,406.50 * (1 + 0.16431)3. Lesser of Calculated Allotment or Expenditures $ 10,243,823.59
If: [HiCap Calc] < ([HiCap Total Expenditures]) Then: [HiCap Calc] Else: [HiCap Total Expenditures]
If: 10,474,574.74 < (22,208,400.35) Then: 10,474,574.74 Else: 22,208,400.35
M. Adjustment for Prior Year $ -371,138.73
N. Total Amount Due $ 9,872,679.64
([HiCap Lesser Calc Allot/Expend] + [HiCap Adjust PY])
(10,243,823.59 + -371,138.73)
O. Total Amount Paid $ 10,100,507.29
P. Adjustment for Current Year $ -227,827.65
[HiCap Total Due Final] - [HiCap Total Paid]
9,872,679.64 - 10,100,507.29
Page 5 of 5
1191SNFSUM
Run January 30, 2017 5:32 PM
TOTALS

State of Washington
Superintendent of Public Instruction Run January 30, 2017 5:32 PM
Transportation Report (State Summary Final)
2015-2016 School Year
Apportionment Final
1191TRNFSUM
Account 4199 & 4499
A. Account 4199 - Operations TOTALS
1. Transportation Allot From 1026-A Total $ 422,045,584.89
2. In-Lieu-Of Depreciation For Contracting Districts $ 7,609,562.47
3. A. Calculated Allotment $ 429,655,147.36
[TRN 1026A] + [In-Lieu-Of Deprec for Contracting Dists]
422,045,584.89 + 7,609,562.47
B. i. F-196, Prog 99 Direct Expenditures $ 466,551,129.13
ii. State Recovery Rate $ 0.16880
iii. Total Expenditures $ 545,313,427.71
[TRN 4199 Prg 99 Direct Expend] * (1+ [TRN 4199 State Rcvry])
466,551,129.13 * (1+ 0.16880)
iv. Payments From Other Districts $ 3,237,407.56
v. Total $ 542,076,020.15
[TRN 4199 Total Expend] - [TRN 4199 pmt frm other dist]
545,313,427.71 - 3,237,407.56 C. Lesser Of A.3A, A.3Bv $ 428,609,603.30
If [TRN 4199 Total bfr Adjust] < [TRN 4199 Total Expend less pmts] then [TRN 4199 Total bfr Adjust], if not then [TRN 4199 Total Expend less pmts]
If 429,655,147.36 < 542,076,020.15 then 429,655,147.36, if not then 542,076,020.15
4. Adjustment For 2014-2015 $ -116,703.73
5. Total Amount Due For 2015-2016 $ 428,492,899.57
[TRN 4199 Lesser Allot Expend] + [TRN 4199 PY Adjust]
428,609,603.30 + -116,703.736. Total Amount Paid in 2015-2016 $ 428,820,897.24
7. Adjustment For 2015-2016 $ -327,997.67
[TRN 4199 Total Amount Due YE] - [TRN 4199 Total Amount Paid]
428,492,899.57 - 428,820,897.24
B. Account 4499 - Depreciation
1. School Bus Depreciation Allowance $ 53,922,856.37
2. Adjustment For 2014-2015 $ 23,172.85
3. Total Amount Due 2015-2016 $ 53,946,029.22
[Prgm 4499 Alloc Trans Deprec] + [TRN 4499 PY Adjust]
53,922,856.37 + 23,172.85
4. Total Amount Paid In 2015-2016 $ 53,946,029.22
5. Adjustment For 2015-2016 $ 0.00
Page 1 of 2
[TRN 4499 Total Amount Due] - [TRN 4499 Total Amount Paid]
53,946,029.22 - 53,946,029.22
Page 2 of 2
1191TRNFSUM
Run January 30, 2017 5:32 PM
TOTALS
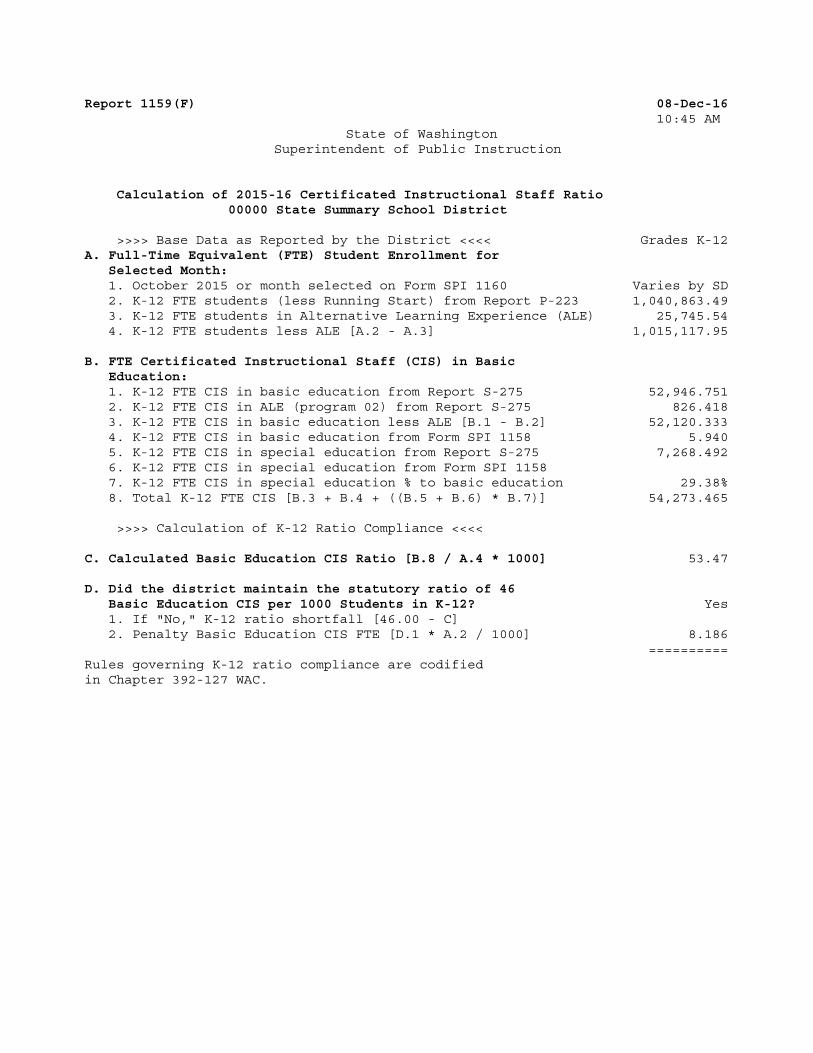
Report 1159(F) 08-Dec-1610:45 AM
State of Washington Superintendent of Public Instruction
Calculation of 2015-16 Certificated Instructional Staff Ratio 00000 State Summary School District
>>>> Base Data as Reported by the District <<<< Grades K-12A. Full-Time Equivalent (FTE) Student Enrollment for Selected Month: 1. October 2015 or month selected on Form SPI 1160 Varies by SD 2. K-12 FTE students (less Running Start) from Report P-223 1,040,863.49 3. K-12 FTE students in Alternative Learning Experience (ALE) 25,745.54 4. K-12 FTE students less ALE [A.2 - A.3] 1,015,117.95
B. FTE Certificated Instructional Staff (CIS) in Basic Education: 1. K-12 FTE CIS in basic education from Report S-275 52,946.751 2. K-12 FTE CIS in ALE (program 02) from Report S-275 826.418 3. K-12 FTE CIS in basic education less ALE [B.1 - B.2] 52,120.333 4. K-12 FTE CIS in basic education from Form SPI 1158 5.940 5. K-12 FTE CIS in special education from Report S-275 7,268.492 6. K-12 FTE CIS in special education from Form SPI 1158 7. K-12 FTE CIS in special education % to basic education 29.38% 8. Total K-12 FTE CIS [B.3 + B.4 + ((B.5 + B.6) * B.7)] 54,273.465
>>>> Calculation of K-12 Ratio Compliance <<<<
C. Calculated Basic Education CIS Ratio [B.8 / A.4 * 1000] 53.47
D. Did the district maintain the statutory ratio of 46 Basic Education CIS per 1000 Students in K-12? Yes 1. If "No," K-12 ratio shortfall [46.00 - C] 2. Penalty Basic Education CIS FTE [D.1 * A.2 / 1000] 8.186
==========Rules governing K-12 ratio compliance are codified in Chapter 392-127 WAC.

Report 1220 24-Jan-17
02:09 PM
00000 State Total School District
Account 4121 Special Education
A. Age 0-2 Resident Special Education Enrollment .........................................................................................................7,068.92
B. Age 3-PreK Resident Special Education Enrollment ................................................................................................12,093.35
C. Age K-21 Resident Special Education Enrollment ......................................................................................................126,506.87
D. BEA Resident FTE Enrollment .....................................................................................................................................1,057,643.58
E. Age K-21 Special Ed Enrollment Percent (C/D) ............................................................................................. 11.96%
F. Funded Age K-21 Special Ed Enrollment Percent
If E is less than or equal to 12.7%, E, else 12.7% ................................................................................ 11.63%
G. Funded Age K-21 Resident Special Education enrollment (D * F) ..................................................................................................................122,953.67
H. BEA Rate (Report 1191 Section V.2)..............................................................................................................................6,203.90$
I. Age 3-PreK Allocation (B * H * 1.15) ........................................................................................................ 87,087,432.97$
J. Age K-21 Allocation
1. 2004-05 Fed Funds Integration Rate Per Student .............................................................................................................................129.37$
2. Fed Funds Int Rate Per Student (J.1. * 24/145)....................................................................................................................................21.41$
3. Age K-21 Allocation (G * ((H * .9309) - J.2)) ..........................................................................................................................715,141,764.41$
K. State Safety Net .................................................................................................................................................................................................24,266,403.00$
L. Transfer of Account 4121 Special Education Allocation .................................................................................................0.00$
M. Total Spec Ed Excess Cost Acct 4121 Alloc. (I + J.3 + K + L) ...........................................................................................826,495,600.38$
ENROLLMENT BY SERVING DISTRICT A. (0-2) B. (3-PreK) C. (K-21) D. (BEA)
00000 STATE TOTAL 7,068.92 12,093.35 126,384.67 1,056,866.93
TOTAL 7,068.92 12,093.35 126,384.67 1,056,866.93
Account 3121 Special Education, General Apportionment
N. Age K-21 Serving District Special Education Enrollment ...........................................................................................126,384.67
O. General Apport Generated by Special Ed Enrollment (N * H) ...........................................................................................792,119,630.69$
P. Allowance for Districtwide Expenditures - State Recovery Rate ...........................................................................................22.34%
Q. General Apport Available for Instructional Programs (O /(1 + P)) ...........................................................................................679,009,603.85$
R. Student Average FTE in Special Education Instruction...........................................................................................29.38%
S. General Apport Allocated for Spec Ed Prog Acct 3121 (Q * R) ...........................................................................................199,561,847.00$
T. Transfer of General Apport for Special Education Allocation .................................................................................................-$
U. Total General Apport for Special Ed Allocation (S + T) ...........................................................................................199,561,847.00$
Total Allocation for Special Education Program 21 (M + U) ................................................................................1,026,057,447.38$
Account 4122 Special Education - Infants and Toddlers
V. Age 0-2 Allocation (A * H * 1.15) ........................................................................................................ 50,879,940.33$
W. Transfer of Account 4122 Special Education Allocation .................................................................................................0.00$
X. Total Special Ed Account 4122 Alloc. (V + W) ...........................................................................................50,879,940.33$
State of Washington
Superintendent of Public Instruction
2015-2016 Special Education Allocations - Final

Report 1191MSCTER 06-Feb-1703:00 PM
00000 State Total School District
A. CTE Minimum Expenditures [Report 1191MSCTE III.B] . . . . . . . . . . . . . . . . . . . . . . . . . . . . . . . . . . $45,135,173.01B. Carryover of Unspent Allocation from 2014-15 . . . . . . . . . . . . . . . . . . . . . . . . . . . . . . . . . . . . . . . . . . . . . . . . . .$1,400,681.78C. F-196 Program 34 Direct Expenditures . . . . . . . . . . . . . . . . . . . . . . . . . . . . . . . . . . . . . . . . . . . . . . . . . .$46,575,187.58D. Allowed Carryover of Unspent Allocation
[A. + B. - C., Maximum of A. * 10%] . . . . . . . . . . . . . . . . . . . . . . . . . . . . . . . . . . . . . . . . . . . . . . . . . . .$1,553,692.72E. Unspent Allocation after Carryover
[C. + D. - A. - B., if less than zero] . . . . . . . . . . . . . . . . . . . . . . . . . . . . . . . . . . . . . . . . . . . . . . . . . . . . . .($519,079.71)F. CTE Allocation per student $6,111.28G. Reg. Allocation per student $5,905.65H. CTE Enhancement per student (F. - G.) $205.63I. CTE FTE [Report 1191ED Line B.1] 8,362.73J. CTE Enhancement Allocation (H. * I.) . . . . . . . . . . . . . . . . . . . . . . . . . . . . . . . . . . . . . . . . . . $2,853,473.51K. Recovery (Greater of E. or -J.) . . . . . . . . . . . . . . . . . . . . . . . . . . . . . . . . . . . . . . . . . . . . . . . . ($243,683.20)L. Carryover to 2016-17 (Lesser of D, or A + B - C; if K is greater than zero) . . . . . . . . . . . . . . . . . . . . . . . . . . . . . . . . . . . . . . . . . . . . . .$1,063,590.58
Notes:If negative CTE Enhancment there isn't a Staff Mix for Program 34
Unspent Allocation (line E.) if the amount is less than a dollar the Recovery is zero and won't prevent a carryover.
Carryover (line L.) must be spent in 2016-17. This will be displayed as theCTE prior year carryforward in section III.C. of the 2016-17report 1191MSCTE beginning in January.
Recovery (line K.) will be included on the 2015-16 Report 1191F issued inJanuary 2017 on line 4 of Analysis of Total Amount Paid.
Districts may request a review of the calculations prior to January 16, 2017based on errors in the calculation or inaccurate school district data.
CTE indirect cost limit rules are in WAC 392-121-570 through WAC 392-121-578.
State of WashingtonSuperintendent of Public Instruction
2015-16 MIDDLE SCHOOL CAREER AND TECHNICAL EDUCATION (CTE) INDIRECT COST LIMITRECOVERY OF STATE ALLOCATIONS
Apportionment Reports by Office of Superintendent of Public Instruction is licensed under aCreative Commons Attribution 4.0 International License.

Report 1191CTER 03-Feb-1702:00 PM
00000 State Total School District
A. CTE Minimum Expenditures [Report 1191CTE III.B.3] . . . . . . . . . . . . . . . . . . . . . . . . . . . . . . $307,092,619.96B. Carryover of Unspent Allocation from 2014-15 . . . . . . . . . . . . . . . . . . . . . . . . . . . . . . . . . . . . . . . . . . . . . . . .$4,447,179.45C. F-196 Program 31 Direct Expenditures . . . . . . . . . . . . . . . . . . . . . . . . . . . . . . . . . . . . . . . . . . . . . . . .$326,062,524.28D. Allowed Carryover of Unspent Allocation
[A. + B. - C., Maximum of A. * 10%] . . . . . . . . . . . . . . . . . . . . . . . . . . . . . . . . . . . . . . . . . . . . . . . $4,311,457.83E. Unspent Allocation after Carryover
[C. + D. - A. - B., if less than zero] . . . . . . . . . . . . . . . . . . . . . . . . . . . . . . . . . . . . . . . . . . . . . . . . . . ($92,799.37)F. CTE Allocation per student $6,332.13G. Reg. Allocation per student $6,210.58H. CTE Enhancement per student (F. - G.) $121.55I. CTE FTE [Report 1191ED Line B.2] 55,270.64J. CTE Enhancement Allocation (H. * I.) . . . . . . . . . . . . . . . . . . . . . . . . . . . . . . . . . . . . . . . . . . $6,718,198.32K. Recovery (Greater of E. or -J.) . . . . . . . . . . . . . . . . . . . . . . . . . . . . . . . . . . . . . . . . . . . . . . . . . . . . ($35,526.70)L. Carryover to 2016-17 (Lesser of D, or A + B - C) . . . . . . . . . . . . . . . . . . . . . . . . . . . . . . . . . . . . . . . . . . . . . .$4,103,966.77
Notes:If negative CTE Enhancment there isn't a Staff Mix for Program 31
Unspent Allocation (line E.) if the amount is less than a dollar the Recovery is zero and won't prevent a carryover.
Carryover (line L.) must be spent in 2016-17. This will be displayed as theCTE prior year carryforward in section III. C. of the 2016-17report 1191CTE beginning in January.
Recovery (line K.) will be included on the 2015-16 Report 1191F issued inJanuary 2017 on line 4 of Analysis of Total Amount Paid.
Districts may request a review of the calculations prior to January 16, 2017based on errors in the calculation or inaccurate school district data.
CTE indirect cost limit rules are in WAC 392-121-570 through WAC 392-121-578.
State of WashingtonSuperintendent of Public Instruction
2015-16 CAREER AND TECHNICAL EDUCATION (CTE) INDIRECT COST LIMITRECOVERY OF STATE ALLOCATIONS
Apportionment Reports by Office of Superintendent of Public Instruction is licensed under aCreative Commons Attribution 4.0 International License.

01/03/17
99tsisi
A. STATE INSTITUTION FTE ENROLLMENT AND STAFF
* 1. 2015‐16 FTE Enrollment Reported on Form E‐672 1,065.62
2. Allocated Certificated Instructional Staff Units (CIS) 122.030
3. Allocated Certificated Administrative Staff Units (CAS) 6.784
4. Allocated Classified Staff Units (CLS) 19.087
B. STATE INSTITUTION CIS ALLOCATION
1. CIS Salary Maintenance Amount 34,172.11
* 2. CIS Staff Mix Factor 1.54944
* 3. CIS Salary Maintenance Total Amount [B.1 * B.2] (180 Day Basis) 52,947.49
4. CIS Salary Increase Amount 35,197.27
* 5. CIS Staff Mix Factor 1.54944
* 6. CIS Salary increase Total Amount [B.4 * B.5 ‐ B.3] (180 Day Basis) 1,588.42
7. CIS 0 Day Maintenance Salary Allocation [ A.2 * B.3 * 0/180 ] 8,180,827.10
8. CIS 0 Day Increase Salary Allocation [ A.2 * B.6 * 0/180 ] 0.00
9. Total CIS 0 Day Salary Allocation [ B.7 + B.8 ] 8,180,827.10
C. STATE INSTITUTION CAS ALLOCATION
1. CAS Salary Maintenance Amount 60,029.02
2. CAS Salary Maintenance Allocation [ A.3 * C.1 ] 409,614.73
3. CAS Salary Increase Allocation [ C.2 * 3.00% ] 12,288.43
4. Total CAS Salary Allocation [ C.2 + C.3 ] 421,903.16
D. STATE INSTITUTION CLS ALLOCATION
1. CLS Salary Maintenance Amount 32,057.67
2. CLS Salary Maintenance Allocation [ A.4 * D.1 ] 610,683.98
3. CLS Salary Increase Allocation [ D.2 * 3.00% ] 18,320.53
4. Total CLS Salary Allocation [ D.2 + D.3 ] 629,004.51
E. STATE INSTITUTION STAFF BENEFIT ALLOCATION
1. Health Benefits
A. Maintenance Allocation [(A.2 + A.3 + ( A.4 * 1.152))* $9,216.00 ] 1,389,793.29
B. Increase Allocation [(A.2 + A.3 + ( A.4 * 1.152))* $144.00 ] 21,715.51
2. Statutory Benefits
A. Certificated Maintenance Salary Benefits [(B.7 + C.2) * 21.42% ] 1,840,072.64
B. Certificated Increase Salary Benefits [(B.8 + C.3) * 20.78% ] 2,553.54
C. Classified Maintenance Salary Benefits [ D.2 * 22.72% ] 138,747.40
D. Classified Increase Salary Benefits [ D.3 * 19.22% ] 3,521.21
3. Total Staff Benefits [ E.1 + E.2 ] 3,396,403.59
F. STATE INSTITUTION DIRECT MATERIAL,SUPPLIES, AND OPERATING COST ALLOCATION
1. Material, Supplies, and Operating Cost Allocation (OBJ 5‐9) [ A.1 * $429.77 ] 457,971.52
G. STATE INSTITUTION INDIRECT COST ALLOCATION
1. Direct Maintenance [ B.7 + C.2 + D.2 + E.1.A + E.2.A + E.2.C + F.1 ] 13,027,710.66
2. Indirect Cost Allocation [ G.1 * 4.7% ] 612,302.40
H. STATE INST. FORMULA ALLOC. [ B.9 + C.4 + D.4 + E.3 + F.1 + G.2 ] 13,698,412.28
I. STATE INSTITUTION NON‐FORMULA ALLOCATION
1. Mentally Ill Offender Unit Allocation 220 Days 125,160.00
J. TOTAL 2015‐16 STATE INSTITUTION ALLOCATION
1. Account State Summary Total Allocation [ H + I.1 ] 13,823,572.28
2. Average Allocation per FTE Pupil [ J.1 / A.1 ] 0.00
3. Average Allocation per FTE Pupil Excluding indrects [( J.1‐G.2)/A.1 ] 12,397.73
NOTES * :
1. These students do not generate other state basic or special education funding.
2. Line A.1:
3. Summary level report ‐ not applicable
4. LINE B.3,B.6: Assumes 0 additional learning improvements days added to base contracts.
5. Summary level report ‐ Not Applicable.
Report 1191SI
STATE OF WASHINGTON
SUPERINTENDENT OF PUBLIC INSTRUCTION
Actual 2015‐16 School Year Allocation for Revenue Account: State Summary
99tsi)

01/03/17
K. YEAR END ALLOCATION ADJUSTMENT
1. Total Allocation at August 31, 2016 14,118,279
2. Final Allocaton at December 31, 2016 14,119,996
3. Year End Allocation Adjustment [ K.2 ‐ K.1 ] 1,717
L. CALCULATION OF CARRYOVER AND RECOVERY
** 1. Final Indirect Allocation [ Line G.2 ] 612,302
2. Direct Expenditures per F‐196 14,017,632
3. Total Program Expenditures including Indirects [ L.1 + L.2 ] 14,629,935
4. Carryover from 2014‐15 0
5. Funding in Excess of Total Program Expense and CFD [ K.2 ‐ L.3 + L.4] 1,092,907
6. Carryover Allowance ‐ Maximum is K.2 * 10% 637,250
7. Funding Recovery [ L.5 ‐ L.6 ] 455,657
M. CALCULATION OF FINAL ADJUSTMENT
1. Final Year End Apportionment Adjustment [ K.3 ‐ L.7 ] (454,131)
NOTES ** :
1. The recovery and carryover calculation is at the revenue account level by school district or ESD.
Individual institution reports are not available.
REPORT 1191SI
STATE OF WASHINGTON
SUPERINTENDENT OF PUBLIC INSTRUCTION
99tsi)