2015 · 16.2 percent compared to 15.8 percent. Adjusted1 earnings per preferred share (EPS)...
202
2015 Annual Report
Transcript of 2015 · 16.2 percent compared to 15.8 percent. Adjusted1 earnings per preferred share (EPS)...

2015 Annual Report
Hen
kel A
nnua
l Rep
ort 2
015

The Company 2 Foreword
6 Report of the Supervisory Board
12 Delivering on our strategy
28 Management Board
Combined management report 30 Management report subindex
31 Corporate governance
52 Shares and bonds
57 Fundamental principles of the Group
65 Economic report
90 Business units
102 Henkel AG & Co. KGaA (condensed version according to the German Com-mercial Code [HGB])
106 Subsequent events
106 Risks and opportunities report
114 Forecast
Consolidated financial statements
116 Consolidated financial statements subindex
118 Consolidated statement of financial position
120 Consolidated statement of income
121 Consolidated statement of comprehensive income
121 Consolidated statement of changes in equity
122 Consolidated statement of cash flows
123 Notes to the consolidated financial statements
180 Independent Auditor’s Report
183 Responsibility statement by the Personally Liable Partner
184 Corporate management bodies of Henkel AG & Co. KGaA
Further information 188 Quarterly breakdown of key financials
189 Multi-year summary
190 Index of tables and graphs
192 Glossary
195 Credits
196 Contacts Financial calendar
Contents
Adhesive Technologies
Our business units
Laundry & Home Care Our top brands
Beauty CareOur top brands
Our top brands
+ 4.9 %organic sales growth
+ 2.1 %organic sales growth
+ 2.4 %organic sales growth
Sales
Sales
Sales

5
7
9
8,117
4,580
4,304
4,626
4,556
5,137
3,510
3,399
3,547
3,542
3,833
7,746
8,127
8,256
8,992
in million euros 2014 2015 +/–
Sales 4,626 5,137 11.0 %
Operating profit (EBIT) 615 786 27.8 %
Adjusted 1 operating profit (EBIT) 749 879 17.4 %
Return on sales (EBIT) 13.3 % 15.3 % 2.0 pp
Adjusted 1 return on sales (EBIT) 16.2 % 17.1 % 0.9 pp
pp = percentage points1 Adjusted for one-time charges/gains and restructuring charges.
in million euros 2014 2015 +/–
Sales 8,127 8,992 10.6 %
Operating profit (EBIT) 1,345 1,462 8.7 %
Adjusted 1 operating profit (EBIT) 1,402 1,534 9.4 %
Return on sales (EBIT) 16.6 % 16.3 % – 0.3 pp
Adjusted 1 return on sales (EBIT) 17.2 % 17.1 % – 0.1 pp
pp = percentage points1 Adjusted for one-time charges/gains and restructuring charges.
Sales Laundry & Home Care in million euros
Sales Beauty Care in million euros
Sales Adhesive Technologies in million euros
Key financials Laundry & Home Care
Key financials Adhesive Technologies
0 2,000 4,000 6,000 8,000
4
6
8
in million euros 2014 2015 +/–
Sales 3,547 3,833 8.1 %
Operating profit (EBIT) 421 561 33.3 %
Adjusted 1 operating profit (EBIT) 544 610 12.2 %
Return on sales (EBIT) 11.9 % 14.6 % 2.7 pp
Adjusted 1 return on sales (EBIT) 15.3 % 15.9 % 0.6 pp
pp = percentage points1 Adjusted for one-time charges/gains and restructuring charges.
Key financials Beauty Care
0 2,000 4,000 6,000 8,000
0 2,000 4,000 6,000 8,000
2013
2012
2011
2014
2015
2013
2011
2014
2015
2012
2013
2012
2011
2014
2015
10,000
10,000
10,000

2015 2015
Highlights 2015
Sales
+ 3.0 %organic sales growth
EBIT
16.2 %adjusted 1 return on sales (EBIT): up 0.4 percentage points
EPS
4.88 euros
adjusted 1 earnings per preferred share (EPS): up 11.4 percent
Dividend
1.47 euros
dividend per preferred share 2
1Key financials
in million euros2011 2012 2013 2014 2015 +/–
2014 – 2015
Sales 15,605 16,510 16,355 16,428 18,089 10.1 %
Operating profit (EBIT) 1,765 2,199 2,285 2,244 2,645 17.9 %
Adjusted 1 operating profit (EBIT) 2,029 2,335 2,516 2,588 2,923 12.9 %
Return on sales (EBIT) in % 11.3 13.3 14.0 13.7 14.6 0.9 pp
Adjusted 1 return on sales (EBIT) in % 13.0 14.1 15.4 15.8 16.2 0.4 pp
Net income 1,191 1,526 1,625 1,662 1,968 18.4 %
Attributable to non-controlling interests 30 46 36 34 47 38.2 %
Attributable to shareholders of Henkel AG & Co. KGaA 1,161 1,480 1,589 1,628 1,921 18.0 %
Earnings per preferred share in euros 2.69 3.42 3.67 3.76 4.44 18.1 %
Adjusted 1 earnings per preferred share in euros 3.14 3.63 4.07 4.38 4.88 11.4 %
Adjusted 1 earnings per preferred share in euros (2012 before IAS 19 revised) 3.70 4.07 4.38 4.88 11.4 %
Return on capital employed (ROCE) in % 15.8 18.7 20.5 19.0 18.2 – 0.8 pp
Dividend per ordinary share in euros 0.78 0.93 1.20 1.29 1.45 2 12.4 %
Dividend per preferred share in euros 0.80 0.95 1.22 1.31 1.47 2 12.2 %
pp = percentage points1 Adjusted for one-time charges/gains and restructuring charges. 2 Proposal to shareholders for the Annual General Meeting on April 11, 2016.
2 3
Adhesive Technologies 50 %
Laundry & Home Care 28 %
Beauty Care 21 %
Sales by business unit Sales by region
Corporate 1 %
Emerging markets 1 43 %Western Europe 34 %
Japan / Australia / New Zealand 2 %
North America 20 %
Corporate 1 %
Corporate = sales and services not assignable to the individual business units.
1 Eastern Europe, Africa/Middle East, Latin America, Asia (excluding Japan).
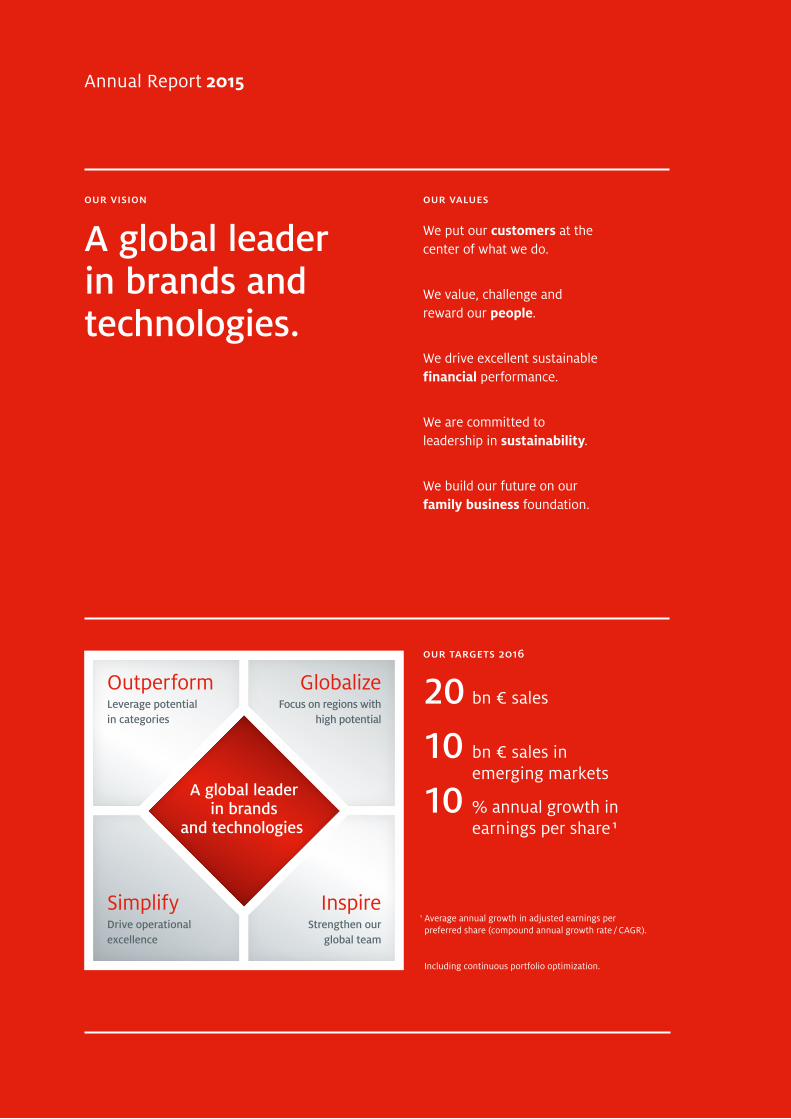
A global leaderin brands
and technologies
Outperform GlobalizeFocus on regions with
high potentialLeverage potentialin categories
InspireSimplifyDrive operationalexcellence
Strengthen ourglobal team
Annual Report 2015
our values
We put our customers at the center of what we do.
We value, challenge and reward our people.
We drive excellent sustainable financial performance.
We are committed to leadership in sustainability.
We build our future on our family business foundation.
A global leader in brands and technologies.
our vision
1 Average annual growth in adjusted earnings per preferred share (compound annual growth rate / CAGR).
Including continuous portfolio optimization.
20 bn € sales
10 bn € sales in emerging markets
10 % annual growth in earnings per share 1
our targets 2016

Kasper Rorsted Chairman of the Management Board
“We achieved strong financial performance, continued to success-fully implement our strategy and laid a strong foundation for our future.”
Henkel Annual Report 20152

2015 was another successful year for Henkel: We grew all our businesses, increased our profitability and advanced key strategic initiatives. This enabled us to improve our competitiveness and create value for shareholders.
Led by our long-term vision to become a global leader in brands and technologies and guided by our values, we continued to implement our strategy: We want to outperform our competition as a globalized company with simplified operations and an inspired team. Our clear focus on this strategy and the dedication of our employees around the world were critical to delivering strong performance – despite a highly volatile and challenging business environment.
In 2015, the global economy grew only moderately. The growth in emerging markets con-tinued to slow down to around 4 percent. This was mainly attributable to lower growth rates in China and recessions in a number of other emerging markets, such as Brazil. The conflict between Russia and Ukraine affected economic growth and the business envi-ronment, as did instability in the Middle East. Mature markets grew around 2 percent, mainly driven by robust economic growth and lower unemployment in the USA. While lower oil prices supported industrial and household demand in many countries, they negatively affected emerging economies that rely on income from oil exports.
Strong performance in 2015
In 2015, Henkel Group sales grew to 18,089 million euros, a double-digit increase com-pared to 16,428 million euros in the previous year. Organic sales growth was 3.0 percent. Adjusted1 earnings before interest rates and taxes (EBIT) grew by 12.9 percent to 2,923 mil-lion euros compared to 2,588 million euros. Adjusted1 return on sales improved to 16.2 percent compared to 15.8 percent. Adjusted1 earnings per preferred share (EPS) grew to 4.88 euros, an increase of 11.4 percent compared to 4.38 euros in 2014.
All three business units delivered solid organic growth and improved their profits. Our emerg-ing markets continued to be the main growth drivers and reported strong organic growth of 5.9 percent in 2015. We also achieved positive organic sales growth in our mature markets.
Henkel increased its cash flow from operating activities to 2,384 million euros versus 1,914 million euros in 2014 and continued to invest in its businesses, brands and innova-tion capabilities. Capital expenditures (excluding acquisitions) rose to 625 million euros from 517 million euros in 2014. In addition, we closed a number of acquisitions across all business units with a total value of more than 300 million euros.
At our Annual General Meeting on April 11, 2016, we will propose to our shareholders a dividend payment of 1.47 euros per preferred share. This represents an increase of 12.2 percent compared to the 1.31 euros paid out in 2015.
In summary, we delivered another excellent year for Henkel in 2015: We recorded double-digit growth rates in sales, profits, earnings per share, share price and our proposed dividend.
Outperform our competition
We have identified digitalization as a key driver of our business success and made further progress in integrating it into all dimensions of our business and processes. In 2015, we continued to standardize and digitalize our business platforms. We also improved inter-nal networking and collaboration and successfully expanded our market- and customer-facing digital activities.
organic sales growth.
+ 3.0 %
adjusted 1 return on sales.
16.2 %
adjusted 1 earnings per preferred share.
+ 11.4 %
1 Adjusted for one-time charges/gains and restructuring charges.
3Henkel Annual Report 2015
Strong brands are the backbone of our business. The share of sales generated by our top 10 brands accounted for 61 percent of total sales compared to 59 percent in the previous year. Our top three brands – Persil, Schwarzkopf and Loctite – generated combined sales of 5.9 billion euros. This significant increase over the previous year was driven by continuous innovation, investment in brand equity and expansion into new markets.
Our commitment to innovation is reflected in high innovation rates across all busi-nesses: In 2015, we generated more than 45 percent of sales in our Laundry & Home Care and Beauty Care businesses with products launched within the last three years. In our Adhesive Technologies business, the share of sales from products launched within the last five years was around 30 percent.
Strong relationships with our major retail and industrial customers are a critical success factor for our business and helped us to grow our share of sales with them in 2015.
Globalize our company
We aim to expand our footprint in emerging markets while leveraging our strong positions in mature markets. In 2015, sales in emerging markets accounted for 43 percent of total Group sales, slightly below the share in the previous year, mainly due to declining curren-cies in a number of emerging markets. At the same time, adjusted for currency fluctuations as well as acquisitions and divestments, emerging markets were the main growth driver for Henkel. We will continue to grow our presence in these markets.
In mature markets, we were able to grow our business and leverage our leading market positions. A highlight in 2015 was the successful launch of two of our flagship brands, Persil and Schwarzkopf, in the US retail business. These launches helped us to return to growth and to improve our performance in our largest market.
Simplify our operations
We aim to continuously simplify our organization in order to improve our operational excellence, increase our efficiency and create competitive advantage. In 2015, we made significant progress in building a scalable business model with standardized, digitalized and accelerated business processes. We successfully established a new organization that manages global supply chain and purchasing activities for all our business units. Its rollout will continue in 2016 and beyond. By the end of 2015, the number of employees in our six shared service centers around the world had climbed to more than 3,000. Key processes for our global organization are handled in these centers. In addition, we launched a new digital networking platform for all employees globally. It complements their digital workplaces and facilitates collaboration across the entire organization.
Inspire our global team
Excellent performance is based on a clear strategy and a strong global team that drives its execution. In order to excel in a highly dynamic and complex business environment, our diverse and increasingly virtual teams require strong leaders. We aim to continuously improve our leadership team and foster a unique performance culture.
A diverse workforce that blends different cultural backgrounds and work experiences is an important success factor. We actively manage diversity and have made significant progress over the past years. In 2015, the share of employees in emerging markets was 55 percent. The share of female managers was around 33 percent.
of sales generated in emerging markets.
43 %
of our managers are women.
Around 33 %
of sales generated by top 10 brands.
61 %
Henkel Annual Report 20154

Committed to leadership in sustainability
2015 was an important milestone on our path toward our long-term sustainability goal: By 2030 we want to triple the value we create for our customers and consumers, for the communities in which we operate and for our company – compared to the environmental footprint of our operations and products.
I am proud to report that we exceeded our interim targets for the first five-year period up to 2015. We improved our overall resource efficiency by 38 percent between 2011 and 2015. This has created a strong foundation to meet our long-term goal by 2030. For the next five years, we have defined a target of 75 percent improvement compared to the base year 2010.
2016 marks another milestone in sustainability for us: We have published our 25th Sustainability Report. Since our first Environment Report in 1992, we have developed it into a detailed and extensive report.
We are committed to leadership in sustainability – this is anchored in our company values. We will continue to be ambassadors for sustainability, drive continuous improve-ments in all its dimensions and actively engage in dialog with stakeholders on our strategy, decisions and actions.
Committed to our targets
2015 was an excellent year for Henkel: We achieved strong financial performance, continued to successfully implement our strategy and laid a strong foundation for our future. After three years of our four-year strategy cycle, we are well on track to meet our key targets for 2016.
After 11 years on the Management Board and 8 years as CEO, I have decided to leave Henkel after the Annual General Meeting at the end of April 2016. I am deeply grateful for my time with Henkel, and I am convinced that the company is well positioned to continue to prosper and grow.
I would like to thank all Henkel employees for their dedication and contribution to our excellent business performance. I would also like to thank our supervisory bodies for their valuable advice. I would like to especially thank you, our shareholders, for your continued trust and support. And finally, I would like to thank our customers around the world for their confidence in our company, people, brands and technologies.
Everyone at Henkel is fully committed to our strategy and targets, and we will continue to implement our strategy and deliver excellent performance.
Düsseldorf, January 29, 2016
Sincerely,
Kasper Rorsted Chairman of the Management Board
5Henkel Annual Report 2015

Dr. Simone Bagel-Trah Chairwoman of the Shareholders’ Committee and the Supervisory Board
“Fiscal 2015 was very successful for Henkel. We are well equipped for the challenges of the future and look toward the continued development of the corporation with confidence.”
Henkel Annual Report 20156 Report of the Supervisory Board

In a difficult business environment characterized by weaker growth in Asia, stagnating economies in Latin America and Eastern Europe, and moderate private consumption overall, fiscal 2015 was very successful for Henkel. All of our business units recorded organic sales growth and a further increase in earnings.
On behalf of the Supervisory Board, I would like to thank all of our employees for their exceptional commitment this past year. My thanks are equally due to the members of the Management Board who have steered the company successfully through these challenging market conditions. I would also like to thank our employee representatives and Works Councils for their constructive support in moving Henkel forward.
To you, our shareholders, I extend my special thanks for your continued confidence in our company, its management and employees, and our brands and technologies over this past fiscal year.
Ongoing dialog with the Management Board
Again in fiscal 2015, the Supervisory Board diligently discharged its duties in accordance with the legal statutes, Articles of Association and rules of proce-dure governing our actions. In particular, we consis-tently monitored the work of the Management Board, advising and supporting it in its stewardship, in the strategic further development of the corporation, and in decisions relating to matters of major importance.
In the course of 2015, the Management Board and the Supervisory Board continued to cooperate through extensive dialog founded on mutual trust and confi-dence. The Management Board kept us regularly and extensively informed of all major issues affecting the corporation’s business and our Group companies with prompt written and oral reports. Specifically, the Management Board reported on the business situation, operational development, business policy, profitability issues, our short-term and long-term corporate, financial and personnel plans, as well as capital expenditures and organizational measures.
Quarterly reports focused on the sales and profits of Henkel Group as a whole, with further analysis by business unit and region. All members of the Super-visory Board consistently had sufficient opportunity to critically review and address the issues raised by each of these reports and to provide their individual guidance.
The Chairman of the Audit Committee and I, as Chairwoman of the Supervisory Board, remained in regular contact with the Chairman of the Manage-ment Board outside of Supervisory Board meetings. This procedure ensured that we were constantly aware of current business developments and signifi-cant events. The other members were informed of major issues no later than by the next Supervisory Board or committee meeting.
The Supervisory Board and the Audit Committee each held four regular meetings in the reporting year. Attendance at the Supervisory Board and committee meetings was around 91 percent and 96 percent respectively. Béatrice Guillaume-Grabisch attended two meetings of the Supervisory Board.
There were no indications of conflicts of interest involving Management Board or Supervisory Board members that required immediate disclosure to the Supervisory Board and reporting to the Annual G eneral Meeting.
Major issues discussed at Supervisory Board meetings
In each of our meetings, we discussed the reports submitted by the Management Board, conferring with it on the development of the corporation and on strategic issues. We also discussed the overall eco-nomic situation and Henkel’s business performance.
In our meeting on March 2, 2015, we focused on approving the annual and consolidated financial statements for 2014, including the risk report and corporate governance report, the 2015 Declaration of Compliance, and our proposals for resolution by the 2015 Annual General Meeting. A detailed report of
7Henkel Annual Report 2015 Report of the Supervisory Board
this was included in our last Annual Report. We also discussed the concept of Laundry & Home Care’s Global Experience Center in Düsseldorf, where we present our innovations to our customers through interactive experiences.
In addition to the general business performance in the first months of the fiscal year, the focus of our meeting on April 13, 2015 was on the challenges fac-ing our corporation from an increasingly digitalized environment. We extensively discussed the priorities for our digital strategy and the corresponding steps being taken in our business units. These include the increased use of digital applications by our employees, innovative solutions and technologies for analyzing data, reaching our customers through digital media, and the expansion of our eCommerce operations.
In our meeting on September 18, 2015, we extensively discussed business and market developments in North America. In the consumer businesses, where the market is characterized by intense competition, the introduction of Persil ProClean and of hair care and styling products in retail channels under the Schwarzkopf brand generated positive results. The Adhesive Technologies business unit also performed positively in North America. We reviewed the struc-tural measures that had been taken, mainly in light of weakening growth in Asia. Likewise addressed at this meeting were the continued development of the leadership team and the recruitment of management talent in emerging markets.
Our meeting on December 11, 2015 focused on the expected figures for 2015 and on our assets and financial planning for fiscal 2016. We also discussed the associated budgets of our business units in detail based on comprehensive documentation.
Supervisory Board committees
In order to enable us to efficiently comply with the duties incumbent upon us according to legal statute and our Articles of Association, we have established an Audit Committee and a Nominations Committee. The Audit Committee was chaired in the year under review by Prof. Dr. Theo Siegert, who complies with the statutory requirements of impartiality and exper-tise in the fields of accounting or auditing and brings experience in the application of accounting principles and internal control procedures. For more details on the responsibilities and composition of these committees, please refer to the corporate governance report on pages 31 to 40 and the membership lists on page 185 of this Annual Report.
Committee activities
Pursuant to its appointment by the 2015 Annual General Meeting, the Audit Committee mandated the external auditor to audit the annual financial state-ments and the consolidated financial statements, and to review the interim financial reports for 2015. The audit fee and focus areas of the audit were also established. The Audit Committee obtained the neces-sary validation of auditor independence for the per-formance of these tasks. The auditor has informed the Audit Committee that there are no circumstances that might give rise to a conflict of interest in the execution of its duties.
The Audit Committee met four times in the year under review. The Chairman of the Audit Committee also remained in regular contact with the auditor outside of the meetings. The meetings and resolu-tions were prepared through the provision of reports and other information by the Management Board. The Chair of the Committee reported promptly and in full to the plenary Supervisory Board on the con-tent and results of each of the Committee meetings.
Henkel Annual Report 20158 Report of the Supervisory Board
All Audit Committee meetings focused on the com-pany and Group accounts, including the interim (quarterly and half-year) financial reports, with all matters arising being duly discussed with the Man-agement Board. The three meetings at which we discussed and approved the interim financial reports were attended by the auditor. The latter reported on the results of the reviews and on the main issues and occurrences relevant to the work of the Audit Com-mittee. There were no objections raised in response to these reports.
The Audit Committee also reviewed the accounting process and the efficacy and further development of the internal Group-wide control and risk manage-ment system. One of its tasks was to review the efficiency of the risk management system, based on the risk reports of previous years. In addition, the Audit Committee received the report of the General Counsel & Chief Compliance Officer regarding major litigations and compliance within the Group, as well as the status report of the Head of Internal Audit. It approved the audit plan put forward by Internal Audit, which extends to examining the functional efficiency and efficacy of the internal control system and our compliance organization. Discussion also centered on treasury risks and their management and on the current reform in statutory auditing including its impact on the work of the Audit Committee.
At its meeting on February 22, 2016, attended by the auditor, the Audit Committee discussed the annual and consolidated financial statements for fiscal 2015, including the audit reports, the associated proposal for appropriation of profits, and the risk report. It also prepared the corresponding resolutions of the Supervisory Board. The Committee also made its rec-ommendation to the Supervisory Board regarding the latter’s proposal for resolution by the Annual General Meeting relating to the appointment of the external auditor for fiscal 2016. A declaration from the auditor asserting its independence was again duly received, accompanied by details pertaining to non-audit services rendered in fiscal 2015 and those envisioned for fiscal 2016. There was no evidence of any bias or
partiality on the part of the auditor. As in previous years, other members of the Supervisory Board took part as guests in this specifically accounting-related meeting of the Audit Committee.
The Nominations Committee prepared the resolu-tions of the Supervisory Board to be presented to the 2016 Annual General Meeting for the upcoming new election of shareholder representatives. In addition to the qualifications of the individual candidates, the Nominations Committee also takes into account when selecting candidates the recommendations of the German Corporate Governance Code [DCGK] and the targets set by the Supervisory Board for its future composition. All of the candidates confirmed their ability to devote the time needed to perform Super-visory Board duties.
Efficiency audit
The Supervisory Board and Audit Committee regu-larly review the efficiency with which they perform their duties, based on a comprehensive, company-specific checklist distributed to all members. The checklist covers important aspects such as meeting preparation and procedure, the scope and content of documents and information – particularly with respect to financial reports, compliance and audits – as well as financial control and risk management. Such a survey took place in the reporting year. The results and assessments were examined in detail in the meeting of the Audit Committee on February 22, 2016 and the meeting of the Supervisory Board on February 23, 2016, where issues of corporate gover-nance and opportunities for improvement were also discussed. The efficiency with which the Supervisory Board and Audit Committee carry out their duties and the required independence of their membership were duly confirmed.
9Henkel Annual Report 2015 Report of the Supervisory Board

Corporate governance and declaration of compliance
The Supervisory Board again dealt with questions of corporate governance in the reporting year. Specifi-cally, in our meeting on September 18, 2015, we reviewed and updated our targets for the composi-tion of the Supervisory Board, taking into account new legislation concerning the composition of supervisory boards for co-determined and listed companies and the relevant provisions of the German Corporate Governance Code. Details of these changes and on Henkel’s corporate governance can be found in the management report on corporate governance (pages 31 to 40 of this Annual Report), with which we fully acquiesce.
At our meeting on February 23, 2016, we discussed and approved the joint Declaration of Compliance of the Management Board, the Shareholders’ Commit-tee and the Supervisory Board with respect to the German Corporate Governance Code [DCGK] for 2016. The full wording of the current and previous declara-tions of compliance can be found on the company website.
Annual and consolidated financial statements / Audit
The auditor appointed for 2015 by the Annual General Meeting – KPMG – has examined the annual financial statements prepared by the Management Board in accordance with the provisions of the German Com-mercial Code [HGB], and the consolidated financial statements along with the consolidated management report, which has been combined with the manage-ment report for Henkel AG & Co. KGaA for 2015. The auditor issued an unqualified opinion for each report. The consolidated financial statements were prepared in accordance with International Financial Reporting Standards (IFRS) as endorsed by the Euro-pean Union (EU), and in accordance with the supple-mentary German statutory provisions pursuant to Section 315a (1) HGB. The consolidated financial statements in their present form exempt us from the requirement to prepare consolidated financial state-ments in accordance with German law.
KPMG conducted the audit in accordance with Section 317 HGB and the German generally accepted standards for the audit of financial statements pro-
mulgated by the Institut der Wirtschaftsprüfer (Institute of Public Auditors in Germany), and in supplementary compliance with International Standards on Auditing (ISA).
The annual financial statements, consolidated finan-cial statements and combined management report, the audit reports of KPMG and the recommendations by the Management Board for the appropriation of the profit made by Henkel AG & Co. KGaA were pre-sented in good time to all members of the Supervi-sory Board. We examined these documents and dis-cussed them at our meeting of February 23, 2016. This was attended by the auditor, which reported on its main audit findings. We received the audit reports and declared our acquiescence therewith. The Chair of the Audit Committee provided the ple-nary session of the Supervisory Board with a detailed account of the treatment of the annual financial statements and the consolidated financial statements by the Audit Committee. Having received the final results of the review conducted by the Audit Committee and concluded our own examination, we see no reason for objection to the aforementioned documents. We have agreed to the results of the audit. The assessment by the Management Board of the position of the company and the Group coincides with our own appraisal. At our meeting of February 23, 2016, we concurred with the recommendations of the Audit Committee and therefore approved the annual financial statements, the consolidated finan-cial statements and the combined management report as prepared by the Management Board.
Additionally, we discussed and approved the proposal by the Management Board to pay out of the unappropriated profit of Henkel AG & Co. KGaA a dividend of 1.45 euros per ordinary share and of 1.47 euros per preferred share, and to carry the remainder and the amount attributable to the trea-sury shares held by the company at the time of the Annual General Meeting forward to the following year. This proposal takes into account the financial and earnings position of the corporation, its medium-term financial and investment planning, and the interests of our shareholders.
In our meeting on February 23, 2016, we also ratified our proposal for resolution by the Annual General Meeting relating to the appointment of the external auditor for the next fiscal year, based on the recom-mendations of the Audit Committee.
Henkel Annual Report 201510 Report of the Supervisory Board

Risk management
Risk management issues were examined not only by the Audit Committee but also the plenary Supervi-sory Board, with emphasis on the risk management system in place at Henkel and any major individual risks of which we needed to be notified. There were no identifiable risks that might jeopardize the con-tinued existence of the corporation as a going con-cern. The structure and function of the risk early warning system were also integral to the audit per-formed by KPMG, which found no cause for reserva-tion. It is also our considered opinion that the risk management system corresponds to the statutory requirements and is fit for the purpose of early iden-tification of developments that could endanger the continuation of the corporation as a going concern.
Changes in the Supervisory Board and Management Board
There were no changes in the Supervisory Board in the year under review.
As announced in mid-January 2016, Kasper Rorsted will leave the company at his own request as of April 30, 2016. Hans Van Bylen, who is currently Executive Vice President with lead responsibility for the Beauty Care business unit, has been appointed as the new Chairman of the Management Board effective May 1, 2016. Pascal Houdayer has been appointed to the Management Board effective March 1, 2016, and will take over as Executive Vice President with lead responsibility for the Beauty Care business unit as of May 1, 2016.
Kasper Rorsted achieved a lot for Henkel during his 11 years as a member of the Management Board, 8 of which he served as Chairman of the Management Board. Under his leadership since 2008, the company has delivered successful performance in a challeng-ing market environment. Sales, profitability and market capitalization have increased significantly and our top brands have been strengthened. For this, I would like to sincerely thank Kasper Rorsted on behalf of all governance committees, employees and shareholders of Henkel.
Hans Van Bylen has long-standing, international experience at Henkel – both in managing brands and markets, and on the Management Board. He started
his successful career at Henkel back in 1984. In the more than 31 years since then, he has occupied vari-ous management posts involving extensive regional responsibility in both the Laundry & Home Care and Beauty Care business units. Hans Van Bylen was appointed to the Management Board in 2005 with responsibility for the Beauty Care business.
Pascal Houdayer was appointed Corporate Senior Vice President at the Laundry & Home Care business unit in 2011. Since that time he has been responsible for International Marketing within the Home Care busi-ness area, the digital activities of the business unit, and also its operations in the Asia-Pacific region. Prior to this, he worked from 1993 for another globally active corporation, occupying a number of positions of international responsibility in the laundry deter-gent / household cleaner and toiletry segments.
We wish Hans Van Bylen and Pascal Houdayer every success in their new roles. We are delighted to have two experienced leaders from within Henkel moving into these positions on the Management Board.
The year ahead will once again present challenges to all of our employees and our management. Many of the issues and changes encountered and tackled in 2015 will remain important for us in 2016. Henkel is well equipped for these challenges and we look toward the continued development of our corpora-tion with confidence.
We thank you for your ongoing trust and support.
Düsseldorf, February 23, 2016
On behalf of the Supervisory Board
Dr. Simone Bagel-Trah (Chairwoman)
11Henkel Annual Report 2015 Report of the Supervisory Board

Outperform
Digitalization drives business successLeveraging digital technology to keep pace with changing customer and consumer trends remained an important driver of our business success in 2015. We also continued to strengthen our top brands, maintained high innovation rates across all business units and deepened our relationships with key customers and consumers.
Digitalization offers an abundance of choices and creates transparency about quality and prices. It also helps to build strong brands in order to meet cus-tomer and consumer demands. This has a significant impact on our business operations, innovations, pro-duction technologies and processes. It also changes
the way global teams around the world collaborate and communicate. We anticipated these trends early on and included digitalization as a main component of our strategic priority “Outperform.” This has given us the ability to leverage digital opportunities that lie ahead.
Henkel Annual Report 201512 Outperform

Our digital strategy provides a clear framework for a consistent and integrated approach to digitalization throughout the entire company. It enables us to evolve our digital culture, leverage data and technol-ogy, engage customers and consumers across all dig-ital touchpoints and grow our business through digi-talization.
Our Digital Council promotes and coordinates this strategy. Within this Council, senior managers and digital experts from all business units and functions work together on strategic digital projects. In 2015, we made progress on the integration of our SAP sys-tems into one platform. We also launched our inter-nal networking platform Yammer, which connects our global workforce and enables digital exchange and collaboration. We expanded our customer-facing digital activities, for example through targeted social media campaigns. We also successfully grew our eCommerce activities, such as in our Beauty Care business in China or with our business-to-business platform “Henkel POD.”
Strengthening our top brands
In 2015, we continued to focus on strengthening our top brands and were able to expand their share of sales: Our top 10 brands accounted for 61 percent of our total Group sales, up from 59 percent in the pre-vious year. Our top three brands, Persil, Schwarzkopf and Loctite, generated combined sales of around 5.9 billion euros in 2015 compared to around 5 bil-lion euros in 2014. We focus on our top brands and strengthen them through investments in innovation and brand equity as they generate above-average growth and profitability.
Persil is the leading brand for our Laundry & Home Care business unit and has been characterized by a commitment to innovation and performance for more than 100 years. Today, Persil is available in more than 50 countries, gaining market share and new customers year after year. In 2015, we launched Persil ProClean in the US market, supported by a suc-cessful, targeted social media campaign. It is now being rolled out nationwide. In 2015, our high-per-formance laundry detergents from Persil achieved global sales of around 1.2 billion euros.
Our Schwarzkopf brand is the global hair expert and the largest brand of our Beauty Care business unit. Schwarz-kopf products are available in more than 60 countries. Since its creation in 1898, outstanding innovation, qual-ity, passion and competence have been the key charac-teristics of this iconic brand. Thanks to its winning innovations in both its professional and retail markets, Schwarzkopf has continuously gained market shares in all categories and generated sales of more than 2 billion euros. Supported by a holistic, consumer-centered approach with a clear focus on digital activities, we successfully introduced Schwarzkopf in the US retail market in 2015. The brand, with its premium posi-tioned hair care, styling and color products, is now being rolled out nationwide.
A clear strategic framework guides digital projects and initiatives across all business units and functions at Henkel. As members of our Digital Steering Group, Dr. Nils Daecke, Dr. Salima Douven and Georg Wawer (from the left) regularly discuss current and future trends and align on the execution of key digital initiatives – from internal processes and systems to customer-facing platforms and channels.
13Henkel Annual Report 2015 Outperform

Outperform
With our new-generation fabric softener Silan Soft & Oils, our Laundry & Home Care business answers consumer demand for “affordable luxury” in Eastern and Western Europe. It is the first transparent fabric softener on the market and allows for extra softness as well as an intensive, long-lasting fragrance. This inno-vation has enabled us to significantly increase value in the fabric softener category, giving us a clear competitive advantage. The product is available in 19 European countries under the brand names Silan and Vernel. Here we see a Polish consumer using Silan Soft & Oils.
Loctite is the largest brand within our Adhesive Tech-nologies business unit and one of the most trusted brands for adhesives, sealants and coating solutions. Loctite products are used in more than 130 countries globally and in many different industries, including aerospace, automotive, and industrial assembly and repair. It is also widely used in consumer applica-tions. In 2015, Loctite products achieved sales of around 2.7 billion euros. Loctite became the first-ever adhesives brand to advertise during the annual National Football League Super Bowl® in the USA in 2015. The commercial generated 45 million page impressions on social media and was the number-one trending topic on Twitter directly after airing. The campaign significantly increased brand aware-ness and helped position Loctite as a leading adhe-sives brand.
Powerful innovations
In highly competitive markets, we continuously strengthen our innovation capabilities to better antic-ipate and meet the needs of our customers and consumers around the world. Our regional research centers allow us to develop customer-specific solu-tions and innovations. Since the start of our current strategy cycle in 2013, we have opened or expanded five research and development centers globally.
In 2015, we achieved high innovation rates in all three business units. In both Laundry & Home Care and Beauty Care, the innovation rate – the share of products launched within the last three years – was more than 45 percent. In Adhesive Technologies, the share of sales from products launched within the last five years was around 30 percent.
Focus on customers
Customer focus is one of our values at Henkel. We put our customers at the center of everything we do and promote customer understanding and connection across the entire company. We put particular emphasis on deepening our relationships with our largest cus-tomers through “top-to-top” exchanges led by our Management Board. This helps us to better understand their dynamic business environment and growth ambitions, and to adapt our cooperation with them accordingly to drive joint business success.
Our Laundry & Home Care Global Experience Center in Düsseldorf provides a unique platform for such “top-to-top” meetings. Here, visitors learn firsthand
Henkel Annual Report 201514 Outperform

about our innovation capabilities through cutting-edge technology, live demonstrations and opportuni-ties for interaction. Since its opening at the beginning of 2015, we have welcomed numerous customers as well as other stakeholders from all over the world.
Within Beauty Care, our strong customer focus forms one of the key pillars for our long-term profitable growth. Through both the Beauty Care Lighthouse, our well-established customer center in Düsseldorf, and extended strategic partnerships with key retail-ers around the world, we have been able to leverage global and local agreements and work together on joint business planning. This enables us to generate above-average growth and regularly earns us top rankings in global customer surveys as well as presti-
gious industry awards as best supplier in the beauty category.
Within our Adhesive Technologies business unit, we have further reinforced our innovation capabilities worldwide to develop tailor-made solutions together with our customers. In our global innovation centers, we offer a broad portfolio of application technolo-gies, specification testing, validation, and training for various industries. With our new innovation cen-ter in Shanghai, for example, our customers particu-larly benefit from our expert knowledge based on strong collaboration across all our business areas.
15Henkel Annual Report 2015 Outperform

Globalize
Strong performance worldwideWe continued to globalize our businesses, delivering growth in emerging and mature markets in 2015. This successful development was driven by strategic investments in brands and technologies as well as in R&D and manufacturing capacities. We also grew our businesses through winning digital initiatives and expansion into new markets and categories.
In order to strengthen our market and category posi-tions around the world, we continued to invest in our leading brands and technologies to meet local or regional needs. We expanded our R&D capabilities and enhanced our manufacturing setup – in particu-
lar in emerging markets. Digital initiatives also played an increasingly important role in driving our business success in many markets. Targeted acquisi-tions across all business units helped to further strengthen and complement our positions in
Henkel Annual Report 201516 Globalize

selected markets and categories or add specific technological expertise. Our successful development in a volatile business environment is testament to the strength and commitment of our teams in both emerging and mature markets.
Strong performance in emerging markets
In 2015, emerging markets continued to be the main growth driver for Henkel with an organic sales growth of 5.9 percent. The share of sales generated in emerging markets was 43 percent.
With a population of over 1.3 billion, China is not only the world’s leading emerging country, but also the largest eCommerce market. While we saw the impact of the economic slowdown in our industrial business, our Beauty Care business continued to deliver double-digit organic sales growth, also driven by strong online sales.
To further expand our leading position in the Chi-nese hair cosmetics market, our Beauty Care busi-ness unit launched an advanced strategic partner-ship with Alibaba, China’s largest online commerce company. In 2015, Beauty Care generated around 30 percent of its sales in China through eCommerce, which is double the amount from the previous year. This also exceeds the high growth rates in the Chinese eCommerce market. Driven by tailored eInnovations and a dedicated, passionate team of local experts, Schwarzkopf now is the number one hair care brand on Tmall, Alibaba’s business-to-con-sumer platform.
Our Laundry & Home Care business unit has created global impact for its brands with over 6.5 billion qualitative ad impressions from digital campaigns in 2015. We have gained over 30 percent growth in reach on social media platforms and are constantly explor-ing new marketing technologies. We have also made significant progress in eCommerce in emerging mar-kets: For example, over 30 percent of our revenue in South Korea is generated through digital channels, and we are constantly expanding this share. The stra-tegic focus of our brands such as Persil, Bref and Somat is to utilize these digital trends. We are con-stantly improving marketing efficiency, exploring new communication channels and focusing on engaging video content. We have partnered with dig-ital start-ups in order to stay up-to-date on trends and ensure business model innovation. In 2016, we plan to further increase our investment in digital marketing by a high double-digit percentage.
In our Adhesive Technologies business unit, we con-tinued to invest in modern multi-technology produc-tion sites, especially in emerging markets. In India, the second-largest emerging market globally, we began construction of a new adhesives production facility. When completed in early 2017, the 20,000 square meter plant will be the largest of its kind in India with a potential output of around 80,000 metric tons per year. In Mumbai, we inaugurated the Henkel Flexible Packaging Academy, the first of its kind in the India, Middle East and Africa region. This academy
Singles’ Day, which is held each year on November 11 in China, has become the world’s largest online retail day with sales of more than 13 billion euros and over 500,000 packages shipped. From the left: Adele Zhang, Tony Wan, Mark Gu and Thea Lang from the Henkel Beauty Care team in Shanghai discuss our product and promotion strategy for the 2015 Singles’ Day. With a focused strategy in place, Beauty Care has achieved a breakthrough in the eCommerce domain with an impressive quota of online sales catering to the highly mobile lifestyle of the world’s largest eCommerce markets.
17Henkel Annual Report 2015 Globalize

Globalize
Working closely with customers like Morey, an electronics manu-facturing services partner in the United States, enables Henkel to provide tailor-made solutions around the world. Morey employee Kevin Hussey explains to Hailey Kamen from Henkel how he tracks the application of Loctite GC 10 on circuit boards.
offers certified training programs for professionals in the flexible packaging industry in association with the Indian Institute of Packaging. In addition, we opened new adhesives production facilities in Russia and in Bosnia and Herzegovina. We also began con-struction of a new plant in Georgia.
Top positions in mature markets
Henkel holds leading positions in many mature mar-kets around the world. In 2015, we achieved organic sales growth of 0.7 percent in these markets. This was driven in particular by positive development in North America.
Our Laundry & Home Care business unit has con-tinuously strengthened its leading position in its mature markets – from Western Europe to the USA – and expanded into new markets in Australia and New Zealand. In 2015, we acquired Colgate-Palmolive’s entire range of laundry detergent and pre-wash brands in Australia and New Zealand. This acquisition makes the Laundry Care business one of the leading players in the detergents category in those countries. In Western Europe, the integration of Spotless Group, which was acquired in 2014, has created new growth potential in highly profitable categories, complementing our exist-ing Laundry & Home Care portfolio. In the USA, we successfully launched our flagship detergent brand Persil ProClean.
Henkel Annual Report 201518 Globalize

Further leveraging country and category opportuni-ties, our Beauty Care business unit complemented its strong performance in the USA, the largest hair mar-ket worldwide, with the successful launch of our top brand Schwarzkopf in the retail market. Introduced in parallel across all hair categories, the brand and products have been recognized with multiple indus-try and consumer awards. In Europe, Beauty Care invested in the expansion of its production facility for shampoos and shower gels in Germany. This advanced, high-throughput facility serves all West-ern European markets as well as selected markets in Eastern Europe.
Based on the strong positions of its different business areas, Adhesive Technologies was able to leverage its innovation competence and introduce state-of-the-art technologies globally. With the first-ever temperature- stable solder paste Loctite GC 10, for example, we offer customers in the electronics industry process improvements and cost reductions by providing them with a solution to logistical and storage challenges. The product cuts energy consumption and reduces waste by eliminating the need for refrigerated trans-port and storage. Loctite GC 10 has been a catalyst for expanding partnerships with our customers, such as with the US-based electronics manufacturing service partner Morey Corporation. The company recently selected Henkel as its primary solder paste and adhesives partner.
19Henkel Annual Report 2015 Globalize

Simplify
Creating competitive advantage In 2015, we made significant progress in driving operational excellence and building a scalable business model, which will increase our efficiency and competitiveness. We successfully launched our global supply chain organization, expanded shared services and advanced the integration of our IT platforms.
Continuously simplifying our organization is one of our strategic priorities. We aim to improve opera-tional excellence in all dimensions of our business processes. Building a scalable business model with standardized, digitalized and accel erated processes will help us create competitive advantages in terms of speed, agility and cost efficiency.
Rollout of one global supply chain
Our newly established global supply chain organiza-tion blends the knowledge of a company with nearly 140 years of history with the energy and excitement of a start-up. Within this new organization, colleagues from all business units and functions work together
Henkel Annual Report 201520 Simplify

in our Amsterdam office. Here, we established a cen-tralized hub for global decision-making for both sup-ply chain and purchasing activities in 2015. The new entity manages supply planning, sourcing, manufac-turing, inventory and distribution for all our business units. This harmonization across the entire company will lead to higher process standardization, improved customer service levels and enhanced efficiency – and thereby drive competitive advantages for Henkel.
The global rollout of our global supply chain structure will continue in 2016 and beyond. We achieved our first major milestone in July 2015 with the successful launch in Benelux and Switzerland as well as at the Beauty Care sites in Germany and Slovenia. By 2017, we will finalize the implementation for 30 countries in Europe, with other regions following subsequently.
During the fourth quarter of 2015, we also began establishing our second hub in Singapore. This office will provide support for the Amsterdam office in the Asia-Pacific region.
Expansion of shared services
In 2015, we continued to expand our shared services organization. Already by the end of 2015, we had more than 3,000 employees in six global shared ser-vice centers handling key processes for our global organization. We have also successfully integrated these shared services with our global IT in our Inte-grated Business Solutions organization.
Strong focus on IT
Digitalization at Henkel goes beyond customer-fac-ing platforms. The ongoing implementation of our SAP platforms plays a key role in establishing our scalable business model, and we have successfully completed this process in the Asia-Pacific region. We also made progress on the implementation in Europe in 2015.
As part of our “Sourcing@Best” initiative, we contin-ued to improve cost efficiency and increase the flex-ibility of our global sourcing processes in 2015. We expanded our eSourcing activities across the entire company.
In 2015, we also introduced our internal digital net-working platform Yammer for all employees around the world. From its launch in September to the end of 2015, around 20,000 employees had registered on this platform. It complements the digital workplaces at Henkel and facilitates collaboration and simpli-fied communication across the company.
Around 150 employees from all functions and business units work together in our new global supply chain company, located in one of the world’s most sustainable buildings, The Edge, in Amsterdam, the Netherlands. From the left: Andrea Hermanns, Chen Zhang, Diego Patruno, May ElMenshawy, Nataliya Soloveva and Marilia Figueiredo use the open space of our new global supply chain office to team up on projects and coordinate tasks.
21Henkel Annual Report 2015 Simplify
Inspire
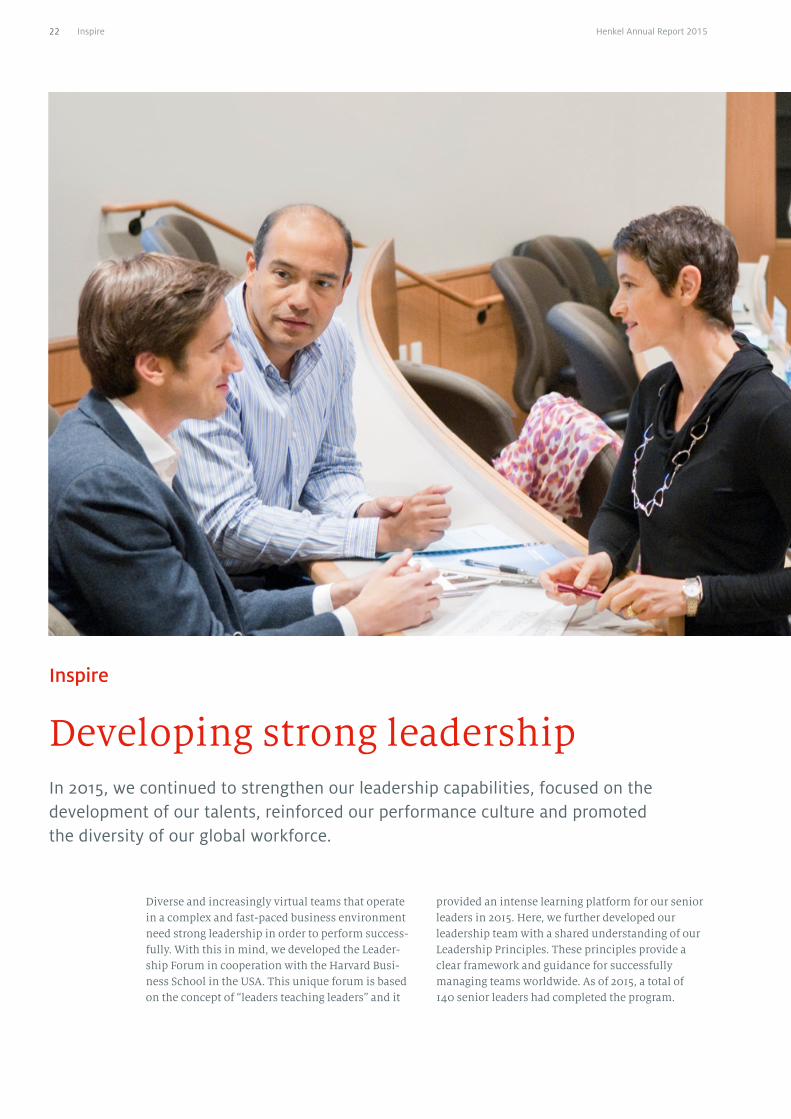
Developing strong leadershipIn 2015, we continued to strengthen our leadership capabilities, focused on the development of our talents, reinforced our performance culture and promoted the diversity of our global workforce.
Diverse and increasingly virtual teams that operate in a complex and fast-paced business environment need strong leadership in order to perform success-fully. With this in mind, we developed the Leader-ship Forum in cooperation with the Harvard Busi-ness School in the USA. This unique forum is based on the concept of “leaders teaching leaders” and it
provided an intense learning platform for our senior leaders in 2015. Here, we further developed our leadership team with a shared understanding of our Leadership Principles. These principles provide a clear framework and guidance for successfully managing teams worldwide. As of 2015, a total of 140 senior leaders had completed the program.
Henkel Annual Report 201522 Inspire

Focus on leadership
Strengthening our pipeline of strong leaders, partic-ularly in emerging markets, is essential to reaching our ambitious growth targets. Our EXCEED program offers talents with strong development potential opportunities for interaction with top management and peers and gives them the opportunity to build diverse networks as future leaders. Since its success-ful launch in the previous year, around 200 employees have participated in the program.
Managing talent development and performance culture
Henkel is regularly recognized as an attractive employer around the world. In 2015, for example, we were included in Argentina’s “Best Employers” rank-ing for the third consecutive year. Opportunities for
individual development of our employees play a key role in attracting the best talents.
Our Henkel Global Academy combines all training offerings, providing employees with a concise out-line of learning opportunities. This gives them a transparent overview of which training offerings best fit their individual development needs and also establishes a stronger link between talent manage-ment and learning.
Our annual Development Round Table has also been an integral part of talent development and perfor-mance management at Henkel since 2008. This globally standardized procedure enables us to evaluate the performance and development potential of our managers worldwide in one integrated process. As a result, we can identify managers with strong development potential and actively manage their careers within Henkel. In 2015, we promoted around 1,300 employees.
Diversity as a competitive advantage
Our company culture and diverse workforce provide us with a competitive edge in a highly dynamic business environment. In 2015, our global internal diversity and inclusion campaign created awareness of how we support employees in all dimensions of diversity. We also systematically support female career development. The share of female managers was around 33 percent of our global leadership team by the end of 2015.
Focus on strong leadership: Around 1,700 Henkel employees par-ticipated in classroom and webinar leadership training throughout the year. As of 2015, a total of 140 senior leaders had completed the Leadership Forum – a program specifically developed with the Harvard Business School in Boston, Massachusetts, USA. From the left: Henkel Vice Presidents Nicolas Krauss, Alfredo Morales and Marie-Laure Marduel engage in a discussion during a lecture break.
23Henkel Annual Report 2015 Inspire

Sustainability
On track toward our long-term goalFor Henkel, sustainability means contributing to the quality of life of a growing population while using less resources and causing less emissions. This is the idea at the heart of our long-term goal: By 2030, we want to triple the value we create in relation to our environmental footprint. In 2015, we exceeded our first milestone targets toward this highly ambitious goal.
By the year 2050, the world’s population is expected to grow to 9 billion. The accompanying acceleration in global economic activity will lead to rising consumption and resource depletion. The effect of increasing pressure on available resources is becom-ing more noticeable around the world. If we are to
meet the needs of a growing population, we must become more efficient in the way we use our planet’s limited resources to create value – for our customers and consumers, for the communities we operate in, and for our company.
Henkel Annual Report 201524 Sustainability

We are committed to leadership in sustainability – this is one of our company values. As sustainability leaders, we pioneer new solutions while continuing to shape our business responsibly and increase our economic success. We are convinced that sustain-ability will be more important than ever before, supporting our growth, improving our cost efficiency and reducing risks.
All interim sustainability targets achieved
Our long-term goal for 2030 to triple our efficiency, which we call Factor 3, requires an average improve-ment of 5 to 6 percent each year. For the five-year period up to 2015, we had set interim targets for each focal area that would result in a 30 percent overall improvement in efficiency.
With a 38 percent overall efficiency improvement, we have clearly achieved the first set of interim targets for the period from 2011 to 2015 – and we are well on track toward meeting our long-term goal.
By the end of 2015, we had reached all five of our 2015 targets: We improved net sales per ton of product by 11 percent (target: 10 percent) and we lowered our worldwide accident rate by 33 percent (target: 20 per-cent). We reduced our energy consumption by 18 per-cent, water usage by 23 percent and waste by 17 per-cent – exceeding our reduction targets of 15 percent in each of these three focal areas.
To stay on track for our long-term goal for 2030, we will need to increase our efficiency by 75 percent by 2020, which is our next milestone. We have defined corresponding targets in our focal areas: • 22 percent improvement in net sales per ton of
product• 30 percent reduction in our carbon dioxide emis-
sions from energy consumption, water usage and waste per ton of product
• 40 percent reduction in our worldwide accident rate
compared to the base year 2010.
We have also committed to drive progress along the entire value chain. Accordingly, we are continuously expanding and refining our measurement systems. This has enabled us to assess our entire footprint, including our raw materials as well as the consumption and use of our products. Based on this comprehensive assessment, we have identified additional improve-ment opportunities and ambitions to create more value and reduce our footprint along the value chain.
Our production site in Viersen-Dülken, Germany, achieved a reduction in electricity consumption of 10 percent in 2015. Regu-lar check-ups of the plant and equipment ensure the efficient use of resources and optimize energy consumption. Here, Reinhard Borowczak and Dr. Dagmar Preis-Amberger use a special detector to identify leakages in compressed air tubes. The generation of compressed air is energy-intensive and even the smallest of leaks in tubes can result in a significant amount of wasted energy and higher costs. With the leakage detector, employees can test for leaks, even in noisy production areas.
25Henkel Annual Report 2015 Sustainability

Sustainability
“Say yes! to the future”: This special training course enables sales employees to integrate sustainability topics more effectively in retail customer dialogs. Our long-term commitment to sustainable business activities reaches across all business units and functions with the initiative. From the left: Steffi Götzel, Uta Steffen-Holder-baum and Eva Braem prepare for a customer meeting.
Focus on products is integral to our goal
If we are to decouple increased quality of life from resource use, product innovations will play an essen-tial role. Our products need to offer customers and consumers more value and better performance while generating a smaller environmental footprint. For us, this is not a question of developing individual “green” products with a focus on selected environ-mental facets. Our aim is to continuously improve all products across our entire portfolio, taking every aspect into account.
This includes the smarter and more efficient aerosol cans we introduced for our Fa, Souplesse and Neu-tromed deodorant ranges. The cans are both lighter and contain 25 percent recycled aluminum, signifi-cantly reducing their carbon footprint. Our Persil ProClean laundry detergents contain high-perform-ing enzymes that enable powerful stain removal and full washing performance even at low tempera-tures, helping consumers in the USA save energy. And our innovative Loctite GC 10 solder paste for the assembly of electronic components helps our customers save energy and costs. Unlike traditional solder pastes, it does not need to be refrigerated dur-ing transport and storage.
Preferred partner in sustainability
The importance of sustainability in our relationships with customers and consumers continues to grow. Our customers expect their suppliers and business partners to ensure compliance with global environ-mental, safety, and social standards and to drive sustainability along the entire value chain. Our stan-dards and management systems, our long tradition
in sustainability reporting, our experience in align-ing our activities to sustainable development, and our recognition by external rating agencies help us to position ourselves as a preferred partner. Cooperat-ing closely with our customers in trade and industry, we are able to leverage our experience to optimize logistics, increase the efficiency of production pro-cesses, develop more sustainable products and foster sustainable, resource-conserving consumption.
Our people make the difference
Our employees play a key role in implementing our strategy and leveraging sustainability to strengthen our business. That is why we strive to give our
Henkel Annual Report 201526 Sustainability

employees a clear understanding of sustainability and enable them to convey its importance to others. Sustainability plays a key role in our internal com-munications and forms an integral part of our train-ing and education programs.
We further promote the involvement of our employ-ees through our Sustainability Ambassadors pro-gram. The program was launched in 2012 to engage employees more deeply on the topic of sustain-ability. Since then, Henkel has trained around 6,200 Sustainability Ambassadors – including all Management Board members – in 74 countries. Ambassadors are encouraged to visit elementary schools in order to explain the concept of sustain-
ability by means of simple, everyday examples. Since the start of the program, the Sustainability Ambassa-dors have helped to educate around 63,000 school-children in 43 countries.
We also engaged our employees around the world through our campaign “(Y)our move toward sustain-ability.” Here we informed and encouraged them to contribute to a sustainable society in their everyday lives. In 2015, we expanded the program and devel-oped an additional module focusing on our retail partners: “Say yes! to the future” combines training for our sales teams, information on Henkel and its product portfolio as well as a systematic approach to partnering with our customers.
27Henkel Annual Report 2015 Sustainability
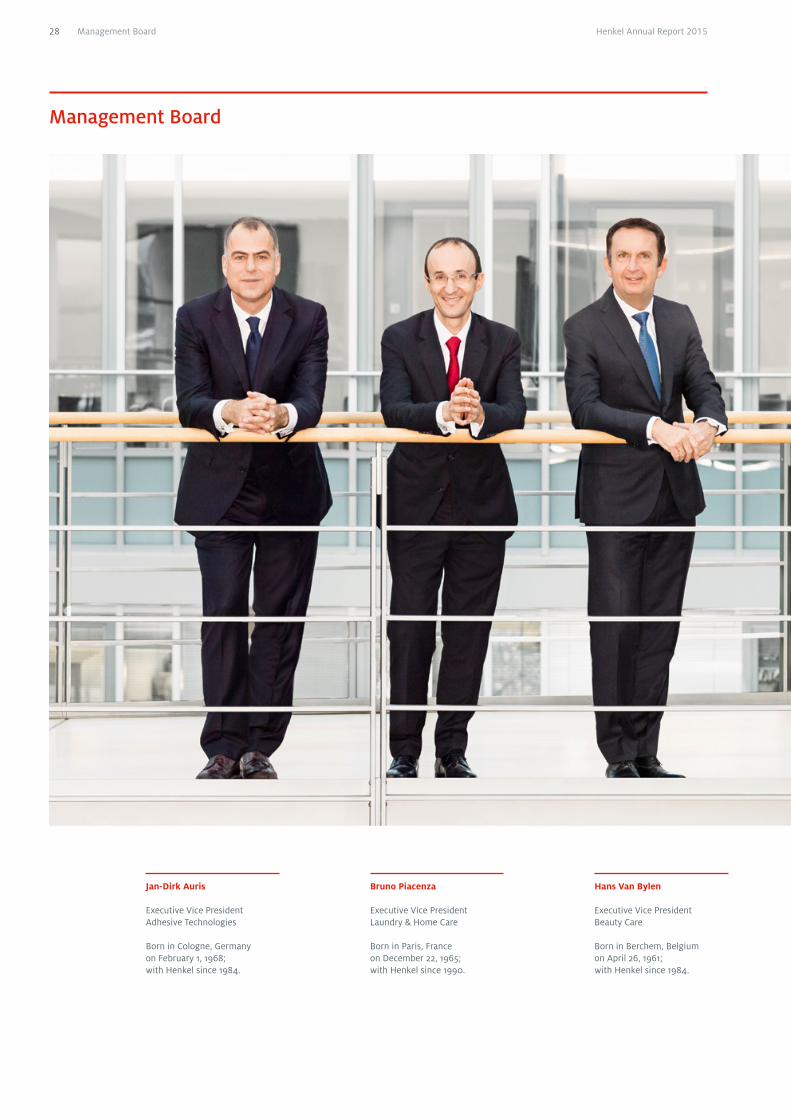
Management Board
Bruno Piacenza
Executive Vice President Laundry & Home Care
Born in Paris, France on December 22, 1965; with Henkel since 1990.
Jan-Dirk Auris
Executive Vice President Adhesive Technologies
Born in Cologne, Germany on February 1, 1968; with Henkel since 1984.
Hans Van Bylen
Executive Vice President Beauty Care
Born in Berchem, Belgium on April 26, 1961; with Henkel since 1984.
Henkel Annual Report 201528 Management Board

Kasper Rorsted
Chairman of the Management Board
Born in Aarhus, Denmark on February 24, 1962; with Henkel since 2005.
Kathrin Menges
Executive Vice President Human Resources / Infra structure Services
Born in Pritzwalk, Germany on October 16, 1964; with Henkel since 1999.
Carsten Knobel
Executive Vice President Finance (CFO) / Purchasing / Integrated Business Solutions
Born in Marburg / Lahn, Germany on January 11, 1969; with Henkel since 1995.
29Henkel Annual Report 2015 Management Board

Combined management report 31 Corporate governance 31 Corporate governance report/
Statement on corporate governance
40 Statutory and regulatory situation
41 Remuneration report
52 Shares and bonds 54 Henkel represented in all major indices
55 International shareholder structure
55 Employee share program
55 Henkel bonds
56 Pro-active capital market communication
57 Fundamental principles of the Group 57 Operational activities
57 Overview
57 Organization and business units
58 Strategy and financial targets 2016
58 Financial targets 2016
59 Strategic priorities in summary
61 Sustainability strategy 2030
64 Management system and performance indicators
64 Cost of capital
65 Economic report 65 Macroeconomic and industry-related conditions
66 Review of overall business performance
67 Results of operations
67 Sales and profits
69 Comparison between actual business performance and guidance
70 Expense items
70 Other operating income and charges
70 Financial result
71 Net income and earnings per share (EPS)
71 Dividends
71 Return on capital employed (ROCE)
71 Economic Value Added (EVA®)
71 Net assets and financial position
71 Acquisitions and divestments
72 Capital expenditures
73 Net assets
74 Financial position
74 Financing und capital management
75 Key financial ratios
76 Employees
79 Procurement
81 Production
83 Research and development
88 Marketing and distribution
90 Business units
90 Laundry & Home Care
94 Beauty Care
98 Adhesive Technologies
102 Henkel AG & Co. KGaA (condensed version according to the German Commercial Code [HGB])
106 Subsequent events
106 Risks and opportunities report 106 Risks and opportunities
106 Risk management system
108 Major risk categories
112 Major opportunity categories
113 Risks and opportunities in summary
114 Forecast 114 Macroeconomic development
114 Sector development
115 Outlook for the Henkel Group 2016
Combined management report Henkel Annual Report 201530

Corporate governance at Henkel AG & Co. KGaAThe Management Board, the Shareholders’ Commit-tee and the Supervisory Board are committed to ensuring that the management and stewardship of the corporation are conducted in a responsible and transparent manner aligned to achieving a long-term increase in shareholder value. With this in mind, they have pledged themselves to the following three principles: • Value creation as the foundation of our manage-
ment approach• Sustainability achieved through the application
of socially responsible management principles• Transparency supported by an active and open
information policy
Corporate governance report / Statement on corporate governance
The German Corporate Governance Code [DCGK] was introduced in order to promote confidence in the management and oversight of listed German corpo-rations. It sets out the nationally and internationally recognized regulations and standards of responsible corporate governance applicable in Germany. The DCGK is aligned to the statutory provisions applica-ble to a German joint stock corporation (“Aktien-gesellschaft” [AG]). It is applied analogously by Henkel AG & Co. KGaA (the corporation). For a better under-standing of Henkel’s situation, this report describes the principles underlying the management and con-trol structure of the corporation. It also outlines the special features distinguishing us from an AG which derive from our specific legal form and our Articles of Association. The primary rights of shareholders of Henkel AG & Co. KGaA are likewise explained. The report takes into account the recommendations of the DCGK and contains all disclosures and explana-tions required according to Sections 289 (4), 289a and 315 (4) of the German Commercial Code [HGB].
Legal form / Special statutory features of Henkel AG & Co. KGaA Henkel is a “Kommanditgesellschaft auf Aktien” [KGaA]. A KGaA is a company with a legal identity (legal entity) in which at least one partner has unlim-ited liability with respect to the company’s creditors (personally liable partner). The other partners’ liability is limited to their shares in the capital stock and they are thus not liable for the company’s debts (limited partners per Section 278 (1) German Stock Corporation Act [AktG]).
In terms of its legal structure, a KGaA is a mixture of a joint stock corporation [AG] and a limited partner-ship [KG], with a leaning toward stock corporation law. The differences with respect to an AG are primarily as follows: The duties of the executive board of an AG are performed at Henkel AG & Co. KGaA by Henkel Management AG – acting through its Management Board – as the sole Personally Liable Partner (Sec-tions 278 (2) and 283 AktG in conjunction with Art. 11 of our Articles of Association).
The rights and duties of the supervisory board of a KGaA are more limited compared to those of the supervisory board of an AG. Specifically, the supervi-sory board is not authorized to appoint personally liable partners, preside over the partners’ contractual arrangements, impose procedural rules on the man-agement board, or rule on business transactions. A KGaA is not required to appoint a director of labor affairs, even if, like Henkel, the company is bound to abide by Germany’s Codetermination Act of 1976.
The general meeting of a KGaA essentially has the same rights as the shareholders’ meeting of an AG. For example, it votes on the appropriation of earn-ings, formally approves the actions of the manage-ment board, elects members of the supervisory board (shareholder representatives), and formally approves the supervisory board’s actions. It appoints the audi-tor and also votes on amendments to the articles of association and measures that change the company’s capital, which are implemented by the management board. Additionally, as stipulated by the legal form, it also votes on the adoption of the annual financial statements of the company, formally approves the actions of the personally liable partner(s), and elects and approves the actions of the members of the share-holders’ committee as established under the articles of association. Resolutions passed in general meeting require the approval of the personally liable partner(s) where they involve matters which, in the case of a partnership, require the authorization of the person-ally liable partners and also that of the limited part-ners (Section 285 (2) AktG) or relate to the adoption of annual financial statements (Section 286 (1) AktG).
According to our Articles of Association, in addition to the Supervisory Board, Henkel also has a standing Shareholders’ Committee comprising a minimum of five and a maximum of 10 members, all of whom are elected by the Annual General Meeting (Art. 27 of the Articles of Association). The Shareholders’ Committee is required in particular to perform the following functions (Section 278 (2) AktG in conjunction with Sections 114 and 161 HGB, and Articles 8, 9 and 26 of the Articles of Association):
31Combined management reportHenkel Annual Report 2015
31 Corporate governance52 Shares and bonds57 Fundamental principles
of the Group65 Economic report
102 Henkel AG & Co. KGaA (condensed version according to the German Commercial Code [HGB])
106 Subsequent events
106 Risks and opportunities report114 Forecast
Com
bine
d m
anag
emen
t re
port

• It acts in place of the Annual General Meeting in guiding the business activities of the corporation.
• It decides on the appointment and dismissal of the Personally Liable Partner(s).
• It holds both the power of representation and executive powers over the legal relationships prevailing between the corporation and Henkel Management AG, the Personally Liable Partner.
• It exercises the voting rights of the corporation in the Annual General Meeting of Henkel Manage-ment AG, thereby choosing its three-member Supervisory Board which, in turn, appoints and dismisses the members of the Management Board.
• It issues rules of procedure incumbent upon Henkel Management AG.
Capital stock denominations / Shareholder rights /Amendments to the Articles of Association The capital stock of the corporation amounts to 437,958,750 euros. It is divided into a total of 437,958,750 bearer shares of no par value, of which 259,795,875 are ordinary bearer shares (nominal pro-portion of capital stock: 1 euro per ordinary share or a total of 259,795,875 euros, representing 59.3 per-cent) and 178,162,875 are preferred bearer shares (nominal proportion of capital stock: 1 euro per pre-ferred share or a total of 178,162,875 euros, represent-ing 40.7 percent). All shares are fully paid in. Multi-ple share certificates for shares may be issued. In accordance with Art. 6 (4) of the Articles of Associa-tion, there is no right to individual share certificates.
Each ordinary share grants to its holder one vote (Art. 21 (1) of the Articles of Association). The preferred shares grant to their holders all shareholder rights apart from the right to vote (Section 140 (1) AktG). The preferred shares carry the following preferential right in the distribution of profit (Section 139 (1) AktG in conjunction with Art. 35 (2) of the Articles of Asso-ciation) unless otherwise resolved by the Annual General Meeting: • The holders of preferred shares receive a preferred
dividend in the amount of 0.04 euros per preferred share. If the profit to be distributed in a fiscal year is insufficient for payment of a preferred dividend of 0.04 euros per preferred share, the arrears are paid without interest from the profit of the follow-ing years, with older arrears to be paid in full before more recent arrears and the preferred divi-dend from the profit of a particular fiscal year paid only after the clearance of all arrears. The holders of ordinary shares then receive a preliminary divi-dend from the remaining unappropriated profit of 0.02 euros per ordinary share, with the residual amount being distributed to the holders of ordi-
nary and preferred shares in accordance with the proportion of the capital stock attributable to them.
• If the preferred dividend is not paid out either in part or in whole in a year, and the arrears are not paid off in the following year together with the full preferred share dividend for that second year, the holders of preferred shares are accorded voting rights until such arrears are paid (Section 140 (2) AktG). Cancellation or limitation of this preferred dividend requires the consent of the holders of preferred shares (Section 141 (1) AktG).
There are no shares carrying multiple voting rights, preference voting rights, maximum voting rights or special controlling rights.
The shareholders exercise their rights in the Annual General Meeting as per the relevant statutory provi-sions and the Articles of Association of Henkel AG & Co. KGaA. In particular, they may exercise their right to vote (ordinary shares only) – either personally, by postal vote, through a legal representative or through a proxyholder nominated by the corporation (Section 134 (3) and (4) AktG in conjunction with Art. 21 (2 and 3) of the Articles of Association) – and are also enti-tled to submit motions on the resolution proposals of management, speak on agenda items, and raise pertinent questions and motions (Section 126 (1), Section 131 AktG in conjunction with Art. 23 (2) of the Articles of Association). The ordinary Annual General Meeting usually takes place within the first four months of the fiscal year.
Shareholders whose shares jointly represent at least one twentieth of the capital stock – corresponding to 21,897,938 ordinary or preferred shares or a com-bination of both – may request that a general meet-ing of shareholders be called. If their proportionate amount of the capital stock jointly amounts to 500,000 euros – corresponding to 500,000 ordinary or preferred shares or a combination of both – they may request that items be placed on the agenda and published (Section 122 (1 and 2) AktG). In addition, shareholders whose combined share of the capital stock amounts to 100,000 euros or more may, subject to certain conditions, request that a special auditor be appointed by the court to examine certain matters (Section 142 (2) AktG).
Through the use of electronic communications, par-ticularly the internet, the corporation makes it easy for shareholders to participate in the Annual General Meeting. It also enables them to be represented by proxyholders for exercising their voting rights. The reports, documents and information required by law
Henkel Annual Report 201532 Combined management report

for the Annual General Meeting, including the finan-cial statements and annual reports, are made available on the internet, as are the agenda for the Annual General Meeting and any countermotions or nomi-nations for election by shareholders that require publication.
Unless otherwise mandated by statute or the Articles of Association, the resolutions of the Annual General Meeting are adopted by simple majority of the votes cast. If a majority of capital is required by statute, resolutions are adopted by simple majority of the voting capital represented (Art. 24 of the Articles of Associa-tion). This also applies to changes in the Articles of Association. However, modifications to the object of the corporation require a three-quarters’ majority (Section 179 (2) AktG). The Supervisory Board and Shareholders’ Committee have the authority to resolve purely formal modifications of and amendments to the Articles of Association (Art. 34 of the Articles of Association). By resolution of the Annual General Meeting, the Supervisory Board is also authorized to amend Articles 5 and 6 of the Articles of Association with respect to each use of the Authorized Capital and upon expiration of the term of the authorization.
Authorized Capital / Share buy-back / Treasury sharesAccording to Art. 6 (5) of the Articles of Association, there is an Authorized Capital limit. Acting within this limit, the Personally Liable Partner is authorized, with the approval of the Shareholders’ Committee and of the Supervisory Board, to increase the capital stock of the corporation until April 12, 2020, by up to a nominal total of 43,795,875 euros through the issue of up to 43,795,875 new preferred shares with no voting rights against cash and/or payment in kind. The authorization can be used in full or also in one or several acts. The proportion of capital stock repre-sented by shares issued against payment in kind on the basis of this authorization must not exceed a total of 10 percent of the capital stock existing at the time the authorization takes effect.
The Personally Liable Partner is authorized, with the approval of the Shareholders’ Committee and of the Supervisory Board, to set aside the pre-emptive rights of shareholders in the case of a capital increase against payment in kind, particularly for the purpose of business combinations or the (direct or indirect) acquisition of entities, operations, parts of businesses, equity interests or other assets, including claims against the corporation or compa-nies dependent upon it within the meaning of Section 17 AktG.
If capital is increased against payment in cash, all shareholders are essentially assigned pre-emptive rights. However, these may be set aside in three cases, subject to the approval of the Shareholders’ Committee and of the Supervisory Board: (1) in order to dispose of fractional amounts; (2) to grant to credi-tors/holders of bonds with warrants or conversion rights or a conversion obligation issued by the cor-poration or one of the companies dependent upon it, pre-emptive rights corresponding to those that would accrue to such creditors/bondholders follow-ing exercise of their warrant or conversion rights or on fulfillment of their conversion obligations; or (3) if the issue price of the new shares is not significantly below the quoted market price at the time of issue price fixing.
In addition, the Personally Liable Partner is autho-rized to purchase ordinary and/or preferred shares of the corporation at any time until April 12, 2020, up to a maximum nominal proportion of the capital stock of 10 percent. This authorization can be exercised for any legal purpose. To the exclusion of the pre-emptive rights of existing shareholders, treasury shares may, in particular, be transferred to third parties for the purpose of acquiring entities or par-ticipating interests of entities. Treasury shares may also be sold to third parties against payment in cash, provided that the selling price is not significantly below the quoted market price at the time of share disposal. Treasury shares may likewise be used to satisfy warrants or conversion rights granted by the corpo ration. The Personally Liable Partner has also been authorized, with the approval of the Sharehold-ers’ Committee and of the Supervisory Board, to can-cel treasury shares without the need for further reso-lution by the Annual General Meeting.
Insofar as shares are issued or used to the exclusion of pre-emptive rights, the proportion of capital stock represented by such shares shall not exceed 10 percent.
Concerning the number of treasury shares and their use, please refer to the disclosures provided in the notes to the consolidated financial statements under Note 10 on pages 141 and 142.
Restrictions with respect to voting rights or the transfer of sharesA share-pooling agreement has been concluded between members of the families of the descendants of company founder Fritz Henkel which contains restrictions with respect to transfers of the ordinary shares covered (Art. 7 of the Articles of Association).
33Combined management reportHenkel Annual Report 2015
31 Corporate governance52 Shares and bonds57 Fundamental principles
of the Group65 Economic report
102 Henkel AG & Co. KGaA (condensed version according to the German Commercial Code [HGB])
106 Subsequent events
106 Risks and opportunities report114 Forecast

Henkel preferred shares acquired by employees through the Employee Share Program, including bonus shares acquired without additional payment, are subject to a company-imposed lock-up period of three years, which begins on the first day of the respective participation period. Essentially, the shares should not be sold before the end of this period. If employee shares are sold during the lock-up period, the bonus shares are forfeited.
Contractual agreements also exist with members of the Management Board governing lock-up periods for Henkel preferred shares which they are required to purchase as part of their variable annual cash remuneration (for additional information, please see the remuneration report on pages 41 to 51).
Major shareholdersAccording to notifications received by the corpora-tion on December 17, 2015, a total of 61.02 percent of the voting rights are held by members of the Henkel family share-pooling agreement. (For additional information, please see the disclosures provided in the notes to the consolidated financial statements under Note 40 on page 178.) No other direct or indi-rect investment in capital stock exceeding 10 percent of the voting rights has been reported to us or is known to us.
Management BoardThe Supervisory Board of Henkel Management AG is responsible for the appointment and dismissal of members of the Management Board of Henkel Management AG (Management Board). The appoint-ments are for a maximum tenure of five years. A reappointment or extension of the tenure is permitted for a maximum period of five years in each case (Section 84 AktG).
The Management Board is composed of at least two members in accordance with Art. 7 (1) of the Articles of Association of Henkel Management AG. The Supervisory Board of Henkel Management AG is also responsible for determining the number of members on the Management Board. The Supervisory Board of Henkel Management AG can appoint a member of the Management Board as Chairperson.
As the executive body of the Group, the Management Board is bound to uphold the interests of the busi-ness and is responsible for ensuring a sustainable increase in shareholder value. The members of the Management Board are responsible for managing Henkel’s business operations in their entirety. The individual Management Board members are
assigned, in accordance with a business distribution plan, areas of competence for which they bear lead responsibility. The members of the Management Board cooperate closely as colleagues, informing one another of all major occurrences within their areas of competence and conferring on all actions that may affect several such areas. Further details relating to cooperation and the division of operational respon-sibilities within the Management Board are regulated by the rules of procedure issued by the Supervisory Board of Henkel Management AG. The Management Board reaches its decisions by a simple majority of the votes cast. In the event of a tie, the Chairperson has the casting vote.
It is the duty of the Management Board to prepare the annual financial statements of Henkel AG & Co. KGaA, the consolidated financial statements for each quarter, half year and year and also the correspond-ing management reports. The Management Board is responsible for management of the overall business including planning, coordination, allocation of resources, financial control, and risk management. It must also ensure compliance with legal provisions, regulatory requirements and internal company guidelines, and take steps to ensure that Group companies also observe them.
Supervisory Board and Shareholders’ Committee; other committeesIt is the responsibility of the Supervisory Board to advise and supervise the Management Board in the performance of its business management duties. The Supervisory Board regularly discusses business per-formance and planning with the Management Board. It reviews the annual financial statements of Henkel AG & Co. KGaA and the Group’s consolidated financial statements as well as the associated management reports, taking into account the reviews and audit reports submitted by the auditor. It also votes on the proposal of the Management Board regarding the appropriation of profit and submits to the Annual General Meeting a proposal indicating its recommen-dation for the appointment of the external auditor.
As a general rule, the Supervisory Board meets four times per year. It passes resolutions by a simple majority of the votes cast. In the event of a tie, the Chairperson has the casting vote. The Supervisory Board has established an Audit Committee and a Nominations Committee.
The Audit Committee is made up of three share-holder and three employee representative members of the Supervisory Board. Each member is elected by
of voting rights are held by members of the Henkel family share-pool-ing agreement.
61.02 %
Henkel Annual Report 201534 Combined management report

the Supervisory Board based on nominations of their fellow shareholder or fellow employee representa-tives on the Board. The Chairperson of the Audit Committee is elected based on a proposal of the shareholder representative members. It is a statutory requirement that the Audit Committee includes at least one independent member of the Supervisory Board with expertise in the fields of accounting or auditing. The Chairperson of the Audit Committee in 2015, Prof. Dr. Theo Siegert, who is not the Chairperson of the Supervisory Board nor a present or former member of the Management Board, satisfies these requirements.
The Audit Committee, which generally meets four times a year, prepares the proceedings and resolu-tions of the Supervisory Board relating to the adop-tion of the annual financial statements and the con-solidated financial statements, and also the auditor appointment proposal to be made to the Annual General Meeting. It issues audit mandates to the audi-tor and defines the focal areas of the audit as well as deciding on the fee for the audit and other advisory services provided by the auditor. It monitors the independence and qualifications of the auditor, requiring the latter to submit a declaration of inde-pendence which it then evaluates. Furthermore, the Audit Committee monitors the accounting process and assesses the effectiveness of the Internal Control System, the Risk Management System and the Inter-nal Auditing and Review System. It is likewise involved in compliance issues. The Group’s Internal Audit function reports regularly to the Audit Com-mittee. It discusses with the Management Board – with the external auditor in attendance – the quarterly reports and the financial report for the half year, prior to their publication.
The Nominations Committee comprises the Chair-person of the Supervisory Board and two further shareholder representatives elected by the Supervi-sory Board based on nominations of the sharehold-ers’ representatives. The Chairperson of the Super-visory Board is also Chairperson of the Nominations Committee. The Nominations Committee prepares the resolutions of the Supervisory Board on election proposals to be presented to the Annual General Meeting for the election of members to the Supervi-sory Board (shareholder representatives).
The Shareholders’ Committee generally meets six times per year and holds a joint conference with the Management Board lasting several days. The Share-holders’ Committee reaches its decisions by a simple majority of the votes cast. It has established Finance
and Human Resources Subcommittees that likewise meet six times per year, as a rule. Each subcommittee comprises five of the members of the Shareholders’ Committee.
The Finance Subcommittee deals primarily with financial matters, questions of financial strategy, financial position and structure, taxation and accounting policy, as well as risk management within the corporation. It also performs the neces-sary preparatory work for decisions to be made by the Shareholders’ Committee in matters for which decision authority has not been delegated to it.
The Human Resources Subcommittee deals primar-ily with personnel matters relating to members of the Management Board, with issues pertaining to human resources strategy, and with remuneration. It performs the necessary preparatory work for deci-sions to be made by the Shareholders’ Committee in matters for which decision authority has not been delegated to it. The Subcommittee also addresses issues concerned with succession planning and management potential within the individual business units, taking into account relevant diversity aspects.
At regular intervals, the Supervisory Board and the Shareholders’ Committee hold an internal review to determine the efficiency with which they and their committees/subcommittees carry out their duties. This self-assessment is performed on the basis of an extensive checklist, whereupon points relating to corporate governance and improvement opportuni-ties are also discussed.
Conflicts of interest must be disclosed in an appro-priate manner to the Supervisory Board or Share-holders’ Committee, particularly those that may arise as the result of a consultancy or committee function performed in the service of customers, suppliers, lenders or other business partners. Members encoun-tering material conflicts of interest that are not of a merely temporary nature are required to resign their mandate.
Some members of the Supervisory Board and of the Shareholders’ Committee are or were in past years holders of senior managerial positions in other com-panies. If and when Henkel pursues business activi-ties with these companies, the same arm’s length principles apply as those applicable to transactions with and between unrelated third parties. In our view, such transactions do not affect the impartiality of the members in question.
35Combined management reportHenkel Annual Report 2015
31 Corporate governance52 Shares and bonds57 Fundamental principles
of the Group65 Economic report
102 Henkel AG & Co. KGaA (condensed version according to the German Commercial Code [HGB])
106 Subsequent events
106 Risks and opportunities report114 Forecast

Interaction between Management Board, Supervisory Board and Shareholders’ CommitteeThe Management Board, Supervisory Board and Shareholders’ Committee work in close cooperation for the benefit of the corporation.
The Management Board agrees the strategic direction of the corporation with the Shareholders’ Committee and discusses with it the status of strategy imple-mentation at regular intervals.
In keeping with good corporate governance, the Management Board informs the Supervisory Board and the Shareholders’ Committee regularly, and in a timely and comprehensive fashion, of all relevant issues concerning business policy, corporate plan-ning, profitability, the business development of the corporation and our major affiliated companies, and also matters relating to risk exposure and risk management.
For transactions of fundamental significance, the Shareholders’ Committee has established a right of veto in the procedural rules governing the actions of Henkel Management AG in its function as sole Personally Liable Partner (Art. 26 of the Articles of Association). This covers, in particular, decisions or measures that materially change the net assets, financial position or results of operations of the corporation. The Management Board complies with these rights of consent of the Shareholders’ Commit-tee and also duly submits to the decision authority of the corporation’s Annual General Meeting.
Principles of corporate governance / ComplianceThe members of the Management Board conduct the corporation’s business with the care of a prudent and conscientious business director in accordance with legal requirements, the Articles of Association of Henkel Management AG and the Articles of Associa-tion of Henkel AG & Co. KGaA, the rules of procedure governing the actions of the Management Board, the provisions contained in the individual contracts of employment of its members, and also the compliance guidelines and resolutions adopted by and within the Management Board.
Corporate management principles which go beyond the statutory requirements are derived from our vision and our values. For our corporation to be successful, it is essential that we share a common approach to entrepreneurship. The corporation’s vision provides our management and employees worldwide with both direction and a primary objec-tive. It reaffirms our ambition to meet the highest ethical standards in everything we do.
Our vision: • A global leader in brands and technologies.
Our vision provides the foundation for building a company with a common ethic.
Our values:• We put our customers at the center of what we do.• We value, challenge and reward our people. • We drive excellent sustainable financial
performance.• We are committed to leadership in sustainability.• We build our future on our family business
foundation.
These values guide our employees in all the day-to-day decisions they make, providing a compass for their conduct and actions.
Henkel is committed to ensuring that all business transactions are conducted in an ethically irre-proachable, legal fashion. Consequently, Henkel expects all our employees not only to respect the corporation’s internal rules and all relevant laws, but also to avoid conflicts of interest, to protect Henkel’s assets and to respect the social values of the coun-tries and cultural environments in which the corpo-ration does business. The Management Board has therefore issued a series of Group-wide codes and standards with precepts that are binding worldwide. These regulatory instruments are periodically reviewed and amended as appropriate, evolving in step with the changing legal and commercial condi-tions that affect Henkel as a globally active corpora-tion. The Code of Conduct supports our employees in ethical and legal issues. The Leadership Principles, for example, define the scope of responsibilities for managers. The Code of Corporate Sustainability describes the principles that drive our sustainable, socially responsible approach to business. This code also enables Henkel to meet the commitments derived from the United Nations Global Compact.
Ensuring compliance in the sense of adherence to laws and regulations is an integral component of our business processes. Henkel has established a Group-wide compliance organization with locally and regionally responsible compliance officers led by a globally responsible General Counsel & Chief Compliance Officer (CCO). The General Counsel & CCO, supported by the Corporate Compliance Office and the interdisciplinary Compliance & Risk Com-mittee, manages and controls compliance-related activities undertaken at the corporate level, coordi-nates training courses, oversees fulfillment of both
Henkel Annual Report 201536 Combined management report
internal and external regulations, and takes appro-priate action in the event of compliance violations.
The local and regional compliance officers are responsible for organizing and overseeing the train-ing activities and implementation measures tailored to the specific requirements of their locations. They report to the Corporate Compliance Office. The Gen-eral Counsel & CCO reports regularly to the Manage-ment Board and to the Audit Committee of the Super-visory Board on identified compliance violations.
The issue of compliance is also a permanent item in the target agreements signed by all managerial staff of Henkel. Due to their position, it is particularly incumbent on them to set the right example for their subordinates, to effectively communicate the com-pliance rules and to ensure that these are obeyed through the implementation of suitable organiza-tional measures.
The procedures to be followed in the event of com-plaints or suspicion of malpractice also constitute an important element of the compliance policy. In addi-tion to our internal reporting system and complaint registration channels, employees may also, for the purpose of reporting serious violations to the Cor porate Compliance Office, anonymously use a compliance hotline operated by an external service provider. The Head of the Corporate Compliance Office is mandated to initiate the necessary follow-up procedures.
Our corporate compliance activities are focused on antitrust law and the fight against corruption. In our Code of Conduct, the corporate guidelines based upon it, and other publications, the Management Board clearly expresses its rejection of all violations of the principles of compliance, particularly antitrust violations and corruption. We do not tolerate such violations in any way. For Henkel, bribery, anticom-petitive agreements, or any other violations of laws are no way to conduct business.
A further compliance-relevant area relates to capital market law. Supplementing the legal provisions, internal codes of conduct have been put in place to regulate the treatment of information that has the potential to affect share prices. The corporation has an Ad Hoc Committee comprised of representatives from various departments. In order to ensure that all insider information is handled as required by law, this Committee reviews developments and events for their possible effect on share prices, determining the
need to issue reports to the capital markets on an ad hoc basis. There are also rules that go beyond the legal requirements, governing the behavior of the members of the Management Board, the Supervisory Board and the Shareholders’ Committee, and also employees of the corporation who, due to their function or involvement in projects, have access to insider information. An insider register is duly kept of the people involved.
Transparency / CommunicationAn active and open communication policy ensuring prompt and continuous information dissemination is a major component of the value-based manage-ment approach at Henkel. Hence shareholders, shareholder associations, participants in the capital market, financial analysts, the media and the public at large are kept informed of the current situation and major business changes relating to the Henkel Group. All stakeholders are treated equally in this respect. All such information is also promptly made available on the internet.
Up-to-date information is likewise incorporated in the regular financial reporting undertaken by the corporation. The dates of the major recurring publi-cations, and also the dates for the press conference on the preceding fiscal year and the Annual General Meeting, are announced in our financial calendar, which is also available on the internet.
The corporation’s advancements and targets in rela-tion to the environment, safety, health and social responsibility are published annually in our Sustain-ability Report. Shareholders, the media and the public at large are further provided with comprehen-sive information through press releases and infor-mation events, while occurrences with the potential to materially affect the price of Henkel shares are communicated in the form of ad hoc announce-ments.
Further information on corporate governance can be found in the section “Principles of corporate governance / Compliance” on page 36. The composi-tion of the Management Board is shown on page 187. For more details on the composition of the Supervi-sory Board and the Shareholders’ Committee or the (sub)committees established by the Supervisory Board and Shareholders’ Committee, please refer to pages 184 to 186. Details of the compensation of the Management Board, the Supervisory Board and the Shareholders’ Committee can be found in the remu-neration report on pages 41 to 51.
37Combined management reportHenkel Annual Report 2015
31 Corporate governance52 Shares and bonds57 Fundamental principles
of the Group65 Economic report
102 Henkel AG & Co. KGaA (condensed version according to the German Commercial Code [HGB])
106 Subsequent events
106 Risks and opportunities report114 Forecast

Targets for the proportion of women on the Management Board and in the first two manage-ment levels below the Management Board In accordance with Section 76 (4) and Section 111 (5) AktG, targets must be set for the proportion of women on the Management Board and in the first two management levels below the Management Board. If the proportion of women is below 30 percent at the time the targets are set, the targets may not be below the proportion already achieved. Deadlines for achievement of the targets must be established at the same time. Each deadline must be within five years and the first deadline can be no later than June 30, 2017.
Proportion of women on the Management BoardIn September 2015, the Supervisory Board of Henkel Management AG, as the body responsible for appointing the Management Board, established in agreement with the recommendations of the Shareholders’ Committee and its Human Resources Subcommittee, a target for the proportion of women on the Management Board of 17 percent, taking into account the remaining tenures of current members and an appropriate Management Board size for the corporation. This proportion will apply, and the target will be met, by December 31, 2016.
The proportion of women on the Management Board at December 31, 2015 was 17 percent.
Proportion of women in the management levels below the Management BoardIn September 2015, the Management Board established the following targets for the first two levels of management below the Management Board within the meaning of Section 76 (4) AktG in consideration of the current personnel mix. These targets are expected to be achieved by December 31, 2016:• First management level: Proportion of 17 percent
women • Second management level: Proportion of
28 percent women
In accordance with the legal requirements, the point of reference for the definition of the management levels was based exclusively on Henkel AG & Co. KGaA and not the Henkel Group – regardless of Henkel’s globally aligned management organization. As a result, the figures include only employees of Henkel AG & Co. KGaA with management responsi-bility who report directly to the Management Board (management level 1) and those who report to management level 1 (management level 2).
Separately from the targets listed above for the first two levels of management below the Management Board of Henkel AG & Co. KGaA – and mindful of our globally aligned management organization – it is our goal to increase our ratio of women at all levels of management at Henkel in the long term. Worldwide, our overall proportion of women in management at December 31, 2015 was around 33 percent.
Objectives regarding Supervisory Board compositionGiven Henkel’s position as a listed corporation subject to the Codetermination Act, the Supervisory Board of Henkel AG & Co. KGaA must consist of at least 30 percent women and at least 30 percent men (Section 96 (2) AktG). These minimums apply to all new elections on or after January 1, 2016.
In consideration of the specific situation of the corporation, the Supervisory Board has, in addition to the statutory requirements listed above, estab-lished the objectives described below with respect to its composition in accordance with Item 5.4.1 of the German Corporate Governance Code [DCGK]. In 2015, the Supervisory Board updated these objectives tak-ing into account the amendments to the DCGK issued on May 5, 2015. These objectives will be taken into account by the Supervisory Board when propos-ing election candidates to the Annual General Meeting for all re-electable and ad hoc replacement Supervisory Board positions:• The members of the Supervisory Board should,
generally speaking, offer the knowledge, skills and relevant experience necessary in order to properly perform their duties. In particular, experience and expertise are required in one or several of the fields of corporate management, accounting, financial control/risk management, corporate gov-ernance/compliance, research and development, production/engineering, and marketing/sales/ distribution, as is knowledge of the industrial or consumer businesses and of the primary markets in which Henkel is active. Members of the Super-visory Board should also have sufficient time at their disposal in order to carry out their mandate.
• The international activities of the corporation should be appropriately reflected in the composi-tion of the Supervisory Board. Thus, it aims to include several members with an international background. The mix of candidates proposed for election should also contain an appropriate num-ber of women. Efforts will therefore be made for upcoming new and ad hoc replacement elections to achieve a proportion higher than the minimum 30 percent required by law.
Henkel Annual Report 201538 Combined management report

• In addition, the Supervisory Board should have an appropriate number of independent members. Specifically, the Supervisory Board should contain no more than two former members of the Manage-ment Board, no persons who perform board or committee functions or act as consultants for major competitors, and no persons whose rela-tionship with the corporation or members of the Management Board could give rise to material con-flicts of interest that are not of a merely temporary nature. Assuming that the exercise of their Super-visory Board mandate by the employee representa-tives cannot be the sole basis for doubt as to whether the independence criteria as defined by Item 5.4.2 of the DCGK are fulfilled, the Supervi-sory Board should include at least 13 members who are independent as defined by the DCGK. Consis-tent with the corporation’s tradition as an open family business, possession of a controlling inter-est or attribution of a controlling interest due to membership in the Henkel family share-pooling agreement is not viewed as a circumstance that creates a conflict of interest in the meaning above. However, irrespective of this, at least three of the shareholder representatives on the Supervisory Board should, as a rule, be neither members of the Henkel family share-pooling agreement nor mem-bers of the Shareholders’ Committee nor members of the Supervisory Board of Henkel Management AG.
• No persons shall be proposed for election at the Annual General Meeting who, at the time of the election, have already reached their 70th birthday. Also, as a rule, no persons should be proposed who, at the time of the election, have already served more than two full terms of office on the Supervisory Board. However, to ensure continuity, members may also serve on the Supervisory Board for longer periods of time in individual cases. Consistent with the tradition of Henkel AG & Co. KGaA as an open family business, this applies particularly to members of the Henkel family share- pooling agreement.
The statutory minimums listed above, or objectives within the meaning of the DCGK, were achieved in full in the year under review.
Among the 16 members of the Supervisory Board are nine men and seven women. Shareholder represen-tatives consist of five men and three women, while the employee representatives consist of four men and four women. This represents an overall ratio on the Supervisory Board of around 56 percent men and 44 percent women. Throughout the entire year under
review, each gender was represented by at least 30 percent among both the shareholder representa-tives and the employee representatives.
Overall, the Supervisory Board has at its disposal the knowledge, skills and technical abilities needed to properly and effectively perform its duties. In addi-tion, several members of the Supervisory Board offer international business experience or other interna-tional expertise. No individual on the Supervisory Board exceeds the specified maximum age.
None of the Supervisory Board members elected by the Annual General Meeting is a former Management Board member, or performs board or committee functions or acts as a consultant for major competi-tors, and none are persons whose relationship with the corporation or members of the Management Board could give rise to material conflicts of interest that are not of a merely temporary nature. Four of the eight shareholder representatives are not members of the Henkel family share-pooling agreement, and seven of the eight shareholder representatives are neither members of the Shareholders’ Committee nor members of the Supervisory Board of Henkel Management AG.
Application of the German Corporate Governance CodeTaking into account the special features arising from our legal form and Articles of Association, Henkel AG & Co. KGaA complies with the recommendations (“shall” provisions) of the DCGK, latest edition, with one exception: So as to protect the legitimate inter-ests and privacy of those members of the corporate management bodies who are also members of the Henkel family, in deviation from Section 6.3 of the DCGK as amended on June 24, 2014 and subsequently on May 5, 2015, the shareholdings of those members exceeding one percent of the shares issued by the corporation have not been and will not be disclosed unless required by law. The DCGK requires disclosure of shareholdings upward of one percent. In accor-dance with the Declaration of Compliance, the fol-lowing information is reported concerning the aggre-gate shareholdings of all members of a corporate body, taking the relevant provisions for attribution into account: The aggregate holdings of the members of the Supervisory Board and of the members of the Shareholders’ Committee exceed in each case one percent of the shares issued by the corporation. The members of the Management Board together hold less than one percent of the shares issued by the cor-poration.
female member-ship on the Super-visory Board.
Around 44 %
39Combined management reportHenkel Annual Report 2015
31 Corporate governance52 Shares and bonds57 Fundamental principles
of the Group65 Economic report
102 Henkel AG & Co. KGaA (condensed version according to the German Commercial Code [HGB])
106 Subsequent events
106 Risks and opportunities report114 Forecast

Henkel also complies with all non-compulsory suggestions (“may/should” provisions) of the DCGK, in keeping with our legal form and the special statu-tory features anchored in our Articles of Association.
The corresponding declarations of compliance together with the reasons for deviations from recommendations can be found on our website at
www.henkel.com/ir
Directors’ dealingsIn accordance with Section 15a of the German Securi-ties Trading Act [WpHG] (Directors’ Dealings), mem-bers of the Management Board, the Supervisory Board and the Shareholders’ Committee, and parties related to same, are obliged to disclose notifiable transactions involving shares in Henkel AG & Co. KGaA or their derivative financial instruments where the value of such transactions by the member, and parties related to the member, attains or exceeds 5,000 euros in a calendar year. The transactions reported to the corporation in the past fiscal year were properly disclosed and can be seen on the website www.henkel.com/ir
Statutory and regulatory situation
Our business is governed by national rules and regulations and – within the European Union (EU) – increasingly by harmonized pan-European laws. In addition, some of our activities are subject to rules and regulations derived from approvals, licenses, certificates or permits.
Our manufacturing operations are bound by rules and regulations with respect to the registration, eval-uation, usage, storage, transportation and handling of certain substances and also in relation to emis-sions, wastewater, effluent and other waste. The con-struction and operation of production facilities and other plant and equipment are governed by frame-work rules and regulations – including those relating to the decontamination of soil.
Product-specific regulations of relevance to us relate in particular to ingredients and input materials, safety in manufacturing, the handling of products and their contents, and the packaging and marketing of these items. The control mechanisms include statutory material-related regulations, usage prohi-bitions or restrictions, procedural requirements (test and inspection, identification marking, provision of warning labels, etc.), and product liability law.
Our internal standards are geared to ensuring com-pliance with statutory regulations and the safety of our manufacturing facilities and products. The asso-ciated requirements have been incorporated within, and implemented throughout, our management systems, and are subject to a regular audit and review regime. This includes monitoring and evaluating relevant statutory and regulatory requirements and changes in a prompt and timely fashion.
Henkel Annual Report 201540 Combined management report

Remuneration report
This remuneration report provides an outline of the compensation system for the Management Board, Henkel Management AG as the Personally Liable Partner, the Supervisory Board and the Shareholders’ Committee of Henkel AG & Co. KGaA, and the Super-visory Board of Henkel Management AG; it also explains the level and structure of the remuneration paid.
The report takes into account the recommendations of the German Corporate Governance Code [DCGK] and contains all disclosures and explanations pursu-ant to the provisions of the German Commercial Code [HGB] and the appropriate principles of German Accounting Standards [DRS], and as required by International Financial Reporting Standards (IFRS). The remuneration report forms part of the combined management report for Henkel AG & Co. KGaA and the Group; the associated information has not there-fore been additionally disclosed in the notes to the consolidated financial statements.
1. Management Board remuneration
Regulation, structure and amountsThe compensation for members of the Management Board of Henkel Management AG is set by the Super-visory Board of Henkel Management AG in consulta-tion with the Human Resources Subcommittee of the Shareholders’ Committee. The Supervisory Board of Henkel Management AG is comprised of three mem-bers of the Shareholders’ Committee.
The structure and amounts of Management Board remuneration are aligned to the size and international activities of the corporation, its economic and finan-cial position, its performance and future prospects, the normal levels of remuneration encountered in comparable companies, and also the general compen-sation structure within the corporation. The compen-sation package is further determined on the basis of the functions, responsibilities and personal perfor-mance of the individual executives, and the perfor-mance of the Management Board as a whole. The vari-able annual remuneration components have been devised such that they take into account both positive and negative developments. The overall remuneration mix is designed to be internationally competitive while also providing an incentive for sustainable business development and a sustainable increase in shareholder value in a dynamic environment.
The Supervisory Board of Henkel Management AG regularly reviews the compensation system as well as the appropriateness of the compensation, based
on the aforementioned criteria. In doing so, Manage-ment Board remuneration is analyzed relative to the compensation paid to senior management and the staff as a whole, both overall and over time, whereby the Supervisory Board determines the boundaries between senior management and relevant staff members.
As recommended by the Human Resources Subcom-mittee of the Shareholders’ Committee, the Supervi-sory Board of Henkel Management AG reviewed the remuneration system for the Management Board and approved amendments for application from fiscal 2015 onwards. The former breakdown of remunera-tion into non-performance-related and variable, per-formance-related components remains unchanged. What has changed is the ratio of the individual components of remuneration to one another, with greater weight being given to the multi-year compo-nent. The basis for determining annual variable cash remuneration has also been modified, and the com-pany pension plan simplified. This modified remu-neration system was approved by the 2015 Annual General Meeting with a large majority.
Members of the Management Board receive remu-neration consisting of non-performance-related components and variable, performance-related components. The non-performance-related compen-sation is made up of their fixed salary together with various in-kind and other benefits (other emol-uments). The performance-related compensation has two parts. The first is a variable annual cash pay-ment (short-term incentive or “STI”), 65 percent of which is short-term variable cash remuneration and 35 percent of which is long-term variable cash remu-neration in the form of an investment financed by the recipient in Henkel preferred shares (share defer-ral). The second is a variable cash payment based on the long-term performance of the business (long-term incentive or “LTI”). The remuneration targeting long-term performance thus consists of the share deferral and the LTI.
If all performance targets are met in full (“at target”), around 21 percent of the remuneration (excluding other emoluments and pension benefits) is paid as the fixed component, while the STI and share deferral account for around 56 percent, and the LTI for around 23 percent.
Pension benefits also form part of the remuneration package. In addition, the Supervisory Board of Henkel Management AG may, at its discretion and after due consideration, grant a special payment in recognition of exceptional achievements.
41Combined management reportHenkel Annual Report 2015
31 Corporate governance52 Shares and bonds57 Fundamental principles
of the Group65 Economic report
102 Henkel AG & Co. KGaA (condensed version according to the German Commercial Code [HGB])
106 Subsequent events
106 Risks and opportunities report114 Forecast

The components in detail:
Non-performance-related compensation
Fixed salaryThe fixed remuneration takes into account the assigned function and responsibility and the market conditions. It is paid out monthly as salary and amounts to 1,200,000 euros per year for the Chairman of the Management Board and 750,000 euros per year for the other Management Board members.
Other emolumentsThe members of the Management Board also receive other emoluments, primarily in the form of costs associated with, or the cash value of, in-kind benefits and other fringe benefits such as standard commercial insurance policies, reimbursement of accommodation/moving costs, costs associated with preventive medical examinations, and provi-sion of a company car or use of a car service, includ-ing any taxes on same. All members of the Manage-ment Board are entitled, in principle, to the same emoluments, whereby the amounts vary depending on personal situation.
Performance-related compensation
Variable annual cash remuneration The performance criteria governing the variable annual cash remuneration (STI) are return on capital employed (ROCE) and earnings per preferred share (EPS) in the relevant fiscal year (“year of payment”), adjusted in each case for exceptional items, together with separate targets for each individual member.
The ROCE targets are derived from a strategic target yield. EPS performance is measured on the basis of actual-to-actual comparison, i.e. the EPS in the year of payment is compared to the EPS from the previous year.
Thresholds have been defined for both key finan-cials; payment is withheld if the minimum targets are not met. If adjusted EPS in the year of payment is more than 25 percent above or below the comparable prior-year figure as a result of extraordinary events, the Supervisory Board of Henkel Management AG may, at its discretion and after due consideration, decide to adjust the target within this corridor, or may determine a new reference value for measuring performance in the following year.
The STI is calculated on the basis of a 40-percent weighting each of ROCE and EPS performance in the year of payment, and a 20-percent weighting of indi-vidual targets. The following factors play a key role in measuring individual performance: the Group results and the results of the relevant business unit, the quality of management demonstrated in those busi-ness units, and the individual contribution made by the Management Board member concerned. The application of these performance parameters ensures that profitable growth is duly rewarded by Henkel.
In determining the STI, the Supervisory Board of Henkel Management AG also takes into account the apparent sustainability of the economic performance delivered in the course of the year, and the perfor-mance levels of the Management Board members.
The total amount of the STI is subject to a cap of 150 percent of the target amount.
Remuneration structure
Fixed salary and other emoluments
Variable annual cash remuneration (STI)Performance parameters: ROCE, EPS,
adjusted in each case; individual targets
Long-term incentivePerformance parameters: Increase in adjusted EPS
Short-term variable cash remuneration (65 % of STI)
Share deferral (35 % of STI)
10
Non-performance- related components
Performance-related components, long-term
Performance-related components, short-term
Henkel Annual Report 201542 Combined management report
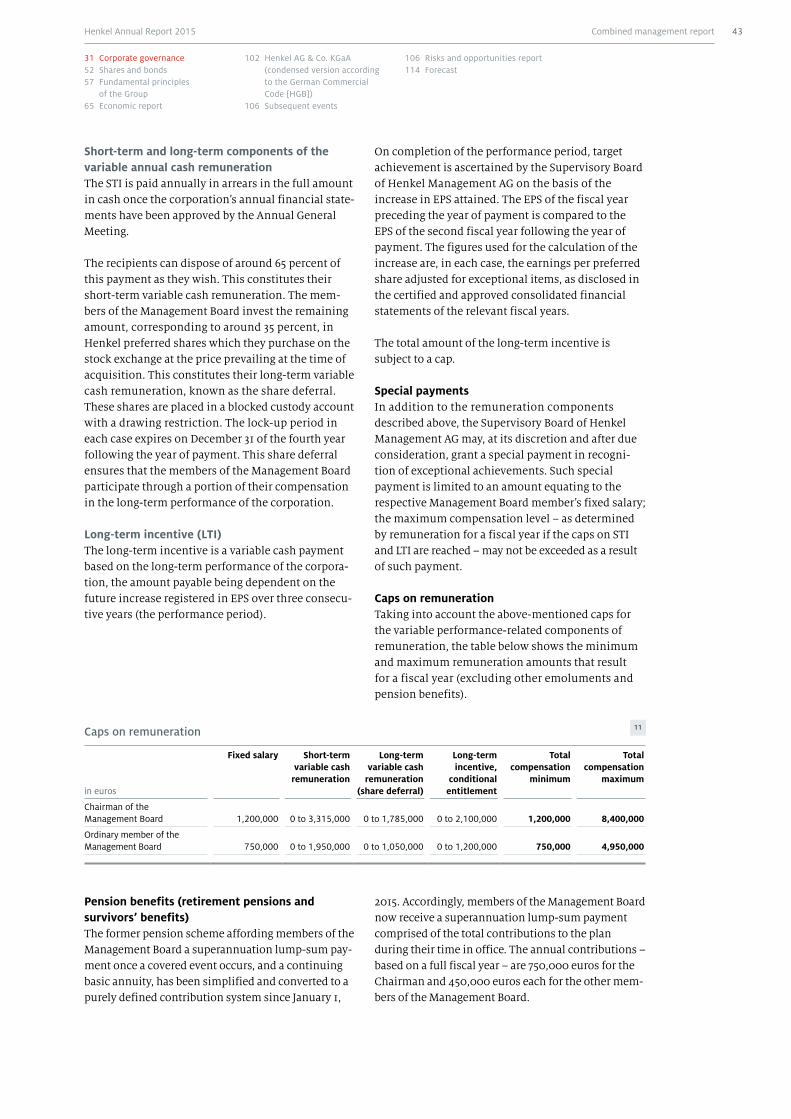
Short-term and long-term components of the variable annual cash remuneration The STI is paid annually in arrears in the full amount in cash once the corporation’s annual financial state-ments have been approved by the Annual General Meeting.
The recipients can dispose of around 65 percent of this payment as they wish. This constitutes their short-term variable cash remuneration. The mem-bers of the Management Board invest the remaining amount, corresponding to around 35 percent, in Henkel preferred shares which they purchase on the stock exchange at the price prevailing at the time of acquisition. This constitutes their long-term variable cash remuneration, known as the share deferral. These shares are placed in a blocked custody account with a drawing restriction. The lock-up period in each case expires on December 31 of the fourth year following the year of payment. This share deferral ensures that the members of the Management Board participate through a portion of their compensation in the long-term performance of the corporation.
Long-term incentive (LTI)The long-term incentive is a variable cash payment based on the long-term performance of the corpora-tion, the amount payable being dependent on the future increase registered in EPS over three consecu-tive years (the performance period).
On completion of the performance period, target achievement is ascertained by the Supervisory Board of Henkel Management AG on the basis of the increase in EPS attained. The EPS of the fiscal year preceding the year of payment is compared to the EPS of the second fiscal year following the year of payment. The figures used for the calculation of the increase are, in each case, the earnings per preferred share adjusted for exceptional items, as disclosed in the certified and approved consolidated financial statements of the relevant fiscal years.
The total amount of the long-term incentive is subject to a cap.
Special paymentsIn addition to the remuneration components described above, the Supervisory Board of Henkel Management AG may, at its discretion and after due consideration, grant a special payment in recogni-tion of exceptional achievements. Such special payment is limited to an amount equating to the respective Management Board member’s fixed salary; the maximum compensation level – as determined by remuneration for a fiscal year if the caps on STI and LTI are reached – may not be exceeded as a result of such payment.
Caps on remunerationTaking into account the above-mentioned caps for the variable performance-related components of remuneration, the table below shows the minimum and maximum remuneration amounts that result for a fiscal year (excluding other emoluments and pension benefits).
Caps on remuneration 11
in euros
Fixed salary Short-term variable cash
remuneration
Long-term variable cash
remuneration (share deferral)
Long-term incentive,
conditional entitlement
Total compensation
minimum
Total compensation
maximum
Chairman of the Management Board 1,200,000 0 to 3,315,000 0 to 1,785,000 0 to 2,100,000 1,200,000 8,400,000
Ordinary member of the Management Board 750,000 0 to 1,950,000 0 to 1,050,000 0 to 1,200,000 750,000 4,950,000
Pension benefits (retirement pensions and survivors’ benefits)The former pension scheme affording members of the Management Board a superannuation lump-sum pay-ment once a covered event occurs, and a continuing basic annuity, has been simplified and converted to a purely defined contribution system since January 1,
2015. Accordingly, members of the Management Board now receive a superannuation lump-sum payment comprised of the total contributions to the plan during their time in office. The annual contributions – based on a full fiscal year – are 750,000 euros for the Chairman and 450,000 euros each for the other mem-bers of the Management Board.
43Combined management reportHenkel Annual Report 2015
31 Corporate governance52 Shares and bonds57 Fundamental principles
of the Group65 Economic report
102 Henkel AG & Co. KGaA (condensed version according to the German Commercial Code [HGB])
106 Subsequent events
106 Risks and opportunities report114 Forecast

An entitlement to pension benefits arises on retire-ment, on termination of the employment relation-ship on or after attainment of the statutory retirement age, in the event of death, or in the event of perma-nent complete incapacity for work. If a member of the Management Board has received no pension benefits prior to their death, the superannuation lump sum accumulated up to time of death is paid out to the sur-viving spouse or surviving children.
Provisions governing termination of position on the Management BoardIf an active member of the Management Board who was first appointed prior to 2009 retires, or dies while still in office, payment of their fixed remuneration continues for a further six months, but not beyond their 65th birthday. In the event of death in service, the payments are made to the surviving spouse or entitled dependent children.
In the event that a member’s position on the Man-agement Board is terminated prematurely by the cor-poration without that member providing good cause or reason for the termination, the executive contract provides for a severance settlement amounting to the remuneration for the remaining contractual term (fixed remuneration plus variable annual remunera-tion for single or multiple years) in the form of a discounted lump-sum payment. These severance payments are limited to two years’ compensation (severance payment cap) and may not extend over a period that exceeds the residual term of the execu-tive contract. In the event that the sphere of respon-sibility/executive function is altered or restricted to such an extent that it is no longer comparable to the position prior to the change or restriction, the affected members of the Management Board are entitled to resign from office and request premature termination of their contract. In such case, members are entitled to severance payments amounting to not more than two years’ compensation.
Upon an executive’s departure from the Management Board, the STI is paid on a time-proportion basis on the ordinary payment date after the end of the fiscal year in which the appointment ends. If not already expired, lock-up periods for the share deferral end six months after departure. This applies accordingly to entitlements under the LTI. However, entitlements from any tranche whose performance period has not yet ended at the date of departure are forfeited with-out replacement if the departure is based on good cause or reason that would have justified revocation of the appointment or termination of the employ-ment contract.
In addition, the executive contracts include a post-contractual non-competition clause with a term of up to two years. This attracts a discretionary payment totaling 50 percent of the annual compensation after allowing for any severance payments and is payable unless the Supervisory Board of Henkel Man-agement AG waives the non-competition clause. Simi-larly, any earnings from new extra-contractual activities during the non-competition period shall be offset against this discretionary payment to the extent that such earnings and discretionary payment together exceed the actual compensation paid in the last fully ended fiscal year by 10 percent or more. No entitlements exist in the event of premature termi-nation of executive duties resulting from a change in control.
Other provisionsThe corporation maintains directors and officers insurance (D&O insurance) for directors and officers of the Henkel Group. For members of the Manage-ment Board there is a deductible amounting to 10 percent per loss event, subject to a maximum for a fiscal year of one and a half times their annual fixed remuneration.
Remuneration for 2015 Excluding pension entitlements, the total compen-sation paid to members of the Management Board for the performance of their duties for and on behalf of Henkel AG & Co. KGaA and its subsidiaries during the year under review amounted to 25,804,019 euros (previous year: 27,404,426 euros). Fixed salaries accounted for 4,950,000 euros (previous year: 4,550,000 euros), other emoluments for 360,477 euros (previous year: 319,926 euros), short-term variable cash remuneration for 9,810,801 euros (previous year: 12,576,000 euros), long-term variable cash remuneration – share deferral – for 5,282,741 euros (previous year: 8,384,000 euros), and the long-term incentive for 5,400,000 euros (previous year: 1,574,500 euros). In accordance with legal regula-tions, the value of the long-term incentive granted for 2015, which is payable in 2018 contingent on the achievement of performance objectives, is recognized here based on the target amount that would be paid assuming a 30 percent increase in EPS within the performance period.
Compensation for the reporting period granted to members of the Management Board serving in 2015, separated into the above-mentioned components, is shown in the following table:
Henkel Annual Report 201544 Combined management report

Remuneration of Management Board members who served in 2015 12
in euros
Kasper Rorsted (Chairman)
Member of the
Management Board since
4/1/2005
Jan-Dirk Auris (Adhesive
Technologies)
Member of the Management
Board since 1/1/2011
Carsten Knobel (Finance)
Member of the
Management Board since
7/1/2012
Kathrin Menges (Human
Resources)
Member of the Management
Board since 10/1/2011
Bruno Piacenza (Laundry &
Home Care)
Member of the Management
Board since 1/1/2011
Hans Van Bylen (Beauty Care)
Member of the
Management Board since
7/1/2005
Total
1. Fixed salary 1 2015 1,200,000 750,000 750,000 750,000 750,000 750,000 4,950,000
2014 1,050,000 700,000 700,000 700,000 700,000 700,000 4,550,000
2. Other emoluments 1 2015 79,206 47,361 50,806 40,285 99,033 43,786 360,477
2014 65,252 51,276 53,072 43,126 59,236 47,964 319,926
3. Short-term variable cash remuneration 1
2015 2,418,846 1,375,171 1,527,921 1,466,821 1,527,921 1,494,121 9,810,801
2014 3,216,000 1,872,000 1,872,000 1,872,000 1,872,000 1,872,000 12,576,000
Single-year remuneration (Total of 1 to 3)
2015 3,698,052 2,172,532 2,328,727 2,257,106 2,376,954 2,287,907 15,121,278
2014 4,331,252 2,623,276 2,625,072 2,615,126 2,631,236 2,619,964 17,445,926
4. Long-term variable cash remuneration (share deferral) 1
2015 1,302,456 740,477 822,727 789,827 822,727 804,527 5,282,741
2014 2,144,000 1,248,000 1,248,000 1,248,000 1,248,000 1,248,000 8,384,000
5. Long-term incentive 2
2015 1,400,000 800,000 800,000 800,000 800,000 800,000 5,400,000
2014 399,500 235,000 235,000 235,000 235,000 235,000 1,574,500
Multi-year remuneration (Total of 4 and 5)
2015 2,702,456 1,540,477 1,622,727 1,589,827 1,622,727 1,604,527 10,682,741
2014 2,543,500 1,483,000 1,483,000 1,483,000 1,483,000 1,483,000 9,958,500
Total remuneration (Total of 1 to 5)
2015 6,400,508 3,713,009 3,951,454 3,846,933 3,999,681 3,892,434 25,804,019
2014 6,874,752 4,106,276 4,108,072 4,098,126 4,114,236 4,102,964 27,404,426
1 The payout is reported pursuant to HGB / IFRS.2 Target amount pursuant to HGB / IFRS, based on a 30-percent increase in adjusted earnings per preferred share within the performance period of three years.
LTI payout for 2015 occurs in 2018; LTI payout for 2014 occurs in 2017.
In the year under review, no member of the Manage-ment Board was granted non-standard benefits by the company in connection with premature termina-tion of their tenure, nor were any such entitlements or arrangements modified. No member of the Man-agement Board was pledged payments from third parties in respect of their duties as executives of the company, nor were any such payments granted in the reporting period.
Structure of Management Board remuneration 13
in euros
Components of single-year remuneration
Components of multi-year remuneration
Fixed salary Other emoluments
Short-term variable cash
remuneration
Long-term variable cash
remuneration (share deferral)
Long-term incentive
Total remuneration
Total 2015 4,950,000 360,477 9,810,801 5,282,741 5,400,000 25,804,019
19.2 % 1.4 % 38.0 % 20.5 % 20.9 % 100 %
Total 2014 4,550,000 319,926 12,576,000 8,384,000 1,574,500 27,404,426
16.6 % 1.2 % 45.9 % 30.6 % 5.7 % 100 %
45Combined management reportHenkel Annual Report 2015
31 Corporate governance52 Shares and bonds57 Fundamental principles
of the Group65 Economic report
102 Henkel AG & Co. KGaA (condensed version according to the German Commercial Code [HGB])
106 Subsequent events
106 Risks and opportunities report114 Forecast

Pension benefitsThe figures calculated in accordance with the German Commercial Code [HGB] and International Accounting Standards (IAS) 19 for service cost for
entitlements acquired in the reporting year and the present value of total pension benefits accruing to the end of the fiscal year are shown in the following table:
Service cost / Present value of pension benefits 14
HGB IAS
in euros
Service cost for pension benefits
in the reporting year
Present value of pension benefits
as of December 31
Service cost for pension benefits
in the reporting year
Present value of pension benefits
as of December 31
Kasper Rorsted 2015 791,760 7,057,239 798,237 7,116,328
2014 649,406 5,759,924 650,059 5,849,341
Jan-Dirk Auris 2015 456,041 2,628,382 456,927 2,746,697
2014 393,196 1,980,974 394,602 2,495,849
Carsten Knobel 2015 455,659 1,994,619 457,887 2,103,255
2014 396,020 1,402,326 399,364 2,002,885
Kathrin Menges 2015 454,902 2,051,174 455,704 2,113,541
2014 395,533 1,451,597 397,958 1,661,415
Bruno Piacenza 2015 454,174 2,045,361 454,174 2,049,561
2014 392,296 1,458,826 393,045 1,465,545
Hans Van Bylen 2015 460,637 5,506,250 460,637 5,937,632
2014 392,372 4,598,944 392,994 5,346,432
Total 2015 3,073,173 21,283,025 3,083,566 22,067,014
2014 2,618,823 16,652,591 2,628,022 18,821,467
For pension obligations to former members of the Management Board and the former management of Henkel KGaA, as well as the former management of its legal predecessor and surviving dependents, 98,729,434 euros (previous year: 108,218,489 euros) is deferred. Amounts paid to such recipients during the year under review totaled 7,163,382 euros (previ-ous year: 7,138,469 euros).
Henkel Annual Report 201546 Combined management report
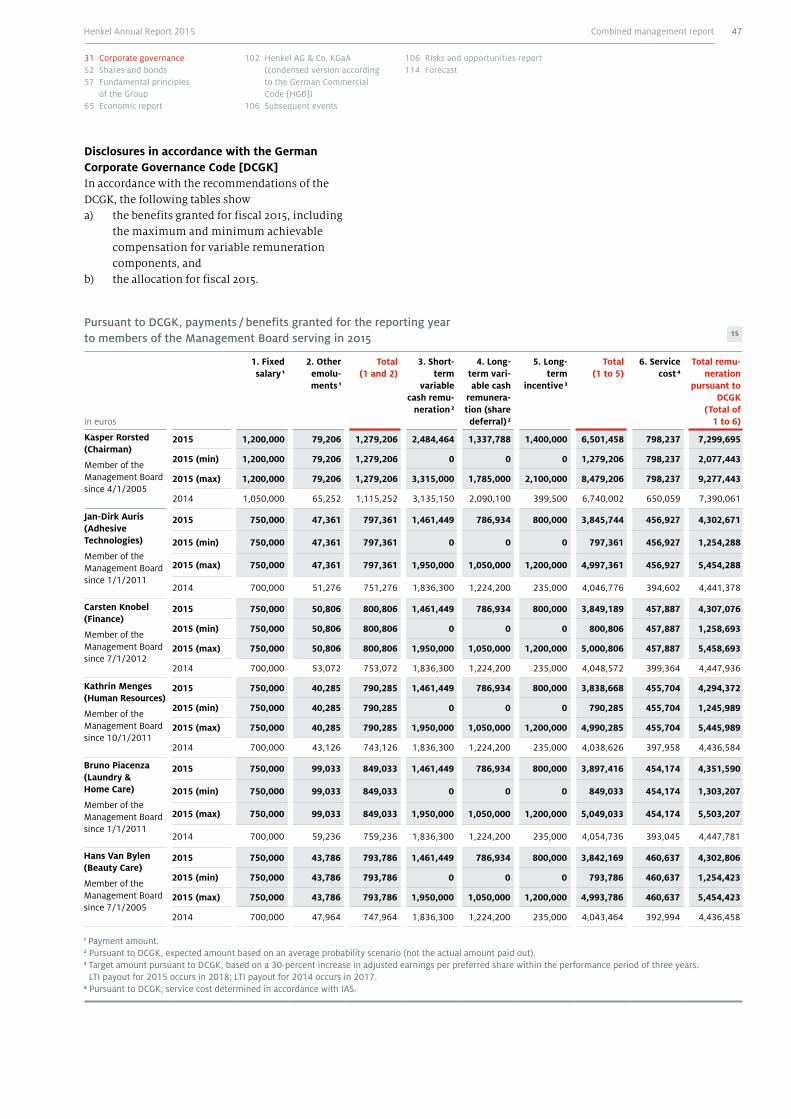
Disclosures in accordance with the German Corporate Governance Code [DCGK]In accordance with the recommendations of the DCGK, the following tables show a) the benefits granted for fiscal 2015, including
the maximum and minimum achievable compensation for variable remuneration components, and
b) the allocation for fiscal 2015.
Pursuant to DCGK, payments / benefits granted for the reporting year to members of the Management Board serving in 2015 15
in euros
1. Fixed salary 1
2. Other emolu-ments 1
Total (1 and 2)
3. Short-term
variable cash remu-
neration 2
4. Long-term vari-able cash
remunera-tion (share deferral) 2
5. Long-term
incentive 3
Total (1 to 5)
6. Service cost 4
Total remu-neration
pursuant to DCGK
(Total of 1 to 6)
Kasper Rorsted (Chairman)
Member of the Management Board since 4/1/2005
2015 1,200,000 79,206 1,279,206 2,484,464 1,337,788 1,400,000 6,501,458 798,237 7,299,695
2015 (min) 1,200,000 79,206 1,279,206 0 0 0 1,279,206 798,237 2,077,443
2015 (max) 1,200,000 79,206 1,279,206 3,315,000 1,785,000 2,100,000 8,479,206 798,237 9,277,443
2014 1,050,000 65,252 1,115,252 3,135,150 2,090,100 399,500 6,740,002 650,059 7,390,061
Jan-Dirk Auris (Adhesive Technologies)
Member of the Management Board since 1/1/2011
2015 750,000 47,361 797,361 1,461,449 786,934 800,000 3,845,744 456,927 4,302,671
2015 (min) 750,000 47,361 797,361 0 0 0 797,361 456,927 1,254,288
2015 (max) 750,000 47,361 797,361 1,950,000 1,050,000 1,200,000 4,997,361 456,927 5,454,288
2014 700,000 51,276 751,276 1,836,300 1,224,200 235,000 4,046,776 394,602 4,441,378
Carsten Knobel (Finance)
Member of the Management Board since 7/1/2012
2015 750,000 50,806 800,806 1,461,449 786,934 800,000 3,849,189 457,887 4,307,076
2015 (min) 750,000 50,806 800,806 0 0 0 800,806 457,887 1,258,693
2015 (max) 750,000 50,806 800,806 1,950,000 1,050,000 1,200,000 5,000,806 457,887 5,458,693
2014 700,000 53,072 753,072 1,836,300 1,224,200 235,000 4,048,572 399,364 4,447,936
Kathrin Menges (Human Resources)
Member of the Management Board since 10/1/2011
2015 750,000 40,285 790,285 1,461,449 786,934 800,000 3,838,668 455,704 4,294,372
2015 (min) 750,000 40,285 790,285 0 0 0 790,285 455,704 1,245,989
2015 (max) 750,000 40,285 790,285 1,950,000 1,050,000 1,200,000 4,990,285 455,704 5,445,989
2014 700,000 43,126 743,126 1,836,300 1,224,200 235,000 4,038,626 397,958 4,436,584
Bruno Piacenza (Laundry & Home Care)
Member of the Management Board since 1/1/2011
2015 750,000 99,033 849,033 1,461,449 786,934 800,000 3,897,416 454,174 4,351,590
2015 (min) 750,000 99,033 849,033 0 0 0 849,033 454,174 1,303,207
2015 (max) 750,000 99,033 849,033 1,950,000 1,050,000 1,200,000 5,049,033 454,174 5,503,207
2014 700,000 59,236 759,236 1,836,300 1,224,200 235,000 4,054,736 393,045 4,447,781
Hans Van Bylen (Beauty Care)
Member of the Management Board since 7/1/2005
2015 750,000 43,786 793,786 1,461,449 786,934 800,000 3,842,169 460,637 4,302,806
2015 (min) 750,000 43,786 793,786 0 0 0 793,786 460,637 1,254,423
2015 (max) 750,000 43,786 793,786 1,950,000 1,050,000 1,200,000 4,993,786 460,637 5,454,423
2014 700,000 47,964 747,964 1,836,300 1,224,200 235,000 4,043,464 392,994 4,436,458
1 Payment amount.2 Pursuant to DCGK, expected amount based on an average probability scenario (not the actual amount paid out).3 Target amount pursuant to DCGK, based on a 30-percent increase in adjusted earnings per preferred share within the performance period of three years.
LTI payout for 2015 occurs in 2018; LTI payout for 2014 occurs in 2017.4 Pursuant to DCGK, service cost determined in accordance with IAS.
47Combined management reportHenkel Annual Report 2015
31 Corporate governance52 Shares and bonds57 Fundamental principles
of the Group65 Economic report
102 Henkel AG & Co. KGaA (condensed version according to the German Commercial Code [HGB])
106 Subsequent events
106 Risks and opportunities report114 Forecast

Pursuant to DCGK, payments / benefits made for the reporting year to members of the Management Board serving in 2015 16
5. Long-term incentive 3
in euros
1. Fixed salary 1
2. Other emolu-ments 1
Total (1 and 2)
3. Short-term
variable cash remu-
neration 2
4. Long-term vari-able cash
remunera-tion (share deferral) 2
2013 tranche
(term 1/1/2013 –
12/31/2015)
2012 tranche
(term 1/1/2012 –
12/31/2014)
Total (1 to 5)
6. Service cost 4
Total remu-neration
pursuant to DCGK
(Total of 1 to 6)
Kasper Rorsted (Chairman)
Member of the Management Board since 4/1/2005
2015 1,200,000 79,206 1,279,206 2,418,846 1,302,456 426,838 5,427,346 798,237 6,225,583
2014 1,050,000 65,252 1,115,252 3,216,000 2,144,000 536,637 7,011,889 650,059 7,661,948
Jan-Dirk Auris (Adhesive Technologies)
Member of the Management Board since 1/1/2011
2015 750,000 47,361 797,361 1,375,171 740,477 251,081 3,164,090 456,927 3,621,017
2014 700,000 51,276 751,276 1,872,000 1,248,000 315,669 4,186,945 394,602 4,581,547
Carsten Knobel (Finance)
Member of the Management Board since 7/1/2012
2015 750,000 50,806 800,806 1,527,921 822,727 251,081 3,402,535 457,887 3,860,422
2014 700,000 53,072 753,072 1,872,000 1,248,000 157,834 4,030,906 399,364 4,430,270
Kathrin Menges (Human Resources)
Member of the Management Board since 10/1/2011
2015 750,000 40,285 790,285 1,466,821 789,827 251,081 3,298,014 455,704 3,753,718
2014 700,000 43,126 743,126 1,872,000 1,248,000 268,318 4,131,444 397,958 4,529,402
Bruno Piacenza (Laundry & Home Care)
Member of the Management Board since 1/1/2011
2015 750,000 99,033 849,033 1,527,921 822,727 251,081 3,450,762 454,174 3,904,936
2014 700,000 59,236 759,236 1,872,000 1,248,000 315,669 4,194,905 393,045 4,587,950
Hans Van Bylen (Beauty Care)
Member of the Management Board since 7/1/2005
2015 750,000 43,786 793,786 1,494,121 804,527 251,081 3,343,515 460,637 3,804,152
2014 700,000 47,964 747,964 1,872,000 1,248,000 315,669 4,183,633 392,994 4,576,627
1 Payment amount.2 Pursuant to DCGK, based on the payment amount of the remuneration components granted for the relevant fiscal year;
actual allocation occurs in the following year.3 Pursuant to DCGK, based on the payment amount of those tranches for which the plan term of three years ended in the
relevant fiscal year; actual allocation occurs in the following year.4 Pursuant to DCGK, service cost determined in accordance with IAS.
Henkel Annual Report 201548 Combined management report

2. Remuneration of Henkel Management AG for assumption of personal liability, and reimbursement of expenses to same
For assumption of personal liability and manage-ment responsibility, Henkel Management AG in its function as Personally Liable Partner receives an annual payment of 50,000 euros (= 5 percent of its capital stock) plus any value-added tax (VAT) due, said fee being payable irrespective of any profit or loss made.
Henkel Management AG may also claim reimburse-ment from or payment by the corporation of all expenses incurred in connection with the manage-ment of the corporation’s business, including the remuneration and pensions paid to its corporate management bodies.
3. Remuneration of the Supervisory Board and of the Shareholders’ Committee of Henkel AG & Co. KGaA
Regulation, structure and amounts The remuneration for the Supervisory Board and the Shareholders’ Committee is determined by the Annual General Meeting; the corresponding provi-sions are contained in Articles 17 and 33 of the Arti-cles of Association.
Each member of the Supervisory Board and of the Shareholders’ Committee receives a fixed fee of 70,000 euros and 100,000 euros per year respec-tively. The Chairs of the Supervisory Board and the Shareholders’ Committee each receive double this amount, and the Vice Chair in each case one and a half times the aforementioned amount.
Members of the Shareholders’ Committee who are also members of one or more subcommittees of the Shareholders’ Committee each receive additional remuneration of 100,000 euros; if they chair one or more subcommittees, they receive 200,000 euros.
Members of the Supervisory Board who are also members of one or more committees each receive additional remuneration of 35,000 euros; if they chair one or more committees, they receive 70,000 euros. Activity in the Nominations Commit-tee is not remunerated separately.
The higher remuneration allocated to the members of the Shareholders’ Committee as compared to the Supervisory Board takes into account that, under the
Articles of Association, the Shareholders’ Committee participates in the management of the corporation.
Other provisionsThe members of the Supervisory Board or a com-mittee receive an attendance fee amounting to 1,000 euros for each meeting in which they partici-pate. If several meetings take place on one day, the attendance fee is only paid once. In addition, the members of the Supervisory Board and of the Shareholders’ Committee are reimbursed expenses incurred in connection with their positions. The members of the Supervisory Board are also reim-bursed the value-added tax (VAT) payable on their total remunerations and reimbursed expenses.
The corporation maintains directors and officers insurance for directors and officers of the Henkel Group. For members of the Supervisory Board and Shareholders’ Committee there is a deductible amounting to 10 percent per loss event, subject to a maximum for the fiscal year of one and a half times their annual fixed remuneration.
Remuneration for 2015Total remuneration paid to the members of the Supervisory Board for the year under review (fixed fee, attendance fee, remuneration for committee activity) amounted to 1,546,000 euros plus VAT (previous year: 1,562,000 euros plus VAT). Of this amount, fixed fees accounted for 1,225,000 euros, attendance fees for 59,000 euros, and remuneration for committee activity (including associated atten-dance fees) for 262,000 euros.
Total remuneration paid to the members of the Shareholders’ Committee for the year under review (fixed fee and remuneration for subcommittee activity) amounted to 2,350,000 euros (previous year: 2,350,000 euros). Of this amount, fixed fees were 1,150,000 euros and remuneration for subcommittee activity 1,200,000 euros.
In the year under review, no compensation or ben-efits were paid or granted for personally performed services, including in particular advisory or interme-diation services.
The remuneration of the individual members of the Supervisory Board and of the Shareholders’ Commit-tee, broken down according to the above-mentioned components, is presented in the tables on the follow-ing pages.
49Combined management reportHenkel Annual Report 2015
31 Corporate governance52 Shares and bonds57 Fundamental principles
of the Group65 Economic report
102 Henkel AG & Co. KGaA (condensed version according to the German Commercial Code [HGB])
106 Subsequent events
106 Risks and opportunities report114 Forecast

4. Remuneration of the members of the Super-visory Board of Henkel Management AG
According to Article 14 of the Articles of Association of Henkel Management AG, the members of the Supervisory Board of Henkel Management AG are each entitled to receive annual remuneration of 10,000 euros. However, those members of said Supervisory Board who are also and simultaneously members of the Supervisory Board or the Share- holders’ Committee of Henkel AG & Co. KGaA do not receive this remuneration.
Supervisory Board remuneration 17
Components of total remuneration
in eurosFixed fee Attendance fee Fee for committee
activity 1Total
remuneration 2
Dr. Simone Bagel-Trah 3, Chair
2015 140,000 4,000 38,000 182,000
2014 140,000 4,000 38,000 182,000
Winfried Zander 3, Vice Chair
2015 105,000 4,000 38,000 147,000
2014 105,000 4,000 39,000 148,000
Jutta Bernicke 2015 70,000 3,000 – 73,000
2014 70,000 5,000 – 75,000
Dr. Kaspar von Braun 2015 70,000 4,000 – 74,000
2014 70,000 5,000 – 75,000
Boris Canessa 2015 70,000 4,000 – 74,000
2014 70,000 5,000 – 75,000
Ferdinand Groos 2015 70,000 4,000 – 74,000
2014 70,000 5,000 – 75,000
Béatrice Guillaume-Grabisch 2015 70,000 2,000 – 72,000
2014 70,000 5,000 – 75,000
Peter Hausmann 3 2015 70,000 3,000 37,000 110,000
2014 70,000 3,000 38,000 111,000
Birgit Helten-Kindlein 3 2015 70,000 4,000 38,000 112,000
2014 70,000 4,000 39,000 113,000
Prof. Dr. Michael Kaschke 3 2015 70,000 3,000 38,000 111,000
2014 70,000 3,000 38,000 111,000
Barbara Kux 2015 70,000 4,000 – 74,000
2014 70,000 5,000 – 75,000
Mayc Nienhaus 2015 70,000 4,000 – 74,000
2014 70,000 5,000 – 75,000
Andrea Pichottka 2015 70,000 4,000 – 74,000
2014 70,000 5,000 – 75,000
Dr. Martina Seiler 2015 70,000 4,000 – 74,000
2014 70,000 4,000 – 74,000
Prof. Dr. Theo Siegert 3 2015 70,000 4,000 73,000 147,000
2014 70,000 4,000 74,000 148,000
Edgar Topsch 2015 70,000 4,000 – 74,000
2014 70,000 5,000 – 75,000
Total 2015 1,225,000 59,000 262,000 1,546,000
2014 1,225,000 71,000 266,000 1,562,000
1 Remuneration for service on the Audit Committee, including attendance fee; there is no separate remuneration payable for service on the Nominations Committee.
2 Figures do not include VAT.3 Member of the Audit Committee. Audit Committee Chair: Prof. Dr. Theo Siegert.
As the Supervisory Board of Henkel Management AG is only comprised of members who also belong to the Shareholders’ Committee, no remuneration was paid in respect of this Supervisory Board in the year under review.
Henkel Annual Report 201550 Combined management report

Shareholders’ Committee remuneration 18
Components of total remuneration
in eurosFixed fee Fee for subcommittee
activity Total remuneration
Dr. Simone Bagel-Trah, Chair (Chair Human Resources Subcommittee)
2015 200,000 200,000 400,000
2014 200,000 200,000 400,000
Dr. Christoph Henkel, Vice Chair (Chair Finance Subcommittee)
2015 150,000 200,000 350,000
2014 150,000 200,000 350,000
Prof. Dr. Paul Achleitner (Member Finance Subcommittee)
2015 100,000 100,000 200,000
2014 100,000 100,000 200,000
Johann-Christoph Frey (Member HR Subcommittee)
2015 100,000 100,000 200,000
2014 100,000 100,000 200,000
Stefan Hamelmann (Vice Chair Finance Subcommittee)
2015 100,000 100,000 200,000
2014 100,000 100,000 200,000
Prof. Dr. Ulrich Lehner (Member Finance Subcommittee)
2015 100,000 100,000 200,000
2014 100,000 100,000 200,000
Dr. Dr. Norbert Reithofer (Member Finance Subcommittee)
2015 100,000 100,000 200,000
2014 100,000 100,000 200,000
Konstantin von Unger (Vice Chair HR Subcommittee)
2015 100,000 100,000 200,000
2014 100,000 100,000 200,000
Jean-François van Boxmeer (Member HR Subcommittee)
2015 100,000 100,000 200,000
2014 100,000 100,000 200,000
Werner Wenning (Member HR Subcommittee)
2015 100,000 100,000 200,000
2014 100,000 100,000 200,000
Total 2015 1,150,000 1,200,000 2,350,000
2014 1,150,000 1,200,000 2,350,000
51Combined management reportHenkel Annual Report 2015
31 Corporate governance52 Shares and bonds57 Fundamental principles
of the Group65 Economic report
102 Henkel AG & Co. KGaA (condensed version according to the German Commercial Code [HGB])
106 Subsequent events
106 Risks and opportunities report114 Forecast

Shares and bonds
Henkel shares recorded very positive price perfor-mance in 2015. The price of Henkel preferred shares increased significantly by 15.4 percent to 103.20 euros. The ordinary shares also showed a strong gain and closed at 88.62 euros, 10.2 percent higher year on year. Over the course of the year, the DAX rose by 9.6 percent to 10,743 points. The EURO STOXX® Consumer Goods Index increased 18.9 percent, closing at 634 points. Henkel shares therefore outperformed the DAX, but growth was lower than other shares representing the consumer goods sector.
Henkel shares largely tracked the overall market in the course of the year. Within this environment, Henkel preferred shares reached an all-time high on April 10, 2015 of 115.20 euros. The ordinary shares also recorded their highest price ever, 99.26 euros, on April 13, 2015. After a notable decline in share prices in the third quarter, the equity markets posted a significant recovery in the fourth quarter.
The preferred shares traded at an average premium of 15.9 percent over the ordinary shares in 2015.
Year on year, the trading volume (Xetra) of preferred shares declined. Each trading day saw an average of around 571,000 preferred shares changing hands (2014: around 614,000). The average volume for our ordinary shares increased to around 104,000 shares per trading day (2014: 81,000). Due to positive share price developments, the market capitalization of our ordinary and preferred shares increased from 36.8 billion euros to 41.4 billion euros.
Henkel shares remain an attractive investment for long-term investors. Shareholders who invested the equivalent of 1,000 euros when Henkel preferred shares were issued in 1985, and re-invested the divi-dends received (before tax deduction) in the stock, had a portfolio value of 34,171 euros at the end of 2015. This represents an increase in value of 3,317 per-cent or an average yield of 12.4 percent per year. Over the same period, the DAX provided an annual yield of 7.7 percent. Over the last five and ten years, the Henkel preferred share has shown an average yield of 19.0 and 15.6 percent per year respectively, offering a signifi-cantly higher return than the average DAX returns of 10.3 percent and 8.8 percent per year for the same periods.
Key data on Henkel shares 2011 through 2015 19
in euros 2011 2012 2013 2014 2015
Earnings per share
Ordinary share 2.67 3.40 3.65 3.74 4.42
Preferred share 2.69 3.42 3.67 3.76 4.44
Share price at year-end 1
Ordinary share 37.40 51.93 75.64 80.44 88.62
Preferred share 44.59 62.20 84.31 89.42 103.20
High for the year 1
Ordinary share 41.10 52.78 75.81 80.44 99.26
Preferred share 49.81 64.61 84.48 90.45 115.20
Low for the year 1
Ordinary share 30.78 37.25 50.28 67.00 76.32
Preferred share 36.90 44.31 59.82 72.64 87.75
Dividends
Ordinary share 0.78 0.93 1.20 1.29 1.45 2
Preferred share 0.80 0.95 1.22 1.31 1.47 2
Market capitalization 1 in bn euros 17.6 24.6 34.7 36.8 41.4
Ordinary shares in bn euros 9.7 13.5 19.7 20.9 23.0
Preferred shares in bn euros 7.9 11.1 15.0 15.9 18.4
1 Closing share prices, Xetra trading system.2 Proposal to shareholders for the Annual General Meeting on April 11, 2016.
+ 15.4 %
+ 10.2 %
increase in Henkel preferred share price.
increase in Henkel ordinary share price.
€ 41.4 bn
market capitalization.
Henkel Annual Report 201552 Combined management report

120
80
100
90
110
115
15
35
55
75
95
2006 2007 2008 2009 2010 2011 2012 2013 2014 2015
Henkel share performance versus market January through December 2015 20
in euros
Henkel share performance versus market 2006 through 2015 21
in euros
Dec. 30, 2005: 28.33 euros
Dec. 30, 2015: 103.20 euros
AugustJanuary February March April May June July September October November December
Henkel preferred share
EURO STOXX® Consumer Goods Index (indexed)Henkel ordinary share (indexed)
DAX (indexed)
Henkel preferred share
EURO STOXX® Consumer Goods Index (indexed)Henkel ordinary share (indexed)
DAX (indexed)
Dec. 30, 2015: 103.20 euros
Dec. 30, 2014: 89.42 euros
53Combined management reportHenkel Annual Report 2015
31 Corporate governance52 Shares and bonds57 Fundamental principles
of the Group65 Economic report
102 Henkel AG & Co. KGaA (condensed version according to the German Commercial Code [HGB])
106 Subsequent events
106 Risks and opportunities report114 Forecast

Henkel represented in all major indices
Henkel shares are traded on the Frankfurt Stock Exchange, predominantly on the Xetra electronic trad-ing platform. Henkel is also listed on all regional stock exchanges in Germany. In the USA, investors are able to invest in Henkel preferred and ordinary shares by way of stock ownership certificates obtained through the Sponsored Level I ADR (American Depositary Receipt) program. The number of ADRs outstanding for ordinary and preferred shares at the end of the year was approximately 1.7 million (2014: 2.5 million).
The international importance of Henkel preferred shares derives not least from their inclusion in many leading indices that serve as important indicators for capital markets, and benchmarks for fund managers. Particularly noteworthy in this respect are the MSCI World, STOXX ® Europe 600, and the FTSE World Europe indices. Henkel’s inclusion in the Dow Jones Titans 30 Personal & Household Goods Index makes it one of the most important corporations in the per-sonal and household goods sector worldwide. As a DAX stock, Henkel is one of the 30 most important exchange-listed companies in Germany.
Share data 22
Preferred shares Ordinary shares
Security code no. 604843 604840
ISIN code DE0006048432 DE0006048408
Stock exch. symbol HEN3.ETR HEN.ETR
Number of shares 178,162,875 259,795,875
ADR data 23
Preferred shares Ordinary shares
CUSIP 42550U208 42550U109
ISIN code US42550U2087 US42550U1097
ADR symbol HENOY HENKY
Once again our advances and achievements in sus-tainable management earned recognition from external experts in 2015. Henkel’s standing was con-firmed in a variety of national and international sus-tainability ratings and indices. Henkel has been rep-resented in the ethics index FTSE4Good since 2001, and in the STOXX ® Global ESG Leaders index family since its launch by Deutsche Börse in 2011. Our membership in the Ethibel Pioneer Investment Reg-ister and the sustainability indices Euronext Vigeo World 120, Europe 120, and Eurozone 120 was also confirmed, as was our membership in the MSCI Global Sustainability Index series. As one of only 50 companies worldwide, Henkel was also once again confirmed in 2015 as a member of the Global Challenges Index.
At year-end 2015, the market capitalization of the preferred shares included in the DAX index was 18.4 billion euros. Henkel thus retained its rank of 18th. In terms of trading volume, Henkel ranked 23rd (2014: 21st). Our DAX weighting increased to 2.05 per-cent (2014: 1.65 percent).
Henkel Annual Report 201554 Combined management report

of voting rights are held by members of the Henkel fam-ily share-pooling agreement.
61.02 %
International shareholder structure
Our preferred shares are the significantly more liq-uid class of Henkel stock. Apart from the treasury shares, they are entirely in free float. A large majority are owned by institutional investors whose portfo-lios are usually broadly distributed internationally.
According to notices received by the company, mem-bers of the Henkel family share-pooling agreement owned a majority of the ordinary shares amounting to 61.02 percent as of December 17, 2015. We have received no other notices indicating that a share-holder holds more than 3 percent of the voting rights (notifiable ownership). As of December 31, 2015, trea-sury stock amounted to 3.7 million shares.
Investing in Henkel shares through participation in our share program has proven to be very beneficial for our employees in the past. Employees who invested 100 euros each month in Henkel shares since the pro-gram was first launched, and waived interim payouts, held portfolios valued at 81,753 euros at the end of 2015. This represents an increase in value of around 387 percent or an average yield of around 12.0 percent per year.
Henkel bonds
Henkel was represented in the international bond markets by one hybrid bond with a total nominal vol-ume of 1.3 billion euros. On October 16, 2015, Henkel called the bond certificates for repayment at their nominal value plus accrued interest. The repayment took place on November 25, 2015.
Further information can be found on the website:
www.henkel.com/creditor-relationsFrance 6 %
Rest of world 11 %
Shareholder structure: institutional investors holding Henkel shares 24
USA 29 %
At November 30, 2015 Source: Nasdaq.
Rest of Europe 18 %
Germany 12 %
UK 24 %
Employee share program
Since 2001, Henkel has offered an employee share program (ESP). For each euro invested in 2015 by an employee (limited to 4 percent of salary up to a max-imum of 4,992 euros per year), Henkel added 33 euro-cents. Around 11,300 employees in 56 countries pur-chased Henkel preferred shares under this program in 2015. At year-end, some 14,500 employees held a total of around 2.7 million shares, representing approximately 1.5 percent of total preferred shares outstanding. The lock-up period for newly acquired ESP shares is three years.
55Combined management reportHenkel Annual Report 2015
31 Corporate governance52 Shares and bonds57 Fundamental principles
of the Group65 Economic report
102 Henkel AG & Co. KGaA (condensed version according to the German Commercial Code [HGB])
106 Subsequent events
106 Risks and opportunities report114 Forecast
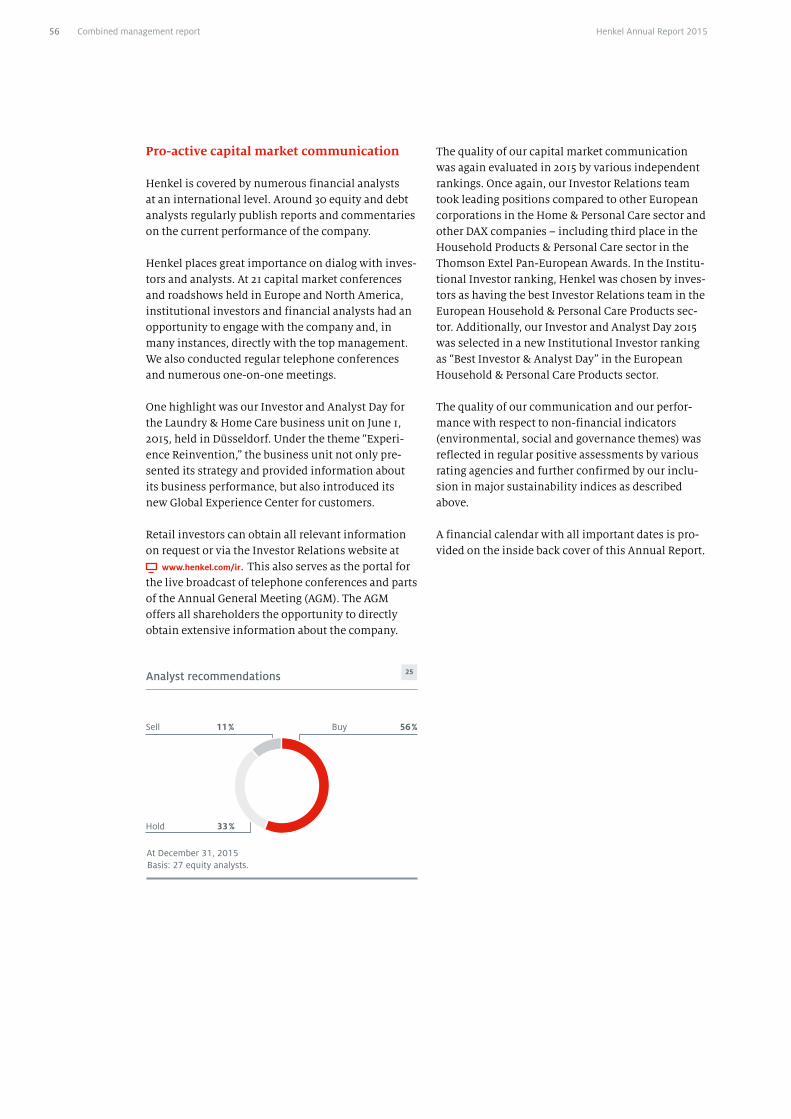
Pro-active capital market communication
Henkel is covered by numerous financial analysts at an international level. Around 30 equity and debt analysts regularly publish reports and commentaries on the current performance of the company.
Henkel places great importance on dialog with inves-tors and analysts. At 21 capital market conferences and roadshows held in Europe and North America, institutional investors and financial analysts had an opportunity to engage with the company and, in many instances, directly with the top management. We also conducted regular telephone conferences and numerous one-on-one meetings.
One highlight was our Investor and Analyst Day for the Laundry & Home Care business unit on June 1, 2015, held in Düsseldorf. Under the theme “Experi-ence Reinvention,” the business unit not only pre-sented its strategy and provided information about its business performance, but also introduced its new Global Experience Center for customers.
Retail investors can obtain all relevant information on request or via the Investor Relations website at
www.henkel.com/ir. This also serves as the portal for the live broadcast of telephone conferences and parts of the Annual General Meeting (AGM). The AGM offers all shareholders the opportunity to directly obtain extensive information about the company.
The quality of our capital market communication was again evaluated in 2015 by various independent rankings. Once again, our Investor Relations team took leading positions compared to other European corporations in the Home & Personal Care sector and other DAX companies – including third place in the Household Products & Personal Care sector in the Thomson Extel Pan-European Awards. In the Institu-tional Investor ranking, Henkel was chosen by inves-tors as having the best Investor Relations team in the European Household & Personal Care Products sec-tor. Additionally, our Investor and Analyst Day 2015 was selected in a new Institutional Investor ranking as “Best Investor & Analyst Day” in the European Household & Personal Care Products sector.
The quality of our communication and our perfor-mance with respect to non-financial indicators (environmental, social and governance themes) was reflected in regular positive assessments by various rating agencies and further confirmed by our inclu-sion in major sustainability indices as described above.
A financial calendar with all important dates is pro-vided on the inside back cover of this Annual Report.
Sell 11 %
Analyst recommendations 25
At December 31, 2015 Basis: 27 equity analysts.
Buy 56 %
Hold 33 %
Henkel Annual Report 201556 Combined management report

Fundamental principles of the Group
Operational activities
Overview Henkel was founded in 1876. Therefore, the year under review marks the 139th in our corporate his-tory. Today, Henkel employs around 49,450 people worldwide, and we occupy globally leading market positions in our consumer and industrial busi-nesses.
Organization and business unitsHenkel AG & Co. KGaA is operationally active as well as being the parent company of the Henkel Group. It is responsible for defining and pursuing Henkel’s corporate objectives and also for the management, control and monitoring of Group-wide activities, including risk management and the allocation of resources. Henkel AG & Co. KGaA performs its tasks within the legal scope afforded to it as part of the Henkel Group, with the affiliated companies other-wise operating as legally independent entities.
Operational management and control is the respon-sibility of the Management Board of Henkel Manage-ment AG in its function as sole Personally Liable Partner. The Management Board is supported in this by the corporate functions.
Henkel is organized into three business units:• Laundry & Home Care• Beauty Care • Adhesive Technologies
Our product range in the Laundry & Home Care busi-ness unit comprises heavy-duty detergents, specialty detergents and cleaning products. The portfolio of the Beauty Care business unit encompasses hair cosmetics, products for body, skin and oral care, and products for the hair salon business. The Adhesive Technologies business unit provides customer-specific solutions worldwide with adhesives, sealants and functional coatings in two business areas: Industry, and Consum-ers, Craftsmen and Building.
Laundry & Home Care, Beauty Care, and Adhesive Technologies are managed on the basis of globally responsible strategic business units. These are sup-ported by the corporate functions of Henkel AG & Co. KGaA, our shared services, and our globally inte-grated supply chain organization in order to ensure optimum utilization of corporate network synergies. Implementation of the strategies at a country and regional level is the responsibility of the national affiliated companies whose operations are supported and coordinated by regional centers. The executive bodies of these national affiliates manage their busi-nesses in line with the relevant statutory regulations, supplemented by their own articles of association, internal procedural rules and the principles incorpo-rated in our globally applicable management stan-dards, codes and guidelines.
Henkel around the world: regional centers 26
Scottsdale, Arizona, USA
regional center
Rocky Hill, Connecticut, USA regional center
São Paulo, Brazilregional center
Dubai, United Arab Emirates regional center
Shanghai, China regional center
Vienna, Austriaregional center
Düsseldorf, Germany global headquarters
Mexico City, Mexico regional center
Year of foundation.
1876
57Combined management reportHenkel Annual Report 2015
31 Corporate governance52 Shares and bonds57 Fundamental principles
of the Group65 Economic report
102 Henkel AG & Co. KGaA (condensed version according to the German Commercial Code [HGB])
106 Subsequent events
106 Risks and opportunities report114 Forecast

Strategy and financial targets 2016
In November 2012, we presented our Strategy 2016 based on thorough analysis of the long-term mega-trends that are relevant for Henkel, and of Henkel’s individual business units. As a result, we see consid-erable potential both for further organic growth and for enhanced profitability in all three business units.
Three megatrends played a key role in the definition of our financial targets:1. We expect progressive consolidation among our
competitors, customers and suppliers. Scale will become an increasingly important factor in our ability to compete over the long term. As such, increasing our sales is essential to allow us to con-tinue to operate successfully in our markets in the future.
2. The shift of economic growth to the emerging markets of Eastern Europe, Africa/Middle East, Latin America and Asia (excluding Japan) will con-tinue. This will require Henkel to steadily expand its position in these important markets and fur-ther increase sales in emerging markets.
3. The speed and volatility of our markets will remain high and may even increase further. This requires processes and structures that are more flexible and more efficient, to enable us to respond to changes faster than our competitors. We therefore want to continuously improve our operational excellence and deliver outstanding financial performance.
This is why• absolute sales of the corporation as a whole,• sales in emerging markets, and• growth in earnings per preferred share (EPS) form the cornerstones of our financial targets through to 2016.
Financial targets 2016By the end of 2016, we aim to generate net sales of 20 billion euros in order to further strengthen our position in the competitive global market environ-ment. The setting of our target reflects the growing importance of emerging markets. We aim to con-tinue achieving above-average growth in these mar-kets and to generate net sales of 10 billion euros there by the end of 2016.
We intend to continue our outstanding financial per-formance through a balanced combination of growth and increasing profitability. Consequently, we aim to increase adjusted earnings per preferred share by an average of 10 percent per year (CAGR: compound annual growth rate) between 2013 and 2016.
The definition of our financial targets up to the end of 2016 assumes not only that we will constantly adapt our structures to market conditions, but also that we will strive to continuously optimize our portfolio. This will encompass both smaller and mid-sized acquisi-tions as well as divestments or the discontinuation of non-strategic activities (representing total sales of around 500 million euros in the period between 2013 and 2016). Potential major acquisitions or divestments are not accounted for in the financial targets.
We have defined clear selection criteria for possible acquisitions to make sure they fit our strategy, both in terms of financial attractiveness and implementabil-ity. The focus in Laundry & Home Care and Beauty Care will center on strengthening our categories in the respective regions, while the focus in Adhesive Technologies will primarily be on advancing technol-ogy leadership.
Progress in fiscal 2015:• Sales increased in 2015 by 10.1 percent to 18,089 mil-
lion euros. This positive sales performance was comprised of solid organic growth of 3.0 percent, positive foreign exchange effects of 4.4 percent, and acquisitions that contributed 2.7 percent.
• Sales in our emerging markets matched the strong performance of previous years, with organic growth coming in at 5.9 percent. Nominal sales amounted to 7,797 million euros.
• In a difficult environment, we increased adjusted earnings per preferred share by 11.4 percent in 2015 compared to the level of 2014.
• We also effectively strengthened our position in all three business units through acquisitions.
Financial targets 2016
20 bn € sales
10 bn € sales in emerging markets
10 % annual growth in earnings per share 1
1 Average annual growth in adjusted earnings per preferred share (compound annual growth rate / CAGR).
Including continuous portfolio optimization.
27
Henkel Annual Report 201558 Combined management report

A global leaderin brands
and technologies
Outperform GlobalizeFocus on regions with
high potentialLeverage potentialin categories
InspireSimplifyDrive operationalexcellence
Strengthen ourglobal team
Strategic priorities in summary
Outperform: leverage potential in categoriesIn order to outperform our competitors in our indi-vidual business units, we will leverage the growth potential in our product categories even more. In our core categories, we will make investments that fur-ther strengthen and expand our leading positions. In our growth categories, we will also make targeted investments, including the development of new seg-ments. In our value categories, we will tap existing earnings potential by making suitable investments while at the same time actively adjusting our portfo-lio. Between 2013 and 2016, we expect to discontinue or divest businesses and operations representing total sales of 500 million euros.
In addition to this active portfolio management, we intend to leverage the potential of our categories by concentrating on three key areas: strengthening our top brands, innovations, and focusing on customers and consumers. By 2016, we intend to have increased the share of sales attributable to our top 10 brands to around 60 percent. A substantial portion of this will come from our rigorous customer orientation and particular focus on innovations.
We are also planning to open and/or significantly expand seven research and development sites in emerging markets around the world in order to underpin our claim to innovation leadership while benefiting from the proximity to our customers and consumers in these strategically important markets.
Progress in fiscal 2015:• In 2015, we were able to further raise the share of
sales attributable to our top 10 brands by 2 percent-age points to 61 percent. We therefore achieved our goal of around 60 percent for year-end 2016 one year ahead of time.
• Numerous innovations strengthened our business performance: In 2015, the research and develop-ment centers we opened in the emerging markets in recent years again acted as hubs for innovations targeted specifically at regional customers’ needs. For examples, please refer to the “Research and development” section on pages 83 to 87.
• We opened the Global Experience Center in Düs-seldorf for the Laundry & Home Care business unit in 2015, creating a new platform through which we can further enhance collaboration with interna-tional customers. In the Beauty Care business unit, the Beauty Care Lighthouse was once again a cen-tral point of contact for our customers worldwide.
Acquisitions completed in fiscal 2015 28
Key brands
Key coun-tries
Contract signed on
Completion on
Annual sales in million euros
Purchase price in million euros
For further informa-tion, see pages
Hairstyling brand in Latin America
Xtreme Mexico 7/15/2014 7/16/2015 ~ 40 55 71, 95, 126 – 127, 161
Novamelt, pressure-sensitive hotmelt adhesives
Germany 4/14/2015 6/1/2015 ~ 50 48 71, 100 – 101, 126 – 127
Laundry detergent and pre-wash brands in Australia and New Zealand
Cold Power, Dynamo, Fab, Sard
Australia, New Zealand
5/11/2015 12/1/2015 ~ 100 194 18, 71, 91, 126 – 127, 161
Magna-Tech, vacuum impregnation
USA 12/14/2015 12/14/2015 ~ 15 32 71, 100 – 101, 126 – 127
of sales generated by top 10 brands.
61 %
59Combined management reportHenkel Annual Report 2015
31 Corporate governance52 Shares and bonds57 Fundamental principles
of the Group65 Economic report
102 Henkel AG & Co. KGaA (condensed version according to the German Commercial Code [HGB])
106 Subsequent events
106 Risks and opportunities report114 Forecast

• In 2015, we opened an additional training center for the Adhesive Technologies business unit in Mumbai, India, where we offer customers both theoretical and practical training in the area of adhesives for flexible packaging.
Globalize: focus on regions with high potentialWe will continue the successful globalization of our company in previous years and concentrate on regions and countries offering particularly high growth poten-tial. In addition to further expanding our strong posi-tions in mature markets, we specifically want to focus on further expanding our existing positions in emerg-ing markets and on accelerating growth. We also plan to enter new markets on a selective basis.
By the end of 2016, we aim to have increased sales in emerging markets to 10 billion euros. We expect 12 countries from the emerging markets to rank among our top 20 countries with the highest sales by 2016. At the same time, we want to take full advan-tage of our strong positions and potential in mature markets to increase our earning power compared to 2012 and to achieve more top positions.
Progress in fiscal 2015:• The emerging markets again made an above-aver-
age contribution to growth of the Group with strong organic sales expansion of 5.9 percent. Growth momentum came in particular from East-ern Europe, Africa/Middle East and Latin America.
• Acquisitions enabled us to expand our portfolio in both the mature and our emerging markets in 2015, thus considerably strengthening our position in attractive segments.
Simplify: drive operational excellenceWe will continuously improve our operational excel-lence to enable us to respond to the increasing speed and persisting volatility in our markets. To this end, we intend to further standardize our processes, invest in information technology (IT) to make these processes faster and more efficient, improve our cost efficiency and reduce the ratio of administrative costs to total sales. We also plan to further optimize our global presence by continuing to consolidate our production sites through to the end of 2016. In addi-tion, we aim to keep our net working capital relative to sales at the low level already achieved.
Plans for the future also include further optimization of our purchasing processes, and expansion of our shared services. Between 2013 and 2016, we want to reduce the number of global suppliers by around 40 percent, and increase the number of employees working in our shared service centers to more than
3,000. We also plan to establish two more shared ser-vice centers during this period.
Overall, we intend to raise our investments by more than 40 percent to around 2 billion euros between 2013 and 2016. Investments in IT infrastructure will be one key lever for optimizing our processes. These will increase between 2013 and 2016. At the same time, we intend to reduce the complexity of our IT systems and significantly decrease the number of processes.
Progress in fiscal 2015:• In 2015, the number of employees in shared ser-
vice centers grew to more than 3,000. We have therefore reached the intended number of employ-ees one year earlier than planned.
• Net working capital as a percentage of sales was 3.8 percent in 2015, an improvement of 0.4 per-centage points over the previous year.
• We have also integrated our production, logistics and purchasing activities across all business units into one global supply chain organization. This organization is based in Amsterdam and com-menced operations in November 2014. The first phase of the European implementation has been successfully completed, and a branch office was opened in Singapore at the end of 2015.
Inspire: strengthen our global teamFurther strengthening our global team will be a key element in the successful development of Henkel.
We will adopt an even more active approach to com-peting internationally for talented professionals to ensure Henkel’s continued ability to recruit the best possible candidates around the world and promote their development within the corporation. One key driver of this will be the rigorous alignment of short-term and long-term remuneration components to individual performance and overall company perfor-mance. The diversity of our teams is also vital to our economic success.
Progress in fiscal 2015:• We supported the professional and personal devel-
opment of our employees through a variety of pro-grams. The extensive program offered by the Henkel Global Academy was expanded worldwide and supplemented with digital learning platforms.
• We strengthened our initiatives in the emerging markets in particular in order to recruit and effec-tively develop top talent for Henkel.
• We also made significant advances in driving our performance-based culture. Within our globally standardized system of management assessment,
organic sales growth in emerg-ing markets.
5.9 %
Henkel Annual Report 201560 Combined management report

factor
we are increasingly focusing on individual inter-ests and personalized options for career planning and development.
• With the continued digitalization of day-to-day work through digital networking platforms, we have created the essential conditions for efficient global collaboration and a lively exchange among employees.
Sustainability strategy 2030
Our corporate values as the foundationCommitment to leadership in sustainability is one of our core corporate values. Maintaining a balance between economic success, protection of the environ-ment, and social responsibility has been fundamental to our corporate culture for decades. We aim to pio-neer new solutions for sustainable development while continuing to shape our business responsibly and increase our economic success. This ambition encom-passes all of our company’s activities – along the entire value chain.
Achieving more with lessWe are facing immense challenges: The global human footprint is already greater today than the planet’s resources can bear. By the year 2050, the world’s population is expected to grow to nine bil-lion. The simultaneous increase in global economic output will lead to rising consumption and resource needs. The pressure on available resources will thus intensify even further in the coming decades. This is why the idea at the heart of our sustainability strat-egy is to achieve more with less.
We want to create more value – for our customers and consumers, for the communities we operate in, and for our company – while at the same time reduc-ing our environmental footprint. To accomplish this, we need innovations, products and technologies that can enhance quality of life while using less input materials. Building on our decades of experience in sustainable development, we aim to work together with our customers and consumers to develop and implement viable solutions for the future. By doing so, we will be contributing both to sustainable devel-opment and to our company’s economic success.
Our goal for 2030: triple our efficiencyOur long-term goal reflects the global challenges of sustainable development. We will have to signifi-cantly improve our efficiency in order to reconcile people’s desire to live well with the resource limits of the planet and to allow us to build on our economic success.
Therefore, compared to 2010 as the base year, we want to triple the value we create through our busi-ness operations in relation to the environmental footprint of our products and services by 2030. This means we want to be three times more efficient. We call this goal “Factor 3.” One way to achieve it is to tri-ple the value we create while leaving the footprint at the same level. Or we can reduce the environmental footprint to one third of today’s level, and achieve our “Factor 3” improvement in efficiency by deliver-ing the same value.
To reach this goal by 2030, we will have to improve our efficiency by an average of 5 to 6 percent each year. We had therefore set concrete interim targets for our focal areas for the five years from 2011 t0 2015 that we were able to meet and exceed by year-end 2015 (see chart on the next page).
We are continuing our efforts to further improve our performance in these areas in the coming years as we move toward our long-term goal of “Factor 3.” To this end, we have defined the following new medium-term targets (again, see chart on the next page). For the period up to 2020, we intend to improve the rela-tionship between the value we create and our envi-ronmental footprint by 75 percent overall.
In order to achieve our aim of driving sustainability along the entire value chain, we engaged in a com-prehensive process to assess our environmental footprint, identify opportunities for improvement, and define key action areas for the coming years. These include working with our partners to improve social standards in our supply chain and helping our customers and consumers reduce energy use and carbon dioxide emissions with our products and expertise.
Our ambition is to become three times more efficient by 2030. We call this “Factor 3.” This means tripling the value we create through our business operations in relation to the environmental footprint of our products and services.
61Combined management reportHenkel Annual Report 2015
31 Corporate governance52 Shares and bonds57 Fundamental principles
of the Group65 Economic report
102 Henkel AG & Co. KGaA (condensed version according to the German Commercial Code [HGB])
106 Subsequent events
106 Risks and opportunities report114 Forecast

Our contributions in six focal areasTo successfully implement our strategy, we are con-centrating on six focal areas that reflect the key chal-lenges of sustainable development as they relate to our operations. In each of these focal areas, we drive prog-ress along the entire value chain through our prod-ucts and processes in two dimensions: “more value” and “reduced footprint.” Three focal areas therefore represent the value we want to deliver to our custom-ers, shareholders and our company, for example in the form of enhanced occupational health and safety, and contributions to social progress. The three other focal areas describe the ways in which we want to reduce our environmental footprint, for instance through reduced water and energy use and less waste.
Our approach for sustainable business processesIn order to successfully establish our strategy and reach our goals, we rely on our products, our coop-eration with our partners, and the involvement of our employees.
Our products deliver more value for our customers and consumers. We achieve this through innovation and information, and through products that offer bet-ter performance with a smaller environmental foot-print, thus reducing resource use and negative envi-ronmental impacts.
Our partners are key to driving sustainability along our value chains and in all areas of business and daily life. We support them with our products and expertise. And we work together with selected suppliers so that they can supply us with raw materials offering an improved environmental footprint. At the other end of the chain, we help our customers and consumers reduce their own environmental footprint.
Our people make the difference – through their dedi-cation, skills and knowledge. They make their own contributions to sustainable development, both in their daily business lives and as members of society. They interface with our customers and make innova-tion possible, develop successful strategies and give our company its unique identity.
We concentrate our activities along the value chain on six focal areas. They reflect the challenges of sustainable development of relevance to us.Efficiency is the product of performance relative to footprint.
Our focal areas and targets 29
2015 targets Achieved 2020 targets
more net sales per ton of product
+ 10 %
+ 30 % + 38 % + 75 %
+ 11 % + 22 %
safer per million hours worked
+ 20 % + 33 % + 40 %
less water per ton of product
– 15 % – 23 % – 30 %
less waste per ton of product
– 15 % – 17 % – 30 %
less energy / CO2 emissions per ton of product
– 15 % – 18 % – 30 %
overall efficiency
Materials andWaste
Wat
er a
ndW
aste
wat
er
HealthSafety and
Performance
Soci
al P
rogr
es
s
Energy and
Climate
at a reduced footprint
Deliver more value
factor
Henkel Annual Report 201562 Combined management report

38 %
Detailed information and background reading on the sub-ject of sustainability can be found in our Sustainability Report – available in both print and online versions
www.henkel.com/ sustainabilityreport
more efficient than in 2010: We are creating more value while at the same time reducing our environmental footprint.
OrganizationThe Management Board bears overall responsibility for our sustainability strategy and objectives, and their implementation in the corporation. Henkel’s Sustainability Council steers our global sustainabil-ity activities in collaboration with the individual business units and functions, and our regional and national affiliated companies.
Our understanding of responsible behavior has been specified and communicated to our employees worldwide in our Code of Conduct and Code of Cor-porate Sustainability. These codes apply together with our more detailed internal standards governing safety, health and environmental protection that were derived from them, our Henkel Social Stan-dards and our Group purchasing standards. Compli-ance with these rules is regularly monitored throughout the Group by internal audits performed at our production and administrative sites, and increasingly also at our toll manufacturers and logistics centers.
By joining the United Nations Global Compact in July 2003, we also publicly underscored our commitment to respect human rights, fundamental labor stan-dards and environmental protection, and to work against all forms of corruption.
Stakeholder dialogViable solutions for promoting sustainability can only be developed in dialog with all relevant social groups. These include our employees, shareholders, customers, suppliers, civil authorities, politicians, associations, governmental and non-governmental organizations, academia, and the public at large. We view dialog with our stakeholders as an opportunity to identify the requirements of our different markets at an early stage and to define the directions which our activities should take. Our dialog with various stakeholder groups enables us to access new ideas for our company, which flow continuously into our strategy development and reporting.
We use a wide range of communication instruments in order to meet the specific information require-ments of our stakeholders, ranging from our own publications and technical articles to events and direct dialog. More details and background reading on the subject of sustainability can be found in our Sustainability Report. In this we document the high priority sustainability has in our company, while at the same time satisfying the reporting requirements laid down in the United Nations Global Compact.
Progress in fiscal 2015• We have achieved our targets for 2015 in all five
areas, and in some cases we were even able to exceed them. We have increased our overall effi-ciency by 38 percent since 2010. By the end of 2015, we generated 11 percent more in net sales per met-ric ton of product compared to the base year of 2010. We have reduced our energy use per ton of product by 18 percent, our use of water by 23 per-cent, and our waste by 17 percent. And occupa-tional safety has improved by 33 percent.
• In the joint program sponsored by our three busi-ness units “Say yes! to the future,” we combined the approaches by which we convey the added value of our product innovations to our customers – best possible performance combined with responsibil-ity toward people and the environment.
• Since mid-2012, we have trained some 6,200 employees around the world as Sustainability Ambassadors. This program has helped to educate around 63,000 schoolchildren in 43 countries.
• Henkel’s leading role in sustainability has been confirmed once again by various national and international sustainability ratings and indices. Examples of this recognition can be found on page 54.
Further information, reports, background details and the latest news on sustainable development at Henkel can be found on the following website:
www.henkel.com/sustainability
2015 Sustainability Report
63Combined management reportHenkel Annual Report 2015
31 Corporate governance52 Shares and bonds57 Fundamental principles
of the Group65 Economic report
102 Henkel AG & Co. KGaA (condensed version according to the German Commercial Code [HGB])
106 Subsequent events
106 Risks and opportunities report114 Forecast

8.5 %
Group WACC before tax in fiscal 2015.
Management system and performance i ndicators
Henkel manages the company based on the strategy and the financial targets for 2016.
As defined and described in the section “Strategy and financial targets 2016,” our financial targets are as fol-lows: For 2016 we aim to generate net sales of 20 bil-lion euros. We recognize the increasing importance of the emerging markets of Eastern Europe, Africa/Mid-dle East, Latin America and Asia (excluding Japan) by targeting above-average growth in these regions. Here we intend to generate net sales of 10 billion euros in 2016. Furthermore, we aim to increase adjusted 1 earn-ings per preferred share by an average of 10 percent per year through to 2016. The financial targets for 2016 are our most important performance indicators.
For efficient management of the Group, we have transferred the Henkel Group strategy into strategic plans for the three business units, Laundry & Home Care, Beauty Care, and Adhesive Technologies, as well as for their respective business areas. The financial targets are represented together with the businesses in both the year and the medium-term plans. A regu-lar comparison of these plans with current develop-ments and reporting of expected figures enables focused management of the company based on the described performance indicators.
Our management system is supplemented by addi-tional key financials relevant to the capital market – primarily, adjusted return on sales (EBIT).
Moreover, we report further key performance indica-tors, such as net working capital as a percentage of sales, and the return on capital employed (ROCE).
Cost of capital
The cost of capital is calculated as a weighted average of the cost of equity and debt capital (WACC). In fis-cal 2015, we applied a WACC of 8.5 percent before tax and 6.0 percent after tax. We regularly review our cost of capital in order to reflect changing market conditions. For fiscal 2016, we will be applying a WACC of 8.25 percent before tax and 5.75 percent after tax.
We apply different WACC rates depending on the business unit involved. These are based on business unit-specific beta factors determined from a peer group benchmark. For the reporting year, we ap plied a WACC before tax of 8.5 percent (6.0 percent after tax) for both the Laundry & Home Care and the Beauty Care business units, and of 10.5 percent before tax (7.5 percent after tax) for the Adhesive Technologies business unit. In 2016 we will be apply-ing a WACC of 9.0 percent before tax (6.25 percent after tax) for the Laundry & Home Care and Beauty Care business units. For the Adhesive Technologies business unit, we will be applying a WACC of 10.75 percent before tax (7.5 percent after tax) in 2016.
WACC before tax by business unit 30
2015 2016
Laundry & Home Care 8.5 % 9.0 %
Beauty Care 8.5 % 9.0 %
Adhesive Technologies 10.5 % 10.75 %
Henkel Group 8.5 % 8.25 %
WACC after tax by business unit 31
2015 2016
Laundry & Home Care 6.0 % 6.25 %
Beauty Care 6.0 % 6.25 %
Adhesive Technologies 7.5 % 7.5 %
Henkel Group 6.0 % 5.75 %
1 Adjusted for one-time charges/gains and restructuring charges.
Henkel Annual Report 201564 Combined management report
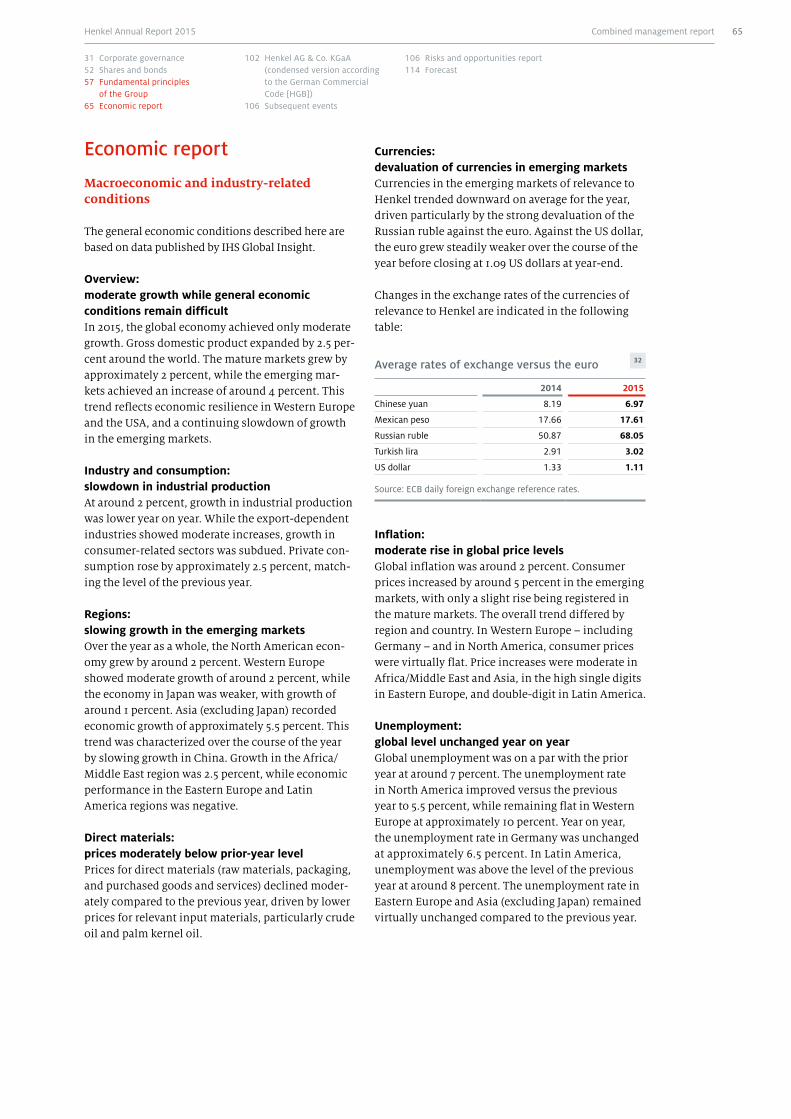
Economic report
Macroeconomic and industry-related co nditions
The general economic conditions described here are based on data published by IHS Global Insight.
Overview: moderate growth while general economic conditions remain difficult In 2015, the global economy achieved only moderate growth. Gross domestic product expanded by 2.5 per-cent around the world. The mature markets grew by approximately 2 percent, while the emerging mar-kets achieved an increase of around 4 percent. This trend reflects economic resilience in Western Europe and the USA, and a continuing slowdown of growth in the emerging markets.
Industry and consumption: slowdown in industrial productionAt around 2 percent, growth in industrial production was lower year on year. While the export-dependent industries showed moderate increases, growth in consumer-related sectors was subdued. Private con-sumption rose by approximately 2.5 percent, match-ing the level of the previous year.
Regions: slowing growth in the emerging marketsOver the year as a whole, the North American econ-omy grew by around 2 percent. Western Europe showed moderate growth of around 2 percent, while the economy in Japan was weaker, with growth of around 1 percent. Asia (excluding Japan) recorded economic growth of approximately 5.5 percent. This trend was characterized over the course of the year by slowing growth in China. Growth in the Africa/Middle East region was 2.5 percent, while economic performance in the Eastern Europe and Latin America regions was negative.
Direct materials: prices moderately below prior-year levelPrices for direct materials (raw materials, packaging, and purchased goods and services) declined moder-ately compared to the previous year, driven by lower prices for relevant input materials, particularly crude oil and palm kernel oil.
Currencies: devaluation of currencies in emerging marketsCurrencies in the emerging markets of relevance to Henkel trended downward on average for the year, driven particularly by the strong devaluation of the Russian ruble against the euro. Against the US dollar, the euro grew steadily weaker over the course of the year before closing at 1.09 US dollars at year-end.
Changes in the exchange rates of the currencies of relevance to Henkel are indicated in the following table:
Average rates of exchange versus the euro 32
2014 2015
Chinese yuan 8.19 6.97
Mexican peso 17.66 17.61
Russian ruble 50.87 68.05
Turkish lira 2.91 3.02
US dollar 1.33 1.11
Source: ECB daily foreign exchange reference rates.
Inflation: moderate rise in global price levels Global inflation was around 2 percent. Consumer prices increased by around 5 percent in the emerging markets, with only a slight rise being registered in the mature markets. The overall trend differed by region and country. In Western Europe – including Germany – and in North America, consumer prices were virtually flat. Price increases were moderate in Africa/Middle East and Asia, in the high single digits in Eastern Europe, and double-digit in Latin America.
Unemployment: global level unchanged year on yearGlobal unemployment was on a par with the prior year at around 7 percent. The unemployment rate in North America improved versus the previous year to 5.5 percent, while remaining flat in Western Europe at approximately 10 percent. Year on year, the unemployment rate in Germany was unchanged at approximately 6.5 percent. In Latin America, unemployment was above the level of the previous year at around 8 percent. The unemployment rate in Eastern Europe and Asia (excluding Japan) remained virtually unchanged compared to the previous year.
65Combined management reportHenkel Annual Report 2015
31 Corporate governance52 Shares and bonds57 Fundamental principles
of the Group65 Economic report
102 Henkel AG & Co. KGaA (condensed version according to the German Commercial Code [HGB])
106 Subsequent events
106 Risks and opportunities report114 Forecast

Development by sector:moderate rise in global consumptionPrivate consumer spending grew moderately at a rate of approximately 2.5 percent. Consumer spending in mature markets increased by approximately 2 per-cent year on year. Consumers in North America increased their spending by 3 percent. In Western Europe, consumer spending grew by approximately 2 percent compared to the previous year. At approxi-mately 2.5 percent, the increase in consumer spend-ing in the emerging markets was lower than in the previous year.
Industry weaker year on yearIndustrial production expanded by around 2 percent in 2015, below the rate of the previous year.
A particularly important customer sector for Henkel, the transport industry, saw production expand by 2 percent. Output in the electronics sector rose by approximately 3.5 percent and in the metal industry by 1.5 percent. Growth was subdued in consumer-related sectors, such as the global packaging industry, which recorded an increase of approximately 1 percent.
Growth in production in the construction industry, at approximately 3 percent, matched the level of the previous year.
Developments in industrial production differed from one region to the next. Manufacturing expanded in North America by around 2 percent and in Western Europe by approximately 1 percent. At approximately 3.5 percent, growth in industrial production in the emerging markets was lower than in the previous year. Industrial production increased by 2 percent in Africa/Middle East and by approximately 5 percent in Asia (excluding Japan), while continuing to decline in Latin America. In Eastern Europe, industrial growth slowed to approximately 1 percent.
Henkel’s business development was impacted by the prevailing global macroeconomic conditions as described above. The economic environment was particularly affected by slowing growth in China, political and social unrest in Africa/Middle East, and the conflict between Russia and Ukraine. The euro depreciated against the US dollar. Prices for direct materials showed a moderate decline, mainly as the result of low crude oil prices.
Within this environment, Henkel significantly increased its sales to 18,089 million euros. Organically we achieved a sales increase of 3.0 percent. The solid increase in organic sales was particularly driven by the strong performance of our businesses in emerging markets. Here, Henkel was able to increase its organic sales by 5.9 percent. The share of Group sales from emerging markets was 43 percent, slightly below the prior-year level due to currency effects (2014: 44 per-cent). We were able to increase organic sales in the mature markets overall.
We increased adjusted 1 gross margin by 0.8 percent-age points to 48.3 percent. The increase was driven by selective price increases, savings from cost-reduc-tion measures, and improvements in production and supply chain efficiency. Moderately lower prices for direct materials (raw materials, packaging, and pur-chased goods and services) also had a positive effect.
As a result of the increase in gross margin and the continuous adjustment of our structures to our mar-kets and customers, we were able to further improve our profitability compared to prior year. For the first time in a fiscal year, 2015 saw us achieve adjusted return on sales of 16.2 percent (2014: 15.8 percent).
Adjusted earnings per preferred share grew to 4.88 euros, a substantial increase of 11.4 percent over the 2014 figure of 4.38 euros.
We were able to improve net working capital as a percentage of sales by 0.4 percentage points to 3.8 percent.
We generated free cash flow of 1,690 million euros. We closed the year with a net financial position of 335 million euros (2014: –153 million euros).
1 Adjusted for one-time charges/gains and restructuring charges.
Review of overall business performance
The economic environment in 2015 was challenging. Nevertheless, Henkel continued the success of the previous year with a solid performance.
Henkel Annual Report 201566 Combined management report

Results of operations
Sales and profitsSales in fiscal 2015 were significantly higher than in the previous year, at 18,089 million euros. The development of currencies had a positive effect on sales of 4.4 percent. Adjusted for foreign exchange effects, sales grew by 5.7 percent. With growth of 3.0 percent, organic sales, i.e. adjusted for foreign exchange and acquisitions/divestments, showed a solid rate of increase. This was driven by both price and volume.
Sales development 1 33
in percent 2015
Change versus previous year 10.1
Foreign exchange 4.4
Adjusted for foreign exchange 5.7
Acquisitions / divestments 2.7
Organic 3.0
of which price 1.7
of which volume 1.3
1 Calculated on the basis of units of 1,000 euros.
Price and volume effects 35
in percentOrganic
sales growthof which
priceof which
volume
Laundry & Home Care 4.9 2.2 2.7
Beauty Care 2.1 1.5 0.6
Adhesive Technologies 2.4 1.5 0.9
Henkel Group 3.0 1.7 1.3
In a market environment that continues to be highly competitive, we were able to increase sales in the West-ern Europe region by 5.6 percent to 6,045 million euros. Compared to the previous year organic sales decreased slightly, by –0.3 percent. The positive performance in countries such as France and the United Kingdom could not entirely compensate for the decline in Switzerland and the northern European countries. The share of sales from the region decreased to 34 percent.
Due to the significant devaluation of the Russian ruble and other currencies in the region, sales in Eastern Europe declined year on year to 2,695 million euros. Organically, however, we were able to increase sales by 7.3 percent. This very strong organic sales growth was primarily driven by the performance of our businesses in Russia and Turkey. The share of sales from the region declined to 15 percent.
Despite the political and social unrest in some countries, our sales in the Africa/Middle East region increased nom-inally by 17.3 percent to 1,329 million euros. Organically we were able to grow sales by a strong 6.8 percent. All of our business units made an important contribution to this performance. The share of sales from the region remained stable at 7 percent.
Sales in the North America region increased substantially by 26.5 percent to 3,648 million euros. Positive foreign exchange effects and our acquisitions in 2014 contrib-uted to the increase. Organically the region posted solid sales growth of 2.3 percent. The share of sales from the region increased to 20 percent.
Sales in the Latin America region rose by 7.9 percent ver-sus prior year, to 1,110 million euros, with organic sales growth of 8.8 percent. Double-digit organic sales growth by our businesses in Mexico made an especially impor-tant contribution to this performance. The share of sales from the region remained unchanged at 6 percent.
2011
2012
2013
2014
2015
5,000 10,000 15,000 20,0000
16,510
16,355
16,428
18,089
Sales in million euros
34
15,605
We achieved a solid increase in organic sales in each of our business units, further expanding share in our rel-evant markets. The Laundry & Home Care business unit recorded organic sales growth of 4.9 percent. Sales in the Beauty Care business unit grew organically by 2.1 percent and Adhesive Technologies achieved organic sales growth of 2.4 percent.
+3.0 %
organic sales growth.
67Combined management reportHenkel Annual Report 2015
31 Corporate governance52 Shares and bonds57 Fundamental principles
of the Group65 Economic report
102 Henkel AG & Co. KGaA (condensed version according to the German Commercial Code [HGB])
106 Subsequent events
106 Risks and opportunities report114 Forecast
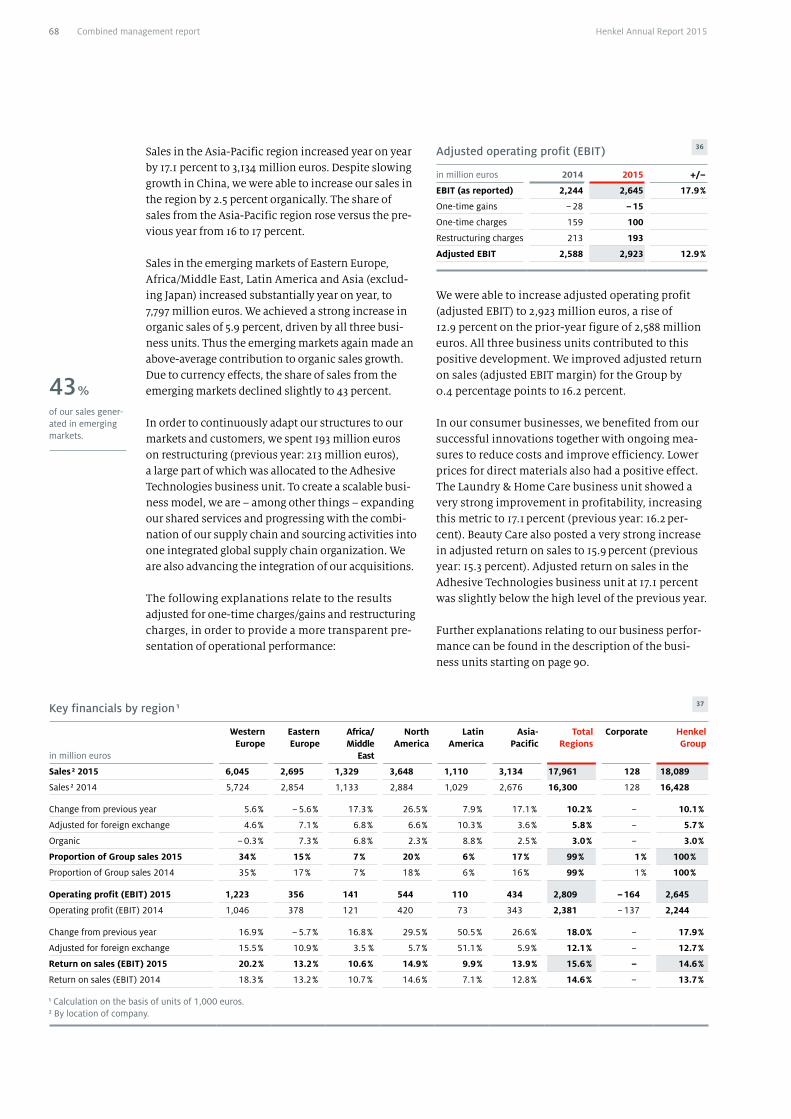
43 %
of our sales gener-ated in emerging markets.
Sales in the Asia-Pacific region increased year on year by 17.1 percent to 3,134 million euros. Despite slowing growth in China, we were able to increase our sales in the region by 2.5 percent organically. The share of sales from the Asia-Pacific region rose versus the pre-vious year from 16 to 17 percent.
Sales in the emerging markets of Eastern Europe, Africa/Middle East, Latin America and Asia (exclud-ing Japan) increased substantially year on year, to 7,797 million euros. We achieved a strong increase in organic sales of 5.9 percent, driven by all three busi-ness units. Thus the emerging markets again made an above-average contribution to organic sales growth. Due to currency effects, the share of sales from the emerging markets declined slightly to 43 percent.
In order to continuously adapt our structures to our markets and customers, we spent 193 million euros on restructuring (previous year: 213 million euros), a large part of which was allocated to the Adhesive Technologies business unit. To create a scalable busi-ness model, we are – among other things – expanding our shared services and progressing with the combi-nation of our supply chain and sourcing activities into one integrated global supply chain organization. We are also advancing the integration of our acquisitions.
The following explanations relate to the results adjusted for one-time charges/gains and restructuring charges, in order to provide a more transparent pre-sentation of operational performance:
Adjusted operating profit (EBIT) 36
in million euros 2014 2015 +/–
EBIT (as reported) 2,244 2,645 17.9 %
One-time gains – 28 – 15
One-time charges 159 100
Restructuring charges 213 193
Adjusted EBIT 2,588 2,923 12.9 %
We were able to increase adjusted operating profit (adjusted EBIT) to 2,923 million euros, a rise of 12.9 percent on the prior-year figure of 2,588 million euros. All three business units contributed to this positive development. We improved adjusted return on sales (adjusted EBIT margin) for the Group by 0.4 percentage points to 16.2 percent.
In our consumer businesses, we benefited from our successful innovations together with ongoing mea-sures to reduce costs and improve efficiency. Lower prices for direct materials also had a positive effect. The Laundry & Home Care business unit showed a very strong improvement in profitability, increasing this metric to 17.1 percent (previous year: 16.2 per-cent). Beauty Care also posted a very strong increase in adjusted return on sales to 15.9 percent (previous year: 15.3 percent). Adjusted return on sales in the Adhesive Technologies business unit at 17.1 percent was slightly below the high level of the previous year.
Further explanations relating to our business perfor-mance can be found in the description of the busi-ness units starting on page 90.
Key financials by region 1 37
in million euros
Western Europe
Eastern Europe
Africa/ Middle
East
North America
Latin America
Asia- Pacific
Total Regions
Corporate Henkel Group
Sales 2 2015 6,045 2,695 1,329 3,648 1,110 3,134 17,961 128 18,089
Sales 2 2014 5,724 2,854 1,133 2,884 1,029 2,676 16,300 128 16,428
Change from previous year 5.6 % – 5.6 % 17.3 % 26.5 % 7.9 % 17.1 % 10.2 % – 10.1 %
Adjusted for foreign exchange 4.6 % 7.1 % 6.8 % 6.6 % 10.3 % 3.6 % 5.8 % – 5.7 %
Organic – 0.3 % 7.3 % 6.8 % 2.3 % 8.8 % 2.5 % 3.0 % – 3.0 %
Proportion of Group sales 2015 34 % 15 % 7 % 20 % 6 % 17 % 99 % 1 % 100 %
Proportion of Group sales 2014 35 % 17 % 7 % 18 % 6 % 16 % 99 % 1 % 100 %
Operating profit (EBIT) 2015 1,223 356 141 544 110 434 2,809 – 164 2,645
Operating profit (EBIT) 2014 1,046 378 121 420 73 343 2,381 – 137 2,244
Change from previous year 16.9 % – 5.7 % 16.8 % 29.5 % 50.5 % 26.6 % 18.0 % – 17.9 %
Adjusted for foreign exchange 15.5 % 10.9 % 3.5 % 5.7 % 51.1 % 5.9 % 12.1 % – 12.7 %
Return on sales (EBIT) 2015 20.2 % 13.2 % 10.6 % 14.9 % 9.9 % 13.9 % 15.6 % – 14.6 %
Return on sales (EBIT) 2014 18.3 % 13.2 % 10.7 % 14.6 % 7.1 % 12.8 % 14.6 % – 13.7 %
1 Calculation on the basis of units of 1,000 euros.2 By location of company.
Henkel Annual Report 201568 Combined management report

Comparison between actual business performance and guidance In November 2015, we updated our guidance for fis-cal 2015, indicating that we expected to achieve organic sales growth of approximately 3 percent, fol-lowing our original forecast of 3 to 5 percent. In the Laundry & Home Care business unit, we anticipated organic sales growth of between 4 and 5 percent, and organic growth of approximately 2 percent in the Beauty Care business unit. We expected that organic sales growth in the Adhesive Technologies business unit would be between 2 and 3 percent, mainly influ-enced by slowing growth in China. The update of our sales guidance for the Adhesive Technologies business unit resulted in the adjustment of our sales guidance for the Henkel Group as a whole. We fur-thermore expected stable development in the share of sales from our emerging markets. We expected adjusted return on sales (EBIT) to increase versus 2014 to approximately 16 percent and an increase in adjusted earnings per preferred share of over 10 percent.
With organic growth of 3.0 percent we achieved our sales growth guidance of approximately 3 percent.
Guidance versus performance 2015 38
Guidance for 2015 Updated guidance for 2015 * Performance in 2015
Organic sales growth Henkel Group: 3–5 percent
Laundry & Home Care: 3–5 percent Beauty Care: approximately 2 percent Adhesive Technologies: 3–5 percent
Henkel Group: approximately 3 percent
Laundry & Home Care: 4–5 percent Beauty Care: approximately 2 percent Adhesive Technologies: 2–3 percent
Henkel Group: 3.0 percent
Laundry & Home Care: 4.9 percent Beauty Care: 2.1 percent Adhesive Technologies: 2.4 percent
Percentage of sales from emerging markets At prior-year level At prior-year level Slightly below prior-year level
Adjusted return on sales (EBIT) Increase to around 16 percent Increase to around 16 percent Increase to 16.2 percent
Adjusted earnings per preferred share Increase of around 10 percent Increase of over 10 percent Increase of 11.4 percent
* Updated November 11, 2015.
The business units were also able to generate the expected sales growth. At 43 percent, the share of sales from emerging markets was slightly below the prior-year level and the stable development fore-casted in our guidance, the decline being mainly attributable to negative foreign exchange effects. At Group level, we posted a strong increase in adjusted return on sales from 15.8 to 16.2 percent, thus achiev-ing our guidance of approximately 16 percent. We increased adjusted earnings per preferred share by 11.4 percent to 4.88 euros (2014: 4.38 euros) and thus realized the anticipated increase of over 10 percent.
Prices for direct materials (raw materials, packaging, and purchased goods and services) decreased moder-ately compared to the previous year. The decline was therefore slightly stronger than anticipated. Our restructuring expenses totaled 193 million euros, and were thus at the expected level of approximately 200 million euros. In November 2015, we adjusted our guidance for investments in property, plant and equipment and intangible assets to approximately 650 million euros, mainly due to currency effects. The actual capital expenditures of 625 million euros in 2015 were slightly lower than the expected level.
adjusted return on sales (EBIT), up 0.4 percentage points.
16.2 %
69Combined management reportHenkel Annual Report 2015
31 Corporate governance52 Shares and bonds57 Fundamental principles
of the Group65 Economic report
102 Henkel AG & Co. KGaA (condensed version according to the German Commercial Code [HGB])
106 Subsequent events
106 Risks and opportunities report114 Forecast

Expense itemsThe following explanations relate to our operating expenses adjusted for one-time charges/gains and restructuring charges. The reconciliation statement and the allocation of the restructuring charges between the various expense items of the consoli-dated statement of income can be found on page 120.
The cost of sales increased by 8.3 percent to 9,350 mil-lion euros. Gross profit increased by 12.1 percent to 8,739 million euros. We increased gross margin by 0.8 percentage points to 48.3 percent. Selective price increases, savings from cost-reduction measures, and improvements in production and supply chain effi-ciency contributed to this increase. Moderately lower prices for direct materials also had a positive effect.
At 4,521 million euros, marketing, selling and distri-bution expenses were above the prior-year level of 4,103 million euros, due in part to acquisitions and also as a result of foreign exchange effects. At 25.0 percent, the ratio to sales remained unchanged versus fiscal 2014. We spent a total of 464 million euros on research and development, raising the ratio to sales slightly to 2.6 percent. Administrative expenses increased compared to the prior-year period to 878 million euros, mainly due to acquisi-tions and foreign exchange effects. At 4.8 percent, the ratio of administrative expenses to sales was above the level of the previous year.
Other operating income and chargesAt 47 million euros, the balance of adjusted other oper-ating income and charges increased year on year (2014: 36 million euros). The absolute increase resulted mainly from the disposal of assets held for sale.
Financial resultThe financial result improved from –49 million euros to –42 million euros, partly attributable to an improvement in the foreign exchange result.
Reconciliation from sales to adjusted operating profit 1 39
in million euros 2014 % 2015 % Change
Sales 16,428 100.0 18,089 100.0 10.1 %
Cost of sales – 8,630 – 52.5 – 9,350 – 51.7 8.3 %
Gross profit 7,798 47.5 8,739 48.3 12.1 %
Marketing, selling and distribution expenses – 4,103 – 25.0 – 4,521 – 25.0 10.2 %
Research and development expenses – 410 – 2.5 – 464 – 2.6 13.2 %
Administrative expenses – 733 – 4.5 – 878 – 4.8 19.8 %
Other operating income/charges 36 0.3 47 0.3 –
Adjusted operating profit (EBIT) 2,588 15.8 2,923 16.2 12.9 %
1 Calculated on the basis of units of 1,000 euros; figures commercially rounded.
2011
2012
2013
2014
2015
500 1,000 1,500 2,0000
1,526
1,625
1,662
1,968
Net income in million euros
40
1,191
2011
2012
2013
2014
2015
1.0 2.0 3.0 4.0 5.00.0
3.63
4.07
4.38
4.88
Adjusted earnings per preferred share in euros
41
3.14
Henkel Annual Report 201570 Combined management report

Return on capital employed (ROCE)At 18.2 percent, return on capital employed (ROCE) decreased year on year. It was negatively impacted by the capital effect of acquisitions and by foreign exchange effects.
Economic Value Added (EVA®)Economic Value Added (EVA®) increased to 1,410 mil-lion euros.
2011
2012
2013
2014
2015
0.5 1.0 1.50.0
0.95
1.22
1.31
1.47 1
Preferred share dividends in euros
42
0.80
1 Proposal to shareholders for the Annual General Meeting on April 11, 2016.
Net income and earnings per share (EPS)Income before tax increased by 408 million euros to 2,603 million euros. Taxes on income amounted to 635 million euros. The tax rate of 24.4 percent was slightly higher than in the previous year (2014: 24.3 percent). The adjusted tax rate increased year on year by 1.0 percentage points to 25.0 percent. Net income increased by 18.4 percent from 1,662 million euros to 1,968 million euros. After consideration of 47 million euros attributable to non-controlling interests, net income attributable to shareholders of Henkel AG & Co. KGaA amounted to 1,921 million euros, 18.0 percent higher than the prior-year figure (2014: 1,628 million euros). Adjusted net income after deducting non-controlling interests was 2,112 million euros compared to 1,896 million euros in fiscal 2014. A condensed version of the annual financial statements of the parent company of the Henkel Group – Henkel AG & Co. KGaA – can be found on pages 102 to 105.
Earnings per preferred share (EPS) rose from 3.76 euros to 4.44 euros. Earnings per ordinary share increased from 3.74 euros to 4.42 euros. Adjusted earnings per preferred share rose by 11.4 percent to 4.88 euros (previous year: 4.38 euros).
DividendsAccording to our dividend policy, dividend payouts of Henkel AG & Co. KGaA shall, depending on the company’s asset and profit positions as well as its financial requirements, amount to 25 percent to 35 percent of net income after non-controlling inter-ests and adjusted for exceptional items. Accordingly, we will propose to the Annual General Meeting an increased dividend compared to the previous year: 1.47 euros per preferred share and 1.45 euros per ordinary share. The payout ratio would then be 30.2 percent.
€1,968 m
net income.
increase in adjusted earnings per preferred share.
+ 11.4 %
25 – 35 %
future dividend payout ratio.
Net assets and financial position
Acquisitions and divestments Effective May 11, 2015, we entered into an agreement with Colgate-Palmolive Company for the purchase of all the laundry detergent and pre-wash brands owned by the company in Australia and New Zea-land. The associated full consolidation commenced on December 1, 2015. This acquisition is part of our global strategy to invest in attractive country cate-gory positions in mature markets.
Effective June 1, 2015, we completed the acquisition of all shares of Novamelt GmbH, Wehr, Germany, expanding our business in pressure-sensitive hot-melt adhesives in the Adhesive Technologies busi-ness unit.
Effective July 16, 2015, we concluded the acquisition of the hairstyling business and the associated brands of Industrias Wet Line S.A. de C.V. in Latin America. The acquisition is part of our strategy to further strengthen our presence in emerging markets.
Effective December 14, 2015, we completed the acquisition of all shares of Magna-Tech Manufactur-ing LLC, Ohio, USA, and MT Canada LLC, Ohio, USA, expanding our vacuum impregnation business in the Adhesive Technologies business unit.
Effective January 30, 2015, we concluded the sale of our chemical additives business for the processing industry in the Adhesive Technologies business unit in the USA.
On May 29, 2015, we invested 19 million euros to acquire the outstanding non-controlling shares of Henkel (Jiangsu) Auto Parts Co. Ltd., Danyang, China, thus increasing our ownership interest to 100 percent.
On June 18, 2015, we invested 26 million euros to acquire the outstanding non-controlling shares of Henkel Chembond Surface Technologies Ltd., Navi Mumbai, India, thus increasing our ownership inter-est to virtually 100 percent.
71Combined management reportHenkel Annual Report 2015
31 Corporate governance52 Shares and bonds57 Fundamental principles
of the Group65 Economic report
102 Henkel AG & Co. KGaA (condensed version according to the German Commercial Code [HGB])
106 Subsequent events
106 Risks and opportunities report114 Forecast

€625 minvestments in property, plant and equipment and intangible assets.
Additional disclosures relating to the acquisitions and divestments can be found on pages 126 and 127 of the notes to the consolidated financial statements.
Neither the acquisitions and divestments nor other measures undertaken resulted in any changes in our business and organizational structure. For detailed information on our organization and business activi-ties, please refer to the disclosures on page 57.
Our long-term ratings remain at “A flat” (Standard & Poor’s) and “A2” (Moody’s). These are also our target ratings. Looking forward, we intend not to jeopardize these when assessing possible acquisitions.
Capital expenditures Capital expenditures (excluding acquisitions) in fiscal 2015 amounted to 625 million euros. Capital expenditures on property, plant and equipment for existing operations totaled 514 million euros, following 452 million euros in 2014. We invested 111 million euros in intangible assets (previous year: 65 million euros).
The majority of these capital expenditures was attrib-utable to the Adhesive Technologies and Laundry & Home Care business units. Around two-thirds of our total capital expenditures went into expansion projects and rationalization measures. The main focus was on capacity expansion and innovative product lines (Laundry & Home Care and Beauty Care). The focus in the Adhesive Technologies busi-ness unit was on consolidating production sites and expanding production capacities in emerging markets.
The major projects of 2015 were as follows:• Expansion of production capacity for WC rim
blocks in Kruševac, Serbia (Laundry & Home Care)• Expansion of production capacity for liquid prod-
ucts in Perm, Russia, and optimization of the logis-tics structure in Russia (Laundry & Home Care)
• Expansion of production capacity for shampoo, shower and bath products in Wassertrüdingen, Germany (Beauty Care)
• Expansion of production capacity for cosmetic products in Imeni Vorovskogo, Russia (Beauty Care)
• Consolidation of our production footprint and expansion of production capacities in China (Adhesive Technologies)
• Building of a factory to manufacture construction products in Bileća, Bosnia and Herzegovina (Adhesive Technologies)
• Global optimization of the supply chain, consoli-dation and optimization of our IT system architec-ture for managing business processes
In regional terms, capital expenditures focused pri-marily on Western Europe, Eastern Europe and Asia-Pacific.
The acquisitions resulted in additions to intangible assets and property, plant and equipment in the amount of 354 million euros. Details of these addi-tions can be found on pages 133 to 138 of the notes to the consolidated financial statements.
Financial structure in million euros
Assets of which in %
Equity and liabilities of which in %
22,323 20,96122,32320,961
Non-current liabilitiesthereof: Pension obligationsthereof: Borrowings
Current liabilitiesthereof: Borrowings
Non-current assetsthereof: Intangible assets /
property, plant and equipment
18
226
Equity56
67
10
428
62
40
68
62
Current assets thereof: Cash and cash equivalents
32
6
69
64
31
5
2015 201420152014
43
Henkel Annual Report 201572 Combined management report
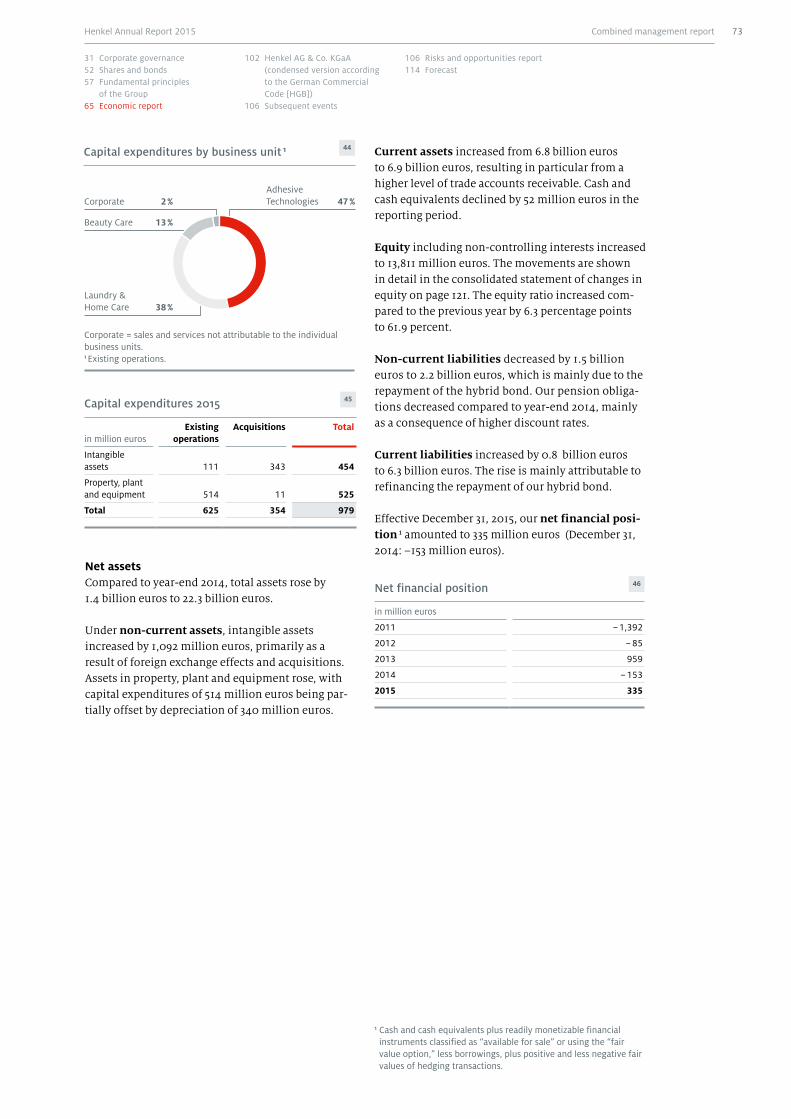
Current assets increased from 6.8 billion euros to 6.9 billion euros, resulting in particular from a higher level of trade accounts receivable. Cash and cash equivalents declined by 52 million euros in the reporting period.
Equity including non-controlling interests increased to 13,811 million euros. The movements are shown in detail in the consolidated statement of changes in equity on page 121. The equity ratio increased com-pared to the previous year by 6.3 percentage points to 61.9 percent.
Non-current liabilities decreased by 1.5 billion euros to 2.2 billion euros, which is mainly due to the repayment of the hybrid bond. Our pension obliga-tions decreased compared to year-end 2014, mainly as a consequence of higher discount rates.
Current liabilities increased by 0.8 billion euros to 6.3 billion euros. The rise is mainly attributable to refinancing the repayment of our hybrid bond.
Effective December 31, 2015, our net financial posi-tion 1 amounted to 335 million euros (December 31, 2014: –153 million euros).
Net financial position 46
in million euros
2011 – 1,392
2012 – 85
2013 959
2014 – 153
2015 335
Capital expenditures 2015 45
in million euros
Existing operations
Acquisitions Total
Intangible assets 111 343 454
Property, plant and equipment 514 11 525
Total 625 354 979
1 Cash and cash equivalents plus readily monetizable financial instruments classified as “available for sale” or using the “fair value option,” less borrowings, plus positive and less negative fair values of hedging transactions.
Corporate = sales and services not attributable to the individual business units.1 Existing operations.
Beauty Care 13 %
Corporate 2 %
Laundry & Home Care 38 %
Adhesive Technologies 47 %
Capital expenditures by business unit 1 44
Net assetsCompared to year-end 2014, total assets rose by 1.4 billion euros to 22.3 billion euros.
Under non-current assets, intangible assets increased by 1,092 million euros, primarily as a result of foreign exchange effects and acquisitions. Assets in property, plant and equipment rose, with capital expenditures of 514 million euros being par-tially offset by depreciation of 340 million euros.
73Combined management reportHenkel Annual Report 2015
31 Corporate governance52 Shares and bonds57 Fundamental principles
of the Group65 Economic report
102 Henkel AG & Co. KGaA (condensed version according to the German Commercial Code [HGB])
106 Subsequent events
106 Risks and opportunities report114 Forecast

1 Inventories plus payments on account, receivables from suppliers and trade accounts receivable, less trade accounts payable, liabili-ties to customers, and current sales provisions.
€ 1,690 mfree cash flow.
Financial positionAt 2,384 million euros, cash flow from operating activities in fiscal 2015 came in above the level of the previous year (1,914 million euros). Higher income tax payments were offset by, in particular, the increase in operating profit. The higher cash flow from operating activities is also reflected in net working capital 1 rela-tive to sales, which improved by 0.4 percentage points to 3.8 percent year on year.
The cash outflow in cash flow from investing activities (–893 million euros) was lower in 2015 than in the previous year (–2,231 million euros) due to lower investments in subsidiaries and other busi-ness units.
The cash flow from financing activities, at –1,555 million euros, was below the comparable figure of the prior-year period (447 million euros). This was mainly attributable to higher cash inflows in the previous year from the partial sale of our securities and time deposits reported under other financing transactions.
Cash and cash equivalents declined compared to December 31, 2014 by 52 million euros to 1,176 mil-lion euros.
At 1,690 million euros, free cash flow was above the level of the previous year (1,333 million euros), mainly due to higher cash flow from operating activities.
Net financial position in million euros
335
At Dec. 31, 2015
– 153
At Dec. 31, 2014
1,690 Free cash
flow
– 597 Dividends
paid
– 60 Allocation to
pension funds
– 374 1 Payments for acquisitions
– 171 2Other
47
Financing and capital managementFinancing of the Group is centrally managed by H enkel AG & Co. KGaA. Funds are, as a general rule, obtained centrally and distributed within the Group. We pursue a conservative and flexible investment and borrowings policy with a balanced investment and financing portfolio. The primary goals of our financial management are to secure the liquidity and creditworthiness of the Group, together with ensur-ing access at all times to the capital market, and to generate a sustainable increase in shareholder value. Measures deployed in order to achieve these aims include optimization of our capital structure, adop-tion of an appropriate dividend policy, equity man-agement, acquisitions, divestments, and debt reduc-tion. Our capital needs and capital procurement activities are coordinated to ensure that require-ments with respect to earnings, liquidity, security and independence are taken into account and prop-erly balanced.
In the reporting period, Henkel paid a higher divi-dend for both ordinary and preferred shares com-pared to the previous year. Cash flows not required for capital expenditures, dividends and interest pay-ments are used for improving our net financial posi-tion, for allocations to pension funds, and for financ-ing acquisitions. We cover our short-term financing requirement primarily through commercial paper. Our multi-currency commercial paper program is additionally secured by a syndicated credit facility.
1 Including purchase of non-controlling interests with no change of control.2 Primarily foreign exchange effects.
Henkel Annual Report 201574 Combined management report

Our financial management is based on the financial ratios defined in our financial strategy (see table of key financial ratios). Due to the international orien-tation of our businesses, a variety of regional statu-tory and regulatory provisions must be adhered to. The current status and amendments to these provi-sions are centrally monitored and any changes are taken into account in our capital management.
Our credit rating is regularly assessed by the rating agencies Standard & Poor’s and Moody’s. As in the previous year, we are rated “A flat”/“A–1” (Standard & Poor’s) and “A2”/“P1” (Moody’s). Hence, both Standard & Poor’s and Moody’s continue to rate Henkel as investment grade, which is the best possible category.
Credit ratings 48
Standard & Poor’s Moody’s
Long-term A flat A2
Outlook Stable Stable
Short-term A–1 P1
At December 31, 2015
As of December 31, 2015, our total borrowings amounted to 884 million euros, consisting mainly of our commercial paper.
Henkel’s financial risk management activities are explained in the risks and opportunities report on pages 106 to 113. Further detailed information on our financial instruments can be found in the financial instruments report on pages 155 to 167 of the notes to the consolidated financial statements.
Key financial ratiosDue to our positive net financial position, operating debt coverage in the reporting period was well above the minimum of 50 percent. Our interest coverage ratio (EBITDA divided by net interest expense) also improved further – supported by higher EBITDA. The further improved equity ratio similarly reflects the high financial strength of the Group.
Key financial ratios 49
2014 2015
Operating debt coverage (net income + amortization and depre-ciation, impairment and write-ups + interest element of pension obliga-tions) / net borrowings and pension obligations 274.8 % 1 375.2 %
Interest coverage ratio (EBITDA / interest result including inter-est element of pension obligations) 48.4 75.7
Equity ratio (equity / total assets) 55.6 % 61.9 %
1 Hybrid bond included on 50-percent debt basis.
75Combined management reportHenkel Annual Report 2015
31 Corporate governance52 Shares and bonds57 Fundamental principles
of the Group65 Economic report
102 Henkel AG & Co. KGaA (condensed version according to the German Commercial Code [HGB])
106 Subsequent events
106 Risks and opportunities report114 Forecast
“ The secret’s in the mix: In my team we all learn from each other!”
Diversity and support
Left: A poster illustrat-ing Henkel’s global campaign for diver-sity and an inclusive company culture. Right: The company and many of its employees are assist-ing with the recep-tion and integration of refugees. Here: Four employees in Düsseldorf prepare product donations for distribution.
Employees
At the end of 2015, Henkel employed around 49,450 people worldwide (annual average: around 49,850). The headcount on December 31, 2015 was lower com-pared to year-end 2014. The expansion of our teams in the shared service centers was offset by synergies arising from the integration of our acquisitions and continuous adjustments in our operating business units. Personnel expenses amounted to 3,047 million euros.
In fiscal 2015, we made further progress in success-fully implementing our human resources strategy globally: • We supported the development of our employees
through a variety of training programs and appren-ticeships. The extensive program offered by the Henkel Global Academy was expanded worldwide and supplemented with digital learning platforms.
• We strengthened our initiatives in the emerging markets in particular in order to recruit and effec-tively develop top talent for Henkel.
• We also made significant advances in driving our performance-based culture. Within our globally standardized system of management assessment,
we are increasingly focusing on individual inter-ests and personalized options for career planning and development.
• With the continued digitalization of day-to-day work through digital networking platforms, we have created the essential conditions for efficient global collaboration and a lively exchange among employees.
• We also continued to provide comprehensive sup-port for the volunteer activities of our employees in 2015 as a key component of our social engage-ment. In addition to their many volunteer efforts, our employees are especially committed to assist-ing refugees in Germany and Europe. A further focus of our social commitment was on support for people in areas of crisis or catastrophe.
Recruiting top talent for HenkelAmong the numerous activities and initiatives we engage in to reinforce our image as an attractive employer, Henkel effectively utilizes digital options for human resource marketing, both in the search for talent and in employee development. Primarily social media channels such as Facebook and LinkedIn make it possible to engage in a continuous exchange with potential applicants in our target group. LinkedIn
Employees by region 50 Employees by organizational unit 51
At December 31, 2015 At December 31, 2015
Western Europe 30 %Adhesive Technologies 54 %
Asia-Pacific 21 %
Latin America 7 % Functions 14 %
Africa/Middle East 9 %
North America 13 %Beauty Care 15 %
Eastern Europe 20 %Laundry & Home Care 17 %
Henkel Annual Report 201576 Combined management report

Employees by activity 52 Employees by age group 53
At December 31, 2015 At December 31, 2015
Production and engineering 52 % 30–39 years 33 %
Research and development 6 % 16–29 years 18 %
50–65 years 21 %
Administration 14 %
Marketing, selling and distribution 28 % 40–49 years 28 %
also enables us to approach candidates directly for specialized vacancies. The number of fans and fol-lowers on our social media channels with a focus on a career with Henkel has increased by more than 20 percent compared to 2014.
Developing employees and providing effective trainingIn 2015 we offered 157 new apprentices in Germany the opportunity to join one of our 27 dual-track study programs or apprenticeships. Currently, more than 500 apprentices and students in total are completing their professional training at Henkel in Germany.
We firmly believe that, aside from traditional learn-ing formats such as seminars, the professional and personal development of all employees takes place primarily in the day-to-day operations of a company. Around 90 percent of knowledge is transmitted through practical experience and direct interaction with supervisors, colleagues and employees.
In order to promote individual employee develop-ment in a manner that meets the current market needs, we consolidate all of our learning opportuni-
Employees 54
(At December 31) 2011 % 2012 % 2013 % 2014 % 2015 %
Western Europe 15,350 32.5 14,600 31.3 14,400 30.7 14,900 30.0 14,900 30.2
Eastern Europe 8,850 18.7 9,150 19.7 9,600 20.5 10,000 20.1 9,800 19.8
Africa/Middle East 5,300 11.3 5,100 11.0 4,800 10.2 4,850 9.7 4,700 9.4
North America 5,250 11.1 5,200 11.1 5,150 11.0 6,200 12.5 6,250 12.7
Latin America 3,700 7.8 3,650 7.8 3,750 8.0 3,650 7.3 3,500 7.1
Asia-Pacific 8,800 18.6 8,900 19.1 9,150 19.6 10,150 20.4 10,300 20.8
Total 47,250 100.0 46,600 100.0 46,850 100.0 49,750 100.0 49,450 100.0
Basis: permanent employees excluding apprentices; figures rounded.
ties into our Henkel Global Academy. Based on their specific needs and development plans, employees can choose general or functionally specific seminars. The extensive range of choices is supplemented globally by over 500 digital learning options and around 500 videos and webinars.
A particular focus of our human resources strategy is the continuous development of our leadership cul-ture. Starting in 2014 and continuing in 2015, a total of 140 top managers have completed our Leadership Forum – a week-long seminar in cooperation with the Harvard Business School in the USA.
We also offer a modular program designed for all of our managers. Important components include instilling and reinforcing our leadership principles as aligned with the employee’s professional situa-tion. The next generation of managers in the emerg-ing markets are thoroughly prepared for the special challenges of their regions in our EXCEED program.
77Combined management reportHenkel Annual Report 2015
31 Corporate governance52 Shares and bonds57 Fundamental principles
of the Group65 Economic report
102 Henkel AG & Co. KGaA (condensed version according to the German Commercial Code [HGB])
106 Subsequent events
106 Risks and opportunities report114 Forecast
A performance-based culture put into practiceWe again conducted our Development Round Table (DRT) in 2015 for some 11,000 managers and excep-tional non-managerial talent, and we improved the internationally standardized process for assessing the performance and potential of these employees. Employees are now asked to formulate their own ideas for career progress so that the next phase can be planned in dialog with their managers. Our aim is to further align the interests of these employees with those of the company.
Valuing diversityAt Henkel, business success is based on a strong global team and diversity among our employees. Diversity and an inclusive company culture are key drivers of creativity and innovation. We promote and utilize diversity within the company, creating an integrated environment based on a holistic approach encom-passing all dimensions – different generations, gen-ders, cultures and experiences.
To this end, our initiatives in 2015 included a world-wide campaign at Henkel to foster a deeper under-standing of “Diversity & Inclusion.” Our goal is to further anchor inclusive conduct in our teams and sharpen awareness of the contributions of each indi-vidual. As part of the Diversity Weeks at Henkel, numerous virtual and local events, activities and initiatives took place at our sites around the world so that differences and diversity could be tangibly experienced.
Henkel has been offering highly flexible work mod-els for years, taking into account the diverse needs of our employees. We promote a work environment based on trust rather than a culture of simple physi-cal presence because we believe this is an important cornerstone for achieving a balance between career and family life, and an advantage in recruiting top talent. We can thus achieve greater success by inte-
grating the pursuit of excellent business results with the fulfillment of personal needs. Increasing digitali-zation enables a high degree of flexibility and expands the possibilities for mobile work. We expect our executives to set an example and support flexible work models at Henkel as part of their management responsibility.
We also promote international careers and experience in intercultural work styles – even at an early stage of professional life. Thus we not only systematically sup-port the professional and personal development of our employees, but also inject new perspectives and new ways of thinking into their collaboration, enhancing the performance and motivation of our global teams.
Career development for female managers is an impor-tant component of the measures we take. Group-wide, we have increased our share of women in manage-ment positions from around 26 percent in 2008 to around 33 percent at the end of 2015.
Acting sustainably and responsibly For Henkel, it is a matter of course that, beyond our business operations, we accept our responsibility toward society around the world. We have organized our corporate citizenship activities into three areas: We support volunteer work by our employees, main-tain strategic partnerships for the common good, and provide aid in emergencies and in response to natural disasters.
Throughout Europe, helping refugees was a key area of focus in 2015. Our commitment concentrated on providing humanitarian aid and supporting those of our employees and retirees who volunteered their assistance in numerous projects.
Overall, we donated more than 8.3 million euros around the world in 2015 to sponsor some 3,400 projects that reached more than 1.5 million people.
of our managers are women.
33 %Around
Henkel Annual Report 201578 Combined management report

Educational initiatives are also a key focus of our social engagement. Education is an essential founda-tion on which to build both the personal develop-ment of each individual and a functioning society. We focus primarily on projects and ideas where we can use our core competences to really make a posi-tive difference. Here again, the personal commitment of our employees and retirees plays a key role.
It is not only in the area of corporate citizenship that the involvement of our employees makes the differ-ence. The successful implementation of our sustain-ability strategy is built on it as well. Therefore, the importance of sustainability is a large part of our internal communications and specifically integrated into our current training and education programs. One example is the success of our Sustainability Ambassadors program. These ambassadors promote the importance of sustainability among colleagues, suppliers, customers and students. By the end of 2015, around 6,200 employees had successfully taken part in this program, including the entire Man-agement Board and all senior management around the world, with our ambassadors also reaching out to around 63,000 elementary school children in 43 countries.
Procurement
We use externally sourced materials (raw materials, packaging and purchased goods) and services to pro-duce our finished products. These items all fall under the general category of direct materials. Examples include washing-active substances (surfactants), adhesive components, cardboard boxes and external filling services.
Aside from supply and demand, the prices of direct materials are mainly determined by the prices of the input materials used to manufacture them. Over the course of 2015, prices for input materials initially rose before declining again in the second half of the year. As a result, overall pricing in the fourth quarter was lower than in the first quarter. The situation dif-fered by both region and type of input material. The average crude oil price was significantly lower than in the previous year. The price for palm kernel oil was also below the level of 2014, while prices for cor-rugated paper and cardboard boxes increased in the course of the year. As a result of numerous plant shutdowns, prices for ethylene and polyethylene in Europe remained particularly high in the first half of the year, but normalized again in the second half. Overall, prices for direct materials in 2015 were mod-erately below the level of the previous year.
Direct material expenditures amounted to 7.8 billion euros. The increase compared to the previous year is primarily attributable to foreign exchange effects and acquisitions, which could not be entirely offset by savings from cost-reduction measures and improve-ments in production and supply chain efficiency.
Our five most important groups of raw materials within the direct materials category are raw materi-als for use in hotmelt adhesives, washing-active sub-stances (surfactants), raw materials for polyure-thane-based adhesives, inorganic raw materials, and water- and acrylic-based adhesive raw materials. These account for around 40 percent of our total direct material expenditures. Our five largest suppli-ers account for around 13 percent of purchasing vol-ume in direct materials.
Purchases made in the general category of indirect materials and services are not directly used in the production of our finished products. Examples include maintenance materials, and logistics, mar-keting and IT services. We were able to more than compensate for the marginal increases in gross
€7.8 bn
expenditures on direct materials.
79Combined management reportHenkel Annual Report 2015
31 Corporate governance52 Shares and bonds57 Fundamental principles
of the Group65 Economic report
102 Henkel AG & Co. KGaA (condensed version according to the German Commercial Code [HGB])
106 Subsequent events
106 Risks and opportunities report114 Forecast

prices in these areas in 2015 through our global pro-curement strategy and structural cost reduction mea-sures. At 5 billion euros, expenditure on indirect materials and services for 2015 was above the prior-year level. The increase compared to the previous year is primarily attributable to foreign exchange effects and acquisitions.
In order to improve efficiency and secure material supplies, we continuously optimize our value chain while ensuring that we maintain our level of quality. In addition to negotiation of new, competitive con-tract terms, our ongoing initiative to lower total pro-curement expenses is a major factor in the success of our purchasing strategy. Together with the three business units, Purchasing works continuously on reducing product complexity, optimizing the raw materials mix and further standardizing packaging and raw materials. We enter into long-term business relationships with selected suppliers to encourage the development of innovations, and to optimize manufacturing costs and logistics processes. At the same time, we ensure the risk of supply shortages is minimized. We also agree on individual targets with our strategic suppliers to strengthen our negotiating position and give us greater flexibility in consolidat-ing our supplier base. In 2015, we succeeded in reduc-ing the number of suppliers by another 15 percent.
We were able to increase the efficiency of our pur-chasing activities by further standardizing, automat-ing and centralizing our procurement processes. In addition to again making greater use of eSourcing tools to support our purchasing operations, we have also pooled large portions of our purchasing admin-istration activities – such as order processing, price data maintenance, and reporting activities – within our shared service centers. As part of our “Sourcing@Best” initiative, we have consolidated our global stra-tegic procurement operations into eight regional
purchasing centers. We have also integrated our pro-duction, logistics and purchasing activities across all business units in one single global supply chain organi-zation. This organization is based in Amsterdam and began operations in November 2014. The first phase of the European implementation has been success-fully completed and a branch office was opened in Singapore at the end of 2015.
Given the uncertainties with respect to raw material price changes and ensuring supply in the procure-ment markets, risk management is an important part of our purchasing strategy. The emphasis is on reducing price and supply risks while maintaining consistently high quality. As part of our active price management approach, we employ strategies to safe-guard prices over the longer term. These are imple-mented both by means of contracts and, where appropriate and possible, through financial hedging instruments. In order to minimize the risk of sup-plier default, we stipulate supplier default clauses and perform detailed risk assessments of suppliers to determine their financial stability. With the aid of an external, independent financial services provider, we continuously monitor important suppliers whose financial situation is seen as critical. If a high risk of supplier default is identified, we systematically pre-pare back-up plans in order to ensure uninterrupted supply.
We expect our suppliers and contractual partners to conduct themselves in a manner consistent with our own corporate ethics and values. The basic require-ments in this regard are set out in our purchasing standards, valid across the Group, and our safety, health and environmental standards formulated in 1997, through which we have long acknowledged our responsibility for the entire supply chain. Conse-quently, in selecting our suppliers and contractual partners, we take into account their performance in
Material expenditures by business unit 55 Material expenditures by type 56
Adhesive Technologies 51 % Raw materials 60 %Beauty Care 15 %
Purchased goods and services 19 %
Laundry & Home Care 34 %
Packaging 21 %
Henkel Annual Report 201580 Combined management report

terms of sustainable development. We use the cross-industry Code of Conduct published by the German Federal Association of Materials Management, Pur-chasing and Logistics [BME] as a globally applicable supplier code, and the basis for our multi-stage Responsible Supply Chain Process. The objective of this process is to ensure supplier compliance with these standards and to improve the sustainability lev-els of our supply chain in tandem with our strategic suppliers. A global training program ensures that the requirements regarding the sustainability profile of our suppliers are understood and properly applied by our employees in Purchasing.
The evaluation of our suppliers with respect to sus-tainability is based on a comprehensive assessment and audit program which we developed as a common standard in 2011 together with five other companies in the chemical industry under the initiative “Together for Sustainability.” The results of audits and assessments are shared among the members of the initiative, producing valuable synergies when evaluating what are – in many cases – common sup-pliers. The “Together for Sustainability” initiative continued to grow in the past year and now numbers 18 members. US companies also joined the initiative for the first time in the reporting year. Global imple-mentation of the assessment and audit program was further expanded through various events including supplier conferences in São Paulo, Brazil, and Shang-hai, China. The initiative also received recognition from Ethical Corporation: In the “Best Supplier Engagement” category, “Together for Sustainability” was honored with a special commendation.
Production
As part of the implementation of our strategy for 2016, we standardized our production and logistics activities across all business units in fiscal 2015, combining them with our purchasing activities into one global supply chain organization based in the Netherlands.
In 2015, Henkel manufactured products of a total weight of 7.9 million metric tons at 170 sites in 55 countries. Our largest production facility is in Düsseldorf, Germany. Here we manufacture not only laundry detergents and household cleaners but also adhesives for consumers and craftsmen, and products for our industrial customers.
Cooperation with toll manufacturers is an integral component of our production strategy, enabling us to optimize our production and logistics structures when entering new markets or when volumes are still small. We currently purchase around 10 percent in additional production tonnage from toll manufac-turers each year.
Number of production sites 57
2014 2015
Laundry & Home Care 28 28
Beauty Care 8 7
Adhesive Technologies 133 135
Total 169 170
In the Laundry & Home Care business unit, the number of production sites remained unchanged versus 2014 at 28. Our plant in Düsseldorf continues to be the largest production site for this business unit. Here we predominantly manufacture powdered and liquid laundry detergents, fabric softeners, liq-uid cleaning products and dishwasher tabs. In 2015, we again implemented numerous measures to sys-tematically further improve the operational excel-lence of our plants. Since our production volume again increased significantly as a result of higher market share and solid organic growth, we continue to invest in capacity expansion, with particular focus on innovations and emerging markets.
We successfully renewed the external certification of Group headquarters and all our plants, confirming our compliance with international quality, environ-mental, safety and energy management standards. Continuous improvements in sustainability enabled us to make significant progress in our focal areas of safety and resource conservation, helped, not least,
170production sites.
81Combined management reportHenkel Annual Report 2015
31 Corporate governance52 Shares and bonds57 Fundamental principles
of the Group65 Economic report
102 Henkel AG & Co. KGaA (condensed version according to the German Commercial Code [HGB])
106 Subsequent events
106 Risks and opportunities report114 Forecast

by the ongoing expansion of our centralized real-time system that measures total resource use around the world and systematically evaluates the findings.
In the logistics field, we made further adaptations to warehousing capacities while also pursuing integra-tion of the new acquisitions. We also consistently worked to optimize the geographical footprint of our warehouses in an effort to reduce transportation mileage to customers and encourage supply flexibility. These adjustments, coupled with the increased use of transportation vehicles that comply with the Euro 6 emission standard, constitute further steps in reduc-ing carbon dioxide emissions along the entire value chain. Further efforts focused on collaborating with individual retail partners to optimize the flow of goods and increase the availability of products on the shelves. This enabled us to again achieve a high level of delivery service worldwide that ranks us among the very best in our industry.
Our Beauty Care business unit continued its focus on driving a significant increase in agility and on out-standing customer service in 2015 in order to enable a faster and more flexible response to changes in the market. We achieved a significant improvement in our service level through better integration of our planning processes along the entire supply chain right up to the interface with our customers. Our efforts also focused on complexity control to raise efficiency when managing the product diversity that Beauty Care offers to meet the diverse needs of its global customer base.
We expanded specific capacities at our Western European sites and adjusted them to market needs. The biggest single investment was in our site at Wassertrüdingen in Germany, where we installed a new high-speed filling system for liquid products in mid-2015, which allows us to keep pace with the growing demands of our customers. In addition to capital expenditures at European sites, we also invested extensively in non-European sites to sup-port organic growth. Production capacity was expanded in Asia, America and Eastern Europe, and particularly at the plant we acquired in Russia at the end of 2013, to enable us to supply local markets with even greater speed and efficiency.
In an environment characterized by fierce compe-tion, we also focused on further improving efficiency and enhancing our flexibility. The motivation of our employees – especially our TPM/lean teams – to con-tinuously optimize processes, again enabled us to increase both quality and productivity.
We have aligned the global production network in our Adhesive Technologies business unit to higher demand – especially in emerging markets. We are investing in the introduction of modern and the optimization of existing production technologies. At the same time, we are continuously improving the efficiency of our production structures in order to generate further cost and quality advantages in prod-uct manufacturing.
In the year under review, two key projects in the form of our multi-technology sites in China and India were taken forward with a view to expanding our produc-tion capacities. The foundation stone was laid for a new plant in India in 2015, whereas the capacities of the plant we opened in China in 2013 were extended. Both sites combine various production technologies in a shared infrastructure to leverage economies of scale.
New production technologies – for manufacturing adhesives for the automotive industry, for example – were rolled out, especially in the emerging markets, to enable us to manufacture our products even more efficiently, cheaply and sustainably. We develop new products to satisfy customer-specific requirements, and invest accordingly in modern manufacturing facilities. We continue to focus on improving the production structures and workflows at our plants. Our lean teams once again introduced a range of optimization measures at our production sites.
As an important aspect in our promise of quality, our optimization efforts in all three business units aim to reduce the environmental footprint of our produc-tion activities. We focus in particular on cutting energy use, thereby contributing to climate protec-tion, on reducing material input and waste volume, and on lowering water usage and wastewater pollu-tion. New warehousing concepts and the production of packaging materials directly on-site where filling takes place reduce transport mileage and thus also contribute to climate protection.
Overall, our global programs in 2015 resulted in 68 percent of our sites reducing their energy use, 75 percent decreasing their water usage, and 59 per-cent lowering their waste footprint.
Keeping our “Factor 3” goal in mind for the year 2030, we set concrete interim targets for our production sites which, by the end of 2015, we had managed to exceed.
Henkel Annual Report 201582 Combined management report

Sustainability targets from 2011 through 2015 and current status 58
Environmental indicators per ton of production volume Target Status
Energy used – 15 % – 18 %
Water used – 15 % – 23 %
Waste generated – 15 % – 17 % 1
Occupational accidents 2 – 20 % – 33 %
1 Excluding construction and demolition waste: – 29 %.2 Per million hours worked.Base year 2010.
Compared to the base year 2010, we managed by the end of 2015 to reduce the energy used per ton of prod-uct by 18 percent, our water usage by 23 percent, and our waste footprint by 17 percent.
We are continuing our efforts to further improve our performance in these areas in the coming years as we move toward our long-term goal of “Factor 3.” To this end, we have defined the following new medium-term targets: By 2020, we want to reduce the direct and indirect carbon dioxide emissions of our pro-duction sites, the water we use and the waste we gen-erate by 30 percent per ton of product in each case, relative to 2010 as our base year.
We have also defined further areas of program focus, including more concerted efforts to save water in regions where it is scarce, to reduce landfill waste, to increase the use of renewable energies, and to lower carbon dioxide emissions associated with the trans-portation of our products.
For further details on our sustainability targets, please see pages 61 to 63 and our Sustainability Report on our website at:
www.henkel.com/sustainabilityreport
Our standards for safety, health and the environ-ment, and the Henkel Social Standards, apply to all our sites worldwide. Using a clearly defined process consisting of communication, training and audits, we ensure compliance with these standards, espe-cially at the production level.
We have the environmental management systems at our sites externally certified wherever this is recog-nized by our partners in the respective markets. By the end of 2015, around 95 percent of our production volume came from sites certified to ISO 14001, the internationally recognized standard for environmen-tal management systems.
Research and development
Expenditures by the Henkel Group for research and development (R&D) in the reporting period amounted to 478 million euros (adjusted for restructuring charges: 464 million euros) compared to 413 million euros (adjusted: 410 million euros) in 2014. The increase is mainly the result of foreign exchange effects and acquisitions. As a percentage of sales, we spent 2.6 percent (adjusted: 2.6 percent) on research and development (2014: 2.5 percent, adjusted: 2.5 percent).
In 2015, personnel expenses accounted for around 60 percent of total R&D spending. Our research and development costs were fully expensed; no product- or technology-related development costs were capi-talized in accordance with International Financial Reporting Standards (IFRS).
R&D expenditures by business unit 60
Adhesive Technologies 63 %Beauty Care 15 %
Laundry & Home Care 22 %
2011
2012
2013
2014
2015
100 200 300 400 5000
R&D expenditures 1 in million euros
59
1 Including restructuring charges of: 14 million euros (2011), 2 million euros (2012), 1 million euros (2013), 3 million euros (2014), 14 million euros (2015).
R&D expenditures in percent of sales.
2.6 %
408
415
413
410
478
83Combined management reportHenkel Annual Report 2015
31 Corporate governance52 Shares and bonds57 Fundamental principles
of the Group65 Economic report
102 Henkel AG & Co. KGaA (condensed version according to the German Commercial Code [HGB])
106 Subsequent events
106 Risks and opportunities report114 Forecast

On an annual average, around 2,800 employees worked in research and development (2014: 2,650). This corresponds to around 6 percent of the total workforce. Our teams are composed of natural scien-tists – predominantly chemists – as well as material scientists, engineers and technicians.
Key R&D figures 62
2011 2012 2013 2014 2015
R&D expenditures 1 (in million euros) 396 406 414 410 464
R&D expenditures 1 (in % of sales) 2.5 2.6 2.6 2.5 2.6
Employees 2 (annual average) 2,650 2,650 2,600 2,650 2,800
1 Adjusted for restructuring charges.2 Figures rounded.
Our capital expenditures and the capabilities of our highly qualified employees form the foundation on which the success of our R&D activities is built. More-over, our Group-wide cooperation models, successful project outsourcing as part of our Open Innovation strategy, and the relocation of resources in the direc-tion of emerging markets all demonstrate our ongoing focus on innovation and our concerted efforts to con-tinuously reduce our resource consumption while maintaining or improving performance.
Strengthening research and development togetherThe research and development experts in the three business units align their project portfolios to the specific needs of their individual businesses. They work together on fundamental processes, basic inno-vation, evaluating partners for innovation, and on sustainability. The Research and Development Com-mittee is responsible for Group-wide coordination.
One example of the joint approach is our coordination on the topic of “Quantum Leaps in Research and Devel-opment,” where the primary focus is on processes to improve both the number and likelihood of success of disruptive innovations. Basic innovations in common areas of knowledge are continually exchanged between the business units, through both formal and informal channels. This is particularly relevant to all surface-modifying technologies such as surfactants, multi-functional polymers and silicones. The documenta-tion of advances in sustainability made within the development projects is also standardized across the three business units.
Open InnovationOur innovations come from both internal and external sources. Therefore, the concept of Open Innovation continues to hold great significance for us. Accord-ingly, we have intensified our efforts to involve exter-nal partners such as universities, research institutes and suppliers in many of our development projects.
Düsseldorf, Germany
Hamburg, Germany
Heidelberg, Germany
Dubai, United Arab Emirates
Shanghai, China
Seoul, South Korea
Tokyo, Japan
Madison Heights, USA
Bridgewater, USA
Rocky Hill, USA
Johannesburg, South Africa
Pune, India
Dublin, Ireland
Irvine, USA
Scottsdale, USA
Toluca, Mexico
Moscow, Russia
Selected research and development sites 61
Bogotá, Colombia São Paulo, Brazil
Barcelona, Spain
Sydney, Australia
Henkel Annual Report 201584 Combined management report

The following examples demonstrate the success achieved with our Open Innovation concept:• Our innovation partner Evonik was honored by
the Laundry & Home Care business unit with the “Best Innovation Contributor Award 2015” for the exclusive development of an innovative repair polymer initially rolled out in 2015 under the brands Der General and Brillantes. Many consum-ers have the problem of scratched surfaces that lose their shine. The unique semi-permanent lam-ination technology smooths away scratched sur-faces and cracks. The patent-pending polymer can significantly improve a faded surface shine even with the first application. Successive applications enhance this innovative effect even more.
• Our long-time partner BASF was honored with the “Best Innovation Contributor Award 2015” by the Beauty Care business unit for continuous and suc-cessful collaboration in the area of micro-emul-sions for body cleansing products. Micro-emulsifi-cation enables the use of higher concentrations of caring oils in transparent surfactant formulations for improved care performance. This micro-oil technology was used for the first time in 2014 in the oil-infused shampoos of the Bonacure brand in the Hair Salon business, before being adapted in 2015 for shower gels under the body care brands Fa in Europe and Dial in North America.
• The Japanese technology company Kaneka, which manufactures a broad range of special polymers for various industrial applications, was awarded the “Supplier Innovation Award” for the second consecutive year by the Adhesive Technologies business unit. Kaneka’s close cooperation with us in Germany, the USA and Asia gives us early access to its latest developments in high-performance specialty polymers which support our latest solu-tions in liquid sealants for the automotive, elec-tronics and industrial markets.
Research and development worldwideIn addition to its central research laboratories, Henkel maintains regional research and development sites around the world as hubs for innovative prob-lem-solving. Worldwide research and development activity is managed globally by the business units. Research-intensive basic technologies are developed at a central location with optimal access to external resources. These basic technologies are applied in the
regional research and development sites to customer and market-specific innovations. At the same time, the research and development staff in the regional sites obtain information about specific problems for the next generation of innovations, working in close contact with markets and customers. The new basic technologies needed for the relevant solutions are again developed centrally.
The following examples illustrate the contribution made by our regional research and development lab-oratories:• Our acquisition of Spotless’ research laboratory for
insect control products in Barcelona, Spain, in 2014 enabled the Laundry & Home Care business unit to further expand its technological expertise in this field. Products are developed for both global and regional use at this site. With ZenSect anti-mosquito sticks, Henkel researchers were success-ful in developing an innovative and highly effec-tive mosquito repellent for the European market based on a completely new principle. The active substance is derived from natural ingredients and the mechanism is found in crop plants. It targets the sensory ability of the insect and suppresses its urge to sting.
• The growing importance of the emerging markets also impacts the R&D strategy of the Beauty Care business unit. In the regional testing and develop-ment centers in Shanghai, China, in Johannesburg, South Africa, and in Bogotá, Colombia, individual products are developed that take account of ethnic distinctions and specific customer needs. For the Asian market, silicone-free transparent anti-dan-druff shampoos were developed and successfully launched under the Syoss brand. Soaps, deodorant sprays and shower gels were developed for the Arab markets with the special scent of Oud, reflect-ing the Arab perfume tradition.
• The Adhesive Technologies business unit provides local expertise and solutions through a global net-work of technology centers. Our center in Pune, India, focuses on the requirements of the automo-tive and manufacturing industry based in that area. The local product development team specializes in creating highly specific customer solutions – in the growing fields of maintenance, repair and overhaul or in industrial fabrication and produc-tion, for example.
85Combined management reportHenkel Annual Report 2015
31 Corporate governance52 Shares and bonds57 Fundamental principles
of the Group65 Economic report
102 Henkel AG & Co. KGaA (condensed version according to the German Commercial Code [HGB])
106 Subsequent events
106 Risks and opportunities report114 Forecast
Contributing to sustainabilityWorldwide, growth and quality of life need to be decoupled from resource use and emissions. Our con-tribution here lies in the development of innovative products and processes that consume less resources while offering the same or better performance. It is therefore both our duty and our desire to ensure that all new products contribute to sustainable develop-ment in at least one of our six defined focal areas. These are systematically integrated within our inno-vation process. Early on, our researchers must demon-strate the specific advantages of their project in regard to product performance, added value for our custom-ers, resource efficiency, and social progress. We thus aim to combine product performance and quality with social and environmental responsibility. Our focus in this respect is on two goals. The first is to continu-ously improve the sustainability profile of the raw materials we use, in collaboration with our suppliers. The second is to help our customers and consumers reduce energy use and carbon dioxide emissions through our innovations.
Life cycle analyses, profiles of potential raw materi-als and packaging options, and our many years of experience in sustainable development help us to identify and evaluate improvement opportunities right from the start of the product development process. A key tool in this respect is our “Henkel Sustainability#Master®.” This evaluation system cen-ters around a matrix based on the individual links in our value chains and on our six focal areas. It shows which areas are most relevant from a sustainability perspective, and allows a transparent and quantifi-able comparison to be made between two products or processes.
Our scientists again made valuable contributions to the company’s success through their innovations in 2015. A selection of particularly outstanding research projects is provided in the examples below:• Washing at lower temperatures makes a significant
contribution to climate protection. Working with its strategic partner, Novozymes, the Laundry & Home Care business unit developed high-perfor-
mance enzymes for a new generation of formulas. This was the basis for the successful introduction of the Persil ProClean brand in the USA. A high-performance formula – patent pending and designed specifically for US requirements – dis-plays its powerful washing performance even at low temperatures both in the cold wash cycle and in high-efficiency washing machines. Consumers experience the dual benefits of a superior cleaning result combined with lower energy usage. Novo-zymes was honored with the “Sustainability Award 2015” in recognition of this innovation.
• An important aspect of sustainability is recycling, which includes both the ability to recycle and the use of recycled materials. As the result of a joint development project with packaging supplier Ball Corporation, Henkel is able to use aerosol cans with a 25-percent recycled aluminum content for deodorant sprays under the Fa, Souplesse and Neutromed brands. The aluminum recycling pro-cess uses significantly less energy than the expen-sive production of primary aluminum from baux-ite. Furthermore, this mixture of aluminum produces greater rigidity, which means that signif-icant material savings of around 10 percent can be achieved with these aerosol cans. The two effects combined result in a reduction of more than 20 percent in the CO2 footprint per aluminum can. Ball Corporation was presented with the “Sustain-ability Award 2015” for this contribution to sus-tainability.
• The development of the innovative solder paste Loctite GC 10 once again highlights the leading role of the Adhesive Technologies business unit in sustainability. This new, thermally stable technol-ogy is used in the assembly of electronic compo-nents. The solder paste’s technical properties allow it to be stored and transported at room tempera-ture. In contrast to conventional solutions, cold storage is no longer needed. Loctite GC 10 contrib-utes to a significant reduction in energy use dur-ing storage and avoids the need for transportation by air freight. It also reduces defects, as Loctite GC 10 can be handled more easily and has a longer open time in our customers’ production processes.
Henkel Annual Report 201586 Combined management report

Fritz Henkel Award for InnovationEach year we select a number of outstanding devel-opments for our Fritz Henkel Award for Innovation. In 2015, the innovation award went to three interna-tional, interdisciplinary project teams for the realiza-tion and successful commercialization of the follow-ing concepts:• A new and innovative active care ingredient has
enabled successful transfer of the attractive oil concept from cosmetics to fabric softeners for the Vernel Soft & Oils line. The new formulation, developed with our innovation partner BASF, makes it possible to combine significantly more efficient care ingredients and premium fragrant oils for the first time, providing exceptional fresh-ness, deep-down laundry care and improved softness. This new generation of fabric softeners, which is unique worldwide, features an inno-vative aesthetic transparency combined with a sophisticated packaging design. The fragrant appeal is enhanced by the lingering presence of special premium perfumes on the laundry. Use of the high-performance active care ingredients makes a positive contribution to sustainability.
• Years of research into the structure of hair matrix keratins has led to the development of patented Keratin Color technology that opens up a new dimension in coloring performance and care: A care complex containing specific keratin compo-nents in the pre-lotion, coloration cream and con-ditioner provides triple-action protection before, during and after the coloring process. The result is maximum coloring performance with 100 percent gray coverage and outstanding care that reduces hair breakage by up to 80 percent. With the devel-opment of its Keratin Color technology and the
Keratin Color brand, the Beauty Care business unit continues to further expand the care colorants cate-gory – which also includes the successful Diadem brand — in order to respond to the consumer need for care and protection. The parallel marketing in Europe and during the market launch of Schwarz-kopf in the USA has helped to reinforce Henkel’s global leadership in innovation.
• A global team of experts from the Adhesive Tech-nologies business has developed a novel Total Solu-tion for assembling mobile phones. The approach combines offering structural adhesives for bonding the mobile phone frame to the cover glass with pre-cise and intelligent dispensing equipment. Both the structural adhesive and dispensing equipment are designed and tailor-made by Adhesive Technol-ogies to meet the specific needs of our individual customers. The Total Solution approach allows our customers a single point of contact for all applica-tion support and accountability, helping to secure the long-term business for Henkel. It also provides Henkel total control of the application and results. In addition, the novel Henkel technology, which is already being deployed by several leading manufac-turers, offers improved sustainability: reduced waste in production, increased occupational safety, and advanced recyclability of devices.
We hold more than 8,150 patents to protect our tech-nologies around the world. Approximately 5,400 pat-ents are currently pending. And we have registered around 1,600 design patents to protect our designs.
Further information on our research and develop-ment activities can be found on our website
www.henkel.com/innovation
Fritz Henkel Award for Innovation 2015
www.vernel.de www.schwarzkopf.com www.loctite.com.au/mobile-bonding
87Combined management reportHenkel Annual Report 2015
31 Corporate governance52 Shares and bonds57 Fundamental principles
of the Group65 Economic report
102 Henkel AG & Co. KGaA (condensed version according to the German Commercial Code [HGB])
106 Subsequent events
106 Risks and opportunities report114 Forecast

Marketing and distribution
We put our customers at the center of what we do. Hence we align our marketing and distribution activ-ities in our business units to the requirements of each specific audience and target group. To further strengthen our top brands and continue the success-ful commercialization of our innovations, we man-age our marketing activities and investments using clear priorities set according to category and region. In distribution, we focus on strategic partnerships while aiming for above-average growth with our top customers. In response to the growing importance of eCommerce, we have intensified our cooperation with various online retailers and expanded our eCommerce offering for industrial customers.
In the Laundry & Home Care business unit, we develop our marketing strategies and product innova-tions on a global scale, adapt them to regional cus-tomer needs and market conditions, and implement them at the local level. We thus ensure central, effi-cient management of our brands and an innovation process that enables us to recognize consumer trends early on and to implement new products quickly while at the same time remaining closely attuned to local needs. We are steadily increasing the use of digital media communication – particularly social media – to develop our media strategies and engage our consumers in the most effective way possible.
To enhance sales, we opened a Global Experience Center in Düsseldorf in February 2015, creating a new platform for deepening our cooperation with inter-national customers, developing tailored solutions to meet the specific requirements of our partners, and identifying opportunities to create value together. At various stations, this customer center shows the business unit’s expertise and innovative concepts – from new product offerings and digitalization to sus-tainability and shopper marketing. Each station at the center is designed to be interactive, allowing visi-tors to explore the world of laundry and cleaning products with all of their senses. We have continued to expand our expertise in the areas of shopper intel-ligence and shopper marketing. This is an essential component of our strength in sales and we are con-tinuing to reinforce it.
Our efficient processes, effective communication with consumers, and our strategic partnerships with the trade enable us to successfully manage our global brand portfolio and to strengthen it with viable inno-vations, both now and into the future.
In the Beauty Care business unit, we develop market-ing and sales strategies for both our Branded Con-sumer Goods and our Hair Salon businesses on a global scale, and then implement them at the local level. Within our Branded Consumer Goods opera-tion, the Beauty Care Lighthouse, which opened in Düsseldorf in 2012, has established itself as a central point of contact for our customers worldwide. This is an interactive customer center with six stations dedi-cated to Innovation, Digital Consultation, Point-of-Sale Marketing, Research and Development, Formula-tion, and Sustainability. Customers can, for example, test innovations themselves, fill store shelves virtu-ally, or try out innovative point-of-sale consultation tools such as digital hair-color testing. In addition to traditional advertising and point-of-sale activities, digital marketing is a key element of our marketing strategy. We are focusing in particular on developing direct consumer interaction through social media.
In the Hair Salon business, we also rely on collabo-rating in close partnership with our customers. As an additional service, our globally established Schwarzkopf Academies offer state-of-the-art special-ist seminars and ongoing training programs with the focus very much on the hair salon as an enterprise. In parallel, our Schwarzkopf sales force ensures that our partners receive comprehensive advice at the local level to continuously enhance the technical skills and commercial success of our salon partners.
Closeness to customers and consumers in both the Branded Consumer Goods and Hair Salon businesses ensures the continued ability of the Beauty Care business unit to successfully bring innovation to market.
As the leading solution provider for adhesives, sealants and functional coatings worldwide, the Adhesive Technologies business unit covers virtu-ally the entire spectrum of the global adhesives mar-ket with its specialized market sectors.
We develop our marketing strategies at both the global and regional level. The measures derived from our planning are then implemented locally. Our strong, internationally established brands are a cen-tral element in the range of products and services we offer. Within our branding strategy, we consistently leverage our five global technology cluster brands in the industrial markets and our four brand platforms in the consumer business.
Henkel Annual Report 201588 Combined management report

We have around 130,000 direct industry and retail customers who are generally serviced by our own sales teams. Our retail customers, in turn, service the needs of private users, craftsmen and smaller indus-trial customers more efficiently than would be the case through direct channels.
With around 6,500 in-house specialists, we foster long-term contact with our customers and have acquired an in-depth understanding of their various areas of application. In light of the significant com-plexity of many of our solutions and technologies, first-rate technical customer service and thorough user training are of key importance. Our global pres-ence enables us to provide technical services to cus-tomers worldwide as well as in-depth product train-ing on site. In 2015, we opened a training center for flexible packaging in Mumbai – the first facility of its kind in India. It follows Düsseldorf and Shanghai as Henkel’s third global training facility where we offer both theoretical and practical courses in adhesives for flexible packaging.
As part of our digitalization strategy, the expansion of our eCommerce platform “Henkel POD” is an important focus in our drive to make our ordering process even easier for our industrial customers. Orders totaling over one billion euros were settled through the platform in the reporting period.
In addition to digital communications, our efforts to reach as many consumers and craftsmen as possible include the continued use of conventional advertis-ing and measures to attract our target groups at the point of sale.
Based on our close customer relationships and our comprehensive technical expertise, we will continue to offer tailored solutions and innovative branded products that provide sustainable added value for our customers in the future.
The importance of sustainability in our relation-ships with customers and consumers continues to grow in all three business units. Our customers expect their suppliers to ensure compliance with global environmental, safety, and social standards. Our standards and management systems, our many years of experience in sustainability reporting, and excellent appraisals by external rating agencies all help us to convince our audience of our credentials in this domain. Moreover, the credible implementa-tion of our sustainability strategy strengthens both our brands and the reputation of our company in the marketplace.
With our decades of experience in aligning our activities to sustainable development, we are able to position ourselves as a leader in the field and as a partner capable of offering our customers future-capable solutions. And we cooperate closely with our customers in trade and industry in the development and implementation of viable concepts.
In order to convey to our customers and consumers the added value of our innovations – best possible performance combined with responsibility toward people and the environment – we use direct product communication supported by more detailed informa-tion provided in new media such as electronic news-papers and online platforms, as well as events and campaigns implemented together with our partners.
Last year, we combined these approaches in a joint program for our three business units: “Say yes! to the future” provides sales training for our employees and strengthens our cooperation with our trade customers.
We intend to increase our involvement in the development of appropriate measurement and assessment methods in order to facilitate effective, credible communication of our contributions to sus-tainability. To this end, we have developed a variety of tools, which are integrated within our “Henkel Sustainability#Master®.” We have launched various projects in collaboration with selected partners to improve and standardize measurement and assess-ment methods.
For further information on the products and brands of our three business units, please go to our website at
www.henkel.com/brands-and-businesses
specialists serving our Adhesive Technologies customers.
6,500Around
89Combined management reportHenkel Annual Report 2015
31 Corporate governance52 Shares and bonds57 Fundamental principles
of the Group65 Economic report
102 Henkel AG & Co. KGaA (condensed version according to the German Commercial Code [HGB])
106 Subsequent events
106 Risks and opportunities report114 Forecast

Laundry & Home Care
1 Adjusted for one-time charges/gains and restructuring charges.
High-performance cleanersCleaners with new formulas that repel water and dirt for enhanced perfor-mance. For example, Bref Brillante Vetri impregnates the glass surface, repelling dirt and preventing contam-inant build-up for shine that lasts five times longer. Other uses include the lime-repelling effect in bathroom cleaners, a grease-stop effect in kitchen cleaners, and water and dust protection in multi-purpose cleaners.
www.henkel-reiniger.de
Perwoll Care & RepairPerwoll Care & Repair is the first fiber-repair detergent from Perwoll able to visibly reduce fuzzing and pilling in hard-worn garments by up to 80 percent. It thus addresses a relevant consumer need. The rich formula with Repairzyme® also prevents new fuzzing and pilling of the fibers – a new dimension in fabric care.
www.perwoll.de
Persil Power-Mix CapsWith new Persil Power-Mix Caps, Persil is setting new standards in the rapidly growing market for pre- portioned detergents. The product uniquely combines the exceptional cleaning performance of a concentrated gel with the whitening performance of a powder. The result is laundry that is well protected against graying.
www.persil.nl
Highlights
Sales growth
+ 4.9 %
Adjusted 1 operating profit
€879 m
Adjusted 1 return on sales
17.1 %organic sales growth adjusted 1 operating profit (EBIT):
up 17.4 percentadjusted 1 return on sales (EBIT): up 0.9 percentage points
Key financials * 63
in million euros 2014 2015 +/–
Sales 4,626 5,137 11.0 %
Proportion of Henkel sales 28 % 28 % –
Operating profit (EBIT) 615 786 27.8 %
Adjusted operating profit (EBIT) 749 879 17.4 %
Return on sales (EBIT) 13.3 % 15.3 % 2.0 pp
Adjusted return on sales (EBIT) 16.2 % 17.1 % 0.9 pp
Return on capital employed (ROCE) 23.4 % 21.1 % – 2.3 pp
Economic Value Added (EVA®) 391 469 20.0 %
pp = percentage points * Calculated on the basis of units of 1,000 euros;
figures commercially rounded.
Sales development * 64
in percent 2015
Change versus previous year 11.0
Foreign exchange 1.1
Adjusted for foreign exchange 9.9
Acquisitions / divestments 5.0
Organic 4.9
of which price 2.2
of which volume 2.7
* Calculated on the basis of units of 1,000 euros.
Henkel Annual Report 201590 Combined management report

Economic environment and market position
In 2015, the relevant world market for laundry and home care showed moderate growth. Price and pro-motional competition remained high in almost all regions. However, we saw a further increase in inten-sity, particularly in Western Europe and Germany.
Nevertheless, our growth again significantly out-paced the relevant global market in 2015. As a result, we were able to further expand share in our relevant markets and strengthen our leadership position. Both the sustained success of our strong brands and the successful global introduction of our innovations contributed to this solid performance.
Market performance in the mature markets was posi-tive. In Western Europe, the relevant market for laun-dry and home care products showed a slight increase overall, with growth in Germany and France as the main contributors. Driven by positive performance in the USA, the North American markets also recorded slightly positive growth following the con-tractions of previous years. In this market environ-ment, the business unit was able to further expand its market share, particularly in Western Europe.
Developments in the emerging markets varied. Mar-ket growth in our relevant markets in the Africa/ Middle East region remained below the figure of the previous year as a result of the challenging market environment. The market in Eastern Europe recorded significantly stronger growth than in previous years, mainly reflecting inflation. In Latin America, the rel-evant market for laundry and home care products showed a slight increase. Overall, we were able to generate a very strong increase in our market shares in emerging markets.
Business activity and strategy
The Laundry & Home Care business unit is globally active in the laundry and home care branded con-sumer goods business. The Laundry Care business includes not only heavy-duty and specialty deter-gents but also fabric softeners, laundry performance enhancers, and other fabric care products. The prod-uct range was successfully expanded with the brands of the France-based Spotless Group acquired in 2014, and now encompasses additional products such as color catcher sheets and fabric dyes. The product portfolio of our Home Care business encompasses hand and automatic dishwashing products, cleaners for bathroom and WC applications, and household, glass and specialty cleaners. We also offer air fresh-
eners and insect control products for household applications.
Our aim is to continue generating profitable growth through continuous expansion of our current business and targeted acquisitions. We pursue continuous gains in market share accompanied by improvements to margin. In order to drive sustained growth in Laundry & Home Care, we intend to further expand the ratio of sales from emerging markets while also raising the profitability of those markets to the higher level of the mature markets. We also aim to further strengthen our leading positions in mature markets.
Our strategy of profitable growth is supported partic-ularly by strong brands and innovations that offer added value for consumers. Our efficient marketing and distribution processes have again enabled us to identify consumer trends at an early stage and bring a number of relevant innovations to market. Accord-ingly, successful product launches again contributed substantially to our positive business performance in the year under review. Our innovation rate 1 in 2015 was once again over 45 percent. Prioritizing categories and centrally steering our global brand portfolio helps us to direct our investments specifically toward those segments that offer growth and profitability, enabling us to generate above-average growth with our most important brands and market segments.
In 2015, we generated 79 percent of our sales with our top 10 brand clusters. A brand cluster com-prises individual global and local brands that share a common brand positioning internationally. By adopting this approach, we generate synergies in our marketing mix.
Acquisitions are part of our global strategy. Our aim is to invest in attractive category positions to accel-erate our growth in profitable segments. In 2015, we expanded our business with the purchase of the entire range of laundry detergent and pre-wash brands previously marketed by Colgate-Palmolive Company in Australia and New Zealand, thereby strengthening our position in the Asia-Pacific region. Integration of the businesses we acquired in 2014 is proceeding successfully and according to plan.
innovation rate 1.
45 %Over
1 Percentage share of sales generated with new products launched onto the market within the last three years.
Top brands
91Combined management reportHenkel Annual Report 2015
31 Corporate governance52 Shares and bonds57 Fundamental principles
of the Group65 Economic report
102 Henkel AG & Co. KGaA (condensed version according to the German Commercial Code [HGB])
106 Subsequent events
106 Risks and opportunities report114 Forecast

Sales and profits and supply chain efficiency enabled us to increase gross margin. Lower prices for direct materials also had a positive effect.
Return on capital employed (ROCE) decreased versus the prior year to 21.1 percent, attributable primarily to acquisitions and foreign exchange. Economic Value Added (EVA®) increased by 78 million euros to 469 million euros. We were able to improve net working capital as a percentage of sales. The figure of –6.7 percent was below the already low level of the previous year.
Business areas
In the following, we comment on the organic sales performance of our two business areas.
Laundry CareThe Laundry Care business area posted a solid sales performance, driven by continued expansion of the leading positions of our core brand Persil and the introduction of successful innovations.
In the premium detergent category, we introduced a high-performance detergent under the Persil brand in the USA: New Persil ProClean has a unique and powerful formula for outstanding laundry results. The Persil ProClean line covers the relevant segments with liquid, powder and pre-portioned detergents. We introduced new Persil Power-Mix Caps into the rapidly growing market for pre-portioned detergents in Western and Eastern Europe. These combine the product advantages of a concentrated gel with the whitening performance of a powder, resulting in impressive cleaning power and extra protection against graying.
For price-conscious consumers in emerging markets, we initiated a new and differentiated positioning approach for our heavy-duty detergents under vari-ous brands in the value-for-money segment. This involves delivering maximum yield and performance backed up by a new packaging design and a new com-munication campaign. The concept has been imple-mented in over 25 countries in Eastern Europe, Latin America and Africa/Middle East under brands such as Pemos (in Russia), Tomi (in Hungary) and 1-2-3 (in Mexico).
In the liquid detergent category, we launched prod-ucts with a unique dispensing system in Western Europe under the brands Le Chat, Mir and X-Tra. The
2011
2012
2013
2014
2015
1,500 3,000 4,500 6,0000
4,556
4,580
4,626
5,137
Sales Laundry & Home Care in million euros
65
4,304
For the first time, the Laundry & Home Care business unit achieved sales in excess of 5 billion euros in a fiscal year, while also recording solid organic growth. Adjusted return on sales showed a very strong increase. The business unit therefore continued its path of profitable growth again in 2015.
Organically (i.e. adjusted for foreign exchange and acquisitions/divestments), sales increased by 4.9 percent. This was significantly above the perfor-mance of the relevant markets. Sales performance was driven by both price and volume.
In the following, we comment on our organic sales performance in the regions.
The emerging markets registered a very strong increase in sales and were once again the biggest driver of organic growth in Laundry & Home Care. The regions Eastern Europe, Latin America and Asia (excluding Japan) each contributed very strong sales growth. The Africa/Middle East region also showed a very strong increase in sales. Compared to the previous year, how-ever, growth slowed due to the difficult market condi-tions prevailing.
Performance in the mature markets was positive. The North America region achieved a solid increase in sales; sales growth in Western Europe was positive.
Adjusted operating profit (EBIT) rose by 17.4 percent from 749 million euros to 879 million euros. Adjusted return on sales reached 17.1 percent with a very strong increase of 0.9 percentage points compared to the previous year. Our innovation initiatives and ongoing measures to reduce costs and enhance production
organic sales growth.
+ 4.9 %
Henkel Annual Report 201592 Combined management report

PowerShot system, which is built into the bottle, pre-cisely measures the liquid detergent for an optimal laundry result, thus preventing accidental overdis-pensing. This technical innovation is exclusively available to Henkel. In the Africa/Middle East region, we introduced new Persil Black Abaya. In addition to the proven performance of Persil Black, the new liq-uid detergent contains a UV-absorbing formula that protects black garments from fading caused by sun-light or washing. We also launched a variant with lavender fragrance under the Persil brand in the region.
The specialty detergents category provided further growth momentum with the introduction of the innovative liquid detergent Perwoll Care & Repair. Perwoll Care & Repair is the first fiber-repair deter-gent from Perwoll able to visibly reduce fuzzing and pilling in hard-worn garments by up to 80 percent. The rich formula with Repairzyme® also effectively prevents new fuzzing and pilling of the fibers.
In the wash additives category, we launched the new Colour Catcher “All at 30°.” For the first time, these color catcher sheets also have a concentrated stain remover. They provide proven protection against color bleeding and produce even cleaner laundry – at just 30 degrees Celsius.
Home CareThe Home Care business area posted a strong sales performance in 2015, driven mainly by the sustained success of our WC products. Hand and automatic dishwashing products also made an important con-tribution.
In WC products, the Bref Power Aktiv brand – in Germany, the WC Frisch brand – once again gener-ated highly dynamic growth. Building on the consid-erable global success of our Superior Value Rim Blocks, we introduced to the international market two new variants featuring innovative fragrances: Hawaiian Plumeria Lei and Rio Carnival. We also strengthened our position in this category with the international launch of new Bref Duo-Aktiv. Bref Duo-Aktiv now features an improved formula and a new duo-chamber design. The new duo-chamber technology offers an optimal combination of a liquid WC cleaner and rim block fragrance for double the hygienic power.
In the hand dishwashing category, we launched the new variant Pur Gold Care under the Pur brand in Eastern Europe. The innovative formula is especially effective against odors. The proven power of Pur to dissolve grease effortlessly removes even dried food residue without tedious soaking. In the Africa/ Middle East region, we launched the new Pril 100 Lemons Power.
We introduced new Somat Gold Gel under the Somat brand to the growing market for liquid products for the automatic dishwasher. The improved formula makes Somat Gold Gel the best gel product in the market. The unique two-phase formula in the two-chamber bottle removes tough grease from any dish while protecting the automatic dishwasher, particu-larly the filter, from grease build-up.
We also strengthened our multi-purpose cleaner cat-egory through innovations that not only remove dirt but also repel it. We launched a new Sidolin in the glass cleaners category: The improved formula with repellent effect impregnates the glass surface and successfully prevents contaminant build-up. The multi-purpose cleaners under the Bref brand are now also enhanced with a special formula that repels dirt. The grease-stop effect of Bref Power Fett & Einge-branntes (Bref Power for grease and baked-on resi-due) weakens the adhesion of grease stains, making them easier and quicker to remove. In our Bref bath-room cleaners, the lime-repellent effect makes water drops bead up, reducing the emergence of new lime deposits.
Capital expenditures
In 2015, our capital expenditures for property, plant and equipment amounted to 217 million euros fol-lowing 201 million euros in the previous year. These expenditures focused on the expansion of our pro-duction capacity, on investment in innovations and on optimizing our production processes. We also made additional investments in the area of plant safety and quality systems. Most of our investments were made in our emerging markets. The biggest single investment related to the expansion of pro-duction capacity in Russia and optimization of the logistics structure there.
investments in property, plant and equipment.
€217 m
93Combined management report
31 Corporate governance52 Shares and bonds57 Fundamental principles
of the Group65 Economic report
102 Henkel AG & Co. KGaA (condensed version according to the German Commercial Code [HGB])
106 Subsequent events
106 Risks and opportunities report114 Forecast
Henkel Annual Report 2015

Beauty Care
1 Adjusted for one-time charges/gains and restructuring charges.
Highlights
Sales growth
+ 2.1 %
Adjusted 1 operating profit
€610 m
Adjusted 1 return on sales
15.9 %organic sales growth adjusted 1 operating profit (EBIT):
up 12.2 percentadjusted 1 return on sales (EBIT): up 0.6 percentage points
Key financials * 66
in million euros 2014 2015 +/–
Sales 3,547 3,833 8.1 %
Proportion of Henkel sales 22 % 21 % –
Operating profit (EBIT) 421 561 33.3 %
Adjusted operating profit (EBIT) 544 610 12.2 %
Return on sales (EBIT) 11.9 % 14.6 % 2.7 pp
Adjusted return on sales (EBIT) 15.3 % 15.9 % 0.6 pp
Return on capital employed (ROCE) 18.3 % 20.4 % 2.1 pp
Economic Value Added (EVA®) 226 328 45.3 %
pp = percentage points * Calculated on the basis of units of 1,000 euros;
figures commercially rounded.
Sales development * 67
in percent 2015
Change versus previous year 8.1
Foreign exchange 4.0
Adjusted for foreign exchange 4.1
Acquisitions / divestments 2.0
Organic 2.1
of which price 1.5
of which volume 0.6
* Calculated on the basis of units of 1,000 euros.
Taft UltimateThe first Taft styling range with hold level 6 for the strongest Taft hold ever. Its unique formula with liquid crystal gloss effect and ultimate-hold polymers provides a luxuri-ously luminous shine and excep-tional, previously unmatched Taft hold – for 100 percent fixation lasting up to 48 hours.
www.taft.de
Dial Miracle OilThe first Dial body wash formulated with micro-oil technology for last-ing, lightweight moisture protection – with no filmy residue. Infused with precious marula or coconut oil, this unique formula’s luxurious lather leaves skin feeling clean, beautifully soft and smooth.
www.dialsoap.com
Schwarzkopf Keratin ColorThe first caring colorant with triple keratin for extremely demanding hair. Its advanced formula with keratin cares and protects before, during and after coloring. Thanks to the innovative mix of pigments, it provides nuances that adapt harmoniously to skin tones.
www.schwarzkopf.com
Henkel Annual Report 201594 Combined management report

Economic environment and market position
In 2015, growth in the world cosmetics markets con-tinued to slow in relevant key markets. Once again, important markets experienced stagnation or decline. Despite this difficult and highly competitive market environment, the Beauty Care business unit was able to secure further market share gains and continued to strengthen its leadership position in its relevant markets.
Our Branded Consumer Goods business encountered particular market weakness in the mature markets of Western Europe and North America. In Western Europe, the environment was characterized by even more intense promotional activity, increased price pressure, and lower average prices. Despite this chal-lenging market environment, we nonetheless suc-ceeded in outperforming the relevant market overall, enabling us to gain market share.
The emerging markets in Africa/Middle East and Asia (excluding Japan) continued to grow, but at a slower pace. The markets in Latin America showed positive performance in the reporting year. The markets in Eastern Europe recorded moderate growth under constantly challenging market conditions. Thanks to the successful international launch of several product innovations, we continued to increase share overall in the emerging markets.
The hair salon market was marked by continued cus-tomer restraint and experienced further decline. In this generally difficult environment, we exceeded our sales level of the previous year and strengthened our position as the world number three in the hair salon market, with added support from the acquisi-tions made in 2014.
Business activity and strategy
The Beauty Care business unit is active in the Branded Consumer Goods business area with Hair Cosmetics, Body Care, Skin Care and Oral Care, as well as in the professional Hair Salon business.
In the Branded Consumer Goods business, we want to continue expanding our innovation leadership in the mature markets in order to further grow our mar-ket share. To this end, we pursue a consistent, pro-active innovation strategy, accompanied by strict
cost management to allow us to step up our market investments and increase profitability. We are driv-ing business development in our emerging markets through expansions to our portfolio, product innova-tions and acquisitions. In the Hair Salon business, we are continuing our strategy of globalization, with particular focus on stimulating our emerging markets.
Organic growth is at the center of our growth strat-egy. We drive this strategy by focusing on our top brands, ensuring the rapid international launch of innovations with above-average profitability, and by selectively pursuing regional expansion. Further key success factors include strong support for our top brands through focused media and promotional activities. We regularly analyze our businesses and brands as part of our pro-active portfolio manage-ment approach.
In our Branded Consumer Goods business, our focus is on the international expansion of our core busi-nesses of Hair Cosmetics, Body Care, Skin Care and Oral Care. Our growth strategy is aligned to continu-ously strengthening our top brands. Based on the specific steps we have taken, we were able to further strengthen our top 10 brands. In 2015, they grew at a faster rate than the overall portfolio, and once again accounted for more than 90 percent of sales. In addi-tion to strengthening our top brands, we focus par-ticularly on the growth potential available in our key accounts. We also continue to expand our Hair Salon business through product innovations and efficient sales and distribution structures while taking advan-tage of new regional opportunities.
Through our concerted innovation strategy and consistent strengthening of our top brands, we want to continue generating dynamic, profitable growth. In 2015, we again set the standard in the market with our innovation rate 1 of over 45 percent. And we are developing additional growth potential through the expansion of strategic partnerships with our customers.
We supplement organic growth with acquisitions. In line with our strategy, we have expanded our portfo-lio in attractive categories. Beauty Care made a num-ber of relatively small acquisitions in 2015. In July 2015, Henkel acquired the Mexican hairstyling brand Xtreme. The acquisition strengthens our market position in Mexico and further expands our emerg-ing markets business in line with our goals.
1 Percentage share of sales generated with new products launched onto the market within the last three years.
innovation rate 1.
45 %Over
Top brands
95Combined management reportHenkel Annual Report 2015
31 Corporate governance52 Shares and bonds57 Fundamental principles
of the Group65 Economic report
102 Henkel AG & Co. KGaA (condensed version according to the German Commercial Code [HGB])
106 Subsequent events
106 Risks and opportunities report114 Forecast
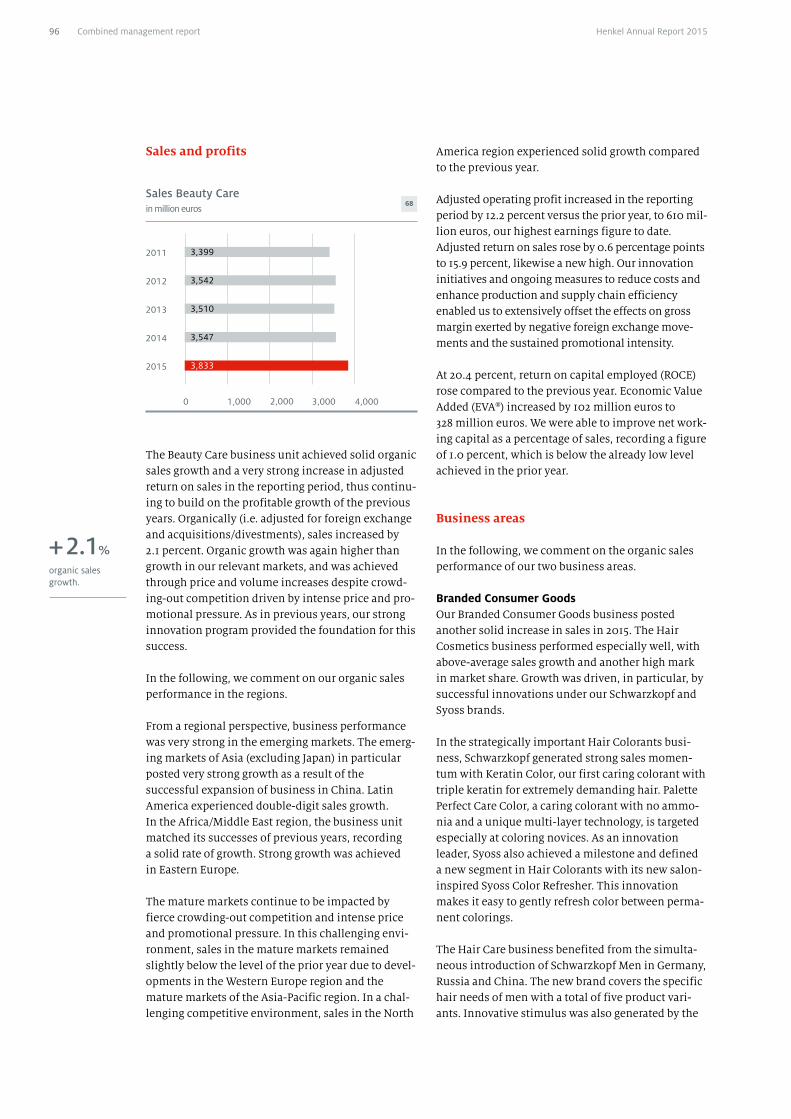
Sales and profits America region experienced solid growth compared to the previous year.
Adjusted operating profit increased in the reporting period by 12.2 percent versus the prior year, to 610 mil-lion euros, our highest earnings figure to date. Adjusted return on sales rose by 0.6 percentage points to 15.9 percent, likewise a new high. Our innovation initiatives and ongoing measures to reduce costs and enhance production and supply chain efficiency enabled us to extensively offset the effects on gross margin exerted by negative foreign exchange move-ments and the sustained promotional intensity.
At 20.4 percent, return on capital employed (ROCE) rose compared to the previous year. Economic Value Added (EVA®) increased by 102 million euros to 328 million euros. We were able to improve net work-ing capital as a percentage of sales, recording a figure of 1.0 percent, which is below the already low level achieved in the prior year.
Business areas
In the following, we comment on the organic sales performance of our two business areas.
Branded Consumer GoodsOur Branded Consumer Goods business posted another solid increase in sales in 2015. The Hair Cosmetics business performed especially well, with above-average sales growth and another high mark in market share. Growth was driven, in particular, by successful innovations under our Schwarzkopf and Syoss brands.
In the strategically important Hair Colorants busi-ness, Schwarzkopf generated strong sales momen-tum with Keratin Color, our first caring colorant with triple keratin for extremely demanding hair. Palette Perfect Care Color, a caring colorant with no ammo-nia and a unique multi-layer technology, is targeted especially at coloring novices. As an innovation leader, Syoss also achieved a milestone and defined a new segment in Hair Colorants with its new salon-inspired Syoss Color Refresher. This innovation makes it easy to gently refresh color between perma-nent colorings.
The Hair Care business benefited from the simulta-neous introduction of Schwarzkopf Men in Germany, Russia and China. The new brand covers the specific hair needs of men with a total of five product vari-ants. Innovative stimulus was also generated by the
2011
2012
2013
2014
2015
1,000 2,000 3,000 4,0000
3,542
3,510
3,547
3,833
Sales Beauty Care in million euros
68
3,399
The Beauty Care business unit achieved solid organic sales growth and a very strong increase in adjusted return on sales in the reporting period, thus continu-ing to build on the profitable growth of the previous years. Organically (i.e. adjusted for foreign exchange and acquisitions/divestments), sales increased by 2.1 percent. Organic growth was again higher than growth in our relevant markets, and was achieved through price and volume increases despite crowd-ing-out competition driven by intense price and pro-motional pressure. As in previous years, our strong innovation program provided the foundation for this success.
In the following, we comment on our organic sales performance in the regions.
From a regional perspective, business performance was very strong in the emerging markets. The emerg-ing markets of Asia (excluding Japan) in particular posted very strong growth as a result of the successful expansion of business in China. Latin America experienced double-digit sales growth. In the Africa/Middle East region, the business unit matched its successes of previous years, recording a solid rate of growth. Strong growth was achieved in Eastern Europe.
The mature markets continue to be impacted by fierce crowding-out competition and intense price and promotional pressure. In this challenging envi-ronment, sales in the mature markets remained slightly below the level of the prior year due to devel-opments in the Western Europe region and the mature markets of the Asia-Pacific region. In a chal-lenging competitive environment, sales in the North
organic sales growth.
+ 2.1%
Henkel Annual Report 201596 Combined management report

market launch of Syoss Renew 7. Applying serine protein technology, it is the first hair treatment from Syoss that repairs seven signs of hair damage. Gliss Kur Oil Nutritive, also newly launched, is the first oil repair treatment from Gliss Kur with eight precious beauty oils and keratin. The business was further energized by the innovation Schauma Spiegelglanz 24 hours with liquefied micro-crystals.
In Hair Styling, the Taft brand celebrated the 60th anniversary of its 1955 launch in Germany. The brand also reinforced its leading role with the introduction of Taft Ultimate for the strongest Taft hold ever. Building on the 2014 launch of Essence Ultîme in the Hair Care business, we introduced Styliste Ultîme, the first line of styling products created in exclusive collaboration with Claudia Schiffer. Mann-o-Mann was developed as the first men’s product line for groomed hairstyles from the trend-setting brand Got2b.
We continued to expand our market position in core markets in the Body Care business. The Fa Magic Oil line with its innovative, non-greasy micro-oil for-mula and floral fragrances generated new growth momentum. With Fa Fresh & Dry we also introduced the first high-performance antiperspirant with non-stop-fresh technology under the Fa brand. And under the men’s brand Right Guard, the innovation Heat Control was introduced to provide extra protection against odor through its heat protection formula. Business performance in North America was also boosted by the body wash Dial Miracle Oil. Infused with marula or coconut oil, it leaves skin feeling clean and soft.
In Skin Care, we added two new lines to the core brand Diadermine: With its new variant N°110 Crème de Lumière, the innovative N°110 series now features a highly effective anti-aging daily skin treatment that balances the complexion while visibly reducing wrinkles and skin discoloration. The lifting product line Diadermine Lift+ Superfiller bolsters skin from the inside out, creating a more youthful appearance and sharper contours.
The Oral Care business was especially enhanced by two developments: With Theramed Non-Stop White, Theramed introduced an innovation that not only makes teeth whiter but also protects against new dis-coloration for up to twelve hours. The formula in the new children’s toothpaste Theramed Junior was developed precisely for the needs of children to ensure healthy teeth.
Hair SalonAlthough the hair salon market recorded a decline, we were able to exceed our sales level of the previous year. This positive development was supported by solid organic growth in the North America region resulting from our acquisition of the US companies Sexy Hair, Kenra and Alterna in 2014.
In Hair Care, Schwarzkopf Professional set new stan-dards in color protection with the new BC Bonacure Color Freeze. The color-locking hair therapy for reduced fading not only seals the surface of the hair but also restores hair to its optimal pH level to strengthen its structure and lock color pigments deep inside. With BC Bonacure Miracle Oil, we offer our hair salon partners a new generation of innova-tive caring oils to provide an exceptional hair-care experience for salon clients. In addition, Schwarzkopf Professional set a new trend in colorants in partner salons worldwide. The eight new Royal Pearlescence shades from Igora with multitonal pearl effects pro-vide an additional color service for fashion-conscious salon clients.
Capital expenditures
Investments in property, plant and equipment amounted to 61 million euros compared to 68 mil-lion euros in the previous year. The investments focused on new production facilities at our plants in Germany and Slovenia, and expansion of our produc-tion site in Russia.
investments in property, plant and equipment.
€61 m
97Combined management reportHenkel Annual Report 2015
31 Corporate governance52 Shares and bonds57 Fundamental principles
of the Group65 Economic report
102 Henkel AG & Co. KGaA (condensed version according to the German Commercial Code [HGB])
106 Subsequent events
106 Risks and opportunities report114 Forecast

Adhesive Technologies
1 Adjusted for one-time charges/gains and restructuring charges.
Loctite 60sec Universal Glue Loctite 60sec Universal Glue is the first all-purpose glue from Loctite that facilitates all kinds of household repairs in only 60 seconds. The non-drip gel formula forms strong bonds faster than other Loctite all-purpose glues and is well suited for a wide range of applications on various materials – no clamping, no waiting. In Germany the product is distributed under the brand Pattex.
www.loctite-consumer.co.uk
Total SolutionA novel Total Solution improves the overall process chain for assembling mobile phones. Thanks to tailored structural adhesives, precise dispensing equipment and comprehensive customer service, Henkel provides a single point of contact for the application of bonding the mobile phone frame and cover glass.
www.loctite.com.au/mobile-bonding
Loctite GC 10Henkel is setting new standards in the electronics industry: Thanks to its unique temperature-stable formulation, the new solder paste material Loctite GC 10 eliminates the need for refrigerated shipping and warehouse storage. This enables customers to simplify their processes, reduce energy consumption and cut costs.
www.soldergamechanger.com
Sales growth
+ 2.4 %
Adjusted 1 operating profit
€1,534 m
Adjusted 1 return on sales
17.1 %organic sales growth adjusted 1 operating profit (EBIT):
up 9.4 percentadjusted 1 return on sales (EBIT): down 0.1 percentage points
Key financials * 69
in million euros 2014 2015 +/–
Sales 8,127 8,992 10.6 %
Proportion of Henkel sales 49 % 50 % –
Operating profit (EBIT) 1,345 1,462 8.7 %
Adjusted operating profit (EBIT) 1,402 1,534 9.4 %
Return on sales (EBIT) 16.6 % 16.3 % – 0.3 pp
Adjusted return on sales (EBIT) 17.2 % 17.1 % – 0.1 pp
Return on capital employed (ROCE) 19.8 % 18.4 % – 1.4 pp
Economic Value Added (EVA®) 597 626 4.8 %
pp = percentage points * Calculated on the basis of units of 1,000 euros;
figures commercially rounded.
Sales development * 70
in percent 2015
Change versus previous year 10.6
Foreign exchange 6.5
Adjusted for foreign exchange 4.1
Acquisitions / divestments 1.7
Organic 2.4
of which price 1.5
of which volume 0.9
* Calculated on the basis of units of 1,000 euros.
Highlights
Henkel Annual Report 201598 Combined management report

Economic environment and market position
The economic environment was characterized by moderate growth in the relevant markets, with expansion in the key industrial sectors lower than initially forecasted. Economic activity in the emerg-ing markets in particular weakened significantly, resulting in slower growth in our markets, including China.
Despite this difficult market environment, the Adhe-sive Technologies business unit continued to grow, with overall sales increasing in line with the market level.
Business activity and strategy
The Adhesive Technologies business unit is a leading solution provider worldwide for adhesives, sealants and functional coatings for industrial customers and also for consumers, craftsmen and building applica-tions. Through our comprehensive technology port-folio and global team of experts, we provide tailor-made solutions that create sustainable value for our customers.
We leverage our technologies, structures and sys-tems across all business areas and regions. As a global market leader, our scale and presence world-wide facilitate efficient creation and delivery of cus-tomized solutions anywhere in the world. Based on these strong synergies, the acquisition of leading technologies that complement our portfolio repre-sents an attractive option for further profitable busi-ness expansion. Our recent acquisitions demonstrate our ability to consistently integrate newly acquired businesses quickly and successfully on the basis of our standardized business processes.
In the Packaging and Consumer Goods Adhesives business area, we work with major international customers to develop innovative and sustainable solutions for the production of food packaging and consumer goods. Our customers benefit from our comprehensive applications expertise made avail-able globally through our technical customer service. Strategically cooperating with partners along the value chain also makes a significant contribution to creating more value for our customers.
In the Transport and Metal business area, we provide the automotive, aircraft and metal processing indus-tries with outstanding system solutions and special-ized technical services. Our customers are major international manufacturers and their suppliers. Through our early involvement in our customers’ design and development processes, we are able to develop innovative, customized solutions to new challenges – for example, in lightweight construc-tion. Our tailor-made products and services are based on our comprehensive technology portfolio and global applications expertise.
In the General Industry business area, we offer our customers a comprehensive portfolio of products for the manufacture and maintenance of durable goods. Our customers range from household appliance manufacturers through to operators of large-scale industrial plant, and service specialists operating in all branches of industry. In addition to providing direct support for our customers from industry, we can also tap into a global network of trained distribu-tion partners. The joint development of new adhe-sive solutions and regular systematic training for users secure our competitive advantage and contin-ued growth.
Our Electronics business area offers customers from the electronics industry a specialized portfolio of innovative high-technology adhesives and materials for the manufacture of microchips, electronic assem-blies and thermal management systems. We com-bine our expertise with targeted investments in our technology portfolio to develop innovative solutions for future product generations. Our global presence enables us to collaborate closely with development centers of major electronics firms while providing extensive support for their production processes.
Our Adhesives for Consumers, Craftsmen and Build-ing business area markets an extensive range of brand-name products for private, trade and construc-tion users. We offer innovative, sustainable products and specific system solutions based on our strong brands, quickly and efficiently translating the latest technological developments from our industrial business into corresponding products for consum-ers, craftsmen and the building industry. Our distri-bution networks are aligned to the different target groups.
Top brands
99Combined management reportHenkel Annual Report 2015
31 Corporate governance52 Shares and bonds57 Fundamental principles
of the Group65 Economic report
102 Henkel AG & Co. KGaA (condensed version according to the German Commercial Code [HGB])
106 Subsequent events
106 Risks and opportunities report114 Forecast

Active portfolio management plays a central role in continuing our profitable growth. We manage our businesses guided by specific business plans to take the best possible advantage of market opportunities, and we invest our resources with a targeted, differen-tiated approach. We aim primarily to strengthen organic growth and invest especially in attractive growth markets. To supplement this, we invest in acquisitions of leading technologies.
Expansion of our innovation and technology leader-ship is a further key component of our growth strat-egy. In 2015, the proportion of sales from products successfully launched onto the market in the last five years was around 30 percent. The consistent imple-mentation of our innovation strategy will continue, using specially developed programs, innovation processes and people initiatives to drive profitable growth. We focus our research activities on top inno-vation programs to align our R&D efforts even more closely to markets and applications with the greatest potential for growth and value creation. Further-more, the systematic search for profitable new tech-nologies and business opportunities, targeted devel-opment of new business ideas – for example by working with innovative start-ups – and close collab-oration with strategic suppliers all continue to be a central focus. Sustainability remains an important driver of growth and innovation. Working closely with our customers and suppliers is critical to advanc-ing sustainability along the entire value chain.
We reinforce our global presence through accelerated expansion of the strong positions we hold in emerg-ing markets. We accomplish this through targeted investments in capacity expansion in order to pro-vide our customers with outstanding service at the local level. In North America and Western Europe, we primarily aim to strengthen our leading market positions and further leverage economies of scale.
We also invest in strengthening our top brands. We successfully completed the consolidation of our brand portfolio into five technology cluster brands in the industrial business, and four strong brand plat-forms in the consumer business. In 2015, we gener-ated over 80 percent of our sales with our 10 biggest brands.
As part of our acquisition strategy, we strengthened our portfolio in 2015 with the purchase of Novamelt GmbH based in Wehr, Germany, on June 1, 2015, further expanding our expertise in pressure-sensitive hotmelt adhesives. In addition, as of December 14, 2015, our vacuum impregnation business was expanded with our acquisition of Magna-Tech Manufacturing LLC, Ohio, USA, and MT Canada LLC, Ohio, USA.
Sales and profits
2011
2012
2013
2014
2015
2,500 5,000 7,500 10,0000
8,256
8,117
8,127
8,992
Sales Adhesive Technologies in million euros
71
7,746
The Adhesive Technologies business unit recorded solid organic sales growth in the reporting period. Adjusted return on sales at 17.1 percent was slightly below the high level of the previous year. Organically (i.e. adjusted for foreign exchange and acquisitions/divestments), sales increased by 2.4 percent, thus growing at the same rate as the market. Growth was driven by both price and volume. Our innovative product solutions and our leading global positions contributed to this solid development.
In the following, we comment on our organic sales performance in the regions.
In the emerging markets, we achieved solid sales growth overall compared to the previous year, with very strong increases in the Latin America region. Performance in the Africa/Middle East and Eastern Europe regions was strong, despite the difficult ongoing political situation and subsequent deterio-ration in the economic conditions prevailing in parts of those regions. Sales in Asia (excluding Japan) showed positive performance.
organic sales growth.
+ 2.4 %
innovation rate 1.
30 %Around
1 Percentage share of sales generated with new products launched onto the market within the last five years.
Henkel Annual Report 2015100 Combined management report

Our sales performance in the mature markets was positive overall. Sales in the Western Europe and North America regions showed positive develop-ment. The mature markets of the Asia-Pacific region recorded solid growth.
Adjusted operating profit increased to 1,534 million euros, its highest level ever. Adjusted return on sales reached 17.1 percent and was therefore slightly below the high figure of the previous year. Ongoing mea-sures to reduce costs and enhance production and supply chain efficiency enabled us to compensate for negative transactional currency effects and increase gross margin. Lower prices for direct materials also had a positive impact.
Return on capital employed (ROCE) decreased versus the prior year to 18.4 percent, partly due to acquisi-tions. Economic Value Added (EVA®) reached 626 mil-lion euros, increasing by 29 million euros over the prior year. We were able to improve net working cap-ital as a percentage of sales. The figure of 11.5 percent was below the already low level of the previous year.
Business areas
In the following, we comment on the organic sales performance of our business areas.
Industrial AdhesivesSales in the Packaging and Consumer Goods Adhe-sives business area showed positive performance versus the previous year. The Flexible Laminates business was among the important contributors to this growth. With the acquisition of Novamelt GmbH, we further expanded our pressure-sensitive hotmelt adhesives expertise. Novamelt offers a comprehen-sive range of specialty hotmelt adhesives used pri-marily in self-adhesive labels and adhesive tape.
We posted our highest revenue increase in the Trans-port and Metal business area. Contributors to this solid growth included our Automotive Acoustics & Structurals business. Generally, our tailored innova-tions and close cooperation with our customers were again key drivers of growth in 2015. With our acquisi-tion of the Magna-Tech companies, we are now also able to provide our vacuum impregnation solutions – where we occupy a leading position in Europe – to our customers in the North American automotive industry.
The business area General Industry posted a positive sales performance, again mainly due to business involving customers in the industrial assembly mar-kets and the vehicle repair and maintenance sector. Under the Bonderite brand we introduced an innova-tive, phosphate-free product for preparing metals such as steel, zinc and aluminum, thereby under-scoring our role as a leading provider of solutions satisfying sustainability criteria.
Sales in the Electronics business area showed solid development compared to the previous year. Growth was stimulated by our business with consumer elec-tronics manufacturers and by thermal management products for the electronics industry. We introduced an important innovation under the Loctite brand: a new type of electrically conductive solder paste whose properties remain stable at room temperature over long periods of time, and which generates sub-stantial cost and efficiency advantages in transport and production for our customers.
Adhesives for Consumers, Craftsmen and BuildingSales in the business area Adhesives for Consumers, Craftsmen and Building showed a solid improvement. The increase was based in part on our construction industry business. We also introduced important innovations under our top brands Loctite, Pattex and Pritt. Additionally, to increase awareness of our Loctite brand, we successfully placed our first-ever TV commercial during the NFL Super Bowl®, the largest television sporting event in the USA.
Capital expenditures
Investments in property, plant and equipment increased to 227 million euros compared to 176 mil-lion euros in the previous year. Following our busi-ness strategy, the focus remained on expanding our production capacity in the emerging markets and constructing manufacturing facilities aligned to specific customer requirements.
investments in property, plant and equipment.
€227 m
101Combined management reportHenkel Annual Report 2015
31 Corporate governance52 Shares and bonds57 Fundamental principles
of the Group65 Economic report
102 Henkel AG & Co. KGaA (condensed version according to the German Commercial Code [HGB])
106 Subsequent events
106 Risks and opportunities report114 Forecast

The annual financial statements of Henkel AG & Co. KGaA have been prepared in accordance with the rules and regulations of the German Commercial Code [HGB] and the German Stock Corporation Act [AktG]. Deviations from the International Financial Reporting Standards (IFRS) applicable to the Group arise particularly with respect to the methods of recognition and measurement of intangible assets, financial instruments and provisions.
Operational activities
Henkel AG & Co. KGaA is operationally active in the three business units Laundry & Home Care, Beauty Care and Adhesive Technologies, as well as being the parent company of the Henkel Group. As such it is responsible for defining and pursuing Henkel’s cor-porate objectives and also for the management, con-trol and monitoring of Group-wide activities, includ-ing risk management and the allocation of resources. As of year-end 2015, the number of people employed at Henkel AG & Co. KGaA was 8,000.
The operating business of Henkel AG & Co. KGaA represents only a portion of the business activity of the entire Henkel Group and is managed across the Group by the business units, particularly on the basis of the performance indicators sales growth (organic and in the emerging markets), adjusted return on sales (EBIT) and adjusted earnings per preferred share. Only the Group approach can pro-vide complete insight into these key financials (see the discussion of the management system and per-formance indicators applicable to the Henkel Group on page 64).
The net assets, financial position and results of oper-ations of Henkel AG & Co. KGaA are influenced both by its own operating activity and by the operating activity of its subsidiaries on the basis of their divi-dend distributions. Thus the financial situation of Henkel AG & Co. KGaA generally corresponds to that of the Group as a whole, which is discussed in the section “Review of overall business performance” on page 66.
Results of operations
Sales and profits
Henkel’s performance in fiscal 2015 was solid. Busi-ness development at Henkel AG & Co. KGaA was characterized by moderate growth in the markets and a high level of competitive intensity. Nevertheless, Henkel was able to continue the solid improvement of the previous year.
At 3,994 million euros, sales of Henkel AG & Co. KGaA in 2015 were 10.8 percent above the figure of the previous year. The sales figure includes revenues of 258 million euros from the sale of inventories to the global supply chain company. This non-recurring effect and the solid sales performance of the Laundry & Home Care business unit are the main reasons why sales were much higher year on year, although we had forecasted the same level of sales in our prior-year outlook. For operating profit before alloca-tion of corporate costs and the regional management costs of our operational business units, our guidance in the previous year of moderately higher perfor-mance was confirmed.
The Laundry & Home Care business unit achieved sales of 1,076 million euros in 2015, thereby record-ing a double-digit increase. Even excluding the rev-enue from the sale of inventories to the global supply chain company of 69 million euros, sales still came in above the level of the previous year. Both our external sales and sales to our affiliated companies contributed to this solid performance.
The Beauty Care business unit achieved sales of 767 million euros in 2015, thus exceeding the prior-year figure. Excluding the revenue of 75 million euros from the sale of inventories to the global supply chain company, sales in our domestic business were below the level of the previous year. Due to the ongo-ing shift of export business to the regions, sales to affiliated companies did not reach the level of the previous year.
The Adhesive Technologies business unit achieved sales in 2015 of 1,466 million euros, thereby record-ing very strong growth. Even excluding the revenue of 114 million euros from the sale of inventories to the global supply chain company, the business unit achieved positive growth. This positive sales perfor-mance was driven by sales to our affiliated compa-nies, while external sales remained stable.
Henkel AG & Co. KGaA (condensed version according to the German Commercial Code [HGB] )*
* The full financial statements of Henkel AG & Co. KGaA with the auditor’s unqualified opinion are filed with the commercial register and accessible on the internet at www.henkel.com/reports
Henkel Annual Report 2015102 Combined management report

Expenditures for research and development in the reporting period increased by 34 million euros to 327 million euros. The ratio to sales was comparable to the previous year at 8.2 percent.
Restructuring charges of 44 million euros, included in the expense items mentioned, were slightly higher than the level of 2014 (41 million euros).
Other operating income and charges
Other operating result increased compared to the previous year by 66 million euros.
Other operating income rose year on year by 172 mil-lion euros to 611 million euros. Additional licensing income from affiliated companies contributed significantly to this increase.
At 266 million euros, other operating charges in 2015 were above the prior-year figure of 160 million euros. This increase is mainly attributable to higher licensing expenses for the use of intellectual property pooled at a German subsidiary assigned to the Adhesive Technologies business unit.
Sales in the (non-operating) Corporate segment increased from 571 million euros in 2014 to 685 mil-lion euros in 2015.
The operating profit of Henkel AG & Co. KGaA improved by 105 million euros to 121 million euros. Significant contributions came from additional licensing income and revenues from the sale of inventories to the global supply chain company.
Expense items
The cost of sales increased compared to 2014 by 275 million euros to 2,770 million euros, including 233 million euros attributable to the sale of invento-ries to the global supply chain company. Gross mar-gin declined by 0.1 percentage points to 30.7 percent.
At 842 million euros, marketing, selling and distribu-tion expenses exceeded the prior-year figure of 807 million euros. The ratio to sales was 21.1 percent, which is slightly below the level of 2014.
Administrative expenses composed primarily of payroll costs and overheads in the administrative units increased compared to the previous year by 8 million euros to 279 million euros. Their ratio to sales declined by 0.5 percentage points to 7.0 percent.
Condensed income statement in accordance with HGB 72
in million euros 2014 2015
Sales 3,603 3,994
Cost of sales – 2,495 – 2,770
Gross profit 1,108 1,224
Selling and administrative expenses – 1,078 – 1,121
Research and development expenses – 293 – 327
Other operating income / charges 279 345
Operating profit 16 121
Financial result 546 578
Profit on ordinary activities 562 699
Income from the release of transfers to special accounts with reserve element 8 8
Income before tax 570 707
Taxes on income – 32 – 91
Net income 538 616
Profit brought forward 176 150
Unappropriated profit 714 766
103Combined management reportHenkel Annual Report 2015
31 Corporate governance52 Shares and bonds57 Fundamental principles
of the Group65 Economic report
102 Henkel AG & Co. KGaA (condensed version according to the German Commercial Code [HGB])
106 Subsequent events
106 Risks and opportunities report114 Forecast

Financial result
The financial result improved from 546 million euros in 2014 to 578 million euros in 2015.
The increase is mainly attributable to higher divi-dend income from affiliated companies. This was reduced by the fall in share prices, resulting in lower income from investments held in the pension fund assets, and by the offsetting increase in interest expense for pension provisions due to a further reduction in the discount rate.
Current assets declined in 2015 from 3,054 million euros to 2,350 million euros. The change resulted primarily from a decline in receivables from affili-ated companies. The partial sale of some of our secu-rities reduced our marketable securities total by 284 million euros in 2015. The decline was partly offset by the increase of 155 million euros in liquid funds.
At 187 million euros, overfunding from offsetting the pension fund assets against the pension provisions was significantly lower than the prior-year level.
Taxes on income
In 2015, taxes on income amounted to –91 million euros following –32 million euros in the previous year.
Result for the year
Net income amounted to 616 million euros and was therefore above the result from 2014 of 538 million euros. The increase resulted primarily from the improved operating profit in 2015.
Net assets and financial position
The total assets of Henkel AG & Co. KGaA increased compared to year-end 2014 by 318 million euros to 12,614 million euros.
Non-current assets increased in 2015 by 1,207 mil-lion euros to 10,055 million euros. The increase in financial assets is primarily due to our acquisitions and various capital measures involving affiliated companies.
Condensed balance sheet in accordance with HGB 73
in million eurosDecember 31,
2014December 31,
2015
Intangible assets and property, plant and equipment 712 884
Financial assets 8,136 9,171
Non-current assets 8,848 10,055
Inventories 240 14
Receivables and miscellaneous assets 2,392 2,043
Marketable securities 288 4
Liquid funds 134 289
Current assets 3,054 2,350
Deferred income 21 22
Assets arising from the overfunding of pension obligations 373 187
Total assets 12,296 12,614
Equity 6,092 6,144
Special accounts with reserve element 112 104
Provisions 691 694
Liabilities / deferred charges 5,401 5,672
Total equity and liabilities 12,296 12,614
Henkel Annual Report 2015104 Combined management report

Equity increased from 6,092 million euros to 6,144 million euros. Provisions increased by 3 mil-lion euros to 694 million euros. The balance of pension provisions and fund assets is reported in assets due to overfunding.
Liabilities and deferred charges rose overall by 271 million euros compared to 2014, despite repay-ment of our hybrid bond in November 2015. This is mainly attributable to an increase in financial liabilities to affiliated companies.
For an overview of the financing and capital manage-ment of Henkel AG & Co. KGaA, please refer to the information about the Henkel Group on pages 74 and 75.
Risks and opportunities
The business performance of Henkel AG & Co. KGaA is essentially subject to the same risks and opportu-nities as that of the Henkel Group. With respect to the risks of its subsidiaries, Henkel AG & Co. KGaA is generally exposed in proportion to its shareholding in each case.
Due to the different discount rates for pension obli-gations under the German Commercial Code [HGB] and IFRS, the conclusion drawn from the risk assess-ment for the separate financial statements of Henkel AG & Co. KGaA differs from that of the Group. We assess the potential financial impact of this risk for Henkel AG & Co. KGaA as major.
Additional information regarding risks and opportu-nities and the risk management system can be found on pages 106 to 113.
Outlook
The performance of Henkel AG & Co. KGaA in its function as an operating holding company is influ-enced primarily by the development and dividend distributions of the companies in which it has shareholdings. Now that our supply chain operations have been carved out into a central, globally active company, the sales of Henkel AG & Co. KGaA will decrease significantly. The positive performance reported for the Group also impacts Henkel AG & Co. KGaA through dividend payments from subsidiaries. Assuming a stable financial result, we expect Henkel AG & Co. KGaA to generate unappropriated profit for 2016 at the level of the previous year. This will enable our shareholders to participate to a reasonable extent in the Group’s net income, with retained earnings also available for utilization if necessary.
The forecast for the Henkel Group can be found on pages 114 and 115.
105Combined management reportHenkel Annual Report 2015
31 Corporate governance52 Shares and bonds57 Fundamental principles
of the Group65 Economic report
102 Henkel AG & Co. KGaA (condensed version according to the German Commercial Code [HGB])
106 Subsequent events
106 Risks and opportunities report114 Forecast

Subsequent events
On January 18, 2016, Henkel announced that Chair-man of the Management Board Kasper Rorsted will leave the company at his own request as of April 30, 2016. He served on the Henkel Management Board for 11 years, thereof 8 years as Chairman of the Management Board. Effective May 1, 2016, Hans Van Bylen has been appointed as his successor. His suc-cessful career at Henkel started in 1984, and he has been a member of the Management Board since 2005, responsible for the Beauty Care business. His early appointment to Chairman of the Management Board in spring will enable him to lead the develop-ment of the new strategy that Henkel will announce at the end of this year, and to drive its successful execution.
Risks and opportunities report
Risks and opportunities
In the pursuit of our business activities, Henkel is exposed to multiple risks inherent in the global mar-ket economy. We deploy an array of effective monit-oring and control systems aligned to identifying risks at an early stage, evaluating the exposure, and introducing effective countermeasures. We have incorporated these instruments within a risk management system as described below.
Entrepreneurial activity also involves identifying and exploiting opportunities as a means of securing and extending the corporation’s competitiveness. The reporting aspect of our risk management system, however, does not encompass entrepreneurial opportunity. Early and regular identification, analy-sis and exploitation of opportunities is performed at the Group level and within the individual business units. This is a fundamental component of our strat-egy. We perform in-depth analysis of the markets and our competitors, and study the relevant cost varia-bles and key success factors.
Risk management system
The risk management system at Henkel is integrated into the comprehensive planning, controlling, and reporting systems used in the subsidiaries, in the business units, and at Group level. Our early warning system and Internal Audit function are also impor-tant components of our risk management system. Within the corporate governance framework, our internal control and compliance management sys-tems support our risk management capability. The risk reporting system encompasses the systematic identification, evaluation, documentation and com-munication of risks. We have defined the principles, processes and responsibilities relating to risk man-agement in a corporate standard that is binding on the Henkel Group. With the continuous development of our corporate standards and systems, we take into account updated findings.
Within our risk strategy framework, the assumption of calculated risk is an intrinsic part of our business. However, risks that endanger the existence of the company must be avoided. When it is not possible to avoid these critical risks, they must be reduced or transferred, for example through insurance. Risks are
Henkel Annual Report 2015106 Combined management report

controlled and monitored at the level of the sub-sidiaries, the business units, and the Group. Risk management is thus performed with a holistic, inte-grative approach to the systematic handling of risks.
We understand risks as potential future develop-ments or events that could lead to negative devia-tions from our guidance. Risks with a probability of occurrence of over 50 percent are taken into account in our guidance and short-term planning. As a rule, we estimate risks for the one-year forecast period.
The annual risk reporting process begins with identi-fying material risks using checklists based on defined operating (for example procurement and production) and functional (for example information technology and human resources) risk categories. We evaluate the risks in a two-stage process according to the prob-ability of occurrence and potential loss. Included in the risk report are risks with a loss potential of at least 1 million euros or 10 percent of the net external sales of a country, where the probability of occurrence is considered greater than zero.
The first step entails determining gross risk to the extent that this is possible. We then calculate the net risk, taking countermeasures into account. Initially, risks are compiled on a decentralized, per-country basis, with the assistance of regional coordinators. The locally collated risks are then analyzed by experts in the business units and corporate functions. In par-ticular areas such as Corporate Treasury, risks are determined with the support of sensitivity analyses including value-at-risk computations. Risk analyses are then prepared for the respective executive com-mittees of the business units and corporate functions, and finally assigned to an area-specific risk inventory. The risk situation is subsequently reported to our Compliance & Risk Committee, the Management Board and the various supervising boards. Material unforeseen changes are reported immediately to the CFO and the Compliance & Risk Committee. Corporate Accounting is responsible for coordinating the overall process and analyzing the inventoried exposures.
The risk reporting process is supported by a web-based database which ensures transparent commu-nication throughout the entire Group. Our Internal Audit function regularly reviews the quality and function of our risk management system. Within the framework of the 2015 audit of our annual financial statements, our external auditor examined the struc-ture and function of our risk early warning system in accordance with Section 317 (4) of the German Com-mercial Code [HGB] and confirmed its compliance.
The following describes the main features of the internal control and risk management system in relation to our accounting processes, in accordance with Section 315 (2) no. 5 HGB. Corresponding with the definition of our risk management system, the objective of our accounting processes lies in the identification, evaluation and management of all risks that jeopardize the regulatory preparation of our annual and consolidated financial statements. Accordingly, the internal control system’s function is to implement relevant principles, procedures and controls so as to ensure the financial statement closing process is regulatory compliant. Within the organization of the internal control system, the Man-agement Board assumes overriding responsibility at Group level. The duly coordinated subsystems of the internal control system lie within the responsibility of the Corporate Accounting, Controlling, Corporate Treasury, Compliance and Regional Finance func-tions. Within these functions, there are a number of integrated monitoring and control levels. These are assessed by regular and comprehensive effectiveness tests performed by our Internal Audit function. Of the multifaceted control processes incorporated into the accounting process, several are important to highlight.
The basis for all our accounting processes is provided by our corporate standard “Accounting,” which con-tains detailed accounting and reporting instructions covering all material circumstances, including clear procedures for inventory valuation or how transfer prices applicable for intra-group transactions should be determined. This corporate standard is binding on the entire Group and is regularly updated and approved by the CFO. The local Presidents and Heads of Finance of all consolidated subsidiaries must con-firm their compliance with this corporate standard on an annual basis.
Further globally binding procedural instructions affecting our accounting practice are contained in our corporate standards “Treasury” and “Investments.” Through appropriate organizational measures in con-junction with restrictive access to our information systems, we ensure segregation of duties in our accounting systems between transaction entry on the one hand, and checking and approval on the other. Documentation relating to the operational accounting and closing processes ensures that important tasks – such as the reconciliation of receivables and payables on the basis of account balance confirmations – are clearly assigned. Additionally, binding authorization regulations exist governing the approval of contracts, credit notes and the like, with strict adherence to the
107Combined management reportHenkel Annual Report 2015
31 Corporate governance52 Shares and bonds57 Fundamental principles
of the Group65 Economic report
102 Henkel AG & Co. KGaA (condensed version according to the German Commercial Code [HGB])
106 Subsequent events
106 Risks and opportunities report114 Forecast

Major risk categories 74
Risk category Probability Potential financial impact
Operating risks
Procurement market risks Low Major
Production risks Moderate Major
Macroeconomic and sector-specific risks High Major
Functional risks
Financial risks
Credit risk Low Major
Liquidity risk Low Minor
Currency risk High Major
Interest rate risk Moderate Minor
Risks from pension obligations High Minor
Legal risks Low Major
IT risks Low Major
Personnel risks Low Moderate
Risks in connection with our brand image or reputation of the company Low Major
Environmental and safety risks Low Major
Business strategy risks Moderate Moderate
Classification of risks in ascending order 75
Probability
Low 1 – 9 %
Moderate 10 – 24 %
High ≥ 25 %
Potential financial impact
Minor 1 – 49 million euros
Moderate 50 – 99 million euros
Major ≥ 100 million euros
principle of dual control as a mandatory requirement. This is also stipulated in our Group-wide corporate standards.
The significant risks for Henkel and the correspond-ing controls with respect to the regulatory prepara-tion of our annual and consolidated financial state-ments are collated in a central documentation pack. This documentation is reviewed and updated annu-ally by the respective process owners. The established systems are regularly reviewed with regard to their improvement and optimization potential. We con-sider these systems to be appropriate and effective.
The accounting activities for subsidiaries included in the consolidated financial statements are performed either locally by the subsidiary or through a shared
service center, taking the corporate standards into account. The individual subsidiaries’ financial state-ments are transferred to our central consolidation system and checked at corporate level for correct-ness. After all consolidation steps have been com-pleted, the consolidated financial statements are prepared by Corporate Accounting in consultation with the specialist departments. Preparation of the combined management report is coordinated by Investor Relations in cooperation with each business unit and corporate function. The Management Board then compiles the consolidated financial statements and annual financial statements of Henkel AG & Co. KGaA, and the combined management report for the Group, and subsequently presents these documents to the Supervisory Board for approval.
Major risk categories
Risks are presented from a net perspective, where their respective mitigation measures are taken into account.
Operating risks
Procurement market risksDescription of risk: We expect prices for direct mate-rials in our procurement markets to remain more or
Henkel Annual Report 2015108 Combined management report

less unchanged overall in 2016 compared to 2015. However, due to geopolitical, global economic, and climatic uncertainties, we expect prices to fluctuate in the course of the year. As a result of this uncertainty as it relates to the development of raw material prices that cannot always be passed on in full, we see risks arising beyond the forecasted stability in relation to important raw materials and packaging materials.
The segments in the industrial goods sector are affected to a greater extent by these price risks than the individual segments in the consumer goods sec-tor. Additional price and supply risks exist due to possible demand or production-related shortages in the procurement markets. In particular, continued unrest in the Africa/Middle East region, and the con-flict between Russia and Ukraine, could lead to rising material prices and supply shortages.
Measures: The measures taken include active sup-plier portfolio management through our globally engaged, cross-divisional sourcing capability, together with strategies aimed at securing price and volume both through contracts and, where appropriate and possible, through financial hedging instruments. Fur-thermore, we work in interdisciplinary teams within Research and Development, Supply Chain Manage-ment and Purchasing on devising alternative formula-tions and packaging forms so as to be able to respond flexibly to unforeseen fluctuations in raw material prices. We also avoid becoming dependent on individ-ual suppliers so as to better secure the constant supply of the goods and services that we require. Finally, close collaboration with our strategic suppliers plays an exceptionally important role in our risk manage-ment. Further details regarding the assessment of supplier financial stability can be found in the section on “Procurement” on pages 79 to 81. The basis for our risk management approach is a comprehensive pro-curement information sy stem aimed at ensuring per-manent transparency with respect to our purchasing volumes.
Impact: Low probability rating, possible major impact on our earnings guidance.
Production risksDescription of risk: Henkel faces production risks in the event of low capacity utilization due to volume decreases and unplanned operational interruptions, especially at our single-source sites.
Measures: We can offset the negative effects of pos-sible production outages through flexible production control and, where economically viable, insurance policies. Such production risks are minimized by ensuring high employee qualification, clearly defined safety standards, and regular plant and equipment maintenance. Capital expenditure decisions on prop-erty, plant and equipment are made in accordance with defined, differentiated responsibility proce-dures and approval processes. They incor porate all relevant specialist functions and are regulated in an internal corporate standard. Investments are analyzed in advance on the basis of detailed risk aspects. Further auditing accompanying projects provides the founda-tion for project management and risk reduction.
Impact: Moderate probability rating, possible major impact on our earnings guidance.
Macroeconomic and sector-specific risksDescription of risk: We remain exposed to macro-economic risks emanating from the uncertainties of the current geopolitical and economic environment. We currently see geopolitical risk arising in connec-tion with the increased number of conflict zones. A decline in the macroeconomic environment poses a risk to the industrial sector in particular. A downturn in consumer spending is relevant for the consumer goods segments. A further significant risk is posed by an increasingly competitive environment, as this could result in stronger price and promotional pres-sures in the consumer goods sector. As consolidation in the retail sector continues and private labels occupy a growing share of the market, crowding-out competition in the consumer goods sector could intensify. The risk of product substitution inherent in this could, in principle, affect all business units.
Measures: We focus on continuously strengthening our brands (see separate risk description on pages 111 and 112) and consistently developing further innova-tions. We consider innovative products to be a signif-icant success factor for our company, enabling us to differentiate ourselves from the competition. Fur-thermore, we also pursue specific sales and market-ing initiatives, for example advertising and promo-tional activities. In addition, we have the capability to react quickly to potential sales declines through flexible production control.
Impact: High probability rating, possible major impact on our sales and earnings guidance.
109Combined management reportHenkel Annual Report 2015
31 Corporate governance52 Shares and bonds57 Fundamental principles
of the Group65 Economic report
102 Henkel AG & Co. KGaA (condensed version according to the German Commercial Code [HGB])
106 Subsequent events
106 Risks and opportunities report114 Forecast

Functional risks
Financial risksDescription of risk: Henkel is exposed to financial risk in the form of credit risks, liquidity risks, cur-rency risks, interest rate risks, and risks arising from pension obligations.
For the description of credit risks, liquidity risks, currency risks and interest rate risks, please refer to the notes to the consolidated financial statements on pages 161 to 167. For the risks arising from our pension obligations, please see pages 149 and 150.
Measures: Risk-mitigating measures and the management of these risks are also described in the notes to the consolidated financial statements on the pages mentioned.
Impact: We classify financial risks as follows:• Credit risk with a low probability of a major impact
on our earnings guidance • Liquidity risk with a low probability of a minor
impact on our earnings guidance• Currency risk with a high probability of a major
impact on our earnings guidance• Interest rate risk with a moderate probability of a
minor impact on our earnings guidance• Risks arising from our pension obligations with a
high probability of a minor impact on our earnings guidance, and with a high probability of a major impact on our equity
Legal and regulatory risksDescription of risk: As a globally active corporation we are exposed, in the course of our ordinary business activities, to a range of risks relating to litigations and other actions, including government agency pro-ceedings in which we are currently involved or may become involved in the future. These risks arise, in particular, in the fields of product liability, product deficiency, competition and cartel law, infringement of proprietary rights, patent law, tax law, environ-mental protection and soil contamination. We cannot rule out the likelihood of negative rulings on current litigations and further litigations being initiated in the future.
Our business is subject to various national rules and regulations and – within the European Union (EU) – increasingly to harmonized laws applying through-out the EU. In addition, some of our operations are subject to rules and regulations derived from approv-als, licenses, certificates or permits. Our manufactur-
ing operations are bound by rules and regulations with respect to the registration, evaluation, usage, storage, transportation and handling of certain sub-stances and also in relation to emissions, wastewa-ter, effluent and other waste. The construction and operation of production facilities and other plant and equipment are governed by framework rules and regulations, including those relating to the decon-tamination of soil. Violation of such regulations may lead to legal proceedings or compromise our future business activities.
Measures: Our internal standards, guidelines, codes of conduct, and training measures are geared to ensuring compliance with statutory regulations and, for example, the safety of our manufacturing facili-ties and products. These requirements have also been incorporated into our management systems and are regularly audited. Ensuring compliance with laws and regulations is an integral component of our business processes. This includes the early monitor-ing and evaluation of relevant statutory and regula-tory requirements and changes. Henkel has estab-lished a Group-wide compliance organization with locally and regionally responsible compliance offi-cers led by a globally responsible General Counsel & Chief Compliance Officer (details can be found in the corporate governance report on pages 31 to 40). In addition, our corporate legal department maintains constant contact with local counsel. Current pro-ceedings and potential risks are recorded in a sepa-rate reporting system. For certain legal risks, we have concluded insurance policies that are standard for the industry and that we consider to be appropriate. However, the outcome of proceedings is inherently difficult to foresee, especially in cases in which the claimant is seeking substantial or unspecified dam-ages. In view of this, we are unable to predict what obligations may arise from such litigations. Conse-quently, major losses may result from litigations and proceedings that are not covered by our insurance policies or provisions.
Impact: Low probability rating, possible major impact on our earnings guidance.
Information technology risksDescription of risk: Information technology has strategic significance for Henkel. Our business processes rely to a great extent on internal and exter-nal IT services, applications, networks, and infra-structure systems. The failure or disruption of criti-cal IT services and the manipulation or loss of data constitute material risks for Henkel. The failure of
Henkel Annual Report 2015110 Combined management report
computer networks or disruption of important IT applications can impair critical business processes. The loss of confidential data, for example formula-tions, customer data or price lists, could benefit our competition. Henkel’s reputation could also be dam-aged by such loss.
Measures: The technical and organizational safe-guards for protecting information at Henkel are based on the international standards ISO 27001 and 27002. Major components include the classification of information, business processes, IT applications, and IT infrastructure safeguards with respect to con-fidentiality, availability, integrity, and data protec-tion requirements, as well as measures for avoiding risk. In addition, Henkel has put technical and orga-nizational measures in place to prevent, discover and defeat cyber attacks. As a member of Cyber Security Sharing and Analytics (CSSA) e.V., Henkel also main-tains regular contact with other major corporations to enable the early detection of threats and imple-mentation of effective countermeasures.
Our critical business processes operate through redundantly configured systems designed for high availability. Our data backup procedures reflect state-of-the-art technology and practice. We regularly review our restore and disaster-recovery processes. We develop our systems using proven project man-agement and program modification procedures.
Access to buildings and areas containing IT systems, access to computer networks and applications, as well as user authorizations for our information sys-tems, are strictly limited to the minimum level nec-essary. For critical business processes, the required segregation of duties is enforced by technological means.
Our networks are protected against unauthorized external access where economically viable. Operating systems and anti-virus software are automatically updated to their latest version on a continual basis.
We inform and instruct our employees in the proper and secure use of information systems as part of their regular duties.
The implementation of our security measures is continually reviewed by our Internal Audit function, other internal departments, and independent third parties.
Impact: Low probability rating, possible major impact on our earnings guidance.
Personnel risksDescription of risk: The motivation and the qualifi-cation of our employees are key drivers of Henkel’s business success. Therefore, it is strategically impor-tant to recruit highly qualified professionals and executives and ensure they stay with the company. In selecting and employing talent, we compete globally for qualified professionals and executives. In this context, we are acutely aware of the effects of demo-graphic change in many of our markets. The change exposes us to the risk of losing valuable employees or being unable to recruit relevant qualified profes-sionals and executives.
Measures: We combat the risk of losing valuable employees through specifically devised personnel development programs and incentive systems. Supporting this is an established, thorough annual review process from which we derive individually tailored and future-viable qualification programs as well as performance-related remuneration systems. We also provide a health management and consulta-tion service on a global scale for our employees, aligned to their age and circumstances.
We reduce the risk of not being able to recruit quali-fied professionals and executives by expanding our employer branding initiatives and through targeted cooperation with colleges and universities in all regions where we conduct business. Our attractive-ness as an employer is reinforced by our focus on pro-moting talent and specialized development programs.
Further information relating to our employees can be found on pages 76 to 79.
Impact: Low probability rating, possible moderate impact on our earnings guidance.
Risks in connection with brand image or reputation of the companyDescription of risk: As a globally active corporation, Henkel is exposed to potential damage to its image in the event of negative reports in the media – includ-ing social media – regarding Henkel’s corporate brand or individual product brands, particularly in the consumer goods sector. These could lead to a negative impact on sales.
111Combined management reportHenkel Annual Report 2015
31 Corporate governance52 Shares and bonds57 Fundamental principles
of the Group65 Economic report
102 Henkel AG & Co. KGaA (condensed version according to the German Commercial Code [HGB])
106 Subsequent events
106 Risks and opportunities report114 Forecast

Measures: We minimize these risks through the measures described under legal and regulatory risks (see page 110). These are designed to ensure that our production facilities and products are safe. We also pursue a policy of pro-active public relations man-agement that serves to reinforce our corporate brand and individual product brands. These measures are supported by a global communication network, and international and local crisis management systems with regular training sessions and crisis response planning.
Impact: Low probability rating, possible major impact on our sales and earnings guidance.
Environmental and safety risksDescription of risk: Henkel is a global manufactur-ing corporation and is therefore exposed to risks per-taining to the environment, safety, health, and social standards, manifesting in the form of personal injury, physical damage to goods, and reputational damage. Soil contamination and the associated remediation expense as well as leakage or other technical failures could give rise to direct costs for the corporation. Furthermore, indirect costs such as fines, claims for compensation or reputational damage may also be incurred.
Measures: We minimize these risks through the mea-sures described under legal and regulatory risks (see page 110), and through our auditing, advisory and training activities. We update these preventive mea-sures continuously in order to ensure that our facili-ties, assets and reputation are properly safeguarded. We ensure compliance with high technical standards, rules of conduct, and relevant statutory requirements as a further means of preserving our assets, and put our corporate values – one of which is sustainability – into practice.
Impact: Low probability rating, possible major impact on our earnings guidance.
Business strategy risksDescription of risk: Business strategy risks can arise from the expectations we set for internal projects, acquisitions and strategic alliances failing to materi-alize. The associated capital expenditures may not generate the originally anticipated value added due to internal or external influences. Individual projects could also be delayed or even halted by unforeseen events.
Measures: We combat these risks through compre-hensive project management. We limit exposure through financial viability assessments in the review, decision, and implementation phases. These assess-ments are performed by specialist departments, sup-ported by external consultants where appropriate. Project transparency and control are supported by our management systems.
Impact: Moderate probability rating, possible mod-erate impact on our earnings guidance.
Major opportunity categories
Entrepreneurial opportunities are identified and evaluated at Group level and in the individual busi-ness units, and duly incorporated into the strategy and planning processes. We understand the opportu-nities presented in the following as potential future developments or events that could lead to a positive deviation from our guidance. We also assess the probabilities of price-related procurement market and financial opportunities.
Procurement market opportunitiesDescription of opportunities: Countervailing the procurement market risks listed on pages 108 and 109, opportunities may also arise in which the influencing factors described in this section develop in a direc-tion that is advantageous to Henkel.
Impact: Low probability rating, possible major impact on our earnings guidance.
Henkel Annual Report 2015112 Combined management report

Macroeconomic and sector-specific opportunitiesDescription of opportunities: Additional business opportunities would arise if the uncertain geopoliti-cal and macroeconomic situation in some regions, or the economic conditions in individual sectors develop substantially better than expected.
Impact: The opportunities described could have a major impact on our sales and earnings guidance.
Financial opportunitiesDescription of opportunities: Countervailing the currency and interest risks indicated under financial risks, and the risks arising from pension obligations as described on page 110, opportunities may also arise in which the influencing factors described in this section develop in a direction that is advanta-geous to Henkel.
Impact: We classify financial opportunities as follows:• Currency opportunities with a low probability of a
major impact on our earnings guidance• Interest rate opportunities with a moderate prob-
ability of a minor impact on our earnings guidance• Opportunities arising from our pension obliga-
tions with a low probability of a minor impact on our earnings guidance, and with a high probability of a major impact on our equity
Acquisition opportunitiesDescription of opportunities: Acquisitions are an essential component of our strategy.
Impact: Large acquisitions could have a major impact on our earnings guidance.
Research and development opportunitiesDescription of opportunities: Opportunities arising from our predominantly continuous innova-tion process are an essential component of our strat-egy and are already accounted for in our guidance. There are additional opportunities in the event of product introductions that exceed our expectations of market acceptance, and in the development of exceptional innovations that have not yet been taken into account.
Impact: Innovations arising from future research and development could have a major impact on our sales and earnings guidance.
Risks and opportunities in summary
At the time this report was prepared, there were no identifiable risks related to future developments that could endanger the existence either of Henkel AG & Co. KGaA, or a material subsidiary included in the consolidation, or the Group, as a going concern. As we have no special purpose vehicles, there is no risk that might originate from such a source.
Compared to the previous year, our expectation of the likelihood and/or of the possible financial impact of individual risk and opportunity categories has changed slightly. Overall, however, the risk and opportunities situation has not altered to any signifi-cant degree.
The system of risk categorization adopted by Henkel continues to indicate that the most significant expo-sure currently relates to the impact of macroecono-mic and sector uncertainty together with financial risks, to which we are responding with the counter-measures described above. The Management Board remains confident that the earning power of the Group forms a solid foundation for future business development and provides the necessary resources to leverage our opportunities.
113Combined management reportHenkel Annual Report 2015
31 Corporate governance52 Shares and bonds57 Fundamental principles
of the Group65 Economic report
102 Henkel AG & Co. KGaA (condensed version according to the German Commercial Code [HGB])
106 Subsequent events
106 Risks and opportunities report114 Forecast

Forecast
Macroeconomic development
Our assessment of future world economic develop-ment is based on data provided by IHS Global Insight.
Overview: moderate gross domestic product growth of approximately 3 percentGlobal economic growth is expected to remain no more than moderate in 2016. IHS expects gross domestic product to grow by approximately 3 percent.
The mature markets should grow by approximately 2 percent. The North American economy is likely to grow by around 3 percent, Japan’s economy is expected to expand by approximately 1 percent. For Western Europe, IHS anticipates growth of approxi-mately 2 percent.
The emerging markets will likely achieve robust economic growth of around 4 percent in 2016, but developments are expected to vary widely between individual regions and countries. Economic output should increase by around 5 percent in Asia (exclud-ing Japan) and by around 3 percent in the Africa/ Middle East region. IHS expects Latin America to show further decline in 2016. An increase of around 2 percent is expected in the Eastern Europe region.
Direct materials: approximately at the level of the previous year; high volatilityWe expect that, overall, prices for direct materials in 2016 will remain approximately at the level of the previous year. In light of prevailing geopolitical and global economic uncertainties, we expect the high volatility in the procurement markets to continue.
Currencies: continued high volatilityWe expect continued high volatility in the currency markets. We anticipate a stronger average US dollar rate for 2016 compared to 2015. By contrast, major currencies in the emerging markets may weaken.
Inflation: moderate rise in global price levelsGlobal inflation of approximately 3 percent is pre-dicted in 2016. While IHS expects a high degree of price stability for the mature markets, with a rise of approximately 1 percent, the inflation rate in the emerging regions is likely to average approximately 6 percent.
It is likely that the recent geopolitical and economic developments and the sharp decline in oil prices will have negative effects on economic activity and exchange rates in individual countries and regions.
Sector development
Consumption and the retail sector: growth of around 3 percentIHS anticipates that global private consumption will increase by around 3 percent in 2016. In the mature markets, consumers are likely to spend approximately 2.5 percent more than in the previous year. The emerging markets should again demonstrate a somewhat higher propensity to spend, with a rise of approximately 3.5 percent in 2016.
Industry: growth of around 3 percentIndustrial production should expand globally by around 3 percent year on year, matching the world economy as a whole.
IHS expects the transport industry to expand produc-tion by around 3 percent. The metal industry is esti-mated to grow by around 2 percent. Production in the electronics sector will likely grow by approximately 4 percent. Growth in the consumer-related sectors, such as the global packaging industry, is expected to be in the low single-digit range, as in the previous year.
IHS expects global construction to expand by around 3 percent.
Henkel Annual Report 2015114 Combined management report

Outlook for the Henkel Group in 2016
We expect the Henkel Group to generate organic sales growth of 2 to 4 percent in fiscal 2016. Our expectation is that each business unit will generate organic sales growth within this range.
We furthermore expect a slight increase in the share of sales from our emerging markets.
The starting point for our expected organic sales growth is our strong competitive position. We have consolidated and further developed this in recent years through our innovative strength, strong brands and leading market positions, as well as the quality of our portfolio.
In recent years we have introduced a number of mea-sures that have had a positive effect on our cost struc-ture. Also in this year, we intend to continue adapting our structures to constantly changing market condi-tions and to maintain our strict cost discipline. Through optimization and standardization of pro-cesses and continued expansion of our shared ser-vices, we can pool activities and thus further improve our efficiency while simultaneously enhancing the quality of our customer service. Moreover, the opti-mization of our production and logistics networks will contribute to improving our cost structures.
These factors, together with the expected increase in sales, will have a positive effect on our earnings per-formance. For adjusted return on sales (EBIT), we anticipate an increase versus prior year to approxi-mately 16.5 percent. The adjusted return on sales of the individual business units is expected to be at or above the level of the previous year. We expect an increase in adjusted earnings per preferred share of between 8 and 11 percent.
Furthermore, we have the following expectations for 2016:• Prices for raw materials, packaging, and purchased
goods and services approximately at the level of the previous year
• Restructuring charges of 150 to 200 million euros• Investments in property, plant and equipment and
intangible assets of between 650 and 700 million euros
DividendsIn accordance with our dividend policy and depend-ing on the company’s asset and profit positions as well as its financial requirements, we expect a divi-dend payout by Henkel AG & Co. KGaA in the range of 25 percent to 35 percent of net income after non-con-trolling interests, and adjusted for exceptional items.
Capital expendituresWe are planning to increase our investments in prop-erty, plant and equipment and intangible assets to between 650 and 700 million euros in fiscal 2016. We intend to allocate our budget to expanding our busi-nesses in the emerging markets and the mature mar-kets in approximately equal proportions.
Considerable investments are planned in the Laun-dry & Home Care and Beauty Care business units for expanding production in Europe and Africa/Middle East. In the Adhesive Technologies business unit, the focus will be on further expanding our produc-tion capacity in the emerging markets of Asia and Eastern Europe. In addition, investments in IT infra-structure will contribute substantially to optimizing our processes.
115Combined management reportHenkel Annual Report 2015
31 Corporate governance52 Shares and bonds57 Fundamental principles
of the Group65 Economic report
102 Henkel AG & Co. KGaA (condensed version according to the German Commercial Code [HGB])
106 Subsequent events
106 Risks and opportunities report114 Forecast

Consolidated financial statements 118 Consolidated statement of
financial position
120 Consolidated statement of income
121 Consolidated statement of comprehensive income
121 Consolidated statement of changes in equity
122 Consolidated statement of cash flows
123 Notes to the consolidated financial statements – Group segment report by business unit
124 Notes to the consolidated financial statements – Key financials by region
125 Notes to the consolidated financial statements – Accounting principles and methods applied in preparation of the consolidated financial statements
133 Notes to the consolidated financial statements – Notes to the consolidated statement of financial position
133 Intangible assets
137 Property, plant and equipment
139 Other financial assets
139 Other assets
140 Deferred taxes
140 Inventories
140 Trade accounts receivable
141 Cash and cash equivalents
141 Assets and liabilities held for sale
141 Issued capital
142 Capital reserve
142 Retained earnings
143 Other components of equity
143 Non-controlling interests
143 Pension obligations
151 Income tax provisions and other provisions
153 Borrowings
154 Other financial liabilities
154 Other liabilities
154 Trade accounts payable
155 Financial instruments report
116 Henkel Annual Report 2015Consolidated financial statements

168 Notes to the consolidated financial statements – Notes to the consolidated statement of income
168 Sales and principles of income recognition
168 Cost of sales
168 Marketing, selling and distribution expenses
168 Research and development expenses
168 Administrative expenses
169 Other operating income
169 Other operating charges
169 Financial result
170 Taxes on income
172 Non-controlling interests
173 Notes to the consolidated financial statements – Other disclosures
173 Reconciliation of adjusted net income
173 Payroll cost and employee structure
173 Share-based payment plans
174 Group segment report
176 Earnings per share
177 Consolidated statement of cash flows
177 Contingent liabilities
177 Other unrecognized financial commitments
178 Voting rights / Related party disclosures
178 Exercise of exemption options
179 Remuneration of the corporate management bodies
179 Declaration of compliance with the German Corporate Governance Code [DCGK]
179 Subsidiaries and other investments
179 Auditor’s fees and services
180 Independent Auditor’s Report
182 Recommendation for the approval of the annual financial statements and the appropriation of the profit of Henkel AG & Co. KGaA
183 Responsibility statement by the Personally Liable Partner
184 Corporate management bodies of Henkel AG & Co. KGaA
117Henkel Annual Report 2015 Consolidated financial statements
C
onso
lidat
ed f
inan
cial
sta
tem
ents

Consolidated statement of financial position
Assets 76
in million euros Note 2014 % 2015 %
Intangible assets 1 10,590 50.5 11,682 52.3
Property, plant and equipment 2 2,461 11.8 2,661 11.9
Other financial assets 3 114 0.5 63 0.3
Income tax refund claims 7 – 7 –
Other assets 4 140 0.7 177 0.8
Deferred tax assets 5 838 4.0 816 3.7
Non-current assets 14,150 67.5 15,406 69.0
Inventories 6 1,671 8.0 1,721 7.7
Trade accounts receivable 7 2,747 13.1 2,944 13.2
Other financial assets 3 676 3.2 540 2.4
Income tax refund claims 174 0.8 196 0.9
Other assets 4 284 1.4 330 1.5
Cash and cash equivalents 8 1,228 5.9 1,176 5.3
Assets held for sale 9 31 0.1 10 –
Current assets 6,811 32.5 6,917 31.0
Total assets 20,961 100.0 22,323 100.0
Henkel Annual Report 2015118 Consolidated financial statements
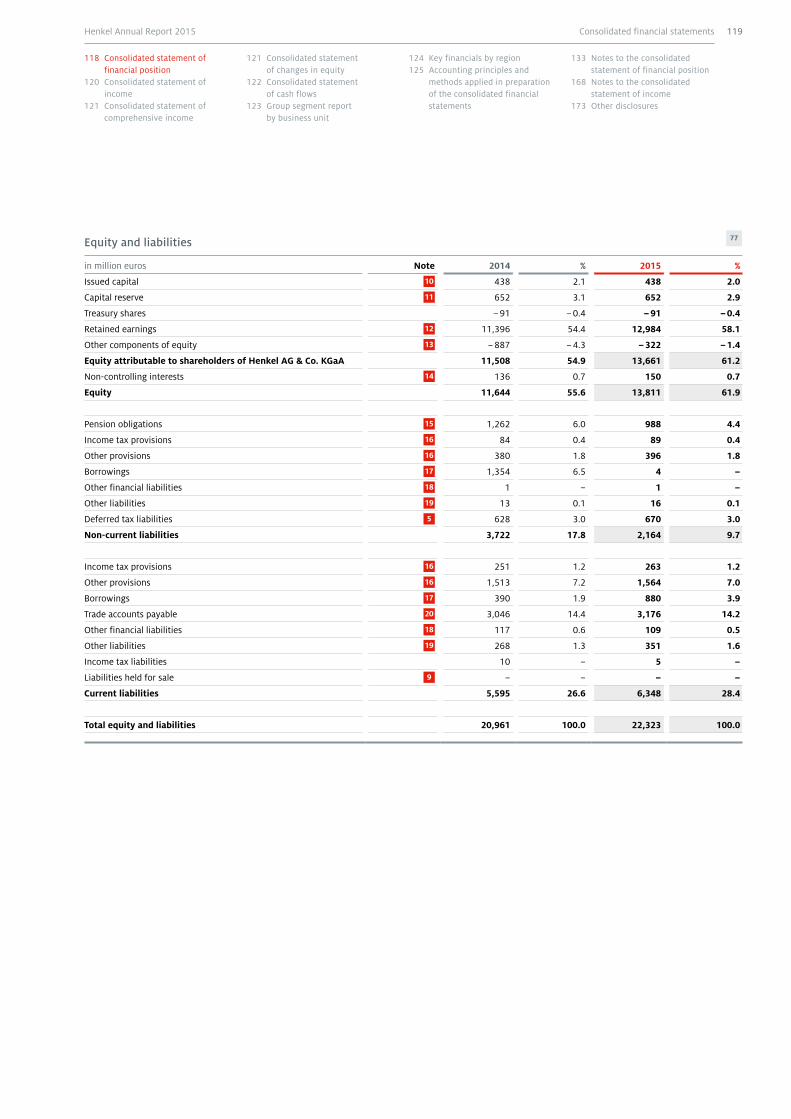
Equity and liabilities 77
in million euros Note 2014 % 2015 %
Issued capital 10 438 2.1 438 2.0
Capital reserve 11 652 3.1 652 2.9
Treasury shares – 91 – 0.4 – 91 – 0.4
Retained earnings 12 11,396 54.4 12,984 58.1
Other components of equity 13 – 887 – 4.3 – 322 – 1.4
Equity attributable to shareholders of Henkel AG & Co. KGaA 11,508 54.9 13,661 61.2
Non-controlling interests 14 136 0.7 150 0.7
Equity 11,644 55.6 13,811 61.9
Pension obligations 15 1,262 6.0 988 4.4
Income tax provisions 16 84 0.4 89 0.4
Other provisions 16 380 1.8 396 1.8
Borrowings 17 1,354 6.5 4 –
Other financial liabilities 18 1 – 1 –
Other liabilities 19 13 0.1 16 0.1
Deferred tax liabilities 5 628 3.0 670 3.0
Non-current liabilities 3,722 17.8 2,164 9.7
Income tax provisions 16 251 1.2 263 1.2
Other provisions 16 1,513 7.2 1,564 7.0
Borrowings 17 390 1.9 880 3.9
Trade accounts payable 20 3,046 14.4 3,176 14.2
Other financial liabilities 18 117 0.6 109 0.5
Other liabilities 19 268 1.3 351 1.6
Income tax liabilities 10 – 5 –
Liabilities held for sale 9 – – – –
Current liabilities 5,595 26.6 6,348 28.4
Total equity and liabilities 20,961 100.0 22,323 100.0
119Consolidated financial statementsHenkel Annual Report 2015
118 Consolidated statement of financial position
120 Consolidated statement of income
121 Consolidated statement of comprehensive income
121 Consolidated statement of changes in equity
122 Consolidated statement of cash flows
123 Group segment report by business unit
124 Key financials by region125 Accounting principles and
methods applied in preparation of the consolidated financial statements
133 Notes to the consolidated statement of financial position
168 Notes to the consolidated statement of income
173 Other disclosures

Consolidated statement of income 78
in million euros Note 2014 % 2015 % +/–
Sales 22 16,428 100.0 18,089 100.0 10.1 %
Cost of sales 1 23 – 8,712 – 53.0 – 9,368 – 51.8 7.5 %
Gross profit 7,716 47.0 8,721 48.2 13.0 %
Marketing, selling and distribution expenses 1 24 – 4,151 – 25.3 – 4,608 – 25.5 11.0 %
Research and development expenses 1 25 – 413 – 2.5 – 478 – 2.6 15.7 %
Administrative expenses 1 26 – 852 – 5.2 – 1,012 – 5.6 18.8 %
Other operating income 27 109 0.7 127 0.7 16.5 %
Other operating charges 28 – 165 – 1.0 – 105 – 0.6 – 36.4 %
Operating profit (EBIT) 2,244 13.7 2,645 14.6 17.9 %
Interest income 39 0.2 28 0.2 – 28.2 %
Interest expense – 48 – 0.2 – 45 – 0.2 – 6.3 %
Other financial result – 46 – 0.3 – 24 – 0.2 – 47.8 %
Investment result 6 – – 1 – –
Financial result 29 – 49 – 0.3 – 42 – 0.2 – 14.3 %
Income before tax 2,195 13.4 2,603 14.4 18.6 %
Taxes on income 30 – 533 – 3.3 – 635 – 3.5 19.1 %
Tax rate in % 24.3 24.4
Net income 1,662 10.1 1,968 10.9 18.4 %
Attributable to non-controlling interests 31 34 0.2 47 0.3 38.2 %
Attributable to shareholders of Henkel AG & Co. KGaA 1,628 9.9 1,921 10.6 18.0 %
Earnings per ordinary share – basic and diluted in euros 3.74 4.42 18.2 %
Earnings per preferred share – basic and diluted in euros 3.76 4.44 18.1 %
Additional voluntary information 79
in million euros Note 2014 2015 +/–
EBIT (as reported) 2,244 2,645 17.9 %
One-time gains – 28 – 15 2 –
One-time charges 159 100 3 –
Restructuring charges 1 213 193 –
Adjusted EBIT 2,588 2,923 12.9 %
Adjusted return on sales in % 15.8 16.2 0.4 pp
Adjusted tax rate in % 24.0 25.0 1.0 pp
Adjusted net income – Attributable to shareholders of Henkel AG & Co. KGaA 32 1,896 2,112 11.4 %
Adjusted earnings per ordinary share in euros 4.36 4.86 11.5 %
Adjusted earnings per preferred share in euros 4.38 4.88 11.4 %
1 Restructuring charges 2015: 193 million euros (2014: 213 million euros), of which: cost of sales 18 million euros (2014: 82 million euros); marketing, selling and distribution expenses 87 million euros (2014: 48 million euros); research and development expenses 14 million euros (2014: 3 million euros); administrative expenses 74 million euros (2014: 80 million euros).
2 Gains from performance-related purchase price components.3 Includes 60 million euros related to optimization of our IT system architecture for managing business processes (2014: 39 million euros), 18 million euros for
provisions related to legal disputes (2014: 109 million euros), 14 million euros for remediation obligations (2014: 0 million euros), and 8 million euros for inciden-tal acquisition costs (2014: 10 million euros).
120 Henkel Annual Report 2015Consolidated financial statements

Consolidated statement of comprehensive income
See Notes 15 and 21 for further explanatory information
80
in million euros 2014 2015
Net income 1,662 1,968
Components to be reclassified to income:
Exchange differences on translation of foreign operations 627 593
Gains/losses from derivative financial instruments (hedge reserve per IAS 39) 15 – 17
Gains/losses from financial instruments in the available-for-sale category (Available-for-sale reserve) 1 –
Components not to be reclassified to income:
Remeasurements from defined benefit plans – 266 265
Other comprehensive income (net of taxes) 377 841
Total comprehensive income for the period 2,039 2,809
Attributable to non-controlling interests 48 58
Attributable to shareholders of Henkel AG & Co. KGaA 1,991 2,751
Consolidated statement of changes in equity
See Notes 10 to 14 for further explanatory information
81
in million euros
Issued capital
Other components of equity
Ordinary shares
Preferred shares
Capital reserve
Treasury shares
Retained earnings
Currency trans-lation
Hedge reserve
per IAS 39
Available- for-sale reserve
Share-holders
of Henkel AG & Co.
KGaA
Non-con-trolling
interests
Total
At January 1, 2014 260 178 652 – 91 10,561 – 1,336 – 182 2 10,044 114 10,158
Net income – – – – 1,628 – – – 1,628 34 1,662
Other comprehensive income – – – – – 266 613 15 1 363 14 377
Total comprehensive income for the period – – – – 1,362 613 15 1 1,991 48 2,039
Dividends – – – – – 525 – – – – 525 – 23 – 548
Sale of treasury shares – – – – – – – – – – –
Changes in ownership interest with no change in control – – – – – 2 – – – – 2 – 2 – 4
Other changes in equity – – – – – – – – – – 1 – 1
At December 31, 2014 / January 1, 2015 260 178 652 – 91 11,396 – 723 – 167 3 11,508 136 11,644
Net income – – – – 1,921 – – – 1,921 47 1,968
Other comprehensive income – – – – 265 582 – 17 – 830 11 841
Total comprehensive income for the period – – – – 2,186 582 – 17 0 2,751 58 2,809
Dividends – – – – – 564 – – – – 564 – 33 – 597
Sale of treasury shares – – – – – – – – – – –
Changes in ownership interest with no change in control – – – – – 34 – – – – 34 – 11 – 45
Other changes in equity – – – – – – – – – – –
At December 31, 2015 260 178 652 – 91 12,984 – 141 – 184 3 13,661 150 13,811
121Consolidated financial statementsHenkel Annual Report 2015
118 Consolidated statement of financial position
120 Consolidated statement of income
121 Consolidated statement of comprehensive income
121 Consolidated statement of changes in equity
122 Consolidated statement of cash flows
123 Group segment report by business unit
124 Key financials by region125 Accounting principles and
methods applied in preparation of the consolidated financial statements
133 Notes to the consolidated statement of financial position
168 Notes to the consolidated statement of income
173 Other disclosures

Consolidated statement of cash flows
See Note 37 for further explanatory information
82
in million euros 2014 2015
Operating profit (EBIT) 2,244 2,645
Income taxes paid – 567 – 715
Amortization/depreciation/impairment/write-ups of intangible assets and property, plant and equipment 1 416 460
Net gains/losses on disposal of intangible assets and property, plant and equipment, and from divestments – 1 – 26
Change in inventories – 103 – 25
Change in trade accounts receivable – 184 – 140
Change in other assets 3 – 79
Change in trade accounts payable 55 77
Change in other liabilities and provisions 51 187
Cash flow from operating activities 1,914 2,384
Purchase of intangible assets and property, plant and equipment, including payments on account – 531 – 625
Acquisition of subsidiaries and other business units – 1,719 – 322
Purchase of associated companies and joint ventures held at equity – – 6
Proceeds on disposal of subsidiaries and other business units 6 25
Proceeds on disposal of intangible assets and property, plant and equipment 13 35
Cash flow from investing activities – 2,231 – 893
Dividends paid to shareholders of Henkel AG & Co. KGaA – 525 – 564
Dividends paid to non-controlling shareholders – 23 – 33
Interest received 202 130
Interest paid – 203 – 155
Dividends and interest paid and received – 549 – 622
Repayment of bonds – 1,030 – 1,300
Other changes in borrowings 275 275
Allocation to pension funds – 87 – 60
Other changes in pension obligations – 62 – 79
Purchase of non-controlling interests with no change of control – 12 – 52
Other financing transactions 2 1,912 283
Cash flow from financing activities 447 – 1,555
Net change in cash and cash equivalents 130 – 64
Effect of exchange rates on cash and cash equivalents 37 12
Change in cash and cash equivalents 167 – 52
Cash and cash equivalents at January 1 1,061 3 1,228
Cash and cash equivalents at December 31 1,228 1,176
1 Of which: Impairment in fiscal 2015: 16 million euros (fiscal 2014: 35 million euros).2 Other financing transactions in fiscal 2015 include payments of – 472 million euros for the purchase of short-term
securities and time deposits as well as provision of financial collateral (fiscal 2014: – 941 million euros). 3 Cash and cash equivalents at January 1, 2014 include cash and cash equivalents of 10 million euros which are
reported in the statement of financial position as held for sale and result in the amount shown of 1,051 million euros.
Additional voluntary information Reconciliation to free cash flow 83
in million euros 2014 2015
Cash flow from operating activities 1,914 2,384
Purchase of intangible assets and property, plant and equipment, including payments on account – 531 – 625
Proceeds on disposal of intangible assets and property, plant and equipment 13 35
Net interest paid – 1 – 25
Other changes in pension obligations – 62 – 79
Free cash flow 1,333 1,690
122 Henkel Annual Report 2015Consolidated financial statements
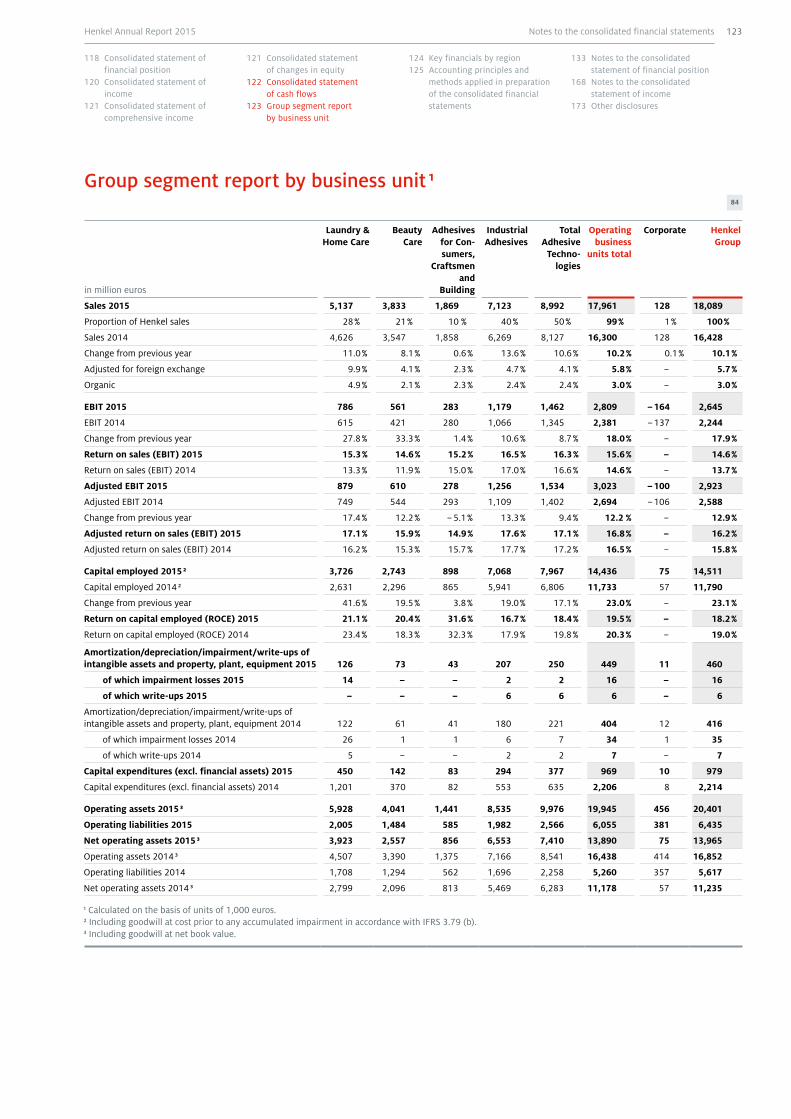
Group segment report by business unit 1 84
in million euros
Laundry & Home Care
Beauty Care
Adhesives for Con-sumers,
Craftsmen and
Building
Industrial Adhesives
Total Adhesive
Techno-logies
Operating business
units total
Corporate Henkel Group
Sales 2015 5,137 3,833 1,869 7,123 8,992 17,961 128 18,089
Proportion of Henkel sales 28 % 21 % 10 % 40 % 50 % 99 % 1 % 100 %
Sales 2014 4,626 3,547 1,858 6,269 8,127 16,300 128 16,428
Change from previous year 11.0 % 8.1 % 0.6 % 13.6 % 10.6 % 10.2 % 0.1 % 10.1 %
Adjusted for foreign exchange 9.9 % 4.1 % 2.3 % 4.7 % 4.1 % 5.8 % – 5.7 %
Organic 4.9 % 2.1 % 2.3 % 2.4 % 2.4 % 3.0 % – 3.0 %
EBIT 2015 786 561 283 1,179 1,462 2,809 – 164 2,645
EBIT 2014 615 421 280 1,066 1,345 2,381 – 137 2,244
Change from previous year 27.8 % 33.3 % 1.4 % 10.6 % 8.7 % 18.0 % – 17.9 %
Return on sales (EBIT) 2015 15.3 % 14.6 % 15.2 % 16.5 % 16.3 % 15.6 % – 14.6 %
Return on sales (EBIT) 2014 13.3 % 11.9 % 15.0 % 17.0 % 16.6 % 14.6 % – 13.7 %
Adjusted EBIT 2015 879 610 278 1,256 1,534 3,023 – 100 2,923
Adjusted EBIT 2014 749 544 293 1,109 1,402 2,694 – 106 2,588
Change from previous year 17.4 % 12.2 % – 5.1 % 13.3 % 9.4 % 12.2 % – 12.9 %
Adjusted return on sales (EBIT) 2015 17.1 % 15.9 % 14.9 % 17.6 % 17.1 % 16.8 % – 16.2 %
Adjusted return on sales (EBIT) 2014 16.2 % 15.3 % 15.7 % 17.7 % 17.2 % 16.5 % – 15.8 %
Capital employed 2015 2 3,726 2,743 898 7,068 7,967 14,436 75 14,511
Capital employed 2014 2 2,631 2,296 865 5,941 6,806 11,733 57 11,790
Change from previous year 41.6 % 19.5 % 3.8 % 19.0 % 17.1 % 23.0 % – 23.1 %
Return on capital employed (ROCE) 2015 21.1 % 20.4 % 31.6 % 16.7 % 18.4 % 19.5 % – 18.2 %
Return on capital employed (ROCE) 2014 23.4 % 18.3 % 32.3 % 17.9 % 19.8 % 20.3 % – 19.0 %
Amortization/depreciation/impairment/write-ups of intangible assets and property, plant, equipment 2015 126 73 43 207 250 449 11 460
of which impairment losses 2015 14 – – 2 2 16 – 16
of which write-ups 2015 – – – 6 6 6 – 6
Amortization/depreciation/impairment/write-ups of intangible assets and property, plant, equipment 2014 122 61 41 180 221 404 12 416
of which impairment losses 2014 26 1 1 6 7 34 1 35
of which write-ups 2014 5 – – 2 2 7 – 7
Capital expenditures (excl. financial assets) 2015 450 142 83 294 377 969 10 979
Capital expenditures (excl. financial assets) 2014 1,201 370 82 553 635 2,206 8 2,214
Operating assets 2015 3 5,928 4,041 1,441 8,535 9,976 19,945 456 20,401
Operating liabilities 2015 2,005 1,484 585 1,982 2,566 6,055 381 6,435
Net operating assets 2015 3 3,923 2,557 856 6,553 7,410 13,890 75 13,965
Operating assets 2014 3 4,507 3,390 1,375 7,166 8,541 16,438 414 16,852
Operating liabilities 2014 1,708 1,294 562 1,696 2,258 5,260 357 5,617
Net operating assets 2014 3 2,799 2,096 813 5,469 6,283 11,178 57 11,235
1 Calculated on the basis of units of 1,000 euros.2 Including goodwill at cost prior to any accumulated impairment in accordance with IFRS 3.79 (b).3 Including goodwill at net book value.
123Notes to the consolidated financial statementsHenkel Annual Report 2015
118 Consolidated statement of financial position
120 Consolidated statement of income
121 Consolidated statement of comprehensive income
121 Consolidated statement of changes in equity
122 Consolidated statement of cash flows
123 Group segment report by business unit
124 Key financials by region125 Accounting principles and
methods applied in preparation of the consolidated financial statements
133 Notes to the consolidated statement of financial position
168 Notes to the consolidated statement of income
173 Other disclosures

Key financials by region 1 85
in million euros
Western Europe
Eastern Europe
Africa/ Middle
East
North America
Latin America
Asia- Pacific
Total Regions
Corporate Henkel Group
Sales 2 2015 6,045 2,695 1,329 3,648 1,110 3,134 17,961 128 18,089
Sales 2 2014 5,724 2,854 1,133 2,884 1,029 2,676 16,300 128 16,428
Change from previous year 5.6 % – 5.6 % 17.3 % 26.5 % 7.9 % 17.1 % 10.2 % – 10.1 %
Adjusted for foreign exchange 4.6 % 7.1 % 6.8 % 6.6 % 10.3 % 3.6 % 5.8 % – 5.7 %
Organic – 0.3 % 7.3 % 6.8 % 2.3 % 8.8 % 2.5 % 3.0 % – 3.0 %
Proportion of Group sales 2015 34 % 15 % 7 % 20 % 6 % 17 % 99 % 1 % 100 %
Proportion of Group sales 2014 35 % 17 % 7 % 18 % 6 % 16 % 99 % 1 % 100 %
Operating profit (EBIT) 2015 1,223 356 141 544 110 434 2,809 – 164 2,645
Operating profit (EBIT) 2014 1,046 378 121 420 73 343 2,381 – 137 2,244
Change from previous year 16.9 % – 5.7 % 16.8 % 29.5 % 50.5 % 26.6 % 18.0 % – 17.9 %
Adjusted for foreign exchange 15.5 % 10.9 % 3.5 % 5.7 % 51.1 % 5.9 % 12.1 % – 12.7 %
Return on sales (EBIT) 2015 20.2 % 13.2 % 10.6 % 14.9 % 9.9 % 13.9 % 15.6 % – 14.6 %
Return on sales (EBIT) 2014 18.3 % 13.2 % 10.7 % 14.6 % 7.1 % 12.8 % 14.6 % – 13.7 %
1 Calculation on the basis of units of 1,000 euros.2 By location of company.
In 2015, the affiliated companies domiciled in Germany, including Henkel AG & Co. KGaA, generated sales of 2,345 mil-lion euros (previous year: 2,280 million euros). Sales realized by the affiliated companies domiciled in the USA amounted to 3,422 million euros in 2015 (previous year: 2,672 million euros). In fiscal 2014 and 2015, no individual customer accounted for more than 10 percent of total sales.
Of the total non-current assets disclosed for the Henkel Group at December 31, 2015 (excluding financial instruments and deferred tax assets) amounting to 14,539 million euros (previ-ous year: 13,203 million euros), 1,842 million euros (previous year: 1,479 million euros) was attributable to the affiliated companies domiciled in Germany, including Henkel AG & Co. KGaA. The non-current assets (excluding financial instru-ments and deferred tax assets) recognized in respect of the affiliated companies domiciled in the USA amounted to 7,308 million euros at December 31, 2015 (previous year: 6,404 million euros).
124 Henkel Annual Report 2015Notes to the consolidated financial statements

Accounting principles and methods applied in preparation of the consolidated financial statements
General information
The consolidated financial statements of Henkel AG & Co. KGaA, Düsseldorf, as of December 31, 2015 have been prepared in accordance with International Financial Reporting Stan-dards (IFRS) and the relevant interpretations of the Interna-tional Financial Reporting Interpretations Committee (IFRIC), as adopted per Regulation number 1606/2002 of the European Parliament and the Council, on the application of international accounting standards in the European Union, and in compli-ance with Section 315a of the German Commercial Code [HGB].
The individual financial statements of the companies included in the consolidation are drawn up on the same accounting date, December 31, 2015, as that of Henkel AG & Co. KGaA.
Members of the KPMG organization or other independent firms of auditors instructed accordingly have audited the financial statements of the material companies included in the consoli-dation. The Management Board of Henkel Management AG – which is the Personally Liable Partner of Henkel AG & Co. KGaA – compiled the consolidated financial statements on Janu-ary 29, 2016 and approved them for forwarding to the Super-visory Board and for publication.
The consolidated financial statements are based on the prin-ciple of historical cost with the exception that certain financial instruments are accounted for at their fair values, and pension obligations are measured using the projected unit credit method. The functional currency of Henkel AG & Co. KGaA and the reporting currency of the Group is the euro. Unless otherwise indicated, all amounts are shown in million euros. In order to improve the clarity and informative value of the consolidated financial statements, certain items are combined in the consoli-dated statement of financial position, the consolidated state-ment of income and the consolidated statement of compre-hensive income, and then shown separately in the notes.
Scope of consolidation
In addition to Henkel AG & Co. KGaA as the ultimate parent company, the consolidated financial statements at December 31, 2015 include nine German and 192 non-German companies in which Henkel AG & Co. KGaA has a dominating influence over financial and operating policy, based on the concept of con-trol. The Group has a dominating influence on a company when it is exposed, or has rights, to variable returns from its involvement with the company and has the ability to affect those returns through its power over the company.
The following table shows the changes to the scope of consoli-dation in fiscal 2015:
Scope of consolidation 86
At January 1, 2015 206
Additions 13
Mergers – 15
Disposals – 2
At December 31, 2015 202
Further details can be found in the section “Acquisitions and divestments” on the two pages overleaf.
Subsidiaries which are of secondary importance to the Group and to the presentation of a true and fair view of our net assets, financial position and results of operations due to their inactivity or low level of activity are generally not included in the consolidated financial statements. The total assets of these companies represent less than 1 percent of the Group’s total assets; their total sales and income (net of taxes) are also less than 1 percent of the Group totals.
125Notes to the consolidated financial statementsHenkel Annual Report 2015
118 Consolidated statement of financial position
120 Consolidated statement of income
121 Consolidated statement of comprehensive income
121 Consolidated statement of changes in equity
122 Consolidated statement of cash flows
123 Group segment report by business unit
124 Key financials by region125 Accounting principles and
methods applied in preparation of the consolidated financial statements
133 Notes to the consolidated statement of financial position
168 Notes to the consolidated statement of income
173 Other disclosures
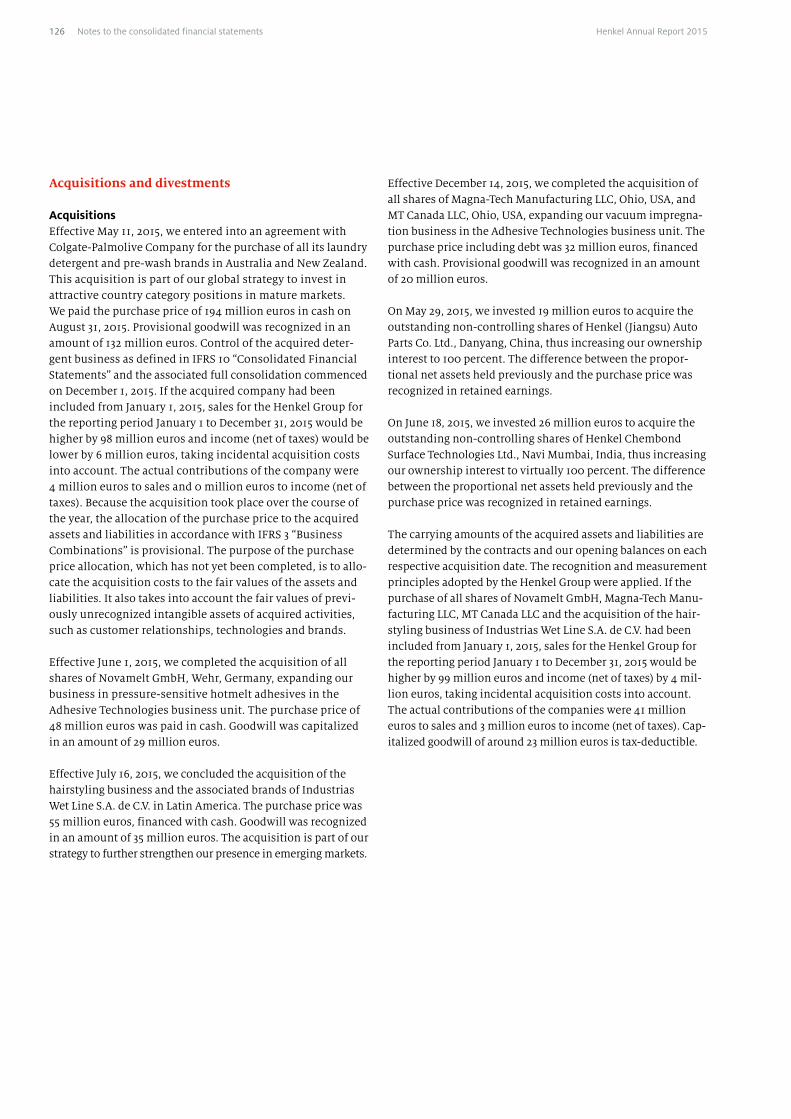
Acquisitions and divestments
AcquisitionsEffective May 11, 2015, we entered into an agreement with Colgate-Palmolive Company for the purchase of all its laundry detergent and pre-wash brands in Australia and New Zealand. This acquisition is part of our global strategy to invest in attractive country category positions in mature markets. We paid the purchase price of 194 million euros in cash on August 31, 2015. Provisional goodwill was recognized in an amount of 132 million euros. Control of the acquired deter-gent business as defined in IFRS 10 “Consolidated Financial Statements” and the associated full consolidation commenced on December 1, 2015. If the acquired company had been included from January 1, 2015, sales for the Henkel Group for the reporting period Janu ary 1 to December 31, 2015 would be higher by 98 million euros and income (net of taxes) would be lower by 6 million euros, taking incidental acquisition costs into account. The actual contributions of the company were 4 million euros to sales and 0 million euros to income (net of taxes). Because the acquisition took place over the course of the year, the allocation of the purchase price to the acquired assets and liabilities in accordance with IFRS 3 “Business Combinations” is provisional. The purpose of the purchase price allocation, which has not yet been completed, is to allo-cate the acquisition costs to the fair values of the assets and liabilities. It also takes into account the fair values of previ-ously unrecognized intangible assets of acquired activities, such as customer relationships, technologies and brands.
Effective June 1, 2015, we completed the acquisition of all shares of Novamelt GmbH, Wehr, Germany, expanding our business in pressure-sensitive hotmelt adhesives in the Adhesive Technologies business unit. The purchase price of 48 million euros was paid in cash. Goodwill was capitalized in an amount of 29 million euros.
Effective July 16, 2015, we concluded the acquisition of the hairstyling business and the associated brands of Industrias Wet Line S.A. de C.V. in Latin America. The purchase price was 55 million euros, financed with cash. Goodwill was recognized in an amount of 35 million euros. The acquisition is part of our strategy to further strengthen our presence in emerging markets.
Effective December 14, 2015, we completed the acquisition of all shares of Magna-Tech Manufacturing LLC, Ohio, USA, and MT Canada LLC, Ohio, USA, expanding our vacuum impregna-tion business in the Adhesive Technologies business unit. The purchase price including debt was 32 million euros, financed with cash. Provisional goodwill was recognized in an amount of 20 million euros.
On May 29, 2015, we invested 19 million euros to acquire the outstanding non-controlling shares of Henkel (Jiangsu) Auto Parts Co. Ltd., Danyang, China, thus increasing our ownership interest to 100 percent. The difference between the propor-tional net assets held previously and the purchase price was recognized in retained earnings.
On June 18, 2015, we invested 26 million euros to acquire the outstanding non-controlling shares of Henkel Chembond Surface Technologies Ltd., Navi Mumbai, India, thus increasing our ownership interest to virtually 100 percent. The difference between the proportional net assets held previously and the purchase price was recognized in retained earnings.
The carrying amounts of the acquired assets and liabilities are determined by the contracts and our opening balances on each respective acquisition date. The recognition and measurement principles adopted by the Henkel Group were applied. If the purchase of all shares of Novamelt GmbH, Magna-Tech Manu-facturing LLC, MT Canada LLC and the acquisition of the hair-styling business of Industrias Wet Line S.A. de C.V. had been included from January 1, 2015, sales for the Henkel Group for the reporting period January 1 to December 31, 2015 would be higher by 99 million euros and income (net of taxes) by 4 mil-lion euros, taking incidental acquisition costs into account. The actual contributions of the companies were 41 million euros to sales and 3 million euros to income (net of taxes). Cap-italized goodwill of around 23 million euros is tax-deductible.
126 Henkel Annual Report 2015Notes to the consolidated financial statements

Reconciliation of the purchase price to provisional goodwill 87
in million euros 2015
Colgate-Palmolive Company’s detergent business in Australia, New Zealand effective December 1, 2015
Purchase price 194
Adjustment based on purchase agreement 27
Adjusted purchase price 221
Fair value of the acquired assets and liabilities 89
Provisional goodwill 132
Others
Purchase price 143
Fair value of the acquired assets and liabilities 51
Provisional goodwill 92
Acquisitions 88
Detergent business in Australia,
New Zealand effective December 1, 2015
Others
in million euros Fair value Fair value Total
Provisional goodwill 132 92 224
Other intangible assets 81 38 119
Property, plant and equipment – 11 11
Other non-current assets 3 – 3
Non-current assets 216 141 357
Inventories 5 6 11
Trade accounts receivable – 10 10
Other current assets – – –
Liquid funds – 2 2
Current assets 5 18 23
Total assets 221 159 380
Net assets 221 143 364
Non-current liabilities – 10 10
Other current provisions / liabilities – 2 2
Trade accounts payable – 4 4
Current liabilities – 6 6
Total equity and liabilities 221 159 380
DivestmentsEffective January 30, 2015, we concluded the sale of our chemi-cal additives business for the processing industry in the Adhe-sive Technologies business unit in the USA. These assets were included in assets held for sale as of December 31, 2014. The sale price was 29 million euros.
The net assets, financial position and results of operations of the company were not materially impacted by divestments in fiscal 2015.
127Notes to the consolidated financial statementsHenkel Annual Report 2015
118 Consolidated statement of financial position
120 Consolidated statement of income
121 Consolidated statement of comprehensive income
121 Consolidated statement of changes in equity
122 Consolidated statement of cash flows
123 Group segment report by business unit
124 Key financials by region125 Accounting principles and
methods applied in preparation of the consolidated financial statements
133 Notes to the consolidated statement of financial position
168 Notes to the consolidated statement of income
173 Other disclosures

Consolidation methods
The financial statements of Henkel AG & Co. KGaA and of the subsidiaries included in the consolidated financial statements were prepared on the basis of uniformly valid principles of rec-ognition and measurement, applying the standardized year-end date adopted by the Group. Such entities are included in the consolidated financial statements as of the date on which the Group acquired control.
All receivables and liabilities, sales, income and expenses, as well as intra-group profits on transfers of non-current assets or inventories, are eliminated on consolidation.
The purchase method is used for capital consolidation. With business combinations, therefore, all hidden reserves and hid-den charges in the entity acquired are revalued at the time of acquisition, and all identifiable intangible assets are sepa-rately disclosed if they are clearly separable or if their recogni-tion arises from a contractual or other legal right. Any differ-ence arising between the acquisition cost and the (share of) net assets after purchase price allocation is recognized as goodwill. The goodwill of subsidiaries is measured in the functional currency of the subsidiary.
Entities acquired are included in the consolidation for the first time as subsidiaries by offsetting the carrying amount of the respective parent company’s investment in them against their assets and liabilities. Contingent consideration is recognized at fair value as of the date of first-time consolidation. Subse-quent changes in value do not result in an adjustment to the valuation at the time of acquisition. (Incidental) costs related to the acquisition of subsidiaries are not included in the pur-chase price. Instead, they are recognized through profit or loss in other operating charges in the period in which they occur.
In the recognition of acquisitions of less than 100 percent, non-controlling interests are measured at the fair value of the share of net assets that they represent.
In subsequent years, the carrying amount of the Henkel AG & Co. KGaA investment is eliminated against the current (share of) equity in the subsidiary entities concerned.
Changes in the shareholdings of subsidiary companies result-ing in a decrease or an increase in the participating interests of the Group without loss of control are recognized within equity as changes in ownership without loss of control.
As soon as the control of a subsidiary is relinquished, all the assets and liabilities and the non-controlling interests, and also the accumulated currency translation gains or losses, are derecognized. In the event that Henkel continues to own non-controlling interests in the non-consolidated entity, these are measured at fair value. The result of deconsolidation is recognized under other operating income or charges.
Companies recognized by the equity method
Associated companies and joint ventures are recognized by the equity method.
An associated company is a company over which the Group can exercise material influence on the financial and operating policies without controlling it. Material influence is generally assumed when the Group holds 20 percent or more of the vot-ing rights. Where a Group company conducts transactions with an associated company or a joint venture, the resulting profits or losses are eliminated in accordance with the share of the Group in that company.
The Group consolidates Dekel Investment Holdings Ltd. and Vitriflex, Inc. using the equity method. The carrying amount of the shareholdings recognized at equity as of December 31, 2015 was 12 million euros (previous year: 5 million euros).
128 Henkel Annual Report 2015Notes to the consolidated financial statements

Currency translation
The annual financial statements of the consolidated compa-nies, including the hidden reserves and hidden charges of Group companies recognized by the purchase method, good-will arising on consolidation, and the consolidated statement of cash flows, are translated into euros using the functional currency method outlined in International Accounting Stan-dard (IAS) 21 “The Effects of Changes in Foreign Exchange Rates.” The functional currency is the currency in which a for-eign company predominantly generates funds and makes payments. As the functional currency for all the companies included in the consolidation is generally the local currency of the company concerned, assets and liabilities are translated
at closing rates, while income and expenses are translated at the average rates for the year as an approximation of the actual rates at the date of the transaction. Equity items are recognized at historical exchange rates. The differences arising from using average rather than closing rates are taken to equity and shown as other components of equity or non-controlling interests, and remain neutral in respect of net income until the shares are divested.
In the subsidiaries’ annual financial statements, transactions in foreign currencies are converted at the rates prevailing at the time of the transaction. Financial assets and liabilities in foreign currencies are measured at closing rates through profit or loss. For the main currencies in the Group, the following exchange rates have been used based on 1 euro:
Currencies 89
ISO code Average exchange rate Exchange rate on December 31
2014 2015 2014 2015
Chinese yuan CNY 8.19 6.97 7.54 7.06
Mexican peso MXN 17.66 17.61 17.87 18.91
Polish zloty PLN 4.18 4.18 4.27 4.26
Russian ruble RUB 50.87 68.05 72.34 80.67
Turkish lira TRY 2.91 3.02 2.83 3.18
US dollar USD 1.33 1.11 1.21 1.09
129Notes to the consolidated financial statementsHenkel Annual Report 2015
118 Consolidated statement of financial position
120 Consolidated statement of income
121 Consolidated statement of comprehensive income
121 Consolidated statement of changes in equity
122 Consolidated statement of cash flows
123 Group segment report by business unit
124 Key financials by region125 Accounting principles and
methods applied in preparation of the consolidated financial statements
133 Notes to the consolidated statement of financial position
168 Notes to the consolidated statement of income
173 Other disclosures
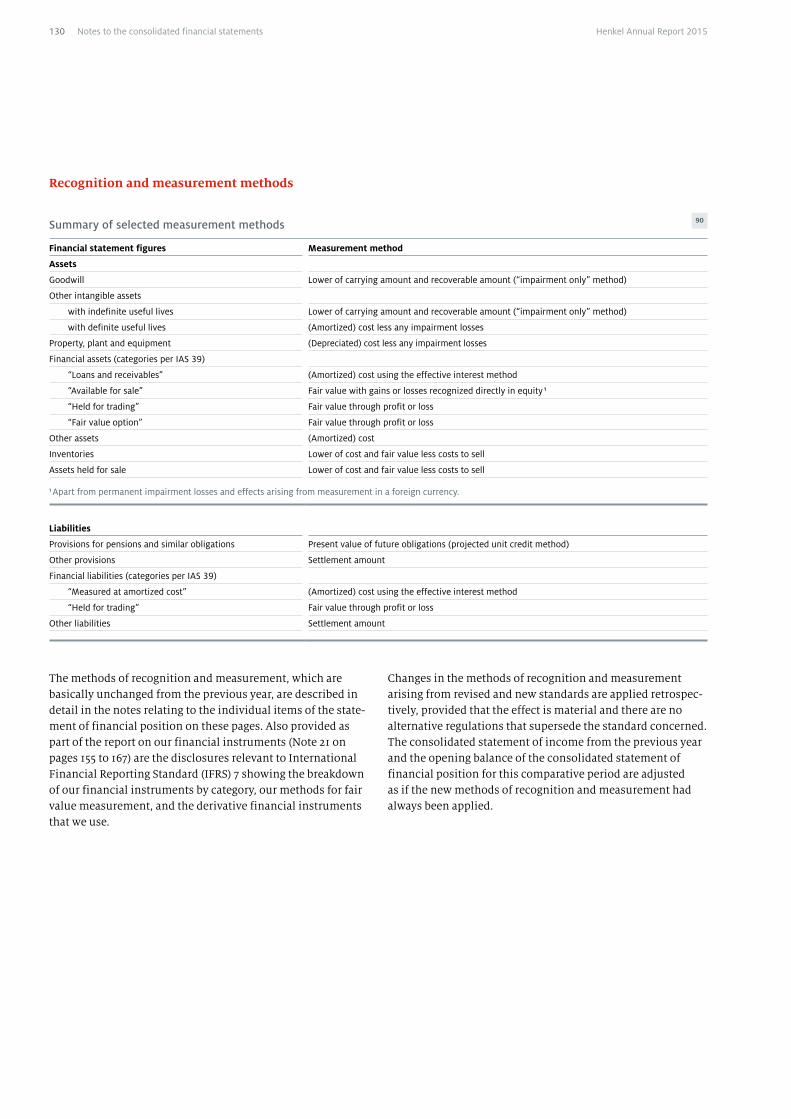
Recognition and measurement methods
Summary of selected measurement methods 90
Financial statement figures Measurement method
Assets
Goodwill Lower of carrying amount and recoverable amount (“impairment only” method)
Other intangible assets
with indefinite useful lives Lower of carrying amount and recoverable amount (“impairment only” method)
with definite useful lives (Amortized) cost less any impairment losses
Property, plant and equipment (Depreciated) cost less any impairment losses
Financial assets (categories per IAS 39)
“Loans and receivables” (Amortized) cost using the effective interest method
“Available for sale” Fair value with gains or losses recognized directly in equity 1
“Held for trading” Fair value through profit or loss
“Fair value option” Fair value through profit or loss
Other assets (Amortized) cost
Inventories Lower of cost and fair value less costs to sell
Assets held for sale Lower of cost and fair value less costs to sell
1 Apart from permanent impairment losses and effects arising from measurement in a foreign currency.
Liabilities
Provisions for pensions and similar obligations Present value of future obligations (projected unit credit method)
Other provisions Settlement amount
Financial liabilities (categories per IAS 39)
“Measured at amortized cost” (Amortized) cost using the effective interest method
“Held for trading” Fair value through profit or loss
Other liabilities Settlement amount
The methods of recognition and measurement, which are basically unchanged from the previous year, are described in detail in the notes relating to the individual items of the state-ment of financial position on these pages. Also provided as part of the report on our financial instruments (Note 21 on pages 155 to 167) are the disclosures relevant to International Financial Reporting Standard (IFRS) 7 showing the breakdown of our financial instruments by category, our methods for fair value measurement, and the derivative financial instruments that we use.
Changes in the methods of recognition and measurement arising from revised and new standards are applied retrospec-tively, provided that the effect is material and there are no alternative regulations that supersede the standard concerned. The consolidated statement of income from the previous year and the opening balance of the consolidated statement of financial position for this comparative period are adjusted as if the new methods of recognition and measurement had always been applied.
130 Henkel Annual Report 2015Notes to the consolidated financial statements

Accounting estimates, assumptions and discretionary judgments
Preparation of the consolidated financial statements is based on a number of accounting estimates and assumptions. These have an impact on the reported amounts of assets, liabilities and contingent liabilities at the reporting date and the disclo-sure of income and expenses for the reporting period. The actual amounts may differ from these estimates.
The accounting estimates and their underlying assumptions are based on past experience and are continually reviewed. Changes in accounting estimates are recognized in the period in which the change takes place where such change exclusively affects that period. A change is recognized in the period in which it occurs and in later periods where such change affects both the reporting period and subsequent periods. The judg-ments of the Management Board regarding the application of those IFRSs which have a significant impact on the consoli-dated financial statements are presented in particular in the explanatory notes on taxes on income (Note 30 on pages 170 to 172), intangible assets (Note 1 on pages 133 to 136), pension obligations (Note 15 on pages 143 to 151), income tax provisions and other provisions (Note 16 on pages 151 and 152), financial instruments (Note 21 on pages 155 to 167) and share-based payment plans (Note 34 on pages 173 and 174).
Material discretionary judgments are made in respect of the demarcation of the cash-generating units as explained in Note 1 on pages 133 to 136 and the segment reporting as explained in Note 35 on pages 174 and 175.
New international accounting regulations according to International Financial Reporting Standards (IFRSs)
Accounting methods applied for the first time in the year under review 91
Mandatory for fiscal years beginning
on or after
General standard “Improvements to IFRS 2011–2013” January 1, 2015
As part of the IFRS annual improvement project, amendments were made to four standards. Adjustments to the wording of individual IFRSs are intended to clarify existing regulations. The following standards are affected: IFRS 1, IFRS 3, IFRS 13 and IAS 40.
The first-time application of the amended standards had no material impact on the presentation of our consolidated financial statements.
Accounting regulations not applied in advance of their effective dateThe following standards and amendments to existing standards of possible relevance to Henkel, which have been adopted into EU law (endorsement mechanism) but are not yet mandatory, have not been applied early:
Accounting regulations not applied in advance of their effective date 92
Mandatory for fiscal years beginning on or after
IFRS 11 (Amendment) “Acquisition of an Interest in a Joint Operation” January 1, 2016
IAS 1 (Amendment) “Notes” January 1, 2016
IAS 16 and IAS 38 (Amendment) “Clar-ification of Acceptable Methods of Depreciation and Amortisation” January 1, 2016
IAS 19 (Amendment) “Defined Benefit Plans: Employee Contributions” February 1, 2015
General standard “Improvements to IFRS 2010 – 2012” February 1, 2015
General standard “Improvements to IFRS 2012 – 2014” January 1, 2016
131Notes to the consolidated financial statementsHenkel Annual Report 2015
118 Consolidated statement of financial position
120 Consolidated statement of income
121 Consolidated statement of comprehensive income
121 Consolidated statement of changes in equity
122 Consolidated statement of cash flows
123 Group segment report by business unit
124 Key financials by region125 Accounting principles and
methods applied in preparation of the consolidated financial statements
133 Notes to the consolidated statement of financial position
168 Notes to the consolidated statement of income
173 Other disclosures

• IFRS 11 governs the procedure for recognizing joint ventures and joint operations in both the statement of financial posi-tion and in profit or loss. Joint ventures must be recognized using the equity method, whereas the treatment of joint operations is comparable to proportionate consolidation, pursuant to IFRS 11. With its amendment of IFRS 11, the International Accounting Standards Board (IASB) has regu-lated the accounting procedure for acquisitions of interests in joint operations in which the activity constitutes a busi-ness, as defined in IFRS 3 Business Combinations. In the case of such operations, the acquirer is required to apply the principles of business combinations accounting in IFRS 3. The disclosure requirements specified in IFRS 3 also apply in such instances. The amendments are applicable for the first time for fiscal years beginning on or after January 1, 2016.
• The amendments relating to IAS 1 affect various reporting issues. The standard now clarifies that disclosures in the notes are only necessary if their content is not immaterial, which is explicitly the case if an IFRS specifies a list of minimum disclosures. Explanations on the procedure for aggregating and disaggregating items on the statements of financial position and comprehensive income have also been included. The standard further requires contributions to other comprehensive income by companies that are rec-ognized using the equity method to be reported in the state-ment of comprehensive income. The amendments are applicable for the first time for fiscal years beginning on or after January 1, 2016.
• In its amendments of IAS 16 and IAS 38, the IASB has pro-vided further guidance for determining acceptable methods of depreciation and amortization. The amendments are applicable for the first time for fiscal years beginning on or after January 1, 2016.
• The amendments to IAS 19 clarify the requirements govern-ing the allocation of contributions by employees or third parties to periods of service if the contributions are linked to the period of service. In addition, it permits a practical expedient if the amount of the contributions is indepen-dent of the number of years of service. The amendments are applicable for the first time for fiscal years beginning on or after February 1, 2015.
• As part of the annual improvement project “Improvements to IFRS 2010 – 2012,” amendments were made to seven stan-dards. Adjustments to the wording of individual IFRSs are intended to clarify existing regulations. Amendments affect-ing disclosures in the notes have also been implemented. The following standards are affected: IFRS 2, IFRS 3, IFRS 8, IFRS 13, IAS 16, IAS 24 and IAS 38. The amendments are applicable for the first time for fiscal years beginning on or after February 1, 2015. The amendments relating to IFRS 2 and IFRS 3 are applicable to transactions executed on or after July 1, 2014.
• As part of the annual improvement project “Improvements to IFRS 2012 – 2014,” amendments were made to four stan-dards. Adjustments to the wording of individual IFRSs/IASs are intended to clarify existing regulations. The following standards are affected: IFRS 5, IFRS 7, IAS 19 and IAS 34. The amendments are applicable for the first time for fiscal years beginning on or after January 1, 2016.
These new standards and amendments to existing standards will be applied by Henkel starting in fiscal 2016. Unless other-wise indicated, we expect the future application of the afore-mentioned regulations not to have a significant impact on the presentation of the financial statements.
Accounting regulations not yet adopted into EU lawIn fiscal 2015, the IASB issued the following standards and amendments to existing standards of relevance to Henkel, which still have to be adopted into EU law (endorsement mechanism) before they become applicable:
Accounting regulations not yet adopted into EU law 93
Mandatory for fiscal years beginning on or after
IFRS 9 “Financial Instruments” January 1, 2018
IFRS 15 “Revenue from Contracts with Customers” January 1, 2018
IFRS 10 and IAS 28 (Amendment) “Sale or Contribution of Assets between an Investor and its Associate or Joint Venture” Outstanding
IFRS 10, IFRS 12 and IAS 28 (Amend-ment) “Investment Entities: Applying the Consolidation Exception” January 1, 2016
These standards and amendments to existing standards will be applied by Henkel starting in fiscal 2016 or later. We are currently examining what impact IFRS 15 “Revenue from Con-tracts with Customers” will have on the consolidated financial statements. A conclusive assessment of its effects is not pos-sible at present.
132 Henkel Annual Report 2015Notes to the consolidated financial statements

Notes to the consolidated statement of financial positionThe measurement and recognition policies for financial statement items are described in the relevant note.
Non-current assets
All non-current assets with definite useful lives are depreci-ated or amortized exclusively using the straight-line method on the basis of estimated useful lives. The useful life estimates are reviewed annually. If facts or circumstances indicate the need for impairment, the recoverable amount is determined. It is measured as the higher of the fair value less costs to sell (net realizable value) and the value in use. Impairment losses are recognized if the recoverable amounts of the assets are lower than their carrying amounts, and are charged to the relevant functions.
The following unchanged, standardized useful lives are applied:
Useful life 94
in years
Intangible assets with definite useful lives 3 to 20
Residential buildings 50
Office buildings 40
Research and factory buildings, workshops, stores and staff buildings 25 to 33
Plant facilities 10 to 25
Machinery 7 to 10
Office equipment 10
Vehicles 5 to 20
Factory and research equipment 2 to 5
1 Intangible assets
Cost 95
in million euros
Trademarks and other rights
Assets with indefinite
useful lives
Assets with definite
useful lives
Internally generated
intangible assets with definite
useful lives
Intangible assets in development
Goodwill Total
At January 1, 2014 1,195 1,449 215 – 6,367 9,226
Acquisitions 434 74 2 – 1,141 1,651
Divestments – – – – – –
Additions – 8 5 52 – 65
Disposals – – 5 – 5 – – 1 – 11
Reclassifications to assets held for sale – – 16 – – – 4 – 20
Reclassifications 33 – 31 – 4 11 2 11
Translation differences 158 27 7 1 580 773
At December 31, 2014 / January 1, 2015 1,820 1,506 220 64 8,085 11,695
Acquisitions 101 18 – – 224 343
Divestments – 1 – – – – 1 – 2
Additions – 12 35 64 – 111
Disposals – – 9 – – – – 9
Reclassifications to assets held for sale – – – – – –
Reclassifications – – 11 – 11 – –
Translation differences 159 71 4 – 553 787
At December 31, 2015 2,079 1,598 270 117 8,861 12,925
133Notes to the consolidated financial statementsHenkel Annual Report 2015
118 Consolidated statement of financial position
120 Consolidated statement of income
121 Consolidated statement of comprehensive income
121 Consolidated statement of changes in equity
122 Consolidated statement of cash flows
123 Group segment report by business unit
124 Key financials by region125 Accounting principles and
methods applied in preparation of the consolidated financial statements
133 Notes to the consolidated statement of financial position
168 Notes to the consolidated statement of income
173 Other disclosures

Accumulated amortization / impairment 96
Trademarks and other rights
in million euros
Assets with indefinite
useful lives
Assets with definite
useful lives
Internally generated
intangible assets with definite
useful lives
Intangible assets in development
Goodwill Total
At January 1, 2014 16 872 135 – 14 1,037
Divestments – – – – – –
Write-ups – – – – – 3 – 3
Scheduled amortization – 79 20 – – 99
Impairment losses – – 1 – – 1
Disposals – – 6 – 6 – – – 12
Reclassifications to assets held for sale – – 10 – – – – 10
Reclassifications – – 2 2 – – –
Translation differences – – 12 5 – – – 7
At December 31, 2014 / January 1, 2015 16 921 157 – 11 1,105
Divestments – – – – – –
Write-ups – 5 – – – – – 5
Scheduled amortization – 91 19 – – 110
Impairment losses – – – – – –
Disposals – – 7 – – – –7
Reclassifications to assets held for sale – – – – – –
Reclassifications 1 – 1 – – – –
Translation differences – 35 5 – – 40
At December 31, 2015 12 1,039 181 – 11 1,243
Net book values 97
Trademarks and other rights
in million euros
Assets with indefinite
useful lives
Assets with definite
useful lives
Internally generated
intangible assets with definite
useful lives
Intangible assets in development
Goodwill Total
At December 31, 2015 2,067 559 89 117 8,850 11,682
At December 31, 2014 1,804 585 63 64 8,074 10,590
Goodwill represents the future economic benefit of assets that are acquired through business combinations and not individu-ally identifiable and separately recognized, as well as expected synergies, and is recognized at cost. Trademarks and other rights acquired for valuable consideration are stated at pur-chase cost, while internally generated software is stated at development cost.
Additions to internally generated intangible assets mostly reflect investments in consolidating and optimizing our IT system architecture for managing business processes.
The change in goodwill resulting from acquisitions and divestments made in the fiscal year is presented in the section “Acquisitions and divestments” on pages 126 and 127.
Goodwill as well as trademarks and other rights with indefi-nite useful lives are subjected to an impairment test at least once a year and also when indicators of impairment are pres-ent (“impairment only” approach).
Amortization and impairment of trademarks and other rights are recognized as selling expenses. Amortization and impair-ment of other intangible assets are allocated to the relevant functions in the consolidated statement of income.
134 Henkel Annual Report 2015Notes to the consolidated financial statements
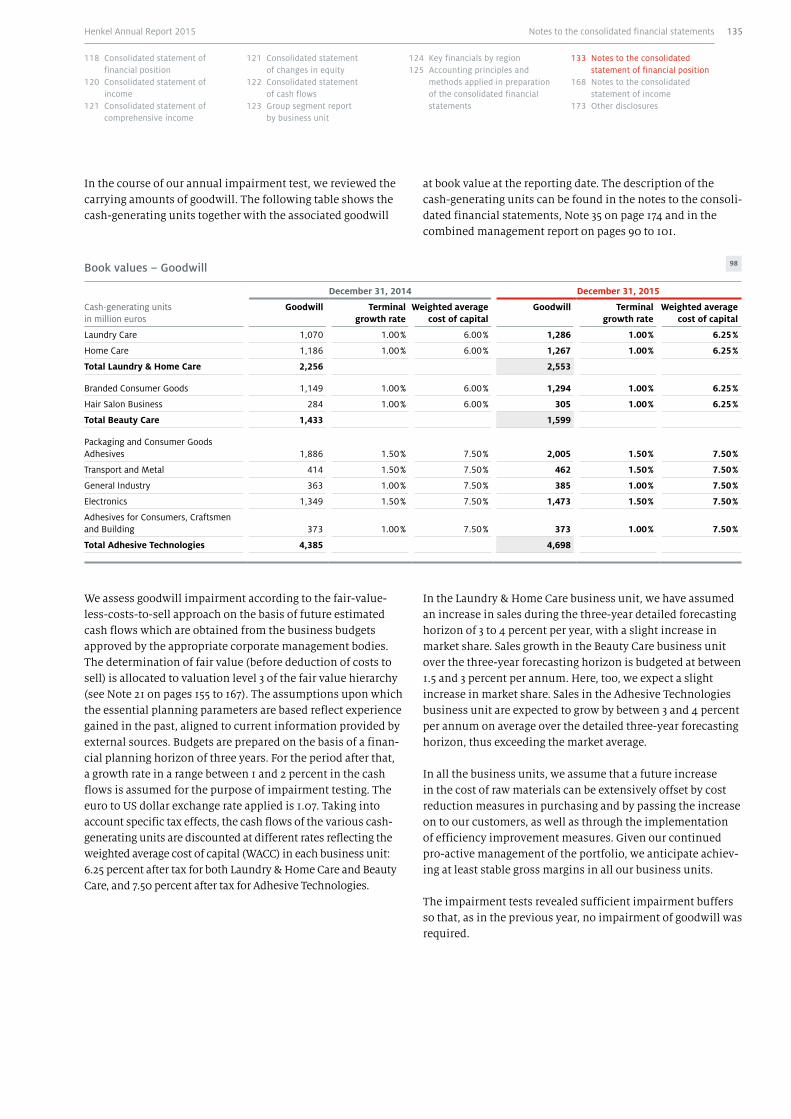
In the course of our annual impairment test, we reviewed the carrying amounts of goodwill. The following table shows the cash-generating units together with the associated goodwill
at book value at the reporting date. The description of the cash-generating units can be found in the notes to the consoli-dated financial statements, Note 35 on page 174 and in the combined management report on pages 90 to 101.
Book values – Goodwill 98
Cash-generating units in million euros
December 31, 2014 December 31, 2015
Goodwill Terminal growth rate
Weighted average cost of capital
Goodwill Terminal growth rate
Weighted average cost of capital
Laundry Care 1,070 1.00 % 6.00 % 1,286 1.00 % 6.25 %
Home Care 1,186 1.00 % 6.00 % 1,267 1.00 % 6.25 %
Total Laundry & Home Care 2,256 2,553
Branded Consumer Goods 1,149 1.00 % 6.00 % 1,294 1.00 % 6.25 %
Hair Salon Business 284 1.00 % 6.00 % 305 1.00 % 6.25 %
Total Beauty Care 1,433 1,599
Packaging and Consumer Goods Adhesives 1,886 1.50 % 7.50 % 2,005 1.50 % 7.50 %
Transport and Metal 414 1.50 % 7.50 % 462 1.50 % 7.50 %
General Industry 363 1.00 % 7.50 % 385 1.00 % 7.50 %
Electronics 1,349 1.50 % 7.50 % 1,473 1.50 % 7.50 %
Adhesives for Consumers, Craftsmen and Building 373 1.00 % 7.50 % 373 1.00 % 7.50 %
Total Adhesive Technologies 4,385 4,698
In the Laundry & Home Care business unit, we have assumed an increase in sales during the three-year detailed forecasting horizon of 3 to 4 percent per year, with a slight increase in market share. Sales growth in the Beauty Care business unit over the three-year forecasting horizon is budgeted at between 1.5 and 3 percent per annum. Here, too, we expect a slight increase in market share. Sales in the Adhesive Technologies business unit are expected to grow by between 3 and 4 percent per annum on average over the detailed three-year forecasting horizon, thus exceeding the market average.
In all the business units, we assume that a future increase in the cost of raw materials can be extensively offset by cost reduction measures in purchasing and by passing the increase on to our customers, as well as through the implementation of efficiency improvement measures. Given our continued pro-active management of the portfolio, we anticipate achiev-ing at least stable gross margins in all our business units.
The impairment tests revealed sufficient impairment buffers so that, as in the previous year, no impairment of goodwill was required.
We assess goodwill impairment according to the fair-value-less-costs-to-sell approach on the basis of future estimated cash flows which are obtained from the business budgets approved by the appropriate corporate management bodies. The determination of fair value (before deduction of costs to sell) is allocated to valuation level 3 of the fair value hierarchy (see Note 21 on pages 155 to 167). The assumptions upon which the essential planning parameters are based reflect experience gained in the past, aligned to current information provided by external sources. Budgets are prepared on the basis of a finan-cial planning horizon of three years. For the period after that, a growth rate in a range between 1 and 2 percent in the cash flows is assumed for the purpose of impairment testing. The euro to US dollar exchange rate applied is 1.07. Taking into account specific tax effects, the cash flows of the various cash-generating units are discounted at different rates reflecting the weighted average cost of capital (WACC) in each business unit: 6.25 percent after tax for both Laundry & Home Care and Beauty Care, and 7.50 percent after tax for Adhesive Technologies.
135Notes to the consolidated financial statementsHenkel Annual Report 2015
118 Consolidated statement of financial position
120 Consolidated statement of income
121 Consolidated statement of comprehensive income
121 Consolidated statement of changes in equity
122 Consolidated statement of cash flows
123 Group segment report by business unit
124 Key financials by region125 Accounting principles and
methods applied in preparation of the consolidated financial statements
133 Notes to the consolidated statement of financial position
168 Notes to the consolidated statement of income
173 Other disclosures
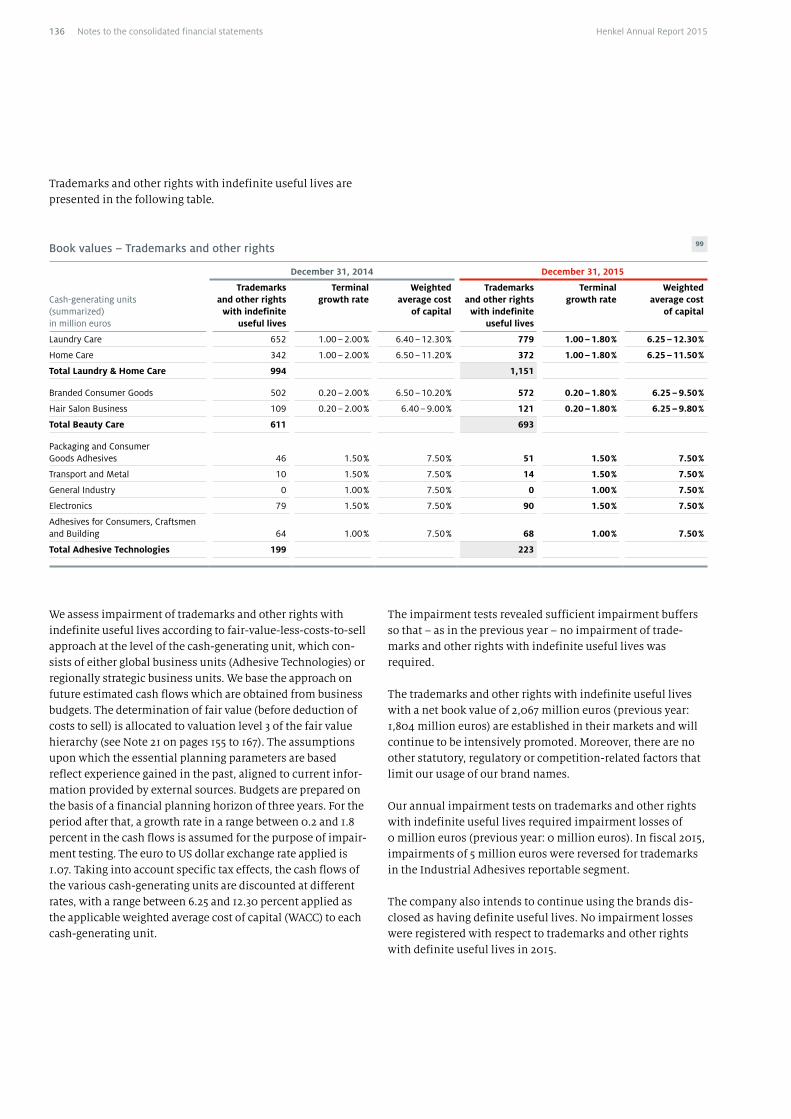
Trademarks and other rights with indefinite useful lives are presented in the following table.
Book values – Trademarks and other rights 99
Cash-generating units (summarized)in million euros
December 31, 2014 December 31, 2015
Trademarks and other rights
with indefinite useful lives
Terminal growth rate
Weighted average cost
of capital
Trademarks and other rights
with indefinite useful lives
Terminal growth rate
Weighted average cost
of capital
Laundry Care 652 1.00 – 2.00 % 6.40 – 12.30 % 779 1.00 – 1.80 % 6.25 – 12.30 %
Home Care 342 1.00 – 2.00 % 6.50 – 11.20 % 372 1.00 – 1.80 % 6.25 – 11.50 %
Total Laundry & Home Care 994 1,151
Branded Consumer Goods 502 0.20 – 2.00 % 6.50 – 10.20 % 572 0.20 – 1.80 % 6.25 – 9.50 %
Hair Salon Business 109 0.20 – 2.00 % 6.40 – 9.00 % 121 0.20 – 1.80 % 6.25 – 9.80 %
Total Beauty Care 611 693
Packaging and Consumer Goods Adhesives 46 1.50 % 7.50 % 51 1.50 % 7.50 %
Transport and Metal 10 1.50 % 7.50 % 14 1.50 % 7.50 %
General Industry 0 1.00 % 7.50 % 0 1.00 % 7.50 %
Electronics 79 1.50 % 7.50 % 90 1.50 % 7.50 %
Adhesives for Consumers, Craftsmen and Building 64 1.00 % 7.50 % 68 1.00 % 7.50 %
Total Adhesive Technologies 199 223
The impairment tests revealed sufficient impairment buffers so that – as in the previous year – no impairment of trade-marks and other rights with indefinite useful lives was required.
The trademarks and other rights with indefinite useful lives with a net book value of 2,067 million euros (previous year: 1,804 million euros) are established in their markets and will continue to be intensively promoted. Moreover, there are no other statutory, regulatory or competition-related factors that limit our usage of our brand names.
Our annual impairment tests on trademarks and other rights with indefinite useful lives required impairment losses of 0 million euros (previous year: 0 million euros). In fiscal 2015, impairments of 5 million euros were reversed for trademarks in the Industrial Adhesives reportable segment.
The company also intends to continue using the brands dis-closed as having definite useful lives. No impairment losses were registered with respect to trademarks and other rights with definite useful lives in 2015.
We assess impairment of trademarks and other rights with indefinite useful lives according to fair-value-less-costs-to-sell approach at the level of the cash-generating unit, which con-sists of either global business units (Adhesive Technologies) or regionally strategic business units. We base the approach on future estimated cash flows which are obtained from business budgets. The determination of fair value (before deduction of costs to sell) is allocated to valuation level 3 of the fair value hierarchy (see Note 21 on pages 155 to 167). The assumptions upon which the essential planning parameters are based reflect experience gained in the past, aligned to current infor-mation provided by external sources. Budgets are prepared on the basis of a financial planning horizon of three years. For the period after that, a growth rate in a range between 0.2 and 1.8 percent in the cash flows is assumed for the purpose of impair-ment testing. The euro to US dollar exchange rate applied is 1.07. Taking into account specific tax effects, the cash flows of the various cash- generating units are discounted at different rates, with a range between 6.25 and 12.30 percent applied as the applicable weighted average cost of capital (WACC) to each cash-generating unit.
136 Henkel Annual Report 2015Notes to the consolidated financial statements

2 Property, plant and equipment
Cost 100
in million euros
Land, land rights and buildings
Plant and machinery
Factory and office
equipment
Assets in the course of construction
Total
At January 1, 2014 2,000 2,777 914 251 5,942
Acquisitions 20 19 4 3 46
Divestments – 11 – 37 – 1 – – 49
Additions 22 104 61 265 452
Disposals – 7 – 74 – 55 – 1 – 137
Reclassifications to assets held for sale – 28 – 47 – 4 1 – 78
Reclassifications 56 105 35 – 207 – 11
Translation differences 36 25 19 – 2 78
At December 31, 2014 / January 1, 2015 2,088 2,872 973 310 6,243
Acquisitions 3 6 2 – 11
Divestments – – – – –
Additions 45 136 77 256 514
Disposals – 16 – 94 – 75 – – 185
Reclassifications to assets held for sale – 1 3 – 4
Reclassifications 62 153 65 – 282 – 2
Translation differences 46 51 2 18 117
At December 31, 2015 2,228 3,125 1,047 302 6,702
Accumulated depreciation / impairment 101
in million euros
Land, land rights and
buildings
Plant and machinery
Factory and office
equipment
Assets in the course of construction
Total
At January 1, 2014 961 1,992 695 – 1 3,647
Divestments – 11 – 37 – 1 – – 49
Write-ups – – 2 – 1 – 1 – 4
Scheduled depreciation 55 154 80 – 289
Impairment losses 17 17 – – 34
Disposals – 5 – 70 – 53 – – 128
Reclassifications to assets held for sale – 24 – 41 – 3 1 – 67
Reclassifications 1 – – 1 – –
Translation differences 14 29 17 – 60
At December 31, 2014 / January 1, 2015 1,008 2,042 733 – 1 3,782
Divestments – – – – –
Write-ups – – 1 – – – 1
Scheduled depreciation 62 182 96 – 340
Impairment losses 2 12 2 – 16
Disposals – 10 – 86 – 73 – – 169
Reclassifications to assets held for sale 1 – 1 2 – 2
Reclassifications – 1 – 3 3 – – 1
Translation differences 19 36 19 – 2 72
At December 31, 2015 1,081 2,181 782 – 3 4,041
137Notes to the consolidated financial statementsHenkel Annual Report 2015
118 Consolidated statement of financial position
120 Consolidated statement of income
121 Consolidated statement of comprehensive income
121 Consolidated statement of changes in equity
122 Consolidated statement of cash flows
123 Group segment report by business unit
124 Key financials by region125 Accounting principles and
methods applied in preparation of the consolidated financial statements
133 Notes to the consolidated statement of financial position
168 Notes to the consolidated statement of income
173 Other disclosures

Net book values 102
in million euros
Land, land rights
and buildings
Plant and machinery
Factory and office
equipment
Assets in the course of construction
Total
At December 31, 2015 1,147 944 265 305 2,661
At December 31, 2014 1,080 830 240 311 2,461
Additions are stated at purchase or manufacturing cost. The latter includes direct costs and appropriate proportions of necessary overheads. Interest charges on borrowings are not included, as Henkel does not currently hold any qualifying assets in accordance with International Accounting Standard (IAS) 23 “Borrowing Costs.” Cost figures are shown net of invest-ment grants and allowances. Incidental acquisition costs incurred in order to make the asset ready for the intended use are capitalized. An overview of the primary investment projects undertaken during the fiscal year can be found on page 72 in the combined management report.
At December 31, 2015, property, plant and equipment with a carrying amount of 0 million euros had been pledged as collateral for existing liabilities. The periods over which the assets are depreciated are based on their estimated useful lives as set out on page 133. Scheduled depreciation and impairment losses recognized are allocated to the relevant functions in the consolidated statement of income.
Of the impairment losses amounting to 16 million euros, pro-duction optimization measures attributable to the Laundry & Home Care business unit accounted for 12 million euros. In the Adhesive Technologies business unit, impairment losses of 2 million euros were recognized as a result of production optimization measures.
138 Henkel Annual Report 2015Notes to the consolidated financial statements

3 Other financial assets
Analysis 103
in million euros
December 31, 2014 December 31, 2015
Non-current Current Total Non-current Current Total
Receivables from associated companies – 1 1 – 1 1
Financial receivables from third parties 14 20 34 15 24 39
Derivative financial instruments 51 37 88 – 72 72
Investments accounted for using the equity method 5 – 5 12 – 12
Other investments 21 – 21 21 – 21
Receivable from Henkel Trust e.V. – 226 226 – 349 349
Securities and time deposits – 301 301 – 5 5
Financial collateral provided – 19 19 – 10 10
Sundry financial assets 23 72 95 15 79 94
Total 114 676 790 63 540 603
With the exception of investments, derivatives, securities and time deposits, other financial assets are measured at amortized cost.
The receivable from Henkel Trust e.V. relates to pension pay-ments made by Henkel AG & Co. KGaA to retirees, for which reimbursement can be claimed from Henkel Trust e.V.
Included under securities and time deposits are monies depos-ited as part of our short-term financial management arrange-ments. The monies involved are primarily time deposits.
Sundry non-current financial assets include, among others, receivables from employees. The sundry current financial assets include the following:• Receivables from sureties and guarantee deposits amount-
ing to 32 million euros (previous year: 29 million euros)• Receivables from suppliers amounting to 14 million euros
(previous year: 13 million euros)• Receivables from employees amounting to 15 million euros
(previous year: 14 million euros)
4 Other assets
Analysis 104
in million euros
December 31, 2014 December 31, 2015
Non-current Current Total Non-current Current Total
Tax receivables – 156 156 – 202 202
Payments on account 1 14 15 – 28 28
Overfunding of pension obligations 25 – 25 58 – 58
Reimbursement rights related to employee benefits 97 8 105 100 11 111
Accruals 16 69 85 18 72 90
Sundry other assets 1 37 38 1 17 18
Total 140 284 424 177 330 507
139Notes to the consolidated financial statementsHenkel Annual Report 2015
118 Consolidated statement of financial position
120 Consolidated statement of income
121 Consolidated statement of comprehensive income
121 Consolidated statement of changes in equity
122 Consolidated statement of cash flows
123 Group segment report by business unit
124 Key financials by region125 Accounting principles and
methods applied in preparation of the consolidated financial statements
133 Notes to the consolidated statement of financial position
168 Notes to the consolidated statement of income
173 Other disclosures

5 Deferred taxes
Deferred taxes are recognized for temporary differences between the valuation of an asset or a liability in the financial statements and its tax base, for tax losses carried forward, and for unused tax credits. This also applies to temporary differences in valuation arising through acquisitions, with the exception of goodwill.
Deferred tax liabilities on taxable temporary differences related to shares in subsidiaries are recognized to the extent that a reversal of this difference is expected in the foreseeable future.
Changes in the deferred taxes in the statement of financial position result in deferred tax expenses or income unless the underlying item is directly recognized in other comprehensive income. For items recognized directly in other comprehensive income, the associated deferred taxes are also recognized in other comprehensive income.
The valuation, recognition and breakdown of deferred taxes in respect of the various items in the statement of financial position are disclosed under Note 30 (“Taxes on income”) on pages 170 to 172.
6 Inventories
In accordance with IAS 2, reported under inventories are those assets that are intended to be sold in the ordinary course of business (finished products and merchandise), those in the process of production for such sale (work in progress) and those to be utilized or consumed in the course of manufacture or the rendering of services (raw materials and supplies). Pay-ments on account made for the purpose of purchasing inven-tories are likewise disclosed under the inventories heading.
Inventories are measured at the lower of cost and net realiz-able value.
Inventories are measured using either the “first in, first out” (FIFO) or the average cost method. Manufacturing cost includes not only the direct costs but also appropriate portions of necessary overheads (for example goods inward department, raw material storage, filling, costs incurred through to the finished goods warehouse), production-related administrative expenses, the costs of the pensions of people who are employed in the production process, and production- related amortization /depreciation. The overhead add-ons are calculated on the basis of average capacity utilization. Not included, however, are interest expenses incurred during the manufacturing period.
The net realizable value is determined as an estimated selling price less costs yet to be incurred through to completion, and necessary selling and distribution costs. Write-downs to the net realizable value are made if, at year-end, the carrying amounts of the inventories are above their realizable fair val-ues. The resultant valuation allowance amounted to 120 mil-lion euros (previous year: 129 million euros). The carrying amount of inventories recognized at fair value less costs to sell amounted to 410 million euros. The carrying amount of inventories pledged as security for liabilities amounted to 2 million euros.
Analysis of inventories 105
in million eurosDecember
31, 2014December
31, 2015
Raw materials and supplies 491 483
Work in progress 67 69
Finished products and merchandise 1,110 1,157
Payments on account for merchandise 3 12
Total 1,671 1,721
7 Trade accounts receivable
Trade accounts receivable amounted to 2,944 million euros (previous year: 2,747 million euros). They are all due within one year. Valuation allowances have been recognized in respect of specific risks as appropriate. Overall, we recognized total valuation allowances of 21 million euros (previous year: 20 million euros).
Trade accounts receivable 106
in million eurosDecember
31, 2014December
31, 2015
Trade accounts receivable, gross 2,855 3,056
less: cumulative valuation allowances on trade accounts receivable 108 112
Trade accounts receivable, net 2,747 2,944
Development of valuation allowances on trade accounts receivable 107
in million euros 2014 2015
Valuation allowances at January 1 98 108
Additions 14 15
Derecognition of receivables – 6 – 12
Currency translation effects 2 1
Valuation allowances at December 31 108 112
140 Henkel Annual Report 2015Notes to the consolidated financial statements

8 Cash and cash equivalents
Recognized under cash and cash equivalents are liquid funds, sight deposits and other financial assets with an original term of not more than three months. In accordance with IAS 7, also recognized under cash equivalents are shares in money mar-ket funds which, due to their first-class credit rating and investment in extremely short-term money market securities, undergo only minor value fluctuations and can be readily con-verted within one day into known amounts of cash. Utilized bank overdrafts are recognized in the statement of financial position as liabilities to banks.
The volume of cash and cash equivalents decreased compared to the previous year from 1,228 million euros to 1,176 million euros. Of this figure, 950 million euros (previous year: 716 mil-lion euros) relates to cash and 226 million euros (previous year: 512 million euros) to cash equivalents. The change is shown in the consolidated statement of cash flows.
9 Assets and liabilities held for sale
Assets held for sale are assets that can be sold in their current condition and whose sale is very probable. Disposal must be expected within one year from the time of reclassification as held for sale. Such assets may be individual assets, groups of assets (disposal groups) or business operations (discontinued operations). Assets held for sale are no longer subject to scheduled depreciation and amortization and are instead rec-ognized at the lower of carrying amount and fair value less costs to sell (level 3), which is determined by the current price negotiations with potential buyers.
Compared to December 31, 2014, assets held for sale declined by 21 million euros to 10 million euros. The reduction is attrib-utable to the sale in the USA of our chemical additives busi-ness for the processing industry in the Adhesive Technologies business unit and the sale of an administration building in Spain. These sales resulted in a gain of around 20 million euros. There were no liabilities held for sale (December 31, 2014: 0 million euros).
Assets and liabilities held for sale 108
in million eurosDecember
31, 2015
Intangible assets and property, plant and equipment 6
Inventories and trade accounts receivable 3
Cash and cash equivalents –
Other assets 1
Provisions –
Borrowings –
Other liabilities –
Net assets 10
10 Issued capital
Issued capital 109
in million eurosDecember
31, 2014December
31, 2015
Ordinary bearer shares 260 260
Preferred bearer shares 178 178
Capital stock 438 438
Comprising: 259,795,875 ordinary shares, 178,162,875 non-voting preferred shares.
All shares are fully paid in. The ordinary and preferred shares are bearer shares of no par value, each of which represents a nominal proportion of the capital stock amounting to 1 euro. The liquidation proceeds are the same for all shares. The num-ber of ordinary shares issued remained unchanged year on year. The number of preferred shares in circulation increased slightly, to 174,482,323 as at December 31, 2015.
By resolution of the Annual General Meeting of April 13, 2015, the Authorized Capital 2010 created by resolution of the Annual General Meeting of April 19, 2010, according to which the Per-sonally Liable Partner was authorized – with the approval of the Shareholders’ Committee and of the Supervisory Board of Henkel AG & Co. KGaA – to increase the capital of the corpora-tion in one or more installments at any time until April 18, 2015, by as much as 25.6 million euros (25.6 million shares) in total by issuing new non-voting preferred shares to be paid up in cash, was repealed and simultaneously replaced by the new Authorized Capital 2015 (Art. 6 (5) of the Articles of Associa-tion). Under Authorized Capital 2015, the Personally Liable Partner is authorized – with the approval of the Shareholders’ Committee and of the Supervisory Board – to increase the cap-ital of the corporation at any time until April 12, 2020, by up to a nominal amount of 43,795,875 euros in total by issuing up to
141Notes to the consolidated financial statementsHenkel Annual Report 2015
118 Consolidated statement of financial position
120 Consolidated statement of income
121 Consolidated statement of comprehensive income
121 Consolidated statement of changes in equity
122 Consolidated statement of cash flows
123 Group segment report by business unit
124 Key financials by region125 Accounting principles and
methods applied in preparation of the consolidated financial statements
133 Notes to the consolidated statement of financial position
168 Notes to the consolidated statement of income
173 Other disclosures
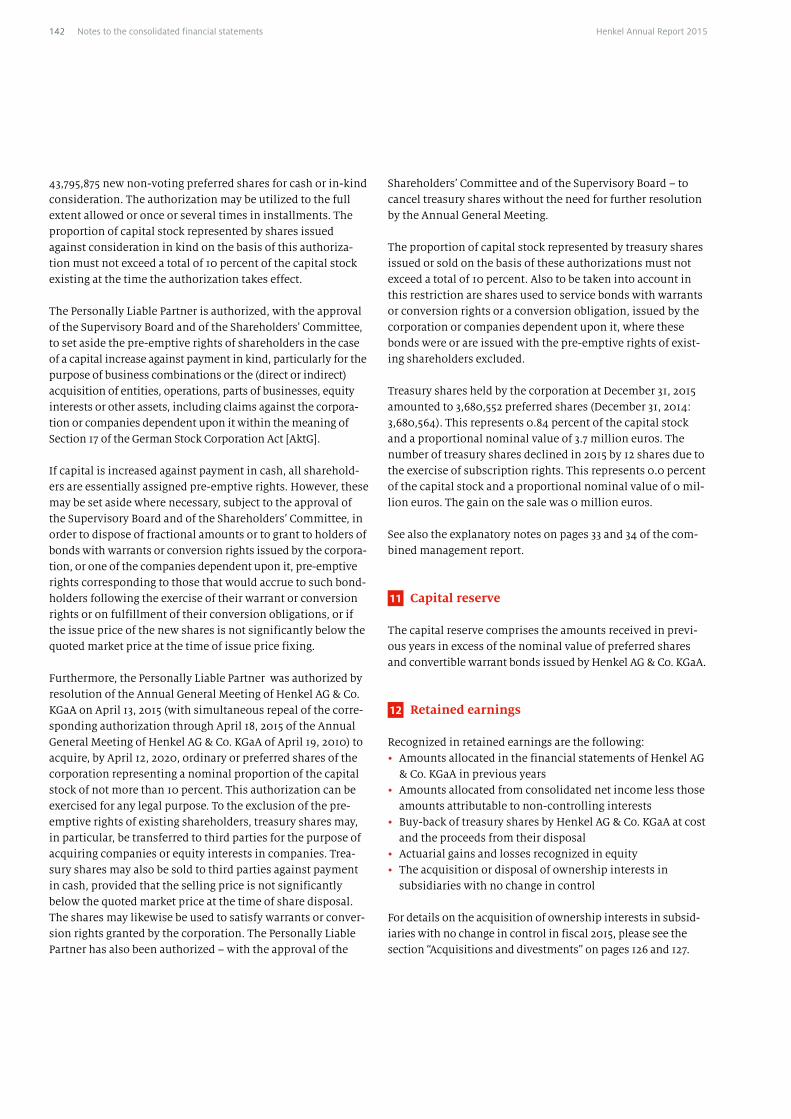
43,795,875 new non-voting preferred shares for cash or in-kind consideration. The authorization may be utilized to the full extent allowed or once or several times in installments. The proportion of capital stock represented by shares issued against consideration in kind on the basis of this authoriza-tion must not exceed a total of 10 percent of the capital stock existing at the time the authorization takes effect.
The Personally Liable Partner is authorized, with the approval of the Supervisory Board and of the Shareholders’ Committee, to set aside the pre-emptive rights of shareholders in the case of a capital increase against payment in kind, particu larly for the purpose of business combinations or the (direct or indirect) acquisition of entities, operations, parts of businesses, equity interests or other assets, including claims against the corpora-tion or companies dependent upon it within the meaning of Section 17 of the German Stock Corporation Act [AktG].
If capital is increased against payment in cash, all sharehold-ers are essentially assigned pre-emptive rights. However, these may be set aside where necessary, subject to the approval of the Supervisory Board and of the Shareholders’ Committee, in order to dispose of fractional amounts or to grant to holders of bonds with warrants or conversion rights issued by the corpora-tion, or one of the companies dependent upon it, pre-emptive rights corresponding to those that would accrue to such bond-holders following the exercise of their warrant or conversion rights or on fulfillment of their conversion obligations, or if the issue price of the new shares is not significantly below the quoted market price at the time of issue price fixing.
Furthermore, the Personally Liable Partner was authorized by resolution of the Annual General Meeting of Henkel AG & Co. KGaA on April 13, 2015 (with simultaneous repeal of the corre-sponding authorization through April 18, 2015 of the Annual General Meeting of Henkel AG & Co. KGaA of April 19, 2010) to acquire, by April 12, 2020, ordinary or preferred shares of the corporation representing a nominal proportion of the capital stock of not more than 10 percent. This authorization can be exercised for any legal purpose. To the exclusion of the pre-emptive rights of existing shareholders, treasury shares may, in particular, be transferred to third parties for the purpose of acquiring companies or equity interests in companies. Trea-sury shares may also be sold to third parties against payment in cash, provided that the selling price is not significantly below the quoted market price at the time of share disposal. The shares may likewise be used to satisfy warrants or conver-sion rights granted by the corporation. The Personally Liable Partner has also been authorized – with the approval of the
Shareholders’ Committee and of the Supervisory Board – to cancel treasury shares without the need for further resolution by the Annual General Meeting.
The proportion of capital stock represented by treasury shares issued or sold on the basis of these authorizations must not exceed a total of 10 percent. Also to be taken into account in this restriction are shares used to service bonds with warrants or conversion rights or a conversion obligation, issued by the corporation or companies dependent upon it, where these bonds were or are issued with the pre-emptive rights of exist-ing shareholders excluded.
Treasury shares held by the corporation at December 31, 2015 amounted to 3,680,552 preferred shares (December 31, 2014: 3,680,564). This represents 0.84 percent of the capital stock and a proportional nominal value of 3.7 million euros. The number of treasury shares de clined in 2015 by 12 shares due to the exercise of subscription rights. This represents 0.0 percent of the capital stock and a proportional nominal value of 0 mil-lion euros. The gain on the sale was 0 million euros.
See also the explanatory notes on pages 33 and 34 of the com-bined management report.
11 Capital reserve
The capital reserve comprises the amounts received in previ-ous years in excess of the nominal value of preferred shares and convertible warrant bonds issued by Henkel AG & Co. KGaA.
12 Retained earnings
Recognized in retained earnings are the following:• Amounts allocated in the financial statements of Henkel AG
& Co. KGaA in previous years• Amounts allocated from consolidated net income less those
amounts attributable to non-controlling interests• Buy-back of treasury shares by Henkel AG & Co. KGaA at cost
and the proceeds from their disposal• Actuarial gains and losses recognized in equity• The acquisition or disposal of ownership interests in
subsidiaries with no change in control
For details on the acquisition of ownership interests in subsid-iaries with no change in control in fiscal 2015, please see the section “Acquisitions and divestments” on pages 126 and 127.
142 Henkel Annual Report 2015Notes to the consolidated financial statements

13 Other components of equity
Reported under this heading are differences reported in equity arising from the currency translation of annual financial state-ments of foreign subsidiaries and also the effects arising from the valuation in total comprehensive income of financial assets in the “Available for sale” category and of derivative financial instruments for which hedge accounting is used. The latter are derivatives used in connection with cash flow hedges or hedges of a net investment in a foreign entity. Due in particu-lar to the appreciation of the US dollar versus the euro, the negative difference attributable to shareholders of Henkel AG & Co. KGaA arising from currency translation declined com-pared to the figure at December 31, 2014, by 582 million euros to –141 million euros.
14 Non-controlling interests
Recognized under non-controlling interests are equity shares held by third parties measured on the basis of the proportion of net assets.
15 Pension obligations
Description of the pension plansEmployees in companies included in the consolidated finan-cial statements have entitlements under company pension plans which are either defined contribution or defined benefit plans. These take different forms depending on the legal, financial and tax regime of each country. The level of benefits provided is based, as a rule, on the length of service and on the income of the person entitled. Details on pension benefits for members of the Management Board are provided in the remuneration report on pages 41 to 51.
In defined benefit plans, the liability for pensions and other post-employment benefits is calculated at the present value of the future obligations (projected unit credit method). This actuarial method of calculation takes future trends in wages, salaries and retirement benefits into account.
The majority of the recipients of pension benefits are located in Germany and the USA. The pension obligations are primar-ily financed via various external trust assets that are legally independent of Henkel.
Active employees of Henkel in Germany participate in a defined contribution system, “Altersversorgung 2004 (AV 2004),”
which was newly formed in 2004. AV 2004 is an employer-financed pension plan that reflects the personal income devel-opment of employees during their career at Henkel and thus provides a performance-related pension. Henkel guarantees a minimum return on the company’s contributions. The benefit essentially consists of an annuity payable upon attainment of the retirement age plus a lump-sum payment if the annuity threshold is exceeded in the employee’s service period. In addition to age and disability pensions, the plan benefits include surviving spouse and surviving child benefits.
Employees who started at Henkel after April 1, 2011, partici-pate in the pension plan “Altersversorgung 2011 (AV 2011).” AV 2011 is an employer-financed, fund-linked retirement plan funded by contributions based on the income development of the employee. Henkel ensures its employees that a lump-sum amount is available upon retirement which is at least equiva-lent to the level of principal contributions made by Henkel. Henkel makes the pension contribution to an investment fund established for the purpose of the company pension plan. Upon attaining retirement age, the employee can choose between an annuity through transfer of the superannuation lump-sum to a pension fund, or a one-time payment.
To provide protection under civil law of the pension entitle-ments of future and current pensioners of Henkel AG & Co. KGaA against insolvency, we have transferred the proceeds of the bond issued in 2005 and certain other assets to Henkel Trust e.V. The trustee invests the cash with which it has been entrusted in the capital market in accordance with investment policies laid down in the trust agreement. In addition, we also subsidize medical benefits for retired employees resident mainly in the USA. Under these programs, retirees are reim-bursed for a certain percentage of their medical expenses. We build provisions during the employees’ service period and pay the promised benefits when they are claimed.
The defined contribution plans are structured in such a way that the corporation pays contributions to public or private sec-tor institutions on the basis of statutory or contractual terms or on a voluntary basis and has no further obligations regarding the payment of benefits to employees. The contributions for defined contribution plans, excluding multi-employer plans, for the reporting period amounted to 82 million euros (previ-ous year: 95 million euros). In 2015, we paid 46 million euros to public sector institutions (previous year: 47 million euros) and 36 million euros to private sector institutions (previous year: 48 million euros).
No extraordinary events occurred in the reporting period.
143Notes to the consolidated financial statementsHenkel Annual Report 2015
118 Consolidated statement of financial position
120 Consolidated statement of income
121 Consolidated statement of comprehensive income
121 Consolidated statement of changes in equity
122 Consolidated statement of cash flows
123 Group segment report by business unit
124 Key financials by region125 Accounting principles and
methods applied in preparation of the consolidated financial statements
133 Notes to the consolidated statement of financial position
168 Notes to the consolidated statement of income
173 Other disclosures

Multi-employer plansHenkel provides defined pension benefits that are financed by more than one employer. The ensuing multi-employer plans are treated as defined contribution plans because, due to the limited share of the contribution volume in the plans, the information available for each of the financing companies is insufficient for defined benefit accounting. In the Henkel Group, benefits from multi-employer plans are provided for employees primarily in the USA and Japan. Withdrawal from our multi- employer plans at the present time would incur a one-time expense of around 30 million euros (previous year: around 25 million euros). Payments into multi-employer plans in fiscal 2015 amounted to 2 million euros (previous year: 2 million euros). We expect contributions of around 2 million euros in fiscal 2016.
AssumptionsGroup-wide, the obligations from our pension plans are valued by an independent external actuary at the end of the fiscal year. The calculations at the end of the fiscal year are based on the actuarial assumptions below. These are given as the weighted average. The mortality rates used are based on published statistics and experience relating to each country. In Germany, the assumptions are based on the “Heubeck 2005G” mortality table. In the USA, the assumptions are based on the modified “RP 2014” mortality table. Further amendments to demographic assumptions in the USA resulted in an actuarial gain of 36 million euros. The valuation of pension obligations in Germany was based essentially on the assumption of a 2 per-cent increase in retirement benefits (previous year: 2 percent).
The discount rate is based on yields in the market for high- ranking corporate bonds on the respective date. The currency and term of the underlying bonds are aligned with the cur-rency and expected maturities of the post-employment pen-sion obligation.
Actuarial assumptions 110
in percent
Germany USA Other countries 1
2014 2015 2014 2015 2014 2015
Discount rate 1.70 2.20 4.10 4.30 2.60 2.85
Income trend 3.25 3.25 3.40 2.85 2.60 2.50
Expected increases in costs for medical benefits – – 7.30 7.10 3.30 3.80
in years
Life expectancy at age 65 as of the valuation date for a person currently
65 years old 20.9 21.0 22.0 22.0 23.1 24.0
40 years old 24.1 24.2 23.0 23.0 25.4 26.0
1 Weighted average.
144 Henkel Annual Report 2015Notes to the consolidated financial statements
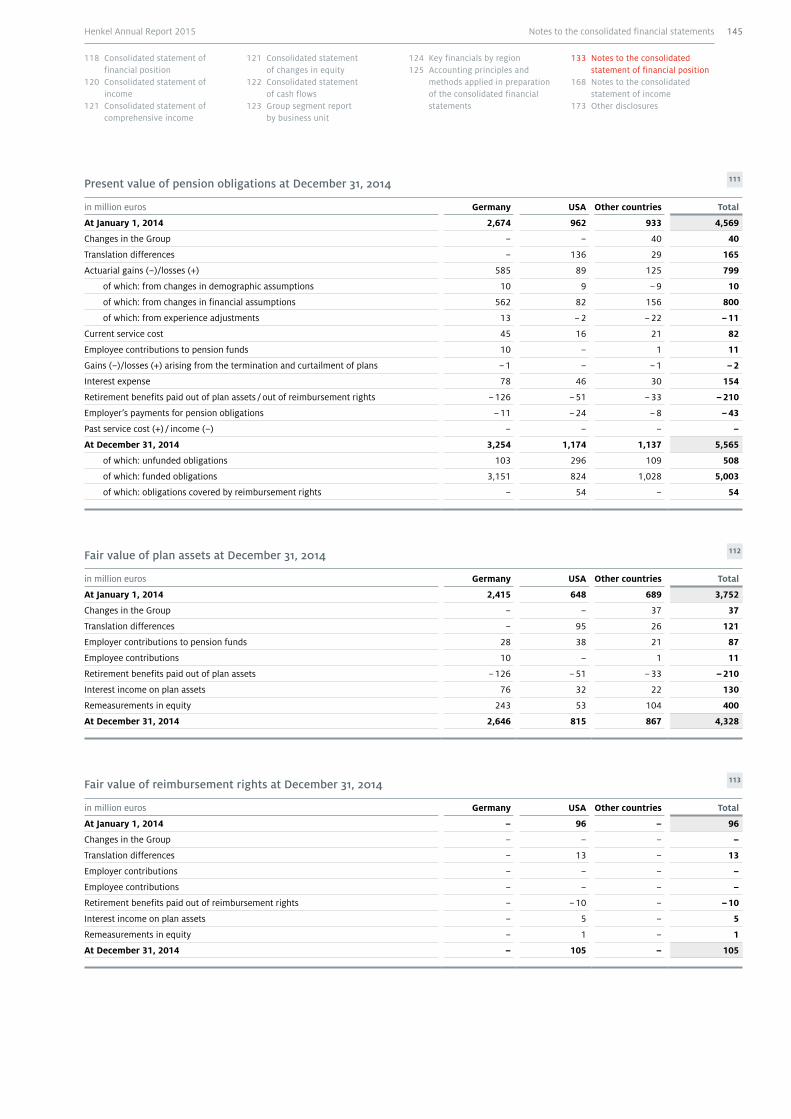
Present value of pension obligations at December 31, 2014 111
in million euros Germany USA Other countries Total
At January 1, 2014 2,674 962 933 4,569
Changes in the Group – – 40 40
Translation differences – 136 29 165
Actuarial gains (–)/losses (+) 585 89 125 799
of which: from changes in demographic assumptions 10 9 – 9 10
of which: from changes in financial assumptions 562 82 156 800
of which: from experience adjustments 13 – 2 – 22 – 11
Current service cost 45 16 21 82
Employee contributions to pension funds 10 – 1 11
Gains (–)/losses (+) arising from the termination and curtailment of plans – 1 – – 1 – 2
Interest expense 78 46 30 154
Retirement benefits paid out of plan assets / out of reimbursement rights – 126 – 51 – 33 – 210
Employer’s payments for pension obligations – 11 – 24 – 8 – 43
Past service cost (+) / income (–) – – – –
At December 31, 2014 3,254 1,174 1,137 5,565
of which: unfunded obligations 103 296 109 508
of which: funded obligations 3,151 824 1,028 5,003
of which: obligations covered by reimbursement rights – 54 – 54
Fair value of plan assets at December 31, 2014 112
in million euros Germany USA Other countries Total
At January 1, 2014 2,415 648 689 3,752
Changes in the Group – – 37 37
Translation differences – 95 26 121
Employer contributions to pension funds 28 38 21 87
Employee contributions 10 – 1 11
Retirement benefits paid out of plan assets – 126 – 51 – 33 – 210
Interest income on plan assets 76 32 22 130
Remeasurements in equity 243 53 104 400
At December 31, 2014 2,646 815 867 4,328
Fair value of reimbursement rights at December 31, 2014 113
in million euros Germany USA Other countries Total
At January 1, 2014 – 96 – 96
Changes in the Group – – – –
Translation differences – 13 – 13
Employer contributions – – – –
Employee contributions – – – –
Retirement benefits paid out of reimbursement rights – – 10 – – 10
Interest income on plan assets – 5 – 5
Remeasurements in equity – 1 – 1
At December 31, 2014 – 105 – 105
145Notes to the consolidated financial statementsHenkel Annual Report 2015
118 Consolidated statement of financial position
120 Consolidated statement of income
121 Consolidated statement of comprehensive income
121 Consolidated statement of changes in equity
122 Consolidated statement of cash flows
123 Group segment report by business unit
124 Key financials by region125 Accounting principles and
methods applied in preparation of the consolidated financial statements
133 Notes to the consolidated statement of financial position
168 Notes to the consolidated statement of income
173 Other disclosures
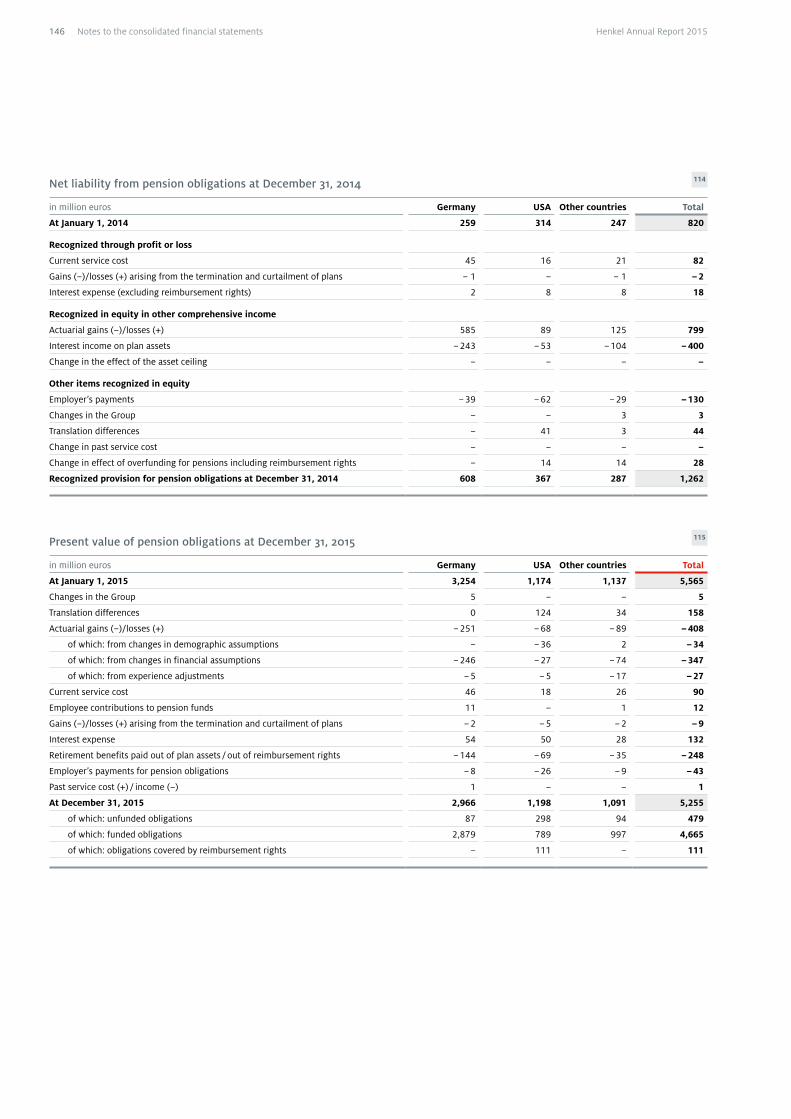
Net liability from pension obligations at December 31, 2014 114
in million euros Germany USA Other countries Total
At January 1, 2014 259 314 247 820
Recognized through profit or loss
Current service cost 45 16 21 82
Gains (–)/losses (+) arising from the termination and curtailment of plans – 1 – – 1 – 2
Interest expense (excluding reimbursement rights) 2 8 8 18
Recognized in equity in other comprehensive income
Actuarial gains (–)/losses (+) 585 89 125 799
Interest income on plan assets – 243 – 53 – 104 – 400
Change in the effect of the asset ceiling – – – –
Other items recognized in equity
Employer’s payments – 39 – 62 – 29 – 130
Changes in the Group – – 3 3
Translation differences – 41 3 44
Change in past service cost – – – –
Change in effect of overfunding for pensions including reimbursement rights – 14 14 28
Recognized provision for pension obligations at December 31, 2014 608 367 287 1,262
Present value of pension obligations at December 31, 2015 115
in million euros Germany USA Other countries Total
At January 1, 2015 3,254 1,174 1,137 5,565
Changes in the Group 5 – – 5
Translation differences 0 124 34 158
Actuarial gains (–)/losses (+) – 251 – 68 – 89 – 408
of which: from changes in demographic assumptions – – 36 2 – 34
of which: from changes in financial assumptions – 246 – 27 – 74 – 347
of which: from experience adjustments – 5 – 5 – 17 – 27
Current service cost 46 18 26 90
Employee contributions to pension funds 11 – 1 12
Gains (–)/losses (+) arising from the termination and curtailment of plans – 2 – 5 – 2 – 9
Interest expense 54 50 28 132
Retirement benefits paid out of plan assets / out of reimbursement rights – 144 – 69 – 35 – 248
Employer’s payments for pension obligations – 8 – 26 – 9 – 43
Past service cost (+) / income (–) 1 – – 1
At December 31, 2015 2,966 1,198 1,091 5,255
of which: unfunded obligations 87 298 94 479
of which: funded obligations 2,879 789 997 4,665
of which: obligations covered by reimbursement rights – 111 – 111
146 Henkel Annual Report 2015Notes to the consolidated financial statements

Fair value of plan assets at December 31, 2015 116
in million euros Germany USA Other countries Total
At January 1, 2015 2,646 815 867 4,328
Changes in the Group 3 – – 3
Translation differences – 93 29 122
Employer contributions to pension funds 25 – 35 60
Employee contributions 11 – 1 12
Retirement benefits paid out of plan assets – 144 – 69 – 35 – 248
Interest income on plan assets 49 34 22 105
Remeasurements in equity – 13 – 39 2 – 50
At December 31, 2015 2,577 834 921 4,332
Fair value of reimbursement rights at December 31, 2015 117
in million euros Germany USA Other countries Total
At January 1, 2015 – 105 – 105
Changes in the Group – – – –
Translation differences – 10 – 10
Employer contributions – 3 – 3
Employee contributions – – – –
Retirement benefits paid out of reimbursement rights – – 7 – – 7
Interest income on plan assets – 5 – 5
Remeasurements in equity – – 5 – – 5
At December 31, 2015 – 111 – 111
Net liability from pension obligations at December 31, 2015 118
in million euros Germany USA Other countries Total
At January 1, 2015 608 367 287 1,262
Recognized through profit or loss
Current service cost 46 18 26 90
Gains (–)/losses (+) arising from the termination and curtailment of plans – 2 – 5 – 2 – 9
Interest expense (excluding reimbursement rights) 5 16 6 27
Recognized in equity in other comprehensive income
Actuarial gains (–)/losses (+) – 251 – 68 – 89 – 408
Interest income on plan assets 13 39 – 2 50
Change in the effect of the asset ceiling – – 6 6
Other items recognized in equity
Employer’s payments – 33 – 26 – 43 – 102
Changes in the Group 2 – – 2
Translation differences – 31 5 36
Change in past service cost 1 – – 1
Change in effect of overfunding for pensions including reimbursement rights – 15 18 33
Recognized provision for pension obligations at December 31, 2015 389 387 212 988
147Notes to the consolidated financial statementsHenkel Annual Report 2015
118 Consolidated statement of financial position
120 Consolidated statement of income
121 Consolidated statement of comprehensive income
121 Consolidated statement of changes in equity
122 Consolidated statement of cash flows
123 Group segment report by business unit
124 Key financials by region125 Accounting principles and
methods applied in preparation of the consolidated financial statements
133 Notes to the consolidated statement of financial position
168 Notes to the consolidated statement of income
173 Other disclosures

The total present value (defined benefit obligation – DBO) is comprised of:• 1,826 million euros for active employees, • 811 million euros for former employees with
vested benefits, and • 2,618 million euros for retirees.
The average weighted duration of pension obligations is 14 years for Germany, 9 years for the USA and 20 years for other countries.
In determining net liability, we take into account amounts that are not recognized due to asset ceiling restrictions. If the fair value of the plan asset item exceeds the obligations arising from the pension benefits, an asset is recognized only if the reporting entity can also derive economic benefit from these assets, for example in the form of return flows or a future reduction in contributions (“Asset Ceiling” per IAS 19.58 ff.). In the reporting period, we recorded an amount of 6 million euros as an asset ceiling (previous year: 0 million euros).
Within our consolidated statement of income, current service costs are allocated on the basis of cost of sales to the respec-
tive function. Only the net of interest expense for the present value of obligations and interest income from plan assets is reported in the interest result. All gains/losses from the termi-nation and curtailment of plans have been recognized in other operating income/charges. The employer’s contributions in respect of state pension provisions are included as “Social security contributions and staff welfare costs” under Note 33, page 173. In 2015, payments into the plan assets amounted to 60 million euros (previous year: 87 million euros).
The reimbursement rights covering a portion of the pension obligations in the USA are assets that do not fulfill the defini-tion of plan assets as stated in IAS 19.
The reimbursement rights indicated are available to the Group in order to cover the expenditures required to fulfill the respective pension obligations. Reimbursement rights and the associated pension obligations must, according to IAS 19, be shown unnetted in the statement of financial position.
Payments into pension funds in fiscal 2016 are expected to total 78 million euros.
Analysis of plan assets 119
in million euros
December 31, 2014 December 31, 2015
Quotation on active markets
No quotation on active markets
Total Quotation on active markets
No quotation on active markets
Total
Shares 1,130 – 1,130 1,274 – 1,274
Europe 456 – 456 555 – 555
USA 205 – 205 223 – 223
Others 469 – 469 496 – 496
Bonds and hedging instruments 2,891 – 2 2,889 2,891 11 2,902
Government bonds 1,006 – 1,006 994 – 994
Corporate bonds 1,885 – 1,885 1,897 – 1,897
Derivatives – – 2 – 2 – 11 11
Alternative investments – 171 171 – 214 214
Cash – 123 123 – 78 78
Liabilities 1 – – 226 – 226 – – 349 – 349
Other assets – 241 241 – 213 213
Total 4,021 307 4,328 4,165 167 4,332
1 Liability to Henkel AG & Co. KGaA from the assumption of pension payments for Henkel Trust e.V.
148 Henkel Annual Report 2015Notes to the consolidated financial statements

Classification of bonds by rating 2015 121Plan assets by country 2015 120
USA 19 % Germany 60 %
Other countries 21 %
Non-investment grade 4 % Investment grade 96 %
The objective of the investment strategy for the global plan assets is the long-term security of pension payments. This is ensured by comprehensive risk management that takes into account the asset and liability portfolios of the defined benefit pension plans. Henkel pursues a liability-driven investment (LDI) approach in order to achieve the investment objective. This approach takes into account the structure of the pension obligations and manages the cover ratio of the pension plans. In order to improve the funding ratio, Henkel invests plan assets in a diversified portfolio for which the expected long-term yield is above the interest costs of the pension obligations.
In order to cover the risks arising from trends in wages, sala-ries and life expectancies, and to close the potential deficit between plan assets and pension obligations over the long term, additional investments are made in a return-enhancing portfolio as an add-on instrument that contains assets such as equities, private equity and real estate. The target portfolio structure of the plan assets is essentially determined in asset-liability studies. These studies are conducted regularly with the help of external advisors who assist Henkel in the invest-ment of plan assets. They examine the actual portfolio struc-ture, taking into account current capital market conditions, investment principles and the obligation structure, and can suggest adjustments be made to the portfolio.
The expected long-term yield for individual plan assets is derived from the target portfolio structure and the expected long-term yields for the individual asset classes.
Major plan assets are administered by external fund managers in Germany and the USA. These countries pursue the above investment strategies and are monitored centrally. At Decem-ber 31, 2015, other assets making up the plan assets included the present value of a non-current receivable of 60 million
euros (previous year: 69 million euros) relating to claims per-taining to a hereditary building lease assigned by Henkel AG & Co. KGaA to Henkel Trust e.V. Also shown here is a claim of 123 million euros against BASF Personal Care & Nutrition GmbH (formerly Cognis GmbH) for indemnification of pen-sion obligations (previous year: 140 million euros). This claim represents the nominal value, which is equivalent to the mar-ket price. In the reporting year, as in the previous year, we held no direct investments and no treasury shares in respect of plan assets in the portfolio.
Risks associated with pension obligations
Our internal pension risk management monitors the risks of all pension plans Group-wide in compliance with local legal regulations. As part of the monitoring process, guidelines on the control and management of risks are adopted and continu-ously developed; these guidelines mainly govern external funding, portfolio structure and actuarial assumptions. The objective of the financing strategy within the Group is to ensure that plan assets cover 90 to 100 percent of the present value of the funded pension obligations. The contributions and investment strategies are intended to ensure nearly com-plete coverage of the plans for the duration of the pension obligations.
Henkel’s pension obligations are exposed to various market risks. These risks are counteracted by the degree of external funding and the structure of pension benefits. The risks relate primarily to changes in market interest rates, inflation, and life expectancy, as well as general market fluctuations. Pension obligations based on contractual provisions in Germany gen-erally entail lifelong benefits payable in the event of death or disability or when the employee reaches retirement age.
149Notes to the consolidated financial statementsHenkel Annual Report 2015
118 Consolidated statement of financial position
120 Consolidated statement of income
121 Consolidated statement of comprehensive income
121 Consolidated statement of changes in equity
122 Consolidated statement of cash flows
123 Group segment report by business unit
124 Key financials by region125 Accounting principles and
methods applied in preparation of the consolidated financial statements
133 Notes to the consolidated statement of financial position
168 Notes to the consolidated statement of income
173 Other disclosures

In order to reduce the risks arising from the payment of lifelong benefits as well as inflation, pension benefits have been gradu-ally converted since 2004 to what are known as modular ben-efits with a pension option in which the benefit is initially divided into an annuity and lump-sum benefit portion. Newly hired employees since 2011 receive a commitment based pri-marily on the lump-sum benefit. Generally, lump-sum benefits may also be paid out as an annuity through a pension fund. All benefits in Germany are financed through a provident fund (Vorsorgefonds) established for the purpose of the occupational pension plan. Benefits for new employees since 2011 as well as a portion of the entitlements vested since 2004 are linked to the performance of this provident fund, resulting in a reduction in overall risk to the Group. The described adjustments reduce the financial risk from pension commitments within the pension structure. By linking the benefit to the capital investment, the net risk is also largely eliminated. An increase in the long-term inflation assumption would mainly affect the expected increase in pensions and the expected increase in pension-eligible salaries.
The pension obligations in the USA are based primarily on three retirement plans that are all closed to new employees. New employees receive pension benefits based on a defined contribution plan. The pension benefits generally have a lump-sum option which is usually exercised. When a pen-sion becomes payable, the amount of the annuity granted is determined on the basis of current market interest rates. As a result, the impact of a change to the interest rate used in the calculation is low compared to pension commitments entail-ing lifelong benefits. Additionally, in the USA, pensions paid once are not adjusted by amount, thus there are no direct risks during the pension payment period arising from pending annuity adjustments. Inflation risks therefore result mainly from the salary adjustments awarded.
In addition to the pension obligation risks already presented, there are specific risks associated with multi-employer plans. In the Henkel Group, these essentially relate to the USA. The contributions to these plans are raised mainly through an allo-cation process based on the pension-eligible income of active
employees. Restructuring contributions may also be made in order to close gaps in coverage. The risks of such plans arise largely from higher future contributions to close coverage gaps or through discontinuation by other companies obligated to make contributions.
The impact of changes to assumptions in medical benefits for employees and retirees in the USA is shown in the sensitivities analysis.
The analysis of our Group-wide pension obligations revealed no extraordinary risks.
Cash flows and sensitivitiesIn the next five financial years, the following payments from pension plans are expected:
Future payments for pension benefits 122
in million eurosGermany USA Other
countriesTotal
2016 146 119 34 299
2017 135 104 30 269
2018 132 103 32 267
2019 134 103 33 270
2020 135 101 35 271
The future level of the funded status and thus of the pension obligations depends on the development of the discount rate, among other factors. Companies based in Germany and the USA account for 79 percent of our pension obligations. The medical costs for employees of our subsidiaries in the USA which are incurred after retirement are also recognized in the pension obligations for defined benefit plans. A rate of increase of 7.1 percent (previous year: 7.3 percent) was assumed for the medical costs. We expect this rate of increase to fall gradually to 4.5 percent by 2037 (previous year: 4.5 percent by 2028). The effects of a change in material actuarial assumptions for the present value of pension obligations are as follows:
150 Henkel Annual Report 2015Notes to the consolidated financial statements

Sensitivities – Present value of pension obligations at December 31, 2015 123
in million euros Germany USA Other countries Total
Present value of obligations 2,966 1,198 1,091 5,255
in the event of
Increase in the discount rate by 0.5 pp 2,763 1,158 999 4,920
Reduction of the discount rate by 0.5 pp 3,185 1,260 1,212 5,657
Rise in future income increases by 0.5 pp 2,968 1,212 1,122 5,302
Reduction of future income increases by 0.5 pp 2,966 1,200 1,076 5,242
Rise in retirement benefits increases by 0.5 pp 3,120 1,206 1,151 5,477
Reduction of retirement benefits increases by 0.5 pp 2,825 1,206 1,066 5,097
Rise in medical costs by 0.5 pp 2,967 1,209 1,099 5,275
Reduction of medical costs by 0.5 pp 2,967 1,203 1,098 5,268
pp = percentage points
The extension of life expectancy in Germany by one year would increase the present value of pension obligations by 4 percent. This would have a more limited effect in the USA because a significant share of the pension plans is based on lump-sum benefits.
It should be noted with respect to the sensitivities presented that, due to mathematical effects, the percentage change is not and does not need to be linear. Thus the percentage increases and decreases do not vary with the same absolute amount. Each sensitivity is independently calculated and is not subject to scenario analysis.
16 Income tax provisions and other provisions
Development in 2015 124
in million euros
Initial balance January 1, 2015
Other changes Utilized Released Added End balance December
31, 2015
Income tax provisions 335 – 28 – 154 – 84 283 352
of which: non-current 84 – 5 – 3 0 13 89
of which: current 251 – 23 – 151 – 84 270 263
Restructuring provisions 240 – 2 – 110 – 27 124 225
of which: non-current 95 – 26 – 12 – 8 23 72
of which: current 145 24 – 98 – 19 101 153
Sundry provisions 1,653 – 11 – 1,099 – 140 1,332 1,735
of which: non-current 285 – 48 – 22 – 3 112 324
of which: current 1,368 37 – 1,077 – 137 1,220 1,411
Total 2,228 – 41 – 1,363 – 251 1,739 2,312
of which: non-current 464 – 79 – 37 – 11 148 485
of which: current 1,764 38 – 1,326 – 240 1,591 1,827
Provisions are recognized for obligations toward third parties where the outflow of resources is probable and the expected obligation can be reliably estimated. Provisions are measured to the best estimate of the expenditures required in order to meet the current obligation as of the reporting date. Price
increases expected to take place prior to the time of perfor-mance are included in the calculation. Provisions in which the interest effect is material are discounted to the reporting date at a pre-tax interest rate. For obligations in Germany, we have applied interest rates of between 0.2 and 2.6 percent.
151Notes to the consolidated financial statementsHenkel Annual Report 2015
118 Consolidated statement of financial position
120 Consolidated statement of income
121 Consolidated statement of comprehensive income
121 Consolidated statement of changes in equity
122 Consolidated statement of cash flows
123 Group segment report by business unit
124 Key financials by region125 Accounting principles and
methods applied in preparation of the consolidated financial statements
133 Notes to the consolidated statement of financial position
168 Notes to the consolidated statement of income
173 Other disclosures

Risks arising from legal disputes and proceedingsProvisions have been made for individual risks arising from civil disputes in the amount of probable claims plus associ-ated procedural costs. The total amount in euros is in the low double-digit millions. In accordance with IAS 37.92, further disclosures with respect to the proceedings and their related risks to Henkel have not been made in order to refrain from interference with their outcome.
On December 18, 2014, in an action relating to infringements between 2003 and 2006, the French antitrust authorities imposed fines amounting to around 951 million euros in total against various international companies in the cosmetic and detergent industries. Henkel received a fine of 109 million euros, which was paid provisionally on May 15, 2015. A deci-sion on the appeal filed by Henkel with regard to the amount of the fine is still pending.
In addition to other retail companies and manufacturers, Henkel was involved in an antitrust proceeding involving con-sumer goods (cosmetics and detergents) in Belgium relating to violations in the period from 2004 to the beginning of 2007. The action was related to a possible collusion between various Belgian retail companies to raise consumer prices (including prices for products in Henkel’s portfolio) with the involvement of Henkel. A final agreement was reached with the Belgian antitrust authorities. Henkel made a payment of around 6 mil-lion euros in this regard on July 15, 2015.
Henkel and its Group companies are also defendants in or parties to other judicial, arbitrational, and official proceed-ings. The course and outcomes of legal disputes are inherently uncertain and unpredictable. Based on the knowledge cur-rently available, no negative future impact, material or other-wise, on the net assets, financial position and results of operations of the corporation is expected.
The income tax provisions comprise accrued tax liabilities and amounts set aside for the outcome of external tax audits.
Other provisions include identifiable obligations toward third parties. They are measured at total cost.
Other changes in provisions include changes in the scope of consolidation, movements in exchange rates, compounding effects, and adjustments to reflect changes in maturity as time passes.
Provisions are recognized in respect of restructuring measures, provided that work has begun on the implementation of a detailed, formal plan or such a plan has already been commu-nicated. Additions to the restructuring provisions are related to the continued expansion of our shared services and to the further optimization of production and process structures in all business units.
The provisions for obligations arising from our sales activities cover expected burdens in the form of subsequent reductions in already generated revenues, and risks arising from pending transactions.
Provisions for payroll obligations essentially cover expendi-tures likely to be incurred by the Group for variable, perfor-mance-related remuneration components.
Provisions for obligations in the production and engineering sphere relate primarily to provisions for warranties.
Analysis of sundry provisions by function 125
in million eurosDecember
31, 2014December
31, 2015
Sales 688 817
of which: non-current 10 14
of which: current 678 803
Payroll 517 638
of which: non-current 169 228
of which: current 348 410
Production and engineering 38 37
of which: non-current 21 20
of which: current 17 17
Various sundry obligations 410 243
of which: non-current 85 62
of which: current 325 181
Total 1,653 1,735
of which: non-current 285 324
of which: current 1,368 1,411
152 Henkel Annual Report 2015Notes to the consolidated financial statements

17 Borrowings
Borrowings 126
in million euros
December 31, 2014 December 31, 2015
Non-current Current Total Non-current Current Total
Bonds 1,342 7 1,349 – – –
Commercial paper 1 – 288 288 – 811 811
Liabilities to banks 2 9 95 104 – 69 69
Other borrowings 3 – 3 4 – 4
Total 1,354 390 1,744 4 880 884
1 From the euro and US dollar commercial paper program (total volume 2 billion US dollars and 1 billion euros).2 Obligations with floating rates of interest or interest rates pegged for less than one year.
Bonds 127
Issuer Type Nominal value
Carrying amounts excluding accrued
interest
Market values excluding accrued
interest 1
Market values including accrued
interest 1
Interest rate 2 Interest fixing
in million euros 2014 2015 2014 2015 2014 2015 2014 2015
Henkel AG & Co. KGaA Hybrid bond 1,300 1,342 – 1,343 – 1,350 – 5.3750 – to 2015 3
Interest rate swap (3-month Euribor +1.80 %) 4 Receiver swap 650 20 – 20 – 23 – 1.8812 – 3 months
Interest rate swap (1-month Euribor +0.955 %) 4 Receiver swap 650 25 – 25 – 28 – 0.9597 – 1 month
Total bonds 2,300 1,342 – 1,343 – 1,350 –
Total interest rate swaps 2,300 45 – 45 – 51 –
1 Market value of the bonds derived from the stock market price at December 31.2 Interest rate on December 31.3 Fixed-rate interest of bond coupon: 5.375 percent, converted using interest rate swaps into a floating interest rate; no further interest fixings
(previous year: January 26, 2015) (fair value hedge).4 Not including the valuation allowance in the amount of 0 million euros to provide for counterparty credit risk (previous year: 2 million euros).
As a result of our call declared on October 16, 2015, the hybrid bond reported in non-current borrowings was repaid in full on November 25, 2015. The repayment was made at the nominal value of 1.3 billion euros plus accrued interest.
153Notes to the consolidated financial statementsHenkel Annual Report 2015
118 Consolidated statement of financial position
120 Consolidated statement of income
121 Consolidated statement of comprehensive income
121 Consolidated statement of changes in equity
122 Consolidated statement of cash flows
123 Group segment report by business unit
124 Key financials by region125 Accounting principles and
methods applied in preparation of the consolidated financial statements
133 Notes to the consolidated statement of financial position
168 Notes to the consolidated statement of income
173 Other disclosures

18 Other financial liabilities
Analysis 128
in million euros
December 31, 2014 December 31, 2015
Non-current Current Total Non-current Current Total
Liabilities to non-consolidated affiliated companies and associated companies – 9 9 – 8 8
Liabilities to customers – 35 35 – 42 42
Derivative financial instruments – 43 43 – 44 44
Sundry financial liabilities 1 30 31 1 15 16
Total 1 117 118 1 109 110
Of the liabilities to non-consolidated affiliated companies and associated companies, 7 million euros are attributable to non-consolidated affiliated companies, and 1 million euros to associated companies. Sundry financial liabilities include payments owed to the Pensionssicherungsverein mutual insurance association amounting to 6 million euros (previous year: 4 million euros).
19 Other liabilities
Analysis 129
in million euros
December 31, 2014 December 31, 2015
Non-current Current Total Non-current Current Total
Other tax liabilities – 108 108 – 174 174
Liabilities to employees – 25 25 – 28 28
Liabilities relating to employee deductions – 61 61 – 70 70
Liabilities in respect of social security 1 22 23 1 22 23
Sundry other liabilities 12 52 64 15 57 72
Total 13 268 281 16 351 367
The sundry other liabilities primarily comprise various accru-als and deferrals amounting to 14 million euros (previous year: 16 million euros) and payments on account received in the amount of 3 million euros (previous year: 4 million euros).
20 Trade accounts payable
Trade accounts payable increased from 3,046 million euros to 3,176 million euros. In addition to purchase invoices, they also relate to accruals for invoices outstanding in respect of goods and services received. They are due within one year.
154 Henkel Annual Report 2015Notes to the consolidated financial statements

Categories used by Henkel
Financial instruments
Financial assets Financial liabilities Equity
Fair value Amortized cost Fair value Cost
Other compre-hensive income
Available for saleLoans and receivables
Held to maturity
Amortized cost
Held for trading
Fair value option
Statement of income Fair value option Held for trading
21 Financial instruments report 130
Financial instruments explained by categoryA financial instrument is any contract that gives rise to a financial asset of one entity and a financial liability or equity instrument of another entity.
Within the Henkel Group, financial instruments are reported under trade accounts receivable, trade accounts payable, borrow-ings, other financial assets, other financial liabilities, and cash and cash equivalents within the statement of financial position.
Financial instruments are recognized once Henkel becomes a party to the contractual provisions of the financial instrument. The recognition of financial assets takes place at the settlement date, with the exception of derivative financial instruments, which are recognized on the transaction date. All financial instruments are initially reported at their fair value. Incidental acquisition costs are only capitalized if the financial instru-ments are not subsequently remeasured to fair value through profit or loss. For subsequent remeasurement, financial instruments are divided into the following classes in accor-dance with IAS 39:• Financial instruments measured at amortized cost• Financial instruments measured at fair value
Different valuation categories are allocated to these two classes. Financial instruments assigned to the valuation categories “Fair value option,” “Available for sale” and “Held for trading” are gen-erally measured at fair value. In fiscal 2014, we included in the fair value option fixed-interest bonds which were recognized in other financial assets under securities and time deposits and for which we had concluded interest rate swaps in order to convert the fixed interest rate into a floating interest rate. Other securi-ties and time deposits as well as other investments which are not measured using the equity method, both part of other financial assets in the statement of financial position, are categorized as “Available for sale.” Only the derivative financial instruments held by the Henkel Group which are not included in hedge accounting are designated as “Held for trading.” We recognize all other financial instruments including the finan-cial assets categorized as “Loans and receivables” at amortized cost using the effective interest method. The measurement category “Held to maturity” is not used within the Henkel Group.
155Notes to the consolidated financial statementsHenkel Annual Report 2015
118 Consolidated statement of financial position
120 Consolidated statement of income
121 Consolidated statement of comprehensive income
121 Consolidated statement of changes in equity
122 Consolidated statement of cash flows
123 Group segment report by business unit
124 Key financials by region125 Accounting principles and
methods applied in preparation of the consolidated financial statements
133 Notes to the consolidated statement of financial position
168 Notes to the consolidated statement of income
173 Other disclosures

The financial instruments in the measurement category “Loans and receivables” are non-derivative financial instru-ments. They are characterized by fixed or determinable pay-ments and are not traded in an active market. Within the Henkel Group, this category is mainly comprised of trade accounts receivable, cash and cash equivalents, and other financial assets with the exception of investments, deriva-tives, securities and time deposits. The carrying amounts of the financial instruments categorized as “Loans and receiv-ables” closely approximate their fair value due to their pre-dominantly short-term nature. If there are doubts as to the realizability of these financial instruments, they are recog-nized at amortized cost less appropriate valuation allowances.
Financial instruments are recognized in the “Fair value option” if this classification conveys more relevant information by eliminating or significantly reducing inconsistencies in the measurement or in the recognition that result from the valua-tion of assets or liabilities or the recognition of gains and losses on a different basis. Financial instruments classified in the “Fair value option” are recognized at fair value through profit or loss.
Financial instruments in the category “Available for sale” are non-derivative financial assets and are recognized at fair value, provided that this is reliably determinable. If the fair value can-not be reliably determined, they are recognized at cost. Value changes between the reporting dates are essentially recog-nized in equity through comprehensive income (revaluation reserve) without affecting profit or loss, unless the cause lies in permanent impairment. Impairment losses are recognized through profit or loss. When the asset is derecognized, the amounts recognized in the revaluation reserve are released through profit or loss. In the Henkel Group, the securities and time deposits recognized under other financial assets, and not
classified under the “Fair value option,” and also other invest-ments, are categorized as “Available for sale.” The fair values of the securities and time deposits are based on quoted market prices, or derived from market data. As the fair values of other investments not recognized using the equity method cannot be reliably determined, they are measured at amortized cost. In fiscal 2014, the shares in Ten Education Ltd. and Ten Lifestyle Holdings Ltd., which were included under other investments, were sold, producing a gain of 6 million euros. At the time of derecognition, the carrying amount of these interests was less than 1 million euros. Henkel is currently not planning to sell any of the other financial instruments recognized under other investments.
The derivative financial instruments that are not included in a designated hedging relationship are categorized as “Held for trading” and recognized at their fair value. All fair value changes are recognized through profit or loss. Hedge account-ing is applied in individual cases – where possible and eco-nomically sensible – in order to avoid profit and loss varia-tions arising from fair value changes in derivative financial instruments. Depending on the type of underlying and the risk being hedged, fair value and cash flow hedges are designated within the Group. Details relating to the hedging contracts transacted within the Group and how the fair values of the derivatives are determined are provided on pages 159 to 161.
All financial liabilities – with the exception of derivative finan-cial instruments – are essentially recognized at amortized cost using the effective interest method.
Borrowings for which a hedging transaction has been concluded that meets the requirements of IAS 39 with respect to a desig-nated hedging relationship are recognized according to hedge accounting rules.
156 Henkel Annual Report 2015Notes to the consolidated financial statements

Carrying amounts and fair values of financial instruments 131
December 31, 2014in million euros
Valuation according to IAS 39
Carrying amount
December 31
Amortized cost
Fair value, through other
comprehensive income
Fair value, through profit
or loss
Fair value December 31
Assets
Loans and receivables 4,331 4,331 – – 4,331
Trade accounts receivable 2,747 2,747 – – 2,747
Other financial assets 356 356 – – 356
Receivables from associated companies 1 1 – – 1
Financial receivables from third parties 34 34 – – 34
Receivables from Henkel Trust e.V. 226 226 – – 226
Sundry financial assets 95 95 – – 95
Cash and cash equivalents 1,228 1,228 – – 1,228
Fair value option 227 – – 227 227
Other financial assets 227 – – 227 227
Fixed-interest securities (level 1) 196 – – 196 196
Fixed-interest securities (level 2) 31 – – 31 31
Available for sale 114 21 93 – 114
Other financial assets 114 21 93 – 114
Other investments 21 21 – – 21
Floating-interest securities and time deposits (level 1) 14 – 14 – 14
Floating-interest securities (level 2) 60 – 60 – 60
Fixed-interest securities (level 1) – – – – –
Financial collateral provided (level 1) 19 – 19 – 19
Held for trading (level 2) 23 – – 23 23
Derivative financial instruments not included in a designated hedging relationship 23 – – 23 23
Derivative financial instruments included in a designated hedging relationship (level 2) 65 – 16 49 65
Total 4,760 4,352 109 299 4,760
Liabilities
Amortized cost 4,865 4,865 – – 4,866
Trade accounts payable 3,046 3,046 – – 3,046
Borrowings not included in a designated hedging relationship 395 395 – – 395
Borrowings included in a designated hedging relationship 1,349 1,349 – – 1,350
Other financial liabilities 75 75 – – 75
Held for trading (level 2) 35 – – 35 35
Derivative financial instruments not included in a designated hedging relationship 35 – – 35 35
Derivative financial instruments included in a designated hedging relationship (level 2) 8 – 8 – 8
Total 4,908 4,865 8 35 4,909
157Notes to the consolidated financial statementsHenkel Annual Report 2015
118 Consolidated statement of financial position
120 Consolidated statement of income
121 Consolidated statement of comprehensive income
121 Consolidated statement of changes in equity
122 Consolidated statement of cash flows
123 Group segment report by business unit
124 Key financials by region125 Accounting principles and
methods applied in preparation of the consolidated financial statements
133 Notes to the consolidated statement of financial position
168 Notes to the consolidated statement of income
173 Other disclosures

Carrying amounts and fair values of financial instruments 132
December 31, 2015in million euros
Valuation according to IAS 39
Carrying amount
December 31
Amortized cost
Fair value, through other
comprehensive income
Fair value, through profit
or loss
Fair value December 31
Assets
Loans and receivables 4,603 4,603 – – 4,603
Trade accounts receivable 2,944 2,944 – – 2,944
Other financial assets 483 483 – – 483
Receivables from associated companies 1 1 – – 1
Financial receivables from third parties 39 39 – – 39
Receivables from Henkel Trust e.V. 349 349 – – 349
Sundry financial assets 94 94 – – 94
Cash and cash equivalents 1,176 1,176 – – 1,176
Fair value option – – – – –
Other financial assets – – – – –
Fixed-interest securities (level 1) – – – – –
Fixed-interest securities (level 2) – – – – –
Available for sale 36 21 15 – 36
Other financial assets 36 21 15 – 36
Other investments 21 21 – – 21
Floating-interest securities and time deposits (level 1) 3 – 3 – 3
Floating-interest securities (level 2) 2 – 2 – 2
Fixed-interest securities (level 1) – – – – –
Financial collateral provided (level 1) 10 – 10 – 10
Held for trading (level 2) 60 – – 60 60
Derivative financial instruments not included in a designated hedging relationship 60 – – 60 60
Derivative financial instruments included in a designated hedging relationship (level 2) 12 – 12 – 12
Total 4,711 4,624 27 60 4,711
Liabilities
Amortized cost 4,126 4,126 – – 4,126
Trade accounts payable 3,176 3,176 – – 3,176
Borrowings not included in a designated hedging relationship 884 884 – – 884
Borrowings included in a designated hedging relationship – – – – –
Other financial liabilities 66 66 – – 66
Held for trading (level 2) 34 – – 34 34
Derivative financial instruments not included in a designated hedging relationship 34 – – 34 34
Derivative financial instruments included in a designated hedging relationship (level 2) 10 – 10 – 10
Total 4,170 4,126 10 34 4,170
The following hierarchy is applied in order to determine and disclose the fair value of financial instruments:• Level 1: Fair values which are determined on the basis of
quoted, unadjusted prices in active markets.• Level 2: Fair values which are determined on the basis of
parameters for which either directly or indirectly derived market prices are available.
• Level 3: Fair values which are determined on the basis of parameters for which the input factors are not derived from observable market data.
The fair value of securities and time deposits classified as level 1 is based on the quoted market prices on the reporting date. Observable market data are used to measure the fair value
158 Henkel Annual Report 2015Notes to the consolidated financial statements

of level 2 securities. If bid and ask prices are available, the mid price is used to determine the fair value.
We did not perform any reclassifications between the valua-tion categories or transfers within the fair value hierarchy either in fiscal 2015 or in the previous year.
Net gains and losses from financial instruments by category The net gains and losses from financial instruments can be allocated to the following categories:
Net results of the measurement categories and reconciliation to financial result 133
in million euros 2014 2015
Loans and receivables 51 57
Fair value option 12 –
Financial assets available for sale 15 2
Financial assets and liabilities held for trading including derivatives in a designated hedging relationship 107 64
Financial liabilities measured at amortized cost – 82 – 77
Total net results 103 46
Foreign exchange effects – 118 – 60
Interest expense of pension obligations less interest income from plan assets and reimburse-ment rights – 19 – 22
Other financial result (not related to financial instruments) – 15 – 6
Financial result – 49 – 42
The net result of “Loans and receivables” is allocated in full to interest income. Net expenses arising from additions and releases of valuation allowances amounting to –21 million euros (previous year: –20 million euros) and income from payments on financial instruments already written off and derecognized amounting to 1 million euros (previous year: 0 million euros) were recognized in operating profit.
The net result of the securities classified under the “Fair value option” includes interest income of 0 million euros (previous year: 5 million euros) and valuation gains of 0 million euros (previous year: 7 million euros).
The net result from securities and time deposits classified as “Available for sale” amounts to 1 million euros (previous year: 8 million euros) for interest income, 1 million euros (previous year: 1 million euros) for income from sales and 0 million euros (previous year: 6 million euros) for income from other investments. The measurement of these financial instruments
at fair value led to a gain of 0 million euros (previous year: 1 million euros) which we have recognized in the reserve for “Financial instruments available for sale” in equity.
The net result from “Held for trading” financial instruments and derivatives in a designated hedging relationship includes, in addition to the outcome of measurement of these deriva-tives at fair value amounting to 17 million euros (previous year: 59 million euros), an expense of 0 million euros arising from additions to the valuation allowance made for counterparty credit risk (previous year: 0 million euros). Moreover, 47 mil-lion euros of interest income and expenses from interest rate derivatives and amounts recycled from cash flow hedges recog-nized in equity are also included under this heading (previous year: 48 million euros).
The net result from “Financial liabilities measured at amor-tized cost” is essentially derived from the interest expense for borrowings amounting to –116 million euros (previous year: –124 million euros). Also included are valuation gains of 43 million euros (previous year: 45 million euros) from bor-rowings in a fair value hedge relationship. Fees amounting to –4 million euros for procuring money and loans were also rec-ognized under this heading (previous year: –3 million euros).
The realization and valuation of financial assets and liabilities in foreign currencies (without derivative financial instruments) resulted in an expense of –60 million euros (previous year: –118 million euros).
Derivative financial instrumentsDerivative financial instruments are measured at their fair value at the reporting date. Recognition of the gains and losses arising from fair value changes of derivative financial instru-ments is dependent upon whether the requirements of IAS 39 are fulfilled with respect to hedge accounting.
Hedge accounting is not applied to the large majority of deriv-ative financial instruments. We recognize through profit or loss the fair value changes in these derivatives which, in eco-nomic terms, represent effective hedges within the framework of Group strategy. These are largely compensated by fair value changes in the hedged items. In hedge accounting, derivative financial instruments are qualified as instruments for hedging the fair value of a recognized underlying (“fair value hedge”), as instruments for hedging future cash flows (“cash flow hedge”) or as instruments for hedging a net investment in a foreign entity (“hedge of a net investment in a foreign entity”). The following table provides an overview of the derivative financial instruments utilized and recognized within the Group, and their fair values:
159Notes to the consolidated financial statementsHenkel Annual Report 2015
118 Consolidated statement of financial position
120 Consolidated statement of income
121 Consolidated statement of comprehensive income
121 Consolidated statement of changes in equity
122 Consolidated statement of cash flows
123 Group segment report by business unit
124 Key financials by region125 Accounting principles and
methods applied in preparation of the consolidated financial statements
133 Notes to the consolidated statement of financial position
168 Notes to the consolidated statement of income
173 Other disclosures

Derivative financial instruments 134
At December 31 in million euros
Nominal value Positive fair value 2 Negative fair value 2
2014 2015 2014 2015 2014 2015
Forward exchange contracts 1 3,516 5,879 39 72 – 36 – 44
(of which: for hedging loans within the Group) (1,757) (4,277) (16) (51) (– 18) (– 29)
(of which: designated as cash flow hedge) (428) (696) (16) (12) (– 8) (– 10)
Foreign exchange options 2 5 – – – –
Interest rate swaps 1,517 – 49 – – 7 –
(of which: designated as fair value hedge) (1,300) (–) (49) (–) (–) (–)
(of which: designated as cash flow hedge) (–) (–) (–) (–) (–) (–)
(of which: to hedge financial instruments in the fair value option) (217) (–) (–) (–) (– 7) (–)
Total derivative financial instruments 5,035 5,884 88 72 – 43 – 44
1 Maturity less than 1 year. 2 Fair values including accrued interest and a valuation allowance for counterparty credit risk of 0 million euros (previous year: 2 million euros).
For forward exchange contracts, we determine the fair value on the basis of the reference exchange rates of the European Central Bank prevailing at the reporting date, taking into account forward premiums / forward discounts for the remain-ing term of the respective contract versus the contracted for-eign exchange rate. Foreign exchange options are measured using price quotations or recognized models for the determi-nation of option prices. We measure interest rate hedging instruments on the basis of discounted cash flows expected in the future, taking into account market interest rates applicable for the remaining term of the contracts. These are indicated for the two most important currencies in the following table. It shows the interest rates quoted on the interbank market in each case on December 31.
Interest rates in percent p.a. 135
At December 31Term
Euro US dollar
2014 2015 2014 2015
1 month 0.02 – 0.21 0.17 0.43
3 months 0.08 – 0.13 0.26 0.61
6 months 0.17 – 0.04 0.36 0.85
1 year 0.33 0.06 0.63 1.18
2 years 0.18 – 0.03 0.88 1.18
5 years 0.36 0.33 1.75 1.74
10 years 0.81 1.00 2.27 2.19
In measuring derivative financial instruments, counterparty credit risk is taken into account with an adjustment to the fair values concerned, determined on the basis of credit risk pre-miums. The adjustment relating to fiscal 2015 amounts to 0 million euros (previous year: 2 million euros). The addition is recognized in profit or loss under financial result.
Depending on their fair value and their maturity on the report-ing date, derivative financial instruments are included in financial assets (positive fair value) or in financial liabilities (negative fair value).
Most of the forward exchange contracts serve to hedge risks arising from trade accounts receivable and payable, and those pertaining to Group financing.
Fair value hedges: A fair value hedge hedges the fair value of rec-ognized assets and liabilities. The change in the fair value of the derivatives and the change in the fair value of the underly-ing relating to the hedged risk are simultaneously recognized in profit or loss.
Receiver interest rate swaps were used to hedge the fair value risk of the hybrid bond issued by Henkel AG & Co KGaA. They expired when the hybrid bond was redeemed in November 2015.
The following table provides an overview of the gains and losses arising from fair value hedges (valuation allowance made for the counterparty credit risk not included):
Gains and losses from fair value hedges 136
in million euros 2014 2015
Gains (+) / losses (–) from hedged items 45 43
Gains (+) / losses (–) from hedging instruments – 50 – 45
Net – 5 – 2
160 Henkel Annual Report 2015Notes to the consolidated financial statements

Cash flow hedges: A cash flow hedge hedges fluctuations in future cash flows from recognized assets and liabilities, and also transactions that are either planned or highly probable, or firmly contracted unrecognized financial commitments, from which an interest-rate or currency risk arises. The effective portion of a cash flow hedge is recognized in the hedge reserve in equity. The ineffective portion arising from the change in value of the hedging instrument is recognized through profit or loss in the financial result or operating profit, depending on the item hedged. The gains and losses recorded in equity are subsequently recognized through profit or loss in the period in which the results are affected by the hedged transaction.
Cash flow hedges (after tax) 137
in million euros
Initial balance
Addition (recognized
in equity)
Disposal (recognized
through profit or loss)
End balance
2015 – 202 1 – 14 – 215
2014 – 217 11 4 – 202
The initial value of the cash flow hedges recognized in equity reflects firstly the fair values of the payer interest swaps that were used to hedge the cash flow risks of the floating-interest US dollar liabilities at Henkel of America, Inc. and expired in 2014. Secondly, it relates to currency hedges for acquisitions transacted in previous years. Further amounts are related to the purchase of Colgate-Palmolive Company’s detergent busi-ness in Australia and New Zealand, and to the acquisition of the hairstyling business and the associated brands of Indust-rias Wet Line S.A. de C.V. in Latin America, completed during the reporting period.
An addition of 6 million euros after tax relates to currency hedges of planned inventory purchases against fluctuations in spot rates. Of the gains recognized in equity, 14 million euros were reclassified to operating profit in the reporting period. The positive and negative fair values of the derivatives con-tracted as a currency hedge of planned inventory purchases amounted to 12 million and –10 million euros respectively. The cash flows from the currency derivatives and the cash flows from the hedged inventory purchases are expected to occur and affect profit or loss in the next fiscal year.
A further addition of –5 million euros results from the cur-rency hedge for the purchase of Colgate-Palmolive Company’s detergent business in Australia and New Zealand (–6 million euros), and for the acquisition of the hairstyling business and the associated brands of Industrias Wet Line S.A. de C.V. in Latin America (1 million euros). The hedged cash flows relat ing to the acquisitions made will only be recognized in operat ing profit with disposal or in the event of an impairment loss on
the hedged items. In the fiscal year under review, ineffective portions amounting to less than 1 million euros (as in the pre-vious year) were recognized in profit or loss under financial result.
Hedges of a net investment in a foreign entity: The accounting treatment of hedges of a net investment in a foreign entity against translation risk is similar to that applied to cash flow hedges. The gain or loss arising from the effective portion of the hedging instrument is recognized in equity through other comprehensive income; the gain or loss of the ineffective por-tion is recognized directly through profit or loss. The gains or losses recognized directly in equity remain there until dis-posal or partial disposal of the net investment.
The items recognized in equity relate essentially to translation risks arising from net investments in Swiss francs and US dollars for which the associated hedges were entered into and settled in previous years.
The addition of –4 million euros relates to hedges of net investments contracted and settled in the past fiscal year in Chinese yuan and Russian rubles. The ineffective portions rec-ognized through profit or loss in the financial result amounted to less than 1 million euros. We made no transfers from equity to profit or loss in the course of the year.
Hedges of a net investment in a foreign entity (after tax) 138
in million euros
Initial balance
Addition (recognized
in equity)
Disposal (recognized
through profit or
loss)
End balance
2015 35 – 4 – 31
2014 35 – – 35
Risks arising from financial instruments, and risk managementAs a globally active corporation, Henkel is exposed in the course of its ordinary business operations to credit risks, liquidity risks and market risks (currency translation, interest rate and com-modity price risks). The purpose of financial risk management is to restrict the exposure arising from operating activities through the use of selective derivative and non- derivative hedges. Henkel uses derivative financial instruments exclusively for the pur-poses of risk management. Without these instruments, Henkel would be exposed to higher financial risks. Changes in exchange rates, interest rates or commodity prices can lead to significant fluctuations in the fair values of the derivatives used. These vari-ations in fair value should not be regarded in isolation from the hedged items, as derivatives and the underlying constitute a unit in terms of countervailing fluctuations.
161Notes to the consolidated financial statementsHenkel Annual Report 2015
118 Consolidated statement of financial position
120 Consolidated statement of income
121 Consolidated statement of comprehensive income
121 Consolidated statement of changes in equity
122 Consolidated statement of cash flows
123 Group segment report by business unit
124 Key financials by region125 Accounting principles and
methods applied in preparation of the consolidated financial statements
133 Notes to the consolidated statement of financial position
168 Notes to the consolidated statement of income
173 Other disclosures

Management of currency, interest rate and liquidity risks is based on the treasury guidelines introduced by the Manage-ment Board, which are binding on the entire corporation. They define the targets, principles and competences of the Corporate Treasury organizational unit. These guidelines describe the fields of responsibility and establish the distribution of these responsibilities between Corporate Treasury and Henkel’s subsidiaries. The Management Board is regularly and compre-hensively informed of all major risks and of all relevant hedging transactions and arrangements. A description of the objectives and fundamental principles adopted in capital management can be found in the combined management report on pages 74 and 75. There were no major risk clusters in the reporting period.
Credit riskIn the course of its business activities with third parties, the Henkel Group is exposed to global credit risk arising from both its operating business and its financial investments. This risk derives from the possibility of a contractual party not fulfilling its obligations.
The maximum credit risk is represented by the carrying value of the financial assets recognized in the statement of financial position (excluding financial investments recognized using the equity method), as indicated in the following table:
Maximum risk position 139
in million euros 2014 2015
Trade accounts receivable 2,747 2,944
Derivative financial instruments not included in a designated hedging relationship 23 60
Derivative financial instruments included in a designated hedging relationship 65 12
Other financial assets 697 519
Cash and cash equivalents 1,228 1,176
Total carrying values 4,760 4,711
In its operating business, Henkel is confronted by progressive concentration and consolidation on the customer side, as reflected in the receivables from individual customers.
A credit risk management system operating on the basis of a globally applied credit policy ensures that credit risks are constantly monitored and bad debts minimized. This policy,
which applies to both new and existing customers, governs the allocation of credit limits and compliance with those lim-its, individual analyses of customers’ creditworthiness based on both internal and external financial information, risk clas-sification, and continuous monitoring of the risk of bad debts at the local level. We also monitor our key customer relation-ships at the regional and global level. In addition, safeguard-ing measures are implemented on a selective basis for particu-lar countries and customers inside and outside the eurozone.
Collateral received and other safeguards include country- specific and customer-specific protection afforded by credit insurance, confirmed and unconfirmed letters of credit in the export business, and guarantees, warranties, and cover notes.
We make valuation allowances with respect to financial assets so that the assets are recognized at their fair value at the report-ing date. In the case of impairment losses that have already occurred but have not yet been identified, we make global valu-ation allowances on the basis of empirical evidence, taking into account the overdue structure of the trade accounts receivable. As a rule, the impairment test on loans and receivables that are more than 180 days overdue results in a valuation allowance of 100 percent.
The decision as to whether a credit risk is accounted for through a valuation allowance account or by derecognition of the impaired receivable depends upon the probability of incurring a loss. For accounts receivable classified as irrecoverable, we report the credit risk directly through derecognition of the impaired item or entry of the relevant amount in the valuation allowance account. If the basis for the original impairment is eliminated, we recognize a reversal through profit or loss.
In all, we recognized valuation allowances on loans and receiv-ables in 2015 in the amount of 21 million euros (previous year: 20 million euros).
The carrying amount of loans and receivables, the term of which was renegotiated because they would have otherwise fallen overdue or been impaired, was 0 million euros (previ-ous year: 0 million euros).
Based on our experience, we do not expect the necessity for any further valuation allowances, other than those described above, on non-overdue, non-impaired financial assets.
162 Henkel Annual Report 2015Notes to the consolidated financial statements

Age analysis of non-impaired overdue loans and receivables 140
Analysis
in million euros Less than 30 days 30 to 60 days 61 to 90 days More than 91 days Total
At December 31, 2015 194 67 32 6 299
At December 31, 2014 173 64 27 2 266
Credit risks also arise from financial investments such as cash at banks, securities and the positive fair value of derivatives. Such exposure is limited by our Corporate Treasury specialists through the selection of counterparties with strong credit rat-ings, and limitations on the amounts allocated to individual investments. In financial investments and derivatives trading with German and international banks, we only enter into transactions with counterparties of high financial standing. We invest exclusively in securities from issuers with an invest-ment grade rating. Our cash deposits can be liquidated at short notice. Our financial investments are broadly diversified across various counterparties and various financial assets. To minimize the credit risk, we agree netting arrangements to offset bilateral receivables and obligations with counterpar-
ties. We additionally enter into collateral agreements with selected banks, on the basis of which reciprocal sureties are established twice a month to secure the fair values of con-tracted derivatives and other claims and obligations. The net-ting arrangements only provide for a contingent right to offset transactions conducted with a contractual party. Accordingly, associated amounts can be offset only under certain circum-stances, such as the insolvency of one of the contractual par-ties. Thus, the netting arrangements do not meet the offsetting criteria under IAS 32 “Financial Instruments: Presentation.” The following table provides an overview of financial assets and financial liabilities from derivatives that are subject to netting, collateral, or similar arrangements:
Financial assets and financial liabilities from derivatives subject to netting, collateral, or similar arrangements 141
At December 31 in million euros
Gross amount recog-nized in the statement of financial position 1
Amount eligible for offsetting
Financial collateral received / provided
Net amount
2014 2015 2014 2015 2014 2015 2014 2015
Financial assets 90 72 26 35 19 35 45 2
Financial liabilities 43 44 26 35 11 10 6 – 1
1 Fair values excluding valuation allowance of 0 million euros made for counterparty credit risk (previous year: 2 million euros).
In addition to netting and collateral arrangements, investment limits are set, based on the ratings of the counterparties, in order to minimize credit risk. These limits are monitored and adjusted regularly. When determining the limits, we also apply
certain other indicators, such as the pricing of credit default swaps (CDS) by banks. A valuation allowance of 0 million euros exists to cover the remaining credit risk from the posi-tive fair values of derivatives (previous year: 2 million euros).
163Notes to the consolidated financial statementsHenkel Annual Report 2015
118 Consolidated statement of financial position
120 Consolidated statement of income
121 Consolidated statement of comprehensive income
121 Consolidated statement of changes in equity
122 Consolidated statement of cash flows
123 Group segment report by business unit
124 Key financials by region125 Accounting principles and
methods applied in preparation of the consolidated financial statements
133 Notes to the consolidated statement of financial position
168 Notes to the consolidated statement of income
173 Other disclosures

Liquidity riskLiquidity risk is defined as the risk of an entity failing to meet its financial obligations at any given time.
We minimize this risk by deploying financing instruments in the form of issued bonds and commercial paper. With the help of our existing debt issuance program in the amount of 6 bil-lion euros, this is also possible on a short-term and flexible basis. In order to ensure the financial flexibility of Henkel at any time, the liquidity within the Group is extensively central-ized and managed through the use of cash pools. We predomi-nantly invest cash in financial assets traded in a liquid market in order to ensure that they can be sold at any time to procure liquid funds. In addition, the Henkel Group has at its disposal
confirmed credit lines of 1.5 billion euros. These credit lines have terms until 2019. The individual subsidiaries additionally have at their disposal committed bilateral loans of 0.1 billion euros with a revolving term of up to one year. Our credit rating is regularly assessed by the rating agencies Standard & Poor’s and Moody’s.
Our liquidity risk can therefore be regarded as very low.
The maturity structure of the original and derivative financial liabilities within the scope of International Financial Report-ing Standard (IFRS) 7 based on cash flows is shown in the fol-lowing table.
Cash flows from financial liabilities 142
Remaining term
in million euros
December 31, 2014 Carrying amounts
Up to 1 year
Between 1 and 5
years
More than 5 years
December 31, 2014
Total cash flow
Bonds 1 1,349 70 – 1,300 1,370
Commercial paper 2 288 288 – – 288
Liabilities to banks 104 96 9 – 105
Trade accounts payable 3,046 3,046 – – 3,046
Sundry financial instruments 3 78 74 1 3 78
Original financial instruments 4,865 3,574 10 1,303 4,887
Derivative financial instruments 43 40 3 – 43
Total 4,908 3,614 13 1,303 4,930
1 Cash flows from the hybrid bond issued in 2005 are indicated up to November 25, 2015, which was the first possible date on which Henkel could redeem the bond. 2 From the euro and US dollar commercial paper program (total volume 2 billion US dollars and 1 billion euros).3 Sundry financial instruments include amounts due to customers, and finance bills.
Cash flows from financial liabilities 143
Remaining term
in million euros
December 31, 2015 Carrying amounts
Up to 1 year
Between 1 and 5
years
More than 5 years
December 31, 2015
Total cash flow
Bonds – – – – –
Commercial paper 1 811 811 – – 811
Liabilities to banks 69 70 – – 70
Trade accounts payable 3,176 3,176 – – 3,176
Sundry financial instruments 2 70 65 1 4 70
Original financial instruments 4,126 4,122 1 4 4,127
Derivative financial instruments 44 44 – – 44
Total 4,170 4,166 1 4 4,171
1 From the euro and US dollar commercial paper program (total volume 2 billion US dollars and 1 billion euros).2 Sundry financial instruments include amounts due to customers, and finance bills.
164 Henkel Annual Report 2015Notes to the consolidated financial statements

Market riskMarket risk exists where the fair value or future cash flows of a financial instrument may fluctuate due to changes in market prices. Market risks primarily take the form of currency risk, interest rate risk and various price risks (particularly the com-modity price risk).
The Corporate Treasury department manages currency expo-sure and interest rates centrally for the Group and is therefore responsible for all transactions with financial derivatives and other financial instruments. Trading, Treasury Controlling and Settlement (front, middle and back offices) are separated both physically and in terms of organization. The parties to the con-tracts are German and international banks which Henkel mon-itors regularly, in accordance with Corporate Treasury guide-lines, for creditworthiness and the quality of their quotations. Financial derivatives are used to manage currency exposure and interest rate risks in connection with operating activities and the resultant financing requirements, again in accordance with the Corporate Treasury guidelines. Financial derivatives are entered into solely for hedging purposes.
The currency and interest rate risk management of the Group is supported by an integrated treasury system which is used to identify, measure and analyze the Group’s currency exposure and interest rate risks. In this context, “integrated” means that the entire process from the conclusion of financial transac-tions to their entry in the accounts is covered. Much of the currency trading takes place on internet-based, multibank dealing platforms. These foreign currency transactions are automatically transferred into the treasury system. The cur-rency exposure and interest rate risks reported by all subsid-iaries under standardized reporting procedures are integrated into the treasury system by data transfer. As a result, it is pos-sible to retrieve and measure at any time all currency and interest rate risks across the Group and all derivatives entered into to hedge the exposure to these risks. The treasury system supports the use of various risk concepts.
Market risk is monitored on the basis of sensitivity analyses and value-at-risk computations. Sensitivity analyses enable estimation of potential losses, future gains, fair values or cash flows of instruments susceptible to market risks arising from one or several selected hypothetical changes in foreign exchange rates, interest rates, commodity prices or other relevant market rates or prices over a specific period. We use sensitivity analyses in the Henkel Group because they enable reasonable risk assessments to be made on the basis of direct assumptions (e.g. an increase in interest rates). Value-at-risk computations reveal the maximum potential future loss of a certain portfolio over a given period based on a specified probability level.
Currency riskThe global nature of our business activities results in a huge number of cash flows in different currencies. The resultant currency exposure breaks down into two categories, namely transaction and translation risks.
Transaction risks arise from possible exchange rate fluctua-tions causing changes in the value of future foreign currency cash flows. The hedging of the resultant exchange rate risks forms a major part of our central risk management activity. Transaction risks arising from our operating business are par-tially avoided by the fact that we largely manufacture our products in those countries in which they are sold. Residual transaction risks on the operating side are proactively man-aged by Corporate Treasury. This includes the ongoing assess-ment of the specific currency risk and the development of appropriate hedging strategies. The objective of our currency hedging is to fix prices based on hedging rates so that we are protected from future adverse fluctuations in exchange rates. Because we limit our potential losses, any negative impact on profits is restricted. The transaction risk arising from major financial payables and receivables is, for the most part, hedged. In order to manage these risks, we primarily utilize forward exchange contracts and currency swaps. The deriva-tives are designated as cash flow hedges or “Held for trading” and measured accordingly. The currency risk that exists within the Group in the form of transaction risk initially affects equity in the case of cash flow hedges, while all changes in the value of derivatives designated as “Held for trading“ are recognized directly in income.
The value-at-risk pertaining to the transaction risk of the Henkel Group as of December 31, 2015 amounted to 102 mil-lion euros after hedging (previous year: 215 million euros). The value-at-risk shows the maximum expected risk of loss in a year as a result of currency fluctuations. Starting in fiscal 2013, our value-at-risk analysis has been extended to one year in our internal risk reports as it provides a more comprehensive rep-resentation of the risk associated with a fiscal year. The risk arises from imports and exports by Henkel AG & Co. KGaA and its foreign subsidiaries. Due to the international nature of its activities, the Henkel Group has a portfolio with more than 50 different currencies. The following table shows the value-at-risk for Henkel’s major currencies.
165Notes to the consolidated financial statementsHenkel Annual Report 2015
118 Consolidated statement of financial position
120 Consolidated statement of income
121 Consolidated statement of comprehensive income
121 Consolidated statement of changes in equity
122 Consolidated statement of cash flows
123 Group segment report by business unit
124 Key financials by region125 Accounting principles and
methods applied in preparation of the consolidated financial statements
133 Notes to the consolidated statement of financial position
168 Notes to the consolidated statement of income
173 Other disclosures

Currency exposure 1 144
in million euros 2014 2015
Russian ruble 115 23
Turkish lira 22 7
Mexican peso 14 4
Brazilian real 13 4
Indian rupee 8 9
US dollar – 7 – 4
Other currencies 50 59
215 102
1 Transaction risk.
The value-at-risk analysis assumes a time horizon of one year and a unilateral confidence interval of 95 percent. We adopt the variance-covariance approach as our basis for calculation. Volatilities and correlations are determined using historical data. The value-at-risk analysis is based on the operating book positions and budgeted positions in foreign currency, nor-mally with a forecasting horizon of nine months.
Translation risks emanate from changes caused by foreign exchange fluctuations to items on the statement of financial position and the income statement of a subsidiary, and the effect these changes have on the translation of individual com-pany financial statements into Group currency. However, unlike transaction risk, translation risk does not necessarily impact future cash flows. The Group’s equity reflects the changes in carrying values resulting from foreign exchange influences. The risks arising from the translation of the earnings results of sub-sidiaries in foreign currencies and from net investments in for-eign entities are only hedged in exceptional cases.
Interest rate riskThe interest rate risk encompasses those potentially negative influences on profits, equity or cash flow in current or future reporting periods arising from changes in interest rates. In the case of fixed-interest financial instruments, changing capital market interest rates result in a fair value risk, as the attribut-able fair values fluctuate depending on capital market interest rates. In the case of floating-interest financial instruments, a cash flow risk exists because the interest payments may be subject to future fluctuations.
The Henkel Group obtains and invests the majority of the cash it requires from and in the international money and capital markets. The resulting financial liabilities and our cash deposits may be exposed to the risk of changes in interest rates. The aim of our centralized interest rate management system is to manage this risk through our choice of interest commitments and the use of derivative financial instruments. Only those derivative financial instruments that can be mod-
eled, monitored and assessed in the risk management system may be used to hedge the interest rate risk.
Henkel’s interest management strategy is essentially aligned to optimizing the net interest result for the Group. The deci-sions made in interest management relate to the commercial paper issued to secure Group liquidity, the securities and time deposits used for cash investments, and the other financial instruments. The financial instruments exposed to interest rate risk are primarily denominated in euros and US dollars.
Depending on forecasts with respect to interest rate develop-ments, Henkel enters into derivative financial instruments, primarily interest rate swaps, in order to optimize the interest rate lock-down structure. The coupon interest on the euro- denominated hybrid bond issued by Henkel was converted from fixed to floating through interest rate swaps until the bond was repaid on November 25, 2015. In the event of an expected rise in interest rate levels, Henkel protects its posi-tions by transacting additional interest rate derivatives as an effective means of guarding against interest rates rising over the short term. A major portion of the financing in US dollars has been converted from floating to fixed interest rates through interest rate swaps. This interest fixing expired at the end of the first quarter 2015. Since that time, the net interest position has been entirely floating.
Our exposure to interest rate risk at the reporting dates was as follows:
Interest rate exposure 145
in million euros
Carrying amounts
2014 2015
Fixed-interest financial instruments
Euro – –
US dollar – –
Others – –
– –
Floating-interest financial instruments
Euro 252 254
US dollar – 1,398 – 1,036
Chinese yuan 502 474
Russian ruble 59 16
Others 432 627
– 153 335
The calculation of the interest rate risk is based on sensitivity analyses. The analysis of cash flow risk examines all the main floating-interest financial instruments as of the reporting date. Net debt is defined as borrowings less cash and cash
166 Henkel Annual Report 2015Notes to the consolidated financial statements

equivalents and readily monetizable financial instruments classified as “Available for sale” or according to the “Fair value option,” less positive and plus negative fair values of hedging transactions. The interest rate risk figures shown in the table are based on this calculation at the relevant reporting date. When analyzing fair value risk, we assume a parallel shift in the interest curve of 100 basis points and calculate the hypo-thetical loss or gain of the relevant interest rate derivatives at the reporting date.
The risk of interest rate fluctuations with respect to the earn-ings of the Henkel Group is shown in the basis point value (BPV) analysis in the following table.
Interest rate risk 146
in million euros 2014 2015
Based on an interest rate change of 100 basis points 2 – 3
of which:
Cash flow through profit or loss 2 – 3
Fair value recognized in equity through comprehensive income – –
Other price risks (commodity price risk)Uncertainty with respect to commodity price development impacts the Group. Purchase prices for raw materials can affect the net assets, financial position and results of opera-tions of Henkel. The risk management strategy put in place by the Group management for safeguarding against procurement market risk is described in more detail in the risk and opportu-nities report on pages 108 and 109.
As a small part of the risk management strategy, cash-settled commodity futures may be entered into on the basis of fore-casted purchasing requirements in order to hedge future uncertainties with respect to commodity prices. Cash-settled commodity derivatives are only used at Henkel where there is a direct relationship between the hedging derivative and the physical underlying. Henkel does not practice hedge account-ing and can therefore be exposed to temporary price risks when holding commodity derivatives. Such price risks arise due to the fact that the commodity derivatives are measured at fair value whereas the purchasing requirement, as a pending transaction, is not measured or recognized. This can lead to losses being recognized in profit or loss and equity. Develop-ments in fair values and the resultant risks are continuously monitored.
167Notes to the consolidated financial statementsHenkel Annual Report 2015
118 Consolidated statement of financial position
120 Consolidated statement of income
121 Consolidated statement of comprehensive income
121 Consolidated statement of changes in equity
122 Consolidated statement of cash flows
123 Group segment report by business unit
124 Key financials by region125 Accounting principles and
methods applied in preparation of the consolidated financial statements
133 Notes to the consolidated statement of financial position
168 Notes to the consolidated statement of income
173 Other disclosures

22 Sales and principles of income recognition
Sales increased year on year to 18,089 million euros. Revenues and their development by business unit and region are sum-marized in the Group segment report and in the key financials by region on pages 123 and 124. A detailed explanation of the development of major income and expense items can be found in the combined management report on pages 67 to 71.
Sales comprise sales of goods and services less direct sales deductions such as customer-related rebates, credits and other benefits paid or granted. Sales are recognized once the goods have been delivered or the service has been performed. In the case of goods, this coincides with the physical delivery and so-called transfer of risks and rewards. Henkel uses different terms of delivery that contractually determine the transfer of risks and rewards. It must also be probable that the economic benefits associated with the transaction will flow to the Group, and the costs incurred with respect to the transaction must be reliably measurable.
Services are generally provided in conjunction with the sale of goods, and recorded once the service has been performed. No sale is recognized if there are significant risks relating to the receipt of the consideration or it is likely that the goods will be returned.
Interest income is recognized on a time-proportion basis that takes into account the effective yield on the asset and the interest rate in force. Dividend income from investments is recognized when the shareholders’ right to receive payment is legally established.
23 Cost of sales
The cost of sales increased from 8,712 million euros to 9,368 mil-lion euros.
Cost of sales comprises the cost of products and services sold and the purchase cost of merchandise sold. It consists of the directly attributable cost of materials and primary production cost, as well as indirect production overheads including the production-related amortization/depreciation and impair-ment of intangible assets and property, plant and equipment.
24 Marketing, selling and distribution expenses
Marketing, selling and distribution expenses amounted to 4,608 million euros (previous year: 4,151 million euros).
In addition to marketing organization and distribution expenses, this item comprises, in particular, advertising, sales promotion and market research expenses. Also included here are the expenses of technical advisory services for customers, valuation allowances on trade accounts receivable and valua-tion allowances and impairment losses on trademarks and other rights.
25 Research and development expenses
Research and development expenses increased year on year to 478 million euros. Expenditures directly attributable to research and development activities amounted to 464 million euros (previous year: 410 million euros).
The capitalization of research expenses is not permitted. Development expenditures are recognized as an asset if all the criteria for recognition are met, the research phase can be clearly distinguished from the development phase, and the expenditures can be attributed to distinct project phases. Currently, the criteria set out in International Accounting Standard (IAS) 38 “Intangible Assets” for recognizing develop-ment expenditures are not all met in regard to product and technology developments, due to a high level of interdepen-dence within these developments and the difficulty of assess-ing which products will eventually be marketable.
26 Administrative expenses
Administrative expenses amounted to 1,012 million euros (previous year: 852 million euros).
Administrative expenses include personnel and material costs relating to the Group management, Human Resources, Pur-chasing, Accounting and IT functions, as well as the costs of managing and administering the business units.
Notes to the consolidated statement of income
168 Henkel Annual Report 2015Notes to the consolidated financial statements

27 Other operating income
Other operating income 147
in million euros 2014 2015
Release of provisions 1 10 11
Gains on disposal of non-current assets 7 34
Insurance claim payouts 4 4
Write-ups of non-current assets – 1
Payments on derecognized receivables – 2
Impairment reversal on assets held for sale 25 –
Sundry operating income 63 75
Total 109 127
1 Including income from the release of provisions for pension obligations (curtailment gains) of 2 million euros in 2015 (2014: 2 million euros).
The increased income from non-current assets is primarily attributable to gains on disposal of assets held for sale. For details, please refer to Note 9 on page 141 referring to assets and liabilities held for sale. Sundry operating income relates to a number of individual items arising from ordinary operat-ing activities, such as grants and subsidies, tax refunds for indirect taxes, and similar income. The figure also includes income of 15 million euros pertaining to performance-related purchase price components in connection with the acquisi-tion of a non-controlling interest in OOO Henkel Bautechnik, which was completed in 2013.
28 Other operating charges
Other operating charges 148
in million euros 2014 2015
Losses on disposal of non-current assets – 6 – 8
Severance payments – – 1
Impairment on assets held for sale – –
Impairment on other assets – –
Sundry operating expenses – 159 – 96
Total – 165 – 105
Sundry operating expenses include a number of individual items arising from ordinary operating activities, such as fees, provisions for litigation and third party claims, incidental acquisition costs, sundry taxes, and similar expenses. The figure also includes an expense of 14 million euros relating to remediation obligations.
29 Financial result
Financial result 149
in million euros 2014 2015
Interest result – 9 – 17
Other financial result – 46 – 24
Investment result 6 – 1
Total – 49 – 42
Interest result 150
in million euros 2014 2015
Interest and similar income from third parties 1 39 28
Interest to third parties 1 – 48 – 45
Total – 9 – 17
1 Including interest income and interest expense, both in the amount of 26 million euros in 2015 (2014: 31 million euros), with respect to mutually offset deposits and liabilities to banks, reported on a net basis.
Other financial result 151
in million euros 2014 2015
Interest expense for pension obligations – 24 – 27
Interest income on plan assets – –
Interest income on reimbursement rights (IAS 19) 5 5
Other financial charges – 154 – 71
Other financial income 127 69
Total – 46 – 24
Other financial charges include –60 million euros (previous year: –118 million euros) from currency losses. Other financial income includes 63 million euros (previous year: 114 million euros) for currency gains. Please see page 159 of the financial instruments report for information on the net results of the valuation categories under International Financial Reporting Standard (IFRS) 7 and the reconciliation to financial result.
Investment resultThe investment result includes 2 million euros for expenses from the valuation of companies that are recognized using the equity method (2014: 0 million euros).
169Notes to the consolidated financial statementsHenkel Annual Report 2015
118 Consolidated statement of financial position
120 Consolidated statement of income
121 Consolidated statement of comprehensive income
121 Consolidated statement of changes in equity
122 Consolidated statement of cash flows
123 Group segment report by business unit
124 Key financials by region125 Accounting principles and
methods applied in preparation of the consolidated financial statements
133 Notes to the consolidated statement of financial position
168 Notes to the consolidated statement of income
173 Other disclosures
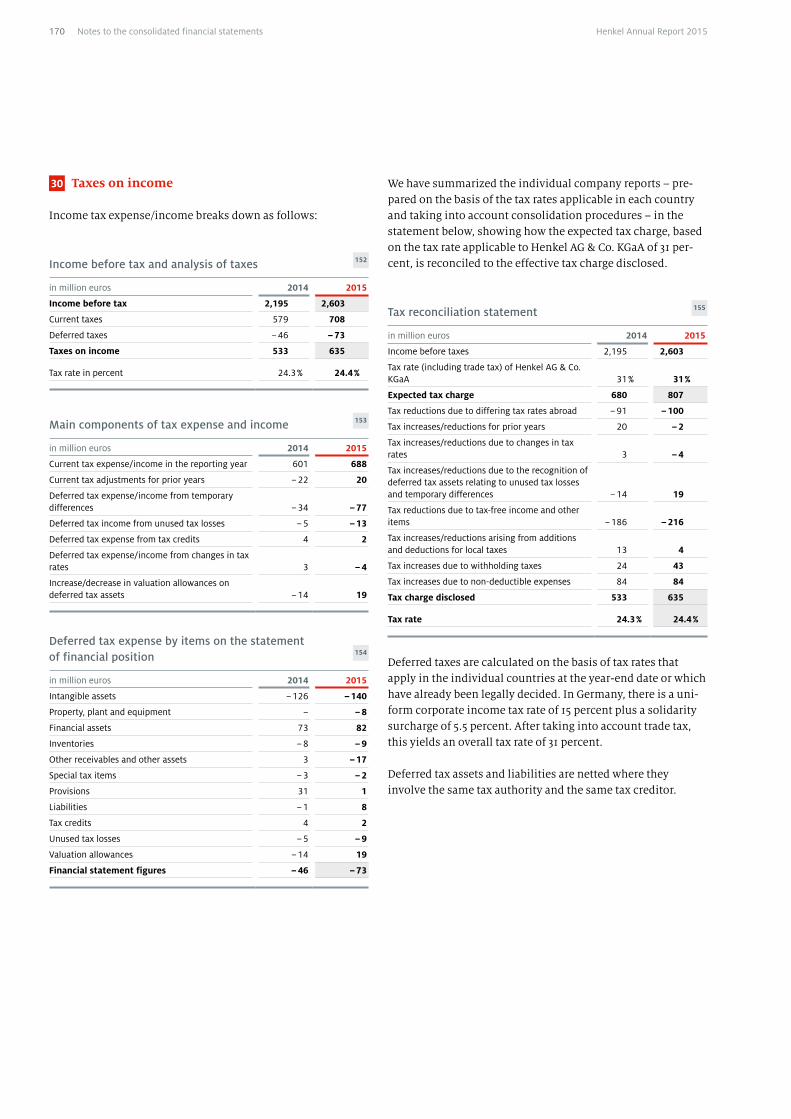
30 Taxes on income
Income tax expense/income breaks down as follows:
Income before tax and analysis of taxes 152
in million euros 2014 2015
Income before tax 2,195 2,603
Current taxes 579 708
Deferred taxes – 46 – 73
Taxes on income 533 635
Tax rate in percent 24.3 % 24.4 %
Main components of tax expense and income 153
in million euros 2014 2015
Current tax expense/income in the reporting year 601 688
Current tax adjustments for prior years – 22 20
Deferred tax expense/income from temporary differences – 34 – 77
Deferred tax income from unused tax losses – 5 – 13
Deferred tax expense from tax credits 4 2
Deferred tax expense/income from changes in tax rates 3 – 4
Increase/decrease in valuation allowances on deferred tax assets – 14 19
Deferred tax expense by items on the statement of financial position 154
in million euros 2014 2015
Intangible assets – 126 – 140
Property, plant and equipment – – 8
Financial assets 73 82
Inventories – 8 – 9
Other receivables and other assets 3 – 17
Special tax items – 3 – 2
Provisions 31 1
Liabilities – 1 8
Tax credits 4 2
Unused tax losses – 5 – 9
Valuation allowances – 14 19
Financial statement figures – 46 – 73
We have summarized the individual company reports – pre-pared on the basis of the tax rates applicable in each country and taking into account consolidation procedures – in the statement below, showing how the expected tax charge, based on the tax rate applicable to Henkel AG & Co. KGaA of 31 per-cent, is reconciled to the effective tax charge disclosed.
Tax reconciliation statement 155
in million euros 2014 2015
Income before taxes 2,195 2,603
Tax rate (including trade tax) of Henkel AG & Co. KGaA 31 % 31 %
Expected tax charge 680 807
Tax reductions due to differing tax rates abroad – 91 – 100
Tax increases/reductions for prior years 20 – 2
Tax increases/reductions due to changes in tax rates 3 – 4
Tax increases/reductions due to the recognition of deferred tax assets relating to unused tax losses and temporary differences – 14 19
Tax reductions due to tax-free income and other items – 186 – 216
Tax increases/reductions arising from additions and deductions for local taxes 13 4
Tax increases due to withholding taxes 24 43
Tax increases due to non-deductible expenses 84 84
Tax charge disclosed 533 635
Tax rate 24.3 % 24.4 %
Deferred taxes are calculated on the basis of tax rates that apply in the individual countries at the year-end date or which have already been legally decided. In Germany, there is a uni-form corporate income tax rate of 15 percent plus a solidarity surcharge of 5.5 percent. After taking into account trade tax, this yields an overall tax rate of 31 percent.
Deferred tax assets and liabilities are netted where they involve the same tax authority and the same tax creditor.
170 Henkel Annual Report 2015Notes to the consolidated financial statements

The deferred tax assets and liabilities stated on the reporting date relate to the following items of the consolidated state-ment of financial position, unused tax losses and tax credits:
Allocation of deferred taxes 156
in million euros
Deferred tax assets Deferred tax liabilities
December 31, 2014
December 31, 2015
December 31, 2014
December 31, 2015
Intangible assets 269 341 750 749
Property, plant and equipment 18 16 82 75
Financial assets 1 1 83 167
Inventories 43 50 5 1
Other receivables and other assets 32 39 46 37
Special tax items – – 37 35
Provisions 755 704 12 26
Liabilities 70 58 6 7
Tax credits 5 3 – –
Unused tax losses 60 60 – –
Amounts netted – 393 – 427 – 393 – 427
Valuation allowances – 22 – 29 – –
Financial statement figures 838 816 628 670
The deferred tax assets of 704 million euros (previous year: 755 million euros) relating to provisions in the financial state-ment result primarily from recognition and measurement differences with respect to pension obligations. The deferred tax liabilities of 749 million euros (previous year: 750 million
euros) relating to intangible assets are mainly attributable to business combinations such as the acquisition of the National Starch businesses in 2008 and of Spotless Group SAS in 2014.
An excess of deferred tax assets is only recognized insofar as it is likely that the company concerned will achieve sufficiently positive taxable profits in the future against which the deduc-tible temporary differences can be offset and tax loss carry-for-wards can be used. Deferred taxes have not been recognized with respect to unused tax losses of 146 million euros (previ-ous year: 126 million euros), as it is not sufficiently probable that taxable gains or benefits will be available against which they may be utilized. Of these tax losses carried forward, 62 mil-lion euros (previous year: 60 million euros) expire after more than three years. State taxes relating to our US subsidiaries account for 53 million euros (previous year: 48 million euros) of these unused tax losses (tax rate: around 2 percent). Of the tax losses carried forward, 76 million euros are non- expiring (previ-ous year: 64 million euros). Deferred tax liabilities of 42 million euros (previous year: 12 million euros) relating to the retained earnings of foreign subsidiaries have been recognized due to the fact that these earnings will be distributed in 2016.
We have summarized the expiry dates of unused tax losses and tax credits in the following table, which includes unused tax losses arising from losses on the disposal of assets of 10 million euros (previous year: 10 million euros) which may be carried forward without restriction. In addition to the unused tax losses listed in the table, an interest expense of 8 million euros (previous year: 16 million euros) is available which may be carried forward in full with no expiration.
Expiry dates of unused tax losses and tax credits 157
Unused tax losses Tax credits
in million eurosDecember
31, 2014December
31, 2015December
31, 2014December
31, 2015
Expire within
1 year 8 3 2 1
2 years 10 3 – –
3 years 13 6 1 –
more than 3 years 145 180 2 2
May be carried forward without restriction 109 103 – –
Total 285 295 5 3
171Notes to the consolidated financial statementsHenkel Annual Report 2015
118 Consolidated statement of financial position
120 Consolidated statement of income
121 Consolidated statement of comprehensive income
121 Consolidated statement of changes in equity
122 Consolidated statement of cash flows
123 Group segment report by business unit
124 Key financials by region125 Accounting principles and
methods applied in preparation of the consolidated financial statements
133 Notes to the consolidated statement of financial position
168 Notes to the consolidated statement of income
173 Other disclosures

In many countries, different tax rates apply to losses on the disposal of assets than to operating profits, and in some cases losses on the disposal of assets may only be offset against gains on the disposal of assets.
Of unused tax losses expiring beyond three years, 91 million euros (previous year: 91 million euros) relate to loss carry-forwards of US subsidiaries with respect to state taxes.
Equity-decreasing deferred taxes of 82 million euros were recognized (previous year: equity-increasing amount of 123 mil-lion euros). Within this figure, an expense of 88 million euros (previous year: income of 127 million euros) results from actu-arial gains and losses on pension obligations, while income of 4 million euros (previous year: expense of 4 million euros) results from gains and losses on cash flow hedges and income of 2 million euros (previous year: 0 million euros) from hedges of net investments.
31 Non-controlling interests
The amount shown here represents the proportion of net income and losses attributable to other shareholders of con-solidated affiliated companies.
Their share of net income was 49 million euros (previous year: 36 million euros) and that of losses was 2 million euros (previ-ous year: 2 million euros).
The non-controlling interests included in the Henkel Group at the end of fiscal 2015 had no material impact on our net assets, financial position and results of operations. The Group has no joint operations or unconsolidated structured entities.
172 Henkel Annual Report 2015Notes to the consolidated financial statements

Other disclosures
32 Reconciliation of adjusted net income
Adjusted net income 158
in million eurosDecember
31, 2014December
31, 2015
Adjusted EBIT 2,588 2,923
Financial result – 49 – 42
Taxes on income (adjusted) – 609 – 720
Adjusted net income 1,930 2,161
Attributable to non-controlling interests 34 49
Attributable to shareholders of Henkel AG & Co. KGaA 1,896 2,112
33 Payroll cost and employee structure
Payroll cost 1 159
in million euros 2014 2015
Wages and salaries 2,073 2,464
Social security contributions and staff welfare costs 372 404
Pension costs 153 179
Total 2,598 3,047
1 Excluding personnel-related restructuring charges of 104 million euros (previous year: 105 million euros).
Number of employees per function 1 160
2014 2015
Production and engineering 23,000 25,400
Marketing, selling and distribution 15,200 14,650
Research and development 2,650 2,800
Administration 6,950 7,000
Total 47,800 49,850
1 Annual average headcount: full-time employees, excluding apprentices and trainees, work experience students and interns; figures rounded.
34 Share-based payment plans
Global Cash Performance Units Plan (Global CPU Plan) 2004 – 2012Since the end of the Stock Incentive Plan in 2004, those eligi-ble for that plan, the senior executive personnel of the Henkel Group (excluding members of the Management Board), have been part of the Global CPU Plan, which enables them to par-ticipate in any increase in the price of the Henkel preferred share. Cash Performance Units (CPUs) are awarded on the basis of the level of achievement of certain defined targets. They grant the beneficiary the right to receive a cash payment at a fixed point in time. Until 2012, the CPUs were granted on con-dition that the member of the Plan was employed for three years by Henkel AG & Co. KGaA or one of its subsidiaries in a position senior enough to qualify to participate and that he or she was not under notice during that period. This minimum period of employment pertained to the calendar year in which the CPUs were granted and the two subsequent calendar years.
The number of CPUs granted depends not only on the hierarchy level of the officer but also on the achievement of set target figures. For the cycles up to 2012, these targets were operating profit (EBIT) and net income attributable to shareholders of Henkel AG & Co. KGaA. The value of a CPU in each case is the average price of the Henkel preferred share as quoted 20 stock exchange trading days after the Annual General Meeting following the performance period. An upper limit or cap is imposed in the event of extraordinary share price increases.
Global Long Term Incentive Plan (Global LTI Plan) 2013In fiscal 2013, the general terms and conditions of the Global CPU Plan 2004 were amended and replaced by the Global LTI Plan 2013, which is a share-based remuneration scheme with cash settlement. Since 2013, CPUs are granted on condition that the member of the Plan is employed for four years by Henkel AG & Co. KGaA or one of its subsidiaries in a position senior enough to qualify to participate and that he or she is not under notice during that period. This minimum period of employment pertains to the calendar year in which the CPUs are granted and the three subsequent calendar years. In addi-tion, an Outperformance Reward, which awards CPUs based on the achievement of target figures established in advance, may be set at the beginning of a four-year medium-term plan.
The total value of the cash remuneration payable to senior management personnel is recalculated on each reporting date and on the settlement date, based on the fair value of the CPUs, and recognized through an appropriate increase in provisions as a payroll cost that is spread over the period of service by the beneficiary. All changes to the measurement of this provision are reported under payroll cost.
173Notes to the consolidated financial statementsHenkel Annual Report 2015
118 Consolidated statement of financial position
120 Consolidated statement of income
121 Consolidated statement of comprehensive income
121 Consolidated statement of changes in equity
122 Consolidated statement of cash flows
123 Group segment report by business unit
124 Key financials by region125 Accounting principles and
methods applied in preparation of the consolidated financial statements
133 Notes to the consolidated statement of financial position
168 Notes to the consolidated statement of income
173 Other disclosures
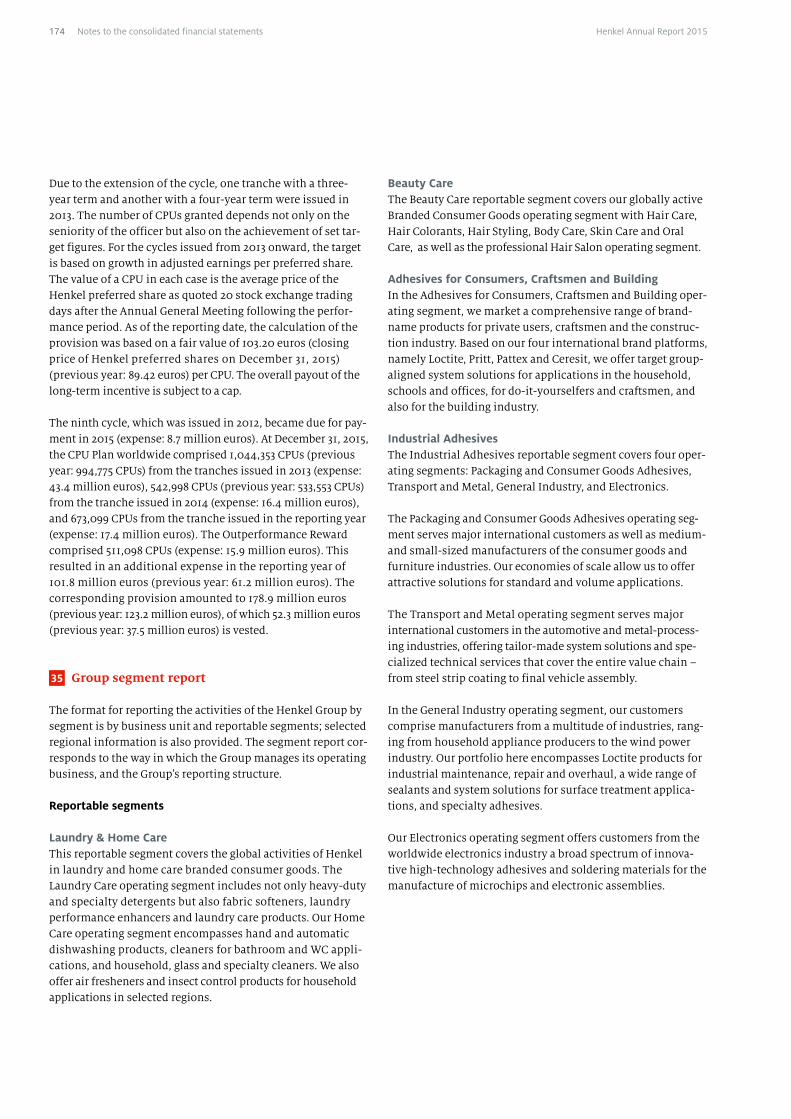
Due to the extension of the cycle, one tranche with a three-year term and another with a four-year term were issued in 2013. The number of CPUs granted depends not only on the seniority of the officer but also on the achievement of set tar-get figures. For the cycles issued from 2013 onward, the target is based on growth in adjusted earnings per preferred share. The value of a CPU in each case is the average price of the Henkel preferred share as quoted 20 stock exchange trading days after the Annual General Meeting following the perfor-mance period. As of the reporting date, the calculation of the provision was based on a fair value of 103.20 euros (closing price of Henkel preferred shares on December 31, 2015) (previous year: 89.42 euros) per CPU. The overall payout of the long-term incentive is subject to a cap.
The ninth cycle, which was issued in 2012, became due for pay-ment in 2015 (expense: 8.7 million euros). At December 31, 2015, the CPU Plan worldwide comprised 1,044,353 CPUs (previous year: 994,775 CPUs) from the tranches issued in 2013 (expense: 43.4 million euros), 542,998 CPUs (previous year: 533,553 CPUs) from the tranche issued in 2014 (expense: 16.4 million euros), and 673,099 CPUs from the tranche issued in the reporting year (expense: 17.4 million euros). The Out performance Reward comprised 511,098 CPUs (expense: 15.9 million euros). This resulted in an additional expense in the reporting year of 101.8 million euros (previous year: 61.2 million euros). The cor responding provision amounted to 178.9 million euros (previous year: 123.2 million euros), of which 52.3 million euros (previous year: 37.5 million euros) is vested.
35 Group segment report
The format for reporting the activities of the Henkel Group by segment is by business unit and reportable segments; selected regional information is also provided. The segment report cor-responds to the way in which the Group manages its operating business, and the Group’s reporting structure.
Reportable segments
Laundry & Home CareThis reportable segment covers the global activities of Henkel in laundry and home care branded consumer goods. The Laundry Care operating segment includes not only heavy-duty and specialty detergents but also fabric softeners, laundry performance enhancers and laundry care products. Our Home Care operating segment encompasses hand and automatic dishwashing products, cleaners for bathroom and WC appli-cations, and household, glass and specialty cleaners. We also offer air fresheners and insect control products for household applications in selected regions.
Beauty CareThe Beauty Care reportable segment covers our globally active Branded Consumer Goods operating segment with Hair Care, Hair Colorants, Hair Styling, Body Care, Skin Care and Oral Care, as well as the professional Hair Salon operating segment.
Adhesives for Consumers, Craftsmen and BuildingIn the Adhesives for Consumers, Craftsmen and Building oper-ating segment, we market a comprehensive range of brand-name products for private users, craftsmen and the construc-tion industry. Based on our four international brand platforms, namely Loctite, Pritt, Pattex and Ceresit, we offer target group-aligned system solutions for applications in the household, schools and offices, for do-it-yourselfers and craftsmen, and also for the building industry.
Industrial AdhesivesThe Industrial Adhesives reportable segment covers four oper-ating segments: Packaging and Consumer Goods Adhesives, Transport and Metal, General Industry, and Electronics.
The Packaging and Consumer Goods Adhesives operating seg-ment serves major international customers as well as medium- and small-sized manufacturers of the consumer goods and furniture industries. Our economies of scale allow us to offer attractive solutions for standard and volume app li cations.
The Transport and Metal operating segment serves major international customers in the automotive and metal-process-ing industries, offering tailor-made system solutions and spe-cialized technical services that cover the entire value chain – from steel strip coating to final vehicle assembly.
In the General Industry operating segment, our customers comprise manufacturers from a multitude of industries, rang-ing from household appliance producers to the wind power industry. Our portfolio here encompasses Loctite products for industrial maintenance, repair and overhaul, a wide range of sealants and system solutions for surface treatment applica-tions, and specialty adhesives.
Our Electronics operating segment offers customers from the worldwide electronics industry a broad spectrum of innova-tive high- technology adhesives and soldering materials for the manufacture of microchips and electronic assemblies.
174 Henkel Annual Report 2015Notes to the consolidated financial statements

Principles of Group segment reportingIn determining the segment results, assets and liabilities, we apply essentially the same principles of recognition and mea-surement as in the consolidated financial statements. We have valued net operating assets in foreign currencies at average exchange rates.
The Group measures the performance of its segments on the basis of a segment income variable referred to by Internal Control and Reporting as “adjusted EBIT.” For this purpose, operating profit (EBIT) is adjusted for one-time charges and gains and also restructuring charges.
Of the restructuring charges, 66 million euros is attributable to the business unit Laundry & Home Care (previous year: 74 mil-lion euros), 43 million euros is attributable to Beauty Care (pre-vious year: 64 million euros) and 77 million euros is attributable to Adhesive Technologies (previous year: 60 million euros).
For reconciliation with the figures for the Henkel Group, Group overheads are reported under Corporate together with income and expenses that cannot be allocated to the individ-ual business units.
Proceeds transferred between the segments only exist to a negligible extent and are therefore not separately disclosed.
Operating assets, provisions and liabilities are assigned to the segments in accordance with their usage or origin. Where usage or origin is attributable to several segments, allocation is effected on the basis of appropriate ratios and keys.
For regional and geographic analysis purposes, we allocate sales to countries on the basis of the country-of-origin prin-ciple, and non-current assets in accordance with the domicile of the international company to which they pertain.
Reconciliation between net operating assets / capital employed and financial statement figures 161
in million euros
Net operating assets Financial statement
figures
Net operating assets Financial statement
figures
Annual average 1
2014
December 31, 2014
December 31, 2014
Annual average 1
2015
December 31, 2015
December 31, 2015
Goodwill at book value 6,842 8,074 8,074 8,605 8,850 8,850
Other intangible assets and property, plant and equipment (total) 4,373 4,977 4,977 5,266 5,493 5,493
Deferred taxes – – 838 – – 816
Inventories 1,700 1,671 1,671 1,836 1,721 1,721
Trade accounts receivable from third parties 2,763 2,747 2,747 3,171 2,944 2,944
Intra-group accounts receivable 764 880 – 1,018 1,246 –
Other assets and tax refund claims 2 410 416 1,395 505 440 1,313
Cash and cash equivalents 1,228 1,176
Assets held for sale 31 10
Operating assets (gross) / Total assets 16,852 18,765 20,961 20,401 20,694 22,323
Operating liabilities 5,617 5,959 – 6,435 6,716 –
of which: Trade accounts payable to third parties 2,992 3,046 3,046 3,242 3,176 3,176
Intra-group accounts payable 764 880 – 1,018 1,246 –
Other provisions and other liabilities 2 (financial and non-financial) 1,861 2,033 2,292 2,175 2,294 2,437
Net operating assets 11,235 12,806 – 13,965 13,978 –
– Goodwill at book value 6,842 – – 8,605 – –
+ Goodwill at cost 3 7,397 – – 9,151 – –
Capital employed 11,790 – – 14,511 – –
1 The annual average is calculated on the basis of the 12 monthly figures.2 We only take amounts relating to operating activities into account in calculating net operating assets.3 Before deduction of accumulated impairment pursuant to IFRS 3.79 (b).
175Notes to the consolidated financial statementsHenkel Annual Report 2015
118 Consolidated statement of financial position
120 Consolidated statement of income
121 Consolidated statement of comprehensive income
121 Consolidated statement of changes in equity
122 Consolidated statement of cash flows
123 Group segment report by business unit
124 Key financials by region125 Accounting principles and
methods applied in preparation of the consolidated financial statements
133 Notes to the consolidated statement of financial position
168 Notes to the consolidated statement of income
173 Other disclosures

36 Earnings per share
Earnings per share 162
2014 2015
in million euros (rounded) Reported Adjusted Reported Adjusted
Net income attributable to shareholders of Henkel AG & Co. KGaA 1,628 1,896 1,921 2,112
Dividends, ordinary shares 335 335 377 377
Dividends, preferred shares 229 229 256 256
Total dividends 564 564 633 633
Retained earnings per ordinary share 636 797 771 885
Retained earnings per preferred share 428 535 517 594
Retained earnings 1,064 1,332 1,288 1,479
Number of ordinary shares 259,795,875 259,795,875 259,795,875 259,795,875
Dividend per ordinary share in euros 1.29 1.29 1.45 3 1.45 3
of which preliminary dividend per ordinary share in euros 1 0.02 0.02 0.02 0.02
Retained earnings per ordinary share in euros 2.45 3.07 2.97 3.41
EPS per ordinary share in euros 3.74 4.36 4.42 4.86
Number of outstanding preferred shares 2 174,482,310 174,482,310 174,482,312 174,482,312
Dividend per preferred share in euros 1.31 1.31 1.47 3 1.47 3
of which preferred dividend per preferred share in euros 1 0.04 0.04 0.04 0.04
Retained earnings per preferred share in euros 2.45 3.07 2.97 3.41
EPS per preferred share in euros 3.76 4.38 4.44 4.88
Number of ordinary shares 259,795,875 259,795,875 259,795,875 259,795,875
Dividend per ordinary share in euros 1.29 1.29 1.45 3 1.45 3
of which preliminary dividend per ordinary share in euros 1 0.02 0.02 0.02 0.02
Retained earnings per ordinary share in euros (after dilution) 2.45 3.07 2.97 3.41
Diluted EPS per ordinary share in euros 3.74 4.36 4.42 4.86
Number of potential outstanding preferred shares 2 174,482,310 174,482,310 174,482,312 174,482,312
Dividend per preferred share in euros 1.31 1.31 1.47 3 1.47 3
of which preferred dividend per preferred share in euros 1 0.04 0.04 0.04 0.04
Retained earnings per preferred share in euros (after dilution) 2.45 3.07 2.97 3.41
Diluted EPS per preferred share in euros 3.76 4.38 4.44 4.88
1 See combined management report, Corporate governance, Capital stock denominations / Shareholder rights / Amendments to the Articles of Association on pages 32 and 33.
2 Weighted annual average of preferred shares.3 Proposal to shareholders for the Annual General Meeting on April 11, 2016.
176 Henkel Annual Report 2015Notes to the consolidated financial statements

37 Consolidated statement of cash flows
We prepare the consolidated statement of cash flows in accor-dance with International Accounting Standard (IAS) 7 “State-ment of Cash Flows.” It describes the flow of cash and cash equivalents by origin and usage of liquid funds, distinguishing between changes in funds arising from operating activities, investing activities, and financing activities. Financial funds include cash on hand, checks and credit at banks, and other financial assets with a remaining term of not more than three months. Securities are therefore included in financial funds, provided that they are available at short term and are only exposed to an insignificant price change risk. The computa-tion is adjusted for effects arising from currency translation. In some countries, there are administrative hurdles to the transfer of money to the parent company.
Cash flows from operating activities are determined by ini-tially adjusting operating profit by non-cash variables such as amortization / depreciation / impairment / write-ups on intan-gible assets and property, plant and equipment – supple-mented by changes in provisions, changes in other assets and liabilities, and also changes in net working capital. We disclose payments made for income taxes under operating cash flow.
Cash flows from investing activities occur essentially as a result of outflows of funds for investments in intangible assets and property, plant and equipment, subsidiaries and other business units, as well as investments accounted for using the equity method and joint ventures. We also recognize inflows of funds from the sale of intangible assets and property, plant and equipment, subsidiaries and other business units here. In the reporting period, cash flows from investing activities mainly involved outflows for the acquisition of subsidiaries and other business units in the amount of –322 million euros (previous year: –1,719 million euros), as well as outflows for investments in intangible assets, and property, plant and equipment in the amount of –625 million euros (previous year: –531 million euros). Outflows for the acquisition of sub-sidiaries and other business units relate to the acquisitions as described in the section “Acquisitions and divestments” on pages 126 and 127.
In cash flow from financing activities, we recognize interest and dividends paid and received, the change in borrowings and in pension provisions, and also payments made for the acquisition of non-controlling interests and other financing transactions. The change in borrowings in the reporting year was influenced by the repayment of our hybrid bond on November 25, 2015 and by inflows from issuing commer-cial paper.
The free cash flow shows how much cash is actually available for acquisitions and dividends, reducing debt and/or contri-butions to pension funds.
38 Contingent liabilities
Analysis 163
in million eurosDecember
31, 2014December
31, 2015
Liabilities under guarantee and warranty agreements
4
12
39 Other unrecognized financial commitments
Operating leases as defined in IAS 17 comprise all forms of rights of use of assets, including rights of use arising from rent and leasehold agreements. Payment commitments under oper-ating lease agreements are shown at the total amounts payable up to the earliest date of termination. The amounts shown are the nominal values. At December 31, 2015, they were due for payment as follows:
Operating lease commitments 164
in million eurosDecember
31, 2014December
31, 2015
Due in the following year 67 72
Due within 1 to 5 years 135 139
Due after 5 years 24 17
Total 226 228
Within the Group, we primarily lease office space and equip-ment, automobiles, and IT equipment. Some of these con-tracts contain extension options and price adjustment clauses. In the course of the 2015 fiscal year, 66 million euros became due for payment under operating leases (previous year: 64 mil-lion euros).
As of the end of 2015, commitments arising from orders for property, plant and equipment amounted to 65 million euros (previous year: 67 million euros).
As of the reporting date, payment commitments under the terms of agreements for capital increases and share purchases contracted prior to December 31, 2015 amounted to 0 million euros (previous year: 0 million euros).
177Notes to the consolidated financial statementsHenkel Annual Report 2015
118 Consolidated statement of financial position
120 Consolidated statement of income
121 Consolidated statement of comprehensive income
121 Consolidated statement of changes in equity
122 Consolidated statement of cash flows
123 Group segment report by business unit
124 Key financials by region125 Accounting principles and
methods applied in preparation of the consolidated financial statements
133 Notes to the consolidated statement of financial position
168 Notes to the consolidated statement of income
173 Other disclosures

40 Voting rights / Related party disclosures
Related parties as defined by IAS 24 “Related Party Disclosures” are legal entities or natural persons who may be able to exert influence on Henkel AG & Co. KGaA and its subsidiaries, or be subject to control or material influence by Henkel AG & Co. KGaA or its subsidiaries. These include, in particular, the members of the Henkel family share-pooling agreement as a whole, the non-consolidated entities in which Henkel holds a participating interest, associated entities and also the mem-bers of the corporate management bodies of Henkel AG & Co. KGaA whose compensation is indicated in the remuneration report section of the combined management report on pages 41 to 51. Henkel Trust e.V. and Metzler Trust e.V. also fall into the category of related parties as defined in IAS 24.
Information required by Section 160 (1) no. 8 of the German Stock Corporation Act [AktG]:
Henkel AG & Co. KGaA, Düsseldorf, has been notified that on December 17, 2015 the proportion of voting rights held by the members of the Henkel family share-pooling agreement repre-sented in total a share of 61.02 percent of the voting rights (158,535,741 votes) in Henkel AG & Co. KGaA (International Secu-rities Identification Number [ISIN]: DE0006048408), held by• 131 members of the families of the descendents of Fritz
Henkel, the company’s founder,• four foundations set up by members of those families,• three trusts set up by members of those families,• two private limited companies (GmbH) set up by members
of those families, 13 limited partnerships with a lim ited company as general partner (GmbH & Co. KG), and one limited partnership (KG),
under the terms of a share-pooling agreement per Section 22 (2) of the German Securities Trading Act [WpHG], whereby the shares held by the two private limited companies, by the 13 limited partnerships with a limited company as general partner, and by the one limited partnership, representing a percentage of 16.97 percent of the voting rights (44,081,965 votes), are attributed (per Section 22 (1) no. 1 WpHG) to the family members who control those companies.
No party to the share-pooling agreement is obliged to notify that it has reached or exceeded 3 percent or more of the total voting rights in Henkel AG & Co. KGaA, even after adding voting rights expressly granted under the terms of usufruct agreements.
Dr. Simone Bagel-Trah, Germany, is the authorized representa-tive of the parties to the Henkel family share-pooling agreement. (Latest notification November 5, 2014.)
Financial receivables from and payables to other investments in the form of non-consolidated affiliated entities and associ-ated entities are disclosed in Notes 3 and 18.
Henkel Trust e.V. and Metzler Trust e.V., as parties to relevant contractual trust arrangements (CTA), hold the assets required to cover the pension obligations in Germany. The claim on Henkel Trust e.V. for reimbursement of pension payments made is shown under other financial assets (Note 3 on page 139). The receivable does not bear interest.
41 Exercise of exemption options
The following German companies included in the consoli-dated financial statements of Henkel AG & Co. KGaA exercised exemption options in fiscal 2015:• Schwarzkopf Henkel Production Europe GmbH & Co. KG,
Düsseldorf (Section 264b German Commercial Code [HGB])• Henkel Loctite-KID GmbH, Hagen (Section 264 (3) HGB)• Henkel IP Management and IC Services GmbH, Monheim
(Section 264 (3) HGB)• The Bergquist Company GmbH, Halstenbek
(Section 264 (3) HGB)
The Dutch company Henkel Nederland B.V., Nieuwegein, exercised the exemption option afforded in Article 2:403 of the Civil Code of the Netherlands.
178 Henkel Annual Report 2015Notes to the consolidated financial statements

42 Remuneration of the corporate management bodies
The total remuneration of the members of the Supervisory Board and of the Shareholders’ Committee of Henkel AG & Co. KGaA amounted to 1,546,000 euros plus value-added tax (pre-vious year: 1,562,000 euros) and 2,350,000 euros (previous year: 2,350,000 euros), respectively. The total remuneration (Section 285 no. 9a and Section 314 (1) no. 6a HGB) of the Management Board and members of the Management Board of Henkel Management AG amounted to 25,804,019 euros (previous year: 27,404,426 euros).
For pension obligations to former members of the Manage-ment Board and the management of Henkel KGaA, as well as the former management of its legal predecessor and surviving dependents, 98,729,434 euros (previous year: 108,218,489 euros) is deferred. The total remuneration for this group of persons (Section 285 no. 9b and Section 314 (1) no. 6b HGB) in the reporting year amounted to 7,163,382 euros (previous year: 7,138,469 euros). For further details regarding the compensa-tion of the corporate management bodies, please refer to the audited remuneration report on pages 41 to 51.
43 Declaration of compliance with the Corporate Governance Code [DCGK]
In March 2015, the Management Board of Henkel Management AG and the Supervisory Board and Shareholders’ Committee of Henkel AG & Co. KGaA approved a joint declaration of com-pliance with the recommendations of the German Corporate Governance Code [DCGK] in accordance with Section 161 of the German Stock Corporation Act [AktG]. The declaration has been made permanently available to shareholders on the company website: www.henkel.com/ir
44 Subsidiaries and other investments
Details relating to the investments held by Henkel AG & Co. KGaA and the Henkel Group, which are part of these financial statements, are provided in a separate schedule appended to these notes to the consolidated financial statements but not included in the printed form of the Annual Report. Said schedule is included in the accounting record submitted for publication in the electronic Federal Gazette and can be viewed there and at the Annual General Meeting. The schedule is also included in the online version of the Annual Report on our website: www.henkel.com/reports
45 Auditor’s fees and services
The total fees charged to the Group for services provided by the auditor KPMG AG Wirtschaftsprüfungsgesellschaft and other companies of the worldwide KPMG network in fiscal 2014 and 2015 were as follows:
Type of fee 165
in million euros 2014of which Germany 2015
of which Germany
Audits 7.5 1.9 8.4 1.8
Other audit-related services 2.0 0.7 1.7 0.6
Tax advisory services 0.9 0.1 0.8 0.1
Other services 0.8 0.8 1.1 1.0
Total 11.2 3.5 12.0 3.5
The item “Audits” includes fees and disbursements with respect to the audit of the Group accounts and the legally pre-scribed financial statements of Henkel AG & Co. KGaA and its affiliat ed companies. The fees for “Other audit-related services” relate primarily to the quarterly reviews. The item “Tax advisory services” includes fees for advice and support on tax issues and the performance of tax compliance services on behalf of affiliated companies outside Germany. “Other services” comprise fees predominantly for project-related consultancy services.
Düsseldorf, January 29, 2016
Henkel Management AG, Personally Liable Partner of Henkel AG & Co. KGaA
Management BoardKasper Rorsted, Jan-Dirk Auris, Carsten Knobel, Kathrin Menges, Bruno Piacenza, Hans Van Bylen
179Notes to the consolidated financial statementsHenkel Annual Report 2015
118 Consolidated statement of financial position
120 Consolidated statement of income
121 Consolidated statement of comprehensive income
121 Consolidated statement of changes in equity
122 Consolidated statement of cash flows
123 Group segment report by business unit
124 Key financials by region125 Accounting principles and
methods applied in preparation of the consolidated financial statements
133 Notes to the consolidated statement of financial position
168 Notes to the consolidated statement of income
173 Other disclosures

Independent Auditor’s Report
To Henkel AG & Co. KGaA, Düsseldorf
Report on the Consolidated Financial Statements
We have audited the accompanying consolidated financial statements of Henkel AG & Co. KGaA, Düsseldorf, and its subsid-iaries, which comprise the consolidated statement of financial position, the consolidated statement of income, the consoli-dated statement of comprehensive income, the consolidated statement of changes in equity, the consolidated statement of cash flows, and notes to the consolidated financial statements for the business year from January 1 to December 31, 2015.
Responsibility of the Personally Liable Partner of the Company for the Consolidated Financial StatementsThe personally liable partner of Henkel AG & Co. KGaA is responsible for the preparation of these consolidated financial statements. This responsibility includes preparing these con-solidated financial statements in accordance with Interna-tional Financial Reporting Standards as adopted by the EU, and the supplementary requirements of German law pursuant to § [Article] 315a Abs. [paragraph] 1 HGB [Handelsgesetzbuch: German Commercial Code], to give a true and fair view of the net assets, financial position and results of operations of the Group in accordance with these requirements. The personally liable partner of the company is also responsible for the inter-nal controls that management determines are necessary to enable the preparation of consolidated financial statements that are free from material misstatement, whether due to fraud or error.
Auditor’s ResponsibilityOur responsibility is to express an opinion on these consoli-dated financial statements based on our audit. We conducted our audit in accordance with § 317 HGB and German generally accepted standards for the audit of financial statements pro-mulgated by the Institut der Wirtschaftsprüfer [Institute of Public Auditors in Germany] (IDW) as well as in supplemen-tary compliance with International Standards on Auditing (ISA). Accordingly, we are required to comply with ethical requirements and plan and perform the audit to obtain rea-sonable assurance about whether the consolidated financial statements are free from material misstatement.
An audit involves performing audit procedures to obtain audit evidence about the amounts and disclosures in the consoli-dated financial statements. The selection of audit procedures depends on the auditor’s professional judgment. This includes
the assessment of the risks of material misstatement of the consolidated financial statements, whether due to fraud or error. In assessing those risks, the auditor considers the inter-nal control system relevant to the entity’s preparation of the consolidated financial statements that give a true and fair view. The aim of this is to plan and perform audit procedures that are appropriate in the given circumstances, but not for the purpose of expressing an opinion on the effectiveness of the Group’s internal control system. An audit also includes evalu-ating the appropriateness of accounting policies used and the reasonableness of accounting estimates made by the compa-ny’s personally liable partner, as well as evaluating the overall presentation of the consolidated financial statements.
We believe that the audit evidence we have obtained is suffi-cient and appropriate to provide a basis for our audit opinion.
Audit OpinionPursuant to § 322 Abs. 3 Satz 1 HGB, we state that our audit of the consolidated financial statements has not led to any reservations.
In our opinion, based on the findings of our audit, the consoli-dated financial statements comply in all material respects with IFRSs as adopted by the EU and the supplementary require-ments of German commercial law pursuant to § 315a Abs. 1 HGB and give a true and fair view of the net assets and financial position of the Henkel Group as at December 31, 2015, as well as the results of operations for the business year then ended, in accordance with these requirements.
Report on the Combined Management ReportWe have audited the accompanying Group management report of Henkel AG & Co. KGaA, which is combined with the manage-ment report of the company, for the business year from January 1 to December 31, 2015. The personally liable partner of Henkel AG & Co. KGaA is responsible for the preparation of the combined management report in compliance with the applicable requirements of German commercial law pursuant to § [Article] 315a Abs. [paragraph] 1 HGB [Handelsgesetzbuch: German Commercial Code]. We conducted our audit in accor-dance with § 317 Abs. 2 HGB and German generally accepted standards for the audit of combined management reports pro-mulgated by the Institut der Wirtschaftsprüfer [Institute of Pub-lic Auditors in Germany] (IDW). Accordingly, we are required to plan and perform the audit of the combined management report to obtain reasonable assurance about whether the com-bined management report is consistent with the consolidated financial statements and the audit findings, and as a whole
180 Henkel Annual Report 2015Consolidated financial statements

provides a suitable view of the Group’s position and suitably presents the opportunities and risks of future development.
Pursuant to § 322 Abs. 3 Satz 1 HGB, we state that our audit of the combined management report has not led to any reserva-tions.
In our opinion, based on the findings of our audit of the con-solidated financial statements and combined management report, the combined management report is consistent with the consolidated financial statements, and as a whole provides a suitable view of the Group’s position and suitably presents the opportunities and risks of future development.
Düsseldorf, January 29, 2016
KPMG AG Wirtschaftsprüfungsgesellschaft
Prof. Dr. Kai C. Andrejewski Simone FischerWirtschaftsprüfer Wirtschaftsprüferin (German Public Auditor) (German Public Auditor)
181Henkel Annual Report 2015
118 Consolidated statement of financial position
120 Consolidated statement of income
121 Consolidated statement of comprehensive income
121 Consolidated statement of changes in equity
122 Consolidated statement of cash flows
123 Group segment report by business unit
124 Key financials by region125 Accounting principles and
methods applied in preparation of the consolidated financial statements
133 Notes to the consolidated statement of financial position
168 Notes to the consolidated statement of income
173 Other disclosures

Recommendation for the approval of the annual financial statements and the appropriation of the profit of Henkel AG & Co. KGaA
It is proposed that the annual financial statements of Henkel AG & Co. KGaA be approved as presented and that the unappropriated profit of 766,311,011.08 euros for fiscal 2015 be applied as follows:a) Payment of a dividend of 1.45 euros per ordinary share (259,795,875 shares) = 376,704,018.75 euros
b) Payment of a dividend of 1.47 euros per preferred share (178,162,875 shares) = 261,899,426.25 euros
c) Carried forward as retained earnings = 127,707,566.08 euros
766,311,011.08 euros
According to Section 71b German Stock Corporation Act [AktG], treasury shares do not qualify for a dividend. The amount in unappropriated profit which relates to the shares held by the corporation (treasury shares) at the date of the Annual General Meeting will be carried forward as retained earnings. As the number of such treasury shares can change up to the time of the Annual General Meeting, a correspondingly adapted proposal for the appropriation of profit will be submitted to it, providing for an unchanged payout of 1.45 euros per ordinary share qualifying for a dividend and 1.47 euros per preferred share qualifying for a dividend, with corresponding adjustment of the other retained earnings and retained earnings carried forward to the following year.
Düsseldorf, January 29, 2016
Henkel Management AG, Personally Liable Partner of Henkel AG & Co. KGaA
Management Board
182 Henkel Annual Report 2015

Responsibility statement by the Personally Liable Partner
To the best of our knowledge, and in accordance with the applicable accounting princi-ples, the consolidated financial statements give a true and fair view of the net assets, financial position and results of operations of the Group, and the management report of the Group, which is combined with the management report of Henkel Management AG & Co. KGaA, includes a fair review of the development, performance and results of the business and the position of the Group, together with a cogent description of the princi-pal opportunities and risks associated with the expected development of the Group.
Düsseldorf, January 29, 2016
Henkel Management AG
Management BoardKasper Rorsted, Jan-Dirk Auris, Carsten Knobel, Kathrin Menges, Bruno Piacenza, Hans Van Bylen
183Henkel Annual Report 2015
118 Consolidated statement of financial position
120 Consolidated statement of income
121 Consolidated statement of comprehensive income
121 Consolidated statement of changes in equity
122 Consolidated statement of cash flows
123 Group segment report by business unit
124 Key financials by region125 Accounting principles and
methods applied in preparation of the consolidated financial statements
133 Notes to the consolidated statement of financial position
168 Notes to the consolidated statement of income
173 Other disclosures

184 Henkel Annual Report 2015Notes to the consolidated financial statements
Dr. rer. nat. Simone Bagel-Trah Chair, Private Investor, Düsseldorf
Born in 1969 Member since: April 14, 2008
Memberships: Henkel Management AG (Chair) 1 Henkel AG & Co. KGaA (Shareholders’ Committee, Chair) 2 Bayer AG 1 Heraeus Holding GmbH 1
Winfried Zander * Vice Chair, Chairman of the General Works Council of Henkel AG & Co. KGaA and Chairman of the Works Council of Henkel AG & Co. KGaA, Düsseldorf site
Born in 1954 Member since: May 17, 1993
Jutta Bernicke * Member of the Works Council of Henkel AG & Co. KGaA, Düsseldorf site
Born in 1962 Member since: April 14, 2008
Dr. rer. nat. Kaspar von Braun Astrophysicist, Pasadena
Born in 1971 Member since: April 19, 2010
Supervisory Board of Henkel AG & Co. KGaA
Boris Canessa Private Investor, Düsseldorf
Born in 1963 Member since: April 16, 2012
Ferdinand Groos Managing Partner, Cryder Capital Partners LLP, London
Born in 1965 Member since: April 16, 2012
Béatrice Guillaume-Grabisch Chairwoman of the Executive Board, Nestlé Deutschland AG, Frankfurt am Main
Born in 1964 Member since: April 16, 2012
Peter Hausmann * Member of the Executive Board of IG Bergbau, Chemie, Energie and responsible for Wages / Finance, Hannover
Born in 1954 Member since: April 15, 2013
Memberships: Continental AG 1 Vivawest Wohnen GmbH (Vice Chair) 1 50 Hertz Transmission AG (Vice Chair) 1
Birgit Helten-Kindlein * Member of the Works Council of Henkel AG & Co. KGaA, Düsseldorf site
Born in 1964 Member since: April 14, 2008
Prof. Dr. sc. nat. Michael Kaschke Chairman of the Executive Board, Carl Zeiss AG, Oberkochen
Born in 1957 Member since: April 14, 2008
Memberships: Deutsche Telekom AG 1 Carl Zeiss Group: Carl Zeiss Industrielle Messtechnik GmbH (Chair) 1 Carl Zeiss Meditec AG (Chair) 1 Carl Zeiss Microscopy GmbH (Chair) 1 Carl Zeiss SMT GmbH (Chair) 1 Carl Zeiss Australia Pty. Ltd. (Chair), Australia 2 Carl Zeiss Far East Co. Ltd. (Chair), China / Hong Kong 2 Carl Zeiss India (Bangalore) Private Ltd., India 2 Carl Zeiss Pte. Ltd. (Chair), Singapore 2 Carl Zeiss (Pty.) Ltd., South Africa 2
Barbara Kux Private Investor, Zurich
Born in 1954 Member since: July 3, 2013
Memberships: Engie S.A., France 2 Firmenich S.A., Switzerland 2 Pargesa Holding S.A., Switzerland 2 Total S.A., France 2 Umicore N.V., Belgium 2
Corporate management bodies of Henkel AG & Co. KGaA
Boards / memberships as defined by Section 125 (1) sentence 5 of the German Stock Corporation Act [AktG] as at January 2016
Honorary Chairman of the Henkel Group: Dipl.-Ing. Albrecht Woeste
* Employee representatives.1 Membership of statutory supervisory and administrative boards in Germany.2 Membership of comparable oversight bodies.

185Notes to the consolidated financial statementsHenkel Annual Report 2015
118 Consolidated statement of financial position
120 Consolidated statement of income
121 Consolidated statement of comprehensive income
121 Consolidated statement of changes in equity
122 Consolidated statement of cash flows
123 Group segment report by business unit
124 Key financials by region125 Accounting principles and
methods applied in preparation of the consolidated financial statements
133 Notes to the consolidated statement of financial position
168 Notes to the consolidated statement of income
173 Other disclosures
Nominations Committee
Functions The Nominations Committee prepares the resolutions of the Supervisory Board on election proposals to be presented to the Annual General Meeting for the election of members of the Supervisory Board (representatives of the share holders).
Members Dr. Simone Bagel-Trah, Chair Dr. Kaspar von Braun Prof. Dr. Theo Siegert
Supervisory Board committees
Mayc Nienhaus * Member of the General Works Council of Henkel AG & Co. KGaA and Chairman of the Works Council of Henkel AG & Co. KGaA, Unna site
Born in 1961 Member since: January 1, 2010
Andrea Pichottka * Managing Director, IG BCE Bonusagentur GmbH, Hannover Managing Director, IG BCE Bonusassekuranz GmbH, Hannover
Born in 1959 Member since: October 26, 2004
Dr. rer. nat. Martina Seiler * Chemist, Duisburg Chairwoman of the General Senior Staff Representative Committee and of the Senior Staff Representative Committee of Henkel AG & Co. KGaA
Born in 1971 Member since: January 1, 2012
Prof. Dr. oec. publ. Theo Siegert Managing Partner of de Haen-Carstanjen & Söhne, Düsseldorf
Born in 1947 Member since: April 20, 2009
Memberships: E.ON AG 1 Merck KGaA 1 DKSH Holding Ltd., Switzerland 2 E. Merck OHG 2
Edgar Topsch * Member of the General Works Council of Henkel AG & Co. KGaA and Vice Chairman of the Works Council of Henkel AG & Co. KGaA, Düsseldorf site
Born in 1960 Member since: August 1, 2010
Audit Committee
Functions The Audit Committee prepares the proceedings and resolutions of the Supervi-sory Board relating to the approval of the annual financial statements and the consolidated financial statements, and relating to ratification of the proposal to be put before the Annual General Meeting regarding appointment of the audi-tor. It also deals with accounting, risk management and compliance issues.
Members Prof. Dr. Theo Siegert, Chair Prof. Dr. Michael Kaschke, Vice Chair Dr. Simone Bagel-Trah Peter Hausmann Birgit Helten-Kindlein Winfried Zander
186 Henkel Annual Report 2015Notes to the consolidated financial statements
Dr. rer. nat. Simone Bagel-Trah Chair, Private Investor, Düsseldorf
Born in 1969 Member since: April 18, 2005
Memberships: Henkel AG & Co. KGaA (Chair) 1 Henkel Management AG (Chair) 1 Bayer AG 1 Heraeus Holding GmbH 1
Dr. rer. pol. h.c. Christoph Henkel Vice Chair, Founding Partner, Canyon Equity LLC, London
Born in 1958 Member since: May 27, 1991
Prof. Dr. oec. HSG Paul Achleitner Chairman of the Supervisory Board, Deutsche Bank AG, Munich
Born in 1956 Member since: April 30, 2001
Memberships: Bayer AG 1 Daimler AG 1 Deutsche Bank AG (Chair) 1
Finance Subcommittee
Functions The Finance Subcommittee deals principally with financial matters, accounting issues including the statutory year-end audit, taxation and accounting policy, internal auditing, and risk management in the company.
Members Dr. Christoph Henkel, Chair Stefan Hamelmann, Vice Chair Prof. Dr. Paul Achleitner Prof. Dr. Ulrich Lehner Dr. Dr. Norbert Reithofer
Shareholders’ Committee of Henkel AG & Co. KGaA
Subcommittees of the Shareholders’ Committee
Johann-Christoph Frey Private Investor, Klosters
Born in 1955 Member since: April 16, 2012
Stefan Hamelmann Private Investor, Düsseldorf
Born in 1963 Member since: May 3, 1999
Prof. Dr. rer. pol. Ulrich Lehner Former Chairman of the Management Board of Henkel KGaA, Düsseldorf
Born in 1946 Member since: April 14, 2008
Memberships: Deutsche Telekom AG (Chair) 1 E.ON SE 1 Porsche Automobil Holding SE 1 ThyssenKrupp AG (Chair) 1
Dr.-Ing. Dr.-Ing. E.h. Norbert Reithofer Chairman of the Supervisory Board of Bayerische Motoren Werke Aktiengesellschaft, Munich
Born in 1956 Member since: April 11, 2011
Memberships: Bayerische Motoren Werke Aktiengesellschaft (Chair) 1 Siemens AG 1
Konstantin von Unger Partner, Quarton International AG, London
Born in 1966 Member since: April 14, 2003
Memberships: Henkel Management AG 1 Ten Lifestyle Management Ltd., Great Britain 2
Jean-François van Boxmeer Chairman of the Executive Board of Heineken N.V., Amsterdam
Born in 1961 Member since: April 15, 2013
Membership: Mondelez International Inc., USA 2
Werner Wenning Chairman of the Supervisory Board of Bayer AG, Leverkusen
Born in 1946 Member since: April 14, 2008
Memberships: Bayer AG (Chair) 1 E.ON SE (Chair) 1 Henkel Management AG 1 Siemens AG 1
Human Resources Subcommittee
Functions The Human Resources Subcommittee deals principally with personnel matters relating to members of the Management Board, issues pertaining to human resources strategy, and with remuneration.
Members Dr. Simone Bagel-Trah, Chair Konstantin von Unger, Vice Chair Johann-Cristoph Frey Jean-François van Boxmeer Werner Wenning
1 Membership of statutory supervisory and administrative boards in Germany.2 Membership of comparable oversight bodies.
187Notes to the consolidated financial statementsHenkel Annual Report 2015
118 Consolidated statement of financial position
120 Consolidated statement of income
121 Consolidated statement of comprehensive income
121 Consolidated statement of changes in equity
122 Consolidated statement of cash flows
123 Group segment report by business unit
124 Key financials by region125 Accounting principles and
methods applied in preparation of the consolidated financial statements
133 Notes to the consolidated statement of financial position
168 Notes to the consolidated statement of income
173 Other disclosures
Kasper Rorsted Chairman of the Management Board
Born in 1962 Member since: April 1, 2005 3
Memberships: Anheuser-Busch InBev SA, Belgium 2 Bertelsmann Management SE 1 Danfoss A/S, Denmark 2
Jan-Dirk Auris Adhesive Technologies
Born in 1968 Member since: January 1, 2011
Membership: Henkel Corporation (Chair), USA 2
Carsten Knobel Finance / Purchasing / Integrated Business Solutions
Born in 1969 Member since: July 1, 2012
Memberships: Henkel (China) Investment Co. Ltd., China 2 Henkel & Cie AG, Switzerland 2 Henkel Central Eastern Europe GmbH (Chair), Austria 2 Henkel Consumer Goods Inc. (Chair), USA 2 Henkel Ltd., Great Britain 2 Henkel of America Inc. (Chair), USA 2
Kathrin Menges Human Resources / Infrastructure Services
Born in 1964 Member since: October 1, 2011
Memberships: Adidas AG 1 Henkel Central Eastern Europe GmbH, Austria 2 Henkel Nederland BV, Netherlands 2 Henkel Norden AB, Sweden 2 Henkel Norden Oy, Finland 2
Bruno Piacenza Laundry & Home Care
Born in 1965 Member since: January 1, 2011
Hans Van Bylen Beauty Care
Born in 1961 Member since: July 1, 2005 3
Memberships: GfK SE, Nuremberg 1 The Dial Corporation (Chair), USA 2
Management Board of Henkel Management AG *
Dr. rer. nat. Simone Bagel-Trah Chair, Private Investor, Düsseldorf
Born in 1969 Member since: February 15, 2008
Memberships: Henkel AG & Co. KGaA (Chair) 1 Henkel AG & Co. KGaA (Shareholders’ Committee, Chair) 2 Bayer AG 1 Heraeus Holding GmbH 1
* Personally Liable Partner of Henkel AG & Co. KGaA.1 Membership of statutory supervisory and administrative boards in Germany.2 Membership of comparable oversight bodies.3 Including membership of the Management Board of Henkel KGaA.
Konstantin von Unger Vice Chair Partner, Quarton International AG, London
Born in 1966 Member since: April 17, 2012
Memberships: Henkel AG & Co. KGaA (Shareholders’ Committee) 2 Ten Lifestyle Management Ltd., Great Britain 2
Werner Wenning Chairman of the Supervisory Board of Bayer AG, Leverkusen
Born in 1946 Member since: September 16, 2013
Memberships: Bayer AG (Chair) 1 E.ON SE (Chair) 1 Siemens AG 1 Henkel AG & Co. KGaA (Shareholders’ Committee) 2
Supervisory Board of Henkel Management AG *

Quarterly breakdown of key financials
166
in million euros
1st quarter 2nd quarter 3rd quarter 4th quarter Full year
2014 2015 2014 2015 2014 2015 2014 2015 2014 2015
Sales
Laundry & Home Care 1,147 1,298 1,139 1,314 1,188 1,314 1,152 1,211 4,626 5,137
Beauty Care 856 940 897 1,006 918 964 876 922 3,547 3,833
Adhesive Technologies 1,893 2,160 2,069 2,343 2,100 2,279 2,065 2,209 8,127 8,992
Corporate 34 32 32 31 30 33 32 32 128 128
Henkel Group 3,929 4,430 4,137 4,695 4,236 4,590 4,126 4,374 16,428 18,089
Cost of sales – 2,016 – 2,264 – 2,210 – 2,439 – 2,245 – 2,361 – 2,241 – 2,304 – 8,712 – 9,368
Gross profit 1,913 2,166 1,927 2,256 1,991 2,229 1,885 2,070 7,716 8,721
Marketing, selling and distribution expenses – 1,033 – 1,166 – 1,025 – 1,185 – 1,045 – 1,158 – 1,048 – 1,099 – 4,151 – 4,608
Research and development expenses – 104 – 119 – 103 – 122 – 104 – 120 – 102 – 117 – 413 – 478
Administrative expenses – 202 – 245 – 216 – 241 – 210 – 278 – 224 – 248 – 852 – 1,012
Other operating charges and income 34 12 6 7 – 29 – 7 – 67 10 – 56 22
EBIT
Laundry & Home Care 196 192 160 198 171 211 88 186 615 786
Beauty Care 114 133 135 158 98 142 74 128 421 561
Adhesive Technologies 331 345 346 388 354 367 314 362 1,345 1,462
Corporate – 32 – 22 – 52 – 29 – 20 – 54 – 33 – 58 – 137 – 164
Henkel Group 608 648 589 715 603 666 444 616 2,244 2,645
Investment result 6 – – – 1 – – – – 6 – 1
Other financial result – 11 – 6 – 13 – 7 – 10 – 3 – 12 – 8 – 46 – 24
Interest result – 10 – 3 2 – 3 – 1 – 8 – – 3 – 9 – 17
Financial result – 15 – 9 – 11 – 11 – 11 – 11 – 12 – 11 – 49 – 42
Income before tax 593 639 578 704 592 655 432 605 2,195 2,603
Taxes on income – 137 – 157 – 132 – 173 – 142 – 161 – 122 – 144 – 533 – 635
Net income 456 482 446 531 450 494 310 461 1,662 1,968
Attributable to non-controlling interests 7 12 5 10 10 10 12 15 34 47
Attributable to shareholders of Henkel AG & Co. KGaA 449 470 441 521 440 484 298 446 1,628 1,921
Earnings per preferred share in euros 1.04 1.09 1.02 1.20 1.01 1.12 0.69 1.03 3.76 4.44
in million euros
1st quarter 2nd quarter 3rd quarter 4th quarter Full year
2014 2015 2014 2015 2014 2015 2014 2015 2014 2015
EBIT (as reported) 608 648 589 715 603 666 444 616 2,244 2,645
One-time gains – 25 – – 3 – – – – – 15 – 28 – 15
One-time charges 8 5 17 24 43 34 91 37 159 100
Restructuring charges 28 54 71 29 47 78 67 32 213 193
Adjusted EBIT 619 707 674 768 693 778 602 670 2,588 2,923
Adjusted earnings per preferred share in euros 1.04 1.18 1.16 1.29 1.17 1.30 1.01 1.11 4.38 4.88
The quarterly figures are specific to the quarter to which they refer and have been rounded for commercial convenience. Calculated on the basis of units of 1,000 euros.
Henkel Annual Report 2015188 Further information

Multi-year summary
167
in million euros2009 2010 2011
restated 12012 2013 2014 2015
Results of operations
Sales 13,573 15,092 15,605 16,510 16,355 16,428 18,089
Laundry & Home Care 4,129 4,319 4,304 4,556 4,580 4,626 5,137
Beauty Care 3,010 3,269 3,399 3,542 3,510 3,547 3,833
Adhesive Technologies 6,224 7,306 7,746 8,256 8,117 8,127 8,992
Corporate 210 199 156 155 148 128 128
Gross margin 45.4 46.5 45.3 46.8 47.7 47.0 48.2
Research and development expenses 396 391 410 408 415 413 478
Operating profit (EBIT) 1,080 1,723 1,765 2,199 2,285 2,244 2,645
Laundry & Home Care 501 542 419 621 682 615 786
Beauty Care 387 411 471 483 474 421 561
Adhesive Technologies 290 878 1,002 1,191 1,271 1,345 1,462
Corporate – 98 – 108 – 127 – 97 – 141 – 137 – 164
Income before tax 885 1,552 1,610 2,018 2,172 2,195 2,645
Tax rate in % 29.0 26.4 26.0 24.4 25.2 24.3 24.4
Net income 628 1,143 1,191 1,526 1,625 1,662 1,968
Attributable to shareholders of Henkel AG & Co. KGaA 602 1,118 1,161 1,480 1,589 1,628 1,921
Net return on sales 2 in % 4.7 7.6 7.6 9.2 9.9 10.1 10.9
Interest coverage ratio 8.7 12.8 14.0 14.3 23.9 48.4 75.7
Net assets
Total assets 15,818 17,525 18,487 19,525 19,344 20,961 22,323
Non-current assets 11,162 11,590 11,848 11,927 11,360 14,150 15,406
Current assets 4,656 5,935 6,639 7,598 7,984 6,811 6,917
Equity 6,544 7,950 8,670 9,511 10,158 11,644 13,811
Liabilities 9,274 9,575 9,817 10,014 9,186 9,317 8,512
Equity ratio in % 41.4 45.4 46.9 48.7 52.5 55.6 61.9
Return on equity 3 in % 9.6 17.5 15.0 17.6 17.1 16.4 16.9
Operating debt coverage ratio in % 41.8 71.4 91.6 >500not relevant 4 274.8 375.2
Financial position
Cash flow from operating activities 1,919 1,851 1,562 2,634 2,116 1,914 2,384
Capital expenditures 415 260 443 516 465 2,214 979
Investment ratio as % of sales 3.0 1.7 2.8 3.1 2.8 13.5 5.4
Shares
Dividend per ordinary share in euros 0.51 0.70 0.78 0.93 1.20 1.29 1.45 5
Dividend per preferred share in euros 0.53 0.72 0.80 0.95 1.22 1.31 1.47 5
Total dividends 227 310 345 411 529 569 639 5
Payout ratio in % 27.6 25.5 25.5 25.6 30.0 30.0 30.2 5
Share price, ordinary shares, at year-end in euros 31.15 38.62 37.40 51.93 75.64 80.44 88.62
Share price, preferred shares, at year-end in euros 36.43 46.54 44.59 62.20 84.31 89.42 103.20
Market capitalization at year-end in bn euros 14.6 18.3 17.6 24.6 34.7 36.8 41.4
Employees
Total 6 (at December 31) 49,250 47,850 47,250 46,600 46,850 49,750 49,450
Germany 8,800 8,600 8,300 8,000 8,050 8,200 8,350
Abroad 40,450 39,250 38,950 38,600 38,800 41,550 41,100
1 Application of IAS 8 “Accounting policies, changes in accounting estimates and errors” (see notes on pages 116 and 117 of the 2012 Annual Report).2 Net income divided by sales.3 Net income divided by equity at the start of the year.4 Figure not relevant due to the positive balance of net financial position and pension obligations.5 Proposed.6 Basis: permanent employees excluding apprentices.
189Henkel Annual Report 2015
188 Quarterly breakdown of key financials
189 Multi-year summary190 Index of tables and graphs
192 Glossary195 Credits196 Contacts
Further information

Index of tables and graphs
The Company
Highlights 2015 (inside cover)
1 Key financials
2 Sales by business unit
3 Sales by region
4 Key financials Laundry & Home Care
5 Sales Laundry & Home Care
6 Key financials Beauty Care
7 Sales Beauty Care
8 Key financials Adhesive Technologies
9 Sales Adhesive Technologies
Combined management report
Remuneration report
10 Remuneration structure 42
11 Caps on remuneration 43
12 Remuneration of Management Board members who served in 2015 45
13 Structure of Management Board remuneration 45
14 Service cost / Present value of pension benefits 46
15 Pursuant to DCGK, payments / benefits granted for the reporting year to mem-bers of the Management Board serving in 2015 47
16 Pursuant to DCGK, payments / benefits made for the reporting year to members of the Management Board serving in 2015 48
17 Supervisory Board remuneration 50
18 Shareholders’ Committee remuneration 51
Shares and bonds
19 Key data on Henkel shares 2011 through 2015 52
20 Henkel share performance versus market January through December 2015 53
21 Henkel share performance versus market 2006 through 2015 53
Henkel represented in all major indices
22 Share data 54
23 ADR data 54
International shareholder structure
24 Shareholder structure: institutional investors holding Henkel shares 55
Pro-active capital market communication
25 Analyst recommendations 56
Operational activities
26 Henkel around the world: regional centers 57
Strategy and financial targets 2016
27 Financial targets 2016 58
28 Acquisitions completed in fiscal 2015 59
29 Our focal areas and targets 62
Cost of capital
30 WACC before tax by business unit 64
31 WACC after tax by business unit 64
Macroeconomic and industry-related conditions
32 Average rates of exchange versus the euro 65
Results of operations
33 Sales development 67
34 Sales 67
35 Price and volume effects 67
36 Adjusted operating profit (EBIT) 68
37 Key financials by region 68
38 Guidance versus performance 2015 69
39 Reconciliation from sales to adjusted operating profit 70
40 Net income 70
41 Adjusted earnings per preferred share 70
42 Preferred share dividends 71
Net assets and financial position
43 Financial structure 72
44 Capital expenditures by business unit 73
45 Capital expenditures 2015 73
46 Net financial position 2011 to 2015 73
47 Net financial position 74
48 Credit ratings 75
49 Key financial ratios 75
Employees
50 Employees by region 76
51 Employees by organizational unit 76
52 Employees by activity 77
53 Employees by age group 77
54 Employees 77
Procurement
55 Material expenditures by business unit 80
56 Material expenditures by type 80
Production
57 Number of production sites 81
58 Sustainability targets from 2011 to 2015 and current status 83
Research and development
59 R&D expenditures 83
60 R&D expenditures by business unit 83
61 Selected research and development sites 84
62 Key R&D figures 84
Laundry & Home Care
63 Key financials 90
64 Sales development 90
65 Sales Laundry & Home Care 92
Beauty Care
66 Key financials 94
67 Sales development 94
68 Sales Beauty Care 96
Adhesive Technologies
69 Key financials 98
70 Sales development 98
71 Sales Adhesive Technologies 100
Results of operations
72 Condensed income statement in accordance with HGB 103
Financial result
73 Condensed balance sheet in accordance with HGB 104
Risk management system
74 Major risk categories 108
75 Classification of risks in ascending order 108
Consolidated financial statements
76 Consolidated statement of financial p osition – Assets 118
77 Consolidated statement of financial position – Equity and liabilities 119
78 Consolidated statement of income 120
79 Additional voluntary information 120
80 Consolidated statement of comprehensive income 121
81 Consolidated statement of changes in equity 121
82 Consolidated statement of cash flows 122
83 Additional voluntary information Reconciliation to free cash flow 122
84 Group segment report by business unit 123
85 Key financials by region 124
86 Scope of consolidation 125
Henkel Annual Report 2015190 Further information
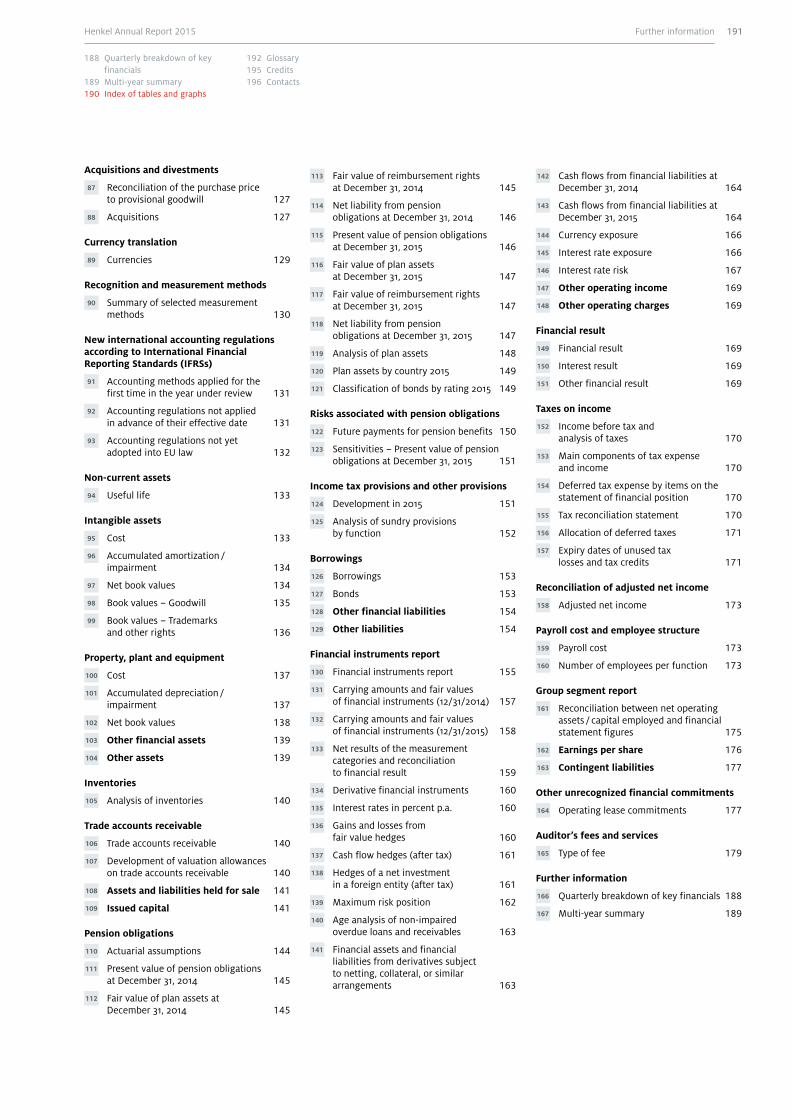
Acquisitions and divestments
87 Reconciliation of the purchase price to provisional goodwill 127
88 Acquisitions 127
Currency translation
89 Currencies 129
Recognition and measurement methods
90 Summary of selected measurement methods 130
New international accounting regulations according to International Financial Reporting Standards (IFRSs)
91 Accounting methods applied for the first time in the year under review 131
92 Accounting regulations not applied in advance of their effective date 131
93 Accounting regulations not yet adopted into EU law 132
Non-current assets
94 Useful life 133
Intangible assets
95 Cost 133
96 Accumulated amortization / impairment 134
97 Net book values 134
98 Book values – Goodwill 135
99 Book values – Trademarks and other rights 136
Property, plant and equipment
100 Cost 137
101 Accumulated depreciation / impairment 137
102 Net book values 138
103 Other financial assets 139
104 Other assets 139
Inventories
105 Analysis of inventories 140
Trade accounts receivable
106 Trade accounts receivable 140
107 Development of valuation allowances on trade accounts receivable 140
108 Assets and liabilities held for sale 141
109 Issued capital 141
Pension obligations
110 Actuarial assumptions 144
111 Present value of pension obligations at December 31, 2014 145
112 Fair value of plan assets at December 31, 2014 145
113 Fair value of reimbursement rights at December 31, 2014 145
114 Net liability from pension obligations at December 31, 2014 146
115 Present value of pension obligations at December 31, 2015 146
116 Fair value of plan assets at December 31, 2015 147
117 Fair value of reimbursement rights at December 31, 2015 147
118 Net liability from pension obligations at December 31, 2015 147
119 Analysis of plan assets 148
120 Plan assets by country 2015 149
121 Classification of bonds by rating 2015 149
Risks associated with pension obligations
122 Future payments for pension benefits 150
123 Sensitivities – Present value of pension obligations at December 31, 2015 151
Income tax provisions and other provisions
124 Development in 2015 151
125 Analysis of sundry provisions by function 152
Borrowings
126 Borrowings 153
127 Bonds 153
128 Other financial liabilities 154
129 Other liabilities 154
Financial instruments report
130 Financial instruments report 155
131 Carrying amounts and fair values of financial instruments (12/31/2014) 157
132 Carrying amounts and fair values of financial instruments (12/31/2015) 158
133 Net results of the measurement categories and reconciliation to financial result 159
134 Derivative financial instruments 160
135 Interest rates in percent p.a. 160
136 Gains and losses from fair value hedges 160
137 Cash flow hedges (after tax) 161
138 Hedges of a net investment in a foreign entity (after tax) 161
139 Maximum risk position 162
140 Age analysis of non-impaired overdue loans and receivables 163
141 Financial assets and financial liabilities from derivatives subject to netting, collateral, or similar arrangements 163
142 Cash flows from financial liabilities at December 31, 2014 164
143 Cash flows from financial liabilities at December 31, 2015 164
144 Currency exposure 166
145 Interest rate exposure 166
146 Interest rate risk 167
147 Other operating income 169
148 Other operating charges 169
Financial result
149 Financial result 169
150 Interest result 169
151 Other financial result 169
Taxes on income
152 Income before tax and analysis of taxes 170
153 Main components of tax expense and income 170
154 Deferred tax expense by items on the statement of financial position 170
155 Tax reconciliation statement 170
156 Allocation of deferred taxes 171
157 Expiry dates of unused tax losses and tax credits 171
Reconciliation of adjusted net income
158 Adjusted net income 173
Payroll cost and employee structure
159 Payroll cost 173
160 Number of employees per function 173
Group segment report
161 Reconciliation between net operating assets / capital employed and financial statement figures 175
162 Earnings per share 176
163 Contingent liabilities 177
Other unrecognized financial commitments
164 Operating lease commitments 177
Auditor’s fees and services
165 Type of fee 179
Further information
166 Quarterly breakdown of key financials 188
167 Multi-year summary 189
191Further informationHenkel Annual Report 2015
188 Quarterly breakdown of key financials
189 Multi-year summary190 Index of tables and graphs
192 Glossary195 Credits196 Contacts

Adjusted EBITEarnings Before Interest and Taxes (EBIT) adjusted for exceptional items in the form of one-time charges, one-time gains and restructuring charges.
Beta factorReflects the systemic risk (market risk) of a share price compared to a certain index (stock market average): In the case of a beta factor of 1.0, the share price fluctu-ates to the same extent as the index. If the factor is less than 1.0, this indicates that the share price undergoes less fluctuation, while a factor above 1.0 indicates that the share price fluctuates more than the market average.
Capital employedCapital invested in company assets and operations. Equity + interest-bearing liabilities.
Cash flowsInflow and outflow of cash and cash equivalents divided within the statement of cash flows into cash flow from operating activities, from investing activities, and from financing activities.
Commercial paperShort-term bearer bonds with a promise to pay, issued for the purpose of generating short-term debt capital.
ComplianceActing in conformity with applicable regulations; ad herence to laws, rules, regulations and in-house or corporate codes of conduct.
Compound annual growth rateYear-over-year rate of growth, e.g. of an investment.
Corporate governanceSystem of management and control, primarily within listed companies. Describes the powers and authority of corporate management, the extent to which these need to be monitored and the extent to which structures should be put in place through which certain interest /stakeholder groups may exert influence on the corporate management.
Corporate Governance Code The German Corporate Governance Code (abbreviation: DCGK) is intended to render the rules governing corpo-rate management and control for a stock corporation in Germany transparent for national and international investors, engendering trust and confidence in the corporate management of German companies.
Credit default swapInstrument used by Henkel to evaluate the credit risks of banks.
Credit facilityAggregate of all loan services available on call from one or several banks as cover for an immediate credit requirement.
DAX ®
Abbreviation for Deutscher Aktienindex, the German share index. The DAX lists the stocks and shares of Germany’s 30 largest listed corporations. Henkel’s pre-ferred shares are quoted on the DAX. DAX is a registered trademark of Deutsche Börse AG, the German stock exchange company.
Declaration of conformityDeclaration made by the management / executive board and supervisory board of a company according to Section 161 of the German Stock Corporation Act [AktG], confirming implementation of the recommendations of the Governmental Commission for the German Corporate Governance Code.
Deferred taxesIn accordance with International Accounting Standard (IAS) 12, deferred taxes are recognized with respect to temporary differences between the statement of finan-cial position valuation of an asset or a liability and its tax base, unused tax losses and tax credits.
Defined contribution plansPost-employment benefit plans under which an entity pays fixed contributions into a separate entity (a fund) and will have no legal or constructive obligation to pay further contributions if the fund does not hold sufficient assets to pay all employee benefits relating to employee service in current and prior periods.
DerivativeFinancial instrument, the value of which changes in res ponse to changes in an underlying asset or an index, which will be settled at a future date and which initially requires only a small or no investment.
DivestmentDisposal, sale or divestiture of an asset, operation or business unit.
Earnings per share (EPS)Metric indicating the income of a joint stock corporation divided between the weighted average number of its shares outstanding. The calculation is performed in accordance with International Accounting Standard (IAS) 33.
Glossary
Henkel Annual Report 2015192 Further information
EBITAbbreviation for Earnings Before Interest and Taxes. Standard profit metric that enables the earning power of the operating business activities of a company to be assessed independently of its financial structure, facilitating comparability between entities where these are financed by varying levels of debt capital.
EBITDAAbbreviation for Earnings Before Interest, Taxes, Depreciation and Amortization.
Economic Value Added (EVA®)The EVA concept reflects the net wealth generated by a company over a certain period. A company achieves pos-itive EVA when the operating result exceeds the weighted average cost of capital. The WACC corresponds to the yield on capital employed expected by the capital market. EVA is a registered trademark of Stern Stewart & Co.
Equity ratioFinancial metric indicating the ratio of equity to total capital. It expresses the share of total assets financed out of equity (owners’ capital) rather than debt capital (pro-vided by lenders). Serves to assess the financial stability and independence of a company.
Fair valueAmount at which an asset or a liability might be exchanged or a debt paid in an arm’s length transaction between knowledgeable, willing parties.
Free cash flowCash flow actually available for acquisitions, dividend payments, the reduction of borrowings, and contribu-tions to pension funds.
GoodwillAmount by which the total consideration for a company or a business exceeds the netted sum of the fair values of the individual, identifiable assets and liabilities.
Gross marginIndicates the percentage by which a company’s sales exceed cost of sales, i.e. the ratio of gross profit to sales.
Gross profitDifference between sales and cost of sales.
Hedge accountingMethod for accounting for hedging transactions where by the compensatory effect of changes in the fair value of the hedging instrument (derivative) and of the underlying asset or liability is recognized in either the statement of income or the statement of comprehensive income.
Hybrid bondEquity-like corporate bond, usually with no specified date of maturity, or with a very long maturity, char acter ized by its subordination in the event of the issuer becoming insolvent.
IAS / IFRSAbbreviation for International Accounting Standards and International Financial Reporting Standards respectively. In Europe, capital market-oriented companies are gener-ally required to prepare consolidated financial statements in accordance with the International Financial Reporting Standards adopted by the European Union. Standards issued before 2003 are known as IAS, those since that date are IFRS.
ImpairmentImpairments of assets are recorded when the recover-able amount is lower than the carrying amount at which the asset is recognized in the statement of financial position. The recoverable amount is calculated as the higher of fair value less costs to sell (net realizable value) and value in use.
IT riskThe international standard ISO / IEC 27001 “Information technology, Security techniques, Information security management systems, Requirements” specifies the requirements for establishing, implementing, operating, monitoring, reviewing, maintaining and improving a documented Information Security Management System within the context of an organization’s overall IT risks. ISO / IEC 27002 additionally provides recommendations for designing the control mechanisms needed for infor-mation security.
KGaAAbbreviation for “Kommanditgesellschaft auf Aktien.” A KGaA is a company with a legal identity (legal entity) in which at least one partner has unlimited liability with respect to the company’s creditors (personally liable partner), while the liability for such debts of the other partners participating in the share-based capital stock is limited to their share capital (limited shareholders).
Long-term incentive (LTI)Bonus aligned to long-term financial performance.
Market capitalizationMarket value of a company calculated from the number of shares issued, multiplied by their list price as quoted on the stock exchange.
Net debtBorrowings less cash and cash equivalents and readily monetizable financial instruments classified as “availa ble for sale” or in the “fair value option,” less positive and plus negative fair values of hedging transactions.
Net working capitalInventories plus payments on account, receivables from suppliers and trade accounts receivable, less trade accounts payable, liabilities to customers, and current sales provisions.
193Further informationHenkel Annual Report 2015
188 Quarterly breakdown of key financials
189 Multi-year summary190 Index of tables and graphs
192 Glossary195 Credits196 Contacts

Non-controlling interests Proportion of equity attributable to third parties in sub-sidiaries included within the scope of consolidation. Previously termed “minority interests.” Valued on a pro-portional net asset basis. A pro-rata portion of the net income of a corporation is due to shareholders owning non-controlling interests.
Operational excellenceA comprehensive program to structure and optimize all Henkel’s business processes based on customer needs, quality and efficiency.
Organic sales growthGrowth in revenues after adjusting for effects arising from acquisitions, divestments and foreign exchange differences – i.e. “top line” growth generated from within.
Payout ratioIndicates what percentage of annual net income (ad justed for exceptional items) is paid out in dividends to shareholders, including non-controlling interests.
Plan assetsPension fund investment vehicles per definition under IAS 19 “Employee Benefits.”
RatingAssessment of the creditworthiness of a company as published by rating agencies.
Return-enhancing portfolioContains investments in equities and alternative invest-ments, and serves to improve the overall return of the pension plan assets over the long term in order to raise the coverage ratio of pension funds. In addition, a broader investment horizon increases the level of investment diversification.
Return on capital employed (ROCE)Profitability metric reflecting the ratio of earnings before interest and taxes (EBIT) to capital employed.
Return on sales (EBIT)Operating business metric derived from the ratio of EBIT to revenues. Also known as EBIT margin.
Scope of consolidationThe scope of consolidation is the aggregate of companies incorporated in the consolidated financial statements.
Supply chainEncompasses purchasing, production, storage, transport, customer services, requirements planning, production scheduling, and supply chain management.
SwapTerm given to the exchange of capital amounts in differ-ing currencies (currency swap) or of different interest obligations (interest swap) between two entities.
Value-at-riskMethod, based on fair value, used to calculate the maxi-mum likely or potential future loss arising from a portfolio.
VolatilityMeasure of fluctuation and variability in the prices quot ed for securities, in interest rates and in foreign exchange rates.
Weighted average cost of capital (WACC)Average return on capital, expressed as a percentage and calculated on the basis of a weighted average of the cost of debt and equity. WACC represents the minimum return expected of a company by its lenders for financing its assets.
Henkel Annual Report 2015194 Further information
Published byHenkel AG & Co. KGaA 40191 Düsseldorf, Germany Phone: +49 (0) 211-797-0
© 2016 Henkel AG & Co. KGaA
Edited by: Corporate Communications, Investor Relations, Corporate Accounting and Subsidiary Controlling
Coordination: Renata Casaro, Dr. Hannes Schollenberger, Wolfgang Zengerling
English translation: RR Donnelley, London
Pre-print proofing: Paul Knighton, Cambridge; Thomas Krause, Krefeld
Design and typesetting: mpm Corporate Communication Solutions, Mainz
Photographs: Charles Cherney, Guido Daniele, Olaf Döring, Neil Hamberg, Steffen Hauser, Philipp Hympendahl, Claudia Kempf, Nils Hendrik Müller; Henkel
Printed by: Druckpartner, Essen
Date of publication of this Report: February 25, 2016
PR N0.: 02 16 3,800 ISSN: 0724-4738 ISBN: 978-3-941517-62-2
Credits
The Annual Report is printed on LuxoArt Silk FSC. The paper is made from pulp bleached without chlorine. It has been certified and verified in accordance with the rules of the Forest Stewardship Council (FSC). The printing inks contain no heavy metals. This publication was cover-finished and bound with these Henkel products: Cellophaning with Aquence GA 6085 HGL laminating adhesive, bound using Technomelt PUR 3400 ME COOL and Technomelt GA 3960 Ultra for the highest occupational health and safety standards.
Except as otherwise noted, all marks used in this publication are trademarks and/or registered trademarks of the Henkel Group in Germany and elsewhere.
This document contains forward-looking statements which are based on the current estimates and assumptions made by the executive management of Henkel AG & Co. KGaA. Forward-looking statements are characterized by the use of words such as expect, intend, plan, predict, assume, believe, estimate, anticipate and similar for-mulations. Such statements are not to be understood as in any way guaranteeing that those expectations will turn out to be accurate. Future performance and the results actually achieved by Henkel AG & Co. KGaA and its affiliated companies depend on a number of risks and uncertainties and may therefore differ materially from forward-looking statements. Many of these factors are outside Henkel’s con-trol and cannot be accurately estimated in advance, such as the future economic environment and the actions of competitors and others involved in the market-place. Henkel neither plans nor undertakes to update forward-looking statements.
195Further informationHenkel Annual Report 2015
188 Quarterly breakdown of key financials
189 Multi-year summary190 Index of tables and graphs
192 Glossary195 Credits196 Contacts
Corporate CommunicationsPhone: +49 (0) 211-797-3533 Fax: +49 (0) 211-798-2484 E-mail: [email protected]
Investor RelationsPhone: +49 (0) 211-797-3937 Fax: +49 (0) 211-798-2863 E-mail: [email protected]
Contacts
Henkel Annual Report 2015196 Further information

Financial calendar
Annual General Meeting Henkel AG & Co. KGaA 2016: Monday, April 11, 2016
Publication of Report for the First Quarter 2016: Thursday, May 19, 2016
Publication of Report for the Second Quarter / Half Year 2016: Thursday, August 11, 2016
Publication of Report for the Third Quarter / Nine Months 2016: Tuesday, November 8, 2016
Publication of Report for Fiscal 2016: Thursday, February 23, 2017
Annual General Meeting Henkel AG & Co. KGaA 2017: Thursday, April 6, 2017
Up-to-date facts and figures on Henkel also available on the internet:
www.henkel.com

Henkel
www.henkel.com/annualreportHenkel
www.henkel.com/sustainabilityreport
Hen
kel A
nnua
l Rep
ort 2
015
Henkel AG & Co. KGaA 40191 Düsseldorf, Germany Phone: +49 (0) 211-797-0 www.henkel.com
Henkel app available for iOS and Android:
Henkel in social media:
www.facebook.com/henkelwww.twitter.com/henkelwww.youtube.com/henkel
www.henkel.com/annualreport www.henkel.com/sustainabilityreport