2015-16 Statement of Accounts DRAFT - Tower Hamlets · The Statement of Accounts 2 ... including a...
126
LONDON BOROUGH OF TOWER HAMLETS DRAFT ANNUAL FINANCIAL REPORT 2015-16
-
Upload
truongkhanh -
Category
Documents
-
view
218 -
download
0
Transcript of 2015-16 Statement of Accounts DRAFT - Tower Hamlets · The Statement of Accounts 2 ... including a...
LONDON BOROUGH OF TOWER HAMLETS
DRAFT ANNUAL FINANCIAL REPORT
2015-16

DRAFT ANNUAL FINANCIAL REPORT 2015-16
CONTENTS
Page
Narrative Report
Overview by the Corporate Director of Resources
1
Review of the Year
The Statement of Accounts
2
The Accounting Statements 8
Movement in Reserves Statement 9
Comprehensive Income and Expenditure Statement 10
Balance Sheet 11
Cash Flow Statement 12
Notes to the Core Financial Statements 13
Statement of Accounting Policies 13
Housing Revenue Account 71
Statement of Movement on the Housing Revenue Account Balance 72
Notes to the Housing Revenue Account 73
Collection Fund 77
Pension Fund Accounts 80
Auditor’s Report 98
Statement of Responsibilities 101
Annual Governance Statement 102
Glossary and Abbreviations 103
1
NARRATIVE REPORT Overview by Corporate Director of Resources I am pleased to introduce Tower Hamlets Council’s Statement of Accounts for 2015/16, which reports our financial results for the year. The accounts have been compiled in accordance with International Financial Reporting Standards, the Code of Practice on Local Authority Accounting in the United Kingdom 2015/16, and the Service Reporting Code of Practice. These constitute “proper accounting practice” with which councils must comply by statute. The Council also produces a summary of the accounts, which is less detailed than the full statement. This has been produced following consultation with stakeholders and is available from the Council’s website at www.towerhamlets.gov.uk Through sound financial management the Council’s spend for the year is in line with the revenue budget and the level of general reserves increased by £0.6 million to £72.1 million. This increase is in line with the revised plan in the 2015/16 budget and is the result of unallocated contingencies for price increases that did not materialise – these unused contingencies also funded the £7.8m deficit within the original budget. This solid financial base has helped to underpin the delivery of the Council’s key objectives, namely: improving the condition of social housing; increasing the supply of affordable social housing (particularly family sized housing); maintaining the provision of services for young people; delivering programmes of skills development, employment and enterprise activity; maintaining support to vulnerable adults; minimising the impact on resident household budgets and; protecting investment in activity that promotes community safety. Key achievements in 2015/16 include:
1. Delivering over 1,000 affordable homes, including stock which are family sized for social rent
2. Increasing the number of properties let to overcrowded households 3. Increasing educational attainment at early years, key stage 2, GCSE
and A Level 4. Reducing further the teenage conception rate 5. Offering free school meals to all primary school children in the borough 6. Making our borough greener, including a programme of tree planting in
streets, parks and open spaces.

2
Many of the key policy objectives have been delivered in conjunction with the Council’s strategic partners including the; Police, NHS Tower Hamlets, Jobcentre Plus and the Voluntary and Community sector (VCS). This joined up approach to the provision of services for our residents is fundamental to improving the outcomes for service users and is overseen by the Local Strategic Partnership Executive. The Council has continued to invest in its infrastructure with £90.7 million spent on its capital programme. The main areas of investment were in housing and schools, with £66.4 million of improvement works through the housing capital programme and £13.9 million into providing school places. The circumstances have been challenging for the Council, and improvement plans have been developed and agreed with the Commissioners, in parallel, the Council remains committed to focussing on the delivery of quality services that are valued by residents. Looking forward the Council will continue to face significant financial challenges. Currently work is underway to deliver the £17.4m savings required for 2016/17. In addition to this, the 2016-2020 Medium Term Financial Plan agreed by Full Council in March 2016 includes a £58m million savings programme in the years 2017/18 to 2019/20. Members are currently engaged in an outcome based budgeting approach to help deliver the future savings. Whilst this forms the basis of a balanced budget over the next Four years, further challenges lay ahead not least any potential impact the business rates devolution and changes to the government’s deficit reduction plans may have. Whilst the strength of the Council’s balance sheet will enable it to effectively manage those risks in the short term, over the longer term there will need to be a further, more fundamental review of the way in which local services are delivered.

3
Review of the Year Delivering against our strategic priorities The Council made progress against the delivery of a range of strategic priorities throughout 2015/16 - a selection of this activity is presented below: Tackling fuel poverty Fuel poverty programmes and initiatives have been delivered throughout the year to reduce household bills and levels of fuel poverty in the borough. 10 energy auctions have been held since the programme commenced in 2013; the last auction achieved an average saving per household of £275. Supporting high quality early years' provision, exp anding free early education places of high quality, including for dis advantaged two-year-olds A local marketing campaign to increase the take up of disadvantaged 2 year old places was undertaken and resulted in an increase in take up of 23 percent. The marketing plan is focussing on volunteering and mentoring to improve parental understanding of early learning years for 2 year olds. During the last year, 873 places were created or approved through capital funding. Delivering the Women and Health employment programm e focusing on the priority of maternity and early years 138 women were engaged in the programme with 54 women offered placements and 50 taking up a job. A further 35 were referred to further training provision through Idea Stores or college; 42 referred to advisory services for barriers to work and learning and 8 referred to the Troubled Families Programme of support. Progression routes for the end of placements have been developed into longer term learning and job opportunities. Working collaboratively across London to enhance in vestment and opportunity Economic partnerships across East London, North London and Central London have been promoted to explore funding and investment options. LBTH has secured £2.4m as part of the Growth Boroughs partnership and £8.5m ESF programme for Employment & Skills. Supporting children to live healthier lives Several milestones have contributed to the successful completion of this activity including: a campaign to ensure children are registered with a GP and dentist; and a new school health (nursing) contract where there is a named

4
nurse for every school, closer partnership working and training for school nurses and training about children’s emotional and health well-being needs. The Healthy Schools Programme has been successfully implemented; Tower Hamlets currently has the highest number of gold, silver and bronze GLA Healthy School Awards across London. Improving support to Carers The Carer’s Centre has been commissioned to deliver carer assessments in order to comply with the Council's statutory responsibilities under the Care Act 2014. The Carer's Centre now carry out carer assessments to the same standard as social workers - it is a 'person centred, person led' approach. The Centre has received positive feedback to date. In addition, a new Carers Plan with monitoring mechanisms is now in place and work with the voluntary sector to provide employment, wellbeing and respite support for carers is being undertaken. Housing - In 2015/16 1,073 affordable homes were delivered. Whilst the minimum expectation of 1,100 was not met, the total number of homes delivered was 438 more than last year. The number of social rented housing completions for family housing in 2015/16 was 328, meaning 143 extra units were delivered this year compared to last. In addition, this year, 1,123 overcrowded families were rehoused; 174 more than last year. The target of 950 lets was exceeded. Progress against our Strategic Priorities for 2016/17 and associated performance measures will be tracked throughout the coming year to ensure we continue to build on the good work of 2015/16. Revenue Income and Expenditure To provide a comparable analysis of income and expenditure across all local authorities there is a standard service analysis. However, it is worth pointing out that the Council budget is structured in line with its service directorates; this sometimes makes it difficult to compare the analysis in the Statement of Accounts with say, the budget analysis in Council Tax Leaflet. Overall, the Council’s Directorate spend was £0.6m below the net General Fund budget of £282.9 million after the planned transfer of £8.7 million of unused contingencies to General Fund Reserves. The HRA account showed an additional surplus of some £10.4 million against budget.

5
The Council’s gross expenditure on services, excluding accounting adjustments, was £1.4 billion (£1.5 billion in 2014/15). An analysis by directorate is shown in the following diagram.
Revenue Funding Government grants and subsidies continue to be the main sources of revenue funding (£0.64 billion). The main specific grant continues to be the Dedicated Schools Grant which can only be used to fund the education services and is largely ‘passported’ directly to the schools. An analysis of all the funding sources is shown in the diagram below.

6
Capital Investment The Council has continued to invest in its property with £93.0 million spent on its capital programme. The main areas of investment were in housing and schools. £65.0 million was spent on improving the existing council housing stock and providing new housing. Investment in schools totalled £10.2m for the provision of new school places and improvement works to the existing buildings. An increase in council dwellings values contributed towards an increase in the Council property, plant and equipment of £114m during 2015/16.
Investment shown as being in ‘non-Council assets’ includes £5.1m of expenditure on schools, £1.4m of expenditure on leaseholder properties and £1.2m of private sector home improvement grants. The table below shows the sources of funding for the capital programme. The majority of this funding was from capital grants and contributions. In addition, £28.3m was also used from the Major Repairs Reserve which is set aside from the Housing Revenue Account for capital investment.

7
Borrowing At the year end the Council had outstanding borrowings of £88.2 million (£89 million 2014/15). This was reduced by PWLB loans that matured during the year. Pensions The Council offers retirement pensions to its staff under a statutory scheme and also makes contributions on their behalf. Although the pension benefits are not payable until employees retire, the Council has a commitment to make the payments and must account for them in the year in which the future entitlements are earned. This commitment is compared with the pension fund assets (investments) and the net amount is included in the accounts as the Council’s pension net surplus or liability. At the end of 2015/16 there was a net liability of £516 million (£638 million 2014/15). Although this sum has a significant impact on the net worth of the Council as shown in its Balance Sheet the deficit will be addressed by contributions to the scheme in future years and returns from the investment strategy. These increased contributions have been reflected in the Council’s Medium Term Financial Plan. Though the value of pension investments and assets decreased in value by £12m in the year (around 1%) mainly due to falling equity markets, the IAS19 deficit reduced as at 31 March 2016 compared to the value reported at 31 March 2015. This is principally due to the impact of unfavourable financial assumptions used at 31 March 2015. A decrease in the net present value discount rate has led to a lower value being placed on liabilities - this has been the case for most LGPS funds. This is a snapshot valuation for accounting purposes and the revaluation for contributory purposes took place at 31 March 2013 reporting a deficit of £365 million (LBTH only). FURTHER INFORMATION Further information about the accounts and a copy of the summary are available from the Head of Corporate Finance, Mulberry Place, 5 Clove Crescent, London, E14 2BG. The summary is also on the Council’s website at www.towerhamlets.gov.uk

8
THE ACCOUNTING STATEMENTS These comprise: The Statement of Accounting Policies on which the figures in the accounts are based. The Core Financial Statements: The Movement in Reserves Statement, as well as showing reserve movements during the year, it also splits reserves between 'usable reserves' (i.e. those that can be applied to fund expenditure or reduce local taxation) and other reserves. The Surplus or (Deficit) on the Provision of Services line shows the true economic cost of providing the Council's services, more details of which are shown in the Comprehensive Income and Expenditure Statement. The Comprehensive Income and Expenditure Account which reports the net cost for the year of all the functions for which the Council is responsible and demonstrates how the cost has been financed from general Government grants and income from local taxpayers. It brings together income and expenditure relating to all the Council’s functions in three distinct sections, each divided by a sub-total, to give the net deficit or surplus for the year. The Balance Sheet which shows the Council’s financial position at the year-end - its balances and reserves and its long-term indebtedness, and the fixed and net current assets employed in its operational activities together with summarised information on the fixed assets held. The Cash Flow Statement which summarises the inflows and outflows of cash arising from transactions with third parties for revenue and capital purposes. Cash is defined as cash in hand and deposits repayable on demand less overdrafts repayable on demand. Notes to the Core Financial Statements The Housing Revenue Account (HRA) which reflects a statutory obligation to maintain a revenue account for local authority housing provision in accordance with Part 6 of the Local Government and Housing Act 1989, and details the credit and debit items required to be taken into account in determining the surplus or deficit on the HRA for the year. It is accompanied by the Statement of Movement on the HRA Balance and appropriate Notes. The Collection Fund which shows the transactions of the Council in relation to non-domestic rates and Council Tax and illustrates the way these have been distributed between Tower Hamlets Council and the Greater London Authority. It reflects the statutory requirement for billing authorities such as the Council to maintain a separate account. The Pension Fund Accounts which provide information about the financial position, performance and the financial adaptability of the statutory pension fund. They show the results for the fund for the year and the disposition of its assets at the period end. We try to produce the statements in a form that is understandable to most stakeholders. However, they include some technical terms which are explained in the Glossary.

GE
NE
RA
L F
UN
D
BA
LAN
CE
EA
RM
AR
KE
D
GE
NE
RA
L F
UN
D
RE
SE
RV
ES
*
HO
US
ING
RE
VE
NU
E
AC
CO
UN
T B
ALA
NC
E
MA
JOR
RE
PA
IRS
R
ES
ER
VE
CA
PIT
AL
RE
CE
IPT
S
RE
SE
RV
E
CA
PIT
AL
GR
AN
TS
U
NA
PP
LIE
D
TO
TA
L U
SA
BLE
RE
SE
RV
ES
RE
VA
LUA
TIO
N
RE
SE
RV
E
CA
PIT
AL
AD
JUS
TM
EN
T
AC
CO
UN
T
PE
NS
ION
S R
ES
ER
VE
CO
LLE
CT
ION
FU
ND
A
DJU
ST
ME
NT
A
CC
OU
NT
FIN
AN
CIA
L IN
ST
RU
ME
NT
A
DJU
ST
ME
NT
A
CC
OU
NT
AC
CU
MU
LAT
ED
AB
SE
NC
ES
A
CC
OU
NT
DE
FE
RR
ED
CA
PIT
AL
RE
CE
IPT
S
TO
TA
L U
NU
SA
BLE
R
ES
ER
VE
S
TO
TA
L A
UT
HO
RIT
Y
RE
SE
RV
ES
£'000 £'000 £'000 £'000 £'000 £'000 £'000 £'000 £'000 £'000 £ '000 £'000 £'000 £'000 £'000 £'000
Balance as at 31 March 2014 64,986 141,806 18,152 16,396 20,948 54,537 316,825 347,108 1,226,255 (495,946) 767 852 (3,427) 47 1,075,656 1,392,481
Movement in reserves during 2014/15
Surplus or (Deficit) on the Provision of Services (7,202) 0 258,213 0 0 0 251,011 0 0 0 0 0 0 0 0 251,011Other comprehensive expenditure and income 0 0 0 0 0 0 0 (1,477) 0 (139,066) 0 0 0 (140,543) (140,543)
Total Comprehensive Expenditure and Income (7,202) 0 258,213 0 0 0 251,011 (1,477) 0 (139,066) 0 0 0 0 (140,543) 110,468
Adjustments between accounting basis and funding basis under regulations 28,511 0 (255,220) 5,778 28,188 947 (191,796) (3,367) 202,316 (14,552) 7,280 (284) 439 (36) 191,796 0
Net Increase or Decrease before Transfers to Earmar ked Reserves 21,309 0 2,993 5,778 28,188 947 59,215 (4,844) 202,316 (153,618) 7,280 (284) 439 (36) 51,253 110,468
Transfers to or from earmarked reserves 8 (13,581) 13,581 0 0 0 0 0 0 0 0 0 0 0 0 0 0Transfers to or from school reserves 8 (1,264) 1,264 0 0 0 0 0 0 0 0 0 0 0 0 0 0
Increase or (Decrease) in 2014/15 6,464 14,845 2,993 5,778 28,188 947 59,215 (4,844) 202,316 (153,618) 7,280 (284) 439 (36) 51,253 110,468
Balance as at 31 March 2015 71,450 156,651 21,145 22,174 49,136 55,484 376,040 342,264 1,428,571 (649,564) 8,047 568 (2,988) 11 1,126,909 1,502,949carried forward
Movement in reserves during 2015/16
Surplus or (Deficit) on the Provision of Services (24,471) 0 94,939 0 0 0 70,468 0 0 0 0 0 0 0 0 70,468Other comprehensive expenditure and income 0 0 0 0 0 0 0 64,703 0 151,822 0 0 0 0 216,525 216,525
Total Comprehensive Expenditure and Income (24,471) 0 94,939 0 0 0 70,468 64,703 0 151,822 0 0 0 0 216,525 286,993
Adjustments between accounting basis and funding basis under regulations 22,308 0 (83,992) (12,998) 37,247 711 (36,724) (5,312) 67,883 (18,853) (7,319) (284) 618 (9) 36,724 0
Net Increase or Decrease before Transfers to Earmar ked Reserves (2,163) 0 10,947 (12,998) 37,247 711 33,744 59,391 67,883 132,969 (7,319) (284) 618 (9) 253,249 286,993
Transfers to or from earmarked reserves 8 (1,368) 1,368 0 0 0 0 0 0 0 0 0 0 0 0 0 0Transfers to or from school reserves 8 4,177 (4,177) 0 0 0 0 0 0 0 0 0 0 0 0 0 0Increase or (Decrease) in Year 646 (2,809) 10,947 (12,998) 37,247 711 33,744 59,391 67,883 132,969 (7,319) (284) 618 (9) 253,249 286,993
Balance as at 31 March 2016 72,097 153,842 32,092 9,176 86,383 56,195 409,785 401,655 1,496,454 (516,595) 728 284 (2,370) 2 1,380,158 1,789,943
MOVEMENT IN RESERVES STATEMENT
This statement shows the movement in the year on the different reserves held by the Council, analysed into 'usable reserves' (i.e. those that can be applied to fund expenditure or reduce local taxation) and other reserves. The Surplus or (Deficit) on the Provision of Services line shows the true economic cost of providing the Council's services, more details of which are shown in the Comprehensive Income and Expenditure Statement. These are different from the statutory amounts required to be charged to the General Fund Balance and the Housing Revenue Account for council tax setting and dwellings rent setting purposes. The Net Increase/Decrease before Transfers to Earmarked Reserves line shows the statutory General Fund Balance and Housing Revenue Account Balance before any discretionary transfers to or from earmarked reserves undertaken by the Council.
NO
TE
S
USABLE RESERVES UNUSABLE RESERVES
9
Gross Gross Net Gross Gross NetExpenditure Income Expenditure Expenditure Income Expenditure
£'000 £'000 £'000 £'000 £'000 £'000
Continuing Operations
108,770 21,733 87,037 Adult Social Services 114,464 32,721 81,743
6,193 5,035 1,158 Central Services 8,182 2,878 5,303
565,398 452,525 112,873 Children's and Education Services 571,852 461,966 109,887
37,476 18,720 18,756 Corporate and Democratic Core 26,782 5,468 21,314
37,369 5,071 32,298 Cultural and Related Services 21,056 4,879 16,177
46,528 7,625 38,903 Environment and Regulatory Services 44,580 6,124 38,456
31,249 21,935 9,314 Highways and Transport Services 29,980 21,597 8,383
333,104 306,415 26,689 Housing Services 332,655 310,043 22,612
-118,296 89,126 (207,422) Local Authority Housing (Housing Revenue Account) 1 33,985 92,177 (58,192)
38 0 38 Non-distributed Costs 5,939 0 5,939
22,084 13,544 8,540 Planning Services 24,234 15,282 8,951
32,355 33,434 (1,079) Public Health 36,484 36,396 88
1,102,268 975,163 127,105 NET COST OF SERVICES 1,250,192 989,531 260,661
(1,533) Other Operating Expenditure 9 (13,150)
28,660 Financing and Investment Income and Expenditure 10 26,783
(405,243) Taxation and Non-Specific Grant Income 11 (344,762)
(251,011) (SURPLUS) OR DEFICIT ON THE PROVISION OF SERVICES (70,468)
Other Comprehensive Income and Expenditure
1,477 (Surplus)/Deficit on revaluation of non-current assets (64,703)
139,066 Actuarial (gains) or losses on pension assets and liabilities (151,822)
140,543 OTHER COMPREHENSIVE INCOME AND EXPENDITURE (216,525)
(110,468) TOTAL COMPREHENSIVE INCOME AND EXPENDITURE (286,993)
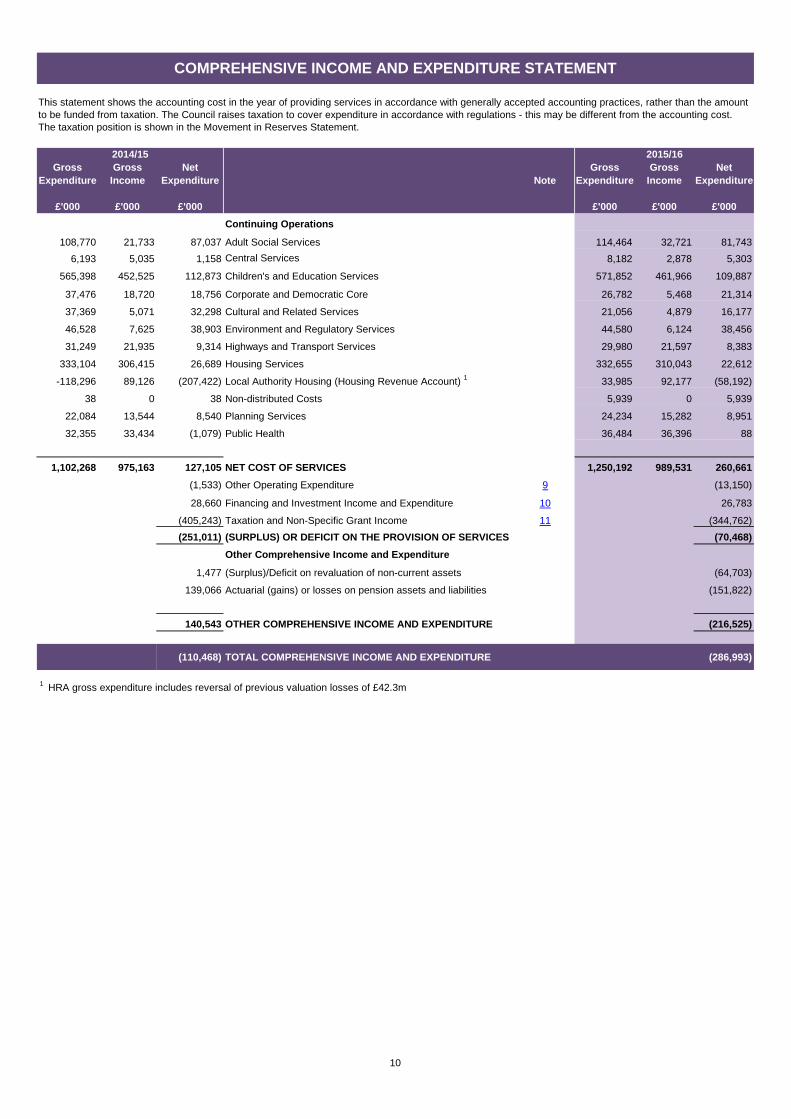
1 HRA gross expenditure includes reversal of previous valuation losses of £42.3m
COMPREHENSIVE INCOME AND EXPENDITURE STATEMENT
This statement shows the accounting cost in the year of providing services in accordance with generally accepted accounting practices, rather than the amount to be funded from taxation. The Council raises taxation to cover expenditure in accordance with regulations - this may be different from the accounting cost. The taxation position is shown in the Movement in Reserves Statement.
2014/15 2015/16
Note
10

31 March Notes 31 March2015 2016£'000 £'000
Long-term Assets2,042,623 Property, plant and equipment 12 2,156,575
9,310 Heritage Assets 43 9,310613 Long Term Debtors 13 572
2,052,546 Total Long-term assets 2,166,457
Current Assets215,748 Short-term investments 15 291,589
225 Assets held for sale 21 13,695115,248 Short-term debtors 19 97,268202,357 Cash and cash equivalents 20 160,712
533,578 Total Current Assets 563,264
Current liabilities1,710 Short-term borrowing 15 3,644
215,640 Short-term creditors 22 204,1584,741 Provisions 23 2,076
222,091 Total Current liabilities 209,878
Long Term Liabilities7,340 Provisions 23 7,623
88,528 Long-term borrowing 15 85,936649,564 Liability related to defined benefit pension schemes 41 516,595
76,190 Capital grants receipts in advance 37 76,12637,509 Deferred liabilities 40 42,040
1,947 Deferred Income - Receipt in Advance 1,576
861,078 Total Long-Term Liabilities 729,896
1,502,956 NET ASSETS 1,789,947
ReservesUsable Reserves
71,457 General Fund 72,10021,145 Housing Revenue Account 32,092
120,663 Earmarked reserves 8 122,03135,988 Schools reserves 8 31,81149,136 Capital receipts reserve 86,38355,484 Capital grants unapplied 56,19522,174 Major repairs reserve 9,176
376,047 Total Usable Reserves 409,788
Unusable Reserves 25342,264 Revaluation Reserve 401,655
1,428,571 Capital Adjustment Account 1,496,4540 Collection Fund 0
8,047 Collection Fund Adjustment Account 728568 Financial Instruments Adjustment Account 284
(649,564) Pensions reserve (516,595)(2,988) Accumulated Absences Account (2,369)
11 Deferred capital receipts 21,126,909 Total Unusable Reserves 1,380,159
1,502,956 TOTAL RESERVES 1,789,947
BALANCE SHEET
This statement shows the Council's balances and reserves, its long term indebtedness and the non-current assets and net current assets employed in its operations as at 31st March 2016.
11

2014/15 Notes 2015/16£'000 £'000
251,011 Net surplus or (deficit) on the provision of services 70,468(43,815) Adjustments to net surplus or deficit on the provision of services for non cash movements 26A 52,405
(59,632)Adjustments for items included in the net surplus or deficit on the provision of services that are investing and financing activities 26A (55,854)
147,564 Net cash flows from Operating Activities 67,019(81,972) Investing Activities 27 (105,757)(1,346) Financing Activities 28 (2,907)
64,246 Net increase or decrease in cash and cash equivalen ts (41,645)138,111 Cash and cash equivalents at the beginning of the reporting period 202,357202,357 Cash and cash equivalents at the end of the reporti ng period 20 160,712
CASH FLOW STATEMENT
The Cash Flow Statement shows the changes in cash and cash equivalents of the authority during the reporting period. The statement shows how the authority generates and uses cash and cash equivalents by classifying cash flows as operating, investing and financing activities. The amount of net cash flows arising from operating activities is a key indicator of the extent to which the operations of the authority are funded by way of taxation and grant income or from the recipients of services provided by the authority. Investing activities represent the extent to which cash outflows have been made for resources which are intended to contribute to the authority’s future service delivery. Cash flows arising from financing activities are useful in predicting claims on future cash flows by providers of capital (i.e. borrowing) to the authority.
12

13
NOTE 1. STATEMENT OF ACCOUNTING POLICIES 1. General Principles The Statement of Accounts summarises the Council’s transactions for the 2015/16 financial year and its position at the year-end of 31st March 2016. The Council is required to prepare an annual Statement of Accounts by the Accounts and Audit Regulations 2015 which require the document to be prepared in accordance with proper accounting practices. These practices primarily comprise the Code of Practice on Local Authority Accounting in the United Kingdom 2015/16 and the Service Reporting Code of Practice (SeRCOP) 2015/16, supported by International Financial Reporting Standards (IFRS) and statutory guidance issued under section 12 of the 2003 Act. The accounting convention adopted in the Statement of Accounts is principally historical cost, modified by the revaluation of certain categories of long-term assets and financial instruments. This is to ensure that the Statement of Accounts gives a true and fair view of the financial position of the Council including the group accounts for the year ending 31st March 2016 and to ensure it is compliant with relevant statutory accounting requirements issued by the International Accounting Standards Board (IASB). Expenditure and income are reported in accordance with a total cost basis of accounting. Gross total cost includes all expenditure attributable to the service/activity, including employee costs, expenditure relating to premises and transport, supplies and services, third party payments, transfer payments, support services and depreciation. No categories of income are considered to be abatements of expenditure, and movements to and from reserves are excluded from total cost. The accounting concepts of ‘materiality’, ‘accruals’, ‘going concern’ and ‘primacy of legislative requirements’ have been considered in the application of accounting policies. In this regard the: • Materiality concept means that information is included where the information is of
such significance as to justify its inclusion. • Accruals concept requires the non-cash effects of transactions to be included in the
financial statement for the year in which they occur, not in the period in which the cash is paid or received.
• Going concern concept assumes that the Council will continue in operational existence for the foreseeable future
• Primacy of Legislation - local authorities derive their power from statute and their financial and accounting framework is closely controlled by legislation. Where there is conflict between a legal requirement and an accounting standard, the legal requirement will take precedence.
2. Accruals of Income and Expenditure Activity is accounted for in the year that it takes place, not simply when cash payments are made or received. In particular: • Revenue from the sale of goods is recognised when the Council transfers the
significant risks and rewards of ownership to the purchaser and it is probable that

14
economic benefits or service potential associated with the transaction will flow to the Council.
• Revenue from the provision of services is recognised when the Council can measure reliably the percentage of completion of the transaction and it is probable that economic benefits or service potential associated with the transaction will flow to the Council. This includes the accounting for fees, charges and rents due from customers; these are accounted for as income at the date the Council provides the relevant goods or services.
• Supplies are recorded as expenditure when they are consumed – where there is a gap between the date supplies are received and their consumption; they are carried as inventories on the Balance Sheet if material.
• Expenses in relation to services received (including services provided by employees) are recorded as expenditure when the services are received rather than when payments are made.
• Interest receivable on investments and payable on borrowings is accounted for respectively as income and expenditure on the basis of the effective interest rate for the relevant financial instrument rather than the cash flows fixed or determined by the contract.
• Where revenue and expenditure have been recognised but cash has not been received or paid, a debtor or creditor for the relevant amount is recorded in the Balance Sheet. Where debts may not be settled, the balance of debtors is written down and a charge made to revenue for the income that might not be collected.
• Exceptionally, income in respect of adults in residential care under the National Assistance Act 1948 is accounted for on a cash basis, although the amount involved is not material to the presentation of the accounts.
• The Council operates a de minimis of £10,000 below which items of income and expenditure are not required.
3. Cash and Cash Equivalents Cash is represented by cash in hand and deposits with financial institutions repayable without penalty on notice. Cash equivalents are investments that mature no more than three months or less from the date of acquisition and that are readily convertible to known amounts of cash with insignificant risk of change in value. In the Cash Flow Statement, cash and cash equivalents are shown net of bank overdrafts that are repayable on demand within the short-term and form an integral part of the Council’s cash management. 4. Exceptional Items When items of income and expense are material, their nature and amount is disclosed separately, either on the face of the Comprehensive Income and Expenditure Statement or in the notes to the accounts, depending on how significant the items are to an understanding of the Council’s financial performance. 5. Prior Period Adjustments, Changes in Accounting Policies and
Estimates and Errors
Prior period adjustments may arise as a result of a change in accounting policies or to correct a material error. Changes in accounting estimates are accounted for prospectively, i.e. in the current and future years affected by the change and do not give rise to a prior period adjustment.

15
Changes in accounting policies are only made when required by proper accounting practices or the change provides more reliable or relevant information about the effect of transactions, other events and conditions on the Council’s financial position or financial performance. Where a change is made, it is applied retrospectively (unless stated otherwise or not material) by adjusting opening balances and comparative amounts for the prior period as if the new policy had always been applied. Changes in Accounting Policy: Future Changes in Accounting Policy - The Code of Practice on Local Council Accounting in the United Kingdom 2015/16 (the Code) has introduced several changes in accounting policies which will be required from 1st April 2016.
The CIPFA Code of Practice on Transport Infrastructure Assets (the Infrastructure Code) takes effect from 1 April 2016. This will require a Highways Network Asset to be recognised in the balance sheet at depreciated replacement cost. This will replace items of infrastructure such as roads and bridges currently shown in the balance sheet at depreciated historic cost. This will be a significant material change, likely to result in a revaluation gain which will increase the value of Property, Plant and Equipment on the balance sheet. New accounting standards usually require retrospective changes to the prior year’s accounts, however this change does not require retrospective restatement. Other changes - In addition there are a number of minor amendments to International Financial Reporting Standards, but these are not expected to have any material impact on the accounts. These comprise:
• Amendments to IAS 19 Employee Benefits (Defined Benefit Plans: Employee Contributions)
• Amendment to IFRS 11 Joint Arrangements (Accounting for Acquisitions of Interests in Joint Operations)
• Amendment to IAS 16 Property, Plant and Equipment and IAS 38 Intangible Assets - Clarification of Acceptable Methods of Depreciation and Amortisation for long-term assets
• Amendment to IAS 1 Presentation of Financial Statements (Disclosure Initiative) – this will change format of Comprehensive Income & Expenditure account to make it based on the council Directorate structure, a new expenditure and funding analysis statement and minor changes to the movement in reserve statement.
6. Charges to Revenue for Long-term Assets
Service revenue accounts, support services and trading accounts are debited with the following amounts to record the cost of holding long-term assets during the year:
• Depreciation attributable to the assets used by the relevant service
• Revaluation losses (general fall in prices across the board) and impairment losses (fall in price specific to an asset) on tangible non-current assets used by the service where there are no accumulated gains in the Revaluation Reserve against which the losses can be written off
The Council is not required to raise Council Tax to fund depreciation, revaluation, impairment losses or amortisations. However, it is required to make an annual provision from revenue to contribute towards the reduction in its overall borrowing requirement (equal to an amount calculated on a prudent basis determined by the Council in accordance with statutory guidance). Depreciation, revaluation and impairment losses and amortisations are therefore replaced by the contribution in the General Fund Balance (Minimum Revenue Provision), by

16
way of an adjusting transaction with the Capital Adjustment Account in the Movement in Reserves Statement for the difference between the two. The Minimum Revenue Provision (MRP) relating to non-housing assets has been calculated for 2015/16 in accordance with Option 1 (the Regulatory Method) set out in the statutory guidance on MRP. 7. Employee Benefits a. Benefits Payable during Employment Short-term employee benefits are those due to be settled within 12 months of the year-end. They include such benefits as wages and salaries, paid annual leave and paid sick leave, bonuses and non-monetary benefits for current employees and are recognised as an expense for services in the year in which employees render service to the Council. If material, an accrual is made for the cost of holiday entitlements (or any form of leave, e.g. time off in lieu) earned by employees but not taken before the year-end which employees can carry forward into the next financial year. The accrual is made at the wage and salary rates applicable in the following accounting year, being the period in which the employee takes the benefit. The accrual is charged to Surplus or Deficit on the Provision of Services, but then reversed out through the Movement in Reserves Statement so that holiday benefits are charged to revenue in the financial year in which the holiday absence occurs. b. Termination Benefits Termination benefits are amounts payable as a result of a decision by the Council to terminate an officer’s employment before the normal retirement date or an officer’s decision to accept voluntary redundancy and are charged on an accruals basis to the appropriate service line in the Comprehensive Income and Expenditure Statement when the Council is demonstrably committed to the termination of the employment of an officer or group of officers or making an offer to encourage voluntary redundancy and a reliable estimate can be made of the cost. Where termination benefits involve the enhancement of pensions, statutory provisions require the General Fund balance to be charged with the amount payable by the Council to the pension fund or pensioner in the year, not the amount calculated according to the relevant accounting standards. In the Movement in Reserves Statement, appropriations are required to and from the Pensions Reserve to remove the notional debits and credits for pension enhancement termination benefits and replace them with debits for the cash paid to the pension fund and pensioners and any such amounts payable but unpaid at the year-end.
c. Post-Employment Benefits
Employees of the Council are members of three separate pension schemes:
• The Local Government Pension Scheme, administered by the Council
• The Local Government Pension Scheme, administered by the London Pensions Fund Authority
• The Teachers’ Pension Scheme, administered by Capita Teachers’ Pensions on behalf of the Department for Education (DfE).
All the schemes provide defined benefits to members (retirement lump sums and pensions), earned as employees work for the Council. However, the arrangements for the Teachers’ scheme mean that liabilities for these benefits cannot be identified to the Council. The scheme is therefore accounted for as if it were a defined contributions scheme – no liability for future payments of benefits is recognised in the Balance Sheet. The Children’s and Education Services line in the Comprehensive Income

17
and Expenditure Statement is charged with the employer’s contributions payable to Teachers’ Pensions in the year. The DfE set the teacher’s pension contribution rate.
The Local Government Pension Scheme
The Local Government scheme is a defined benefits scheme. The Council’s wholly owned subsidiary, Tower Hamlets Homes Limited (THH), is a Local Government Pension Scheme Employer in accordance with the Local Government Pension Scheme (Amendment) Regulations 2002. The Council has indemnified THH in respect of all liabilities that have arisen or may arise from its pension obligations.
The liabilities of the pension scheme attributable to the Council are included in the Balance Sheet on an actuarial basis using the projected unit method – an assessment of the future payments that will be made in relation to retirement benefits earned to date by employees, based on assumptions about mortality rates, employee turnover rates, etc. and estimates of projected earnings for current employees.
Council liabilities are discounted to their value at current prices, using a discount rate derived from corporate bond yields (as measured by the yield on iBoxxSterling Corporates Index, AA over 15 years) as at 31st March 2016.
Assets attributable to the Council are included in the Balance Sheet at their fair value. Quoted or unitised securities are valued at current bid price; unquoted securities on the basis of professional estimate; and property at market value.
The change in the net pension liability is analysed into seven components:
• current service cost – the increase in liabilities as a result of years of service earned this year, allocated in the Comprehensive Income and Expenditure Statement to the revenue accounts of services for which the employees worked.
• past service cost – the increase in liabilities arising from current year decisions the effect of which relates to years of service earned in earlier years, debited to the Surplus or Deficit on the Provision of Services as part of Non Distributed Costs within the Comprehensive Income and Expenditure Statement.
• interest cost – the expected increase in the present value of liabilities during the year as they move one year closer to being paid, debited to Financing and Investment Income and Expenditure in the Comprehensive Income and Expenditure Statement.
• expected rate of return (on assets) – the annual investment return on the fund assets attributable to the Council, based on an average of the expected long-term return, credited to Financing and Investment Income and Expenditure in the Comprehensive Income and Expenditure Statement.
• gains and losses on settlements and curtailments – the result of actions to relieve the Council of liabilities or events that reduce the expected future service or accrual of benefits of employees, credited or debited to the Surplus or Deficit on the Provision of Services as part of Non Distributed Costs within the Comprehensive Income and Expenditure Statement.
• actuarial gains and losses – changes in the net pensions liability that arise because events have not coincided with assumptions made at the last actuarial valuation or because the actuaries have updated their assumptions, debited to the Pensions Reserve.
• contributions paid to the pension funds – cash paid as employer’s contributions to the pension funds.
In relation to retirement benefits, statutory provisions require the General Fund balance to be charged with the amount payable by the Council to the pension fund in the year, not the
18
amount calculated according to the relevant accounting standards. In the Movement of Reserves Statement, this means that there are appropriations to and from the Pensions Reserve to remove the notional debits and credits for retirement benefits and replace them with debits for the cash paid to the pension funds and any amounts payable to the funds but unpaid at the year-end. The negative balance that arises on the Pensions Reserve thereby measures the beneficial impact to the General Fund of being required to account for retirement benefits on the basis of cash flows rather than as benefits are earned by employees as calculated under IAS19.
Discretionary Benefits
The Council also has restricted powers to make discretionary awards of retirement benefits in the event of early retirements. Any liabilities estimated to arise as a result of an award to any member of staff (including teachers) are accrued in the year of the decision to make the award and accounted for using the same policies as are applied to the Local Government Pension Scheme. 8. Events after the Balance Sheet date Events after the Balance Sheet date are those events, both favourable and unfavourable, that occur between the end of the reporting period and the date when the Statement of Accounts is authorised for issue. Two types of events can be identified: a. those that provide evidence of conditions that existed at the end of the reporting
period – the Statement of Accounts is adjusted to reflect such material events b. those that are indicative of conditions that arose after the reporting period – the
Statement of Accounts is not adjusted to reflect such events, but where a category of events would have a material effect, disclosure is made in the notes of the nature of the events and their estimated financial effect, or a statement that an estimate cannot be reliably made.
Events taking place after the date of authorisation for issue are not reflected in the Statement of Accounts. Events after the Balance Sheet date are reflected up to the date when the Statement of Accounts is authorised for issue 9. Financial Instruments
a. Financial Liabilities Financial liabilities are recognised on the Balance Sheet when the Council becomes a party to the contractual provisions of a financial instrument and are initially measured at fair value and are carried at their amortised cost. Annual charges to the Financing and Investment Income and Expenditure line in the Comprehensive Income and Expenditure Statement for interest payable are based on the carrying amount of the liability, multiplied by the effective rate of interest for the instrument. The effective interest rate is the rate that exactly discounts estimated future cash payments over the life of the instrument to the amount at which it was originally recognised. For most of the borrowings that the Council has, this means that the amount presented in the Balance Sheet is the outstanding principal repayable (plus accrued interest); and interest charged to the Comprehensive Income and Expenditure Statement is the amount payable for the year according to the loan agreement. Gains and losses on the repurchase or early settlement of borrowing are credited and debited to the Financing and Investment Income and Expenditure line in the Comprehensive

19
Income and Expenditure Statement in the year of repurchase/settlement. However, where repurchase has taken place as part of a restructuring of the loan portfolio that involves the modification or exchange of existing instruments, the premium or discount is respectively deducted from or added to the amortised cost of the new or modified loan and the write-down to the Comprehensive Income and Expenditure Statement is spread over the life of the loan by an adjustment to the effective interest rate. Where premia and discounts have been charged to the Comprehensive Income and Expenditure Statement, regulations allow the impact on the General Fund Balance to be spread over future years. The Council has a policy of spreading the gain or loss over the term that was remaining on the loan against which the premium was payable or discount receivable when it was repaid. The reconciliation of amounts charged to the Comprehensive Income and Expenditure Statement to the net charge required against the General Fund Balance is managed by a transfer to or from the Financial Instruments Adjustment Account in the Movement in Reserves Statement.
b. Financial Assets
Financial assets are classified into two types:
• loans and receivables – assets that have fixed or determinable payments but are not quoted in an active market
• available-for-sale assets – assets that have a quoted market price and/or do not have fixed or determinable payments
Loans and Receivables
Loans and receivables are recognised on the Balance Sheet when the Council becomes a party to the contractual provisions of a financial instrument and are initially measured at fair value and carried at their amortised cost. Annual credits to the Financing and Investment line in the Comprehensive Income and Expenditure Statement for interest receivable are based on the carrying amount of the asset multiplied by the effective rate of interest for the instrument. For most of the loans that the Council has made, this means that the amount presented in the Balance Sheet is the outstanding principal receivable (plus accrued interest) and interest credited to the Comprehensive Income and Expenditure Statement is the amount receivable for the year in the loan agreement.
Where assets are identified as impaired because of a likelihood arising from a past event that payments due under the contract will not be made, the asset is written down and a charge made to the relevant service (for receivables specific to that service) or the Financing and Investment Income and Expenditure line in the Comprehensive Income and Expenditure Statement.
Any gains and losses that arise on the derecognition of the asset are credited / debited to the Financing and Investment Income and Expenditure line in the Comprehensive Income and Expenditure Statement. 10. Foreign Currency Translation
Where the Council has entered into a transaction denominated in a foreign currency, the transaction is converted into sterling at the exchange rate applicable on the date the transaction was effective.
11. Government Grants and Contributions

20
Whether paid on account, by instalments or in arrears, government grants and third party contributions and donations are recognised as due to the Council when there is reasonable assurance that: • the Council will comply with the conditions attached to the payments, and • the grants or contributions will be received. Amounts recognised as due to the Council are not credited to the Comprehensive Income and Expenditure Statement until conditions attached to the grant or contribution have been satisfied. Conditions are stipulations that specify that the future economic benefits or service potential embodied in the asset acquired using the grant or contribution are required to be consumed by the recipient as specified, or future economic benefits or service potential must be returned to the transferor. Monies advanced as grants and contributions for which conditions have not been satisfied are carried in the Balance Sheet as creditors (revenue grants) or Capital Grants Receipts in Advance account (capital grants). When conditions are satisfied, the grant or contribution is credited to the relevant service line (attributable revenue grants and contributions) or Taxation and Non-Specific Grant Income (non-ring-fenced revenue grants and all capital grants) in the Comprehensive Income and Expenditure Statement. Unapplied revenue grants without repayment conditions are shown as earmarked reserves. Where capital grants are credited to the Comprehensive Income and Expenditure Statement, they are reversed out of the General Fund Balance in the Movement in Reserves Statement. Where the grant has yet to be used to finance capital expenditure, it is posted to the Capital Grants Unapplied reserve. Where it has been applied, it is posted to the Capital Adjustment Account. Amounts in the Capital Grants Unapplied reserve are transferred to the Capital Adjustment Account once they have been applied to fund capital expenditure. 12. Heritage assets The Code of Practice on Local Authority Accounting in the United Kingdom requires material heritage assets held by the Council to be disclosed. The value of heritage assets currently held in the Balance Sheet as part of long-term assets is £9.3 million at 31 March 2016. This valuation is based on valuations for art and museum collections where the asset has a material value. The council holds information on the value of an item of material value within the art collection (one painting), two public sculptures and civic regalia (value held for insurance purposes). Valuations are made by any method that is appropriate, including reference to sale proceeds of similar items by same artist to demonstrate values are clearly under materiality values. There is no requirement for valuations to be carried out or certified by external valuers nor is there any prescribed minimum period between valuations. The Council has four heritage assets that have material values, these values are reviewed periodically, however the real value would only be established upon sale as valuations on assets of this nature are subjective. Where the Council has information on the cost or value of a heritage asset the Council includes that value in its balance sheet. Where this information is not available and the historical cost information cannot be obtained the asset is excluded from the balance sheet. Heritage assets (other than operational heritage assets) shall normally be included in the balance sheet at their current value where material. The Council has a materiality threshold of £50,000 for considering heritage assets for valuation. Where it is not practical to obtain a
21
valuation at a reasonable cost heritage assets are valued at cost where known. Most heritage assets owned by the council have an historical interest to the Borough, but would not have material market value. Operational heritage assets (i.e. those that in addition to being held for their heritage characteristics are also used for other activities or provide other services) are accounted for as operational assets and valued in the same way as other assets of that type. Depreciation is not required on heritage assets with indefinite lives. However where there is evidence of physical deterioration to a material heritage asset or doubts arise to its authenticity the value of the asset would be reviewed.
13. Interests in Companies and Other Entities The Council has an interest in Tower Hamlets Homes which is a wholly owned subsidiary of the Council but is not considered material and does not require group accounts to be prepared (a summary of this interest can be found in note 45). The Council, as part of the Government’s Building Schools for the Future (BSF) initiative, also has a ten percent shareholding in the delivery company Tower Hamlets Local Education Partnership Ltd. but has determined that the interest is outside the group accounts requirement. In the Council’s own single-entity accounts, interests in companies and other entities are recorded as financial assets at cost, less any provision for losses.
14. Inventories and Long Term Contracts Inventories (stocks) are included in the Balance Sheet at the lower of cost and net realisable value. Where material, the council would select a valuation process appropriate for the asset. Long term contracts are accounted for on the basis of charging the Surplus or Deficit on the Provision of Services with the value of works and services received under the contract during the financial year.
15. Leases
Leases are classified as finance leases where the terms of the lease transfer substantially all the risks and rewards incidental to ownership of the property, plant or equipment from the lessor to the lessee. All other leases are classified as operating leases.
The Council as a Lessee
The Council has reviewed its leases in detail and has determined that, except for PFI agreements, there are a small number of finance leases with immaterial asset values, so the agreement costs are charged to revenue. For finance leases (including the PFI assets), the accounting policy is as follows;
a. Finance Leases The Council accounts for leases as finance leases when substantially all the risks and rewards relating to the leased property transfer to the Council. Rentals payable are apportioned between: • a charge for the acquisition of the interest in the property, plant or equipment
(recognised as a liability in the Balance Sheet at the start of the lease, matched with a
22
tangible property, plant or equipment asset – the liability is written down as the rent becomes payable), and
• A finance charge (debited to the Financing and Investment Income and Expenditure line in the Comprehensive Income and Expenditure Statement).
Property, Plant and Equipment recognised under finance leases is accounted for using the policies applied generally to such assets, subject to depreciation being charged over the lease term if this is shorter than the asset’s estimated useful life (where ownership of the asset does not transfer to the council at the end of the lease period).
b. Operating Leases
Leases that do not meet the definition of finance leases as described above are accounted for as operating leases. Rentals payable are charged to the relevant service revenue account within the Comprehensive Income and Expenditure Statement on an equalised basis over the term of the lease, to reflect the economic benefits consumed over the life of the lease, irrespective of fluctuations in annual payments. The Council as a Lessor The council has some operating leases as a lessor; the accounting policy is as follows: Operating Leases Where the Council grants an operating lease over a property or an item of plant or equipment, the asset is retained in the Balance Sheet. Rental income is credited to the Other Operating Expenditure line in the Comprehensive Income and Expenditure Statement. Credits are made on a straight-line basis over the life of the lease, even if this does not match the pattern of payments (e.g. there is a premium paid at the commencement of the lease). Initial direct costs incurred in negotiating and arranging the lease are added to the carrying amount of the relevant asset and charged as an expense over the lease term on the same basis as rental income.
16. Overheads and Support Services
The costs of overheads and support services are charged to those services that benefit from the supply or service in accordance with the costing principles of the CIPFA Service Reporting Code of Practice 2015/16 (SeRCOP). The total absorption costing principle is used – the full cost of overheads and support services is shared between users in proportion to the benefits received, with the exception of:
• Corporate and Democratic Core – costs relating to the Council’s status as a multi-functional, democratic organisation.
• Non Distributed Costs – costs not attributable to services such as depreciation and impairment losses chargeable on non-operational properties
These two cost categories are defined in SeRCOP and accounted for as separate headings in the Comprehensive Income and Expenditure Statement, as part of Net Expenditure on Continuing Services.
17. Property, Plant and Equipment Assets that have physical substance and are held for use in the production or supply of goods or services, for rental to others, or for administrative purposes and that are expected to be used during more than one financial year are classified as Property, Plant and Equipment.
23
Recognition Expenditure on the acquisition, creation or enhancement of Property, Plant and Equipment is capitalised on an accruals basis, provided that it is probable that the future economic benefits or service potential associated with the item will flow to the Council and the cost of the item can be measured reliably. Expenditure that maintains but does not add to an asset’s potential to deliver future economic benefits or service potential (i.e. repairs and maintenance) is charged as an expense when it is incurred. The de minimus level above which expenditure on tangible property, plant and equipment assets is classified as capital is £50,000 except where the expenditure is financed by grants or contributions; or where lesser amounts on the same asset accumulate above that level. Measurement Assets are initially measured at cost, comprising:
• the purchase price • any costs attributable to bringing the asset to the location and condition necessary for
it to be capable of operating in the manner intended by management The Council does not capitalise borrowing costs incurred whilst assets are under construction. The cost of assets acquired other than by purchase is deemed to be its current value, unless the acquisition does not have commercial substance (i.e. it will not lead to a variation in the cash flows of the Council). In the latter case, where an asset is acquired via an exchange, the cost of the acquisition is the carrying amount of the asset given up by the Council. Assets are then carried in the Balance Sheet using the following measurement bases: • infrastructure, community assets and assets under construction – depreciated
historical cost. • dwellings – current value, determined using the basis of existing use value for social
housing (EUV-SH). • All other assets – fair value, determined as the amount that would be paid for the
asset in its existing use (existing use value – EUV). Where there is no market-based evidence of current value because of the specialist nature of an asset, depreciated replacement cost (DRC) is used as an estimate of current value. Where non-property assets that have short useful lives or low values (or both), depreciated historical cost basis is used as a proxy for current value – this is commonly used as a basis for valuing vehicles, plant and equipment.
Assets included in the Balance Sheet at current value are revalued sufficiently regularly to ensure that their carrying amount is not materially different from their current value at the year-end, but as a minimum every five years. Increases in valuations are matched by credits to the Revaluation Reserve to recognise unrealised gains. Gains are credited to the Comprehensive Income and Expenditure Statement where they arise from the reversal of a loss previously charged to a service. Where decreases in value are identified, they are accounted for by: • Where there is a balance of revaluation gains for the asset in the Revaluation
Reserve, the carrying amount of the asset is written down against that balance (up to the amount of the accumulated gains)
• Where there is no balance in the Revaluation Reserve or an insufficient balance, the carrying amount of the asset is written down against the relevant service line(s) in the Comprehensive Income and Expenditure Statement.
The Revaluation Reserve contains revaluation gains recognised since 1st April 2007 only, the date of its formal implementation. Gains arising before that date have been consolidated into the Capital Adjustment Account.
24
Impairment Assets are assessed at each year-end as to whether there is any indication that an asset may be impaired. Where indications exist and any possible differences are estimated to be material, the recoverable amount of the asset is estimated and, where this is less than the carrying amount of the asset, an impairment loss is recognised for the shortfall. Where impairment losses are identified, they are accounted for by: • Where there is a balance of revaluation gains for the asset in the Revaluation
Reserve, the carrying amount of the asset is written down against that balance (up to the amount of the accumulated gains)
• Where there is no balance in the Revaluation Reserve or an insufficient balance, the carrying amount of the asset is written down against the relevant service line(s) in the Comprehensive Income and Expenditure Statement.
Where an impairment loss is reversed subsequently, the reversal is credited to the relevant service line(s) in the Comprehensive Income and Expenditure Statement, up to the amount of the original loss, adjusted for depreciation that would have been charged if the loss had not been recognised. Depreciation Depreciation is provided for on all Property, Plant and Equipment assets by the systematic allocation of their depreciable amounts over their useful lives. An exception is made for assets without a determinable finite useful life (i.e. freehold land and certain Community Assets) and assets that are not yet available for use (i.e. assets under construction). Deprecation is calculated on the following bases: • dwellings - equivalent to the Major Repairs Allowance payable by the Government
which has been used as an appropriate proxy for depreciation • other buildings – straight-line allocation over the useful life of the property as
estimated by the valuer • vehicles, plant, furniture and equipment – a percentage of the value of each class
of assets in the Balance Sheet, as advised by a suitably qualified officer. For equipment, over five years
• infrastructure – straight-line allocation over 40 years Revaluation gains are also depreciated, with an amount equal to the difference between current value depreciation charged on assets and the depreciation that would have been chargeable based on their historical cost being transferred each year from the Revaluation Reserve to the Capital Adjustment Account. Where an item of Property, Plant and Equipment asset has major components whose cost is significant in relation to the total cost of the item, the components are depreciated separately if they have a materially different remaining life from the underlying asset. Any assets with a depreciable value below £1 million are not considered material for containing separate components. Separate components will be considered in an asset with a value greater than £1 million if the component has a value of greater than 25% of the asset and the remaining life of the asset is materially different from the underlying asset. Disposals and Non-Current Assets Held for Sale When it becomes probable that the carrying amount of an asset will be recovered principally through a sale transaction rather than through its continuing use, it is reclassified as an Asset Held for Sale. The asset is revalued immediately before reclassification and then carried at the lower of this amount and fair value less costs to sell. Where there is a subsequent decrease to fair value less costs to sell, the loss is posted to the Other Operating Expenditure line in the Comprehensive Income and Expenditure Statement. Gains in fair value are recognised only up to the amount of any previous losses recognised in the Surplus
25
or Deficit on Provision of Services. Depreciation is not charged on Assets Held for Sale. If assets no longer meet the criteria to be classified as Assets Held for Sale, they are reclassified back to long-term assets and valued at the lower of their carrying amount before they were classified as held for sale; adjusted for depreciation, amortisation or revaluations that would have been recognised had they not been classified as Held for Sale, and their recoverable amount at the date of the decision not to sell. Assets that are to be abandoned or scrapped are not reclassified as Assets Held for Sale. When an asset is disposed of or decommissioned, the carrying amount of the asset in the Balance Sheet (whether Property, Plant and Equipment or Assets Held for Sale) is written off to the Other Operating Expenditure line in the Comprehensive Income and Expenditure Statement as part of the gain or loss on disposal. Receipts from disposals (if any) are credited to the same line in the Comprehensive Income and Expenditure Statement also as part of the gain or loss on disposal (i.e. netted off against the carrying value of the asset at the time of disposal). Any revaluation gains accumulated for the asset in the Revaluation Reserve are transferred to the Capital Adjustment Account. Amounts received for a disposal in excess of £10,000 are categorised as capital receipts. A proportion of receipts relating to housing disposals (75% for dwellings, 50% for land and other assets, net of statutory deductions and allowances) is payable to the Government. The balance of receipts is required to be credited to the Capital Receipts Reserve, and can then only be used for new capital investment or set aside to reduce the Council’s underlying need to borrow (the capital financing requirement). Receipts are appropriated to the Reserve from the General Fund Balance in the Movement in Reserves Statement. The written-off value of disposals is not a charge against Council Tax, as the cost of long-term assets is fully provided for under separate arrangements for capital financing. Amounts are appropriated to the Capital Adjustment Account from the General Fund Balance in the Movement in Reserves Statement.
18. Private Finance Initiative (PFI) and Similar Contracts PFI contracts are agreements to receive services, where the responsibility for making available the property, plant and equipment long-term assets needed to provide services passes to the PFI contractor. As the Council is deemed to control the services that are provided under its PFI schemes, and as ownership of the property, plant and equipment will pass to the Council at the end of the contracts for no additional charge, the Council carries the assets used under the contracts on its Balance Sheet as part of Property, Plant and Equipment.The Council is party to two PFI contracts in respect of schools which terminate in 2027 and 2029. The original recognition of these long-term assets at current value (based on the cost to purchase the property, plant and equipment) was balanced by the recognition of a liability for amounts due to the scheme operator to pay for capital investment. Non-current assets recognised on the Balance Sheet are revalued and depreciated in the same way as property, plant and equipment owned by the Council. The amounts payable to the PFI operators each year are analysed into five elements: • fair value of the services received during the year – debited to the relevant service in
the Comprehensive Income and Expenditure Statement • finance cost – an interest charge on the outstanding Balance Sheet liability, debited
to the Financing and Investment Income and Expenditure line in the Comprehensive Income and Expenditure Statement

26
• contingent rent – increases in the amount to be paid for the property arising during the contract, debited to the Financing and Investment Income and Expenditure line in the Comprehensive Income and Expenditure Statement
• payment towards liability – applied to write down the Balance Sheet liability towards the PFI operator (the profile of write-downs is calculated using the same principles as for a finance lease).
• lifecycle replacement costs – recognised as long-term assets on the Balance Sheet if capital in nature
MRP policy for PFI schemes - a minimum revenue provision is charged based on a share of the charge paid within the above contracts - this represents repayment of the contract liability for the long-term assets within the contract. There is also a third PFI contract for the Barkantine Heat and Power scheme. This concession agreement is a user pay arrangement where the end user pays the operator for the combined heat and power (CHP) services rendered. The Council receives a profit share but pays no unitary charge for the service. As the Council does not pay for this scheme, there is no MRP chargeable.The assets of the CHP scheme are included on the council’s balance sheet with a deferred income balance, both of which are written down over the term of the contract.
19. Provisions, Contingent Liabilities and Contingent Assets
a. Provisions
Provisions are made where an event has taken place that gives the Council an obligation that probably requires settlement by a transfer of economic benefits or service potential and a reliable estimate can be made of the amount of the obligation. For instance, if the Council were to be involved in a court case that could eventually result in the making of a settlement or the payment of compensation.
Provisions are charged to the appropriate service revenue account in the year that the Council becomes aware of the obligation, based on the best estimate at the balance sheet date of the expenditure required to settle the obligation, taking into account relevant risks and uncertainties. When payments are eventually made, they are charged to the provision carried in the Balance Sheet. Estimated settlements are reviewed at the end of each financial year. Where it becomes more likely than not that a transfer of economic benefits will not be required (or a lower settlement than anticipated is made), the provision is reversed and credited back to the relevant service account.
Where some or all of the payment required to settle an obligation is expected to be met by another party (e.g. from an insurance claim), this is only recognised as income in the relevant revenue account if it is virtually certain that reimbursement will be received if the Council settles the obligation.
b. Contingent Liabilities A contingent liability arises where an event has taken place that gives the Council a possible obligation whose existence will only be confirmed by the occurrence or otherwise of uncertain future events not wholly within the control of the Council. Contingent liabilities also arise in circumstances where a provision would otherwise be made but either it is not probable that an outflow of resources will be required or the amount of the obligation cannot be measured reliably. Contingent liabilities are not recognised in the Balance Sheet but disclosed in note 45 to the accounts.

27
c. Contingent Assets A contingent asset arises where an event has taken place that gives the Council a possible asset whose existence will only be confirmed by the occurrence or otherwise of uncertain future events not wholly within the control of the Council. Contingent assets are not recognised in the Balance Sheet but disclosed in a note to the accounts where it is probable that there will be an inflow of economic benefits or service potential.
20. Reserves
The Council sets aside specific amounts as reserves for future policy purposes or to cover contingencies. Reserves are created by appropriating amounts out of the General Fund Balance in the Movement of Reserves Statement. When expenditure to be financed from a reserve is incurred it is charged to the relevant service revenue account in that year to score against the Surplus or Deficit on the Provision of Services in the Comprehensive Income and Expenditure Statement. The reserve is then appropriated back into the General Fund Balance statement so that there is no net charge against Council Tax for the expenditure.
Certain reserves are kept to manage the accounting processes for long-term assets, financial instruments, retirement and employment benefits and do not represent usable resources for the Council – these reserves are explained in the relevant policies. The Council treats transfers from the insurance reserve as above the line income to services rather than below the line transfers between reserves. This is a deviation from the Accounting Code of Practice but does not have a material effect on the financial statements.
21. Revenue Expenditure Funded from Capital under Statute (REFCUS)
Expenditure incurred during the year that may be capitalised under statutory provisions but does not result in the creation of long-term assets has been charged as expenditure to the relevant service revenue account in the year. Where the Council has determined to meet the cost of this expenditure from existing capital resources or by borrowing, a transfer in the Movement of Reserves Statement from the General Fund Balance to the Capital Adjustment Account then reverses out the amounts charged so there is no impact on the level of Council Tax.
22. Fair value measurement
The authority measures some of its non-financial assets such as surplus assets and asset held for sale and some of its financial instruments such as equity shareholdings at fair value at each reporting date. Fair value is the price that would be received to sell an asset or paid to transfer a liability in an orderly transaction between market participants at the measurement date. The fair value measurement assumes that the transaction to sell the asset or transfer the liability takes place either:
a) in the principal market for the asset or liability, or
b) in the absence of a principal market, in the most advantageous market for the asset or liability.
The authority measures the fair value of an asset or liability using the assumptions that market participants would use when pricing the asset or liability, assuming that market participants act in their economic best interest.

28
When measuring the fair value of a non-financial asset, the authority takes into account a market participant’s ability to generate economic benefits by using the asset in its highest and best use or by selling it to another market participant that would use the asset in its highest and best use.
The authority uses valuation techniques that are appropriate in the circumstances and for which sufficient data is available, maximising the use of relevant observable inputs and minimising the use of unobservable inputs.
Inputs to the valuation techniques in respect of assets and liabilities for which fair value is measured or disclosed in the authority’s financial statements are categorised within the fair value hierarchy, as follows:
Level 1 – quoted prices (unadjusted) in active markets for identical assets or liabilities that the authority can access at the measurement date
Level 2 – inputs other than quoted prices included within Level 1 that are observable for the asset or liability, either directly or indirectly
Level 3 – unobservable inputs for the asset or liability.
23. Value added Tax (VAT)
VAT payable is included as an expense only to the extent that it is not recoverable from Her Majesty’s Revenue and Customs. VAT receivable is excluded from income. 24. Collection Fund The Council is required by statute to maintain a separate fund for the collection and distribution of amounts due in respect of Council Tax, Business Rate Supplements (BRS) and Non-Domestic Rates (NDR). This account receives income on behalf of the Council, Central Government and its other preceptor the Greater London Authority (GLA). Collection Fund income for the year is the Council’s accrued income for the year and not the amount required to be transferred from the Collection Fund under regulation. The difference between the amount included in the Comprehensive Income and Expenditure Statement and the amount required by regulation to be credited to the General Fund is taken to the Collection Fund Adjustment Account and included within the Movement of Reserves Statement.
The cash collected by the Council from Council Tax, BRS & NDR debtors belongs proportionately to the billing authority, Central Government and the preceptors. This results in a debtor / creditor position between the Council, Central Government and preceptors for the difference between the cash collected from Council Tax, BRS & NDR debtors and the precept paid over during the year. The Balance Sheet includes the Council’s share of Council Tax & NNDR arrears and impairment for bad debts, Council Tax & NDR over payments and prepayments and the debtor/ creditor from the preceptors. The Council’s share of net cash collected from Council Tax & NDR debtors in the year is included within the Cash Flow Statement. The difference between the major preceptors’ share of net cash collected and amounts paid to the precepting authorities is included in the net cash-flows for financing activities. The amount included in the Council’s Balance Sheet is the amount of cash collected from NNDR taxpayers (less the amount retained in respect of a cost of collection allowance) that has not yet been paid to the Central Government & GLA or has been overpaid to the Central Government & GLA on the Balance Sheet date.

3
4
5Current Year Items
6
Pensions Liability - Estimation of the net liability to pay pensions depends on a number of complex judgements relating to the discount rate used, the rate at which salaries are projected to increase, changes in retirement ages, mortality rates and expected returns on pension fund investments. A firm of consulting actuaries is engaged to provide the Council with expert advice about the assumptions to be applied.
The assumptions interact in complex ways. During 2015/16, the Council’s actuaries advised that the net pensions liability had decreased by £133.0 million to £516.6 million mainly as a result of a higher discount factor used to calculate the net present value of future pension payments. The value of the pension fund decreased in value by £12 million in the year due to falling investment values.
If the useful life of assets is reduced, depreciation increases and the carrying amount of the assets falls. It is estimated that the annual depreciation charge for buildings would increase by approximately £1.1 million for every year that useful lives had to be reduced.
Heritage Assets - In valuing material heritage assets, valuations have been obtained from independent Valuers where practicable. Where a value has been given between a certain band, then the mid-point valuation is used. However, because of their unique nature the value of heritage assets is difficult to predict. There is a risk that the value of heritage assets is incorrectly stated, but this would only become apparent if the asset is sold. Most heritage items have been given a nil value in the Accounts as their values are significantly below the materiality threshold - any risk is the assets' value is understated.
NNDR Appeals - There are approximately 6,200 NNDR (Business Rates) appeals that are yet to be heard by the Government's Valuation Tribunal. Of these 3,467 will not result in a reduction in rateable value and 1,936 are considered speculative. Provision has been made for the remaining appeals.
There are no financial post balance sheet events that are not mentioned elsewhere in these Accounts.
Material Items of Income and Expense
Actuarial gain on pension fund - there was a £133.0 million actuarial gain on the pension fund mainly due to an increase in the discount factor used to calculate the net present value of future pension payments.
Events After the Balance Sheet Date
Revaluation of HRA dwellings - The valuation of property, plant and equipment as at 1st April 2015 resulted in an increase in the value of dwellings of £90.4m, of which £40.9m was credited to HRA gross expenditure as a reversal of previous revaluation losses. The remaining £49.5m was credited to the revaluation reserve and is shown as part of other comprehensive income and expenditure.
The Statement of Accounts contains estimated figures that are based on assumptions made by the Council about the future or that are otherwise uncertain. Estimates are made taking into account historical experience, current trends and other relevant factors. However, because balances cannot be determined with certainty, actual results could be materially different from the assumptions and estimates.
The items in the Council's Balance Sheet at 31st March 2016 for which there is a significant risk of material adjustment in the forthcoming financial year are as follows:
Property, Plant and Equipment - Assets are depreciated over useful lives that are dependent on assumptions about the level of repairs and maintenance that will be incurred in relation to individual assets. The current economic climate makes it uncertain that the Council will be able to sustain its current spending on repairs and maintenance, bringing into doubt the useful lives assigned to assets.
Restated Accounting Statements
There were no restated accounting statements.
Assumptions Made About the Future and Other Major Sources of Estimation Uncertainty
Valuations at 1st April 2015 and 31st March 2016 have been used to construct the balance sheet. Valuers have indicated that market values for housing properties have increased by roughly 8.5%, this would equate to £93m. The impact of these increases will be taken into account in a more detailed valuation exercise for the 2016/17 Accounts.
31

7
GE
NE
RA
L F
UN
D
BA
LAN
CE
EA
RM
AR
KE
D G
EN
ER
AL
FU
ND
RE
SE
RV
ES
*
HO
US
ING
RE
VE
NU
E
AC
CO
UN
T B
ALA
NC
E
MA
JOR
RE
PA
IRS
R
ES
ER
VE
CA
PIT
AL
RE
CE
IPT
S
RE
SE
RV
E
CA
PIT
AL
GR
AN
TS
U
NA
PP
LIE
D
TO
TA
L U
SA
BLE
RE
SE
RV
ES
TO
TA
L U
NU
SA
BLE
R
ES
ER
VE
S
TO
TA
L A
UT
HO
RIT
Y
RE
SE
RV
ES
£'000 £'000 £'000 £'000 £'000 £'000 £'000 £'000 £'000
Adjustments involving the Capital Adjustment Accoun t
Reversal of items debited or credited to the Comprehensive I&E
Charges for depreciation and impairment of non current assets 24,159 0 0 15,321 0 0 39,480 (39,480) 0Revaluation losses on PPE (charged to SDPS) 4,717 0 (40,892) 0 0 0 (36,175) 36,175 0
Capital grants and contributions applied (6,097) 0 (9,903) 0 0 (41,073) (57,073) 57,073 0
Revenue expenditure funded from capital under statute 9,533 0 1,365 0 0 0 10,898 (10,898) 0Amounts of non current assets written off on disposal or sale as part of the gain/loss on disposal to the CIES 4 0 23,221 0 0 0 23,225 (23,225) 0
Statutory provision for the financing of capital investment (7,084) 0 (82) 0 0 0 (7,166) 7,166 0
Capital expenditure charged against the General Fund and HRA balances (1,929) 0 (4,671) 0 0 0 (6,600) 6,600 0
Adjustments involving the Capital Receipts ReserveTransfer of sale proceeds credited as part of the gain/loss on disposal to the CIES (82) 0 (36,063) 0 36,145 0 0 0 0
Use of the Capital Receipts Reserve to finance new capital expenditure 0 0 0 0 (841) 0 (841) 841 0
Contribution from the Capital Receipts Reserve to finance the payments to the Government capital receipts pool 1,774 0 0 0 (1,774) 0 0 0 0
Unattached capital receipts (1,897) 0 (1,811) 0 3,708 0 0 0 0
Deferred Capital Receipts 0 0 0 0 9 0 9 (9) 0
Adjustment involving the Major Repairs ReserveUse of the Major Repairs Reserve to finance new capital expenditure 0 0 0 (28,319) 0 0 (28,319) 28,319 0
Amount by which finance costs charged to the CIES are different from finance costs chargeable in the year in accordance with statutory requirements 102 0 182 0 0 0 284 (284) 0
Adjustment involving the Pensions ReserveReversal of items relating to retirement benefits debited or credited to the CIES 60,306 0 4,093 0 0 0 64,399 (64,399) 0
Employer's pensions contributions and direct payments to pensioners payable in the year (42,713) 0 (2,833) 0 0 0 (45,546) 45,546 0
Amount by which council tax credited to the CIES is different from council tax income calculated in accordance with statutory requirements 7,319 0 0 0 0 0 7,319 (7,319) 0
Amount by which amounts charged for Equal Pay claims to the CIES are different from the cost of settlements chargeable in the year in accordance with statutory requirements 0 0 0 0 0 0 0 0 0
Other adjustments include
Adjustments involving the Capital Grants Unapplied AccountCapital grants and contributions unapplied credited to CIES when receivable (25,186) 0 (16,598) 0 0 41,784 0 0 0
Depreciation of non-current asset revaluation gains 0 0 0 0 0 0 0 0 0Revaluation gains written out on disposal 0 0 0 0 0 0 0 0 0
0 0 0 0 0 0 0 0 0
Amount by which officer remuneration charged to the CIES on an accruals basis is different from remuneration chargeable in the year in accordance with statutory requirements (618) 0 0 0 0 0 (618) 618 0
22,308 0 (83,992) (12,998) 37,247 711 (36,724) 36,724 0Total Adjustments
2015/16
Adjustments involving the Unequal Pay Back Pay Adju stment Account
Adjustment between the Capital Adjustment Account a nd the Revaluation Reserve
Adjustments involving the Financial Instruments Adj ustment Account
Adjustments involving the Collection Fund Adjustmen t Account
Transfers from General Fund (as directed by Secreta ry of State)
This note details the adjustments that are made to the total comprehensive income and expenditure recognised by the Council in the year in accordance with proper
Inclusion of items not debited or credited to the Comprehensive
Adjustments involving the Accumulated Absences Acco unt
ADJUSTMENTS BETWEEN ACCOUNTING BASIS AND FUNDING BA SIS UNDER REGULATIONS
USABLE RESERVESUNUSABLE RESERVES
32

7
GE
NE
RA
L F
UN
D
BA
LAN
CE
EA
RM
AR
KE
D G
EN
ER
AL
FU
ND
RE
SE
RV
ES
*
HO
US
ING
RE
VE
NU
E
AC
CO
UN
T B
ALA
NC
E
MA
JOR
RE
PA
IRS
R
ES
ER
VE
CA
PIT
AL
RE
CE
IPT
S
RE
SE
RV
E
CA
PIT
AL
GR
AN
TS
U
NA
PP
LIE
D
TO
TA
L U
SA
BLE
RE
SE
RV
ES
TO
TA
L U
NU
SA
BLE
R
ES
ER
VE
S
TO
TA
L A
UT
HO
RIT
Y
RE
SE
RV
ES
£'000 £'000 £'000 £'000 £'000 £'000 £'000 £'000 £'000
Adjustments involving the Capital Adjustment Accoun t
Reversal of items debited or credited to the Comprehensive I&E
Charges for depreciation and impairment of non current assets 23,632 0 0 15,718 0 0 39,350 (39,350) 0Revaluation losses on PPE (charged to SDPS) 31,911 0 (194,072) 0 0 0 (162,161) 162,161 0
Capital grants and contributions applied (18,748) 0 (1,803) 0 0 (68,134) (88,685) 88,685 0
Movement in the donated assets account 0 0 0 0 0 0 0 0 0
Revenue expenditure funded from capital under statute 16,951 0 4,044 0 0 0 20,995 (20,995) 0Amounts of non current assets written off on disposal or sale as part of the gain/loss on disposal to the CIES 0 0 33,497 0 0 0 33,497 (33,497) 0
Statutory provision for the financing of capital investment (6,881) 0 0 0 0 0 (6,881) 6,881 0Capital expenditure charged against the General Fund and HRA balances (7,720) 0 (8,855) 0 0 0 (16,575) 16,575 0
Adjustments involving the Capital Receipts ReserveTransfer of sale proceeds credited as part of the gain/loss on disposal to the CIES 0 0 (34,814) 0 34,814 0 0 0 0Use of the Capital Receipts Reserve to finance new capital expenditure 0 0 0 0 (8,549) 0 (8,549) 8,549 0Contribution from the Capital Receipts Reserve to finance the payments to the Government capital receipts pool 1,572 0 0 0 (1,572) 0 0 0 0Unattached capital receipts (681) 0 (2,778) 0 3,459 0 0 0 0Deferred Capital Receipts 0 0 0 0 36 0 36 (36) 0
Adjustment involving the Major Repairs ReserveUse of the Major Repairs Reserve to finance new capital expenditure 0 0 0 (9,940) 0 0 (9,940) 9,940 0
0
Amount by which finance costs charged to the CIES are different from finance costs chargeable in the year in accordance with statutory requirements 102 0 182 0 0 0 284 (284) 0
Adjustment involving the Pensions ReserveReversal of items relating to retirement benefits debited or credited to the CIES 55,603 0 1,296 0 0 0 56,899 (56,899) 0Employer's pensions contributions and direct payments to pensioners payable in the year (39,814) (2,533) 0 0 0 (42,347) 42,347 0
Amount by which council tax credited to the CIES is different from council tax income calculated in accordance with statutory requirements (7,280) 0 0 0 0 0 (7,280) 7,280 0
Amount by which amounts charged for Equal Pay claims to the CIES are different from the cost of settlements chargeable in the year in accordance with statutory 0 0 0 0 0 0 0 0 0
Other adjustments includeAdjustments involving the Capital Grants Unapplied Account
Capital grants and contributions unapplied credited to CIES when receivable (19,697) 0 (49,384) 0 0 69,081 0 0 0
Depreciation of non-current asset revaluation gains 0 0 0 0 0 0 0 0 0Revaluation gains written out on disposal 0 0 0 0 0 0 0 0 0
Amount by which officer remuneration charged to the CIES on an accruals basis is different from remuneration chargeable in the year in accordance with statutory requirements (439) 0 0 0 0 0 (439) 439 0
28,511 0 (255,220) 5,778 28,188 947 (191,796) 191,796 0
Adjustments involving the Accumulated Absences Acco unt
Total Adjustments
ADJUSTMENTS BETWEEN ACCOUNTING BASIS AND FUNDING BA SIS UNDER REGULATIONS
2014/15
Inclusion of items not debited or credited to the Comprehensive
Adjustments involving the Financial Instruments Adj ustment
Adjustments involving the Collection Fund Adjustmen t Account
Adjustments involving the Unequal Pay Back Pay Adju stment
Adjustment between the Capital Adjustment Account a nd the
Transfers from General Fund (as directed by Secreta ry of State)
USABLE RESERVESUNUSABLE RESERVES
33

8
BALANCE AT 1 APRIL 2014
£'000
TRANSFERS OUT 2014/15
£'000
TRANSFE-RS IN 2014/15 £'000
BALANCE AT 31 MARCH
2015 £'000
TRANSFERS OUT 2015/16
£'000
TRANSFERS IN 2015/16 £'000
BALANCE AT 31 MARCH
2016 £'000
GENERAL FUNDGeneral Fund Reserve 64,989 0 6,467 71,456 0 644 72,100
EARMARKED RESERVES
Corporate1 Improvement & Transformation 12,493 (927) 5,351 16,917 (1,936) 9,047 24,0282 Severance 11,000 0 4,000 15,000 (4,152) 1,152 12,0003 Finance Systems 2,510 0 0 2,510 0 0 2,5104 ICT Refresh 1,855 (676) 370 1,549 (218) 0 1,3315 Olympic Legacy Schemes 651 0 0 651 (651) 0 06 Education Grant Reduction 2,093 (760) 0 1,333 0 1,110 2,4437 Employment and other Corporate Initiatives 14,464 (3,366) 2,747 13,845 (4,471) 3,859 13,2338 Other 3,464 0 70 3,534 (2,334) 0 1,200
Service Specific9 Homelessness 2,575 (361) 0 2,214 (559) 0 1,65510 Parking Control 913 0 1,006 1,919 0 1,376 3,29511 Development & Renewal Other 2,865 (100) 1,789 4,554 (113) 1,440 5,88112 Communities, Localities & Culture 1,216 (88) 709 1,837 (190) 1,013 2,66013 Children, Schools & Families 1,595 (402) 988 2,181 (1,610) 667 1,23814 Adults, Health & Wellbeing 800 0 1,138 1,938 (328) 1,092 2,70215 Chief Executives & Resources 564 0 0 564 0 60 624
Revenue Reserves - Other16 Insurance 20,911 (582) 2,736 23,065 (1,005) 0 22,06017 Schools Balances 34,724 (2,148) 3,412 35,988 (4,177) 0 31,81118 CSF - Early Intervention 2,316 0 146 2,462 (2,244) 0 21819 Housing Revenue Account (HRA) 17,153 (1) 2,993 20,145 1,000 10,947 32,09220 Housing Revenue Account - Future Housing Supply 1,000 0 0 1,000 (1,000) 0 0
Capital Reserves21 Capital Programme (General Fund) 24,795 (7,800) 7,593 24,588 (288) 651 24,951
Earmarked Reserve Total 159,957 (17,211) 35,048 177,794 (24,276) 32,414 185,932(42,924) 117,033 4,964 (7,766) 122,140
Total Usable Reserve Total 224,946 (17,211) 41,515 249,250 (24,276) 33,058 258,032
Corporate Reserves1
2
3 & 4
5
6
7
8
9
10
11-15
16
17 Reserves held by schools under the scheme of delegation.
18 Reserve created from grant for Children, School & Families early intervention schemes.
19
20
Capital Reserves21
An earmarked HRA reserve to fund housing projects.
Reserves to support the financing of the capital programme.
Reserves held for service specific initiatives.
TRANSFERS TO / FROM EARMARKED RESERVES
This note sets out the amounts set aside from the General Fund and HRA balances in earmarked reserves to provide financing for future expenditure plans and the amounts
The Council is self insured for most liability and property risks below £1 million. The level of the reserve is reviewed annually and where appropriate an amount transferred to the Insurance Provision.
Reserve created to support the delivery of the Council's transformation programme.
Service Specific Reserves
The reserve balance on the ring-fenced Housing Revenue Account to be used for the provision of social housing in the Borough.
Reserve for potential severance / redundancy payments.
Reserve to support the planned investment in Council's finance systems.
Reserve created from grant income to support initiatives related to the Olympics programme.
Reserve to mitigate the impact of reductions to education improvement grant funding.
Revenue Reserves - Other
A reserve to mitigate the impact of the increased cost of dealing with homelessness.
Reserve for employment, business support and corporate initiatives.
Other reserves for community based initiatives.
Reserve to finance highways and transport related improvements.
34

9
2014/15 2015/16£'000 Note £'000
Levies236 - Lee Valley Regional Park Authority 237173 - Environment Agency 180
1,261 - London Pensions Fund Authority 1,2861,670 Total Levies 1,7031,572 Payments to Housing Capital Receipts Pool 1,774
(1,316) Net (gain)/loss on disposal of non-current assets (12,919)(3,459) Unattached capital receipts (3,708)(1,533) Total (13,150)
10
2014/15 2015/16£'000 £'000
9,745 Interest payable and similar charges 9,76121,175 Pensions interest cost and expected return on pensions assets 20,509(2,254) Interest receivable and similar income 15 (3,131)
(6) Surplus or deficit of trading operations 29 (356)28,660 Total 26,783
11
2014/15 2015/16£'000 £'000(67,576) Council Tax income (71,793)
(108,528) Non domestic rates (112,493)(146,321) Non-ringfenced Government grants 37 (111,500)(82,818) Capital grants and contributions 37 (48,976)
(405,243) Total (344,762)
Financing and Investment Income and Expenditure
Taxation and Non Specific Grant Income
Other Operating Expenditure
35

12
COUNCIL DWELLINGS
OTHER LAND AND
BUILDINGS
VEHICLES, PLANT, FURNITURE & EQUIPMENT
INFRA- STRUCTURE
ASSETS
COMMUNITY ASSETS
SURPLUS ASSETS
ASSETS UNDER CONSTRUCTION
TOTAL PROPERTY, PLANT AND EQUIPMENT
PFI ASSETS INCLUDED IN PROPERTY, PLANT AND EQUIPMENT
£'000 £'000 £'000 £'000 £'000 £'000 £'000 £'000 £'000Cost or Valuation
At 1 April 2015 1,125,613 958,446 24,176 149,030 53,577 24,873 2,840 2,338,555 278,021Additions 60,244 11,802 252 4,773 253 7 10,741 88,072 6,302
Revaluation increases/(decreases) recognised in the Revaluation Reserve 35,852 2,046 0 0 0 5,896 0 43,794 (176)Revaluation Increases/(decreases) recognised in the Surplus/Deficit on the provision of services 40,892 980 0 0 0 (4,322) 0 37,550 (29)Derecognition - Disposals (22,213) (440) 0 0 0 0 0 (22,653) 0Derecognition - Other 0 (418) 0 0 0 0 0 (418) 0Assets Reclassified (to)/from Held for Sale 0 (223) 0 0 0 (14,029) 0 (14,252) 0
Other Reclassification of Assets4,006 (651) 0 0 61 (540) (2,876)
0(33,493)
At 31 March 2016 1,244,394 971,542 24,428 153,803 53,891 11,885 10,705 2,470,648 250,625
Accumulated Depreciation and ImpairmentAt 1 April 2015 152,134 80,036 20,177 42,619 0 966 0 295,932 14,424Depreciation charge 13,753 21,222 944 3,601 0 157 0 39,677 5,971Depreciation written out to the Revaluation Reserve (13,635) (6,060) 0 0 0 (1,214) 0
(20,909)(134)
Derecognition - Disposals (289) 0 0 0 0 0 0 (289) 0Derecognition - Other 0 0 0 0 0 0 0 0 0Assets reclassified (to)/from Held for Sale 0 (3) 0 0 0 (335) 0 (338) 0
Other Reclassification of Assets 0 (5) 0 0 5 0 0 0 (3,011)At 31 March 2016 151,963 95,190 21,121 46,220 5 (426) 0 314 ,073 17,250
Net Book ValueAt 31 March 2016 1,092,431 876,352 3,307 107,583 53,886 1 2,311 10,705 2,156,575 233,375At 31 March 2015 973,479 878,410 3,999 106,411 53,577 23, 907 2,840 2,042,623 263,597
PROPERTY, PLANT AND EQUIPMENT
MOVEMENTS IN 2015/16
36

12
COUNCIL DWELLINGS
OTHER LAND AND BUILDINGS
VEHICLES, PLANT, FURNITURE & EQUIPMENT
INFRASTRUCTURE ASSETS
COMMUNITY ASSETS
SURPLUS ASSETS
ASSETS UNDER CONSTRUCTION
TOTAL PROPERTY, PLANT AND EQUIPMENT
PFI ASSETS INCLUDED IN PROPERTY, PLANT AND EQUIPMENT
£'000 £'000 £'000 £'000 £'000 £'000 £'000 £'000 £'000Cost or Valuation
At 1 April 2014 905,913 974,232 23,414 143,975 49,677 24,588 0 2,121,799 270,854Additions 69,969 32,881 762 5,055 3,900 285 2,840 115,692 7,167
Revaluation increases/(decreases) recognised in the Revaluation Reserve (10,338) (16,748) 0 0 0 0 0 (27,086) 0Revaluation Increases/(decreases) recognised in the Surplus/Deficit on the provision of services 194,071 (31,919) 0 0 0 0 0 162,152 0Derecognition - Disposals (34,002) 0 0 0 0 0 0 (34,002) 0Derecognition - Other 0 0 0 0 0 0 0 0 0Assets Reclassified (to)/from Held for Sale 0 0 0 0 0 0 0
00
Other Reclassification of Assets 0 0 0 0 0 0 0 0 0At 31 March 2015 1,125,613 958,446 24,176 149,030 53,577 24,873 2,840 2,338,555 278,021
Accumulated Depreciation and ImpairmentAt 1 April 2014 152,733 71,326 19,106 38,976 0 359 0 282,500 6,722Depreciation charge 14,141 20,086 1,071 3,643 0 607 0 39,548 7,702Depreciation written out to the Revaluation Reserve (14,234) (11,376) 0 0 0 0 0 (25,610) 0Derecognition - Disposals (506) 0 0 0 0 0 0 (506) 0Derecognition - Other 0 0 0 0 0 0 0 0 0Assets reclassified (to)/from Held for Sale 0 0 0 0 0 0 0
00
Other Reclassification of Assets 0 0 0 0 0 0 0 0 0At 31 March 2015 152,134 80,036 20,177 42,619 0 966 0 295,932 14,424
Net Book ValueAt 31 March 2015 973,479 878,410 3,999 106,411 53,577 23,907 2,840 2,042,623 263,597At 31 March 2014 753,180 902,906 4,308 104,999 49,677 24,229 0 1,839,299 264,132
PROPERTY, PLANT AND EQUIPMENT (continued)
COMPARATIVE MOVEMENTS IN 2014/15
37

12
Depreciation
Capital Commitments
Committed Costs to 2016/17 Contractsum 31/3/2016 onwards End Date£m £m £m
Decent Homes Contract 175.000 119.394 55.606 31/03/2017Watts Grove - GLA Pipeline 23.897 8.802 15.095 10/03/2017Olga Primary School Expansion 10.472 6.586 3.886 25/08/2017St Paul's Way Trust School 11.379 3.780 7.599 24/08/2018
TOTAL 220.748 138.562 82.186
Revaluations
COUNCIL DWELLINGS
OTHER LAND AND BUILDINGS
VEHICLES, PLANT, FURNITURE & EQUIPMENT
INFRASTRUCT-URE ASSETS
COMMUNITY ASSETS
SURPLUS ASSETS
ASSETS UNDER CONSTRUCTION
TOTAL PROPERTY, PLANT AND EQUIPMENT
£'000 £'000 £'000 £'000 £'000 £'000 £'000 £'000Valued at historic cost - 9,558 3,307 107,583 53,886 - 10,705 185,039 Valued at current value in:
2015/16 1,092,431 51,625 - - - 12,311 - 1,156,367 2014/15 - 75,128 - - - - - 75,128 2013/14 - 94,952 - - - - - 94,952 2012/13 - 622,104 - - - - - 622,104 2011/12 - 22,985 - - - - - 22,985
Value at 31 March 2016 1,092,431 876,352 3,307 107,583 53,886 12,311 10,705 2,156,575
13Balance at 1st April
2014 AdvancesIncome and Adjustments
Balance at 31st March 2015 Advances
Income and Adjustments
Balance at 31st March 2016
£'000 £'000 £'000 £'000 £'000 £'000 £'000
Mortgages on Right to Buy properties 61 4 (37) 28 11 (10) 29Sundry Loans 529 183 (127) 585 83 (125) 543
590 187 (164) 613 94 (135) 572
14
PROPERTY, PLANT AND EQUIPMENT (continued)
The following useful lives and depreciation rates have been used in the calculation of depreciation:- Council Dwellings – As a method of depreciation, the council has used the Major Repairs Allowance (MRA) to adjust the value of the housing stock to reflect the effects of use, deterioration and obsolescence. In 2015/16, the council compared the MRA figure to a depreciation figure calculated based on figures from a qualified valuer to ensure the depreciation charge to the HRA was adequate to finance the HRA’s long-term financial plan.- Other Land and Buildings – As advised by qualified valuer- Vehicles, Plant & Equipment - 5 years on a straight line basis - Infrastructure assets - 40 years
ANALYSIS OF ROLLING REVALUATION PROGRAMME
INTANGIBLE ASSETS
In 2015/16, the housing stock and the non-dwellings assets were valued by Wilks Head and Eve. Valuations of land and buildings were carried out in accordance with themethodologies and bases for estimation set out in the professional standards of the Royal Institution of Chartered Surveyors. The valuation of council dwellings is in accordancewith guidelines produced by Communities and Local Government in the 'Stock Valuation for Resource Accounting: Guidance for Valuers 2010'.
All surplus assets and assets held for sale are valued at fair value under IFRS 13. These have been categorised by the valuers as being within level 2 of the fair value hierarchy, which are based on observable inputs such as market rents and recent sales of similar properties. Further details of fair value can be found within the accounting policies.
The Council accounts for its software as intangible assets, to the extent that the software is not an integral part of a particular IT system and accounted for as part of the hardware item of Property, Plant and Equipment. The intangible assets include only purchased licences, not internally generated software. Since the provision of IT services transferred to the Council's partner organisation on 1st May 2012 there have been no intangible asset transactions.
The Council had contractually binding capital commitments, in respect of schemes costing in excess of £1 million, totalling £82.186 million at 31st March 2016 (£98.525 million at 31st March 2015).
The Council carries out a rolling programme that ensures that all Property, Plant and Equipment required to be measured at fair value is revalued at least every five years.Valuations are as at 1st April in the year of valuation. In 2015/16, school assets were also subject to a desktop valuation as at 31st March 2016. A summary of total valuation perasset category is shown below.
LONG TERM DEBTORS
38

15 FINANCIAL INSTRUMENT NOTES
1
2
31 March 31 March 31 March 31 March 31 March 31 March2015 2016 2015 2016 2015 2016£'000 £'000 £'000 £'000 £'000 £'000
Financial LiabilitiesBorrowings at amortised cost 88,528 85,936 746 2,267 89,274 88,203Deferred Liabilities (PFI and Finance Leases) 37,509 42,040 964 1,377 38,473 43,417
0 0 71,728 49,681 71,728 49,681Total Liabilities 126,037 127,976 73,438 53,325 199,475 181,301Financial AssetsLoans and receivables 0 0 215,748 291,589 215,748 291,589
0 0 25,655 25,560 25,655 25,560Cash held at bank and cash equivalents 0 0 202,357 160,712 202,357 160,712Total Financial Assets 0 0 443,760 477,861 443,760 477,861
NOTES
Compliance
6. The above long term figures are based on paragraph B9, Module 7 of the 2015/16 code of practice guidance notes which states an
Local authorities are required to comply with the requirements of the Code of Practice on Local Authority Accounting in the United Kingdom, issued by the Chartered Institute of Public Finance and Accountancy / LASAAC Joint Committee. This requires the disclosure of financial instruments at amortised cost and fair value.
These accounting standards have meant that most financial instruments (whether borrowing or investment) have to be valued on an amortised cost basis using the effective interest rate (EIR) method.
In these disclosure notes, financial instruments are also required to be shown at fair value. Fair value is defined as the amount for which an asset could be exchanged or a liability settled, assuming that the transaction was negotiated between parties knowledgeable about the market in which they are dealing and willing to buy/sell at an appropriate price, with no other motive in their negotiations other than to secure a fair price.
The Council has:
Adopted the CIPFA‘s Treasury Management in the Public Services: Code of Practice.
Set treasury management indicators to control key financial instrument risks in accordance with CIPFA’s Prudential Code.
Types of Financial Instruments
Amortised Cost
Fair Value
Long-Term
Debtors - financial assets carried at contract amounts
7. In addition to the above financial liabilities, the Council has contingent liabilities for warranties provided to landlords. Details are outlined in note 30 to the accounts. The Council has also provided an assurance that it will meet the pension liabilities of Tower Hamlets Homes in the event the ALMO is unable to fund the liabilities arising from its pension obligations.
Creditors - Financial Liabilities carried at contract amount
3. The Authority's investment portfolio consists of fixed term deposits, callable deposits, collar deposits, certificates of deposits, call accounts and money market funds.
Current Total
1. Market loans (LOBOs) of £77.5 million have been included in long term borrowing.
Financial Instrument Categories
4. The terms of the collar deposits, referenced to 3 month LIBOR are: £5m from 10.01.2014 - 09.01.2017, with a floor of 1.74% and a cap of 2.50%; £5m from 20.03.2014 - 20.03.16, with a floor of 1.25% and a cap of 1.80%.
5. Balances in the money market funds at 31 March 2016 are shown under 'cash and cash equivalent' in the balance sheet. Cash equivalents are highly liquid deposits which are readily convertible into cash at short notice. They include £89.8 million (£165.9 million as at 31st March 2015) of short-term deposits with banks and building societies excluded from loans and receivables.
2. Included in loans and receivables is £25m of deposits due to be settled within 1 and 3 years as at 31 March 2016.
39

16 FINANCIAL INSTRUMENTS (continued)
Gains and Losses on Financial Instruments
Financial Liabilities measured at
amortised cost
Financial Assets Loans
and receivables
Financial Liabilities
measured at amortised cost
Financial Assets Loans and receivables
£'000 £'000 £'000 £'000
Interest expense 9,745 0 9,761 0Interest income 0 2,254 0 3,131TOTAL INTEREST AND INVESTMENT INCOME 9,745 2,254 9,761 3,131
31 March 2015 31 March 2015 31 March 2016 31 March 2016
Carrying amount Fair valueCarrying amount Fair value
£'000 £'000 £'000 £'00011,455 14,598 10,375 13,019
Lender's option, borrower's option loans 77,818 100,297 77,828 132,81438,473 38,473 43,417 43,41771,728 71,728 49,681 49,681
199,474 225,096 181,301 238,931
31 March 2015 31 March 2015 31 March 2016 31 March 2016
Carrying amount Fair valueCarrying amount Fair value
£'000 £'000 £'000 £'000Fixed term deposits with banks and building societies 215,741 215,945 291,589 318,842Equity Shares (not quoted in an active market) 7 7 7 7
21,615 21,615 19,651 19,651Cash held at Bank 67,188 67,188 68,398 68,398Cash equivalents (deposits with banks and other financial institutions) 135,169 135,129 92,314 89,824
439,720 439,884 471,959 496,722
The gains and losses recognised in the Income and Expenditure Account in relation to financial instruments are made up as follows:
2014/15 2015/16
The fair value of an instrument is determined by calculating the Net Present Value (NPV) of future cash flows, which provides an estimate of the value of payments in the future in today's terms.
The discount rate used in the NPV calculation is the rate applicable in the market on the date of valuation for an instrument with the same structure, terms and remaining duration. For debt, this will be the new borrowing rate since premature repayment rates include a margin which represents the lender's profit as a result of rescheduling the loan; this is not included in the fair value calculation since any motivation other than securing a fair price should be ignored. The rates quoted in this valuation were obtained by the Council's treasury management consultants from the market on 31st March, using bid prices where applicable.
The fair value of each class of financial assets and liabilities which are carried in the balance sheet at amortised cost is disclosed below:
Methods and Assumptions in valuation technique
• Fair values for all instruments in the portfolio have been calculated, but only those which are materially different from the carrying value are disclosed.
The calculations are made with the following assumptions:
• The fair value of trade and other receivables is taken to be the invoiced or billed amount.
• The PWLB liabilities have been calculated by reference to the "Premature Redemption" set of rates in force on the 31st March 2016. • For other market debt and investments the discount rate used is the rate available for an instrument with the same terms from a comparable lender. • Interpolation techniques have been used between available rates where the exact maturity period was not available. • No early repayment or impairment is recognised.
The fair value is higher than the carrying amount because the Council's portfolio of investments includes a number of fixed rate loans where the interest rate receivable is higher than the rates available for similar loans at the Balance Sheet date.
Public Works Loans Board
The fair values are as follows:
The commitment to pay interest below current market rates reduces the amount that the Council would have to pay if the lender requested or agreed to early repayment of the loans. Fair value is more than the carrying amount because the Council’s portfolio of loans includes a number of fixed rate loans where the interest rate payable is higher than the rates available for similar loans at the Balance Sheet date.
Fair Value of Liabilities Carried at Amortised Cost
Deferred liabilities - (PFI/Finance Leases)
Fair Value of Assets Carried at Amortised Cost
Creditors - Financial Liabilities carried at contract amount
Debtors - financial assets carried at contract amounts
Financial Assets
Financial Liabilities
40

15 FINANCIAL INSTRUMENTS (continued)
1. Credit Risk
Amounts at 31 March
2015Historical experience
of default
Historical experience
adjusted for market conditions as at 31
March 2015
Estimated maximum
exposure to default and non-
collection£'000 % % £'000
Cash & cash equivalents deposits 102,207 0% 0% 0%Money Market Funds 100,150 0% 0% 0%
1 - 3 months 0 0% 0% 0%3 - 6 months 60,091 0% 0% 0%6 - 12 months 145,621 0% 0% 0%Over 12 months 10,029 0% 0% 0%TOTAL 418,098 0% 0% 0%
Amounts at 31 March
2016Historical experience
of default
Historical experience
adjusted for market conditions as at 31
March 2016
Estimated maximum
exposure to default and non-
collection£'000 % % £'000
Cash & cash equivalents deposits 97,888 0% 0% 0%Money Market Funds 62,824 0% 0% 0%
1 - 3 months 27,001 0% 0% 0%3 - 6 months 50,142 0% 0% 0%6 - 12 months 135,729 0% 0% 0%Over 12 months 105,718 0% 0% 0%TOTAL 479,302 0% 0% 0%
The Council does not generally allow credit for customers, such that £3.7 million of the £64 million balance (2014/15 - £6.0 million of the £79.7 million) is past its due date for payment, but not impaired. The past due amount can be analysed by age as follows:
Nature and extent of risks arising from Financial I nstruments
Credit risk is the possibility that other parties may not pay amounts due to the Council. This risk arises from the short-term lendingof surplus funds to banks, building societies and other local authorities as well as credit exposures to the Council’s customers. TheCouncil invests primarily on the basis of prudence and then the level of returns. It is the policy of the Council to place deposits onlywith a limited number of high quality banks and building societies whose credit rating is independently assessed as sufficientlysecure by the Council’s treasury advisers and to restrict lending to a prudent maximum amount for each institution or thoseunderwritten by the Government. The Council has a policy of limiting deposits with institutions to a maximum of £10 million forfinancial institutions and £70 million for government backed borrowing, in any one transaction. The authority's minimum creditrating criteria is as detailed in the Treasury Management Strategy.
The following maturity profile summarises the Council’s potential maximum exposure to credit risk, based on past experience andcurrent market conditions. No credit limits were exceeded during the financial year and the Council expects full repayment on thedue date of deposits placed with its counterparties.
No credit limits were exceeded during the reporting period and the Council does not expect any losses from non-performance byany of its counterparties in relation to deposits and bonds.
The Council’s management of treasury risks actively works to minimise the Council’s exposure to the unpredictability of financial markets and to protect the financial resources available to fund services. Risk management is carried out by a central treasury team under policies approved by the Council in the annual treasury management strategy report. The Council has fully adopted and implemented CIPFA’s Code of Treasury Management Practices and has written principles for overall risk management as well as written policies and procedures covering specific areas such as credit risk, liquidity risk and market risk. The treasury management team have also fully implemented the Government's national investment guidance.
Fixed term deposits with banks and other financial institutions:
Fixed term deposits with banks and other financial institutions:
41

15 FINANCIAL INSTRUMENTS (continued)
Credit Risk31 March
201531 March
2016£'000 £'000
Three to six months 1,191 570Six months to one year 1,496 626More than one year 3,334 2,553
TOTAL 6,021 3,749
2. Liquidity Risk
The maturity structure of financial liabilities is as follows (at nominal value):
Loans outstanding31 March
201531 March
2016£'000 £'000
11,455 10,375
77,818 77,828
PFI / Finance Leases 38,473 43,417TOTAL 127,746 131,620
1,710 3,643
3,094 3,157
9,590 8,885
19,580 27,354
93,772 88,581TOTAL 127,746 131,620
3. Market RiskInterest rate risk
The current interest rate risk for the Council is summarised below:
Between 1 and 2 years
Nature and extent of risks arising from Financial I nstruments (Continued)
Public Works Loans Board
Market debt
Less than 1 year
The Council has access to a facility to borrow from the Public Works Loans Board. As a result there is nosignificant risk that the Council will be unable to raise finance to meets its commitments under financialinstruments. The Council has safeguards in place to ensure that a significant proportion of its borrowing does notmature for repayment at any one time in the future to reduce the financial impact of re-borrowing at a time ofunfavourable interest rates. The Council’s policy is to ensure that not more than 20% of loans are due to maturewithin any financial year through a combination of prudent planning of new loans taken out and, where it iseconomic to do so, making early repayments.
The Council has a number of strategies for managing interest rate risk. The policy is to keep variable rateborrowings to a minimum. During periods of falling interest rates, and where economic circumstances make itfavourable, fixed rate loans will be repaid early to limit exposure to losses.
Between 2 and 5 years
Between 5 and 10 years
More than 10 years
In the more than 10 years category, there are £77.5 million of Lender's Option, Borrower's Option (LOBO) marketloans, of which £17.5 million have call dates in the less than one year category. The Council uses money marketfunds to provide liquidity.
• The fair value of fixed rate financial liabilities will rise if interest rates fall. This will not impact on the BalanceSheet for the majority of liabilities held at amortised cost, but will impact on the disclosure note for fair value.
The Council is exposed to interest rate risk in two different ways - the uncertainty of interest paid/received onvariable rate instruments and the effect of fluctuations in interest rates on the fair value of an instrument.
• Decreases in interest rates will affect interest earned on variable rate investments, potentially reducing incomecredited to the Comprehensive Income and Expenditure Account.
• Increases in interest rates will affect interest paid on variable rate borrowings, potentially increasing interestexpense charged to the Comprehensive Income and Expenditure Account.
• The fair value of fixed rate financial assets will fall if interest rates rise. This will not impact on the BalanceSheet for the majority of assets held at amortised cost, but will impact on the disclosure note for fair value. Itwould have a negative effect on the Balance Sheet for those assets held at fair value in the Balance Sheet, whichwould also be reflected in the Movement in Reserves Statement.
42

15 FINANCIAL INSTRUMENTS (continued)
2014/15 2015/16£'000 £'000
Increase in interest payable on variable rate borrowings 775 645Increase in interest receivable on variable rate investments (3,909) (3,000)
(3,134) (2,355)
2014/15 2015/16£'000 £'000
Decrease in fair value of fixed rate investments 956 508Decrease in fair value of fixed rate borrowing liabilities 3,993 1,458
4,949 1,966The impact of a 1% fall in interest rates would be as above but with the movements being reversed.
2014/15 2015/16£'000 £'000
The Tower Hamlets Local Education Partnership 7 7Total 7 7
16
17
Paragraph 4.7.4.2(1) of the Code requires disclosure by class of assets of the amounts for impairment losses and impairment reversals charged to the Surplus or Deficit on the Provision of Services and to Other Comprehensive Income and Expenditure. These disclosures are consolidated in note 12 reconciling the movement over the year in the Property, Plant and Equipment and Intangible Asset balances. An impairment review was carried out by qualified valuers at 31st March 2016 and concluded that there was no significant impairment to report.
The Council does not have any construction contracts (work in progress) where the construction work is undertaken for the Council's customers.
IMPAIRMENT LOSSES
Impact on Income and Expenditure Account
CONSTRUCTION CONTRACTS
Fair Value Movements
Nature and extent of risks arising from Financial I nstruments (Continued)
Impact on Income and Expenditure Account
The treasury management strategy assesses interest rate exposure - this feeds into the setting of the annual budget.
According to this assessment, at 31st March 2016, if interest rates had been 1% higher with all other variables heldconstant, the financial effect would be :
Interest Rate Risk
Equity Shares (not quoted on an active market)
43

18 HERITAGE ASSETS
Balance at 31st March 2014
2014/15 Acquisitions
2014/15 Disposals
2014/15 Revaluation
Balance at 31st March 2015
2014/15 Acquisitions
2014/15 Disposals
2014/15 Revaluation
Balance at 31st March 2016
£'000 £'000 £'000 £'000 £'000 £'000 £'000 £'000 £'000
(a) 8,910 0 0 0 8,910 0 0 0 8,910(b) 389 0 0 0 389 0 0 0 389(c) 0 0 0 0 0 0 0 0 0(d) 11 0 0 0 11 0 0 0 11
9,310 0 0 0 9,310 0 0 0 9,310
(a)
(b)
(c)
(d)
The Council holds a number of heritage assets. These include civic regalia, works of art across the borough and collections at Tower Hamlets Local History Library and Archive (Bancroft Library). These are held as part of increasing the knowledge and understanding of the area's history.
Value of Heritage Assets held by Council- Works of art- Civic Regalia- Local History Library and Archive Collections
The Council has held these heritage assets for a number of years pre-dating 2010. These assets are held at an estimate of current value on the balance sheet, except for the local history collection which is not included on the balance sheet as valuations are not available due to the unique nature of the assets. The council has a materiality threshold of £50,000 per asset. There are only four heritage assets above this threshold - civic regalia, two sculptures and one painting. The council has held these assets for a number of years. It was not practicable or cost effective to obtain valuations prior to 2010.
It is assumed that these material heritage assets have an indefinite lifespan, therefore depreciation is not charged on these assets. If evidence was received that required the value of the heritage assets to be impaired, this reduction would be charged to the revaluation reserve. The Council does not have any heritage assets buildings.
The council is considering a number of options relating to the future of one of the statues including the possibility of sale.
- Public Art (Middlesex Street)
A new capital scheme started in 2012/13 to create a piece of public art funded by section 106 contributions from developments in the area. The agreed budget for the scheme is £250k and is not yet completed. The asset is shown at historical cost, which is 2012/13 expenditure.
These comprise the Mayor's chain and other civic regalia. These were valued by the auctioneers Bonhams in January 2012.
Tower Hamlets Local History Library & Archives holds an extensive and unique collection of books, pamphlets, maps, photographs, press cuttings and ephemera, deeds, archives, audio-visual material, oral histories and sound recordings, digital records, and a range of other sources, all of which reflect and provide evidence of the history of the borough. It was not considered appropriate or practicable to place a value on these items due to their unique nature. It is highly unlikely that any of these assets would ever be sold as the council has a legal obligation to maintain its archives.
These collections are preserved and made publicly available at the library on Bancroft Road and increasingly through the web and a range of exhibitions and outreach projects. The library & archives continues to proactively collect resources which illustrate and provide evidence of the activities and experiences of residents, organisations and businesses active in the borough, including the local authority.
The council also has a collection of 75 other paintings which are held at the local history library. These paintings are of local scenes and past local dignitaries so intrinsic value is in local interest rather than realisable value.
TOTAL HERITAGE ASSETS
The council holds a number of works of art. The council has three works of art with a material value - the council has received indications of value on these assets from art experts at auction houses.
There are 109 works of art across the borough for which the council has a duty of care. These include sculptures, statues, murals, memorials and other works. The
majority of these reflect the history of the borough. It was not cost effective to obtain formal valuations for these immaterial items, however public data is available of
sale proceeds of similar works by the same artists - none of these values are considered material. The estimated value of these assets has not changed since 2010.
44
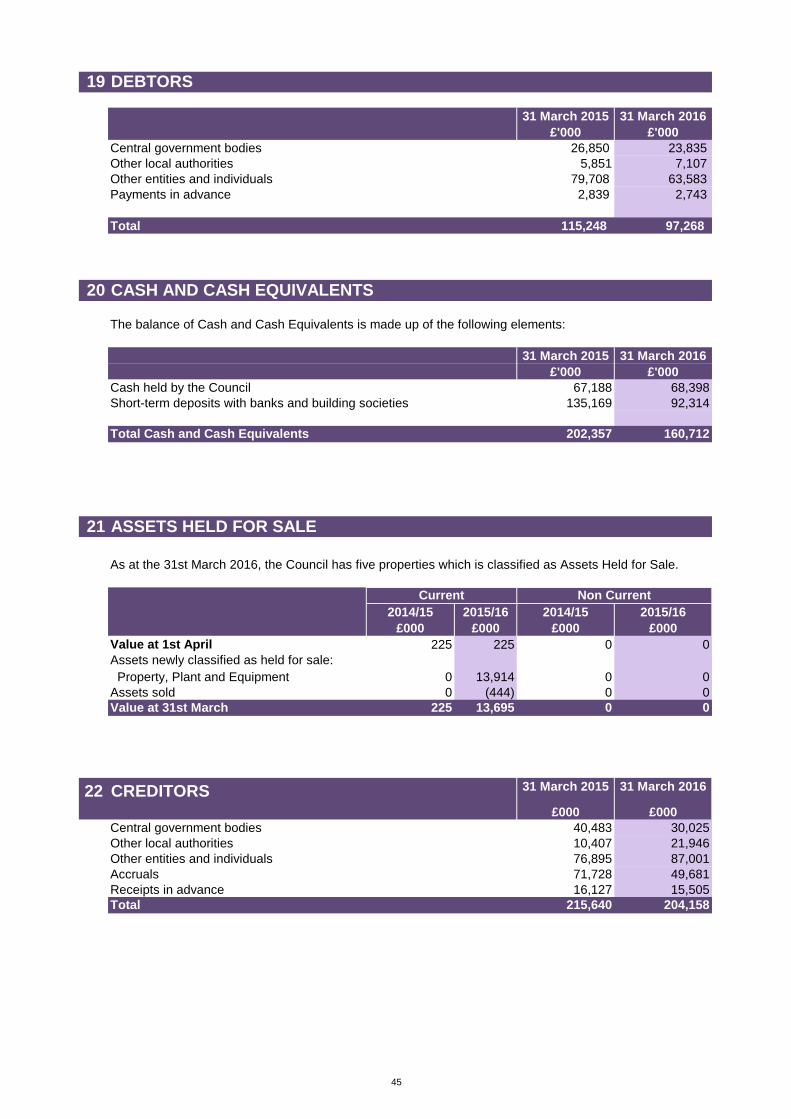
19 DEBTORS
31 March 2015 31 March 2016£'000 £'000
Central government bodies 26,850 23,835 Other local authorities 5,851 7,107 Other entities and individuals 79,708 63,583 Payments in advance 2,839 2,743
Total 115,248 97,268
20 CASH AND CASH EQUIVALENTS
31 March 2015 31 March 2016£'000 £'000
Cash held by the Council 67,188 68,398135,169 92,314
202,357 160,712
21 ASSETS HELD FOR SALE
2014/15 2015/16 2014/15 2015/16£000 £000 £000 £000
Value at 1st April 225 225 0 0Assets newly classified as held for sale:
0 13,914 0 0Assets sold 0 (444) 0 0Value at 31st March 225 13,695 0 0
22 CREDITORS 31 March 2015 31 March 2016
£000 £000Central government bodies 40,483 30,025Other local authorities 10,407 21,946Other entities and individuals 76,895 87,001Accruals 71,728 49,681Receipts in advance 16,127 15,505Total 215,640 204,158
Property, Plant and Equipment
Short-term deposits with banks and building societies
Total Cash and Cash Equivalents
The balance of Cash and Cash Equivalents is made up of the following elements:
As at the 31st March 2016, the Council has five properties which is classified as Assets Held for Sale.
Current Non Current
45

23 PROVISIONS
SHORT-TERM PROVISIONS£'000 £'000 £'000 £'000 £'000 £'000 £'000
(a) Single Status 174 0 0 174 (112) 0 62(b) ICT provision and other corporate provisions 772 (195) 878 1,455 (200) 53 1,308(c) Adoption Fees 40 (40) 0 0 0 0 0(d) Contract disputes 102 0 0 102 0 21 123(e) Business rates appeals provision 8,250 (7,040) 1,800 3,010 (2,427) 0 583
TOTAL 9,338 (7,275) 2,678 4,741 (2,739) 74 2,076Note - all short term provisions are due to be realised in the next financial year.
LONG-TERM PROVISIONS£'000 £'000 £'000 £'000 £'000 £'000 £'000
(f) Insurance Fund 9,024 (2,247) 0 6,777 (75) 358 7,060(g) Repayment of deposits 169 0 0 169 0 0 169(h) Repayment of European funding 394 0 0 394 0 0 394
TOTAL 9,587 (2,247) 0 7,340 (75) 358 7,623
9,699(a)
(b)
(c)
(d)
(e)
(f)
(g)
(h)
Amounts used in 2015/16
Contributions in 2015/16
Balance at 31 March 2016
Balance at 1 April 2014
Amounts used in 2014/15
Contributions in 2014/15 Balance at 31
March 2015
Balance at 1 April 2015
Balance at 31 March 2016
Amounts used in 2014/15
Contributions in 2014/15 Balance at 31
March 2015
Contributions in 2015/16
Amounts used in 2015/16
For additional costs resulting from the single status agreement which changed employees' conditions of service.
Provision for ICT licences and corporate provision.
Provision for contract disputes.
Provision required in 2014/15 for the final payment to other authorities should particular children placed with potential adopters resident in other boroughs ultimately be legally adopted.
There are a number of European funded schemes where there is a probability that grant will need to be repaid. The potential for repayment will expire in 2017, ten years after the grant was received.
The provision is used to hold deposits received from contractors with approval for erecting temporary structures. On completion of the work, the deposits will be refunded to the contractors, less deductions for any liabilities incurred. The refund of deposits will depend on the successful completion of contracts.
To cover a range of self-insured risks including personal accident cover for staff, motor car credit guarantee insurance and miscellaneous items of property. Amounts are transferred to the provision from the insurance reserve on an annual basis if a reliable estimate can be made of the likely settlement amount. The nature of insurance claims means it is not possible to accurately forecast when settlement of claims will take place. The Council is active in risk management, identifying areas of particular risk and taking management steps with a view to reducing possible future claims and losses. There are no material risks which are not covered by either direct insurance or self insurance via the provision.
Council share of provision for NNDR business rates appeals.
46

24 USABLE RESERVES
25
31 March 2015£'000
342,264 Revaluation Reserve 401,655
1,428,571 Capital Adjustment Account 1,496,454
568 Financial Instruments Adjustment Account 284
(649,564) Pensions Reserve (516,595)
8,047 Collection Fund Adjustment Account 728
(2,988) Accumulating Compensated Absences Adjustment Account (2,369)
11 Deferred Capital Receipts 2
Total Unusable Reserves 1,380,159
Revaluation Reserve
347,109 Balance at 1 April 342,265
14,170 Upward revaluation of assets 106,896
(15,647)Downward revaluation of assets and impairment losses not charged to the Surplus/Deficit on the Provision of Services (42,193)
(1,477)Surplus or deficit on revaluation of non-current assets not posted to the Surplus or Deficit on the Provision of Services 64,703
(3,228)Difference between current value depreciation and historical cost depreciation (3,735)
(139) Accumulated gains on assets sold or scrapped (1,577)
(3,367) Amount written off to the Capital Adjustment Account (5,312)
342,265 Balance at 31 March 401,656
2014/15£'000
2015/16£'000
Movements in the Council’s usable reserves are detailed in the Movement in Reserves Statement and note 7.
The Revaluation Reserve contains the gains made by the Council arising from increases in the value of its Property, Plant and Equipment. The balance is reduced when assets with accumulated gains are:
• revalued downwards or impaired and the gains are lost• used in the provision of services and the gains are consumed through depreciation, or• disposed of and the gains are realised.
The Reserve contains only revaluation gains accumulated since 1 April 2007, the date that the Reserve was created. Accumulated gains arising before that date are consolidated into the balance on the Capital Adjustment Account.
UNUSABLE RESERVES
31 March 2014£'000
1,126,909
47

25 UNUSABLE RESERVES
Capital Adjustment Account
2014/15£'0001,226,254 Balance at 1 April 1,428,571
Reversal of items relating to capital expenditure debited or credited to the Comprehensive Income and Expenditure Statement:
(39,350) Charges for depreciation and impairment of non current assets (39,480)
162,161 Revaluation losses and reversals on Property, Plant and Equipment 36,175
(20,995) Revenue expenditure funded from capital under statute (10,898)
(33,497)Amounts of non current assets written off on disposal or sale as part of the gain/loss on disposal to the Comprehensive Income and Expenditure Statement
(23,225)
68,319 (37,428)
3,367 Adjusting amounts written out of the Revaluation Reserve 5,312
71,686Net written out amount of the cost of non current assets consumed in the year
(32,116)
Capital financing applied in the year:
8,549 Use of the Capital Receipts Reserve to finance new capital expenditure 841
9,940 Use of the Major Repairs Reserve to finance new capital expenditure 28,319
88,685Application of grants and contributions to capital financing from the Capital Grants Unapplied Account
57,073
6,882Statutory provision for the financing of capital investment charged against the General Fund and HRA balances
7,167
16,575 Capital expenditure charged against the General Fund and HRA balances 6,600
130,631 100,000
1,428,571 Balance at 31 March 1,496,455
£'0002015/16
The Capital Adjustment Account absorbs the timing differences arising from the different arrangements for accounting for the consumption of non-current assets and for financing the acquisition, construction or enhancement of those assets under statutory provisions. The Account is debited with the cost of acquisition, construction or enhancement as depreciation, impairment losses and amortisations are charged to the Comprehensive Income and Expenditure Statement (with reconciling postings from the Revaluation Reserve to convert current value figures to a historical cost basis). The Account is credited with the amounts set aside by the Council as finance for the costs of acquisition, construction and enhancement.
The Account contains accumulated gains and losses on Investment Properties and gains recognised on donated assets that have yet to be consumed by the Council.
The Account also contains revaluation gains accumulated on Property, Plant and Equipment before 1 April 2007, the date that the Revaluation Reserve was created to hold such gains.
Note 7 provides details of the source of all the transactions posted to the Account, apart from those involving the Revaluation Reserve.
48

25 UNUSABLE RESERVES (continued)
Financial Instruments Adjustment Account
2014/15 2015/16£'000 £'000
852 Balance at 1 April 568
(284)
Amount by which finance costs charged to the Comprehensive Income and Expenditure Statement are different from finance costs chargeable in the year in accordance with statutory requirements (284)
568 Balance at 31 March 284
Pensions Reserve
2014/15 2015/16£'000 £'000
(495,946) Balance at 1 April (649,564)
(139,066) Actuarial gains or losses on pensions assets and liabilities 151,822
(56,899)Reversal of items relating to retirement benefits debited or credited to the Surplus or Deficit on the Provision of Services in the Comprehensive Income and Expenditure Statement
(64,399)
42,347Employer’s pensions contributions and direct payments to pensioners payable in the year
45,546
(649,564) Balance at 31 March (516,595)
The Financial Instruments Adjustment Account absorbs the timing differences arising from the different arrangements for accounting for income and expenses relating to certain financial instruments and for bearing losses or benefiting from gains per statutory provisions. The Council uses the Account to manage premiums paid on the early redemption of loans. Premiums are debited to the Comprehensive Income and Expenditure Statement when they are incurred, but reversed out of the General Fund Balance to the Account in the Movement in Reserves Statement. Over time, the expense is posted back to the General Fund Balance in accordance with statutory arrangements for spreading the burden on council tax. In the Council’s case, this period is the unexpired term that was outstanding on the loans when they were redeemed. As a result, the balance on the Account was charged to the General Fund over 10 years with the final charge in 2016/17.
The Pensions Reserve absorbs the timing differences arising from the different arrangements for accounting for post employment benefits and for funding benefits in accordance with statutory provisions. The Council accounts for post employment benefits in the Comprehensive Income and Expenditure Statement as the benefits are earned by employees accruing years of service, updating the liabilities recognised to reflect inflation, changing assumptions and investment returns on any resources set aside to meet the costs. However, statutory arrangements require benefits earned to be financed as the Council makes employer’s contributions to pension funds or eventually pays any pensions for which it is directly responsible. The debit balance on the Pensions Reserve therefore shows a substantial shortfall in the benefits earned by past and current employees and the resources the Council has set aside to meet them. The statutory arrangements will ensure that funding will have been set aside by the time the
49

25 UNUSABLE RESERVES
Collection Fund Adjustment Account
2014/15 2015/16£'000 £'000
767 Balance at 1 April 8,047
7,280 (7,319)8,047 Balance at 31 March 728
Deferred Capital Receipts
2014/15 2015/16£'000 £'000
48 Balance at 1 April 11 (37) Transfer to the Capital Receipts Reserve upon receipt of cash (9)11 Balance at 31 March 2
The Collection Fund Adjustment Account manages the differences arising from the recognition of council tax incomein the Comprehensive Income and Expenditure Statement as it falls due from council tax payers compared with thestatutory arrangements for paying across amounts to the General Fund from the Collection Fund.
The Deferred Capital Receipts Reserve holds the gains recognised on the disposal of non-current assets but for whichcash settlement has yet to take place. Under statutory arrangements, the Council does not treat these gains as usablefor financing new capital expenditure until they are backed by cash receipts. When the deferred cash settlementeventually takes place, amounts are transferred to the Capital Receipts Reserve.
Amount by which council tax income credited to the Comprehensive Income and Expenditure Statement is different from council tax income calculated for the year in accordance with statutory requirements
50

26a NOTE A TO THE CASH FLOW STATEMENT
2014/15
£'000
251,011 Net Surplus or (Deficit) on the Provision of Services 70,468
Adjust net surplus or (deficit) on the provision of services for non cash movements
39,349 Depreciation 39,479
(162,161) Impairment and downward valuations (36,175)
57 Adjustments for effective interest rates (2,168)
(602) Increase/Decrease in Interest Creditors
(13,290) Increase/Decrease in Creditors (6,469)
49,890 Increase/Decrease in Debtors 18,022
1,739 Increase/Decrease in Inventories
14,550 Pension Liability 18,873
(6,844) Contributions to/(from) Provisions (2,382)
33,497Carrying amount of non-current assets sold (property, plant and equipment, investment property and intangible assets) 23,225
(43,815) 52,405
(20,551) Capital Grants credited to surplus or deficit on the provision of services (16,001)
(808) Premiums or Discounts on the repayment of financial liabilities
(38,273)Proceeds from the sale of property plant and equipment, investment property and intangible assets (39,853)
(59,632) (55,854)
147,564 Net cash flows from operating activities 67,019
26b CASH FLOW STATEMENT - OPERATING ACTIVITIES
The cash flows for operating activities include the following items:
2014/15 2015/16
£'000 £'000
2,311 Interest received 1,621
(10,347) Interest paid (10,419)
(8,036) (8,798)
27 CASH FLOW STATEMENT - INVESTING ACTIVITIES
2014/15 2015/16
£'000 £'000
(123,351) Purchase of property, plant and equipment, investment property and intangible assets (86,126)
(30,112) Purchase of short-term and long-term investments (75,841)
36,676 Other receipts from investing activities 20,057
(81,972) Net cash flows from investing activities (105,756)
28 CASH FLOW STATEMENT - FINANCING ACTIVITIES
2014/15 2015/16
£'000 £'000
808 Billing Authorities - Council Tax and NNDR adjustments (1,572)
(1,216) Other receipts from financing activities 0
(938)Cash payments for the reduction of the outstanding liabilities relating to finance leases and on-balance sheet PFI contracts (964)
0 Repayments of short- and long-term borrowing (371)
(1,346) Net cash flows from financing activities (2,907)
2015/16
£'000
Adjust for items included in the net surplus or def icit on the provision of services that are investing or financing activities
51

29 TRADING OPERATIONS
The following services are reported as trading activities
Expenditure Income Surplus/ Expenditure Income Surplus/ Balance (Deficit) (Deficit) 31/03/2016
£'000 £'000 £'000 £'000 £'000 £'000 £'000
2,482 2,488 6 2,125 2,481 356 572
2,482 2,488 6 2,125 2,481 356 572
30 CONTINGENT LIABILITIES
Housing Transfers to Registered Social Landlords
30a CONTINGENT ASSETS
31 POOLED BUDGETS
ICES BCF LDSA£'000 £'000 £'000
The Council 812 9,092 0
Barts and the London Trust health services 836 0 0
Clinical Commissioning Group (CCG) 0 12,357 0
1,648 21,449 0Expenditure 1,680 20,329 0
(32) 1,120 0
ICES BCF LDSA£'000 £'000 £'000
The Council 984 0 1,706
Barts and the London Trust health services 813 0 1,420
1,797 0 3,126Expenditure 1,961 0 3,126
(164) 0 0
32
2014/15 2015/16£'000 £'000
836 788
836 788Note - The number of Members in Tower Hamlets was reduced to 45 from the May 2014 election.
Over recent years the Council has entered into development agreements to develop sites as part of its regeneration of the Ocean Estate and Blackwall Reach areas. In the event of any of the individual sites achieving overall profit for the development partners, an overage payment may become due to the Council. Any subsequent use of overage receipts arising from the Ocean Estate scheme will be subject to approval by the Greater London Authority.
Regeneration Schemes
Death of Child In Mile End Park
Between March 1998 and March 2015 the Council transferred tenanted and leasehold properties to other landlords - 7,457 to Poplar Housing and Regeneration Community Association; 2,392 to Tower Hamlets Community Housing; 970 to Swan Housing Association; 3,537 to East End Homes; 2,079 to Toynbee Island Homes; 238 to Bethnal Green and Victoria Park Housing Association and 106 to Spitalfields Housing Association. The Council has given warranties to provide the funders of those landlords with a level of comfort in relation to their loans, which represents a potential liability to the Council. The amount of the potential liability cannot be determined with any certainty at present.
In 2015, a child died in Mile End Park. A coroners hearing is to consider the cause of death pending further investigations. Provision has been made within the insurance provision to meet the maximum potential insurance liability. At this time, it is uncertain if further liabilities will be raised against the Council.
TOTAL TRADING ACCOUNTS
Street Trading
2015/162014/15
Income
2015/16
Under the terms of a Section 75 Agreement (National Health Service Act 2006), the Council entered into two Pooled Budget and Lead Commissioning agreements with the Primary Care Trust. The Council will manage and deliver statutory functions, alongside the Primary Care Trust, in respect of the following:
(a) Integrated Community Equipment Service (ICES)
(b) Better Care Fund (BCF)
Total
Surplus/Deficit for the year
Surplus/(Deficit) for the year
MEMBERS' ALLOWANCESThe Council paid the following amounts to Members of the council during the year.
A summary memorandum Income and Expenditure Account for each pooled budget is shown below. The Council's contribution to each pool is included in the Adult Social Care gross expenditure figure disclosed in the Comprehensive Income and Expenditure Account.
The purpose of the arrangements for ICES and BCF is to work collaboratively with health providers in the Borough, to deliver efficient, joined up health and social care services to residents.
In 2014/15 the council operated another pooled budget for Services for Adults with Learning Difficulties (LDSA). From 2015/16, the pooled budget is not operating under a Section 75 agreement. The service is operating based on a Memorandum of Understanding (MOU) which covers only recharges by partners.
Allowances
Income
2014/15
52

33
Salary, Fees and
Allowances Expenses
Compen-sation for Loss of Office
Pension Contribu-
tion Other Total£ £ £ £ £ £
Mr S Halsey - Head of Paid Service & Corporate Director CLC 161,329 0 0 25,004 0 186,333Total Head of Paid Service 161,329 0 0 25,004 0 186,333
Corporate DirectorsResources (Acting) 123,417 0 0 19,094 0 142,511Development and Renewal 142,086 0 0 21,963 0 164,049Education, Health and Wellbeing 148,000 0 0 22,898 0 170,898
OtherMonitoring Officer 119,840 0 0 0 0 119,840Public Health 101,265 0 0 14,177 0 115,442
795,937 0 0 103,136 0 899,073
Salary, Fees and
Allowances Expenses
Compen-sation for Loss of Office
Pension Contrib-
ution Other Total£ £ £ £ £ £
Mr W Tuckley - Chief Executive 1 86,503 0 0 13,448 0 99,951
Mr S Halsey - Head of Paid Service & Corporate Director CLC 2 94,540 0 0 13,712 0 108,252Total Head of Paid Service 181,043 0 0 27,160 0 208,203
Corporate DirectorsAdults Services (Interim) 3 62,792 0 0 9,921 0 72,713
Childrens Services 4 6,682 0 0 0 0 6,682
Childrens Services (Interim) 5 115,600 0 0 0 0 115,600
Communites, Localities and Culture 6 62,361 0 0 9,634 0 71,995Development and Renewal 138,086 0 0 21,331 0 159,417
Education, Health and Wellbeing 7 79,172 0 147,940 6,525 0 233,637
Law, Probity & Governance 8 64,612 0 0 9,947 0 74,559Public Health 100,472 0 0 14,755 0 115,227
Resources 9 80,996 0 0 12,476 0 93,472
Resources (Acting) 10 41,486 0 0 6,390 0 47,876
OtherMonitoring Officers 11 41,715 0 0 0 0 41,715
975,017 0 147,940 118,139 0 1,241,096
1 Commenced 19/10/20152 Head of paid service role ended 18/10/20153 Commenced 01/07/20154 Commenced 14/03/20165 From 14/07/2015 to 11/03/20166 From 19/10/20157 Left 13/07/20158 Commenced 17/09/20159 Commenced 03/08/201510 Acting up ended 02/08/201511 Monitoring Officer role within Director for Law Probity & Governance post from 17/09/2015. Cost of monitoring officers until 16/09/2015 shown
2014/15 2015/16
Teaching Staff
Includes Teaching Redund-ancies
Other Staff
Includes Other Staff
Redund-ancies Total Staff
Teaching Staff
Includes Teaching Redund-ancies Other Staff
Includes Other Staff
Redund-ancies Total Staff
212 (2) 103 (2) 315 246 (1) 117 (17) 363130 (1) 44 (1) 174 159 0 48 (6) 207
60 0 52 (3) 112 53 0 53 (9) 10628 0 20 (1) 48 36 0 24 (2) 6025 0 30 (1) 55 35 0 27 (6) 6214 0 5 (1) 19 20 (1) 13 (1) 33
9 (1) 3 0 12 17 (2) 4 0 216 0 4 (1) 10 4 0 6 (3) 104 0 1 0 5 6 0 2 (1) 84 0 7 (2) 11 7 0 4 (3) 114 0 7 (1) 11 2 0 7 (1) 91 0 4 (1) 5 3 0 4 (2) 71 0 0 0 1 2 0 1 0 31 0 0 0 1 0 0 0 0 01 0 0 0 1 0 0 1 (1) 11 0 0 0 1 1 0 0 0 10 0 0 0 0 1 0 0 0 13 0 0 0 3 2 0 0 0 20 0 0 0 0 0 0 0 0 00 0 0 0 0 0 0 1 (1) 10 0 0 0 0 1 0 0 0 10 0 0 0 0 0 0 2 (2) 20 0 0 0 0 0 0 1 (1) 1
504 (4) 280 (14) 784 595 (4) 315 (56) 910
50,000 - 54,999 55,000 - 59,999 60,000 - 64,999
Remuneration band (£)
155,000 - 159,999
120,000 - 124,999
The remuneration paid to the Council’s senior employees is as follows:
2014/15
amounts:*
2015/16
185,000 - 189,999 160,000 - 164,999
130,000 - 134,999 140,000 - 144,999 145,000 - 149,999 150,000 - 154,999
The Council's other employees receiving more than £50,000 remuneration for the year (excluding employer's pension contribution) were paid the following
65,000 - 69,999
OFFICERS' REMUNERATION
125,000 - 129,999
70,000 - 74,999 75,000 - 79,999 80,000 - 84,999 85,000 - 89,999 90,000 - 94,999 95,000 - 99,999 100,000 - 104,999 105,000 - 109,999 110,000 - 114,999 115,000 - 119,999
53

2014/15 2015/16 2014/15 2015/16 2014/15 2015/16 2014/15 2015/16
4 3 14 109 18 112 153 981
20,001 - 40,000 1 1 11 55 12 56 326 1,649
40,001 - 60,000 0 0 6 30 6 30 306 1,434
60,001 - 80,000 0 0 3 18 3 18 203 1,205
80,001 - 100,000 0 0 2 9 2 9 174 813
100,001 - 150,000 0 0 4 11 4 11 477 1,352
150,001 - 200,000 0 0 0 3 0 3 0 494
200,001 - 250,000 0 0 0 1 0 1 0 2265 4 40 236 45 240 1,639 8,154
34 CAPITAL EXPENDITURE AND CAPITAL FINANCING
The following table shows how capital expenditure was financed in the year.
2014/15 2015/16£'000 £'000
Expenditure
115,692 82,081
-
Heritage Assets - -
20,995 10,898
136,687 92,979
Sources of FinanceBorrowing 12,939 145
Capital Grants and Contributions 88,685 57,073
Capital Receipts 8,548 841
Major Repairs Reserve 9,940 28,319
Direct Revenue Funding 16,575 6,600
136,687 92,978
2014/15 2015/16
Restated 1
£'000 £'000
Opening Capital Financing Requirement 1 257,561 263,618Capital investment
115,692 88,072
0
Heritage Assets 0 0
20,995 10,898
Sources of finance(88,685) (57,073)
(8,548) (841)
(9,940) (28,319)
(16,575) (6,600)
(6,882) (7,084)
0 (83)
Closing Capital Financing Requirement 263,618 262,588
Explanation of movements in year
(3,582) (7,166)
9,639 145
0 5,991
Increase/(decrease) in Capital Financing Requiremen t 6,057 (1,030)
Exit Payments
Total cost of exit packages in each band
(£000)
The number of exit payments with total cost per band and total cost of the compulsory and other redundancies are set out in the table below:
0 - 20,000
Number of compulsory redundancies
Number of other departures agreed
Total number of exit packages by cost band
Total
The total amount of capital expenditure incurred in the year is shown in the table below (including the value of assets acquired under finance leases and PFI contracts), together with the resources that have been used to finance it. Where capital expenditure is to be financed in future years by charges to revenue as assets are used by the Council, the expenditure results in an increase in the Capital Financing Requirement (CFR), a measure of the capital expenditure incurred historically by the Council that has yet to be financed. The CFR is analysed in the second part of this note.
Property, Plant and Equipment
The above table includes any compensation for loss of office payments included within the senior officer remuneration note on previous page.
Intangible Assets
TOTAL
Exit Package cost band (£)
Sums set aside from revenue:
Capital grants and contributions
• Minimum Revenue Provision1
• Direct revenue contributions
1 2014/15 figures adjusted to include PFI liability and PFI MRP
Increase in underlying need to borrow (unsupported by government financial assistance)
Assets acquired under finance leases
TOTAL
Revenue Expenditure Funded from Capital Under Statute
• HRA Revenue Provision for Debt Repayment on Finance Lease Principal
Revenue Expenditure Funded from Capital under Statute
Intangible Assets
Property, Plant and Equipment
Major repairs reserve
Capital receipts
Decrease in underlying need to borrow (supported by government financial assistance)
54

35
2014/15 2015/16£'000 £'000
277 210
6 20
30 20
55 46Total 369 296
36
Notes DSG Receivable for 2014/15Central
Expenditure
Individual Schools Budget Total
£'000 £'000 £'000A DSG for 2014/15 before Academy Recoupment 48,999 267,375 316,374
B Academy figure Recouped 2014/15 0 (16,249) (16,249)
C Total DSG after Academy Recoupment 2014/15 48,999 251,126 300,125
D Brought forward from 2013/14 7,579 (187) 7,392
E Carry forward to 2015/16 agreed in advance 0 0 0
F Agreed initial budgeted distribution in 2014/15 56,578 250,939 307,517
G In-year adjustments 0 0 0
H Final budget distribution for 2014/15 56,578 250,939 307,517
I Less actual central expenditure (51,330) 0 (51,330)
J Less actual ISB deployed to schools 0 (252,092) (252,092)
K Council contribution for 2014/15 3,818 0 3,818
L Carry forward to 2015/16 9,066 (1,153) 7,913A DSG figure as issued by DfE in July 2014
B
C Total DSG after Academy Recoupment 2014/15
D Figure brought forward from 2013/14
E
F
G
H Budgeted distribution of DSG at year end
I Actual amount of central expenditure items in 2014/15
J
K
L
Notes DSG Receivable for 2015/16Central
Expenditure
Individual Schools Budget Total
£'000 £'000 £'000A DSG for 2015/16 before Academy Recoupment 44,933 276,075 321,008
B Academy figure Recouped 2015/16 0 (22,350) (22,350)
C Total DSG after Academy Recoupment 2015/16 44,933 253,725 298,658
D Brought forward from 2014/15 7,913
E Carry forward to 2016/17 agreed in advance 0 0 0
F Agreed initial budgeted distribution in 2015/16 52,845 253,725 306,570
G In-year adjustments 0 0
H Final budget distribution for 2015/16 52,845 253,725 306,570
I Less actual central expenditure (49,980) 0 (49,980)
J Less actual ISB deployed to schools 0 (254,334) (254,334)
K Council contribution for 2015/16 3,818 0 3,818
L Carry forward to 2016/17 6,683 (609) 6,074A DSG figure as issued by DfE in March 2016
B
C Total DSG after Academy Recoupment 2015/16
D Figure brought forward from 2014/15
E
F
G
H Budgeted distribution of DSG at year end
I Actual amount of central expenditure items in 2015/16
J
K
L
Contribution from the Council in 2015/16 which substituted for DSG in funding the Schools Budget
Difference between budgeted distributions and actuals plus carry forward agreed in advance
Difference between budgeted distributions and actuals plus carry forward agreed in advance
Academy figure Recouped 2015/16
The amount which the Council decided after consultation with the schools forum to carry forward to 2016/17 rather than distribute in 2015/16
Budgeted distribution of DSG, adjusted for carry forward, as agreed with the schools forum
Changes to Initial distribution in 2015/16
Amount of ISB distributed to schools
Contribution from the Council in 2014/15 which substituted for DSG in funding the Schools Budget
EXTERNAL AUDIT COSTS
DEDICATED SCHOOLS GRANT
The Council has incurred the following costs in relation to the audit of the Statement of Accounts, certification of grant claims and statutory inspections and to non-audit services provided by the Council’s external auditors - KPMG.
The Council's expenditure on schools is funded by grant monies provided by the Department for Children, Schools and Families, - the Dedicated Schools Grant (DSG). DSG is ring-fenced and can only be applied to meet expenditure properly included in the Schools Budget. The Schools Budget includes elements for a restricted range of services provided on an authority-wide basis and for the Individual Schools Budget, which is divided into a budget share for each school. Over and underspends on the two elements are required to be accounted for separately.
Fees payable to appointed external auditor with regard to external audit services carried out by the appointed auditor for the year
Fees payable to appointed external auditor for the certification of grant claims and returns for the year
Fees payable in respect of other services provided by external auditors during the year
Academy figure Recouped 2014-15
Additional fees payable to the external auditor for inquiries relating to 2014/15 include £20k for consideration of an objection against the best value Inspection fee and the completion of best value review work.
The fees payable to the external auditors for other services comprise £39.3k of audit work relating to 2013/14 of reviewing the sale of council assets, the review of East End Life and best value inspection work following on from PwC's review. £6.5k was charged for the audit of the housing capital receipts pooling return and the teacher's pension return.
Amount of ISB distributed to schools
Changes to Initial distribution in 2014/15
Budgeted distribution of DSG, adjusted for carry forward, as agreed with the schools forum.
The amount which the Council decided after consultation with the schools forum to carry forward to 2015/16 rather than distribute in 2014/15
Addition fees payable to external Audit for inquiries relating to 2014/15 invoiced in 2015/16
55

37 GRANT INCOME
2014/15 2015/16
£'000 £'000
Non-Ringfenced Government GrantsBusiness Rate Related Grants (7,025) (7,972)Council Tax Freeze Grant (871) (901)Council Tax Related Grants (209) (96)Local Service Support Grant (135) (88)New Homes Bonus (19,811) (18,143)Revenue Support Grant (Formula Grant) (118,270) (84,300)
Total Non-Ringfenced Government Grants (146,321) (111,500)
Capital Grants and ContributionsNon-conditional grants:
Schools-funded Capital Programme (3,480) (1,815)Transport for London Funding (2,992) (2,315)Major Works Contributions (cash received) (3,384) (3,328)Capital Maintenance Grant (3,095) (3,126)Basic Needs/New Pupil Places (6,805) (6,459)Decent Homes Backlog Funding (46,000) (13,270)Community Infrastructure Levy (CIL) 0 (6,832)Other Non-Conditional Grants Received (1,138) (99)
Conditional grants:
Building Schools for the Future (4,513) 703Targeted Basic Need Grant (4,383) 0Energy Efficiency Grant (Fuel Poverty Fund) 0 (2,254)Building the Pipeline Housing Grant 0 (5,828)Other Conditional Grants Applied (1,136) (458)
Developers' Contributions (5,892) (3,895)Total Capital Grants and Contributions (82,818) (48,976)
Credited to Services
Capital Grants funding REFCUS (4,868) (6,615)Developers' Contributions (capital) funding REFCUS (1,947) (2,192)Developers' Contributions (revenue) (2,350) (4,491)PFI Credits (8,037) (8,148)School Sixth Form Grant (17,589) (17,660)Pupil Premium Grant (24,753) (24,606)Public Health Grant (32,261) (34,017)Other Revenue Grants (24,016) (23,652)
Total Credited to Services (115,821) (121,380)
Total Grant Income in Comprehensive Income & Expenditu re Account (344,960) (281,856)
31st March 2015
31st March 2016
£'000 £'000Capital Grants Receipts in Advance
Developers' Contributions 53,124 61,788Building Schools for the Future 0 58Major Works Invoices 8,485 6,028National Affordable Housing Programme 6,265 6,163Energy Efficiency Programme (Fuel Poverty Fund) 2,254 0New Homes Bonus London Enterprise Panel (LEP) 0 1,000Building the Pipeline Housing Grant 5,100 0Other capital grants and contributions 962 1,089
Total 76,190 76,126
The Council credited the following grants, contributions and donations to the Comprehensive Income and Expenditure Statement in 2014/15:
Credited to Taxation and Non Specific Grant Income
The Council has received a number of grants, contributions and donations that have yet to be recognised asincome as they have conditions attached to them that will require the monies or property to be returned to thegiver. The balances at the year-end are as follows:
56
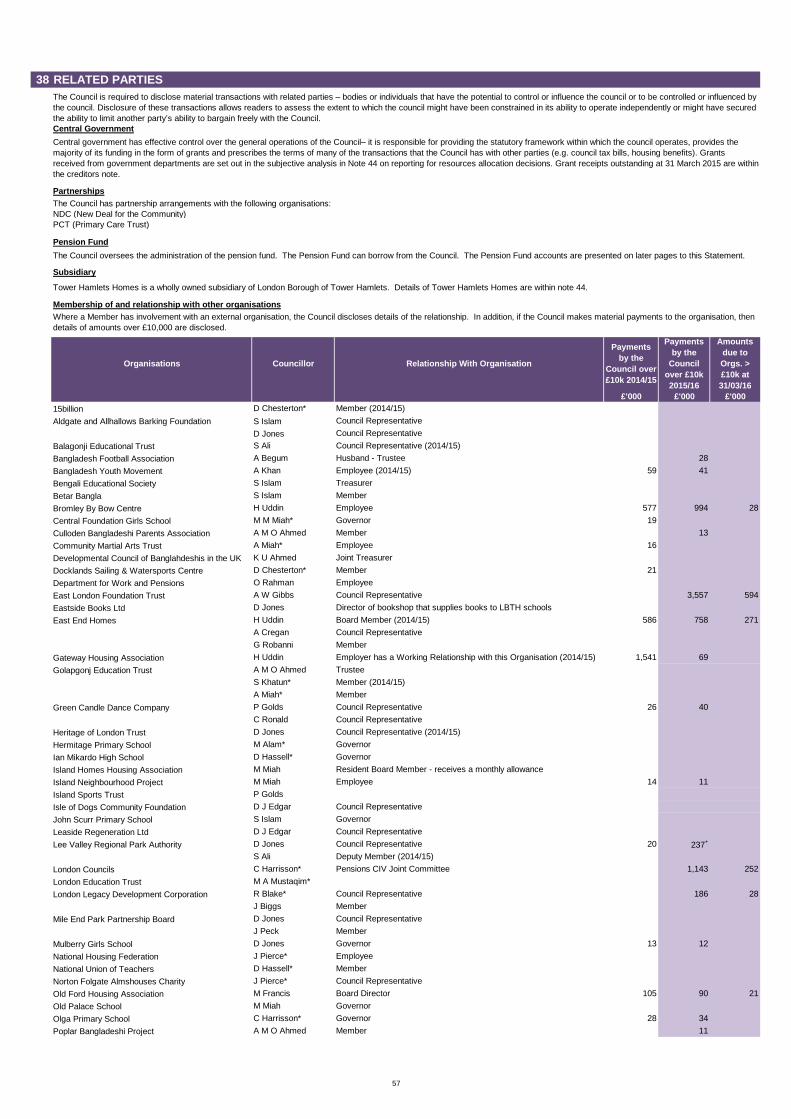
38 RELATED PARTIES
Central Government
Partnerships
NDC (New Deal for the Community)PCT (Primary Care Trust)
Pension Fund
Subsidiary
Membership of and relationship with other organisat ions
Organisations Councillor Relationship With Organisati on
Payments by the
Council over £10k 2014/15
Payments by the
Council over £10k 2015/16
Amounts due to Orgs. > £10k at 31/03/16
£'000 £'000 £'00015billion D Chesterton* Member (2014/15)
Aldgate and Allhallows Barking Foundation S Islam Council Representative
D Jones Council Representative
Balagonji Educational Trust S Ali Council Representative (2014/15)
Bangladesh Football Association A Begum Husband - Trustee 28
Bangladesh Youth Movement A Khan Employee (2014/15) 59 41
Bengali Educational Society S Islam Treasurer
Betar Bangla S Islam Member
Bromley By Bow Centre H Uddin Employee 577 994 28
Central Foundation Girls School M M Miah* Governor 19
Culloden Bangladeshi Parents Association A M O Ahmed Member 13
Community Martial Arts Trust A Miah* Employee 16
Developmental Council of Banglahdeshis in the UK K U Ahmed Joint Treasurer
Docklands Sailing & Watersports Centre D Chesterton* Member 21
Department for Work and Pensions O Rahman Employee
East London Foundation Trust A W Gibbs Council Representative 3,557 594
Eastside Books Ltd D Jones Director of bookshop that supplies books to LBTH schools
East End Homes H Uddin Board Member (2014/15) 586 758 271
A Cregan Council Representative
G Robanni Member
Gateway Housing Association H Uddin Employer has a Working Relationship with this Organisation (2014/15) 1,541 69
Golapgonj Education Trust A M O Ahmed Trustee
S Khatun* Member (2014/15)
A Miah* Member
Green Candle Dance Company P Golds Council Representative 26 40
C Ronald Council Representative
Heritage of London Trust D Jones Council Representative (2014/15)
Hermitage Primary School M Alam* Governor
Ian Mikardo High School D Hassell* Governor
Island Homes Housing Association M Miah Resident Board Member - receives a monthly allowance
Island Neighbourhood Project M Miah Employee 14 11
Island Sports Trust P Golds
Isle of Dogs Community Foundation D J Edgar Council Representative
John Scurr Primary School S Islam Governor
Leaside Regeneration Ltd D J Edgar Council Representative
Lee Valley Regional Park Authority D Jones Council Representative 20 237+
S Ali Deputy Member (2014/15)
London Councils C Harrisson* Pensions CIV Joint Committee 1,143 252
London Education Trust M A Mustaqim*
London Legacy Development Corporation R Blake* Council Representative 186 28
J Biggs Member
Mile End Park Partnership Board D Jones Council Representative
J Peck Member
Mulberry Girls School D Jones Governor 13 12
National Housing Federation J Pierce* Employee
National Union of Teachers D Hassell* Member
Norton Folgate Almshouses Charity J Pierce* Council Representative
Old Ford Housing Association M Francis Board Director 105 90 21
Old Palace School M Miah Governor
Olga Primary School C Harrisson* Governor 28 34
Poplar Bangladeshi Project A M O Ahmed Member 11
The Council has partnership arrangements with the following organisations:
The Council oversees the administration of the pension fund. The Pension Fund can borrow from the Council. The Pension Fund accounts are presented on later pages to this Statement.
Where a Member has involvement with an external organisation, the Council discloses details of the relationship. In addition, if the Council makes material payments to the organisation, then details of amounts over £10,000 are disclosed.
Tower Hamlets Homes is a wholly owned subsidiary of London Borough of Tower Hamlets. Details of Tower Hamlets Homes are within note 44.
The Council is required to disclose material transactions with related parties – bodies or individuals that have the potential to control or influence the council or to be controlled or influenced by the council. Disclosure of these transactions allows readers to assess the extent to which the council might have been constrained in its ability to operate independently or might have secured the ability to limit another party’s ability to bargain freely with the Council.
Central government has effective control over the general operations of the Council– it is responsible for providing the statutory framework within which the council operates, provides the majority of its funding in the form of grants and prescribes the terms of many of the transactions that the Council has with other parties (e.g. council tax bills, housing benefits). Grants received from government departments are set out in the subjective analysis in Note 44 on reporting for resources allocation decisions. Grant receipts outstanding at 31 March 2015 are within the creditors note.
57

Organisations Councillor Relationship With Organisati on
Payments by the
Council over £10k 2014/15
Payments by the
Council over £10k 2015/16
Amounts due to Orgs. > £10k at 31/03/16
£'000 £'000 £'000Poplar Harca A M O Ahmed 2,854 5,819 567
Rich Mix Cultural Foundation D Jones Director 711
C Ronald Council Representative
A Begum Council Representative
Solander Gardens Community & Education H Miah Secretary
Smithy Street Primary School A Khan School Governor (2014/15)
Spitalfields Housing Association Ltd A Mukit* Board Member
St Katherine & Shadwell Trust S Haque Deputy
St Matthias Primary School A Mukit* School Governer
St Pauls Way Trust School R Saunders Council Representative 41 13
St Peters Bengali Associaltion M A Mustaqim* 82 60
Sylhet Divisional Welfare Council K U Ahmed General Secretary
The Childrens Society A Whitelock
Tower Hamlets Cemetry D J Edgar Member 33 47
R Blake* Member
Tower Hamlets Community Housing G Robanni Council Representative 205 199
C Harrisson* Member
R Khan Member
A W Gibbs Husband - Member
Tower Hamlets Homes G Robanni Council Representative 15,677 15,282
A Choudhury Council Representative
J Pierce* Council RepresentativeA Asad Wife - EmployeeH Uddin Board Member
Tower Hamlets Youth Sport Foundation A Begum Husband - Trustee 19
Toynbee Hall S Khatun* Employee 643 28
Trinity Buoy Wharf D Jones Director
Unison C Harrisson* Employee 467 424 75
Victoria & Albert Museum of Childhood D Jones Council Representative 11
Wadajir Somali Centre A M O Ahmed Member 32
Wiltons Music Hall D Jones Trustee (2014/15)
*New Member from May 2014
58

39 LEASES
Authority as Lessee
Finance Leases
Leased In Assets
Buildings Buildings31 March
201531 March
2016£'000 £'000
Dame Colet Residential Development 0 5,991
Total 0 5,991
Buildings Buildings31 March
201531 March
2016£'000 £'000
Finance lease liabilities (net present value of minimum lease payments) 0 5,908
Finance costs payable in future years 0 14,280
Minimum lease payments 0 20,188
The minimum lease payments will be payable over the following periods:
31 March 2015
31 March 2016
31 March 2015
31 March 2016
£'000 £'000 £'000 £'000
Not later than one year 0 585 0 171
Later than one year and not later than five years 0 2,340 0 685
Later than five years 0 17,264 0 5,052
0 20,188 0 5,908
The minimum lease payments do not include rents that are contingent on event taking place after the lease was entered into, such as adjustments following rent reviews. In 2015/16 no contingent rents were payable by the Authority.
As a Lessee the Council has acquired a residential development under finance leases. The assets acquired under the leases are carried as Property, Plant and Equipment in the Balance Sheet at the following net amounts.Depreciation policy on leased assets is consistent with the policy on owned assets and subject to revaluation in the same way as any other asset.
Minimum Lease Finance Lease
The Authority is committed to making minimum payments under these leases comprising settlement of the long-term liability for the interest in the property acquired by the Authority and finance costs that will be payable by the Authority in future years while the liability remains outstanding. The minimum lease payments are made up of the following amounts:
58

39 LEASES
Authority as Lessee
Operating Leases
Leased In Assets
Land & Buildings
Vehicles Plant &
Equipment
Land & Buildings
Vehicles Plant &
Equipment31 March
201531 March
201531 March
201631 March
2016£'000 £'000 £'000 £'000
150 0 149 0601 0 597 0
1,678 0 1,519 0
Chief Executive's Not later than one year 0 164 0 82Later than one year and not later than five years 0 80 0 2Later than five years 80 0 0 0
142 332 113 255318 371 244 244577 9 537 1
0 649 0 5170 1,452 0 1,1930 410 0 170
2,895 0 2,905 1311,579 0 9,360 42,136 0 1,863 0
3,187 1,144 3,167 86712,497 1,903 10,201 1,4434,472 419 3,920 171
20,156 3,467 17,288 2,481
Children Schools and Families
Adults Health and WellbeingNot later than one yearLater than one year and not later than five yearsLater than five years
Later than one year and not later than five yearsLater than five years
Communities Localities and CultureNot later than one year
The Council leases in some properties (including office accommodation, car parks and business units), and as well as a number of vehicles (including minibuses and vans), plant and equipment (including office equipment, specialised health and safety and security equipment). These leases are for variable lengths and range between 1 and 25 years in duration.
The future minimum lease payments due under these leases in future years are:
Later than five years
TotalNot later than one yearLater than one year and not later than five yearsLater than five years
Later than one year and not later than five yearsLater than five years
Development and RenewalNot later than one yearLater than one year and not later than five years
Not later than one year
59

39 LEASES (continued)
Land & Buildings
Vehicles Plant &
Equipment
Land & Buildings
Vehicles Plant &
Equipment31st March
201531st March
201531st March
201631st March
2016£'000 £'000 £'000 £'000
150 0 149 0
Minimum Lease Payments 0 164 0 166
0 673 0 751
240 494 240 369
2,895 0 2,905 13
3,285 1,331 3,294 1,299
Authority as LessorFinance LeasesAs a Lessor the Council has no finance leases to report .
Operating Leases
31st March 2015
31st March 2016
£'000 £'000(3,313) (3,469)
(10,896) (10,618)(16,595) (15,736)(30,804) (29,823)
Children Schools and FamiliesMinimum Lease Payments
Not later than one yearLater than one year and not later than five years
TotalMinimum Lease Payments
Later than five years
The future minimum lease payments receivable under non-cancellable leases in future years are:
As the primary purpose of holding these assets is to provide support to the community, rather than generating financial gain for the Council, these assets are not considered as investment properties.
Chief Executive's
The expenditure charged to the Services line in the Comprehensive Income and Expenditure Statement during the year in relation to these leases was:
The Council leases out property and equipment under operating leases for economic development purposes to provide suitable affordable accommodation for local businesses.
Adults Health and WellbeingMinimum Lease Payments
Communities Localities and Culture
Development and RenewalMinimum Lease Payments
Minimum Lease Payments
60

40
Mulberry Grouped BarkantineSchool Schools Energy Total£'000 £'000 £'000 £'000
Asset value at 31 March 2015 30,564 230,637 2,396 263,597Depreciation (760) (5,031) (181) (5,972)Revaluations 0 0 (71) (71)Enhancements 0 6,302 0 6,302Derecognition 0 (30,582) 100 (30,482)
Asset value at 31 March 2016 29,804 201,326 2,244 233,374
Mulberry Group BarkantineSchool Schools Energy Total£'000 £'000 £'000 £'000
Liabilities at 31 March 2015 6,478 29,623 2,372 38,473Repayments/Amortisation of deferred liability (250) (516) (198) (964)
Liabilities at 31 March 2016 6,228 29,107 2,174 37,509
Consisting of:Long term liability 5,926 28,400 1,977 36,303Short-term liability 302 706 198 1,206
6,228 29,107 2,174 37,509
Mulberry Group BarkantineSchool Schools Energy Total£'000 £'000 £'000 £'000
LiabilityWithin 1 year 302 706 197 1,205Within 2 - 5 years 1,344 4,821 791 6,956Within 6 - 10 years 2,538 15,950 988 19,476Within 11 - 15 years 2,044 7,630 198 9,872
6,228 29,107 2,174 37,509
Interest
Within 1 year 699 4,580 0 5,279
Within 2 - 5 years 2,433 16,954 0 19,387
Within 6 - 10 years 2,093 14,408 0 16,501
Within 11 - 15 years 473 1,613 0 2,086
5,698 37,555 0 43,253
Service Charges
Within 1 year 673 1,493 0 2,166
Within 2 - 5 years 2,694 11,838 0 14,532
Within 6 - 10 years 3,367 12,655 0 16,022
Within 11 - 15 years 2,020 3,742 0 5,762
8,754 29,728 0 38,482
Payments due under PFI schemes
Liability value at 31 March 2016
A third PFI contract was entered into in relation to the Barkantine Estate Combined Heat and Power scheme. There are no unitary payments made under this scheme as it is classed as a user pay arrangement. An asset was brought onto the balance sheet in 2010/11, matched by a deferred income balance and contract ends in 2026.
PRIVATE FINANCE INITIATIVES AND SIMILAR CONTRACTSThe Council is party to two Private Finance Initiative (PFI) schemes in respect of the design, construction,maintenance and servicing of 28 schools - the Mulberry and Group Schools schemes - until the years 2029 and2027 respectively. Prior to 2010/11 the assets involved were treated as "off balance sheet" in accordance withInternational Financial Reporting Standards the assets are included on the Council's Balance Sheet, matched by afinance lease liability.
Movement on PFI Assets
Movement on PFI Liabilities
61

41 PENSIONS SCHEMES - DEFINED BENEFIT
Participation in pensions schemes
- The Local Government Pension Scheme, administered by the London Pensions Fund Authority
Transactions Relating to Retirement Benefits
2014/15 2015/16 2014/15 2015/16 2014/15 2015/16
£'000 £'000 £'000 £'000 £'000 £'000
35,148 42,358 329 385 35,477 42,743209 1,147 38 0 247 1,147
35,357 43,505 367 385 35,724 43,890(38,519) (32,439) (2,218) (1,587) (40,737) (34,026)
Interest cost on defined benefit obligation 59,382 52,532 2,530 2,003 61,912 54,53520,863 20,093 312 416 21,175 20,509
56,220 63,598 679 801 56,899 64,399
Changes in financial assumptions 209,109 (149,342) 7,006 (4,424) 216,115 (153,766)Other experience (13,659) (22,390) 72 (10) (13,587) (22,400)Return on plan assets excluding amounts included in net interest (70,160) 29,352 (1,384) 2,104 (71,544) 31,456
125,290 (142,380) 5,694 (2,330) 130,984 (144,710)
(56,220) (63,598) (679) (801) (56,899) (64,399)
41,554 44,753 793 793 42,347 45,546
Total remeasurements recognised in Comprehensive In come and Expenditure Statement
Movement in Reserves Statement - General Fund Balan ceReversal of net charges made for retirement benefits in accordance with IAS 19
In addition to the recognised gains and losses included in the Comprehensive Income and Expenditure Account, actuarial gains of £151.822 million(£139.066 million in 2014/15) were included in the Actuarial gains or losses on pension assets and liabilities within Other Comprehensive Income andExpenditure on the face of the Comprehensive Income and Expenditure Account. The cumulative amount of actuarial losses recognised is £367.548million.
Actual amount charged against the General Fund Balance for pensions in the year
In 2015/16 the Council paid £12.659 million into the Teachers Pension Scheme, representing 14.1% of pensionable pay until 31st August 2015 (16.48%from Ist September 2015). The figures for 2014/15 were £11.133 million and 14.1% respectively. In addition, the Council is responsible for all pensionpayments and annual increases in respect of added years it has awarded. In 2013/14 and 2014/15 there were no added year payments by the Council.
Comprehensive Income and Expenditure AccountCost of Services
As part of the terms and conditions of employment of its employees, the Council offers retirement benefits. Although these benefits will not be payableuntil employees retire, the Council has a commitment to make the payments which needs to be disclosed at the time the employees earn their futureentitlement.
The Council participates in three pensions schemes:
- The Local Government Pension Scheme (LGPS) administered by the Council
- The Teachers’ Pension Scheme (TPS), administered by Capita Teachers’ Pensions on behalf of the Department for Children, Schools and
Families (DCSF).
The LGP schemes are funded defined benefit final salary schemes, meaning that the Council and employees pay contributions into a fund, calculated ata level intended to balance the pensions liabilities with investment assets.
Total Net InterestNet Charge to the Comprehensive Income andExpenditure Account
Remeasurement of the Scheme Liabilities
Current service costsImpact of settlements and curtailmentsTotal Service CostInterest income on plan assets
The TPS is an unfunded defined benefit final salary scheme meaning that there are no investment assets built up to meet the pensions liabilities, andcash has to be generated to meet pensions payments as they eventually fall due. It does, however, use a notional fund as the basis for calculating theemployers' contribution rate paid by local education authorities (LEAs) of which the Council is one. It is not possible for the Council to identify a share ofthe underlying liabilities in the scheme attributable to its own employees and it is therefore accounted for on the same basis as a defined contributionscheme. This means that contributions are included on the basis of the actual amount paid into the scheme.
The cost of LGPS retirement benefits is recognised in the Net Cost of Services when the benefits are earned by employees rather than when the benefitsare eventually paid as pensions. However, the charge required to be made against Council Tax is based on the cash payable in the year. The real cost ofretirement benefits is therefore reversed out in the Movement in Reserves Statement for the General Fund Balance. The following transactions havebeen made in the Comprehensive Income and Expenditure Account and Movement in Reserves Statement during the year:
The Council LPFA Total
62

41 PENSION SCHEME (continued)
Assets and Liabilities in Relation to Retirement Be nefits
2014/15 2015/16 2014/15 2015/16 2014/15 2015/16£'000 £'000 £'000 £'000 £'000 £'000
1st April (1,503,100) (1,777,605) (61,951) (68,409) (1,565,051) (1,846,014)
In-year adjustment to exclude/(incorporate) THH deficit (19,172) 4,466 0 0 (19,172) 4,466Current service cost (35,148) (42,358) (329) (385) (35,477) (42,743)Interest cost (59,382) (52,532) (2,530) (2,003) (61,912) (54,535)Contributions (9,638) (9,626) (81) (78) (9,719) (9,704)Actuarial gains / (losses) (195,450) 171,732 (7,078) 4,434 (202,528) 176,166Benefits paid 44,494 43,874 3,598 3,425 48,092 47,299Losses on curtailments (209) (1,147) (38) 0 (247) (1,147)031st March (1,777,605) (1,663,196) (68,409) (63,016) (1,846,014) (1,726,212)
Reconciliation of fair value of the scheme assets ( LGPS):
2014/15 2015/16 2014/15 2015/16 2014/15 2015/16
£'000 £'000 £'000 £'000 £'000 £'000
1st April 1,012,951 1,139,418 56,154 57,032 1,069,105 1,196,450In-year adjustment to exclude/(incorporate) THH deficit 11,090 2,646 0 0 11,090 2,646Expected rate of return 38,519 32,439 2,218 1,587 40,737 34,026Actuarial (losses) / gains 70,160 (29,352) 1,384 (2,104) 71,544 (31,456) Members 9,638 9,626 81 78 9,719 9,704 Employer 41,554 44,753 793 793 42,347 45,546Benefits paid (44,494) (43,874) (3,598) (3,425) (48,092) (47,299)31st March 1,139,418 1,155,656 57,032 53,961 1,196,450 1,209,617
Scheme history
2011/12 2012/13 2013/14 2014/15 2015/16
£'000 £'000 £'000 £'000 £'000Present value of liabilities:
The Council (1,214,784) (1,453,831) (1,503,100) (1,777,605) (1,663,196) LPFA (59,245) (67,336) (61,951) (68,409) (63,016)Fair value of assets
The Council 803,077 947,684 1,012,951 1,139,418 1,155,656
LPFA 48,405 50,521 56,154 57,032 53,961
Deficit in the scheme The Council (411,707) (506,147) (490,149) (638,187) (507,540)
LPFA (10,840) (16,815) (5,797) (11,377) (9,055)
(422,547) (522,962) (495,946) (649,564) (516,595)
LPFA TotalThe Council
The Council
Reconciliation of present value of scheme liabiliti es (LGPS):
The contributions expected to be made by the Council in the year to 31st March 2017 are £44.088 million to the Council's scheme and £0.528 millionto the LPFA scheme (per actuary's reports).
The expected return on scheme assets is determined by considering the expected returns available on the assets underlying the current investmentpolicy. Expected yields on fixed interest investments are based on gross redemption yields as at the balance sheet date. Expected returns on equityinvestments reflect long-term real rates of return experienced in the respective markets.
Total deficit in the schemes
LPFA Total
The liabilities show the underlying commitments that the Council has in the long run to pay retirement benefits. Whilst the total deficit in the schemes of£516.6 million has a significant impact on the net worth of the Council as recorded in the balance sheet, statutory arrangements for funding the deficitmean that the financial position of the Council remains healthy - the deficit will be made good by increased contributions over the remaining working lifeof employees, as assessed by the schemes' actuary.
63

41 PENSION SCHEME (continued)
Basis for estimating assets and liabilities
2014/15 2015/16 2014/15 2015/16
Long-term expected rate of return on assets in the scheme 1 4.3% 4.3% 4.0% 4.0%
Mortality assumptions:
Longevity at 65 for current pensioners:
Men 22.2 years 22.2 years 21.1 years 21.2 years
Women 24.2 years 24.2 years 24.4 years 24.5 years
Longevity at 65 for future pensioners:
Men 24.3 years 24.3 years 23.5 years 23.6 years
Women 26.4 years 26.4 years 26.7 years 26.9 years
Rate of inflation 3.0% 2.9%
Rate of increase in salaries 3.8% 3.7% 4.0% 3.8%
Rate of increase in pensions 2.4% 2.2% 2.2% 2.0%
Rate for discounting scheme liabilities 3.2% 3.5% 3.0% 3.3%
50%* 50%*
1 The expected rates of return are set equal to the discount rate.* Pre-April 2008 service - 75% for post-April 2008 service
Major categories of assets as a proportion of total assets
The categories of assets are as follows.
2014/15 2015/16 2014/15 2015/16Equities 66% 64% 43% 46%Bonds 17% 17% 0% 0%
Property 10% 11% 3% 4%
Infrastructure 0% 0% 5% 5%
Commodities 0% 0% 1% 0%
Cash 4% 5% 11% 13%
Cash flow matching 0% 0% 8% 10%
Target return portfolio/other 3% 3% 29% 22%
History of experience gains and losses
2011/12 2012/13 2013/14 2014/15 2015/16% % % % %
The Council
-5.40 6.10 0.05 6.96 -2.87
5.98 9.89 -2.20 11.94 -11.25
London Pensions Fund Authority
-0.01 4.52 13.47 0.00 0.00
8.19 12.05 -5.45 10.35 -7.04
Experience gains and (losses) on assets
Experience gains and (losses) on liabilities
The Council
Experience gains and (losses) on liabilities
LPFA
The actuarial gains and losses identified as movements on the Pension Reserve in 2015/16 can be analysed into the following categories, measured as a percentage of assets or liabilities at 31st March 2016:
Experience gains and (losses) on assets
The Council LPFA
Liabilities have been assessed on an actuarial basis using the projected unit method - an estimate of the pensions that will be payable in future years dependent on assumptions about mortality rates, salary levels etc. Both schemes have been assessed by independent actuaries, based on the following main assumptions. Hymans Robertson LLP provide the LBTH report, Barnett Waddingham the LPFA report.
Take-up of option to convert annual pension into retirement lump sum
64

42 AMOUNTS REPORTED FOR RESOURCE ALLOCATION DECISION S
The income and expenditure of the Council's directorates recorded in the report to Cabinet in July 2016 was as follows:
DIRECTORATE CI&E 2015/16 Adults
Service
Directorate of Law, Probity &
Governance
Children, Schools and
Families
Communities, Localities and
Culture Development and Renewal Resources
Corporate & Others
Housing Revenue Account TOTAL
£'000 £'000 £'000 £'000 £'000 £'000 £'000 £'000 £'000
Fees, charges and other service income (27,590) (9,457) (115,129) (60,632) (73,121) (83,905) (31,518) (92,736) (494,088)Government grants (255) (157) (363,041) (3,858) (860) (273,286) (60,840) 0 (702,297)
TOTAL INCOME (27,845) (9,614) (478,170) (64,490) (73,981) (357,191) (92,358) (92,736) (1,196,385)
Employee expenses 26,230 9,860 325,427 39,235 25,014 28,662 24,290 3,149 481,867Other service expenses 104,385 4,160 212,216 88,178 55,614 288,944 17,321 37,466 808,284Support service recharges 22,324 5,174 32,948 17,825 9,708 47,240 1,853 38,062 175,134
TOTAL EXPENDITURE 152,939 19,194 570,591 145,238 90,336 364,846 43,464 78,677 1,465,285
NET EXPENDITURE 125,094 9,580 92,421 80,748 16,355 7,655 (48,894) (14,059) 268,900
£'000
Net expenditure in the Directorate Analysis 268,900
Net expenditure of services and support services no t included in the Analysis 0
Amounts in the Comprehensive Income and Expenditure Statement not reported to management in the Analys is (19,256)
Amounts included in the Analysis not included in th e Comprehensive Income and Expenditure Statement 11,017
COST OF SERVICES IN INCOME AND EXPENDITURE STATEMENT 260,661
The analysis of income and expenditure by service on the face of the Comprehensive Income and Expenditure Statement is that specified by the Best Value Accounting Code of Practice. However, decisions about resource allocation are taken by the Council's Cabinet on the basis of budget reports analysed across directorates. These reports are prepared on a different basis from the accounting policies used in the financial statements. In particular:
This reconciliation shows how the figures in the analysis of directorate income and expenditure relate to the amounts included in the Comprehensive Income and Expenditure
- no charges are made to directorates for revaluation losses and revenue expenditure funded from capital under statute (REFCUS) whilst they are charged to services in the Comprehensive Income and Expenditure Statement; - the cost of retirement benefits is based on cash flows (payment of employer's pensions contributions) rather than current service cost of benefits accrued in the year; - the gross expenditure and income associated with trading activities are reported for directorates whilst only the net position is included in the Comprehensive Income and Expenditure Statement
65

42 AMOUNTS REPORTED FOR RESOURCE ALLOCATION DECISION S
SUBJECTIVE ANALYSIS
2015/16 Directorate analysis
Services & support
services not in analysis
Amounts not reported to
Management for Decision
Making
Amounts not included in
I&E Cost of services
Corporate amounts TOTAL
£'000 £'000 £'000 £'000 £'000 £'000 £'000Fees, charges and other service income (494,088) 168,327 (198) 19,651 (306,308) 0 (306,308)Interest and investment income 0 0 0 3,131 3,131 (3,131) 0Unattached capital receipts 0 0 0 0 0 (3,708) (3,708)Government grants and contributions - service specific (702,297) 0 (538) 22,807 (680,028) 0 (680,028)Income from Council tax 0 0 0 0 0 (71,793) (71,793)Government grants and contributions - non-service specific 0 0 0 0 0 (111,500) (111,500)Distribution from non-domestic rates pool 0 0 0 0 0 (112,493) (112,493)Capital Grants and Contributions 0 0 (8,808) 0 (8,808) (48,976) (57,784)HRA Settlement Determination (including Premia) 0 0 0 0 0 0 0(Surplus)/Deficit on Trading Activities 0 0 0 2,481 2,481 0 2,481
TOTAL INCOME (1,196,385) 168,327 (9,544) 48,070 (989,532) (351,601) (1,341,133)
Employee expenses 481,867 0 (2,274) 0 479,593 0 479,593Other service expenses 808,284 (7,438) (28,852) 771,994 0 771,994Support service recharges 175,134 (168,327) 0 0 6,807 0 6,807Depreciation, amortisation and impairment 0 0 0 0 0 0 0Interest payments 0 0 0 (4,373) (4,373) 9,760 5,387Precepts and levies 0 0 0 (1,703) (1,703) 1,703 0Payments to Housing Capital Receipts Pool 0 0 0 0 0 1,773 1,773Gain or Loss on Disposal of Fixed Assets 0 0 0 0 0 (12,919) (12,919)Pensions interest costs and expected return on pensions assets 0 0 0 0 0 20,509 20,509HRA Settlement Determination (including Premia) 0 0 0 0 0 0 0(surplus)/Deficit on Trading Activities 0 0 0 (2,125) (2,125) (356) (2,481)TOTAL EXPENDITURE 1,465,285 (168,327) (9,712) (37,053) 1,250,193 20,470 1,270,663SURPLUS OR DEFICIT ON THE PROVISION OF SERVICES 268,900 0 (19,256) 11,017 260,661 (331,131) (70,470)
This reconciliation shows how the figures in the analysis of directorate income and expenditure relate to a subjective analysis of the deficit on the Provision of Services included in the Income and Expenditure Statement
66
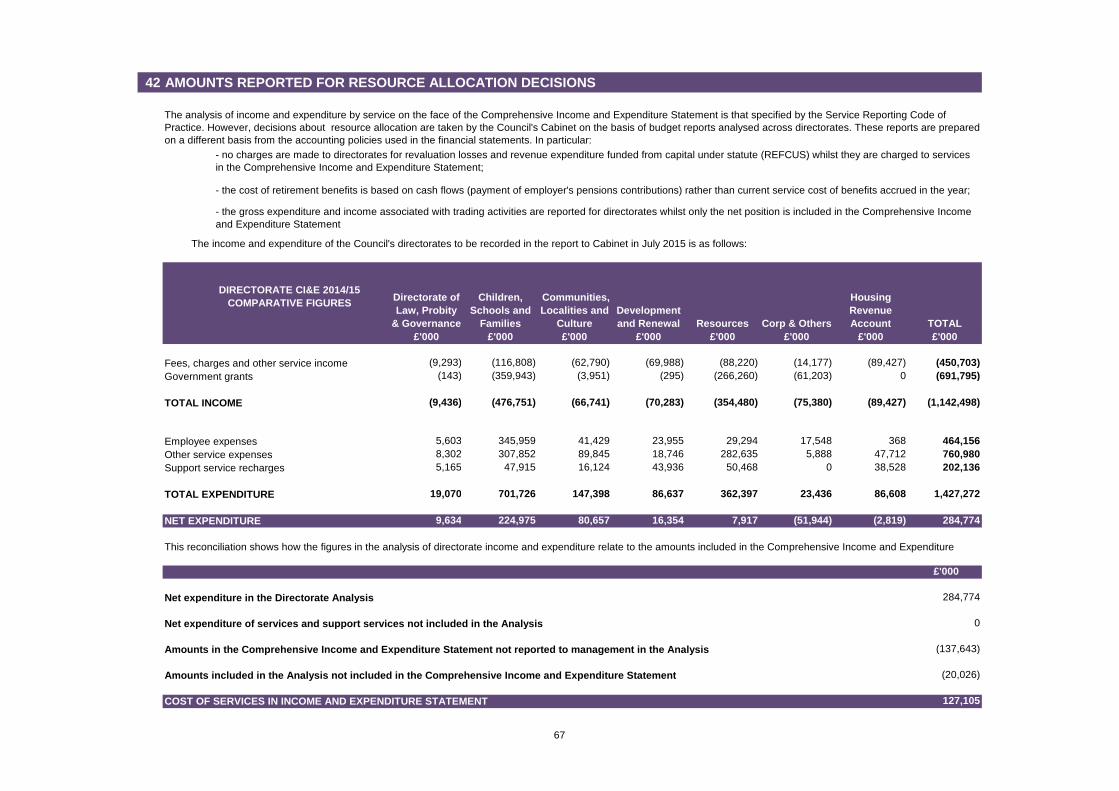
42 AMOUNTS REPORTED FOR RESOURCE ALLOCATION DECISION S
Directorate of Law, Probity
& Governance
Children, Schools and
Families
Communities, Localities and
Culture Development and Renewal Resources Corp & Others
Housing Revenue Account TOTAL
£'000 £'000 £'000 £'000 £'000 £'000 £'000 £'000
Fees, charges and other service income (9,293) (116,808) (62,790) (69,988) (88,220) (14,177) (89,427) (450,703)Government grants (143) (359,943) (3,951) (295) (266,260) (61,203) 0 (691,795)
TOTAL INCOME (9,436) (476,751) (66,741) (70,283) (354,480) (75,380) (89,427) (1,142,498)
Employee expenses 5,603 345,959 41,429 23,955 29,294 17,548 368 464,156Other service expenses 8,302 307,852 89,845 18,746 282,635 5,888 47,712 760,980Support service recharges 5,165 47,915 16,124 43,936 50,468 0 38,528 202,136
TOTAL EXPENDITURE 19,070 701,726 147,398 86,637 362,397 23,436 86,608 1,427,272
NET EXPENDITURE 9,634 224,975 80,657 16,354 7,917 (51,944) (2,819) 284,774
£'000
Net expenditure in the Directorate Analysis 284,774
Net expenditure of services and support services no t included in the Analysis 0
Amounts in the Comprehensive Income and Expenditure Statement not reported to management in the Analys is (137,643)
Amounts included in the Analysis not included in th e Comprehensive Income and Expenditure Statement (20,026)
COST OF SERVICES IN INCOME AND EXPENDITURE STATEMENT 127,105
This reconciliation shows how the figures in the analysis of directorate income and expenditure relate to the amounts included in the Comprehensive Income and Expenditure
The analysis of income and expenditure by service on the face of the Comprehensive Income and Expenditure Statement is that specified by the Service Reporting Code of Practice. However, decisions about resource allocation are taken by the Council's Cabinet on the basis of budget reports analysed across directorates. These reports are prepared on a different basis from the accounting policies used in the financial statements. In particular:
- no charges are made to directorates for revaluation losses and revenue expenditure funded from capital under statute (REFCUS) whilst they are charged to services in the Comprehensive Income and Expenditure Statement;
- the cost of retirement benefits is based on cash flows (payment of employer's pensions contributions) rather than current service cost of benefits accrued in the year;
- the gross expenditure and income associated with trading activities are reported for directorates whilst only the net position is included in the Comprehensive Income and Expenditure Statement
The income and expenditure of the Council's directorates to be recorded in the report to Cabinet in July 2015 is as follows:
DIRECTORATE CI&E 2014/15 COMPARATIVE FIGURES
67

42 AMOUNTS REPORTED FOR RESOURCE ALLOCATION DECISION S
Directorate analysis
Services & support
services not in analysis
Amounts not reported to
Management for Decision
Making
Amounts not included in
I&E Cost of
servicesCorporate amounts TOTAL
£'000 £'000 £'000 £'000 £'000 £'000 £'000Fees, charges and other service income (450,703) 147,520 (188) (605) (303,976) 0 (303,976)Interest and investment income 0 0 0 2,254 2,254 (2,254) 0Unattached capital receipts 0 0 0 0 0 (3,459) (3,459)Government grants and contributions - service specific (691,795) 0 (1,061) 23,741 (669,115) 0 (669,115)Income from Council tax 0 0 0 0 0 (67,576) (67,576)Government grants and contributions - non-service specific 0 0 0 0 0 (146,321) (146,321)Distribution from non-domestic rates pool 0 0 0 0 0 (108,528) (108,528)Capital Grants and Contributions 0 0 (6,815) 0 (6,815) (82,818) (89,633)HRA Settlement Determination (including premia) 0 0 0 0 0 0 0(Surplus)/Deficit on Trading Activities 0 0 0 2,488 2,488 0 2,488TOTAL INCOME (1,142,498) 147,520 (8,064) 27,878 (975,164) (410,956) (1,386,120)
Employee expenses 464,156 0 (5,928) 0 458,228 0 458,228Other service expenses 760,980 0 (123,651) (39,500) 597,829 0 597,829Support service recharges 202,136 (147,520) 0 0 54,616 0 54,616Depreciation, amortisation and impairment 0 0 0 0 0 0 0Interest payments 0 0 0 (4,252) (4,252) 9,745 5,493Precepts and levies 0 0 0 (1,670) (1,670) 1,670 0Payments to Housing Capital Receipts Pool 0 0 0 0 0 1,572 1,572Gain or Loss on Disposal of Fixed Assets 0 0 0 0 0 (1,316) (1,316)Pensions interest costs and expected return on pensions assets 0 0 0 0 0 21,175 21,175HRA Settlement Determination (including premia) 0 0 0 0 0 0 0(Surplus)/Deficit on Trading Activities 0 0 0 (2,482) (2,482) -6 (2,488)TOTAL EXPENDITURE 1,427,272 (147,520) (129,579) (47,904) 1,102,269 32,840 1,135,109SURPLUS OR DEFICIT ON THE PROVISION OF SERVICES 284,774 0 (137,643) (20,026) 127,105 (378,116) (251,011)
SUBJECTIVE ANALYSIS 2014/15 COMPARATIVE FIGURES
This reconciliation shows how the figures in the analysis of directorate income and expenditure relate to a subjective analysis of the deficit on the Provision of Services included in the Income and Expenditure Statement
68

43 TRUST FUNDS
Balance at 1/4/2014
2014/15 Expenditure
2014/15 Income
Balance at 31/3/2014
2015/16 Expenditure
2015/16 Income
Balance at 31/3/2015
£'000 £'000 £'000 £'000 £'000 £'000 £'000(a) 954 5,882 8,571 3,643 2,875 2,697 3,465(b) 1,544 1,792 315 67 9 68 126(c) 163 1,472 1,410 101 3 0 98(d) 160 0 0 160 0 0 160(e) 54 40 0 14 0 142 156
2,875 9,186 10,296 3,985 2,887 2,907 4,005
(a)
(b)
(c)
(d)(e)
The Council acts as trustee for a number of Trust Funds, the principal ones being shown below. It should be noted that the Council's Balance Sheet does not include all Trust Fund assets and liabilities and so does not comply fully with relevant accounting standards, although the amounts involved are not material.
Sundry Other includes funds representing a number of miscellaneous deposits.
Tower Hamlets Further Education TrustGlobe Town Picture FundSundry OtherTOTAL TRUST FUNDS
The fund represents monies held by Social Services on behalf of deputyship and appointeeship service users. It is held to protect the service users monies and to finance the purchase of goods and services on behalf of residents.These Funds represent monies held by the Council on behalf of any residents of the borough (including those in private accommodation) who are unable to manage their own personal affairs.
The Council also holds a number of deposits relating to Trust Funds administered by the Council. The funds are held in an interest bearing account maintained by the Council. The account is excluded from the financial statements relating to the Council. The relevant Trusts and transactions during the financial year ended 31st March 2015 may be summarised as follows:
This was established by the Council in conjunction with Canary Wharf Limited with the objective of "the advancement of education and training for the residents of the London Borough of Tower Hamlets". The Council is the sole Trustee and the Trust is registered with the Charities Commission (No. 1002772). Accounts relating to the Trust have been deposited with the Charities Commissioners.
This Fund was established with the proceeds of the sale of a painting by the Council.
Welfare Savings / Client Financial AffairsSocial Services Trust Funds - sundry other
69
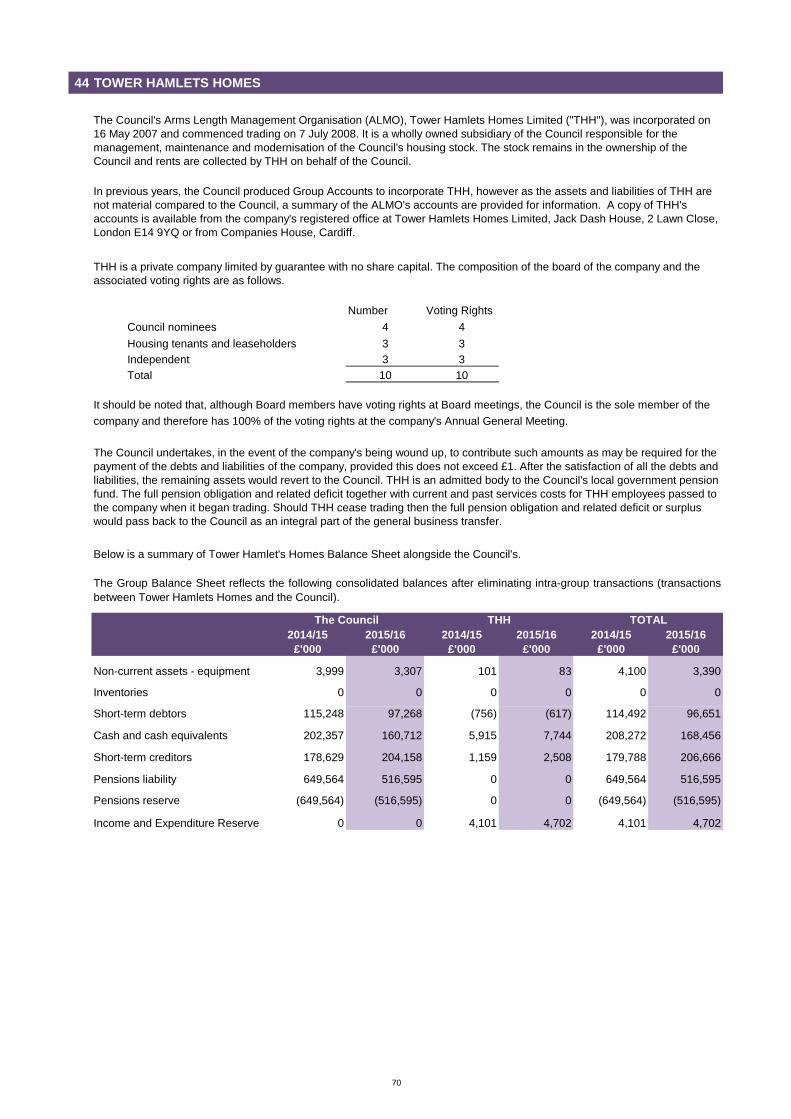
44 TOWER HAMLETS HOMES
Number Voting Rights
Council nominees 4 4
Housing tenants and leaseholders 3 3Independent 3 3Total 10 10
2014/15 2015/16 2014/15 2015/16 2014/15 2015/16£'000 £'000 £'000 £'000 £'000 £'000
Non-current assets - equipment 3,999 3,307 101 83 4,100 3,390
Inventories 0 0 0 0 0 0
Short-term debtors 115,248 97,268 (756) (617) 114,492 96,651
Cash and cash equivalents 202,357 160,712 5,915 7,744 208,272 168,456
Short-term creditors 178,629 204,158 1,159 2,508 179,788 206,666
Pensions liability 649,564 516,595 0 0 649,564 516,595
Pensions reserve (649,564) (516,595) 0 0 (649,564) (516,595)
Income and Expenditure Reserve 0 0 4,101 4,702 4,101 4,702
The Group Balance Sheet reflects the following consolidated balances after eliminating intra-group transactions (transactionsbetween Tower Hamlets Homes and the Council).
The Council THH TOTAL
The Council's Arms Length Management Organisation (ALMO), Tower Hamlets Homes Limited ("THH"), was incorporated on 16 May 2007 and commenced trading on 7 July 2008. It is a wholly owned subsidiary of the Council responsible for the management, maintenance and modernisation of the Council's housing stock. The stock remains in the ownership of the Council and rents are collected by THH on behalf of the Council.
Below is a summary of Tower Hamlet's Homes Balance Sheet alongside the Council's.
It should be noted that, although Board members have voting rights at Board meetings, the Council is the sole member of the
company and therefore has 100% of the voting rights at the company's Annual General Meeting.
THH is a private company limited by guarantee with no share capital. The composition of the board of the company and the associated voting rights are as follows.
The Council undertakes, in the event of the company's being wound up, to contribute such amounts as may be required for the payment of the debts and liabilities of the company, provided this does not exceed £1. After the satisfaction of all the debts and liabilities, the remaining assets would revert to the Council. THH is an admitted body to the Council's local government pension fund. The full pension obligation and related deficit together with current and past services costs for THH employees passed to the company when it began trading. Should THH cease trading then the full pension obligation and related deficit or surplus would pass back to the Council as an integral part of the general business transfer.
In previous years, the Council produced Group Accounts to incorporate THH, however as the assets and liabilities of THH are not material compared to the Council, a summary of the ALMO's accounts are provided for information. A copy of THH's accounts is available from the company's registered office at Tower Hamlets Homes Limited, Jack Dash House, 2 Lawn Close, London E14 9YQ or from Companies House, Cardiff.
70

Note 2014/15 2015/16£'000 £'000
EXPENDITURERepairs and maintenance 21,061 19,807Supervision and management 32,098 37,990Rents, rates, taxes and other charges 2,534 2,821Depreciation of non-current assets 6
On dwellings 14,141 13,754On other assets 1,577 1,570
Revaluation losses (and reversals) (194,063) (42,267)Debt management costs 73 73Movement in the allowance for bad debts 239 (1,128)Sums directed by the Secretary of State that are expenditure in accordance with the Code 4,044 1,365
TOTAL EXPENDITURE (118,296) 33,985
INCOME
Gross rental income Dwelling rents 67,966 68,116 Non dwelling rents 3,876 4,253Charges for services and facilities 17,169 19,693Contributions towards expenditure 115 115
TOTAL INCOME 89,126 92,177
(207,422) (58,192)
HRA services share of Corporate and Democratic Core 157 157
NET COST OF HRA SERVICES (207,265) (58,035)
HRA share of operating income and expenditure included in the whole authority Income and Expenditure Account(Gain)/loss on sale of HRA non-current assets (1,317) (12,841)Unattached capital receipts (2,778) (1,811)Interest payable and similar charges 12 3,338 3,516Interest and investment income (300) (560)Pensions interest cost and expected return on pension assets 7 1,296 1,293Capital grants and contributions receivable (51,187) (26,501)
DEFICIT / (SURPLUS) FOR THE YEAR ON HRA SERVICES (258,213) (94,939)
The Housing Revenue Account (HRA) deals with the provision and maintenance of council housing by the Council acting asLandlord. It also shows income from rents and Government grant. There is a statutory requirement to keep this account separatefrom other Council activities (including other housing activities).
HOUSING REVENUE ACCOUNTINCOME AND EXPENDITURE ACCOUNT
NET COST OF HRA SERVICES AS INCLUDED IN THE WHOLE A UTHORITY INCOME AND EXPENDITURE ACCOUNT
71

STATEMENT OF MOVEMENT ON THE HOUSING REVENUE ACCOUNT BALANCE
Note£'000 £'000 £'000 £'000
Balance on the Statutory HRA Brought Forward (17,153) (20,146)
(258,213) (94,939)
255,220 83,991
Decrease (Increase) in the HRA Balance (2,993) (10,948)
Transfers to or (from) reserves 0 02,811 (8,137)
Balance on the Statutory HRA Carried Forward (20,146) (31,094)
2015/16
Net additional amount required by statute to be credited to the HRA balance for the year 1
Deficit / (Surplus) for the year on the HRA Income and Expenditure Account
The Housing Revenue Account (HRA) Income and Expenditure Account discloses the income received and expenditure incurred in providing council dwellings to tenants for the year. However, the Council is required to raise council rents based on the balance on the Statutory Housing Revenue Account.
This reconciliation statement summarises the differences between the outturn on the HRA Income and Expenditure Account and the balance on the Statutory HRA.
2014/15
72
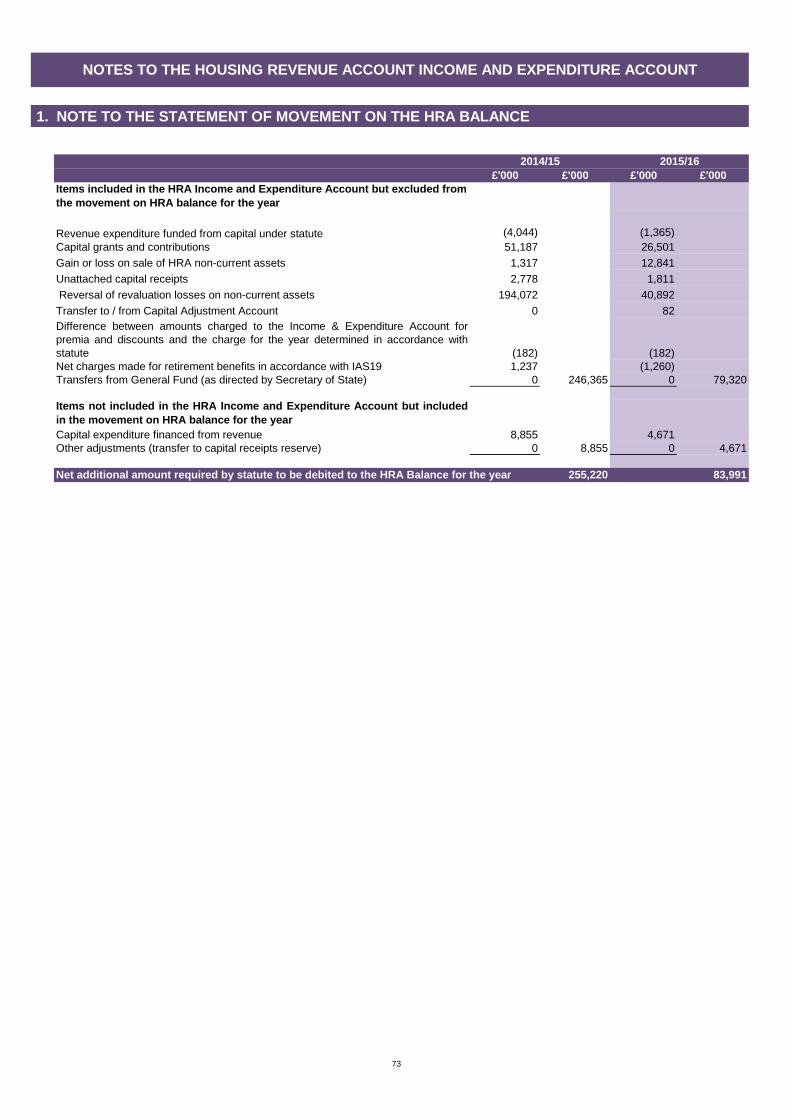
1. NOTE TO THE STATEMENT OF MOVEMENT ON THE HRA BALA NCE
£'000 £'000 £'000 £'000Items included in the HRA Income and Expenditure Acc ount but excluded from the movement on HRA balance for the year
Revenue expenditure funded from capital under statute (4,044) (1,365)Capital grants and contributions 51,187 26,501
Gain or loss on sale of HRA non-current assets 1,317 12,841
Unattached capital receipts 2,778 1,811
Reversal of revaluation losses on non-current assets 194,072 40,892
Transfer to / from Capital Adjustment Account 0 82Difference between amounts charged to the Income & Expenditure Account forpremia and discounts and the charge for the year determined in accordance withstatute (182) (182)Net charges made for retirement benefits in accordance with IAS19 1,237 (1,260)Transfers from General Fund (as directed by Secretary of State) 0 246,365 0 79,320
Items not included in the HRA Income and Expenditure Account but includedin the movement on HRA balance for the yearCapital expenditure financed from revenue 8,855 4,671Other adjustments (transfer to capital receipts reserve) 0 8,855 0 4,671
Net additional amount required by statute to be deb ited to the HRA Balance for the year 255,220 83,991
2015/16
NOTES TO THE HOUSING REVENUE ACCOUNT INCOME AND EXPENDITURE ACCOUNT
2014/15
73

2 HOUSING STOCK
2014/15 2015/16
262 2597,115 6,9943,927 3,849
781 782
TOTAL AT 31 st MARCH 12,085 11,884
3 NON-CURRENT ASSETS
The balance sheet values of assets within the Council's HRA were as follows:2014/15 2015/16
£'000 £'000973,479 1,092,431
Other Land and Buildings 57,087 65,248Surplus Assets Not Held for Sale 1,690 0Assets Under Construction 2,840 10,705Assets Held for Sale 225 6,178
TOTAL 1,035,321 1,174,562
Dwellings Other land Surplus Assets Assets Under Assets Held TOTALand buildings not held for sale Construction For Sale
£'000 £'000 £'000 £'000 £'000 £'000
Total value at 1st April 2014 753,180 57,641 1,753 0 225 812,799
Additions, disposals, transfers and revaluations 220,299 (554) (63) 0 (300) 219,382
Total value at 31st March 2015 973,479 57,087 1,690 2,840 225 1,035,321
Additions, disposals, transfers and revaluations 118,952 8,161 (1,690) 7,865 5,953 139,241
TOTAL VALUE AT 31 st MARCH 2016 1,092,431 65,248 0 10,705 6,178 1,174,562
4 MAJOR REPAIRS RESERVE
2014/15 2015/16£'000 £'000
Balance at 1 st April 16,396 22,174Transfer from Capital Adjustment Account - depreciation 15,718 15,321
(9,940) (28,319)
Balance at 31 st March 22,174 9,176
The type and number of dwellings in the Council's housing stock at 31st March were as follows:
Low-rise flats (1-2 storeys)Medium-rise flats (3-5 storeys)High-rise flats (6 or more storeys)
Financing of capital expenditure
Dwellings
The vacant possession value of dwellings within the Council's HRA was £4,154 million in 2015/16 (£3,700 million in 2014/15). The difference between the vacant possession value and the balance sheet value shows the economic cost to the Government of providing council housingat less than open market rents.
The balance sheet values of the land, houses and other property within the Housing Revenue Account are as follows:
Houses and bungalows
74
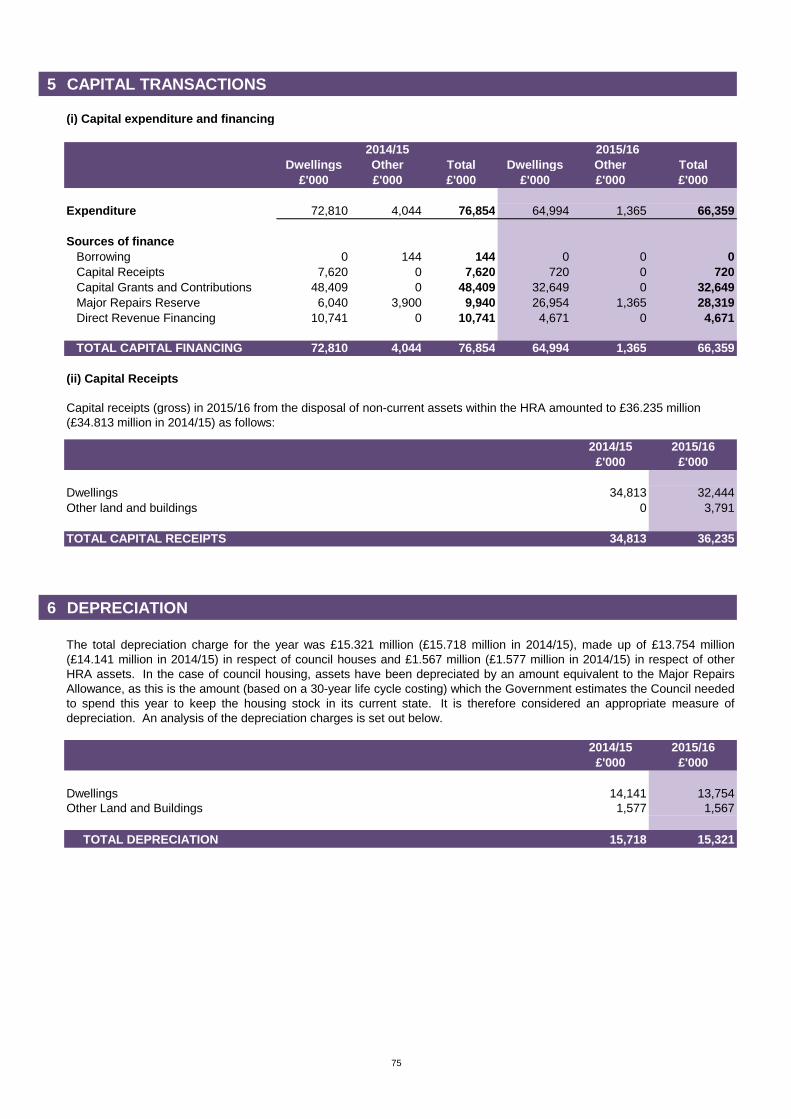
5 CAPITAL TRANSACTIONS
(i) Capital expenditure and financing
Dwellings Other Total Dwellings Other Total£'000 £'000 £'000 £'000 £'000 £'000
Expenditure 72,810 4,044 76,854 64,994 1,365 66,359
Sources of finance Borrowing 0 144 144 0 0 0 Capital Receipts 7,620 0 7,620 720 0 720 Capital Grants and Contributions 48,409 0 48,409 32,649 0 32,649 Major Repairs Reserve 6,040 3,900 9,940 26,954 1,365 28,319
Direct Revenue Financing 10,741 0 10,741 4,671 0 4,671
TOTAL CAPITAL FINANCING 72,810 4,044 76,854 64,994 1,365 66,359
(ii) Capital Receipts
2014/15 2015/16£'000 £'000
Dwellings 34,813 32,444Other land and buildings 0 3,791
TOTAL CAPITAL RECEIPTS 34,813 36,235
6 DEPRECIATION
2014/15 2015/16£'000 £'000
Dwellings 14,141 13,754Other Land and Buildings 1,577 1,567
TOTAL DEPRECIATION 15,718 15,321
2015/162014/15
Capital receipts (gross) in 2015/16 from the disposal of non-current assets within the HRA amounted to £36.235 million (£34.813 million in 2014/15) as follows:
The total depreciation charge for the year was £15.321 million (£15.718 million in 2014/15), made up of £13.754 million(£14.141 million in 2014/15) in respect of council houses and £1.567 million (£1.577 million in 2014/15) in respect of otherHRA assets. In the case of council housing, assets have been depreciated by an amount equivalent to the Major RepairsAllowance, as this is the amount (based on a 30-year life cycle costing) which the Government estimates the Council neededto spend this year to keep the housing stock in its current state. It is therefore considered an appropriate measure ofdepreciation. An analysis of the depreciation charges is set out below.
75

7 PENSION COSTS
2014/15 2015/16 2014/15 2015/16 2014/15 2015/16Income and Expenditure Account £'000 £'000 £'000 £'000 £'000 £'000
2,170 2,726 10 0 2,180 2,726
3,665 3,381 76 0 3,741 3,381Settlements / Curtailments 13 74 1 0 14 74
(2,378) (2,088) (67) 0 (2,445) (2,088)
Expenditure Account 3,470 4,093 20 0 3,490 4,093
Statement of Movement in the HRA Balance
(3,470) (4,093) (20) 0 (3,490) (4,093)
Employer's contribution to scheme 2,557 2,833 7 0 2,564 2,833
8 RENT ARREARS
2014/15 2015/16£'000 £'000
3,877 4,1215.7 6.0
2,869 3,079
9 TRANSFERS FROM GENERAL FUND (AS DIRECTED BY SECRET ARY OF STATE)
10 ITEM 8 INTEREST ADJUSTMENT
Capital works on non-current assets within the council's HRA are partly funded by borrowing. The total interest cost of borrowing is allocated between HRA and General Fund in accordance with the Item 8 Credit and Item 8 Debit (General) Determination for the year, as specified in Schedule 4 of the Local Government and Housing Act 1989. These are included within the interest figures shown on the HRA Income and Expenditure Account.
Arrears as % of rent receivableProvision made for bad debts
Authorities are allowed to transfer sums to the HRA from another revenue account on the basis of directions issued by the Government. No sums were transferred during 2015/16.
Gross rent arrears at 31st March
in accordance with IAS19
Interest cost
These figures represent the cost of pensions attributable to the HRA. Further details of the treatment of pensions costs are shown in note 41 of the Core Financial Statements, together with details of the assumptions made in calculating the figures included in this note. The following transactions have been made in the account for the year.
The Council LPFA Total
Net Cost of Services Current service costs Net Operating Expenditure
Expected return on assets in the schemeNet Charge to the Income and
Reversal of net charges made for retirement benefits
76

Note 2014/15 2014/15 2015/16 2015/16£'000 £'000 £'000 £'000
INCOMECouncil Tax (net of benefits) 2 92,504 97,503Transfers from General Fund - Council Tax Benefits 92,504 97,503
Distribution of prior year deficit on Collection Fund 0
National Non-Domestic Rates 3 369,804 377,998- Transitional Protection 1,364 371,168 41 378,039
Business Rate Supplement 12,156 11,513
TOTAL INCOME 475,828 487,055
EXPENDITURE
Council TaxPrecepts and demands
London Borough of Tower Hamlets 66,395 69,814Greater London Authority 22,419 88,814 23,258 93,072
Increase in provision for Council Tax bad debts 5 2,111 1,793
Distribution of prior year Council Tax surplus on Collection Fund 0 2,556National Non-Domestic Rates NNDR Estimated surplus for 2013/14 applied in 2015/16 0 (95)
National Non-Domestic Rates Interest 10 34Transitional Protection 0 0Cost of collection allowance 946 956 965 999
National Non-Domestic Rates Precepts & DemandsLondon Borough of Tower Hamlets 102,429 114,738DCLG 170,714 191,230Greater London Authority 68,286 341,429 76,492 382,460
Distribution of Prior Year Surplus on NNDR Collection FundLondon Borough of Tower Hamlets 2,085 4,922DCLG 3,474 8,045Greater London Authority 1,390 6,949 3,218 16,185
Business Rate Supplement 4Payment to Greater London Authority * 12,065 12,263Cost of collection allowance 22 12,087 19 12,282
National Non-Domestic Rates Provision For Bad DebtLondon Borough of Tower Hamlets 736 619DCLG 1,226 1,032Greater London Authority 491 2,453 413 2,064
National Non-Domestic Rates Provision For AppealsLondon Borough of Tower Hamlets 1,800 0DCLG 3,000 0Greater London Authority 1,200 6,000 0 0
TOTAL EXPENDITURE 460,799 511,316
INCREASE/(DECREASE) IN FUND BALANCE 15,029 (24,261)BRS Debtor/(Creditor) 700
COLLECTION FUND BALANCE (23,561)
Balance at the beginning of the year 833 15,862 LBTH estimated surplus for 2013/14 B/Fwd to apply in future years less amount applied 1,848 (Deficit)/Surplus for the year 15,029 (23,561)
BALANCE AT END OF YEAR 1 15,862 (5,851)* BRS payment includes 69k on account of 2014/15 ar rears
COLLECTION FUND
77

1. GENERAL
2. COUNCIL TAX
Band Market Value in Fraction of
April 1991 Band D
A Up to £40,000 6/9B Over £40,001 and up to £52,000 7/9C Over £52,001 and up to £68,000 8/9D Over £68,001 and up to £88,000 9/9E Over £88,001 and up to £120,000 11/9F Over £120,001 and up to £160,000 13/9G Over £160,001 and up to £320,000 15/9H Over £320,001 18/9
2014/15 2014/15 2015/16 2015/16Band No. of Council No. of Council
Properties Tax Base Properties Tax BaseA 3,005 628 3,527 515B 25,897 16,634 25,903 16,741C 36,342 28,666 36,875 29,260D 23,643 21,032 24,461 21,939E 17,631 19,228 18,293 20,077F 8,108 10,627 8,470 10,987G 3,179 4,817 3,280 4,966H 469 858 507 938
Total 118,274 102,490 121,316 105,423
Band D TaxAmount to be
raised Band D TaxAmount to be
raisedIncrease / (Decrease)
£ £'000 £ £'000 £ %
Tower Hamlets 885.52 66,395 885.52 69,814 0 0Greater London Authority 299.00 22,419 295.00 23,258 -4.00 -1.34%
TOTAL 1,184.52 88,814 1,180.52 93,072 -4.00 -0.34%
NOTES TO THE COLLECTION FUND
2014/15 2015/16
The Collection Fund accounts for all transactions in respect of Council Tax and National Non-Domestic Rates (also known as NNDR or BusinessRates) and Community Charge (prior to 1st April 1993). Although the account is kept separate from the Income and Expenditure Account, theCollection Fund balance is included in the Council's Balance Sheet.
The Council Tax surplus on the Fund (£2.694m) is attributable to the Council (£1.902m) and the Greater London Authority (£0.792m). The latteramount is carried as a creditor in the Council's Balance Sheet.
When the 2015/16 Council Tax was set the position was as follows:
The Council Tax is made up of amounts for the Greater London Authority as well as the Council. The Band D tax and total amount to be raised in the last 2 years was as follows:
Council Tax is a tax payable depending on the nature and degree of occupation of the residential property concerned. It is subject to a system of personal discounts. For the purpose of calculating the individual tax, all domestic properties were valued by the Inland Revenue as at 1st April 1991 and placed in one of eight bands. By law the tax for each Band is set as a fraction of Band D.
Under the NNDR collection arrangements, there was a deficit of £23.574m in 2015/16 (a surplus of £13.039m during 2014/15). The deficit was due to delays in obtaining valuations of new businesses before year-end. Back-dated NNDR charges have been raised in 2016/17 to recover the deficit. Of this deficit , £3.16m (30%) is attributable to the Council, £2.11m (20%) to the GLA and £5.27m (50%) to the CLG.
78

3. NATIONAL NON-DOMESTIC RATES (NNDR)
4. CROSSRAIL BUSINESS RATE SUPPLEMENT
2014/15 2015/16£'000 £'000
12,467 Non Domestic Rates Due 12,345Less Allowances and Other Adjustments
376 Mandatory & Discretionary Relief 832
0 Provision for Bad Debts 0
26 Cost of Collection 19
12,065 Collectable from Business Rate Supplement Payer s 11,494
5. PROVISION FOR IRRECOVERABLE COUNCIL TAX DEBTS
NNDR, or business rates, collected by local authorities are the way that those who occupy non-domestic propertycontribute towards the cost of local services. Under the business rates retention arrangements introduced from1st April 2013, authorities keep a proportion of the business rates paid locally. NNDR due is calculated bymultiplying a national uniform rate (set by the Government) by the rateable value of the property. The nationaluniform rate in 2015/16 was 49.3p in the £ (48.2p in the £ in 2014/15). The total rateable value in the borough asat 31 March 2016 was £865.2 million (£827.6 million at 31 March 2015). A periodic revaluation of businessproperties took place in April 2010. At March 2016 there were around 6,200 NNDR appeals that are yet to beheard by the Government's Valuation tribunal. Of these 3,467 will not result in a reduction in rateable value and1,936 are considered speculative. Provision has been made for the remaining appeals.
The Greater London Authority (GLA) introduced a business rate supplement (BRS) in April 2010 to finance £4.1 billion of the costs of the £15.9 billion Crossrail project. Details on the progress of the project so far and the proposed policies for the BRS in the 2015/16 financial year are set out below.
The Crossrail BRS will be used to finance £3.5 billion worth of GLA borrowing and the repayment of this sum after Crossrail is completed. A further £0.6 billion of BRS revenues will be used to finance the construction works directly.
The Crossrail BRS multiplier for 2015/16 is 2p per pound of rateable value. Reliefs for the Crossrail BRS will apply on the same basis and at the same percentage rate as for your National Non Domestic Rates (NNDR) bill, although no transitional relief is provided for the BRS.
www.london.gov.uk/crossrail-brs
Contributions are made to or from the Collection Fund Income and Expenditure Account to a provision for baddebts. For 2015/16 the Council Tax bad debt provision was increased by £1.793 million (£2.111 million in2014/15) and £1.621 million of irrecoverable debts were written off (£2.066 million in 2014/15).
79

PENSION FUND ACCOUNT Note 2014/15 2015/16£'000 £'000
Contributions
From employers
Normal 3 26,855 26,812
Augmentation 3 780 1,697
Deficit funding 3 18,500 20,500
From members 3 11,031 10,951
Transfers inTransfers in from other pension funds 4 1,719 2,166
Benefits
Pensions 4 (37,265) (39,103)Lump sum benefits 4 (8,055) (13,158)
Payments to and on account of leavers
Refunds of contributions (125) (169)State scheme premiums (132) (196)Transfers out to other pension funds (7,263) (4,092)
Administrative expenses 13 (803) (1,038)
NET ADDITIONS FROM DEALINGS WITH MEMBERS 5,242 4,370
RETURN ON INVESTMENTS 2014/15 2015/16£'000 £'000
Investment income 11 16,581 14,349
Taxes on Income (329) (409)Change in market value of investments
Realised 23,292 1,321Unrealised 10 82,933 (28,625)
Investment management expenses 13 (2,450) (3,076)
NET RETURN ON INVESTMENTS 120,027 (16,440)
Net increase in the Fund during the year 125,269 (12,070)Add: Opening net assets of the scheme 1,012,930 1,138,199
CLOSING NET ASSETS OF THE SCHEME 1,138,199 1,126,129
NET ASSETS STATEMENT AS AT 31ST MARCH 2015 2016£'000 £'000
Investments Assets Equities 244,335 214,617 Pooled Investment Vehicles Unit TrustsUnit Trusts 628,744 572,275 PropertyProperty 116,945 129,933
Other 101,303 54,607
1,091,327 971,432 Cash deposits 6 5,414 5,647 Other investment balances 5 978 1,973
Investments LiabilitiesOther investment balances 5 (223) (35)
Current Assets 5 42,154 149,054
Current Liabilities 5 (1,451) (1,942)
TOTAL NET ASSETS 1,138,199 1,126,129
PENSION FUND ACCOUNTS
DEALINGS WITH MEMBERS, EMPLOYERS AND OTHERS DIRECTL Y INVOLVED IN THE SCHEME
80

1. INTRODUCTION
2. ACCOUNTING POLICIES
(a) Accounts
(b) Basis of preparation
(c)
Contribution Income
Normal contributions, both from the members and from the employer, are accounted for on an accruals basis at the percentage rate recommended by the actuary in the payroll period to which it relates. Any amount due in the year butunpaid will be classified as a current asset.
Employer deficit contributions are accounted for in accordance with the agreement under which they are paid.
(d) Investments
(i)
(ii)
(iii)
(iv)
(v)
(vi)
(e)
(i)
(ii)
(iii)
(iv)
Fund Account - Revenue Recognition
Interest income is recognised in the Fund account as it accrues.
Dividend income is recognised in the Fund account on an accruals basis. Any amount not received by the end of the reporting period
is disclosed in the net asset statement as a current financial asset.Distributions from pooled funds are re-invested and as such are recognised in the change in market value.
Changes in the net market value of investments held at any time during the year are recognised as income and comprise all realised and unrealised gains/losses.
Pooled investment vehicles are valued at bid price, middle market price or single price at close of trading on 31st March 2016.
Property unit trusts are shown by reference to bid price at close of business on 31st March 2016.
Investments are shown in the Net Assets Statement at market value on the following bases.
Listed securities are shown by reference to bid price at the close of business on 31st March 2016.
The Fund does not hold any direct property holdings and therefore does not employ a separate property valuer.
Investments designated in foreign currencies are valued in sterling at the exchange rates ruling on 31st March 2016. Where theCouncil has entered into a transaction denominated in a foreign currency, the transaction is converted into sterling at the exchangerate applicable on the date the transaction was effective.
Investment Income
Cash is represented by deposits held with financial institutions repayable on demand without penalty.
The accounts summarise the transactions and net assets of the Pension Fund and comply in all material respects with Chapter 2("Recommended Accounting Practice") of the Statement of Recommended Practice (Financial Reports of Pensions Schemes) 2007and the Code of Practice on Local Authority Accounting issued by the Chartered Institute of Public Finance and Accountancy (CIPFA).
Except where otherwise stated, the accounts have been prepared on an accruals basis, that is income and expenditure are recognisedas earned or incurred, not as received or paid.
The financial statements of the Fund do not take account of liabilities to pay pensions and other benefits after 31st March 2016. Theactuarial present value of promised retirement benefits, valued on an IAS19 basis is disclosed in note 12 of the Accounts as permittedunder IAS26.
The Fund is administered in accordance with the Local Government Pension Scheme Regulations 2013 (as amended) and the Local Governemnt Pension Scheme (Management and Investment of Funds) Regulations 2009.
NOTES TO THE PENSION FUND ACCOUNTS
The Council is the administering authority for the Pension Fund and has executive responsibility for it. The Council delegates its responsibilityfor administering the Fund to the Pensions Committee which is responsible for considering all pension matters and discharging theobligations and duties of the Council under the Superannuation Act 1972 and other statutes relating to investment issues. The Committeemeets quarterly to determine investment policy objectives, appoint investment managers, monitor investment performance and makerepresentations to the Government on any proposed changes to the Local Government Pension Scheme. The Committee is required toobtain proper advice on the investment strategy of the Fund for which it has established an Investment Panel which includes professionalinvestment advisors. The Panel meets quarterly to determine the general investment strategy, monitor the performance of the Fund andindividual managers and consider technical reports on investment issues. The Fund employs eight specialist investment managers withmandates corresponding to the principal asset classes.
The day to day administration of the Fund and the operation of the management arrangements and administration of the investment portfoliois delegated to the Corporate Director of Resources.
The Fund is operated as a funded, defined benefits scheme which provides for the payment of benefits to former employees of the LondonBorough of Tower Hamlets and those of bodies admitted to the Fund. These individuals are referred to as "members". The benefits includenot only retirement pensions, but also widows' pensions, death grants and lump sum payments in certain circumstances. The Fund isfinanced by contributions from members, employers and from interest and dividend receipts and gains on the Fund's investments.
The objective of the Pension Fund's financial statements is to provide information about the financial position, performance and financialadaptability of the Fund. They show the results of the stewardship of management - that is the accountability of management for theresources entrusted to it - and the disposition of its assets at the period end.
81

2 ACCOUNTING POLICIES Cont…
Fund account - expense items
(f) Management Expenses
Administrative Expenses
Oversight & Governance Costs
Investment Management Expenses
(g) Benefits Payable
Net assets statement
Financial Assets(h)
(i)
(ii)
2.a CRITICAL JUDGEMENTS IN APPLYING ACCOUNTING POLICIESThe Statement of Accounts contains estimated figures that are based on assumptions made by the authority about the future or that are otherwise uncertain. Estimates are made taking into account historical experience, current trends and other relevant factors. However, because balances cannot be determined with certainty, actual results could be materially different from assumptions and estimates.
There is just one item in the authority's net asset statement as at 31st March 2016 for which there which there is a significant risk of material adjustment in the forthcoming financial year.
Pensions Liability - Estimation of the net liability to pay pensions depends on a number of complex judgements relating to the discount rate used, the rate at which salaries are projected to increase, changes in retirement ages, mortality rates and expected returns on pension fund investments. A firm of consulting actuaries is engaged to provide the Council with expert advice about the assumptions to be applied.
The assumptions interact in complex ways. During 2015/16, the Council’s actuaries advised that the net pensions liability had decreased by £123.5 million to £505.0 million as a result of falling real bond yields.
Market-quoted investments
Fixed interest securities
Fixed Interest Securities – are recorded at net market value based on their bid price.
Market quoted investments – the value of an investment for which there is a readily available market price is determined by the bid price ruling on the final day of the accounting period.
Fund managers' fees are paid in accordance with the terms of each individual management agreement. The fees arebased mainly on a percentage of the value of funds under their management and increase or reduce as the value of theinvestments change.
Pensions and lump sums payable include all amounts known to be due as at the end of the financial year. Any amountsdue but unpaid are disclosed in the net assets statement as current liabilities.
Financial assets are included in the net assets statement on a fair value basis as at the reporting date. A financial assetis recognised in the net assets statement on the date the fund becomes party to the contractual acquisition of the asset.From this date any gains or losses arising from changes in the fair value of the assets are recognised by the fund.
The values of investments as shown in the net assets statement have been determined as follows:
NOTES TO THE PENSION FUND ACCOUNTS
Staff costs of the pensions of the pensions administration team are charged direct to the fund. Associated management, accommodation and other overheads are apportioned to this activity and charged as expenses to the fund.
Staff costs relating to oversight and governance are charged direct to the fund. Associated management, accommodation and other overheads are apportioned to this activity and charged as expenses to the fund.
The Code of Practice does not require any breakdown of pension fund administrative expenses. However in the interests of greater transparency, the Council discloses its pension fund management expenses in accordance with the CIPFA guidance on accounting for LGPS management costs.
82

82

3. CONTRIBUTIONS
2014/15 2015/16£'000 £'000
Members normal contributions Council 9,731 9,673 Admitted bodies 221 184 Scheduled body 1,079 1,094Total members 11,031 10,951
Employers Normal contributions Council 22,356 22,105 Admitted bodies 1,015 887 Scheduled bodies 3,484 3,820 Deficit funding contributions Council 18,500 20,500Other contributions Council 780 1,697Total employers 46,135 49,009
Total contributions 57,166 59,960
4. BENEFITS, REFUNDS OF CONTRIBUTIONS AND TRANSFER VAL UES
CouncilAdmitted Bodies
Scheduled Bodies Total Council
Admitted Bodies
Scheduled Bodies Total
£'000 £'000 £'000 £'000 £'000 £'000 £'000 £'000
Pensions (35,259) (1,126) (880) (37,265) (37,467) (585) (1,051) (39,103)Lump sum retirement benefits (6,027) (307) (379) (6,713) (10,828) (441) (425) (11,694)Lump sum death benefits (1,232) (42) (68) (1,342) (1,080) (175) (208) (1,463)Total Pensions and Benefits (42,518) (1,475) (1,327) (45,320) (49,375) (1,201) (1,684) (52,260)Transfer Values Received (Individual) 1,719 0 0 1,719 2,166 0 0 2,166Transfer Values Paid (Individual) (7,263) 0 0 (7,263) (4,092) 0 0 (4,092)Total (48,062) (1,475) (1,327) (50,864) (51,301) (1,201) (1,684) (54,186)
Benefits payable and refunds of contributions have been brought into the accounts on the basis of all valid claims approved during the year. Benefits are index linked to keep pace with inflation based on the consumer price index. Transfers out/in are those sums paid to, or received from, other pension schemes and relate to the period of previous pensionable employment. Transfer values are brought into the accounts on a cash basis. Benefits payable are analysed below.
2014/15 2015/16
Contributions represent the total amounts receivable from the employing authority in respect of its own contributions and those of its pensionable employees. Employees pay contributions based on the level of pay they receive, with contribution rates set between 5.5% and 12.5% dependent on pensionable pay. The employer's contributions are made at a rate determined by the Fund's actuary necessary to maintain the Fund in a state of solvency, having regard to existing and future liabilities. The Primary Contribution Rates used during the financial year ending the 31 March 2016 range from 15.9% to 41.4% of pensionable pay. The Council paid an agreed additional monetary contribution of £20.5m to recover the deficit. Contributions shown in the revenue statement may be categorised as follows:-
Note: The Council is required to operate an Additional Voluntary Contribution (AVC) scheme for employees. In 2015/16 employees made contributionsof £10,870.28 (£60,530.28 in 2014/15) into the AVC Scheme operated by Aviva (Norwich Union) and £6,434.33 to Equitable Life (£9,455.96 in2014/15). The contributions are not included in the Pension Fund Accounts in accordance with regulation 4(2)(b) of the Local Government PensionScheme (Management and Investment of Funds) Regulations 2009 but are deducted from salaries and remitted directly to the provider.
Employer deficit funding contributions are accounted for on the due dates on which they are payable under the schedule of contributions set by the scheme actuary or on receipt if earlier than the due date.
83
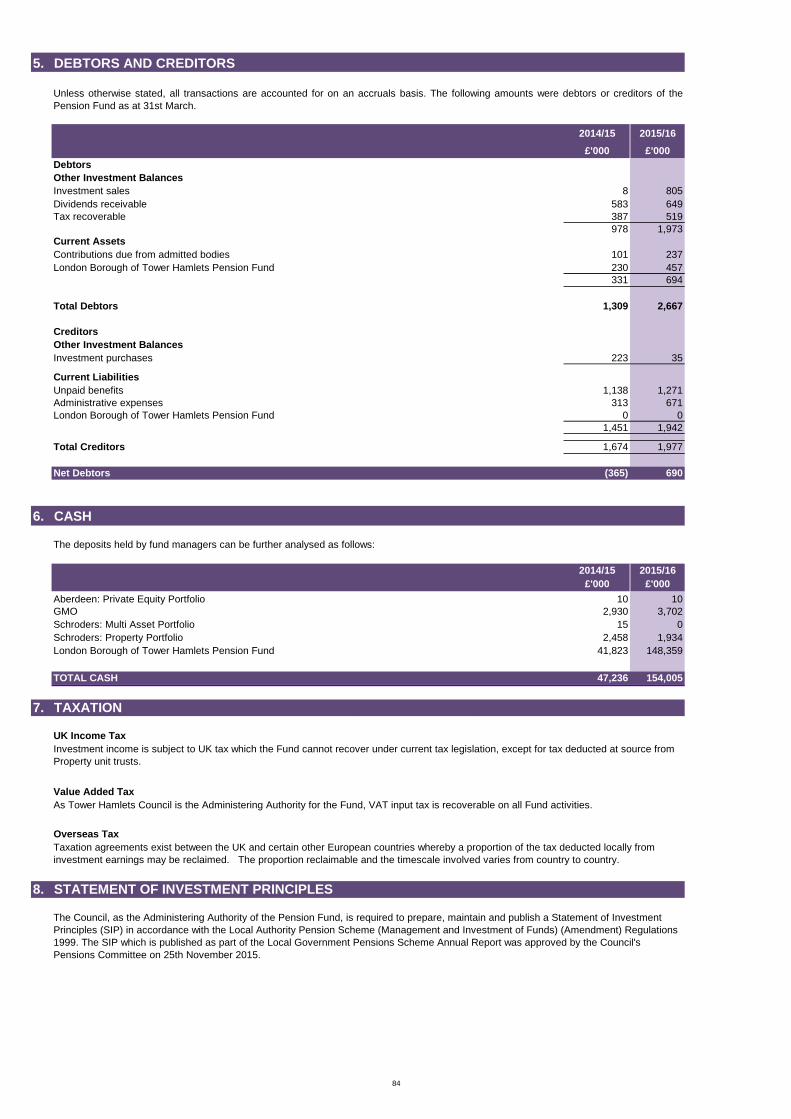
5. DEBTORS AND CREDITORS
2014/15 2015/16
£'000 £'000DebtorsOther Investment BalancesInvestment sales 8 805Dividends receivable 583 649Tax recoverable 387 519
978 1,973Current AssetsContributions due from admitted bodies 101 237London Borough of Tower Hamlets Pension Fund 230 457
331 694
Total Debtors 1,309 2,667
CreditorsOther Investment BalancesInvestment purchases 223 35
Current LiabilitiesUnpaid benefits 1,138 1,271Administrative expenses 313 671London Borough of Tower Hamlets Pension Fund 0 0
1,451 1,942
Total Creditors 1,674 1,977
Net Debtors (365) 690
6. CASH
The deposits held by fund managers can be further analysed as follows:
2014/15 2015/16£'000 £'000
Aberdeen: Private Equity Portfolio 10 10GMO 2,930 3,702Schroders: Multi Asset Portfolio 15 0Schroders: Property Portfolio 2,458 1,934London Borough of Tower Hamlets Pension Fund 41,823 148,359
TOTAL CASH 47,236 154,005
7. TAXATION£'000 £'000
UK Income Tax
Value Added Tax
Overseas Tax
8. STATEMENT OF INVESTMENT PRINCIPLES
The Council, as the Administering Authority of the Pension Fund, is required to prepare, maintain and publish a Statement of Investment Principles (SIP) in accordance with the Local Authority Pension Scheme (Management and Investment of Funds) (Amendment) Regulations 1999. The SIP which is published as part of the Local Government Pensions Scheme Annual Report was approved by the Council's Pensions Committee on 25th November 2015.
Investment income is subject to UK tax which the Fund cannot recover under current tax legislation, except for tax deducted at source from Property unit trusts.
As Tower Hamlets Council is the Administering Authority for the Fund, VAT input tax is recoverable on all Fund activities.
Taxation agreements exist between the UK and certain other European countries whereby a proportion of the tax deducted locally from investment earnings may be reclaimed. The proportion reclaimable and the timescale involved varies from country to country.
Unless otherwise stated, all transactions are accounted for on an accruals basis. The following amounts were debtors or creditors of thePension Fund as at 31st March.
84

9. MEMBERSHIP OF THE FUND
2015 2016
London Borough of Tower HamletsActive Members 6,249 6,365Pensioners 4,131 4,352Deferred Pensioners 6,434 6,770Dependants 993 1,018
17,807 18,505Admitted & Scheduled BodiesActive Members 611 657Pensioners 221 247Deferred Pensioners 352 375Dependants 18 26
1,202 1,305
Admitted BodiesAgilysisCapitaCircle Anglia Ltd.East End HomesEcovert FM Ltd.Gateway Housing Association (formerly Bethnal Green and Victoria Park Housing Association)Greenwich Leisure LimitedLook Ahead Housing and CareOne Housing Group (formerly Island Homes)Redbridge Community Housing Ltd.Swan Housing AssociationTower Hamlets Community Housing
Scheduled BodiesBethnal Green AcademyCanary Wharf CollegeCulloden Primary SchoolLondon Enterprise AcademyOld Ford Primary SchoolSir William Burrough SchoolSolebay AcademySt. Pauls Way Community SchoolTower Hamlets Homes Limited
10. INVESTMENTS
The Fund employs nine specialist investment managers with mandates corresponding to the principal asset classes.
Manager MandateBaillee Gifford Life Ltd. Global Equity, Diversified GrowthGMO UK Ltd. Global EquityInvestec Asset Management Absolute Return BondsLegal & General Investment Management UK Equity, Index Linked GiltsRuffer LLP Diversified GrowthSchroders Asset Management Property Fund Property
The value of the Fund, by manager, as at 31st March was as follows:
£ million % £ million %Baillee Gifford Life Ltd - Diversified Growth 50.7 4.6 0.0 - Baillee Gifford Life Ltd - Equities 217.7 19.8 209.9 21.4 GMO UK Ltd. 274.3 25.0 248.4 25.4 Investec Asset Management 99.6 9.1 0.0 - Legal & General Investment Management - Equities 225.7 20.1 217.3 22.2 Legal & General Investment Management 59.4 5.9 60.6 6.2 Ruffer LLP 50.6 4.6 54.6 5.6 Schroders Asset Management Property Fund 119.5 10.9 131.9 13.5 London CIV 0.0 0.0 56.3 5.8
2015 2016
The following table sets out the membership of the Fund at 31st March:
The following bodies have been admitted into the Fund:
85

10. INVESTMENTS (continued)
Market Value as at
1 Apr 2015
Purchases Sales Change in Market Value
Market Value as at
31 Mar 2016
£'000 £'000 £'000 £'000 £'000Baillee Gifford Life Ltd - Diversified Growth 50,685 6,490 (46,746) (10,429) 0Baillee Gifford Life Ltd - Equities 217,670 481 (3,274) (4,989) 209,888GMO UK Ltd. 270,637 244,815 (256,368) (16,288) 242,796Investec Asset Management 99,631 0 (98,701) (930) 0Legal & General Investment Management 285,141 0 0 (7,277) 277,864Ruffer LLP 50,618 6,474 0 (2,486) 54,606Schroders Asset Management Property 116,945 10,360 (8,978) 11,607 129,934London CIV 0 54,177 0 2,167 56,344
1,091,327 322,797 (414,067) (28,625) 971,432
Other Investment BalancesCash Deposits 5,414 0 0 0 5,647Investment income due 978 0 0 0 1,973Amounts payable for purchases of investments (223) 0 0 0 (35)Net Investment Assets 6,169 7,585
Market Value as at
1 Apr 2014
Purchases Sales Change in Market Value
Market Value as at
31 Mar 2015
£'000 £'000 £'000 £'000 £'000Baillee Gifford Life Ltd - Diversified Growth 46,889 72 0 3,724 50,685Baillee Gifford Life Ltd - Equities 183,066 2,004 0 32,600 217,670GMO UK Ltd. 256,678 196,511 (184,536) 1,984 270,637Investec Asset Management 97,502 0 0 2,129 99,631Legal & General Investment Management 260,556 0 0 24,585 285,141Ruffer LLP 45,030 0 0 5,588 50,618Schroders Asset Management Property 101,628 12,757 (9,762) 12,322 116,945
991,349 211,344 (194,298) 82,932 1,091,327
Derivative ContractsForward Currency Contracts (647) 0 0 0 0
(647)
Other Investment BalancesCash Deposits 5,292 0 0 0 5,414Investment income due 817 0 0 0 978Net Investment Assets 6,109 6,357
The movement in the opening and closing value of investments during the year, together with related direct transaction costs, were asfollows:
86

10. INVESTMENTS (continued)
Market Value as at 1 Apr 2015
Market Value as at
31 Mar 2016£'000 £'000
EquitiesUKQuoted 27,874 16,023OverseasQuoted 216,487 198,593
244,361 214,616
Pooled Funds - Additional AnalysisUKFixed Income Unit Trust 159,079 60,630Unit Trusts 544,666 538,072OverseasUnit Trusts 26,276 28,181
730,021 626,883
Pooled Property Investments 116,945 129,934116,945 129,934
Cash Deposits 5,414 5,647Investment Income Due 978 1,973
6,392 7,620
Total Investment Assets 1,097,719 979,053
Investment LiabilitiesAmounts Payable for Purchases (223) (35)Total Investment Liabilities (223) (35)
Net Investment Assets 1,097,496 979,018
A further analysis of investments assets is as follows.
87

11. INVESTMENT INCOME
2014/15 2015/16£'000 £'000
Dividends from overseas equities 10,617 8,660Net rents from properties 5,234 4,733Interest on cash deposits 170 387Foreign tax 231 160
TOTAL 16,252 13,940
2014/15 2015/16£'000 £'000
Withholding tax - fixed interest securities 0 0Withholding tax - equities 281 360Withholding tax - pooled 47 49TOTAL 328 409
12 ACTUARIAL POSITION
£m2014/15 18.502015/16 20.502016/17 22.00
Investment income is broken down as follows.
The basis of valuing the Fund's assets (see note 2) is compatible with the basis of placing a value on members' benefits as bothare related to market conditions at the valuation date.
The Local Government Pension Scheme Regulations require a triennial revaluation of the Fund to assess the adequacy of theFund's investments and contributions in relation to its overall and future obligations. The contribution rate required for benefitsaccruing in the future is assessed by considering the benefits that accrue over the course of the three years to the next valuation.The employer's contribution rate is determined by the Actuary as part of the revaluation exercise.
The 2013 statutory triennial revaluation of the Pension Fund completed by the Actuary (Hymans Robertson) in the year estimatedthe deficit on the Fund to be £365 million and the funding level to be 72%. This compares to a deficit at the previous revaluation in2010 of £305 million and a corresponding funding level of 71%.
The Actuary has determined that the deficit can be recovered over a period of 20 years and the agreed contributions to recover thedeficit for the term of the revaluation is as set out below :-
The FSS requires that the Fund operates the same target funding level of all on-going employers of 100% of its accrued liabilitiesvalued on the on-going basis, to be achieved over a 20 year period (a period equivalent to the expected future working lifetime ofthe remaining scheme members). The valuation of the Fund as at 31st March 2013 determined that this would require acontribution (additional to the future contribution rate) of 15.2% of members' pensionable pay equivalent to £18.5 million perannum.
The Council, as Administering Authority, prepares a Funding Strategy Statement (FSS) in respect of the Fund in collaboration withthe Fund's Actuary and after consultation with the employers and investment advisors. The Actuary is required to have regard tothis statement when carrying out the valuation. The FSS includes the Fund's funding policy, the objectives of which are:
- to ensure the long-term solvency of the Fund
- to ensure that sufficient funds are available to meet all benefits as they fall due for payment
- not to restrain unnecessarily the investment strategy of the Fund so that the Council can seek to maximise investment returns (and hence minimise the cost of the benefits) for an appropriate level of risk.
TAXES ON INVESTMENT INCOME
88

12. ACTUARIAL POSITION (continued)
Financial Assumptions Nominal RealPrice inflation (CPI) 2.5%Pay increases 3.8% 1.3% Real rates are nominal ratesFunding basis discount rate 4.6% 2.1% adjusted for inflation
Longevity (in years) Male Female
22.2 24.2
24.3 26.4
Assumptions
To assess the value of the employer's liabilities the actuary rolls forward the values from the liabilities calculated from the funding valuationas at 31 March 2013 using financial assumptions that comply with IAS 19
Demographic assumptions
The demographic assumptions used are consistent with those used for the funding valuation as at March 2013
Average future life expectancies at age 65 years Males Females
Current pensioners 22 24Future pensioners 24 26
Financial assumptions
Year ended31st March
201531st March
2016
Pension increase rate 2.4% 2.2%
Salary increase rate 3.8% 3.7%
Discount rate 3.2% 3.5%
13. MANAGEMENT EXPENSES
2014/15 2015/16£'000 £'000
Administration costs 714 677Investment management expenses 2,450 3,076Oversight & governance 90 86
3,254 3,839
14. INVESTMENT EXPENSES
2014/15 2015/16£'000 £'000
Management fees 2,357 2,901Custody fees 93 175
2,450 3,076
In accordance with the funding policy, the Actuary determines the employer contribution requirement for future service for the Fundas a whole, and for employers who continue to admit new members. The cost of future service benefits is assessed, taking intoaccount expected future salary increases. In order to place a current value on future benefit cashflows the Actuary "discounts" thefuture cashflows to the valuation date at a suitable rate. The Actuary adopts a "gilt-based" valuation which uses the yield on suitablydated Government bonds as the discount rate. This is then uplifted to the "funding basis discount rate" taking into account the Fund'scurrent and expected future investment strategy to reflect the percentage by which the Fund is anticipated to "outperform" the yield on Government bonds. The contribution rate required to meet the expected cost of future service benefits is derived as this value lessexpected member contributions expressed as a percentage of the value of members' pensionable pay. This is known as the"Projected Unit method". The future contribution rate for 2015/16 was 18.5%.
In addition, the Actuary compares the value of the Fund's assets with the estimated cost of members' past service. The ratio of theasset value to the estimated cost of members' past service benefits is known as the "funding level". If the funding level is more than100% there is a "surplus"; if it less than 100% there is a "shortfall". The next valuation will be as at 31st March 2016 and therecommendations implemented from 1st April 2017.
Although the funding shortfall is significant, it should be noted that current legislation provides that the level of members' basicpension entitlement and contributions are not affected by the financial position of the Fund. It is the Council's responsibility to ensurethat pension entitlements are fully funded and that the impact on Council Tax is minimised. It should also be recognised that theCouncil is a long-term investor both because a high proportion of pension benefits do not become payable until far in the future andthe Council has a relatively secure long-term income stream.
The latest full triennial actuarial valuation of the Fund's liabilities in accordance with IAS26 took place at 31st March 2013. The main actuarial assumptions used in revaluation and applied during the intervaluation period were as follows:
Average future life expectancy for a pensioner aged 65 at the valuation dateAverage future life expectancy at age 65 for a non-pensioner aged 45 at the valuation date
IAS 26 requires the present value of the Fund's promised retirement benefits to be disclosed and for this purpose the actuarial assumptions and methodology should be based on IAS19.
The actuarial present value of promised retirement benefits calculated in line with IAS19 assumptions is estimated to be £1.659 million (£1,783 million in 2014/15). This includes both vested and non-vested benefits.
Actuarial Value of Promised Retirement Benefits
89

15. RISK MANAGEMENT
Nature and extent of risks arising from financial i nstruments
Risk and Risk Management
Credit risk
Liquidity risk
Market risk
Interest rate risk
Interest Rate RiskAs At 31st March
2015As At 31st March
2016
Asset Type £'000 £'000Cash and cash equivalents 5,414 5,647Cash balances 42,154 149,053Fixed interest securities 159,079 60,630
Total 206,647 215,330
Interest Rate Risk - Sensitivity Analysis
+100 BPS -100 BPS
Asset Type £'000 £'000Cash and cash equivalents 5,647 56 (56)Cash balances 149,053 1,491 (1,491)Fixed interest securities 60,630 (606) 606
Total change in net assets available 215,330 941 (941)
Interest rate risk - sensitivity analysis
Interest Rate Risk - Sensitivity Analysis
+100 BPS -100 BPSAsset Type £'000 £'000Cash and cash equivalents 5,414 54 (54)Cash balances 42,154 422 (422)Fixed interest securities 159,079 (1,591) 1,591
Total change in net assets available 206,647 (1,115) 1 ,115
The fund's primary long-term risk is that the fund's assets will fall short of its liabilities. The aim of investment riskmanagement is to minimise the risk of a reduction in the value of the fund and to maximise the opportunity for gainsacross the whole portfolio. The fund achieves this through asset diversification to reduce exposure to market risk andcredit risk to an acceptable level.
Interest rates can vary and can affect both income to the fund and the value of net assets available to pay benefits. A100 basis point (BPS) movement in interest rates is consistent with the level of sensitivity applied as part of the fund'srisk management strategy. The table below shows the effect of a +/- 100 BPS change in interest rates.
Change in year in net assets available to pay benefits
Carrying Amount As At 31st March 2016
Carrying Amount As At 31st March 2015
This is the risk that fair value or future cash flows of a financial instrument will fluctuate because of changes in marketprices. Market risk comprises; interest rate risk, currency risk and other price risk. The Fund mitigates these risks asfollows:
Cash deposits held in the Pension Fund bank account are invested in accordance with the Council’s approvedTreasury Management Strategy.
The Fund holds a percentage of its portfolio in fixed interest securities to mitigate this risk should interest rates fall.
The Fund's direct exposure to interest rate movements as at 31st March 2015 and 31st March 2016 is set out below.
Change in year in net assets available to pay benefits
Should the Fund have insufficient money available to meet its commitments it may, under Regulation 5.2 borrow cashfor up to 90 days. If there was a longer term shortfall then the Fund’s assets could be sold to provide additional cash.A significant proportion of the Fund is made up of readily realisable assets.
Credit risk is the risk that a counter party to a financial instrument may fail to pay amounts due to the Pension fund.The market value of investments generally reflect an assessment of credit in their pricing and consequently the risk ofloss is implicitly provided for in the carrying value of the fund's financial assets and liabilities. The fund carries out areview of its investment managers annual internal control reports to ensure that managers are diligent in theirselection and use of counterparties and brokers. Deposits are made with banks and financial institutions that arerated independently and meet the Council's credit criteria.
The Council only invests money with institutions with a minimum Fitch credit rating of A+ or higher.
This is the risk that the Fund might not have the cash flow required in order to meet its financial obligations when theybecome due. Over the years contributions have tended to be greater than benefits and this has ensured thatsufficient cash has been available to meet payments.
The Fund currently operates two bank accounts. One is held by the Fund’s custodian (State Street Bank) and holdscash relating to the investment activities and the other is the LBTH Pension Fund bank account and this is used tohold cash relating to member activities.
90

15. RISK MANAGEMENT (continued)Currency risk
Currency Exposure - Asset Type As At 31st March 2015
As At 31st March 2016
Asset Type £'000 £'000Overseas quoted securities 245,548 230,423Overseas unit trusts 3,808 3,574Cash 14 0Total overseas assets 249,370 233,997
Currency Exposure - Sensitivity Analysis
+6.8% -6.8%
Asset Type £'000 £'000 £'000Overseas quoted securities 230,423 246,092 214,754Overseas unit trusts 3,574 3,817 3,331Cash 0 0 0Total change in net assets available 233,997 249,909 218,085
Currency Exposure - Sensitivity Analysis
+6.3% -6.3%
Asset Type £'000 £'000Overseas quoted securities 245,548 261,018 230,078Overseas unit trusts 3,808 4,048 3,568Cash 14 15 13Total change in net assets available 249,370 265,081 233,659
Other Price risk
Price Risk - sensitivity analysis
Asset TypeUK equities 10.6%Global equity 11.3%Total fixed interest 3.8%Alternatives 4.6%Cash 0.0%Pooled Property Investments 2.2%
The Fund invests in financial instruments denominated in currencies other than Sterling and as a result is exposed to exchange raterisk. This is the risk that the fair value of future cash flows of a financial instrument will fluctuate because of changes in foreignexchange rates. To alleviate this risk the Fund allows investment managers to use derivative contracts, in accordance with the contractconditions:
Following analysis of historical data in consultation with the fund's investment advisors, the Council considers the likely volatility associated with foreign exchange rate movements to be 6.8%. This analysis assumes all other variables, in particular interest rates, remain constant.
Carrying Amount As At 31st March
2016
Change in year in net assets available to pay benefits
Carrying Amount As At 31st March
2015
Change in year in net assets available to pay benefits
To mitigate the risk of a loss owing to a fall in market prices the Fund maintains a diverse portfolio of investments. Diversificationensures that the Fund has a balance of investments that offer different levels of risk and return.
The Fund employs a number of investment managers, with differing but complementary styles, to mitigate the risk of underperformanceof any single manager and to ensure that any fall in market prices should not affect the Fund as a whole.
Manager performance and asset allocation policy is regularly reviewed by the Pensions Investment Panel. The Fund also uses certainderivative instruments as part of efficient portfolio management.
Other price risk - sensitivity analysis
Potential price changes are determined based on the observed historical volatility of asset class returns. 'Riskier' assets such asequities will display greater potential volatility than bonds. The potential volatilities are consistent with a one standard deviationmovement in the change in value of the assets over the latest three years.
Following analysis of historical data and expected investment return movement during the financial year, in consultation with the Fund'sinvestment advisors, the Council has determined that the following movements in market price risk are reasonably possible for the2015/16 reporting period. This analysis assumes that all other variables, in particular foreign currency exchange rates and interestrates remain the same.
Potential Market Movements (+/-)
The percentage change in the year of 6.8% represents the average change in currency exposure, derived by multiplying the weight ofeach currency by the change in its exchange rate relative to GBP.
The following table summarises the Fund's currency exposure as at 31 March 2016 and as at the previous year end.
91

15. RISK MANAGEMENT (continued)
Value as at 31 March 2016
Percentage change
Value on increase Value on decrease
Asset Type £'000 % £'000 £'000Cash and cash equivalents 154,005 0.0% 154,005 154,005Investment portfolio assetsUK equities 217,234 10.6% 240,261 194,207Global equity 452,685 11.3% 503,838 401,532Total fixed interest 60,630 3.8% 62,934 58,326Alternatives 110,950 4.6% 116,054 105,846Pooled Property Investments 129,934 2.2% 132,793 127,075Net derivative assets 0 0.0% 0 0Investment income due 1,973 0.0% 1,973 1,973Amounts receivable for sales 0 0.0% 0 0
Amounts payable for purchases (35) 0.0% (35) (35)Total assets available to pay benefits 1,127,376 0% 1, 211,822 1,042,929
Value as at 31 March 2015
Percentage change
Value on increase Value on decrease
Asset Type £'000 % £'000 £'000Cash and cash equivalents 47,236 0.0% 47,236 47,236Investment portfolio assetsUK equities 225,693 10.1% 248,488 202,898Global equity 488,307 10.0% 537,138 439,476Total fixed interest 159,079 3.4% 164,488 153,670Alternatives 101,303 4.1% 105,456 97,150Pooled Property Investments 116,945 2.4% 119,752 114,138Net derivative assets 0 0.0% 0 0Investment income due 978 0.0% 978 978Amounts receivable for sales 0 0 0Amounts payable for purchases (223) 0.0% (223) (223)Total assets available to pay benefits 1,139,318 1,22 3,313 1,055,323
Refinancing risk
Had the market price of the Fund's investments increased/decreased in line with the above, the change in net assets available to pay benefits in the market price would have been as follows:
The Council does not have any financial instruments that have a refinancing risk as part of its treasury management and investment strategies.
Had the market price of the Fund's investments increased/decreased in line with the above, the change in net assets available to pay benefits in the market price would have been as follows:
92

16. VALUATION OF FINANCIAL INSTRUMENTS CARRIED AT FAIR VALUE
IFRS7 requires the Fund to classify fair value instruments using a three-level hierarchy.The three levels are summarised as follows:
Level 2 - inputs other than quoted prices for identical assets or liabilities in active markets
Level 1 Level 2 Level 3 Total£'000 £'000 £'000 £'000
Equities 214,617 0 0 214,617Pooled Funds
Unit Trusts 572,275 0 0 572,275Property Unit Trust 128,083 0 1,850 129,933Other 54,607 0 0 54,607
Derivative ContractsForward Foreign Exchange Contracts 0 0 0 0Cash and bank Deposits 154,464 0 0 154,464
Current Assets 2,210 0 0 2,210Current Liabilities (1,977) 0 0 (1,977)
1,124,279 0 1,850 1,126,129
During the year ended 31st March 2016 there were no transfers between the levels of the fair value hierarchy.
The equivalents at 31st March 2015 were as follows:Level 1 Level 2 Level 3 Total£'000 £'000 £'000 £'000
Equities 244,335 0 0 244,335Pooled Funds
Unit Trusts 628,744 0 0 628,744Property Unit Trust 116,945 0 0 116,945Other 101,303 0 0 101,303
Derivative ContractsForward Foreign Exchange Contracts 0 0 0 0Cash and bank Deposits 47,467 0 0 47,467
Current Assets 1,079 0 0 1,079Current Liabilities (1,674) 0 0 (1,674)
1,138,199 0 0 1,138,199
Fair Value Hierarchy
The following sets out the Fund's assets and liabilities according to the fair value hierarchy as at 31st March 2016.
Level 1 - inputs that reflect quoted prices for identical assets or liabilities in active markets. Products classified as level 1 comprise quoted equities, quoted fixed securities, quoted index-linked securities and unit trusts
Level 3 - inputs that are not based on observable data. Such instruments would include unquoted equity investments and hedge fund of funds.
93

16. FINANCIAL INSTRUMENTS DISCLOSURES
Net gains and losses on financial istruments
2014/15 2015/16£'000 £'000
Financial AssetsLoans and receivables 180 398Financial assets at fair value through profit or loss 106,225 (27,304)Total Financial Assets 106,405 (26,906)
Financial LiabilitiesPayablesFinancial liabilities at fair value through profit or loss 409 0Total Financial Liabilities 409 0
Long-term
94

17. CURRENT ASSETS
2014/15 2015/16£'000 £'000
Contributions due - employeesContributions due - employers 101 236Sundry debtors 230 458Cash balances 41,823 148,359
42,154 149,053
Analysis of debtors 2014/15 2015/16£'000 £'000
42,154 149,05342,154 149,053
18. CURRENT LIABILITIES
2014/15 2015/16£'000 £'000
Sundry creditors 313 671Benefits payable 1,138 1,271
1,451 1,942
Analysis of creditors 2014/15 2015/16£'000 £'000
Other entities and individuals 1,451 1,9421,451 1,942
Other entities and individuals
95

19. RELATED PARTY TRANSACTIONS
2014/15 2015/16
Fund Administration Expenses £'000 £'000Payroll / HR Support 370 494Corporate Finance 299 175
669 669
Employees holding key positions in the financial management of the fund as at 31st March 2015 include:
The financial value of their relationship with the fund is as set out below
2014/15 2015/16£'000 £'000
Short term benefits 20 19Long term/post retirement benefits 4 4
20. CONTINGENT LIABILITIES
21. CONTINGENT ASSETS
Compensation of key management - It was not practical to include costs relating to key management personnel within the Pension Fund Accounts, principally as they are charged to the Council's Accounts and have not been charged to the Pension Fund. All costs are disclosed within note 33 of the Council's main accounts.
The Council has also provided an assurance that it will meet the pension liabilities of Tower Hamlets Homes in the event the ALMO is unable to fund the liabilities arising from its pension obligations. The liability as at 31st March 2016 was £2.542m (£9.654m 2014/15).
Admitted body employers in the Fund hold insurance bonds to guard against the possibility of not being able to meet their pension obligations. These bonds are drawn in favour of the pension fund and payment will only be triggered in event of employer default.
Fund administration expenses payable to the administrating authority are as set out in the table below.
Key Management Personnel
Chief Accountant
Governance
Each member of the pension fund committee is required to declare their interests at each meeting of the Committee. These are recorded as part of the public record of each meeting. For 2014/15 there were no Members of the Pension Fund Committee who had involvement with other organisations.
The Council has a subsidiary company, Tower Hamlets Homes, who are within the Fund. During the year the Fund received contribution payments totalling £3.4m (£3.5m 2014/15) from this company.
The London Borough of Tower Hamlets Pension Fund is administered by The London Borough of Tower Hamlets.
In accordance with IAS24 'Related Party Disclosure', material transactions with related parties not disclosed elsewhere in the financial statements are detailed below.
The Council incurred costs of £669k (£669k 2014/15) relating to administration of the Fund and has been reimbursed by the Fund for these expenses. The Council contributed £20.5m (£18.5m 2014/15) to the Fund in respect of back funding. All monies owing to and from the Fund were paid in the year.
During the year no Committee Members or Council Chief Officers with direct responsibility for pension fund issues, haveundertaken any declarable transactions with the Pension Fund, other than administrative services undertaken by the Councilon behalf of the Pension Fund.
The pension fund cash held by London Borough of Tower Hamlets is invested on the money markets by the treasury management operations of the Council. During the year to 31st March 2016, the Fund held an average investment of £48.1m (£24.8m 31st March 2015), earning interest of £398k (£180k in 2014/15).
97

22. IMPAIRMENT LOSSES
During 2015/16 impairment losses were nil (impairment losses in 2014/15 were also nil).
98

Independent auditor’s report to the members of the London Borough of Tower
Hamlets
To Follow – 3 pages
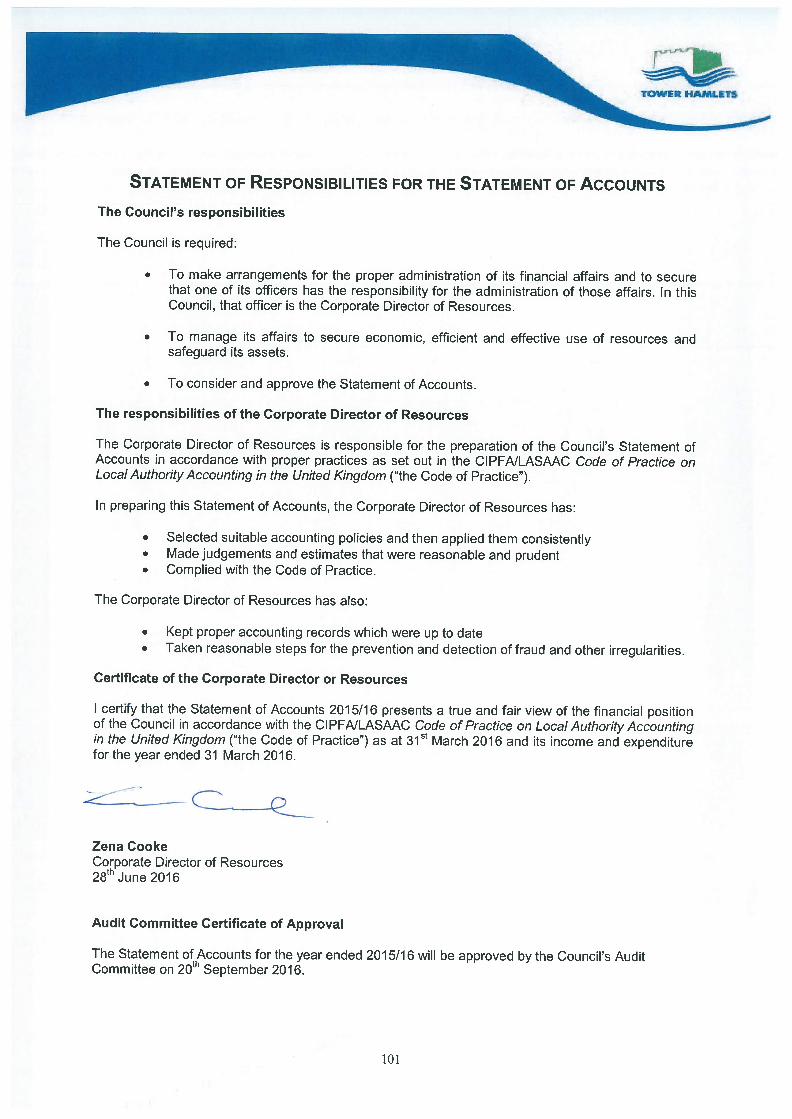

Draft Annual Governance Statement 2015/16 We (the Council) are required by law to prepare a statement that details the Council’s framework for making decisions and controlling its resources. The statement includes the Council’s governance arrangements as well as control issues. This statement enables stakeholders to have assurance that decisions are properly made and public money is being properly spent on behalf of citizens. The statement below complies with the Accounts and Audit Regulations 2011. This statement relates to the financial year 2015/16. The Annual Government Statement for 2014/15 was formally presented to the Audit Committee on 22nd March 2016.The governance issues raised in that statement have been reviewed as part of the review of effectiveness the Council’s governance arrangements for 2015/16 and where relevant, captured in the 2015/16 statement. Background On the 4th April 2014 the Department of Communities and Local Government (DCLG) appointed PricewaterhouseCoopers LLP (PwC) to carry out an inspection of compliance by the London Borough of Tower Hamlets with the requirements of Part 1 of the Local Government Act 1999 ‘in relation to the Authority’s functions in respect of governance, particularly in respect of the authority’s functions under Section 151 of the Local Government Act 1972’ and as they relate to the following: • The authority’s payment of grants and connected decisions; • Transfer of property to third parties; • Spending and decisions in relation to publicity; and • Processes and practices relating to entering of contracts. PwC’s final report was published by the DCLG on 4th November 2014. In their report, PWC reported the Authority was not achieving Best Value in the following areas: • The authority’s payments of grants and connected decisions; • The transfer of property to third parties; and • Spending and the decisions of the authority in relation to publicity.
In respect of processes and practices relating to entering of contacts, PwC reported the Authority was complying with its Best Value duty but highlighted areas where the Authority could improve. The Secretary of State for Communities and Local Government (CLG) considered the PwC report and representations from the Authority and issued Directions on 17 December 2014. Further directions were issued on 6 May 2015 in respect of the appointment of statutory officers. More information about the directions issued by the Secretary of State for CLG to the Authority and the actions to comply are included within this statement. Full details of the directions can be found at https://www.gov.uk/government/news/secretary-of-state-sends-in-commissioners-to-tower-hamlets. In response, we were required to produce in total, seven best value improvement plans, including actions arising from the electoral court judgement in respect of the Mayoral election in May 2014, as detailed below: - • Procurement Action Plan • Grants Action Plan • Property and Disposal Action Plan • Communications Action Plan • Organisational Culture Action Plan • Recruitment of statutory officers • Elections

We are co-operating fully with the Commissioners to ensure we comply with the directions issued by the Secretary of State for CLG and the matters raised in the PwC report, and address the issues raised as soon as possible. We have established a Best Value Programme Review Board to monitor the progress towards implementation of the actions contained within the various improvement plans. The first public meeting of the Board was on 15 July 2015 and was chaired by the then Head of Paid Service. Subsequent quarterly meetings have been chaired by the Mayor. We were required to respond to the Secretary of State for CLG within three months, by developing action plans that had to be agreed with the Commissioners. Further, the directions require, we provide six monthly reports to the Secretary of State for CLG. The first such report was submitted on 17 September 2015, details of which can be found at http://www.towerhamlets.gov.uk/News_events/News/september_2015/tower_hamlets_getting_back_on.aspx. Following its submission, the Secretary of State for CLG welcomed the progress we had made. Further, the Secretary of State for CLG allowed the directions raised on 6 May 2015 to lapse on 31 October 2015, in light of the progress the Authority had made and the assurances received from the Commissioners. The full response can be found at https://www.gov.uk/government/uploads/system/uploads/attachment_data/file/472377/151023_-_Response_from_the_SofS_to_the_Mayor_of_Tower_Hamlets.pdf. More recently at the Best Value Programme Review Board meeting on 19 April, the direction relating to elections was also allowed to lapse. We submitted our second six monthly progress update to the Secretary of State on 17th March 2016, confirming that over 80 per cent of the actions set out in the agreed Best Value Plan have already been delivered. Key achievements include: • the introduction of a procurement transformation programme to ensure we are at the forefront of
procurement best practice; improvements have also been made to procurement processes with tightened controls and spend analysis to reduce costs;
• the introduction of a voluntary and community sector strategy supporting a move from grant funding to a more commissioned service approach; in addition, a cross party group will now consider grant proposals before they are determined;
• development of a new communications strategy with a plan to deliver our publicity function; and • improvement to the culture of the organisation: Elected members have worked effectively across
party lines to develop a transparency communion; the mayor has introduced regular assemblies for residents to raise issues in public; we are actively working jointly with other London boroughs.
The progress report and the Commissioners response to this can be found at: http://www.towerhamlets.gov.uk/News_events/media_centre/Setting_the_record_straight/best_value_inspection_update.aspx We continue to deliver on the agreed Best Value Action Plan and address the issues underlying the government’s intervention. Performance will continue to be overseen by the Best Value Programme Board, which meets monthly. The progress made in recent months provides a firm foundation for further improvements to be evidenced and embedded prior to the Council’s third update to the Secretary of State in September 2016. 1. Responsibility of the Council We are responsible for ensuring our business is conducted in accordance with the law and proper standards, and that public money is safeguarded and properly accounted for, and used economically, efficiently and effectively. We also have a duty under the Local Government Act 1999 to make arrangements to secure continuous improvement in the way in which our functions are exercised, having regard to a combination of economy, efficiency and effectiveness. In discharging this overall responsibility, we are responsible for putting in place proper arrangements for the governance of our affairs and facilitating the effective exercise of our functions.

We have approved and adopted a code of corporate governance which is consistent with the principles of the CIPFA/SOLACE Framework, Delivering Good Governance in Local Government. A copy of the code is on our website at www.towerhamlets.gov.uk or can be obtained from the Council's monitoring officer. This statement explains how we comply with the code and also meet the requirements of regulation 4(2) of the Accounts and Audit Regulations 2011 in relation to the publication of the Annual Governance Statement. 2. What is Corporate Governance Framework? The governance framework comprises the systems and processes, and culture and values, by which we direct and control our activities and through which, we account to, engage with and lead our community. The governance framework allows us to monitor the achievement of our strategic objectives and to consider whether those objectives have led to the delivery of appropriate, cost-effective services. The system of internal control is a significant part of the governance framework and is designed to manage risk to a reasonable level. It cannot eliminate all risk of failure to achieve policies, aims and objectives and can therefore only provide reasonable and not absolute assurance of effectiveness. The system of internal control is based on an on-going process designed to identify and prioritise the risks to achievement of Tower Hamlets’ policies, aims and objectives, to evaluate the likelihood of those risks being realised and the impact should they be realised, and to manage any such risks efficiently, effectively and economically. Our governance framework exists through its systems, processes, culture and values. These are regularly reviewed. The governance framework has been in place throughout the year ended 31 March 2016 and up to the date of approval of the statement of accounts. 3. The Council’s Governance Framework Our governance arrangements aim to ensure that we set out and meet our objectives and responsibilities in a lawful, timely, open, inclusive and honest manner and that our use of public money and resources is safeguarded, properly accounted for and used economically, efficiently and effectively. The key elements of the systems and processes that comprise the Authority’s governance arrangements are described below. 3.1 Vision and Priorities Our vision is to improve the quality of life for everyone living and working in Tower Hamlets. This involves helping to create a thriving, achieving community in which people feel at ease with one another, have good learning and employment opportunities, experience a higher standard of living and good health, and enjoy a safe and an attractive environment together with a wide range of cultural and leisure opportunities. We are part of the Tower Hamlets Partnership with a vision to 2020 which set out in the borough’s Sustainable Community Strategy, known as the Community Plan1. The Community Plan has four main themes to make Tower Hamlets: • A Great Place to Live - Tower Hamlets will be a place where people live in quality affordable
housing, located in clean and safe neighbourhoods served by well connected and easy to access services and community facilities;
• A Prosperous Community - Tower Hamlets will be a place where everyone, regardless of their background and circumstances, has the aspiration and opportunity to achieve their full potential;
• A Safe and Cohesive Community - Tower Hamlets will be a safer place where people feel safe, get on better together and difference is not seen as a threat but a core strength of the borough; and
1 http://www.towerhamlets.gov.uk/lgnl/community_and_living/community_plan/community_plan.aspx

• A Healthy and Supportive Community - Tower Hamlets will be a place where people are supported to live healthier, more independent lives and the risk of harm and neglect to vulnerable children and adults is reduced.
Running through this vision is the core theme of “One Tower Hamlets” with a focus and drive around reducing inequality, strengthening community cohesion and working in partnership. Our Strategic Plan flows from the Community Plan and contains more detailed priorities and objectives for the Authority to deliver against. More information about our performance against the Plan and achievements in 2015/16 is available on the website http://www.towerhamlets.gov.uk/lgnl/council_and_democracy/council_performance.aspx and the 2016/17 Strategic Plan is located at http://www.towerhamlets.gov.uk/lgnl/community_and_living/community_plan/strategic_plan.aspx Over the past year we have also developed a new framework for the Strategic Plan which is centred on
two priority outcomes which aim to;
Creating opportunity by supporting aspiration and t ackling poverty through: • a dynamic local economy, with high levels of growth benefiting us • more residents in good-quality, well-paid jobs • young people realising their potential • more people living healthily and independently for longer • reducing inequality and embracing diversity Creating and maintaining a vibrant, successful plac e through: • an improved local environment • better quality homes for all • less crime and anti-social behaviour • engaged, resilient and cohesive communities These priorities are supported by an enabling objective which aims to deliver a transformed council, making best use of resources and with an outward looking culture. 3.2 Corporate and Service Plans The overall planning framework is illustrated in the following diagram. As the diagram below shows, we align our Strategic Plan with the Community Plan structure around the themes, priorities and objectives of the Community Plan. The Strategic Plan is refreshed each year through Cabinet, at which time it is also reviewed by the Overview and Scrutiny. The Community Plan is refreshed every three years.

Our vision, priorities and objectives are used to structure all directorate service plans and Personal Development Plans (PDPs). This ensures that there is a “golden thread” that runs from the Community Plan to each individual employee’s work. This helps ensure that the vision, priorities and objectives are communicated to and delivered at all levels of the organisation. Further communication of core values and key initiatives takes place through the Council’s staff newsletter “Tower Hamlets Now”. 3.3 Performance Management We operate a comprehensive performance management framework to ensure that strategic priorities are embedded in service, team and individual performance development plans; that resources are linked to operational aims and plans; and that progress against plans and targets is monitored and evaluated at all levels. There is a mechanism by which all Council strategic performance indicators are challenged, annually risk assessed and a sample selected for testing by the performance management team supported by internal audit. The Council’s Corporate Management Team (CMT), comprising the Directors and Corporate Directors for each service (including the Council’s Section 151 officer and the Monitoring Officer), is responsible for the overall management of the Council. The CMT also has responsibility for reviewing and challenging the Council’s performance and delivery of the strategic plan. The Cabinet and the Overview and Scrutiny Committee receive regular reports highlighting Council performance. 3.4 Council Constitution We have an agreed Constitution that details how the Council operates and sets out:
COMMUNITY PLAN A strategic document prepared in partnership with local agencies (including the Police, NHS,
Probation Service, Voluntary Sector etc) and people living and working in the borough.
THE COUNCIL'S STRATEGIC PLAN The Council's corporate aims, objectives and key activities to achieve them, along with an
analysis of performance against targets and future targets.
SERVICE AND DIRECTORATE PLANS Linking operational aims and objectives for services/directorates to resource use.
Purpose Strategic
Focus Broad
Specific
TYPE OF PLAN
TEAM PLANS Operational objectives and activities for teams working within services.
PERSONAL DEVELOPMENT PLANS Set out performance objectives and training and development needs for individual staff.
Operational
• the rules and procedures to be followed by the Council and committees when conducting their business;
• the decision making powers of the Executive and of Committees; • the financial and contract regulations; • the scheme of delegation to chief officers; • the role of overview and scrutiny; • the role and responsibilities of the Audit Committee; • codes of conduct for councillors and employees; • the whistleblowing arrangements; and • members' interests and allowances. Under the Council’s constitution, the Executive is the elected Mayor, who makes decisions in respect of all executive matters which cover the operational delivery of Council services within the delegation set out under the executive powers of the constitution. In making his decisions the Mayor is supported by the Cabinet, Directors and Corporate Directors and other officers of the Council. The Full Council retains some strategic decision making responsibilities such as budget approval and the setting of Council Tax. A scheme of delegation is in place to enable officers to manage their services operationally. All key decisions required are published in advance in the Executive’s Forward Plan, and are discussed in a meeting open to the public. There was a review of the constitution during 2013/14 which indicated that the constitution is fit for purpose and conforms to statute and best practice. The review has indicated that there are some areas of the constitution where we have options to expand or amend wording to clarify certain issues. A verbal update on the work of the Constitutional Working Party was given by the Monitoring Officer to the General Purposes Committee in September 2014. The Monitoring Officer continues to work with the General Purposes Committee to complete the constitutional review. The Council considers and approves any changes proposed to the key strategic policies set out in article 4 of the constitution, including: • the constitution; • the corporate performance plan; • the corporate strategy; • the medium term financial plan including the capital programme and annual revenue budget; • the licencing policy; and • the local development framework. 3.5 Codes of Conduct We have a code of conduct for officers supported by a requirement to make declarations of interest and to declare gifts and hospitality. Interests must be declared by officers at least annually. Officers are required to generally decline gifts and hospitality to ensure they are not inappropriately influenced. These codes and processes are made available to staff as part of their induction; they are also on the intranet and training is available to ensure every member of staff understands their responsibilities. The responsibility to declare interests has also been extended to all tenderers and bidders as part of the procurement process. Periodically the audit plan contains reviews relating to compliance with the codes of conduct. Councillors are required to make declarations of interest when elected and to consider their interests and make appropriate declarations at each meeting they attend. Councillors must also declare any gifts and hospitality with the records made public on the Council’s website.

3.6 Rules, Regulations, Policies, and Procedures Our rules and procedure is part four of the Council’s Constitution. We have a duty to ensure that we act in accordance with the law and relevant regulations in the performance of its functions. We have developed policies and procedures to ensure that, as far as are reasonably possible, all Members and officers understand their responsibilities both to the Council and to the public. These include the Constitution, Standing Orders, Financial Regulations and Financial Procedures, Codes of Conduct and Protocols. Key documents are available to Members and staff through the Council’s intranet and to a wider audience through publication on the Council’s website. All policies are subject to periodic review to ensure that they remain relevant and reflect changes to legislation and other developments in the environment within which the Council operates. 3.7 Overview and Scrutiny During 2015/16 the work of the Executive was scrutinised by an Overview and Scrutiny Committee and the Health Scrutiny Panel. A “call-in” procedure allows Scrutiny to review Executive decisions before they are implemented, and to recommend alternative courses of action. The Overview and Scrutiny function reviews decisions made by the Mayor in Cabinet and raises proposals for the Mayor in Cabinet from its annual plan of work. The focus of their role is thus to provide a challenge and to support the development of policies. At their meetings they also consider performance monitoring information and have a key role in reviewing and challenging the Mayor in Cabinet’s budget prior to consideration at Full Council. In 2015/16 an executive decision was called in on the decision to abandon litigation against Rich Mix which was refereed back to the Mayor for consideration in Cabinet. As a result some changes were made to the original decision to include greater performance monitoring. The Committee held Scrutiny Spotlights with the Mayor and Cabinet Members focusing on a range of issues which allowed them to hold to account the Cabinet. The Committee’s major piece of work this year focused on transparency within the organisation. The Committee’s Transparency Commission final report set out the following key goals for the Council:
• Make the Council a beacon for openness, accountability and transparency by the end of 2017-18 • Enhance the role of Overview and Scrutiny to enable greater openness, accountability and
transparency in 2016-17, and • Publish all data by default wherever possible by the end of 2016-17
An Annual Scrutiny Report detailing the work of the Overview and Scrutiny Committee and the Health and Scrutiny Panel is approved and presented to Council annually. The 2015/16 report was included in the May 2016 agenda of the Committee. The work programme also involved a number of in-depth scrutiny reviews and challenge sessions focusing on Prevent, Homelessness, Maternity Services, Child, Adolescent Mental Health Services, Workforce to Reflect the Community, Recycling and Social and Emotional Mental Health. 3.8 Monitoring of the Best Value Performance Plan As detailed earlier in this statement, the PwC inspection identified best value failings in relation to three out of the four areas reviewed and although there was compliance in the procurement, there were noted areas for improvement. As a result of this and the subsequent directives for each of the four areas the Council has produced a best value action plan, which includes a focus on broader areas, including Organisational Culture. The Plan was submitted to the Secretary of State for CLG in March 2015. Officers responsible for these improvement areas have regular meetings with the Commissioners to review the progress against the action plan and a Best Value Programme Board, chaired by the Mayor, has been set up to monitor progress. As required by the directions this progress is then reported back to the Secretary of State for CLG every six months. The Council has submitted two progress reports so far September 2015 and March 2016 highlighting progress made against actions.

3.9 Audit Committee For 2015/16, the Audit Committee comprised seven members; four from the majority group and one each from the three largest minority groups in proportion to their representation on the Council. The Audit Committee’s remit is to review the Council’s systems of internal control and its risk management and governance arrangements, as outlined in the Audit Committee: Guidance for Local Authority and Police. The Audit Committee also reviews audit findings and the effectiveness of the internal audit function. Specifically, the core functions of the Audit Committee are to consider the annual audit plan and the performance of internal audit; to be satisfied that the authority’s annual governance statement properly reflects the risk environment; to demonstrate its fiduciary responsibilities in preventing and detecting fraud; to monitor the authority’s risk management framework; to meet the accounts and audit regulations in respect of approving the authority’s Annual Financial Report, including the annual statement of accounts, and to consider reports from the Council’s external auditor, KPMG. The Audit Committee met four times during the financial year 2015/16 and plans to meet five times in 2016/17. The 2014/15 annual accounts have not been formally signed off. 3.10 Internal Audit Internal audit is an independent appraisal function that measures, evaluates and reports upon the effectiveness of the controls in place to manage risks. Internal Audit provides assurance and advice on internal control to the Mayor, the Corporate Management Team and Members. Internal Audit reviews and evaluates the adequacy, reliability and effectiveness of internal control and where relevant, recommends improvements. It also supports the management of the Council in developing its systems and providing advice on matters pertaining to risk and control. In carrying out this function Internal Audit contributes to the discharge of the Corporate Director, Resources’ Section 151 responsibilities. The work of the Internal Audit Section is monitored and reviewed by the Audit Committee. Annually the Head of Audit and Risk Management is required to give an opinion on the Council’s internal control framework based upon the work carried out during the year in the form of an annual report. This report is one of the sources of assurance used in the preparation of this statement. For 2015/16, the overall the control environment was adjudged by the Head of Internal Audit to be adequate. Following the publication of the Public Sector Internal Audit Standards (PSIAS), the Council’s internal audit arrangements have been updated and the Audit Charter endorsed by the Audit Committee most recently in June 2015. The Head of Audit & Risk reports quarterly, on a formal basis, to the Corporate Management Team on findings of audit work and investigations. He also meets as required with CMT members individually as well as other officers with roles key to the Governance Framework to discuss governance related issues. The internal audit charter, setting out the purpose and authority and responsibility of internal audit was approved by CMT and the Audit Committee in June 2015. To support the monitoring and assurances available with regards the completion of the Best Value Action Plans the 2015/16 Internal Audit Plan includes some focused work to assess whether the milestones detailed in the Best Value Improvement Plan have been implemented. The Internal audit report for the review of the Procurement Best Value Improvement plan was presented to the Best Value Programme Board on 26 January 2016 and the internal audit reports for Communications, Property and Grants was presented on 22 February 2016. 3.11 External Audit The Council’s external auditors, KPMG: • Review the Council’s accounts to ensure that they comply with statutory requirements and that
proper practices have been observed in compiling them; and

• Conclude on the Council’s arrangements in place for securing economy, efficiency and effectiveness in its use of resources (the value for money conclusion).
In 2013/14, KPMG issued an unqualified audit opinion on the Council’s financial statements. In respect of whether the authority had made proper arrangements to secure economy, efficiency and effectiveness in its use of resources, KPMG issued an adverse opinion and raised a S11 recommendation under the Audit Commission Act 1998. The recommendation was reported to the Audit Committee on 23 September 2015 in the external audit report “To Those Charged with Governance.” The Authority considered the Section 11 recommendation at a meeting of the full Council on 20 January 2016 and at the General Purposes Committee on 8 February 2016. At the Council and General Purposes Committee meetings it was agreed to accept the Section 11 recommendation and that the following courses of action would be undertaken: • Continue with actions identified in the Best Value Action Plan in keeping with the agreed timescales. • Set up a ‘Governance Working Group’ with formal Terms of Reference to thoroughly review the
governance processes of the Authority. • Construct a ‘Governance Working Group Action Plan’, with identifiable tasks, responsible officers
and timeframes. • Complete other items identified in the Final ISA260 Report 2013/14. • Report progress to the General Purposes Committee and the Audit Committee on a regular basis. Further information can be found at http://moderngov.towerhamlets.gov.uk/documents/s81734/2016%2001%2007%20PG%20Draft%20Council%20Report%20-%20S11%20V5%20-%20legal%20v2%20Final.pdf. 3.12 Whistle Blowing Policy and the Complaints Procedure We have a recognised complaints process which is administered by the Complaints and Information team. The complaints process comprises of three stages to enable the public to escalate their complaints if they are not satisfied with the answer they receive. Details of complaints are monitored by the Monitoring Officer and the Standards Advisory Committee. The Mayor and elected Members also receive enquiries and complaints via their surgeries, walkabouts and question time activities. The Council has arrangements to support members in addressing these queries to ensure that the public receive an appropriate answer. The Council also has a whistle blowing policy in addition to the Council’s Anti Fraud and Corruption Strategy. The Anti-Fraud and Corruption Strategy is refreshed annually and reported to the Audit Committee at its March committee. The strategy was last refreshed in June 2016. We have enhanced current arrangements by promoting the Council’s whistle blowing arrangements by raising awareness of the Council’s whistle blowing arrangements and improving reporting. The new arrangements were rolled out in May 2016. 3.13 Risk Management We have a Risk Management Strategy to identify and manage the principal risks to achieving its objectives. The principles of risk management are embedded in the Council’s decision making processes. The Strategy recognises that when making decisions the Council may not always adopt the least risky option, particularly where the potential benefits to the community warrant the acceptance of a higher level of risk. All committee reports seeking decisions or approval to a proposed course of action contain an assessment of the risk involved and both financial and legal comments. Key risks are recorded in corporate and directorate risk registers, which are subject to periodic review and reporting to the Corporate Management Team. Directorate Risk Champions oversee the continued development of the Council’s approach to risk management.

We have engaged Zurich Municipal Engineering to review of the Council’s risk management arrangements and suggested enhancements to further embed risk management within the organisation and facilitating workshops with the Corporate Management Team and Directorate Management Teams. This work will look at our appetite to take risks in pursuit of our strategic objectives and assess whether organisationally we have the same understanding of our risk appetite. 3.14 Information Governance We have established two groups to oversee Information Governance as a risk area and ensure robust governance arrangements are in place and adhered to across the organisation. An Information Governance Group meets six weekly to discuss issues arising and the Freedom of Information Board, which is co-ordinated by Legal Services, who have overall oversight. In 2014/15 we participated in a voluntary inspection by the Information Commissioners Office (ICO) to generate independent assurances with regards the arrangements in place. An action plan has been developed following this inspection and signed off by the Freedom of Information Board before being submitted to the ICO. The action plan was agreed with the ICO and monitored by the Information Governance Group. 3.15 Financial Management Statutory responsibility for ensuring that there is an effective system of internal financial control rests with the Corporate Director, Resources (the Council’s S151 officer). The system of internal financial control provides reasonable assurance that assets are safeguarded, that transactions are authorised and properly recorded, and that material errors or irregularities are either prevented or will be detected. Our medium term financial plan sets out the need to deliver financial savings to 2019/2020. Arrangements have been made to identify opportunities and for the delivery and reporting of savings to CMT and Cabinet. Internal financial control is based on a well established framework of financial regulations and financial procedures which include the segregation of duties, management supervision and a system of delegation and accountability. On-going development and maintenance of the various processes is a management responsibility. The control arrangements in 2015/16 included: • comprehensive corporate and directorate budgeting systems; • an annual budget approved by the Council that reflects strategic priorities; • a medium-term financial plan incorporating an analysis of the financial risks facing the Council over
the next three years and an assessment of the adequacy of General Fund and HRA reserves; • regular reporting of actual expenditure and income against budgets and spending forecasts and
service performance against targets; • an annual Treasury Management and Investment Strategy including a prudential borrowing
framework and associated indicators; and • standing meetings of finance managers from across the Council (Finance Strategy Group and the
Financial Reporting Technical Excellence Group). Since the publication of the CIPFA statement on the role of the Financial Officer in Local Government (2010), a self-assessment of the Council has shown the authority conforms to the good practice identified within the code. 3.16 The Efficient and Effective Use of Resources As noted earlier in this statement, we have been subject to a Best Value inspection and the findings arising from the inspection are captured under review of effectiveness (Section 4). KPMG’s assessment on the Council’s arrangements in place for securing economy, efficiency and effectiveness in its use of resource in relation to 2013/14 resulted in the issue of an adverse opinion in respect of the authority’s arrangements to secure value for money.
The authority has developed an action plan to improve value for money and seek continuous service improvement through a range of processes, including the application of best value principles and the carrying out of efficiency reviews as set out under the background section of this report. During 2014/15 and 2015/16, the Council continued work on its efficiency programme and has made plans to manage with significantly reduced financial resource in the future. As part of its service and financial planning process, the Council set efficiency targets and brought performance data into the consideration of resource allocation. The strategic planning process ensures that resources are focused on the priorities set out in the Strategic Plan. Processes for service and financial planning are aligned and the annual budget process evaluates new requirements for resources in terms of their contribution to the objectives of the Strategic Plan. Corporate guidance on team planning requires consideration of value for money issues in developing annual objectives. Reports concerned with proposed expenditure, reviewing or changing service delivery or the use of resources contain an efficiency statement setting out how the proposals will assist towards achieving greater efficiency together with associated Equality Impact Assessments. We also participate in the National Fraud Initiative (NFI) a computerised data matching exercise, led by the Cabinet Office, designed to detect fraud perpetrated on public bodies. The Corporate Anti-Fraud team continues to actively engage with the Cabinet Office to test and improve the output from the NFI exercise. The findings were reported to CMT and the Audit Committee, the exercise is completed every two years. We are deploying increasing innovative approaches to tackle risks to deliver value for money services. One example is to link debtors across a number of council activities to ensure the more efficient and effective use of Council resources in pursuit of the debts and to improve outcomes through a targeted approach. 3.17 Learning and Organisational Development We have a commitment that every member of staff receives an annual appraisal to discuss performance, targets and personal development. The Council provides a range of training opportunities for managers and staff to ensure that they are best equipped to deliver excellent public service. These include a Leadership programme, specific training relating to Recruitment and Selection, Risk Management, and computer based training. Councillors have a member support officer and a development program to keep them up to date with changes and to support training needs. Training is supplemented by information through briefings, conferences and weekly bulletins. For some aspects of Council work Members are required to undertake a period of study and pass a test to ensure they can demonstrate appropriate competence, for example the Licensing Committee. 3.18 Communication and Engagement We publish numerous documents on our website as well as providing a weekly paper, East End Life to keep residents up-to-date, in an informal and accessible way, on the work of the Council. A review of the value for money and compliance of East End Life was requested as part of the Best Value Action Plan. Following the review, a decision was made for East End life to be published fortnightly from January 2016 and quarterly from May 2016 to bring the publication in line with the Recommended Code of Practice for Local Authority Publicity. We also engage with citizens through surveys such as the annual resident’s survey and a tenants’ survey. These help to inform us of the perception of services we provide and the experience of services users. Further, we use portal range of digital media to engage with a wide range of stakeholders. Our website is continually being developed to provide more information, enable more services to take place electronically and to receive comments from all stakeholders.

At a local level we have a number of community forums which are used to engage with the community. Young people make up a greater proportion of the Tower Hamlets population compared to the rest of London, and the Council has thus sought to engage with them by enabling them to vote for a young Mayor of the Council. The young Mayor has a clear manifesto and is working to make a difference to young people’s lives within the borough. The Mayor’s surgeries with community groups, local businesses and others also provide direct communication and engagement with all stakeholders. Elected Members of the council also hold regular surgeries for their wards. 3.19 Partnerships Our most significant partnership is Tower Hamlets Partnership. In February 2012, the partnership structure was refreshed. In the new structure, the Partnership Executive and Board has been rationalised but still with responsibility for developing the overall strategy and for ensuring plans are delivered. The Community Plan Delivery Groups have been updated but with continued focus on the five key themes in the community plan including the statutory boards. At a ward level Local Community Ward Forums enable local people to engage with the council and identify local priorities and projects for co-delivery. Due to the Care Act and the drive towards more integrated services the Council we have been working in partnership with the Clinical Commissioning Groups, BARTs and East London Mental Health Trust. A formal partnership called the Tower Hamlets Integrated Provider Partnership has been created and we are committed to working to achieve shared outcomes with the members of the partnership. There are also partnership arrangements with the Police, Probation and Youth Justice services to help to meet the targets for reducing crime and making Tower Hamlets a safer and stronger community. We have an established Arm’s Length Management Organisation, Tower Hamlets Homes, a wholly owned subsidiary limited by guarantee to manage its housing stock. Tower Hamlets Homes has a formal governance structure and manages its internal affairs and delegated budgets through the Company’s Board. Performance is monitored through a regular review process with senior council officers and elected Members. The company operates its own risk management strategy and is subject to internal and external inspections and audit in compliance with the Companies Acts. 4. Review of Effectiveness We have responsibility for conducting, at least annually, a review of the effectiveness of the system of internal control. The review of effectiveness is informed by the work of the executive managers within the authority who have responsibility for the development and maintenance of governance environment, the head of audit’s annual report, and also by comments made by the external auditors and other review agencies and inspectorates. The review involved the evaluation of the key sources of assurance:
• The Council evaluated its corporate governance arrangements against good practice criteria set out
in the CIPFA/SOLACE guidance. The arrangements were found to be sound albeit recommendations were made to enhance current arrangements.
• The annual Head of Audit Opinion expressed the opinion that overall the Council’s system of internal control is adequate.
• The risk management framework, including the corporate and directorate risk registers, provides
assurance that the key risks to strategic objectives are managed effectively and are monitored by senior officers and Members.
• The Council is subject to external audit activity both corporately and for individual services. The judgements of the external auditors contained in their annual audit letter and other reports provide assurance that the Council has a reasonable system of financial internal control.

• Performance monitoring shows improvement in performance against external measures, the
Council’s own targets and in comparison to other authorities.
• Monitoring of the 2014/15 Significant Governance Issues as well as the actions plans arising from the PwC review of best value.
• The outturn on the 2015/16 budget shows that the financial management systems and processes of
the Council succeeded in keeping expenditure within planned limits. • Quarterly monitoring of strategic risks of the Council by the Corporate Management Team.
• Meetings with Corporate Management Team Members who have reviewed their own directorate
governance issues and actions with their Directorate Management Teams to seek input to the issues at a corporate level.
There has also been significant work to review and improve our governance arrangements and this work is considered in the process to produce this statement. An example of this is outlined below. Our Overview and Scrutiny Committee established an Overview and Scrutiny Transparency Commission (OSTC). The Commission aimed to identify actions the council should take to improve transparency and find ways the council can be more transparent. The Commission considered how: • residents be better informed about council activity, processes and decisions; • elected members be supported to make more transparent decisions; and • decision-makers be held to account transparently. The Overview and Scrutiny Committee agreed its final report, at its meeting on 29 January 2016. The report contained 18 recommendations and has been presented to the Mayor for implementation. We have been advised on the implications of the review of the effectiveness of the governance systems of the Council having regard to the sources of assurance set out in this statement, and we are satisfied that the system of control is effective. We propose over the coming year to take steps to further enhance our governance arrangements. Significant Governance Issues The PwC review and our own internal review of the effectiveness of the governance arrangements in place during 2015/16 has identified some areas where action is appropriate to enhance the Council’s governance framework. The significant issues and the specific actions to address that have been taken and those planned for the future are set out below and in all cases, due to the on-going monitoring of the governance framework, work is already underway to address the action points. Each significant governance issue has an identified CMT lead who takes responsibility for progress and implementation. The actions identified within this statement form part of the performance management framework for each director and will be incorporated into their directorate performance plans. The overall process is overseen by the Audit Committee who approves the Annual Governance Statement prior to it being signed off by the Mayor and the Chief Executive.
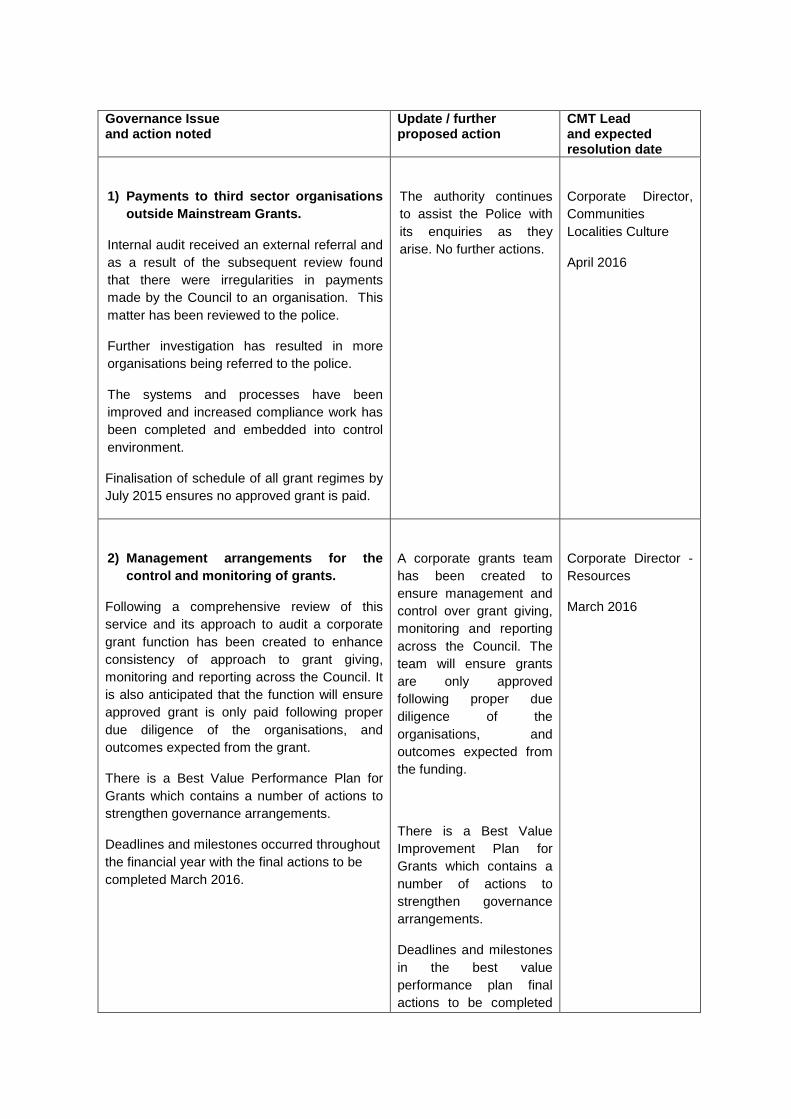
Governance Issue and action noted
Update / f urther proposed action
CMT Lead and expected resolution date
1) Payments to third sector organisations outside Mainstream Grants.
Internal audit received an external referral and as a result of the subsequent review found that there were irregularities in payments made by the Council to an organisation. This matter has been reviewed to the police.
Further investigation has resulted in more organisations being referred to the police.
The systems and processes have been improved and increased compliance work has been completed and embedded into control environment.
Finalisation of schedule of all grant regimes by July 2015 ensures no approved grant is paid.
The authority continues to assist the Police with its enquiries as they arise. No further actions.
Corporate Director, Communities Localities Culture
April 2016
2) Management arrangements for the control and monitoring of grants.
Following a comprehensive review of this service and its approach to audit a corporate grant function has been created to enhance consistency of approach to grant giving, monitoring and reporting across the Council. It is also anticipated that the function will ensure approved grant is only paid following proper due diligence of the organisations, and outcomes expected from the grant.
There is a Best Value Performance Plan for Grants which contains a number of actions to strengthen governance arrangements.
Deadlines and milestones occurred throughout the financial year with the final actions to be completed March 2016.
A corporate grants team has been created to ensure management and control over grant giving, monitoring and reporting across the Council. The team will ensure grants are only approved following proper due diligence of the organisations, and outcomes expected from the funding.
There is a Best Value Improvement Plan for Grants which contains a number of actions to strengthen governance arrangements.
Deadlines and milestones in the best value performance plan final actions to be completed
Corporate Director - Resources
March 2016
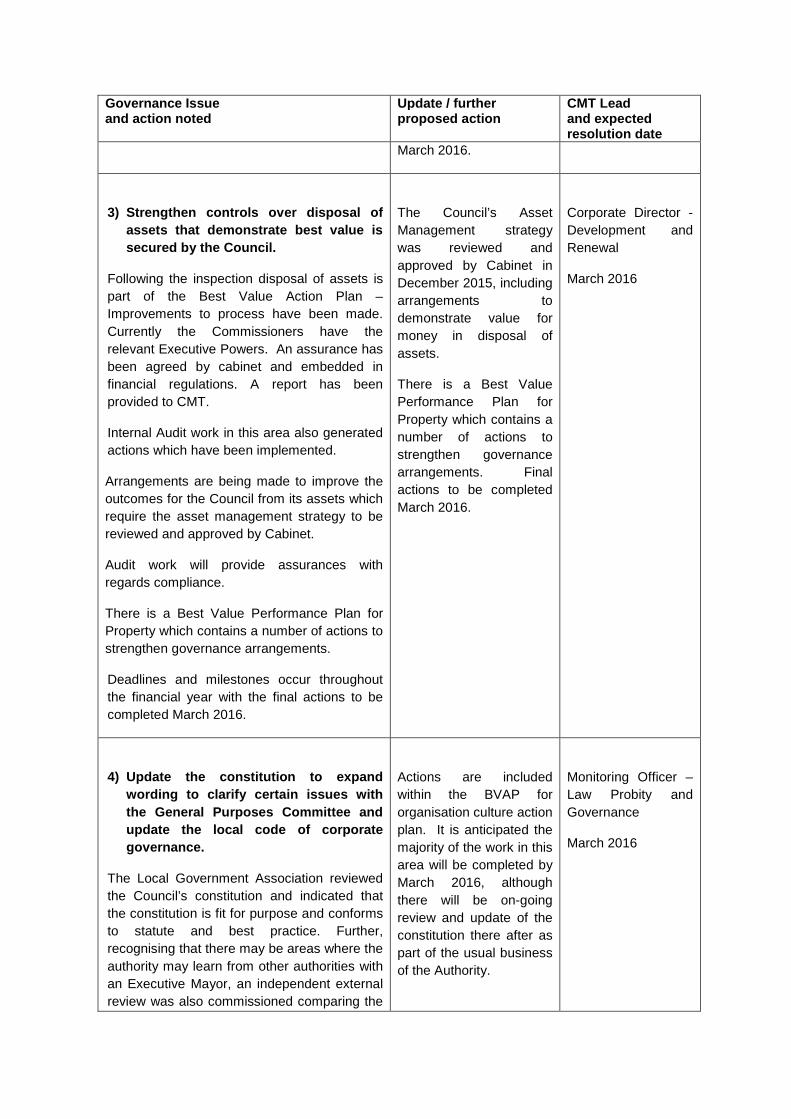
Governance Issue and action noted
Update / f urther proposed action
CMT Lead and expected resolution date
March 2016.
3) Strengthen controls over disposal of assets that demonstrate best value is secured by the Council.
Following the inspection disposal of assets is part of the Best Value Action Plan – Improvements to process have been made. Currently the Commissioners have the relevant Executive Powers. An assurance has been agreed by cabinet and embedded in financial regulations. A report has been provided to CMT.
Internal Audit work in this area also generated actions which have been implemented.
Arrangements are being made to improve the outcomes for the Council from its assets which require the asset management strategy to be reviewed and approved by Cabinet.
Audit work will provide assurances with regards compliance.
There is a Best Value Performance Plan for Property which contains a number of actions to strengthen governance arrangements.
Deadlines and milestones occur throughout the financial year with the final actions to be completed March 2016.
The Council’s Asset Management strategy was reviewed and approved by Cabinet in December 2015, including arrangements to demonstrate value for money in disposal of assets.
There is a Best Value Performance Plan for Property which contains a number of actions to strengthen governance arrangements. Final actions to be completed March 2016.
Corporate Director - Development and Renewal
March 2016
4) Update the constitution to expand wording to clarify certain issues with the General Purposes Committee and update the local code of corporate governance.
The Local Government Association reviewed the Council’s constitution and indicated that the constitution is fit for purpose and conforms to statute and best practice. Further, recognising that there may be areas where the authority may learn from other authorities with an Executive Mayor, an independent external review was also commissioned comparing the
Actions are included within the BVAP for organisation culture action plan. It is anticipated the majority of the work in this area will be completed by March 2016, although there will be on-going review and update of the constitution there after as part of the usual business of the Authority.
Monitoring Officer – Law Probity and Governance
March 2016

Governance Issue and action noted
Update / f urther proposed action
CMT Lead and expected resolution date
Council’s constitution with those of similar local authorities. This review confirmed there were no fundamental weaknesses of gaps in the Council’s constitution. There are opportunities to word elements more clearly or tighten up some areas of process to enable the Executive and non-Executive business to run more smoothly.
The work to review the constitution commenced in 2014 but is not yet complete.
There were some minor issues around scheme of delegation raised through audit work in 2014/15.
External Review of Virements was completed in 2014.
Review of the constitution.
Review of the Schemes of Delegation and implementation of an annual review process which will be confirmed as part of the annual governance processes embedded within the organisations governance framework.
It is anticipated the work in this area will be completed by March 2016, although there will be on-going review and update of the constitution there after as part of the usual business of the Authority.
5) Enhance contract management and contract letting process.
The Procurement Strategy and procedures have been refreshed and adopted.
To ensure compliance around procurement, the Competition Planning Forum and the Competition Board continue to monitor and recommend the best course of action for all significant purchases.
The new procedures now provide greater visibility and input from the Corporate procurement team and over the next financial year, the team plan to seek better outcomes from the organisation’s spend and enhance
Monitoring of the Best Value Performance Plan for Procurement which contains a number of actions to strengthen governance arrangements final actions to be completed April 2016
Chair of Competition Board and Corporate Director, Resources
April 2016

Governance Issue and action noted
Update / f urther proposed action
CMT Lead and expected resolution date
contract monitoring arrangements across the organisation.
There is a Best Value Performance Plan for Procurement which contains a number of actions to strengthen governance arrangements.
Future planned actions include an Annual Procurement Report, three year strategy and Supplier Ethical Code of Conduct.
Deadlines and milestones occurred throughout the year with the final actions to be completed April 2016.
6) Review the Council’s Section 106 arrangements.
The Council’s external auditors highlighted a number of control issues in the administration of the Council’s S106 arrangements.
An independent review of the arrangements in relation to s106 receipts and payments will be undertaken to ensure effective and robust processes, controls, monitoring and reporting arrangements are in place, in accordance with agreements and aligned with the planning consents.
Grant Thornton was appointed to carry out an independent review. Grant Thornton has completed its review and has issued a draft report for management comment before finalising the report in April 2016.
Corporate Director, Development and Renewal and Corporate Director, Resources
We propose over the coming year to take steps to address the above matters to further enhance our governance arrangements. We are satisfied that these steps will address the need for improvement that were identified in our review of effectiveness and will monitor progress periodically and confirm their implementation and operation as part of the process to produce the 2015/16 Annual Governance Statement. ……….……….……….……….………. ……….……….……….……….……….
Chief Executive Mayor
Date: Date:

110
GLOSSARY OF FINANCIAL TERMS AND ABBREVIATIONS The following terms and abbreviations, while not being exhaustive, may provide assistance in understanding the Statement of Accounts. FINANCIAL TERMS Accounting period – The period of time covered by the Council’s accounts. The Council’s financial year is from the period 1st April to the following 31st March. Accounting policies – The specific principles, bases, conventions, rules, and practices, applied by the Council, in preparing and presenting the financial statements. Accounting standards – A set of rules explaining how accounts are to be kept. (See ‘International Financial Reporting Standards’) Accrual – The recognition of income and expenditure in the year that they occur and not when any cash is received or paid. Accumulated Absences Account – This account represents the value of leave rolled over from one financial year to another. This reserve account is used to avoid reducing general fund reserves. Actuary – An independent adviser to the Council on the financial position of the Pension Fund. Actuarial Valuation – Every three years the Actuary reviews the assets and liabilities of the Pension Fund and reports to the Council on the fund’s financial position and recommended employers’ contribution rates. The most recent valuation was in 2013. Agency services – Services provided by or for another local authority or public body where the cost of carrying out the service is reimbursed. Arm’s Length Management Organisation (ALMO) – Arm's length management organisation. An organisation set up to manage all or part of a local authority's housing stock. Ownership of the stock remains with the local authority. Amortisation – The writing off of an intangible asset or loan balance to the Comprehensive Income and Expenditure Statement over an appropriate period of time. Amortised Cost – The carrying value of an intangible asset or liability in the balance sheet, which has been written up or down via the Comprehensive Income and Expenditure Statement. Asset – Something valuable that the Council owns, benefits from, or has use of, in generating income. Balance Sheet – A statement of all the assets, liabilities and other balances of the Council at the end of an accounting period. Benchmarking - the analysis of selected activities and processes, and their comparison with similar analyses for other organisations. Billing Authority – Refers to a local authority that is responsible for the collection of tax, both on behalf of itself and local authorities in its area. Budget – A forecast of future expenditure plans for the Council. Detailed revenue budgets are prepared for each year and it is on the basis of these figures that the Council Tax is set. Budgets are revised throughout the year for changes as necessary.

110
Business Rate Supplement – The Business Rate Supplements Act 2009 enables levying authorities - county councils, unitary district councils and, in London, the Greater London Authority - to levy a supplement on the Business Rate to support additional projects aimed at economic development of the area. Capital Adjustment Account – Represents amounts set aside from revenue resources or capital receipts to finance expenditure on property, plant, and equipment (PPE) or for the repayment of external loans, or certain other capital financing transactions. Capital Expenditure – Expenditure on the acquisition of property, plant, and equipment (PPE) or expenditure which adds to the value of an existing item of PPE. Capital Financing Requirement – Represents the Council’s underlying need to borrow for a capital purpose. Capital Grants Receipts in Advance – Balances of capital grants and contributions that have conditions which may require future repayment if not spent. Capital Grants Unapplied – Grant balances that will be used for future capital expenditure. Capital Receipt – Income received from the sale of PPE such as land or buildings. Capital Receipts Reserve – Represents proceeds from the sale of PPE available to meet future capital investment. Carrying Value – In relation to the value of assets, the value is based on the original cost of the asset less any depreciation, amortisation or impairment costs made against the asset. It is the amount to be recognised on the Balance Sheet. Cash Equivalents – Highly liquid and safe investments that can easily be converted into cash. Chartered Institute of Public Finance and Accountan cy (CIPFA) – A professional accountancy body, that specialises in the Public Sector. It promotes best practice by issuing guidelines and Codes of Practice. Collection Fund – A statutory account which receives Council Tax and Non-Domestic Rates to cover the costs of services provided by the Council and its precepting authorities. Collection Fund Adjustment Account – The Collection Fund Adjustment Account represents the Council’s share of the Collection Fund Surplus/Deficit. Community Assets - Assets that a local authority intends to hold in perpetuity, that have no determinable useful life and that may have restrictions on their disposal. Examples of Community Assets are parks and historic buildings. Comprehensive Income and Expenditure Statement - A statement showing the expenditure and income of the Council’s services during the year, and demonstrating how costs have been financed from general Government grants and income from local taxpayers. Contingent Liability - Where possible “one-off” future liabilities or losses are identified, but the level of uncertainty is such that the establishment of a provision is not appropriate. Corporate and Democratic Core (CDC) - This includes corporate policy making, activities that relate to the corporate management of the Council and all other member-based activities. Under the terms of SeRCOP, all support costs are allocated to services except for CDC and Non Distributed Costs. Consumer Price Index (CPI) – Measures the average change in retail prices of a basket of goods and services purchased by most UK households, to provide an indication of the rate of inflation. The CPI includes some financial services in the basket of goods not included in the RPI. Creditors - Amount of money owed by the Council for goods and services received. Also referred to as, Payables.

110
Current Assets - Any asset expected to last or be in use for less than one year is considered a current asset. Examples are stock, cash and debtors. Current Liability - An amount which will become payable or could be called in within the next accounting period. Examples are creditors and Short Term Borrowing. Debtors - Amount of money owed to the Council by individuals, and organisations. Also referred to as, Receivables. Dedicated Schools Grant – Grant monies provided by the Department of Education ring-fenced to schools budgets. This is a ring-fenced grant. Deferred Capital Receipts - Income that is received in instalments over agreed periods of time. They arise from mortgages on sales of Council houses and repayments from loans. Deferred Income – Receipt in Advance – This represents a receipt received as part of entering into a building lease. The credit is being released over the term of the lease. Deferred Liabilities – These are future payments that the Council is contractually obliged to pay in future years. These liabilities relate to Private Finance Initiative (PFI) schemes. Defined Benefit Scheme - A pension scheme which defines benefits independently of the contributions payable. Benefits are not directly related to the investments of the Pension Fund. Depreciation - The measure of the wearing out, consumption or other reduction in the useful economic life of PPE, whether arising from use, passage of time or obsolescence through technological or other changes. Direct Revenue Funding (DRF) – The use of revenue monies to pay for capital expenditure. Also referred to as Revenue Contributions to Capital Outlay (RCCO). Earmarked Reserves - Amounts set aside for a specific purpose to meet future commitments or potential liabilities, for which it is not appropriate to establish provisions. Fair Value - It is the price that would be received to sell an asset or paid to transfer a liability in an orderly transaction between market participants at the measurement date. Fees and Charges – Income receivable as payment for goods or services provided. These charges are reviewed annually as part of the annual budget process. Finance Lease - A lease that transfers substantially all of the risks and rewards of ownership of an asset to the lessee. Financial Instrument - Any contract that gives rise to a financial asset of one entity and a financial liability or equity instrument of another. Financial Instrument Adjustment Account - This represents the balance of deferred discounts relating to the premature redemption of Public Works Loans Board (PWLB) debt. General Fund (GF) - The Council’s main revenue account from which the cost of providing most of the Council’s services is met. Greater London Authority (GLA) – A strategic Local Authority with a capital-wide role. Gross Spending – the total cost of providing services before any income such as government grants, fees and charges are deducted. Group Accounts – Where a Council has a material interest in a separate entity, the entity’s assets and liabilities may need to be incorporated within the council’s group accounts. If the council controls an entity, it is a subsidiary (as in the case of Tower Hamlets Homes for the Council).

110
Heritage asset – An asset with historical, artistic, scientific, technological, geo-physical and/or environmental qualities that is held and maintained principally for its contribution to knowledge and culture. Historic Cost – The actual cost of an asset in terms of past consideration as opposed to current value. Housing Revenue Account (HRA) - A statutory account maintained separately from the General Fund for the recording of income and expenditure relating to the provision of council housing. Impairment – A reduction in the valuation of PPE caused either by a change in the market price of the asset or damage/deterioration of the asset in excess of depreciation. Infrastructure Assets – Inalienable assets, expenditure on which is only recoverable by continued use of the asset created. There is no prospect of sale or alternative use. Examples include roads, bridges, and tunnels. Intangible Assets – Non-financial long-term assets that do not have physical substance but are identifiable and controlled by the Council i.e. purchased software licences. Interest Rate Risk – The uncertainty of interest paid/received on variable rate instruments and the effect of fluctuations in interest rates on the fair value of an instrument. International Financial Reporting Standards (IFRS) – The set of international accounting standards issued by the International Accounting Standards Board (IASB). Local Authorities are required to produce accounts based on IFRS. Inventories – The values of, stocks held and work in progress that have not been completed. Investment Properties – Those properties that are held solely to earn rentals and/or for capital appreciation, rather than for the delivery of services. Liability – A liability is where the Council owes payment to an individual or another organisation. Levy – Payments to bodies such as the Environment Agency. The cost of these bodies is funded by local authorities in the area concerned based on their Council Tax base and is met from the General Fund. Long-Term Assets – Assets that yield benefit to the Council and the services it provides for a period of more than one year. Long-Term Liability – An amount which by arrangement is payable beyond the next year at some point in the future or to be paid off by an annual sum over a period of time. Major Repairs Reserve – Represents the funds available to meet capital investment in council housing Materiality - t he level (usually expressed in financial terms but not usually expressly stated) below which accountants, auditors, or their clients or employers, consider risks or problems not to be significant. Medium Term Financial Plan (MTFP) – The Council’s strategic plan surrounding its finances for the next 3 years. Minimum Revenue Provision (MRP) – The amount that has to be charged to revenue to provide for the redemption of debt. Not applicable to the HRA. Movement in Reserves Statement – A summary of the Council’s reserves at the balance sheet date split between usable and unusable reserves. National Non-Domestic Rates (NNDR) Pool - Non-Domestic Rates are collected by the Council. From 1st April 2013 the Council keeps 30%, gives the GLA 20% and the other 50% is passed over to the DCLG.

110
Net Book Value – The amount at which PPE is included in the balance sheet after depreciation has been provided for. Net Realisable Value – The open market value of the asset less the expenses to be incurred in realising the asset. Non Current Assets Held for Sale – Items of PPE whose carrying amount is to be recovered principally through a sale rather than continued use by the Council. Operating Lease – A lease other than a finance lease - a lease which permits the use of the asset without substantially transferring the risks and rewards of ownership. Outturn – The actual level of expenditure and income for the year. Precept – The charge made by the Greater London Authority (the precepting authority) on the Council to finance its net expenditure. Private Finance Initiative (PFI) – Instead of providing and owning the assets needed for their services, public authorities arrange for private sector bodies (usually formed from consortia) to provide and own them. These other bodies’ then make the assets available under operating leases to enable public authorities to deliver the services required. Projected Unit Method – Actuarial valuation method whose key feature is to assess future service cost; the Actuary calculates the employer’s contribution rate, which will meet the cost of benefits accruing in the year after the valuation date. Property, Plant, and Equipment (PPE) – The land and building assets under the council’s control or ownership. Assets under the control or owned by the Council that have a physical existence and are expected to be used for a period exceeding one year form PPE. Important components of PPE include land and land improvements, buildings, plant and machinery, vehicles and equipment where material. Provisions – Amounts set aside for liabilities and losses, which are certain or very likely to occur but where the exact amount or timing of the payment are uncertain. Public Works Loans Board (PWLB) – Central Government agency which funds much of local government borrowing. Registered Social Landlord – A not-for-profit organisation which owns and manages social housing. Reserves – Amounts set aside, which do not fall within the definition of a provision, to fund items of anticipated expenditure. These include general reserves or balances which every Council must maintain as a matter of prudence. Retail Price Index (RPI) – Measures the average change in retail prices of a basket of goods and services purchased by most UK households, to provide an indication of the rate of inflation. The RPI includes mortgage interest payments and council tax in the basket of goods not included in the CPI. Revaluation Reserve – Represents the increase in value of the Council’s land and building assets from 1st April 2007. Revenue Expenditure – The day-to-day expenditure of the Council - salaries, goods and services and capital financing charges. Revenue Expenditure Funded from Capital Under Statu te (REFCUS) – Expenditure incurred during the year that may be capitalised under statutory provisions but does not result in the creation of long-term assets, that has been charged as expenditure to the relevant service revenue account in the year Revenue Support Grant – General grant paid by the Government to local authorities.

110
Right To Buy (RTB) - The council is legally required to sell council homes to tenants, at a discount, where the tenant wishes to buy their home. The money received from the sale is a capital receipt, some of which will be retained by the council to spend on capital expenditure, while the remainder must be paid over to the DCLG under pooling arrangements. Ring-Fenced Grant – A grant that can only be spent on a specific purpose, such as the Dedicated Schools Grant. Service Level Agreements - agreements between operational units, which state the price and specifications of the support service by one to another. Service Reporting Code of Practice (SeRCOP) – CIPFA’s accounting recommendations for local authorities that legally constitute proper accounting practice, below the statement of accounts level. Soft Loan – Loans given at less than market/commercial rates to community or not-for-profit organisations. Supplementary Business Rates (SBR/BRS) – Locally raised business rates for local projects. London Councils are levying a SBR for the Cross-rail project. Support Services – Activities of a professional, technical and administrative nature which are not Council services in their own right, but support main front line services such as finance, information technology and human resources. Surplus Assets – Those assets which are not being used to deliver services, but do not meet the criteria to be classified as either Investment Properties or Non Current Assets Held for Sale. Unusable Reserves – These represent reserve balances that cannot be spent as part of an organisation’s medium term financial plan. An example is the revaluation reserve. Usable Reserves – These represent reserve balances that can be spent as part of an organisation’s medium term financial plan. Any organisation has to review reserve levels to ensure long-term financial stability. General fund and Housing Revenue Account reserves are usable reserves. Value for money (VFM) – This term is used to describe the relationship between the economy, efficiency, and effectiveness (known as the ‘three Es’) of a service, function or activity. Value for money is high when there is an optimum balance between all three.

110
Abbreviations used in Accounts
AGS - Annual Governance Statement
ALMO - Arm’s Length Management Organisation (Tower Hamlets Homes)
BSF - Building Schools for the Future
CAA - Capital Adjustment Account
CDC - Corporate and Democratic Core
CFR - Capital Financing Requirement
CIES - Comprehensive Income and Expenditure Statement
CIL - Community Infrastructure Levy
CIPFA - Chartered Institute of Public Finance and Accountancy
CPI - Consumer Price Index
CRR - Capital Receipts Reserve
DCLG - Department of Communities and Local Government
DEFRA - Department for Environment, Food and Rural Affairs
DfE - Department for Education
DRF - Direct Revenue Funding
DSG - Dedicated Schools Grant
DWP - Department for Work and Pensions
EIR - Effective Interest Rate
GAAP - Generally Accepted Accounting Principles
GF - General Fund
GLA - Greater London Authority
HRA - Housing Revenue Account
IAS - International Accounting Standard
IFRS - International Financial Reporting Standards
LABGI - Local Authority Business Growth Incentive
LAML - London Authorities Mutual Limited
LASAAC - Local Authority (Scotland) Accounts Advisory Committee
LATS - Landfill Allowance Trading Scheme
LBTH - London Borough of Tower Hamlets
LGPS - Local Government Pension Scheme
LOBO - Lender’s Option – Borrower’s option
LPFA - London Pensions Fund Authority
MRA - Major Repairs Allowance
MRP - Minimum Revenue Provision
MTFP - Medium Term Financial Plan
NBV - Net Book Value
NCS - Net Cost of Services
NDC - Non Distributed Costs
(N)NDR - (National) Non-Domestic Rates
NPV - Net Present Value

110
NRV - Net Realisable Value
PBC - Prepared By Client
PCT - Primary Care Trust
PFI - Private Finance Initiative
PPA - Prior Period Adjustment
PPE - Property, Plant and Equipment
PWLB - Public Works Loans Board
RCCO - Revenue Contributions to Capital Outlay
REFCUS - Revenue Expenditure Funded by Capital Under Statute
RICS - Royal Institute of Chartered Surveyors
RPI - Retail Price Index
RR - Revaluation reserve
RSG - Revenue Support Grant
RTB - Right To Buy
SBR - Supplementary Business Rates
SDPS - Surplus or Deficit on the Provision of Services
SeRCOP - Service Reporting Code of Practice
SLAs - Service Level Agreements
SORP - Statement of Recommended Practice (now Code of Practice on Local Authority Accounting)
TH - Tower Hamlets
THH - Tower Hamlets Homes
VFM - Value For Money
WDA - Waste Disposal Authority
WGA - Whole of Government Accounts