· 2015-01-07 · Nif crystal was sliced parallel to the respective (hkl) plane. A crystal segment...
12
1 Supplementary data 2.5 Generation of morphology from calculated modified attachment energy The surface docking method as a prediction tool was employed to simulate the impact of additives on the crystal morphology. 1 If an additive has a strong interaction on one particular face, the growth rate of this particular face will be slowed down. Thus, this face will be bigger relative to the other facets, therefore guiding the absolute morphology. For the solid surface consideration, the crystal morphology was computed using attachment energy and the morphologically importance (MI) faces were determined. The attachment energy method generated possible crystal faces where the morphology was controlled by {0 0 1}, {0 1 0}, {0 1 1}, {1 0 0}, {1 1 1}, {0 0 2}, and {1 1 0} crystal facets. These seven faces of the upmost morphological significance were picked individually and provided the necessary lattice values for the generation of amorphous cell. The liquid side modeling requires the construction of amorphous cells which comprised solvents and additive molecules. 2 The amorphous cell was constructed containing definite number of solvent and additive molecules and then the structure was refined by MD technique. Nif crystal was sliced parallel to the respective (hkl) plane. A crystal segment was created as a periodic superstructure. This crystal segment was optimized by the molecular dynamics. An amorphous cell was created, which enclosed calculated number of solvent and additive molecules. It was impossible to place the total polymer chains in a vacuum box during simulation, hence a representative HPMC chain length was taken as per the molar ratio present during the experimental crystallization. 3, 4 This amorphous cell was additionally refined by MD technique. The subsequent task involved optimization of this amorphous cell. These amorphous cells were then minimized at 10,000 iteration steps. Newton method was used for the energy minimization. The succeeding equilibration on this cell comprised of 100 ps NVE and 10 ps NPT runs. Double-layer interfacial method was used for MD calculation to study the impact of the polymer additive on the crystal shape. One part of this model was the crystal segment and the solvent (DCM) + additive (HPMC) layer occupied another. Vacuum slab of 10 Å thick was built over the solvent + additive layer. The energy minimization was carried out before Electronic Supplementary Material (ESI) for CrystEngComm. This journal is © The Royal Society of Chemistry 2015
Transcript of · 2015-01-07 · Nif crystal was sliced parallel to the respective (hkl) plane. A crystal segment...

1
Supplementary data
2.5 Generation of morphology from calculated modified attachment energy
The surface docking method as a prediction tool was employed to simulate the impact of
additives on the crystal morphology.1 If an additive has a strong interaction on one
particular face, the growth rate of this particular face will be slowed down. Thus, this face
will be bigger relative to the other facets, therefore guiding the absolute morphology. For
the solid surface consideration, the crystal morphology was computed using attachment
energy and the morphologically importance (MI) faces were determined. The attachment
energy method generated possible crystal faces where the morphology was controlled by
{0 0 1}, {0 1 0}, {0 1 1}, {1 0 0}, {1 1 1}, {0 0 2}, and {1 1 0} crystal facets. These seven
faces of the upmost morphological significance were picked individually and provided the
necessary lattice values for the generation of amorphous cell. The liquid side modeling
requires the construction of amorphous cells which comprised solvents and additive
molecules.2 The amorphous cell was constructed containing definite number of solvent and
additive molecules and then the structure was refined by MD technique. Nif crystal was
sliced parallel to the respective (hkl) plane. A crystal segment was created as a periodic
superstructure. This crystal segment was optimized by the molecular dynamics. An
amorphous cell was created, which enclosed calculated number of solvent and additive
molecules. It was impossible to place the total polymer chains in a vacuum box during
simulation, hence a representative HPMC chain length was taken as per the molar ratio
present during the experimental crystallization.3, 4 This amorphous cell was additionally
refined by MD technique. The subsequent task involved optimization of this amorphous
cell. These amorphous cells were then minimized at 10,000 iteration steps. Newton method
was used for the energy minimization. The succeeding equilibration on this cell comprised
of 100 ps NVE and 10 ps NPT runs.
Double-layer interfacial method was used for MD calculation to study the impact of the
polymer additive on the crystal shape. One part of this model was the crystal segment and
the solvent (DCM) + additive (HPMC) layer occupied another. Vacuum slab of 10 Å thick
was built over the solvent + additive layer. The energy minimization was carried out before
Electronic Supplementary Material (ESI) for CrystEngComm.This journal is © The Royal Society of Chemistry 2015

2
the molecular dynamics simulation. NVT calculations were carried out for 10 ps with a
time step of 1 fs. The attained potential energy containing both crystal surface and
amorphous structure was denoted as Etotal. Consequently, the energies of the divided
structures of the crystal surface and amorphous layer were determined and denoted as
Esurface and Eamorphous correspondingly. MAE (Modified attachment energy) was calculated
by the method5, 6:
modEatt= Etotal – (Esurface + Eamorphous) (1)
Where modEatt stands for the attachment energy (modified) of the selected additive and
solvent with a particular crystal face and Etotal symbolizes the energy of layer. Esurface stands
for the energy of crystal surface and Eamorphous represents the energy of additives and
solvents. The habit was created based on the Hartman and Bennema equation.7
Rg ~ [modEatt] (2)
Where Rg stand for the growth rate in a specific direction, which is directly comparative to
the modified attachment energy.
3.1 Crystallization experiments and computational simulation
Crystal facets {1 0 0}showed equal abundance of non-polar functional groups (4 methyl)
and polar functional groups (2 carboxyl), facet{1 1 0} showed dominance of non polar
functional groups (2 methyl), facet {0 0 2} demonstrated the abundance of non polar
functional groups (2 methyl and 2 aromatic rings) when compared to polar functional
groups (1 nitro and 1 carboxyl), facet {(0 1 1}showed an abundance of polar functional
moieties (1 nitro,1 carboxyl and 1 amine) when compared to non-polar functional moieties
(2 methyl), while {1 1 -1} facet demonstrated an abundance of polar functional moieties
(two carboxyl with two amine) in comparison to non-polar functional moieties (2 methyl
and 1 aromatic ring), and a profusion of non polar functional groups (four methyl and one
aromatic ring) when compared to the polar functional groups (two carboxyl and one amine)
that was observed on facet {1 1 1}.

3
References
1. D. Kumar and N. R. Shastri, Cryst. Growth Des., 2014, 14, 326-338.
2. A. Thakur, D. Kumar, R. Thipparaboina and N. R. Shastri, J. Cryst. Growth, 2014,
406, 18-25.
3. W. Zhu, F. S. Romanski, X. Meng, S. Mitra and M. S. Tomassone, Euro. J. Pharm.
Sci., 2011, 42, 452-461.
4. W. Zhu, F. S. Romanski, S. V. Dalvi, R. N. Dave and M. Silvina Tomassone, Chem.
Eng. Sci., 2012, 73, 218-230.
5. Y. Yani, P. S. Chow and R. B. H. Tan, Mol. Pharm., 2011, 8, 1910-1918.
6. K. Zhou, J. Li, J. Luo and Y. Jin, Chinese J. Chem. Eng., 2012, 20, 602-607.
7. H.-E. Lee, T. B. Lee, H.-S. Kim and K.-K. Koo, Cryst. Growth Des., 2009, 10, 618-
625.

4
Supplementary Table 1. Percent surface area of important facets of Nif by BFDH and layer docking (LD) models
% Surface areaLayer Docking hkl BFDH Nif-0 Nif-2 Nif-4 Nif-6
{ 1 0 0 } 35.61{ 0 1 1 } 41.04 11.28 8.23 4.88{ 1 1 0 } 7.39 21.35 44.84 49.76 67.45{ 0 0 2 } 13.62 10.95 15.47 18.68 22.23{ 1 1 1 } 1.087 50.33 13 14.14 3.90{ 1 0 -2 } 1.23 17.34 12.21
Supplementary Table 2. Particle size distribution of Nif crystals with different HPMC concentration
D10(µm) D50(µm) D90(µm)
Nif-0 1142.68 ± 2.32 1278.26 ± 6.62 1434.78 ± 4.48Nif-2 1157.24 ± 3.62 1328.76 ± 4.46 1464.84 ± 5.40Nif-4 1153.45 ± 4.68 1274.60 ± 7.48 1476.72 ± 8.86Nif-6 1164.34 ± 3.80 1312.62 ± 8.94 1481.44 ± 11.26

5
Supplementary Table 3. Nif-0 PXRD

6
Supplementary Table 4. Nif-2 PXRD

7
Supplementary Table 5. Nif-4 PXRD
8
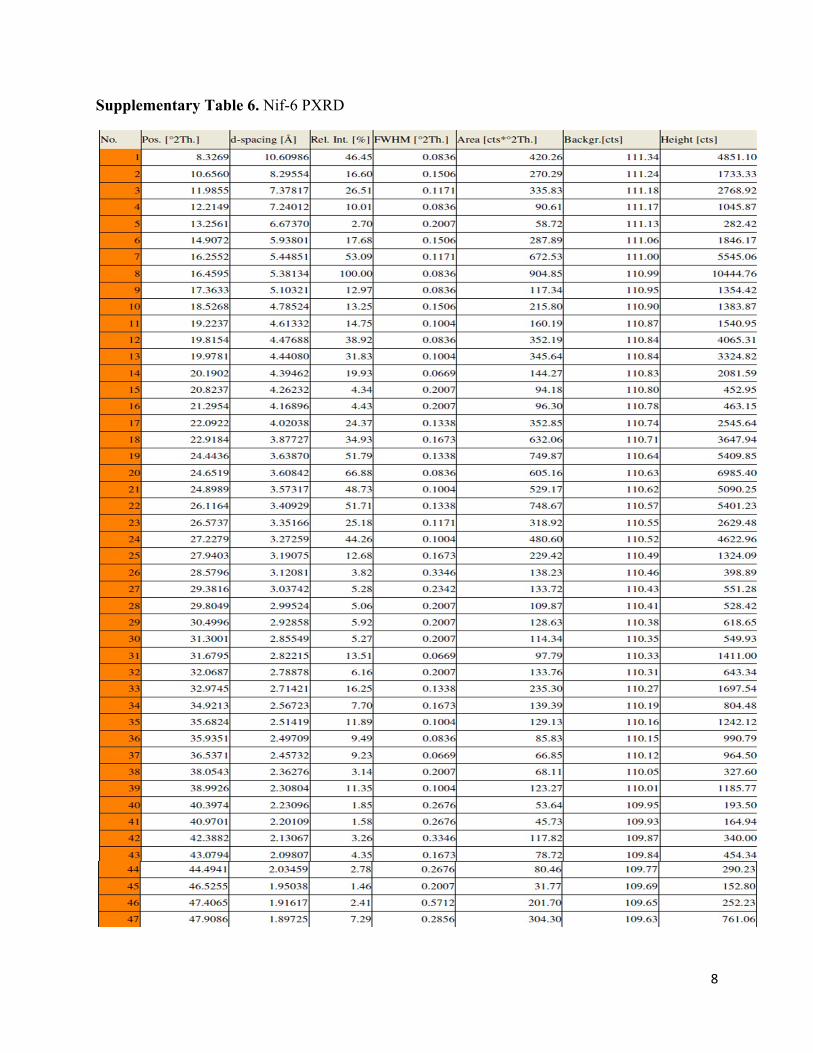
Supplementary Table 6. Nif-6 PXRD

9
Supplementary figure 1. Modified crystal habits of Nif with DCM as solvent and HPMC as additive (a) Experimental Nif-2 habit (b) Experimental Nif-4 habit (c) Experimental Nif-6 habit
10
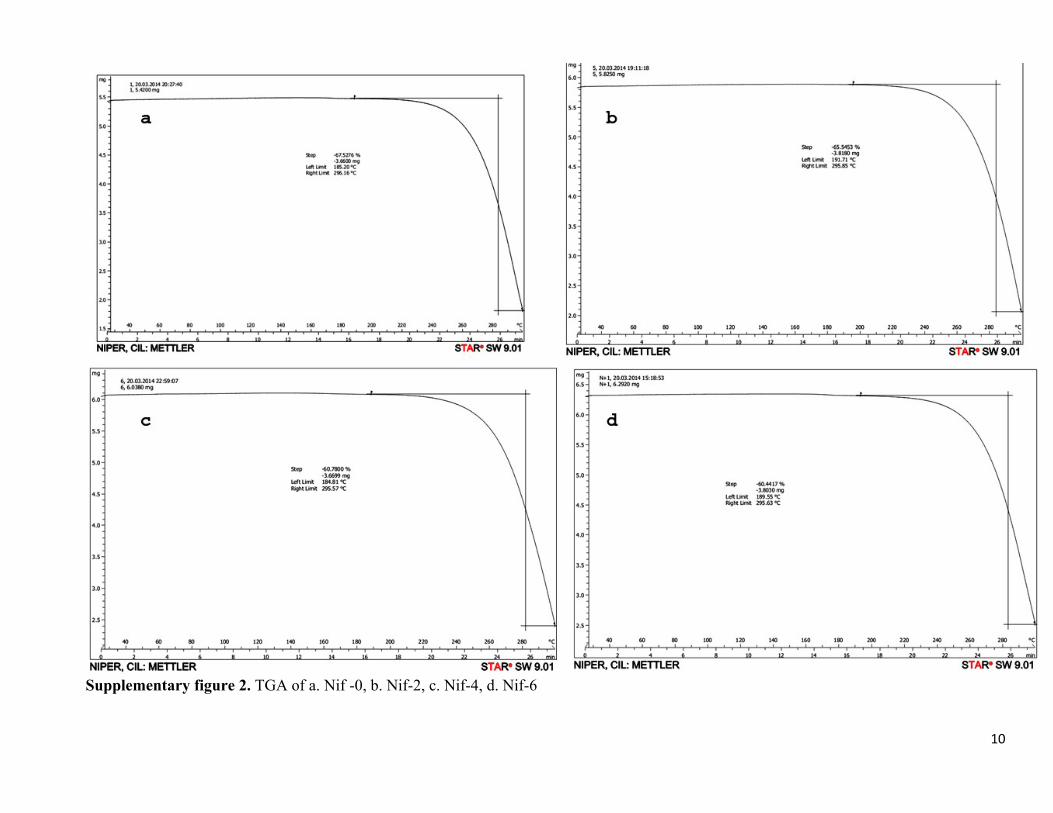
Supplementary figure 2. TGA of a. Nif -0, b. Nif-2, c. Nif-4, d. Nif-6

11
Supplementary figure 3. Nif simulated p-XRD

12
Supplementary figure 4. Mass spectra of a. Nif b. Nif-0 c. Nif-2 d. Nif-4 e. Nif-6 f. HPMC