
20141007 latency prez - eng
27
Improve mobile application performance Mobility for Business – Oct 2014
-
Upload
community-motwin -
Category
Technology
-
view
119 -
download
3
Transcript of 20141007 latency prez - eng

Improve mobile application performance
Mobility for Business – Oct 2014

2
Why is speed important ?
The impact of mobility
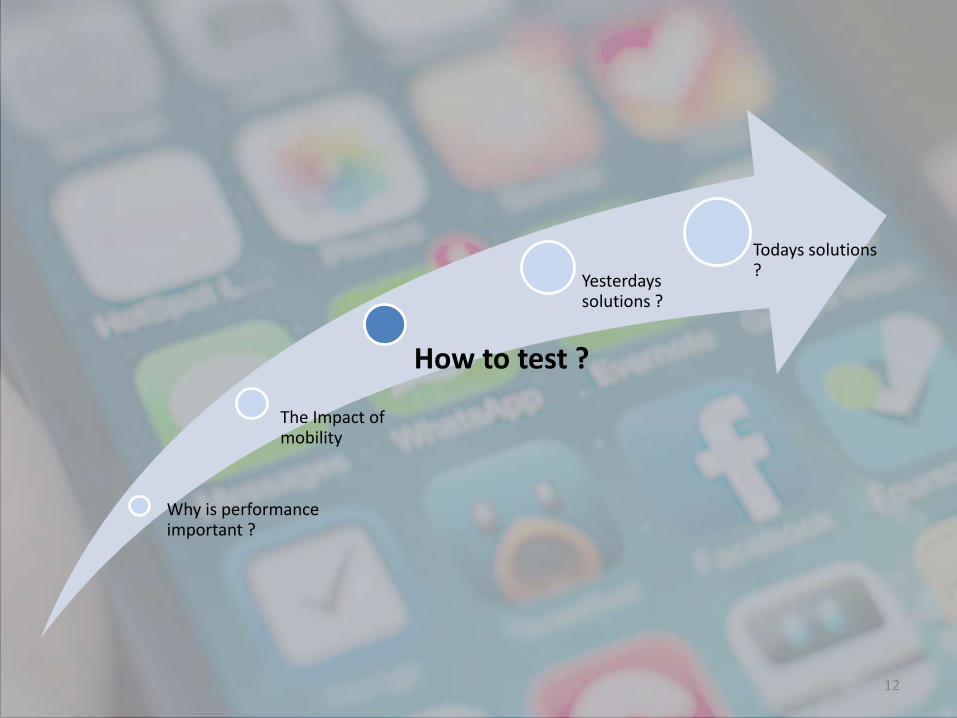
How to test ?
Yesterdays solutions
Todays solutions
3
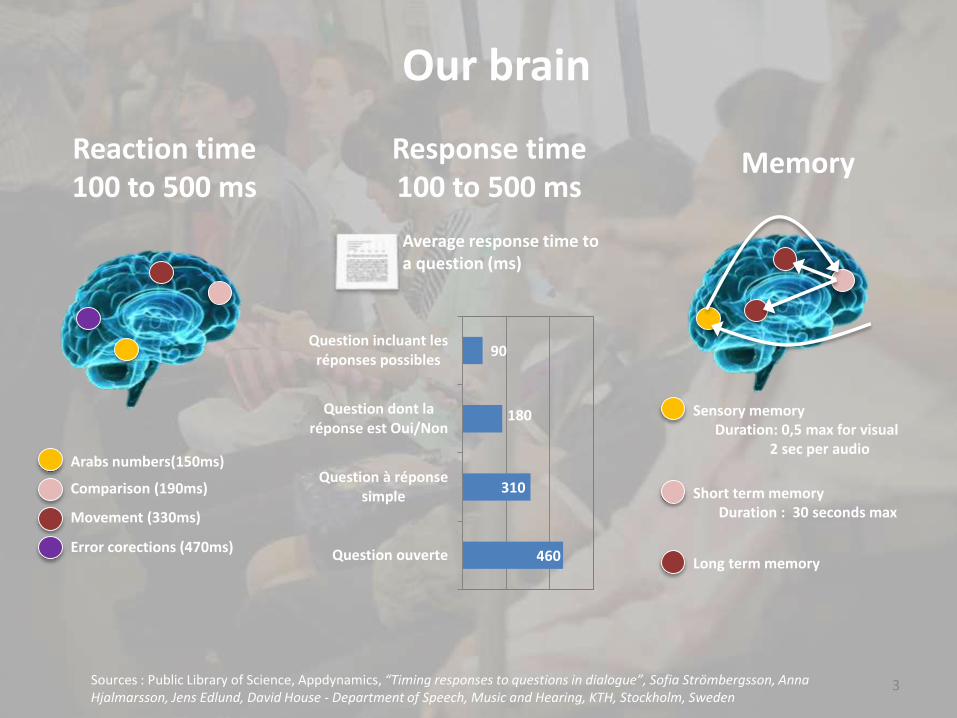
Our brain
Sources : Public Library of Science, Appdynamics, “Timing responses to questions in dialogue”, Sofia Strömbergsson, Anna Hjalmarsson, Jens Edlund, David House - Department of Speech, Music and Hearing, KTH, Stockholm, Sweden
Arabs numbers(150ms)
Comparison (190ms)
Movement (330ms)
Error corections (470ms)
Reaction time100 to 500 ms
Response time100 to 500 ms
Memory
Sensory memoryDuration: 0,5 max for visual
2 sec per audio
Short term memoryDuration : 30 seconds max
Long term memory
Average response time to a question (ms)
460
310
180
90
Question ouverte
Question à réponsesimple
Question dont laréponse est Oui/Non
Question incluant lesréponses possibles
4
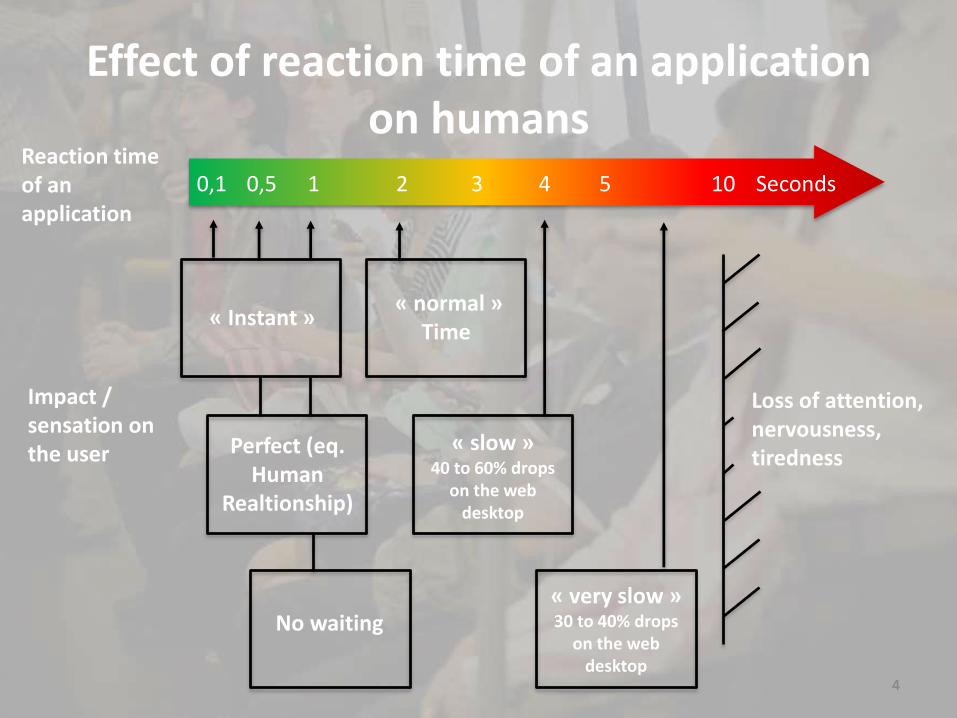
Effect of reaction time of an application on humans
4
Reaction time of an application
Impact / sensation on the user
0,1 Seconds0,5 2 3 5 101 4
« Instant »
Perfect (eq. Human
Realtionship)
« normal »Time
« slow »40 to 60% drops
on the web desktop
« very slow »30 to 40% drops
on the web desktop
Loss of attention, nervousness, tiredness
No waiting

55
0,1 Seconds0,5 2 3 5 101 4
« Instant »Temps
« normal »
Average timeWeb desktop
Average timeWeb mobile
Impact / sensation on the user
Reaction time of an application
Effect of reaction time of an application on humans
Perfect (eq. Human
Realtionship)
« slow »40 to 60% drops
on the web desktop
No waiting« very slow »30 to 40% drops
on the web desktop
Loss of attention, nervousness, tiredness

66
0,1 Seconds0,5 2 3 5 101 4
« Instant »Temps
« normal »
Average timeWeb desktop
Average timeWeb mobile
Impact / sensation on the user
Reaction time of an application
Effect of reaction time of an application On humans
Perfect (eq. Human
Realtionship)
« slow »40 to 60% drops
on the web desktop
No waiting« very slow »30 to 40% drops
on the web desktop
Loss of attentionfeeling nervoustired
Revenue Decline Decline in AdoptionDecreased
productivity
Consequences
Amazon: If the display time increases by 100 ms, the revenue goes down to 1%Google : If the display time increases 500ms , research fell by 25%
Compared to a site loading in 1 second , a site loading in 3 seconds losses 22% of page views,increase rebounds by 50 % and generate22% lesstransformations
A slow website requires50% concentration of additional efforts
78 % of users feelstressed or angry whenusing a slow website
Increase in usage time for employees
Sources :Jakob Nielsen : http://www.useit.com/alertbox/response-times.html, Foviance: http://www.foviance.com/what-we-think/wen-stress-a-wake-up-call-for european-business/, Harris interactive: http://www.tealeaf.com/news/news-releases/2011/tealeaf-announces-new-mobile-research.php, PhoCusWright : http://www.phocuswright.com/free_reports/consumer-response-to-travel-site-performance, Redhat http://www.webperformancetoday.com/2010/07/01/the-best-graphs-of-velocity/

7
Why is performance important ?
The Impact of mobility
How to test ?
Yesterdays solutions
Todays Solutions

8
The sources of performance
Page construction
Answers
Request
Display Treatment
Performance=
Device processing+
Time to communication+
Server processing
LatencyDebit
Amount of DataQuantity of requests
Protocol

9
TCP SYN « Hi !»
TCP SYN ACK « Hi ?! »
TCP ACK « There you are ! »
HTTP GET « I want this »
HTTP 200« OK »
[index.html] « Here it is : ….»
Note: Secured version (SSL ), the dialogue before data recovery requires a turn and return to giveThe " encryption keys "
HTTP
The most common protocol (HTTP) = 2 round trips
Time for one round trip = latency
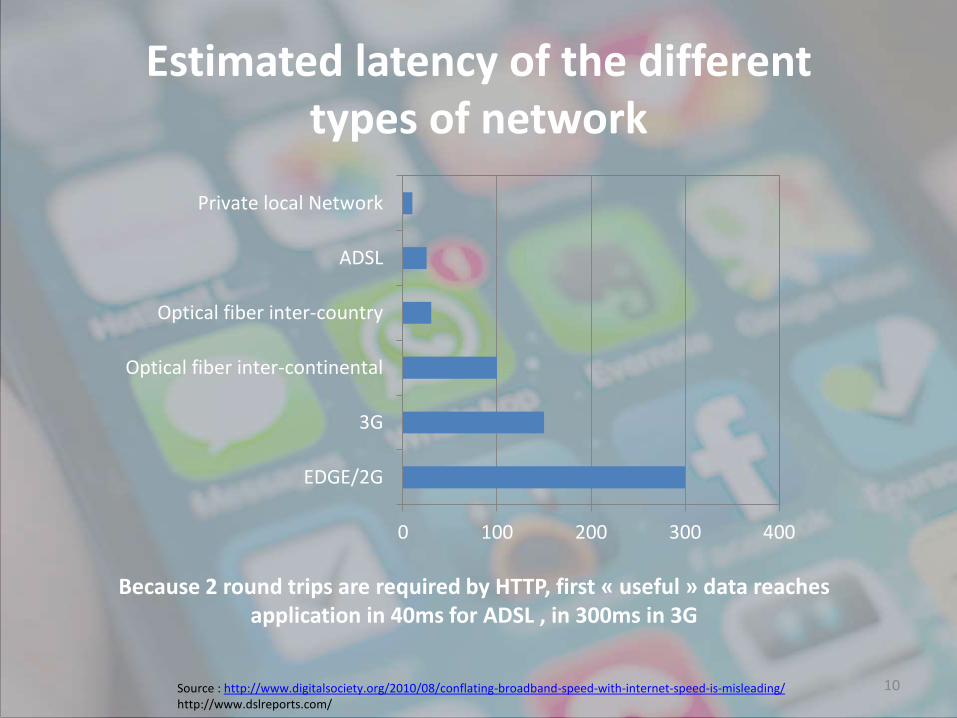
Estimated latency of the differenttypes of network
10Source : http://www.digitalsociety.org/2010/08/conflating-broadband-speed-with-internet-speed-is-misleading/http://www.dslreports.com/
Because 2 round trips are required by HTTP, first « useful » data reachesapplication in 40ms for ADSL , in 300ms in 3G
0 100 200 300 400
EDGE/2G
3G
Optical fiber inter-continental
Optical fiber inter-country
ADSL
Private local Network

11
4G delivers us ?
11http://opensignal.com/reports/state-of-lte-q1-2014/
Yes, it multiple the download by 4
More dedicated bandwidth depends on the overall traffic and mobile traffic increased by 68 % in France
But it reduces latencyjust by 40 %
12
Why is performance important ?
The Impact of mobility
How to test ?
Yesterdayssolutions ?
Todays solutions ?

13
Tools to analyse application performance(APM : Application Performance Management)
Synthetic testing Real User Monitoring (RUM)
Probe to integrate into applications or based on emulations
Objectives : crash, display time , ...by screens / by request
Actors: Compuware Riverbet , AppDynamics , New Relic , Akamai ( Movbitest ) , Keynote Systems, Witbe, Dynatrace, Aternity, Newrelic, …
Robots testing applications on devices

14
Why is performance important ?
The impact of mobility
How to test ?
Yesterdays solution
Todays solutions

15
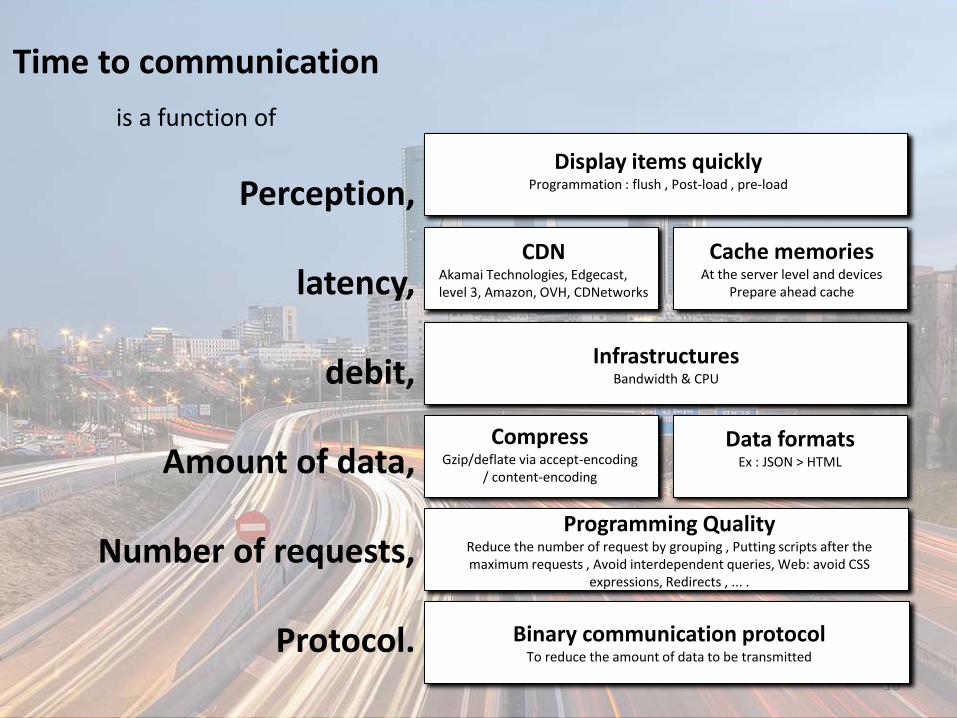
Time to communication
is a function of
Perception,
latency,
debit,
Amount of data,
Number of requests,
Protocol.
16
Display items quicklyProgrammation : flush , Post-load , pre-load
CDNAkamai Technologies, Edgecast, level 3, Amazon, OVH, CDNetworks
Cache memoriesAt the server level and devices
Prepare ahead cache
InfrastructuresBandwidth & CPU
CompressGzip/deflate via accept-encoding
/ content-encoding
Data formatsEx : JSON > HTML
Binary communication protocolTo reduce the amount of data to be transmitted
Programming QualityReduce the number of request by grouping , Putting scripts after the maximum requests , Avoid interdependent queries, Web: avoid CSS
expressions, Redirects , ... .
Time to communication
is a function of
Perception,
latency,
debit,
Amount of data,
Number of requests,
Protocol.

17
Why is performance important ?
The impact of mobility
How to test ?
Yesterdayssolutions
Todays solutions

18
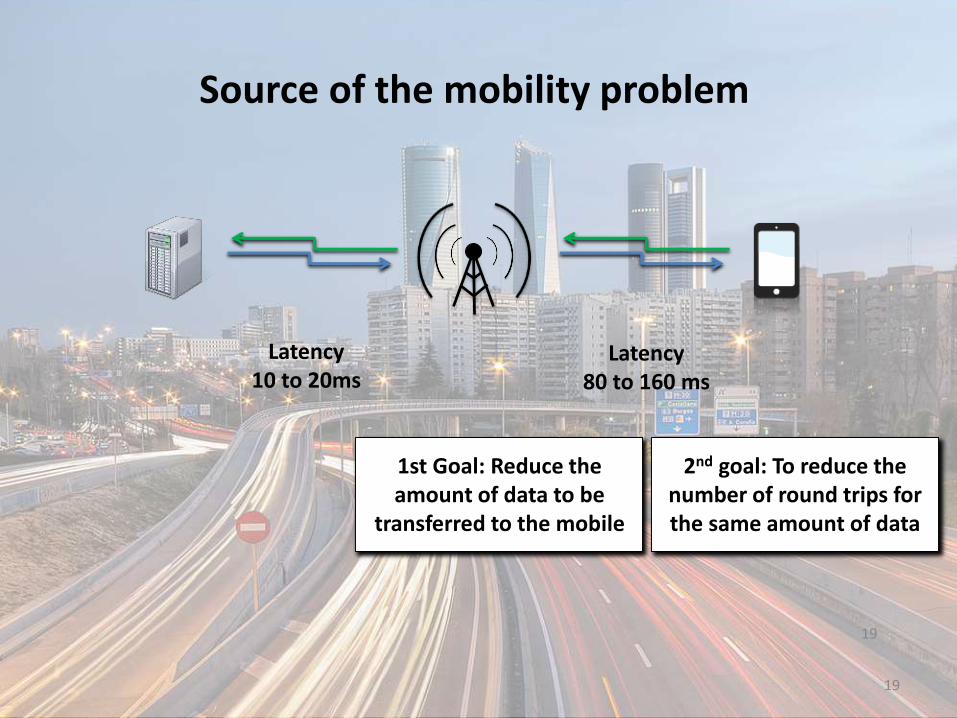
Latency 10 to 20ms
Latency 80 to 160 ms
Source of the mobility problem
19
19
1st Goal: Reduce the amount of data to be
transferred to the mobile
2nd goal: To reduce the number of round trips for the same amount of data
Source of the mobility problem
Latency 10 to 20ms
Latency 80 to 160 ms
20
Sources
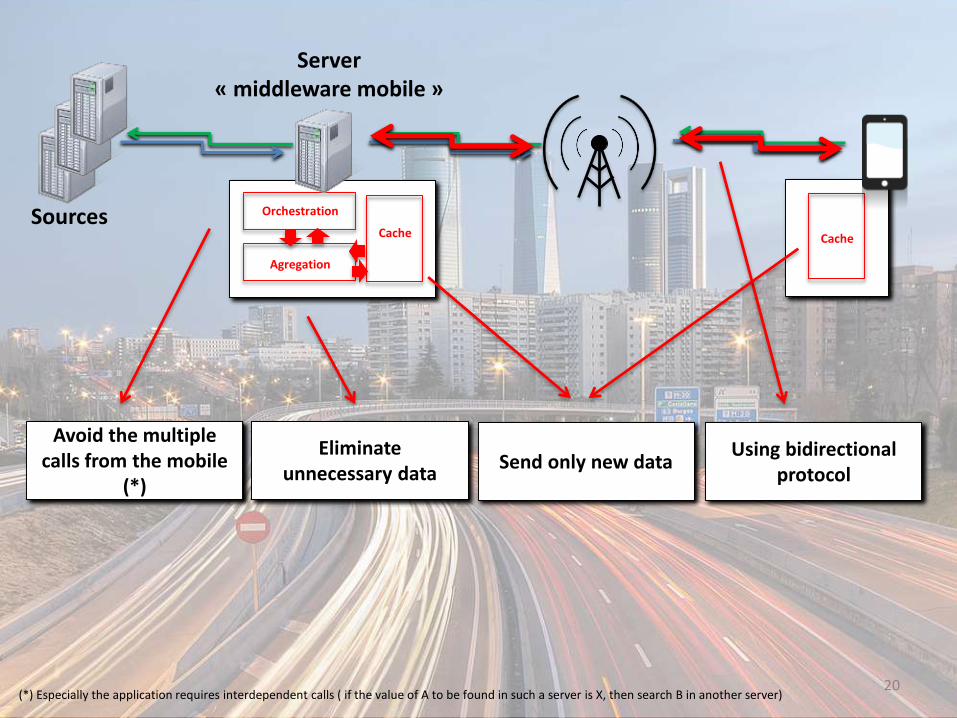
Server « middleware mobile »
Agregation
Cache Cache
Orchestration
Eliminateunnecessary data
Avoid the multiple calls from the mobile
(*)Send only new data
Using bidirectionalprotocol
(*) Especially the application requires interdependent calls ( if the value of A to be found in such a server is X, then search B in another server)

21
« Hello !»« Yes ?! »
« Cool ! »
« I want this »« OK »« Here! »
HTTPPage 1
Page 2« Hello !»
« Again?! »« Cool ! »
« I want this »« OK »« Here! »
Page 1 – Data refresh (*)
« Yeah … »
« Cool !»
« OK »« Here! »
« Hello !»« Yes ?! »
« I want this »« OK »« Tiens! »
Page 1
2nd page
«I want this »
« Here! »
1st page – data refresh
« Here! »
Bidirectional protocol
Note: (* ) upgradeable scenario with long polling
Compared to the conventional protocol and two-way protocol
« Hello !»
« I want this »
« Cool ? »

22
Transferred data for the same transactionMobile application for trading
Transferred data for the same transactionMobile application for sports betting
298
95
1.60
50
100
150
200
250
300
350
Web app Mobile app Motwin app
Ko Ko
608
243
48
0
100
200
300
400
500
600
700
Web app Mobile app Motwin app
-99% -92%
The impact of these new solutions on the quantity of transferred data
23
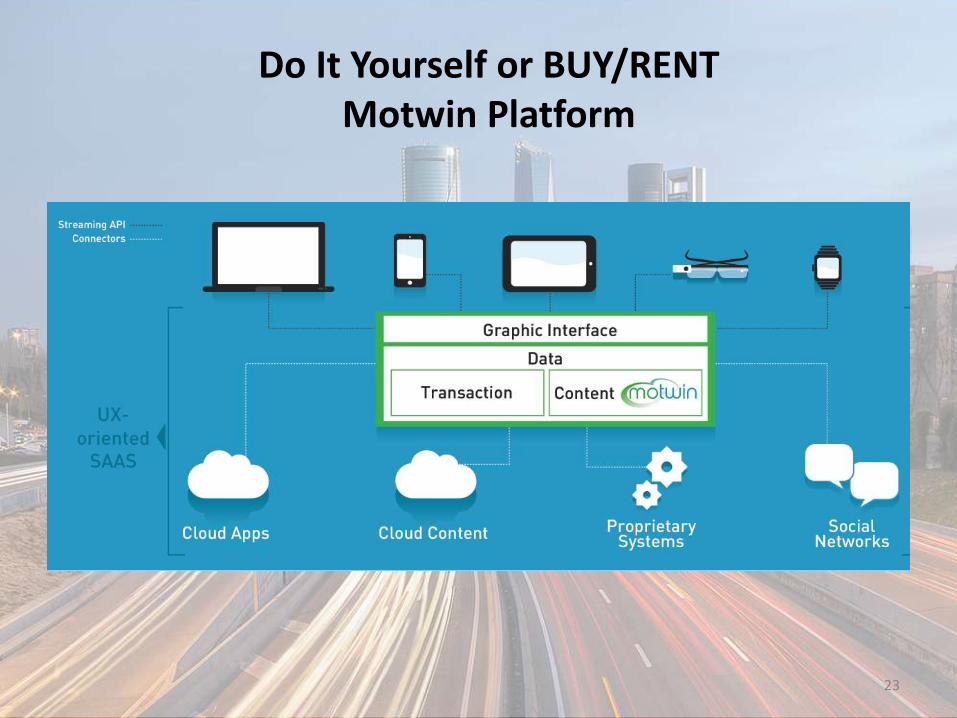
Do It Yourself or BUY/RENTMotwin Platform

24
Implementation of the Motwin platform

25
3 sensitive segments performance
Trading & Betting
• Access to real-time data
• UI faster for customers in a hurry to buy / sell / bet
Collaborators Tools
• Real time CRM/ERP
• Assisted maintenance
IoT real time BtB
• Configuration, Maintenance and Monitoring
• IU efficient and real - time control objects
25
Critical data
Efficiency and Productivity
Critical systems

26
Reactivity Disponibility Speeddeployment
Maintenance Costand Scalability
-30 to 70% 90% less data
Management Microcuts
x 7Beyond the
first OS
-30% to -60%

Thank You !
Stand : E32B
27
www.motwin.com
@motwin_inc