2014.09_Furniture (2)
21
Furniture Executive Summary This sector fact sheet provides key trade and investment related statistics for the furniture sector. Specifically, it shows global trade and investment flows including an analysis of top markets and products for South Africa and the Western Cape highlighting the largest and fastest growing products and sub-sectors. The key highlights in the furniture sector are provided below: SECTOR OVERVIEW In the last 10 years, world trade of furniture has grown faster than furniture production, and has consistently amounted to about 1% of the world trade of manufactures. Current trends in the South African furniture sector include major retailors providing e-commerce services such as online buying as well as increased consumer confidence and increased value sales. TRADE Global trade in furniture was worth ZAR1.18trn in 2012, growing by 18% from 2011. South Africa’s exports of furniture was worth ZAR4.26bn in 2013 and grew 50.3% from 2012. Western Cape’s exports of furniture was worth ZAR282m in 2012 growing by 4.4% from 2011. Parts of seats are the Western Cape’s largest furniture export in value terms, reaching ZAR107m in 2012 and a compound Annual Growth Rate (CAGR) of 7% was experienced in this sub-sector from 2004 to 2012. The Western Cape used to be a net exporter of metal furniture but from 2006 become a net importer with an import CAGR of around 24%. Germany was the leading destination market for furniture products from South Africa in 2013 (ZAR1.1bn), and from the Western Cape in 2012 (ZAR70m) Seven out of the top ten South African export destination markets for furniture are other African countries. Six out of the top ten Western Cape export destination markets for furniture are other African countries. INVESTMENT Foreign Direct Investment (FDI) into the South African furniture sector between 2003 and 2013 reached ZAR649.71m, which is an average investment of ZAR129.78m per project. South Africa is the 21 th largest source market for global FDI projects in this sector and the 49 th largest destination market. Poltrona Frau invested ZAR300m in the Cape Town in March 2012 for a furniture retail project.
-
Upload
neil-a-yates -
Category
Documents
-
view
7 -
download
2
description
An analysis on Furniture
Transcript of 2014.09_Furniture (2)
Furniture
Executive Summary
This sector fact sheet provides key trade and investment related statistics for the furniture sector. Specifically, it
shows global trade and investment flows including an analysis of top markets and products for South Africa and
the Western Cape highlighting the largest and fastest growing products and sub-sectors. The key highlights in the
furniture sector are provided below:
SECTOR OVERVIEW
In the last 10 years, world trade of furniture has grown faster than furniture production, and has
consistently amounted to about 1% of the world trade of manufactures.
Current trends in the South African furniture sector include major retailors providing e-commerce services
such as online buying as well as increased consumer confidence and increased value sales.
TRADE
Global trade in furniture was worth ZAR1.18trn in 2012, growing by 18% from 2011.
South Africa’s exports of furniture was worth ZAR4.26bn in 2013 and grew 50.3% from 2012.
Western Cape’s exports of furniture was worth ZAR282m in 2012 growing by 4.4% from 2011.
Parts of seats are the Western Cape’s largest furniture export in value terms, reaching ZAR107m in 2012
and a compound Annual Growth Rate (CAGR) of 7% was experienced in this sub-sector from 2004 to
2012.
The Western Cape used to be a net exporter of metal furniture but from 2006 become a net importer with
an import CAGR of around 24%.
Germany was the leading destination market for furniture products from South Africa in 2013 (ZAR1.1bn),
and from the Western Cape in 2012 (ZAR70m)
Seven out of the top ten South African export destination markets for furniture are other African countries.
Six out of the top ten Western Cape export destination markets for furniture are other African countries.
INVESTMENT
Foreign Direct Investment (FDI) into the South African furniture sector between 2003 and 2013 reached
ZAR649.71m, which is an average investment of ZAR129.78m per project.
South Africa is the 21th largest source market for global FDI projects in this sector and the 49th largest
destination market.
Poltrona Frau invested ZAR300m in the Cape Town in March 2012 for a furniture retail project.

2
1. Sector Overview
The global furniture sector includes all movable articles that are used to make a room or building suitable for living
or working in, such as tables, chairs, or desks. The definition used in this sector analysis also includes mattresses
and parts of furniture that are not yet compiled. It specifically excludes medical, dental or veterinary furniture as
well as all rotating, reclining and elevating seats. This sector review will look at the retail sale of furniture globally
and particularly in South Africa and the Western Cape.
The products assessed in this sector are classified under domestic or household furniture, including office furniture.
Furniture is usually divided by function into the following sub-sectors:
SUB-SECTORS OF DOMESTIC AND OFFICE FURNITURE
SUB-SECTORS PRODUCT GROUPS
Upholstered seating
Armchairs, reclining chairs, couches, sofas, divans,
footstools, seating elements upholstered with leather, wool,
synthetic material, cotton etc.
Non-upholstered seating Seats, armchairs, rocking chairs, seats convertible into
beds, stools
Dining and living room furniture
Dining sets (tables and chairs), dressers, coffee tables,
sideboards, shelf systems, room dividers,
television/video/music system storage units
Kitchen furniture
Fitted cabinets and kitchen units, kitchen tables and chairs,
free-standing pieces such as movable trolleys and butcher
blocks
Bedroom Furniture Beds, headboards, bedside tables, dressing tables, chests
of drawers, wardrobes (fitted or free standing)
Office furniture Desks, chairs, drawer units, filing cabinets, integrated
workstations
Other furniture Cupboards, bookcases and wall units, mirrors, hall stands,
bathroom furniture such as baskets
Furniture parts Parts of furniture or seats, including semi-finished furniture
Source: cbi, 2014
In addition to its function, furniture can also be defined by material or content or by style. Furniture by raw material
can be classified as:
Wood
Cane, osier, bamboo, etc.
Metal
Plastic/synthetic
Stone
Glass
Combination of materials
The materials used in the furniture manufacturing process affects the prices and profit margins in the furniture
sector. The global commodity prices that can be analysed include cotton, iron, steel and aluminium. The graphs
below show the prices of the commodities and the percentage change in price from year to year. All of the
commodities experienced large dips in 2009 due to the financial crisis as well as in 2012 due to many developed
economies experiencing a double-dip recession, US dollar appreciation and a slowdown in global demand.
Interestingly, none of the metal commodity prices are forecast to rise above pre-crisis levels and all the commodities
below are forecast to stabilise to a certain degree.
Cotton prices range between 57USc/lb and 138USc/lb, with quite a high volatility. From 2014 the price is
forecast to average around 80 to 90USc/lb.
Iron prices range between 84USD/tonne and 176 USD/tonne, with quite a high volatility. From 2014 the
price is forecast to average around 90 to 100 USD/tonne.
Aluminium prices range between 1704USD/tonne and 2425USD/tonne, with quite a high volatility. From
2014 the price is forecast to rise steadily from 1800USD/tonne to 2200 USD/tonne in 2018.
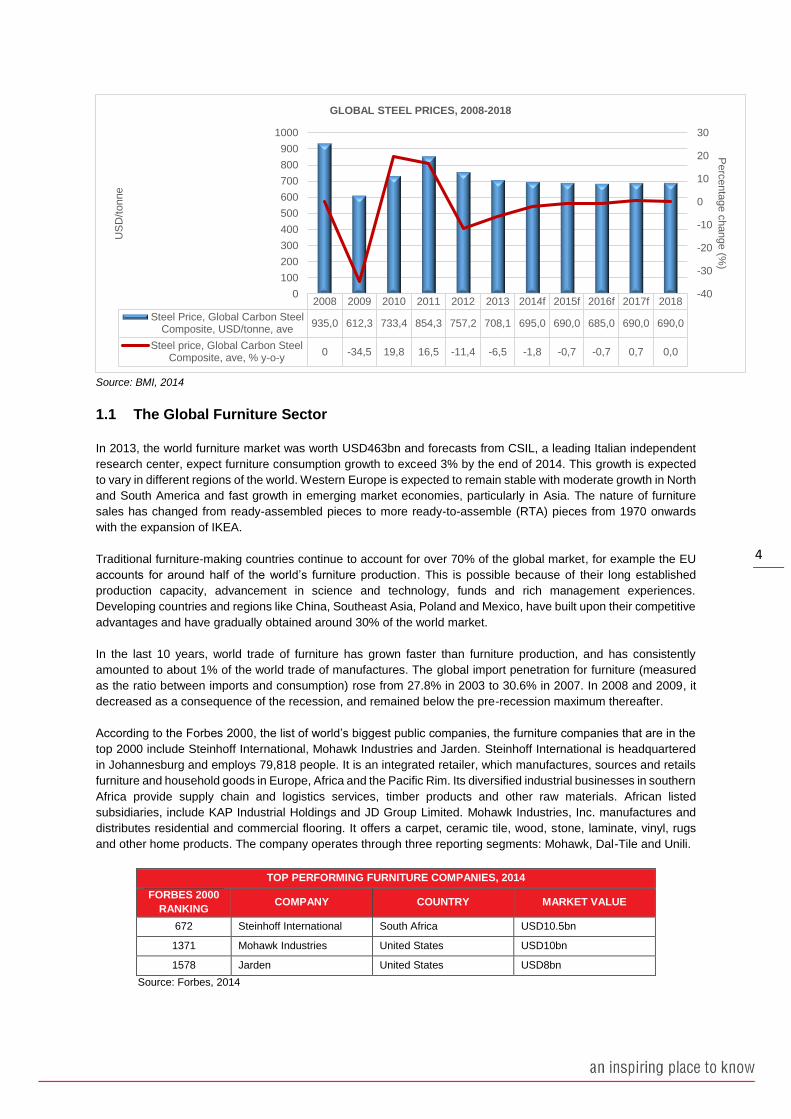
Steel prices range between 612USD/tonne and 935USD/tonne, with quite a high volatility. From 2014 the
price is forecast to average around 690USD/tonne.

3
Source: BMI, 2014
Source: BMI, 2014
Source: BMI, 2014
2008 2009 2010 2011 2012 2013 2014f 2015f 2016f 2017f 2018f
Cotton Price, USc/lb, ave 63,6 57,1 94,1 137,5 79,7 83,4 82,0 84,0 86,0 89,0 91,5
Cotton price, ave, % y-o-y 11,2 -10,2 64,8 46,1 -42,0 4,6 -1,6 2,4 2,4 3,5 2,8
-60
-40
-20
0
20
40
60
80
0
20
40
60
80
100
120
140
160
Perc
enta
ge c
hange (%
)
US
c/lb
GLOBAL COTTON PRICES, 2008-2018
2008 2009 2010 2011 2012 2013 2014f 2015f 2016f 2017f 2018
Iron Ore Price, USD/tonne, ave 152,5 84,5 153,4 175,5 128,6 135,2 108,0 100,0 95,0 90,0 85,0
Iron ore price, ave, % y-o-y 25,6 -44,6 81,5 14,4 -26,7 5,1 -20,1 -7,4 -5,0 -5,3 -5,6
-60
-40
-20
0
20
40
60
80
100
0,0
20,0
40,0
60,0
80,0
100,0
120,0
140,0
160,0
180,0
200,0
Perc
enta
ge c
hange (%
)
US
D/t
onne
GLOBAL IRON PRICES, 2008-2018
2008 2009 2010 2011 2012 2013 2014f 2015f 2016f 2017f 2018
Aluminium Price, Three-month,USD/tonne, ave
2623 1704 2193 2421 2053 1887 1850 1900 2000 2100 2200
Aluminium price, three-month, ave, %y-o-y
-1,5 -35,0 28,7 10,4 -15,2 -8,1 -2,0 2,7 5,3 5,0 4,8
-40
-30
-20
-10
0
10
20
30
40
0
500
1000
1500
2000
2500
3000
Perc
enta
ge c
hange (%
)
US
D/t
onne
GLOBAL ALUMINIUM PRICES, 2008-2018
4
Source: BMI, 2014
1.1 The Global Furniture Sector
In 2013, the world furniture market was worth USD463bn and forecasts from CSIL, a leading Italian independent
research center, expect furniture consumption growth to exceed 3% by the end of 2014. This growth is expected
to vary in different regions of the world. Western Europe is expected to remain stable with moderate growth in North
and South America and fast growth in emerging market economies, particularly in Asia. The nature of furniture
sales has changed from ready-assembled pieces to more ready-to-assemble (RTA) pieces from 1970 onwards
with the expansion of IKEA.
Traditional furniture-making countries continue to account for over 70% of the global market, for example the EU
accounts for around half of the world’s furniture production. This is possible because of their long established
production capacity, advancement in science and technology, funds and rich management experiences.
Developing countries and regions like China, Southeast Asia, Poland and Mexico, have built upon their competitive
advantages and have gradually obtained around 30% of the world market.
In the last 10 years, world trade of furniture has grown faster than furniture production, and has consistently
amounted to about 1% of the world trade of manufactures. The global import penetration for furniture (measured
as the ratio between imports and consumption) rose from 27.8% in 2003 to 30.6% in 2007. In 2008 and 2009, it
decreased as a consequence of the recession, and remained below the pre-recession maximum thereafter.
According to the Forbes 2000, the list of world’s biggest public companies, the furniture companies that are in the
top 2000 include Steinhoff International, Mohawk Industries and Jarden. Steinhoff International is headquartered
in Johannesburg and employs 79,818 people. It is an integrated retailer, which manufactures, sources and retails
furniture and household goods in Europe, Africa and the Pacific Rim. Its diversified industrial businesses in southern
Africa provide supply chain and logistics services, timber products and other raw materials. African listed
subsidiaries, include KAP Industrial Holdings and JD Group Limited. Mohawk Industries, Inc. manufactures and
distributes residential and commercial flooring. It offers a carpet, ceramic tile, wood, stone, laminate, vinyl, rugs
and other home products. The company operates through three reporting segments: Mohawk, Dal-Tile and Unili.
TOP PERFORMING FURNITURE COMPANIES, 2014
FORBES 2000
RANKING COMPANY COUNTRY MARKET VALUE
672 Steinhoff International South Africa USD10.5bn
1371 Mohawk Industries United States USD10bn
1578 Jarden United States USD8bn
Source: Forbes, 2014
2008 2009 2010 2011 2012 2013 2014f 2015f 2016f 2017f 2018
Steel Price, Global Carbon SteelComposite, USD/tonne, ave
935,0 612,3 733,4 854,3 757,2 708,1 695,0 690,0 685,0 690,0 690,0
Steel price, Global Carbon SteelComposite, ave, % y-o-y
0 -34,5 19,8 16,5 -11,4 -6,5 -1,8 -0,7 -0,7 0,7 0,0
-40
-30
-20
-10
0
10
20
30
0
100
200
300
400
500
600
700
800
900
1000
Perc
enta
ge c
hange (%
)
US
D/t
onne
GLOBAL STEEL PRICES, 2008-2018
5
1.2 South African Furniture Sector
When considering the South African consumer spending on furniture over time we have used the broad definition
which is the sum of spending on household furniture for all household rooms such as chairs, sofas, tables, beds,
cupboards, ornaments, mirrors, baby furniture, bedding, ceramics, etc. It also includes carpets and other floor
coverings and furniture repairs which are not included in the trade and investment analysis.
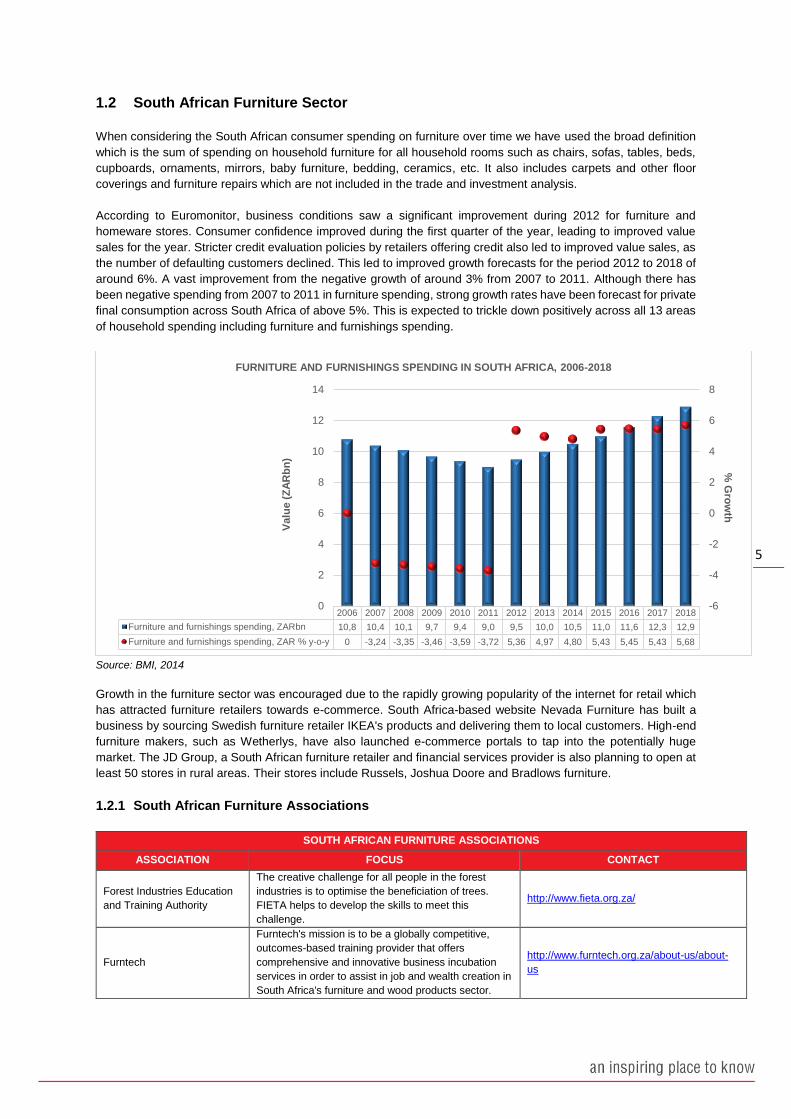
According to Euromonitor, business conditions saw a significant improvement during 2012 for furniture and
homeware stores. Consumer confidence improved during the first quarter of the year, leading to improved value
sales for the year. Stricter credit evaluation policies by retailers offering credit also led to improved value sales, as
the number of defaulting customers declined. This led to improved growth forecasts for the period 2012 to 2018 of
around 6%. A vast improvement from the negative growth of around 3% from 2007 to 2011. Although there has
been negative spending from 2007 to 2011 in furniture spending, strong growth rates have been forecast for private
final consumption across South Africa of above 5%. This is expected to trickle down positively across all 13 areas
of household spending including furniture and furnishings spending.
Source: BMI, 2014
Growth in the furniture sector was encouraged due to the rapidly growing popularity of the internet for retail which
has attracted furniture retailers towards e-commerce. South Africa-based website Nevada Furniture has built a
business by sourcing Swedish furniture retailer IKEA's products and delivering them to local customers. High-end
furniture makers, such as Wetherlys, have also launched e-commerce portals to tap into the potentially huge
market. The JD Group, a South African furniture retailer and financial services provider is also planning to open at
least 50 stores in rural areas. Their stores include Russels, Joshua Doore and Bradlows furniture.
1.2.1 South African Furniture Associations
SOUTH AFRICAN FURNITURE ASSOCIATIONS
ASSOCIATION FOCUS CONTACT
Forest Industries Education
and Training Authority
The creative challenge for all people in the forest
industries is to optimise the beneficiation of trees.
FIETA helps to develop the skills to meet this
challenge.
http://www.fieta.org.za/
Furntech
Furntech's mission is to be a globally competitive,
outcomes-based training provider that offers
comprehensive and innovative business incubation
services in order to assist in job and wealth creation in
South Africa's furniture and wood products sector.
http://www.furntech.org.za/about-us/about-
us
2006 2007 2008 2009 2010 2011 2012 2013 2014 2015 2016 2017 2018
Furniture and furnishings spending, ZARbn 10,8 10,4 10,1 9,7 9,4 9,0 9,5 10,0 10,5 11,0 11,6 12,3 12,9
Furniture and furnishings spending, ZAR % y-o-y 0 -3,24 -3,35 -3,46 -3,59 -3,72 5,36 4,97 4,80 5,43 5,45 5,43 5,68
-6
-4
-2
0
2
4
6
8
0
2
4
6
8
10
12
14
% G
row
th
Valu
e (
ZA
Rb
n)
FURNITURE AND FURNISHINGS SPENDING IN SOUTH AFRICA, 2006-2018

6
The wood and paper industries in South Africa also have a Competitiveness Enhancement Incentives (ECA)
managed by the IDC. These are investments which facilitate increased competitiveness, sustainable economic
growth and development in a specific sector. Focus areas are projects and investments in forestry, pulp and paper,
furniture, saw milling, board production and renewable energy. The applicability is competitive risk-related interest
rates based on the prime bank overdraft rate.
1.3 Western Cape Furniture Sector
The manufacture of furniture in the Western Cape is depicted in the graph below. The graph shows that over time
the percentage contribution of furniture and other manufacture is declining as a percentage of GDP from 2.04% in
2003 to 1.66% in 2011. The value of the furniture manufacturing sector in the Western Cape peaked in 2008 at
ZAR3.4bn and has since declined to ZAR3.08bn in 2011.
Source: Quantec, 2014
1.3.1 Western Cape Furniture Associations
The Western Cape has a few associations that provide support to the furniture sector in the Province. They can
be seen in the table below:
WESTERN CAPE FURNITURE ASSOCIATIONS
ASSOCIATION FOCUS CONTACT
Cape Furniture
Manufacturer’s Association
(CFMA)
Provide support for collective bargaining and
representation. http://www.cfma.org.za/
Western Cape Furniture
Initiative
To develop and grow the furniture industry in a
sustainable manner through the implementation of
programmes and interventions that will improve the
industry skills and making the furniture industry
globally competitive
http://www.capefurniture.za.org/about.htm
Furniture Bargaining Council
for the Western Cape Representation, mediation and administration http://www.furniture.org.za/about.htm
2003 2004 2005 2006 2007 2008 2009 2010 2011
Furniture and other manufacturing(ZARbn)
2,74 2,83 2,98 3,13 3,24 3,40 3,07 3,09 3,08
% of total GDP 2,04% 2,00% 1,98% 1,96% 1,91% 1,92% 1,76% 1,71% 1,66%
0,0%
0,5%
1,0%
1,5%
2,0%
2,5%
0,0
0,5
1,0
1,5
2,0
2,5
3,0
3,5
4,0
% C
ON
TR
IBU
TIO
N T
O G
DP
VA
LU
E (
ZA
Rb
n)
FURNITURE MANUFACTURING IN THE WESTERN CAPE: CONTRIBUTION TO GDP, 2003-2011

7
1.3.2 Western Cape Furniture Sector Value Chain
Companies in the furniture value chain in the Western Cape are presented below. These are the companies
registered under the Companies and Intellectual Properties Commission (CIPC) under furniture manufacture
[SIC931], furniture and requisite wholesale [SIC6139] and furniture retail outlets [SIC6233].
Source: BFA, 2014
MANUFACTURE [SIC931]
• CARLIZE ELS INTERIOR DESIGN CONSULTANT
• COTTAGE FURNITURE MANUFACTURERS
• DREAMWORKS KITCHENS
• JUAN ARCHITECTURAL INTERIOR DESIGN PROJECTS
• MILO'S CABINET WORKS
• RENSILVLEI
• BC WOODWORKS
• CCC MANUFACTURING
• DIENER CUPBOARDS
• MAVERICK TRADING 399
WHOLESALE DISTRIBUTORS [SIC6139]
• 360 DEGREE BLINDS AND PROJECT SOLUTIONS
• A AND E FURNITURE
• A AND G FURNITURE SUPPLIES
• ADESSO WHOLESALE
• AMABANE AIRCONDITIONING
• BHOFOLO FURNISHERS
• BRICKFIELD OFFICE FURNITURE AND TRADING
• CONTRAFURN
• CRAFTWELL KITCHENS AND INTERIORS
• DAVE WATLING AGENCIES
• FUTURE FURNISHERS
• GOUROUX
• HOT TUNA PROPS
• HUNTERS AIR
• INTERNATIONAL FURNITURE HOUSE
• J AND B SATELITES
• KZN KITCHEN CUPBOARDS
• LATIF FURNISHERS
• LEZMIN 2748
• LOW PRICE FURNISHERS
• MAGNUM MEUBELS
• MAP FURNITURE WAREHOUSE
• NATALIA FURNISHERS
• SEAWOLF MARINE
• SEN-AD
• SHAINE AMIKA TRADING
• SUPER PRICE FURNISHERS
• VARI-VEST FOURTEEN
RETAIL OUTLETS [SIC 6233]
• CHEAP SLEEP
• LE JACQUES BEACH HOUSE D'COR
• LIGHTHOUSE LOUNGE
• OFFICE MAD LIQUIDATION CENTRE
• THE BEDROOM SHOP

8
2. Trade
2.1 Global Trade in the Furniture Sector
Global exports of furniture products increased steadily from 2004 to 2008, before a dip in 2009. However increases
in exports were recorded from 2010 to 2012, with 2012 recording the highest exports of furniture products over the
ten year period. Global exports of furniture increased from ZAR606bn in 2004 to ZAR1.18trn in 2012. In 2012,
exports of furniture products increased by 18%, the highest growth since pre-crisis levels.
Source: TradeMap, 2014
As can be seen below, China was the leading source market for furniture products in 2012, valued at ZAR455bn,
followed by Germany and Italy valued at ZAR92bn and ZAR87bn respectively. Other top source markets were
Poland (ZAR69bn) and the United States (ZAR57bn). Four of the top 10 source markets are European markets.
South Africa is ranked 40th, exporting furniture to the value of ZAR2.8bn.
Source: TradeMap, 2014
2004 2005 2006 2007 2008 2009 2010 2011 2012
Trade (ZARbn) 606 661 768 930 1 110 911 926 1 002 1 184
y-o-y Growth (%) 1 9 16 21 19 -18 2 8 18
-20
-15
-10
-5
0
5
10
15
20
25
0
200
400
600
800
1 000
1 200
1 400
% g
row
thV
alu
e (
ZA
R b
n)
GLOBAL FURNITURE TRADE, 2004-2012
TOP 10 EXPORTING MARKETS FOR FURNITURE, 2012
RANK SOURCE MARKETS
VALUE
2012
(ZARbn)
%GROWTH
2011-2012
1 China 455 42.9%
2 Germany 92 5.8%
3 Italy 87 6.1%
4 Poland 69 5.1%
5 United States of America 57 28.1%
6 Mexico 47 36.4%
7 Viet Nam 40 79.4%
8 Canada 31 17.7%
9 Malaysia 22 17.5%
10 France 20 3.5%
40 South Africa 2.8 -13%
TOTAL 1 721 25.6%
9
The top 5 export products from each of the top 3 export markets are listed below:
China (HS10)
Metal furniture (ZAR76bn)
Wooden furniture (ZAR71bn)
Other upholstered and metal framed seats (50bn)
Furniture parts (ZAR47bn)
Articles of bedding with man-made stuffed fibre (ZAR39bn)
Germany (HS10)
Fitted kitchens (ZAR19bn)
Non-wooden seat parts (ZAR17bn)
Metal furniture (ZAR13bn)
Parts of metal furniture (ZAR7bn)
Wooden furniture for bedrooms (ZAR6bn)
Italy (HS10)
Wooden furniture (ZAR16bn)
Upholstered seats with wooden frames (ZAR14bn)
Non-metal and wood parts of furniture (ZAR10bn)
Wooden parts of furniture (ZAR9bn)
Fitted kitchen units(ZAR7bn)
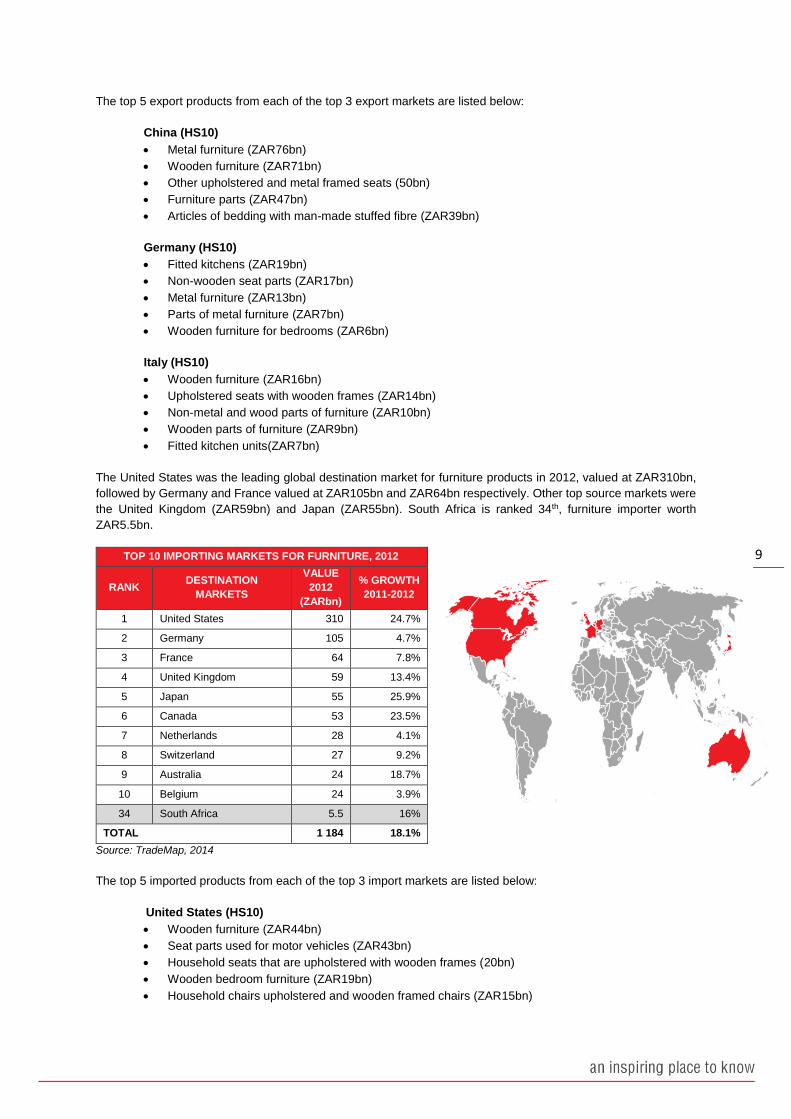
The United States was the leading global destination market for furniture products in 2012, valued at ZAR310bn,
followed by Germany and France valued at ZAR105bn and ZAR64bn respectively. Other top source markets were
the United Kingdom (ZAR59bn) and Japan (ZAR55bn). South Africa is ranked 34th, furniture importer worth
ZAR5.5bn.
TOP 10 IMPORTING MARKETS FOR FURNITURE, 2012
RANK DESTINATION
MARKETS
VALUE
2012
(ZARbn)
% GROWTH
2011-2012
1 United States 310 24.7%
2 Germany 105 4.7%
3 France 64 7.8%
4 United Kingdom 59 13.4%
5 Japan 55 25.9%
6 Canada 53 23.5%
7 Netherlands 28 4.1%
8 Switzerland 27 9.2%
9 Australia 24 18.7%
10 Belgium 24 3.9%
34 South Africa 5.5 16%
TOTAL 1 184 18.1%
Source: TradeMap, 2014
The top 5 imported products from each of the top 3 import markets are listed below:
United States (HS10)
Wooden furniture (ZAR44bn)
Seat parts used for motor vehicles (ZAR43bn)
Household seats that are upholstered with wooden frames (20bn)
Wooden bedroom furniture (ZAR19bn)
Household chairs upholstered and wooden framed chairs (ZAR15bn)
10
Germany (HS10)
Non wooden seat parts (ZAR37bn)
Household seats that are upholstered with wooden frames (ZAR14bn)
Wooden furniture for dining room and living room (ZAR10bn)
Wooden furniture (ZAR9bn)
Metal furniture (ZAR7bn)
France (HS10)
Upholstered seats with wooden frames (ZAR9bn)
Non- wood parts of seats (ZAR8bn)
Wooden furniture (ZAR7bn)
Metal furniture (ZAR5bn)
Wooden furniture for dining room and living room (ZAR5bn)
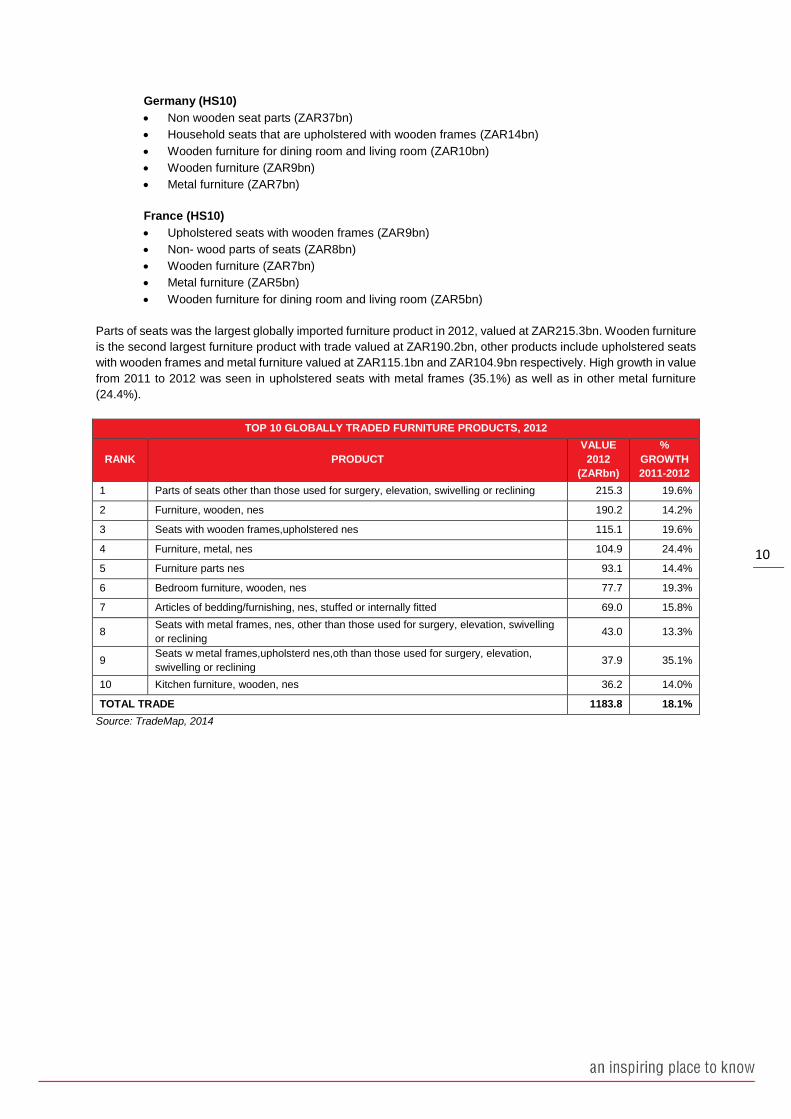
Parts of seats was the largest globally imported furniture product in 2012, valued at ZAR215.3bn. Wooden furniture
is the second largest furniture product with trade valued at ZAR190.2bn, other products include upholstered seats
with wooden frames and metal furniture valued at ZAR115.1bn and ZAR104.9bn respectively. High growth in value
from 2011 to 2012 was seen in upholstered seats with metal frames (35.1%) as well as in other metal furniture
(24.4%).
TOP 10 GLOBALLY TRADED FURNITURE PRODUCTS, 2012
RANK PRODUCT
VALUE
2012
(ZARbn)
%
GROWTH
2011-2012
1 Parts of seats other than those used for surgery, elevation, swivelling or reclining 215.3 19.6%
2 Furniture, wooden, nes 190.2 14.2%
3 Seats with wooden frames,upholstered nes 115.1 19.6%
4 Furniture, metal, nes 104.9 24.4%
5 Furniture parts nes 93.1 14.4%
6 Bedroom furniture, wooden, nes 77.7 19.3%
7 Articles of bedding/furnishing, nes, stuffed or internally fitted 69.0 15.8%
8 Seats with metal frames, nes, other than those used for surgery, elevation, swivelling
or reclining 43.0 13.3%
9 Seats w metal frames,upholsterd nes,oth than those used for surgery, elevation,
swivelling or reclining 37.9 35.1%
10 Kitchen furniture, wooden, nes 36.2 14.0%
TOTAL TRADE 1183.8 18.1%
Source: TradeMap, 2014

11
2.2 South African Furniture Trade
South African exports of furniture has been volatile over the past decade. Imports rose sharply from 2012 to 2013,
increasing by 16%. Exports declined from 2011 to 2012, increasing the negative trade balance experienced by
South Africa. South Africa has not always been a net importer of furniture, for example from 2004-2007 South
Africa was a net exporter as well as in 2009 and 2010. The change in South Africa’s trade position is due to an
increase in imports from emerging markets such as China, as their competitive advantage in this industry is
increasing.
Source: TradeMap, 2014
Germany was the leading destination market for furniture from South Africa in 2013, with a value of ZAR1.15bn,
the largest export to Germany is parts of seats other than medical and dental furniture. This is also the greatest
imported product from Germany to South Africa. Germany is one of the world’s largest manufacturers and global
exporters of furniture and South Africa also imports from Germany (ZAR489m). Namibia and Botswana are South
Africa’s second and third largest destination markets valued at ZAR557m and ZAR427m respectively. Seven out
of the top ten destination markets for furniture products are other African countries, with three other European
markets.
China was the leading source market for furniture to South Africa in 2013, valued at ZAR2.88bn, making up 52%
of all South African imports. China is followed by Germany and Thailand valued at ZAR489m and ZAR321m. Five
of the top 10 source markets are Asian markets. The top 5 imported products from China are wooden furniture
(ZAR442m); household chairs upholstered and wooden framed chairs (ZAR397m); metal furniture (ZAR281m);
articles of bedding stuffed or internally fitted (ZAR245m) and parts of seats other than those used for surgery,
elevation, swivelling or reclining (ZAR232m).
2004 2005 2006 2007 2008 2009 2010 2011 2012 2013
Import (ZARbn) 1,53 2,30 3,04 3,58 4,06 3,15 3,81 4,06 4,80 5,58
Exports (ZARbn) 4,08 3,50 3,24 3,73 4,04 3,27 3,96 3,27 2,83 4,26
Trade balance (ZARbn) 2,54 1,20 0,20 0,15 -0,02 0,12 0,15 -0,79 -1,96 -1,32
-3
-2
-1
0
1
2
3
4
5
6
Valu
e (
ZA
Rbn)
SOUTH AFRICAN FURNITURE TRADE, 2004-2013

12
SOUTH AFRICA'S TOP 10 EXPORT MARKETS OF
FURNITURE PRODUCTS, 2013
SOUTH AFRICA’S TOP 10 IMPORT MARKETS OF
FURNITURE PRODUCTS, 2013
RANK PRODUCT
VALUE
2013
(ZARm)
%
GROWTH,
2012-2013
RANK PRODUCT
VALUE
2013
(ZARm)
%
GROWTH,
2012-2013
1 Germany 1 151 -14.1% 1 China 2 883 11.7%
2 Namibia 557 - 2 Germany 489 27.0%
3 Botswana 427 - 3 Thailand 321 43.8%
4 Swaziland 223 - 4 Italy 212 35.5%
5 Lesotho 197 - 5 Malaysia 189 -2.7%
6 Zambia 192 1.2% 6 Poland 170 15.7%
7 Spain 170 39.7% 7 Indonesia 126 -0.9%
8 Mozambique 166 23.1% 8 United Kingdom 103 94.1%
9 Bulgaria 155 -10.6% 9 United States of America 96 13.3%
10 Zimbabwe 136 7.2% 10 India 94 21.8%
TOTAL EXPORTS 4 259 50.3% TOTAL IMPORTS 5 578 16.3%
Source: Trademap, 2014
Parts of seats were the leading furniture export from South Africa, valued at ZAR1.739bn, followed by wooden
furniture (ZAR426m) and other seats (ZAR274.5m). Three of the top 10 exports are seats or parts of seats. Mattrass
supports showed strong growth in exports of 659.5% in 2013.
The leading furniture import into South Africa was parts of seats valued at ZAR1.536bn, followed by wooden
furniture (ZAR797.8m) and seats with wooden frames (ZAR475.6m). There has been high growth in the import of
articles of bedding in 2013 with 53% growth, other furniture parts have also grown by 52.4% in 2013.
SOUTH AFRICA'S TOP 10 EXPORTS OF FURNITURE PRODUCTS,
2013
SOUTH AFRICA'S TOP 10 IMPORTS OF FURNITURE PRODUCTS,
2013
RANK PRODUCT
VALUE
2013
(ZARm)
%
GROWTH
2012-2013
RANK PRODUCT
VALUE
2013
(ZARm)
%
GROWTH
2012-2013
1
Parts of seats other than those used
for surgery, elevation, swivelling or
reclining
1 739.7 -4.6% 1
Parts of seats other than those used
for surgery, elevation, swivelling or
reclining
1 536.6 24.8%
2 Furniture, wooden, nes 426.0 172.6% 2 Furniture, wooden, nes 797.8 0.6%
3
Seats nes, other than those used for
surgery, elevation, swivelling or
reclining
274.5 54.7% 3 Seats with wooden frames,
upholstered nes 475.6 8.5%
4 Articles of bedding/furnishing, nes,
stuffed or internally fitted 222.6 272.0% 4 Furniture, metal, nes 421.8 6.8%
5 Furniture, metal, nes 204.8 61.4% 5 Articles of bedding/furnishing, nes,
stuffed or internally fitted 413.2 53.2%
6 Mattress supports 202.7 659.5% 6 Bedroom furniture, wooden, nes 299.6 3.9%
7 Bedroom furniture, wooden, nes 194.2 310.4% 7
Seats with metal frames, nes, other
than those used for surgery,
elevation, swivelling or reclining
235.7 19.3%
8 Seats with wooden frames,
upholstered nes 164.0 98.8% 8
Seats nes, other than those used for
surgery, elevation, swivelling or
reclining
208.8 -5.6%
9 Office furniture, wooden, nes 157.6 134.0% 9
Swivel seats & variable height
adjustment other than those used for
surgery and veterinary
175.4 45.5%
10
Mattresses fitted w
springs/stuffed/internally fitted w/any
material
119.5 422.5% 10 Furniture parts nes 175.2 52.4%
TOTAL EXPORTS 4 258.9 50.3% TOTAL IMPORTS 5 578.1 16.3%
Source: Trademap, 2014
13
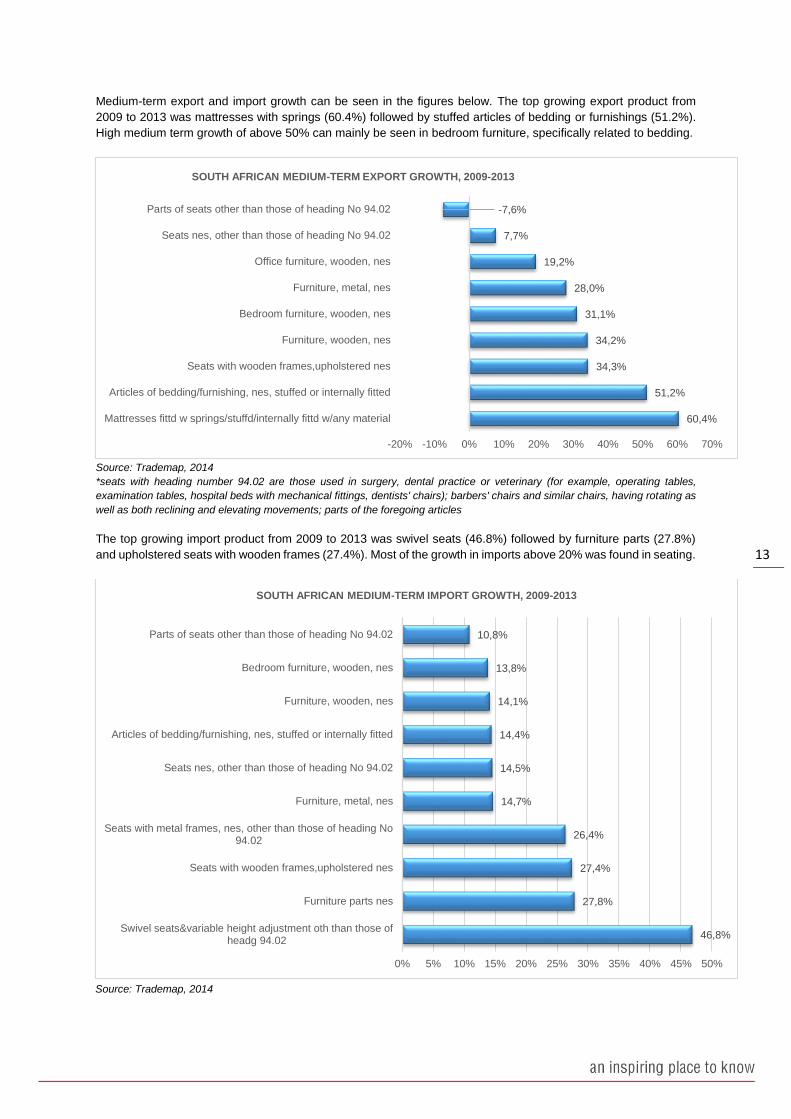
Medium-term export and import growth can be seen in the figures below. The top growing export product from
2009 to 2013 was mattresses with springs (60.4%) followed by stuffed articles of bedding or furnishings (51.2%).
High medium term growth of above 50% can mainly be seen in bedroom furniture, specifically related to bedding.
Source: Trademap, 2014
*seats with heading number 94.02 are those used in surgery, dental practice or veterinary (for example, operating tables,
examination tables, hospital beds with mechanical fittings, dentists' chairs); barbers' chairs and similar chairs, having rotating as
well as both reclining and elevating movements; parts of the foregoing articles
The top growing import product from 2009 to 2013 was swivel seats (46.8%) followed by furniture parts (27.8%)
and upholstered seats with wooden frames (27.4%). Most of the growth in imports above 20% was found in seating.
Source: Trademap, 2014
60,4%
51,2%
34,3%
34,2%
31,1%
28,0%
19,2%
7,7%
-7,6%
-20% -10% 0% 10% 20% 30% 40% 50% 60% 70%
Mattresses fittd w springs/stuffd/internally fittd w/any material
Articles of bedding/furnishing, nes, stuffed or internally fitted
Seats with wooden frames,upholstered nes
Furniture, wooden, nes
Bedroom furniture, wooden, nes
Furniture, metal, nes
Office furniture, wooden, nes
Seats nes, other than those of heading No 94.02
Parts of seats other than those of heading No 94.02
SOUTH AFRICAN MEDIUM-TERM EXPORT GROWTH, 2009-2013
46,8%
27,8%
27,4%
26,4%
14,7%
14,5%
14,4%
14,1%
13,8%
10,8%
0% 5% 10% 15% 20% 25% 30% 35% 40% 45% 50%
Swivel seats&variable height adjustment oth than those ofheadg 94.02
Furniture parts nes
Seats with wooden frames,upholstered nes
Seats with metal frames, nes, other than those of heading No94.02
Furniture, metal, nes
Seats nes, other than those of heading No 94.02
Articles of bedding/furnishing, nes, stuffed or internally fitted
Furniture, wooden, nes
Bedroom furniture, wooden, nes
Parts of seats other than those of heading No 94.02
SOUTH AFRICAN MEDIUM-TERM IMPORT GROWTH, 2009-2013

14
2.3 Western Cape Furniture Trade
The Western Cape’s trade of furniture products has been dominated by imports over the past decade, with exports
rising to ZAR282.34m in 2012. Western Cape’s imports have increased by 16.86% from 2011 to 2012 to reach
ZAR1.02bn in 2012. The import of furniture into the Western Cape is likely to increase into the future at around 6%
per annum.
Source: Quantec, 2014
Germany was the leading destination market for furniture from the Western Cape in 2012, with a value of ZAR70m.
Angola and the United Kingdom ranked second and third valued at ZAR38m and ZAR33m respectively. Six of the
top 10 destination markets are fellow African markets.
China was the leading source market for furniture imports into the Western Cape in 2012, with a value of ZAR672m.
Indonesia and Pakistan ranked second and third valued at ZAR45m and ZAR43m respectively. Six of the top 10
source countries are Asian markets.
Source: Quantec, 2014
2004 2005 2006 2007 2008 2009 2010 2011 2012
Exports (ZARm) 186,17 185,71 217,35 305,16 240,34 181,49 227,33 270,32 282,34
Imports (ZARm) 208,71 361,35 579,03 707,04 817,19 743,94 765,06 874,07 1021,46
Trade Balance (ZARm) -22,55 -175,64 -361,68 -401,88 -576,85 -562,46 -537,73 -603,75 -739,12
-1000
-800
-600
-400
-200
0
200
400
600
800
1000
1200
Valu
e (
ZA
Rm
)
WESTERN CAPE TRADE IN FURNITURE, 2004-2012
TOP 10 DESTINATION COUNTRIES FOR WESTERN CAPE’S
FURNITURE EXPORTS, 2012
TOP 10 SOURCE COUNTRIES OF WESTERN CAPE’S
FURNITURE IMPORTS, 2012
RANK COUNTRY
VALUE
2012
(ZARm)
%
GROWTH
2011-2012
RANK COUNTRY
VALUE
2012
(ZARm)
%
GROWTH
2011-2012
1 Germany 70.14 6.1 1 China 672.28 23
2 Angola 38.48 35.5 2 Indonesia 45.00 36
3 United Kingdom 33.07 27.9 3 Pakistan 43.49 80
4 Mozambique 22.28 13.4 4 Malaysia 41.84 22
5 Zambia 14.46 7.5 5 Italy 36.62 17
6 Zimbabwe 13.84 10.2 6 Germany 28.53 6
7 United States 12.86 11.0 7 India 27.71 29
8 Mauritius 11.00 114.9 8 Vietnam 22.88 25
9 United Republic of Tanzania 9.02 28.1 9 United States 18.02 19
10 Ghana 8.68 23.2 10 Turkey 13.58 22
TOTAL EXPORTS 282.34 6.6 TOTAL IMPORTS 1021.46 18
15
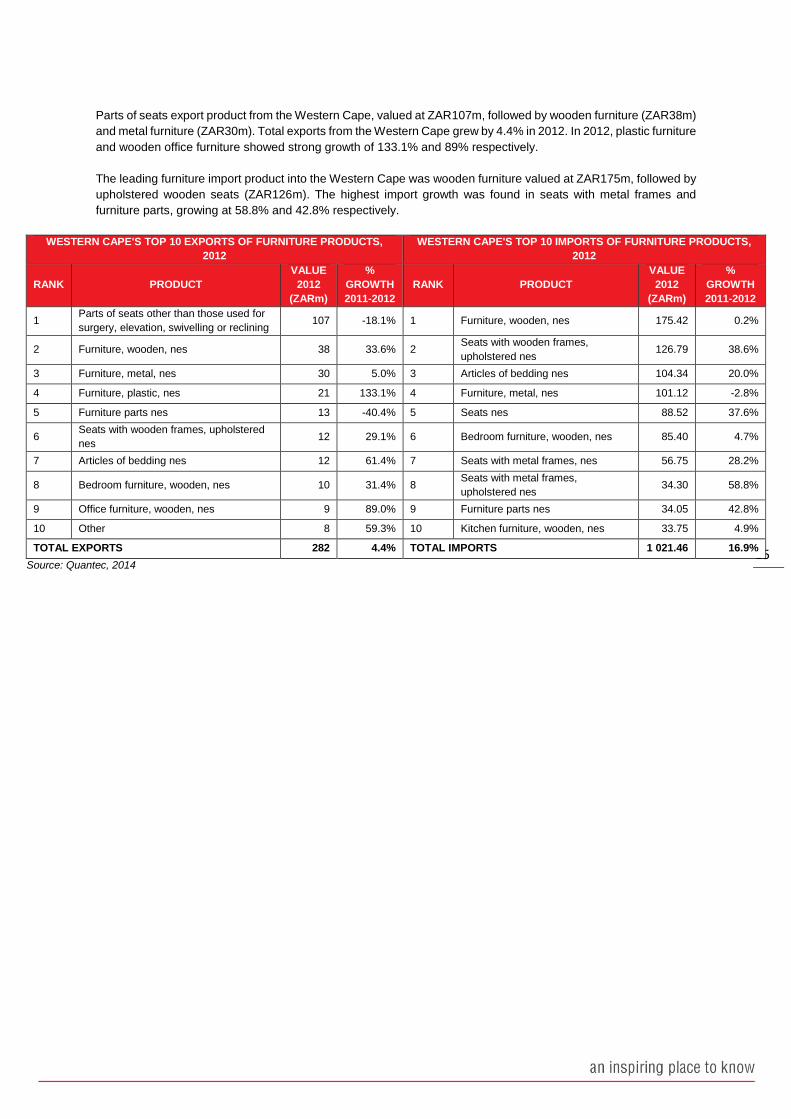
Parts of seats export product from the Western Cape, valued at ZAR107m, followed by wooden furniture (ZAR38m)
and metal furniture (ZAR30m). Total exports from the Western Cape grew by 4.4% in 2012. In 2012, plastic furniture
and wooden office furniture showed strong growth of 133.1% and 89% respectively.
The leading furniture import product into the Western Cape was wooden furniture valued at ZAR175m, followed by
upholstered wooden seats (ZAR126m). The highest import growth was found in seats with metal frames and
furniture parts, growing at 58.8% and 42.8% respectively.
WESTERN CAPE'S TOP 10 EXPORTS OF FURNITURE PRODUCTS,
2012
WESTERN CAPE'S TOP 10 IMPORTS OF FURNITURE PRODUCTS,
2012
RANK PRODUCT
VALUE
2012
(ZARm)
%
GROWTH
2011-2012
RANK PRODUCT
VALUE
2012
(ZARm)
%
GROWTH
2011-2012
1 Parts of seats other than those used for
surgery, elevation, swivelling or reclining 107 -18.1% 1 Furniture, wooden, nes 175.42 0.2%
2 Furniture, wooden, nes 38 33.6% 2 Seats with wooden frames,
upholstered nes 126.79 38.6%
3 Furniture, metal, nes 30 5.0% 3 Articles of bedding nes 104.34 20.0%
4 Furniture, plastic, nes 21 133.1% 4 Furniture, metal, nes 101.12 -2.8%
5 Furniture parts nes 13 -40.4% 5 Seats nes 88.52 37.6%
6 Seats with wooden frames, upholstered
nes 12 29.1% 6 Bedroom furniture, wooden, nes 85.40 4.7%
7 Articles of bedding nes 12 61.4% 7 Seats with metal frames, nes 56.75 28.2%
8 Bedroom furniture, wooden, nes 10 31.4% 8 Seats with metal frames,
upholstered nes 34.30 58.8%
9 Office furniture, wooden, nes 9 89.0% 9 Furniture parts nes 34.05 42.8%
10 Other 8 59.3% 10 Kitchen furniture, wooden, nes 33.75 4.9%
TOTAL EXPORTS 282 4.4% TOTAL IMPORTS 1 021.46 16.9%
Source: Quantec, 2014

16
2.4. Trade Trends in Furniture sub-sectors in the Western Cape
Parts of seats, wooden furniture and metal furniture are the top three furniture sub-sectors that are exported from
the Western Cape. The Western Cape is a net exporter of parts of seats and a net importer of wooden and metal
furniture.
The graph below shows trade trends in the Western Cape for parts of seats. Exports for parts of seats have
fluctuated vastly, with a moving average trend-line experiencing two peaks and two dips in the 8 year period.
Exports of these products have experienced a CAGR of 7% over the past 8 years, growing from around ZAR60m
in 2004 to ZAR106m in 2012. Import values have had a larger CAGR of 22% over the 8 year period, however their
growth has been from a low base of ZAR3.59m in 2004 to around ZAR18m in 2012. There has not been the same
degree of volatility in the imports as there has been in the exports.
Source: Quantec, 2014
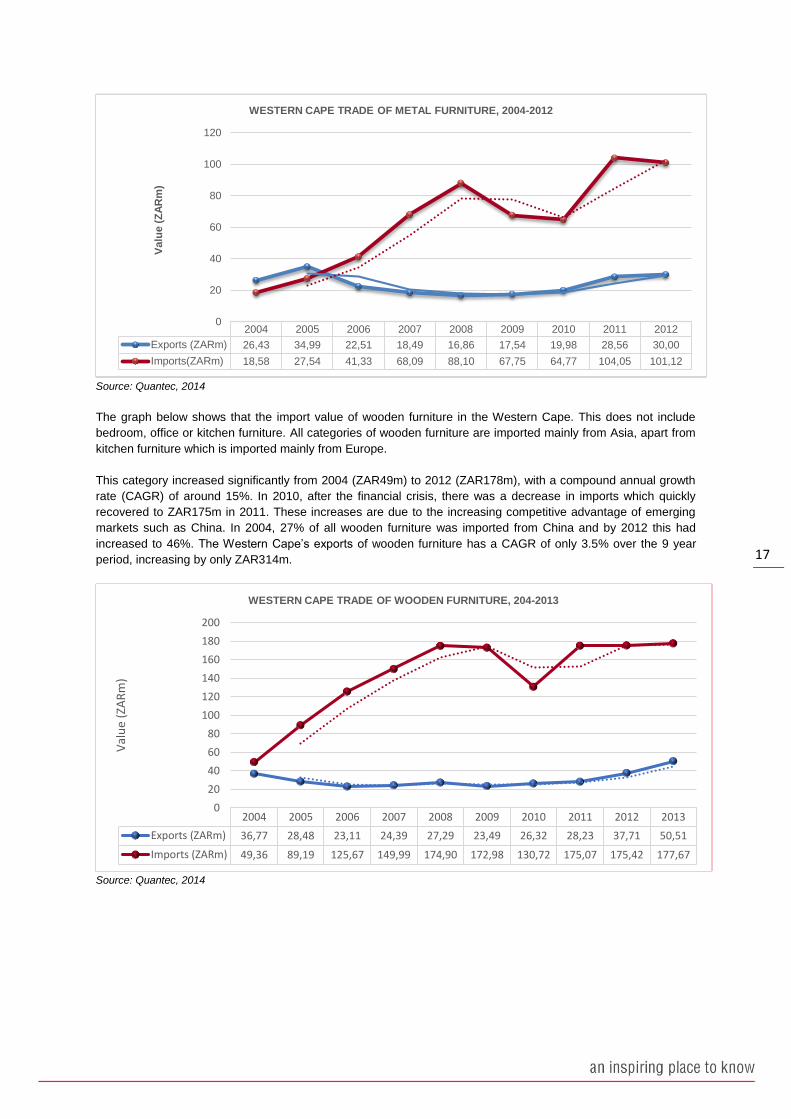
The graph below shows that the import value of metal furniture in the Western Cape increased significantly from
2004 (ZAR19m) to 2012 (ZAR101m), with a compound annual growth rate (CAGR) of around 24%. In 2008, around
the financial crisis, there was a decrease in imports until 2010, with a large increase in 2011 of around ZAR40m to
maintain the clear upward trend seen in the moving average trendline. These increases are due to the increasing
competitive advantage of emerging markets such as China. In 2004, 61% of all metal furniture was imported from
China and by 2012 this had increased to 72%.
The Western Cape’s exports of metal furniture has a CAGR of only 1.6% over the 8 year period, increasing by only
ZAR3.5m. In 2004 and 2005 the Western Cape was a net exporter of metal furniture, however, into 2005 there was
a stark divergence where exports decreased and imports increased by around ZAR10m each. Thereafter exports
have not recovered.
2004 2005 2006 2007 2008 2009 2010 2011 2012
Exports (ZARm) 59,63 59,21 126,05 200,68 115,44 65,70 103,98 130,52 106,88
Imports(ZARm) 3,56 12,80 21,76 30,90 31,44 24,38 26,53 13,29 17,86
0
50
100
150
200
250
Valu
e (
ZA
Rm
)
WESTERN CAPE TRADE OF PARTS OF SEATS, 2004-2012
17
Source: Quantec, 2014
The graph below shows that the import value of wooden furniture in the Western Cape. This does not include
bedroom, office or kitchen furniture. All categories of wooden furniture are imported mainly from Asia, apart from
kitchen furniture which is imported mainly from Europe.
This category increased significantly from 2004 (ZAR49m) to 2012 (ZAR178m), with a compound annual growth
rate (CAGR) of around 15%. In 2010, after the financial crisis, there was a decrease in imports which quickly
recovered to ZAR175m in 2011. These increases are due to the increasing competitive advantage of emerging
markets such as China. In 2004, 27% of all wooden furniture was imported from China and by 2012 this had
increased to 46%. The Western Cape’s exports of wooden furniture has a CAGR of only 3.5% over the 9 year
period, increasing by only ZAR314m.
Source: Quantec, 2014
2004 2005 2006 2007 2008 2009 2010 2011 2012
Exports (ZARm) 26,43 34,99 22,51 18,49 16,86 17,54 19,98 28,56 30,00
Imports(ZARm) 18,58 27,54 41,33 68,09 88,10 67,75 64,77 104,05 101,12
0
20
40
60
80
100
120
Valu
e (
ZA
Rm
)
WESTERN CAPE TRADE OF METAL FURNITURE, 2004-2012
2004 2005 2006 2007 2008 2009 2010 2011 2012 2013
Exports (ZARm) 36,77 28,48 23,11 24,39 27,29 23,49 26,32 28,23 37,71 50,51
Imports (ZARm) 49,36 89,19 125,67 149,99 174,90 172,98 130,72 175,07 175,42 177,67
0
20
40
60
80
100
120
140
160
180
200
Val
ue
(ZA
Rm
)
WESTERN CAPE TRADE OF WOODEN FURNITURE, 204-2013

18
3. FDI
3.1 Global FDI into the Furniture Sector
The classification of furniture products can be found in the consumer products industry (72% of global projects),
the wood products industry (15% of projects) and the textile industry (13%). Between January 2003 and December
2013, a total of 1,537 FDI projects were recorded into the furniture sector, equating to a 0.9% share of global FDI.
These projects represent a total capital investment of ZAR365.94bn which is an average investment of
ZAR238.06m per project. During the period, a total of 308,839 jobs were created.
Source: FDI Intelligence, 2014
The United States was the leading source market in terms of investment projects in the global furniture industry
with 373 investment projects, accounting for 24% of projects and 18% of capex. Sweden and Germany ranked
second and third with 173 projects (11%) and 112 projects (7%). South Africa was the 21st source market for
furniture FDI, with 12 projects in the period and ZAR1.89bn. South Africa is a net investor in the furniture sector.
SOURCE MARKETS FOR FDI IN THE FURNITURE SECTOR, JAN 2003-DEC 2013
RANK SOURCE MARKETS PROJECTS %
PROJECTS
CAPEX
(ZARm) % CAPEX JOBS
1 United States 373 24% 67172.7 18.3 66 962
2 Sweden 173 11% 80097.5 21.8 51 014
3 Germany 112 7% 20381.7 5.5 15 242
4 Italy 99 6% 22276.3 6.1 18 406
5 Spain 97 6% 29007.3 7.9 20 493
6 Austria 72 5% 16249.5 4.4 11 531
7 Denmark 71 5% 24143.6 6.6 17 355
8 France 68 4% 19928.7 5.4 11 184
9 United Kingdom 44 3% 5887.1 1.6 5 713
10 China 40 3% 4036.3 1.1 3 823
21 South Africa 12 1% 1896.2 - 1 483
TOTAL 1545 100% 367420.9 100% 310197
Source: FDI Intelligence, 2014
The United States was also the leading destination market in terms of investment projects, for furniture with 282
investment projects, accounting for 18%. China and Germany rank second and third with 122 (8%) projects and
2003 2004 2005 2006 2007 2008 2009 2010 2011 2012 2013
CAPEX (ZARbn) 15,7 19,6 21,0 26,3 41,9 45,9 44,7 32,4 32,1 44,2 42,0
Projects 74 83 94 119 158 160 169 165 153 175 187
0
5
10
15
20
25
30
35
40
45
50
20
40
60
80
100
120
140
160
180
200
Valu
e (
ZA
Rb
n)
Pro
jects
GLOBAL FDI INTO FURNITURE, JAN 2003-DEC 2013

19
94 (6%) projects respectively. South Africa ranks 49th in terms of FDI projects with 5 projects in the period, with a
capex value of ZAR649.7m.
DESTINATION MARKETS FOR FDI IN THE FURNITURE SECTOR, DEC 2003-DEC 2013
RANK DESTINATION MARKETS PROJECTS % PROJECTS CAPEX
(ZARm) % CAPEX JOBS
1 United States 282 18% 51 943.3 14.1 43 270
2 China 122 8% 35 225.9 9.6 33 262
3 Germany 94 6% 22 495.3 6.1 10 293
4 United Kingdom 82 5% 8 441.3 2.3 7 778
5 India 62 4% 23 774.9 6.5 26 249
6 France 58 4% 23 225.2 6.3 11 277
7 Poland 56 4% 17 827.5 4.9 13 449
8 Spain 45 3% 14 816.1 4.0 9 948
9 Russia 44 3% 14 919.5 4.1 30 549
10 UAE 41 3% 5 835.0 1.6 6 096
49 South Africa 5 0% 649.7 - 4 582
TOTAL 1545 100% 367420.87 100% 310197
Source: FDI Intelligence, 2014
IKEA was the leading global company investing in the furniture sector with 104 projects, followed by Jysk and Zara
Home with 47 projects and 34 projects respectively. The largest investment made by IKEA was valued at
ZAR6.07bn. This investment was to set up 25 retail stores through a wholly owned subsidiary across India. The
second stage retail investment, which is still to come is estimated to be around ZAR9bn.
TOP 10 INVESTING COMPANIES IN THE FURNITURE SECTOR, JAN 2003-DEC 2013
RANK INVESTING COMPANY NUMBER OF
PROJECTS CAPEX (ZARm)
1 IKEA 104 63 617.4
2 Jysk 47 14 788.9
3 Zara Home 34 13 668.8
4 Swedwood 22 8 647.2
5 Ethan Allen Interiors 19 4 714.1
6 Kinnarps 15 770.4
7 Kika/Leiner Group 15 2 666.6
8 Euromarket Designs (Crate & Barrel) 14 3 584.2
9 Conforama 14 7 603.1
10 Porcelanosa 14 3 579.2
TOTAL 1 545 367 420.9
Source: FDI Intelligence, 2014
20
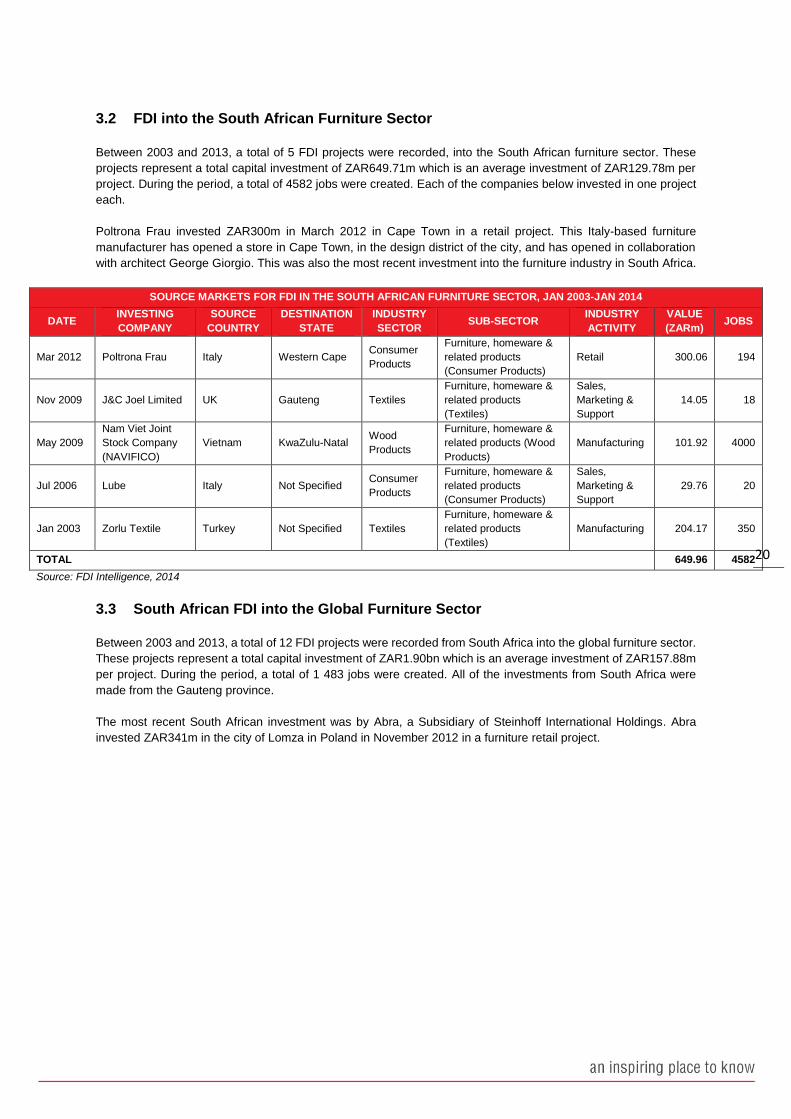
3.2 FDI into the South African Furniture Sector
Between 2003 and 2013, a total of 5 FDI projects were recorded, into the South African furniture sector. These
projects represent a total capital investment of ZAR649.71m which is an average investment of ZAR129.78m per
project. During the period, a total of 4582 jobs were created. Each of the companies below invested in one project
each.
Poltrona Frau invested ZAR300m in March 2012 in Cape Town in a retail project. This Italy-based furniture
manufacturer has opened a store in Cape Town, in the design district of the city, and has opened in collaboration
with architect George Giorgio. This was also the most recent investment into the furniture industry in South Africa.
SOURCE MARKETS FOR FDI IN THE SOUTH AFRICAN FURNITURE SECTOR, JAN 2003-JAN 2014
DATE INVESTING
COMPANY
SOURCE
COUNTRY
DESTINATION
STATE
INDUSTRY
SECTOR SUB-SECTOR
INDUSTRY
ACTIVITY
VALUE
(ZARm) JOBS
Mar 2012 Poltrona Frau Italy Western Cape Consumer
Products
Furniture, homeware &
related products
(Consumer Products)
Retail 300.06 194
Nov 2009 J&C Joel Limited UK Gauteng Textiles
Furniture, homeware &
related products
(Textiles)
Sales,
Marketing &
Support
14.05 18
May 2009
Nam Viet Joint
Stock Company
(NAVIFICO)
Vietnam KwaZulu-Natal Wood
Products
Furniture, homeware &
related products (Wood
Products)
Manufacturing 101.92 4000
Jul 2006 Lube Italy Not Specified Consumer
Products
Furniture, homeware &
related products
(Consumer Products)
Sales,
Marketing &
Support
29.76 20
Jan 2003 Zorlu Textile Turkey Not Specified Textiles
Furniture, homeware &
related products
(Textiles)
Manufacturing 204.17 350
TOTAL 649.96 4582
Source: FDI Intelligence, 2014
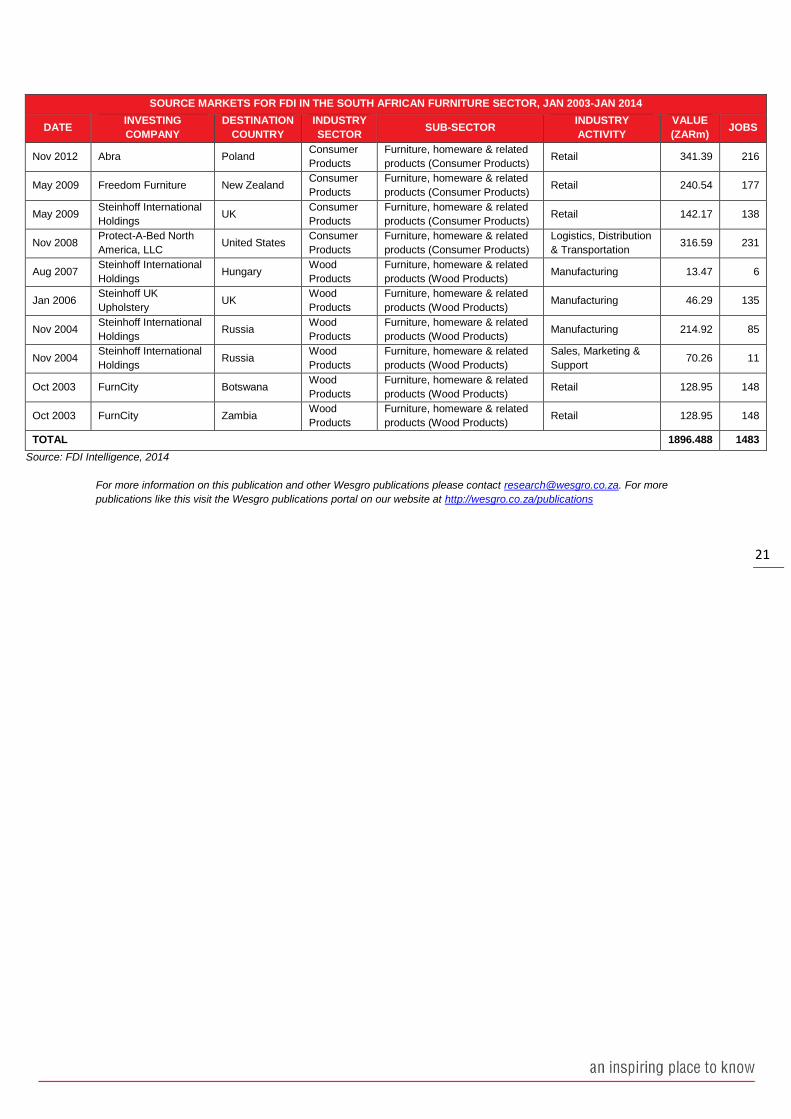
3.3 South African FDI into the Global Furniture Sector
Between 2003 and 2013, a total of 12 FDI projects were recorded from South Africa into the global furniture sector.
These projects represent a total capital investment of ZAR1.90bn which is an average investment of ZAR157.88m
per project. During the period, a total of 1 483 jobs were created. All of the investments from South Africa were
made from the Gauteng province.
The most recent South African investment was by Abra, a Subsidiary of Steinhoff International Holdings. Abra
invested ZAR341m in the city of Lomza in Poland in November 2012 in a furniture retail project.
21
SOURCE MARKETS FOR FDI IN THE SOUTH AFRICAN FURNITURE SECTOR, JAN 2003-JAN 2014
DATE INVESTING
COMPANY
DESTINATION
COUNTRY
INDUSTRY
SECTOR SUB-SECTOR
INDUSTRY
ACTIVITY
VALUE
(ZARm) JOBS
Nov 2012 Abra Poland Consumer
Products
Furniture, homeware & related
products (Consumer Products) Retail 341.39 216
May 2009 Freedom Furniture New Zealand Consumer
Products
Furniture, homeware & related
products (Consumer Products) Retail 240.54 177
May 2009 Steinhoff International
Holdings UK
Consumer
Products
Furniture, homeware & related
products (Consumer Products) Retail 142.17 138
Nov 2008 Protect-A-Bed North
America, LLC United States
Consumer
Products
Furniture, homeware & related
products (Consumer Products)
Logistics, Distribution
& Transportation 316.59 231
Aug 2007 Steinhoff International
Holdings Hungary
Wood
Products
Furniture, homeware & related
products (Wood Products) Manufacturing 13.47 6
Jan 2006 Steinhoff UK
Upholstery UK
Wood
Products
Furniture, homeware & related
products (Wood Products) Manufacturing 46.29 135
Nov 2004 Steinhoff International
Holdings Russia
Wood
Products
Furniture, homeware & related
products (Wood Products) Manufacturing 214.92 85
Nov 2004 Steinhoff International
Holdings Russia
Wood
Products
Furniture, homeware & related
products (Wood Products)
Sales, Marketing &
Support 70.26 11
Oct 2003 FurnCity Botswana Wood
Products
Furniture, homeware & related
products (Wood Products) Retail 128.95 148
Oct 2003 FurnCity Zambia Wood
Products
Furniture, homeware & related
products (Wood Products) Retail 128.95 148
TOTAL 1896.488 1483
Source: FDI Intelligence, 2014
For more information on this publication and other Wesgro publications please contact [email protected]. For more
publications like this visit the Wesgro publications portal on our website at http://wesgro.co.za/publications