2014 YEAR END REPORT YEAR‐END REPORT Page 1 of 58 Republic of the Philippines Development Budget...
58
2014 YEAR‐END REPORT Page 1 of 58 Republic of the Philippines Development Budget Coordination Committee Malacañang, Manila Year‐End Report on the 2014 National Budget October 31, 2015 Introduction Over the past five years, the Philippine economy has been treading a path of inclusive development. Despite its slower and below‐target growth performance in 2014, the countryʹs economy still remains among the fastest‐growing in the region. The average economic growth of more than 6 percent for the period 2010 through 2014 has been the highest in any given five‐year period over the past 30 years. Nevertheless, FY 2014 is faced with critical challenges to the governmentʹs goals of improving the quality of social well‐being of the Filipino people. Foremost of these challenges is the slower‐than‐expected pace of government spending due mostly to institutional issues ‐ from poor planning to sluggish procurement ‐ that hampers the efficient delivery of government services. In response to this, the Aquino administration issued Administrative Order No. 46 to direct agencies to address these institutional weaknesses and facilitate the execution of programs and projects. Last yearʹs accomplishments were rather mixed: employment has improved, yet growth has slowed down, and number of poor people has increased. Still, there are clear signs that the country is treading on the right path, as supported by solid institutionalization of financial reforms. In particular, bold public financial management (PFM) reforms initiated since 2010 and bankrolled by the FY 2014 General Appropriations Act (GAA) enabled the government to spend within its means, on the right priorities, with measurable results, and through an empowering regime of transparency, accountability, and citizenʹs engagement. The governmentʹs efforts for good governance as reflected in these PFM reforms ‐ such as the Budget Priorities Framework (BPF), the GAA‐as‐release‐ document (GAARD), and Performance‐Informed Budgeting (PIB) ‐ may not have attained full fruition, but is now beginning to show results. In 2014, about a million jobs were generated 1 ; about 15 million children enrolled in kinder and elementary 2 ; 87 out of 100 Filipinos were covered by health insurance; more than 400,000 1 Socioeconomic Report (SER) 2014, NEDA 2 Basic Education Information System Statistics, DepEd
Transcript of 2014 YEAR END REPORT YEAR‐END REPORT Page 1 of 58 Republic of the Philippines Development Budget...
2014 YEAR‐END REPORT
Page 1 of 58
Republic of the Philippines
Development Budget Coordination Committee Malacañang, Manila
Year‐End Report on the 2014 National Budget
October 31, 2015
Introduction
Over the past five years, the Philippine economy has been treading a path of
inclusive development. Despite its slower and below‐target growth performance in
2014, the countryʹs economy still remains among the fastest‐growing in the region.
The average economic growth of more than 6 percent for the period 2010 through
2014 has been the highest in any given five‐year period over the past 30 years.
Nevertheless, FY 2014 is faced with critical challenges to the governmentʹs
goals of improving the quality of social well‐being of the Filipino people. Foremost
of these challenges is the slower‐than‐expected pace of government spending due
mostly to institutional issues ‐ from poor planning to sluggish procurement ‐ that
hampers the efficient delivery of government services. In response to this, the
Aquino administration issued Administrative Order No. 46 to direct agencies to
address these institutional weaknesses and facilitate the execution of programs and
projects.
Last yearʹs accomplishments were rather mixed: employment has improved,
yet growth has slowed down, and number of poor people has increased. Still, there
are clear signs that the country is treading on the right path, as supported by solid
institutionalization of financial reforms. In particular, bold public financial
management (PFM) reforms initiated since 2010 and bankrolled by the FY 2014
General Appropriations Act (GAA) enabled the government to spend within its means,
on the right priorities, with measurable results, and through an empowering regime of
transparency, accountability, and citizenʹs engagement.
The governmentʹs efforts for good governance as reflected in these PFM
reforms ‐ such as the Budget Priorities Framework (BPF), the GAA‐as‐release‐
document (GAARD), and Performance‐Informed Budgeting (PIB) ‐ may not have
attained full fruition, but is now beginning to show results. In 2014, about a million
jobs were generated1; about 15 million children enrolled in kinder and elementary2;
87 out of 100 Filipinos were covered by health insurance; more than 400,000
1 Socioeconomic Report (SER) 2014, NEDA 2 Basic Education Information System Statistics, DepEd
2014 YEAR‐END REPORT
Page 2 of 58
indigent senior citizens received their monthly pension3; more than half a million
hectares of agrarian lands have already been distributed since 20104; and more than
half a million people have socialized housing5. These are clear indication of creating
direct and meaningful benefits for the Filipino people.
Coming from a strong economic performance in 2013, the FY 2014 National
Budget ‐ A Budget for Inclusive Development ‐ was crafted to intensify its
investments on the people, especially in capacitating the poor through provision of
education, healthcare, social protection, and other basic services. This report
discusses how the implementation of this Budget enabled the government in
pursuing its inclusive development agenda.
Prepared by the Development Budget Coordination Committee (DBCC), this
Year‐End Report for 2014 tackles the following:
Overview of the principles and policy reforms embedded in the 2014
Budget;
Examination of the yearʹs overall performance relative to the
macroeconomic, revenue, expenditure, financing, and debt targets;
Discussion of national government’s expenditure performance by sector,
expense class, department, and program;
Reporting of physical performance of key departments and major
programs and projects based on the set performance indicators; and
Summary of proposed legislative measures on fiscal reforms being
supported.
3 Physical Report of Operations, DSWD 4 Accomplishment Report (as published in the Transparency Seal), DAR 5 SER 2014, NEDA

2014 YEAR‐END REPORT
Page 3 of 58
I.
The 2014 National Government Budget
The 2014 Budget was designed to give the poor a fair shot at the opportunities that
the countryʹs newfound prosperity has been providing. As the President said in his
Budget Message, ʺAng hangarin natin: ang mga mamamayan mismo ang lumilikha at
nagmamay‐ari ng bagong kasaganaan ang ating bansa. Ang obligasyon natin bilang
pamahalaan ay ilagay ang ating mga kabababayan sa patas na tungtungan (Our desire is to
enable the citizens themselves to create and take ownership of new prosperity in the
country. Our obligation as government is to put our people on an equal footing).ʺ
Anchoring the 2014 Budget on Inclusive Development is naturally the logical
step in the Administrationʹs journey towards reforming the Budget: from a Budget
exploited by a culture of patronage, inefficiencies, and corruption to a Peopleʹs
Budget that fosters a regime of citizen empowerment.
This Budget was built on the reforms pursued and the accomplishments
achieved by the Aquino administration through its preceding Budgets. The 2011
Budget saw how the government weeded out wasteful spending, opened up
transparency mechanisms, and partnered with civil societies. The 2012 Budget,
meanwhile, significantly reshaped budgetary priorities around the key result areas
of the Aquino Social Contract with the Filipino People. The people have been given a
greater voice and stake in the allocation of resources in the 2013 Budget after the
government introduced the Bottom‐Up Budgeting (BUB) program and other means
for citizen’s participation.
Meanwhile, the 2014 Budget sought to further empower citizens by creating
equal opportunities for them—through the delivery of ample social safety nets and
social services, as well as investments in economic expansion and job creation—
through good governance. The following principles and key reforms shaped the
2014 Budget:
Moving Toward Performance‐Informed Budgeting
Inclusive Development is not merely rhetoric. The government sought to
bring down barriers to opportunities by ensuring each peso leads to direct
and meaningful benefits for the people. The 2014 Budget has been able to
quantify these benefits by linking budget to performance, which is further
linked to the desired outcomes of the Philippine Development Plan (PDP).
For the first time, the National Budget presented performance targets
of each agency at the output level alongside financial allocations. This shift to
Performance‐Informed Budgeting (PIB) has enabled the government to allocate
more resources to programs that fulfill the Administrationʹs prosperity for all

2014 YEAR‐END REPORT
Page 4 of 58
agenda. The PIB also sought to strengthen Congressʹ oversight function to
hold agencies accountable for the results they commit to deliver in exchange
of taxpayersʹ money. Ultimately, the PIB should empower citizens to monitor
how their government spend their money and evaluate whether these
expenditures are truly attuned to their needs.
Tighter Budget Prioritization for Inclusive Development
The government has greatly reshaped its priorities, focusing the Budget to the
five Key Result Areas of the Aquino Social Contract with the Filipino People:
1. Transparent, Accountable, and Participatory Governance
2. Poverty Reduction and Empowerment of the Poor and Vulnerable
3. Rapid, Inclusive, and Sustained Economic Growth
4. Just and Lasting Peace and the Rule of Law
5. Integrity of the Environment and Climate Change Adaptation and
Mitigation
The 2014 Budget not only linked the budget to performance through
PIB, but more importantly, ensured that the countryʹs medium‐term
development plan is well funded. This Budget was guided by the Budget
Priorities Framework, where resources were directed towards funding
programs that are important to achieving inclusive development. Agencies
were also directed to propose programs, activities, and projects based on key
programs indentified in this document as well as tailor fit their programs
based on the local needs of the identified poorest and most vulnerable
provinces. Through this framework, the priorities that should be funded in
the remaining years of the current Administration were identified, thus
ensuring that the allocation of scarce resources efficiently prioritizes programs
that matter the most to the people.
Better Collaboration as the New Standard in Government
To keep every agency on the same page, the government introduced the
Program Budgeting Approach, where departments and agencies are encouraged
to collaborate and talk first before submitting their individual budget
proposals. This approach aims to ensure programs of every agency
complement each other and support the governmentʹs development plan as
well as its budget priorities. In the end, this approach seeks to deepen the
focus of the budget on priority programs, and strengthen inter‐agency
collaboration and synergize their efforts in achieving the goals stated in the
BPF.

2014 YEAR‐END REPORT
Page 5 of 58
Enabling the Private Sector as Engine of Economic Growth
The Administration has always held the belief that government should
facilitate economic growth by helping the private sector to create more jobs
and wealth for the nation. To this end, the government has been instituting
better enabling policies, cutting too many steps in doing business, providing a
stable macroeconomic and political environment, and most importantly,
investing in the capacities of the Filipino people.
These investments, however, should not come at a hefty price. This
Budget ensured that the government only spent within its means, as it was
designed to sustain medium‐term fiscal plan toward keeping a fiscal deficit
limit at 2.0 percent of GDP and toward reducing outstanding debt to 46.8
percent of GDP. This Budget has also allocated more resources to fund the
infrastructure needs of the countryʹs growing economy and increasing
population, so that the target 5 percent of GDP infrastructure spending is met
by 2016.
Transparency at the Core of Effective Public Financial Management
This Budget asserts that transparency not only ensures the public is informed
about how their taxes are allocated and spent, but also enables the
government to more effectively manage scarce resources with efficiency,
predictability, and effectiveness. For one, the 2014 National Budget was the
first Budget crafted using the Unified Account Code Structure, which is
important to ensuring that all financial processes follow a single classification.
Managing governmentʹs cash has also become better following the maiden
implementation of the Treasury Single Account, which provides a unified
structure of bank accounts, consolidates in the process its cash resources, and
in the end, helps the government determine how much money it has in real
time.
Empowering the Citizenry through the Budget
For the Administration believes in the simple notion that the countryʹs future
rests on what the people need, the 2014 Budget allowed more citizens to
decide on budget allocations alongside the government. For one, more civil
society organizations (CSOs) and national government agencies entered into
Budget Partnership Agreements. This mechanism provides CSOs a space to
review agencyʹs budgets and programs as well as suggest budget proposals.
Moreover, the Bottom‐Up Budgeting (BUB), which was introduced in
2012, was expanded for the crafting of the 2014 Budget to include 1,226 cities
and municipalities. Through the BUB process, peopleʹs organizations and

2014 YEAR‐END REPORT
Page 6 of 58
local CSOs work with their local government units to craft a poverty
reduction plan that details programs and projects to be funded by the
National Budget. The BUB process was also expanded from budget
preparation to budget execution and accountability, where local community
organizations were tapped to participate in and monitor the progress of
implementing local poverty reduction projects.
2014 YEAR‐END REPORT
Page 7 of 58
II.
Macroeconomic and Fiscal Performance
A. Macroeconomic Environment
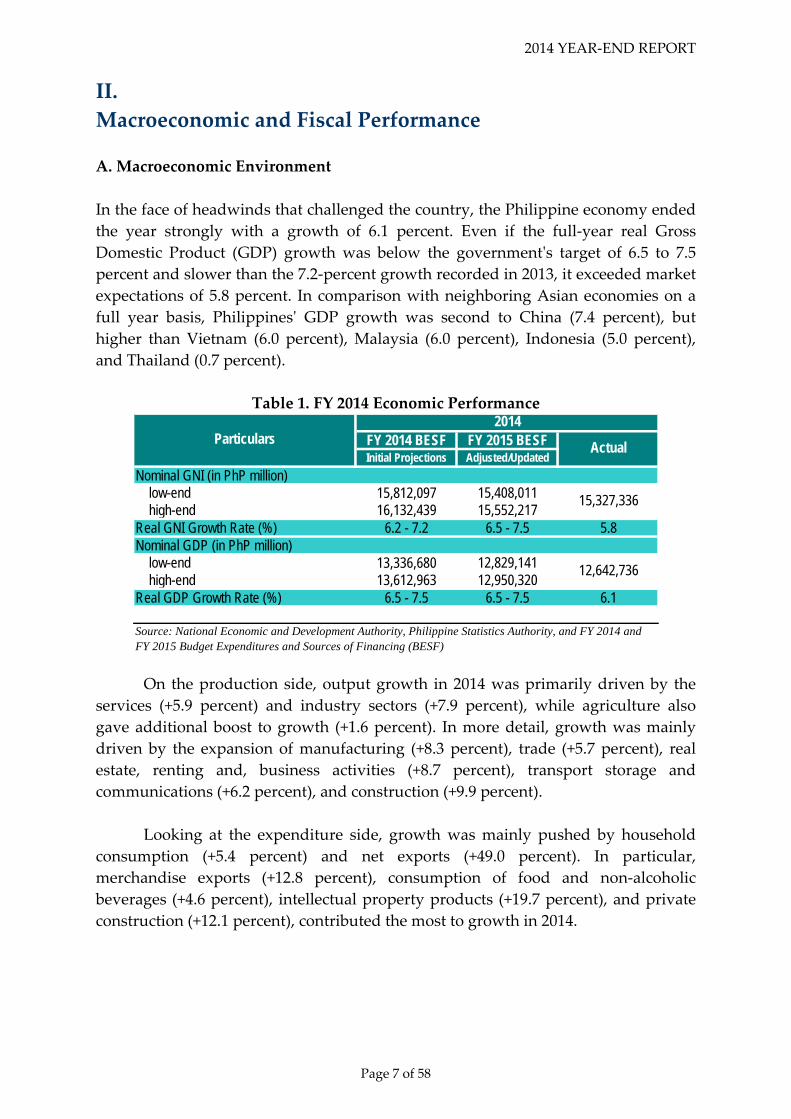
In the face of headwinds that challenged the country, the Philippine economy ended
the year strongly with a growth of 6.1 percent. Even if the full‐year real Gross
Domestic Product (GDP) growth was below the governmentʹs target of 6.5 to 7.5
percent and slower than the 7.2‐percent growth recorded in 2013, it exceeded market
expectations of 5.8 percent. In comparison with neighboring Asian economies on a
full year basis, Philippinesʹ GDP growth was second to China (7.4 percent), but
higher than Vietnam (6.0 percent), Malaysia (6.0 percent), Indonesia (5.0 percent),
and Thailand (0.7 percent).
Table 1. FY 2014 Economic Performance
FY 2014 BESF FY 2015 BESFInitial Projections Adjusted/Updated
Nominal GNI (in PhP million) low-end 15,812,097 15,408,011 high-end 16,132,439 15,552,217Real GNI Growth Rate (%) 6.2 - 7.2 6.5 - 7.5 5.8Nominal GDP (in PhP million) low-end 13,336,680 12,829,141 high-end 13,612,963 12,950,320Real GDP Growth Rate (%) 6.5 - 7.5 6.5 - 7.5 6.1
12,642,736
Source: National Economic and Development Authority, Philippine Statistics Authority, and FY 2014 and FY 2015 Budget Expenditures and Sources of Financing (BESF)
Particulars2014
Actual
15,327,336
On the production side, output growth in 2014 was primarily driven by the
services (+5.9 percent) and industry sectors (+7.9 percent), while agriculture also
gave additional boost to growth (+1.6 percent). In more detail, growth was mainly
driven by the expansion of manufacturing (+8.3 percent), trade (+5.7 percent), real
estate, renting and, business activities (+8.7 percent), transport storage and
communications (+6.2 percent), and construction (+9.9 percent).
Looking at the expenditure side, growth was mainly pushed by household
consumption (+5.4 percent) and net exports (+49.0 percent). In particular,
merchandise exports (+12.8 percent), consumption of food and non‐alcoholic
beverages (+4.6 percent), intellectual property products (+19.7 percent), and private
construction (+12.1 percent), contributed the most to growth in 2014.

2014 YEAR‐END REPORT
Page 8 of 58
Table 2. Growth of GDP, by components
2012-13 2013-14Supply Side
Agriculture 1.1 1.6Industry 9.2 7.9
o.w. Manufacturing 10.3 8.3Services 7.0 5.9
Demand SidePrivate Consumption 5.6 5.4Government Consumption 5.0 1.7Capital Formation 27.7 5.4
o.w. Fixed Capital 12.2 6.8Exports -1.0 11.3Imports 4.4 8.7
GROSS DOMESTIC PRODUCT 7.1 6.1
Source: Philippine Statistics Authority
Growth Rate (%)Particulars
The deceleration in GDP growth (6.1 percent from 7.2 percent in 2013)
stemmed from the contraction in changes in inventories (‐37.1 percent) which arose
from a combination of lower‐than‐expected demand and a substantial build‐up of
inventory in 2013; and the slowdown in purchases of durable equipment (3.7
percent, from 15.5 percent in 2013), mainly because of the completion of the re‐
fleeting program of major airlines. In addition, part of this slowdown was due to the
below‐program spending of the government (1.7 percent, from 5.0 percent in 2013
for government final consumption expenditure; and 6.3 percent, from 18.0 percent in
2013 for public construction) due to lags in adjusting to new spending protocols,
legal uncertainties arising from the Supreme Court ruling on the Disbursement
Acceleration Program, and institutional weaknesses—such as poor planning and
procurement bottlenecks—that hampered the efficient and effective delivery of
programs and projects.
The performance of domestic private demand is partly supported by the
increase in net primary income. Net primary income (NPI), adjusted for inflation,
grew by 4.1 percent in 2014, supported by the strong inflow of compensation and
property income. This growth of NPI resulted in a 5.8 percent expansion in Gross
National Income (GNI).
The countryʹs macroeconomic fundamentals performed broadly in line with
the revised macroeconomic assumptions for 2014, as reflected in the FY 2015 Budget
of Expenditures and Sources of Financing (BESF). Average headline inflation in 2014
was 4.1 percent, well‐within the government assumption of 3.0 to 5.0 percent. This
was the sixth consecutive year that inflation fell within the government target band.
Still, inflation in 2014 was slightly higher than the 3.0 percent average inflation

2014 YEAR‐END REPORT
Page 9 of 58
recorded in 2013, due mainly to higher food inflation induced by temporary
disruptions in domestic supply of key commodities.
Table 3. FY 2014 Performance vs. Macroeconomic Assumptions
FY 2014 BESF FY 2015 BESFInitial Projections Adjusted/Updated
Inflation 3.0 – 5.0 3.0 – 5.0 4.1364-day T-bill rate a/ 2.0 – 4.0 1.5 – 4.0 1.8Exchange rate (PhP/USD, period average) 41.00 – 43.00 42.00 – 45.00 44.40LIBOR (6 months) 0.5 – 1.5 0.3 – 1.5 0.3Dubai crude oil price (US$/barrel) 90.00 – 110.00 100.00 – 110.00 96.61Merchandise exports growth b/ 14.0 6.0 7.3Merchandise imports growth b/ 14.0 9.0 2.3
Notes:
Source: Bangko Sentral ng Pilipinas, National Economic and Development Authority
2014
Actual
a/ Based on primary market ratesb/ Based on the Balance of Payments Manual, 6th Edition (BPM6) concept
Particulars
To pre‐empt the risk of second round effects from elevated prices in 2014, the
Bangko Sentral ng Pilipinas (BSP) implemented adjustments to its key policy
instruments to rein‐in inflation expectations and contain strong liquidity growth
resulting from strong domestic growth prospects. For one, the BSP raised the reverse
repurchase (RRP) and the Special Deposit Account (SDA) rates by a cumulative 50
basis points to 4.0 percent and 2.5 percent, respectively. The BSP also increased the
reserve requirement ratio by a cumulative two percentage points to 20.0 percent.6
Consequently, domestic interest rates also rose. The average 364‐day T‐bill rate in
the primary market increased to 1.8 percent in 2014, from 0.7 percent average in
2013. Nonetheless, the 2014 average 364‐day T‐bill rate registered within the 1.5‐ to
4.0‐percent revised DBCC assumption in the FY 2015 BESF but fell short of the initial
assumption of 2.0 to 4.0 percent in the FY 2014 BESF.
The peso‐dollar exchange rate depreciated in 2014 as the rate averaged
P44.40/US$1, weaker than the 2013 average of P42.45/US$1. This was also weaker
than assumed in the FY 2014 BESF but within the revised assumption of P42.00 –
P45.00/US$1 in the FY 2015 BESF. The peso depreciation in 2014 was influenced
mainly by the gradual tapering of the quantitative easing (QE) program in the
United States (US) that triggered portfolio rebalancing by investors towards US‐
denominated assets. While the US Federal Reserve ended its QE program in October
2014, monetary authorities in other advanced economies, particularly in the Euro
area and Japan, remained accommodative in their monetary policy stance. As a
result, the 180‐day London Interbank Offered Rate (LIBOR) stayed relatively low in
2014. London Inter‐Bank Offered Rates (LIBOR) averaged 0.3 percent during the
year, hitting the low‐end of the revised DBCC assumption of 0.3 – 1.5 percent in the
6 The 20.0 percent reserve requirement ratio applies to peso deposit liabilities and deposit substitutes of universal/commercial banks and deposit subsitutes of non‐banks with quasi‐banking functions.
2014 YEAR‐END REPORT
Page 10 of 58
FY 2015 BESF. This was, however, lower than the initial assumption of 0.5 – 1.5
percent in the FY 2014 BESF.
Dubai crude oil prices declined considerably to US$96.61 per barrel in 2014
from US$105.52 per barrel in 2013. This was within the FY 2014 BESF crude oil
assumption of US$90.00 to 110.00 per barrel but fell outside the adjusted assumption
of US$100.00 to 110.00 per barrel in the FY 2015 BESF. The significant drop in oil
prices was attributed to a combination of abundant supply, weak demand, and a
strong dollar. Moreover, the strategic decision of the Organization of the Petroleum
Exporting Countries (OPEC) to protect its market share was an important
determining factor in oil price trends.
The stronger‐than‐expected performance in advanced economies, such as the
US, European Union (EU), and Japan, supported the demand for the country’s
export products and led to the higher‐than‐expected improvement in the country’s
exports in 2014. Merchandise exports in 2014 grew by 7.3 percent, slightly higher
than the revised government assumption for exports growth of 6.0 percent in the FY
2015 BESF. The firmer expansion was due mainly to increased demand for
manufactures exports (i.e., electronics, machinery and transport equipment,
garments, etc.), which accounted for about 80 percent of the country’s total exports.
The double‐digit growth in agro‐based (i.e., coconut, fruits and vegetables, other
agro‐based products) and mineral products also supported the growth in exports.
Meanwhile, merchandise imports posted a modest increase of 2.3 percent, lower
than the revised government assumption for imports growth of 9.0 percent in the FY
2015 BESF. This was due mainly to the reduced imports of capital goods (i.e., land
transportation equipment, power generating and specialized machines, and aircraft,
ships and boats).
Overall, amidst the lower‐than‐expected GDP growth in 2014, the countryʹs
strong macroeconomic fundamentals—within‐target inflation, stable and
competitive peso, robust financial system, and favorable fiscal and external
balances—coupled with bright investment prospects, improved governance and key
policy reforms, continue to stir a sound macroeconomic environment that enables a
strong GDP growth path over the medium‐term. This is also where public spending
becomes crucial, since we need not only attain rapid economic growth, but to
achieve inclusive growth. One of the strategies to address the key constraints to
inclusive growth is to be able to bridge gaps in infrastructure and human capital
development.
2014 YEAR‐END REPORT
Page 11 of 58
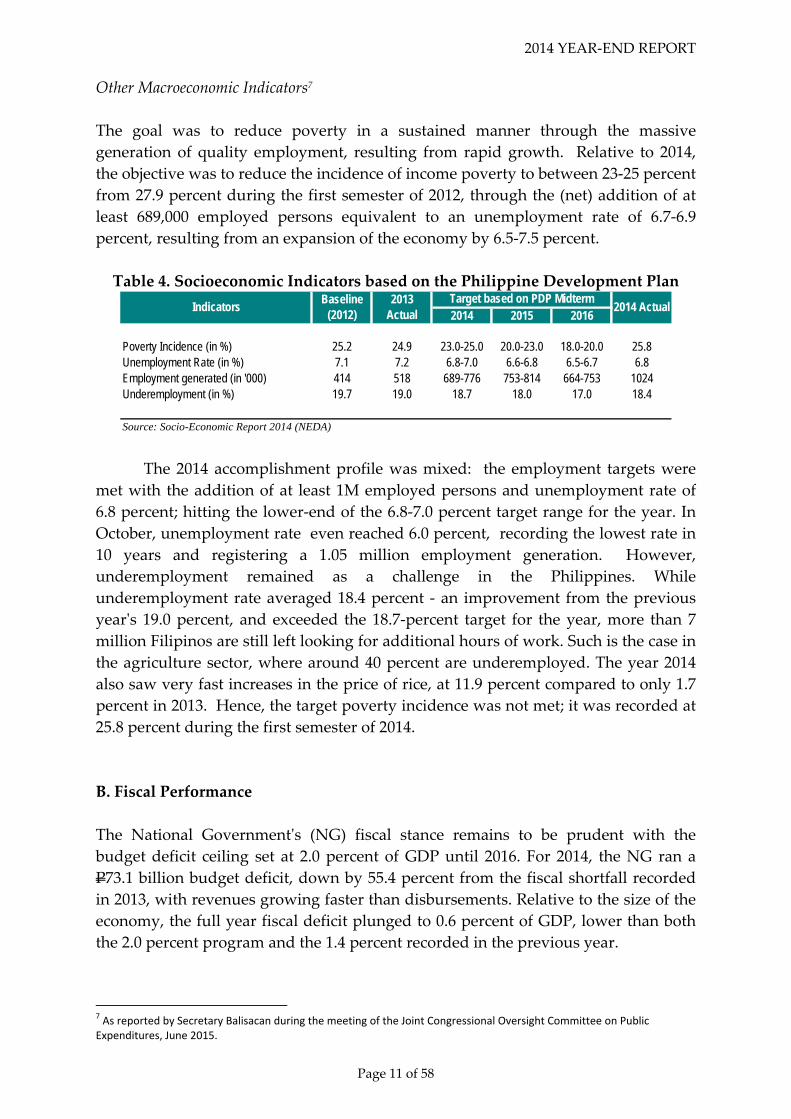
Other Macroeconomic Indicators7
The goal was to reduce poverty in a sustained manner through the massive
generation of quality employment, resulting from rapid growth. Relative to 2014,
the objective was to reduce the incidence of income poverty to between 23‐25 percent
from 27.9 percent during the first semester of 2012, through the (net) addition of at
least 689,000 employed persons equivalent to an unemployment rate of 6.7‐6.9
percent, resulting from an expansion of the economy by 6.5‐7.5 percent.
Table 4. Socioeconomic Indicators based on the Philippine Development Plan
2014 2015 2016
Poverty Incidence (in %) 25.2 24.9 23.0-25.0 20.0-23.0 18.0-20.0 25.8Unemployment Rate (in %) 7.1 7.2 6.8-7.0 6.6-6.8 6.5-6.7 6.8Employment generated (in '000) 414 518 689-776 753-814 664-753 1024Underemployment (in %) 19.7 19.0 18.7 18.0 17.0 18.4
Source: Socio-Economic Report 2014 (NEDA)
Target based on PDP Midterm 2014 ActualIndicators
Baseline (2012)
2013 Actual
The 2014 accomplishment profile was mixed: the employment targets were
met with the addition of at least 1M employed persons and unemployment rate of
6.8 percent; hitting the lower‐end of the 6.8‐7.0 percent target range for the year. In
October, unemployment rate even reached 6.0 percent, recording the lowest rate in
10 years and registering a 1.05 million employment generation. However,
underemployment remained as a challenge in the Philippines. While
underemployment rate averaged 18.4 percent ‐ an improvement from the previous
yearʹs 19.0 percent, and exceeded the 18.7‐percent target for the year, more than 7
million Filipinos are still left looking for additional hours of work. Such is the case in
the agriculture sector, where around 40 percent are underemployed. The year 2014
also saw very fast increases in the price of rice, at 11.9 percent compared to only 1.7
percent in 2013. Hence, the target poverty incidence was not met; it was recorded at
25.8 percent during the first semester of 2014.
B. Fiscal Performance
The National Governmentʹs (NG) fiscal stance remains to be prudent with the
budget deficit ceiling set at 2.0 percent of GDP until 2016. For 2014, the NG ran a
P73.1 billion budget deficit, down by 55.4 percent from the fiscal shortfall recorded
in 2013, with revenues growing faster than disbursements. Relative to the size of the
economy, the full year fiscal deficit plunged to 0.6 percent of GDP, lower than both
the 2.0 percent program and the 1.4 percent recorded in the previous year.
7 As reported by Secretary Balisacan during the meeting of the Joint Congressional Oversight Committee on Public Expenditures, June 2015.

2014 YEAR‐END REPORT
Page 12 of 58
Table 5. National Government Fiscal Performance
(in Billion Pesos, unless otherwise indicated) 2013
Actual Program Actual Difference 2013 2014 Total Revenues 1,716.1 2,018.1 1,908.5 (109.5) 14.9 15.1 11.2
Tax Revenues 1,535.7 1,879.9 1,720.1 (159.8) 13.3 13.6 12.0 Tax Effort (%) 13.3 14.7 13.6 0.1 0.1
Non-Tax Revenues 177.5 136.1 186.5 50.3 1.5 1.5 5.1 Privatization 2.9 2.0 1.9 (0.1) 0.0 0.0 (33.7)
Disbursements 1,880.2 2,284.3 1,981.6 (302.7) 16.3 15.7 5.4 Current Operating Expenditures 1,519.2 1,800.9 1,616.7 (184.2) 13.2 12.8 6.4 Capital Outlays 344.3 458.4 351.5 (106.9) 3.0 2.8 2.1 Net Lending 16.6 25.0 13.4 (11.6) 0.1 0.1 (19.3)
Surplus/(Deficit) (164.1) (266.2) (73.1) 193.2 (1.4) (0.6) (55.4) % of GDP (1.4) (2.1) (0.6)
Memo Item:Nominal GDP 11,542.3 12,829.1 12,642.7
GrowthParticulars2014 Percent of GDP
Revenue Performance8
In 2014, total revenues amounted to P1,908.5 billion, registering a growth of 11.2
percent year‐on‐year. Of the total revenues, P1,720.1 billion or 90.1 percent were tax
revenues while non‐tax revenues and privatization proceeds amounted to P188.4
billion or 9.9 percent.
Albeit lower than the collection target, total tax revenues increased by 12.0
percent year‐on‐year, further boosting tax effort to 13.6 percent compared to 13.3
percent registered in 2013. This is attributed mainly to the continued improved
collection performance of the Bureau of Internal Revenue (BIR), Bureau of Customs
(BOC) and other offices.
Tax revenues from BIR, which account for 77.6 percent of the total tax
collection, grew by 9.7 percent year‐on‐year. The Bureau’s commitment to the strict
enforcement of the country’s tax laws through the implementation of its priority
programs, such as the invigorated Run after Tax Evaders (RATE) Program, and
Oplan Kandado, among others, was the impetus behind this growth. The newly‐
implemented Internal Revenue Stamps Integrated System (IRSIS) Excise Fuse‐on
Stamps Program was also proven to be a worthwhile initiative with the significant
improvements in the distribution of stamps and the collection of excise taxes.
Total collections of BOC continued to improve as its total collection reached
P369.3 billion, a double digit growth of 21.1 percent over the 2012‐2013 growth of 5.2
percent due to improved valuation and the various administrative reforms
implemented by the Bureau to improve its collection efficiency.
Non‐tax revenues totaled to P186.5 billion, which is higher by P9.0 billion
year‐on‐year. The Bureau of the Treasury (BTr) registered an income and collection
of P93.4 billion ‐ higher by P12.4 billion from 2013, or 15.3 percent, as a result of pro‐
8 Please see Annex for details on the tax and non‐tax revenues as reflected on Table C.1, C.2, and C.3 of the BESF

2014 YEAR‐END REPORT
Page 13 of 58
active cash and investment management, and the more aggressive stance by DOF to
collect dividends from GOCCs.
Revenues from fees and charges amounted to P32.8 billion, growing by 7.3
percent year‐on‐year. Other non‐tax revenues totaled to P60.0 billion in 2014 ‐ a
decrease from the previous yearʹs P65.6 primarily due to lower revenue collected
from the Malampaya operations amounting to P22.3 billion from P27.7 billion in
2013. Meanwhile, income from privatization totaled only to P1.9 billion ‐ lower by
33.7 percent compared to 2013 proceeds, bulk of which came from the Presidential
Commission on Good Governmentʹs (PCGG) disposition of properties, rental
income, bond and cash dividends, etc., amounting to P1.534 billion. In addition,
aside from PCGGʹs contribution, P0.413 billion came from the Privatization and
Management Officeʹs (PMO) disposition of properties, lease, interest and other
income.
BIR Collections in 2014 9
Income taxes had the highest impact on the BIRʹs total tax collection,
accounting for 58.8 percent of total collections. Value‐Added Tax (VAT) and
excise taxes also contributed significant revenues, at 20.9 percent and 10.1
percent, respectively. Documentary stamp tax followed with 5.2 percent, and
percentage taxes with 4.2 percent. In general, the 2014 tax revenues exceeded
the previous year’s revenues with income taxes, property taxes, VAT, excise
taxes, franchise taxes, DST, and other taxes posting growth rates ranging from
3.1 percent to 53.4 percent.
Table 6. BIR Collection Performance
(in Billion Pesos, unless otherwise indicated)
Total BIR Collections 1,216.7 1,334.8 9.7% 100.0%Taxes on Net Income and Profits 718.4 784.8 9.2% 58.8%Taxes on Property 3.3 5.5 66.7% 0.4%Taxes on Domestic Goods and Services 495.0 544.5 10.0% 40.8%
General Sales, Turnover or VAT 250.1 278.8 11.5% 20.9%Selective Excise on Goods 118.9 135.3 13.8% 10.1%Selective Taxes on Services 60.3 55.9 -7.3% 4.2%Taxes on the Use of Goods or Property or Permission to Perform Activities
0.5 0.6 20.0% 0.0%
Documentary Stamp Tax (DST) 60.3 69.0 14.4% 5.2%Other Taxes 4.9 4.9 1.2% 0.4%
Note:
Figures are based on the FY 2014 BIR Annual Report, and as reflected in the FY 2015 and FY 2016 BESF
Source: Bureau of Internal Revenues
2014 Distribution
Particulars 2013 Growth2014
9 Based on the submission of the Bureau of Internal Revenue. Please see Annex A‐1 and A‐2 for a detailed breakdown of the actual collection, by source and by department/agency

2014 YEAR‐END REPORT
Page 14 of 58
Taxes on Net Income and Profits
The positive collection performance for income taxes (9.2 annual percent
growth) was driven by several factors such as declaration of cash dividends,
higher sales by various taxpayers as a result of the countryʹs strong economic
activity, and higher expanded withholding tax remittances resulting from
increased purchases and cost of services. This increase in income tax
collections was slightly tempered by the losses of banks from income‐yielding
investments such as stocks and government securities; utilization of prior
year’s excess tax credits; decline in the volume of gross domestic borrowings;
and lower interest rates for savings deposit and SDA compared to 2013 rates.
Selective Excise on Goods
Likewise, the favorable collection performance of excise taxes was driven by
the country’s strong economic performance, which propelled collections from
Miscellaneous and Mining Industry. Excise taxes on automobiles also
contributed a healthy volume of revenues, as a consequence of the higher
demand of automobile consumers due to easier financing access and the
launch of new car models. The Mining Industry contributed significantly to
the positive collection growth of excise taxes, owing to the boom in the
construction and real estate in both public and private sectors. Revenues from
tobacco increased due to the implementation of the Sin Tax Reform Act of
2012, which raised tax rates on alcohol and tobacco products, and the full
implementation of Internal Revenue Stamps Integrated System (IRSIS). Tax
revenues for alcohol products grew by 11.9 percent from last year despite the
weakened demand. Excise tax collections from petroleum products also
increased by 10.8 percent compared to last year.
Impact of Sin Taxes
The passage and implementation of R.A. No. 10351 (Sin Tax Law)
boosted excise tax collections. For FY 2014, total collections from
tobacco and alcohol registered at P75.5 billion and P38.5 billion,
respectively. Thus, the National Government collected P50.2 billion in
incremental revenues as defined under the Sin Tax Law, P7.4 billion
higher than the projected incremental revenues of P42.9 billion. These
proceeds are earmarked for the Universal Health Program.

2014 YEAR‐END REPORT
Page 15 of 58
Table 7. Impact of Sin Tax Law Implementation
(in Billion Pesos, unless otherwise indicated)
Tobacco 70.4 75.5 7.3%Alcohol 33.0 38.5 16.7%
Total 103.4 114.0 10.3%
Note:
Includes both locally-produced and imported alcohol and tobacco products
Source: Department of Finance
Particulars 2013 2014 Growth
Table 8. Incremental Revenues
(in Billion Pesos, unless otherwise indicated)
Projected Actual DifferenceTobacco 29.6 39.4 9.8 Alcohol 13.3 10.8 (2.5)
Total 42.9 50.2 7.4
Source: Department of Finance
Particulars2014
Value‐Added Tax
VAT collections in 2014 exceeded the 2013 outturn by 11.5 percent due to
increased revenues from the audit of deficiency VAT covering prior periods.
The higher volume of sales by various taxpayers engaged in
telecommunications, manufacturing, tobacco and alcohol industry also
contributed to the increased collection. With these measures, the BIR attained
85.6 percent of its VAT collection target, as these were partly offset by the
increase in claims of input taxes and organization restructuring of some
multinational corporations.
Selective Taxes on Services
The decrease in percentage tax collections can be traced primarily to the
downswing in trading gains due to the declining prices of fixed income
securities, the absence of non‐recurring sales of shares of stocks, and the
decline in banking transactions by some banks brought about by the Third
Basel Accord (Basel III) which put restrictions on banks in engaging with
highly leveraged‐activities that yield high trading gains.

2014 YEAR‐END REPORT
Page 16 of 58
Documentary Stamp and Other Taxes
The improved collection in documentary stamp tax and other taxes was
attributed to an increase in reloading of Electronic Documentary Stamp Tax
(eDST) credits by banks; significant interest payments made for deficiency
documentary stamp tax; and renewal of big insurance accounts.
BOC Collections in 2014 10
For 2014, the Bureau of Customs sustained its double‐digit growth at 21.1
percent year‐on‐year. The reduction and elimination of duties under free
trade agreements spurred higher volume of imports that positively impact on
other BOC collections. This was coupled with the aggressive implementation
of customs administrative reforms which involved the redeployment of
Customs personnel and officials.
Table 9. BOC Collection Performance
(in Billion Pesos, unless otherwise indicated)
Total BOC Collections 304.9 369.3 21.1% 100.0%o.w. Tax Expenditure Fund 2.4 11.5 378.2% 3.1%Import Duties 35.3 56.3 59.3% 15.2% Non-Oil 35.0 55.9 59.9% 15.1% Oil 0.4 0.4 4.5% 0.1% Crude Oil 0.0 0.0 0.0% 0.0% Oil Products 0.4 0.4 4.5% 0.1%VAT 239.8 279.1 16.4% 75.6% Non-Oil 167.2 203.0 21.4% 55.0% Oil 72.6 76.1 4.8% 20.6% Crude Oil 33.5 34.0 1.4% 9.2% Oil Products 39.1 42.1 7.8% 11.4%Excise Tax 26.9 30.4 12.9% 8.2%Others 2.8 3.5 23.0% 0.9%
Source: Bureau of Customs
2014 Percentage Distribution
Particulars 2013 2014 Growth
Duties and VAT on non‐oil, crude and petroleum products brought in
a total of P56.3 billion and P279.1 billion, respectively, which are higher than
2013 collections by 56.3 percent and 16.4 percent as efforts to plug leakages
managed to partly offset the decline in collections due to the lowering of
international oil prices. Likewise, excise tax collections on other import goods
for 2014 were realized at P30.4 billion, 12.9 percent higher than the 2013
collection of P26.9 billion.
10 Based on the submission of the Bureau of Customs.

2014 YEAR‐END REPORT
Page 17 of 58
Borrowing Performance
Financing and Debt
With the fiscal deficit reaching its lowest level in 8 years and the government’s
healthy cash position, the NG was able to downscale its borrowing for the period,
attaining a 73:27 borrowing mix in favor of domestic debt.
Total gross borrowing reached P529.8 billion, which is 29.4 percent lower than
the P750.5 billion revised program for the year. Aside from the lower funding
requirement brought about by the lower‐than‐expected deficit and the government’s
healthy cash position, the decline in gross financing is also due to the scaling back of
contributions to the Bond Sinking Fund (BSF) used for the redemption of maturing
domestic obligations.
Table 10. National Government Financing
(in Million Pesos, unless otherwise indicated)
ProgramRevised Program
Actual Difference %
274,110 283,970 175,239 (108,731) -38%5,036 4,236 12,572 8,336 197%
95,030 130,500 141,949 11,449 9%89,994 126,264 129,377 3,113 2%
269,074 279,734 162,667 (117,067) -42%620,011 620,011 387,838 (232,173) -37%350,937 340,277 225,171 (115,106) -34%
13% 17% 27%87% 83% 73%
Source: Bureau of the Treasury
Domestic
Domestic (Gross)Less: Amortization
Financing Mix (% of total)External
External (Net)External (Gross)Less: Amortization
Domestic (Net)
Particulars2014 Actual vs. Revised
Financing
Domestic financing, which accounts for 73 percent of the total, was 37 percent
below program. Aside from the regular issuance of debt securities, BTr successfully
conducted a domestic bond exchange in the 3rd quarter of 2014 as part of the liability
management initiatives of the government. This resulted in interest expense savings
and eases future debt burden by retiring outstanding expensive debt in favour of
cheaper and longer maturing securities.
Meanwhile, external borrowing in 2014 was higher vis‐à‐vis the revised
program as well as actual borrowings from a year ago, mainly due to the availment
of emergency loans to support Yolanda relief and reconstruction efforts. Also, the
government raised P67.7 billion in global bonds offering, wherein P39.0 billion was
used to accelerate the repayment of high interest debt while the remaining P28.7
billion was for general budgetary support.

2014 YEAR‐END REPORT
Page 18 of 58
National Government Debt
As of end‐2014, the NG outstanding debt was recorded at P5,735.2 billion. In line
with risk management objectives, domestic debt amounting to P3,820.6 billion
accounted for 67 percent of total NG obligations while external obligations were at
P1,914.6 billion.
Table 11. National Government Debt
(in Million Pesos, unless otherwise indicated)
2013 2014 Difference %5,681,153 5,735,242 54,089 1.0%
External 1,947,731 1,914,639 (33,092) -1.7%Domestic 3,733,422 3,820,603 87,181 2.3%
External 34.3% 33.4%Domestic 65.7% 66.6%
49.2% 45.4% -3.9%External 16.9% 15.1% -1.7%Domestic 32.3% 30.2% -2.1%
323,434 321,185 (2,249) -0.7%External 101,117 100,690 (427) -0.4%Domestic 222,317 220,495 (1,822) -0.8%
Total IP as % of GDP 2.8% 2.5%Total IP as % of Disbursements 17.2% 16.2%Total IP as % of Revenues 18.8% 16.8%
10.03 9.90External 10.89 11.13Domestic 9.57 9.20
5.5% 5.4%External 5.1% 4.8%Domestic 5.8% 5.7%
100.0% 100.0%Fixed 94.1% 93.0%Floating 5.7% 6.8%Interest Free 0.1% 0.1%
Note:a/ Average maturity is measured in years on residual basis
Memo Items:GDP 11,542,286 12,642,736Peso/US$ 44.45 44.70Disbursements 1,880,155 1,981,619Revenues 1,716,093 1,908,527
Source: Bureau of the Treasury
Interest Rate Mix
ActualParticulars
Weighted Average Interest Rate
Total Interest Payments
Average Maturity (years) a/
Total NG Debt
% of Total
% of GDP
Consistent with the borrowing program, outstanding NG debt issued in the
domestic market increased by 2.3 percent year‐on‐year, equivalent to P87.2 billion.
Meanwhile, external obligations decreased by P33.1 billion or 1.7 percent compared
to end‐2013 figures. The growth of NG debts is driven by the expansion of domestic

2014 YEAR‐END REPORT
Page 19 of 58
debt in line with the objective of reducing foreign exchange risks and other external
shocks.
Attesting to the government’s proactive liability management and sustained
economic growth, debt sustainability indicators such as NG debt ratio has
progressively improved, narrowing considerably to 45.4 percent as of end‐December
2014 compared to 49.2 percent in the previous year. The 3.8‐percentage point
improvement could be attributed to the combined effect of strong economic growth
and lower deficit resulting in reduced borrowings. Both domestic and external debt
decreased relative to GDP at 30.2 percent and 15.2 percent, down by 2.1 percentage
points and 1.7 percentage points, respectively.
Alongside improvements in the relative size of its obligations, the
Government was also successful in shifting the profile of its outstanding debt in line
with cost and risk considerations.
NG obligations continue to exhibit resilience against interest rate risks
resulting from the Government of the Philippines’ (GOP) preference to
issue fixed‐rate securities. As of end‐December 2014, only 6.8 percent of
the total debt portfolio are subject to resetting, mitigating adverse swings
and allowing for more certain projections such as those related to interest
payments.
Despite the rising interest rate environment, weighted average interest
rate (WAIR) of the NG debt portfolio stays on a downward trend. WAIR
for NG domestic and external obligations is at 5.7 percent and 4.8 percent
from 5.8 percent and 5.1 percent as of end‐2013, respectively. The
contraction of borrowing costs result from a strategic issuance policy that
takes advantage of favourable domestic interest rates to refinance
maturing obligations, including those done through liability management
transactions.
The average maturity of the debt portfolio has maintained a comfortable
average of 9.9 years, residing on the upper bound of the country’s
medium‐term debt target of 7 to 10 years. This is because 88 percent of the
country’s total outstanding debt have long maturities, which diminishes
the country’s exposure to refinancing risks. Domestic and external debt
have average maturities of 9.2 and 11.1 years, respectively.
Debt service metrics have simultaneously improved with interest
payments taking up a lower percentage of revenues and expenditures. IP
reached P321.2 billion in 2014, slightly less than the P323.4 billion for 2013
while generating savings of P31.5 billion against the full‐year program. IP
relative to revenues declined to 16.8 percent from 18.8 percent the

2014 YEAR‐END REPORT
Page 20 of 58
previous year, implying improved NG capacity to service debt. Similarly,
IP fell to 16.2 percent of expenditures from 17.2 percent in 2013, freeing
fiscal space for more productive government spending.
Disbursement Performance
Total national government spending for 2014 reached P1,981.6 billion, higher than
the 2013 disbursement level of P1,880.2 billion by P101.5 billion or 5.4 percent. The
year‐on‐year growth of disbursements in 2014 has maintained the 5.8‐percent
growth in 2013. Netting out interest payments (IP), the cumulative growth in
disbursements was at a relatively higher rate of 6.7 percent, resulting from a slight
year‐on‐year decrease in IP of about 0.7 percent. The growth in spending was largely
driven by increased spending on Personnel Services; the combined increase of 7.3
percent in productive expenditures such as Maintenance and Other Operating
Expenditures (MOOE) and Infrastructure and Other Capital Outlays (CO); higher
Internal Revenue Allotment (IRA) for Local Government Units (LGUs); subsidies to
Government‐Owned and ‐Controlled Corporations (GOCCs); and tax expenditure
subsidies for GOCCs and National Government Agencies (NGAs) (See Table 12
below).
On the other hand, the cumulative disbursement outturn was lower than the
program for the year by about P302.7 billion or 13.3 percent, which can be attributed
in part to virtuous factors like savings in IP and net lending (P43.1 billion).
Unfortunately, shortfalls in the disbursement performance were also realized due to
institutional problems in the delivery of goods and services, such as poor planning
and procurement bottlenecks; as well as the unintended delays caused by the
implementation of reforms, such as new payment rules (See Table 13 below).
Among the departments which registered the largest underspending in terms
of magnitude are the Department of Public Works and Highways (DPWH),
Department of Education (DepEd), Department of Social Welfare and Development
(DSWD), Department of Interior and Local Government (DILG), Department of
Agriculture (DA), Department of Health (DOH), Department of Transportation and
Communications (DOTC), Department of Agrarian Reform (DAR) and the
Department of Environment and Natural Resources (DENR). The extent of
underperformance by these departments accounted for the P175.4 billion or nearly
58.0 percent of the total underspending of P302.7 billion in 2014.
Based on the consultation meetings conducted by the Department of Budget
and Management (DBM) with these departments, the low disbursement outturn can
be mostly attributed to the delays introduced by additional procedures required by
the FY 2014 General Appropriations Act (GAA) for transparency and accountability;
additional restrictions on the use of savings and realignments as a result of the SC
ruling on the DAP; structural weaknesses within the departments demonstrated by

2014 YEAR‐END REPORT
Page 21 of 58
poorly prepared projects, project implementation difficulties and procurement
issues; as well as other reasons that are said to be beyond the control of the
departments/agencies (e.g., unforeseen circumstances, unfavorable weather
conditions, and peace and order situation).
Year‐on‐Year Performance
Table 12. Disbursements by Expense Class, Year‐on‐Year
(in Billion Pesos, unless otherwise indicated)
2013 2014 Amount %Current Operating Expenditures 1,519.2 1,616.7 97.5 6.4%
Personnel Services 581.7 603.6 21.9 3.8%Maintenance and Other Oper. Exp. 282.9 308.7 25.8 9.1%Subsidy 66.3 80.4 14.1 21.3%Allotment to LGUs 241.8 273.2 31.4 13.0%Interest Payments 323.4 321.2 (2.2) -0.7%Tax Expenditure 23.0 29.5 6.5 28.3%
Capital Outlays 344.3 351.5 7.2 2.1%Infrastructure & Other CO 261.8 276.0 14.1 5.4%Equity 11.5 1.7 (9.7) -84.8%Capital Transfers to LGUs 71.0 73.8 2.8 3.9%
Net Lending 16.6 13.4 (3.2) -19.4%TOTAL 1,880.2 1,981.6 101.5 5.4%
Source: Department of Budget and Management
ParticularsJanuary-December Increase/Decrease
The major sources of year‐on‐year growth in disbursements are as follows:
• Spending for Personnel Services (PS) grew by P21.9 billion or 3.8 percent
year‐on‐year largely on account of the increase in requirements of DepEd
corresponding to the salaries and benefits of the 58,734 teaching positions
created and filled in 2013, as well as the funding requirements for the
29,776 positions filled in 2014 out of the 33,006 positions created for the
year. In addition, funding for the creation and recruitment of 13,000 Police
Officer I positions and 1,200 Fire Officer I positions were provided in 2014
along with the P4.6 billion in retirement and separation incentives and
benefits for rationalized personnel under the offices of DAR, DA and
DENR.
• Maintenance spending reached P308.7 billion, higher by P25.8 billion or
9.1 percent from the 2013 level of P282.9 billion. This was essentially
driven by the increased investments in major social protection services
particularly the DSWDʹs Pantawid Pamilyang Pilipino Program (4Ps), which
was expanded by 41.3 percent to cover 4,309,769 households under the
regular conditional cash transfer (CCT) program from 3,809,769
beneficiaries in 2013, and additional requirements to cover 131,963
homeless families. Other programs of the DSWD that were expanded in
2014 were the Supplemental Feeding Program (from P3.0 billion in 2013 to
P4.2 billion in 2014) which provides food to targeted children‐beneficiaries

2014 YEAR‐END REPORT
Page 22 of 58
and the Social Pension for Indigent Filipino Senior Citizens (from P1.5
billion in 2013 to P3.1 billion in 2014) which entitles poor senior citizens to
a monthly pension of P500 to augment their daily subsistence and other
medical needs. On top of this is the amount of P4.3 billion released to the
DSWD for the Emergency Shelter Assistance of LGUs in Yolanda‐affected
areas. This program provides cash assistance to families whose houses
were either totally or partially destroyed/ damaged by Typhoon Yolanda,
and have no permanent source of income or whose income is below the
poverty threshold.
Other contributing factors to the increase in MOOE were the higher
requirements allotted to DOH for the operation of special hospitals,
medical centers and activities for Disease Prevention Control, as well as
the P3.2 billion Medical Assistance Program for indigent patients, who are
either confined or seeking outpatient services in government hospitals.
• Support to GOCCs in terms of subsidies surpassed the previous year’s
level by P14.1 billion or 21.3 percent owing to the P35.3‐billion subsidy for
health insurance premium of 14.7 million poor and near‐poor families to
be covered under the National Health Insurance Program (NHIP).
However, this increase was partly subdued by the impact of the
magnitude of releases made in 2013 for National Electrification
Administration (NEA), National Irrigation Administration (NIA), and
Philippine Coconut Authority (PCA) for the rehabilitation and restoration
of calamity‐affected areas.
• Allotment and capital transfers to LGUs expanded by P34.2 billion or 10.9
percent chiefly on account of the higher IRA share of LGUs resulting from
a larger tax base in 2011.
• Tax expenditure subsidies paid by national government agencies and
GOCCs to BIR and BOC rose to P29.5 billion, whcih is P6.5 billion or 28.3
percent more than the 2013 level. This was brought about by the combined
impact of the smaller allocation for the Philippine Deposit Insurance
Corporation (PDIC), whose 5‐year entitlement to tax subsidy expired in
June 2014 in accordance with R.A. No. 9576 (or PDIC Charter); and the
increase in tax subsidies to the National Food Authority (NFA), which
amounted to almost P11.0 billion in 2014 corresponding to the importation
of 1.3 million metric tons of rice that year.
• Infrastructure and other capital outlays (CO) increased by only P14.1
billion or 5.4 percent to P276.0 billion in 2014. The increase was mostly on
account of the higher releases for the infrastructure development
programs of the DOTC (P11.4 billion in 2014 Notice of Cash Allocation or

2014 YEAR‐END REPORT
Page 23 of 58
NCA, releases compared to P4.6 billion in 2013), and the P4.9 billion
allocation for Department of National Defense (DND) to cover the
requirements of the fighter/surface attack/lead‐in fighter trainer
(F/SA/LIFT) aircraft acquisition project including the purchase of
communications security equipment and buyer‐enhanced furnished
equipment under the Revised Armed Forces of the Philippines (AFP)
Modernization Program.
However, the year‐on‐year expansion of disbursements was partly weakened
by the decline in the following expenditure items:
• Equity contributions to GOCCs dropped by P9.7 billion or nearly 85
percent to P1.7 billion in 2014 primarily due to the non‐recurring release of
P10 billion in December 2013 which already covered in full the balance of
NG share in the capitalization of the BSP.
• Net lending to GOCCs also decelerated in 2014 by P3.2 billion or 19.4
percent with the decrease in NG advances for NFA as it opted to refinance
and maximize the available credit lines from government financial
institutions for its maturing bond obligations, and for North Luzon
Railways Corporation given the accelerated payment in 2013 of the
Export‐Import Bank of China (China Exim Bank) loan.
Program vs. Actual
The substantial shortfall of P302.7 billion or 13.3 percent against the disbursement
targets was mainly accounted for by the following:
Table 13. Disbursements by Expense Class, Program vs. Actual
(in Billion Pesos, unless otherwise indicated)
Program Actual Amount %Current Operating Expenditures 1,800.9 1,616.7 (184.2) -10.2%
Personnel Services 661.5 603.6 (57.9) -8.8%Maintenance and Other Oper. Exp. 374.6 308.7 (65.9) -17.6%Subsidy 109.0 80.4 (28.6) -26.2%Allotment to LGUs 273.2 273.2 - 0.0%Interest Payments 352.7 321.2 (31.5) -8.9%Tax Expenditure 29.9 29.5 (0.3) -1.2%
Capital Outlays 458.4 351.5 (106.9) -23.3%Infrastructure & Other CO 365.2 276.0 (89.2) -24.4%Equity 3.3 1.7 (1.6) -47.4%Capital Transfers to LGUs 84.9 73.8 (11.1) -13.1%CARP-LO Compensation 5.0 - (5.0) -100.0%
Net Lending 25.0 13.4 (11.6) -46.3%TOTAL 2,284.3 1,981.6 (302.7) -13.3%
Source: Department of Budget and Management
ParticularsDeviationJanuary-December

2014 YEAR‐END REPORT
Page 24 of 58
PS closed at 8.8 percent below program, primarily due to the unutilized
funds from unfilled positions, and creation of new positions, as well as the
unreleased allocations for lump‐sum PS items such as the Miscellaneous
Personnel Benefits Fund (MPBF) and the Pension Gratuity Fund (PGF).
MOOE finished below expectations by P65.9 billion or 17.6 percent as a
result of both the low obligation rates of MOOE‐heavy departments11 such
as the Office of the President (OP, 54.8 percent) and DAR (49.4 percent),
and to a greater degree, the huge unspent balances compared to the
DBCC‐approved program for DSWD, DA, DILG, DOH, and DENR. As
earlier mentioned, the more significant causes of the underspending in
these departments can be traced back to the structural weaknesses that
undermine their ability to plan better, implement programs and projects
on schedule and procure goods and services needed for these programs
and projects in a timely manner.
More specifically, inadequate planning was noted in the delays in
complying with the pre‐conditions for release in the FY 2014 GAA, such
as: the submission of a master plan for the provision of agricultural
equipment and facilities of the DA; securing DPWH certification of LGU
capacity to implement projects in the case of Recovery Assistance on
Yolanda (RAY) under DILG; complete submission of geo‐tagged photos
and other requisites for the release of funds for the DENR National
Greening Program; and the required validation of beneficiaries for the
Socialized Pension program of the DSWD. Furthermore, as represented by
DSWD, the low utilization of FY 2014 funds was also attributed mostly to
the postponement of the Expanded CCT program until June 2014,
resulting to unutilized funds of P5.1 billion corresponding to the January
to May 2014 program, as well as the limited capacity of regional Technical
Education and Skills Development Authority (TESDA) offices to
implement skills training thereby causing delays in the implementation of
the Sustainable Livelihood Program and in the disbursement of funds in
the amount of P1.5 billion.
In the same manner, contributing to the underutilization of funds
were the procurement difficulties experienced by some departments like
the DepEd, for instance, which encountered delays in the finalization of
requisite documents for the bidding of textbooks and other instructional
materials; while other departments such as DOH, DAR, and DILG
considered some of the following as key hurdles that slowed down their
procurement process: 1) incidents of failed bidding; 2) insufficient bidding
11 These are the departments with more than one‐third (33.3 percent) of their budget allocated to MOOE. Moreover, those considered with low obligation rates have absorptive capacities (obligations‐to‐allotments ratio) less than the average MOOE obligation rate of 77.2 percent over the period 2012 through 2014 for national government agencies.
2014 YEAR‐END REPORT
Page 25 of 58
requirements; 3) weak staff capacities; and 4) changes in technical
specifications. OP has also attributed its low utilization to intricacies of the
repair requirements for the Presidential Airlift Wing and the procurement
process, which stalled the program for one year.
Lastly, the DA also cited the poor liquidation of cash advances by
LGUs for agriculture banner programs and Bottom‐Up Budgeting projects
as one of the major reasons for their low disbursements. This signals the
weak capacities of LGU in preparing fund liquidation requirements and
highlights the need to capacitate LGU personnel in public financial
management.
Notwithstanding the significant growth in subsidies year‐on‐year, NG
support to GOCCs in the form of operational and program subsidies slid
below program by P28.6 billion or 26.2 percent mainly due to the delays in
program/project implementation of the National Housing Authority
(NHA), Social Housing Finance Corporation (SHFC), NEA, and the
National Power Corporation (NPC). Bulk of the undisbursed amount for
NHA was due to the following factors: 1) revision of housing design for
the Armed Forces of the Philippines and Philippine National Police
(AFP/PNP) Housing Project from loft‐type to bungalow (P4.1 billion); 2)
lack of documentation or delays in securing clearances and permits from
other agencies and LGUs for the Informal Settler Families (ISF) Housing
Program (P1.6 billion) and the AFP/PNP Housing Project Phase 2A (P1.3
billion); 3) delay in the issuance of BIR ruling on exemption for payment of
capital gains and documentary stamp tax despite the submission of
complete requirements for the ISF Housing Program (P3.2 billion) and for
the AFP/PNP Housing Project Phases 2 and 2A (P0.8 billion); and 4)
procurement issues in the housing program for ISFs due to the non‐
compliant technical or financial proposals and delayed and insufficient
submission of bidding documents by contractors (P0.9 billion).
Likewise, SHFC has also encountered delays in the issuance of
permits and licenses by LGUs such as Sangguniang Bayan resolutions,
development and building permits, and other documentary requirements
for its Community Mortgage Program which resulted to an
underspending of P1.8 billion. In the case of NEA, they attributed most of
its underutilization of funds to the refocusing of efforts to the
rehabilitation of distribution lines of electric cooperatives in Typhoon
Yolanda‐affected areas. In particular, they said that NEA personnel and
supply of materials were diverted to restore power in Yolanda‐affected
areas from the 4th Quarter, 2013 to 2nd Quarter, 2014, thereby delaying
the implementation of electrification projects scheduled in FY 2014. Lastly,
the NPC cited non‐compliant deliveries or delays in deliveries or project

2014 YEAR‐END REPORT
Page 26 of 58
completion by suppliers and contractors as some of the reasons for the
slow disbursement of FY 2014 funds. NPC somehow alluded this delay to
port congestion, since some affected spare parts are internationally
manufactured.
Savings in IP amounted to P31.5 billion or 8.9 percent, due to the
combined effects of lower volume of domestic borrowings particularly
treasury bills and fixed rate treasury bonds, as well as lower‐than‐
programmed interest rates (average 364‐day T‐bill rate of 1.8 percent for
2014 compared to the program of 3.0 percent). As a result, the share of IP
in total disbursements declined to 16.2 percent in 2014, the lowest in three
decades.
The largest underspending in terms of magnitude was recorded under
infrastructure and other CO, for which actual disbursements fell short of
program by P89.0 billion or by 24.2 percent against program. This was
mainly due to the considerably low NCA utilization rates of DPWH (76.9
percent) and DOTC (67.6 percent), and their much lower obligation rates
of 69.3 percent for DPWH (compared to 90.6 percent in 2013) and 58.2
percent for DOTC (vs. 66.9 percent in 2013).
Based on the reports of both departments, CO underspending
resulted from a mix of factors. Some justified reasons were the non‐
spending12 of P2.1 billion in items affected by the SC decisions on the
Priority Development Assistance Fund (PDAF) and DAP, and unspent
funds in the amount of P9.7 billion due to factors beyond their control
such as weather disturbances, peace and order problems, and delayed
concurrence by or difficulty in securing approvals from authorities and
donor institutions.
As previously discussed, others reasons affecting fund utilization
point to the structural problems/inefficiencies and long standing
constraints that hamper project implementation and slow down payment
processes. Most of the bottlenecks came from the delays in the approval or
issuance of documents to contractors which are requisites for claim
payments, as well as late billings and incomplete documentation by
contractors (P18.1 billion as accounted for by DPWH); coordination
problems with and limited capacity of implementing partner
agencies/institutions (P14.1 billion); unresolved right‐of‐way problems
and other legal issues (P4.2 billion); and difficulty in securing
permits/clearances prior to project implementation (P2.6 billion). The
DOTC also attributed part of its slow disbursements to the procurement
12 Unutilized funds resulting from unpaid projects, inability to use savings and difficulty in realigning funds

2014 YEAR‐END REPORT
Page 27 of 58
issues encountered for the New Bohol Airport and the acquisition of
rolling stocks for the MRT 3 Expansion.
Capital transfers to LGUs were recorded below program by P11.1 billion
or 13.1 percent due to the unreleased balances of the special shares of
LGUs in the proceeds of national taxes such as VAT and the Tobacco
Excise Tax, in the amounts of P4.7 billion and P5.6 billion, respectively. In
the case of VAT, the 70 percent share of LGUs in accordance with Section
150 of R.A. No. 7160 is still unreleased pending BIRʹs identification of
beneficiary LGUs where the situs of the branches, sub‐outlets, plant or
plantation, and retail stores are located. As for the Tobacco Excise Tax, the
30 percent and 80 percent shares of congressional districts with respect to
the excise taxes of locally‐manufactured Virginia‐type cigarettes under
R.A. No. 7171, and from Burley & Native tobacco under R.A. No. 8240,
respectively, cannot be released in view of the SC ruling on PDAF
declaring as unconstitutional any form of post‐enactment intervention by
legislators in the implementation of the budget. Prior to the issuance of
that SC decision, the release of the congressional district share requires
consultation or identification of programs and projects by legislators.
The P5.0 billion allocation for the payment of landownersʹ compensation
under the Comprehensive Agrarian Reform Program (CARP) was not
released in 2014 in the absence of the Presidential Agrarian Reform
Council (PARC) endorsement and in view of the huge and sufficient cash
balance of the Agrarian Reform Fund (ARF) administered by the Land
Bank of the Philippines (LBP).
Actual net lending to GOCCs of P13.4 billion was lower than the program
by P11.6 billion or 46.3 percent. The DOF attributed the decline to the
policy initiatives undertaken for GOCCs that are directed towards fiscal
discipline and prudent cash management, which includes refinancing of
maturing obligations of some GOCCs by government financial
institutions.
2014 YEAR‐END REPORT
Page 28 of 58
III.
National Government Expenditure Performance
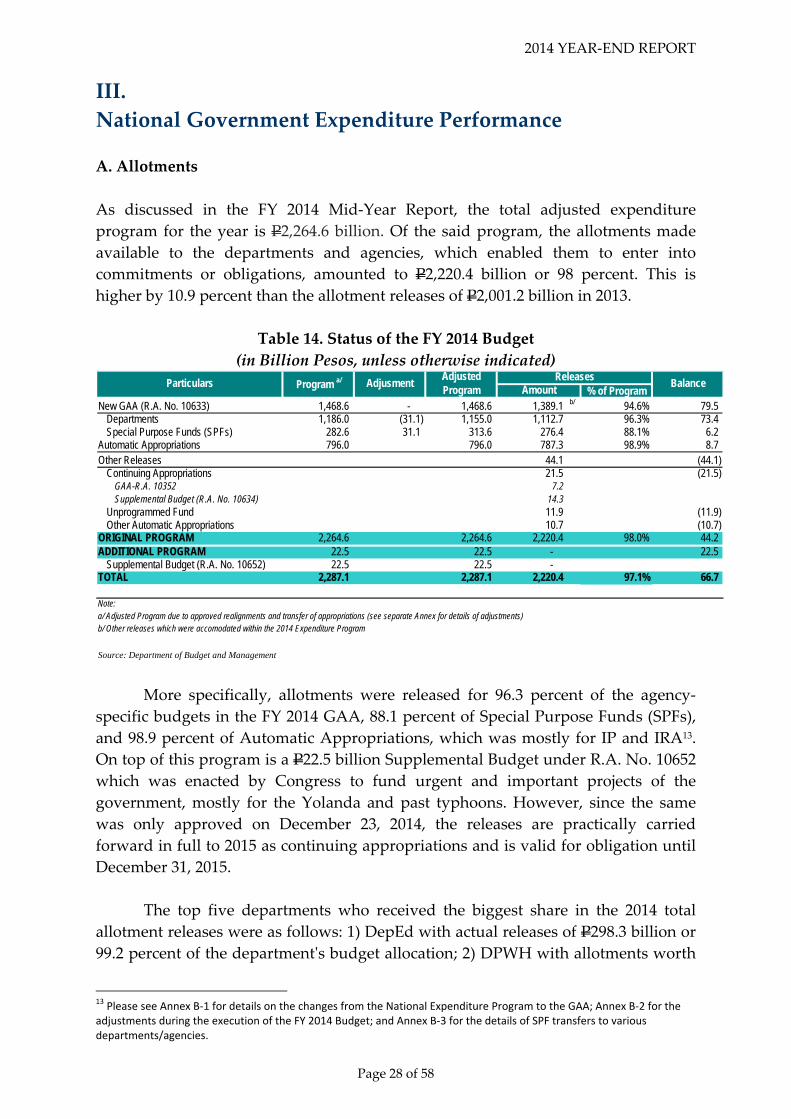
A. Allotments
As discussed in the FY 2014 Mid‐Year Report, the total adjusted expenditure
program for the year is P2,264.6 billion. Of the said program, the allotments made
available to the departments and agencies, which enabled them to enter into
commitments or obligations, amounted to P2,220.4 billion or 98 percent. This is
higher by 10.9 percent than the allotment releases of P2,001.2 billion in 2013.
Table 14. Status of the FY 2014 Budget
(in Billion Pesos, unless otherwise indicated)
% of ProgramNew GAA (R.A. No. 10633) 1,468.6 - 1,468.6 1,389.1 b/ 94.6% 79.5
Departments 1,186.0 (31.1) 1,155.0 1,112.7 96.3% 73.4 Special Purpose Funds (SPFs) 282.6 31.1 313.6 276.4 88.1% 6.2
Automatic Appropriations 796.0 796.0 787.3 98.9% 8.7 Other Releases 44.1 (44.1)
Continuing Appropriations 21.5 (21.5) GAA-R.A. 10352 7.2 Supplemental Budget (R.A. No. 10634) 14.3
Unprogrammed Fund 11.9 (11.9) Other Automatic Appropriations 10.7 (10.7)
ORIGINAL PROGRAM 2,264.6 2,264.6 2,220.4 98.0% 44.2 ADDITIONAL PROGRAM 22.5 22.5 - 22.5
Supplemental Budget (R.A. No. 10652) 22.5 22.5 - TOTAL 2,287.1 2,287.1 2,220.4 97.1% 66.7
Note:a/ Adjusted Program due to approved realignments and transfer of appropriations (see separate Annex for details of adjustments)b/ Other releases which were accomodated within the 2014 Expenditure Program
Source: Department of Budget and Management
Particulars Program a/ BalanceReleases
AmountAdjusment
Adjusted Program
More specifically, allotments were released for 96.3 percent of the agency‐
specific budgets in the FY 2014 GAA, 88.1 percent of Special Purpose Funds (SPFs),
and 98.9 percent of Automatic Appropriations, which was mostly for IP and IRA13.
On top of this program is a P22.5 billion Supplemental Budget under R.A. No. 10652
which was enacted by Congress to fund urgent and important projects of the
government, mostly for the Yolanda and past typhoons. However, since the same
was only approved on December 23, 2014, the releases are practically carried
forward in full to 2015 as continuing appropriations and is valid for obligation until
December 31, 2015.
The top five departments who received the biggest share in the 2014 total
allotment releases were as follows: 1) DepEd with actual releases of P298.3 billion or
99.2 percent of the departmentʹs budget allocation; 2) DPWH with allotments worth
13 Please see Annex B‐1 for details on the changes from the National Expenditure Program to the GAA; Annex B‐2 for the adjustments during the execution of the FY 2014 Budget; and Annex B‐3 for the details of SPF transfers to various departments/agencies.
2014 YEAR‐END REPORT
Page 29 of 58
P257.9 billion or 90.8 percent of its obligation program; 3) DILG with P151.0 billion
in allotment releases or 99.5 percent of its annual appropriations; 4) DND with
P141.7 billion or almost 100 percent of its programmed budget; and 5) DSWD with
releases amounting to P99.0 billion representing almost its entire budget. The
allotment releases for these five major departments account for 42.7 percent of the
P2,220.4 billion total allotments issued for the year.
B. Obligations
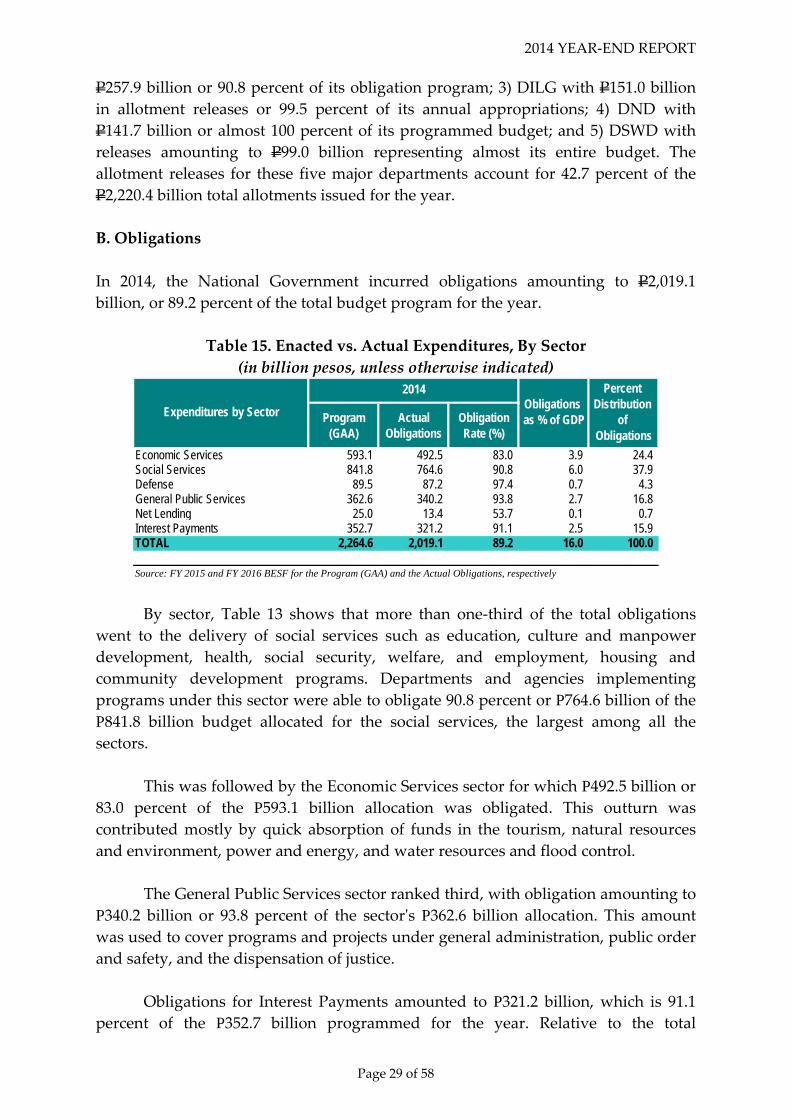
In 2014, the National Government incurred obligations amounting to P2,019.1
billion, or 89.2 percent of the total budget program for the year.
Table 15. Enacted vs. Actual Expenditures, By Sector
(in billion pesos, unless otherwise indicated)
Program(GAA)
ActualObligations
ObligationRate (%)
Economic Services 593.1 492.5 83.0 3.9 24.4 Social Services 841.8 764.6 90.8 6.0 37.9 Defense 89.5 87.2 97.4 0.7 4.3 General Public Services 362.6 340.2 93.8 2.7 16.8 Net Lending 25.0 13.4 53.7 0.1 0.7 Interest Payments 352.7 321.2 91.1 2.5 15.9 TOTAL 2,264.6 2,019.1 89.2 16.0 100.0
Source: FY 2015 and FY 2016 BESF for the Program (GAA) and the Actual Obligations, respectively
2014
Expenditures by SectorObligations as % of GDP
Percent Distribution
of Obligations
By sector, Table 13 shows that more than one‐third of the total obligations
went to the delivery of social services such as education, culture and manpower
development, health, social security, welfare, and employment, housing and
community development programs. Departments and agencies implementing
programs under this sector were able to obligate 90.8 percent or P764.6 billion of the P841.8 billion budget allocated for the social services, the largest among all the
sectors.
This was followed by the Economic Services sector for which P492.5 billion or 83.0 percent of the P593.1 billion allocation was obligated. This outturn was
contributed mostly by quick absorption of funds in the tourism, natural resources
and environment, power and energy, and water resources and flood control.
The General Public Services sector ranked third, with obligation amounting to
P340.2 billion or 93.8 percent of the sectorʹs P362.6 billion allocation. This amount
was used to cover programs and projects under general administration, public order
and safety, and the dispensation of justice.
Obligations for Interest Payments amounted to P321.2 billion, which is 91.1
percent of the P352.7 billion programmed for the year. Relative to the total

2014 YEAR‐END REPORT
Page 30 of 58
obligations, IP had declined to 15.9 percent from the 16.2 percent recorded in the
previous year.
The Defense sector placed fifth with obligation amounting to P87.2 billion of
the sectorʹs P89.5 billion allocation for the year. The said amount was obligated by
the Department of National Defense in its effort to strengthen domestic security.
Lastly, P13.4 billion or 53.7 percent of the program, was obligated for the
servicing of government guaranteed corporate debt. Compared to the previous year,
actual net lending has declined by P3.2 billion. The decline was attributed to the
strengthened fiscal discipline and improved cash management being undertaken for
government corporations.
C. Financial and Physical Performance of Selected Major Programs and Projects, by
Department, as of 31 December 2014
Table 16. Enacted vs. Actual Expenditures, Selected Departments
(in Billion Pesos, unless otherwise indicated)
Allotments
Received2/Obligations
Incurred3/Obligation
Rate (%)4/
Agrarian Reform 25.4 19.7 12.2 61.9Agriculture 72.7 70.1 55.5 79.1Education 308.6 306.3 274.5 89.6Energy 4.1 4.1 0.9 21.9Environment and Natural Resources 28.8 27.0 23.8 88.4Health 56.4 56.4 47.2 83.6Interior and Local Government 159.9 159.1 143.0 89.9Public Works and Highways 301.2 274.9 191.8 69.8Science and Technology 14.7 14.7 12.6 86.2Social Welfare and Development 103.6 103.5 86.1 83.2Transportation and Communications 58.0 58.0 34.1 58.8Other Executive Offices
o.w. CHED 9.8 9.8 5.6 56.4 TESDA 5.9 5.8 5.3 91.8
Notes:1/
2/
3/ Obligations incurred by the Departments in 2014 as reported in the FY 2016 BESF4/ Ratio of obligations incurred to allotments received by departments - measure of absorptive capacity
Source: Department of Budget and Management
FY 2014 Adjusted Appropriations pertain to the following: 1) FY 2014 Budget including the Department-Specific Budget, releases to the Department charged against the Special Purpose Funds and Automatic Appropriations; 2) FY 2013 Continuing Appropriations that were released in 2014; and 3) unobligated allotments as of 31 December 2013, which are still valid for obligation until end-2014.
Allotments received by the Departments charged against the following: 1) FY 2014 Budget including the Department-Specific Budget, releases to the Department charged against the Special Purpose Funds and Automatic Appropriations; 2) FY 2013 Continuing Appropriations that were released in 2014; and 3) unobligated allotments as of 31 December 2013, which are still valid for obligation until end-2014.
DepartmentFY 2014 Adjusted
Appropriations1/
As of 31 December 2014
Department of Agrarian Reform
Financial Performance. DAR received a total allotment release of P19.7
billion, of which P12.2 billion or 62 percent was obligated. The low
2014 YEAR‐END REPORT
Page 31 of 58
obligation rate was recorded in foreign‐assisted projects (FAPs), with total
obligations amounting to P408 million, or 12 percent of its allotment of
P3.5 billion. The department cited procurement problems and the
implementation of the rationalization plan of DAR as the cause of delays
of most FAPs. The Mindanao Sustainable Agrarian and Agriculture
Development Project (MINSAAD), supported by the Japan International
Cooperation Agency (JICA), only incurred obligations of P184 million,
equivalent to 10 percent of its P1.8 billion allotment; while the Italian
Assistance to the Agrarian Reform Community Development Support
Program (IARCDSP) obligated only P31 million, or 3 percent of its P1.1
billion allotment for the year.
Among its major final outputs (MFOs), the Land Tenure Services
(LTS) received the biggest allotment amounting to P5.9 billion, of which
P4.0 billion or 68 percent was obligated. The Land Acquisition and
Distribution (LAD), a component of LTS, was provided with an allotment
of P4.1 billion, of which P3.2 billion or 78 percent was obligated.
Meanwhile, the total allotment for Technical Advisory Services (TAS)
amounted to P3.4 billion, with obligations totaling P2.5 billion (72
percent). The Agrarian Legal Services (ALS) received allotment of P1.1
billion, of which P822 million or 77 percent was obligated.
Physical Accomplishments. For LTS, the DAR was able to acquire around
245,788 hectares of landholdings, exceeding its target for the year of
240,707 hectares. However, out of the 187,685‐hectare target, only 104,996
hectares were distributed. Out of these landholdings distributed, 91,666
hectares was awarded with Certificate of Land Ownership Award
(CLOA). For the 2,145,663‐hectare scope covered by collective CLOAs, the
department had subdivided around 989,482 hectares, while 264,457
hectares of landholdings were not yet identified for subdivision. Of the
subdivided landholdings, a total of 23,208 hectares were accomplished
during the year 2014. This reduced the balance to 891,724 hectares,
accounted as of 1 January 2015, subject for subdivision in the subsequent
years.
For TAS, the department held trainings in 31,213 days, catering to a
total of 623,126 agrarian reform beneficiaries (ARBs), exceeding the target
for the year of 534,527 ARBs. Around 95 percent of the participants rated
the trainings satisfactorily.
For ALS, the department rendered 67,375 legal services to farmers
and landowner clients, surpassing the 60,792‐target for the year, and
around 93 percent of the clients rating the services favorably. Likewise,
around 65,845 agrarian reform cases were acted upon, exceeding the target

2014 YEAR‐END REPORT
Page 32 of 58
of 57,789 cases. Around 73 percent of the total caseload filed reached
resolution, while 81 percent of cases were resolved by adjudication within
three (3) months.
For MINSAAD, the procurement of the consulting firm that will be
responsible for the review of infrastructure subprojects encountered
significant delays. This resulted in the non‐completion of its infrastructure
development activities in year 2014. The DAR is addressing the issue by
requesting clearance from the JICA to utilize the loan proceeds for small
infrastructure projects which can be implemented by the LGUs and by
facilitating the rebidding for consultancy services. Meanwhile, under the
agricultural and environmental development component of the project,
around 340 hectares were established as areas for agriculture and
agribusiness development. The feasibility studies for the remaining 4,177
hectares of landholdings, as well as the 882 hectares identified for
agroforestry development, are still underway. Moreover, under Project
Management and Administration, technical assistance was provided to 11
targeted project monitoring offices, while preparation of 64 projects on
agribusiness and agroforestry, 20 on irrigation, 78 on farm‐to‐market
roads, 58 on potable water supply and 86 on post‐harvest facilities had
commenced, meeting the target for the year.
The implementation of IARCDSP was derailed by procurement
problems and the turn‐over of the Italian Grant‐designated Chief
Technical Advisor (CTA), causing the delay in the engagement of local
consultants and the need to revise the project operation manual. As a
result of these issues, no community infrastructure and agricultural
enterprise development support activities was reported as completed in
2014. The issue in the project will be addressed through close coordination
among its management and concerned field offices, as well as the bids‐
and‐awards committee and technical working group, to facilitate the
procurement and implementation of the project. For the meantime, under
Local Capacity Building Support, the department conducted activities to
strengthen farmer organizations comprising of 47 ARBs.
Department of Agriculture
Financial Performance. For the year 2014, the DA received a total allotment
of P70.1 billion and obligated P55.5 billion or 79 percent of such amount.
Among the agencies under the DA, the biggest chunk of the releases went
to the Office of the Secretary (DA‐OSEC) for the administration of the
Banner Commodity Programs and major projects of the department, most
notably the Rice Program, the High Value Commodity Crop Program and
farm‐to‐market road (FMR) projects. Out of the total allotment of P61.3
2014 YEAR‐END REPORT
Page 33 of 58
billion released to the DA‐OSEC, the agency was able to obligate P48.4
billion or 79 percent. Meanwhile, an allotment of P6.7 billion was released
to the Bureau of Fisheries and Aquatic Resources (BFAR), which in turn
incurred obligations amounting to P5.3 billion, or 79 percent, for the
Fisheries Program.
Physical Accomplishments. Under the Food Staples Sufficiency Program, the
DA distributed 665,160 kilograms of starter seeds for community seed
banking, equivalent to 82 percent of its 815,600‐seed target, due to
insufficient seed variety at the Philippine Rice Research Institute, the
reduction of its target driven by price increases, and the postponement of
distribution because of the insufficient supply of water in some regions.
Some of the seed varieties was planned to be procured in the first quarter
of 2015, while distribution of undelivered seeds will resume during the
target season.
Meanwhile, some of the Agri‐Pinoy Trading Centers (APTC) had
been completed and operationalized during the year. Among these
facilities were the Quezon Corn Trading and Processing Center, and the
newly launched APTCs in Pangasinan, Camarines Norte and Isabela. The
construction of other similar facilities are ongoing and are expected to be
completed in the subsequent years.
For FMR projects, only around 0.17 kilometers out of the 1,000‐
kilometer target was constructed or rehabilitated based on the report
submitted by the DPWH. Some of the FMR projects are still undergoing
the pre‐engineering stage, while others are already undergoing
construction.
Furthermore, around 122,626 target post‐harvest equipment,
machineries and facilities were constructed and delivered to the
beneficiaries, which is equivalent to only 49 percent of the 252,025 target.
The shortfall was caused by the delayed submission of Postharvest
Development Master Plan as required by the special provision of the FY
2014 GAA. The implementation of remaining activities are currently being
completed by the department.
For its credit support services, the department was able to grant
loans amounting to P1.5 billion, or 69 percent of its P2.1 billion target,
benefitting around 36,127 client farmers and fisher folk.

2014 YEAR‐END REPORT
Page 34 of 58
Department of Education
Financial Performance. P306.3 billion was released to the DepEd in 2014 to,
among others, support its preparations for the implementation of Senior
High School under the K to 12 Program beginning 2016. Of the allotments
released, P274.5 billion or 89.6 percent was obligated by DepEd. The bulk
of the DepEd expenditures amounting to P243.4 billion funded the basic
salaries and benefits of teachers, teaching‐related and non‐teaching
personnel. Other major expenditure items pertain to the implementation
of the Basic Education Facilities Fund (BEFF) amounting to P13.5 billion
(DPWH – P11.3 billion and DepED – P2.2 billion); school MOOE with
P13.0 billion; and Government Assistance to Students and Teachers in
Private Education (GASTPE) at P6.2 billion.
Physical Accomplishments. During the year, a total of 11,515 classrooms
were constructed out of the 48,634 target; while 6,409 classrooms were
repaired or rehabilitated out of the 17,009 target. Likewise, 34,755 water
and sanitation facilities were constructed while 2,056 were repaired or
rehabilitated. These were all sourced from FYs 2013 and 2014 BEFF
including the School Building Program.
Meanwhile, DepEd was able to procure 1,481,553 seats, 69.7 percent
of the targeted school desks and chairs, and delivered these to beneficiary
schools.
In terms of manpower requirements, of the 34,638 approved
teaching and teaching‐related items, a total of 30,619 positions or 88.4
percent was filled up. Meanwhile, 2,729 non‐teaching positions or 80.6
percent of the target were likewise filled up.
The provision of textbooks and teachers’ manuals has been
continuously pursued. This translated to the procurement and delivery of
close to 36.0 million learning materials out of 48.7 million target for the
year.
The GASTPE which provides subsidy to high school grantees
through education service contracting scheme and voucher system has
benefited 855,449 students, or 86 percent of the 995,000 revised target.
The Abot Alam Program focuses on out of school youths (OSYs) by
enrolling them into programs on education, employment, and
entrepreneurship. Out of 1,550,986 mapped OSYs, only 543,456 were
enrolled. This translates to 54.3 percent of the total target of 1.0 million
beneficiaries.

2014 YEAR‐END REPORT
Page 35 of 58
Finally, 9,522 schools out of the 9,917 targeted beneficiaries across
the country have been provided funding support to improve school
internet connectivity.
Department of Environment and Natural Resources
Financial Performance. The DENR received allotment of P27.0 billion and
incurred obligations amounting to P23.8 billion, registering an 88.4‐
percent obligation rate. For the National Greening Program (NGP), around
P5.9 billion was obligated from its allotment of P6.5 billion, recording a 91‐
percent obligation rate. Meanwhile, for the Cadastral Survey, an amount
of P815 million, or 96 percent of the P850‐million allotment, was obligated.
For the Air Quality Management Program under the Environmental
Management Bureau, a total of P777 million, or 97 percent of its P781‐
million allotment, was obligated within the year. The Unified Mapping, a
project under the National Mapping and Resource Information Authority
(NAMRIA), reported obligations of P483 million, equivalent to 99 percent
of the P488‐million continuing allotment. Meanwhile, the Mines and
Geosciences Bureau (MGB) received allotment of P424 million for its
Geohazard Assessment and Mapping Project, of which P421 million or 99
percent was obligated.
Meanwhile, its foreign‐assisted projects encountered significant
procurement delays, resulting in low financial performance. The JICA‐
assisted Forestland Management Project (FMP) only obligated P260
million or 39 percent of its P672‐million allotment; while the Integrated
Natural Resources and Environmental Management Project (INREMP),
supported by the Asian Development Bank (ADB) and the International
Fund for Agriculture Development (IFAD), incurred obligations of P81
million or only 14 percent of its P591‐million allotment. The DENR has
taken actions to address these problems by securing the endorsement of
NEDA and the subsequent concurrence of the JICA on the department’s
proposal to engage individual consultants for the FMP; and by securing a
data sharing arrangement with NAMRIA in lieu of the satellite imageries
that were not procured for INREMP.
Physical Accomplishments. For the National Greening Program, a total of
205,414,639 seedlings were planted, covering 334,456 hectares of areas and
exceeding the targets for the year of 164,646,538 seedlings in 300,000
hectares. As of the end of 2014, a total of 1,017,783 hectares had already
been covered by the program. For the Cadastral Survey, around 124 cities

2014 YEAR‐END REPORT
Page 36 of 58
and municipalities were surveyed and issued with maps, meeting the
target for the year.
For Linis Hangin Program, implemented by the EMB under Air
Quality Management, around 12,931 smoke‐belching vehicles were
apprehended while three (3) anti‐smoke belching unit teams were created
and rolled‐out. To strengthen ambient air monitoring, 66 sampling stations
were maintained and monitored, while 118 air quality monitoring stations
(AQMS) were calibrated. An additional eight (8) real‐time AQMS were
installed in Metro Manila, completing the target of one station per LGU in
the National Capital Region. For the Unified Mapping Project of
NAMRIA, very high resolution (VHR) satellite imageries covering the 1.5
million hectares were acquired; while 456 ortho‐image maps were
produced. Under Geohazard Assessment and Mapping, the MGB has
conducted the assessment of 684 cities and municipalities and 1,241
relocation sites for land field mapping and survey, while 122
municipalities underwent assessment for coastal geohazard and impact of
climate change, attaining the corresponding targets for the year.
Department of Energy
Financial Performance. In 2014, the DOE obligated only 21.9 percent of its available allotment of P4.1 billion14, which is a lot less than its obligation
rate of 77.8 percent in 2013. The low absorptive capacity of DOE stemmed
from the failure to award a contract for the Market Transformation
through the Introduction of Energy‐Efficient Electric Vehicles Project (E‐
Vehicle Project) for 2014. Netting out the E‐Vehicle Project of P3.1 billion15,
the obligation rate of DOE should have been 87.3 percent for 2014.
Physical Accomplishments. Out of the total obligations of the Department,
some P132 million was for the Household Electrification Program (HEP) in
Off‐Grid Areas Using Renewable Energy. For 2014, the notable
accomplishments include the installation and commissioning of the
remaining 258 and 1,666 solar home systems under the amended HEP
2011 and HEP 2012 2nd batch, respectively, the issuance of notice to
proceed for the HEP 2014 (Lot 1) covering 4,058 households in Luzon and
Visayas, and the conduct of photovoltaic technician’s training for
beneficiary electric cooperatives and local government units.
14 Available allotment includes releases from current budget, supplemental and continuing appropriations as well as unobligated allotment as of December 31, 2014. 15 Referring to Fund 102 and Fund 151 for the project.
2014 YEAR‐END REPORT
Page 37 of 58
Department of Health
Financial Performance. To support the government’s commitment to
provide accessible and quality health services for all, especially the
marginalized, through the Universal Health Care Program, the DOH was
supported with a total allotment release of P56.4 billion in 2014. Of the
said amount, total obligations reached P47.2 billion or 83.6 percent of
allotment releases to DOH. The bulk of the funds were spent for the
following priority health programs: a) National Health Insurance
Program (NHIP) – P35.3 billion; b) Health Facilities Enhancement Program
(HFEP) – P4.4 billion; c) Health Human Resource Program – P1.2 billion;
d) National Immunization Program – P2.5 billion; e) Family Health and
Responsible Parenting Program – P1.6 billion; f) TB Control Program –
P0.7 billion; and g) Elimination of diseases such as malaria, filariasis, etc. –
P0.7 billion.
Physical Accomplishments. The NHIP, which is being implemented through
the Philippine Health Insurance Corporation (PHIC), covered a total of
14.7 million household beneficiaries, including those in the informal
sector. This accomplishment, which seeks to reduce out‐of‐pocket
expenses of the poor, was made possible through additional revenues
from the Sin Tax Reform Law. However, program enhancements—such as
intensive information campaign in tandem with the local government
units; and improvement in health insurance benefit packages, including
health facilities—need to be intensified.
Part of the whole package of providing health services entails the
even distribution of health human resources across the country. This is
done through the implementation of Doctors to the Barrios, Pinoy MD,
Nurses Deployment Program, Registered Nurses for Health Enhancement
and Local Service, and Rural Health Midwives Placement Program. In
2014, 320 doctors, 11,292 nurses, and 2,700 midwives were deployed.
DOH has provided full immunization, including vitamin and
mineral supplementation to children below five years old, to a total of 2.2
million children covered by the National Immunization Program.
The Family Health and Responsible Parenting Program is another
important undertaking which covers: 1) micronutrient supplementation, 2)
family planning, and 3) adolescent immunization. The program was able
to provide 5.1 million children below five years old with vitamin A
supplementation, and 2.2 million women with family planning
commodities and services.

2014 YEAR‐END REPORT
Page 38 of 58
Continued budgetary support has been given to combating
tuberculosis, among the leading causes of mortality in the country. As a
result, 257,912 cases of tuberculosis were treated in 2014 under the
Tuberculosis Program.
In terms of other public health diseases, the treatment of the
following were reported: 1) 6,962 cases of malaria, 2) 2.1 million cases of
schistosomiasis, and 3) 17 million cases of filariasis.
Department of Interior and Local Government
Financial Performance. To support the promotion of good local
governance—including peace and order, public safety, local autonomy,
and community development—DILG received a total allotment of P159.0
billion (inclusive of P8.4 billion allotment from previous yearsʹ budget) in
2014. Of this amount, DILG incurred a total obligation of P143.0 billion or
89.9 percent of allotments it received, of which P5.3 billion is from prior
yearsʹ allotments. Bulk of DILG’s obligations were incurred by the
Philippine National Police (PNP) with P109.5 billion or 76.6 percent of
total; followed by the DILG‐Office of the Secretary (DILG‐Osec) and the
Bureau of Fire Protection (BFP), with P11.2 billion apiece or 7.8 percent of
the total obligations incurred.
Physical Accomplishments. The allotted budget for DILG‐OSec enabled the provision of technical assistance on accountable transparent, participative
and effective governance to 1,592 LGUs and assessment of 1,676 LGUs for
their compliance with the standards of the Seal of Good Local Governance
(SGLG). In addition, nine Salintubig subprojects and 741 BUB subprojects
have been assisted with financial subsidy and technical assistance for
project preparation and implementation of water facilities.
Meanwhile, the BFP inspected 947,414 buildings or 99.9 percent of
the establishments targeted for the year. The agency also responded to
7,579 fire incidents and 4,667 fire related emergency or rescue calls
nationwide. Moreover, an additional 1,200 fire officer I positions were
created, bringing the fireman to population ratio to 1:5,530 (estimated 96
million population), still a far cry from the ideal 1:2,000 ratio. In terms of
firetruck acquisition, a total of 380 units were purchased during the year,
resulting to the actual ratio of firetruck to population of 1:50,157 as
compared to the ideal ratio of 1:28,000. An additional 368 fire stations
across the country were likewise constructed.
The PNP, on the other hand, conducted 6,535,619 foot patrols and
5,698,090 mobile patrols in 2014. This helped reduce the crime rate from

2014 YEAR‐END REPORT
Page 39 of 58
39.1 percent to 27.9 percent in 2014. Alongside these accomplishments, the
civilian national police force has undertaken a total of 708,350 crime
investigations that led to the arrest of 3,079 most wanted persons or high‐
value targets.
The creation of additional 13,000 police officer I positions resulted
to an improved police to population ratio of 1:578 as compared to the
previous yearʹs 1:633 ratio. Under the Capability Enhancement Program,
also known as the PNP Modernization Program, the government
supported the acquisition of various transportation equipment
requirements of the agency with P1.37 billion. Another P627 million was
used to procure various firearms and communications equipment.
Department of Public Works and Highways
Financial Performance. To support DPWH’s role as the construction arm of
the national government, the government released a total budgetary
allotment of P274.9 billion 16 to bankroll the agency’s programs,
particularly the construction, rehabilitation, and maintenance of national
roads, bridges, and flood control systems. However, only around 69.8
percent or P191.8 billion was obligated. Still, the agency’s current‐year
capital outlays obligation for 201417 increased by P9.2 billion from P147.2
billion in 2013 to P156.4 billion in 2014 or equivalent to P83.0 billion or
113.1 percent increase from 2011 levels.
Physical Accomplishments. Supported by reforms to ensure the right projects,
at the right cost, with the right quality, finished right on time, and implemented
by the right people, the DPWH completed the paving of around 93.3 percent
of the total 31,242 kilometers (km.) national road network as of end 2014.
For the year alone, almost 1,600 km. were paved, higher than previous
year’s actual accomplishment of 1,262 km. This brings in the total
accomplishment of almost 3,900 km. since 2011. Meanwhile, 7,129 lineal
meters (lm.) of bridges were made permanent, bringing the total of
permanent bridges along the national road network to 343,988 lm., 99.4
percent of the total 345,978 lm. targeted by 2016.
Furthermore, the DPWH increased the flood protected areas
around the identified major and principal river basins from 14.5 percent in
2013 to 17.3 percent in 2014. To support this, DPWH completed, among
others the construction or maintenance of 458 flood control structures and
16 Available allotment includes releases from the current budget, supplemental and continuing appropriations, as well as unobligated allotment as of December 31, 2014 17 Current year obligation includes agency specific budget, special purpose funds and automatic appropriations.

2014 YEAR‐END REPORT
Page 40 of 58
drainage systems and construction or rehabilitation of 18 flood control
structures.
Department of Science and Technology
Financial Performance. The total allotment received by the Department of
Science and Technology in year 2014 amounted to P14.7 billion, of which
P12.6 billion or 86.2 percent was obligated. The Office of the Secretary
(DOST‐OSEC), which implements the Small Enterprise Technology
Upgrading Program (SETUP), received an allotment of P3.6 billion and
obligated P3.5 billion, recording a 97‐percent obligation rate.
The total allotment released to the Philippine Atmospheric,
Geophysical and Astronomical Services Administration (PAGASA)
reached P1.9 billion, of which P1.4 billion or 74 percent was obligated.
Meanwhile, the Philippine Institute of Volcanology and Seismology
(PHIVOLCS) recorded a total allotment receipt of P368 million and
obligations of P307 million, posting 83 percent rate.
Furthermore, the Science Education Institute reported that the
agency obligated P1.7 billion, which was 99.8 percent of its allotment
amounting to P1.75 billion. Similarly, almost 100 percent of the P1.67‐
billion allotment for its scholarship programs was obligated.
Physical Accomplishments. Through the SETUP, 2,896 firms were provided
with science and technology assistance, while 5,037 technology
interventions were pursued and 31,683 jobs were generated, exceeding all
the corresponding targets for the year.
For the scholarship programs of the SEI, around 14,495 students
from different levels (12,117 in the Undergraduate level, 1,912 in the
Master’s and 466 in the Doctoral Program) were provided with
educational assistance and stipends, covering 95 percent of its 15,230
target scholars.
Meanwhile, PHIVOLCS issued 1,308 hazards and risk maps and
evaluation reports, which was beyond its target of 600. Likewise, the
PAGASA released 2,553 weather and flood warnings, exceeding its target
for the year of 1,920 warnings issued.

2014 YEAR‐END REPORT
Page 41 of 58
Meanwhile for Project Nationwide Operational Assessment of
Hazards, Light Detection and Ranging (LiDAR) data had been generated
for 29 areas, while 1,091 out of the 1,212 targeted automated rain gauges
(ARGs) and water level monitoring system (WLMS) were established or
installed.
Department of Social Welfare and Development
Financial Performance. With the resolve to protect the poorest and most
vulnerable sectors in society, the 2014 allotment for the DSWD mainly
funded the following social protection programs: a) Pantawid Pamilyang
Pilipino Program (4Ps); b) Supplemental Feeding Program; c) Social
Pension for Indigent Senior Citizens; and d) Sustainable Livelihood
Program. As of year‐end 2014, DSWD incurred a total obligation of P86.1
billion or 83.2 percent of the P103.6 billion in allotments it received during
the year.
Physical Accomplishments. As of 31 December 2014, DSWD was able to
provide monthly cash allowances to 4,478,562 beneficiaries under the CCT
program. The grant of the cash subsidy is contingent upon compliance to
specific health and education requirements such as school attendance and
medical check‐up of school children and pregnant mothers.
The Supplemental Feeding Program, implemented in partnership
with the LGUs, provides hot meals in LGU‐run day care centers and
supports supervised neighborhood play for children 2‐5 years old for 120
days. For 2014, a total of 1.8 million day care children benefited from the
program. However, delays in the submission of liquidation reports by
some LGUs affected the program’s implementation.
The provision of social pension of P500 monthly to indigent senior
citizens, pursuant to the Expanded Senior Citizens Act of 2010 (R.A. 9994),
already covered 452,836 or 95 percent of the targeted beneficiaries aged 77
and above.
Meanwhile, the Sustainable Livelihood Program, which employs a
community‐based capacity building approach, benefited a total of 123,890
families under the micro‐enterprise development track and provided
employment facilitation to another 9,627 families.

2014 YEAR‐END REPORT
Page 42 of 58
Department of Transportation and Communications
Financial Performance. To support DOTC’s mandate to improve land‐based,
air, maritime, and rail transport services, the government released a total
allotment of P58.0 billion in 2014. Of this, only 58.8 percent18 or P34.1
billion was obligated by the Department out of the total P58.0 billion
allotment. It is noteworthy that more than 80 percent of these obligations
were for MOOE and CO. For locally‐funded projects, around P11.1
billion19 was obligated. Big‐ticket items include the acquisition of new
rolling‐stocks for MRT‐3 (P3.8 billion), subsidy for MRT‐3 (P3.7 billion),
and the Integrated Transport System (ITS) – SLEX (FTI) Terminal and
South Coastal Road (PRA) Terminal (P2.1 billion). Meanwhile, P4.7
billion20 was obligated for Foreign‐Assisted Projects, including P3.3 billion
was for Puerto Princesa International Airport Development Project.
Physical Accomplishments. Physical milestones of the projects funded in
2014 include: the on‐going site acquisition for the ITS – SLEX (FTI) and
South Coastal Road (PRA) Terminals; the approval of the designs of the
new rolling‐stocks for the MRT‐3, towards the delivery of the prototype in
2015 and full delivery of rolling stocks by 2016; the obligation of the
subsidy for MRT 3 to Metro Rail Transit Corporation to cover the equity
rental fee; the ongoing implementation of the design‐build contract for the
Puerto Princesa Airport; and the procurement of consultants for the LRT
Line 1 Cavite Extension Project, including the enhancement of the Mass
Transit System in Metro Manila Project.
Commission on Higher Education
Financial Performance. The Commission on Higher Education (CHED)
which is mandated to ensure the promotion of accessible, relevant and
quality higher education in the country, has obligated P5.6 billion or 56.4
percent of its total allotment of P9.8 billion. Bulk of the obligation funded
the Tunong Dunong Scholarship Program and the Student Financial
Assistance Program.
Physical Accomplishments. The Tunong Dunong Scholarship Program, a
grants‐in‐aid program for graduating high school students who are poor
but deserving, benefitted about 330,000 scholars. The low utilization of
funds for this component is attributed to the delay in compliance of the
beneficiaries to documentary requirements, such as certificate of
enrolment and grades from the previous semester.
18 Available allotment includes releases from the current budget, supplemental and continuing appropriations, as well as unobligated allotment as of December 31, 2014. 19 Obligations for agency specific (current) budget only. 20 Obligations for agency specific (current) budget and continuing appropriations only.

2014 YEAR‐END REPORT
Page 43 of 58
The Student Financial Assistance Program, which provides
opportunities for quality higher education through scholarships, grants‐in‐
aid and loan programs, supported 46,656 student beneficiaries, or 91
percent of its target in 2014.
Meanwhile, the Expanded Students’ Grants‐in‐Aid Program, which
provides financial assistance or scholarships through the various SUCs to
poor but deserving students, particularly CCT beneficiaries, supported
34,152 students or 84 percent of the total targeted beneficiaries of 40,453.
Technical Education and Skills Development Authority
Financial Performance. The Technical Education and Skills Development
Authority (TESDA), which is tasked to formulate continuing, coordinated
and integrated technical education and skills development policies and
programs, was able to obligate a total of P5.3 billion or 91.8 percent of its
total allotment of P5.8 billion as of end‐2014. Of the said amount, P2.6
billion supported the Training for Work Scholarship Program (TWSP), the
Private Education Student Financial Assistance (PESFA), and Special
Training for Employment Program (STEP).
Physical Accomplishments. In general, the numbers of target enrollees and
graduates for the programs under the TWSP and PESFA had been
exceeded due to the varying costs of trainings or scholarships being
offered.
Specifically, the TWSP benefitted 175,522 enrollees out of the target
of 163,300 enrollees; while 146,988 TWSP scholars graduated out of the
2014 target of 146,970. The program provides intervention to meet the
need for highly critical skills through incentives and training that will link
to existing jobs for immediate employment for both local and overseas.
In the case of PESFA, which is aimed to provide financial assistance to
marginalized yet deserving students and guarantee immediate employment, the total number of enrollees reached 26,758 out of the 26,667 targetted enrollees. Similarly, 23,945 beneficiaries graduated, beating the target of 24,000 for 2014.
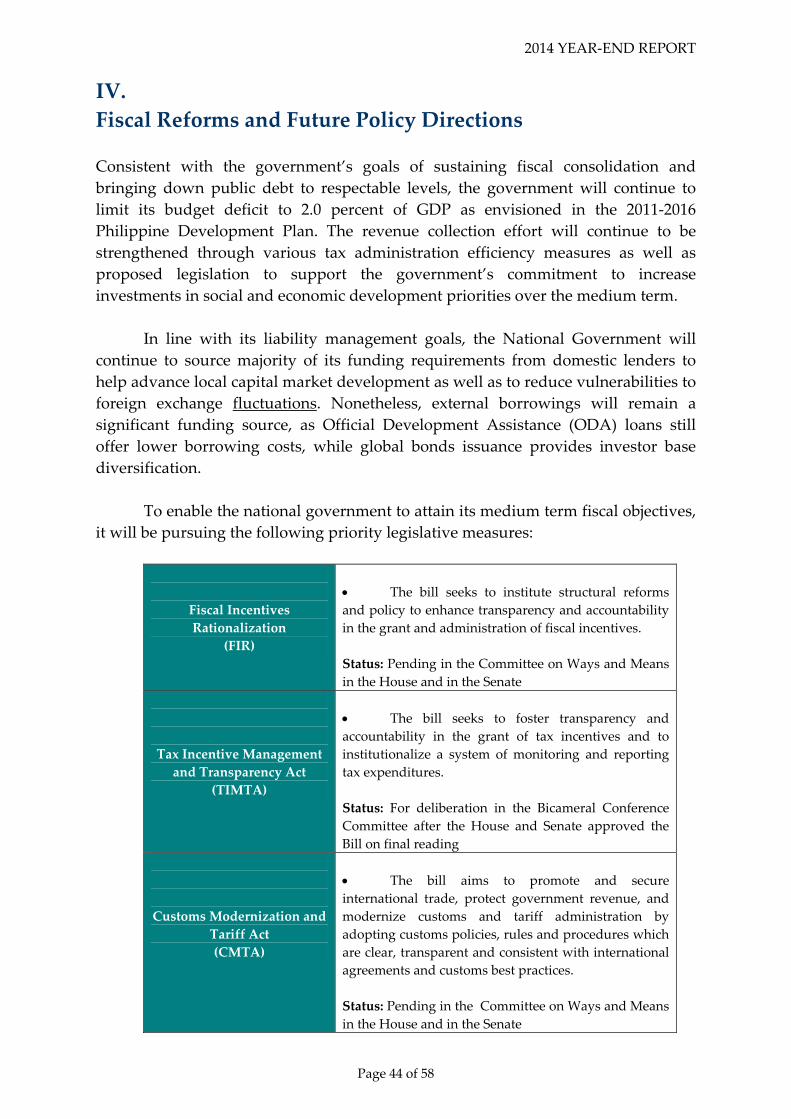
2014 YEAR‐END REPORT
Page 44 of 58
IV.
Fiscal Reforms and Future Policy Directions
Consistent with the government’s goals of sustaining fiscal consolidation and
bringing down public debt to respectable levels, the government will continue to
limit its budget deficit to 2.0 percent of GDP as envisioned in the 2011‐2016
Philippine Development Plan. The revenue collection effort will continue to be
strengthened through various tax administration efficiency measures as well as
proposed legislation to support the government’s commitment to increase
investments in social and economic development priorities over the medium term.
In line with its liability management goals, the National Government will
continue to source majority of its funding requirements from domestic lenders to
help advance local capital market development as well as to reduce vulnerabilities to
foreign exchange fluctuations. Nonetheless, external borrowings will remain a
significant funding source, as Official Development Assistance (ODA) loans still
offer lower borrowing costs, while global bonds issuance provides investor base
diversification.
To enable the national government to attain its medium term fiscal objectives,
it will be pursuing the following priority legislative measures:
Fiscal Incentives
Rationalization
(FIR)
The bill seeks to institute structural reforms
and policy to enhance transparency and accountability
in the grant and administration of fiscal incentives.
Status: Pending in the Committee on Ways and Means
in the House and in the Senate
Tax Incentive Management
and Transparency Act
(TIMTA)
The bill seeks to foster transparency and
accountability in the grant of tax incentives and to
institutionalize a system of monitoring and reporting
tax expenditures.
Status: For deliberation in the Bicameral Conference
Committee after the House and Senate approved the
Bill on final reading
Customs Modernization and
Tariff Act
(CMTA)
The bill aims to promote and secure
international trade, protect government revenue, and
modernize customs and tariff administration by
adopting customs policies, rules and procedures which
are clear, transparent and consistent with international
agreements and customs best practices.
Status: Pending in the Committee on Ways and Means
in the House and in the Senate
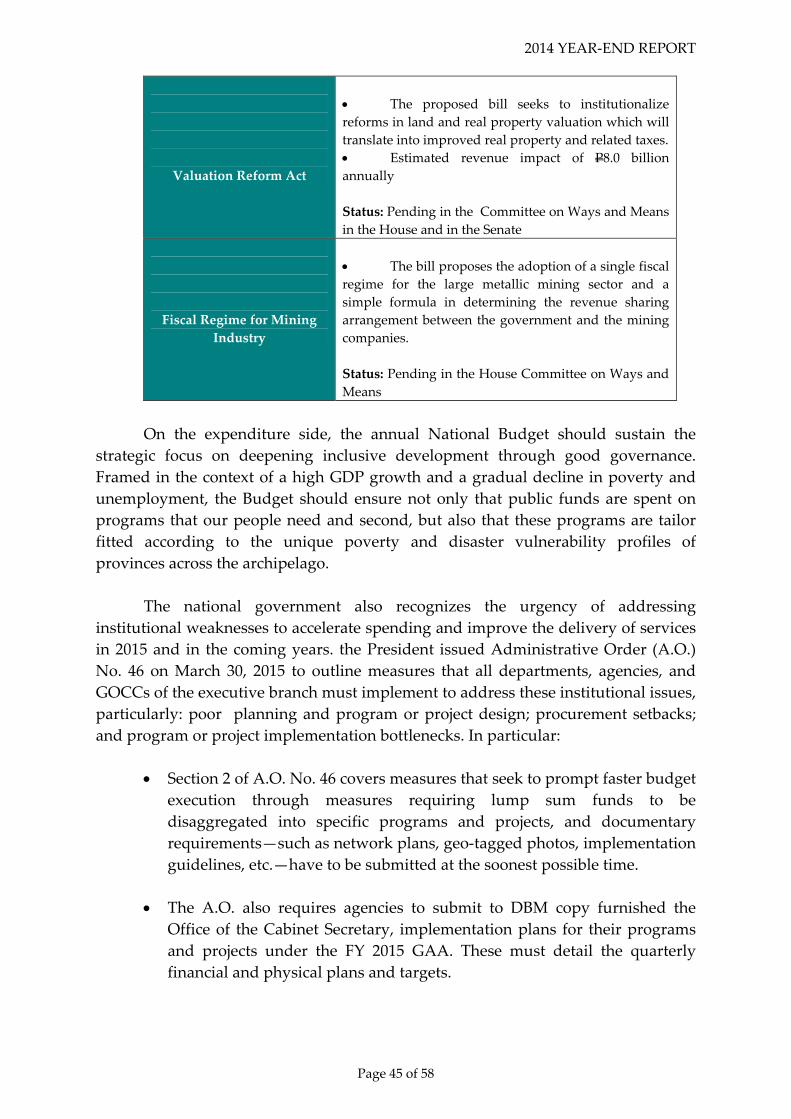
2014 YEAR‐END REPORT
Page 45 of 58
Valuation Reform Act
The proposed bill seeks to institutionalize
reforms in land and real property valuation which will
translate into improved real property and related taxes.
Estimated revenue impact of P8.0 billion
annually
Status: Pending in the Committee on Ways and Means
in the House and in the Senate
Fiscal Regime for Mining
Industry
The bill proposes the adoption of a single fiscal
regime for the large metallic mining sector and a
simple formula in determining the revenue sharing
arrangement between the government and the mining
companies.
Status: Pending in the House Committee on Ways and
Means
On the expenditure side, the annual National Budget should sustain the
strategic focus on deepening inclusive development through good governance.
Framed in the context of a high GDP growth and a gradual decline in poverty and
unemployment, the Budget should ensure not only that public funds are spent on
programs that our people need and second, but also that these programs are tailor
fitted according to the unique poverty and disaster vulnerability profiles of
provinces across the archipelago.
The national government also recognizes the urgency of addressing
institutional weaknesses to accelerate spending and improve the delivery of services
in 2015 and in the coming years. the President issued Administrative Order (A.O.)
No. 46 on March 30, 2015 to outline measures that all departments, agencies, and
GOCCs of the executive branch must implement to address these institutional issues,
particularly: poor planning and program or project design; procurement setbacks;
and program or project implementation bottlenecks. In particular:
Section 2 of A.O. No. 46 covers measures that seek to prompt faster budget
execution through measures requiring lump sum funds to be
disaggregated into specific programs and projects, and documentary
requirements—such as network plans, geo‐tagged photos, implementation
guidelines, etc.—have to be submitted at the soonest possible time.
The A.O. also requires agencies to submit to DBM copy furnished the
Office of the Cabinet Secretary, implementation plans for their programs
and projects under the FY 2015 GAA. These must detail the quarterly
financial and physical plans and targets.

2014 YEAR‐END REPORT
Page 46 of 58
Section 3 of the A.O. aims to address procurement‐related delays and
other issues, by instructing agencies to assign full‐time support staff for
Bids and Awards Committees (BACs) and to coordinate with the DBM to
ensure that the requirements for the creation of more positions and BACs
are immediately provided. To date, 90 additional positions have been
created to support BACs. On June 4, 2015, National Budget Circular No.
2015‐558 or the Guidelines in the Organization and Staffing of
procurement Units was issued. The NBC was issued to guidelines on the
establishment or strengthening of the organizational structure and staffing
of the Procurement Units of agencies and provide adequate support to the
BACs.
To help address program and project implementation issues, Section 4 of
A.O. No. 46 mandates each agency to create a full‐time delivery unit, led
by an Undersecretary and with supporting personnel, who shall monitor
program and project implementation for their agency. This delivery unit
shall ensure the execution and delivery of services according to their
agency’s implementation plan; and by the end of the first quarter, identify
programs and projects with historical trends of low disbursement rates, or
those with anticipated delays.
Other measures to speed up spending and ensure the efficient
implementation of programs and projects include:
To facilitate program or project implementation, assistance is being sought
from the NEDA and the Government Procurement Policy Board (GPPB) to
strengthen the planning capacities of departments and agencies, including
procurement.
The GPPB has also been directed to review the Implementing Rules and
Regulations (IRR) of the Procurement Law and reconsider its provisions
which can be simplified or threshold amounts which can be increased to
facilitate the procurement process without weakening transparency and
accountability mechanisms. The GPPB will likewise continue and
strengthen its procurement training program for national and local
governments, suppliers, and CSOs, particularly in the areas of
procurement planning, market benchmarking, and development of
specifications and costing. Towards this, the GPPB is finalizing its
procurement professionalization courses to be piloted within 2015.
More LGUs will be tapped to advance the implementation of the
programs and projects. Current national government initiatives—such as
the Seal of Good Local Governance, the LGU Public Financial
Management Program, and Bottom‐Up Budgeting—seek to enhance the

2014 YEAR‐END REPORT
Page 47 of 58
financial stewardship and service delivery capacities of LGUs while
incentivizing their adoption of greater fiscal transparency and
participation. Moreover, in order to establish effective partnership and
proper coordination with them, the regional and field offices of
departments and agencies should providing partner‐LGUs with technical
assistance in implementing projects, including better project planning and
fund liquidation. The Philippine Constructors Association (PCA) have also
conveyed their plans to train more architects and engineers to act as
procurement observers in LGUs and to assist LGUs in project planning
and management. Through the composite team of trainers established by
the GPPB, LGUs will continuously be trained on the implementation of the
procurement law, rules and regulations.
While these measures may provide immediate relief to the problem
of underspending, some of the problems and their root causes cited earlier
indicate a more fundamental and basic issue of weak planning‐budgeting‐
implementation continuum both at the implementing agency and
oversight levels. Hence, the government has to invest heavily in systems
and processes which will enable agencies to plan ahead, to address gaps
and deficiencies in their areas, and implement the programs and projects
more efficiently and effectively.
Towards this, the government continues to roll‐out its Public
Financial Management (PFM) Reform program to improve transparency,
accountability and efficiency in budgeting, accounting, cash management
and other financial management systems. One of its components is the
Unified Account Code Structure which will harmonize all government
financial processes—from budgeting, cash management, to accounting
and audit—by prescribing a single accounts classification system. This will
simplify the collection, consolidation, and reporting of financial
transactions across government, which will enable the Commission on
Audit, DBM, and DOF to share a common set of information and, thus,
avoiding unnecessary duplications in reports.
The PFM Reform Program also supports the development of the
Treasury Single Account, which will enable the government to consolidate
its cash resources on a daily basis, provide timely and accurate reports on
the status funds, and thereby manage cash resources and debt more
effectively. Towards establishing a full‐scale Government Integrated
Financial Management Information System—an ICT‐based system which
will harmonize all the financial information systems of oversight and
implementing agencies—the government is currently developing the
Budget and Treasury Management System that will integrate the budget
execution and accountability functions of DBM and DOF‐BTr.

2014 YEAR‐END REPORT
Page 48 of 58
Beyond the development of technology‐based applications, the
PFM Reform Program seeks to establish a cohesive policy framework for
PFM that supports the institutionalization of reforms introduced since
2010. Towards this, a proposed Public Financial Accountability Act has been
drafted and filed in Congress.21
21 As of this writing Senate President Franklin M. Drilon, and Senators Ralph G. Recto and Juan Edgardo M. Angara has filed their respective versions of the proposed Public Financial Accountability Act.

2014 YEAR‐END REPORT
Page 49 of 58
Annex A‐1 REVENUE PROGRAM, BY SOURCE
(In Million Pesos)
Program Actual Difference 2013 2014
TAX REVENUES 1,535,698 1,879,918 1,720,116 (159,802) 13.3 13.6 12.0
Taxes on Net Income and Profits 718,210 877,210 784,859 (92,350) 6.2 6.2 9.3
Taxes on Property 3,552 5,060 5,450 390 0.0 0.0 53.4
Taxes on Domestic Goods and Services 509,010 589,553 560,530 (29,023) 4.4 4.4 10.1
General Sales, Turnover or VAT 250,619 310,672 278,727 (31,945) 2.2 2.2 11.2
Selected Excises on Goods 118,906 128,195 135,315 7,120 1.0 1.1 13.8
Selected Taxes on Services 59,921 66,709 55,881 (10,828) 0.5 0.4 (6.7)
Taxes on the Use of Goods or Property
or Permission to Perform Activities 574 721 592 (129) 0.0 0.0 3.2
Other Existing Taxes 78,990 83,256 90,015 6,759 0.7 0.7 14.0
Taxes on International Trade and Transactions 304,925 408,096 369,277 (38,819) 2.6 2.9 21.1
NON-TAX REVENUES 177,459 136,133 186,465 50,332 1.5 1.5 5.1
Fees and Charges 30,541 32,871 32,771 (100) 0.3 0.3 7.3
Income from Treasury Operations 47,466 35,622 53,390 17,768 0.4 0.4 12.5
Interest Income on NG Deposits 3,432 2,178 3,159 981 0.0 0.0 (8.0)
Interest on Advances to GOCCs 190 750 142 (608) 0.0 0.0 (25.3)
Income from BSF/SSF 37,201 26,563 41,920 15,357 0.3 0.3 12.7
Guarantee Fee 2,245 3,600 3,120 (480) 0.0 0.0 39.0
Government Services 4,398 2,531 1,577 (954) 0.0 0.0 (64.1)
Foreign Exchange Risk Cover Fee 1,492 1,650 3,472 1,822 0.0 0.0 132.7 Fidelity Bond Premia 650 230 675 445 0.0 0.0 3.8 Subscription Fee - RoSS Participants 9 11 10 (1) 0.0 0.0 11.1 Escheat of Unclaimed Balances 29 20 140 120 0.0 0.0 382.8 Service Fee on Relent Loans 2,165 620 2,597 1,977 0.0 0.0 20.0 Other Miscellaneous Income 53 - 50 50 0.0 0.0 (5.7)
NG Income Collected by BTr 33,547 20,615 40,054 19,439 0.3 0.3 19.4
Dividends on Shares of Stocks 18,903 5,500 24,374 18,874 0.2 0.2 28.9
NG Share in Airport Terminal Fee 481 465 555 90 0.0 0.0 15.4
NG Share in PAGCOR Income 13,039 14,000 14,021 21 0.1 0.1 7.5
NG Share in MIAA Profit 1,124 650 1,104 454 0.0 0.0 (1.8)
Other Existing Non-Tax Revenues 65,584 47,025 60,017 12,992 0.6 0.5 (8.5)
Foreign Grants 321 - 233 233 0.0 0.0 (27.4)
PRIVATIZATION 2,936 2,000 1,946 (54) 0.0 0.0 (33.7)
TOTAL REVENUES 1,716,093 2,018,051 1,908,527 (109,524) 14.9 15.1 11.2
Memo item:Nominal GDP 11,548,191 12,642,736
Source: FY 2015 and FY 2016 BESF
2014 percent of GDPGrowthParticulars
2013Actual

2014 YEAR‐END REPORT
Page 50 of 58
Annex A‐2 TAX REVENUE PROGRAM, BY COLLECTING DEPARTMENT/AGENCY, BY SOURCE, 2013 - 2014(In Million Pesos)
Program Actual
DEPARTMENT OF ENVIRONMENT AND NATURAL RESOURCES 132 141 133
Office of the Secretary 132 141 133
Taxes on Domestic Goods and ServicesOther Taxes
Forest Charges 132 141 133
DEPARTMENT OF FINANCE 1,521,586 1,864,416 1,704,039
Bureau of Customs 304,925 408,096 369,277
Taxes on International Trade and Transactions 304,925 408,096 369,277 Import Duties and Taxes 35,341 60,835 56,279 VAT on Imports 239,831 319,703 279,114 Other Collections (Excise) 29,753 27,558 33,885
Bureau of Internal Revenue 1,216,661 1,456,320 1,334,762
Taxes on Net Income and Profits 718,210 877,210 784,859 Individual 252,610 309,898 283,651
Of which: Capital Gains Tax 11,128 11,330 Company, Corporate and Enterprises 418,453 506,420 455,139 Tax on Treasury Bills 33,982 46,014 46,069 Commercial Paper - 4 Bank Deposits 13,166 14,874
Taxes on Property 3,552 5,060 5,450 Property Transfer Tax 3,552 5,060 5,450
Taxes on Domestic Goods and Services 494,898 575,050 544,453
General Sales, Turnover or VAT 1/ 250,619 311,672 278,727
Selective Excises on Goods 118,906 128,195 135,315 Alcohol Products 33,549 38,215 37,525 Tobacco Products 71,620 72,119 82,336 Fuel and Oils 8,505 12,270 9,419 Mining 2,516 2,813 3,203 Other Miscellaneous 2,716 2,778 2,832
Selective Taxes on Services 59,921 66,709 55,881 Other Percentage Taxes 30,055 34,355 28,769 Banks/Financial Institutions 29,278 31,526 25,485 Insurance Premiums 149 173 1,184 Amusements 439 655 445
Taxes on the Use of Goods or Property or Permission to Perform Activities 574 721 592
Franchise Taxes 574 721 592
Documentary Stamp Tax 59,867 62,041 69,017
Particulars2013
Actual2014

2014 YEAR‐END REPORT
Page 51 of 58
Other Taxes 5,011 5,712 4,921 Miscellaneous 5,011 5,712 4,921
Tax Refunds Other than VAT Refunds - (1,000) -
DEPARTMENT OF THE INTERIOR AND LOCAL GOVERNMENT 1,018 1,120 1,129
Bureau of Fire Protection 1,018 1,120 1,129
Taxes on Domestic Goods and ServicesOther Taxes
Fire Code Tax 1,018 1,120 1,129
DEPARTMENT OF JUSTICE 69 73 72
Bureau of Immigration 69 73 72
Taxes on Domestic Goods and ServicesOther Taxes
Immigration Tax 69 73 72
DEPARTMENT OF TRANSPORTATION AND COMMUNICATIONS 11,008 12,161 12,916
Office of the Secretary 11,008 12,161 12,916
Land Transportation Office 11,008 12,161 12,916
Taxes on Domestic Goods and Services12,916
Motor Vehicle Tax 11,008 12,161
OTHER EXECUTIVE OFFICES 1,885 2,008 1,827
Commission on Higher Education 1,626 1,732 1,542
Other Taxes 1,626 1,732 1,542
National Commission for Culture and the Arts 259 276 285
Other Taxes 259 276 285
TOTAL TAX REVENUES 1,535,698 1,879,918 1,720,116
Source: Department of FinanceNumbers may not add up due to rounding.

2014 YEAR‐END REPORT
Page 52 of 58
Annex B‐1 FY 2014 BUDGET TRACKING, BY DEPARTMENT/SPECIAL PURPOSE
(In Thousand Pesos)
TOTAL TOTAL TOTAL TOTAL TOTAL TOTAL TOTAL TOTAL TOTAL TOTAL
DEPARTMENTSCONGRESS 10,347,533 - 10,347,533 10,347,533 10,021,592 (12,000) 10,009,592 - 10,021,592 10,742,423 Senate 3,097,837 - 3,097,837 3,097,837 2,998,240 - 2,998,240 - 2,998,240 3,344,359 SET 132,444 - 132,444 132,444 126,684 (12,000) 114,684 - 126,684 87,052 CA 513,369 - 513,369 513,369 501,105 - 501,105 - 501,105 538,449 HOR 6,450,000 - 6,450,000 6,450,000 6,247,579 - 6,247,579 - 6,247,579 6,624,579 HET 153,883 - 153,883 153,883 147,984 - 147,984 - 147,984 147,984
OP 2,822,967 - 2,822,967 2,822,967 2,790,665 - 2,790,665 - 2,790,665 2,790,665 The Pres. Off 2,822,967 - 2,822,967 2,822,967 2,790,665 - 2,790,665 - 2,790,665 2,790,665
OVP 421,248 (200,000) 221,248 221,248 217,296 - 217,296 - 217,296 217,296 OVP 421,248 (200,000) 221,248 221,248 217,296 - 217,296 - 217,296 217,296
DAR 20,383,752 - 20,383,752 20,383,752 20,002,768 - 20,002,768 - 20,002,768 20,002,768 OSEC 20,383,752 - 20,383,752 20,383,752 20,002,768 - 20,002,768 - 20,002,768 20,002,768
DA 70,992,865 (897,116) 70,095,749 70,095,749 68,576,751 20,000 68,596,751 - 68,576,751 68,596,751 OSEC 64,259,264 (897,116) 63,362,148 63,362,148 62,135,559 20,000 62,155,559 - 62,135,559 62,155,559 ACPC 55,898 - 55,898 55,898 53,869 - 53,869 - 53,869 53,869 BFAR 4,915,126 - 4,915,126 4,915,126 4,877,724 - 4,877,724 - 4,877,724 4,877,724 CODA 61,939 - 61,939 61,939 57,336 - 57,336 - 57,336 57,336 FPA 57,438 - 57,438 57,438 54,815 - 54,815 - 54,815 54,815 FIDA 242,858 - 242,858 242,858 228,464 - 228,464 - 228,464 228,464 LDC 43,779 - 43,779 43,779 42,914 - 42,914 - 42,914 42,914 NAFC 299,688 - 299,688 299,688 155,797 - 155,797 - 155,797 155,797 NMIS 374,537 - 374,537 374,537 300,226 - 300,226 - 300,226 300,226 PCC 481,356 - 481,356 481,356 474,494 - 474,494 - 474,494 474,494 PCPHDM (BUPHIRE) 200,982 - 200,982 200,982 195,553 - 195,553 - 195,553 195,553
DBM 1,033,159 - 1,033,159 1,033,159 997,494 - 997,494 - 997,494 997,494 OSEC 999,425 - 999,425 999,425 963,760 - 963,760 - 963,760 963,760 GPPB-TSO 33,734 - 33,734 33,734 33,734 - 33,734 - 33,734 33,734
DepEd 300,546,665 - 300,546,665 300,546,665 281,751,791 1,000 281,752,791 - 281,751,791 281,774,247 OSEC 299,007,716 - 299,007,716 299,007,716 280,702,764 - 280,702,764 - 280,702,764 280,724,220 NBDB 25,180 - 25,180 25,180 24,179 - 24,179 - 24,179 24,179 NCCT 14,159 - 14,159 14,159 13,941 - 13,941 - 13,941 13,941 NM 955,290 - 955,290 955,290 947,719 1,000 948,719 - 947,719 948,719 ECCDC 479,985 479,985 479,985 - - - - - PHSA 64,335 - 64,335 64,335 63,188 - 63,188 - 63,188 63,188
- - SUCS 36,790,888 - 36,790,888 36,790,888 34,650,625 27,000 34,677,625 - 34,650,625 35,934,625
DOE 4,051,016 - 4,051,016 4,051,016 3,259,376 40,000 3,299,376 - 3,259,376 3,299,376 OSEC 4,051,016 - 4,051,016 4,051,016 3,259,376 40,000 3,299,376 - 3,259,376 3,299,376
DENR 23,908,498 10 23,908,508 23,908,508 23,359,621 (14,000) 23,345,621 - 23,359,621 23,345,621 OSEC 20,237,609 10 20,237,619 20,237,619 19,833,662 (68,000) 19,765,662 - 19,833,662 19,769,662 EMB 1,311,114 - 1,311,114 1,311,114 1,254,315 52,000 1,306,315 - 1,254,315 1,304,315 MGB 1,189,784 - 1,189,784 1,189,784 1,126,184 2,000 1,128,184 - 1,126,184 1,126,184 NAMRIA 1,028,907 - 1,028,907 1,028,907 1,011,001 - 1,011,001 - 1,011,001 1,011,001 NWRB 68,246 - 68,246 68,246 64,747 - 64,747 - 64,747 64,747 PCSDS 72,838 - 72,838 72,838 69,712 - 69,712 - 69,712 69,712
DOF 12,704,414 164,847 12,869,261 12,869,261 11,387,941 500,000 11,887,941 0 11,387,941 11,524,941 OSEC 456,086 - 456,086 456,086 438,758 500,000 938,758 - 438,758 438,758 BOC 2,368,296 - 2,368,296 2,368,296 1,939,435 - 1,939,435 - 1,939,435 1,939,435 BIR 7,703,335 - 7,703,335 7,703,335 6,952,251 - 6,952,251 - 6,952,251 6,952,251 BLGF 200,623 - 200,623 200,623 188,829 - 188,829 - 188,829 188,829 BTR 1,081,401 - 1,081,401 1,081,401 1,049,002 - 1,049,002 - 1,049,002 1,049,002 CBAA 10,528 - 10,528 10,528 9,755 - 9,755 - 9,755 9,755 CDA 341,354 - 341,354 341,354 320,006 - 320,006 - 320,006 320,006 IC 199,304 - 199,304 199,304 7 - 7 - 7 7 NTRC 46,715 - 46,715 46,715 43,776 - 43,776 - 43,776 43,776 PMO 42,442 - 42,442 42,442 42,442 - 42,442 - 42,442 42,442 SEC 254,330 164,847 419,177 419,177 403,680 - 403,680 - 403,680 540,680
DFA 12,210,927 - 12,210,927 12,210,927 12,113,738 17,000 12,130,738 - 12,113,738 12,130,738 OSEC 12,143,568 - 12,143,568 12,143,568 12,049,500 17,000 12,066,500 - 12,049,500 12,066,500 FSI 46,667 - 46,667 46,667 43,944 - 43,944 - 43,944 43,944 TCCP 4,408 - 4,408 4,408 4,338 - 4,338 - 4,338 4,338 UNESCO 16,284 - 16,284 16,284 15,956 - 15,956 - 15,956 15,956
DOH 81,641,808 4,316,627 85,958,435 85,958,435 85,123,939 (592,950) 84,530,989 (1,200,000) 83,923,939 84,356,933 OSEC 80,993,481 4,316,627 85,310,108 85,310,108 84,487,927 (592,950) 83,894,977 (1,200,000) 83,287,927 83,720,921 POPCOM 308,402 - 308,402 308,402 299,814 - 299,814 - 299,814 299,814 NNC 339,925 - 339,925 339,925 336,198 - 336,198 - 336,198 336,198
DILG 100,765,055 587,966 101,353,021 101,353,021 100,183,030 12,400 100,195,430 2,600,000 102,783,030 100,295,430 OSEC 9,725,997 587,966 10,313,963 10,313,963 10,127,472 5,000 10,132,472 2,600,000 12,727,472 10,132,472 BFP 9,536,529 - 9,536,529 9,536,529 8,725,325 - 8,725,325 - 8,725,325 8,725,325 BJMP 6,273,467 - 6,273,467 6,273,467 6,270,665 - 6,270,665 - 6,270,665 6,270,665 LGA 151,565 - 151,565 151,565 149,856 - 149,856 - 149,856 149,856 NAPOLCOM 1,462,583 - 1,462,583 1,462,583 1,422,618 - 1,422,618 - 1,422,618 1,422,618 PNP 72,064,540 - 72,064,540 72,064,540 71,945,660 7,400 71,953,060 - 71,945,660 72,053,060 PPSC 1,550,374 - 1,550,374 1,550,374 1,541,434 - 1,541,434 - 1,541,434 1,541,434
DOJ 11,591,057 - 11,591,057 11,591,057 10,693,658 121,000 10,814,658 282,000 10,975,658 10,903,778 OSEC 3,598,282 - 3,598,282 3,598,282 3,356,476 111,000 3,467,476 282,000 3,638,476 3,467,476 BC 1,941,214 - 1,941,214 1,941,214 1,885,351 - 1,885,351 - 1,885,351 1,885,351 BI 636,054 - 636,054 636,054 601,157 10,000 611,157 - 601,157 650,677 LRA 1,241,981 - 1,241,981 1,241,981 888,452 - 888,452 - 888,452 888,452 NBI 996,640 - 996,640 996,640 939,277 - 939,277 - 939,277 978,277 OGCC 94,239 - 94,239 94,239 89,559 - 89,559 - 89,559 89,559 OSG 520,641 - 520,641 520,641 488,803 - 488,803 - 488,803 499,403 PPA 557,264 - 557,264 557,264 516,599 - 516,599 - 516,599 516,599 PCGG 106,450 - 106,450 106,450 102,111 - 102,111 - 102,111 102,111 PAO 1,898,292 - 1,898,292 1,898,292 1,825,873 - 1,825,873 - 1,825,873 1,825,873
DOLE 10,511,384 3,291,240 13,802,624 13,802,624 13,423,273 (1,096,000) 12,327,273 (1,200,000) 12,223,273 12,177,273 OSEC 3,701,024 2,272,000 5,973,024 5,973,024 5,803,819 (1,100,000) 4,703,819 (1,200,000) 4,603,819 4,553,819 ILS 28,692 - 28,692 28,692 26,937 - 26,937 - 26,937 26,937 NCMB 193,271 (2,760) 190,511 190,511 180,880 - 180,880 - 180,880 180,880 NLRC 699,422 - 699,422 699,422 665,524 - 665,524 - 665,524 665,524 NMP 76,900 - 76,900 76,900 74,284 - 74,284 - 74,284 74,284 NWPC 172,577 - 172,577 172,577 165,203 - 165,203 - 165,203 165,203 POEA 351,098 - 351,098 351,098 334,555 - 334,555 - 334,555 334,555 PRC 1,069,322 - 1,069,322 1,069,322 1,058,879 - 1,058,879 - 1,058,879 1,058,879 TESDA 4,219,078 1,022,000 5,241,078 5,241,078 5,113,192 4,000 5,117,192 - 5,113,192 5,117,192
H.B. 2630 Inclusive of Auto
H.B. 2630 AMENDMENT-SENATE SENATE AMENDMENT-DBM GAB with DBM
Amendment GAA (RA 10633)
PARTICULARS FY 2014 NEP ERRATA
NEP (Inclusive of ERRATA)
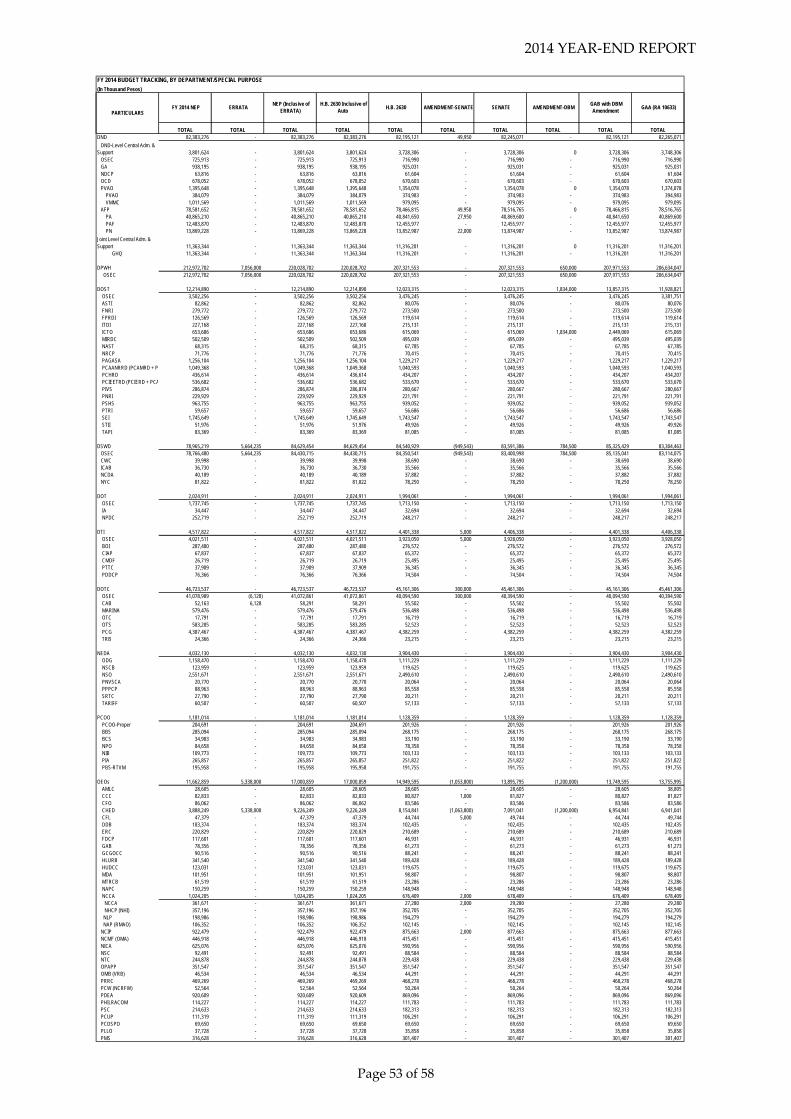
2014 YEAR‐END REPORT
Page 53 of 58
FY 2014 BUDGET TRACKING, BY DEPARTMENT/SPECIAL PURPOSE
(In Thousand Pesos)
TOTAL TOTAL TOTAL TOTAL TOTAL TOTAL TOTAL TOTAL TOTAL TOTALDND 82,383,276 - 82,383,276 82,383,276 82,195,121 49,950 82,245,071 - 82,195,121 82,265,071
DND-Level Central Adm. & Support 3,801,624 - 3,801,624 3,801,624 3,728,306 - 3,728,306 0 3,728,306 3,748,306 OSEC 725,913 - 725,913 725,913 716,990 - 716,990 - 716,990 716,990 GA 938,195 - 938,195 938,195 925,031 - 925,031 - 925,031 925,031 NDCP 63,816 - 63,816 63,816 61,604 - 61,604 - 61,604 61,604 OCD 678,052 - 678,052 678,052 670,603 - 670,603 - 670,603 670,603 PVAO 1,395,648 - 1,395,648 1,395,648 1,354,078 - 1,354,078 0 1,354,078 1,374,078 PVAO 384,079 - 384,079 384,079 374,983 - 374,983 - 374,983 394,983 VMMC 1,011,569 - 1,011,569 1,011,569 979,095 - 979,095 - 979,095 979,095 AFP 78,581,652 - 78,581,652 78,581,652 78,466,815 49,950 78,516,765 0 78,466,815 78,516,765 PA 40,865,210 - 40,865,210 40,865,210 40,841,650 27,950 40,869,600 - 40,841,650 40,869,600 PAF 12,483,870 - 12,483,870 12,483,870 12,455,977 - 12,455,977 - 12,455,977 12,455,977 PN 13,869,228 - 13,869,228 13,869,228 13,852,987 22,000 13,874,987 - 13,852,987 13,874,987
Joint Level Central Adm. & Support 11,363,344 - 11,363,344 11,363,344 11,316,201 - 11,316,201 0 11,316,201 11,316,201 GHQ 11,363,344 - 11,363,344 11,363,344 11,316,201 - 11,316,201 - 11,316,201 11,316,201
DPWH 212,972,702 7,056,000 220,028,702 220,028,702 207,321,553 - 207,321,553 650,000 207,971,553 206,634,047 OSEC 212,972,702 7,056,000 220,028,702 220,028,702 207,321,553 - 207,321,553 650,000 207,971,553 206,634,047
DOST 12,214,890 - 12,214,890 12,214,890 12,023,315 - 12,023,315 1,834,000 13,857,315 11,928,821 OSEC 3,502,256 - 3,502,256 3,502,256 3,476,245 - 3,476,245 - 3,476,245 3,381,751 ASTI 82,862 - 82,862 82,862 80,076 - 80,076 - 80,076 80,076 FNRI 279,772 - 279,772 279,772 273,500 - 273,500 - 273,500 273,500 FPRDI 126,569 - 126,569 126,569 119,614 - 119,614 - 119,614 119,614 ITDI 227,168 - 227,168 227,168 215,131 - 215,131 - 215,131 215,131 ICTO 653,686 - 653,686 653,686 615,069 - 615,069 1,834,000 2,449,069 615,069 MIRDC 502,509 - 502,509 502,509 495,039 - 495,039 - 495,039 495,039 NAST 68,315 - 68,315 68,315 67,785 - 67,785 - 67,785 67,785 NRCP 71,776 - 71,776 71,776 70,415 - 70,415 - 70,415 70,415 PAGASA 1,256,104 - 1,256,104 1,256,104 1,229,217 - 1,229,217 - 1,229,217 1,229,217 PCAANRRD (PCAMRD + PC 1,049,368 - 1,049,368 1,049,368 1,040,593 - 1,040,593 - 1,040,593 1,040,593 PCHRD 436,614 - 436,614 436,614 434,207 - 434,207 - 434,207 434,207 PCIEETRD (PCIERD + PCA 536,682 - 536,682 536,682 533,670 - 533,670 - 533,670 533,670 PIVS 286,874 - 286,874 286,874 280,667 - 280,667 - 280,667 280,667 PNRI 229,929 - 229,929 229,929 221,791 - 221,791 - 221,791 221,791 PSHS 963,755 - 963,755 963,755 939,052 - 939,052 - 939,052 939,052 PTRI 59,657 - 59,657 59,657 56,686 - 56,686 - 56,686 56,686 SEI 1,745,649 - 1,745,649 1,745,649 1,743,547 - 1,743,547 - 1,743,547 1,743,547 STII 51,976 - 51,976 51,976 49,926 - 49,926 - 49,926 49,926 TAPI 83,369 - 83,369 83,369 81,085 - 81,085 - 81,085 81,085
DSWD 78,965,219 5,664,235 84,629,454 84,629,454 84,540,929 (949,543) 83,591,386 784,500 85,325,429 83,304,463 OSEC 78,766,480 5,664,235 84,430,715 84,430,715 84,350,541 (949,543) 83,400,998 784,500 85,135,041 83,114,075 CWC 39,998 - 39,998 39,998 38,690 - 38,690 - 38,690 38,690 ICAB 36,730 - 36,730 36,730 35,566 - 35,566 - 35,566 35,566 NCDA 40,189 - 40,189 40,189 37,882 - 37,882 - 37,882 37,882 NYC 81,822 - 81,822 81,822 78,250 - 78,250 - 78,250 78,250
DOT 2,024,911 - 2,024,911 2,024,911 1,994,061 - 1,994,061 - 1,994,061 1,994,061 OSEC 1,737,745 - 1,737,745 1,737,745 1,713,150 - 1,713,150 - 1,713,150 1,713,150 IA 34,447 - 34,447 34,447 32,694 - 32,694 - 32,694 32,694 NPDC 252,719 - 252,719 252,719 248,217 - 248,217 - 248,217 248,217
DTI 4,517,822 - 4,517,822 4,517,822 4,401,338 5,000 4,406,338 - 4,401,338 4,406,338 OSEC 4,021,511 - 4,021,511 4,021,511 3,923,050 5,000 3,928,050 - 3,923,050 3,928,050 BOI 287,480 - 287,480 287,480 276,572 - 276,572 - 276,572 276,572 CIAP 67,837 - 67,837 67,837 65,372 - 65,372 - 65,372 65,372 CMDF 26,719 - 26,719 26,719 25,495 - 25,495 - 25,495 25,495 PTTC 37,909 - 37,909 37,909 36,345 - 36,345 - 36,345 36,345 PDDCP 76,366 - 76,366 76,366 74,504 - 74,504 - 74,504 74,504
DOTC 46,723,537 - 46,723,537 46,723,537 45,161,306 300,000 45,461,306 - 45,161,306 45,461,306 OSEC 41,078,989 (6,128) 41,072,861 41,072,861 40,094,590 300,000 40,394,590 - 40,094,590 40,394,590 CAB 52,163 6,128 58,291 58,291 55,502 - 55,502 - 55,502 55,502 MARINA 579,476 - 579,476 579,476 536,498 - 536,498 - 536,498 536,498 OTC 17,791 - 17,791 17,791 16,719 - 16,719 - 16,719 16,719 OTS 583,285 - 583,285 583,285 52,523 - 52,523 - 52,523 52,523 PCG 4,387,467 - 4,387,467 4,387,467 4,382,259 - 4,382,259 - 4,382,259 4,382,259 TRB 24,366 - 24,366 24,366 23,215 - 23,215 - 23,215 23,215
NEDA 4,032,130 - 4,032,130 4,032,130 3,904,430 - 3,904,430 - 3,904,430 3,904,430 ODG 1,158,470 - 1,158,470 1,158,470 1,111,229 - 1,111,229 - 1,111,229 1,111,229 NSCB 123,959 - 123,959 123,959 119,625 - 119,625 - 119,625 119,625 NSO 2,551,671 - 2,551,671 2,551,671 2,490,610 - 2,490,610 - 2,490,610 2,490,610 PNVSCA 20,770 - 20,770 20,770 20,064 - 20,064 - 20,064 20,064 PPPCP 88,963 - 88,963 88,963 85,558 - 85,558 - 85,558 85,558 SRTC 27,790 - 27,790 27,790 20,211 - 20,211 - 20,211 20,211 TARIFF 60,507 - 60,507 60,507 57,133 - 57,133 - 57,133 57,133
PCOO 1,181,014 - 1,181,014 1,181,014 1,128,359 - 1,128,359 - 1,128,359 1,128,359 PCOO-Proper 204,691 - 204,691 204,691 201,926 - 201,926 - 201,926 201,926 BBS 285,094 - 285,094 285,094 268,175 - 268,175 - 268,175 268,175 BCS 34,983 - 34,983 34,983 33,190 - 33,190 - 33,190 33,190 NPO 84,658 - 84,658 84,658 78,358 - 78,358 - 78,358 78,358 NIB 109,773 - 109,773 109,773 103,133 - 103,133 - 103,133 103,133 PIA 265,857 - 265,857 265,857 251,822 - 251,822 - 251,822 251,822 PBS-RTVM 195,958 - 195,958 195,958 191,755 - 191,755 - 191,755 191,755
OEOs 11,662,859 5,338,000 17,000,859 17,000,859 14,949,595 (1,053,800) 13,895,795 (1,200,000) 13,749,595 13,755,995 AMLC 28,605 - 28,605 28,605 28,605 - 28,605 - 28,605 38,805 CCC 82,833 - 82,833 82,833 80,827 1,000 81,827 - 80,827 81,827 CFO 86,062 - 86,062 86,062 83,586 - 83,586 - 83,586 83,586 CHED 3,888,249 5,338,000 9,226,249 9,226,249 8,154,841 (1,063,800) 7,091,041 (1,200,000) 6,954,841 6,941,041 CFL 47,379 - 47,379 47,379 44,744 5,000 49,744 - 44,744 49,744 DDB 183,374 - 183,374 183,374 102,435 - 102,435 - 102,435 102,435 ERC 220,829 - 220,829 220,829 210,689 - 210,689 - 210,689 210,689 FDCP 117,601 - 117,601 117,601 46,931 - 46,931 - 46,931 46,931 GAB 78,356 - 78,356 78,356 61,273 - 61,273 - 61,273 61,273 GCGOCC 90,516 - 90,516 90,516 88,241 - 88,241 - 88,241 88,241 HLURB 341,540 - 341,540 341,540 189,428 - 189,428 - 189,428 189,428 HUDCC 123,031 - 123,031 123,031 119,675 - 119,675 - 119,675 119,675 MDA 101,951 - 101,951 101,951 98,807 - 98,807 - 98,807 98,807 MTRCB 61,519 - 61,519 61,519 23,286 - 23,286 - 23,286 23,286 NAPC 150,259 - 150,259 150,259 148,948 - 148,948 - 148,948 148,948 NCCA 1,024,205 - 1,024,205 1,024,205 676,409 2,000 678,409 - 676,409 678,409 NCCA 361,671 - 361,671 361,671 27,280 2,000 29,280 - 27,280 29,280 NHCP (NHI) 357,196 - 357,196 357,196 352,705 - 352,705 - 352,705 352,705 NLP 198,986 - 198,986 198,986 194,279 - 194,279 - 194,279 194,279 NAP (RMAO) 106,352 - 106,352 106,352 102,145 - 102,145 - 102,145 102,145 NCIP 922,479 - 922,479 922,479 875,663 2,000 877,663 - 875,663 877,663 NCMF (OMA) 446,918 - 446,918 446,918 415,451 - 415,451 - 415,451 415,451 NICA 625,076 - 625,076 625,076 590,956 - 590,956 - 590,956 590,956 NSC 92,491 - 92,491 92,491 88,584 - 88,584 - 88,584 88,584 NTC 244,878 - 244,878 244,878 229,438 - 229,438 - 229,438 229,438 OPAPP 351,547 - 351,547 351,547 351,547 - 351,547 - 351,547 351,547 OMB (VRB) 46,534 - 46,534 46,534 44,291 - 44,291 - 44,291 44,291 PRRC 469,269 - 469,269 469,269 468,278 - 468,278 - 468,278 468,278 PCW (NCRFW) 52,564 - 52,564 52,564 50,264 - 50,264 - 50,264 50,264 PDEA 920,609 - 920,609 920,609 869,096 - 869,096 - 869,096 869,096 PHILRACOM 114,227 - 114,227 114,227 111,783 - 111,783 - 111,783 111,783 PSC 214,633 - 214,633 214,633 182,313 - 182,313 - 182,313 182,313 PCUP 111,319 - 111,319 111,319 106,291 - 106,291 - 106,291 106,291 PCDSPO 69,650 - 69,650 69,650 69,650 - 69,650 - 69,650 69,650 PLLO 37,728 - 37,728 37,728 35,858 - 35,858 - 35,858 35,858 PMS 316,628 - 316,628 316,628 301,407 - 301,407 - 301,407 301,407
H.B. 2630 Inclusive of Auto
H.B. 2630 AMENDMENT-SENATE SENATE AMENDMENT-DBM GAB with DBM
Amendment GAA (RA 10633)
PARTICULARS FY 2014 NEP ERRATA
NEP (Inclusive of ERRATA)

2014 YEAR‐END REPORT
Page 54 of 58
FY 2014 BUDGET TRACKING, BY DEPARTMENT/SPECIAL PURPOSE
(In Thousand Pesos)
TOTAL TOTAL TOTAL TOTAL TOTAL TOTAL TOTAL TOTAL TOTAL TOTAL
AR 20,525,939 - 20,525,939 20,525,939 19,615,029 - 19,615,029 - 19,615,029 19,615,029 ARMM 20,525,939 - 20,525,939 20,525,939 19,615,029 - 19,615,029 - 19,615,029 19,615,029
JLEC 4,167 - 4,167 4,167 4,167 - 4,167 - 4,167 4,167 LEDAC 4,167 - 4,167 4,167 4,167 - 4,167 - 4,167 4,167
JUDICIARY 19,244,825 - 19,244,825 19,244,825 18,462,816 - 18,462,816 - 18,462,816 18,559,816 SCPLC 17,101,528 - 17,101,528 17,101,528 16,407,654 - 16,407,654 - 16,407,654 16,407,654 PET 91,174 - 91,174 91,174 88,023 - 88,023 - 88,023 88,023 SB 404,992 - 404,992 404,992 393,410 - 393,410 - 393,410 393,410 CA 1,391,963 - 1,391,963 1,391,963 1,329,129 - 1,329,129 - 1,329,129 1,426,129 CTA 255,168 - 255,168 255,168 244,600 - 244,600 - 244,600 244,600
CSC 1,274,030 - 1,274,030 1,274,030 1,213,353 - 1,213,353 - 1,213,353 1,213,353 CSC 1,195,766 - 1,195,766 1,195,766 1,137,290 - 1,137,290 - 1,137,290 1,137,290 CESB 78,264 - 78,264 78,264 76,063 - 76,063 - 76,063 76,063
COA 8,427,013 - 8,427,013 8,427,013 7,969,497 - 7,969,497 - 7,969,497 7,969,497 COA 8,427,013 - 8,427,013 8,427,013 7,969,497 - 7,969,497 - 7,969,497 7,969,497
COMELEC 2,885,984 - 2,885,984 2,885,984 2,735,321 - 2,735,321 - 2,735,321 2,735,321 COMELEC 2,885,984 - 2,885,984 2,885,984 2,735,321 - 2,735,321 - 2,735,321 2,735,321
OMBUDSMAN 1,794,019 - 1,794,019 1,794,019 1,732,334 - 1,732,334 - 1,732,334 1,732,334 OMB 1,794,019 - 1,794,019 1,794,019 1,732,334 - 1,732,334 - 1,732,334 1,732,334
CHR 347,800 - 347,800 347,800 326,923 - 326,923 - 326,923 326,923 CHR 347,800 - 347,800 347,800 326,923 - 326,923 - 326,923 326,923
Sub-Total, Departments 1,211,905,373 25,321,809 1,237,227,182 1,237,227,182 1,188,233,005 (2,624,943) 1,185,608,062 2,550,500 1,190,783,505 1,186,029,690
SPFsBSGC 46,696,697 - 46,696,697 46,696,697 45,710,497 (779,039) 44,931,458 1,512,000 47,222,497 46,255,210
ALGU 19,707,094 (527,803) 19,179,291 19,179,291 19,177,219 206,624 19,383,843 62,103 19,239,322 19,588,843 Spec. Shares 16,602,482 - 16,602,482 16,602,482 16,602,482 - 16,602,482 - 16,602,482 16,602,482 BODBF 50,000 - 50,000 50,000 50,000 - 50,000 - 50,000 50,000 LGSF (FSLGU) 200,000 - 200,000 200,000 200,000 - 200,000 - 200,000 405,000
Shares of LGUs in the Proceeds of Fire Code Fees 200,000 - 200,000 200,000 200,000 - 200,000 - 200,000 200,000 MMDA 2,654,612 (527,803) 2,126,809 2,126,809 2,124,737 206,624 2,331,361 62,103 2,186,840 2,331,361
National Disaster Risk Reduction Management Fund (Calamity Fund) 7,500,000 - 7,500,000 7,500,000 7,500,000 5,500,000 13,000,000 17,500,000 25,000,000 13,000,000
Contingent Fund 1,000,000 - 1,000,000 1,000,000 1,000,000 - 1,000,000 - 1,000,000 1,000,000
DepEd-School Building Program 1,000,000 - 1,000,000 1,000,000 1,000,000 - 1,000,000 - 1,000,000 1,000,000
ICF 4,815,644 - 4,815,644 4,815,644 4,815,644 - 4,815,644 - 4,815,644 4,815,644
MPBF 80,713,614 347,994 81,061,608 81,061,608 81,061,608 (25,502,642) 55,558,966 (19,124,603) 61,937,005 53,535,086 - - - - - - - -
Feasibility Studies Fund 400,000 - 400,000 400,000 400,000 - 400,000 - 400,000 400,000 - - - - - - - -
Rehabilitation and Reconstruction Fund-NEW - - - - - 20,000,000 20,000,000 - - 20,000,000
- - PGF 120,495,952 - 120,495,952 120,495,952 120,495,952 - 120,495,952 (2,500,000) 117,995,952 120,495,952
PDAF 25,240,000 (25,240,000) - - - - - - - -
E-Government Fund 2,478,900 - 2,478,900 2,478,900 2,478,900 - 2,478,900 - 2,478,900 2,478,900
Sub-Total, SPFs 310,047,901 (25,419,809) 284,628,092 284,628,092 283,639,820 (575,057) 283,064,763 (2,550,500) 281,089,320 282,569,635
NEW GAA 1,521,953,274 (98,000) 1,521,855,274 1,521,855,274 1,471,872,825 (3,200,000) 1,468,672,825 - 1,471,872,825 1,468,599,325
AUTOMATICAPPROPRIATION
Interest Payments 352,652,000 - 352,652,000 352,652,000 352,652,000 - 352,652,000 - 352,652,000 352,652,000 IRA 341,544,726 - 341,544,726 341,544,726 341,544,726 - 341,544,726 - 341,544,726 341,544,726 Net Lending 24,950,000 - 24,950,000 24,950,000 24,950,000 - 24,950,000 - 24,950,000 24,950,000 RLIP - - - - 28,859,006 - 28,859,006 - 28,859,006 28,859,006 Tax Refund - - - - - - - - - - Special Account - - - - 21,116,662 - 21,116,662 - 21,116,662 21,116,662 Grant Proceeds - - - - 6,450 - 6,450 - 6,450 6,450 Pension - - - - 331 - 331 - 331 331
Tax Expenditures Fund 26,900,000 - 26,900,000 26,900,000 26,900,000 - 26,900,000 - 26,900,000 26,900,000 Sub-Total, Automatic Appropriation 746,046,726 - 746,046,726 746,046,726 796,029,175 - 796,029,175 - 796,029,175 796,029,175
TOTAL PROGRAM 2,268,000,000 (98,000) 2,267,902,000 2,267,902,000 2,267,902,000 (3,200,000) 2,264,702,000 - 2,267,902,000 2,264,628,500
H.B. 2630 Inclusive of Auto
H.B. 2630 AMENDMENT-SENATE SENATE AMENDMENT-DBM GAB with DBM
Amendment GAA (RA 10633)
PARTICULARS FY 2014 NEP ERRATA
NEP (Inclusive of ERRATA)
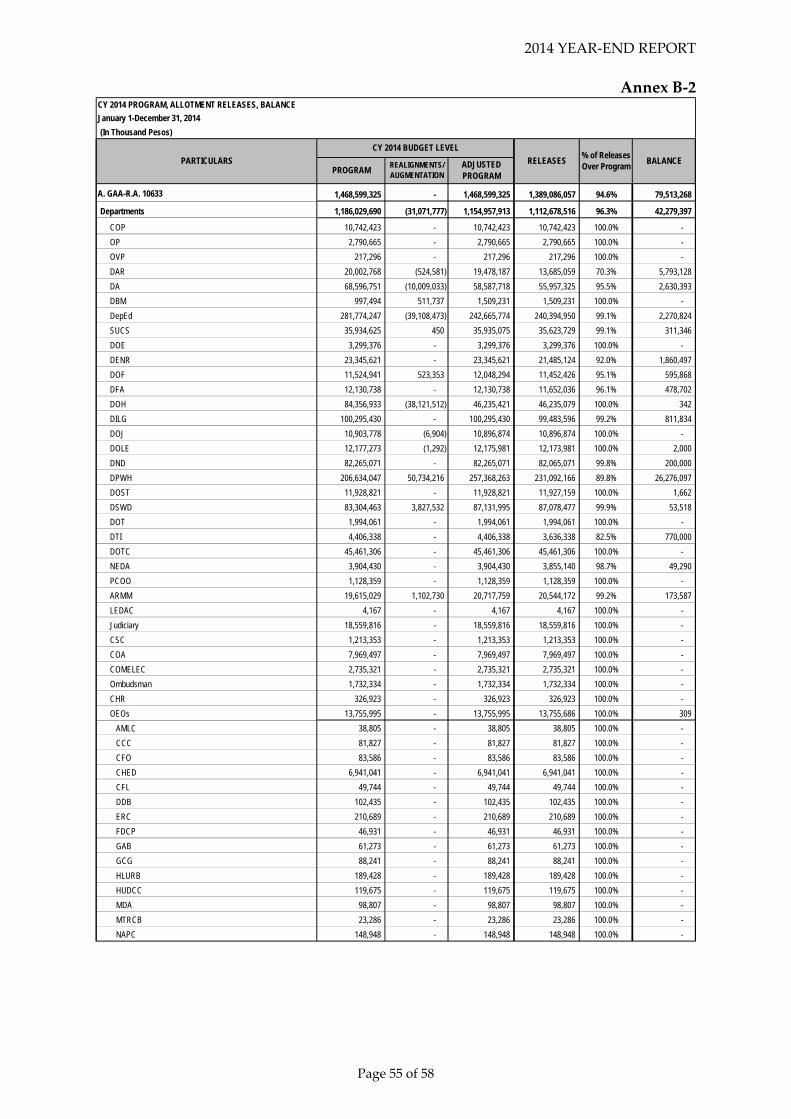
2014 YEAR‐END REPORT
Page 55 of 58
Annex B‐2 CY 2014 PROGRAM, ALLOTMENT RELEASES, BALANCE
January 1-December 31, 2014
(In Thousand Pesos)
A. GAA-R.A. 10633 1,468,599,325 - 1,468,599,325 1,389,086,057 94.6% 79,513,268
Departments 1,186,029,690 (31,071,777) 1,154,957,913 1,112,678,516 96.3% 42,279,397
COP 10,742,423 - 10,742,423 10,742,423 100.0% -
OP 2,790,665 - 2,790,665 2,790,665 100.0% -
OVP 217,296 - 217,296 217,296 100.0% -
DAR 20,002,768 (524,581) 19,478,187 13,685,059 70.3% 5,793,128
DA 68,596,751 (10,009,033) 58,587,718 55,957,325 95.5% 2,630,393
DBM 997,494 511,737 1,509,231 1,509,231 100.0% -
DepEd 281,774,247 (39,108,473) 242,665,774 240,394,950 99.1% 2,270,824
SUCS 35,934,625 450 35,935,075 35,623,729 99.1% 311,346
DOE 3,299,376 - 3,299,376 3,299,376 100.0% -
DENR 23,345,621 - 23,345,621 21,485,124 92.0% 1,860,497
DOF 11,524,941 523,353 12,048,294 11,452,426 95.1% 595,868
DFA 12,130,738 - 12,130,738 11,652,036 96.1% 478,702
DOH 84,356,933 (38,121,512) 46,235,421 46,235,079 100.0% 342
DILG 100,295,430 - 100,295,430 99,483,596 99.2% 811,834
DOJ 10,903,778 (6,904) 10,896,874 10,896,874 100.0% -
DOLE 12,177,273 (1,292) 12,175,981 12,173,981 100.0% 2,000
DND 82,265,071 - 82,265,071 82,065,071 99.8% 200,000
DPWH 206,634,047 50,734,216 257,368,263 231,092,166 89.8% 26,276,097
DOST 11,928,821 - 11,928,821 11,927,159 100.0% 1,662
DSWD 83,304,463 3,827,532 87,131,995 87,078,477 99.9% 53,518
DOT 1,994,061 - 1,994,061 1,994,061 100.0% -
DTI 4,406,338 - 4,406,338 3,636,338 82.5% 770,000
DOTC 45,461,306 - 45,461,306 45,461,306 100.0% -
NEDA 3,904,430 - 3,904,430 3,855,140 98.7% 49,290
PCOO 1,128,359 - 1,128,359 1,128,359 100.0% -
ARMM 19,615,029 1,102,730 20,717,759 20,544,172 99.2% 173,587
LEDAC 4,167 - 4,167 4,167 100.0% -
Judiciary 18,559,816 - 18,559,816 18,559,816 100.0% -
CSC 1,213,353 - 1,213,353 1,213,353 100.0% -
COA 7,969,497 - 7,969,497 7,969,497 100.0% -
COMELEC 2,735,321 - 2,735,321 2,735,321 100.0% -
Ombudsman 1,732,334 - 1,732,334 1,732,334 100.0% -
CHR 326,923 - 326,923 326,923 100.0% -
OEOs 13,755,995 - 13,755,995 13,755,686 100.0% 309
AMLC 38,805 - 38,805 38,805 100.0% -
CCC 81,827 - 81,827 81,827 100.0% -
CFO 83,586 - 83,586 83,586 100.0% -
CHED 6,941,041 - 6,941,041 6,941,041 100.0% -
CFL 49,744 - 49,744 49,744 100.0% -
DDB 102,435 - 102,435 102,435 100.0% -
ERC 210,689 - 210,689 210,689 100.0% -
FDCP 46,931 - 46,931 46,931 100.0% -
GAB 61,273 - 61,273 61,273 100.0% -
GCG 88,241 - 88,241 88,241 100.0% -
HLURB 189,428 - 189,428 189,428 100.0% -
HUDCC 119,675 - 119,675 119,675 100.0% -
MDA 98,807 - 98,807 98,807 100.0% -
MTRCB 23,286 - 23,286 23,286 100.0% -
NAPC 148,948 - 148,948 148,948 100.0% -
PARTICULARS
CY 2014 BUDGET LEVEL
RELEASESPROGRAM
REALIGNMENTS/ AUGMENTATION
ADJUSTED PROGRAM
% of Releases Over Program
BALANCE

2014 YEAR‐END REPORT
Page 56 of 58
CY 2014 PROGRAM, ALLOTMENT RELEASES, BALANCE
January 1-December 31, 2014
(In Thousand Pesos)
NCCA 678,409 - 678,409 678,409 100.0% -
Proper 29,280 - 29,280 29,280 100.0% -
NHCP 352,705 - 352,705 352,705 100.0% -
NLP 194,279 - 194,279 194,279 100.0% -
NAP 102,145 - 102,145 102,145 100.0% -
NCIP 877,663 - 877,663 877,663 100.0% -
NCMF 415,451 - 415,451 415,451 100.0% -
NICA 590,956 - 590,956 590,956 100.0% -
NSC 88,584 - 88,584 88,584 100.0% -
NTC 229,438 - 229,438 229,129 99.9% 309
OPAPP 351,547 - 351,547 351,547 100.0% -
OMB 44,291 - 44,291 44,291 100.0% -
PRRC 468,278 - 468,278 468,278 100.0% -
PCW 50,264 - 50,264 50,264 100.0% -
PDEA 869,096 - 869,096 869,096 100.0% -
Philracom 111,783 - 111,783 111,783 100.0% -
PSC 182,313 - 182,313 182,313 100.0% -
PCUP 106,291 - 106,291 106,291 100.0% -
PCDSPO 69,650 - 69,650 69,650 100.0% -
PLLO 35,858 - 35,858 35,858 100.0% -
PMS 301,407 - 301,407 301,407 100.0% -
Special Purpose Funds 282,569,635 31,071,777 313,641,412 276,407,541 88.1% 37,233,871
Budgetary Support to Government Corporations 46,255,210 35,404,769 81,659,979 79,400,947 97.2% 2,259,032
Allocation to Local Government Units 19,588,843 - 19,588,843 7,944,429 40.6% 11,644,414
Special Shares of LGUs in the Proceeds of National Taxes 16,602,482 - 16,602,482 5,540,670 33.4% 11,061,812
Metropolitan Manila Development Authority 2,331,361 - 2,331,361 2,331,361 100.0% -
Barangay Officials Death Benefits Fund 50,000 - 50,000 22,398 44.8% 27,602
Local Government Support Fund 405,000 - 405,000 50,000 12.3% 355,000
Special Shares of LGUs in the Proceeds of Fire Code Fees 200,000 - 200,000 - 0.0% 200,000
Contingent Fund 1,000,000 372,864 1,372,864 1,372,864 100.0% -
DepEd School-Building Program 1,000,000 - 1,000,000 181,752 18.2% 818,248
E-Government Fund 2,478,900 - 2,478,900 1,626,061 65.6% 852,839
Feasibility Studies Fund 400,000 - 400,000 202,347 50.6% 197,653
International Commitments Fund 4,815,644 - 4,815,644 4,669,516 97.0% 146,128
Miscellaneous Personnel Benefits Fund 53,535,086 (2,600,000) 50,935,086 50,653,537 99.4% 281,549
National Disaster Risk Reduction Management Fund 13,000,000 2,600,000 15,600,000 15,535,468 99.6% 64,532
Pension and Gratuity Fund 120,495,952 (4,705,856) 115,790,096 106,064,875 91.6% 9,725,221
Rehabilitation and Reconstruction Fund 20,000,000 - 20,000,000 8,755,745 43.8% 11,244,255
B. Automatic Appropriations 796,029,175 - 796,029,175 787,280,187 98.9% 8,748,988
Retirement and Life Insurance Premium 28,859,006 - 28,859,006 31,665,061 109.7% (2,806,055)
Internal Revenue Allotment 341,544,726 - 341,544,726 341,544,726 100.0% -
Pension of Ex-Presidents/Widows 331 - 331 288 87.0% 43
Grants/Donations 6,450 - 6,450 6,450 100.0% -
Special Account in the General Fund 21,116,662 - 21,116,662 21,116,662 100.0% -
Motor Vehicle Users Charge Fund 13,011,543 - 13,011,543 13,011,543 100.0% -
Others 8,105,119 - 8,105,119 8,105,119 100.0% -
Net Lending 24,950,000 - 24,950,000 13,395,000 53.7% 11,555,000
Interest Payments 352,652,000 - 352,652,000 352,652,000 100.0% -
Tax Expenditures Fund/Customs Duties and Taxes 26,900,000 - 26,900,000 26,900,000 100.0% -
PARTICULARS
CY 2014 BUDGET LEVEL
RELEASESPROGRAM
REALIGNMENTS/ AUGMENTATION
ADJUSTED PROGRAM
% of Releases Over Program
BALANCE

2014 YEAR‐END REPORT
Page 57 of 58
CY 2014 PROGRAM, ALLOTMENT RELEASES, BALANCE
January 1-December 31, 2014
(In Thousand Pesos)
C. OTHER RELEASES - - - 44,065,655 (44,065,655)
CONTINUING APPROPRIATIONS-R.A. 10352 - - - 7,157,246 (7,157,246)
Departments - - - 2,459,768 (2,459,768)
DA - 514,138 (514,138)
DENR - 78,807 (78,807)
DOF - 357,017 (357,017)
DPWH - - - 925,975 (925,975)
ARMM - 583,831 (583,831)
Special Purpose Funds - - - 4,697,478 (4,697,478)
ALGU - - - 204,579 (204,579)
SSPNT - 18,845 (18,845)
LGSF - 185,734 (185,734)
Contingent - 778,077 (778,077)
NDRRMF - 3,714,822 (3,714,822)
SUPPLEMENTAL BUDGET-R.A. 10634 - - - 14,306,842 (14,306,842)
DSWD 3,400,000 (3,400,000)
National Disaster Risk Reduction Management Fund 10,906,842 (10,906,842)
UNPROGRAMMED FUND - 11,884,147 (11,884,147)
OTHER AUTOMATIC APPROPRIATIONS - - - 10,717,420 (10,717,420)
Grants/Donations - 3,602,876 (3,602,876)
SAGF-OTHERS - 1,751,302 (1,751,302)
Military Camps Sales Proceeds Fund - 1,664,578 (1,664,578)
AFP Modernization Act Trust Fund - 860,629 (860,629)
Motor Vehicle Users Charge Fund - 94,728 (94,728)
Tax Exp. Fund/CDT - 2,743,307 (2,743,307)
ORIGINAL PROGRAM 2,264,628,500 - 2,264,628,500 2,220,431,899 98.0% 44,196,601
SUPPLEMENTAL BUDGET 22,467,608 22,467,608 22,467,608
TOTAL 2,287,096,108 - 2,287,096,108 2,220,431,899 97.1% 66,664,209
PARTICULARS
CY 2014 BUDGET LEVEL
RELEASESPROGRAM
REALIGNMENTS/ AUGMENTATION
ADJUSTED PROGRAM
% of Releases Over Program
BALANCE
Annex B‐3

2014 YEAR‐END REPORT
Page 58 of 58
SPF TransfersJanuary 1-December 31, 2014 (In Thousand Pesos)
PARTICULARS
Budgetary Support to
Government Corporations
Allocation to LGUs
National Disaster Risk
Reduction Management
Fund
Contingent Fund
DepEd School Building Program
E-Government Fund
International Commitments
Fund
Miscellaneous Personnel
Benefits Fund
Rehabilitation and
Reconstruction Program
Feasibility Studies Fund
Pension and Gratuity Fund
TOTAL
O E O s - - - 102,658 - 37,000 17,207 219,351 - 169,760 545,976 CCC - - - - - - - 140 - - 140 CFO - - - - - - - 1,529 - 1,726 3,255 CHED - - - - - - - 11,281 - 14,433 25,714 CFL - - - - - - - 245 - 1,677 1,922 DDB - - - - - - - 1,499 - 1,085 2,584 ERC - - - - - - - 3,291 - 23,179 26,470 FDCP - - - - - - - 592 - 67 659 GAB - - - - - - - 3,078 - 1,608 4,686 GCG - - - - - - - 12,207 - 510 12,717 HLURB - - - - - - - 6,352 - 4,926 11,278 HUDCC - - - - - - - 420 - - 420 MDA - - - - - - 7,547 1,006 - - 8,553 MTRCB - - - - - - - 1,236 - 503 1,739 NAPC - - - 23,586 - - 5,019 6,411 - - 35,016 NCCA - - - - - 37,000 - 10,025 - 5,198 52,223 Proper - - - - - - - 951 - - 951 NHCP - - - - - - - 4,123 - 1,657 5,780 NLP - - - - - 37,000 - 4,341 - 1,179 42,520 NAP - - - - - - - 610 - 2,362 2,972 NCIP - - - - - - - 27,132 - 13,390 40,522 NCMF - - - 8,968 - - 2,677 6,401 - 56,819 74,865 NICA - - - 1,656 - - - 16,878 - 15,006 33,540 NSC - - - - - - - 1,173 - 316 1,489 NTC 14,413 - 31,097 3,730 49,240 OPAPP - - - 54,035 - - - 5,710 - - 59,745 OMB - - 841 429 1,270 PRRC - - - - - - - 256 - 244 500 PCW - - - - - - 1,964 896 - 271 3,131 PDEA - - - - - - - 49,032 - 10,796 59,828 Philracom - 1,367 945 2,312 PSC - - - - - - - 798 - 408 1,206 PCUP - - - - - - - 1,894 - 4,662 6,556 PCDSO - - - - - - - 382 - - 382 PLLO - - - - - - - 1,519 - 69 1,588 PMS - - - - - - - 14,663 - 7,763 22,426
GOCCs 79,400,947 - 11,000,000 69,200 - - - - 178,100 - 1,084,241 91,732,488 LGUs - 5,590,670 71,170 - - - - - - 133,686 5,795,526 MMDA - 2,331,361 - 45,311 - - - 49,316 - 2,716 2,428,704
TOTAL 79,400,947 7,944,429 15,535,468 1,372,864 181,752 1,626,061 4,669,516 50,653,537 8,755,745 202,347 106,064,875 276,407,541