2014 Utility Strike Damages Report - USAG Home · remains to get more sources of data for the...
36
2014 Utility Strike Damages Report Prepared by the USAG Data & Reporting Working Group 06 June 2016 USAG U T I L I T Y S T R I K E A V O I D A N C E G R O U P
Transcript of 2014 Utility Strike Damages Report - USAG Home · remains to get more sources of data for the...

2014 Utility Strike Damages ReportPrepared by the USAG Data & Reporting Working Group
06 June 2016
USAG
UT
I L I T YS T R I K E A V O I D A N C E
G R
OU
P

2014 Utility Strike Damages Report2
This report summarises the key findings of over 2000 utility strikes across the UK during 2014 from 24 participants. It highlights what caused the most damages and provides scope and recommendations to:
1. Avoid future damages
2. Improve the ability to analyse the strike data in future years
It also provides a comparison against the previous year’s (2013) data; it was found that many of the issues were replicated across the two periods which strengthens the conclusions made.
The main conclusions for the causes were:
1. Better preparation in advance of works commencing, through availability of more accurate plans and more robust location and survey practices was critical
2. Behavioural issues on site during the execution of the works is a key issue and a recommendation for further investigation
What you can do to help the industry and reduce asset strikes
- Distribute this report within your organisation and to your wider industry contacts
- Support the initiative by submitting data for the 2015 and 2016 reports
- Contact us via [email protected] with any comments
Executive Summary
Prepared by the following members of the USAG Data & Reporting Working Group
Richard Broome LinesearchbeforeUdig
Stephen Crossland Balfour Beatty – Gas & Water
Andrew Rhoades Heathrow Airport
Gerry Duffy Enserve Group
Jeremy Blom North Midlands Construction
Nicole Metje University of Birmingham

32014 Utility Strike Damages Report
Introduction aND GENERAL COMMENTS 4
Why this report is important 4
Learning from international best practice 4
How the report is structured 4
Developing the knowledge of works undertaken 5
Improving the volume of strike data submitted 5
Data collection 5
Acknowledgements 5
Usag 2014 strike analysis 6
When the incident occurred - Month 6
When the incident occurred - Day 7
When the incident occurred - Time of day 8
Where the incident occurred - Location type 9
How the asset was damaged - Equipment used 10
Strikes by equipment used and location 11
What was damaged - Asset type 12
Strikes by asset damaged and location type 13
Strikes by asset damagedand equipment used 14
Why the strike occured - Nature of works undertaken 15
Why the asset was damaged - Strike cause (planning) 16, 17 &18
Why the asset was damaged - Strike cause (execution) 19
Questionnaire responses 20 & 21
Conclusion 22
Appendices 23
1. About USAG 24 & 25
2. Definitions 26
3.Letter to industry 27
4. Non-disclosure agreement 28 & 29
5. Strike data template 30
6. Questionnaire 31
7. Data categories 32, 33, 34 & 35
contents
2013 Utility Strike Damages Report
2014 Utility Strike Damages Report4 42013 Utility Strike Damages Report
WHY THIS REPORT IS IMPORTANT
There are many groups and organisations actively engaged and working hard in the pursuit of elimination of utility strikes and significant improvements have been made as a result of these efforts.
To keep improving safety in the pursuit of eliminating strikes, the industry needs a collaborative effort to ensure effective and sustainable change. A widely reported statistic within the industry is that there are over 60,000 cable strikes per annum so there is still a significant problem. Whilst there is no “silver bullet”, USAG is aiming to achieve the following:
1. Analysing the results received (when, where, how, what)
2. Understanding the potential causes (why)
3. Creating a baseline to understand current performance and to measure future continued improvement
4. Raising the profile of the issues faced by the industry
By doing so USAG and all contributors can collectively prevent injury, damage, disruption and raise the performance standards of our industry.
LEARNING FROM INTERNATIONAL BEST PRACTICE
Similar reports are produced annually in other parts of the world including the USA, Canada and Australia which have been instrumental in reducing utility strikes.
It is important to learn from our international colleagues, showing that the UK is equally committed to improving our practices, to continue to reduce damages and ensure everyone goes home safe each and every day.
HOW THE REPORT IS STRUCTURED
This report builds on the findings of the inaugural 2013 report. The data was collected from 24 USAG Members which includes over 2000 utility strikes.
These strikes have been analysed in the following areas:
• When the strike occurred
o Month
o Day
o Time
• Where the strike occurred
o Location type
• How the asset was damaged
o Equipment used
• What the damage was
o Asset type
• Why the asset was damaged
o Nature of works
o Cause of damage-
planning
o Cause of damage-
execution
Each section shows a figure (graph), a brief commentary on the data, comparison with the previous report and some guideline industry recommendations for improvement.
INTRODUCTION AND GENERAL COMMENTS

52014 Utility Strike Damages Report
Developing the knowledge of works undertaken
Current situation
It is important to understand how many works are taking place across the UK in order to understand the current position and measure future improvement. Widely reported figures within the industry suggest that there are approximately four million excavations and 60,000 cable strikes per annum. The source of these figures is not known but it is not thought to include all works or annual variations.
Problem
It is estimated that, based on the number of strikes reported, the overall volume of works (including those not resulting in strikes) for this report is approximately 200,000.
Proposed solution
1. Agree uniform metrics (no. of excavations/man hours worked on site/services crossed etc.)
2. Get more from each contributor in future years
3. Continue to use indicative pan industry figures (where available) as a guide.
This will be an area of specific focus over the next two “period” years.
Improving the volume of strike data submitted
Current situation
The volume of data received from the 2014 request was significantly reduced from those received from the 2013 request.
Problem
More data inevitably leads to more reliable conclusions but more questions leads to lower submissions. Slightly more information for 2014 was asked for to improve the analysis but it is felt that this resulted in fewer submissions than the 2013 request.
Proposed solution
1. Keep it fairly simple to encourage completion
2. Minimise any changes between years
3. Get to a point where strikes can be submitted during the year they occur
4. Ensure that as many people in each organisation encourage submission
5. Allow each contributor to benchmark and analyse their own figures through
enhanced request forms
Data Collection
The data used within this report was gathered through a survey period following requests to USAG Members, associated CECA Members as well as other key stakeholders.
The request included the following:
1. Letter (Appendix 1) introducing the report and our intentions
2. Non-Disclosure Agreement (Appendix 2) to overcome any reticence of sharing sensitive data
3. Strike Data Template (Appendix 3) in a standard (Excel) format
4. Questionnaire (Appendix 4) for the collation of various opinion and records based information such as the volume of annual works
5. Data Categories (Appendix 5) to help collate information for the spreadsheet
Acknowledgements
Thank you to all of those that responded with utility strike information, sharing your data for the wider good of the industry. Your support is very much appreciated.

2014 Utility Strike Damages Report6
usag 2014 strike analysisWhen the strike occurred- Month
As for last year’s data, the number of enquiries received through the LinesearchbeforeUdig (LSBUD) service has been used as it isthe only source of data available to indicate the volume of works being undertaken across the UK.The results still show some correlation although the need remains to get more sources of data for the volume of works undertaken.
Due to the reduced volume of strike data received (particularly from larger contributors) there is less confidence in the results. Please also note that a major contributor to the data has been shown in a different colour as the firm changed its procedures towards the end of the year, reporting many more strikes from September onwards which had a significant effect on the trends seen.
The periods above are classified into three periods:
- Jan- Mar. This is shown as the end of typical financial year and the high volume of strikes could be due to schemes being under pressure to be completed by end of March.- Apr-Aug. This is fairly typical with increases in July/August possibly due to longer working days, perhaps with mixed teams and holiday cover.- Sep-Dec. September and October appeared to be months where a high volume of works were undertaken so the higher volume of strikes may be related to result of this. Whilst there were sharp falls for November and December which would be expected due to downturn in works completed and shorter working days, the strikes are not reflective of the volume of LSBUD enquiries in that month.
Comparison with 2013 dataFigure 1 has a different profile and it must be considered that there were significant less reports in 2014 so bigger contributors are likely to have had a more significant skew effect on the data. There are still similar issues in the summer months, which may point to behavioural issues.
There could be many reasons for this but the initial indication may be that the types of personnel undertaking the works is a more significant factor than first thought.
Guideline industry recommendations
1. Be aware of higher risk months and ensure that guidance is in place to mitigate any of the factors above2. Each contributor to consider their own results and provide commentary3. Measures of the work undertaken across the industry to be provided through an agreed metric. We are also keen to add any other industry sources to compare in addition to the LSBUD data as this is critical for the effectiveness of the analysis
Figure 1: Number of utility strikes by month in 2014

72014 Utility Strike Damages Report2013 Utility Strike Damages Report7
usag 2014 strike analysisWhen the strike occurred- dAY
Figure 2: Number of strikes by work day in 2014
Figure 3: Number of strikes by work day and severity in 2014
The trend initially showed what was expected in that there was a reduction of strikes over the weekend when the work was significantly reduced. There was a minor peak through the middle of the week (Tues & Weds) with a tail off towards the latter part of the week which could be as a result of more setting up works at the beginning of the week and backfilling/closing down sites towards the end of the week.
The severity of strikes each day was then analysed. The results were largely as expected but with a lower proportion of medium risk strikes on a Saturday. It is unknown why this would be but is an area that will be reviewed with next year’s data.
Comparison with 2013 data
Generally, very similar profile found.
Guideline industry recommendations
1. Be aware of higher risk days and ensure that guidance is in place to mitigate any of the factors above2. Each contributor to consider their own results and provide commentary

2014 Utility Strike Damages Report8
usag 2014 strike analysisWhen the strike occurred- time of day
Most strikes reported took place between 0900 and 1600 which is not altogether surprising due to ‘typical’ working days. There are spikes in mid-morning (approx. 1000), at 1200 and a significant spike after the typical lunchtime period (approx. 1400).
The severity of the strikes across the time periods was then analysed which showed that the spike at 1400 was predominantly low severity strikes. These spikes are considered likely to be related to behavioural issues on site.
Comparison with 2013 dataVery similar profile found.
Guideline industry recommendations1. Be aware of higher risk time periods and ensure that guidance is in place to mitigate any of the factors above a. Consider cultural practices such as encouraging healthy eating to manage behavioural factors. As an example, the group is aware of a case study for work at the Olympics 2012 site where an uptake of porridge breakfasts was found to reduce accident rates. Further information available in HSE Research Report 955 “Pre-conditioning for success”.2. Each contributor to consider their own results and provide commentary
Figure 4: Number of strikes by time of day in 2014
Figure 5: Number of strikes by time of day and severity n 2014

92014 Utility Strike Damages Report9
usag 2014 strike analysisWhere the strike occurred- location
type
There were more options than the previous request although footpaths and carriageways remain where most of the strikes occurred. This is not unexpected as this is where the majority of utilities are located; a relatively small area with a relatively congested amount of utilities. Much of the excavation works undertaken across the industry to effect the installation or repair of utilities is therefore within these areas.
Comparison with 2013 dataVery similar profile found in that most strikes occur in the footpath and carriageway.
Recommendations for 2015 data report1. Addition of Railway option
Guideline industry recommendations1. Be aware of higher risk areas and ensure that guidance is in place to mitigate any of the factors above2. Each contributor to consider their own results and provide commentary
Figure 6: Percentage of strikes by location in 2014

2014 Utility Strike Damages Report10 10
usag 2014 strike analysishow the asset was damaged - equipment used
Figure 7: Percentage of strikes by location in 2014
Hand Tools and Mini-diggers have again been shown to represent the highest numbers for the type of equipment being used when a strike event occurred. This is likely to be aligned with them being the most used pieces of equipment across the industry.
Combining ‘excavator’ and ‘mini digger’ as one source (i.e. mechanical excavation) resulted in them as the highest source of strikes compared to using hand tools and other ground breaking equipment.
The equipment used in each location was then analysed:

112014 Utility Strike Damages Report11
Figure 8: Number of strikes by equipment used and location in 2014
This showed two key results:1. Hand tools in the footpath were the key contributor2. Mini-diggers in the carriageway (and then footpaths) were the second (and third) highest contributors
Comparison with 2013 dataVery similar profile found.
Guideline industry recommendations1. Be aware of higher risk equipment and ensure that guidance is in place to mitigate the factors above2. Consider alternative excavation practices, e.g. vacuum excavation, machine controls and similar to reduce strikes3. Consider risks to operatives when using specific types of equipment4. Each contributor to consider their own results and working areas and to provide opinion
usag 2014 strike analysisstrikes by equipment used and location

2014 Utility Strike Damages Report12 12
usag 2014 strike analysiswhat asset was damaged - asset type
The highest volume of strikes is against Low Voltage electricity cables (<1000V) which whilst classified separately to street lighting cables is likely to include a proportion of them. These types of cable are mainly located in footpaths, are rarely identified on plans, are often difficult to locate and are shallow.
Strikes to the Telecoms networks (Copper and Fibre) are likely to be common due to being shallow and similarly difficult to locate on site.
Low pressure gas and water also showed significant volumes which is likely to be due to location difficulties with equipment typically used on site as well as due to service connections.
The location type for each asset damaged was then analysed:
Figure 9: Number of strikes by asset damaged in 2014
132014 Utility Strike Damages Report13
usag 2014 strike analysisstrikes by asset damaged and
location type
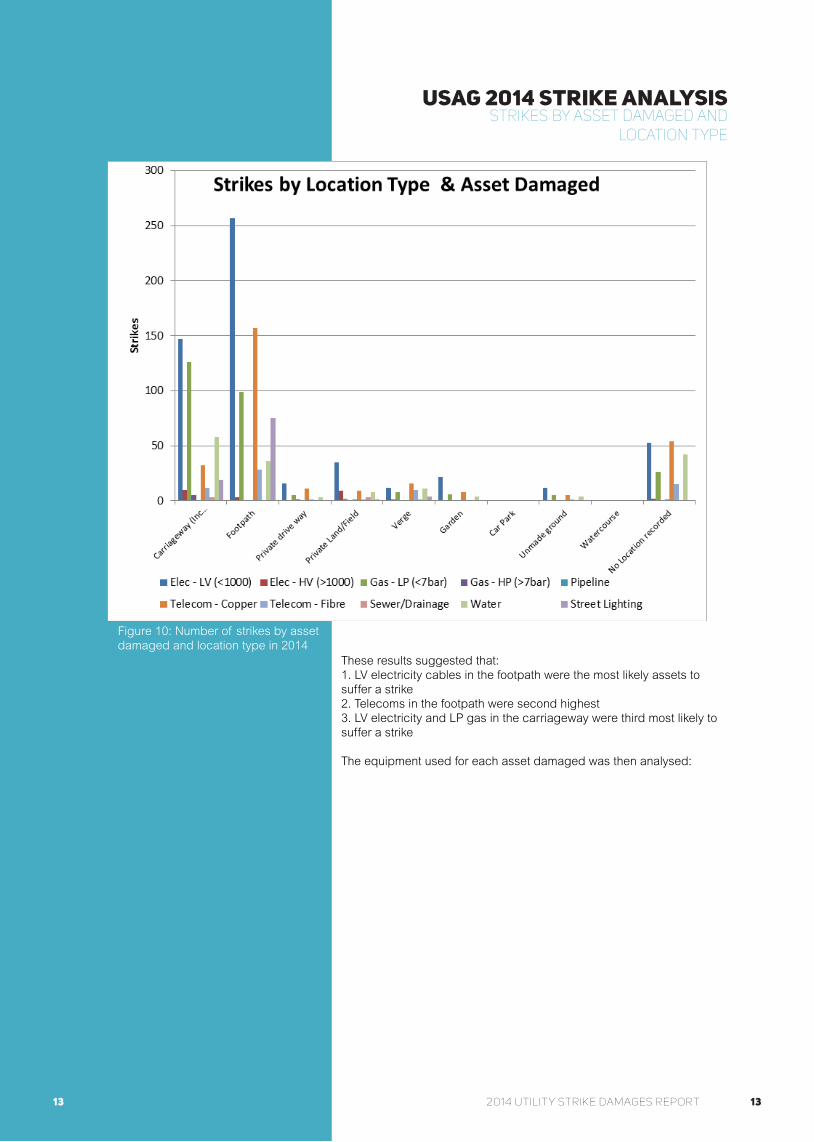
Figure 10: Number of strikes by asset damaged and location type in 2014
These results suggested that:1. LV electricity cables in the footpath were the most likely assets to suffer a strike2. Telecoms in the footpath were second highest3. LV electricity and LP gas in the carriageway were third most likely to suffer a strike
The equipment used for each asset damaged was then analysed:

2014 Utility Strike Damages Report14 14
usag 2014 strike analysisstrikes by asset damaged and equipment used
The takeaway result from this is that LV electricity was the asset stuck most regularly by a specific piece of equipment which was ‘hand tools’. This represents a significant risk for operatives undertaking this work.
Comparison with 2013 dataVery similar profile found (where similar analysis was made).
Guideline industry recommendations1. It appears that assets which require more effort to accurately locateon site were hit most often. This would suggest the following would be sensible:
a. Ensure plans of all known services are collated beforeworks commence
i.High quality plans would help but must not besolely relied upon
b. Undertake high quality surveys to locate assets(recommended to be PAS128 levels)c. Ensure that the Genny is used when using the Locatord. Develop Locator training
2. Be aware of the risks associated with using hand tools andconsider the use of PPE such as insulated hand tools as a last line of defence3. Please refer to Cause of Damage Recommendations here and here
Figure 11: Number of strikes by asset damaged and equipment used in 2014

152014 Utility Strike Damages Report15
Usag 2014 strike analysiswhy the strike occured: nature of
works undertaken
Most strikes reported were defined as low severity and due to planned works which is not surprising due to the likely nature of most works being undertaken. Figure 12 shows the profile of the three work categories in percentage terms for planned, unplanned/reactive and emergency:
• The planned column shows most strikes in the low severity category, a significant proportion in the medium severity and few in the high category. We would have expected more in the low severity rather than medium severity classifications• The unplanned/reactive column shows most strikes in the low severity category, suggesting that this type of work was more likely to result in a lower severity strike than the planned works which is typically unlikely. This may be related to differing procedures and personnel on site for these works• The emergency works (albeit based on only 15 strikes) suggests that strikes here lead to much higher severity strikes, with the majority in the medium severity category and 20% in the higher severity category
Comparison with 2013 dataN/A
Guideline industry recommendations1. Be aware that the data suggests that strikes when undertaking emergency works are likely to lead to higher risk strikes2. Be aware that planned works are still leading to medium and high risk strikes 3. Each contributor to consider their own results and provide commentary
Strikes by nature of works Severity of strike
Nature of works Strikes Low Medium High
Planned 636 365 261 9
Unplanned/reactive
89 84 4 1
Emergency 15 3 9 3
Figure 12: Number of strikes by nature of works and severity of strikes in 2014
2014 Utility Strike Damages Report16 16
usag 2014 strike analysiswhy the asset was damaged - strike cause (planning)
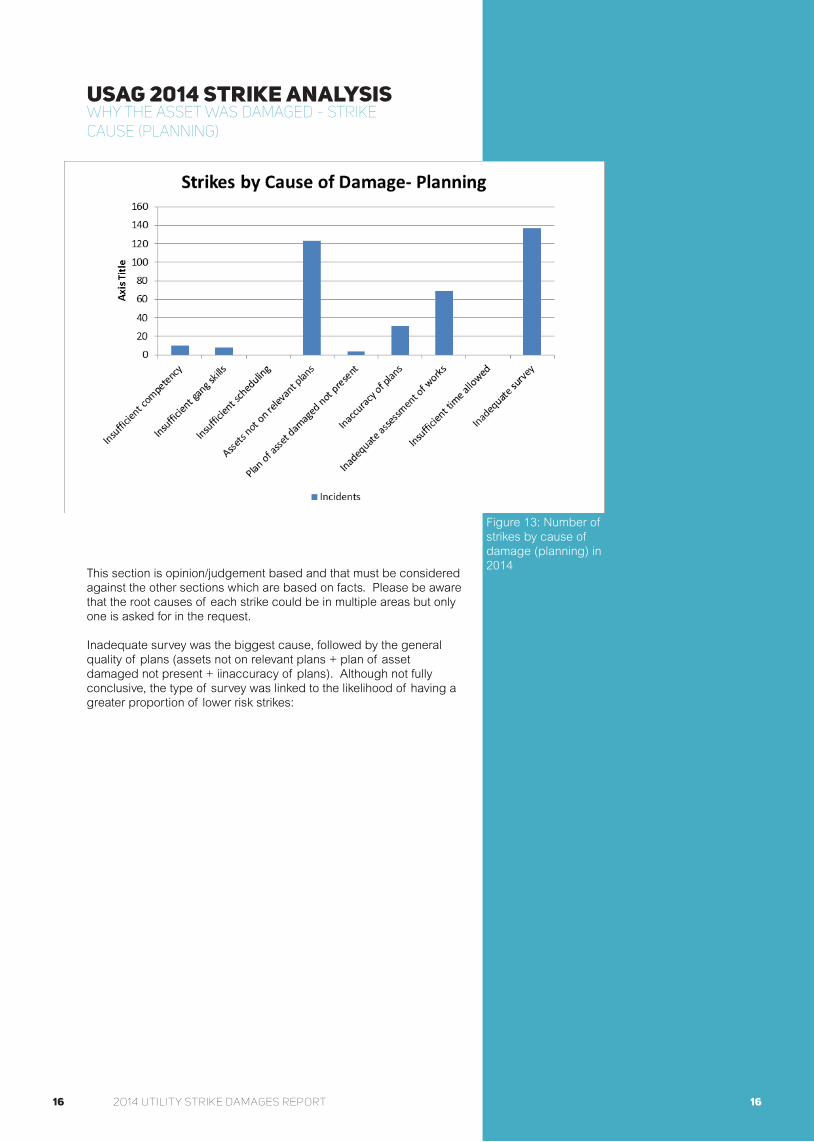
This section is opinion/judgement based and that must be considered against the other sections which are based on facts. Please be aware that the root causes of each strike could be in multiple areas but only one is asked for in the request.
Inadequate survey was the biggest cause, followed by the general quality of plans (assets not on relevant plans + plan of asset damaged not present + iinaccuracy of plans). Although not fully conclusive, the type of survey was linked to the likelihood of having a greater proportion of lower risk strikes:
Figure 13: Number of strikes by cause of damage (planning) in 2014

172014 Utility Strike Damages Report17
usag 2014 strike analysiswhy the asset was damaged - strike
cause (planning)
Figure 14: Percentage of strikes by survey level in 2014
The relationship between the asset damaged and the survey type was then analysed as shown on the next page:
Strikes by Survey Level in
accordance with PAS128
Severity of strike
Survey Level Low Medium High
D - Desk Top 62% 38% 0%
C - Ste Reconnaissance 52% 46% 2%
B - Detection 92% 6% 2%
A - Verification 90% 10% 0%
NON PAS128 83% 17% 0%
2014 Utility Strike Damages Report18 18
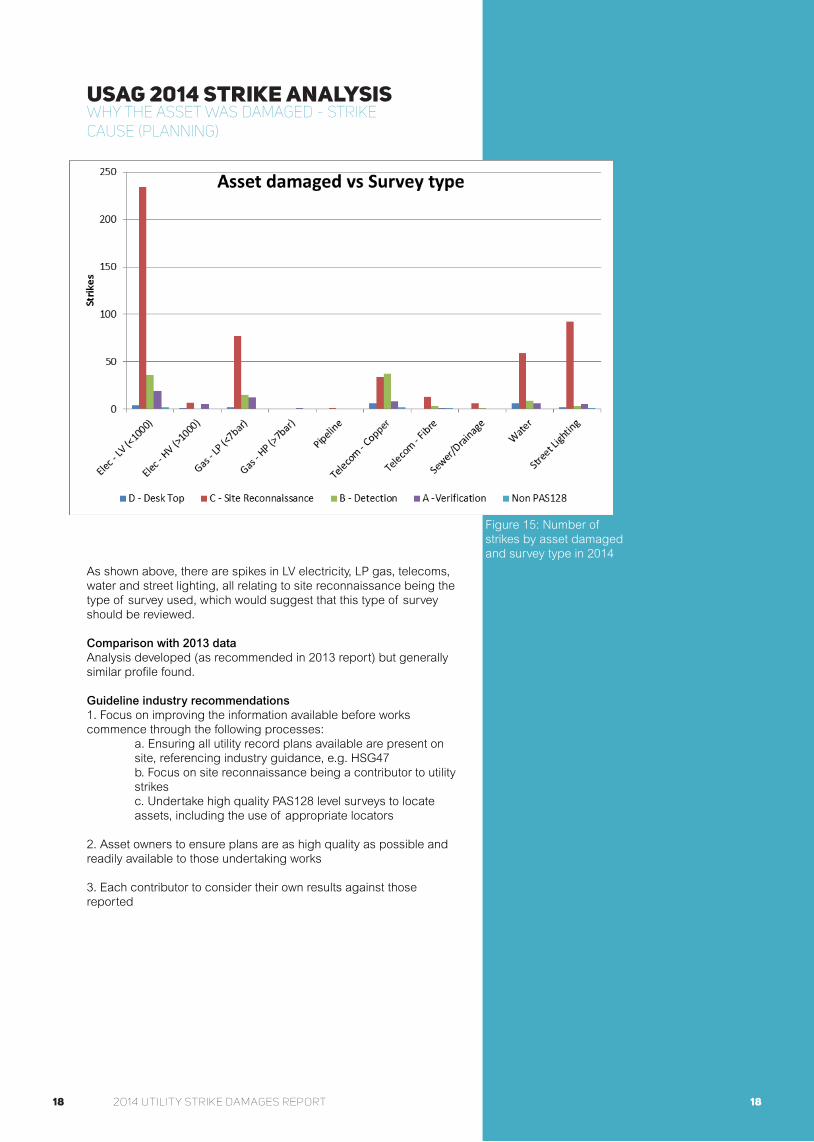
Figure 15: Number of strikes by asset damaged and survey type in 2014
As shown above, there are spikes in LV electricity, LP gas, telecoms, water and street lighting, all relating to site reconnaissance being the type of survey used, which would suggest that this type of survey should be reviewed.
Comparison with 2013 dataAnalysis developed (as recommended in 2013 report) but generally similar profile found.
Guideline industry recommendations1. Focus on improving the information available before works commence through the following processes: a. Ensuring all utility record plans available are present on site, referencing industry guidance, e.g. HSG47 b. Focus on site reconnaissance being a contributor to utility strikes c. Undertake high quality PAS128 level surveys to locate assets, including the use of appropriate locators 2. Asset owners to ensure plans are as high quality as possible and readily available to those undertaking works
3. Each contributor to consider their own results against those reported
usag 2014 strike analysiswhy the asset was damaged - strike cause (planning)

192014 Utility Strike Damages Report2013 Utility Strike Damages Report19
Figure 16: Number of strikes by cause of damage (execution) in 2014
This section is opinion/judgement based and that must be considered against the other sections which are more based on fact.
Excavation practices not sufficient is the biggest cause (defined as No or inadequate development/ implementation/enforcement of Safe System of Work), followed by misuse of tools and a number of causes that point to behavioural impact.
Please be aware that the root causes of each strike could be in multiple areas but only one is asked for in the request.
Comparison with 2013 dataAnalysis developed (as recommended in 2013 report) but generally similar profile found.
Guideline industry recommendations1. Focus on improving the behavioural activity on site during works with the following recommendations: a. Checking any different results with different gangs b. Improved/accredited training courses that focus on excavating around/adjacent to utility assets. c. Undertaking interviews and site team competency audits with behaviour as the focus area. 2. Each contributor to consider their own results against those reported.
usag 2014 strike analysisWhy the asset was damaged- Strike cause
(execution)

2014 Utility Strike Damages Report20 2013 Utility Strike Damages Report
Purpose
The purpose of the questionnaire was to get more data to support the understanding of volumes of works undertaken across the industry, including when the works usually took place and what equipment was used. This could be referenced against the strike data received to investigate if a specific type of work was more likely to lead to a strike or whether it was as a result of the volume of works undertaken.
The final question asked for opinion on the costs of utility strikes.
Commentary on Questions asked
There were 11 responses to the questionnaire and these responses included a wide variety of results. Where possible, meaningful trends from the data have been analysed but it must be noted that this is based on a very limited sample size.
Total works undertaken
This was very difficult to analyse and no accurate / reliable conclusions were drawn.
Time of works
90% works were during the day (80% certainty).
Nature of works
95% of works were planned works (rather than emergency or reactive) (80% certainty).
Cost of strikes
Based on the questionnaire responses, the average strike cost estimates typically ranged between £2000 and £7500 with an average of £3600, which was mainly made up of direct costs.
Based on an estimated value of £3600 per strike, the total direct costs of strikes reported for 2014 is approximately £7,000,000.
Once indirect costs including project overrun, traffic delays, downtime, back office time and social costs such as loss of productivity to businesses are taken into account the true cost of a utility strike increases significantly.
Based on a report recently undertaken entitled “What do Utility Strikes Really Cost?, for 16 case studies in an urban area, it was shown that for every £1 spend on the direct cost, £29 is spent on the indirect and social costs. Based on the above direct costs, this results in the average true cost of a utility strike of over £100,000.
Reference: Makana L, Metje N, Jefferson I & Rogers CDF (2016). What Do Utility Strikes Really Cost? Report prepared for Transport for London, School of Engineering, University of Birmingham, Birmingham, UK.
Taking consideration of the indirect costs, the total value of all of the strikes reported in this report exceeds £200 million. Based on the widely reported statistic of 60,000 strikes per annum across the UK being 30 times the reported figure, the scale of the problem is staggering.
questionnaire responses

212014 Utility Strike Damages Report
Recommendations for 2015 report
We will reduce the paperwork and administrative requirements for the request, simply asking contributors for their preference on the measure of works for future years, with the following options available:
- Number of jobs/excavations
- Number of man hours on site
- Number of utilities known / crossed / struck
As stated earlier, understanding the total volume of works is critical to measuring future years’ data and understanding industry performance.
USAG Members will be encouraged to submit data by making the submission of data a requirement of the USAG Charter.
questionnaire responses

2014 Utility Strike Damages Report22
conclusion
We hope that the report has been useful for you with respect to the trends, analysis and guideline recommendations discussed.
We need more strikes to be reported in the coming years to help develop the analysis given and conclusions made. This will be most effective by having a greater understanding of the volume of works undertaken across the industry and when and where these works are undertaken. By having more data to analyse we can significantly develop the usefulness and value of the report.
Please help us do this by forwarding the 2015 and 2016 request spreadsheets to your relevant team members; we hope that by the end of 2016 we can be in a position where strikes are reported on a monthly basis and ensure that all involved in the industry can take advantage of the current information available. Submission of data will soon become a condition of the USAG Charter in the interests of all.
We leave you with ten takeaway points for digestion and look forward to receiving the data for 2015 to [email protected]. Thank you.
Ten takeaway points
1. Asset owners to improve quality, accuracy and access to plans
2. Undertakers of works to use plans more effectively in accordance with improved survey practices
3. Visual site reconnaissance as a standalone survey practice is not sufficient to avoid utility strikes
4. The most usual asset struck using a specific type of equipment is LV electricity using hand tools in the footpath
5. Emergency works lead to higher likelihood of high risk strikes
6. Behavioural issues are showing increasing importance and all contributors should review their results accordingly
7. True costs of utility strikes remain largely unknown but much higher than most estimate them to be
8. We need more industry data to draw better conclusions and allow better benchmarking
9. We need to agree work volume metrics across the UK
10. Analysis will develop in years to come but questions asked need to be easy to answer to encourage submission of data

232014 Utility Strike Damages Report
Appendices1. About USAG
2. Definitions
3. Letter to Industry
4. Non-Disclosure Agreement
5. Strike Data Template
6. Questionnaire
7. Data Categories

2014 Utility Strike Damages Report24
The Utility Strike Avoidance Group (USAG) is the established body within the utility, excavation and construction industries to reduce the number and severity of underground utility strikes arising from work activities in proximity to such services.
The primary role of USAG is to provide a forum for employers and industry partners to influence and promote improved standards of health and safety within the utility sector. It has become the leading provider of industry knowledge for safe excavation around utilities and as such has been endorsed by both the HSE and IOSH. It was the winner of the Innovation award for the NJUG Awards in 2012 and the USAG Charter currently has over 150 signatories.
Terms of Reference
The primary role of USAG is to provide a forum for employers and industry partners to influence and promote improved standards of health and safety within the utility sector.
This will include:
• The development of a consistent approach by all members to ensure that legal duties are complied with as an absolute minimum
• The sharing and promotion of good practice in all work activities carried out in proximity of utility services
• The support of industry initiatives and campaigns designed to reduce the incidence of utility strikes
• The promotion of the reporting and analysis of data to identify any industry trends with a view to developing responsive actions
• The maintenance of close liaison with other relevant groups within the utility sector
• The maintenance of close dialogue with HSE and other relevant regulatory bodies and stakeholders as necessary
• Raising awareness amongst other parties including designers, training providers and equipment manufacturers of Their responsibilities for and influence on the provision of utility services
• The identification of new and emerging hazards and risks
• The development and promotion of industry wide programmes and initiatives and relevant guidance as necessary to promote training and skills related issues
about usag

252014 Utility Strike Damages Report
Aims & Objectives
USAG has the following aims and objectives:
• To manage and oversee all information published within the USAG framework of committees
• To ensure duties under health and safety legislation are implemented consistently by all partners and to discuss and assess the impact of and application of draft legislation
• To promote health and safety practice throughout the utility sector via an agreed programme of work, to be kept under regular review
• To share and exchange any other relevant information affecting the utility sector
• To provide a forum for HSE to raise issues of operational policy that may impact on the represented industries
Working Groups
To deliver the aims above, USAG has three main working groups:
- Toolkit Development
- Data & Reporting
- Training & Competence
These groups are supported by Communication, Website Development and Membership teams who support the overall delivery of the USAG groups.
How to become involved
USAG is always looking for additional members/participants so if you would like to become involved please visit www.utilitystrikeavoidancegroup.org where you can:
1. Download the USAG Charter – This Charter is designed to help change the way we all work around utilities and to set a minimum standard for adoption across the industry.
2. View and download our Toolkit, the toolkit includes section for:
a. Planning
b. Responsibilities
c. Training
d. Permits, Calibration and Daily Inspection
e. Key Risk Guidance
f. Personal Protection
g. Investigation Process and Record
- View previous strike reports and related information.
3. Contact us via email; [email protected]
about usag

2014 Utility Strike Damages Report26
Utility Strike: Any service (as defined below) damaged during works involving drilling, excavation/backfilling or heavy loads where sheath or protective wrap has been pierced or damaged, or the service has been severed, crushed or dented. This also applies to services that are damaged if the asset owner hasn’t given express written permission to break them out.
Near miss: A near miss is where a utility strike was narrowly avoided or could have happened due to an avoidable strike but by sheer good fortune didn’t occur.
Services: Any above or below ground cables (telecoms, data, control cables, electricity (all voltages), pipes (gas, district heating systems (all temps), water, sewer, fuel, oil), ducting and drains including any associated features or unidentified utilities either individually or collectively within containment.
definitions
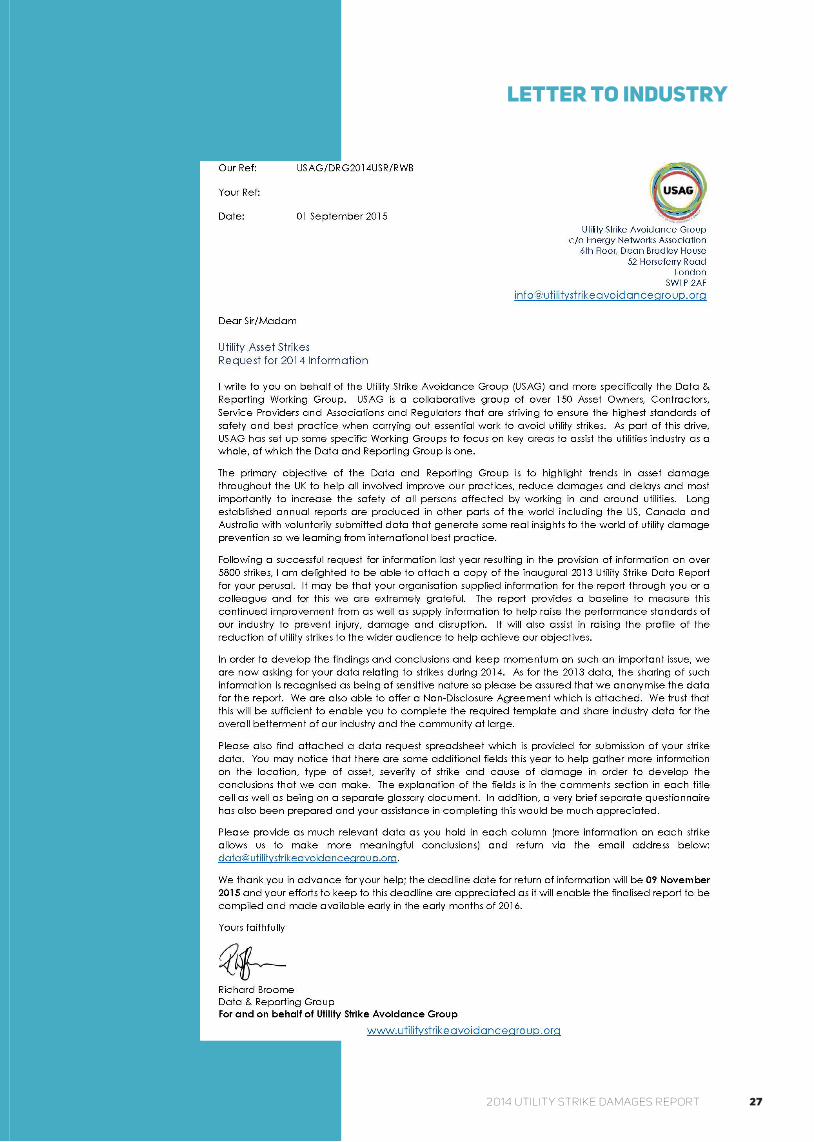
272014 Utility Strike Damages Report
letter to industry

2014 Utility Strike Damages Report28
non-disclosure agreement

292014 Utility Strike Damages Report
Non-disclosure agreement

2014 Utility Strike Damages Report30
strike data template

312014 Utility Strike Damages Report
QUESTIONNAIRE
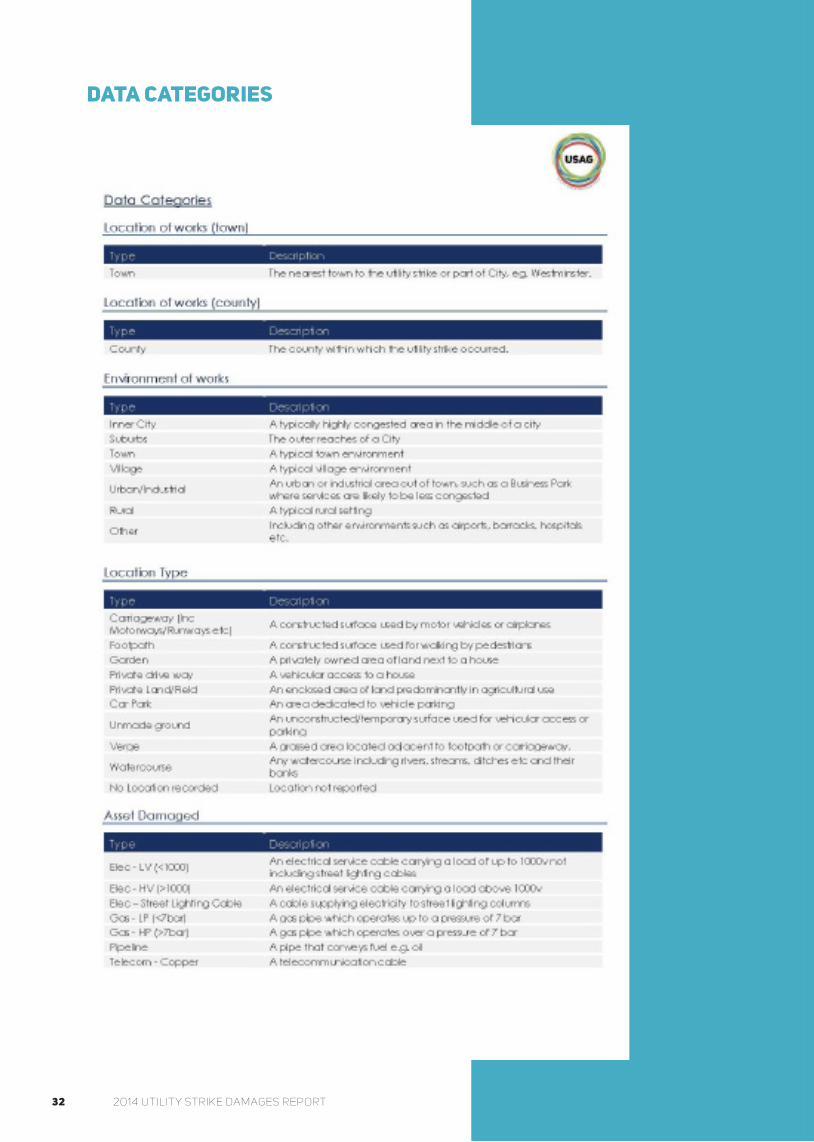
2014 Utility Strike Damages Report32
data categories
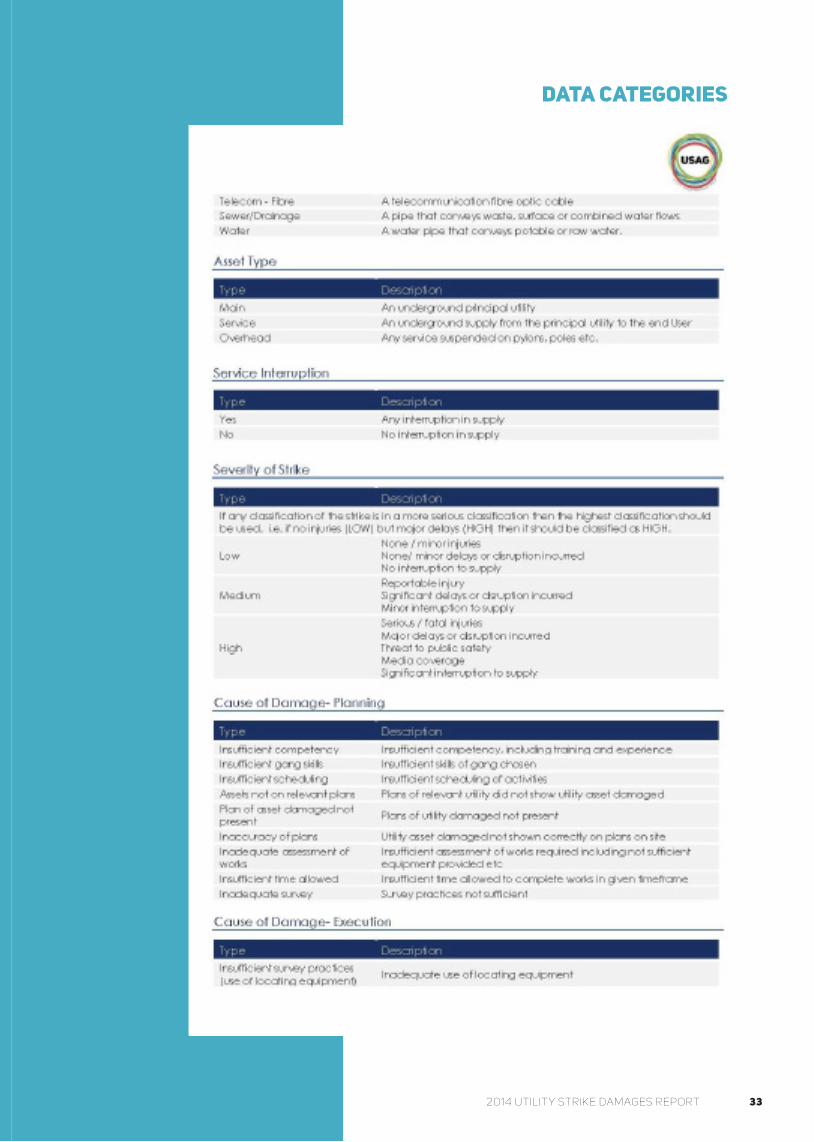
332014 Utility Strike Damages Report
data categories

2014 Utility Strike Damages Report34
data categories

352014 Utility Strike Damages Report
data categories

2014 Utility Strike Damages Report36