2014 Traffic Safety Awareness: Post Campaign...2014 Traffic Safety Awareness: Post‐Campaign...
41
2014 Traffic Safety Awareness: Post‐Campaign Final Report Confidential Reproduction in whole or in part is not permitted without the express permission of Halifax Regional Municipality Prepared for: Halifax Regional Municipality December 2014 www.cra.ca 1‐888‐414‐1336
Transcript of 2014 Traffic Safety Awareness: Post Campaign...2014 Traffic Safety Awareness: Post‐Campaign...

2014 Traffic Safety Awareness: Post‐Campaign
Final Report
Confidential
Reproduction in whole or in part is not permitted without the express permission of Halifax Regional Municipality
Prepared for:
Halifax Regional Municipality
December 2014
www.cra.ca
1‐888‐414‐1336
Table of Contents
Introduction ................................................................................................................................. 1
Executive Summary ...................................................................................................................... 2
Detailed Analysis .......................................................................................................................... 4
Modes of Transportation ......................................................................................................... 4
Overall Perceptions Regarding Road and Sidewalk Safety ...................................................... 6
Overall Perceptions Regarding Drivers, Pedestrians and Bicyclists ......................................... 7
Unaided Awareness of Pedestrian Safety Ads ....................................................................... 23
Post‐Wave, Awareness of Pedestrian Safety Ads .................................................................. 27
Post‐Wave, Awareness of Crosswalk Awareness Day ........................................................... 38
Study Methodology .................................................................................................................... 39
Appendices:
A: Survey Questionnaire
B: Tabular Results

2014 Traffic Safety Awareness: Post‐Campaign
Corporate Research Associates Inc., 2014
1
Introduction
The Halifax Regional Municipality commissioned Corporate Research Associates Inc. (CRA) to conduct the
2014 Traffic Safety Awareness Study. This study involved two parts: a pre‐wave study conducted prior to
traffic safety advertisements and communications targeting the Halifax Municipality, and a post‐wave
study conducted shortly after the conclusion of the campaign. The overall purpose of this research was to
understand residents’ perceptions of their responsibility in ensuring safety on the roads, as well as to
assess the impact of a new advertising campaign on the topic of road safety. More specifically, this
research aimed to:
Determine how residents define their role in traffic safety;
Assess overall concern for safety when travelling in Halifax, for drivers, pedestrians and cyclists;
Assess how residents’ choice of transportation mode may or may not impact their views;
Assess residents’ behaviour when using crosswalks in Halifax;
Assess resident awareness of 2014 ‘Heads Up Halifax’ Campaign and Crosswalk Awareness Day;
Determine who residents believe has responsibility for traffic safety; and
Determine if there have been any behaviour changes among residents, as a result of the campaign.
In fulfillment of the study objectives, for each wave of the study a total of 402 online surveys were
collected with adult residents of Halifax. Specifically, respondents included a mix of demographics
including representation across urban and rural communities within Halifax. The pre‐wave was conducted
from October 14th to 18th, 2014 as the campaign launched on October 19th, 2014, and the average
interview length for the pre‐wave survey was 11 minutes. The post‐wave was conducted from December
11th to 16th, several days after the conclusion of the campaign and excluded anyone who completed the
pre‐wave survey. The average interview length for the post‐wave survey was 17.5 minutes.
In both waves of the survey, aided and unaided questions were posed to residents of the Municipality in
order to determine awareness. Aided questions were designed to include a list of possible answers offered
as prompts to respondents to aid in their recall. Alternatively, unaided questions were designed to gather
only top‐of‐mind responses from residents, and therefore included no prompts. Note, a few of the survey
questions were based on the 2013 Crosswalk Safety Study survey. Where possible, comparisons to both
the pre‐wave results from this year, and the 2013 post‐wave study were made in order to gauge possible
changes to public opinion on certain issues.
This detailed report provides an Executive Summary of the findings, a Detailed Analysis of the study
results, as well as a Study Methodology. Appended to the report is a copy of the post‐wave survey
(Appendix A), as well as tabular results for each question for this phase (Appendix B). Consistent with the
2014 pre‐wave report, tabular results for each question are broken down by key demographic subgroups.

2014 Traffic Safety Awareness: Post‐Campaign
Corporate Research Associates Inc., 2014
2
Executive Summary
Results of the 2014 Traffic Safety Post‐Campaign Study reveal strong support for the campaign among
residents, with a clear indication that the topic of traffic safety clearly remains a high profile issue among
citizens. Study results revealed that a strong majority of residents reported having recently seen or heard
advertisements and/or messaging related to pedestrian, cyclist or driver safety. That said, results show
that while message link performed reasonably well and there was low wear‐out among residents who saw
the Halifax‐sponsored ad, the campaign had modest levels of recall. Indeed, the 2014 ‘Heads Up Halifax’
campaign was viewed by one‐quarter (25%) of residents indicating they had seen at least one of the print
or online ads, or heard one of the radio ads. It is important to note, however, that the general increase in
media coverage regarding vehicle‐pedestrian collisions during the campaign’s run may have played a factor
in moderate ad recall for this campaign, as increased media coverage on the topic of traffic safety in
general may have made it more difficult for the ads to ‘break through’.
Pointing to the efficacy of the campaign’s messaging, it is important to note that residents with previous
exposure to the Campaign prior to the survey are notably more likely to assign responsibility for safety on
the roads and sidewalk at the individual level and are more likely to agree the ads make them more
concerned about crosswalk safety and the importance of staying alert. Furthermore, residents with
previous exposure to the campaign are also more likely to indicate taking part in various crosswalk safety
measures (e.g., always waiting for vehicles to stop before proceeding through a crosswalk).
The ‘Heads Up Halifax’ Campaign advertisements performed well on various impact metrics. Indeed,
seven‐in‐ten or more residents offered some level of agreement that the ads were an effective way to
raise awareness about crosswalk safety issues, that the ads made them more aware of staying alert when
travelling on Halifax’s roads, and that the ads made them more concerned about crosswalk safety.
Overall, the campaign was viewed positively, with more than eight‐in‐ten residents holding a favourable
view of the ‘Heads Up Halifax’ campaign, with a third having a completely favourable view. Further,
virtually all residents offered some level of support for the Halifax Regional Municipality’s efforts in
sponsoring advertising concerning the importance of crosswalk safety, with two‐thirds offering their
complete support.
Opinions regarding the overall purpose of the campaign were generally on point with residents most
commonly associating the Campaign’s main message to be encouraging residents to avoid distractions
while driving/walking, avoiding cell phone use while driving/walking, or to be more aware of their physical
surroundings while commuting around the City. In terms of campaign impact, a clear majority of residents
view the campaign as being an effective way to raise awareness regarding crosswalk safety issues.
Furthermore, a clear majority indicate that the ads make them more concerned about crosswalk safety
and more aware of the need to stay alert.
Despite virtually all residents perceiving themselves as being actively aware of their surroundings, and
widespread public perception that motorists are generally safe when travelling Halifax, there remain

2014 Traffic Safety Awareness: Post‐Campaign
Corporate Research Associates Inc., 2014
3
higher levels of concern regarding pedestrian and cyclist safety. Indeed, six‐in‐ten residents view the City
as being an unsafe place for cyclists to commute in, while nearly one‐half view it as being an unsafe place
for pedestrians. Moreover, a strong minority of residents overall view the City as being a generally less
safe place to travel compared to one year ago. That said, nearly half of residents indicate road and
sidewalk safety as being only top‐of‐mind when they see, hear or read about someone getting injured. It is
also important to note that, compared to pre‐wave results, there has been a marked decline in the
proportion of residents indicating they have been distracted while driving a motor vehicle in the past
month.
While there was a high level of support in the Municipality’s efforts in sponsoring such a campaign, more
than one‐half were unable to correctly identify the Municipality as the campaign sponsor, suggesting there
may be an opportunity to increase sponsor awareness for future Municipality campaigns. While few
residents were able to provide unaided commentary or suggestions regarding the campaign, among those
who did provide a response, the most common suggestions for improvement related to increasing
promotion of the campaign, ensuring better policing of the rules and regulations related to traffic safety,
and ensuring crosswalks are properly marked.
Overall, post‐wave results reveal that traffic safety remains an area of continued concern amongst Halifax
residents. Moreover, there appear to be opportunities to build upon the campaign and further encourage
the adoption of various driver and pedestrian measures to improve traffic safety overall, given the notable
gaps in perceptions between those who recall seeing the campaign prior to the survey and those not
previously exposed to the ads, and gaps in perceptions between those previously aware of Crosswalk
Awareness Day and those not familiar with the event.

2014 Traffic Safety Awareness: Post‐Campaign
Corporate Research Associates Inc., 2014
4
Detailed Analysis
Modes of Transportation Consistent with pre‐wave results, motor vehicle travel is clearly the mode of transportation used most
frequently among Halifax residents.
As may be expected, the frequency of travelling by specific modes of transportation remains consistent
with pre‐wave results. Indeed, motor vehicles remain the most frequently‐used mode of travel for
residents, with nearly two‐thirds (61%, down 2 points from pre‐wave results) of residents indicating they
use this form of transportation on a daily basis. Conversely, one‐quarter (26%, down 1 point) indicate they
walk to and from their destination daily. Given the time of year, it is also perhaps unsurprising that no one
reports using a bicycle with the same frequency (0%, down 2 points). (Tables 20a‐c)
Males, residents between the ages of 35 and 54, those with higher annual household incomes, and those
with higher education levels are more likely than their respective counterparts to indicate they drive a
motor vehicle on a daily basis. Furthermore, consistent with the pre‐wave results, residents who are
employed are more likely than retirees to report driving on a daily basis (71% vs. 48%), while residents of
central Halifax remain less likely than residents of other areas of the City to report driving on a daily basis
(Halifax: 51% vs. Dartmouth: 61%, Bedford/Sackville: 73% and Rest of Halifax: 73%).
The likelihood of walking to and from destinations on a daily basis decreases notably with age (Daily: 18‐
34: 44%, 35‐54: 21% and 55+: 14%). Moreover, retirees and those with annual household incomes above
$100,000 are less likely than their respective counterparts to walk daily to and from their destination.
Of note, residents of central Halifax are less likely than Halifax residents overall to indicate never walking
2014 Traffic Safety Awareness: Post‐Campaign
Corporate Research Associates Inc., 2014
5
to and from their destination (4% vs. 10%). Furthermore, residents with a high school education or less are
also more likely than those with higher education levels to indicate never walking to and from their
destination (H.S. or less: 18% vs. Some P.S.: 8% and Grad P.S.: 9%).
Given the time of year in which data collection occurred for the post‐wave, it is perhaps not surprising that
virtually no one indicated they used a bicycle to travel to and from their destination on a daily basis.
Moreover, residents 55 years of age or older, residents with high school or less education, and retirees are
more likely than their respective counterparts to report never using this mode of transportation to travel.
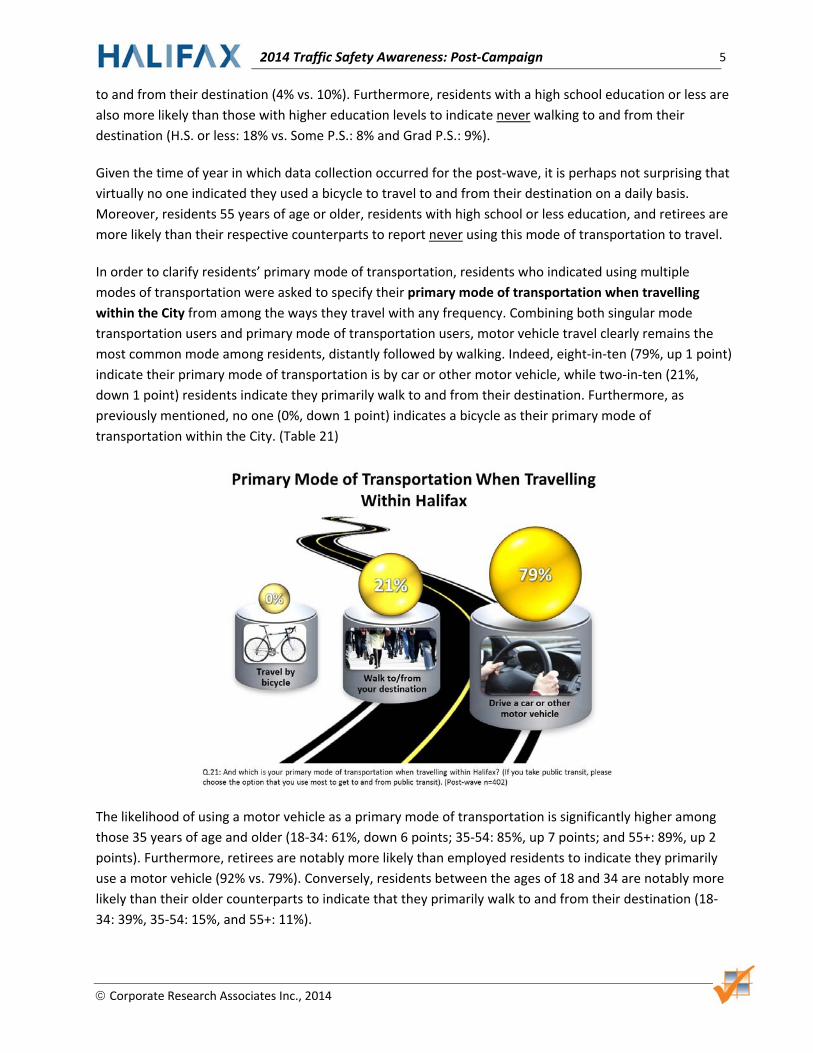
In order to clarify residents’ primary mode of transportation, residents who indicated using multiple
modes of transportation were asked to specify their primary mode of transportation when travelling
within the City from among the ways they travel with any frequency. Combining both singular mode
transportation users and primary mode of transportation users, motor vehicle travel clearly remains the
most common mode among residents, distantly followed by walking. Indeed, eight‐in‐ten (79%, up 1 point)
indicate their primary mode of transportation is by car or other motor vehicle, while two‐in‐ten (21%,
down 1 point) residents indicate they primarily walk to and from their destination. Furthermore, as
previously mentioned, no one (0%, down 1 point) indicates a bicycle as their primary mode of
transportation within the City. (Table 21)
The likelihood of using a motor vehicle as a primary mode of transportation is significantly higher among
those 35 years of age and older (18‐34: 61%, down 6 points; 35‐54: 85%, up 7 points; and 55+: 89%, up 2
points). Furthermore, retirees are notably more likely than employed residents to indicate they primarily
use a motor vehicle (92% vs. 79%). Conversely, residents between the ages of 18 and 34 are notably more
likely than their older counterparts to indicate that they primarily walk to and from their destination (18‐
34: 39%, 35‐54: 15%, and 55+: 11%).

2014 Traffic Safety Awareness: Post‐Campaign
Corporate Research Associates Inc., 2014
6
Overall Perceptions Regarding Road and Sidewalk Safety Residents continue to consider themselves as being actively aware of their surroundings when travelling;
however, consistent with the pre‐wave of the study, a significant minority admit that road and sidewalk
safety is only top‐of‐mind when learning about someone being injured in a traffic‐related incident.
Virtually all (99%, up 1 point) residents offer some level of agreement that they actively try to be aware of
their surroundings to ensure personal and others’ safety, with eight‐in‐ten (80%, down 3 points) offering
complete agreement to this statement. Consistent with pre‐wave results, females are more likely than
males to offer complete agreement that they are actively aware of their surroundings (87% vs. 73%).
Furthermore, those familiar with the recent campaign, and residents 55 years of age and older are more
likely than their respective counterparts to completely agree they are actively aware of their surroundings.
(Table 27b)
Nearly one‐half (45%, up 2 points) of residents offer some level of agreement that road and sidewalk
safety is generally only top‐of‐time when they see, hear or read about someone getting injured.
Interestingly, younger residents, residents with lower annual household incomes and those with high
school education or less are more likely than their respective counterparts to indicate road and sidewalk
safety is only top‐of‐mind when they see, hear or read about someone getting injured. (Table 27a)

2014 Traffic Safety Awareness: Post‐Campaign
Corporate Research Associates Inc., 2014
7
Overall Perceptions Regarding Drivers, Pedestrians and Bicyclists
The vast majority of residents feel they are aware of the rules governing traffic lights and crosswalks for
motorists and cyclists, and about the rights and responsibilities of cyclists. That said, consistent with the
pre‐wave, only one‐half of residents believe the majority of motorists understand how to drive safely
around cyclists.
Consistent with the pre‐wave, one‐half (51%, up 3 points) of residents offer some level of agreement that
motorists understand how to drive safely around bikes and bike lanes; that said, only seven percent (up
one point) offer complete agreement with this statement. Males, residents 55 years of age and older, and
residents who were aware of Crosswalk Awareness Day are more likely than their respective counterparts
to offer some level of agreement with this statement. (Table 29a)
One‐half (51%, up 4 points) of residents completely agree that they are fully aware of the rules about how
cars and bicycles should stop at traffic lights and crosswalks, while slightly fewer (40%, down 5 points) mostly
agree that they are aware of such rules. Males and residents aware of Crosswalk Awareness Day are more
likely than their respective counterparts to offer complete agreement that they are aware of these rules.
Moreover, residents 35 years of age and older are more likely than their younger counterparts to offer some
level of agreement that they are fully aware of these rules (18‐34: 85%, 35‐54: 93%, and 55+: 96%). (Table 29b)
Eight‐in‐ten (82%, down 1 point) residents offer some level of agreement that they are fully aware of the
rights and responsibilities of bicycles on the road, with one‐third of residents (33%, up 5 points) indicate
complete agreement with this statement. Of note, residents 35 years of age and older are more likely than
their younger counterparts to offer some level of agreement with this statement (18‐34: 75%, 35‐54: 84%,
and 55+: 88%). Moreover, residents with a high school education or less, retirees and those aware of
Crosswalk Awareness Day are more likely to offer complete agreement regarding their awareness of the
rights and responsibilities of bicycles on the road. (Table 29c)

2014 Traffic Safety Awareness: Post‐Campaign
Corporate Research Associates Inc., 2014
8
Perceptions of Halifax as a safe place to travel have declined compared with pre‐wave results.
Respondents were asked if they thought Halifax’s roads, sidewalks and crosswalks were generally safer, as
safe, or less safe to one year ago. While one‐half view the City as being generally as safe as it was one year
ago, more than four‐in‐ten (42%) view the City as being a less safe place to travel. Overall, females and
residents 55 years of age and older are more likely than their respective counterparts to view the City as
being less safe, while males and those aware of Crosswalk Awareness Day are more likely than their
respective counterparts to view the City as being safer than a year ago. (Table 22a)
Compared to the pre‐wave, fewer residents view the City as being a safe place to travel for motorists and
pedestrians. Indeed, slightly fewer than nine‐in‐ten (85%, down 6 points) residents believe Halifax is at
least a generally safe place to travel for motorists, while just over one‐half (55%, down 6 points) believe it
is at least a generally safe place to travel for pedestrians. This decline in perception of Halifax as being a
safe place to travel for motorists and pedestrians may be in part due to an increase in media coverage
regarding vehicle‐pedestrian accidents in recent weeks. That said, perceptions regarding how safe it is for
cyclists to travel in the City remains virtually unchanged, with four‐in‐ten (39%, up 1 point) indicating that
it is at least a generally safe place to travel for cyclists.
Consistent with the pre‐wave, only two percent report Halifax as an extremely safe place to travel for
pedestrians (down 3 points), and only one percent believe Halifax is an extremely safe place for cyclists to
travel (down 3 points). Interestingly, compared to the pre‐wave, fewer residents now believe Halifax is an
extremely safe place to travel for motorists (9%, down 8 points). (Tables 22 Motorists, Pedestrians,
Cyclists)

2014 Traffic Safety Awareness: Post‐Campaign
Corporate Research Associates Inc., 2014
9
Of note, the likelihood of considering Halifax as a safe place to travel for motorists increases with age (18‐
34: 75%, 35‐54: 86%, and 55+: 93%). Moreover, retirees are more likely than employed residents and
unemployed/students to consider Halifax safe for motorists (retired: 93% vs. employed: 85% and
unemployed/students: 71%).
The likelihood of considering Halifax as being a generally safe place to travel for pedestrians increases with
age (18‐34: 45%, 35‐54: 57%, and 55+: 62%), and males are more likely than females to view the City as
being a safe place for pedestrians (59% vs. 51%).
Finally, males are more likely than females to feel that Halifax is generally a safe place to travel for cyclists
(44% vs. 35%).

2014 Traffic Safety Awareness: Post‐Campaign
Corporate Research Associates Inc., 2014
10
Overall, slightly fewer residents view pedestrians as being at least mostly aware of their surroundings
compared to two months ago.
Three‐quarters (73%, unchanged) of residents indicate motorists are at least mostly aware of their
surroundings when travelling in the City, while slightly fewer residents (68%, down 5 points) are at least
mostly aware of their surroundings. Conversely, less than one‐half (44%, down 7 points) of residents think
pedestrians are at least mostly aware of their surroundings. That said, it is important to note that no more
than one‐in‐ten residents feel people are completely aware of their surroundings when travelling,
regardless of the mode of transportation chosen (Motorists: 4%, down 1 point; Pedestrians: 2%, down 3
points; and Cyclists: 7%, down 3 points), revealing a continued, general acknowledgement of distraction
when travelling. (Tables 28a‐c)
Residents 35 years of age and older are more likely than residents between the ages of 18 and 34 to
believe motorists are at least mostly aware of their surroundings (55+: 78%, unchanged and 35‐54: 76%,
unchanged vs. 18‐34: 64%, up 2 points). Conversely, employed residents are less likely than retirees to
view motorists as being at least mostly aware (74% vs. 85%). Residents of central Halifax are also less likely
to view motorists as being at least mostly aware compared to residents of other areas of the City (Central
Halifax: 66% vs. Dartmouth: 76%, Bedford/Sackville: 82%, and Rest of Halifax: 77%).
Residents who are aware of Crosswalk Awareness Day are more likely than those unaware of the event to
consider pedestrians as being at least mostly aware of their surroundings while travelling (51% vs. 42%),
and to consider cyclists as being at least mostly aware of their surroundings (76% vs. 65%).
2014 Traffic Safety Awareness: Post‐Campaign
Corporate Research Associates Inc., 2014
11
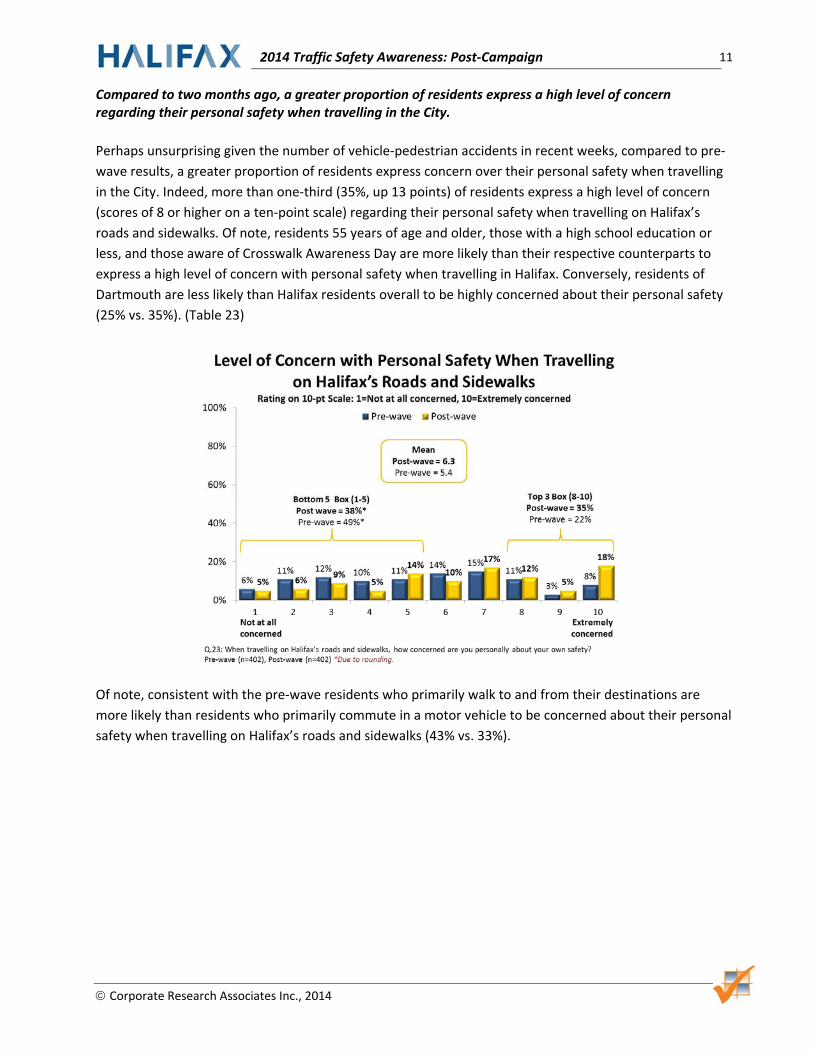
Compared to two months ago, a greater proportion of residents express a high level of concern regarding their personal safety when travelling in the City.
Perhaps unsurprising given the number of vehicle‐pedestrian accidents in recent weeks, compared to pre‐
wave results, a greater proportion of residents express concern over their personal safety when travelling
in the City. Indeed, more than one‐third (35%, up 13 points) of residents express a high level of concern
(scores of 8 or higher on a ten‐point scale) regarding their personal safety when travelling on Halifax’s
roads and sidewalks. Of note, residents 55 years of age and older, those with a high school education or
less, and those aware of Crosswalk Awareness Day are more likely than their respective counterparts to
express a high level of concern with personal safety when travelling in Halifax. Conversely, residents of
Dartmouth are less likely than Halifax residents overall to be highly concerned about their personal safety
(25% vs. 35%). (Table 23)
Of note, consistent with the pre‐wave residents who primarily walk to and from their destinations are
more likely than residents who primarily commute in a motor vehicle to be concerned about their personal
safety when travelling on Halifax’s roads and sidewalks (43% vs. 33%).

2014 Traffic Safety Awareness: Post‐Campaign
Corporate Research Associates Inc., 2014
12
Three‐quarters (77%, down 2 points) of residents express a high level of commitment for ensuring personal
and others’ safety when travelling on Halifax’s roads and sidewalks. Females, residents with annual
household incomes of $100,000 or more, residents previously aware of the Municipality’s campaign and
retirees are more likely than their respective counterparts to indicate they feel high levels of commitment
in this regard. Moreover, the likelihood of expressing high commitment for ensuring personal and others’
safety when travelling increases with age (18‐34: 69%, 35‐54: 75%, and 55+: 86%). (Table 24)

2014 Traffic Safety Awareness: Post‐Campaign
Corporate Research Associates Inc., 2014
13
Interestingly, when asked, unaided, who is responsible for safety on the roads and sidewalks of Halifax,
results remain virtually unchanged from the pre‐campaign. Indeed, two‐thirds (64%, unchanged) believe
safety is everyone’s responsibility, distantly followed by drivers alone (32%, up 1 point), pedestrians alone
(29%, down 1 point), cyclists alone (12%, down 2 points), and the Municipality (13%, down 1 point). Fewer
than one‐in‐ten mentioned any alternative organization as being responsible. (Table 25)
Pointing to the efficacy of the campaign, residents previously aware of the Municipality’s ads are more
likely than those who did not see the campaign prior to the completing the survey to assign responsibility
for safety to everyone (67% vs. 55%). Conversely, residents who were unaware of the campaign were
more likely to identify pedestrians alone as being responsible for safety on City roads and sidewalks (35%
vs. 27%). Females are also more likely than males to cite pedestrians alone (32% vs. 25%) or cyclists alone
(15% vs. 8%) as being responsible.
Residents of central Halifax, those between the ages of 35 and 54, and residents with annual household
incomes of $75‐100,000 were less likely than their respective counterparts to report road and sidewalk
safety as being everyone’s responsibility. Of note, residents of central Halifax are more likely than
residents of other areas of the City to assign responsibility to drivers (Central Halifax: 38%, Dartmouth:
28%, Bedford/Sackville: 30%, Rest of Halifax: 27%).
2014 Traffic Safety Awareness: Post‐Campaign
Corporate Research Associates Inc., 2014
14
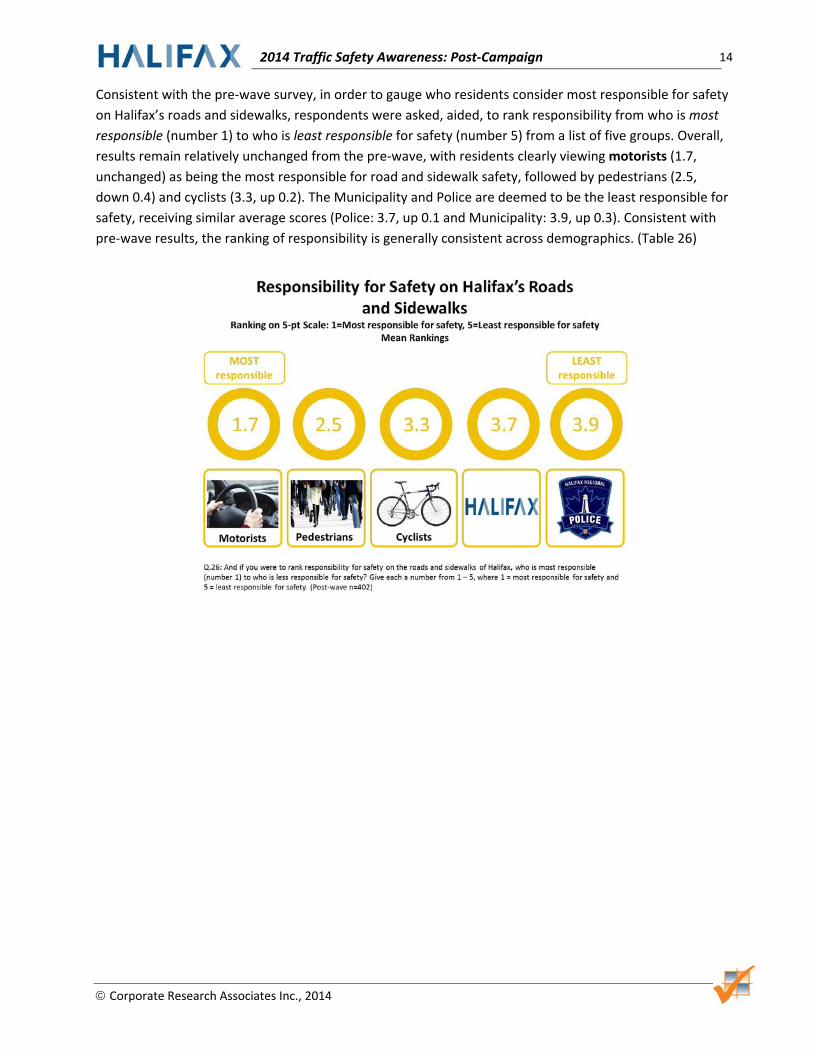
Consistent with the pre‐wave survey, in order to gauge who residents consider most responsible for safety
on Halifax’s roads and sidewalks, respondents were asked, aided, to rank responsibility from who is most
responsible (number 1) to who is least responsible for safety (number 5) from a list of five groups. Overall,
results remain relatively unchanged from the pre‐wave, with residents clearly viewing motorists (1.7,
unchanged) as being the most responsible for road and sidewalk safety, followed by pedestrians (2.5,
down 0.4) and cyclists (3.3, up 0.2). The Municipality and Police are deemed to be the least responsible for
safety, receiving similar average scores (Police: 3.7, up 0.1 and Municipality: 3.9, up 0.3). Consistent with
pre‐wave results, the ranking of responsibility is generally consistent across demographics. (Table 26)
2014 Traffic Safety Awareness: Post‐Campaign
Corporate Research Associates Inc., 2014
15
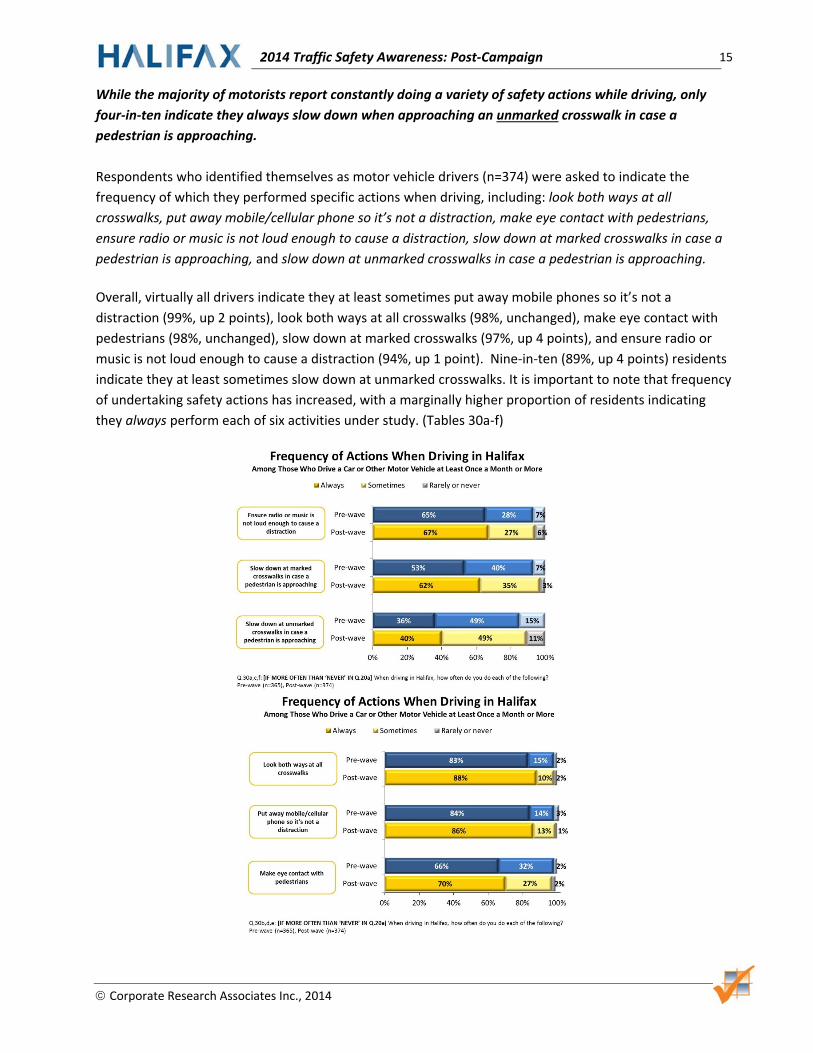
While the majority of motorists report constantly doing a variety of safety actions while driving, only
four‐in‐ten indicate they always slow down when approaching an unmarked crosswalk in case a
pedestrian is approaching.
Respondents who identified themselves as motor vehicle drivers (n=374) were asked to indicate the
frequency of which they performed specific actions when driving, including: look both ways at all
crosswalks, put away mobile/cellular phone so it’s not a distraction, make eye contact with pedestrians,
ensure radio or music is not loud enough to cause a distraction, slow down at marked crosswalks in case a
pedestrian is approaching, and slow down at unmarked crosswalks in case a pedestrian is approaching.
Overall, virtually all drivers indicate they at least sometimes put away mobile phones so it’s not a
distraction (99%, up 2 points), look both ways at all crosswalks (98%, unchanged), make eye contact with
pedestrians (98%, unchanged), slow down at marked crosswalks (97%, up 4 points), and ensure radio or
music is not loud enough to cause a distraction (94%, up 1 point). Nine‐in‐ten (89%, up 4 points) residents
indicate they at least sometimes slow down at unmarked crosswalks. It is important to note that frequency
of undertaking safety actions has increased, with a marginally higher proportion of residents indicating
they always perform each of six activities under study. (Tables 30a‐f)

2014 Traffic Safety Awareness: Post‐Campaign
Corporate Research Associates Inc., 2014
16
Drivers with lower levels of education are more likely to indicate they always slow down at marked
crosswalks (H.S. or less: 83%, Some P.S.: 66%, Grad P.S.: 57%). Conversely, those unaware of Crosswalk
Awareness Day and residents between the ages of 35 and 54 are less likely than their respective
counterparts to indicate they always slow down at marked crosswalks in case pedestrians are approaching.
Moreover, drivers with a high school education or less and those with annual household incomes below
$75,000 are both more likely than their respective counterparts to indicate they always slow down at
unmarked crosswalks.
Drivers previously aware of the Municipality’s campaign are more likely than those previously unexposed
to indicate they always make eye contact with pedestrians (72% vs. 65%).
Drivers with some post‐secondary education are less likely than those with higher or lower educations
levels to report always looking both ways at all crosswalks (H.S. or Less: 92%, Some P.S.: 79%, Grad P.S.:
90%).
Consistent with pre‐wave results, the likelihood of reporting always putting away mobile phones to avoid
distractions increases with age (18‐34: 76%, 35‐54: 84%, and 55+: 95%). Moreover retired drivers and
those aware of Crosswalk Awareness Day are more likely to report always putting away their mobile
phones.
Finally, drivers 55 years of age and older, drives with annual household incomes below $75,000, drivers
with lower education levels and those aware of Crosswalk Awareness Day are more likely than their
respective counterparts to indicate they always ensure the radio or music is not loud enough to cause a
distraction.

2014 Traffic Safety Awareness: Post‐Campaign
Corporate Research Associates Inc., 2014
17
Consistent with the pre‐wave, while the vast majority of pedestrians indicate they put away their mobile
phone so it’s not a distraction when crossing the street, two‐in‐ten admit they at least sometimes text or
use a cell phone when walking through a crosswalk.
Similar to the questions asked to motorists, respondents who identified themselves as pedestrians (n=359)
were asked to indicate the frequency of which they performed specific actions when crossing the street,
including: take out headphones, make eye contact with drivers, put away mobile/cellular phone so it’s not
a distraction, look both ways at all crosswalks, wear highly visible/bright clothing to be more visible to
drivers at night, text or use cell phone, and ensure vehicles are stopped before proceeding.
All or virtually all pedestrians indicate they at least sometimes ensure vehicles are stopped before
proceeding (100%, unchanged), look both ways at all crosswalks (100%, up 1 point), make eye contact with
drivers (97%, down 1 point), and put away mobile phone so it’s not a distration (91%, down 1 point).
Furthermore, more than eight‐in‐ten pedestrians indicate they at least sometimes wear highy
visible/bright clothing to be visible to drivers at night (84%, up 5 points), while three‐quarters indicate they
take out headphones (73%, up 6 points). Conversely, two‐in‐ten (18%, down 5 points) of pedestrians admit
they at least sometimes text or use a cell phone while crossing the street. Of note, the frequency of
residents reporting that they look both ways at all crosswalks has changed from the pre‐wave results with
a higher proportion of residents indicating that they always do this when crossing the street as a
pedestrian. (Tables 31a‐g)
Female pedestrians and older pedestrians are more likely than their respective counterparts to indicate
they always take out headphones, make eye contact with drivers, put away mobile phone so it’s not a
distraction, and ensure vehicles are stopped before proceeding. Furthermore, with the exception of
making eye contact with drivers, retired pedestrians are also more likely than those employed to indicate
they always perform each of these four activities, and retirees and those aware of Crosswalk Awareness
Day are more likely than their respective counterparts to indicate they always wear highly visible clothing
so drivers can see them at night.

2014 Traffic Safety Awareness: Post‐Campaign
Corporate Research Associates Inc., 2014
18
Finally, also evidence of campaign efficacy, residents with no previous exposure to the Municipality’s
campaign are more likely than those with previous exposure to indicate they always ensure vehicles are
stopped before proceeding (92% vs. 83%), and residents aware of Crosswalk Awareness Day are more
likely than those not familiar to indicate they always wear highly visible clothing at night (33% vs. 22%). Of
note, having fewer hours of daylight during the winter months may explain, at least in part, the marginal
increase in the proportion of post‐wave respondents indicating they always wear highly visible clothing.

2014 Traffic Safety Awareness: Post‐Campaign
Corporate Research Associates Inc., 2014
19
Compared to two months ago, fewer residents report having been distracted while driving a motor
vehicle in the past month. That said, the frequency of distraction appears to have gone up among those
who have been distracted
Marking an overall decline, four‐in‐ten (41%, down 10 points) motorists state that in the last month they
have been distracted while driving, and among those, half (51%, up 10 points) report having been
distracted at least once a week or more. An additional three‐in‐ten (29%, down 2 points) report being
distracted a few times a month, while two‐in‐ten (20%, down 7 points) indicate they are distracted at least
once a month. (Tables 32 & 33)
Employed motorists are more likely than retirees to report having been distracted while driving in the past
month (47% vs. 27%), and motorists with previous exposure to the Municipality’s campaign are more likely
than those who did not see the campaign to indicate they have been distracted (43% vs. 34%). Conversely,
the likelihood of reporting having been distracted while driving in the past month decreases with age (18‐
34: 49%, 35‐54: 44%, 55+: 31%). Of note, male motorists, motorists under the age of 55, and employed
motorists are more likely than their respective counterparts to indicate they have been distracted at least
once a week or more while driving.
2014 Traffic Safety Awareness: Post‐Campaign
Corporate Research Associates Inc., 2014
20
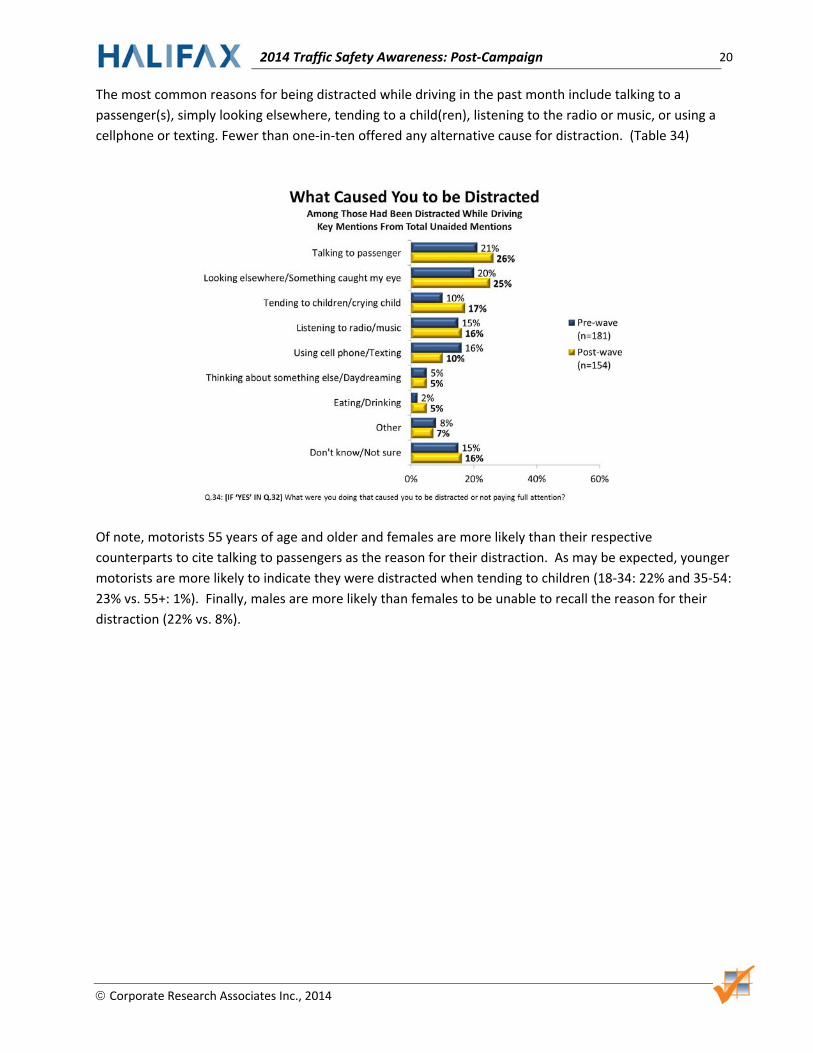
The most common reasons for being distracted while driving in the past month include talking to a
passenger(s), simply looking elsewhere, tending to a child(ren), listening to the radio or music, or using a
cellphone or texting. Fewer than one‐in‐ten offered any alternative cause for distraction. (Table 34)
Of note, motorists 55 years of age and older and females are more likely than their respective
counterparts to cite talking to passengers as the reason for their distraction. As may be expected, younger
motorists are more likely to indicate they were distracted when tending to children (18‐34: 22% and 35‐54:
23% vs. 55+: 1%). Finally, males are more likely than females to be unable to recall the reason for their
distraction (22% vs. 8%).

2014 Traffic Safety Awareness: Post‐Campaign
Corporate Research Associates Inc., 2014
21
Only one‐in‐ten (11%, up 2 points) pedestrians state that in the last month they have walked through a
marked or unmarked crosswalk in Halifax while distracted or not paying full attention. Among the few
who indicated being distracted while crossing a marked or unmarked crosswalk in the past month (n=28),
one‐quarter (26%, down 35 points) report having been distracted at least once a week or more. Note,
extremely small sample sizes warrant caution in the interpretation of these results. (Tables 35 & 36)
Among those distracted pedestrians surveyed, a third (33%) were unable to indicate the cause of their
distraction. That said, among those who offered a response, the most common reason for being distracted
while walking through a crosswalk is simply looking elsewhere. Other reasons include using a cell phone,
talking to someone, bad weather, listening to music, being in a rush, and daydreaming. (Table 37)
Of note, pedestrians between the ages of 18 and 34 are more likely than older pedestrians to report being
distracted (18‐34: 25% vs. 35‐54: 6% and 55+: 1%), and more likely to mention cell phone use and/or
texting as a reason for this distraction. That said, extremely small sample sizes warrant caution in the
interpretation of these results.

2014 Traffic Safety Awareness: Post‐Campaign
Corporate Research Associates Inc., 2014
22
Consistent with pre‐wave results, on average, residents indicate they experienced more than five close
calls whereby they were almost involved in a vehicle pedestrian collision in the past year.
All respondents were asked to indicate how many “close calls” they personally experienced in terms of
being almost involved in a vehicle‐pedestrian collision in Halifax within the last year ‐ either as a motorist
or as a pedestrian. Overall, residents indicate they experienced an average of 5.7 (up 0.6) close calls in the
last year. Residents of Bedford/Sackville report the lowest number of close calls (3.1, up 0.2) compared to
residents of central Halifax (5.6, down 1.2), Dartmouth (5.6, up 1.1), and Rest of Halifax (9.9, up 2.2). Again,
given the time of year in which post‐wave data collection occurred, specifically, with there being fewer
daytime hours, it is perhaps unsurprising that the number of close calls being reported increased
marginally from pre‐wave results. (Table 38)
Employed residents are also more likely than retirees to report a higher number of close calls (5.7 vs. 4.5),
and males are more likely than females to report a higher number of close calls (6.6 vs. 4.9). Moreover,
younger residents are more likely to report a higher number of close calls (18‐34: 7.7, 35‐54: 4.3, and 55+:
4.6). Finally, residents previously aware of the Municipality’s campaign are less likely than those previously
unaware of the campaign to report a higher number of close calls (4.9 vs. 8.5), while those aware of
Crosswalk Awareness Day are more likely than those unaware of the event to report a higher number of
close calls (7.5 vs. 5.1).

2014 Traffic Safety Awareness: Post‐Campaign
Corporate Research Associates Inc., 2014
23
Unaided Awareness of Pedestrian Safety Ads There is a high degree of unaided awareness regarding advertisements and/or messaging related to
pedestrian, cyclist or driver safety issues. Moreover, compared to two months ago, recall is higher for
topics related driver and pedestrian safety, clearly demonstrating the continued high profile of traffic
safety issues in Halifax.
Three‐quarters (77%, up one point) of residents recall recently seeing or hearing a radio, television,
newspaper, magazine, billboard, online advertisements, videos, or any other messages involving traffic
safety issues. Of note, recall of such advertisements was higher among those 55 years and older (18‐34:
75%, 35‐54: 73% and 55+: 84%). Moreover, as may be expected, residents who were aware of Crosswalk
Awareness Day were more likely than those unaware of the event to recall such advertisements (84% vs.
75%.
Among those who indicated they had seen or heard of advertisements and/or messaging related to traffic
safety issues (n=310), recall of advertisements related to pedestrian safety was strongest (85%, up 10
points), distantly followed by driver safety (51%, up 11 points) and cyclist safety (39%, down 8 points). The
likelihood of recalling advertisements on pedestrian safety increases with age (18‐34: 76%, 35‐54: 83% and
55+: 94%). Moreover, retirees are more likely than employed residents to recall pedestrian‐related
advertisements (92% vs. 83%). Finally, residents aware of Crosswalk Awareness Day are more likely than
those unfamiliar with the event to recall advertisements related to driver safety (57% vs. 49%).
(Tables 4 & 5)

2014 Traffic Safety Awareness: Post‐Campaign
Corporate Research Associates Inc., 2014
24
When residents were asked, unaided, what they specifically recall about the advertisements they heard or
seen about pedestrian, cyclist or driver safety, accidents/pedestrians being hit in crosswalks is the
advertisement recalled most often (28%, up 14 points), while more than one‐in‐ten (12%) residents
recalled advertisements related to the need for pedestrians/drivers to pay attention. Two‐in‐ten (19%)
were unable to recall any details regarding the advertisement they saw. All other topics were mentioned
by fewer than one‐in‐ten residents. (Table 6)

2014 Traffic Safety Awareness: Post‐Campaign
Corporate Research Associates Inc., 2014
25
Television, radio and newspapers are the most frequently mentioned media vehicles for pedestrian, cyclist
or driver safety advertisements and/or messaging. Fewer than two‐in‐ten mentioned recalling safety
advertisements through alternative advertising mediums including word‐of‐mouth, online, social media,
outdoor advertising, or through an authority or public service announcements.
Of note, the likelihood of recall via television increases with age, while recall via social media and outdoor
advertising decreases with age. Moreover, females are more likely than males to report recall via a
number of mediums including television, radio, newspaper/magazines, word‐of‐mouth, and social media.
Finally, employed residents are more likely to recall advertisements via social media, outdoor
advertisements and/or radio, while retirees are more likely to recall advertisements via television and
newspaper. (Table 7)

2014 Traffic Safety Awareness: Post‐Campaign
Corporate Research Associates Inc., 2014
26
Unaided, one‐in‐seven (14%, down 2 points) residents who state an unaided awareness of recent
advertisements on pedestrian, cyclist and/or driver safety, identify the municipality (HRM) as the sponsor
of the traffic safety messaging, while six‐in‐ten (60%, down 7 points) are unable to identify the ad sponsor.
Of note, females are more likely than males to be unable to recall the sponsor of the advertisement they
saw (66% vs. 55%), while residents 55 years of age and older are also more likely than their younger
counterparts to be unable to recall the ad sponsor (55+: 67% vs. 18‐34: 58% and 35‐54: 55%). (Table 8)
2014 Traffic Safety Awareness: Post‐Campaign
Corporate Research Associates Inc., 2014
27
Post‐Wave, Awareness of Pedestrian Safety Ads
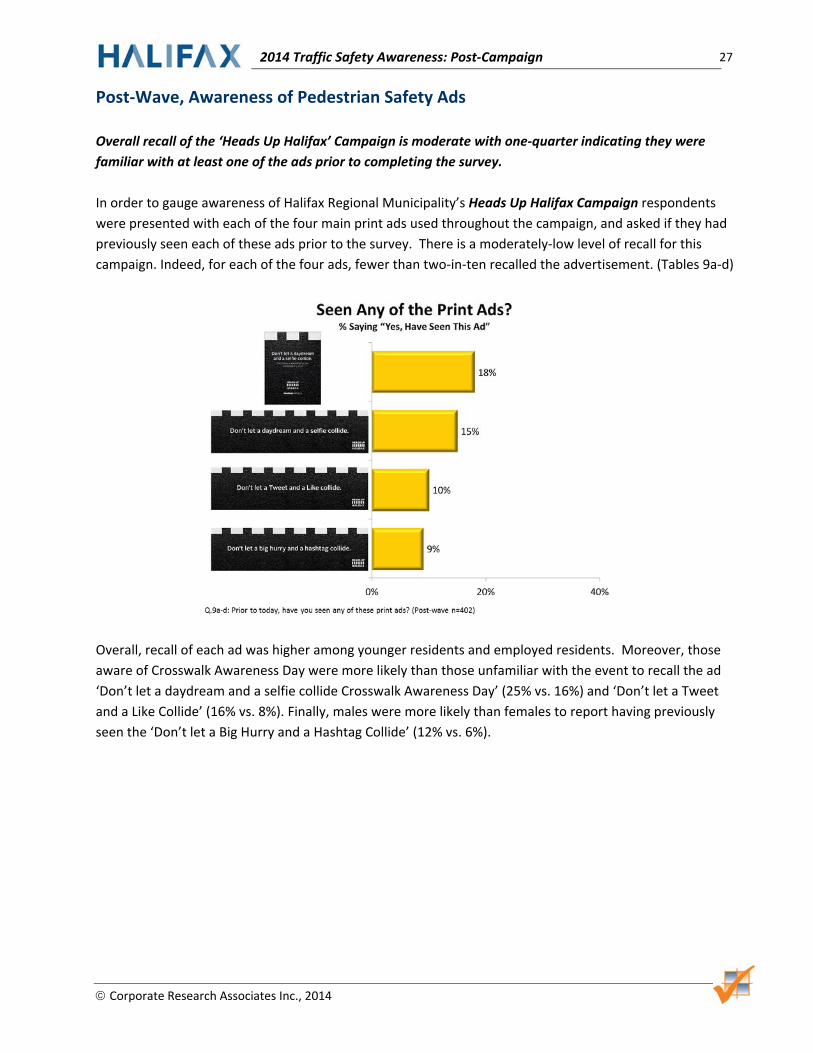
Overall recall of the ‘Heads Up Halifax’ Campaign is moderate with one‐quarter indicating they were
familiar with at least one of the ads prior to completing the survey.
In order to gauge awareness of Halifax Regional Municipality’s Heads Up Halifax Campaign respondents
were presented with each of the four main print ads used throughout the campaign, and asked if they had
previously seen each of these ads prior to the survey. There is a moderately‐low level of recall for this
campaign. Indeed, for each of the four ads, fewer than two‐in‐ten recalled the advertisement. (Tables 9a‐d)
Overall, recall of each ad was higher among younger residents and employed residents. Moreover, those
aware of Crosswalk Awareness Day were more likely than those unfamiliar with the event to recall the ad
‘Don’t let a daydream and a selfie collide Crosswalk Awareness Day’ (25% vs. 16%) and ‘Don’t let a Tweet
and a Like Collide’ (16% vs. 8%). Finally, males were more likely than females to report having previously
seen the ‘Don’t let a Big Hurry and a Hashtag Collide’ (12% vs. 6%).

2014 Traffic Safety Awareness: Post‐Campaign
Corporate Research Associates Inc., 2014
28
Unaided, on the exterior of a Halifax Transit bus is the location residents most commonly noted seeing the
campaign (40%), distantly followed by billboards (27%), the interior of a Halifax Transit bus (26%), Metro
News (24%), the print edition of the Chronicle Herald (19%), Facebook (13%) and online advertising (13%).
Fewer than one‐in‐ten cited seeing the campaign via alternative mediums. (Table 10)
Males are more likely to recall seeing the campaign on the exterior of a Halifax Transit bus (44% vs. 35%),
while females are more likely to recall seeing the campaign in the Chronicle Herald (25% vs. 14%).
Residents between the ages of 18 and 34 were more likely than their older counterparts to recall seeing
the campaign on the exterior of the Halifax Transit bus (18‐34: 45%, 35‐54: 37%, and 55+: 32%) and the
interior of the Halifax Transit bus (18‐34: 36%, 35‐54: 23%, 55+: 3%), while residents between the ages of
35 and 54 are more likely than their younger and older counterparts to recall seeing the campaign on a
billboards (18‐34: 14%, 35‐54: 47% and 55+: 8%), and resident 55 years of age and older are more likely to
report seeing the campaign in the Chronicle Herald (18‐34: 14%, 35‐54: 16%, 55+: 41%).
Finally, employed residents are more likely to recall the campaign on the Halifax Transit bus
(interior/exterior) and billboards, while retired residents are more likely to cite Metro News and the
Chronicle Herald as where they viewed the campaign.

2014 Traffic Safety Awareness: Post‐Campaign
Corporate Research Associates Inc., 2014
29
Results show that while message link performed reasonably well and there was low wear‐out among
residents who saw the Halifax‐sponsored ad, the campaign had modest levels of recall. Indeed, one‐
quarter (25%) of residents indicated having seen at least one of the print or online ads, or heard one of the
radio ads for the 2014 ‘Heads Up Halifax’ campaign. It is important to note, however, that the general
increase in media coverage regarding vehicle‐pedestrian collisions during the campaign’s run may have
played a factor in moderate ad recall for this campaign, as increased media coverage on the topic of traffic
safety in general may have made it more difficult for the ads to ‘break through’.

2014 Traffic Safety Awareness: Post‐Campaign
Corporate Research Associates Inc., 2014
30
Nearly one‐half (45%) of residents correctly identified the Municipality as the sponsor of this campaign,
while an additional six percent identified ‘Heads Up Halifax’ as the sponsor. No more than three percent
mentioned an alternative sponsor. (Table 11)
Of note, residents between the ages of 35 and 54 and employed residents are more likely than their
respective counterparts to correctly identify the Municipality as the sponsor.
2014 Traffic Safety Awareness: Post‐Campaign
Corporate Research Associates Inc., 2014
31
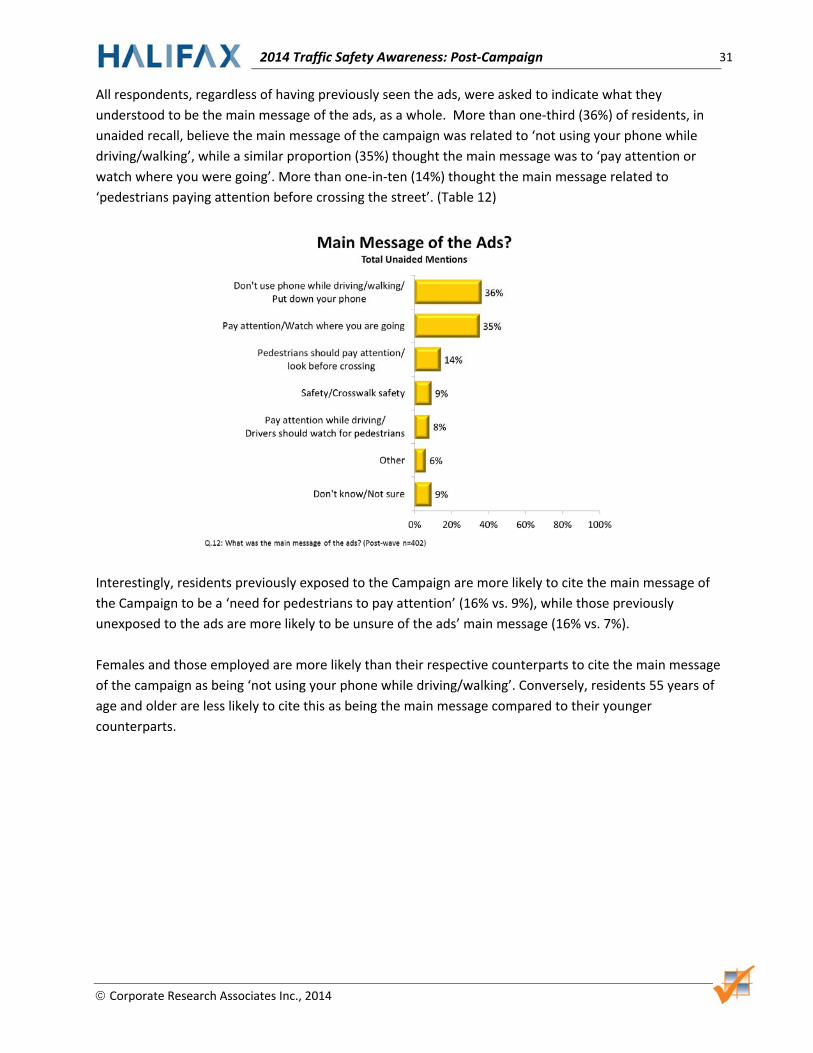
All respondents, regardless of having previously seen the ads, were asked to indicate what they
understood to be the main message of the ads, as a whole. More than one‐third (36%) of residents, in
unaided recall, believe the main message of the campaign was related to ‘not using your phone while
driving/walking’, while a similar proportion (35%) thought the main message was to ‘pay attention or
watch where you were going’. More than one‐in‐ten (14%) thought the main message related to
‘pedestrians paying attention before crossing the street’. (Table 12)
Interestingly, residents previously exposed to the Campaign are more likely to cite the main message of
the Campaign to be a ‘need for pedestrians to pay attention’ (16% vs. 9%), while those previously
unexposed to the ads are more likely to be unsure of the ads’ main message (16% vs. 7%).
Females and those employed are more likely than their respective counterparts to cite the main message
of the campaign as being ‘not using your phone while driving/walking’. Conversely, residents 55 years of
age and older are less likely to cite this as being the main message compared to their younger
counterparts.

2014 Traffic Safety Awareness: Post‐Campaign
Corporate Research Associates Inc., 2014
32
Aided, when asked the main message of the campaign, more than a third (35%) indicate ‘Avoid
Distractions While Driving or Walking’ as being the main message, while a quarter (25%) indicate the main
message is ‘Don’t Use Your Cell Phone When on the Road or Walking’. Two‐in‐ten (20%) recall ‘Be Aware
of Your Surroundings Regardless of How You’re Commuting’ as the main message of the recent ad
campaign, followed by ‘Safety on the Roads is a Shared Responsibility’ (12%). (Table 13)
Of note, females are more likely than males to recall the main message as being ‘Be Aware of Your Surroundings
Regardless of How You’re Commuting’ (24% vs. 15%). Finally, the likelihood of citing ‘Don’t Use Your Cell Phone
When on the Road or Walking’ as the Campaign’s main message decreases with age.

2014 Traffic Safety Awareness: Post‐Campaign
Corporate Research Associates Inc., 2014
33
The ‘Heads Up Halifax’ Campaign advertisements performed well on various desired impact metrics. Indeed,
seven‐in‐ten (69%) residents offer some level of agreement that the ads were an effective way to raise
awareness about crosswalk safety issues. Three‐quarters (76%) offer some level of agreement that the ads
made them more aware of staying alert when travelling on Halifax’s road, while a similar proportion (72%)
offer some level of agreement that the ads made them more concerned about crosswalk safety. Moreover,
only one‐in‐ten (9%) indicate they are getting tired of seeing the advertisements. (Tables 14a‐d)
Residents who have seen at least one of the ads prior to completing the survey were more likely than
residents seeing the ads for the first time to offer some level of agreement that the ads make them more
concerned about crosswalk safety (75% vs. 62%), make them more aware of staying alert when travelling
(78% vs. 67%), and perceive the ads as being an effective way to raise awareness about crosswalk safety
issues (72% vs. 60%). Moreover, residents aware of Crosswalk Awareness Day are also more likely than
those unfamiliar with the event to offer some level of agreement on these same three factors (78% vs.
70%, 83% vs. 73%, 75% vs. 67%, respectively).
Finally, males and residents between the ages of 35 and 54 are more likely than their respective
counterparts to offer some level of agreement that the ads are an effective means of raising awareness
about crosswalk safety.

2014 Traffic Safety Awareness: Post‐Campaign
Corporate Research Associates Inc., 2014
34
In terms of overall assessment of the campaign, more than eight‐in‐ten (83%) residents hold a favourable
view of the Heads Up Halifax campaign, with a third having a completely favourable view of the Campaign.
(Table 15)
Of note, males were more likely than females to indicate they held a completely or mostly favourable view
of the Campaign (87% vs. 80%). Moreover, residents who recalled seeing at least one of the ads prior to
the survey were more likely than those being exposed to the ad for the first time to hold a favourable view
of the campaign (87% vs. 73%).

2014 Traffic Safety Awareness: Post‐Campaign
Corporate Research Associates Inc., 2014
35
When asked if they had any further comments or suggestions regarding the Heads Up Halifax campaign,
no more than six percent offered any specific comment, though suggestions included increasing
promotion, increasing the strength and visual appeal of the ads, as well as more tactical suggestions
related to enforcement policy and more visible markings at crosswalks. (Table 16)

2014 Traffic Safety Awareness: Post‐Campaign
Corporate Research Associates Inc., 2014
36
In terms of an overall assessment of the Campaign, virtually all (93%) offered some level of support for the
Halifax Regional Municipality’s efforts in sponsoring advertising concerning the importance of crosswalk
safety, with two‐thirds offering their complete support. Only a very small percentage of residents (4%)
offered an unfavourable opinion of the campaign. (Table 17)
Across demographics, females, residents 35 years of age and older, those with previous exposure to the
ads, and those aware of Crosswalk Awareness Day are each more likely than their respective counterparts
to offer their complete support of the Municipality sponsoring such a campaign.

2014 Traffic Safety Awareness: Post‐Campaign
Corporate Research Associates Inc., 2014
37
After seeing the ads, all residents were asked for final comments or suggestions regarding how to improve
crosswalk safety in the City. Among those who offered an opinion, one‐in‐six (16%) suggested enforcement
of the law (e.g., dispensing fines/tickets), while suggestions for having better lighting at crosswalks and
more flashing lights at crosswalks were each suggested by one‐in‐ten residents. Fewer than one‐in‐ten
offered alternative suggestions including pedestrians being more aware, having more painted lines, having
more public awareness/education, people paying attention, offering better signage near crosswalks,
drivers being more aware, and using flags at crosswalks. (Table 18)

2014 Traffic Safety Awareness: Post‐Campaign
Corporate Research Associates Inc., 2014
38
Post‐Wave, Awareness of Crosswalk Awareness Day
Awareness of Crosswalk Awareness Day is modest, with most having seen media coverage regarding the
event.
When assessing awareness of Halifax’s Crosswalk Awareness Day, findings suggest that overall awareness
of the event is modest. Indeed, among those surveyed, one‐quarter (25%) indicated they were aware of
the Crosswalk Awareness Day prior to completing the survey. Of those who were aware (n=99), more than
eight‐in‐ten (84%) saw media coverage of the event, while two‐in‐ten (21%) reported seeing community
members out promoting crosswalk safety on November 5th. (Tables 19a‐b)
Males were more likely than females to indicate they had heard of Crosswalk Awareness Day prior to the
survey (29% vs. 21%). As may be expected, residents who primarily walk to and from their destinations are
more likely than residents who primarily commute in a motor vehicle to be aware of Crosswalk Awareness
Day in Halifax (32% vs. 23%). Furthermore, those previously exposed to the ‘Heads Up Halifax’ ads are
more likely than those previously unaware of the ads to be aware of the event (27% vs. 18%).
Interestingly, males are more likely than females to indicate they saw media coverage of the event, while
females are more likely to indicate they saw community members out promoting crosswalk safety on
November 5th.

2014 Traffic Safety Awareness: Post‐Campaign
Corporate Research Associates Inc., 2014
39
Study Methodology
Questionnaire Design
The questionnaire used for this study was designed by CRA, in consultation with Halifax staff members.
Prior to being finalized, the survey was pre‐tested on a small number of respondents to ensure the
appropriateness of the questions and response categories.
Survey Administration
To meet research objectives, an online survey was conducted with CRA’s Atlantic Canadian online panel
members. For both the pre‐ and post‐wave, online panel members from Research Now (CRA’s subcontract
partner) aged 18 years and older were invited to take part in the 2014 Traffic Safety Awareness Study.
Note, respondents who completed the pre‐wave survey, were excluded from taking part in the post‐wave
survey. For each wave, a total of 402 panel members completed the survey. While the online panel
included a wide mix of demographics, due to the fact that it is an online general public panel study, no
margin of error may be applied (as per industry standards and guidelines).
The pre‐wave online survey was conducted between October 14th and 18th, 2014, and the average time to
complete the pre‐wave survey was approximately 11 minutes. The post‐wave was conducted from
December 11th to 16th, 2014 and the average time to complete the post‐wave survey was approximately
17.5 minutes. Appended to the report is a copy of the post‐wave survey questionnaire (Appendix A) and
the detailed data tables (Appendix B).