2014 Talent Search Grade 2 Female SCAT Verbalcty.jhu.edu/talent/docs/test data scat/2014SCAT.pdf ·...
28
Score Frequency Percentile Rank 471 0 469 1 100.0% 467 0 100.0% 466 0 99.9% 465 0 99.9% 464 0 99.9% 462 3 99.6% 461 0 99.6% 459 3 99.3% 458 0 99.3% 456 7 98.5% 455 0 98.4% 453 8 97.5% 451 18 95.4% 450 1 95.3% 448 15 93.6% 446 16 91.7% 445 2 91.5% 443 23 88.8% 441 25 85.8% 439 27 82.7% 438 24 79.9% 437 25 76.9% 436 0 76.9% 435 24 74.1% 434 37 69.8% 433 23 67.1% 431 36 62.9% 430 28 59.6% 429 33 55.7% 428 44 50.6% 427 31 47.0% 426 37 42.6% 424 28 39.3% 423 36 35.1% 422 32 31.4% 421 3 31.0% 420 36 26.8% 419 20 24.5% 418 26 21.4% 417 1 21.3% 416 27 18.1% 415 26 15.1% 414 26 12.1% 413 16 10.2% 412 18 8.1% 411 17 6.1% 410 19 3.9% 409 9 2.8% 408 8 1.9% 407 3 1.5% 406 3 1.2% 405 2 0.9% 404 3 0.6% 403 2 0.4% 402 0 0.3% 401 2 0.1% 400 1 0.1% 0 50th 427 75th 435 Median 427 Standard Deviation 19 Percentiles 25th 419 Mean 427 2014 Talent Search Grade 2 Female SCAT Verbal Number of Students 855 0 5 10 15 20 25 30 35 40 45 50 471 465 459 453 446 439 435 430 426 421 417 413 409 405 401 Frequency Distribution
Transcript of 2014 Talent Search Grade 2 Female SCAT Verbalcty.jhu.edu/talent/docs/test data scat/2014SCAT.pdf ·...

Score Frequency Percentile Rank
471 0469 1 100.0%467 0 100.0%466 0 99.9%465 0 99.9%464 0 99.9%462 3 99.6%461 0 99.6%459 3 99.3%458 0 99.3%456 7 98.5%455 0 98.4%453 8 97.5%451 18 95.4%450 1 95.3%448 15 93.6%446 16 91.7%445 2 91.5%443 23 88.8%441 25 85.8%439 27 82.7%438 24 79.9%437 25 76.9%436 0 76.9%435 24 74.1%434 37 69.8%433 23 67.1%431 36 62.9%430 28 59.6%429 33 55.7%428 44 50.6%427 31 47.0%426 37 42.6%424 28 39.3%423 36 35.1%422 32 31.4%421 3 31.0%420 36 26.8%419 20 24.5%418 26 21.4%417 1 21.3%416 27 18.1%415 26 15.1%414 26 12.1%413 16 10.2%412 18 8.1%411 17 6.1%410 19 3.9%409 9 2.8%408 8 1.9%407 3 1.5%406 3 1.2%405 2 0.9%404 3 0.6%403 2 0.4%402 0 0.3%401 2 0.1%400 1 0.1%
0
50th 42775th 435
Median 427Standard Deviation 19Percentiles
25th 419
Mean 427
2014 Talent SearchGrade 2 Female SCAT Verbal
Number of Students 855
0
5
10
15
20
25
30
35
40
45
50
471
465
459
453
446
439
435
430
426
421
417
413
409
405
401
Frequency Distribution

Score Frequency Percentile Rank
477 0 -476 0 -475 0 -473 0 -472 1 100.0%470 1 99.9%469 0 99.8%467 2 99.6%466 1 99.5%464 0 99.5%463 2 99.3%461 0 99.2%460 3 98.9%458 0 98.9%457 4 98.5%454 8 97.5%452 0 97.5%451 6 96.8%449 9 95.8%447 4 95.3%445 9 94.3%443 17 92.3%440 19 90.0%439 19 87.8%438 17 85.8%437 15 84.1%436 17 82.1%435 36 77.9%434 28 74.6%433 27 71.4%432 38 67.0%431 26 63.9%430 30 60.4%429 39 55.9%428 30 52.3%427 30 48.8%426 41 44.0%425 30 40.5%424 1 40.4%423 30 36.9%422 63 29.5%421 42 24.6%420 27 21.4%419 37 17.1%418 21 14.6%417 46 9.3%416 32 5.5%415 15 3.7%414 11 2.5%413 9 1.4%412 12 0.0%
0
75th 434
10Percentiles
25th 42150th 427
427Standard Deviation
2013 Talent SearchGrade 2 Female SCATQuantitative Scores
Number of Students
MedianMean
855428
0
10
20
30
40
50
60
70
477
472
466
460
452
445
438
434
430
426
422
418
414
Frequency Distribution

Score Frequency Percentile Rank
471 0 ▬469 2 99.9%467 0 99.9%466 0 99.9%465 2 99.7%464 0 99.7%462 4 99.4%461 0 99.4%459 8 98.7%458 1 98.6%456 7 98.0%455 0 98.0%453 13 96.9%451 16 95.5%450 2 95.4%448 27 93.1%446 22 91.2%445 0 91.2%443 29 88.7%441 30 86.1%439 37 83.0%438 38 79.7%437 37 76.5%436 1 76.5%435 48 72.3%434 43 68.7%433 49 64.5%431 41 61.0%430 49 56.8%429 47 52.7%428 47 48.7%427 47 44.7%426 43 41.0%424 49 36.8%423 33 34.0%422 37 30.8%421 3 30.6%420 40 27.1%419 33 24.3%418 33 21.5%417 6 21.0%416 30 18.4%415 37 15.2%414 28 12.8%413 29 10.4%412 38 7.1%411 13 6.0%410 19 4.4%409 25 2.2%408 3 2.0%407 4 1.6%406 9 0.9%405 3 0.6%404 5 0.2%403 1 0.1%402 0 0.0%401 1 0.0%400 0 0.0%
0
50th 42875th 435
Median 428Standard Deviation 12Percentiles
25th 419
Mean 428
2014 Talent SearchGrade 2 Male SCAT Verbal
Number of Students 1,169
0
10
20
30
40
50
60
471
465
459
453
446
439
435
430
426
421
417
413
409
405
401
Frequency Distribution

Score Frequency Percentile Rank
477 0 -476 0 -475 0 -473 0 -472 4 99.7%470 0 99.7%469 3 99.5%467 0 99.4%466 13 98.4%464 0 98.3%463 18 96.8%461 1 96.7%460 21 94.9%458 4 94.6%457 21 92.8%454 30 90.2%452 3 90.0%451 16 88.6%449 23 86.6%447 27 84.3%445 33 81.5%443 37 78.3%440 41 74.8%439 38 71.6%438 42 68.0%437 31 65.3%436 37 62.2%435 29 59.7%434 37 56.5%433 40 53.1%432 53 48.5%431 35 45.5%430 36 42.5%429 42 38.9%428 36 35.8%427 49 31.6%426 34 28.7%425 43 25.0%424 5 24.6%423 26 22.3%422 76 15.8%421 28 13.4%420 21 11.6%419 36 8.6%418 17 7.1%417 31 4.5%416 25 2.3%415 13 1.2%414 6 0.7%413 5 0.3%412 3 0.1%
0
75th 440
12Percentiles
25th 42550th 432
432Standard Deviation
2014 Talent SearchGrade 2 Male SCATQuantitative Scores
Number of Students
MedianMean
1,169433
0
10
20
30
40
50
60
70
80
477
472
466
460
452
445
438
434
430
426
422
418
414
Frequency Distribution

Score Frequency Percentile Rank
471 0 ▬469 0 ▬467 9 99.3%466 0 99.3%465 10 98.5%464 0 98.4%462 19 96.8%461 0 96.8%459 25 94.7%458 0 94.6%456 34 91.8%455 3 91.5%453 34 88.6%451 46 84.6%450 3 84.4%448 60 79.2%446 53 74.7%445 3 74.4%443 62 69.1%441 64 63.6%439 63 58.2%438 64 52.7%437 50 48.4%436 9 47.6%435 52 43.1%434 47 39.1%433 42 35.5%431 42 31.9%430 39 28.5%429 33 25.7%428 44 21.9%427 36 18.8%426 29 16.3%424 27 14.0%423 27 11.7%422 19 10.1%421 2 9.9%420 14 8.7%419 15 7.4%418 21 5.6%417 0 5.5%416 14 4.4%415 13 3.3%414 7 2.7%413 10 1.8%412 4 1.5%411 5 1.0%410 4 0.7%409 2 0.5%408 2 0.3%407 1 0.3%406 1 0.2%405 1 0.1%404 0 0.0%403 1 0.0%402 0 ▬401 0 ▬400 0 ▬
0
Mean 437
2014 Talent SearchGrade 3 Female SCAT Verbal
Number of Students 1,165
50th 43775th 446
Median 437Standard Deviation 12Percentiles
25th 428
0
10
20
30
40
50
60
70
471
465
459
453
446
439
435
430
426
421
417
413
409
405
401
Frequency Distribution

Score Frequency Percentile Rank
477 0 -476 1 100.0%475 0 100.0%473 2 99.8%472 5 99.4%470 0 99.3%469 6 98.9%467 2 98.7%466 15 97.4%464 3 97.2%463 15 95.9%461 7 95.3%460 18 93.7%458 8 93.0%457 25 90.9%454 44 87.1%452 8 86.4%451 24 84.4%449 34 81.4%447 37 78.3%445 53 73.7%443 56 68.9%440 52 64.4%439 47 60.4%438 48 56.3%437 40 52.8%436 54 48.2%435 52 43.7%434 39 40.4%433 43 36.7%432 44 32.9%431 34 30.0%430 33 27.1%429 38 23.9%428 38 20.6%427 30 18.0%426 22 16.2%425 32 13.4%424 1 13.3%423 18 11.8%422 34 8.8%421 15 7.6%420 18 6.0%419 10 5.2%418 9 4.4%417 24 2.3%416 9 1.5%415 6 1.0%414 2 0.9%413 7 0.3%412 3 0.1%
0
436Standard Deviation
2014 Talent SearchGrade 3 Female SCATQuantitative Scores
Number of Students
MedianMean
1,165437
75th 445
13Percentiles
25th 42950th 436
0
10
20
30
40
50
60
477
472
466
460
452
445
438
434
430
426
422
418
414
Frequency Distribution

Score Frequency Percentile Rank
471 1 100.0%469 2 99.8%467 4 99.5%466 0 99.5%465 16 98.3%464 0 98.3%462 15 97.2%461 1 97.1%459 37 94.3%458 2 94.2%456 43 90.9%455 1 90.9%453 57 86.5%451 41 83.4%450 5 83.1%448 57 78.8%446 63 74.0%445 4 73.7%443 75 68.0%441 59 63.6%439 59 59.1%438 61 54.5%437 49 50.8%436 8 50.2%435 51 46.3%434 61 41.7%433 50 37.9%431 49 34.2%430 47 30.7%429 35 28.0%428 40 25.0%427 43 21.8%426 33 19.3%424 30 17.0%423 31 14.7%422 28 12.5%421 6 12.1%420 29 9.9%419 20 8.4%418 18 7.0%417 3 6.8%416 24 5.0%415 13 4.0%414 12 3.1%413 11 2.3%412 8 1.7%411 8 1.1%410 2 0.9%409 5 0.5%408 3 0.3%407 0 0.3%406 1 0.2%405 1 0.2%404 1 0.1%403 0 0.1%402 0 0.0%401 1 0.0%400 0 ▬
0
50th 43575th 446
Median 435Standard Deviation 13Percentiles
25th 428
Mean 436
2014 Talent SearchGrade 3 Male SCAT Verbal
Number of Students 1,324
0
10
20
30
40
50
60
70
80
471
465
459
453
446
439
435
430
426
421
417
413
409
405
401
Frequency Distribution
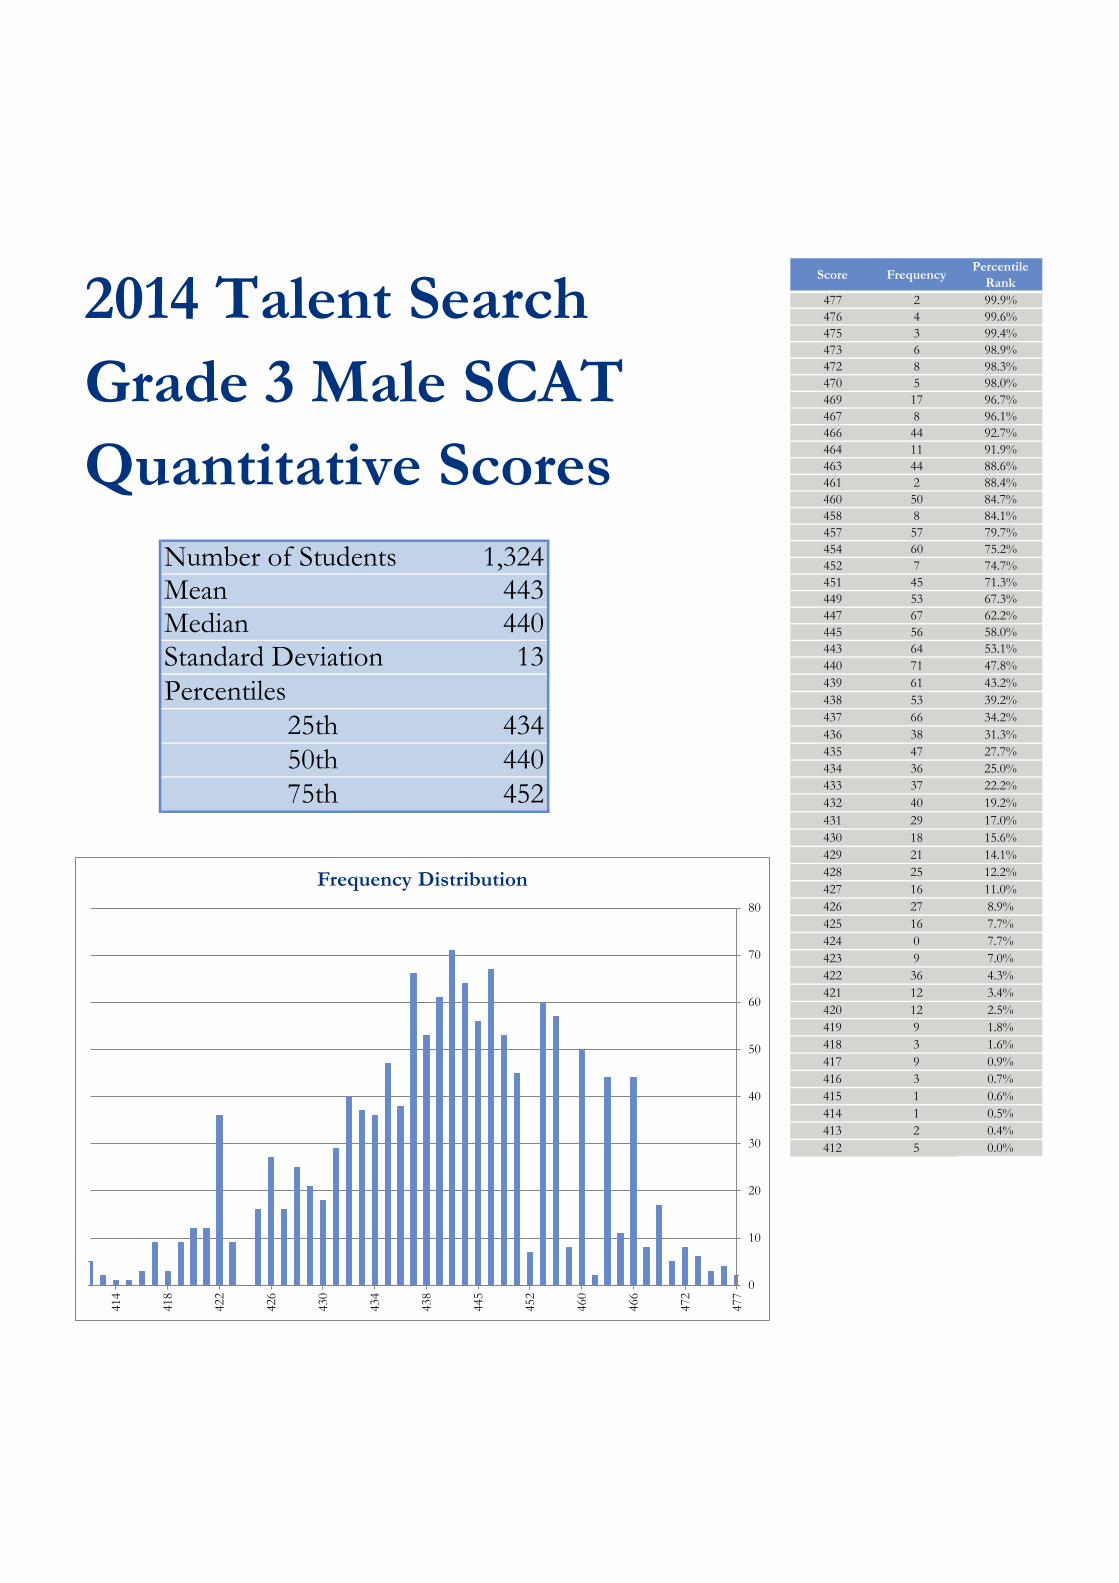
Score Frequency Percentile Rank
477 2 99.9%476 4 99.6%475 3 99.4%473 6 98.9%472 8 98.3%470 5 98.0%469 17 96.7%467 8 96.1%466 44 92.7%464 11 91.9%463 44 88.6%461 2 88.4%460 50 84.7%458 8 84.1%457 57 79.7%454 60 75.2%452 7 74.7%451 45 71.3%449 53 67.3%447 67 62.2%445 56 58.0%443 64 53.1%440 71 47.8%439 61 43.2%438 53 39.2%437 66 34.2%436 38 31.3%435 47 27.7%434 36 25.0%433 37 22.2%432 40 19.2%431 29 17.0%430 18 15.6%429 21 14.1%428 25 12.2%427 16 11.0%426 27 8.9%425 16 7.7%424 0 7.7%423 9 7.0%422 36 4.3%421 12 3.4%420 12 2.5%419 9 1.8%418 3 1.6%417 9 0.9%416 3 0.7%415 1 0.6%414 1 0.5%413 2 0.4%412 5 0.0%
0
75th 452
13Percentiles
25th 43450th 440
440Standard Deviation
2014 Talent SearchGrade 3 Male SCATQuantitative Scores
Number of Students
MedianMean
1,324443
0
10
20
30
40
50
60
70
80
477
472
466
460
452
445
438
434
430
426
422
418
414
Frequency Distribution
Score Frequency Percentile Rank
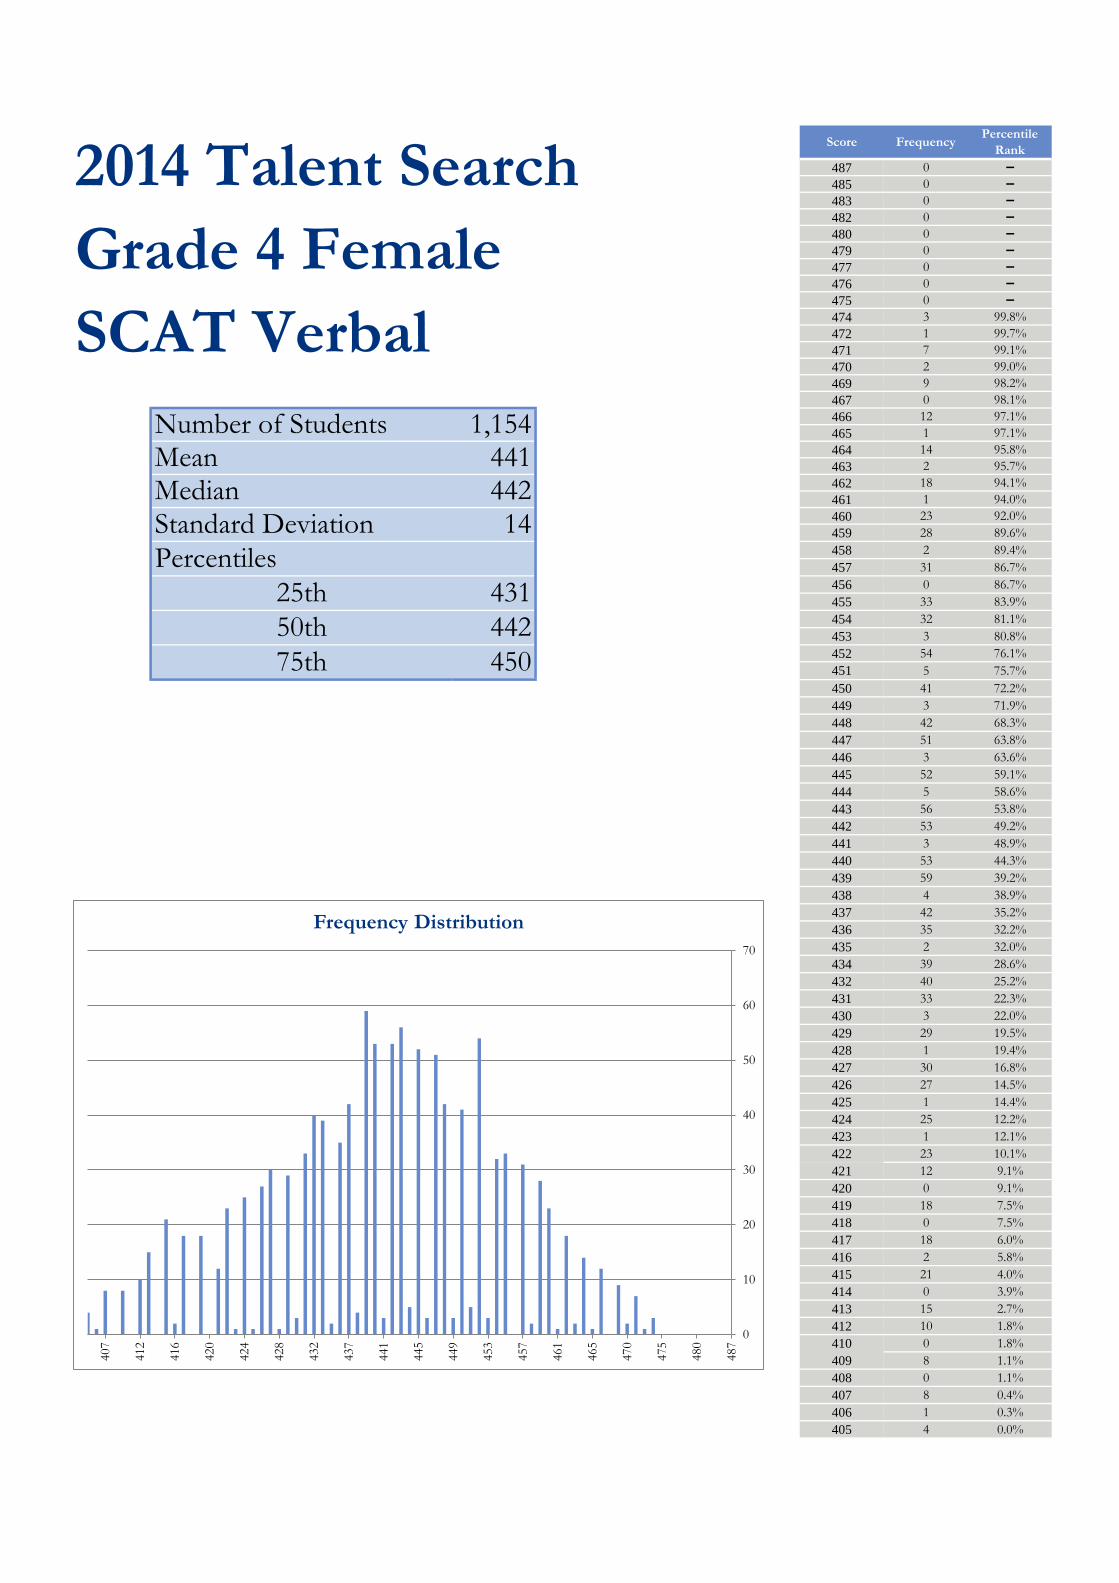
487 0 ▬485 0 ▬483 0 ▬482 0 ▬480 0 ▬479 0 ▬477 0 ▬476 0 ▬475 0 ▬474 3 99.8%472 1 99.7%471 7 99.1%470 2 99.0%469 9 98.2%467 0 98.1%466 12 97.1%465 1 97.1%464 14 95.8%463 2 95.7%462 18 94.1%461 1 94.0%460 23 92.0%459 28 89.6%458 2 89.4%457 31 86.7%456 0 86.7%455 33 83.9%454 32 81.1%453 3 80.8%452 54 76.1%451 5 75.7%450 41 72.2%449 3 71.9%448 42 68.3%447 51 63.8%446 3 63.6%445 52 59.1%444 5 58.6%443 56 53.8%442 53 49.2%441 3 48.9%440 53 44.3%439 59 39.2%438 4 38.9%437 42 35.2%436 35 32.2%435 2 32.0%434 39 28.6%432 40 25.2%431 33 22.3%430 3 22.0%429 29 19.5%428 1 19.4%427 30 16.8%426 27 14.5%425 1 14.4%424 25 12.2%423 1 12.1%422 23 10.1%421 12 9.1%420 0 9.1%419 18 7.5%418 0 7.5%417 18 6.0%416 2 5.8%415 21 4.0%414 0 3.9%413 15 2.7%412 10 1.8%410 0 1.8%409 8 1.1%408 0 1.1%407 8 0.4%406 1 0.3%405 4 0.0%
0
Mean 441
2014 Talent SearchGrade 4 Female SCAT Verbal
Number of Students 1,154
50th 44275th 450
Median 442Standard Deviation 14Percentiles
25th 431
0
10
20
30
40
50
60
70
487
480
475
470
465
461
457
453
449
445
441
437
432
428
424
420
416
412
407
Frequency Distribution
Score Frequency Percentile Rank
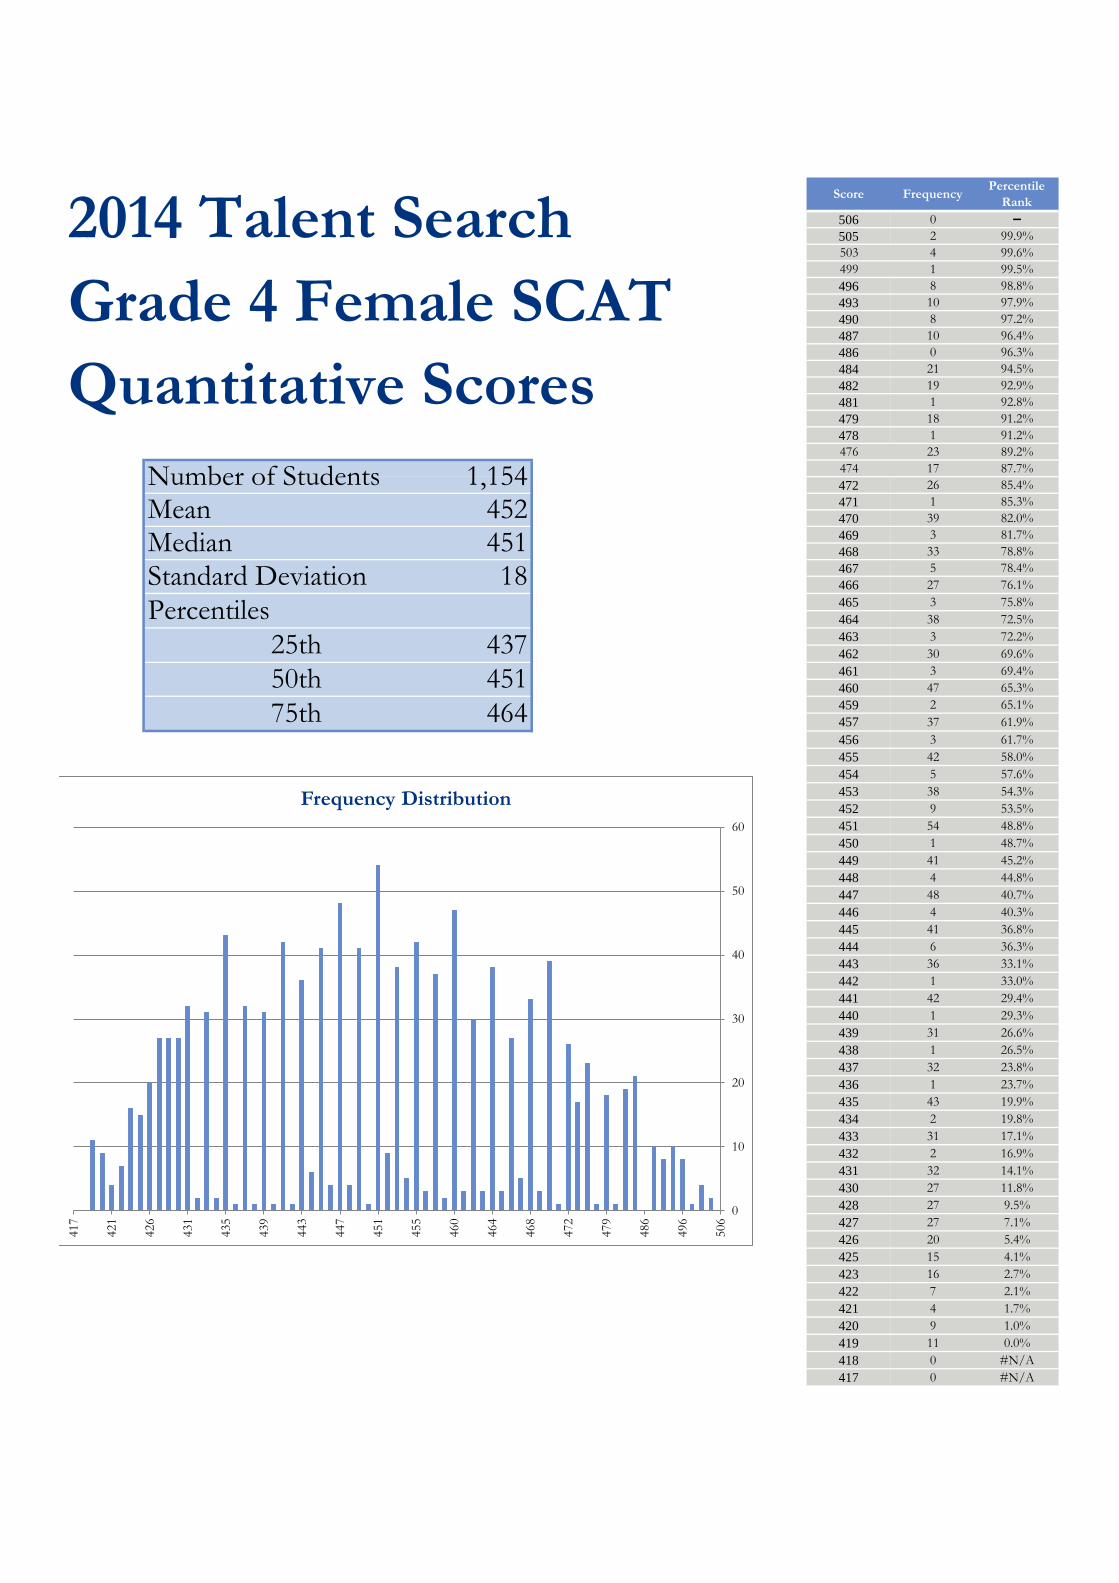
506 0 ▬505 2 99.9%503 4 99.6%499 1 99.5%496 8 98.8%493 10 97.9%490 8 97.2%487 10 96.4%486 0 96.3%484 21 94.5%482 19 92.9%481 1 92.8%479 18 91.2%478 1 91.2%476 23 89.2%474 17 87.7%472 26 85.4%471 1 85.3%470 39 82.0%469 3 81.7%468 33 78.8%467 5 78.4%466 27 76.1%465 3 75.8%464 38 72.5%463 3 72.2%462 30 69.6%461 3 69.4%460 47 65.3%459 2 65.1%457 37 61.9%456 3 61.7%455 42 58.0%454 5 57.6%453 38 54.3%452 9 53.5%451 54 48.8%450 1 48.7%449 41 45.2%448 4 44.8%447 48 40.7%446 4 40.3%445 41 36.8%444 6 36.3%443 36 33.1%442 1 33.0%441 42 29.4%440 1 29.3%439 31 26.6%438 1 26.5%437 32 23.8%436 1 23.7%435 43 19.9%434 2 19.8%433 31 17.1%432 2 16.9%431 32 14.1%430 27 11.8%428 27 9.5%427 27 7.1%426 20 5.4%425 15 4.1%423 16 2.7%422 7 2.1%421 4 1.7%420 9 1.0%419 11 0.0%418 0 #N/A417 0 #N/A
0
451Standard Deviation
2014 Talent SearchGrade 4 Female SCATQuantitative Scores
Number of Students
MedianMean
1,154452
75th 464
18Percentiles
25th 43750th 451
0
10
20
30
40
50
60
506
496
486
479
472
468
464
460
455
451
447
443
439
435
431
426
421
417
Frequency Distribution

Score Frequency Percentile Rank487 0 ▬485 0 ▬483 0 ▬482 0 ▬480 0 ▬479 0 ▬477 0 ▬476 1 99.9%475 1 99.9%474 2 99.7%472 0 99.7%471 8 99.1%470 1 99.1%469 13 98.1%467 1 98.0%466 18 96.7%465 0 96.7%464 22 95.1%463 3 94.9%462 36 92.3%461 0 92.3%460 26 90.4%459 44 87.2%458 1 87.1%457 38 84.4%456 5 84.0%455 47 80.6%454 50 77.0%453 1 76.9%452 51 73.2%451 6 72.8%450 60 68.4%449 3 68.2%448 57 64.1%447 78 58.4%446 3 58.2%445 53 54.3%444 2 54.2%443 51 50.5%442 61 46.0%441 6 45.6%440 60 41.2%439 65 36.5%438 1 36.5%437 34 34.0%436 50 30.4%435 3 30.1%434 43 27.0%432 38 24.3%431 32 21.9%430 3 21.7%429 41 18.7%428 2 18.6%427 32 16.3%426 40 13.4%425 1 13.3%424 30 11.1%423 2 11.0%422 30 8.8%421 26 6.9%420 3 6.7%419 19 5.3%418 0 5.3%417 19 3.9%416 3 3.7%415 10 3.0%414 1 2.9%413 12 2.0%412 9 1.4%411 0 1.3%410 1 1.3%409 10 0.6%408 0 0.5%407 3 0.4%406 2 0.2%405 3 0.1%
1
50th 44275th 452
Median 442Standard Deviation 14Percentiles
25th 432
Mean 442
2014 Talent SearchGrade 4 Male SCAT Verbal
Number of Students 1,378
0
10
20
30
40
50
60
70
80
90
487
480
475
470
465
461
457
453
449
445
441
437
432
428
424
420
416
412
408
Frequency Distribution

Score Frequency Percentile Rank
506 1 100.0%505 13 99.1%503 15 98.0%499 16 96.8%496 31 94.6%493 25 92.7%490 29 90.6%487 29 88.5%486 2 88.4%484 22 86.8%482 34 84.3%481 1 84.2%479 43 81.1%478 2 81.0%476 45 77.7%474 43 74.6%472 36 72.0%471 3 71.8%470 44 68.6%469 6 68.1%468 32 65.8%467 4 65.5%466 46 62.2%465 3 61.9%464 49 58.4%463 3 58.2%462 35 55.6%461 4 55.3%460 51 51.6%459 3 51.4%457 48 47.9%456 4 47.6%455 43 44.5%454 3 44.3%453 49 40.7%452 1 40.7%451 38 37.9%450 6 37.5%449 42 34.4%448 3 34.2%447 41 31.2%446 8 30.6%445 55 26.7%444 5 26.3%443 36 23.7%442 4 23.4%441 40 20.5%440 4 20.2%439 34 17.7%438 4 17.4%437 37 14.7%436 3 14.5%435 28 12.5%434 1 12.4%433 30 10.2%432 4 9.9%431 19 8.6%430 23 6.9%428 20 5.4%427 12 4.6%426 11 3.8%425 19 2.4%423 8 1.8%422 9 1.2%421 5 0.8%420 4 0.5%419 7 0.0%418 0 0.0%417 0 0.0%
0
75th 474
20Percentiles
25th 44350th 457
457Standard Deviation
2014 Talent SearchGrade 4 Male SCATQuantitative Scores
Number of Students
MedianMean
1,378459
0
10
20
30
40
50
60
506
496
486
479
472
468
464
460
455
451
447
443
439
435
431
426
421
417
Frequency Distribution

Score Frequency Percentile Rank487 0 -485 0 -483 0 -482 0 -480 3 99.9%479 3 99.7%477 1 99.6%476 11 99.0%475 1 98.9%474 19 97.8%472 3 97.6%471 26 96.1%470 3 95.9%469 29 94.2%467 5 93.9%466 35 91.9%465 3 91.7%464 52 88.6%463 8 88.2%462 47 85.4%461 4 85.2%460 54 82.0%459 67 78.1%458 8 77.6%457 91 72.2%456 12 71.5%455 87 66.4%454 75 62.0%453 7 61.6%452 64 57.8%451 11 57.2%450 65 53.4%449 4 53.1%448 62 49.5%447 75 45.1%446 7 44.6%445 66 40.8%444 6 40.4%443 64 36.6%442 60 33.1%441 7 32.7%440 37 30.5%439 52 27.5%438 4 27.2%437 42 24.8%436 46 22.1%435 2 21.9%434 48 19.1%432 34 17.1%431 35 15.1%430 1 15.0%429 26 13.5%428 3 13.3%427 32 11.4%426 29 9.7%425 0 9.7%424 23 8.4%423 3 8.2%422 26 6.6%421 27 5.1%420 0 5.0%419 19 3.9%418 0 3.9%417 14 3.1%416 0 3.1%415 13 2.4%414 2 2.2%413 15 1.4%412 6 1.0%411 0 1.0%410 0 1.0%409 7 0.6%408 0 0.6%407 2 0.5%406 4 0.2%405 4 0.0%
0
Mean 446
2014 Talent SearchGrade 5 Female SCAT Verbal
Number of Students 1,701
50th 44875th 457
Median 448Standard Deviation 15Percentiles
25th 437
0
10
20
30
40
50
60
70
80
90
100
487
480
475
470
465
461
457
453
449
445
441
437
432
428
424
420
416
412
408
Frequency Distribution

Score Frequency Percentile Rank
506 1 99.2%505 14 99.2%503 21 97.9%499 22 96.6%496 42 94.2%493 46 91.5%490 39 89.2%487 32 87.3%486 2 87.2%484 48 84.4%482 38 82.1%481 6 81.8%479 49 78.9%478 7 78.5%476 53 75.4%474 59 71.9%472 57 68.5%471 12 67.8%470 76 63.4%469 8 62.9%468 74 58.5%467 9 58.0%466 68 54.0%465 8 53.5%464 71 49.4%463 10 48.8%462 50 45.8%461 5 45.5%460 70 41.4%459 3 41.2%457 68 37.2%456 5 36.9%455 48 34.1%454 6 33.8%453 56 30.5%452 7 30.1%451 45 27.4%450 3 27.2%449 42 24.8%448 2 24.6%447 40 22.3%446 3 22.1%445 49 19.2%444 5 18.9%443 39 16.6%442 3 16.5%441 34 14.5%440 2 14.4%439 31 12.5%438 3 12.4%437 25 10.9%436 1 10.8%435 40 8.5%434 1 8.4%433 31 6.6%432 2 6.5%431 21 5.2%430 24 3.8%428 12 3.1%427 12 2.4%426 14 1.6%425 7 1.2%423 9 0.6%422 4 0.4%421 2 0.3%420 2 0.2%419 2 0.1%418 0 0.0%417 1 0.0%
0
464Standard Deviation
2014 Talent SearchGrade 5 Female SCATQuantitative Scores
Number of Students
MedianMean
1,701462
75th 474
19Percentiles
25th 44950th 464
0
10
20
30
40
50
60
70
80
506
496
486
479
472
468
464
460
455
451
447
443
439
435
431
426
421
417
Frequency Distribution

Score Frequency Percentile Rank487 0 ▬485 0 ▬483 0 ▬482 0 ▬480 0 ▬479 5 99.8%477 2 99.7%476 7 99.3%475 2 99.2%474 27 97.8%472 4 97.6%471 35 95.8%470 0 95.7%469 55 92.9%467 5 92.6%466 69 89.0%465 3 88.9%464 61 85.7%463 4 85.5%462 92 80.7%461 8 80.3%460 71 76.6%459 82 72.3%458 8 71.9%457 86 67.4%456 6 67.1%455 94 62.2%454 99 57.0%453 4 56.8%452 73 53.0%451 8 52.6%450 87 48.0%449 11 47.4%448 69 43.8%447 62 40.6%446 2 40.5%445 64 37.2%444 4 37.0%443 45 34.6%442 71 30.9%441 6 30.6%440 51 27.9%439 56 25.0%438 7 24.6%437 49 22.1%436 54 19.3%435 4 19.1%434 47 16.6%432 27 15.2%431 23 14.0%430 5 13.7%429 31 12.1%428 3 12.0%427 35 10.1%426 28 8.7%425 4 8.5%424 15 7.7%423 2 7.6%422 15 6.8%421 31 5.2%420 1 5.1%419 18 4.2%418 2 4.1%417 9 3.6%416 1 3.5%415 12 2.9%414 0 2.9%413 12 2.3%412 11 1.7%411 0 1.7%410 2 1.6%409 8 1.2%408 0 1.2%407 8 0.8%406 3 0.6%405 12 0.0%
0
Mean 448
2014 Talent SearchGrade 5 Male SCAT Verbal
Number of Students 1,917
50th 45075th 459
Median 450Standard Deviation 15Percentiles
25th 439
0
20
40
60
80
100
120
487
480
475
470
465
461
457
453
449
445
441
437
432
428
424
420
416
412
408
Frequency Distribution

Score Frequency Percentile Rank
506 7 99.7%505 48 97.2%503 57 94.2%499 70 90.6%496 77 86.5%493 66 83.1%490 80 78.9%487 76 74.9%486 6 74.6%484 81 70.4%482 69 66.8%481 11 66.2%479 85 61.8%478 4 61.6%476 85 57.2%474 80 53.0%472 75 49.1%471 8 48.6%470 73 44.8%469 9 44.4%468 62 41.1%467 6 40.8%466 61 37.6%465 8 37.2%464 63 33.9%463 7 33.6%462 46 31.2%461 4 30.9%460 39 28.9%459 6 28.6%457 45 26.3%456 6 25.9%455 42 23.7%454 2 23.6%453 39 21.6%452 5 21.3%451 61 18.2%450 3 18.0%449 42 15.8%448 5 15.6%447 35 13.7%446 3 13.6%445 23 12.4%444 2 12.3%443 25 11.0%442 4 10.8%441 25 9.4%440 3 9.3%439 18 8.4%438 2 8.2%437 18 7.3%436 0 7.3%435 17 6.4%434 1 6.4%433 22 5.2%432 0 5.2%431 15 4.4%430 23 3.2%428 22 2.1%427 10 1.6%426 6 1.3%425 9 0.8%423 5 0.5%422 2 0.4%421 2 0.3%420 0 0.3%419 6 0.0%418 0 ▬417 0 ▬
0
472Standard Deviation
2014 Talent SearchGrade 5 Male SCATQuantitative Scores
Number of Students
MedianMean
1,917470
75th 487
21Percentiles
25th 45550th 472
0
10
20
30
40
50
60
70
80
90
506
496
486
479
472
468
464
460
455
451
447
443
439
435
431
426
421
417
Frequency Distribution

Score Frequency Percentile Rank
496 0 ▬495 0 ▬494 0 ▬493 0 ▬492 0 ▬491 0 ▬490 2 99.9%489 8 99.5%488 19 98.5%486 18 97.5%484 21 96.4%483 36 94.5%481 46 92.0%480 64 88.6%478 62 85.3%476 60 82.1%474 67 78.5%473 78 74.3%472 5 74.0%471 59 70.9%470 4 70.6%469 77 66.5%468 6 66.2%467 68 62.6%466 7 62.2%465 72 58.3%464 0 58.3%463 76 54.3%462 10 53.7%461 64 50.3%460 79 46.1%458 77 41.9%456 71 38.1%454 62 34.8%452 69 31.1%450 76 27.0%448 62 23.7%446 52 20.9%444 47 18.4%443 6 18.1%441 42 15.9%440 5 15.6%439 42 13.3%437 31 11.7%436 5 11.4%434 31 9.7%433 2 9.6%432 33 7.9%431 2 7.8%430 23 6.5%429 2 6.4%428 26 5.0%427 1 5.0%426 20 3.9%424 2 3.8%423 23 2.6%422 2 2.5%421 16 1.6%419 10 1.1%417 8 0.6%415 3 0.5%413 6 0.2%412 2 0.1%411 0 0.0%410 1 0.0%
0
50th 46075th 473
Median 460Standard Deviation 17Percentiles
25th 448
Mean 459
2014 Talent SearchGrade 6 Female SCAT Verbal
Number of Students 1,868
0
10
20
30
40
50
60
70
80
90
496
492
488
481
474
470
466
462
456
448
441
436
431
427
422
415
410
Frequency Distribution

Score Frequency Percentile Rank
514 1 100.0%512 0 100.0%511 9 99.5%509 0 99.5%508 23 98.3%506 1 98.2%505 20 97.2%504 2 97.1%503 28 95.6%502 2 95.4%501 34 93.6%499 44 91.3%498 5 91.0%497 45 88.6%496 4 88.4%495 54 85.5%494 4 85.3%493 51 82.5%492 6 82.2%491 80 77.9%490 4 77.7%489 69 74.0%488 8 73.6%487 75 70.0%484 99 64.3%482 95 59.2%480 95 54.1%478 91 49.2%476 85 44.7%474 68 41.0%472 65 37.5%470 77 33.4%468 66 29.9%466 63 26.5%464 69 22.8%462 57 19.8%460 44 17.4%458 2 17.3%457 50 14.6%455 1 14.6%454 50 11.9%453 0 11.9%452 30 10.3%451 2 10.2%450 33 8.4%449 1 8.4%448 33 6.6%447 2 6.5%446 13 5.8%445 2 5.7%444 18 4.7%443 0 4.7%442 17 3.8%441 1 3.7%440 15 2.9%439 1 2.9%438 14 2.1%437 0 2.1%435 10 1.6%433 7 1.2%431 7 0.9%430 5 0.6%428 6 0.3%426 0 0.2%425 3 0.1%424 2 0.0%
0
75th 489
17Percentiles
25th 46450th 478
478Standard Deviation
2014 Talent SearchGrade 6 Female SCATQuantitative Scores
Number of Students
MedianMean
1,868475
0
20
40
60
80
100
120
514
508
503
498
494
490
484
476
468
460
454
450
446
442
438
431
425
Frequency Distribution

Score Frequency Percentile Rank
496 0 ▬495 0 ▬494 1 100.0%493 0 100.0%492 1 100.0%491 0 99.9%490 6 99.7%489 11 99.1%488 17 98.3%486 22 97.2%484 24 96.1%483 42 94.0%481 44 91.9%480 71 88.4%478 75 84.8%476 57 82.0%474 65 78.8%473 73 75.3%472 4 75.1%471 97 70.4%470 6 70.1%469 84 66.0%468 7 65.6%467 79 61.8%466 2 61.7%465 81 57.8%464 3 57.6%463 77 53.9%462 8 53.5%461 70 50.1%460 89 45.7%458 93 41.2%456 85 37.1%454 81 33.1%452 79 29.3%450 62 26.3%448 69 22.9%446 56 20.2%444 44 18.1%443 8 17.7%441 43 15.6%440 5 15.3%439 46 13.1%437 41 11.1%436 3 10.9%434 33 9.3%433 6 9.1%432 26 7.8%431 5 7.5%430 27 6.2%429 7 5.9%428 25 4.7%427 3 4.5%426 19 3.6%424 3 3.5%423 24 2.3%422 0 2.3%421 16 1.5%419 12 1.0%417 10 0.4%415 2 0.3%413 2 0.2%412 3 0.1%411 0 0.1%410 2 0.0%
0
Mean 459
2014 Talent SearchGrade 6 Male SCAT Verbal
Number of Students 2,056
50th 46075th 471
Median 460Standard Deviation 17Percentiles
25th 448
0
20
40
60
80
100
120
496
492
488
481
474
470
466
462
456
448
441
436
431
427
422
415
410
Frequency Distribution

Score Frequency Percentile Rank
514 2 100.0%512 10 99.5%511 26 98.2%509 4 98.0%508 40 96.1%506 0 96.0%505 48 93.7%504 2 93.6%503 80 89.7%502 5 89.5%501 71 86.0%499 96 81.4%498 6 81.1%497 90 76.7%496 13 76.1%495 75 72.4%494 7 72.1%493 92 67.6%492 9 67.2%491 91 62.7%490 8 62.3%489 100 57.5%488 12 56.9%487 92 53.0%484 87 48.2%482 79 44.3%480 99 39.5%478 68 36.2%476 90 31.8%474 66 28.6%472 65 25.5%470 70 22.0%468 57 19.3%466 40 17.3%464 50 14.9%462 32 13.3%460 47 11.1%458 3 10.9%457 36 9.1%455 4 9.0%454 37 7.2%453 3 7.0%452 28 5.6%451 1 5.6%450 22 4.5%449 1 4.5%448 15 3.7%447 1 3.7%446 11 3.2%445 1 3.1%444 12 2.5%443 0 2.5%442 14 1.8%441 0 1.8%440 11 1.3%439 0 1.3%438 7 1.0%437 0 1.0%435 8 0.6%433 4 0.4%431 2 0.3%430 4 0.1%428 0 0.1%426 0 0.1%425 0 0.1%424 2 0.0%
0
484Standard Deviation
2014 Talent SearchGrade 6 Male SCATQuantitative Scores
Number of Students
MedianMean
2,056482
75th 495
17Percentiles
25th 47050th 484
0
20
40
60
80
100
120
514
508
503
498
494
490
484
476
468
460
454
450
446
442
438
431
425
Frequency Distribution

Score Frequency Percentile Rank
496 1 100.0%495 2 99.9%494 0 99.9%493 4 99.6%492 0 99.6%491 8 99.2%490 0 99.1%489 15 98.3%488 14 97.4%486 21 96.2%484 22 94.8%483 36 92.7%481 58 89.2%480 62 85.5%478 61 81.8%476 65 77.9%474 62 74.2%473 10 73.6%472 67 69.6%471 9 69.0%470 58 65.6%469 15 64.7%468 60 61.1%467 11 60.4%466 46 57.6%465 16 56.7%464 65 52.8%463 17 51.8%462 42 49.3%461 14 48.4%460 82 43.6%458 65 39.6%456 57 36.2%454 54 32.9%452 66 29.0%450 57 25.6%448 50 22.6%446 46 19.8%444 23 18.4%443 10 17.8%441 25 16.3%440 19 15.2%439 47 12.4%437 27 10.7%436 8 10.3%434 23 8.9%433 7 8.5%432 15 7.6%431 12 6.8%430 19 5.7%429 5 5.4%428 11 4.7%427 4 4.5%426 11 3.8%424 3 3.7%423 15 2.8%422 5 2.5%421 9 1.9%419 10 1.3%417 4 1.1%415 7 0.7%413 6 0.3%412 2 0.2%411 0 0.1%410 3 0.0%
0
50th 46275th 474
Median 462Standard Deviation 17Percentiles
25th 448
Mean 460
2014 Talent SearchGrade 7 Female SCAT Verbal
Number of Students 1,668
0
10
20
30
40
50
60
70
80
90
496
492
488
481
474
470
466
462
456
448
441
436
431
427
422
415
410
Frequency Distribution

Score Frequency Percentile Rank
514 1 100.0%512 3 99.8%511 12 99.1%509 11 98.4%508 1 98.4%506 21 97.1%505 5 96.8%504 26 95.3%503 5 95.0%502 35 92.9%501 3 92.7%499 45 90.0%498 59 86.4%497 8 86.0%496 37 83.7%495 11 83.1%494 50 80.1%493 11 79.4%492 61 75.8%491 13 75.0%490 48 72.1%489 22 70.8%488 57 67.4%487 75 66.3%484 72 58.5%482 72 54.2%480 84 49.2%478 74 44.8%476 80 40.0%474 72 35.6%472 69 31.5%470 66 27.5%468 51 24.5%466 46 21.7%464 50 18.7%462 42 16.2%460 31 14.3%458 14 13.5%457 31 11.6%455 23 10.3%454 24 8.8%453 7 8.4%452 10 7.8%451 8 7.3%450 21 6.1%449 5 5.8%448 19 4.6%447 9 4.1%446 7 3.7%445 2 3.5%444 12 2.8%443 2 2.7%442 7 2.3%441 4 2.0%440 8 1.6%439 1 1.5%438 8 1.0%437 1 1.0%435 6 0.6%433 5 0.3%431 1 0.2%430 0 0.2%428 2 0.1%426 1 0.1%425 0 0.0%424 1 0.0%
0
75th 491
17Percentiles
25th 46850th 480
480Standard Deviation
2014 Talent SearchGrade 7 Female SCATQuantitative Scores
Number of Students
MedianMean
1,668478
0
10
20
30
40
50
60
70
80
90
514
508
503
498
494
490
484
476
468
460
454
450
446
442
438
431
425
Frequency Distribution

Score Frequency Percentile Rank
496 1 100.0%495 1 99.9%494 0 99.9%493 4 99.7%492 0 99.7%491 4 99.5%490 0 99.5%489 9 99.0%488 17 98.1%486 26 96.7%484 37 94.7%483 39 92.6%481 45 90.1%480 46 87.7%478 60 84.4%476 78 80.2%474 64 76.7%473 9 76.2%472 62 72.9%471 11 72.3%470 82 67.8%469 14 67.1%468 54 64.2%467 21 63.0%466 77 58.9%465 14 58.1%464 45 55.7%463 21 54.5%462 61 51.2%461 18 50.2%460 69 46.5%458 65 43.0%456 70 39.2%454 68 35.5%452 76 31.4%450 65 27.9%448 69 24.1%446 43 21.8%444 27 20.4%443 16 19.5%441 27 18.0%440 17 17.1%439 51 14.3%437 28 12.8%436 15 12.0%434 21 10.9%433 9 10.4%432 17 9.5%431 12 8.8%430 26 7.4%429 15 6.6%428 15 5.8%427 10 5.3%426 12 4.6%424 13 3.9%423 17 3.0%422 3 2.8%421 10 2.3%419 10 1.7%417 11 1.1%415 6 0.8%413 7 0.4%412 3 0.3%411 1 0.2%410 4 0.0%
0
50th 46075th 472
Median 460Standard Deviation 18Percentiles
25th 448
Mean 459
2014 Talent SearchGrade 7 Male SCAT Verbal
Number of Students 1,848
0
10
20
30
40
50
60
70
80
90
496
492
488
481
474
470
466
462
456
448
441
436
431
427
422
415
410
Frequency Distribution
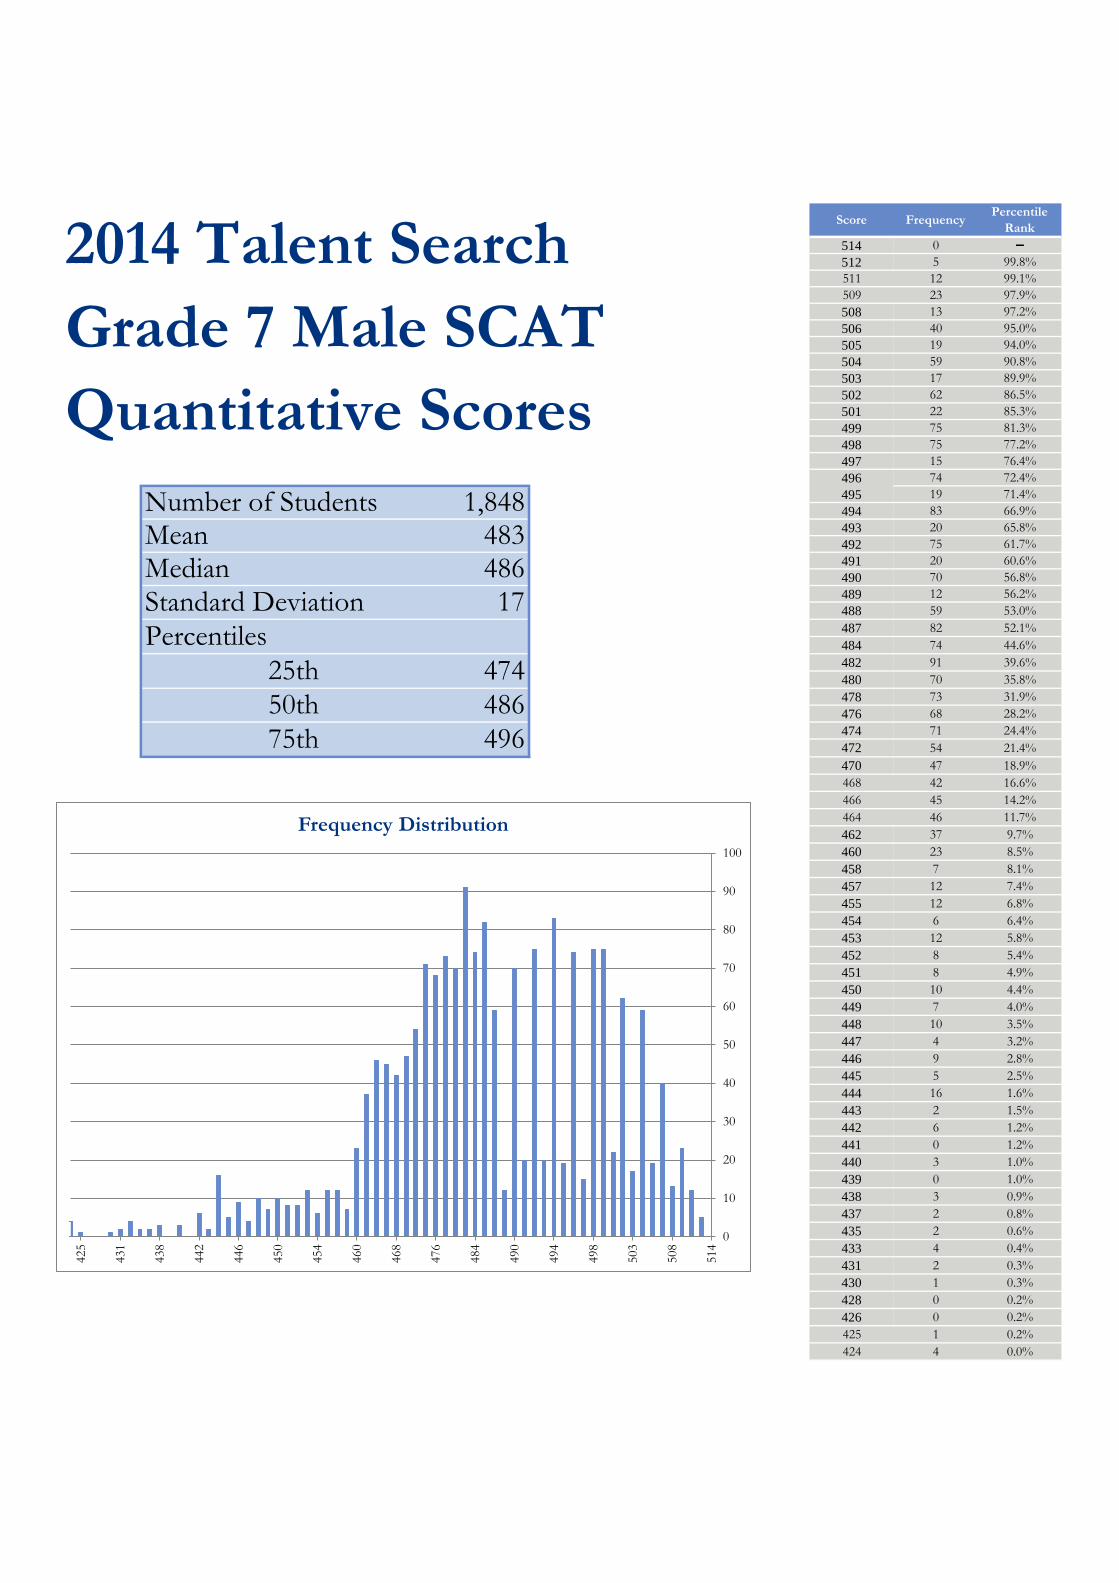
Score Frequency Percentile Rank
514 0 ▬512 5 99.8%511 12 99.1%509 23 97.9%508 13 97.2%506 40 95.0%505 19 94.0%504 59 90.8%503 17 89.9%502 62 86.5%501 22 85.3%499 75 81.3%498 75 77.2%497 15 76.4%496 74 72.4%495 19 71.4%494 83 66.9%493 20 65.8%492 75 61.7%491 20 60.6%490 70 56.8%489 12 56.2%488 59 53.0%487 82 52.1%484 74 44.6%482 91 39.6%480 70 35.8%478 73 31.9%476 68 28.2%474 71 24.4%472 54 21.4%470 47 18.9%468 42 16.6%466 45 14.2%464 46 11.7%462 37 9.7%460 23 8.5%458 7 8.1%457 12 7.4%455 12 6.8%454 6 6.4%453 12 5.8%452 8 5.4%451 8 4.9%450 10 4.4%449 7 4.0%448 10 3.5%447 4 3.2%446 9 2.8%445 5 2.5%444 16 1.6%443 2 1.5%442 6 1.2%441 0 1.2%440 3 1.0%439 0 1.0%438 3 0.9%437 2 0.8%435 2 0.6%433 4 0.4%431 2 0.3%430 1 0.3%428 0 0.2%426 0 0.2%425 1 0.2%424 4 0.0%
0
75th 496
17Percentiles
25th 47450th 486
486Standard Deviation
2014 Talent SearchGrade 7 Male SCATQuantitative Scores
Number of Students
MedianMean
1,848483
0
10
20
30
40
50
60
70
80
90
100
514
508
503
498
494
490
484
476
468
460
454
450
446
442
438
431
425
Frequency Distribution

Score Frequency Percentile Rank
496 0 ▬495 5 99.7%494 0 99.6%493 9 98.9%492 0 98.9%491 4 98.6%490 0 98.6%489 3 98.3%488 15 97.1%486 23 95.2%484 36 92.2%483 30 89.7%481 47 85.9%480 37 82.8%478 48 78.8%476 47 74.9%474 49 70.9%473 9 70.1%472 50 66.0%471 12 65.0%470 31 62.4%469 13 61.4%468 27 59.1%467 16 57.8%466 31 55.3%465 21 53.5%464 32 50.9%463 17 49.5%462 23 47.6%461 42 44.1%460 42 40.7%458 47 36.7%456 41 33.3%454 34 30.5%452 30 28.1%450 44 24.4%448 46 20.6%446 35 17.7%444 26 15.6%443 12 14.6%441 20 12.9%440 6 12.4%439 27 10.2%437 19 8.6%436 7 8.0%434 10 7.2%433 5 6.8%432 15 5.5%431 7 5.0%430 10 4.1%429 6 3.6%428 5 3.2%427 4 2.9%426 5 2.5%424 6 2.0%423 8 1.3%422 4 1.0%421 1 0.9%419 2 0.7%417 5 0.3%415 1 0.2%413 1 ▬412 0 ▬411 1 ▬410 1 ▬
0
50th 46375th 476
Median 463Standard Deviation 17Percentiles
25th 450
Mean 461
2014 Talent SearchGrade 8 Female SCAT Verbal
Number of Students 1,210
0
10
20
30
40
50
60
496
492
488
481
474
470
466
462
456
448
441
436
431
427
422
415
410
Frequency Distribution

Score Frequency Percentile Rank
514 0 ▬512 4 99.8%511 8 99.1%509 10 98.3%508 4 97.9%506 21 96.2%505 5 95.8%504 21 94.0%503 9 93.3%502 35 90.4%501 10 89.6%499 60 84.6%498 44 81.0%497 15 79.7%496 40 76.4%495 18 74.9%494 45 71.2%493 17 69.8%492 34 67.0%491 18 65.5%490 32 62.9%489 20 61.2%488 40 57.9%487 67 55.5%484 65 47.0%482 43 43.4%480 63 38.2%478 42 34.7%476 43 31.2%474 39 28.0%472 30 25.5%470 37 22.4%468 40 19.1%466 32 16.5%464 36 13.5%462 33 10.8%460 22 8.9%458 6 8.4%457 12 7.4%455 5 7.0%454 12 6.0%453 2 5.9%452 5 5.5%451 1 5.4%450 10 4.5%449 2 4.4%448 8 3.7%447 2 3.6%446 3 3.3%445 2 3.1%444 10 2.3%443 2 2.2%442 5 1.7%441 0 1.7%440 6 1.2%439 0 1.2%438 4 0.9%437 0 0.9%435 4 0.6%433 1 0.5%431 2 0.3%430 2 0.2%428 2 0.0%426 0 ▬425 0 ▬424 0 ▬
0
75th 495
16Percentiles
25th 47050th 484
484Standard Deviation
2014 Talent SearchGrade 8 Female SCATQuantitative Scores
Number of Students
MedianMean
1,210482
0
10
20
30
40
50
60
70
80
514
508
503
498
494
490
484
476
468
460
454
450
446
442
438
431
425
Frequency Distribution

Score Frequency Percentile Rank
496 1 100.0%495 3 99.8%494 0 99.7%493 3 99.5%492 0 99.5%491 5 99.1%490 0 99.1%489 13 98.0%488 23 96.1%486 22 94.3%484 29 91.9%483 33 89.2%481 37 86.2%480 39 82.9%478 44 79.3%476 40 76.0%474 65 70.7%473 12 69.7%472 33 66.9%471 10 66.1%470 36 63.1%469 17 61.7%468 27 59.5%467 13 58.5%466 38 55.3%465 22 53.5%464 32 50.9%463 15 49.6%462 29 47.2%461 20 45.6%460 49 41.5%458 42 38.1%456 45 34.4%454 43 30.8%452 43 27.3%450 43 23.7%448 35 20.9%446 39 17.6%444 14 16.5%443 11 15.6%441 16 14.3%440 13 13.2%439 29 10.8%437 15 9.6%436 13 8.5%434 11 7.6%433 4 7.3%432 10 6.4%431 6 5.9%430 8 5.3%429 13 4.2%428 7 3.6%427 6 3.1%426 6 2.6%424 5 2.2%423 3 2.0%422 5 1.6%421 2 1.4%419 4 1.1%417 3 0.8%415 6 0.3%413 4 0.0%412 0 ▬411 0 ▬410 0 ▬
0
50th 46375th 474
Median 463Standard Deviation 17Percentiles
25th 450
Mean 461
2014 Talent SearchGrade 8 Male SCAT Verbal
Number of Students 1,214
0
10
20
30
40
50
60
70
496
492
488
481
474
470
466
462
456
448
441
436
431
427
422
415
410
Frequency Distribution
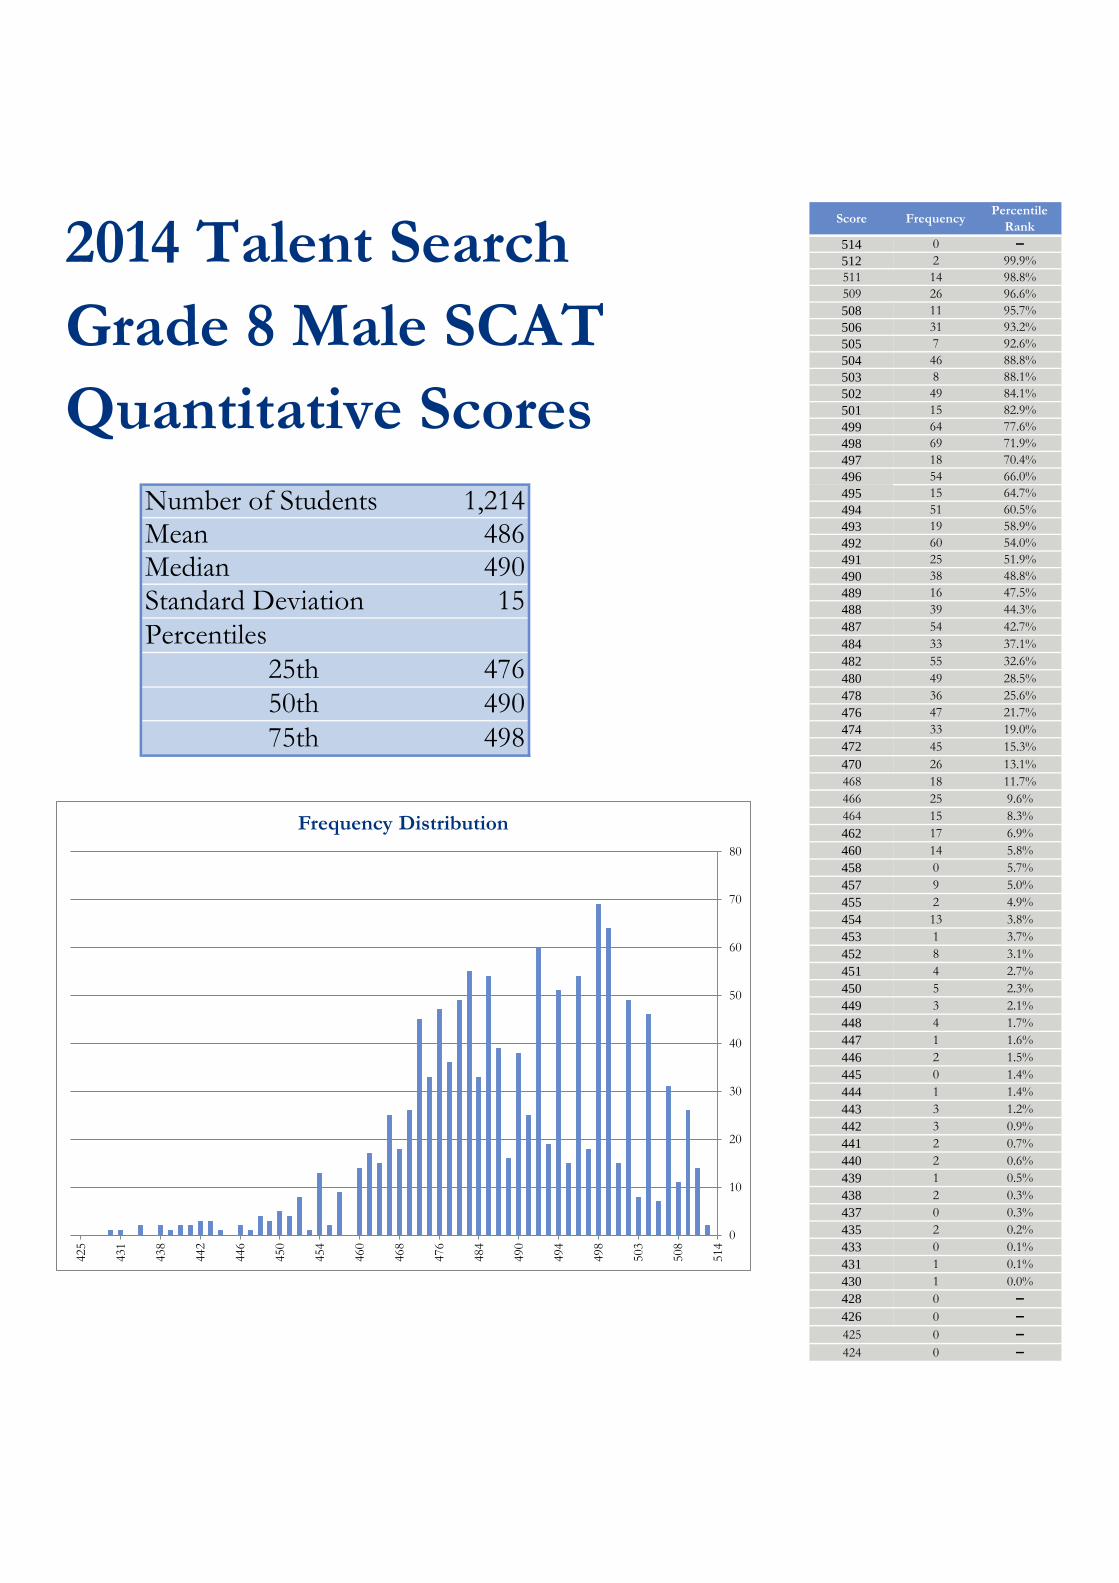
Score Frequency Percentile Rank
514 0 ▬512 2 99.9%511 14 98.8%509 26 96.6%508 11 95.7%506 31 93.2%505 7 92.6%504 46 88.8%503 8 88.1%502 49 84.1%501 15 82.9%499 64 77.6%498 69 71.9%497 18 70.4%496 54 66.0%495 15 64.7%494 51 60.5%493 19 58.9%492 60 54.0%491 25 51.9%490 38 48.8%489 16 47.5%488 39 44.3%487 54 42.7%484 33 37.1%482 55 32.6%480 49 28.5%478 36 25.6%476 47 21.7%474 33 19.0%472 45 15.3%470 26 13.1%468 18 11.7%466 25 9.6%464 15 8.3%462 17 6.9%460 14 5.8%458 0 5.7%457 9 5.0%455 2 4.9%454 13 3.8%453 1 3.7%452 8 3.1%451 4 2.7%450 5 2.3%449 3 2.1%448 4 1.7%447 1 1.6%446 2 1.5%445 0 1.4%444 1 1.4%443 3 1.2%442 3 0.9%441 2 0.7%440 2 0.6%439 1 0.5%438 2 0.3%437 0 0.3%435 2 0.2%433 0 0.1%431 1 0.1%430 1 0.0%428 0 ▬426 0 ▬425 0 ▬424 0 ▬
0
75th 498
15Percentiles
25th 47650th 490
490Standard Deviation
2014 Talent SearchGrade 8 Male SCATQuantitative Scores
Number of Students
MedianMean
1,214486
0
10
20
30
40
50
60
70
80
514
508
503
498
494
490
484
476
468
460
454
450
446
442
438
431
425
Frequency Distribution