2014 study of CEOs, governance, and success The value · PDF file2014 study of CEOs,...
16
2014 study of CEOs, governance, and success The value of getting CEO succession right
Transcript of 2014 study of CEOs, governance, and success The value · PDF file2014 study of CEOs,...
2014 study of CEOs, governance, and success
The value of getting CEO succession right
2 Strategy&
Companies have gotten a lot better at succession planning over the past 15 years—and that’s good news, because simply having a turnover at the top, for any reason, depresses companies’ performance: the median shareholder return at companies that have changed CEOs falls to -3.5 percent (relative to the index they trade on) in the year after the change.
But too many companies still aren’t getting succession planning right. We estimate that at the world’s largest public companies just one problem—being forced into turnovers instead of planning them—has recently cost each company in that situation an average of $1.8 billion in foregone shareholder value.
3Strategy&
In our 15th year of studying CEO successions at the 2,500 largest public companies in the world, we’ve assessed how much progress companies have made toward better succession planning, the value of that improvement, and how much more value some companies are leaving on the table with poor planning.
What’s going right?
• Morecompaniesareplanningsuccessionsinstead of forcing them: companies have increased the share of planned turnovers by 30 percent over the course of our study—from 63 percent in 2000–02 to 82 percent in 2012–14. This is a shift from an average of 85 companies in the top 2,500 having forced turnovers each year to 61.
• Aclearsignofgoodplanningisastronginternal pipeline: High-performing companies with planned successions are more apt to hire their CEO from inside the company than are other companies, and they follow one insider CEO with another one 82 percent of the time, 9 percentage points more often than low-performing companies.
But companies are still too often forced into making a change, and poorly planned successions tend to lead to a vicious circle:
• 27percentofcompaniesundergoingaforced succession hired a CEO from outside
the company over the past 10 years, compared with 20 percent of those making a planned succession.
• OutsiderCEOshavebeenforcedoutofoffice44 percent more often than insiders over the past 10 years (36 percent of the time compared with 25 percent for insiders).
• CEOswhocomeinafteraforcedsuccessionhave shorter median tenures than those coming in after a planned succession—only 4.2 years compared with 5.6—meaning that companies without good succession plans are setting themselves up for more frequent turnovers.
• Mostoften,companiesthatarealreadylowperformers are the ones forced into turnovers and hiring CEOs from the outside—so their poor succession planning tends to increase the degree of change, uncertainty, and sometimes even paralysis inside these companies, and correlates with ongoing low performance and turnovers happening ever faster.
There is hope:
• Iftheworld’slargestcompaniescollectivelywere able to reach a steady state in which only 10 percent of their turnovers each year were forced, we estimate this could help them add some $60 billion in shareholder value annually (assuming all else stays the same).
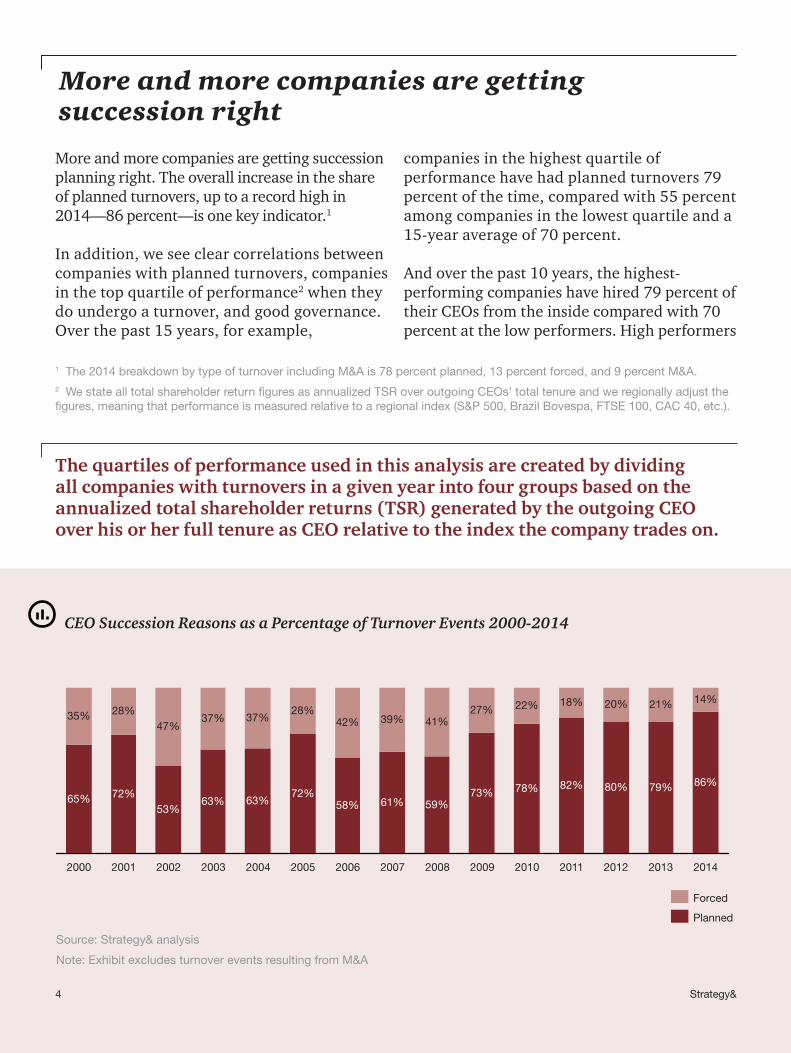
CEO Succession Reasons as a Percentage of Turnover Events 2000-2014
4 Strategy&
1 The 2014 breakdown by type of turnover including M&A is 78 percent planned, 13 percent forced, and 9 percent M&A.2 We state all total shareholder return figures as annualized TSR over outgoing CEOs’ total tenure and we regionally adjust the figures, meaning that performance is measured relative to a regional index (S&P 500, Brazil Bovespa, FTSE 100, CAC 40, etc.).
Moreandmorecompaniesaregettingsuccessionplanning right. The overall increase in the share of planned turnovers, up to a record high in 2014—86 percent—is one key indicator.1
In addition, we see clear correlations between companies with planned turnovers, companies in the top quartile of performance2 when they do undergo a turnover, and good governance. Over the past 15 years, for example,
companies in the highest quartile of performancehavehadplannedturnovers79percent of the time, compared with 55 percent among companies in the lowest quartile and a 15-yearaverageof70percent.
Andoverthepast10years,thehighest-performingcompanieshavehired79percentoftheirCEOsfromtheinsidecomparedwith70percent at the low performers. High performers
More and more companies are getting succession right
The quartiles of performance used in this analysis are created by dividing all companies with turnovers in a given year into four groups based on the annualized total shareholder returns (TSR) generated by the outgoing CEO over his or her full tenure as CEO relative to the index the company trades on.
201120102009200820072006200520042003200220012000 201420132012
82%
18%
78%
22%
73%
27%
59%
41%
61%
39%
58%
42%
72%
28%
63%
37%
63%
37%
53%
47%
72%
28%
65%
35%
86%
14%
79%
21%
80%
20%
Planned
Forced
Source: Strategy& analysis
Note: Exhibit excludes turnover events resulting from M&A
5Strategy&
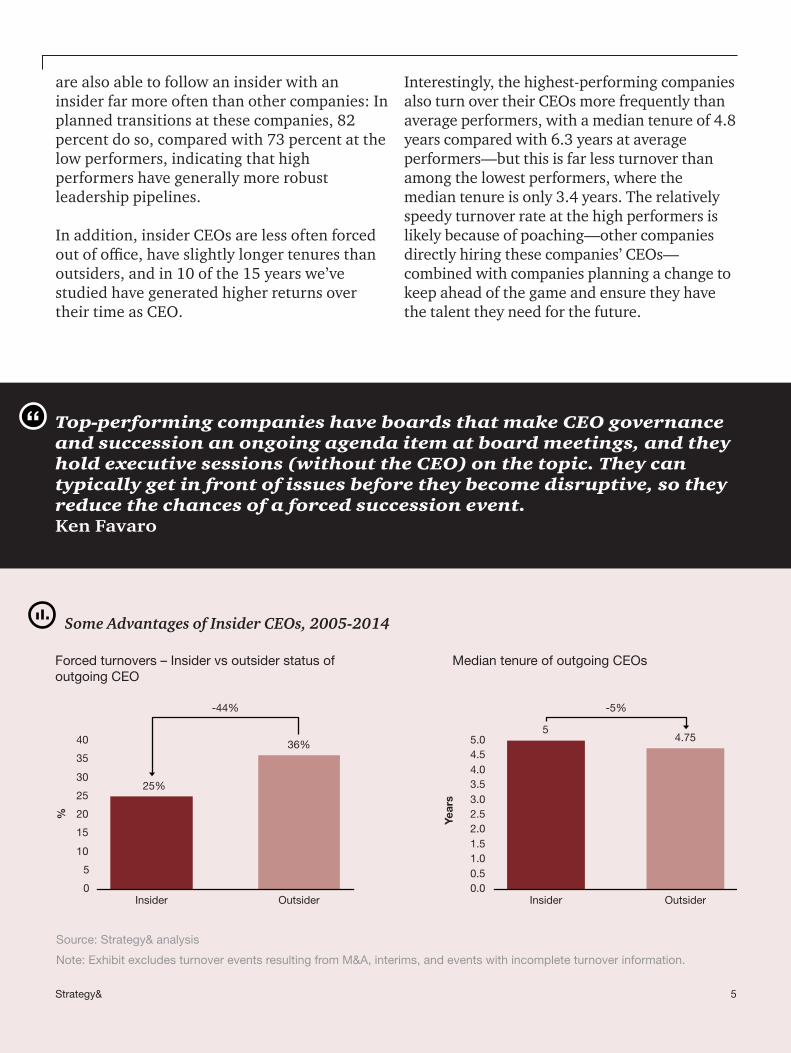
are also able to follow an insider with an insider far more often than other companies: In planned transitions at these companies, 82 percentdoso,comparedwith73percentatthelow performers, indicating that high performers have generally more robust leadership pipelines.
In addition, insider CEOs are less often forced outofoffice,haveslightlylongertenuresthanoutsiders, and in 10 of the 15 years we’ve studied have generated higher returns over their time as CEO.
Interestingly, the highest-performing companies also turn over their CEOs more frequently than average performers, with a median tenure of 4.8 years compared with 6.3 years at average performers—but this is far less turnover than among the lowest performers, where the median tenure is only 3.4 years. The relatively speedy turnover rate at the high performers is likely because of poaching—other companies directly hiring these companies’ CEOs—combined with companies planning a change to keep ahead of the game and ensure they have the talent they need for the future.
Top-performing companies have boards that make CEO governance and succession an ongoing agenda item at board meetings, and they hold executive sessions (without the CEO) on the topic. They can typically get in front of issues before they become disruptive, so they reduce the chances of a forced succession event.Ken Favaro
Source: Strategy& analysis
Note: Exhibit excludes turnover events resulting from M&A, interims, and events with incomplete turnover information.
Some Advantages of Insider CEOs, 2005-2014
0
5
10
15
20
25
30
35
40
Outsider
25%
36%
%
Insider
5
0.00.51.01.52.02.53.03.54.04.55.0
Outsider
4.75
-5%-44%
Year
s
Insider
Forced turnovers – Insider vs outsider status of outgoing CEO
Median tenure of outgoing CEOs
It’s important to remember that forced turnovers aren’t always the wrong choice—surprises happen to the best-run companies and sometimes a board simply needs to make a change for the overall good of the company. Even so, our experience suggests that having a solid plan will help a company stabilize sooner after any kind of turnover.Gary L. Neilson
More Interim and Outsider CEOs at the Lowest-Performing Companies
Permanent insider
Permanent outsider
Interim
Lowest-performing companies
60%
25%
15% 10%
21%
69%
Highest-performing companies
Source: Strategy& analysis
Note: Exhibit excludes turnover events resulting from M&A, and events with incomplete turnover information.
6 Strategy&
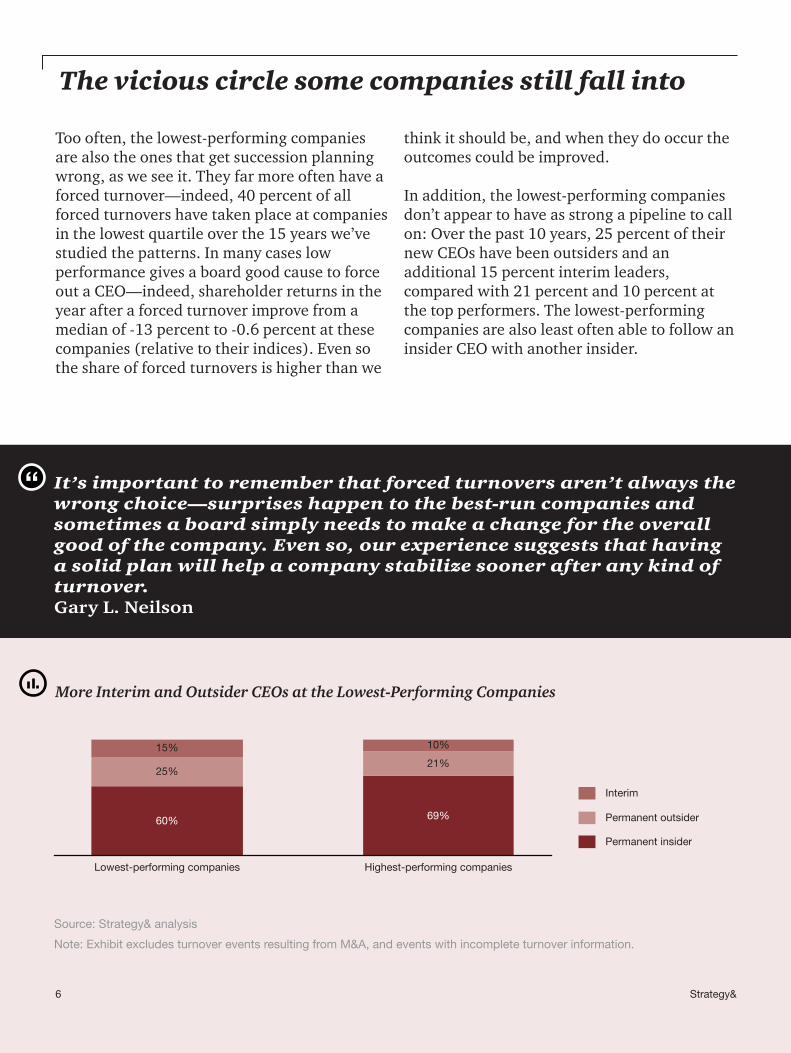
Too often, the lowest-performing companies are also the ones that get succession planning wrong, as we see it. They far more often have a forced turnover—indeed, 40 percent of all forced turnovers have taken place at companies in the lowest quartile over the 15 years we’ve studied the patterns. In many cases low performance gives a board good cause to force out a CEO—indeed, shareholder returns in the year after a forced turnover improve from a median of -13 percent to -0.6 percent at these companies (relative to their indices). Even so the share of forced turnovers is higher than we
think it should be, and when they do occur the outcomes could be improved. In addition, the lowest-performing companies don’t appear to have as strong a pipeline to call on: Over the past 10 years, 25 percent of their new CEOs have been outsiders and an additional 15 percent interim leaders, compared with 21 percent and 10 percent at the top performers. The lowest-performing companies are also least often able to follow an insider CEO with another insider.
The vicious circle some companies still fall into
7Strategy&
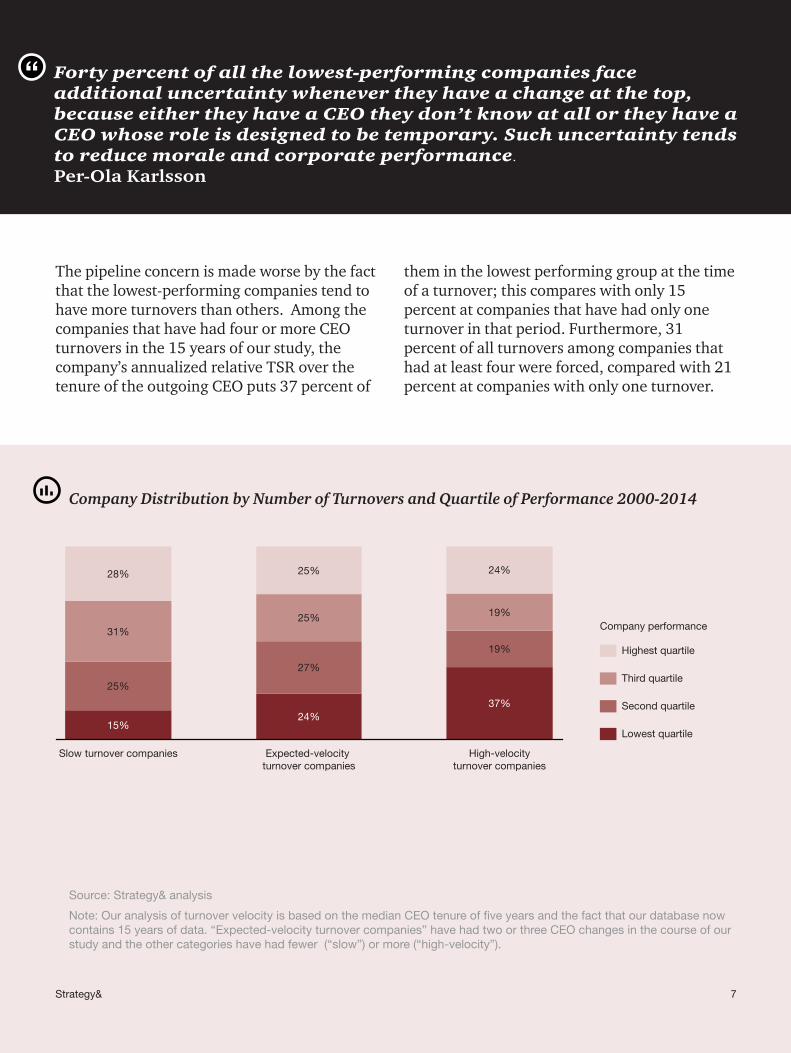
The pipeline concern is made worse by the fact that the lowest-performing companies tend to havemoreturnoversthanothers.Amongthecompanies that have had four or more CEO turnovers in the 15 years of our study, the company’s annualized relative TSR over the tenureoftheoutgoingCEOputs37percentof
them in the lowest performing group at the time of a turnover; this compares with only 15 percent at companies that have had only one turnover in that period. Furthermore, 31 percent of all turnovers among companies that had at least four were forced, compared with 21 percent at companies with only one turnover.
Forty percent of all the lowest-performing companies face additional uncertainty whenever they have a change at the top, because either they have a CEO they don’t know at all or they have a CEO whose role is designed to be temporary. Such uncertainty tends to reduce morale and corporate performance.
Per-Ola Karlsson
Company Distribution by Number of Turnovers and Quartile of Performance 2000-2014
Source: Strategy& analysis
Note: Our analysis of turnover velocity is based on the median CEO tenure of five years and the fact that our database now contains 15 years of data. “Expected-velocity turnover companies” have had two or three CEO changes in the course of our study and the other categories have had fewer (“slow”) or more (“high-velocity”).
15%24%
37%
25%
27%
19%
31%25% 19%
28% 25% 24%
Slow turnover companies High-velocityturnover companies
Expected-velocity turnover companies
Highest quartile
Company performance
Lowest quartile
Second quartile
Third quartile
8 Strategy&
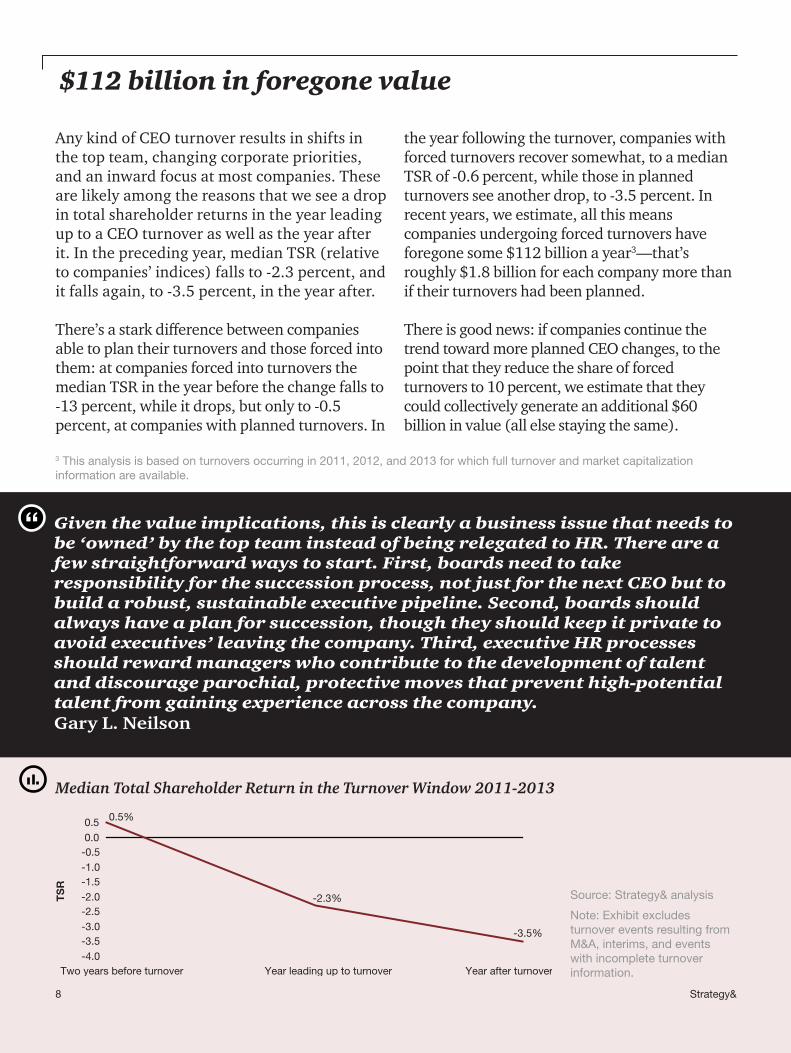
AnykindofCEOturnoverresultsinshiftsinthe top team, changing corporate priorities, and an inward focus at most companies. These are likely among the reasons that we see a drop in total shareholder returns in the year leading up to a CEO turnover as well as the year after it. In the preceding year, median TSR (relative to companies’ indices) falls to -2.3 percent, and it falls again, to -3.5 percent, in the year after.
There’sastarkdifferencebetweencompaniesable to plan their turnovers and those forced into them: at companies forced into turnovers the median TSR in the year before the change falls to -13 percent, while it drops, but only to -0.5 percent, at companies with planned turnovers. In
the year following the turnover, companies with forced turnovers recover somewhat, to a median TSR of -0.6 percent, while those in planned turnovers see another drop, to -3.5 percent. In recent years, we estimate, all this means companies undergoing forced turnovers have foregone some $112 billion a year3—that’s roughly $1.8 billion for each company more than if their turnovers had been planned.
There is good news: if companies continue the trend toward more planned CEO changes, to the point that they reduce the share of forced turnovers to 10 percent, we estimate that they could collectively generate an additional $60 billion in value (all else staying the same).
$112 billion in foregone value
Given the value implications, this is clearly a business issue that needs to be ‘owned’ by the top team instead of being relegated to HR. There are a few straightforward ways to start. First, boards need to take responsibility for the succession process, not just for the next CEO but to build a robust, sustainable executive pipeline. Second, boards should always have a plan for succession, though they should keep it private to avoid executives’ leaving the company. Third, executive HR processes should reward managers who contribute to the development of talent and discourage parochial, protective moves that prevent high-potential talent from gaining experience across the company.Gary L. Neilson
Median Total Shareholder Return in the Turnover Window 2011-2013
Source: Strategy& analysis
Note: Exhibit excludes turnover events resulting from M&A, interims, and events with incomplete turnover information.
3 This analysis is based on turnovers occurring in 2011, 2012, and 2013 for which full turnover and market capitalization information are available.
-4.0-3.5-3.0-2.5-2.0-1.5-1.0-0.50.00.5
TS
R
Year after turnover
-3.5%
Year leading up to turnover
-2.3%
Two years before turnover
0.5%
9Strategy&
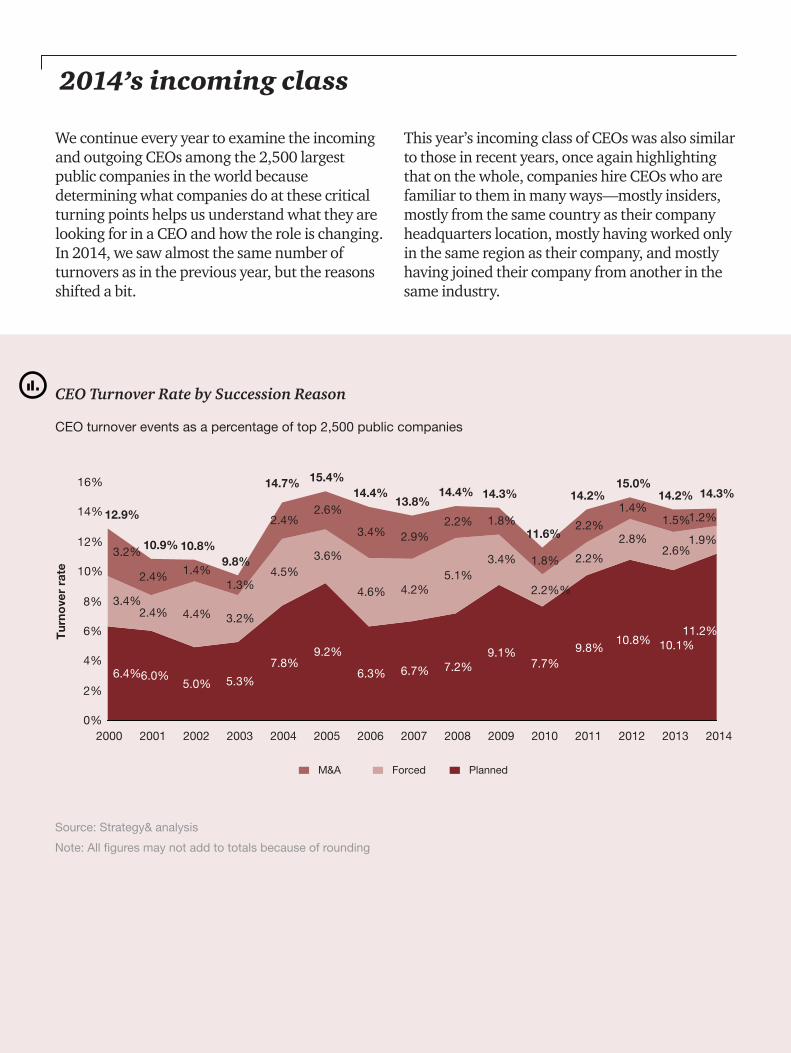
We continue every year to examine the incoming and outgoing CEOs among the 2,500 largest public companies in the world because determining what companies do at these critical turning points helps us understand what they are looking for in a CEO and how the role is changing. In 2014, we saw almost the same number of turnovers as in the previous year, but the reasons shifted a bit.
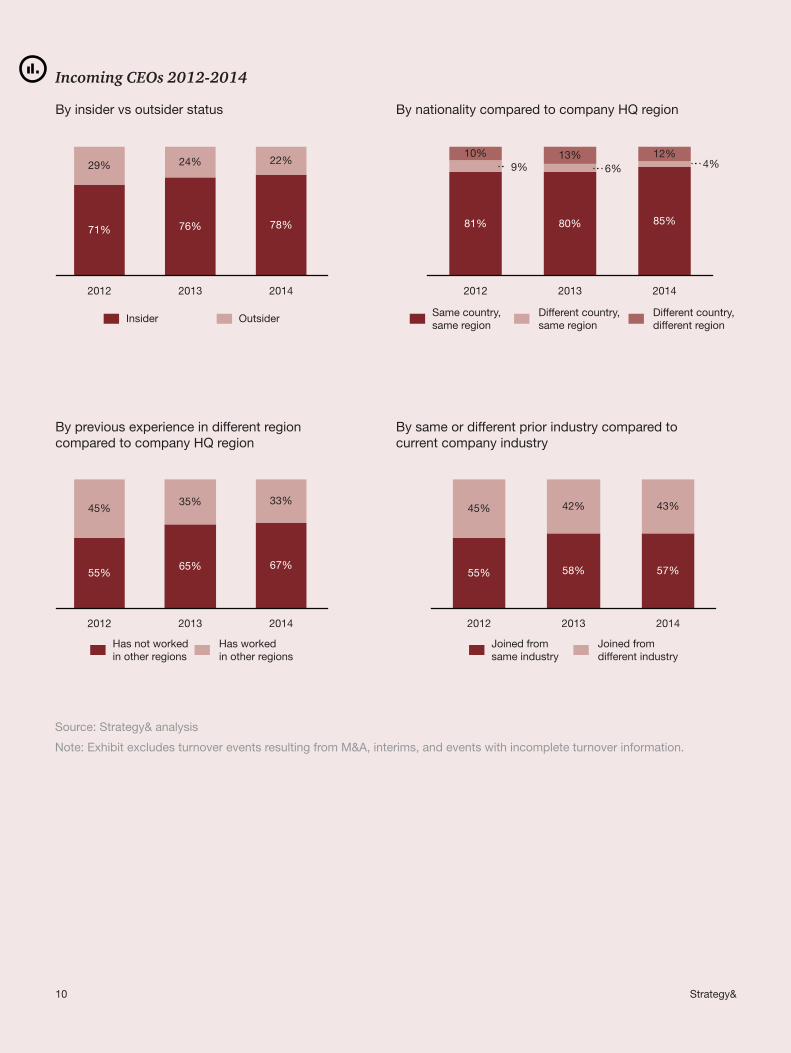
This year’s incoming class of CEOs was also similar to those in recent years, once again highlighting that on the whole, companies hire CEOs who are familiar to them in many ways—mostly insiders, mostly from the same country as their company headquarters location, mostly having worked only in the same region as their company, and mostly having joined their company from another in the same industry.
2014’s incoming class
CEO Turnover Rate by Succession Reason
CEO turnover events as a percentage of top 2,500 public companies
Source: Strategy& analysis
Note: All figures may not add to totals because of rounding
0%
2%
4%
6%
8%
10%
12%
14%
16%
11.2%
1.9%
1.2%
2013
14.2%
10.1%
2.6%
1.5%
2012
15.0%
10.8%
2.8%
1.4%
2011
14.2%
9.8%
2.2%
2.2%
2010
11.6%
7.7%
2.2%%
1.8%
2009 2014
14.3%
Tur
nove
r ra
te
14.3%
9.1%
3.4%
1.8%
2008
14.4%
7.2%
5.1%
2.2%
2007
13.8%
6.7%
4.2%
2.9%
2006
14.4%
6.3%
4.6%
3.4%
2005
15.4%
9.2%
3.6%
2.6%
2004
14.7%
7.8%
4.5%
2.4%
2003
9.8%
5.3%
3.2%
1.3%
2002
10.8%
5.0%
4.4%
1.4%
2001
10.9%
6.0%
2.4%
2.4%
2000
12.9%
6.4%
3.4%
3.2%
PlannedForcedM&A
10 Strategy&
2012
78%
22%
76%
24%
2013
71%
29%
2014
2014
67%
33%
2013
65%
35%
2012
55%
45%
80% 85%
2014
12%
2013
6% 4%13%
2012
81%
9%10%
55% 58% 57%
45% 42% 43%
201420132012
Insider Outsider Same country, same region
Different country, same region
Different country, different region
Joined from same industry
Joined from different industry
Has not worked in other regions
Has worked in other regions
By insider vs outsider status
By previous experience in different region compared to company HQ region
By nationality compared to company HQ region
By same or different prior industry compared to current company industry
Source: Strategy& analysis
Note: Exhibit excludes turnover events resulting from M&A, interims, and events with incomplete turnover information.
Incoming CEOs 2012-2014
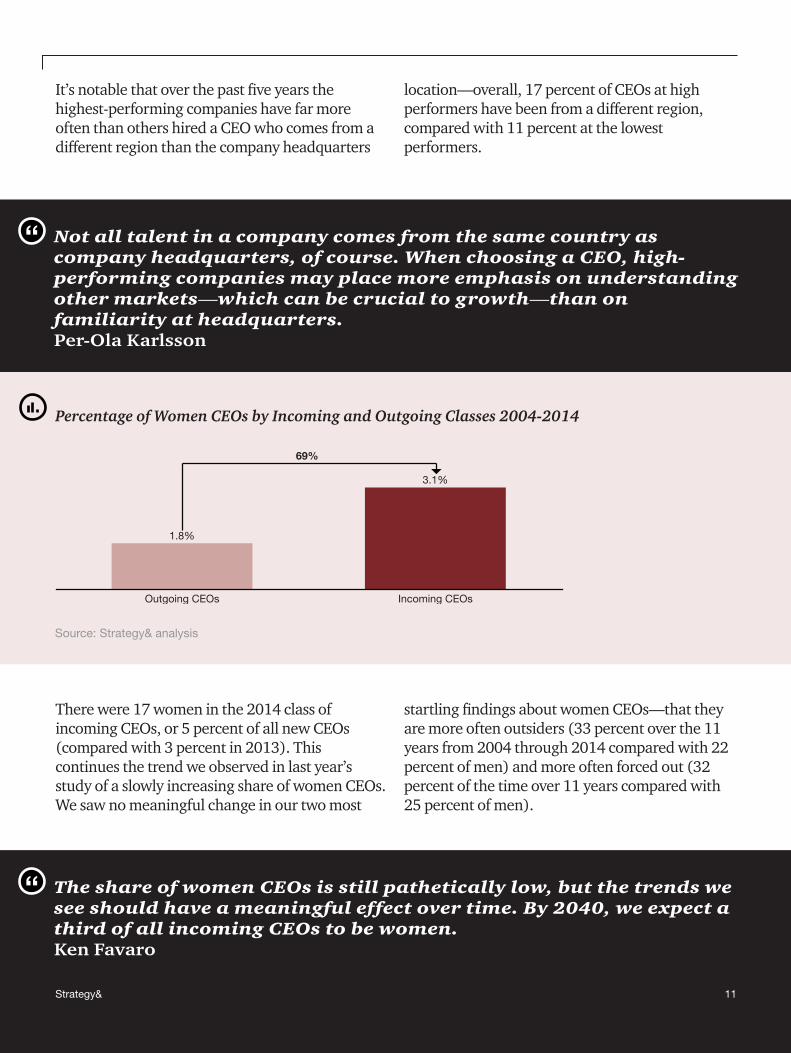
Not all talent in a company comes from the same country as company headquarters, of course. When choosing a CEO, high-performing companies may place more emphasis on understanding other markets—which can be crucial to growth—than on familiarity at headquarters. Per-Ola Karlsson
The share of women CEOs is still pathetically low, but the trends we see should have a meaningful effect over time. By 2040, we expect a third of all incoming CEOs to be women. Ken Favaro
It’snotablethatoverthepastfiveyearsthehighest-performing companies have far more often than others hired a CEO who comes from a differentregionthanthecompanyheadquarters
location—overall,17percentofCEOsathighperformershavebeenfromadifferentregion,compared with 11 percent at the lowest performers.
Therewere17womeninthe2014classofincoming CEOs, or 5 percent of all new CEOs (compared with 3 percent in 2013). This continues the trend we observed in last year’s study of a slowly increasing share of women CEOs. We saw no meaningful change in our two most
startlingfindingsaboutwomenCEOs—thattheyare more often outsiders (33 percent over the 11 years from 2004 through 2014 compared with 22 percent of men) and more often forced out (32 percent of the time over 11 years compared with 25 percent of men).
Source: Strategy& analysis
Percentage of Women CEOs by Incoming and Outgoing Classes 2004-2014
69%
Incoming CEOsOutgoing CEOs
1.8%
3.1%
11Strategy&
12 Strategy&
Source: Strategy& analysis1 “Other mature” economies include Argentina, Australia, Bahrain, Chile, Cyprus, Czech Republic, Hong Kong, Hungary, New Zealand, Poland, Saudi Arabia, South Korea, etc. 2 “Other emerging” economies include Colombia, Egypt, Indonesia, Kazakhstan, Mauritius, Mexico, Mongolia, Nigeria, South Africa, Turkey, etc.
Note: “Mature” countries are defined as per the U.N. Development Programme 2013 ranking of countries with “very high human development” (human development index >0.8); all others are “emerging” countries.
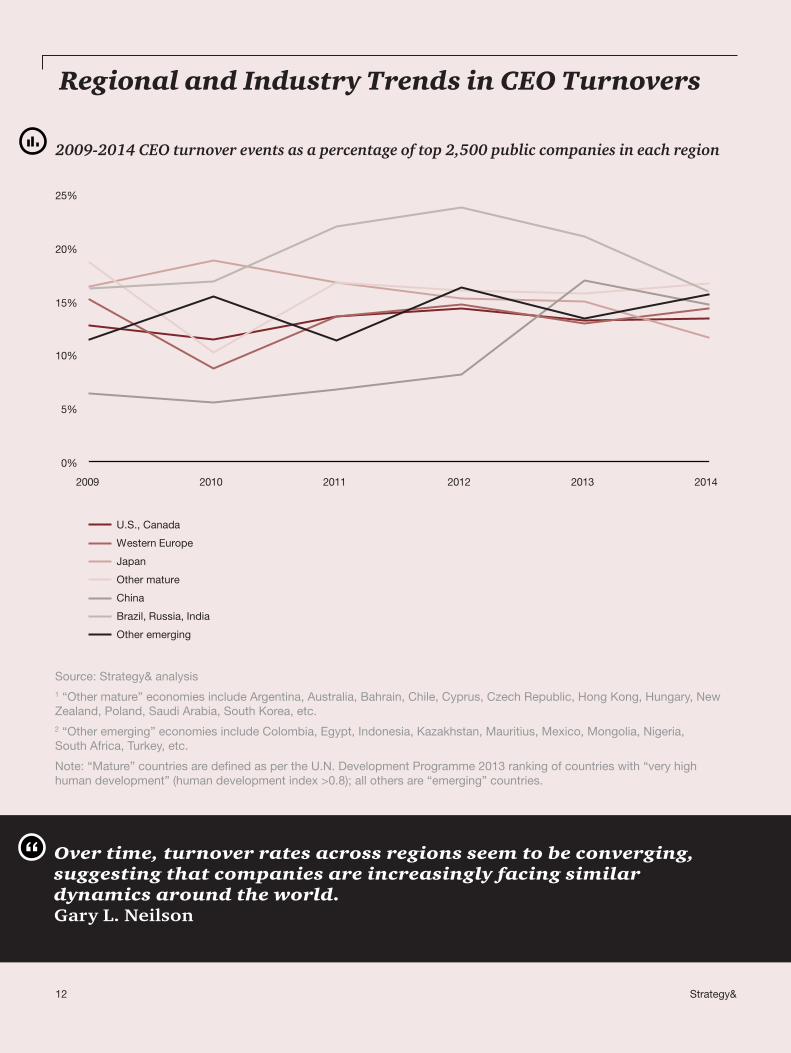
2009-2014 CEO turnover events as a percentage of top 2,500 public companies in each region
0%
5%
10%
15%
20%
25%
2009 2010 2011 2012 2013 2014
China
Brazil, Russia, India
Other emerging
Other mature
Japan
Western Europe
U.S., Canada
Over time, turnover rates across regions seem to be converging, suggesting that companies are increasingly facing similar dynamics around the world.Gary L. Neilson
Regional and Industry Trends in CEO Turnovers
13Strategy&
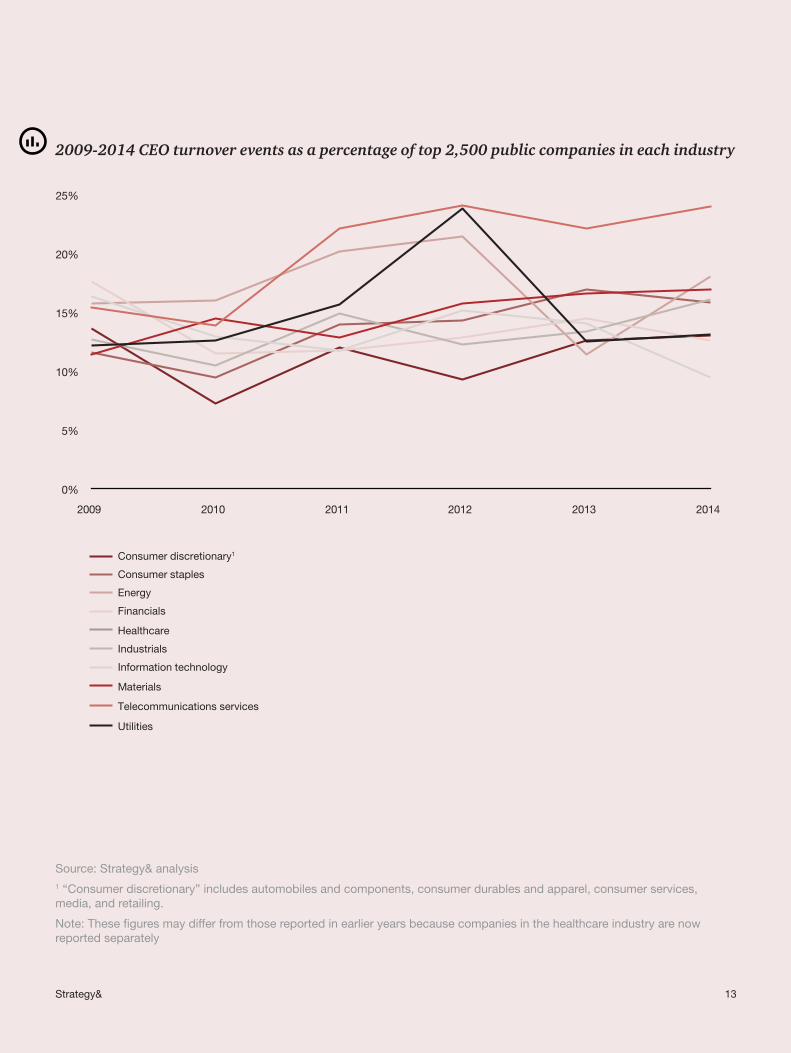
2009-2014 CEO turnover events as a percentage of top 2,500 public companies in each industry
Source: Strategy& analysis1 “Consumer discretionary” includes automobiles and components, consumer durables and apparel, consumer services, media, and retailing.
Note: These figures may differ from those reported in earlier years because companies in the healthcare industry are now reported separately
0%
5%
10%
15%
20%
25%
2009 2010 2011 2012 2013 2014
Energy
Financials
Industrials
Information technology
Materials
Telecommunications services
Consumer staples
Consumer discretionary1
Utilities
Healthcare
14 Strategy&
This study of CEOs, Governance, and Success identified the world’s 2,500 largest public companies, defined by their market capitalization (from Bloomberg) on January 1, 2014. We then identified the companies among the top 2,500 that had experienced a chief executive succession event between January 1, 2014, and December 31, 2014, and cross-checked data using a wide variety of printed and electronic sources in many languages. For a listing of companies that had been acquired or merged in 2014, we also used Bloomberg.
Each company that appeared to have changed its CEO was investigated for confirmation that a change occurred in 2014, and additional details—title, tenure, chairmanship, nationality, professional experience, and so on—were sought on both the outgoing and incoming chief executives (as well as any interim chief executives).
Company-provided information was acceptable for most data elements except the reason for the succession. Outside press reports and other independentsourceswereusedtoconfirmthereason for an executive’s departure. Finally, Strategy& consultants worldwide separately validated each succession event as part of the efforttolearnthereasonforspecificCEOchanges in their region.
To distinguish between mature and emerging economies, Strategy& followed the United Nations Development Programme 2013 ranking.
Total shareholder return data over a CEO’s tenure was sourced from Bloomberg and includes reinvestment of dividends (if any). Total shareholder return data was then regionally market-adjusted (measured as the differencebetweenthecompany’sreturnandthe return of the main regional index over the same time period) and annualized.
Methodology
15Strategy&
Ken Favaro
Ken Favaro is a Strategy& senior partner and its global lead for enterprise strategy. He is based in New York. His expertise covers corporate and business strategy, strategic innovation, and organic growth. Favaro works across all industries, particularly in the consumer, retail, healthcare, and financial-servicesindustries.
Per-Ola Karlsson
Based in Dubai, Per-Ola Karlsson is a senior partner with 28 years of consulting experience. His main areas of expertise are strategy formulation, organizational development, corporate center design, and governance. In addition, he frequently supports companies in the areas of change management and people capabilities.
Gary L. Neilson
Gary L. Neilson isaseniorpartnerbasedinStrategy&’sChicagooffice.Hehas35yearsofexperiencewiththefirmandfocusesonhelpingFortune500companieswithoperatingmodeltransformationchallenges.Morespecifically,hehelpsclientsacrossallindustrieswithorganizationaldesign,costrestructuring, and enterprise-wide transformation programs.
About the authors
Contacts
Abu Dhabi
Joanne [email protected]
Amsterdam
Monique De [email protected]
London
Deirdre [email protected]
Munich
Meike Hegge+49-89-545-25-644meike.hegge @strategyand.pwc.com
Paris
Beatrice Malasset +33-1-44-34-3131 beatrice.malasset @strategyand.pwc.com
São Paulo
Deborah Frattini +55-11-5501-6290 deborah.frattini @strategyand.pwc.com
Shanghai
Michelle Wang +86-21-2327-9825michelle.wang @strategyand.pwc.com
Stockholm
Fredrik Vernersson+46-8-506-190-62fredrik.vernersson @strategyand.pwc.com
Sydney
Sarah Cole+61-2-9321-1931 sarah.cole @strategyand.pwc.com
Tokyo
Ayumi Suda+81-3-6757-8683ayumi.suda @strategyand.pwc.com
Washington, DC
Michelle Farhi+1-301-758-7011michelle.farhi @strategyand.pwc.com
Zurich
Karla Schulze-Osthoff +41-43-268-2137karla.schulzeosthoff @strategyand.pwc.com

© 2015 PwC. All rights reserved. PwC refers to the PwC network and/or one or more of its member firms, each of which is a separate legal entity. Please see www.pwc.com/structure for further details. Disclaimer: This content is for general information purposes only, and should not be used as a substitute for consultation with professional advisors.
www.strategyand.pwc.com
Strategy& is a global teamof practical strategists committed to helping you seize essential advantage.
We do that by working alongside you to solve your toughest problems and helping you capture your greatest opportunities.
These are complex and high-stakes undertakings — often game-changing transformations. We bring 100 years of strategy consulting experienceand the unrivaled industry and functional capabilitiesof the PwC network to the task. Whether you’re
charting your corporate strategy, transforming a function or business unit, or building critical capabilities, we’ll help you create the value you’re looking forwith speed, confidence,and impact.
We are part of the PwC network of firms in157 countries with more than 195,000 people committed to delivering quality in assurance, tax, and advisory services. Tell us what matters to you and find out more by visiting us at strategyand.pwc.com/me.