2014 Report on Women’s Earnings - CalHR Homes-earnings-2014.pdf2014 Report on Women’s Earnings...
25
2014 Report on Women’s Earnings in California State Civil Service Classifications California Department of Human Resources Office of Civil Rights and Statewide Workforce Planning and Recruitment Unit 1515 S Street, North Building, Suite 400 Sacramento, California 95811
Transcript of 2014 Report on Women’s Earnings - CalHR Homes-earnings-2014.pdf2014 Report on Women’s Earnings...

2014 Report on Women’s Earnings in California State Civil Service Classifications
California Department of Human Resources Office of Civil Rights and Statewide Workforce Planning and Recruitment Unit 1515 S Street, North Building, Suite 400 Sacramento, California 95811

2014 Report on Women’s Earnings in State Civil Service Classifications
2
Contents Overview ....................................................................................................................... 4
Background ................................................................................................................... 4
Comparing Gender Pay Gaps ........................................................................................ 5
CHART 1 – Gender Pay Gap in the US, California, Federal Civil Service, and California Civil Service 2013 to 2014 ......................................................................... 6
State Civil Service Gender Pay Gap: 1989 to 2014 ......................................................... 6
CHART 2 – State Civil Service Gender Pay Gap: 25-Year Comparison .................... 6
Closing the State Civil Service Gender Pay Gap ........................................................... 6
CHART 3 – Gender Pay Gap Forecast for Next 10 Years ......................................... 7
Women’s Earnings as a Percentage of Men’s Earnings ................................................. 7
CHART 4 – Twenty-Five Year Trend: Women’s Earnings as a Percentage of Men's Earnings .......................................................................................................... 8
CHART 5 – Ten Year Trend: Women’s Earnings as a Percentage of Men's Earnings .................................................................................................................... 8
Women’s Occupations in State Civil Service Compared to California and US Workforce ...................................................................................................................... 8
TABLE 1 – Percentage of Women in Each Occupational Group - State Civil Service, California, and US Workforce in 2014 .......................................................... 9
Women in State Civil Service - 1989 and 2014............................................................ 10
TABLE 2 – Full-Time Employment Increases by Gender, 1989 to 2014 .................. 10
State Civil Service Median Salary Data Since 1989 ...................................................... 11
TABLE 3 – Full-Time Employees’ Median Salary by Year and Gender .................... 11
Recruitment and Hiring Women ................................................................................... 12
TABLE 4a – Number and Percentage of Hires that were Women ........................... 12
Strategies for Supporting Recruitment and Hiring of Women in State Civil Service . 12
Marketing ............................................................................................................. 12
Benefits including the following ............................................................................ 12
Focused Recruitment for Diversity that is Representative of the Labor Force ...... 13
Media ................................................................................................................... 13
Internships and Job Shadowing Opportunities ...................................................... 13
Reduction and Gender Shift in the State’s Clerical Workforce ................................. 14
TABLE 4b – Percentage of Women Hires by Occupation ........................................ 14
Promoting Women ....................................................................................................... 15
TABLE 5a –Women Promoted in Civil Service ........................................................ 15
Recommended Strategies to Help Support Professional Development and Retention of Women in the Workplace .................................................................... 16
Training and Development Opportunities ............................................................. 16

2014 Report on Women’s Earnings in State Civil Service Classifications
3
Upward Mobility .................................................................................................... 16
Encourage Flexibility ............................................................................................ 16
Emphasize Family-Friendly Benefits .................................................................... 16
Develop an Agency Culture that Emphasizes Work-Life Balance ......................... 16
Leadership Development/Succession Planning .................................................... 17
Changes in Women’s Promotional Patterns ............................................................ 17
TABLE 5b– Civil Service Promotions by Job Category ............................................ 17
TABLE 6a –Women Civil Service Employees .......................................................... 19
Employment by Job Category .................................................................................. 19
TABLE 6b – Distribution of Full-Time Women Employees By Job Category ............ 20
Conclusion .................................................................................................................. 22
Attachment 1: Government Code section 19827.2 ........................................................ 23
Attachment 2: California Civil Service Classifications Not Matched to Occupational Groups ........................................................................................................................ 25

2014 Report on Women’s Earnings in State Civil Service Classifications
4
Overview
The California Department of Human Resources (CalHR) recognizes the interest of both the Administration and the Legislature in closing the pay equity gap. Building on the Federal Equal Pay Act, the California Fair Pay Act went into effect this year, and CalHR is committed to the Act’s guiding principle: like salaries should be paid for comparable duties. This report not only marks current progress toward this goal, but it also presents strategies for state agencies to increase the number of women in high-paying jobs in an effort to close the gap in median salary between women and men in state civil service.
Women working in state civil service careers are employed in a greater variety of occupations than in the overall California and United States (US) workforce, and California state civil service has a larger percentage of women holding positions in science, technology, engineering, and mathematics, or STEM, careers. Despite these employment gains, women in state civil service experience a larger gender pay gap compared to the federal civil service and the general California and US workforce. Gender pay gap is defined as the difference between the median salary of male and female employees.
The State of California has made progress in reducing the gender pay gap over the past 25 years. The number of women employed in California’s civil service increased 30 percent from 1989 to 2014, while the number of male employees increased by 27.3 percent. In 2014, women accounted for 59.7 percent of all new hires by the state and received 44.0 percent of all promotions. In 1989, the majority of women were employed in Professional, Technical and Clerical positions. By 2014, the percentage of female civil service employees working in Clerical jobs had decreased by 17.5 percent and the total in Administrative positions had increased by 16.4 percent. With women branching out to higher paying job categories, the gender pay gap has improved, closing from 25.8 percent in 1989 to 20.5 percent in 2014.
While the number of women in state civil service has increased in a variety of occupations and the gender pay gap has been reduced since 1989, women are still underrepresented relative to their presence in the population, and female employees have not yet reached pay parity. The state must close the gender pay gap by applying inclusive talent management strategies to recruitment, selection and hiring, retention, and professional development efforts focused on bringing more women into higher-paying civil service careers.
Background
Government Code section 19827.2 (Attachment 1) requires CalHR to review information relevant to the setting of salaries for “female-dominated” occupations. The intent of the legislation is to establish a foundation for setting salaries for female-dominated jobs based on comparability of the value of work to other classes within state civil service.
Since 1983, CalHR has set salaries and other terms and conditions of employment for the majority of civil service employees based on Memoranda of Understanding

2014 Report on Women’s Earnings in State Civil Service Classifications
5
(MOU) agreed to in bargaining between the State of California and exclusive representatives. Government Code section 3517 provides that actions to adjust employee compensation occur through collective bargaining following the meet-and-confer process. Not only rank and file, but also management classifications, receive wage differentials based on merit and seniority. No state classification imposes wage differentials based on employee gender.
CalHR adjusts the salaries for employee classes excluded from collective bargaining taking into consideration market compensation surveys of large public sector employers, geographical labor market needs, recruitment and retention issues, the employer’s ability to pay, and the state salary structure.
Comparing Gender Pay Gaps
The “gender pay gap” is the salary difference between male and female workers. Annually the median salary of male employees is compared to the median salary of female employees. This “dollar” difference is converted to a percentage difference of the female median to the male median. A gap of 20 percent would mean that females earn 80 percent of the male median salary.
The gender pay gap in state civil service is currently 20.5 percent. The median earnings of men working in state civil service earns 20.5 percent more than median earnings of women working in state civil service. This gap is due to the professions in which women are employed. There is no gender-based difference to pay within occupations of the state civil service.
The California civil service gender pay gap is about the same as the national labor force figure of 20.1 percent1 as reported by the United States Census Bureau in their American Community Survey data for 2014. The Census Bureau bases its figure on the median earnings of full-time wage and salary workers, age 16 years and older. At the same time, the Census Bureau reported that the gap between female and male workers in California was just 15.9 percent2 and just 11.9 percent for the Federal workforce.3 Therefore, the gender pay gap for state civil service employees is about the same as the national pay gap, but greater than the pay gap for all workers in California and the federal civil service, as illustrated in Chart 1 below. While the gap decreased in all four categories last year, the decrease was largest in state civil service.
1 “S2002: Median Earning in the Past 12 Months of Workers by Sex and Women’s Earnings as a Percentage of Men’s Earnings by Selected Characteristics.” American Community Survey, US Census Bureau, U.S. Department of Commerce. 2 “S2402: Occupation by Sex and Median Earnings in the Past 12 months for Full-Time, Year-Round Civilian Employed Population 16 Years and Over.” American Community Survey, US Census Bureau, U.S. Department of Commerce. 3 “S2002: Median Earnings in the Past 12 Months of Workers by Sex and Women’s Earnings as a Percentage of Men’s Earnings by Selected Characteristics.” American Community Survey, US Census Bureau, U.S. Department of Commerce.

2014 Report on Women’s Earnings in State Civil Service Classifications
6
CHART 1 – Gender Pay Gap in the US, California, Federal Civil Service, and California Civil Service 2013 to 2014
State Civil Service Gender Pay Gap: 1989 to 2014
The California civil service gender pay gap has changed over time. Historical trends reveal progress in closing the gender pay gap.
The state civil service gender pay gap has remained larger than 19.5 percent since 1989.
CHART 2 – State Civil Service Gender Pay Gap: 25-Year Comparison
Closing the State Civil Service Gender Pay Gap
During the past decade, the gender pay gap has ranged between 19.8 percent and
21.2% 20.1%
16.3% 15.9%
12.3% 11.9%
21.1% 20.5%
0.0%
5.0%
10.0%
15.0%
20.0%
25.0%
2013 2014
US Gender Pay Gap California Gender Pay Gap
Federal Civil Service Pay Gap California State Civil Service Pay Gap
25.8%
28.9%
22.2%
24.7%
19.8%
26.2%
21.3%
21.4%
20.2%
21.1%
20.5%
18.0%
20.0%
22.0%
24.0%
26.0%
28.0%
30.0%
19
89
19
90
19
91
19
92
19
93
19
94
19
95
19
96
19
97
19
98
19
99
20
00
20
01
20
02
20
03
20
04
20
05
20
06
20
07
20
08
20
09
20
10
20
11
20
12
20
13
20
14

2014 Report on Women’s Earnings in State Civil Service Classifications
7
28.9 percent and is projected to shrink 2.8 percent over the next 10 years when applying the 25-year trend. Wage parity will be achieved in 2089. However, if applying the gender pay gap trend over the past ten years, the gender pay gap would decline 7.5 percent by 2024, and wage parity would be accomplished by 2044. Chart 3 displays the forecast comparing the two trends.
CHART 3 – Gender Pay Gap Forecast for Next 10 Years
Women’s Earnings as a Percentage of Men’s Earnings
The gender pay gap may also be illustrated as a percentage of the median male salary. In 2014, the median female employee in state civil service earned 79.5 percent of what the median male did.
Chart 4 (next page) illustrates women’s earnings as a percentage of men’s earnings to show how the female-to-male median salary ratio has grown since 1989 and reduced the gender pay gap for state civil service employees.
13.0%
17.7%
20.5%
20.5%
0.0% 5.0% 10.0% 15.0% 20.0% 25.0%
Using Last 10 Year Trend
Using Last 25 Year Trend
2014
2024

2014 Report on Women’s Earnings in State Civil Service Classifications
8
CHART 4 – Twenty-Five Year Trend: Women’s Earnings as a Percentage of Men's Earnings
The gender pay gap was reduced by 4.7 percent between 1989 and 2014, and closer inspection reveals it has steadily reduced by 5.7 percent in the past ten years alone. Chart 5 (below) illustrates this trend.
CHART 5 – Ten Year Trend: Women’s Earnings as a Percentage of Men's Earnings
Women’s Occupations in State Civil Service Compared to California and US Workforce
The type of work women perform determines their salary level and influences the gender pay gap. Table 1 (next page) shows the percentage of women employed in each of the federally-recognized occupational groups in state civil service, the California workforce, and United States workforce during 2014. These occupational
74.2%
71.1%
77.8%
75.3%
80.2%
73.8%
79.8%
78.9%
79.5%
66.0%
68.0%
70.0%
72.0%
74.0%
76.0%
78.0%
80.0%
82.0%
19
89
19
90
19
91
19
92
19
93
19
94
19
95
19
96
19
97
19
98
19
99
20
00
20
01
20
02
20
03
20
04
20
05
20
06
20
07
20
08
20
09
20
10
20
11
20
12
20
13
20
14
73.8%
76.0%
78.7% 78.6%
79.8%
78.9% 79.5%
73.0%
74.0%
75.0%
76.0%
77.0%
78.0%
79.0%
80.0%
2005 2006 2007 2008 2009 2010 2011 2012 2013 2014

2014 Report on Women’s Earnings in State Civil Service Classifications
9
groups are used to make comparisons across different segments of the American workforce. Some civil service classifications have yet to be matched to these occupational groups while some cannot be matched due to breadth of duties. See Attachment 2 for a list of the unmatched classifications.
The state employed a greater percentage of women in higher-paying jobs such as STEM occupations, legal careers, and management positions than the California and United States workforce. The state also employed more women in traditionally male-dominated Construction and Maintenance related jobs than the California and United States workforce. While these employment gains are encouraging, the state also had a larger proportion of women in lower-paying occupations such as Office and Administrative Support and Food Preparation and Serving occupations. The gender pay gap will be reduced as women make employment gains in higher salary professions and become more evenly represented across a variety of occupations.
TABLE 1 – Percentage of Women in Each Occupational Group – State Civil Service, California, and US Workforce in 2014
Occupational Group
State Civil Service Employees Percent Women
California Workforce Percent Women
United States Workforce Percent Women
Architecture and Engineering Occupations
19.6% 15.2% 14.0%
Arts, Design, Entertainment, Sports, and Media Occupations
45.5% 38.6% 42.2%
Building and Grounds Cleaning and Maintenance Occupations
22.4% 31.2% 32.9%
Business and Financial Operations Occupations
68.8% 55.2% 54.0%
Community and Social Services Occupations
48.4% 63.4% 62.5%
Computer and Mathematical Occupations
39.8% 22.6% 24.9%
Construction and Extraction Occupations
4.1% 2.1% 2.5%
Education, Training, and Library Occupations
52.3% 65.5% 71.0%
Farming, Fishing, and Forestry Occupations
33.5% 22.3% 16.8%
Food Preparation and Serving Related Occupations
46.8% 37.6% 45.8%
Healthcare Practitioners and Technical Occupations
62.5% 65.7% 72.0%
Healthcare Support Occupations 85.7% 81.7% 86.2%
Installation, Maintenance, and Repair Occupations
3.1% 4.0% 3.7%
Legal Occupations 54.5% 47.1% 49.6%

2014 Report on Women’s Earnings in State Civil Service Classifications
10
Occupational Group
State Civil Service Employees Percent Women
California Workforce Percent Women
United States Workforce Percent Women
Life, Physical, and Social Science Occupations
47.0% 43.8% 43.3%
Management Occupations 46.3% 37.8% 38.2%
Office and Administrative Support Occupations
76.4% 67.9% 71.3%
Personal Care and Service Occupations
66.0% 74.0% 75.2%
Production Occupations 9.5% 26.9% 25.4%
Protective Service Occupations 13.6% 18.0% 19.0%
Sales and Related Occupations 38.7% 42.3% 41.1%
Transportation and Material Moving Occupations
8.0% 14.0% 13.2%
State Classifications Not Matched to Occupational Groups
54.4% N/A N/A
Total Statewide Employment - All Occupations
46.4% 41.0% 42.9%
Women in State Civil Service - 1989 and 2014
In 1989, female employees comprised 45.5 percent of the full-time California civil service workforce. Since 1989, the state civil service workforce grew 28.5 percent, from 146,029 to 187,668 full-time employees. Table 2 (below) illustrates that the total number of female employees increased by 30 percent since 1989, raising the percentage of women in state civil service by 0.5 percent to 46 percent; while the total number of male employees increased by 27.3 percent, decreasing the percentage of men in state civil service by 0.5 percent to 54.0 percent.
TABLE 2 – Full-Time Employment Increases by Gender, 1989 to 2014
Year Women Percent Women
Men Percent Men
Combined
1989 66,374 45.5% 79,655 54.5% 146,029
2014 86,305 46.0% 101,363 54.0% 187,668
Increase 1989-2014
30.0%
27.3%
28.5%

2014 Report on Women’s Earnings in State Civil Service Classifications
11
State Civil Service Median Salary Data Since 1989
Table 3 (below) shows the median monthly salary for both male and female employees in state civil service between 19894 and 2014. Since 1989, the median monthly salary for full-time female employees increased 130 percent while the median monthly salary for full-time male employees increased 114 percent. Based on these findings, the percentage increase in median monthly salary for full-time female employees was 16 percent higher than that for full-time male employees over the past 25 years.
TABLE 3 – Full-Time Employees’ Median Salary by Year and Gender
Year Men Women All Employees
1989 $2,979 $2,211 $2,710
1990 $3,216 $2,350 $2,885
1991 $3,545 $2,520 $3,054
1992 $3,545 $2,535 $3,171
1993 $3,582 $2,562 $3,206
1994 $3,723 $2,715 $3,367
1995 $3,835 $2,853 $3,468
1996 $3,835 $2,949 $3,480
1997 $3,835 $2,985 $3,487
1998 $3,980 $2,997 $3,654
1999 $4,314 $3,308 $3,990
2000 $4,487 $3,465 $4,150
2001 $4,487 $3,505 $4,150
2002 $4,574 $3,619 $4,221
2003 $4,885 $3,919 $4,548
2004 $5,129 $3,977 $4,659
2005 $5,388 $3,977 $4,811
2006 $5,538 $4,124 $4,978
2007 $5,852 $4,446 $5,148
2008 $5,865 $4,476 $5,230
2009 $5,900 $4,585 $5,332
2010 $5,929 $4,668 $5,348
2011 $6,127 $4,814 $5,350
2012 $6,144 $4,901 $5,456
2013 $6,311 $4,977 $5,580
2014 $6,389 $5,077 $5,618
4 Earliest verifiable median salary data is from 1989 SPB report “Annual Census of State Employees”.

2014 Report on Women’s Earnings in State Civil Service Classifications
12
Recruitment and Hiring Women
Women have made hiring gains in most state civil service job categories since 1989. The percentage of women hired increased from 48.5 percent of all hires in 1989 to 59.7 percent in 2014. In 2013, it was even higher at 61.7 percent. Women also showed gains in supervisory classifications. The greatest gains were in Administrative and Professional/Technical occupations. Hires decreased in lower paying Clerical and Crafts and Trades occupations compared to 1989.
Table 4a illustrates the total number of state civil service employees hired in 1989 and 2014.
TABLE 4a – Number and Percentage of Hires that were Women
Year 1989 2014
Total Hires 28,408 17,852
Total Women Hired 13,790 10,655
Percentage of Hires that were Women
48.5% 59.7%
Strategies for Supporting Recruitment and Hiring of Women in State Civil Service
Agencies should evaluate their communications sent to women, both internally and externally. Agencies should make clear that they want women in all classifications and that many women have success working in male dominated occupations. Department hiring policies must be free from gender bias and discrimination.
Marketing
Agencies should review all of their current marketing strategies to make sure that they highlight our diverse workforce, and should feature women working in the classifications and occupations that are traditionally male dominated. Marketing strategies should be reflected on agency websites and social media accounts, as well as in printed materials including brochures, fliers, advertisements, and annual reports. Because most people make career decisions based on who they see working in an occupation and what they know about careers, providing images and quotes by women is critical to successful recruitment efforts. When an agency is actively recruiting women it is important to be aware of all benefits that may be appealing to women when marketing your recruiting needs.
Benefits including the following
Flexibility in the Workplace With women making up nearly half of the U.S. work force, and most children living in families with an employed mother, tools to balance work and family demands are of great benefit to California women. The state offers civil service employees alternative work week and flexible work week schedules. Telecommuting has also allowed women to manage their families. By creating more flexible work

2014 Report on Women’s Earnings in State Civil Service Classifications
13
environments and a clear understanding of alternative work options, departments improve support for working women.
Wellness Programs Agencies also may provide Wellness Programs to all employees. These programs differ from department to department and promote healthy lifestyles to prevent illness/disability and improve the physical health and mental well-being of the state workforce.
Wellness Programs may include quit smoking workshops, walking groups, lunchtime workouts, eating healthy seminars and can encourage overall healthy living which may support recruitment and retention in the workplace.
College Course Reimbursement Agencies may offer college course reimbursement opportunities to help recruit and retain women in our workforce. Department training policies can support the overall growth and career advancement of state civil service employees.
Dependent Care Reimbursement/State On-site Programs Childcare and Elder/Disabled dependent care are both benefits the state offers. Many departments offer on-site day care centers that assists their employees’ work-life balance and improves overall retention at their department. State departments also provide lactation rooms for nursing mothers. Employees can also seek counseling regarding childcare and elder/disabled care by speaking with an Employee Assistance Program Counselor (see below).
Employee Assistance Program (EAP) This program is provided to state employees and their eligible dependents. EAP is confidential and offered at no charge to employees during difficult times and those that need consultation about day-to-day concerns. The services provided include legal and financial consultations, identity protection and recovery, and more.
Focused Recruitment for Diversity that is Representative of the Labor Force
Where women are underrepresented within a state agency relative to the labor force, the agency is encouraged to develop a focused recruitment plan. This requires actively conducting outreach to community groups, associations, colleges and other public and private entities to reach women. By creating focused connections, agencies can meet their diversity goals. Focused outreach and recruitment are intended to supplement-not to replace-general broad and inclusive recruitment and outreach efforts.
Media
Using various formats of media can also help agencies reach more women. If agencies are conducting recruitment efforts targeting women or are holding open houses for careers not traditionally associated with women, they should promote marketing efforts to various media outlets, including social media. This may increase your outcomes and encourage women to apply.
Internships and Job Shadowing Opportunities
Some women may be unfamiliar with the opportunities available in careers that

2014 Report on Women’s Earnings in State Civil Service Classifications
14
traditionally include fewer women. Agencies can improve representation of women through focused recruitment for internships and students assistants which can build a strong pipeline to future permanent positions. Job shadowing and mentoring also provides opportunities for employees to learn what it would be like to work in a particular classification.
Reduction and Gender Shift in the State’s Clerical Workforce
As shown on Table 4b below, in 1989, 20.6 percent of new employees were hired into Clerical jobs, and 82 percent of Clerical hires were women. By 2014, only 16.1 percent of new hires were clerical, and the percentage of those that were women had decreased to 78.5. Data is rounded for all job categories and does not include Career Opportunity Development (COD) classes or less than full-time, transfer, or seasonal hires.
TABLE 4b – Percentage of Women Hires by Occupation
Occupation
1989 Percent of All Hires
1989 Percent of Hires that were Women
2014 Percent of All Hires
2014 Percent of Hires that were Women
Office Support – Clerical 20.60% 82.00% 16.11% 78.51%
Office Support – Supervisory Clerical
0.20% 50.90% 0.73% 77.86%
Office Support – Total 20.80% 81.65% 16.84% 78.48%
Crafts & Trades – Laborers
3.40% 39.40% 0.46% 6.10%
Crafts & Trades – Semiskilled
17.40% 32.30% 2.15% 7.55%
Crafts & Trades – Skilled 4.10% 7.30% 2.98% 5.83%
Crafts & Trades – Supervisory
0.20% 5.00% 0.45% 11.11%
Crafts & Trades – Total 25.10% 28.91% 6.04% 6.86%
Service & Custodial – Rank & File
1.90% 49.30% 2.88% 46.99%
Service & Custodial – Supervisory
0.40% 21.40% 0.92% 48.17%
Service & Custodial – Total
2.30% 44.34% 3.80% 47.28%
Professional & Technical – Subprofessional Technical
20.90% 56.90% 13.85% 70.19%
Professional & Technical – Supervisory Subprofessional Technical
0.30% 27.60% 0.32% 82.76%
Professional & Technical – Field Representative
2.60% 46.10% 3.30% 60.44%

2014 Report on Women’s Earnings in State Civil Service Classifications
15
Occupation
1989 Percent of All Hires
1989 Percent of Hires that were Women
2014 Percent of All Hires
2014 Percent of Hires that were Women
Professional & Technical – Supervisory Field Representative
0.20% 30.20% 0.17% 67.74%
Professional & Technical – Professional
12.80% 45.70% 26.03% 65.43%
Professional & Technical – Supervisory Professional
0.50% 34.80% 1.42% 59.68%
Professional & Technical – Total
37.20% 51.64% 45.09% 66.48%
Law Enforcement – Line Peace Officer
10.10% 22.80% 6.89% 21.38%
Law Enforcement – Supervisory Peace Officer
0.30% 52.70% 0.50% 16.67%
Law Enforcement – Total 10.40% 23.72% 7.39% 21.06%
Administrative – Staff 3.90% 38.40% 19.35% 61.24%
Administrative – Supervisory
0.20% 41.90% 1.42% 59.45%
Administrative – Line (C.E.A.)
0.10% 22.20% 0.05% 44.44%
Administrative – Total 4.10% 38.37% 20.83% 61.08%
GRAND TOTAL
48.50%
59.69%
Total may not add up to 100 percent due to rounding.
Promoting Women
Women’s promotions in state civil service indicate career mobility and changes in occupational representation across state civil service. Table 5a (next page) indicates that in 1989, the state promoted 12,603 full-time employees, with 55.1 percent of these promotions being women. In 2014, the state promoted 6,090 full-time employees, with 44.0 percent of these promotions affecting women.
TABLE 5a –Women Promoted in Civil Service
Year 1989 2014
Total Promotions 12,603 6,090
Women Promoted 6,940 2,678
Percentage of Promotions that were Women 55.1% 44.0%

2014 Report on Women’s Earnings in State Civil Service Classifications
16
Recommended Strategies to Help Support Professional Development and Retention of Women in the Workplace
Training and Development Opportunities
Training committees or coordinators should evaluate the training received by all employees to ensure women are receiving the equivalent training and professional development opportunities as men. Training can assist with the development of skills needed to promote into higher paying classifications.
Upward Mobility
Upward Mobility is the planned development and advancement of employees in low-paying classes to entry level technical, professional, and administrative positions in state civil service. Because many women are in low paying classes, having an effective program gives more women opportunities to develop new skills and advance their careers. Agencies should have an active Upward Mobility program in place that aligns with Government Code section 19402, which states, “All upward mobility programs shall include annual goals that include the number of employees expected to progress from positions in low-paying occupational groups to entry-level technical, professional and administrative positions, and the timeframe within this progress shall occur.”
Encourage Flexibility
Agencies could promote the importance of workplace flexibility by giving the benefits of telecommuting, alternative work weeks and altered schedules. When agencies offer workplace flexibility, it can lead to retaining their talent.
Emphasize Family-Friendly Benefits
Organizations that are considered to be the best places to work for are often identified as organizations that recognize the value and importance of being family-friendly. Pressures that come along with balancing work and family life can often be eased with the options of family-friendly benefits. Benefits such as maternity/paternity leave, job sharing, paid leave and other programs encourage positive employee satisfaction, engagement and retention.
It is crucial to promote these benefits so current and prospective employees are aware of their options and how to take advantage of them. Descriptions of the benefits could be marketed through job postings, department websites and social media, while data percentages on current employee usage could be used to promote the positive experiences and benefits of offering these options.
Develop an Agency Culture that Emphasizes Work-Life Balance A quality work-life balance is essential to ensuring positive employee satisfaction, engagement and retention. It is important for employees and management to be aware of the policies in place that encourage flexibility and work-life balance; but it is crucial that agency and department cultures do not stigmatize those who utilize the policies.

2014 Report on Women’s Earnings in State Civil Service Classifications
17
Marketing the positive benefits and opportunities of work-life balance can help generate and sustain a desirable and accommodating workplace culture. Showcasing real employee testimonials is a powerful method to promote the effectiveness and value of work-life balance benefits.
Leadership Development/Succession Planning
Encourage and support women as leaders in agencies by providing a culture that values accountability, provides rewarding work, and models exemplary leadership. Leadership development is offered amongst many agencies. Like all career development opportunities, building leaders from within an organization is a great way to retain talent and create equal representation for all demographics, including women. Succession planning programs and mentoring opportunities are strategies to develop leaders at all levels of the organization.
Changes in Women’s Promotional Patterns
In 2014, women were promoted more in Administrative and Professional/Technical occupations and less in Clerical, Crafts and Trades, and Custodial occupations compared to 1989.
TABLE 5b– Civil Service Promotions by Job Category
Occupation
1989 Percent of All Promotions
1989 Percent of Promotions that were Women
2014 Percent of All Promotions
2014 Percent of Promotions that were of Women
Office Support – Clerical
15.89% 88.26% 3.83% 78.11%
Office Support – Supervisory Clerical
6.28% 82.83% 3.56% 74.19%
Office Support – Total
22.17% 86.72% 7.39% 76.22%
Crafts & Trades – Laborers
0.17% 23.81% 0.07% 0.00%
Crafts & Trades – Semiskilled
2.39% 28.24% 0.38% 8.70%
Crafts & Trades – Skilled
2.09% 17.42% 2.13% 7.69%
Crafts & Trades – Supervisory
2.84% 4.19% 6.09% 5.93%
Crafts & Trades – Total
7.49% 16.00% 8.67% 6.44%
Service & Custodial – Rank & File
0.24% 53.33% 0.56% 52.94%

2014 Report on Women’s Earnings in State Civil Service Classifications
18
Occupation
1989 Percent of All Promotions
1989 Percent of Promotions that were Women
2014 Percent of All Promotions
2014 Percent of Promotions that were of Women
Service & Custodial – Supervisory
0.62% 37.18% 0.28% 41.18%
Service & Custodial – Total
0.86% 41.67% 0.84% 49.02%
Professional & Technical – Subprofessional Technical
10.16% 75.00% 2.94% 70.95%
Professional & Technical – Supervisory Subprofessional Technical
3.33% 61.90% 1.82% 72.07%
Professional & Technical – Field Representative
2.78% 65.43% 3.56% 65.44%
Professional & Technical – Supervisory Field Representative
2.54% 57.81% 2.46% 66.00%
Professional & Technical – Professional
13.99% 43.73% 10.99% 57.70%
Professional & Technical – Supervisory Professional
8.79% 35.29% 7.03% 45.79%
Professional & Technical – Total
41.59% 53.35% 28.80% 58.72%
Law Enforcement – Line Peace Officer
4.59% 19.55% 5.60% 13.49%
Law Enforcement – Supervisory Peace Officer
7.04% 20.07% 22.56% 15.79%
Law Enforcement – Total
11.62% 19.86% 28.16% 15.34%
Administrative – Staff
9.67% 68.74% 12.23% 64.70%

2014 Report on Women’s Earnings in State Civil Service Classifications
19
Occupation
1989 Percent of All Promotions
1989 Percent of Promotions that were Women
2014 Percent of All Promotions
2014 Percent of Promotions that were of Women
Administrative – Supervisory
5.05% 54.09% 9.13% 64.39%
Administrative –C.E.A.
1.56% 26.53% 4.78% 49.14%
Administrative – Total
16.27% 60.17% 26.14% 61.75%
GRAND TOTAL
55.07%
43.97%
Total may not add up to 100 percent due to rounding
TABLE 6a –Women Civil Service Employees
Year 1989 2014
Total Employees 146,029 187,668
Total Women Employees 66,374 86,305
Percentage of Women Employees 45.5% 46.0%
Employment by Job Category
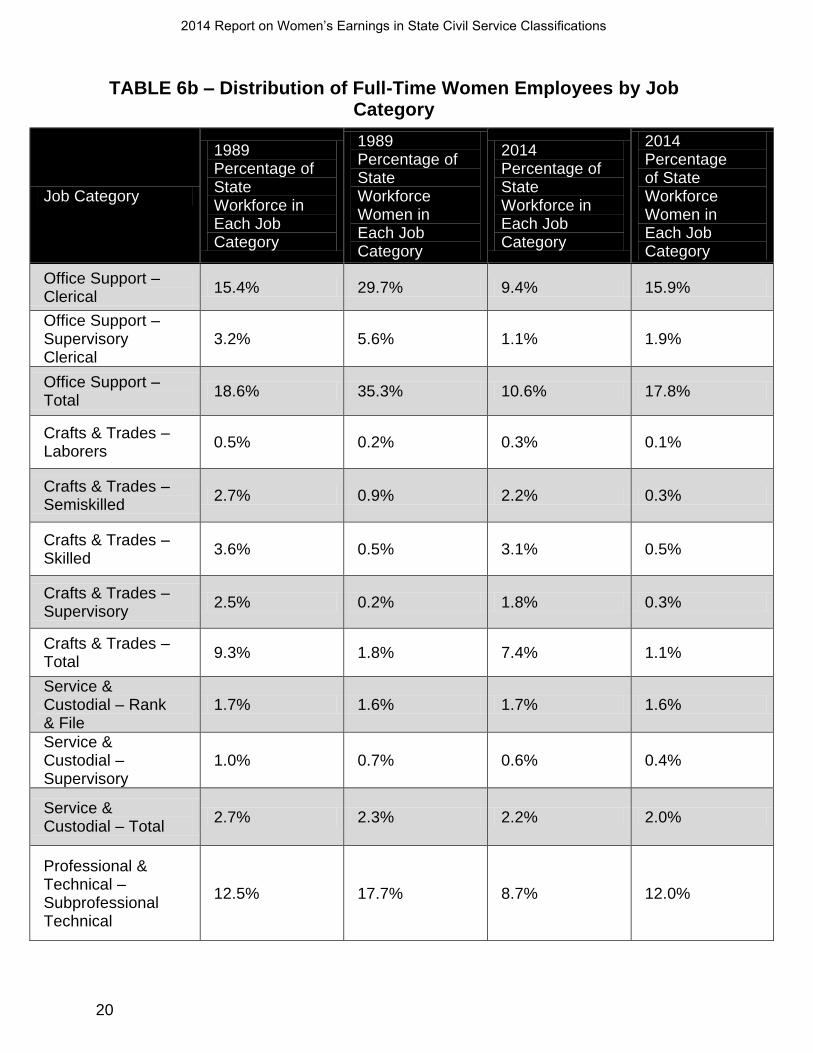
The occupational distribution of state civil service has changed since 1989, as illustrated in Table 6b (next page). The first two columns in Table 6b illustrate the percentage of full-time employees in each state civil service job category in 1989 and 2014. The next two columns illustrate the percentage of women in each job category during those years. For example, in 1989, 18.6 percent of all employees in state civil service performed Office Support jobs, but this category represented 35.3 percent of all jobs held by women. By 2014, only 10.6 percent of all California civil service employees were employed in Office Support jobs, and this category represented just 17.8 percent of all civil service careers held by women.
While the percentage of female employees in state civil service has increased in a number of job categories, the number of female supervisors in lower-paying categories has decreased since 1989. For example, the percentage of women in Supervisory Clerical jobs has decreased from 5.6 percent in 1989 to 1.9 percent in 2014; in Supervisory Janitor/Custodian jobs from 0.7 percent to 0.4 percent; and in Supervisory Subprofessional from 2.4 percent to 0.8 percent.
2014 Report on Women’s Earnings in State Civil Service Classifications
20
TABLE 6b – Distribution of Full-Time Women Employees by Job Category
Job Category
1989 Percentage of State Workforce in Each Job Category
1989 Percentage of State Workforce Women in Each Job Category
2014 Percentage of State Workforce in Each Job Category
2014 Percentage of State Workforce Women in Each Job Category
Office Support – Clerical
15.4% 29.7% 9.4% 15.9%
Office Support – Supervisory Clerical
3.2% 5.6% 1.1% 1.9%
Office Support – Total
18.6% 35.3% 10.6% 17.8%
Crafts & Trades – Laborers
0.5% 0.2% 0.3% 0.1%
Crafts & Trades – Semiskilled
2.7% 0.9% 2.2% 0.3%
Crafts & Trades – Skilled
3.6% 0.5% 3.1% 0.5%
Crafts & Trades – Supervisory
2.5% 0.2% 1.8% 0.3%
Crafts & Trades – Total
9.3% 1.8% 7.4% 1.1%
Service & Custodial – Rank & File
1.7% 1.6% 1.7% 1.6%
Service & Custodial – Supervisory
1.0% 0.7% 0.6% 0.4%
Service & Custodial – Total
2.7% 2.3% 2.2% 2.0%
Professional & Technical – Subprofessional Technical
12.5% 17.7% 8.7% 12.0%

2014 Report on Women’s Earnings in State Civil Service Classifications
21
Job Category
1989 Percentage of State Workforce in Each Job Category
1989 Percentage of State Workforce Women in Each Job Category
2014 Percentage of State Workforce in Each Job Category
2014 Percentage of State Workforce Women in Each Job Category
Professional & Technical – Supervisory Subprofessional Technical
2.3% 2.4% 0.6% 0.8%
Professional & Technical – Field Representative
2.6% 2.9% 2.6% 3.1%
Professional & Technical – Supervisory Field Representative
1.5% 1.0% 0.8% 1.1%
Professional & Technical – Professional
7.4% 4.1% 20.8% 23.4%
Professional & Technical – Supervisory Professional
12.5% 17.7% 4.6% 4.2%
Professional & Technical – Total
45.2% 45.0% 38.1% 44.7%
Law Enforcement – Line Peace Officer
12.1% 4.1% 17.6% 5.9%
Law Enforcement – Supervisory Peace Officer
2.3% 0.6% 3.6% 1.2%
Law Enforcement – Total
14.3% 4.6% 21.2% 7.1%
Administrative – Staff
6.0% 8.1% 14.9% 20.1%
Administrative – Supervisory
2.6% 2.0% 4.7% 6.4%
Administrative –C.E.A.
1.3% 0.8% 0.7% 0.7%

2014 Report on Women’s Earnings in State Civil Service Classifications
22
Job Category
1989 Percentage of State Workforce in Each Job Category
1989 Percentage of State Workforce Women in Each Job Category
2014 Percentage of State Workforce in Each Job Category
2014 Percentage of State Workforce Women in Each Job Category
Administrative – Total
9.9% 10.9% 20.3% 27.3%
Total may not add up to 100 percent due to rounding
Conclusion
The state has reduced the gender pay gap since 1989 by increasing the number of women in our workforce and hiring women into higher paying occupations. However, women are still underrepresented in state civil service relative to population, and female employees have yet to reach pay parity.
CalHR has worked hard to align the Civil Service Improvement initiatives with the current efforts to recruit women in state service. An online manual is currently in development that will help agencies to address recruitment challenges by outlining specific recruitment tactics, including focused recruitment to eliminate underutilization of women in state classifications. Current statewide recruitment activities include various outreach seminars and career events. Our outreach efforts have included industry cluster focused events, focused recruitment for diverse underrepresented populations, general public, military veterans and persons with disabilities.
In addition to recruitment efforts, CalHR also recognizes the importance of professional development in preparing employees for career advancement. CalHR will continue to provide a variety of professional development opportunities, and will seek additional courses to assist more women in our workforce with advancement into higher-paying careers as a strategy to close the gender pay gap.
It is important that state agencies identify occupations where women are under-utilized, incorporate this data into their workforce plans and outline appropriate strategies to improve representation. CalHR is available to assist agencies with these efforts. Workforce Planning, Selection, and Civil Rights Divisions of CalHR can provide support and consultation to help organizations evaluate current workforce demographics and provide strategies to improve representation.

2014 Report on Women’s Earnings in State Civil Service Classifications
23
Attachment 1: Government Code section 19827.2
(a) The Legislature, having recognized December 1980 statistics from the U.S. Department of Labor, finds: that 60 percent of all women 18 to 64 are in the workforce, that two- thirds of all those women are either the head of household or had husbands whose earnings were less than ten thousand dollars ($10,000), and that most women are in the workforce because of economic need; that the median working woman has earned less than the median working man, not only because of the lack of educational and employment opportunities in the past, but because of segregation into historically undervalued occupations where wages have been depressed; and that a failure to reassess the basis on which salaries in state service are established will perpetuate these pay inequities, which have a particularly discriminatory impact on minority and older women; and, therefore, it is the intent of the Legislature in enacting this statute to establish a state policy of setting salaries for female-dominated jobs on the basis of comparability of the value of the work.
(b) The department shall review and analyze existing information, including those studies from other jurisdictions relevant to the setting of salaries for female-dominated jobs.
This information shall be provided on an annual basis to the appropriate policy committee of the Legislature and to the parties meeting and conferring pursuant to Section 3517.
(c) For the purpose of implementing this section, the following definitions apply:
(1) "Salary" means, except as otherwise provided in Section 18539.5, the amount of money or credit received as compensation for service rendered, exclusive of mileage, traveling allowances, and other sums received for actual and necessary expenses incurred in the performance of the state's business, but including the reasonable value of board, rent, housing, lodging, or similar advantages received from the state.

2014 Report on Women’s Earnings in State Civil Service Classifications
24
(2) "Comparability of the value of the work" means the value of the work performed by an employee, or group of employees within a class or salary range, in relation to value of the work of another employee, or group of employees, to any class or salary range within state service.
(3) "Skill" means the skill required in the performance of the work, including any type of intellectual or physical skill acquired by the employee through experience, training, education, or natural ability.
(4) "Effort" means the effort required in the performance of the work, including any intellectual or physical effort.
(5) "Responsibility" means the responsibility required in the performance of the work, including the extent to which the employer relies on the employee to perform the work, the importance of the duties, and the accountability of the employee for the work of others and for resources.
(6) "Working conditions," means the conditions under which the work of an employee is performed, including physical or psychological factors.
(d) If the provisions of this section are in conflict with the provisions of a memorandum of understanding reached pursuant to Section 3517.5, the memorandum of understanding shall be controlling without further legislative action, except that if the provisions of a memorandum of understanding require the expenditure of funds, the provisions shall not become effective unless approved by the Legislature in the annual Budget Act.

2014 Report on Women’s Earnings in State Civil Service Classifications
25
Attachment 2: California Civil Service Classifications Not Matched to Occupational Groups
According to the State Controller’s Office, Position Benefit File (PosBen), of the 194,728 full time California civil service employees, 194,469 (99.9%) were successfully mapped to federal occupational groups; however, the following 17 civil service classifications with a combined 259 full-time incumbents have not yet been mapped to federal occupational groups. CalHR continues work to map these.
Senior Plant Nematologist (Specialist)
Deputy Chief Investment Officer, California State Teachers’ Retirement System
Agricultural Program Supervisor I
Agricultural Program Supervisor II
Agricultural Program Supervisor III
Agricultural Program Supervisor IV
Hydroelectric Plant Technician Supervisor
Receiver’s Clinical Executive (Safety)
Infection Control Specialist
Information Systems Manager
Boating Facilities Manager II
Supervising Field Representative School Administration
Assistant Civil Engineer
Junior Civil Engineer
Assistant Finance Budget Analyst
Special Consultant
LEAP Candidate