2017 Minerals Yearbook - prd-wret.s3.us-west-2.amazonaws.com

2014 Minerals Yearbook
U.S. Department of the Interior U.S. Geological Survey
ALUMINUM [ADVANCE RELEASE]
November 2015
Aluminum—2014 [ADVAnCE RElEASE] 5.1
AluminumBy E. lee Bray
Domestic survey data and tables were prepared by Susan M. Weaver, statistical assistant, and the world production table was prepared by Lisa D. Miller, international data coordinator.
During 2014, total aluminum production in the united States decreased slightly and consumption increased by 12% compared with that of 2013. net imports of crude metal were essentially unchanged but total domestic inventories decreased by 20% compared with those in 2013 to supply the increased consumption. net exports of semifabricated aluminum products decreased by 47%.
Domestic primary aluminum smelters produced 1.71 million metric tons (mt) of aluminum metal valued at $3.94 billion, 12% less than the quantity and 3% less than the value in 2013. At yearend, three companies were operating eight primary aluminum smelters in six States. An additional three smelters were temporarily idle. During the year, one smelter that had been temporarily idled was permanently shut down after bankruptcy proceedings failed to find a buyer. About 28% [660,000 metric tons per year (t/yr)] of domestic primary aluminum smelting capacity (table 2), including idle potlines at operating smelters, was idle at yearend. The aluminum price on the london metal Exchange ltd. (lmE) averaged $0.846 per pound, a slight increase from 2013 as continued high global inventory levels and increased global production from new smelting capacity outpaced shutdowns of obsolete and high-cost capacity. However, the 2014 annual average u.S. market price of primary aluminum ingot increased by 11% to $1.045 per pound from $0.942 per pound in 2013 and the price premium for the u.S. market price to the lmE price averaged 24% in 2014, compared with 13% in 2013 (table 8).
Aluminum recovered from purchased and tolled scrap increased by 4% to 3.64 mt. Of this recovered metal, 53% came from new (manufacturing) scrap, and 47% came from old (obsolete aluminum products) scrap (table 1). Aluminum used beverage cans (uBCs) accounted for 45% of the old scrap consumed in 2014 and 19% of total scrap consumed (table 4).
Apparent consumption of aluminum in the united States increased by 12% compared with that in 2013. Owing to lower domestic primary production and increased consumption, the u.S. net import reliance for aluminum as a percentage of apparent consumption increased to 33% in 2014 from 21% in 2013, and was at its highest level since 2005. Producers of unwrought and semifabricated aluminum products in the united States and Canada reported that they shipped 86.0% of their products to markets in the united States and Canada, of which the transportation industry accounted for 32.9%; containers and packaging, 18.1%; building and construction, 12.0%; electrical, 6.9%; machinery and equipment, 6.7%; consumer durables, 6.5%; and other markets, 2.9%. Exports to external markets accounted for 14.0% of shipments from producers in Canada and the united States in 2014 (table 6).
Primary aluminum was produced in 41 countries in 2014. China, Russia, Canada, and the united Arab Emirates, in
decreasing order of metal produced, accounted for 65% of primary world production (table 13). World primary metal production increased by 6% compared with that of 2013 owing to increased production in China, Germany, india, malaysia, Saudi Arabia, and the united Arab Emirates. Commissioning of new smelters and brownfield expansions accounted for the increased production. These increases were partially offset by decreased production in Australia, Brazil, Canada, the netherlands, Russia, South Africa, the united States, and Venezuela. Cash flow issues, currency valuations, obsolete equipment, low aluminum prices, and high power prices were cited as reasons for shutdowns of smelters in these countries. The united States was surpassed by the united Arab Emirates, india, and Australia in the volume of metal produced, dropping to the seventh-leading producer of primary aluminum from fourth during 2013.
Combined world inventories of aluminum metal and alloys held by the lmE decreased by 30% to 4.31 mt from 5.59 mt. At yearend 2014, world inventories of unwrought aluminum held by producers, as reported by the international Aluminium institute (iAi), were 1.41 mt, 20% more than those at yearend 2013 (international Aluminium institute, 2015b; london metal Exchange ltd., 2013a, 2014).
Legislation and Government Programs
in 2013, acting on complaints that long load-out times from lmE-registered warehouses were distorting the aluminum market, the lmE adopted new rules that were intended to reduce wait times to less than 50 days. At the time, wait times were longer than 300 days at some lmE-registered warehouses. The new rules would have taken effect April 1, 2014, but on march 27, 2014, the High Court of Justice of England and Wales found that the market consultation conducted by the lmE did not satisfy legal requirements and ordered that the proposed rules not be implemented as scheduled (Blamey and Cooke, 2014).
long wait times had developed after lmE inventories increased in the wake of the financial crisis of 2008–09, when producers increased delivery of primary aluminum to the lmE as manufacturers required less aluminum. low interest rates and low storage rates offered by owners of lmE-registered warehouses encouraged investors to use aluminum in long-term financing deals. inventories of primary aluminum at lmE-registered warehouses, which were about 930,000 t at yearend 2007, more than doubled to 2.34 mt by yearend 2008, nearly doubled again to 4.62 mt by yearend 2009, and continued on an upward trend to 5.45 mt at yearend 2013. With recovery in aluminum use, daily limits on delivery of metal from lmE-registered warehouses resulted in delivery wait times approaching 1 year at Detroit, mi, and Vlissingen, netherlands.
5.2 [ADVAnCE RElEASE] u.S. GEOlOGiCAl SuRVEY minERAlS YEARBOOK—2014
in response to complaints by manufacturers wanting to take delivery of aluminum from lmE-registered warehouses that the long wait times and daily delivery limits created an artificially tight supply and inflated the price of aluminum, Government regulators in Europe and the united States launched investigations. The lmE responded by increasing daily load-out limits to ensure that wait times were less than 50 days, although prior to the financial crisis, wait times usually had been less than 30 days. However, despite the stay in implementing the new lmE load-out rules, inventories decreased by 1.28 mt during 2014 (CRu Aluminum monitor, 2013a, b; london metal Exchange ltd., 2007, 2008, 2009, 2013a, b, 2014).
Production
Primary.—in march, Alcoa inc. (Pittsburgh, PA) permanently shut down the two remaining potlines at the massena East smelter in new York, citing high operating costs. The two potlines had a combined capacity of 84,000 t/yr. One other potline at the smelter with a capacity of 42,000 t/yr had been permanently shut down in August 2013 (Alcoa inc., 2014j).
Alcoa temporarily shut down a 54,000-t/yr potline at the Warrick smelter in Evansville, in, citing damage from an electrical fire on September 28. The other four potlines at the 269,000-t/yr smelter were not affected (laliberte, 2014b). Production from the damaged potline was restarted in early December (matyi, 2014c).
in June, workers represented by the united Steelworkers (USW) ratified a 5-year contract with Alcoa. The contract covered approximately 6,000 employees at 11 facilities, including primary smelters at massena, Evansville, and Wenatchee, WA, as well as rolling mills and secondary smelters at other locations. Work had continued without interruption under an extension of the prior contract, which had expired on may 16 (united Steelworkers, 2014).
in September, niagara Worldwide llC made the shutdown of the 271,000-t/yr smelter in Hannibal, OH, permanent, citing a lack of an interested buyer and high power prices. in June, niagara Worldwide had purchased the smelter from Ormet Corp., which had filed for Chapter 10 bankruptcy protection on February 25, 2013, citing low aluminium prices, high power costs, high debt levels, and legacy costs. The smelter had not operated since October 2013 (laliberte, 2014e; matyi, 2014b; Ormet Corp., 2013).
Century Aluminum Co. (Chicago, il) announced that it would increase capacity to produce extrusion billet and rolling slab at the 205,000-t/yr smelter in Sebree, KY. Anticipated demand by customers supplying the aerospace, automobile, and construction industries was cited for the upgrades. A project schedule was not available (Century Aluminum Co., 2014b).
in January, the Kentucky Public Service Commission approved power supply agreements among Century, Big Rivers Electric Corp., and Kenergy Corp. The agreements were for Century to purchase power for the Sebree smelter at spot market rates from the energy suppliers starting February 1, 2014, when their prior contracts expired (Century Aluminum Co., 2014c). Subsequently in July, employees at the Sebree smelter represented by the USW ratified a 5-year contract (Century Aluminum Co., 2014a).
in August and September, noranda Aluminum Holding Corp.’s (Franklin, Tn) 263,000-t/yr primary aluminum smelter in new madrid, mO, experienced a higher rate of pot failures than normal. The pots were being repaired and were expected to all be producing by early 2015. The number of pots affected was not disclosed but noranda cited the pot failures and weather-related problems in the first quarter of the year for shipments decreasing by 5% from those of 2013 (matyi, 2014a; noranda Aluminum Holding Corp., 2015, p. 2).
Secondary.—Bermco Aluminum Co. (Birmingham, Al) completed a new 110,000-t/yr secondary smelter in Birmingham, Al. Production from one furnace started in January 2014 and production from the second furnace started in September. The smelter replaced a 55,000-t/yr smelter at a different location in Birmingham that was too small for Bermco’s needs and did not have room to expand (Davidson, 2014a; Platts metals Week, 2012).
nanshan America Advanced Aluminum Technologies llC (lafayette, in) completed a secondary smelter adjacent to its extrusion plant in lafayette, in. Production from the 136,000-t/yr smelter started in February 2014. The casthouse supplied billet to nanshan’s extrusion plant and external customers in the electrical and transportation industries (American Foundry Society inc., 2014).
Huntington Aluminum inc. (Huntington, in) was expanding its secondary smelter in Huntington, in. The project was expected to double the capacity of the smelter and repair damage from a fire in April, but specific capacity was not reported. The construction started in August and was scheduled for completion in 2017 (laliberte, 2014c; Slater, 2014).
in September, matalco inc. (Brampton, Ontario, Canada) started construction of a new secondary smelter in lordstown, OH. The smelter would produce extrusion billet and have a capacity of about 135,000 t/yr. Completion was expected by yearend 2015 (laliberte, 2014d; matalco inc., 2014).
Aleris international inc. (Cleveland, OH) shut down production at its Richmond, VA, rolling mill and remelt furnace following a fire on January 29, 2014. The plant, which supplied sheet to the building and construction industry, was restarted in April (Fitzgerald, 2014).
A mechanical failure at logan Aluminum’s rolling mill in Russellville, KY, halted production from December 29, 2014, until January 17, 2015. Capacity of the rolling mill was estimated to be 816,000 t/yr and accounted for approximately 45% of aluminum beverage can sheet rolling capacity in north America. logan Aluminum was a joint venture between novelis inc. [a subsidiary of Hindalco industries ltd. (mumbai, india)] and Tri-Arrows Aluminum inc. (louisville, KY) (laliberte, 2015a, b; matyi, 2015; Platts metals Daily, 2015).
Consumption
Apparent consumption of aluminum in the united States increased for the fifth consecutive year, rising to 5.1 Mt in 2014, 12% more than in 2013, but remained below the 2007 consumption level of 5.2 mt. Shipments of aluminum ingot and semifabricated products by producers in the united States and Canada to their combined domestic markets increased by 5% in 2014 compared with the amount shipped in 2013. net
Aluminum—2014 [ADVAnCE RElEASE] 5.3
u.S. imports of crude aluminum and semifabricated products from Canada decreased by 11% compared with those in 2013. Shipments of aluminum to the building and construction and consumer durables sectors increased by 7%, while shipments to the transportation and machinery sectors increased by 11% and 6%, respectively, compared with those in 2013. Shipments to the containers and packaging sector were unchanged, shipments to the electrical products sector decreased by 7% and those to other sectors increased slightly (table 6).
The increase in aluminum shipments for use in transportation was partly attributed to increased automobile production and sales. Domestic sales of new passenger cars and light trucks in 2014 increased by 5.8% compared with sales in 2013. light-vehicle sales in 2014 were 16.44 million units, the highest number since 2006 and nearly 60% more than the number of units sold in 2009. light-vehicle sales have increased every year since 2009 (Stoddard, 2015).
increased deliveries of commercial aircraft also contributed to the increase in shipments of aluminum to the transportation sector. The Boeing Co. (Chicago, il) reported that its deliveries of commercial aircraft increased by 12% compared with deliveries in 2013. Deliveries of the 787 Dreamliner, an aircraft with a fuselage and wings made from composite materials instead of aluminum, but which has a significant amount of aluminum in other parts, increased by 75% and accounted for 16% of commercial aircraft deliveries; deliveries of Boeing’s other commercial aircraft increased by 4% compared with deliveries in 2013 (Boeing Co., The, 2015, p. 13).
in October, Alcoa opened its 20,000-t/yr aluminum-lithium plant in lafayette, in, which was constructed to serve anticipated consumption by the aerospace industry. The lighter, stronger aluminum-lithium alloys provide for better fuel efficiency, have lower maintenance costs than other aluminum alloys used in the aerospace industry, and are less expensive than titanium and composite materials (Alcoa inc., 2014d).
The increase in aluminum shipments for use in building and construction and consumer durables resulted from increased commercial and residential construction. in the united States, housing starts increased by 8.8% in 2014 compared with starts in 2013 and the number of houses completed in 2014 was 15.5% more than in 2013. Total u.S. construction spending during 2014 increased by 5.6% compared with that in 2013, which was attributed to a 4.1% increase in spending on residential construction, and a 10.5% increase in spending on the more aluminum-intensive nonresidential construction (u.S. Census Bureau, 2015a, b, c).
Ford motor Co. started production of the redesigned 2015 model F–150 Series truck, and deliveries to showrooms started in December 2014. The new design used aluminum sheet for the body panels instead of steel and weighed approximately 700 pounds less than prior models. The trucks were built at the Dearborn, mi, assembly line, and in 2015 the assembly line in Claycomo, mO, would start producing the F–150 Series trucks. The assembly lines had a combined capacity of 700,000 trucks per year (Ford motor Co., 2014). Although the substitution of steel by aluminum for automotive sheet applications in other vehicles had not been announced by other major automobile manufactures, a study commissioned by The Aluminum
Association inc.’s Aluminum Transportation Group found that other automobile manufacturers were planning to introduce additional automobile models with aluminum replacing steel in sheet applications. The study projected that by 2025, 75% of light trucks, 24% of midsized sedans, and 22% of sport utility vehicles sold in north America would use aluminum sheet instead of steel for body panels. The study also projected that by 2025, light trucks would contain an average of 550 pounds of aluminum per truck (Baltic and Tran, 2014).
in anticipation of increased consumption of aluminum sheet by automobile manufacturers, several companies were expanding rolling mill capacity. Alcoa expanded its rolling mill at Davenport, iA, which started trial production in December 2013. Alcoa began expansion of its rolling mill in Alcoa, Tn, in August 2013 and expected to complete the project by midyear 2015 (Alcoa inc., 2014b, f).
novelis inc. expected to complete expansion of its rolling mill in Oswego, nY, to supply automobile manufacturers, to 360,000 t/yr from 280,000 t/yr in early 2015 (novelis inc., 2013). in October, novelis completed a rolling mill in Changzhou, China, to produce heat-treated sheet for use in the automobile industry. The facility had a capacity of 120,000 t/yr (novelis, 2014c).
in October, Aleris started an expansion of its rolling mill at lewisport, KY, that was expected to be completed by early 2017. The rolling mill would have a capacity of approximately 215,000 t/yr of heat-treated sheet for automobile manufacturers (Aleris international inc., 2014a).
norsk Hydro ASA (Oslo, norway) completed a 50,000-t/yr rolling line at its rolling mill in Grevenbroich, Germany, and was expanding rolling capacity to 200,000 t/yr in 2016 to supply automobile manufacturers (norsk Hydro ASA, 2014b).
Stocks
According to data reported by The Aluminum Association (2015), united States and Canadian producers’ combined inventories of aluminum ingot, mill products, and scrap increased 14% to 1.28 mt at yearend 2014 from 1.13 mt at yearend 2013. The lmE reported that primary aluminum metal ingot stocks in its u.S. warehouses decreased by 41% to 1.11 mt at yearend 2014 from 1.86 mt at yearend 2013. At yearend 2014, lmE warehouses in the united States also held 80,700 t of north American special aluminum alloy contract (nASAAC) metal ingot, a 5% decrease from the 84,800 t held at yearend 2013 (london metal Exchange ltd., 2013a, 2014). The decrease took place despite industry concerns that long load-out delays were limiting market availability of lmE-held aluminum inventories. (See legislation and Government Programs.)
Prices
The monthly average u.S. spot market price of primary aluminum metal, as reported by Platts metals Week, averaged $0.959 per pound in January, 7% higher than the average price in December 2013, and generally increased throughout the year, reaching a high monthly average of $1.160 per pound in november before decreasing to $1.098 per pound in December. The annual average price in 2014 increased to $1.045 per
5.4 [ADVAnCE RElEASE] u.S. GEOlOGiCAl SuRVEY minERAlS YEARBOOK—2014
pound from $0.942 per pound in 2013. in 2014, the annual average lmE cash price increased to $0.846 per pound from to $0.837 per pound in 2013. in January, the u.S. market price premium to the lmE cash price increased to 22% and averaged 23% for the year, an increase from 13% in 2013. The indicator prices for selected secondary aluminum ingots and scrap, as published in American metal market, followed the same trend as primary ingot prices (table 8).
Foreign Trade
in 2014, total net imports of aluminum-base materials increased by 22% compared with net imports in 2013 to satisfy increased consumption and offset decreased primary production (tables 10, 12). imports for consumption of crude aluminum were unchanged, while imports of semifabricated aluminum materials (plates, sheet, and bars) increased by 17%, and scrap imports decreased slightly. Canada remained the leading source country, accounting for 57% of the total (crude, semifabricated, and scrap) imports in 2014; no other nation accounted for more than 10% of total aluminum imports. imports of crude metal and alloys from Canada accounted for 46% of all aluminum imports during 2014 (table 12).
Total exports of aluminum decreased by 5% during 2014 compared with those of 2013 (table 10). Exports of crude aluminum (metal and alloys) and semifabricated aluminum materials were essentially unchanged but exports of scrap decreased by 8%. About 78% of total u.S. exports of unmanufactured aluminum (crude, semifabricated, and scrap) in 2014 were shipped to Canada, China, or mexico. mexico (37%) and Canada (36%) were the leading destinations for semi-manufactured aluminum exports. The aluminum shipped to China was 96% scrap and scrap shipped to China accounted for 33% of all u.S. aluminum exports during 2014 (table 10).
World Industry Structure
Production.—World primary aluminum production increased by 6% in 2014 compared with that of 2013 owing to new smelters and brownfield expansions in China, India, malaysia, Saudi Arabia, and the united Arab Emirates, and restart of capacity in Germany. These gains were partially offset by smelter closures in several countries as a result of lower aluminum prices, high power costs, unfavorable currency exchange rates, and technical issues. China, Russia, Canada, and the united Arab Emirates, in decreasing order of production, accounted for 66% of total world primary aluminum production. China was the leading producer and accounted for 48% of global production (table 13).
Stocks.—Although low aluminum prices led many smelters to shut down during 2014, industry inventories increased, as reported by the iAi, ending the destocking trend by primary producers started during the financial crisis in 2008–09 and partially accounting for a steep rise in lmE-held inventories. The iAi reported that total aluminum inventories increased by 14% to 2.48 mt at yearend 2014 from 2.17 mt at yearend 2013. Total aluminum includes unwrought aluminum plus unprocessed scrap, metal in process, and finished semifabricated (mill) products. unwrought aluminum inventories held by iAi member
producers increased by 20% to 1.41 mt at yearend 2014 from 1.17 Mt at yearend 2013. Unwrought aluminum is defined by the iAi as aluminum in its basic form made from primary metal or from scrap and that is metallurgically unworked. Yearend 2014 inventories of unalloyed aluminum metal held by the lmE, however, decreased by 23% to 4.21 mt from 5.45 mt at yearend 2013, and aluminum alloy inventories decreased by 24% to 107,000 t from 141,000 t. At yearend 2014, global combined iAi-reported and lmE-held inventories of primary and alloyed aluminum were 12% lower than those at yearend 2013 (international Aluminium institute, 2015a, b; london metal Exchange ltd., 2013a, 2014).
Mergers and Acquisitions.—On December 1, Alcoa sold its 50.3% interest in the mt. Holly aluminum smelter in South Carolina to its partner, Century. Capacity of the smelter was 229,000 t/yr (Alcoa inc., 2014c). Since 2011, Alcoa has been selling or shutting down some of its high-cost upstream assets in order to focus on higher value downstream assets.
On October 31, Rio Tinto plc (london, united Kingdom) sold its 50% share of the Soral smelter in Husnes, norway, to its partner norsk Hydro ASA. The 180,000-t/yr smelter has produced at about 50% of its capacity since 2009 (norsk Hydro ASA, 2014a). On December 31, Rio Tinto sold its 46.7% share of the Alucam 100,000-t/yr smelter in Cameroon to the Government of Cameroon (Rio Tinto Alcan inc., 2014b; Rio Tinto plc, 2015b, p. 4).
in may, Trimet Aluminum SE (Essen, Germany) acquired the 95,000-t/yr Voerde aluminum smelter, which filed for bankruptcy protection in may 2012. Voerde had been owned by Kleche Group since 2009. Trimet planned to add a 60,000-t/yr continuous casting line but a construction schedule was not available (Blamey, 2014b; Trimet Aluminium SE, 2014).
in montenegro, privately owned uniprom purchased the Kombinat Aluminujuma Podgorica (KAP) smelter which had filed for bankruptcy protection in 2013 citing low aluminum prices, debt, and high power prices for its 120,000-t/yr smelter in Podgorica. Previously, KAP was owned by Central European Aluminum Co. (29.4%), the Government of montenegro (29.4%), and other investors (40.2%) (Dimitrievska, 2014).
BHP Billiton ltd. (melbourne, Victoria, Australia) announced that it planned to spin off its alumina, aluminum, bauxite, coal, lead, manganese, nickel, silver, and zinc assets to create a new company to be called South32 that would be headquartered in Perth, Western Australia, Australia. Assets of South32 would include the mozal smelter in mozambique (565,000 t/yr), the Hillside smelter in South Africa (715,000 t/yr), BHP Billiton’s 40% share of the Alumar smelter in Brazil (447,000 t/yr) as well as bauxite mines and alumina refineries in Australia and Brazil. The spinoff was pending shareholder approval which was expected in may 2015 (BHP Billiton ltd., 2014b, c).
in October, Constellium plc (Amsterdam, netherlands) announced that it would acquire Wise metals intermediate Holdings llC (muscle Shoals, Al). Wise owned a secondary smelter and rolling mill in muscle Shoals, Al, which produced beverage can sheet and other sheet products. Constellium announced it would increase capacity of the rolling mill to 700,000 t/yr from 450,000 t/yr, with the additional capacity being used to supply sheet to automobile manufacturers. The
Aluminum—2014 [ADVAnCE RElEASE] 5.5
deal was completed in January 2015 (Blamey, 2014a; Wookey, 2015).
Aleris acquired nichols Aluminum llC (Davenport, iA) from Quanex Building Products Corp. (Houston, TX). nichols produced aluminum sheet products from recycled scrap for the building and construction, consumer durables, electrical, machinery, and transportation industries. The sale included a remelt facility and rolling mill in Davenport, iA, and rolling mills in Decatur, Al, and lincolnshire, il. Aleris announced that the Decatur rolling mill would be shut down in early 2015, citing a plan to streamline the company’s production facilities (Berry, 2014; laliberte, 2014a).
Aleris was restructuring its business to focus on rolled aluminum products. As such, Aleris arranged to sell its recycling and specification alloys businesses, including 18 production facilities in north America and 6 in Europe, to Signature Group Holdings (Sherman Oaks, CA). The sale was pending regulatory approval and was expected to be completed in early 2015. Aleris also announced that it would sell its extrusion business to Sankyo Tateyanma of Japan, pending regulatory approval that was expected in early 2015. The transaction included one extrusion plant in China and four in Europe (Aleris international inc., 2014b; Baltic, 2014).
World Review
Australia.—Primary aluminum production in Australia declined by 4% (74,000 t) in 2014 compared with production in 2013 and was 9% less than production in 2012 owing to smelter shutdowns during 2013 and 2014. in August 2014, Alcoa permanently shut down the 190,000-t/yr Point Henry primary smelter and an adjacent rolling mill in Geelong, Victoria. Another rolling mill and a 55,000-t/yr secondary smelter in Yennora, new South Wales, also were shut down permanently in the fourth quarter. High power prices and obsolete technology were cited for the closures of the primary smelter, which first started producing aluminum in 1963, and the secondary smelter, which opened prior to 1974 (Alcoa inc., 2014a, g; 2015, p. 12, 13).
Bahrain.—in April, Aluminium Bahrain B.S.C. (Alba) completed a modernization project on potline 4 that increased capacity to 935,000 t/yr from 931,000 t/yr. Alba also secured a gas supply agreement that would enable expanding capacity of its smelter to 1.3 million metric tons per year (mt/yr) by adding a sixth potline. Construction of the proposed potline was pending regulatory approval and was expected to take 3 years to complete (Aluminium Bahrain B.S.C., 2014a, b; Phang, 2014a).
Brazil.—Primary aluminum production decreased to 962,000 t, 26% less than that in 2013 and the lowest level since 1990. High power costs were cited for decreased production at several smelters. Annual average industrial power prices were 23% higher than those in 2013 (Assalve, 2015; Associação Brasileira do Alumínio, 2015; Carvalho, 2014b). The shutdowns of primary smelting capacity were cited for increased imports of aluminum to supply consumers in Brazil. Citing the increased demand for imports, the Government eliminated a 6% tariff on unalloyed primary aluminum imports, from August 18, 2014, until August 17, 2015, on up to 300,000 t (Carvalho, 2014a).
Alcoa and BHP Billiton temporarily shut down an additional 143,000 t/yr of capacity at their jointly owned 447,000-t/yr Alumar smelter in Sao luis, maranhao State, 142,000 t/yr of capacity at the smelter having been temporarily shut down in the third quarter of 2013. Alcoa also announced that it would temporarily shut down the remaining 62,000 t/yr of capacity at its 96,000-t/yr Pocos de Calda smelter; in 2013, 34,000 t/yr of capacity was shut down. Adverse market conditions, including high power prices and low aluminum prices, were cited for the shutdowns, which were completed in may (Alcoa inc., 2014f, i; American metal market, 2014).
At yearend, novelis permanently shut down its 18,000-t/yr primary aluminum smelter in Ouro Preto, minas Gerais State, that first opened in 1934. High power costs, inefficient capacity size, and the company’s desire to focus on secondary aluminum production were cited as the reasons for the shutdown (Allagh, 2014; novelis, 2014a).
Canada.—in June, Rio Tinto permanently shut down one 24,000-t/yr potline at the Kitimat, British Columbia, smelter as part of a modernization and expansion project. The shutdown left the smelter with 186,000 t/yr of capacity. First production from the modernized capacity was expected by the end of the first half of 2015 and rampup of the smelter to 420,000 t/yr was expected to be completed in the first half of 2016 (Rio Tinto plc, 2014, p. 5; 2015a, p. 18). Rio Tinto expected to increase capacity of the Alma, Quebec, smelter to 452,000 t/yr from 440,000 t/yr by June 2015 (Rio Tinto Alcan inc., 2014c).
in December, Rio Tinto signed a 6-year power supply agreement with the government of Quebec for the Arvida smelter in Saguenay. An environmental permit was also renewed that would allow the smelter to operate through the end of 2020. The smelter began production in 1954 and had a capacity of 176,000 t/yr (Rio Tinto Alcan inc., 2014a).
The government of Quebec approved power supply agreements between Alcoa and Hydro-Quebec. The agreements were for Alcoa to purchase power for the 413,000-t/yr Becancour and the 260,000-t/yr Deschambault smelters from Hydro-Quebec through 2030. Hydro-Quebec would also supply power to the 280,000-t/yr Baie-Comeau smelter through 2036. Alcoa planned modernization projects, which were expected to be completed in 2019, to increase the efficiency of the smelters, though the capacity of the smelters would not increase. A previously announced project—to construct a new potline to replace two potlines at the Baie-Comeau smelter that were permanently shut down in mid-2013—was cancelled (Alcoa inc., 2014e).
China.—Primary aluminum production in 2014 was 24.38 mt, 10% more than that in 2013 (China metal market—Alumina and Aluminum, 2015b). Secondary aluminum production was 5.65 mt, 8.7% more than that produced in 2013 (China metal market—Alumina and Aluminum, 2015a). Primary smelting capacity increased by 12% to 35.84 mt/yr at yearend 2014 from that at yearend 2013. Capacity increases were focused in Gansu, Henan, and Shandong Provinces and Xinjiang uyghur Autonomous Region and more than offset permanent shutdowns of obsolete high-cost capacity in Guizhou, Henan, and Shaanxi Provinces. Several expansions
5.6 [ADVAnCE RElEASE] u.S. GEOlOGiCAl SuRVEY minERAlS YEARBOOK—2014
were expected to be completed during 2015 in Gansu and Shandong Provinces and Xinjiang uyghur Autonomous Region (leung, 2015).
On January 1, the Government of China started an electricity pricing policy that would increase the price smelters pay for power based on the amount of power consumed per ton of aluminum production. The policy was an effort to limit production from inefficient smelters in order to conserve power and reduce pollution (China metal market—Alumina and Aluminum, 2014a). However, some Provincial and local governments encouraged high-cost smelters to continue producing in order to maintain employment levels (China metal market—Alumina and Aluminum, 2014c).
Government policies continued to encourage the permanent shutdown of inefficient, older, smaller smelters that were mostly located in the eastern and southern parts of the country. The Government also issued policies prohibiting the construction of new smelters and the expansion of existing smelters until 2017. The Banking Regulatory Commission issued rules prohibiting loans for expansion projects in the aluminum industry that were not approved and also tied loan terms to approval. Approved existing smelters must comply with standards set for access to power supplies, capacity, energy efficiency, environmental emissions, and technology by yearend 2015 (China metal market—Alumina and Aluminum, 2013a, b, 2014b).
France.—Trimet was expanding capacity of the St. Jean-de-maurienne smelter to 145,000 t/yr from 90,000 t/yr. Completion of the project was expected at yearend 2014 or early in 2015. Trimet acquired the smelter from Rio Tinto in December 2013 (Trimet Aluminium SE, 2014).
Germany.—in October, novelis completed construction of a recycling center and casthouse adjacent to its rolling mill in nachterstedt. The 400,000-t/yr facility would supply rolling ingot to novelis’ adjacent rolling mill and another rolling mill in Sierre, Switzerland. The nachterstedt rolling mill capacity was to be expanded to 350,000 t/yr from 230,000 t/yr in 2015 to meet increased consumption by automobile manufactures (novelis inc., 2014b, d).
Iceland.—Century was expanding the Grundartangi smelter to 326,000 t/yr from 286,000 t/yr, and by yearend 2014, had a capacity of 298,000 t/yr. The project was expected to be completed by 2019 (Century Aluminum Co., 2014d; 2015, p. 3).
India.—Primary aluminum production in 2014 increased by 14% compared with that in 2013 as new capacity ramped up. Vedanta Resources plc (london, united Kingdom) started production at the Korba II smelter during the first quarter of 2014 and expected to ramp up production to full capacity of 325,000 t/yr by early 2015. in the fourth quarter of 2014, Vedanta completed the Jharsuguda ii smelter and started trial production. The smelter was expected to ramp up to one-half of its 1.25-mt/yr capacity by yearend 2015 (Vedanta Resources plc, 2014; 2015, p. 9–10).
Hindalco started production from the 360,000-t/yr Aditya smelter in January. Hindalco was continuing to ramp up the 360,000-t/yr mahan smelter, which started production during the first quarter of 2013. Both smelters had 900-megawatt (mW) captive powerplants and would be supplied with alumina from Hindalco’s 1.5-Mt/yr Utkal alumina refinery that
was commissioned in the second quarter of 2013 (Hindalco industries ltd., 2013, 2014).
Indonesia.—PT indonesia Asahan Aluminium ltd. (inalum) planned to expand capacity of its aluminum smelter in Asahan, north Sumatra, to 650,000 t/yr from 250,000 t/yr. Construction was expected to begin in early 2015 and to be completed in 2017. in addition to expansion of the smelter, inalum also planned to build a 1.2-Mt/yr alumina refinery in Mempawah, West Kalimantan, which was expected to be completed in 2017 (Gunawan, 2014).
Italy.—in August, the temporary closure of Alcoa’s 150,000-t/yr Portovesme smelter was made permanent. Alcoa, which had shut down the smelter in november 2012 citing high power costs, determined that it was unlikely to be able to obtain power at competitive rates in the future (Alcoa inc., 2014h).
Japan.—nippon light metals inc. (nlm) permanently shut down the Kanbara smelter in march. The 7,000-t/yr smelter opened in 1940 and produced high-purity aluminum (99.95%) used for electronics applications. nlm would continue to serve its customers by purifying standard 99.7%-pure ingot (Watanabe, 2014).
Malaysia.—Primary aluminum production in malaysia increased by 48% compared with that in 2013 owing to the restart of one smelter and startup of new capacity at another smelter. Press metal Berhad’s 120,000-t/yr mukah smelter ramped up to full capacity in march, having restarted in november 2013 following a power failure on June 27, 2013 (mok, 2014). Press metal Berhad’s Samalaju smelter was expanded to 320,000 t/yr from 240,000 t/yr in early 2014. The smelter was being expanded to 520,000 t/yr with completion expected by yearend 2015; additional expansion to 640,000 t/yr was planned for completion in 2018 (Phang, 2014b).
Mexico.—in September, Toyota Tsusho Corp. started construction of a 48,000-t/yr secondary aluminum smelter in Zacatecas. The smelter would produce ingot for automotive parts manufacturers and other consumers in mexico and for export, including to the united States. Production was expected to start in June 2015 (Davidson, 2014b).
Netherlands.—Aluminum Delfzijl (Aldel) (a subsidiary of Klesch Group) shut down its 110,000-t/yr primary smelter in Groningen after it filed for bankruptcy protection on December 30, 2013. High power prices and low aluminum prices were cited for the bankruptcy and shutdown. in november, Klesch announced production from the primary smelter would restart in early 2015 pending a deal to obtain power from Germany (Bhal, 2014; Gnezditskaia, 2014; Thomas, 2014).
Nigeria.—An arbitration panel ruled in favor of united Company RuSAl Plc (moscow, Russia) in the dispute over the ownership of the 96,000-t/yr Alscon smelter in ikot Abasi. in 2013, the Supreme Court of nigeria overturned the sale of 77.5% of the Government’s 92.5% share of the smelter to RuSAl, ruling that it violated nigeria’s privatization law because BFi Group Corp. (los Angeles, CA) had offered a higher bid for the smelter. However, after the Court ruling, BFi Group did not pay for the disputed share of the smelter, and ownership was awarded back to RuSAl (Smart, 2014b; united Company RuSAl Plc, 2013).
Aluminum—2014 [ADVAnCE RElEASE] 5.7
Norway.—in early 2014, norsk Hydro completed the restart of 50,000 t/yr of primary aluminum capacity at the Sunndal smelter, which had been shut down in 2009. The restart, which began in September 2013, brought the smelter to its full capacity of 400,000 t/yr. A 50,000-t/yr secondary furnace at Sunndal was temporarily shut down so that total output from the Sunndal casthouse did not change (norsk Hydro ASA, 2014c).
Russia.—Primary aluminum production in Russia decreased by 6% (236,000 t) compared with that in 2013 owing to shutdowns of high-cost capacity during 2013. RuSAl continued modernizing Soderberg potlines at the Bratz and Krasnoyarsk smelters, which each had a capacity of 1.05 mt/yr. The modernized pots decreased emissions by 3% and increased power efficiency. The project started in 2005 and was scheduled to be completed in 2020 (united Company RuSAl Plc, 2014).
RuSAl continued construction of the Boguchansky smelter, with the start of production from the first 147,000-t/yr potline planned for 2015. The smelter would have a capacity of 588,000 t/yr when completed. A schedule for the additional capacity was not available. The smelter would be powered by the 3,000-mW Boguchanskaya hydroelectric powerplant on the Angara River (united Company RuSAl Plc, 2015, p. 14).
Saudi Arabia.—Alcoa (25.1%) and its partner Saudi Arabian mining Co. (Riyadh) (74.9%) completed the rampup of the 740,000-t/yr smelter in Ras al Khair in the second quarter of 2014. The rampup of the Ras al Khair smelter accounted for aluminum production in Saudi Arabia increasing by 478,000 t (256%) compared with that in 2013. Production from an adjacent rolling mill also started during the second quarter and construction was completed by yearend. The rolling mill would produce sheet for automotive and construction markets, containers and packaging, and foil stock (Alcoa inc., 2014f).
South Africa.—Primary aluminum production in South Africa decreased by 10% (79,000 t) compared with that in 2013 owing to the permanent closure in June of BHP Billiton’s 95,000-t/yr Bayside smelter in Richards Bay. The casthouse would continue to operate using molten aluminum produced at the nearby Hillside smelter (BHP Billiton ltd., 2014a, p. 13; Smart, 2014a).
United Arab Emirates.—Primary aluminum production in the united Arab Emirates increased by 25% (466,000 t) in 2014 compared with that in 2013. Dubai Aluminum Co. ltd. (a subsidiary of Emirates Global Aluminium Co. ltd.) expanded the Al Taweelah smelter to 1.32 mt/yr from 0.8 mt/yr and started production from the new capacity in June (Emirates Global Aluminium Co. ltd., 2014).
Venezuela.—Primary aluminum production decreased by 13% (20,000 t) compared with that in 2013. lack of spare parts for equipment was cited for the capacity utilization rate of about 25% throughout the year. in 2013, the Government of Venezuela negotiated a $5 billion investment by the Government of China to fund modernization of the state-owned aluminum industry. About $500 million of the investment would be used to restore production from the 430,000-t/yr Venalum smelter and the 170,000-t/yr Alcasa smelter to full capacity. The modernization project was expected to begin in June 2015 (Soules, 2014, 2015).
Outlook
World demand for aluminum in 2015 is expected to increase modestly from that in 2014 as economic expansion in most nations continues. Consumption in Europe is expected to continue to increase modestly as the economies in several countries recover from the impact of the debt crisis. A resolution to the complaints about long load-out times at lmE-registered warehouses may cause regional premiums to decline, especially in the united States, and lmE inventories to continue to decline.
Some u.S. smelters are expected to remain shut down or to be permanently closed, owing to high power prices and obsolete technology. As of June 1, 2015, about 28% (660,000 t/yr) of domestic primary aluminum smelting capacity was idle. The global trend of permanently closing older smelters or modernizing them in order to comply with environmental regulations, increase efficiency, and reduce costs is expected to continue. new smelters located where power costs are relatively low are expected to continue to replace production at high-cost smelters in several parts of the world. in China, construction of new capacity is expected to be limited, and older capacity is expected to be shut down.
Aluminum consumption by the domestic automobile industry is expected to increase as automobile manufacturers increase the amount of aluminum per vehicle in response to increasing fuel efficiency standards and as more vehicles are manufactured to satisfy pent-up demand as the economy improves. The substitution of aluminum sheet for steel in certain truck models is also expected to increase domestic consumption of aluminum in 2015. Aluminum consumption by u.S. and European aircraft manufacturers is expected to increase as airlines continue to replace older aircraft with newer, more-fuel-efficient models. Competition from carbon composites, magnesium, and high-strength steel is expected to continue as the transportation sector seeks lightweight materials to improve fuel efficiency, with the aluminum industry developing new aluminum alloys to compete with other materials.
References Cited
Alcoa inc., 2014a, About Yennora: new York, nY, Alcoa inc. (Accessed February 18, 2014, at http://www.alcoa.com/australia/en/info_page/yennora_overview.asp#.)
Alcoa inc., 2014b, Alcoa completes $300 million automotive expansion in iowa to meet growing demand for aluminum intensive vehicles: new York, nY, Alcoa inc. news release, January 14. (Accessed January 15, 2014, at http://www.alcoa.com/global/en/news/news_detail.asp?pageiD=20140114000184en&newsYear=2014.)
Alcoa inc., 2014c, Alcoa completes sales of two upstream assets: new York, nY, Alcoa inc. news release, December 1. (Accessed December 5, 2014, at http://www.alcoa.com/global/en/news/news_detail.asp?pageiD=20141201000244en&newsYear=2014.)
Alcoa inc., 2014d, Alcoa opens world’s largest aluminum-lithium aerospace plant in indiana: new York, nY, Alcoa inc. news release, October 2. (Accessed October 15, 2014, at http://www.alcoa.com/global/en/news/news_detail.asp?pageiD=20141002000232en&newsYear=2014.)
Alcoa inc., 2014e, Alcoa reaches power agreement to improve competitiveness of Quebec smelters, secure 3,000 jobs: new York, nY, Alcoa inc. news
5.8 [ADVAnCE RElEASE] u.S. GEOlOGiCAl SuRVEY minERAlS YEARBOOK—2014
release, February 25. (Accessed February 26, 2014, at http://www.alcoa.com/ global/en/news/news_detail.asp?pageiD=20140225000195en&newsYear=2014.)
Alcoa Inc., 2014f, Alcoa reports strong second quarter 2014 profits driven by continued portfolio transformation: new York, nY, Alcoa inc. news release, July 8. (Accessed march 18, 2015, at http://www.alcoa.com/global/en/news/news_detail.asp?pageiD=20140708000217en&newsYear=2014.)
Alcoa inc., 2014g, Alcoa to close Point Henry aluminum smelter and rolling mills in Australia: new York, nY, Alcoa inc. news release, February 17. (Accessed February 18, 2014, at http://www.alcoa.com/global/en/news/news_detail.asp?pageiD= 20140217000194en&newsYear=2014.)
Alcoa inc., 2014h, Alcoa to close Portovesme smelter in italy: new York, nY, Alcoa inc. news release, August 25. (Accessed march 18, 2015, at http://www.alcoa.com/global/en/news/news_detail.asp?pageiD=20140825000222en&newsYear=2014.)
Alcoa inc., 2014i, Alcoa to curtail 147,000 metric tons of aluminum smelting capacity in Brazil: new York, nY, Alcoa inc. news release, march 28. (Accessed march 28, 2014, at http://www.alcoa.com/global/en/news/news_detail.asp?pageiD=20140328000202en&newsYear=2014.)
Alcoa inc., 2014j, Alcoa to permanently close remaining potlines at massena East smelter: new York, nY, Alcoa inc. news release, January 15. (Accessed January 22, 2014, at http://www.alcoa.com/global/en/news/news_detail.asp?pageiD=20140115000185en&newsYear=2014.)
Alcoa inc., 2015, Form 10–K—2014: u.S. Securities and Exchange Commission, 175 p. (Accessed April 24, 2015, at http://www.sec.gov/Archives/edgar/data/4281/000119312515054376/d836461d10k.htm.)
Aleris international inc., 2014a, Aleris breaks ground on $350 million automotive expansion in lewisport, Kentucky: Cleveland, OH, Aleris international inc. news release, October 29. (Accessed november 18, 2014, at http://investor.aleris.com/2014-10-29-Aleris-Breaks-Ground-on-350-million-Automotive-Expansion-in-lewisport-Kentucky.)
Aleris International Inc., 2014b, Aleris to sell its recycling and specification alloy businesses to Signature Group Holdings: Cleveland, OH, Aleris international inc. news release, October 17. (Accessed november 18, 2014, at http://investor.aleris.com/2014-10-17-Aleris-to-Sell-its-Recycling-and-specification-Alloy-Businesses-to-Signature-Group-Holdings.)
Allagh, Tina, 2014, novelis to close Brazil aluminum smelter at year-end: Platts metals Daily, v. 3, no. 204, October 16, p. 1–2.
Aluminium Bahrain B.S.C., 2014a, Alba thanks Bahrain Cabinet for line 6 support: Bahrain, Bahrain, Aluminium Bahrain B.S.C. press release, July 2. (Accessed march 23, 2015, at http://www.albasmelter.com/mc/news/Pages/2014/Alba-thanks-Bahrain-Cabinet-for-line-6-Support.aspx.)
Aluminium Bahrain B.S.C., 2014b, Alba’s pot line 4 upgraded to AP36 technology: Bahrain, Bahrain, Aluminium Bahrain B.S.C. press release, April 22. (Accessed march 23, 2015, at http://www.albasmelter.com/mc/news/Pages/2014/Pot-l4-upgraded-to-AP36-technology.aspx.)
Aluminum Association inc., The, 2015, The aluminum situation: Washington, DC, The Aluminum Association inc., February 23, 7 p.
American Foundry Society inc., 2014, new aluminum continuous caster opens in indiana: Schaumburg, il, American Foundry Society inc. press release, February 13. (Accessed march 12, 2015, at http://www.afsinc.org/news/news.cfm?itemnumber=16011.)
American metal market, 2014, BHP Billiton to cut Brazil aluminum output: American metal market, v. 122, no. 16–4, April 17, p. 4.
Assalve, Danielle, 2015, Brazil’s primary aluminum production hits 24-year low: American metal market, v. 123, no. 7–2, February 18, p. 7.
Associação Brasileira do Alumínio, 2015, Primary aluminum: Sao Paulo, Brazil, Associação Brasileira do Alumínio. (Accessed march 23, 2015, at http://www.abal.org.br/en/statistics/national/primary-aluminum/production-per-company/.)
Baltic, Sarah, 2014, Aleris to sell Al extrusions business to Sankyo Tateyama: Platts metals Daily, v. 3, no. 249, December 18, p. 2–3.
Baltic, Sarah, and Tran, Estelle, 2014, Al bodies in 75% of n. American pickups by 2025—Ducker: Platts metals Daily, v. 3, no. 112, June 10, p. 1–3.
Berry, lucy, 2014, Aleris international announces nichols Aluminum plant closure, 95 job cuts in Decatur: Alabama media Group, October 15. (Accessed march 12, 2015, at http://www.al.com/business/index.ssf/2014/10/aleris_international_announces.html.)
Bhal, Harpreet, 2014, Dutch aluminium smelter Aldel to restart next year: Thomson Reuters, november 13. (Accessed march 26, 2015, at http://af.reuters.com/article/commoditiesnews/idAFl6n0T33F720141113.)
BHP Billiton ltd., 2014a, BHP Billiton operational review for the year ended 30 June 2014: melbourne, Victoria, Australia, BHP Billiton ltd. news release,
July 23, 28 p. (Accessed July 23, 2014, at http://www.bhpbilliton.com/ ~/media/bhp/documents/investors/reports/2014/140723_bhpbillitonoperationalreviewfortheyearended30june2014.pdf.)
BHP Billiton ltd., 2014b, Creation of new global metals and mining company to accelerate portfolio simplification: Melbourne, Victoria, Australia, BHP Billiton ltd. news release, August 19. (Accessed march 18, 2015, at http://www.bhpbilliton.com/home/investors/news/Pages/Articles/Creation-of-new-Global-metals-and-mining-Company.aspx.)
BHP Billiton ltd., 2014c, new company to be named South32: melbourne, Victoria, Australia, BHP Billiton ltd. news release, December 8. (Accessed march 18, 2015, at http://www.bhpbilliton.com/home/investors/news/Pages/Articles/new-Company-to-be-named-South32.aspx.)
Blamey, Andy, 2014a, moody’s downgrades Constellium on Wise acquisition: Platts metals Daily, v. 3, no. 239, December 4, p. 3–4.
Blamey, Andy, 2014b, Trimet acquires bankrupt Voerde aluminum smelter: Platts metals Daily, v. 3, no. 103, may 28, p. 4–5.
Blamey, Andy, and Cooke, Henry, 2014, lmE to postpone launch of linked load-in, load-out rates after English court ruling: Platts metals Daily, v. 3, no. 61, march 27, p. 1, 12–13.
Boeing Co., The, 2015, Boeing reports record 2014 revenue, core EPS and backlog and provides 2015 guidance: Chicago, il, The Boeing Co., January 28, 14 p. (Accessed February 20, 2015, at http://boeing.mediaroom.com/2015-01-28-Boeing-Reports-Record-2014-Revenue-Core-EPS-and-Backlog-and-Provides-2015-Guidance.)
Carvalho, Adriana, 2014a, Brazil eliminates aluminum import tariff for one year: Platts metals Daily, v. 3, no. 153, August 6, p. 1–2.
Carvalho, Adriana, 2014b, Brazilian industry’s electricity costs up 23% in 2014: Platts metals Daily, v. 3, no. 254, December 29, p. 1, 10.
Century Aluminum Co., 2014a, Century Aluminum Sebree and uSW ratify new labor agreement: Chicago, il, Century Aluminum Co. news release, July 21. (Accessed march 18, 2015, at http://investor.shareholder.com/cenx/releasedetail.cfm?ReleaseiD=860992.)
Century Aluminum Co., 2014b, Century Aluminum to expand Sebree smelter facility in Henderson County: Chicago, il, Century Aluminum Co. news release, July 31. (Accessed August 15, 2014, at http://www.centuryaluminum.com/CenturyRelease7-31-14.html.)
Century Aluminum Co., 2014c, Century receives positive ruling from Kentucky Public Service Commission on market-priced power for Sebree, KY smelter: Chicago, il, Century Aluminum Co. press release, January 30, 1 p. (Accessed February 12, 2014, at http://investor.shareholder.com/cenx/releasedetail.cfm?ReleaseiD=822255.)
Century Aluminum Co., 2014d, Grundartangi, iceland: Chicago, il, Century Aluminum Co. Web site. (Accessed march 27, 2015, at http://www.centuryaluminum.com/grundartangi.php.)
Century Aluminum Co., 2015, Form 10–K 2014 annual report: Chicago, il, Century Aluminum Co., march 2, 153 p. (Accessed may 6, 2015, at http://investor.shareholder.com/cenx/sec.cfm?DocType=Annual&Year=2015&FormatFilter=.)
China metal market—Alumina and Aluminum, 2013a, Highlight: China metal market—Alumina and Aluminum, no. 203, november 1, p. 2.
China metal market—Alumina and Aluminum, 2013b, industrial policy, foreign investment and trade: China metal market—Alumina and Aluminum, no. 198, June 1, p. 18–19.
China metal market—Alumina and Aluminum, 2014a, Highlight: China metal market—Alumina and Aluminum, no. 205, January 1, p. 2.
China metal market—Alumina and Aluminum, 2014b, Highlight: China metal market—Alumina and Aluminum, no. 207, march 1, p. 2.
China metal market—Alumina and Aluminum, 2014c, market commentary: China metal market—Alumina and Aluminum, no. 207, march 1, p. 6–7.
China metal market—Alumina and Aluminum, 2015a, Aluminum: China metal market—Alumina and Aluminum, no. 222, June 1, p. 22.
China metal market—Alumina and Aluminum, 2015b, Statistics: China metal market—Alumina and Aluminum, no. 218, February 1, p. 20.
CRu Aluminum monitor, 2013a, All eyes on lmE warehouse system: CRu Aluminum monitor, August, p. 2–3.
CRu Aluminum monitor, 2013b, lmE responds to market pressure on warehousing: CRu Aluminum monitor, november, p. 2–3.
Davidson, Sean, 2014a, Bermco completes upgrade to Alabama smelting facility: American metal market, v. 122, no. 37–5, September 12, p. 7.
Davidson, Sean, 2014b, Toyota Tsusho n. America smelter to lift auto reach: American metal market, v. 122, no. 37–3, September 10, p. 1.
Dimitrievska, Valentina, 2014, montenegro’s uniprom signs deal to buy aluminum smelter KAP for 28 mln euro—media: Podgorica, montenegro,
Aluminum—2014 [ADVAnCE RElEASE] 5.9
See news The Corporate Wire, June 10. (Accessed march 26, 2015, at http://wire.seenews.com/news/montenegros-uniprom-signs-deal-to-buy-aluminum-smelter-kap-for-28-mln-euro-media-425087.)
Emirates Global Aluminium Co. ltd., 2014, more industry milestones as EmAl completes start-up of new potline: Abu Dhabi, united Arab Emirates, Emirates Global Aluminium Co. ltd. news release, June 23. (Accessed September 14, 2015, at http://www.ega.ae/en/media/newsdetail/?id=2998.)
Fitzgerald, Daniel, 2014, Aleris restarts ops at Richmond facility: American metal market, v. 122, no. 17–3, April 23, p. 4.
Ford motor Co., 2014, Ford begins building all-new F–150; Customer interest for truck at record levels: Dearborn, mi, Ford motor Co. press release, november 11. (Accessed march 27, 2015, at https://media.ford.com/content/fordmedia/fna/us/en/news/2014/11/11/ford-begins-building-all-new-f-150.html.)
Gnezditskaia, Anastasia, 2014, Recycling unit at bankrupt smelter Aldel may have future: Platts metals Daily, v. 3, no. 7, January 10, p. 6.
Gunawan, Apriadi, 2014, inalum to spend $2b on new facilities: The Jakarta [indonesia] Post, January 21. (Accessed January 21, 2014, at http://www.thejakartapost.com/news/2014/01/21/inalum-spend-2b-new-facilities.html.)
Hindalco industries ltd., 2013, Hindalco reports standalone and consolidated audited results for year ended 31 march 2013: mumbai, india, Hindalco industries ltd. press release, may 28. (Accessed march 13, 2014, at http://www.hindalco.com/media/press-releases/hindalco-FY13-results.)
Hindalco industries ltd., 2014, Hindalco announces Q3 FY2013–14 standalone results (unaudited): mumbai, india, Hindalco industries ltd. press release, February 13. (Accessed march 13, 2014, at http://www.hindalco.com/media/press-releases/hindalco-Q3FY14-results.)
international Aluminium institute, 2015a, Historical aluminium inventories (1973–2014) [total]: london, united Kingdom, international Aluminium institute. (Accessed may 15, 2015, at http://www.world-aluminium.org/publications/#822/reported_total_aluminium_producer_inventories_-_january_1973_to_december_2014_historical_data.xls.)
international Aluminium institute, 2015b, Historical aluminium inventories (1973–2014) [unwrought]: london, united Kingdom, international Aluminium institute. (Accessed may 15, 2015, at http://www.world-aluminium.org/publications/#822/reported_unwrought_aluminium_producer_inventories_-_january_1973_to_december_2014_historical_data.xls.)
laliberte, nathan, 2014a, Aleris in $110m deal to buy nichols Aluminum: American metal market, v. 122, no. 7–2, February 11, p. 1–9.
laliberte, nathan, 2014b, Fire idles one potline at Alcoa’s Warrick smelter: American metal market, v. 122, no. 41–4, October 9, p. 1.
laliberte, nathan, 2014c, Huntington Aluminum plans expansion at indiana plant: American metal market, v. 122, no. 37–3, September 10, p. 7.
laliberte, nathan, 2014d, matalco breaks ground at aluminum extrusion facility: American metal market, v. 122, no. 39–1, September 22, p. 3.
laliberte, nathan, 2014e, niagara pulls plug, sets auction plans for Ormet: American metal market, v. 122, no. 39–4, September 25, p. 1.
laliberte, nathan, 2015a, logan Aluminum outage could shake can market: American metals market, v. 123, no. 1–5, January 9, p. 1, 6.
laliberte, nathan, 2015b, logan Aluminum restarting mill early: American metals market, v. 123, no. 3–1, January 19, p. 5.
leung, Joshua, 2015, China’s end-April aluminum smelting capacity hits 37.485 mil mt/year, up 5% since end-2014: Platts metals Daily, v. 4, no. 101, may 26, p. 1–2.
london metal Exchange ltd., 2007, Aluminium stocks: london, united Kingdom, london metal Exchange ltd., December 31, 3 p.
london metal Exchange ltd., 2008, Aluminium stocks: london, united Kingdom, london metal Exchange ltd., December 31, 3 p.
london metal Exchange ltd., 2009, Aluminium stocks: london, united Kingdom, london metal Exchange ltd., December 31, 3 p.
london metal Exchange ltd., 2013a, Aluminium stocks: london, united Kingdom, london metal Exchange ltd., December 31, 3 p.
london metal Exchange ltd., 2013b, lmE introduces comprehensive package of warehouse reforms: london, united Kingdom, london metal Exchange ltd. press release, november 7. (Accessed April 16, 2014, at http://www.lme.com/news-and-events/press-releases/press-releases/2013/11/warehousing-announcement-nov-13/.)
london metal Exchange ltd., 2014, Aluminium stocks: london, united Kingdom, london metal Exchange ltd., December 31, 3 p.
matalco inc., 2014, matalco inc. announces new aluminum facility in lordstown, Ohio: Brampton, Ontario, Canada, matalco inc. news release,
July 23, 2 p. (Accessed August 15, 2014, at http://www.matalco.com/pdf/matalco_PressReleaseJul232014.pdf.)
matyi, Bob, 2014a, noranda rebuilding aluminum pots at new madrid smelter: Platts metals Daily, v. 3, no. 236, December 1, p. 1–2.
matyi, Bob, 2014b, Ormet’s old aluminum smelter won’t restart—new owner: Platts metals Daily, v. 3, no. 193, October 1, p. 3.
matyi, Bob, 2014c, Potline back in production at Alcoa’s Warrick operations: Platts metals Daily, v. 3, no. 243, December 10, p. 4.
matyi, Bob, 2015, novelis forced to import can sheet because of unexpected logan hot mill outage: Platts metals Daily, v. 4, no. 27, February 9, p. 1–2.
mok, Yuencheng, 2014, malaysian Press metal’s mukah Al smelter near 100% capacity: Platts metals Daily, v. 3, no. 49, march 11, p. 3–4.
noranda Aluminum Holding Corp., 2015, 2014 annual report: Franklin, Tn, noranda Aluminum Holding Corp., 123 p. (Accessed July 10, 2015, via http://investor.norandaaluminum.com/phoenix.zhtml?c=220051&p=irol-reportsAnnual.)
norsk Hydro ASA, 2014a, Hydro and RTA close Soral deal: Oslo, norway, norsk Hydro ASA news release, november 3. (Accessed november 3, 2014, at http://www.hydro.com/en/Press-room/news/Archive/2014/Hydro-and-RTA-closes-Soral-deal/.)
norsk Hydro ASA, 2014b, Hydro boosts capacity for growth market in automotive products: Oslo, norway, norsk Hydro ASA news release, February 25. (Accessed march 23, 2015, at http://www.hydro.com/en/Press-room/news/Archive/Stock-exchange-announcements/2014/Hydro-boosts-capacity-for-growth-market-in-automotive-products/.)
norsk Hydro ASA, 2014c, Hydro optimizes production capacity in Sunndal: Oslo, norway, norsk Hydro ASA news release, September 9. (Accessed march 23, 2015, at http://www.hydro.com/en/Press-room/news/Archive/2014/Hydro-optimizes-production-capacity-in-Sunndal-/.)
novelis inc., 2013, novelis announces $205 million investment to further expand global automotive aluminum capacity to 900,000 tons annually: Atlanta, GA, novelis inc. news release, December 17. (Accessed march 17, 2014, at http://novelis.mediaroom.com/index.php?s= 43&item=394&printable.)
novelis inc., 2014a, novelis announces closure of Ouro Preto aluminum smelter to focus Brazilian operations on core rolled products business: Atlanta, GA, and Sao Paulo, Brazil, novelis inc. news release, October 16. (Accessed march 17, 2015, at http://novelis.mediaroom.com/index.php?s=43&item=466&printable.)
novelis inc., 2014b, novelis celebrates groundbreaking for new automotive finishing line at Nachterstedt facility: Atlanta, GA, and Nachterstedt, Germany, novelis inc. news release, April 7. (Accessed march 18, 2015, at http://novelis.mediaroom.com/index.php?s=43&item=402&printable.)
Novelis Inc., 2014c, Novelis opens China’s first manufacturing facility for heat-treated aluminum automotive sheet: Atlanta, GA, novelis inc. news release, October 20. (Accessed march 17, 2015, at http://novelis.mediaroom.com/index.php?s=43&item=470&printable.)
novelis inc., 2014d, novelis opens world’s largest aluminum recycling facility: Atlanta, GA, and nachterstedt, Germany, novelis inc. news release, October 1. (Accessed march 17, 2015, at http://novelis.mediaroom.com/index.php?s=43&item=455&printable.)
Ormet Corp., 2013, Ormet Corporation reaches agreement on debt restructuring and sale of business to Wayzata investment Partners: Hannibal, OH, Ormet Corp. press release, February 25, 3 p. (Accessed march 20, 2013, at http://www.ormet.com/news/PDF/FOR immEDiATE RElEASE February 25 For Wayzata FinAl.pdf.)
Phang, S.l., 2014a, Alba seeks approval to expand capacity by 44%: Platts metals Daily, v. 3, no. 131, July 7, p. 4.
Phang, S.l., 2014b, Press metal to double Samalaju Al smelter capacity: Platts metals Daily, v. 3, no. 229, november 20, p. 4.
Platts metals Daily, 2015, logan Aluminum repair could take up to six weeks: Platts metals Daily, v. 4, no. 4, January 7, p. 4.
Platts metals Week, 2012, Bermco to build new Alabama facility: Platts metals Week, v. 83, no. 14, April 2, p. 16–17.
Rio Tinto Alcan inc., 2014a, Rio Tinto Alcan reaches agreement with the Quebec government to extend the life of the Arvida aluminium smelter: montreal, Quebec, Canada, Rio Tinto Alcan inc. media release, December 19. (Accessed march 20, 2015, at http://www.riotintoalcan.com/EnG/media/media_releases_2851.asp.)
Rio Tinto Alcan inc., 2014b, Rio Tinto Alcan to dispose of its shares in the Alucam Group in Cameroon and will maintain its partnership with the Government of Cameroon: montreal, Quebec, Canada, Rio Tinto
5.10 [ADVAnCE RElEASE] u.S. GEOlOGiCAl SuRVEY minERAlS YEARBOOK—2014
Alcan inc. media release, October 8. (Accessed march 20, 2015, at http://www.riotintoalcan.com/EnG/media/media_releases_2830.asp.)
Rio Tinto Alcan inc., 2014c, Rio Tinto Alcan to invest C$14.8 million at its Alma smelter in Quebec: montreal, Quebec, Canada, Rio Tinto Alcan inc. media release, September 9. (Accessed march 20, 2015, at http://www.riotintoalcan.com/EnG/media/media_releases_2808.asp.)
Rio Tinto plc, 2014, Rio Tinto delivers very strong first half production: London, united Kingdom, Rio Tinto plc media release, July 16, 26 p. (Accessed July 23, 2014, at http://www.riotinto.com/documents/140716_Rio_Tinto_delivers_very_strong_first_half_production.pdf.)
Rio Tinto plc, 2015a, 2014 annual report: london, united Kingdom, Rio Tinto plc, February 12, 228 p. (Accessed July 8, 2015, at http://www.riotinto.com/investors/results-and-reports-2146.aspx#tab_2014.)
Rio Tinto plc, 2015b, Rio Tinto releases robust fourth quarter production performance: london, united Kingdom, Rio Tinto plc media release, January 20, 27 p. (Accessed January 21, 2015, at http://www.riotinto.com/documents/150120_RT_fourth_quarter_operations_review.pdf.)
Slater, Sherry, 2014, Huntington Aluminum expanding: The Journal Gazette [Fort Wayne, in], September 9. (Accessed September 14, 2015, at http://www.journalgazette.net/business/Huntington-Aluminum-expanding-2278022.)
Smart, Greg, 2014a, BHP Billiton in talks over Bayside smelter closure: Platts metals Daily, v. 3, no. 13, January 20, p. 1–2.
Smart, Greg, 2014b, lCiA tribunal rules in Rusal’s favor on nigeria smelter: Platts metals Daily, v. 3, no. 204, October 16, p. 4–5.
Soules, George, 2014, Alcasa admits cell replacement effort behind schedule: Platts metals Daily, v. 3, no. 174, September 4, p. 5.
Soules, George, 2015, Venalum’s Jan Al smelter sales down 56% to 3,073 mt: Platts metals Daily, v. 4, no. 39, February 25, p. 4.
Stoddard, Haig, 2015, u.S. light-vehicle sales hit 8-year high in 2014: WardsAuto press release, January 5. (Accessed march 17, 2015, at http://wardsauto.com/north-america/us-light-vehicle-sales-hit-8-year-high-2014.)
Thomas, Susan, 2014, Dutch aluminium smelter Aldel applies for bankruptcy: Thomson Reuters Online, January 7. (Accessed march 26, 2015, at http://www.reuters.com/article/2014/01/07/aluminium-smelter-iduSl6n0KH17B20140107.)
Trimet Aluminium SE, 2014, Fiscal year 2013/2014—Course set for future growth—TRimET integrates new sites and extends its product portfolio: Essen, Germany, Trimet Aluminium SE press release, September 16. (Accessed April 24, 2015, at http://www.trimet.eu/en/presse/pressemitteilungen/2014/2014-09-16-weichen-fur-kunftiges-wachstum-gestellt.)
united Company RuSAl Plc, 2013, uC Rusal suspends aluminium production at the AlSCOn smelter: moscow, Russia, united Company RuSAl Plc press release, march 15. (Accessed march 20, 2013, at http://www.rusal.ru/en/press-center/news_details.aspx?id=8445&ibt=13.)
united Company RuSAl Plc, 2014, uC RuSAl to switch nearly 2.1 mln tonnes of production capacities in Russia to EcoSoederberg technology: moscow, Russia, united Company RuSAl Plc press release, march 14. (Accessed march 23, 2015, at http://www.rusal.ru/en/press-center/news_details.aspx?id=10257&ibt=13&at=0.)
united Company RuSAl Plc, 2015, Annual report 2014: moscow, Russia, united Company RuSAl Plc, February 13, 278 p. (Accessed June 5, 2015, via http://www.rusal.ru/en/investors/reports.aspx.)
United Steelworkers, 2014, USW members vote to ratify five-year contract with Alcoa: Pittsburgh, PA, united Steelworkers press release, June 6. (Accessed march 27, 2015, at http://www.usw.org/news/media-center/releases/2014/usw-members-vote-to-ratify-five-year-contract-with-alcoa.)
u.S. Census Bureau, 2015a, December 2014 construction spending at $982.1 billion annual rate: Washington, DC, u.S. Census Bureau news release, February 2, 5 p. (Accessed February 20, 2015, at http://www.census.gov/construction/c30/pdf/pr201412.pdf.)
u.S. Census Bureau, 2015b, new residential construction in December 2014: Washington, DC, u.S. Census Bureau news release, January 21, 6 p. (Accessed February 20, 2015, at http://www.census.gov/construction/nrc/pdf/newresconst_201412.pdf.)
u.S. Census Bureau, 2015c, new residential construction in January 2015: Washington, DC, u.S. Census Bureau news release, February 18, 6 p. (Accessed February 20, 2015, at http://www.census.gov/construction/nrc/pdf/newresconst_201501.pdf.)
Vedanta Resources plc, 2014, Production release for the fourth quarter and full year ended 31 march 2014: london, united Kingdom, Vedanta Resources plc news release, April 10, 8 p. (Accessed April 18, 2014, at http://www.vedantaresources.com/media/162867/Vedanta%20Q4%20FY2014%20Production%20Release.pdf.)
Vedanta Resources plc, 2015, Production release for the third quarter ended 31 December 2014: london, united Kingdom, Vedanta Resources plc news release, January 30, 15 p. (Accessed march 25, 2015, at http://www.vedantaresources.com/media/171132/vedanta_q3_press_release_final.pdf.)
Watanabe, mayumi, 2014, nippon light metals to close Al smelter by mar 31: Platts metals Daily, v. 3, no. 52, march 14, p. 7.
Wookey, Jethro, 2015, Constellium completes buy of Wise metals for $1.4 billion: American metal market, v. 123, no. 1–3, January 7, p. 4.
GENERAL SOURCES OF INFORMATION
U.S. Geological Survey Publications
Aluminum. Ch. in mineral Commodity Summaries, annual.Aluminum. mineral industry Surveys, monthly.Aluminum (Al). Ch. in metal Prices in the united States Through
2010, Scientific Investigations Report 2012–5188, 2013.Aluminum and Bauxite. Ch. in united States mineral
Resources, Professional Paper 820, 1973.Bauxite and Alumina. Ch. in mineral Commodity
Summaries, annual.Historical Statistics for mineral and material Commodities in
the united States. Data Series 140.u.S. Trade in Bauxite and Alumina. mineral industry
Surveys, quarterly.World Bauxite Resources. Professional Paper 1076–B, 1986.
Other
Aluminum. Ch. in mineral Facts and Problems, u.S. Bureau of mines Bulletin 675, 1985.
Aluminum Statistical Review. The Aluminum Association inc., annual.
Aluminum—2014 [ADVAnCE RElEASE] 5.11
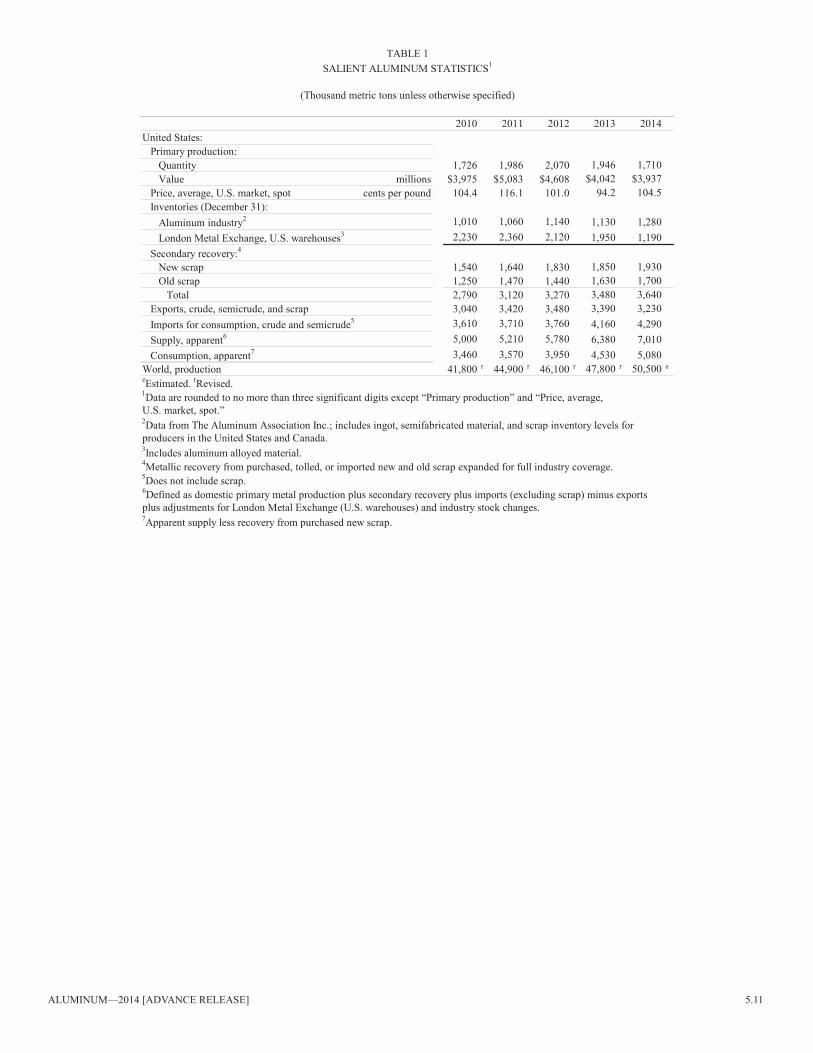
2010 2011 2012 2013 2014united States:
Primary production:Quantity 1,726 1,986 2,070 1,946 1,710Value millions $3,975 $5,083 $4,608 $4,042 $3,937
Price, average, u.S. market, spot cents per pound 104.4 116.1 101.0 94.2 104.5inventories (December 31):
Aluminum industry2 1,010 1,060 1,140 1,130 1,280london metal Exchange, u.S. warehouses3 2,230 2,360 2,120 1,950 1,190
Secondary recovery:4
new scrap 1,540 1,640 1,830 1,850 1,930Old scrap 1,250 1,470 1,440 1,630 1,700
Total 2,790 3,120 3,270 3,480 3,640Exports, crude, semicrude, and scrap 3,040 3,420 3,480 3,390 3,230imports for consumption, crude and semicrude5 3,610 3,710 3,760 4,160 4,290Supply, apparent6 5,000 5,210 5,780 6,380 7,010Consumption, apparent7 3,460 3,570 3,950 4,530 5,080
World, production 41,800 r 44,900 r 46,100 r 47,800 r 50,500 e
6Defined as domestic primary metal production plus secondary recovery plus imports (excluding scrap) minus exportsplus adjustments for london metal Exchange (u.S. warehouses) and industry stock changes.7Apparent supply less recovery from purchased new scrap.
u.S. market, spot.”2Data from The Aluminum Association inc.; includes ingot, semifabricated material, and scrap inventory levels for producers in the united States and Canada.3includes aluminum alloyed material.4metallic recovery from purchased, tolled, or imported new and old scrap expanded for full industry coverage.5Does not include scrap.
TABlE 1SAliEnT Aluminum STATiSTiCS1
(Thousand metric tons unless otherwise specified)
eEstimated. rRevised. 1Data are rounded to no more than three significant digits except “Primary production” and “Price, average,
5.12 [ADVAnCE RElEASE] u.S. GEOlOGiCAl SuRVEY minERAlS YEARBOOK—2014
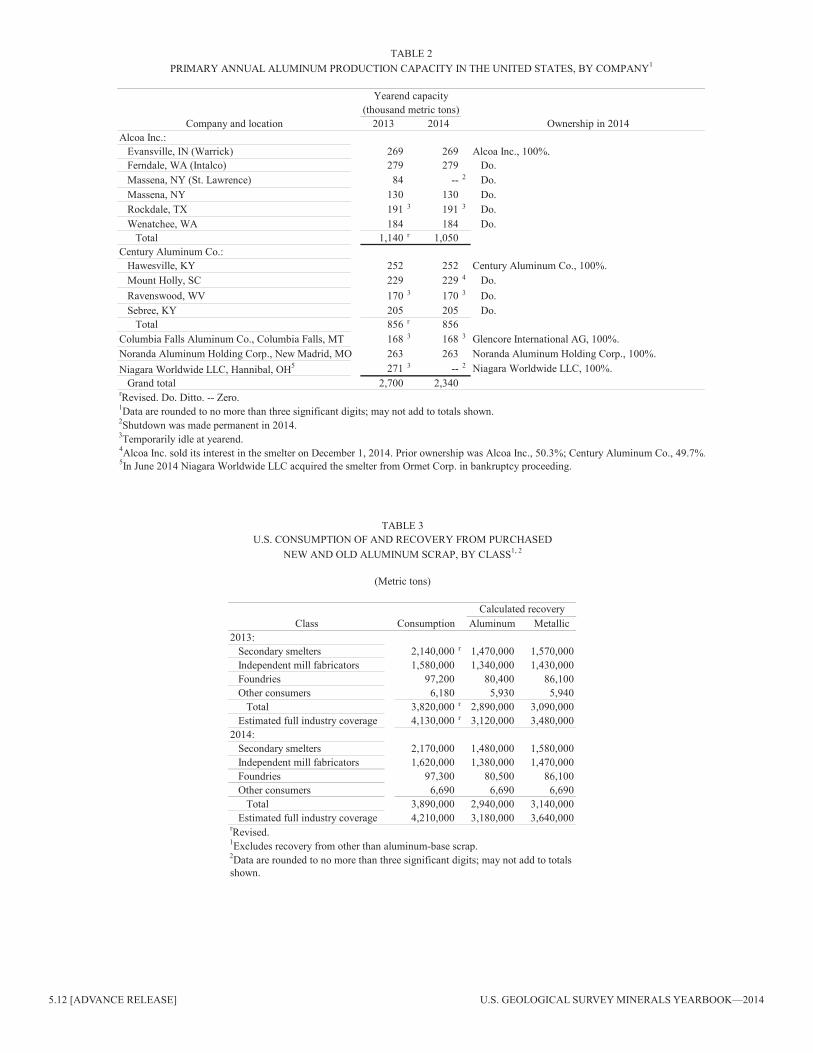
Yearend capacity(thousand metric tons)
Company and location 2013 2014 Ownership in 2014Alcoa inc.:
Evansville, in (Warrick) 269 269 Alcoa inc., 100%.Ferndale, WA (intalco) 279 279 Do.massena, nY (St. lawrence) 84 -- 2 Do.massena, nY 130 130 Do.Rockdale, TX 191 3 191 3 Do.Wenatchee, WA 184 184 Do.
Total 1,140 r 1,050Century Aluminum Co.:
Hawesville, KY 252 252 Century Aluminum Co., 100%.mount Holly, SC 229 229 4 Do.Ravenswood, WV 170 3 170 3 Do.Sebree, KY 205 205 Do.
Total 856 r 856Columbia Falls Aluminum Co., Columbia Falls, mT 168 3 168 3 Glencore international AG, 100%.noranda Aluminum Holding Corp., new madrid, mO 263 263 noranda Aluminum Holding Corp., 100%.niagara Worldwide llC, Hannibal, OH5 271 3 -- 2 niagara Worldwide llC, 100%.
Grand total 2,700 2,340
4Alcoa inc. sold its interest in the smelter on December 1, 2014. Prior ownership was Alcoa inc., 50.3%; Century Aluminum Co., 49.7%.5in June 2014 niagara Worldwide llC acquired the smelter from Ormet Corp. in bankruptcy proceeding.
TABlE 2PRimARY AnnuAl Aluminum PRODuCTiOn CAPACiTY in THE uniTED STATES, BY COmPAnY1
rRevised. Do. Ditto. -- Zero.1Data are rounded to no more than three significant digits; may not add to totals shown.2Shutdown was made permanent in 2014.3Temporarily idle at yearend.
Class Consumption Aluminum metallic2013:
Secondary smelters 2,140,000 r 1,470,000 1,570,000independent mill fabricators 1,580,000 1,340,000 1,430,000Foundries 97,200 80,400 86,100Other consumers 6,180 5,930 5,940
Total 3,820,000 r 2,890,000 3,090,000Estimated full industry coverage 4,130,000 r 3,120,000 3,480,000
2014:Secondary smelters 2,170,000 1,480,000 1,580,000independent mill fabricators 1,620,000 1,380,000 1,470,000Foundries 97,300 80,500 86,100Other consumers 6,690 6,690 6,690
Total 3,890,000 2,940,000 3,140,000Estimated full industry coverage 4,210,000 3,180,000 3,640,000
TABlE 3u.S. COnSumPTiOn OF AnD RECOVERY FROm PuRCHASED
nEW AnD OlD Aluminum SCRAP, BY ClASS1, 2
(metric tons)
Calculated recovery
rRevised.1Excludes recovery from other than aluminum-base scrap.2Data are rounded to no more than three significant digits; may not add to totalsshown.
Aluminum—2014 [ADVAnCE RElEASE] 5.13
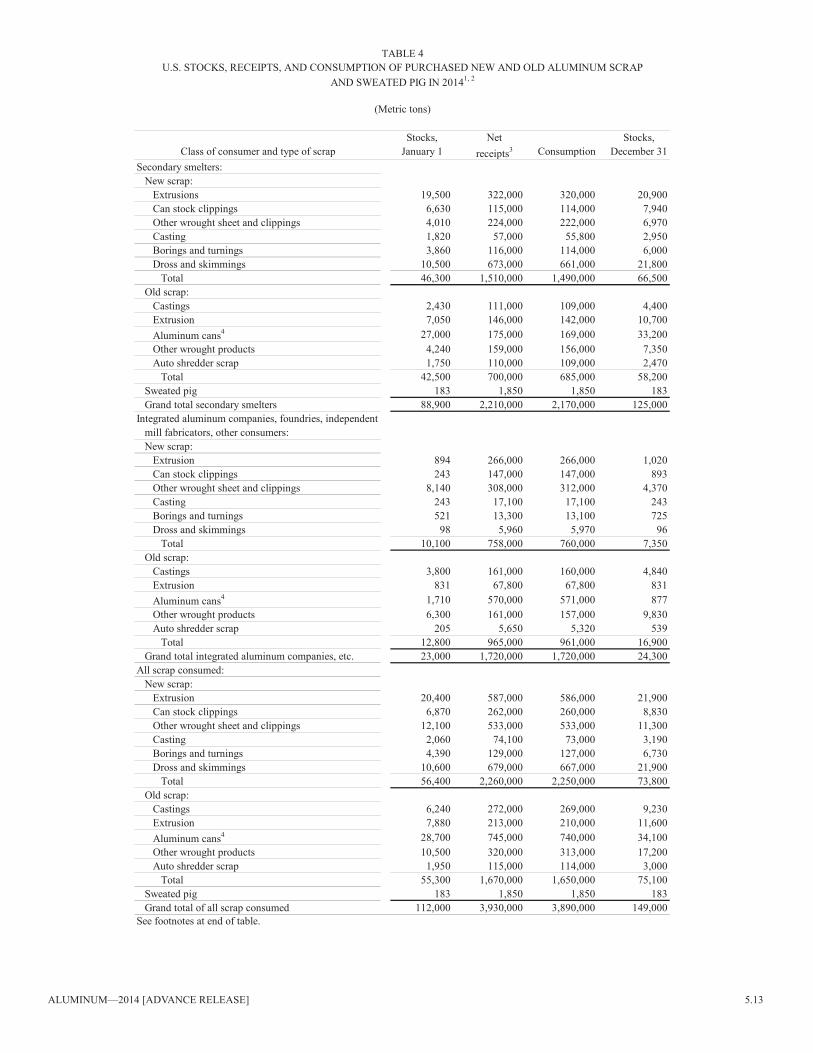
Stocks, net Stocks,Class of consumer and type of scrap January 1 receipts3 Consumption December 31
Secondary smelters:new scrap:
Extrusions 19,500 322,000 320,000 20,900Can stock clippings 6,630 115,000 114,000 7,940Other wrought sheet and clippings 4,010 224,000 222,000 6,970Casting 1,820 57,000 55,800 2,950Borings and turnings 3,860 116,000 114,000 6,000Dross and skimmings 10,500 673,000 661,000 21,800
Total 46,300 1,510,000 1,490,000 66,500Old scrap:
Castings 2,430 111,000 109,000 4,400Extrusion 7,050 146,000 142,000 10,700Aluminum cans4 27,000 175,000 169,000 33,200Other wrought products 4,240 159,000 156,000 7,350Auto shredder scrap 1,750 110,000 109,000 2,470
Total 42,500 700,000 685,000 58,200Sweated pig 183 1,850 1,850 183Grand total secondary smelters 88,900 2,210,000 2,170,000 125,000
integrated aluminum companies, foundries, independentmill fabricators, other consumers:new scrap:
Extrusion 894 266,000 266,000 1,020Can stock clippings 243 147,000 147,000 893Other wrought sheet and clippings 8,140 308,000 312,000 4,370Casting 243 17,100 17,100 243Borings and turnings 521 13,300 13,100 725Dross and skimmings 98 5,960 5,970 96
Total 10,100 758,000 760,000 7,350Old scrap:
Castings 3,800 161,000 160,000 4,840Extrusion 831 67,800 67,800 831Aluminum cans4 1,710 570,000 571,000 877Other wrought products 6,300 161,000 157,000 9,830Auto shredder scrap 205 5,650 5,320 539
Total 12,800 965,000 961,000 16,900Grand total integrated aluminum companies, etc. 23,000 1,720,000 1,720,000 24,300
All scrap consumed:new scrap:
Extrusion 20,400 587,000 586,000 21,900Can stock clippings 6,870 262,000 260,000 8,830Other wrought sheet and clippings 12,100 533,000 533,000 11,300Casting 2,060 74,100 73,000 3,190Borings and turnings 4,390 129,000 127,000 6,730Dross and skimmings 10,600 679,000 667,000 21,900
Total 56,400 2,260,000 2,250,000 73,800Old scrap:
Castings 6,240 272,000 269,000 9,230Extrusion 7,880 213,000 210,000 11,600Aluminum cans4 28,700 745,000 740,000 34,100Other wrought products 10,500 320,000 313,000 17,200Auto shredder scrap 1,950 115,000 114,000 3,000
Total 55,300 1,670,000 1,650,000 75,100Sweated pig 183 1,850 1,850 183Grand total of all scrap consumed 112,000 3,930,000 3,890,000 149,000
TABlE 4u.S. STOCKS, RECEiPTS, AnD COnSumPTiOn OF PuRCHASED nEW AnD OlD Aluminum SCRAP
AnD SWEATED PiG in 20141, 2
(metric tons)
See footnotes at end of table.
5.14 [ADVAnCE RElEASE] u.S. GEOlOGiCAl SuRVEY minERAlS YEARBOOK—2014
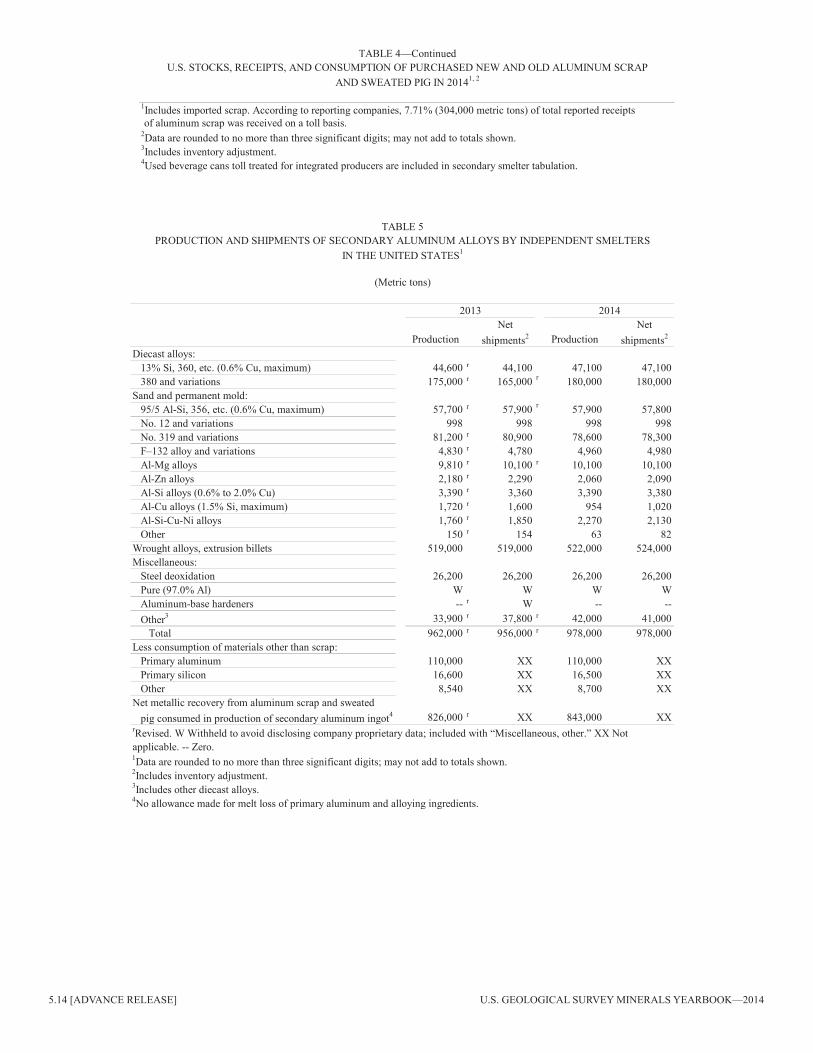
2Data are rounded to no more than three significant digits; may not add to totals shown.3includes inventory adjustment.4used beverage cans toll treated for integrated producers are included in secondary smelter tabulation.
1includes imported scrap. According to reporting companies, 7.71% (304,000 metric tons) of total reported receipts of aluminum scrap was received on a toll basis.
TABlE 4—Continuedu.S. STOCKS, RECEiPTS, AnD COnSumPTiOn OF PuRCHASED nEW AnD OlD Aluminum SCRAP
AnD SWEATED PiG in 20141, 2
2013 2014net net
Production shipments2 Production shipments2
Diecast alloys:13% Si, 360, etc. (0.6% Cu, maximum) 44,600 r 44,100 47,100 47,100380 and variations 175,000 r 165,000 r 180,000 180,000
Sand and permanent mold:95/5 Al-Si, 356, etc. (0.6% Cu, maximum) 57,700 r 57,900 r 57,900 57,800no. 12 and variations 998 998 998 998no. 319 and variations 81,200 r 80,900 78,600 78,300F–132 alloy and variations 4,830 r 4,780 4,960 4,980Al-mg alloys 9,810 r 10,100 r 10,100 10,100Al-Zn alloys 2,180 r 2,290 2,060 2,090Al-Si alloys (0.6% to 2.0% Cu) 3,390 r 3,360 3,390 3,380Al-Cu alloys (1.5% Si, maximum) 1,720 r 1,600 954 1,020Al-Si-Cu-ni alloys 1,760 r 1,850 2,270 2,130Other 150 r 154 63 82
Wrought alloys, extrusion billets 519,000 519,000 522,000 524,000miscellaneous:
Steel deoxidation 26,200 26,200 26,200 26,200Pure (97.0% Al) W W W WAluminum-base hardeners -- r W -- --Other3 33,900 r 37,800 r 42,000 41,000
Total 962,000 r 956,000 r 978,000 978,000less consumption of materials other than scrap:
Primary aluminum 110,000 XX 110,000 XXPrimary silicon 16,600 XX 16,500 XXOther 8,540 XX 8,700 XX
net metallic recovery from aluminum scrap and sweatedpig consumed in production of secondary aluminum ingot4 826,000 r XX 843,000 XX
1Data are rounded to no more than three significant digits; may not add to totals shown.2includes inventory adjustment.3includes other diecast alloys.4no allowance made for melt loss of primary aluminum and alloying ingredients.
TABlE 5PRODuCTiOn AnD SHiPmEnTS OF SECOnDARY Aluminum AllOYS BY inDEPEnDEnT SmElTERS
in THE uniTED STATES1
(metric tons)
rRevised. W Withheld to avoid disclosing company proprietary data; included with “miscellaneous, other.” XX not applicable. -- Zero.
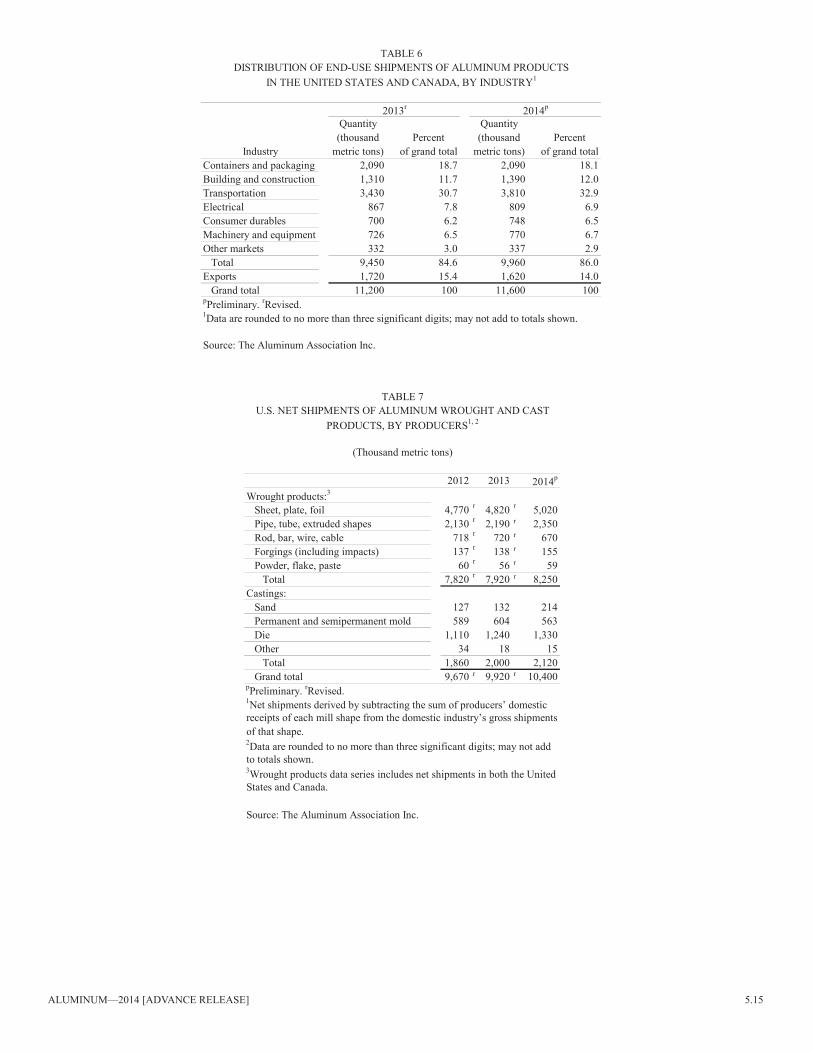
Aluminum—2014 [ADVAnCE RElEASE] 5.15
2013r 2014p
Quantity Quantity(thousand Percent (thousand Percent
industry metric tons) of grand total metric tons) of grand totalContainers and packaging 2,090 18.7 2,090 18.1Building and construction 1,310 11.7 1,390 12.0Transportation 3,430 30.7 3,810 32.9Electrical 867 7.8 809 6.9Consumer durables 700 6.2 748 6.5machinery and equipment 726 6.5 770 6.7Other markets 332 3.0 337 2.9
Total 9,450 84.6 9,960 86.0Exports 1,720 15.4 1,620 14.0
Grand total 11,200 100 11,600 100
TABlE 6DiSTRiBuTiOn OF EnD-uSE SHiPmEnTS OF Aluminum PRODuCTS
in THE uniTED STATES AnD CAnADA, BY inDuSTRY1
pPreliminary. rRevised.1Data are rounded to no more than three significant digits; may not add to totals shown.
Source: The Aluminum Association inc.
2012 2013 2014p
Wrought products:3
Sheet, plate, foil 4,770 r 4,820 r 5,020Pipe, tube, extruded shapes 2,130 r 2,190 r 2,350Rod, bar, wire, cable 718 r 720 r 670Forgings (including impacts) 137 r 138 r 155Powder, flake, paste 60 r 56 r 59
Total 7,820 r 7,920 r 8,250Castings:
Sand 127 132 214Permanent and semipermanent mold 589 604 563Die 1,110 1,240 1,330Other 34 18 15
Total 1,860 2,000 2,120Grand total 9,670 r 9,920 r 10,400
States and Canada.
Source: The Aluminum Association inc.
1net shipments derived by subtracting the sum of producers’ domesticreceipts of each mill shape from the domestic industry’s gross shipmentsof that shape.2Data are rounded to no more than three significant digits; may not addto totals shown.3Wrought products data series includes net shipments in both the united
TABlE 7u.S. nET SHiPmEnTS OF Aluminum WROuGHT AnD CAST
PRODuCTS, BY PRODuCERS1, 2
(Thousand metric tons)
pPreliminary. rRevised.
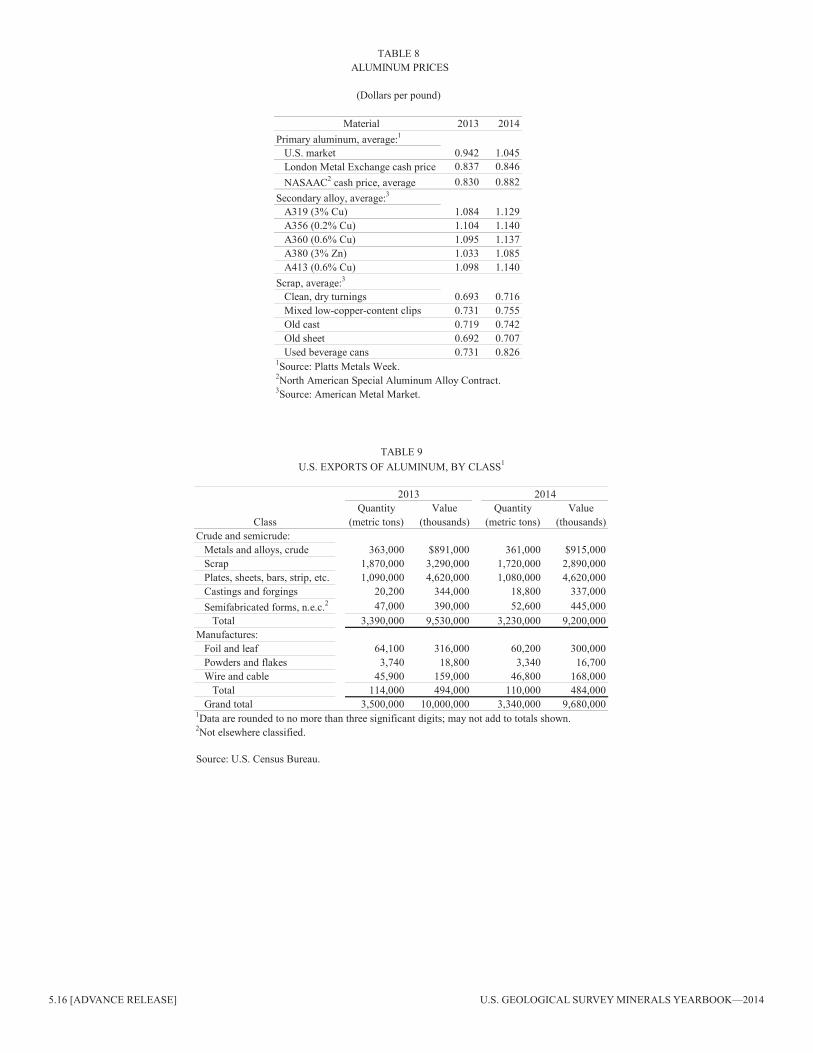
5.16 [ADVAnCE RElEASE] u.S. GEOlOGiCAl SuRVEY minERAlS YEARBOOK—2014
material 2013 2014Primary aluminum, average:1
u.S. market 0.942 1.045london metal Exchange cash price 0.837 0.846nASAAC2 cash price, average 0.830 0.882
Secondary alloy, average:3
A319 (3% Cu) 1.084 1.129A356 (0.2% Cu) 1.104 1.140A360 (0.6% Cu) 1.095 1.137A380 (3% Zn) 1.033 1.085A413 (0.6% Cu) 1.098 1.140
Scrap, average:3
Clean, dry turnings 0.693 0.716mixed low-copper-content clips 0.731 0.755Old cast 0.719 0.742Old sheet 0.692 0.707used beverage cans 0.731 0.826
TABlE 8 Aluminum PRiCES
(Dollars per pound)
1Source: Platts metals Week.2north American Special Aluminum Alloy Contract.3Source: American metal market.
2013 2014Quantity Value Quantity Value
Class (metric tons) (thousands) (metric tons) (thousands)Crude and semicrude:
metals and alloys, crude 363,000 $891,000 361,000 $915,000Scrap 1,870,000 3,290,000 1,720,000 2,890,000Plates, sheets, bars, strip, etc. 1,090,000 4,620,000 1,080,000 4,620,000Castings and forgings 20,200 344,000 18,800 337,000Semifabricated forms, n.e.c.2 47,000 390,000 52,600 445,000
Total 3,390,000 9,530,000 3,230,000 9,200,000manufactures:
Foil and leaf 64,100 316,000 60,200 300,000Powders and flakes 3,740 18,800 3,340 16,700Wire and cable 45,900 159,000 46,800 168,000
Total 114,000 494,000 110,000 484,000Grand total 3,500,000 10,000,000 3,340,000 9,680,000
Source: u.S. Census Bureau.
TABlE 9u.S. EXPORTS OF Aluminum, BY ClASS1
1Data are rounded to no more than three significant digits; may not add to totals shown.2not elsewhere classified.
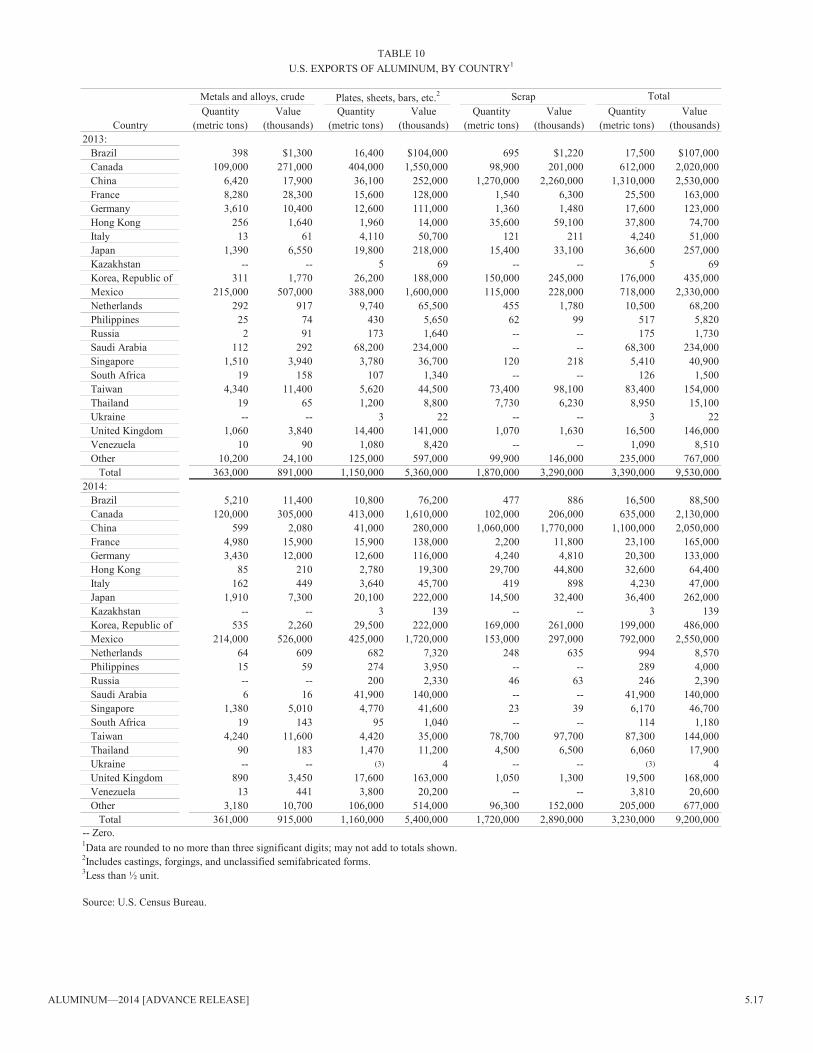
Aluminum—2014 [ADVAnCE RElEASE] 5.17
metals and alloys, crude Plates, sheets, bars, etc.2 ScrapQuantity Value Quantity Value Quantity Value Quantity Value
Country (metric tons) (thousands) (metric tons) (thousands) (metric tons) (thousands) (metric tons) (thousands)2013:
Brazil 398 $1,300 16,400 $104,000 695 $1,220 17,500 $107,000Canada 109,000 271,000 404,000 1,550,000 98,900 201,000 612,000 2,020,000China 6,420 17,900 36,100 252,000 1,270,000 2,260,000 1,310,000 2,530,000France 8,280 28,300 15,600 128,000 1,540 6,300 25,500 163,000Germany 3,610 10,400 12,600 111,000 1,360 1,480 17,600 123,000Hong Kong 256 1,640 1,960 14,000 35,600 59,100 37,800 74,700italy 13 61 4,110 50,700 121 211 4,240 51,000Japan 1,390 6,550 19,800 218,000 15,400 33,100 36,600 257,000Kazakhstan -- -- 5 69 -- -- 5 69Korea, Republic of 311 1,770 26,200 188,000 150,000 245,000 176,000 435,000mexico 215,000 507,000 388,000 1,600,000 115,000 228,000 718,000 2,330,000netherlands 292 917 9,740 65,500 455 1,780 10,500 68,200Philippines 25 74 430 5,650 62 99 517 5,820Russia 2 91 173 1,640 -- -- 175 1,730Saudi Arabia 112 292 68,200 234,000 -- -- 68,300 234,000Singapore 1,510 3,940 3,780 36,700 120 218 5,410 40,900South Africa 19 158 107 1,340 -- -- 126 1,500Taiwan 4,340 11,400 5,620 44,500 73,400 98,100 83,400 154,000Thailand 19 65 1,200 8,800 7,730 6,230 8,950 15,100ukraine -- -- 3 22 -- -- 3 22united Kingdom 1,060 3,840 14,400 141,000 1,070 1,630 16,500 146,000Venezuela 10 90 1,080 8,420 -- -- 1,090 8,510Other 10,200 24,100 125,000 597,000 99,900 146,000 235,000 767,000
Total 363,000 891,000 1,150,000 5,360,000 1,870,000 3,290,000 3,390,000 9,530,0002014:
Brazil 5,210 11,400 10,800 76,200 477 886 16,500 88,500Canada 120,000 305,000 413,000 1,610,000 102,000 206,000 635,000 2,130,000China 599 2,080 41,000 280,000 1,060,000 1,770,000 1,100,000 2,050,000France 4,980 15,900 15,900 138,000 2,200 11,800 23,100 165,000Germany 3,430 12,000 12,600 116,000 4,240 4,810 20,300 133,000Hong Kong 85 210 2,780 19,300 29,700 44,800 32,600 64,400italy 162 449 3,640 45,700 419 898 4,230 47,000Japan 1,910 7,300 20,100 222,000 14,500 32,400 36,400 262,000Kazakhstan -- -- 3 139 -- -- 3 139Korea, Republic of 535 2,260 29,500 222,000 169,000 261,000 199,000 486,000mexico 214,000 526,000 425,000 1,720,000 153,000 297,000 792,000 2,550,000netherlands 64 609 682 7,320 248 635 994 8,570Philippines 15 59 274 3,950 -- -- 289 4,000Russia -- -- 200 2,330 46 63 246 2,390Saudi Arabia 6 16 41,900 140,000 -- -- 41,900 140,000Singapore 1,380 5,010 4,770 41,600 23 39 6,170 46,700South Africa 19 143 95 1,040 -- -- 114 1,180Taiwan 4,240 11,600 4,420 35,000 78,700 97,700 87,300 144,000Thailand 90 183 1,470 11,200 4,500 6,500 6,060 17,900ukraine -- -- (3) 4 -- -- (3) 4united Kingdom 890 3,450 17,600 163,000 1,050 1,300 19,500 168,000Venezuela 13 441 3,800 20,200 -- -- 3,810 20,600Other 3,180 10,700 106,000 514,000 96,300 152,000 205,000 677,000
Total 361,000 915,000 1,160,000 5,400,000 1,720,000 2,890,000 3,230,000 9,200,000
3less than ½ unit.
Source: u.S. Census Bureau.
TABlE 10u.S. EXPORTS OF Aluminum, BY COunTRY1
Total
-- Zero.1Data are rounded to no more than three significant digits; may not add to totals shown.2includes castings, forgings, and unclassified semifabricated forms.
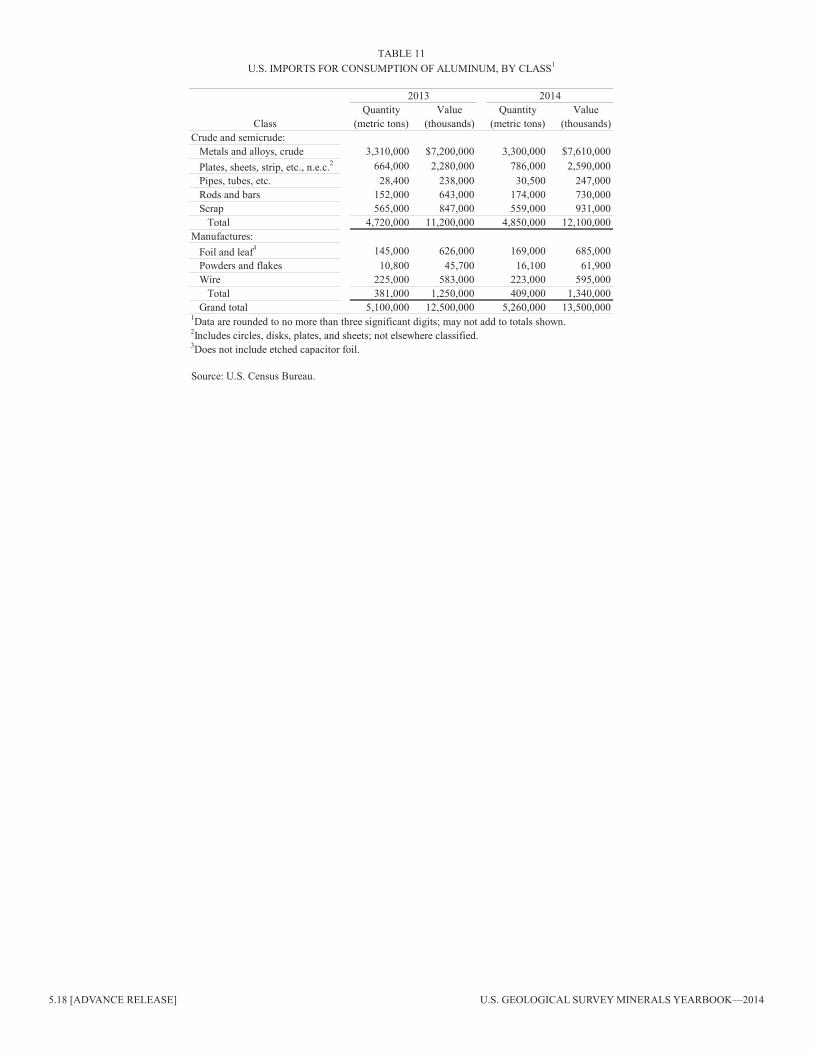
5.18 [ADVAnCE RElEASE] u.S. GEOlOGiCAl SuRVEY minERAlS YEARBOOK—2014
2013 2014Quantity Value Quantity Value
Class (metric tons) (thousands) (metric tons) (thousands)Crude and semicrude:
metals and alloys, crude 3,310,000 $7,200,000 3,300,000 $7,610,000Plates, sheets, strip, etc., n.e.c.2 664,000 2,280,000 786,000 2,590,000Pipes, tubes, etc. 28,400 238,000 30,500 247,000Rods and bars 152,000 643,000 174,000 730,000Scrap 565,000 847,000 559,000 931,000
Total 4,720,000 11,200,000 4,850,000 12,100,000manufactures:
Foil and leaf3 145,000 626,000 169,000 685,000Powders and flakes 10,800 45,700 16,100 61,900Wire 225,000 583,000 223,000 595,000
Total 381,000 1,250,000 409,000 1,340,000Grand total 5,100,000 12,500,000 5,260,000 13,500,000
TABlE 11u.S. imPORTS FOR COnSumPTiOn OF Aluminum, BY ClASS1
1Data are rounded to no more than three significant digits; may not add to totals shown.2includes circles, disks, plates, and sheets; not elsewhere classified.3Does not include etched capacitor foil.
Source: u.S. Census Bureau.
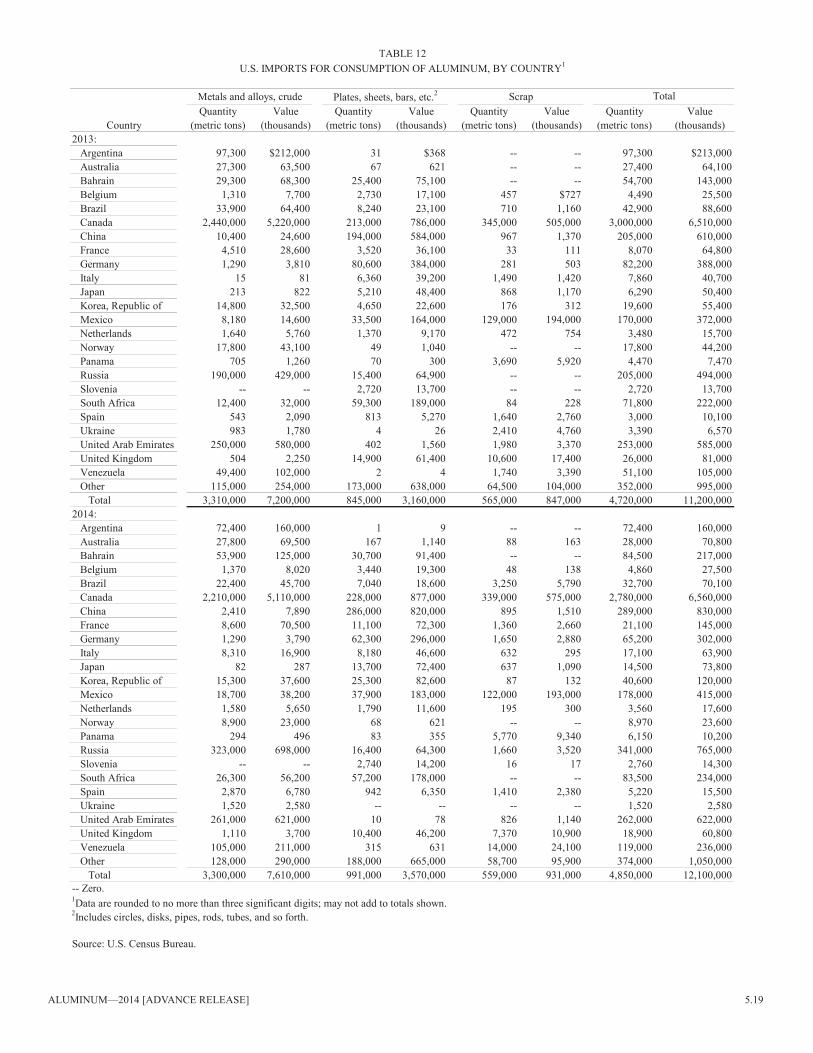
Aluminum—2014 [ADVAnCE RElEASE] 5.19
metals and alloys, crude ScrapQuantity Value Quantity Value Quantity Value Quantity Value
Country (metric tons) (thousands) (metric tons) (thousands) (metric tons) (thousands) (metric tons) (thousands)2013:
Argentina 97,300 $212,000 31 $368 -- -- 97,300 $213,000Australia 27,300 63,500 67 621 -- -- 27,400 64,100Bahrain 29,300 68,300 25,400 75,100 -- -- 54,700 143,000Belgium 1,310 7,700 2,730 17,100 457 $727 4,490 25,500Brazil 33,900 64,400 8,240 23,100 710 1,160 42,900 88,600Canada 2,440,000 5,220,000 213,000 786,000 345,000 505,000 3,000,000 6,510,000China 10,400 24,600 194,000 584,000 967 1,370 205,000 610,000France 4,510 28,600 3,520 36,100 33 111 8,070 64,800Germany 1,290 3,810 80,600 384,000 281 503 82,200 388,000italy 15 81 6,360 39,200 1,490 1,420 7,860 40,700Japan 213 822 5,210 48,400 868 1,170 6,290 50,400Korea, Republic of 14,800 32,500 4,650 22,600 176 312 19,600 55,400mexico 8,180 14,600 33,500 164,000 129,000 194,000 170,000 372,000netherlands 1,640 5,760 1,370 9,170 472 754 3,480 15,700norway 17,800 43,100 49 1,040 -- -- 17,800 44,200Panama 705 1,260 70 300 3,690 5,920 4,470 7,470Russia 190,000 429,000 15,400 64,900 -- -- 205,000 494,000Slovenia -- -- 2,720 13,700 -- -- 2,720 13,700South Africa 12,400 32,000 59,300 189,000 84 228 71,800 222,000Spain 543 2,090 813 5,270 1,640 2,760 3,000 10,100ukraine 983 1,780 4 26 2,410 4,760 3,390 6,570united Arab Emirates 250,000 580,000 402 1,560 1,980 3,370 253,000 585,000united Kingdom 504 2,250 14,900 61,400 10,600 17,400 26,000 81,000Venezuela 49,400 102,000 2 4 1,740 3,390 51,100 105,000Other 115,000 254,000 173,000 638,000 64,500 104,000 352,000 995,000
Total 3,310,000 7,200,000 845,000 3,160,000 565,000 847,000 4,720,000 11,200,0002014:
Argentina 72,400 160,000 1 9 -- -- 72,400 160,000Australia 27,800 69,500 167 1,140 88 163 28,000 70,800Bahrain 53,900 125,000 30,700 91,400 -- -- 84,500 217,000Belgium 1,370 8,020 3,440 19,300 48 138 4,860 27,500Brazil 22,400 45,700 7,040 18,600 3,250 5,790 32,700 70,100Canada 2,210,000 5,110,000 228,000 877,000 339,000 575,000 2,780,000 6,560,000China 2,410 7,890 286,000 820,000 895 1,510 289,000 830,000France 8,600 70,500 11,100 72,300 1,360 2,660 21,100 145,000Germany 1,290 3,790 62,300 296,000 1,650 2,880 65,200 302,000italy 8,310 16,900 8,180 46,600 632 295 17,100 63,900Japan 82 287 13,700 72,400 637 1,090 14,500 73,800Korea, Republic of 15,300 37,600 25,300 82,600 87 132 40,600 120,000mexico 18,700 38,200 37,900 183,000 122,000 193,000 178,000 415,000netherlands 1,580 5,650 1,790 11,600 195 300 3,560 17,600norway 8,900 23,000 68 621 -- -- 8,970 23,600Panama 294 496 83 355 5,770 9,340 6,150 10,200Russia 323,000 698,000 16,400 64,300 1,660 3,520 341,000 765,000Slovenia -- -- 2,740 14,200 16 17 2,760 14,300South Africa 26,300 56,200 57,200 178,000 -- -- 83,500 234,000Spain 2,870 6,780 942 6,350 1,410 2,380 5,220 15,500ukraine 1,520 2,580 -- -- -- -- 1,520 2,580united Arab Emirates 261,000 621,000 10 78 826 1,140 262,000 622,000united Kingdom 1,110 3,700 10,400 46,200 7,370 10,900 18,900 60,800Venezuela 105,000 211,000 315 631 14,000 24,100 119,000 236,000Other 128,000 290,000 188,000 665,000 58,700 95,900 374,000 1,050,000
Total 3,300,000 7,610,000 991,000 3,570,000 559,000 931,000 4,850,000 12,100,000
2includes circles, disks, pipes, rods, tubes, and so forth.
Source: u.S. Census Bureau.
TABlE 12u.S. imPORTS FOR COnSumPTiOn OF Aluminum, BY COunTRY1
Plates, sheets, bars, etc.2 Total
-- Zero.1Data are rounded to no more than three significant digits; may not add to totals shown.
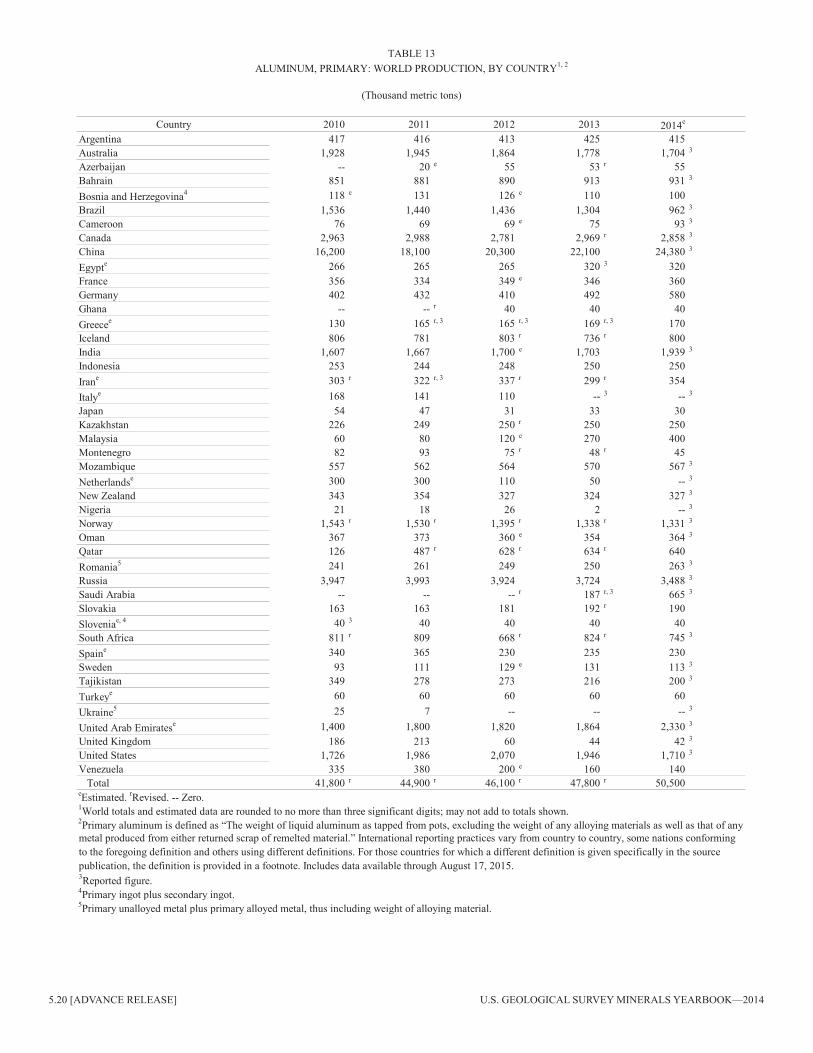
5.20 [ADVAnCE RElEASE] u.S. GEOlOGiCAl SuRVEY minERAlS YEARBOOK—2014
Country 2010 2011 2012 2013 2014e
Argentina 417 416 413 425 415Australia 1,928 1,945 1,864 1,778 1,704 3
Azerbaijan -- 20 e 55 53 r 55Bahrain 851 881 890 913 931 3
Bosnia and Herzegovina4 118 e 131 126 e 110 100Brazil 1,536 1,440 1,436 1,304 962 3
Cameroon 76 69 69 e 75 93 3
Canada 2,963 2,988 2,781 2,969 r 2,858 3
China 16,200 18,100 20,300 22,100 24,380 3
Egypte 266 265 265 320 3 320France 356 334 349 e 346 360Germany 402 432 410 492 580Ghana -- -- r 40 40 40Greecee 130 165 r, 3 165 r, 3 169 r, 3 170iceland 806 781 803 r 736 r 800india 1,607 1,667 1,700 e 1,703 1,939 3
indonesia 253 244 248 250 250irane 303 r 322 r, 3 337 r 299 r 354italye 168 141 110 -- 3 -- 3
Japan 54 47 31 33 30Kazakhstan 226 249 250 r 250 250malaysia 60 80 120 e 270 400montenegro 82 93 75 r 48 r 45mozambique 557 562 564 570 567 3
netherlandse 300 300 110 50 -- 3
new Zealand 343 354 327 324 327 3
nigeria 21 18 26 2 -- 3
norway 1,543 r 1,530 r 1,395 r 1,338 r 1,331 3
Oman 367 373 360 e 354 364 3
Qatar 126 487 r 628 r 634 r 640Romania5 241 261 249 250 263 3
Russia 3,947 3,993 3,924 3,724 3,488 3
Saudi Arabia -- -- -- r 187 r, 3 665 3
Slovakia 163 163 181 192 r 190Sloveniae, 4 40 3 40 40 40 40South Africa 811 r 809 668 r 824 r 745 3
Spaine 340 365 230 235 230Sweden 93 111 129 e 131 113 3
Tajikistan 349 278 273 216 200 3
Turkeye 60 60 60 60 60ukraine5 25 7 -- -- -- 3
united Arab Emiratese 1,400 1,800 1,820 1,864 2,330 3
united Kingdom 186 213 60 44 42 3
united States 1,726 1,986 2,070 1,946 1,710 3
Venezuela 335 380 200 e 160 140Total 41,800 r 44,900 r 46,100 r 47,800 r 50,500
TABlE 13Aluminum, PRimARY: WORlD PRODuCTiOn, BY COunTRY1, 2
(Thousand metric tons)
eEstimated. rRevised. -- Zero.1World totals and estimated data are rounded to no more than three significant digits; may not add to totals shown.2Primary aluminum is defined as “The weight of liquid aluminum as tapped from pots, excluding the weight of any alloying materials as well as that of anymetal produced from either returned scrap of remelted material.” international reporting practices vary from country to country, some nations conforming to the foregoing definition and others using different definitions. For those countries for which a different definition is given specifically in the sourcepublication, the definition is provided in a footnote. includes data available through August 17, 2015.3Reported figure.4Primary ingot plus secondary ingot.5Primary unalloyed metal plus primary alloyed metal, thus including weight of alloying material.